
partech.com Q2 2026 Earnings Presentation August 6, 2026 NYSE: PAR
Forward-Looking Statements. This presentation contains forward-looking statements made pursuant to the safe harbor provisions of Section 21E of the Securities Exchange Act of 1934, as amended, Section 27A of the Securities Act of 1933, as amended, and the Private Securities Litigation Reform Act of 1995, and the accuracy of such statements is necessarily subject to risks, uncertainties and assumptions as to future events that may not prove to be accurate. Forward-looking statements can be identified by words such as “believe,” “could,” “would,” “should,” “will,” “continue,” “anticipate,” “expect,” “path,” “plan,” “intend,” “estimate,” “future,” “may,” “potential,” and similar expressions. These statements include, but are not limited to, express or implied forward-looking statements relating to: our future financial performance, including revenues, gross margins, expenses, cash flows, and other financial measures and key performance indicators; the plans, strategies and objectives of management relating to our growth, results of operations, and financial performance, including service and product offerings, the development, demand, market share, and competitive performance of our products and services; the availability and terms of product and component supplies for our hardware products; anticipated benefits of acquisitions, divestitures, and capital markets transactions; and macroeconomic trends, geopolitical events, tariffs, and trade disputes and the expected impact of those trends and events on our business, results of operations, and financial performance. These statements are neither promises nor guarantees but are subject to a variety of risks and uncertainties, many of which are beyond our control, which could cause actual results to differ materially from those contemplated in these forward-looking statements. Factors, risks, trends and uncertainties that could cause actual results to differ materially from those expressed or implied by forward-looking statements include our ability to successfully develop or acquire and transition new products and services and enhance existing products and services to meet evolving customer needs and respond to emerging technological trends, including through effective use of artificial intelligence (AI) in product development and integration of AI tools across our products, service offerings and our customers’ data; our ability to add and retain Active Sites and integration partners; our ability to successfully integrate acquisitions into our operations, and realize the anticipated benefits; macroeconomic trends, such as a recession or slowed economic growth, fluctuating interest rates, inflation, and changes in consumer confidence and discretionary spending; geopolitical events affecting countries where we operate or our customers or suppliers operate, including changes in import/export regulations, such as tariffs, and trade disputes involving the United States and those countries; our ability to retain and manage suppliers, secure alternative suppliers, and manage inventory levels and costs, navigate manufacturing disruptions or logistics challenges, shipping delays, and shipping costs; and the other factors discussed in our most recent Annual Report on Form 10-K and our other filings with the Securities and Exchange Commission. Undue reliance should not be placed on the forward-looking statements in this presentation, which are based on information available to us on the date hereof. We undertake no obligation to update or revise any forward-looking statements, whether as a result of new information, future events, or otherwise, except as may be required under applicable securities law. Industry and Market Data. Market, industry, and other data included in this presentation are from or based on our own internal good faith estimates and research, and on publicly available publications, research, surveys and studies conducted by third parties, which we believe are reliable, but have not independently verified. Similarly, while we believe our internal estimates and research are reliable, we have not independently verified our internal estimates or research. While we are not aware of any misstatements regarding any market, industry, or other data used by us or expressed in this presentation, such information, because it has not been verified or, by its nature - market surveys, estimates, projections or similar data, are inherently subject to uncertainties, and actual results may differ materially from the assumptions and circumstances reflected in this information. Key Performance Indicators and Non-GAAP Financial Measures.(1) We monitor certain key performance indicators and non-GAAP financial measures in the evaluation and management of our business; certain key performance indicators and non-GAAP financial measures are provided in this presentation as we believe they are useful in facilitating period-to-period comparisons of our business performance. Key performance indicators and non-GAAP financial measures do not reflect and should be viewed independently of our financial performance determined in accordance with GAAP. Key performance indicators and non-GAAP financial measures are not forecasts or indicators of future or expected results and should not have undue reliance placed upon them by investors. Where historic non-GAAP financial measures are included in this presentation, the most directly comparable GAAP financial measures and a detailed reconciliation between GAAP and non-GAAP financial measures is included in the Appendix to this presentation. Unless otherwise indicated, financial and operating data included in this presentation is as of June 30, 2026. Trademarks. “PAR®,” “PAR POSTM”, “Punchh®,” “PAR OrderingTM”, "PAR OPS®," “Data Central®," “DelagetTM,” "PAR RetailTM", "PAR® Pay”, and other trademarks identifying our products and services appearing in this presentation belong to us. Solely for convenience, our trademarks referred to in this presentation may appear without the ® or TM symbols, but such references are not intended to indicate in any way that we will not assert, to the fullest extent under applicable law, our rights to these trademarks. This presentation may also contain trade names and trademarks of other companies. Our use of such other companies’ trade names or trademarks is not intended to imply any endorsement or sponsorship by these companies of us or our products or services. (1) See Appendix for Non-GAAP reconciliations and Key Performance Indicators 2partech.com
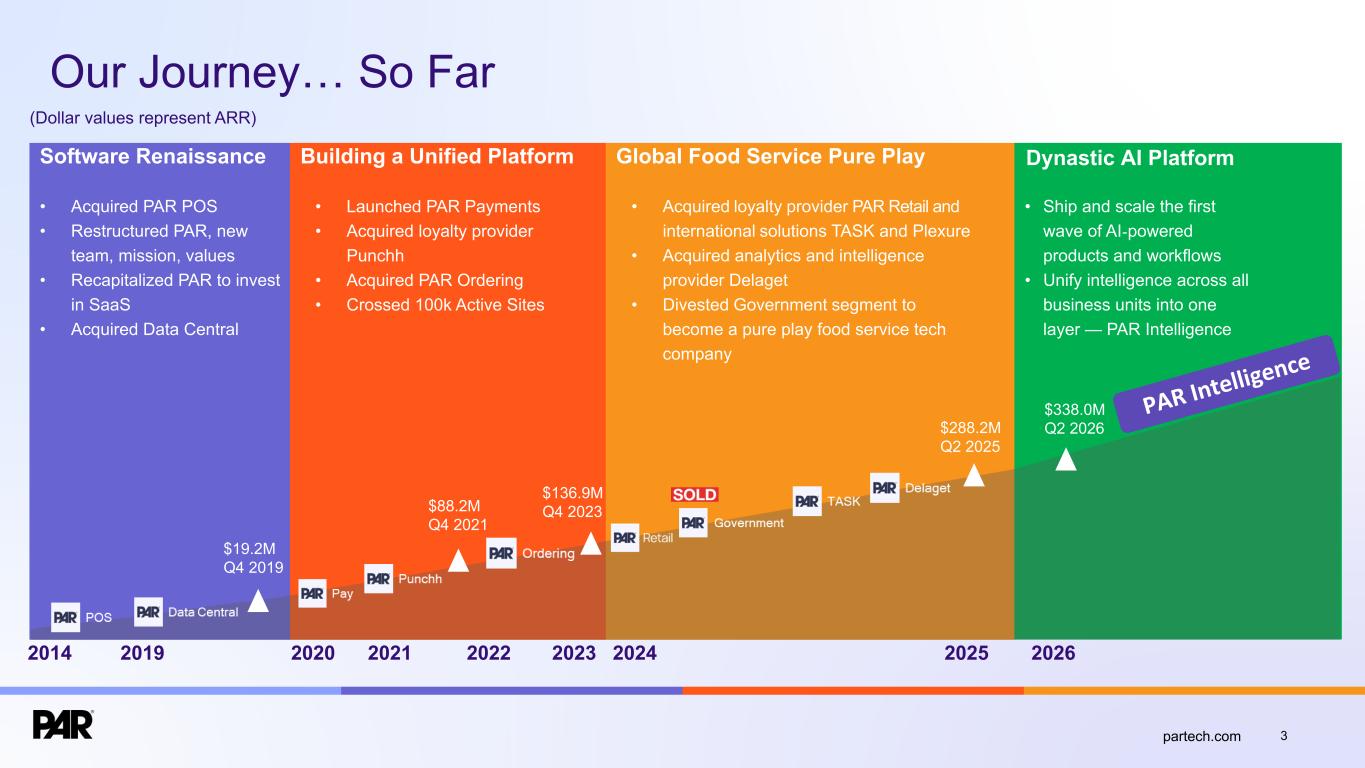
Software Renaissance Building a Unified Platform Global Food Service Pure Play Our Journey… So Far (Dollar values represent ARR) • Acquired PAR POS • Restructured PAR, new team, mission, values • Recapitalized PAR to invest in SaaS • Acquired Data Central 2014 202520242020 20232021 20222019 $19.2M Q4 2019 $88.2M Q4 2021 $136.9M Q4 2023 • Launched PAR Payments • Acquired loyalty provider Punchh • Acquired PAR Ordering • Crossed 100k Active Sites • Acquired loyalty provider PAR Retail and international solutions TASK and Plexure • Acquired analytics and intelligence provider Delaget • Divested Government segment to become a pure play food service tech company • Ship and scale the first wave of AI-powered products and workflows • Unify intelligence across all business units into one layer — PAR Intelligence Dynastic AI Platform 2026 $338.0M Q2 2026$288.2M Q2 2025 PAR I ntelli gence partech.com 3
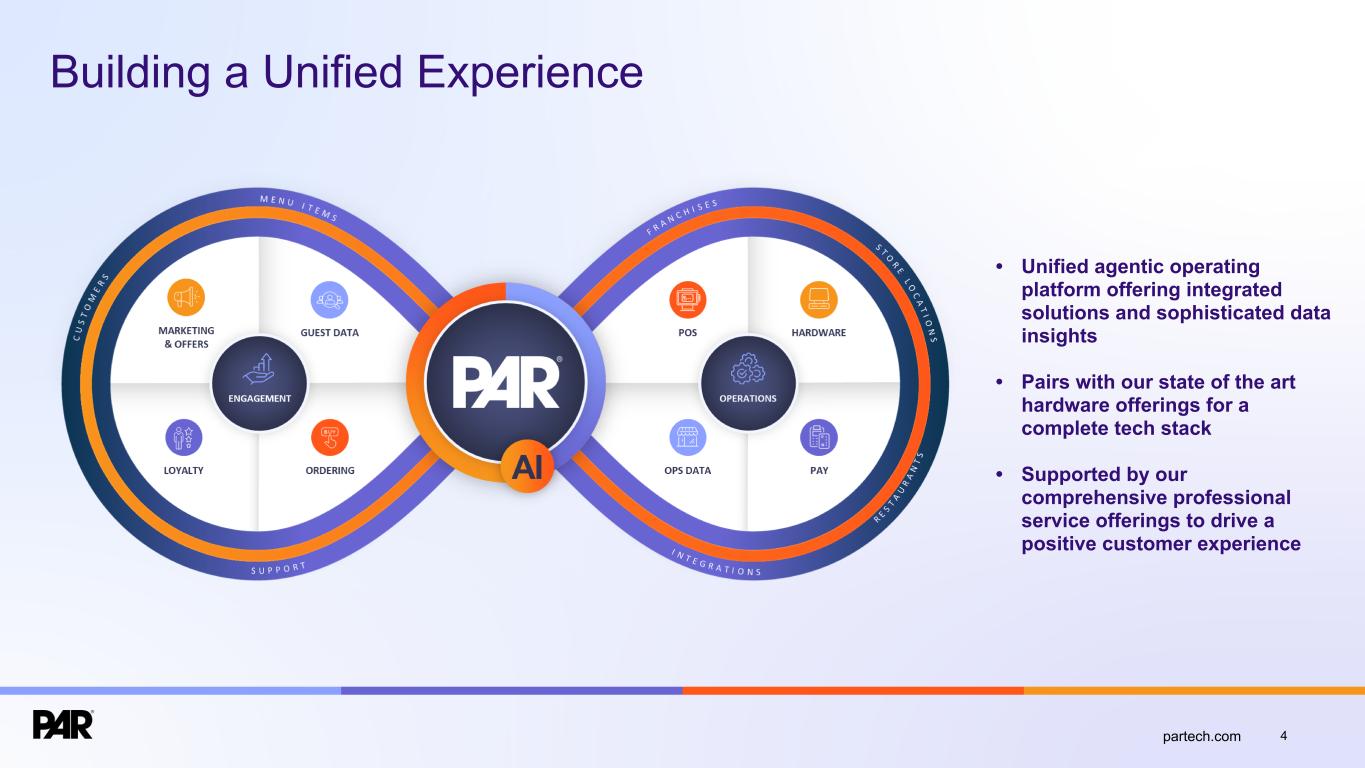
4partech.com • Unified agentic operating platform offering integrated solutions and sophisticated data insights • Pairs with our state of the art hardware offerings for a complete tech stack • Supported by our comprehensive professional service offerings to drive a positive customer experience Building a Unified Experience

5partech.com Financial Review Second Quarter 2026 Highlights
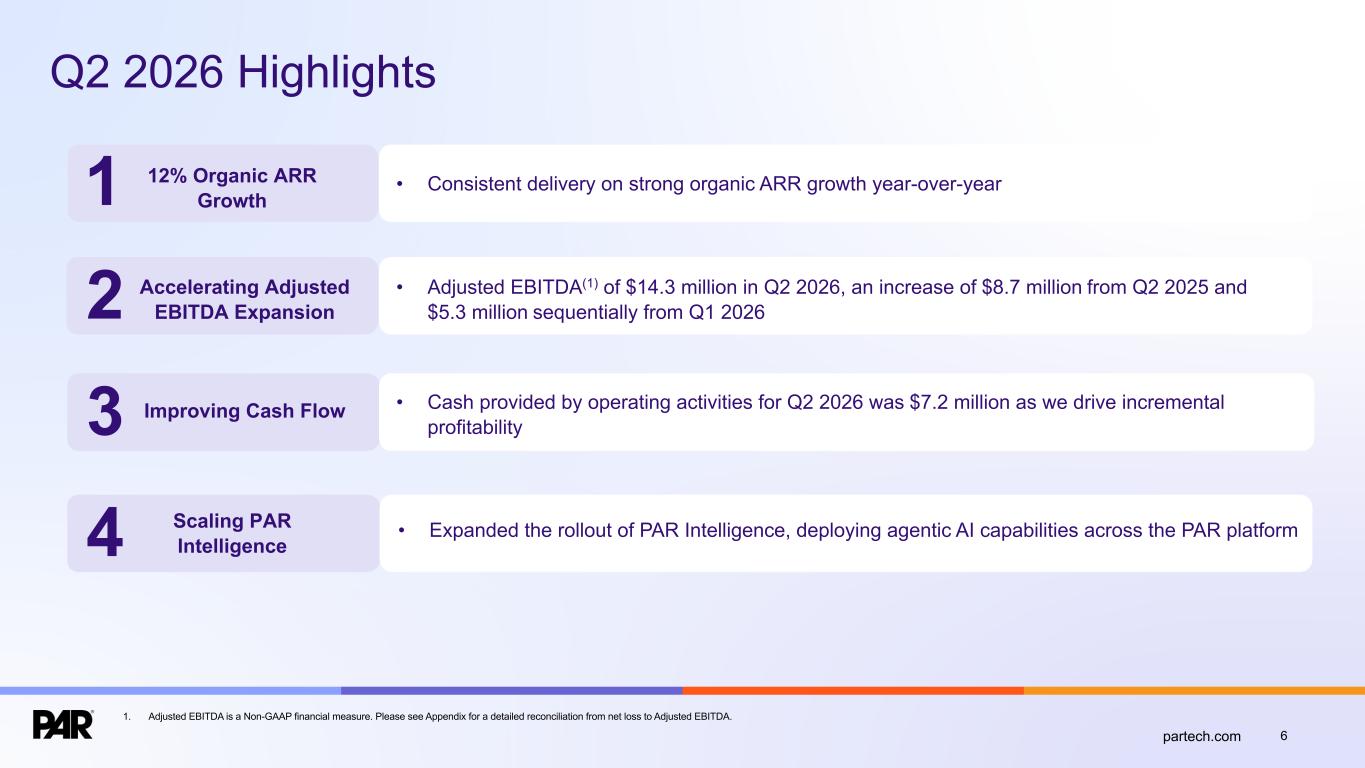
6partech.com Q2 2026 Highlights 1. Adjusted EBITDA is a Non-GAAP financial measure. Please see Appendix for a detailed reconciliation from net loss to Adjusted EBITDA. 3 4 Improving Cash Flow Scaling PAR Intelligence • Cash provided by operating activities for Q2 2026 was $7.2 million as we drive incremental profitability • Expanded the rollout of PAR Intelligence, deploying agentic AI capabilities across the PAR platform • Consistent delivery on strong organic ARR growth year-over-year 2 • Adjusted EBITDA(1) of $14.3 million in Q2 2026, an increase of $8.7 million from Q2 2025 and $5.3 million sequentially from Q1 2026 12% Organic ARR Growth1 Accelerating Adjusted EBITDA Expansion
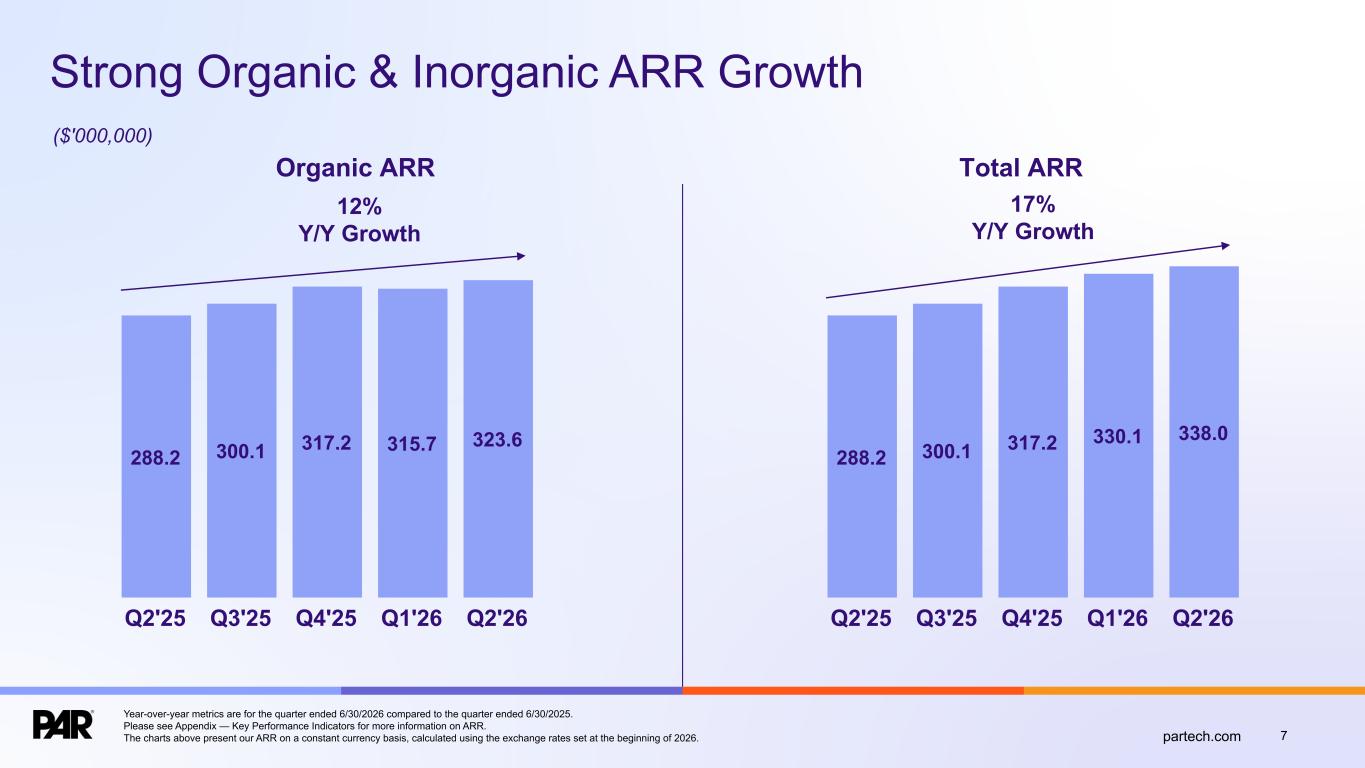
7partech.com 17% Y/Y Growth 288.2 300.1 317.2 315.7 323.6 Q2'25 Q3'25 Q4'25 Q1'26 Q2'26 ($'000,000) Organic ARR 12% Y/Y Growth 288.2 300.1 317.2 330.1 338.0 Q2'25 Q3'25 Q4'25 Q1'26 Q2'26 Total ARR Strong Organic & Inorganic ARR Growth Year-over-year metrics are for the quarter ended 6/30/2026 compared to the quarter ended 6/30/2025. Please see Appendix — Key Performance Indicators for more information on ARR. The charts above present our ARR on a constant currency basis, calculated using the exchange rates set at the beginning of 2026.
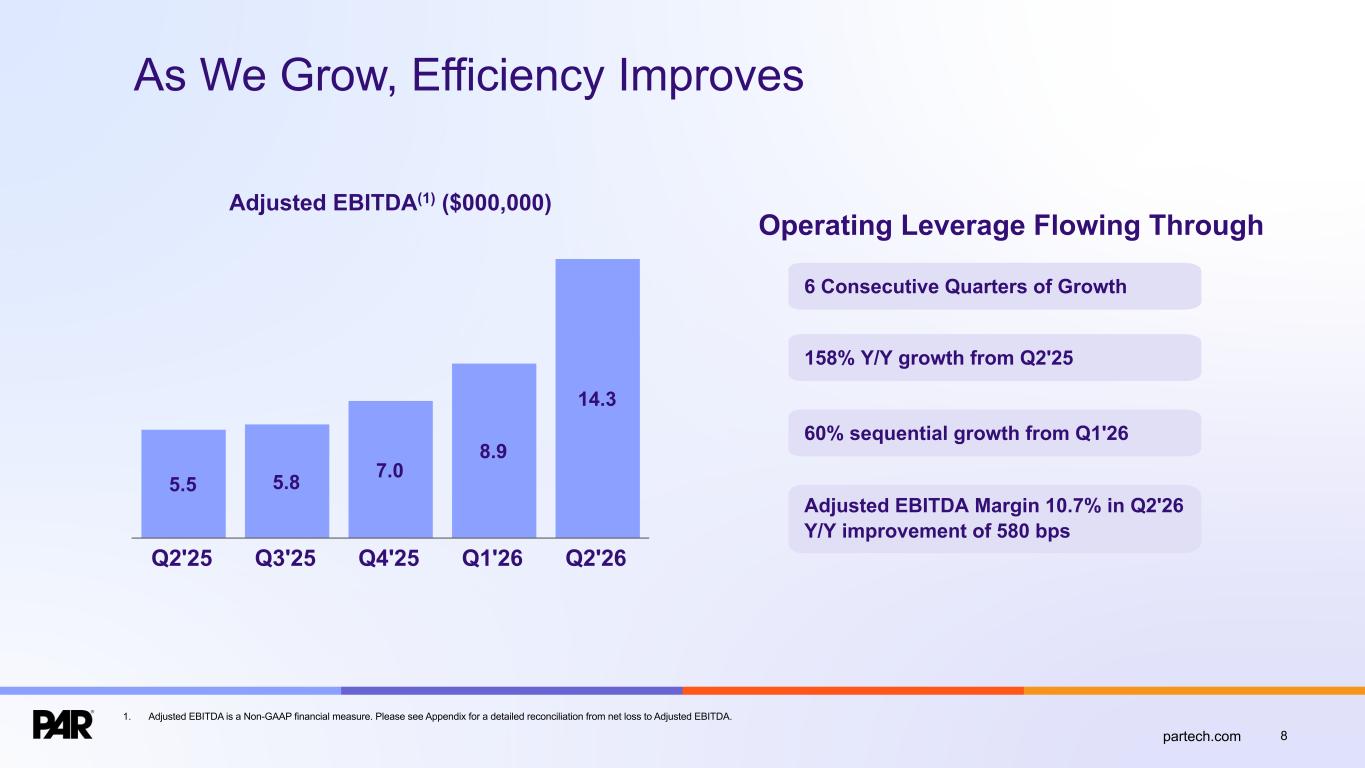
As We Grow, Efficiency Improves 5.5 5.8 7.0 8.9 14.3 Q2'25 Q3'25 Q4'25 Q1'26 Q2'26 Adjusted EBITDA(1) ($000,000) Operating Leverage Flowing Through 8 1. Adjusted EBITDA is a Non-GAAP financial measure. Please see Appendix for a detailed reconciliation from net loss to Adjusted EBITDA. partech.com 6 Consecutive Quarters of Growth 158% Y/Y growth from Q2'25 60% sequential growth from Q1'26 Adjusted EBITDA Margin 10.7% in Q2'26 Y/Y improvement of 580 bps
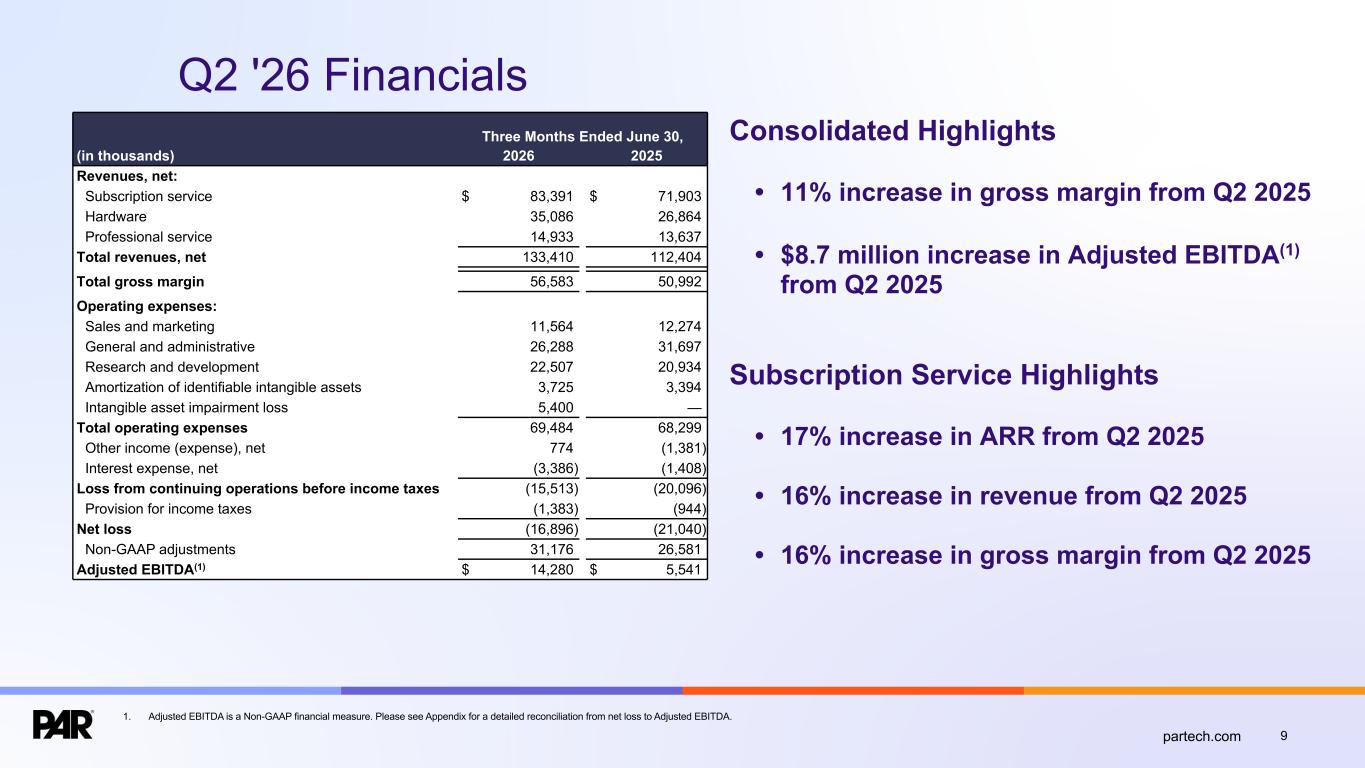
9partech.com Q2 '26 Financials Consolidated Highlights • 11% increase in gross margin from Q2 2025 • $8.7 million increase in Adjusted EBITDA(1) from Q2 2025 Subscription Service Highlights • 17% increase in ARR from Q2 2025 • 16% increase in revenue from Q2 2025 • 16% increase in gross margin from Q2 2025 Three Months Ended June 30, (in thousands) 2026 2025 Revenues, net: Subscription service $ 83,391 $ 71,903 Hardware 35,086 26,864 Professional service 14,933 13,637 Total revenues, net 133,410 112,404 Total gross margin 56,583 50,992 Operating expenses: Sales and marketing 11,564 12,274 General and administrative 26,288 31,697 Research and development 22,507 20,934 Amortization of identifiable intangible assets 3,725 3,394 Intangible asset impairment loss 5,400 — Total operating expenses 69,484 68,299 Other income (expense), net 774 (1,381) Interest expense, net (3,386) (1,408) Loss from continuing operations before income taxes (15,513) (20,096) Provision for income taxes (1,383) (944) Net loss (16,896) (21,040) Non-GAAP adjustments 31,176 26,581 Adjusted EBITDA(1) $ 14,280 $ 5,541 1. Adjusted EBITDA is a Non-GAAP financial measure. Please see Appendix for a detailed reconciliation from net loss to Adjusted EBITDA.

10partech.com Appendix
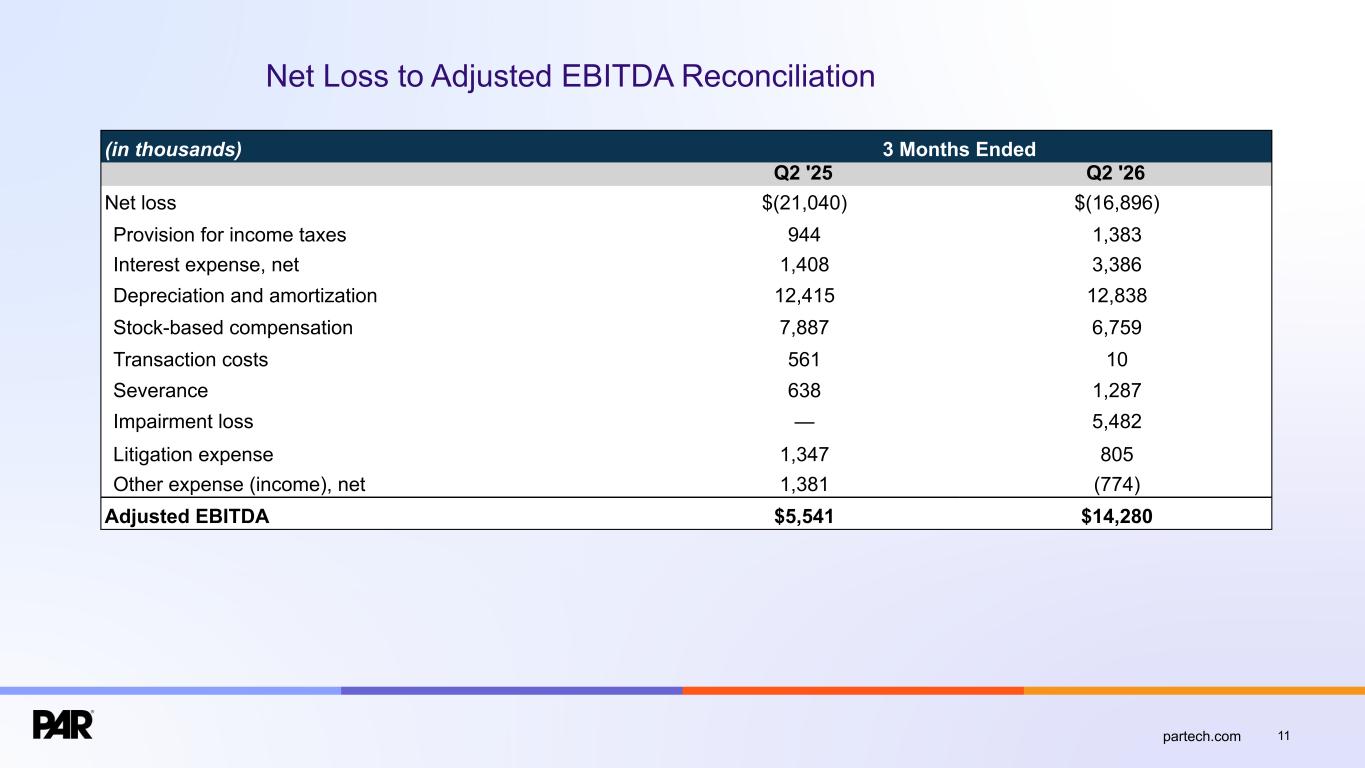
11partech.com (in thousands) 3 Months Ended Q2 '25 Q2 '26 Net loss $(21,040) $(16,896) Provision for income taxes 944 1,383 Interest expense, net 1,408 3,386 Depreciation and amortization 12,415 12,838 Stock-based compensation 7,887 6,759 Transaction costs 561 10 Severance 638 1,287 Impairment loss — 5,482 Litigation expense 1,347 805 Other expense (income), net 1,381 (774) Adjusted EBITDA $5,541 $14,280 Net Loss to Adjusted EBITDA Reconciliation
12partech.com Key Performance Indicators • Annual Recurring Revenue or "ARR” is the annualized revenue from subscription services, including subscription fees for our SaaS solutions and related software support, managed platform development services, and transaction-based payment processing services. We generally calculate ARR by annualizing the monthly recurring revenue for all Active Sites as of the last day of each month for the respective reporting period. Our reported ARR is based on a constant currency, using the exchange rates established at the beginning of the year and consistently applied throughout the period and to comparative periods presented. Applying a constant currency impacted our reported ARR figures for prior periods presented, beginning with Q3 2024, as exchange rate effects began with the acquisition of TASK Group Holdings Limited in 2024. • “Active Sites” represent locations active on PAR’s subscription services as of the last day of the respective reporting period. • “Non-GAAP Subscription Service Gross Margin Percentage” represents subscription service gross margin percentage adjusted to exclude amortization from acquired and internally developed software, stock-based compensation, severance, and impairment of capitalized software development costs. • “Non-GAAP Consolidated Gross Margin Percentage” represents consolidated gross margin percentage adjusted to exclude amortization from acquired and internally developed software, stock-based compensation, severance, and impairment of capitalized software development costs. • “Adjusted EBITDA” represents net loss before income taxes, interest expense, and depreciation and amortization adjusted to exclude discontinued operations, stock-based compensation, transaction costs, severance, impairment loss, litigation expense, and other expense (income), net. • “ARR Per Unit” represents ARR divided by Active Sites as of the last day of each month for the respective reporting period.

13partech.com Thank You!