Investor Update Third Quarter 2025
Forward Looking Statements This presentation contains forward-looking statements made pursuant to the safe-harbor provisions of the Private Securities Litigation Reform Act of 1995. Such forward-looking statements can often, but not always, be identified by the use of words like “believe”, “continue”, “pattern”, “estimate”, “project”, “intend”, “anticipate”, “expect” and similar expressions or future or conditional verbs such as “will”, “would”, “should”, “could”, “might”, “can”, “may”, or similar expressions. These forward-looking statements include, but are not limited to, statements relating to the expected timing and benefits of the proposed merger (the “Merger”) between First Merchants Corporation (“First Merchants”) and First Savings Financial Group, Inc. (“First Savings”), including future financial and operating results, cost savings, enhanced revenues, and accretion/dilution to reported earnings that may be realized from the Merger, as well as other statements of expectations regarding the Merger, and other statements of First Merchants’ goals, intentions and expectations; statements regarding the First Merchants’ business plan and growth strategies; statements regarding the asset quality of First Merchants’ loan and investment portfolios; and estimates of First Merchants’ risks and future costs and benefits whether with respect to the Merger or otherwise. These forward-looking statements are subject to significant risks, assumptions and uncertainties that may cause results to differ materially from those set forth in forward-looking statements, including, among other things: the risk that the businesses of First Merchants and First Savings will not be integrated successfully or such integration may be more difficult, time-consuming or costly than expected; expected revenue synergies and cost savings from the Merger may not be fully realized or realized within the expected time frame; revenues following the Merger may be lower than expected; customer and employee relationships and business operations may be disrupted by the Merger; the ability to obtain required regulatory approvals or the approval of First Savings’ common shareholders, and the ability to complete the Merger on the expected timeframe; possible changes in monetary and fiscal policies, and laws and regulations; the effects of easing restrictions on participants in the financial services industry; the cost and other effects of legal and administrative cases; possible changes in the credit worthiness of customers and the possible impairment of collectability of loans; fluctuations in market rates of interest; competitive factors in the banking industry; changes in the banking legislation or regulatory requirements of federal and state agencies applicable to bank holding companies and banks like First Merchants’ affiliate bank; continued availability of earnings and excess capital sufficient for the lawful and prudent declaration of dividends; changes in market, economic, operational, liquidity (including the ability to grow and maintain core deposits and retain large uninsured deposits), credit and interest rate risks associated with First Merchants’ business; the impacts of epidemics, pandemics or other infectious disease outbreaks; and other risks and factors identified in each of First Merchants’ filings with the Securities and Exchange Commission (“SEC”). First Merchants undertakes no obligation to update any forward-looking statement, whether written or oral, relating to the matters discussed in this presentation or press release. In addition, First Merchants’ past results of operations do not necessarily indicate its anticipated future results, whether the Merger is effectuated or not. ADDITIONAL INFORMATION Communications in this presentation do not constitute an offer to sell or the solicitation of an offer to buy any securities or a solicitation of any proxy vote or approval. First Merchants will file a Registration Statement on Form S-4 with the SEC in connection with the Merger that will include a Proxy Statement for First Savings and a Prospectus for First Merchants, as well as other relevant documents concerning the proposed transaction, which, when finalized, the Proxy Statement - Prospectus will be submitted to First Savings common shareholders to solicit their vote on the Merger. INVESTORS ARE URGED TO READ THE REGISTRATION STATEMENT AND THE CORRESPONDING PROXY STATEMENT - PROSPECTUS REGARDING THE MERGER WHEN THEY BECOME AVAILABLE, AS WELL AS ANY OTHER RELEVANT DOCUMENTS FILED WITH THE SEC CONCERNING THE MERGER, TOGETHER WITH ALL AMENDMENTS OR SUPPLEMENTS TO THOSE DOCUMENTS, AS THEY WILL CONTAIN IMPORTANT INFORMATION. When filed, this document and other documents relating to the Merger filed by First Merchants and First Savings can be obtained free of charge from the SEC’s website at www.sec.gov. First Merchants and First Savings and certain of their respective directors and executive officers may be deemed to be participants in the solicitation of proxies from the common shareholders of First Savings in connection with the proposed Merger. Information about the directors and executive officers of First Merchants is set forth in the proxy statement for First Merchants’ 2025 annual meeting of shareholders, as filed with the SEC on Schedule 14A on April 1, 2025, which information has been updated by First Merchants from time to time in subsequent filings with the SEC. Information about the directors and executive officers of First Savings will be set forth in the Proxy Statement for the First Savings 2025 annual meeting of shareholders, as filed with the SEC on Schedule 14A on January 8, 2025. Additional information regarding the interests of these participants, including First Savings’ officers and directors, will also be included in the Proxy Statement-Prospectus regarding the proposed Merger when it becomes available. PRO FORMA AND PROJECTED INFORMATION This presentation contains certain pro forma and projected financial information, including projected pro forma information, which reflects First Merchants’ current expectations and assumptions. This pro forma information is for illustrative purposes only and should not be relied on as necessarily being indicative of future results. The assumptions and estimates underlying the pro forma information are inherently uncertain and are subject to a wide variety of significant business, economic and competitive risks and uncertainties that could cause actual results to differ materially from those contained in the prospective financial information, including those in the “Forward Looking Statements” disclaimer. Accordingly, there can be no assurance that the prospective results are indicative of future performance of the combined company after the proposed acquisition or that actual results will not differ materially from those presented in the pro forma information. NON-GAAP FINANCIAL MEASURES These slides contain non-GAAP financial measures. For purposes of Regulation G, a non-GAAP financial measure is a numerical measure of the registrant’s historical or future financial performance, financial position or cash flows that excludes amounts, or is subject to adjustments that have the effect of excluding amounts, that are included in the most directly comparable measure calculated and presented in accordance with GAAP in the statement of income, balance sheet or statement of cash flows (or equivalent statements) of the issuer; or includes amounts, or is subject to adjustments that have the effect of including amounts, that are excluded from the most directly comparable measure so calculated and presented. In this regard, GAAP refers to generally accepted accounting principles in the United States. Pursuant to the requirements of Regulation G, First Merchants Corporation has provided reconciliations within the slides, as necessary, of the non-GAAP financial measure to the most directly comparable GAAP financial measure. 2
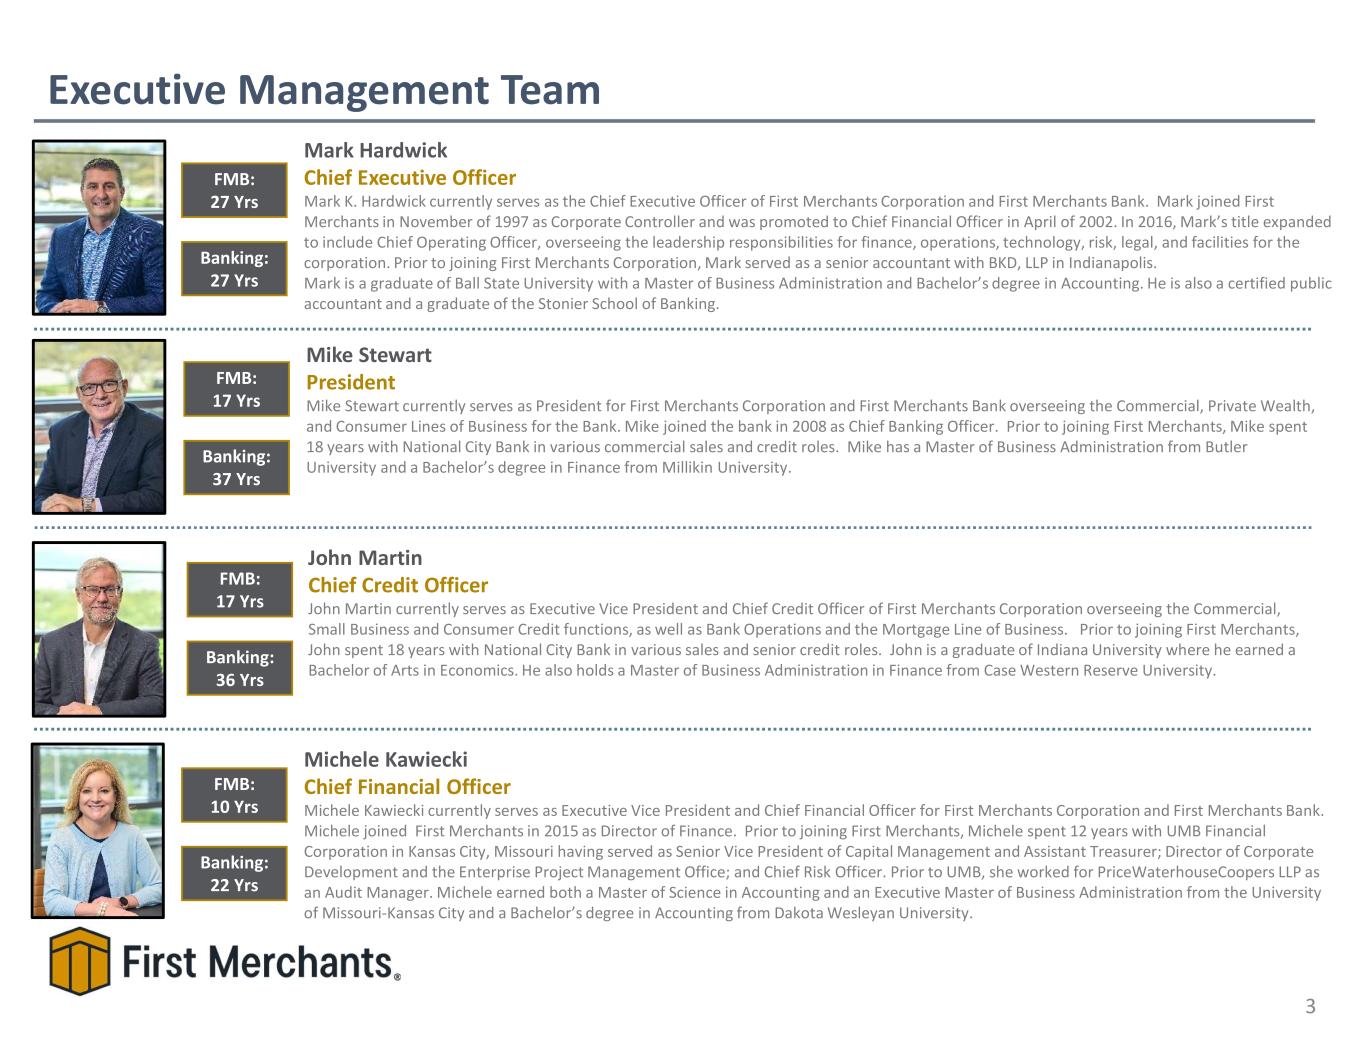
Executive Management Team 3 Mark Hardwick Chief Executive Officer Mark K. Hardwick currently serves as the Chief Executive Officer of First Merchants Corporation and First Merchants Bank. Mark joined First Merchants in November of 1997 as Corporate Controller and was promoted to Chief Financial Officer in April of 2002. In 2016, Mark’s title expanded to include Chief Operating Officer, overseeing the leadership responsibilities for finance, operations, technology, risk, legal, and facilities for the corporation. Prior to joining First Merchants Corporation, Mark served as a senior accountant with BKD, LLP in Indianapolis. Mark is a graduate of Ball State University with a Master of Business Administration and Bachelor’s degree in Accounting. He is also a certified public accountant and a graduate of the Stonier School of Banking. FMB: 27 Yrs Banking: 27 Yrs FMB: 10 Yrs Banking: 22 Yrs Michele Kawiecki Chief Financial Officer Michele Kawiecki currently serves as Executive Vice President and Chief Financial Officer for First Merchants Corporation and First Merchants Bank. Michele joined First Merchants in 2015 as Director of Finance. Prior to joining First Merchants, Michele spent 12 years with UMB Financial Corporation in Kansas City, Missouri having served as Senior Vice President of Capital Management and Assistant Treasurer; Director of Corporate Development and the Enterprise Project Management Office; and Chief Risk Officer. Prior to UMB, she worked for PriceWaterhouseCoopers LLP as an Audit Manager. Michele earned both a Master of Science in Accounting and an Executive Master of Business Administration from the University of Missouri-Kansas City and a Bachelor’s degree in Accounting from Dakota Wesleyan University. FMB: 17 Yrs Banking: 37 Yrs Mike Stewart President Mike Stewart currently serves as President for First Merchants Corporation and First Merchants Bank overseeing the Commercial, Private Wealth, and Consumer Lines of Business for the Bank. Mike joined the bank in 2008 as Chief Banking Officer. Prior to joining First Merchants, Mike spent 18 years with National City Bank in various commercial sales and credit roles. Mike has a Master of Business Administration from Butler University and a Bachelor’s degree in Finance from Millikin University. FMB: 17 Yrs Banking: 36 Yrs John Martin Chief Credit Officer John Martin currently serves as Executive Vice President and Chief Credit Officer of First Merchants Corporation overseeing the Commercial, Small Business and Consumer Credit functions, as well as Bank Operations and the Mortgage Line of Business. Prior to joining First Merchants, John spent 18 years with National City Bank in various sales and senior credit roles. John is a graduate of Indiana University where he earned a Bachelor of Arts in Economics. He also holds a Master of Business Administration in Finance from Case Western Reserve University.
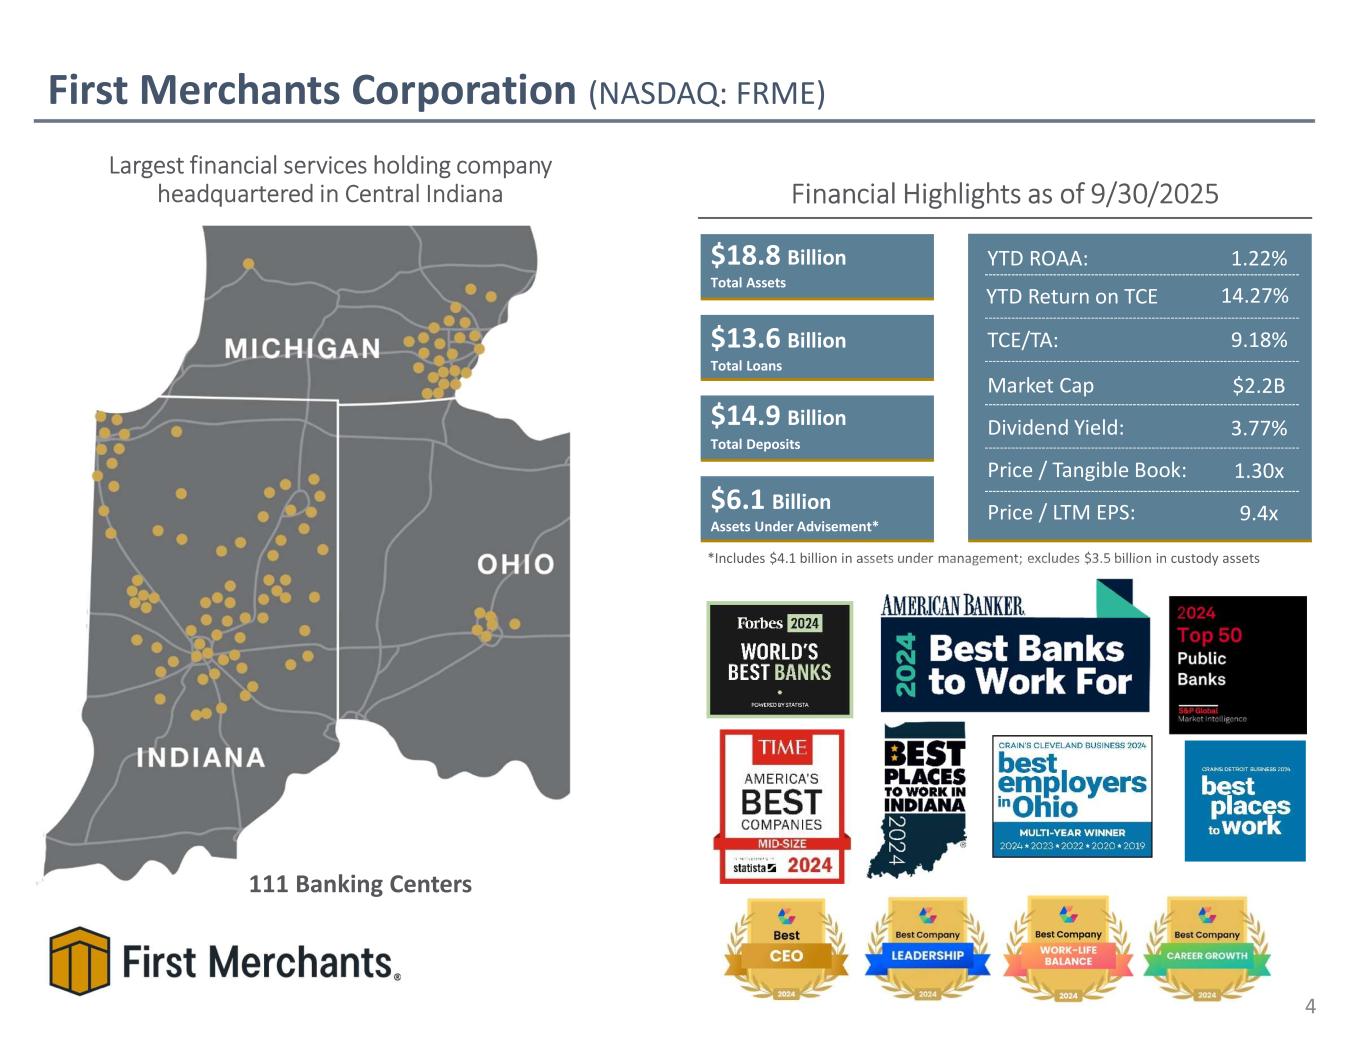
First Merchants Corporation (NASDAQ: FRME) Financial Highlights as of 9/30/2025 $18.8 Billion $13.6 Billion $14.9 Billion $6.1 Billion Assets Under Advisement* Total Assets Total Loans Total Deposits TCE/TA: YTD Return on TCE YTD ROAA: Dividend Yield: Price / Tangible Book: Price / LTM EPS: 1.22% 9.18% 14.27% 3.77% 1.30x 9.4x Market Cap $2.2B Largest financial services holding company headquartered in Central Indiana 111 Banking Centers 4 *Includes $4.1 billion in assets under management; excludes $3.5 billion in custody assets
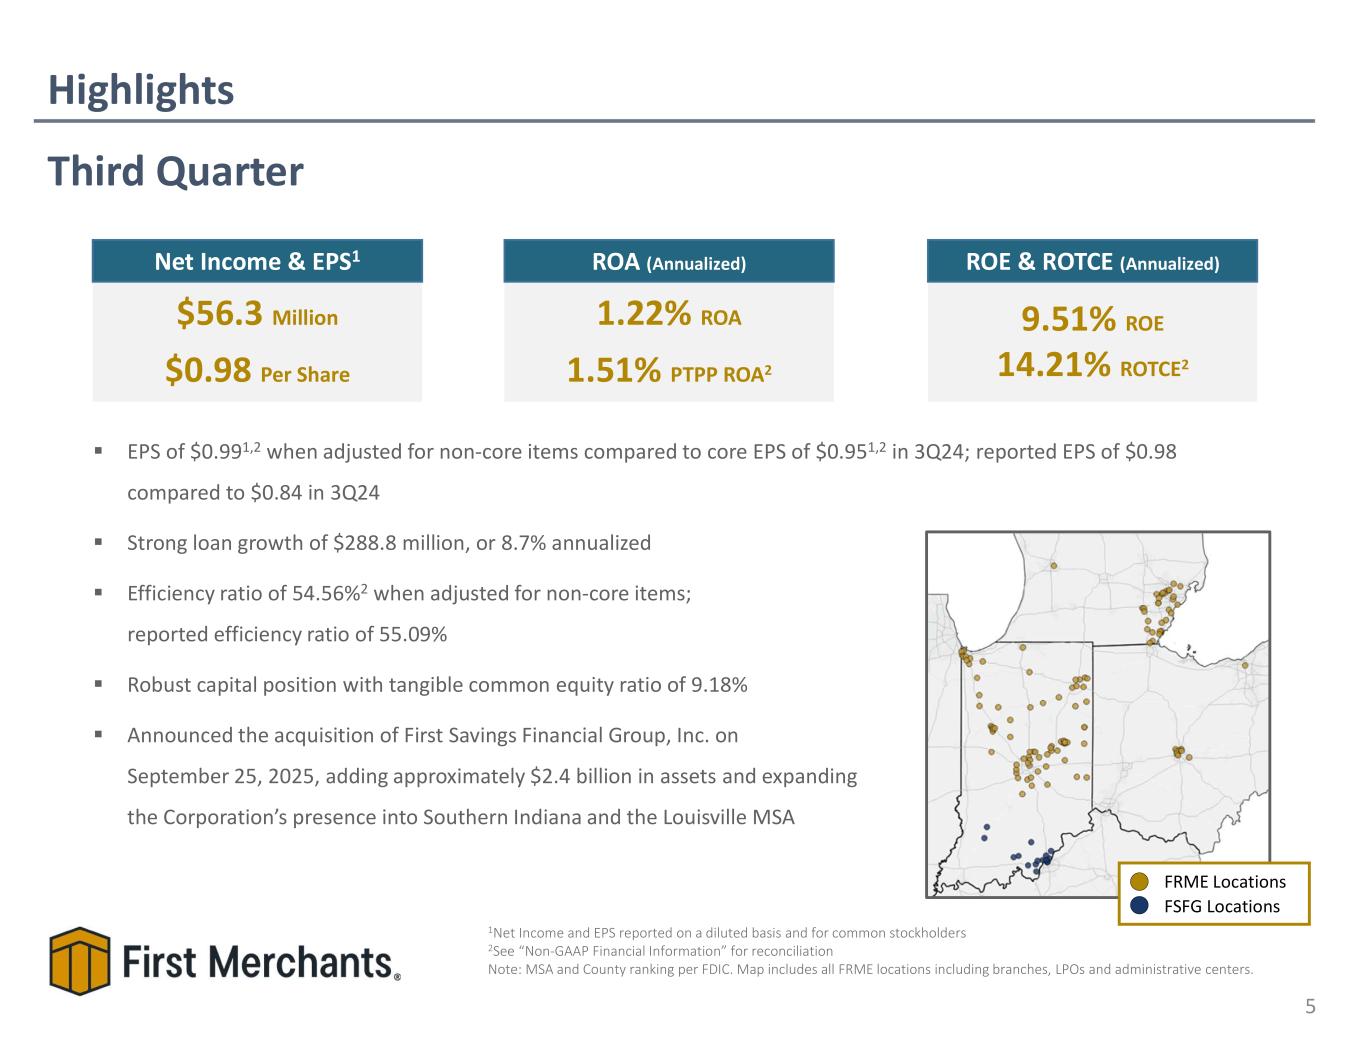
Highlights 5 EPS of $0.991,2 when adjusted for non-core items compared to core EPS of $0.951,2 in 3Q24; reported EPS of $0.98 compared to $0.84 in 3Q24 Strong loan growth of $288.8 million, or 8.7% annualized Efficiency ratio of 54.56%2 when adjusted for non-core items; reported efficiency ratio of 55.09% Robust capital position with tangible common equity ratio of 9.18% Announced the acquisition of First Savings Financial Group, Inc. on September 25, 2025, adding approximately $2.4 billion in assets and expanding the Corporation’s presence into Southern Indiana and the Louisville MSA 9.51% ROE 14.21% ROTCE2 ROE & ROTCE (Annualized) $56.3 Million $0.98 Per Share Net Income & EPS1 1.22% ROA 1.51% PTPP ROA2 ROA (Annualized) 1Net Income and EPS reported on a diluted basis and for common stockholders 2See “Non-GAAP Financial Information” for reconciliation Note: MSA and County ranking per FDIC. Map includes all FRME locations including branches, LPOs and administrative centers. Third Quarter FRME Locations FSFG Locations
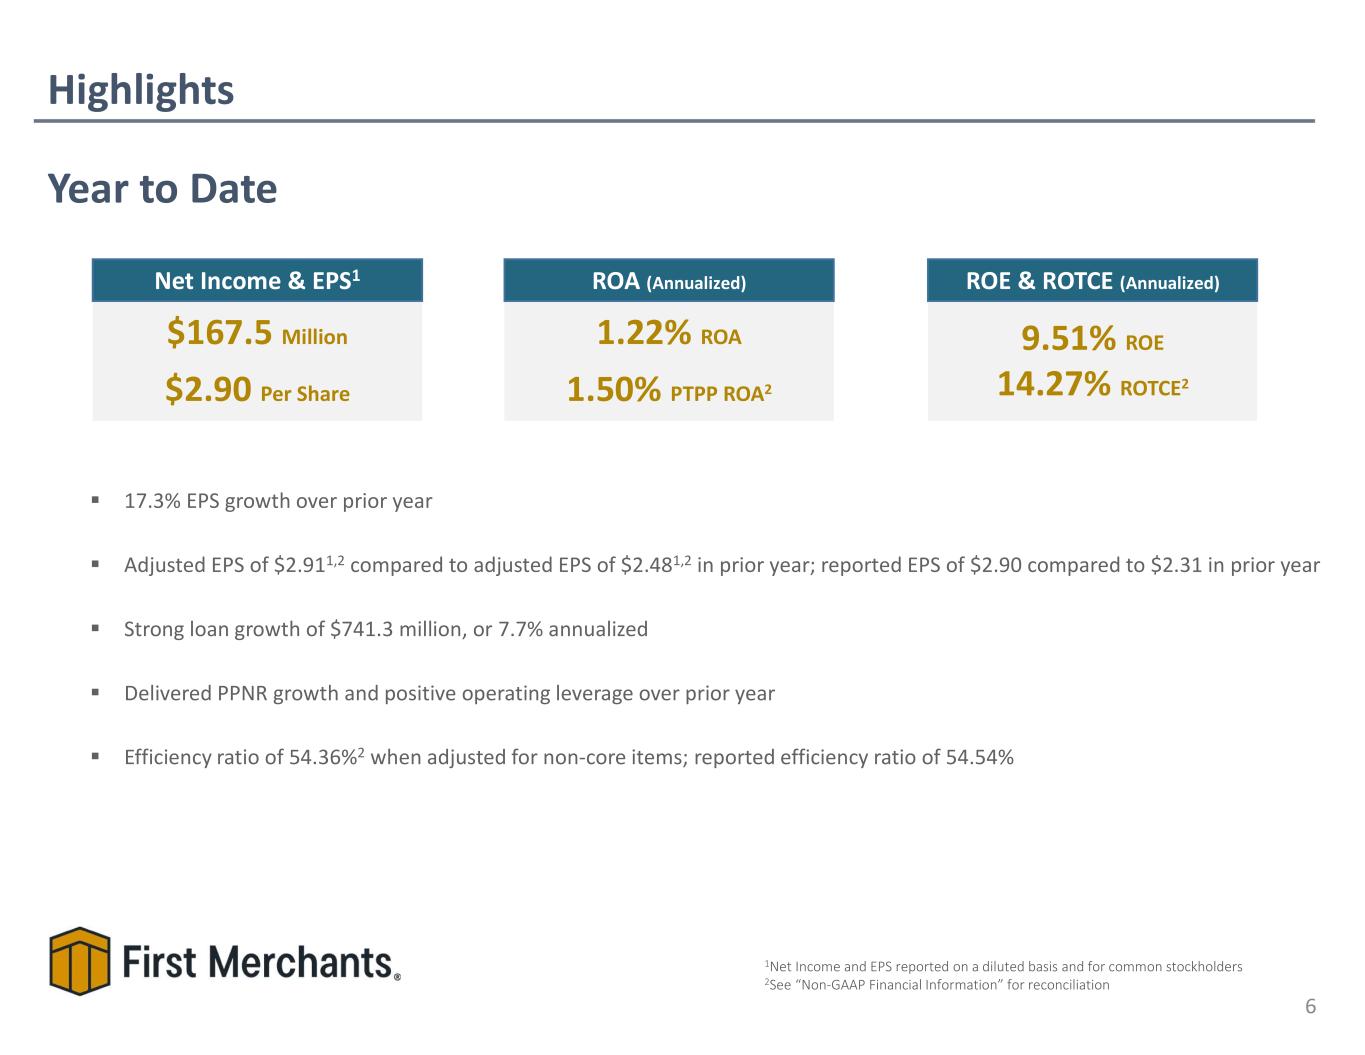
Highlights 6 1Net Income and EPS reported on a diluted basis and for common stockholders 2See “Non-GAAP Financial Information” for reconciliation 9.51% ROE 14.27% ROTCE2 ROE & ROTCE (Annualized) $167.5 Million $2.90 Per Share Net Income & EPS1 1.22% ROA 1.50% PTPP ROA2 ROA (Annualized) Year to Date 17.3% EPS growth over prior year Adjusted EPS of $2.911,2 compared to adjusted EPS of $2.481,2 in prior year; reported EPS of $2.90 compared to $2.31 in prior year Strong loan growth of $741.3 million, or 7.7% annualized Delivered PPNR growth and positive operating leverage over prior year Efficiency ratio of 54.36%2 when adjusted for non-core items; reported efficiency ratio of 54.54%
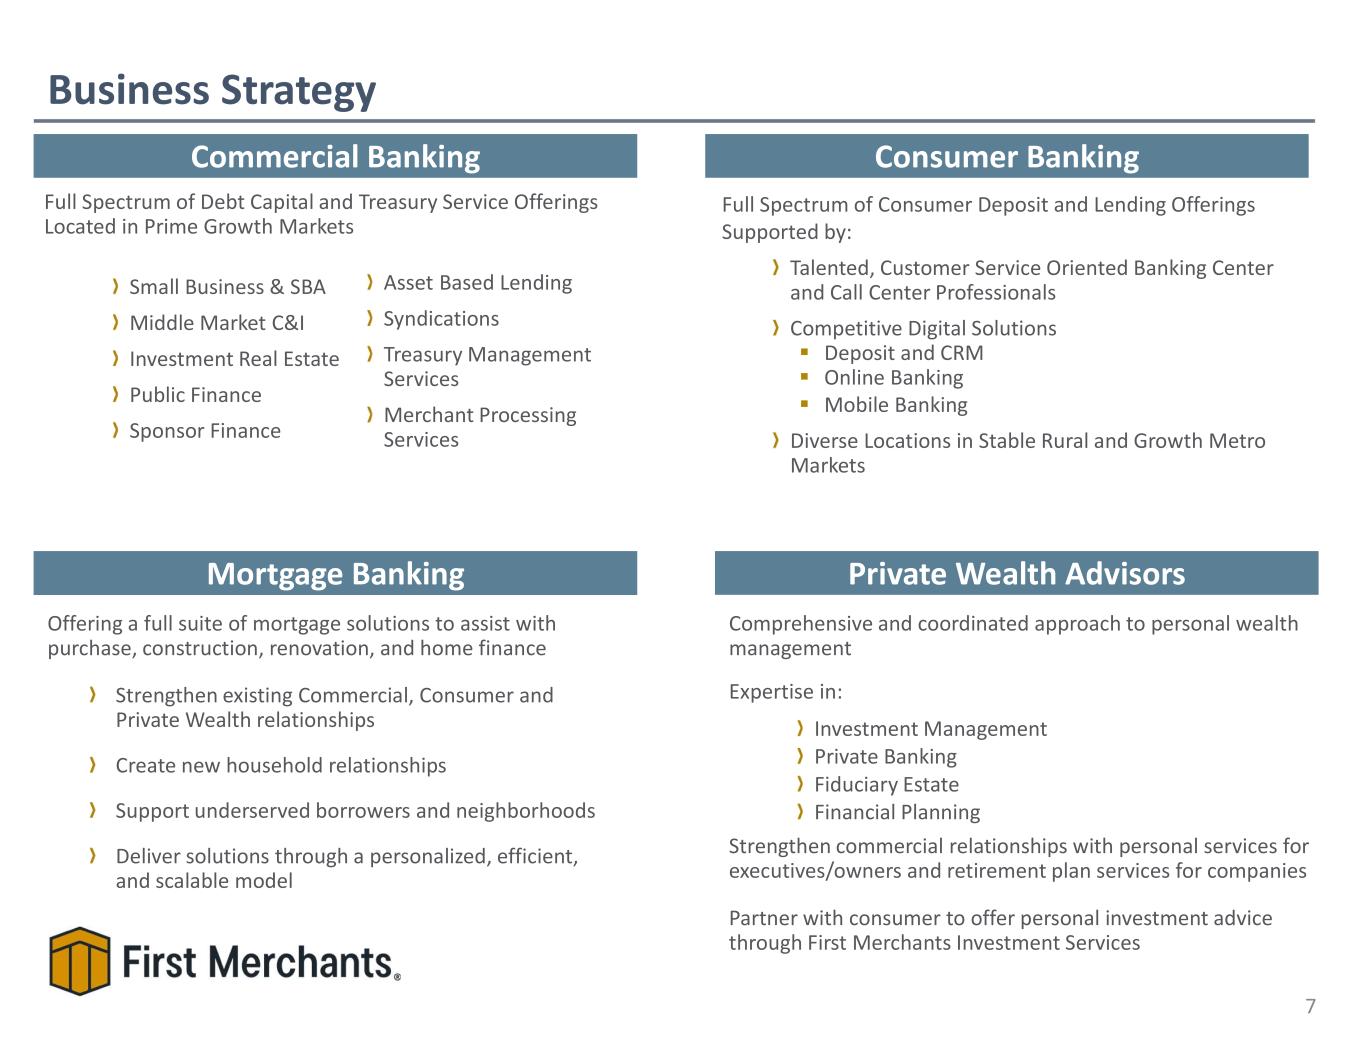
Business Strategy 7 Full Spectrum of Debt Capital and Treasury Service Offerings Located in Prime Growth Markets Small Business & SBA Middle Market C&I Investment Real Estate Public Finance Sponsor Finance Full Spectrum of Consumer Deposit and Lending Offerings Supported by: Talented, Customer Service Oriented Banking Center and Call Center Professionals Competitive Digital Solutions Deposit and CRM Online Banking Mobile Banking Diverse Locations in Stable Rural and Growth Metro Markets Comprehensive and coordinated approach to personal wealth management Expertise in: Investment Management Private Banking Fiduciary Estate Financial Planning Strengthen commercial relationships with personal services for executives/owners and retirement plan services for companies Partner with consumer to offer personal investment advice through First Merchants Investment Services Offering a full suite of mortgage solutions to assist with purchase, construction, renovation, and home finance Strengthen existing Commercial, Consumer and Private Wealth relationships Create new household relationships Support underserved borrowers and neighborhoods Deliver solutions through a personalized, efficient, and scalable model Commercial Banking Private Wealth Advisors Consumer Banking Mortgage Banking Asset Based Lending Syndications Treasury Management Services Merchant Processing Services
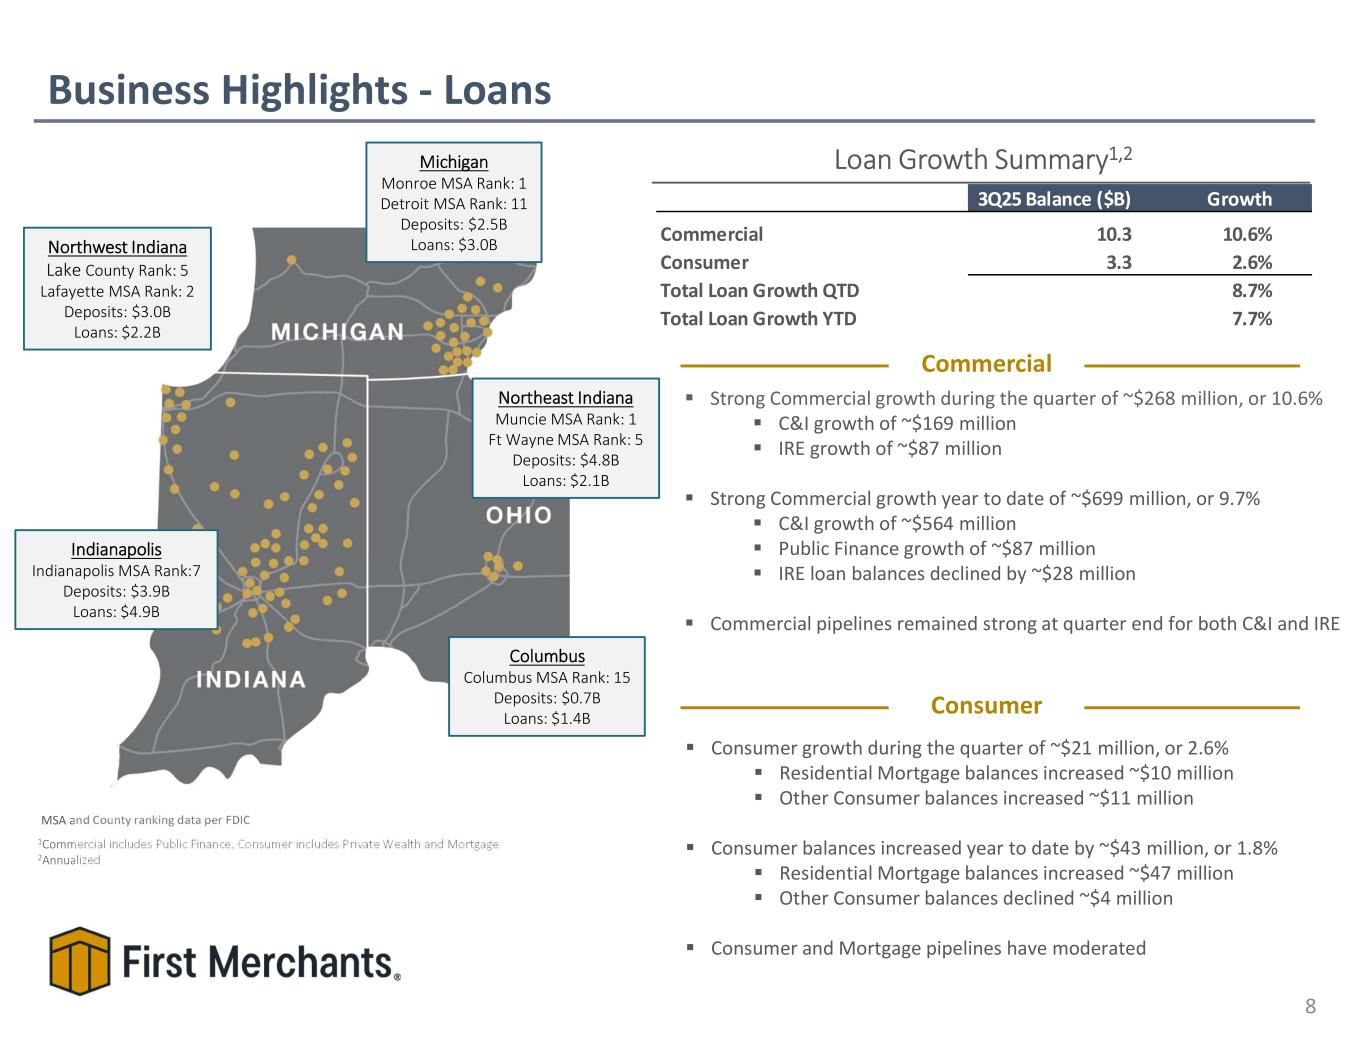
Strong Commercial growth during the quarter of ~$268 million, or 10.6% C&I growth of ~$169 million IRE growth of ~$87 million Strong Commercial growth year to date of ~$699 million, or 9.7% C&I growth of ~$564 million Public Finance growth of ~$87 million IRE loan balances declined by ~$28 million Commercial pipelines remained strong at quarter end for both C&I and IRE Loan Growth Summary1,2 Business Highlights - Loans 8 MSA and County ranking data per FDIC Commercial Consumer 1Commercial includes Public Finance, Consumer includes Private Wealth and Mortgage 2Annualized Indianapolis Indianapolis MSA Rank:7 Deposits: $3.9B Loans: $4.9B Columbus Columbus MSA Rank: 15 Deposits: $0.7B Loans: $1.4B Northwest Indiana Lake County Rank: 5 Lafayette MSA Rank: 2 Deposits: $3.0B Loans: $2.2B Northeast Indiana Muncie MSA Rank: 1 Ft Wayne MSA Rank: 5 Deposits: $4.8B Loans: $2.1B Michigan Monroe MSA Rank: 1 Detroit MSA Rank: 11 Deposits: $2.5B Loans: $3.0B Consumer growth during the quarter of ~$21 million, or 2.6% Residential Mortgage balances increased ~$10 million Other Consumer balances increased ~$11 million Consumer balances increased year to date by ~$43 million, or 1.8% Residential Mortgage balances increased ~$47 million Other Consumer balances declined ~$4 million Consumer and Mortgage pipelines have moderated 3Q25 Balance ($B) Growth Commercial 10.3 10.6% Consumer 3.3 2.6% Total Loan Growth QTD 8.7% Total Loan Growth YTD 7.7%
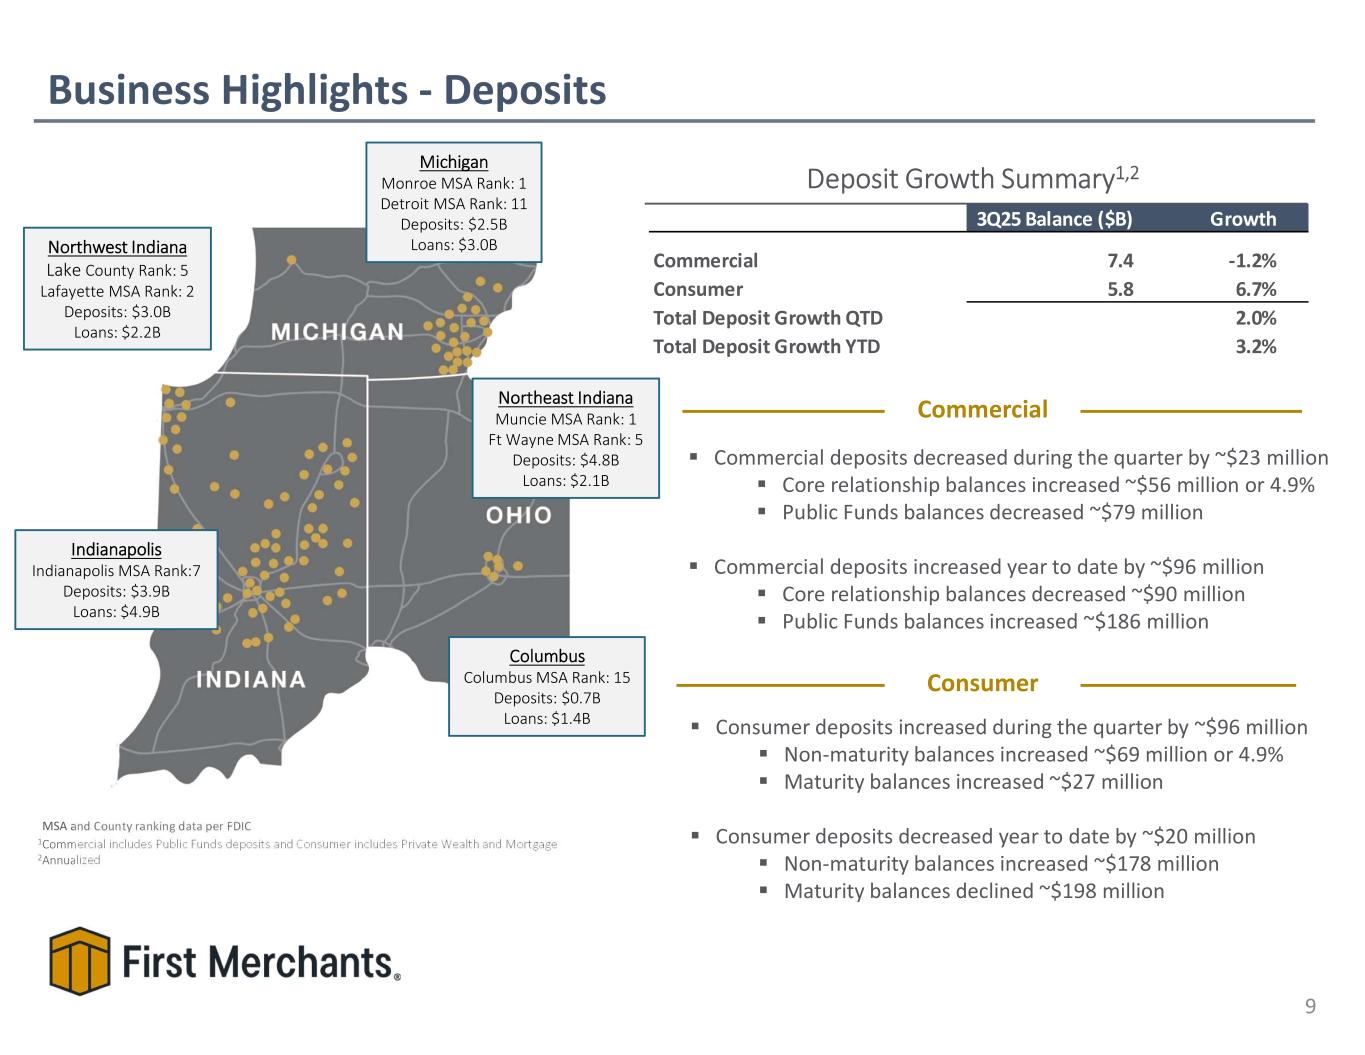
Deposit Growth Summary1,2 Business Highlights - Deposits 9 MSA and County ranking data per FDIC 1Commercial includes Public Funds deposits and Consumer includes Private Wealth and Mortgage 2Annualized Commercial deposits decreased during the quarter by ~$23 million Core relationship balances increased ~$56 million or 4.9% Public Funds balances decreased ~$79 million Commercial deposits increased year to date by ~$96 million Core relationship balances decreased ~$90 million Public Funds balances increased ~$186 million Commercial Consumer Consumer deposits increased during the quarter by ~$96 million Non-maturity balances increased ~$69 million or 4.9% Maturity balances increased ~$27 million Consumer deposits decreased year to date by ~$20 million Non-maturity balances increased ~$178 million Maturity balances declined ~$198 million 3Q25 Balance ($B) Growth Commercial 7.4 -1.2% Consumer 5.8 6.7% Total Deposit Growth QTD 2.0% Total Deposit Growth YTD 3.2% Indianapolis Indianapolis MSA Rank:7 Deposits: $3.9B Loans: $4.9B Columbus Columbus MSA Rank: 15 Deposits: $0.7B Loans: $1.4B Northwest Indiana Lake County Rank: 5 Lafayette MSA Rank: 2 Deposits: $3.0B Loans: $2.2B Northeast Indiana Muncie MSA Rank: 1 Ft Wayne MSA Rank: 5 Deposits: $4.8B Loans: $2.1B Michigan Monroe MSA Rank: 1 Detroit MSA Rank: 11 Deposits: $2.5B Loans: $3.0B
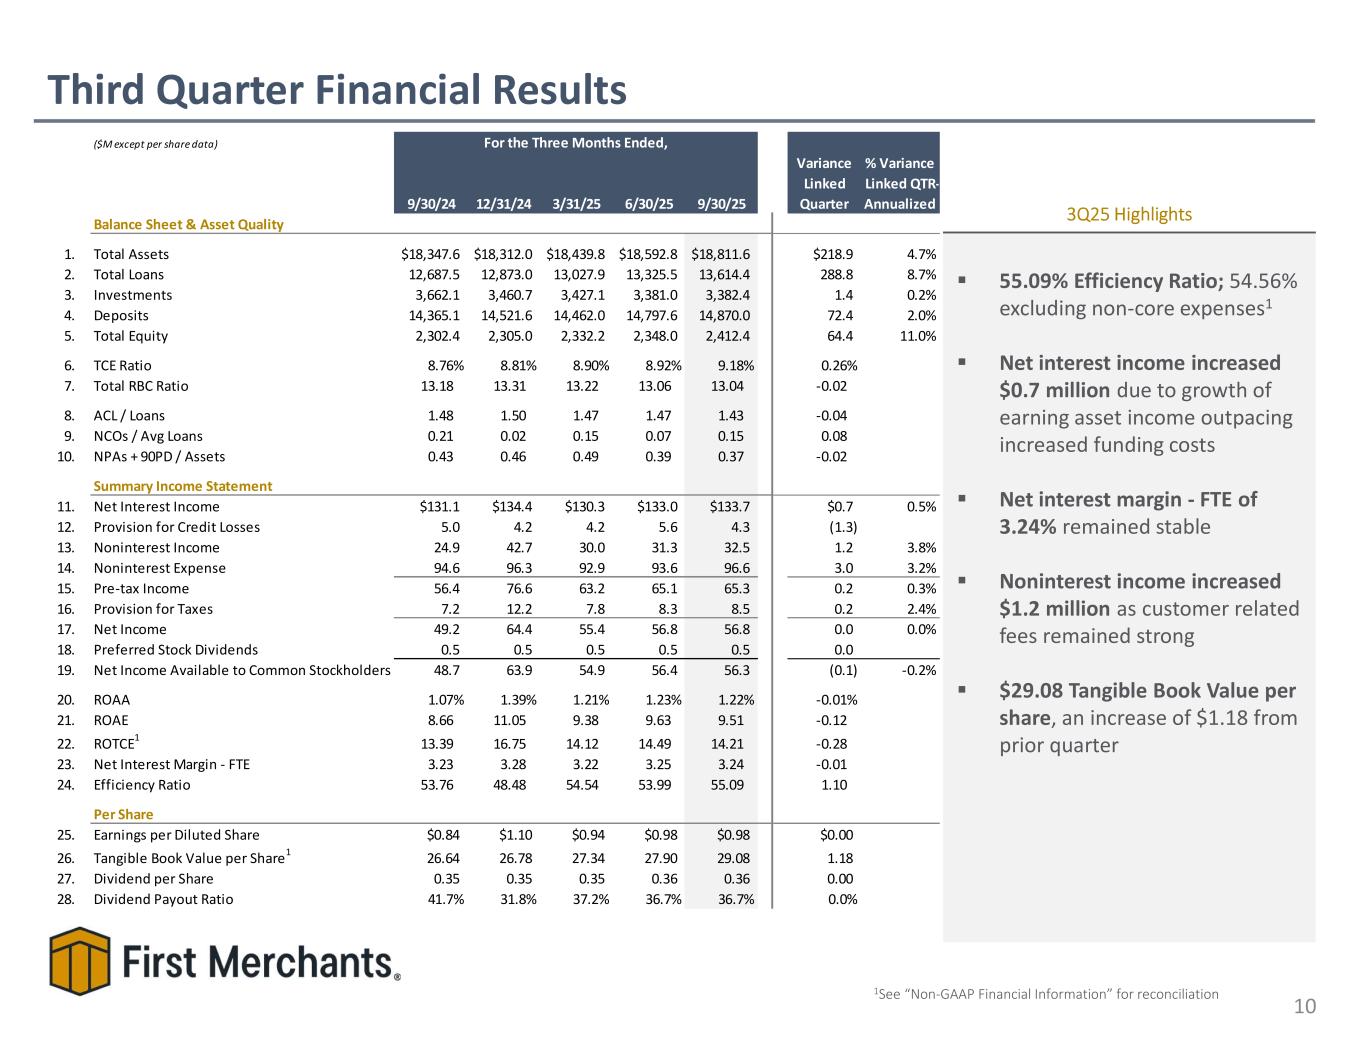
Third Quarter Financial Results 10 55.09% Efficiency Ratio; 54.56% excluding non-core expenses1 Net interest income increased $0.7 million due to growth of earning asset income outpacing increased funding costs Net interest margin - FTE of 3.24% remained stable Noninterest income increased $1.2 million as customer related fees remained strong $29.08 Tangible Book Value per share, an increase of $1.18 from prior quarter 3Q25 Highlights 1See “Non-GAAP Financial Information” for reconciliation ($M except per share data) 9/30/24 12/31/24 3/31/25 6/30/25 9/30/25 Variance Linked Quarter % Variance Linked QTR- Annualized Balance Sheet & Asset Quality 1. Total Assets $18,347.6 $18,312.0 $18,439.8 $18,592.8 $18,811.6 $218.9 4.7% 2. Total Loans 12,687.5 12,873.0 13,027.9 13,325.5 13,614.4 288.8 8.7% 3. Investments 3,662.1 3,460.7 3,427.1 3,381.0 3,382.4 1.4 0.2% 4. Deposits 14,365.1 14,521.6 14,462.0 14,797.6 14,870.0 72.4 2.0% 5. Total Equity 2,302.4 2,305.0 2,332.2 2,348.0 2,412.4 64.4 11.0% 6. TCE Ratio 8.76% 8.81% 8.90% 8.92% 9.18% 0.26% 7. Total RBC Ratio 13.18 13.31 13.22 13.06 13.04 -0.02 8. ACL / Loans 1.48 1.50 1.47 1.47 1.43 -0.04 9. NCOs / Avg Loans 0.21 0.02 0.15 0.07 0.15 0.08 10. NPAs + 90PD / Assets 0.43 0.46 0.49 0.39 0.37 -0.02 Summary Income Statement 11. Net Interest Income $131.1 $134.4 $130.3 $133.0 $133.7 $0.7 0.5% 12. Provision for Credit Losses 5.0 4.2 4.2 5.6 4.3 (1.3) 13. Noninterest Income 24.9 42.7 30.0 31.3 32.5 1.2 3.8% 14. Noninterest Expense 94.6 96.3 92.9 93.6 96.6 3.0 3.2% 15. Pre-tax Income 56.4 76.6 63.2 65.1 65.3 0.2 0.3% 16. Provision for Taxes 7.2 12.2 7.8 8.3 8.5 0.2 2.4% 17. Net Income 49.2 64.4 55.4 56.8 56.8 0.0 0.0% 18. Preferred Stock Dividends 0.5 0.5 0.5 0.5 0.5 0.0 19. Net Income Available to Common Stockholders 48.7 63.9 54.9 56.4 56.3 (0.1) -0.2% 20. ROAA 1.07% 1.39% 1.21% 1.23% 1.22% -0.01% 21. ROAE 8.66 11.05 9.38 9.63 9.51 -0.12 22. ROTCE1 13.39 16.75 14.12 14.49 14.21 -0.28 23. Net Interest Margin - FTE 3.23 3.28 3.22 3.25 3.24 -0.01 24. Efficiency Ratio 53.76 48.48 54.54 53.99 55.09 1.10 Per Share 25. Earnings per Diluted Share $0.84 $1.10 $0.94 $0.98 $0.98 $0.00 26. Tangible Book Value per Share1 26.64 26.78 27.34 27.90 29.08 1.18 27. Dividend per Share 0.35 0.35 0.35 0.36 0.36 0.00 28. Dividend Payout Ratio 41.7% 31.8% 37.2% 36.7% 36.7% 0.0% For the Three Months Ended,
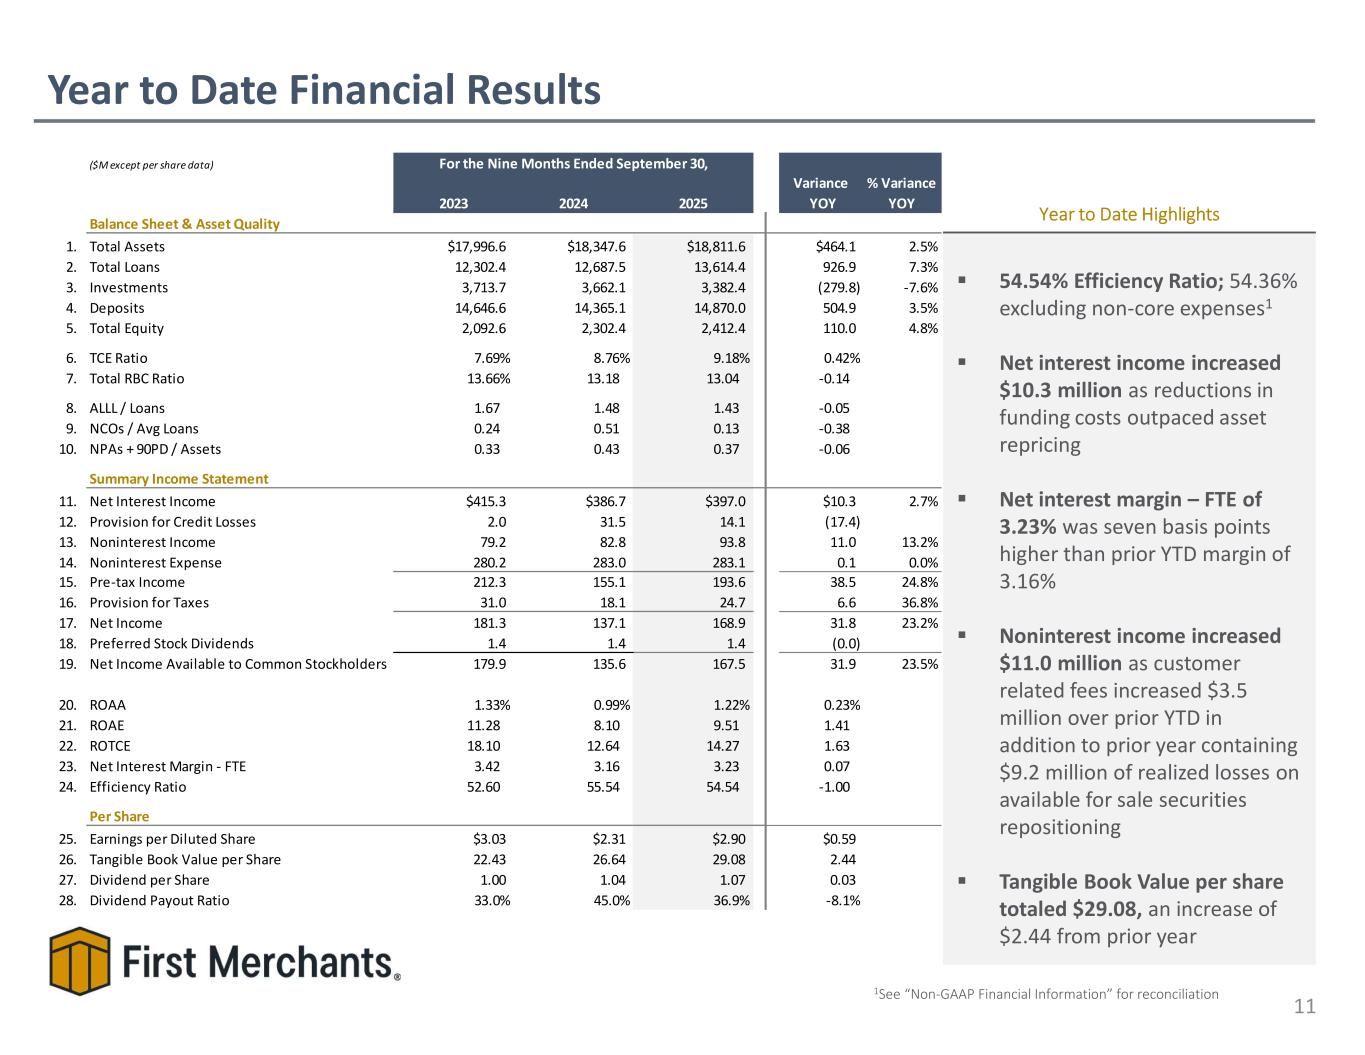
Year to Date Financial Results 11 54.54% Efficiency Ratio; 54.36% excluding non-core expenses1 Net interest income increased $10.3 million as reductions in funding costs outpaced asset repricing Net interest margin – FTE of 3.23% was seven basis points higher than prior YTD margin of 3.16% Noninterest income increased $11.0 million as customer related fees increased $3.5 million over prior YTD in addition to prior year containing $9.2 million of realized losses on available for sale securities repositioning Tangible Book Value per share totaled $29.08, an increase of $2.44 from prior year Year to Date Highlights 1See “Non-GAAP Financial Information” for reconciliation ($M except per share data) 2023 2024 2025 Variance YOY % Variance YOY Balance Sheet & Asset Quality 1. Total Assets $17,996.6 $18,347.6 $18,811.6 $464.1 2.5% 2. Total Loans 12,302.4 12,687.5 13,614.4 926.9 7.3% 3. Investments 3,713.7 3,662.1 3,382.4 (279.8) -7.6% 4. Deposits 14,646.6 14,365.1 14,870.0 504.9 3.5% 5. Total Equity 2,092.6 2,302.4 2,412.4 110.0 4.8% 6. TCE Ratio 7.69% 8.76% 9.18% 0.42% 7. Total RBC Ratio 13.66% 13.18 13.04 -0.14 8. ALLL / Loans 1.67 1.48 1.43 -0.05 9. NCOs / Avg Loans 0.24 0.51 0.13 -0.38 10. NPAs + 90PD / Assets 0.33 0.43 0.37 -0.06 Summary Income Statement 11. Net Interest Income $415.3 $386.7 $397.0 $10.3 2.7% 12. Provision for Credit Losses 2.0 31.5 14.1 (17.4) 13. Noninterest Income 79.2 82.8 93.8 11.0 13.2% 14. Noninterest Expense 280.2 283.0 283.1 0.1 0.0% 15. Pre-tax Income 212.3 155.1 193.6 38.5 24.8% 16. Provision for Taxes 31.0 18.1 24.7 6.6 36.8% 17. Net Income 181.3 137.1 168.9 31.8 23.2% 18. Preferred Stock Dividends 1.4 1.4 1.4 (0.0) 19. Net Income Available to Common Stockholders 179.9 135.6 167.5 31.9 23.5% 20. ROAA 1.33% 0.99% 1.22% 0.23% 21. ROAE 11.28 8.10 9.51 1.41 22. ROTCE 18.10 12.64 14.27 1.63 23. Net Interest Margin - FTE 3.42 3.16 3.23 0.07 24. Efficiency Ratio 52.60 55.54 54.54 -1.00 Per Share 25. Earnings per Diluted Share $3.03 $2.31 $2.90 $0.59 26. Tangible Book Value per Share 22.43 26.64 29.08 2.44 27. Dividend per Share 1.00 1.04 1.07 0.03 28. Dividend Payout Ratio 33.0% 45.0% 36.9% -8.1% For the Nine Months Ended September 30,
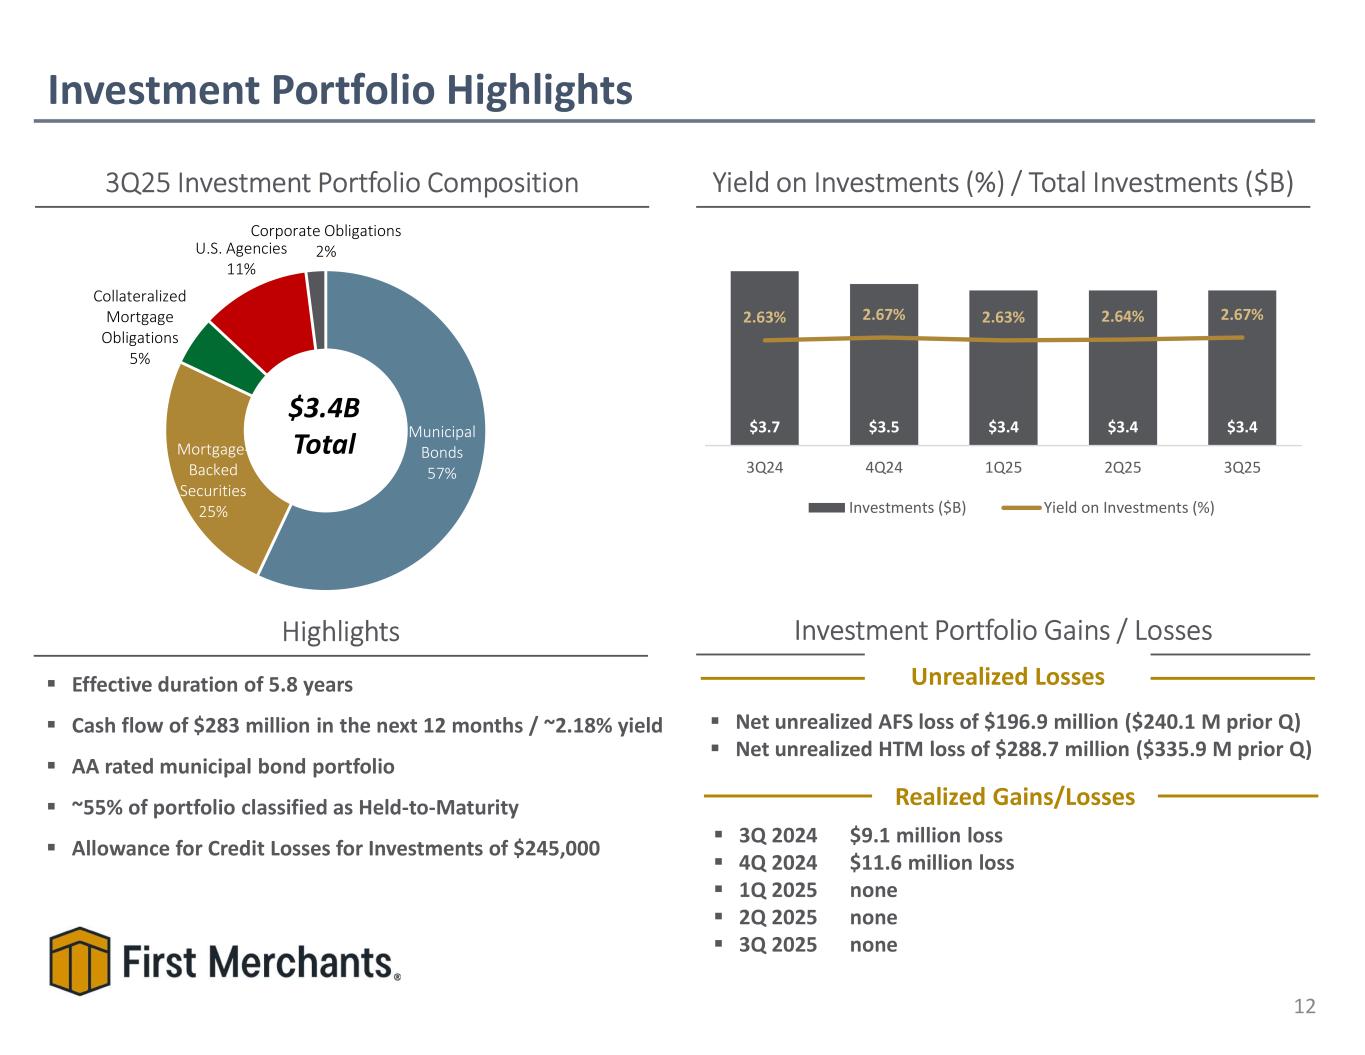
Net unrealized AFS loss of $196.9 million ($240.1 M prior Q) Net unrealized HTM loss of $288.7 million ($335.9 M prior Q) Investment Portfolio Highlights 12 3Q25 Investment Portfolio Composition Yield on Investments (%) / Total Investments ($B) $3.4B Total Investment Portfolio Gains / LossesHighlights Realized Gains/Losses 3Q 2024 $9.1 million loss 4Q 2024 $11.6 million loss 1Q 2025 none 2Q 2025 none 3Q 2025 none Unrealized Losses Effective duration of 5.8 years Cash flow of $283 million in the next 12 months / ~2.18% yield AA rated municipal bond portfolio ~55% of portfolio classified as Held-to-Maturity Allowance for Credit Losses for Investments of $245,000 Municipal Bonds 57% Mortgage- Backed Securities 25% Collateralized Mortgage Obligations 5% U.S. Agencies 11% Corporate Obligations 2% $3.7 $3.5 $3.4 $3.4 $3.4 2.63% 2.67% 2.63% 2.64% 2.67% 3Q24 4Q24 1Q25 2Q25 3Q25 Investments ($B) Yield on Investments (%)
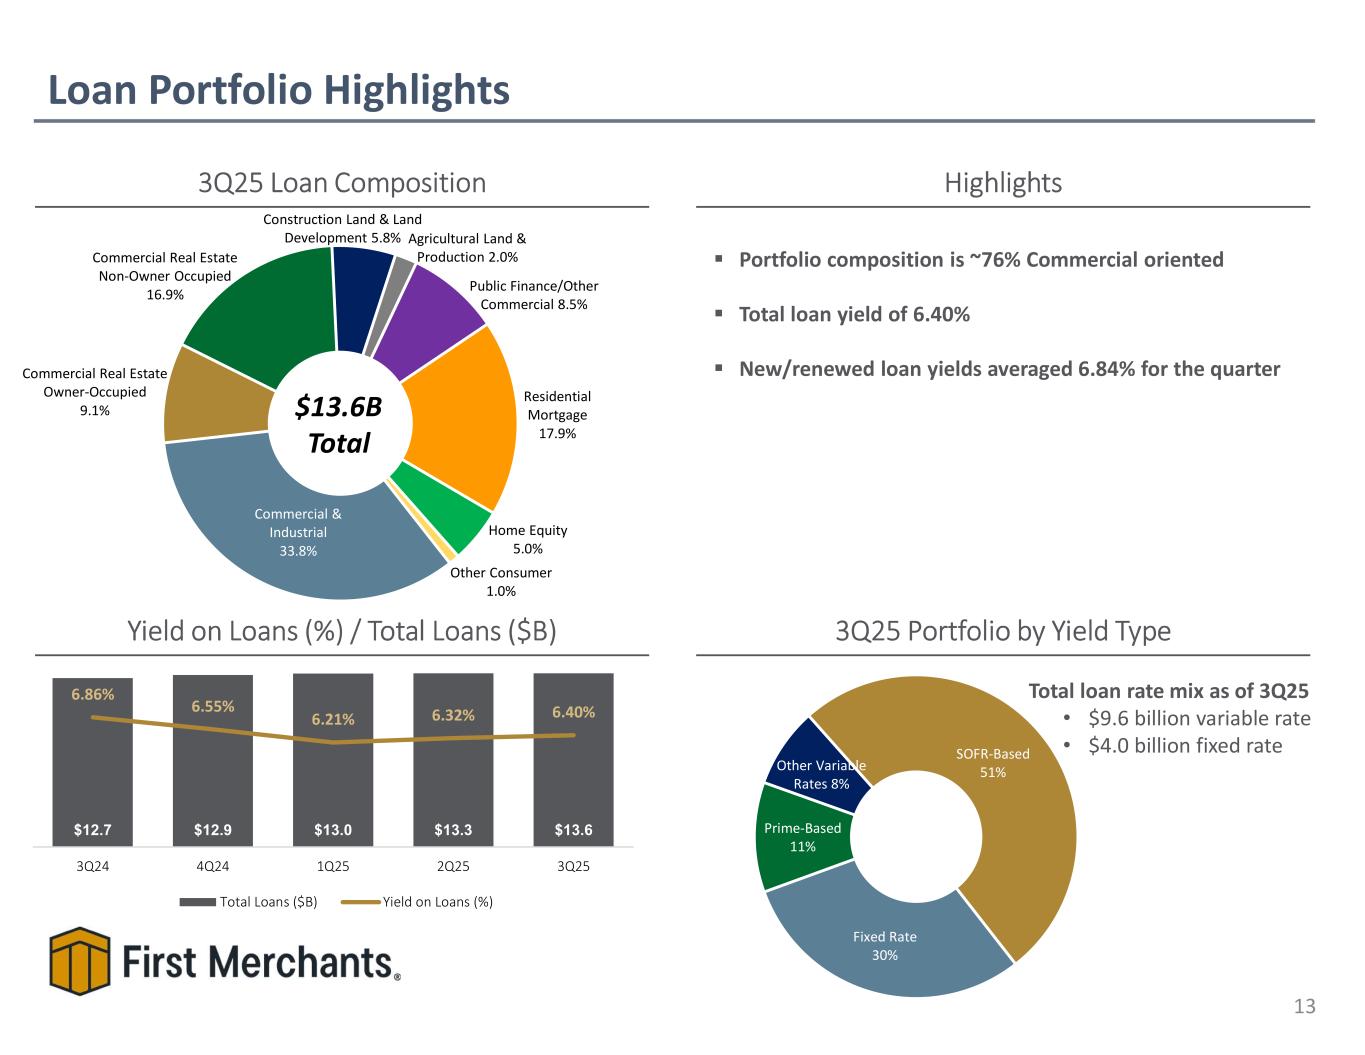
Loan Portfolio Highlights 13 3Q25 Loan Composition Yield on Loans (%) / Total Loans ($B) $13.6B Total 3Q25 Portfolio by Yield Type Highlights Total loan rate mix as of 3Q25 • $9.6 billion variable rate • $4.0 billion fixed rate Portfolio composition is ~76% Commercial oriented Total loan yield of 6.40% New/renewed loan yields averaged 6.84% for the quarter $0.9 $0.7 $0.7$0.4$0.7$0.7 Commercial & Industrial 33.8% Commercial Real Estate Owner-Occupied 9.1% Commercial Real Estate Non-Owner Occupied 16.9% Construction Land & Land Development 5.8% Agricultural Land & Production 2.0% Public Finance/Other Commercial 8.5% Residential Mortgage 17.9% Home Equity 5.0% Other Consumer 1.0% Fixed Rate 30% Prime-Based 11% Other Variable Rates 8% SOFR-Based 51% $12.7 $12.9 $13.0 $13.3 $13.6 6.86% 6.55% 6.21% 6.32% 6.40% 3Q24 4Q24 1Q25 2Q25 3Q25 Total Loans ($B) Yield on Loans (%)

Allowance for Credit Losses - Loans 14 3Q25 Allowance for Credit Losses - Loans Highlights Change in ACL – Loans $4.3 million Q3 provision The reserve for unfunded commitments totals $18.0 million and is recorded in Other Liabilities The remaining fair value accretion on acquired loans is $14.4 million inclusive of credit and interest rate marks $187.8 $192.8 $192.0 $195.3 $194.5 1.48% 1.50% 1.47% 1.47% 1.43% 3Q24 4Q24 1Q25 2Q25 3Q25 Allowance Allowance to Loans $204,934 $192,757 $194,468 $37,200 $14,100 $49,377 $12,389 ACL - Loans 12/31/2023 Net Charge-offs 2024 Provision 2024 ACL - Loans 12/31/2024 Net Charge-offs 2025 YTD Provision 2025 YTD ACL - Loans 9/30/2025 Increase Decrease
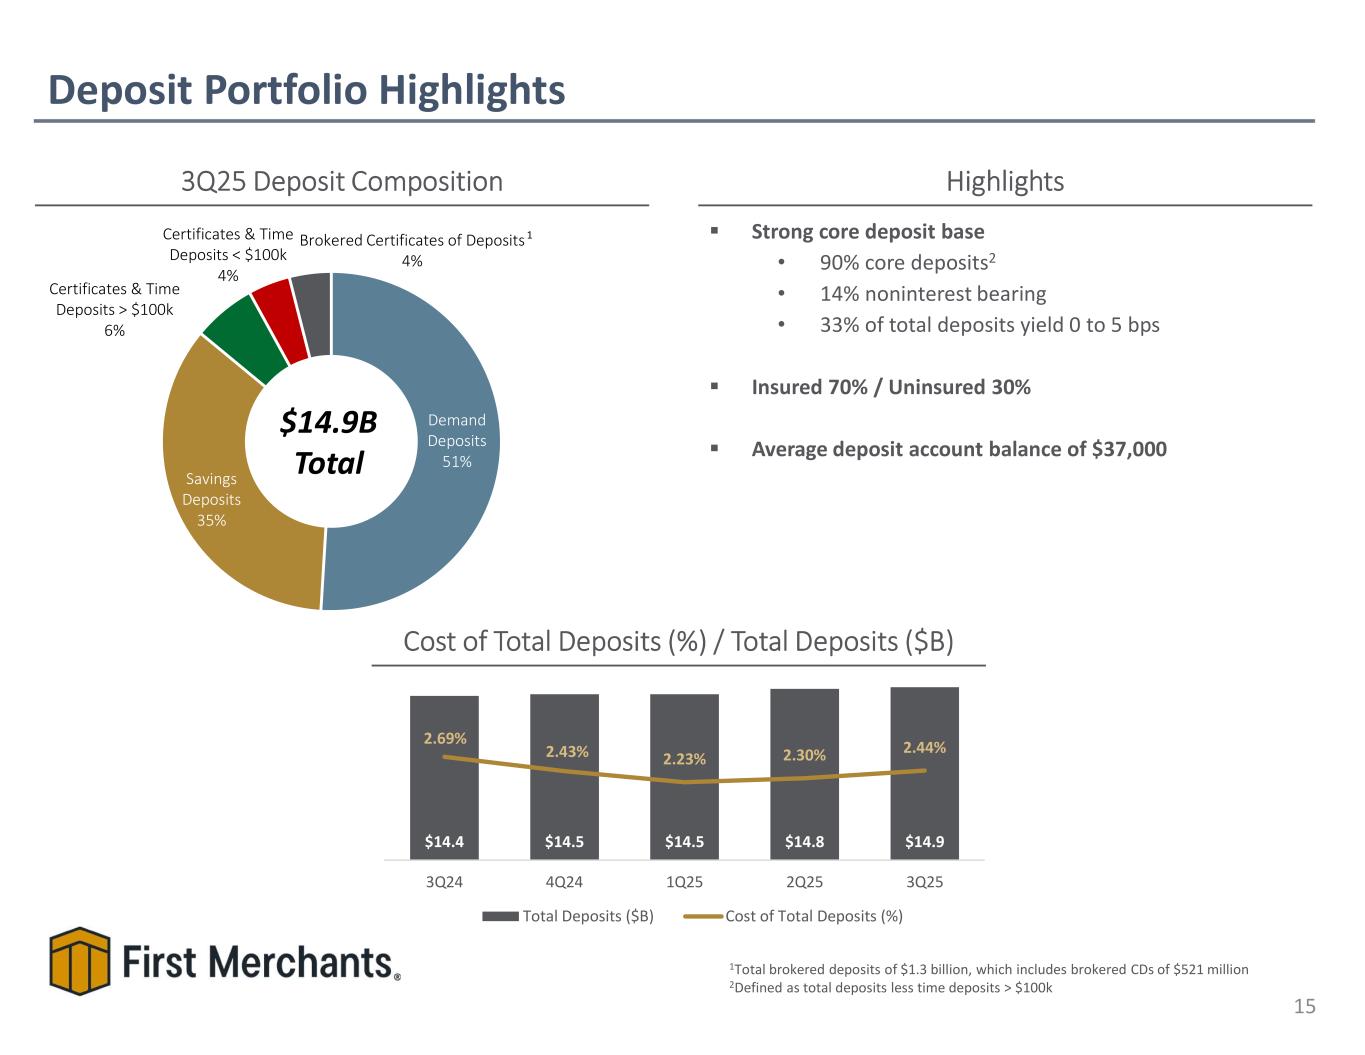
Demand Deposits 51% Savings Deposits 35% Certificates & Time Deposits > $100k 6% Certificates & Time Deposits < $100k 4% Brokered Certificates of Deposits 4% Deposit Portfolio Highlights 15 3Q25 Deposit Composition Highlights $14.9B Total 1Total brokered deposits of $1.3 billion, which includes brokered CDs of $521 million 2Defined as total deposits less time deposits > $100k Cost of Total Deposits (%) / Total Deposits ($B) Strong core deposit base • 90% core deposits2 • 14% noninterest bearing • 33% of total deposits yield 0 to 5 bps Insured 70% / Uninsured 30% Average deposit account balance of $37,000 1 $14.4 $14.5 $14.5 $14.8 $14.9 2.69% 2.43% 2.23% 2.30% 2.44% 3Q24 4Q24 1Q25 2Q25 3Q25 Total Deposits ($B) Cost of Total Deposits (%)

Net Interest Margin 16 $105.1$97.1 $97.3 $105.1 $107.0$97.8 $107.0 $97.3 $105.1 $110.0$109.2$107.0 $105.1 $109.2 $110.0 $106.9 1Adjusted for Fair Value Accretion $137.0 $140.2 $136.4 $139.2 $139.9 3.23% 3.28% 3.22% 3.25% 3.24% 3Q24 4Q24 1Q25 2Q25 3Q25 Net Interest Income - FTE ($millions) Net Interest Margin - FTE 3Q24 4Q24 1Q25 2Q25 3Q25 1. Net Interest Income - FTE ($millions) $ 137.0 $ 140.2 $ 136.4 $ 139.2 $ 139.9 2. Fair Value Accretion $ 1.4 $ 1.4 $ 1.1 $ 1.0 $ 0.9 3. Adjusted Net Interest Income - FTE1 $ 135.6 $ 138.8 $ 135.3 $ 138.2 $ 139.0 4. Tax Equivalent Yield on Earning Assets 5.82% 5.63% 5.39% 5.50% 5.58% 5. Interest Expense/Average Earning Assets 2.59% 2.35% 2.17% 2.25% 2.34% 6. Net Interest Margin - FTE 3.23% 3.28% 3.22% 3.25% 3.24% 7. Fair Value Accretion Effect 0.04% 0.03% 0.03% 0.03% 0.02% 8. Adjusted Net Interest Margin1 3.19% 3.25% 3.19% 3.22% 3.22%
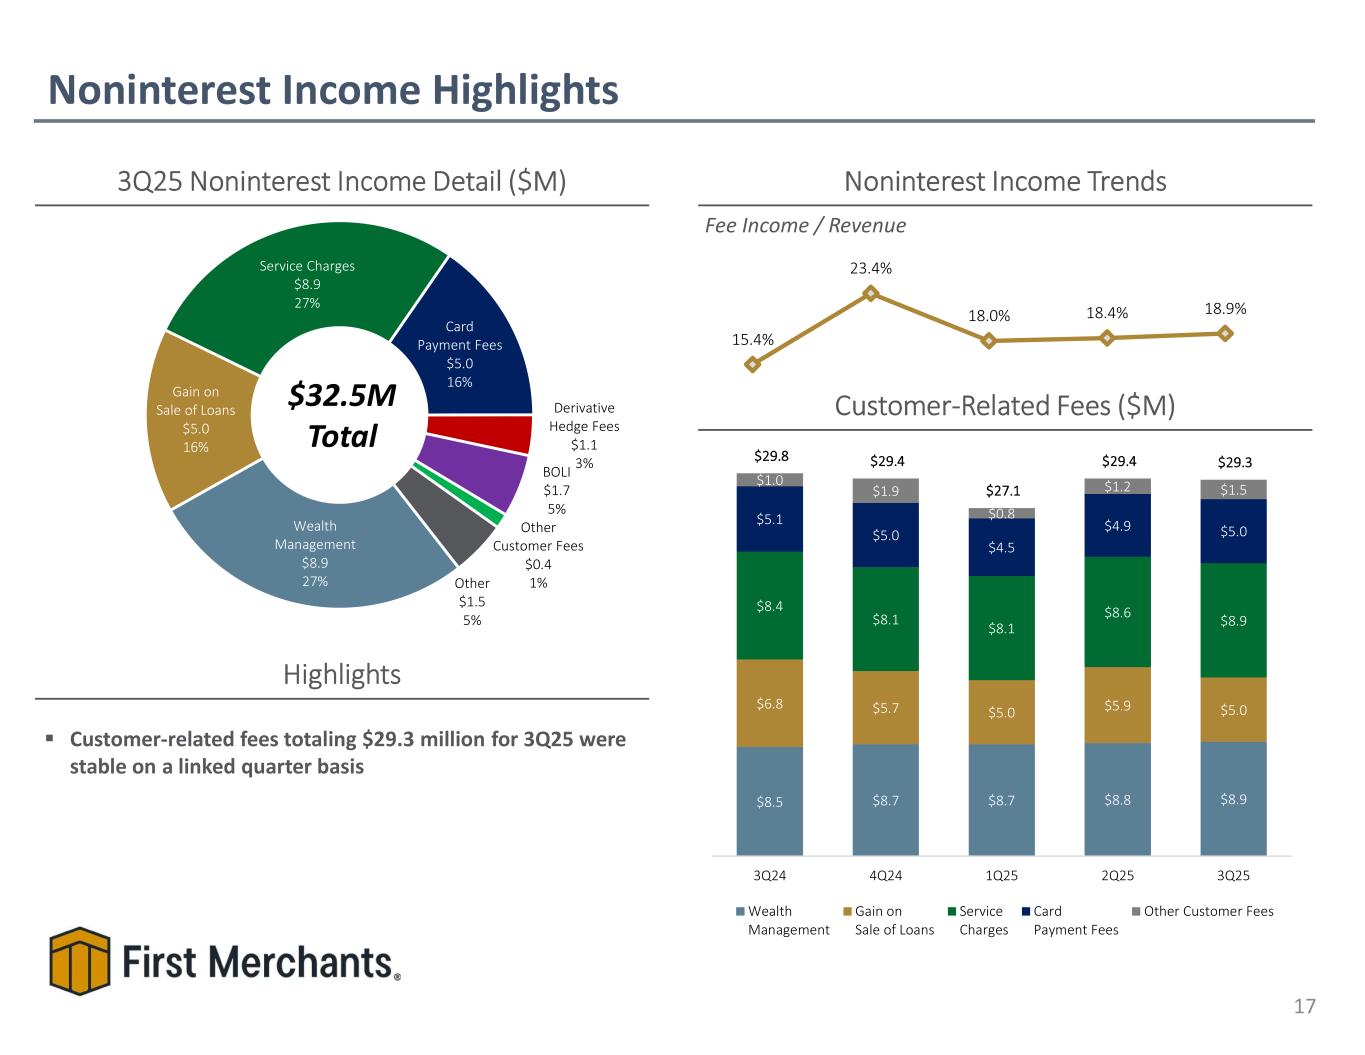
Wealth Management $8.9 27% Gain on Sale of Loans $5.0 16% Service Charges $8.9 27% Card Payment Fees $5.0 16% Derivative Hedge Fees $1.1 3%BOLI $1.7 5% Other Customer Fees $0.4 1%Other $1.5 5% Noninterest Income Highlights 17 3Q25 Noninterest Income Detail ($M) $32.5M Total Noninterest Income Trends Fee Income / Revenue Highlights Customer-related fees totaling $29.3 million for 3Q25 were stable on a linked quarter basis Customer-Related Fees ($M) 15.4% 23.4% 18.0% 18.4% 18.9% $8.5 $8.7 $8.7 $8.8 $8.9 $6.8 $5.7 $5.0 $5.9 $5.0 $8.4 $8.1 $8.1 $8.6 $8.9 $5.1 $5.0 $4.5 $4.9 $5.0 $1.0 $1.9 $0.8 $1.2 $1.5 $29.8 $29.4 $27.1 $29.4 $29.3 3Q24 4Q24 1Q25 2Q25 3Q25 Wealth Management Gain on Sale of Loans Service Charges Card Payment Fees Other Customer Fees
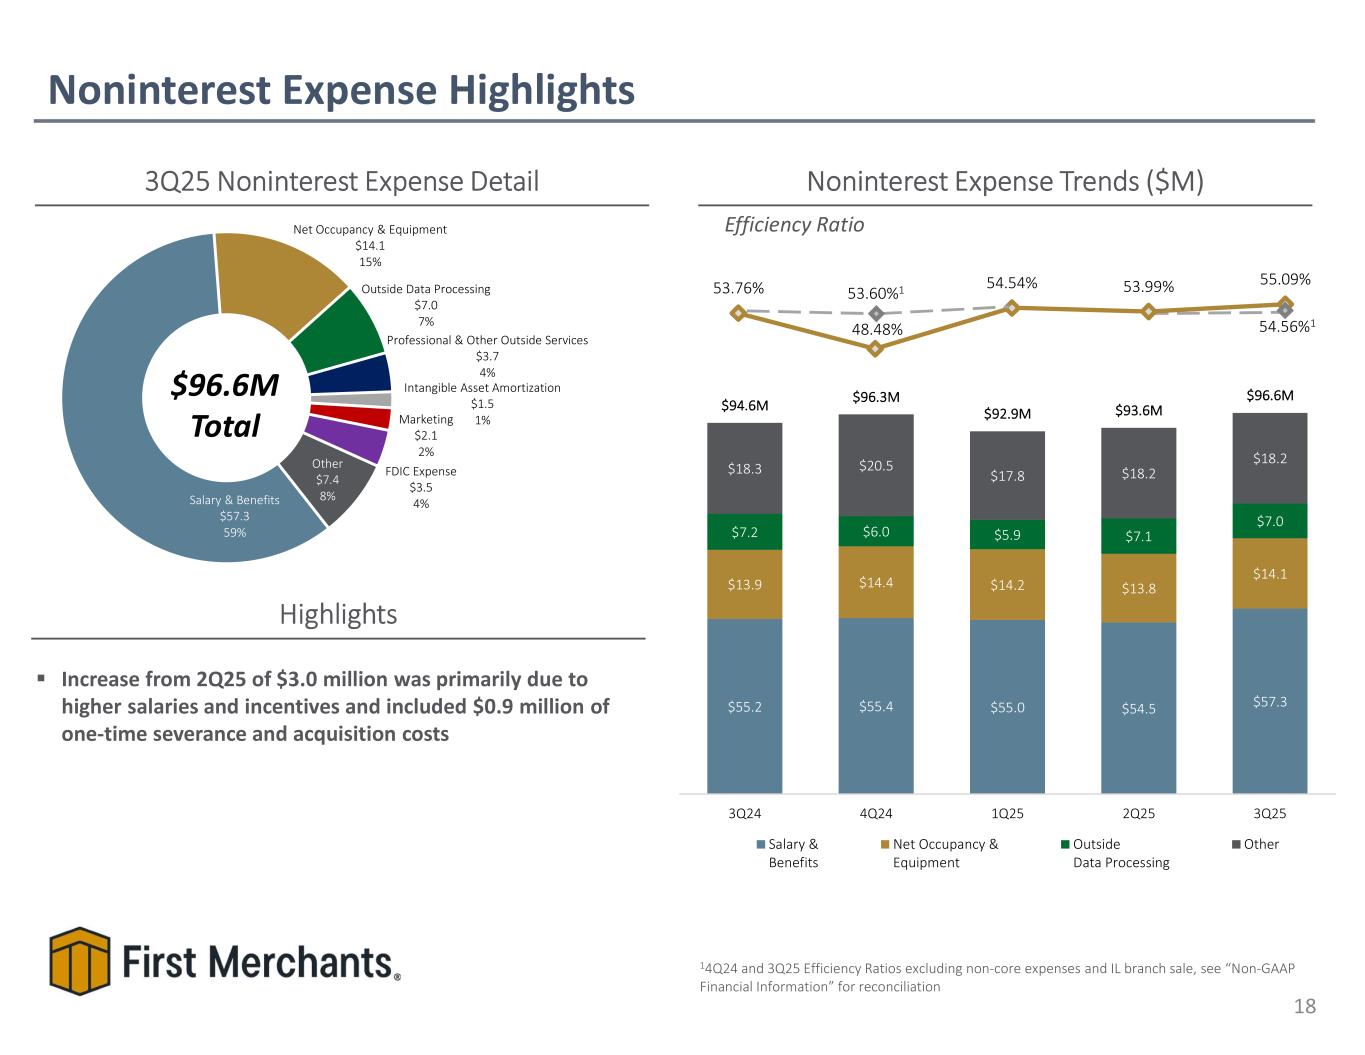
Salary & Benefits $57.3 59% Net Occupancy & Equipment $14.1 15% Outside Data Processing $7.0 7% Professional & Other Outside Services $3.7 4% Intangible Asset Amortization $1.5 1%Marketing $2.1 2% FDIC Expense $3.5 4% Other $7.4 8% 53.76% 48.48% 54.54% 53.99% 55.09% Noninterest Expense Highlights 18 3Q25 Noninterest Expense Detail $96.6M Total Noninterest Expense Trends ($M) Efficiency Ratio Highlights Increase from 2Q25 of $3.0 million was primarily due to higher salaries and incentives and included $0.9 million of one-time severance and acquisition costs 14Q24 and 3Q25 Efficiency Ratios excluding non-core expenses and IL branch sale, see “Non-GAAP Financial Information” for reconciliation 53.60%1 $55.2 $55.4 $55.0 $54.5 $57.3 $13.9 $14.4 $14.2 $13.8 $14.1 $7.2 $6.0 $5.9 $7.1 $7.0 $18.3 $20.5 $17.8 $18.2 $18.2 $94.6M $96.3M $92.9M $93.6M $96.6M 3Q24 4Q24 1Q25 2Q25 3Q25 Salary & Benefits Net Occupancy & Equipment Outside Data Processing Other 54.56%1
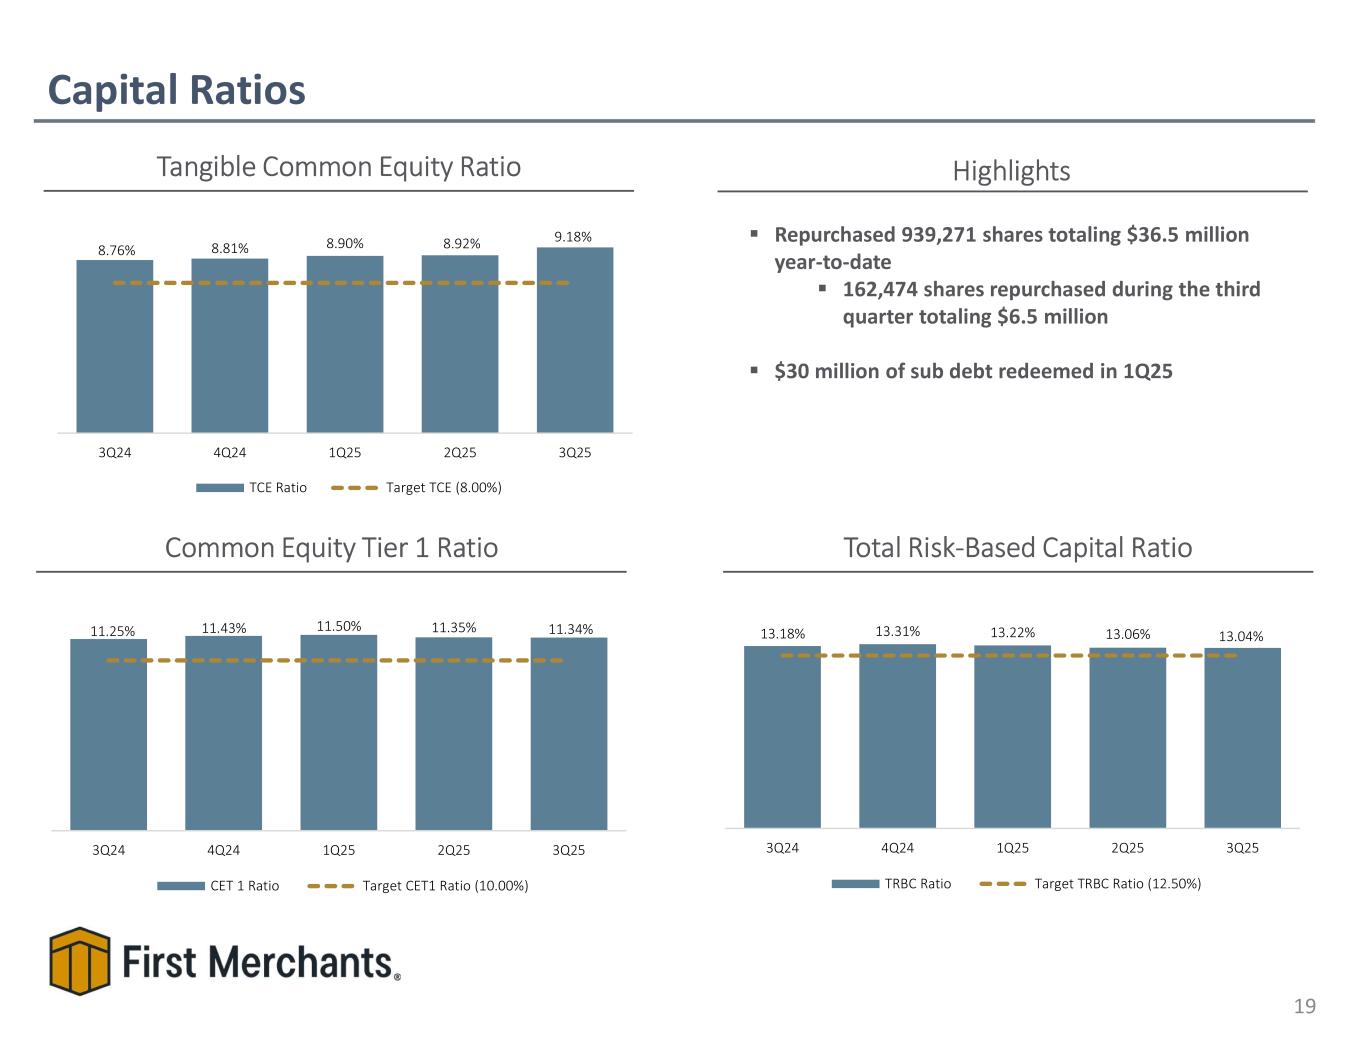
Capital Ratios 19 Tangible Common Equity Ratio Common Equity Tier 1 Ratio Total Risk-Based Capital Ratio 9.31% 9.31% 9.57% 9.31% 9.65%9.57%9.31% 9.57% 9.65% Repurchased 939,271 shares totaling $36.5 million year-to-date 162,474 shares repurchased during the third quarter totaling $6.5 million $30 million of sub debt redeemed in 1Q25 Highlights 8.76% 8.81% 8.90% 8.92% 9.18% 3Q24 4Q24 1Q25 2Q25 3Q25 TCE Ratio Target TCE (8.00%) 11.25% 11.43% 11.50% 11.35% 11.34% 3Q24 4Q24 1Q25 2Q25 3Q25 CET 1 Ratio Target CET1 Ratio (10.00%) 13.18% 13.31% 13.22% 13.06% 13.04% 3Q24 4Q24 1Q25 2Q25 3Q25 TRBC Ratio Target TRBC Ratio (12.50%)
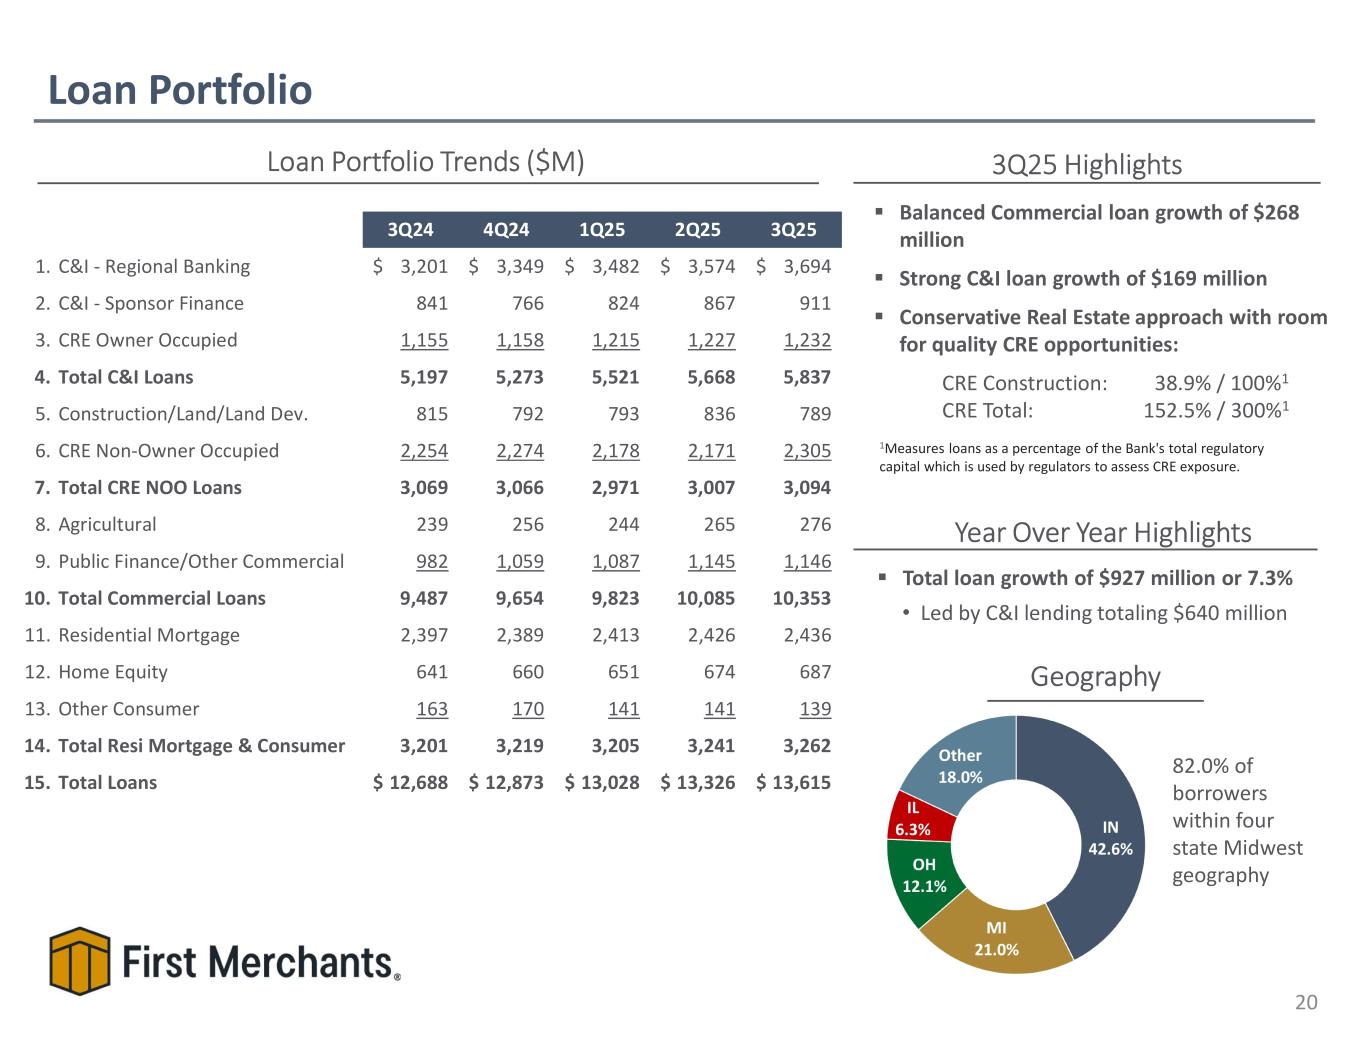
3Q25 Highlights Loan Portfolio 20 Geography Loan Portfolio Trends ($M) Year Over Year Highlights Total loan growth of $927 million or 7.3% • Led by C&I lending totaling $640 million 82.0% of borrowers within four state Midwest geography 1Measures loans as a percentage of the Bank's total regulatory capital which is used by regulators to assess CRE exposure. Balanced Commercial loan growth of $268 million Strong C&I loan growth of $169 million Conservative Real Estate approach with room for quality CRE opportunities: CRE Construction: 38.9% / 100%1 CRE Total: 152.5% / 300%1 3Q24 4Q24 1Q25 2Q25 3Q25 1. C&I - Regional Banking 3,201$ 3,349$ 3,482$ 3,574$ 3,694$ 2. C&I - Sponsor Finance 841 766 824 867 911 3. CRE Owner Occupied 1,155 1,158 1,215 1,227 1,232 4. Total C&I Loans 5,197 5,273 5,521 5,668 5,837 5. Construction/Land/Land Dev. 815 792 793 836 789 6. CRE Non-Owner Occupied 2,254 2,274 2,178 2,171 2,305 7. Total CRE NOO Loans 3,069 3,066 2,971 3,007 3,094 8. Agricultural 239 256 244 265 276 9. Public Finance/Other Commercial 982 1,059 1,087 1,145 1,146 10. Total Commercial Loans 9,487 9,654 9,823 10,085 10,353 11. Residential Mortgage 2,397 2,389 2,413 2,426 2,436 12. Home Equity 641 660 651 674 687 13. Other Consumer 163 170 141 141 139 14. Total Resi Mortgage & Consumer 3,201 3,219 3,205 3,241 3,262 15. Total Loans 12,688$ 12,873$ 13,028$ 13,326$ 13,615$
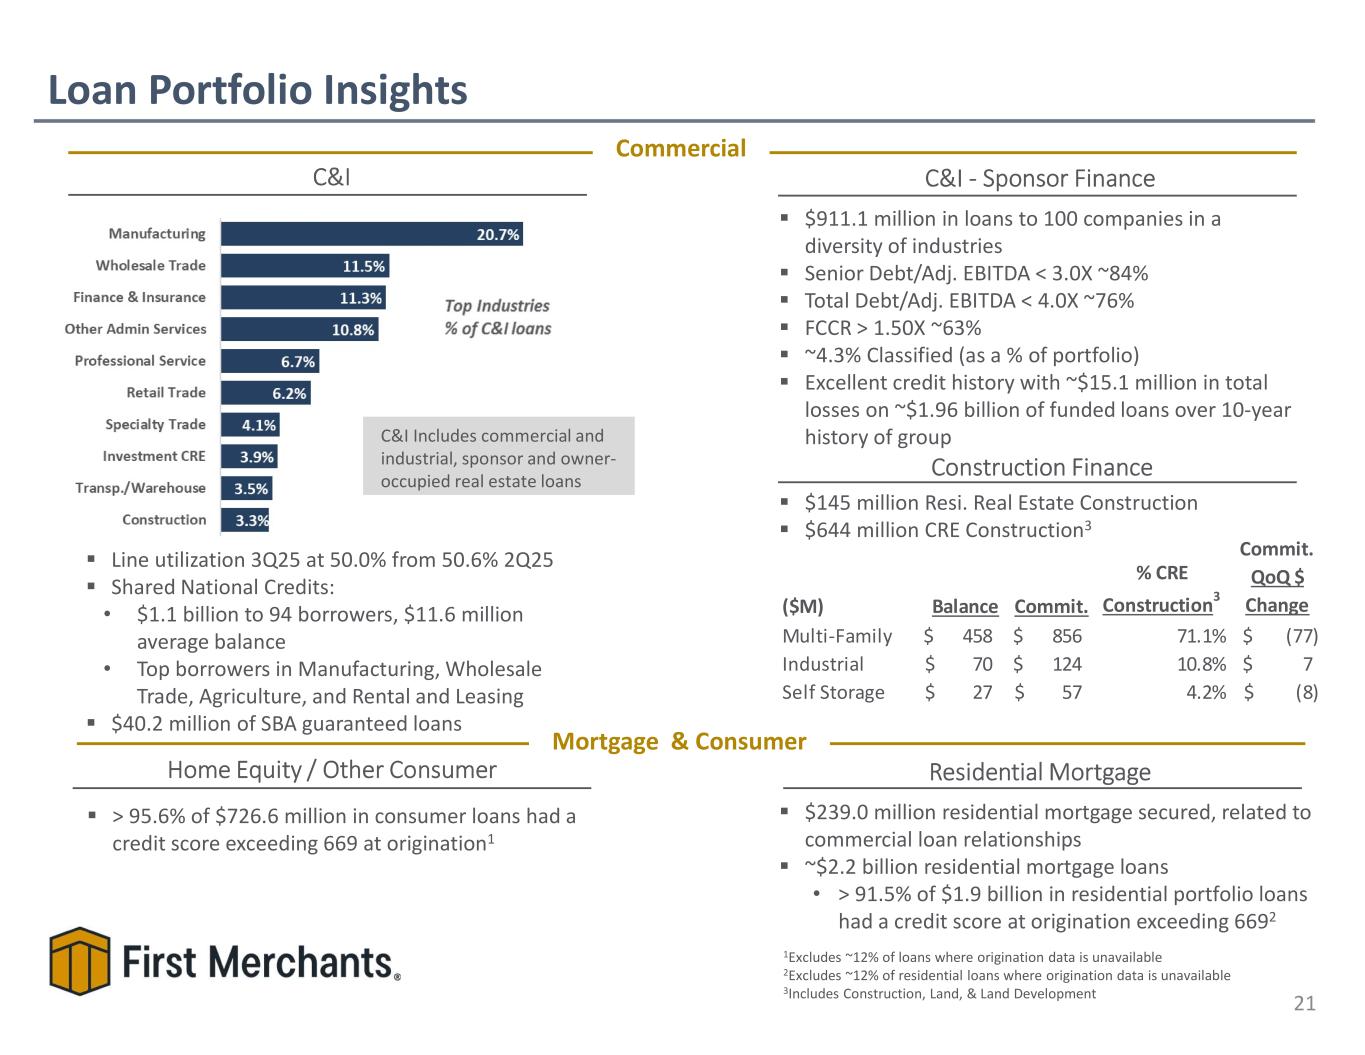
($M) Balance Commit. % CRE Construction3 Commit. QoQ $ Change Multi-Family 458$ 856$ 71.1% (77)$ Industrial 70$ 124$ 10.8% 7$ Self Storage 27$ 57$ 4.2% (8)$ $911.1 million in loans to 100 companies in a diversity of industries Senior Debt/Adj. EBITDA < 3.0X ~84% Total Debt/Adj. EBITDA < 4.0X ~76% FCCR > 1.50X ~63% ~4.3% Classified (as a % of portfolio) Excellent credit history with ~$15.1 million in total losses on ~$1.96 billion of funded loans over 10-year history of groupC&I Includes commercial and industrial, sponsor and owner- occupied real estate loans C&I - Sponsor Finance Line utilization 3Q25 at 50.0% from 50.6% 2Q25 Shared National Credits: • $1.1 billion to 94 borrowers, $11.6 million average balance • Top borrowers in Manufacturing, Wholesale Trade, Agriculture, and Rental and Leasing $40.2 million of SBA guaranteed loans Loan Portfolio Insights 21 C&I $145 million Resi. Real Estate Construction $644 million CRE Construction3 Construction Finance Home Equity / Other Consumer Residential Mortgage > 95.6% of $726.6 million in consumer loans had a credit score exceeding 669 at origination1 $239.0 million residential mortgage secured, related to commercial loan relationships ~$2.2 billion residential mortgage loans • > 91.5% of $1.9 billion in residential portfolio loans had a credit score at origination exceeding 6692 Commercial Mortgage & Consumer 1Excludes ~12% of loans where origination data is unavailable 2Excludes ~12% of residential loans where origination data is unavailable 3Includes Construction, Land, & Land Development
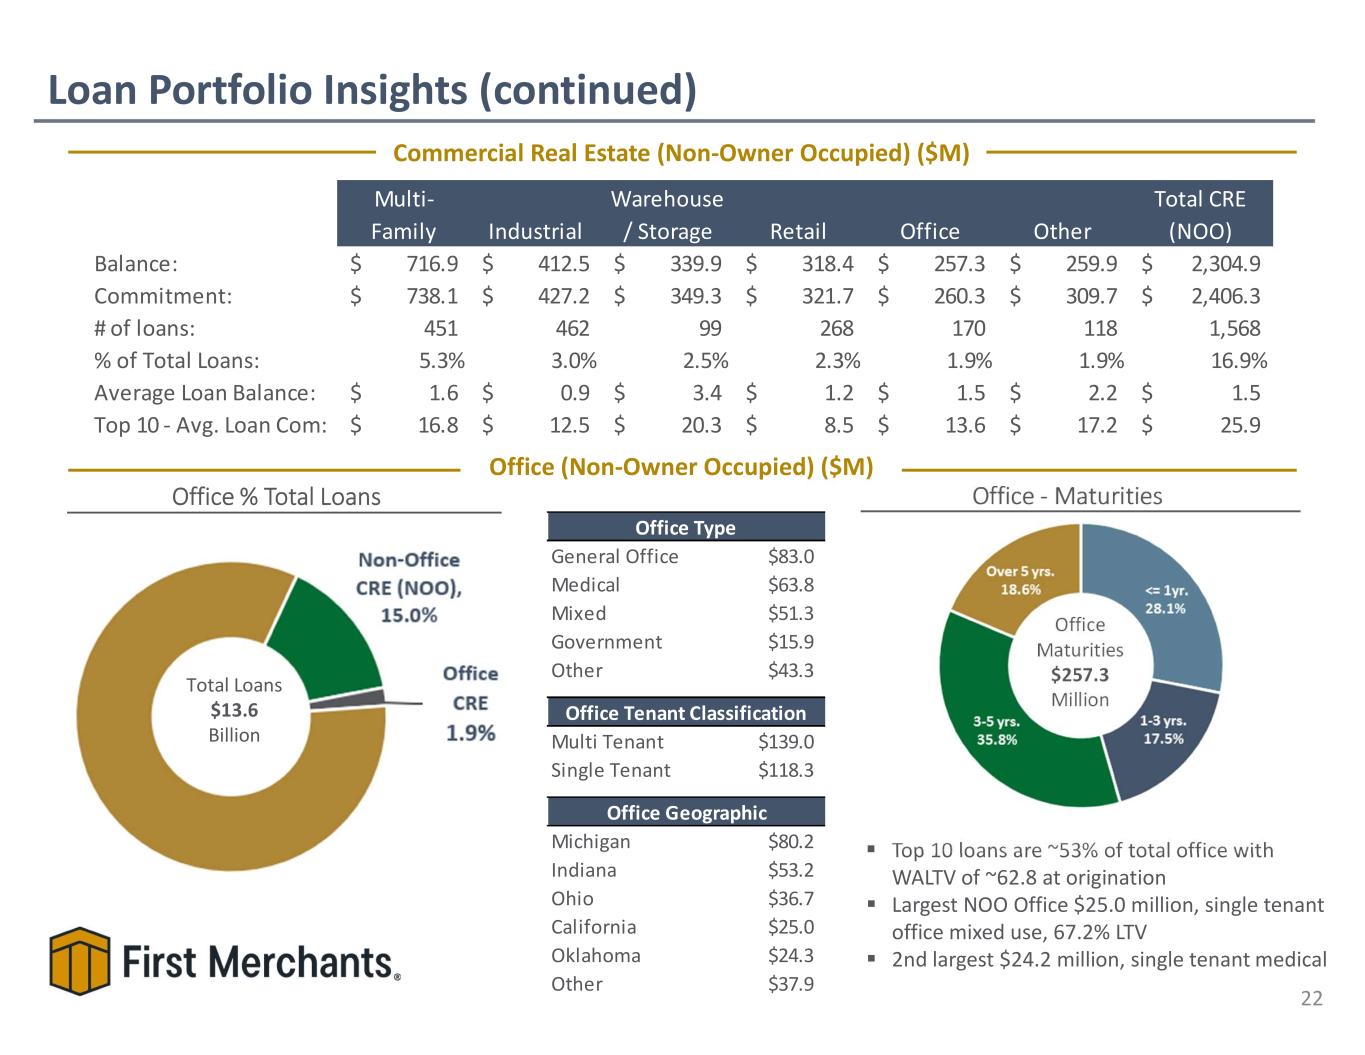
Office - Maturities Loan Portfolio Insights (continued) 22 Total Loans $13.6 Billion Commercial Real Estate (Non-Owner Occupied) ($M) Office (Non-Owner Occupied) ($M) Top 10 loans are ~53% of total office with WALTV of ~62.8 at origination Largest NOO Office $25.0 million, single tenant office mixed use, 67.2% LTV 2nd largest $24.2 million, single tenant medical Office Maturities $257.3 Million Office % Total Loans Multi- Family Industrial Warehouse / Storage Retail Office Other Total CRE (NOO) Balance: 716.9$ 412.5$ 339.9$ 318.4$ 257.3$ 259.9$ 2,304.9$ Commitment: 738.1$ 427.2$ 349.3$ 321.7$ 260.3$ 309.7$ 2,406.3$ # of loans: 451 462 99 268 170 118 1,568 % of Total Loans: 5.3% 3.0% 2.5% 2.3% 1.9% 1.9% 16.9% Average Loan Balance: 1.6$ 0.9$ 3.4$ 1.2$ 1.5$ 2.2$ 1.5$ Top 10 - Avg. Loan Com: 16.8$ 12.5$ 20.3$ 8.5$ 13.6$ 17.2$ 25.9$ General Office $83.0 Medical $63.8 Mixed $51.3 Government $15.9 Other $43.3 Multi Tenant $139.0 Single Tenant $118.3 Michigan $80.2 Indiana $53.2 Ohio $36.7 California $25.0 Oklahoma $24.3 Other $37.9 Office Geographic Office Type Office Tenant Classification
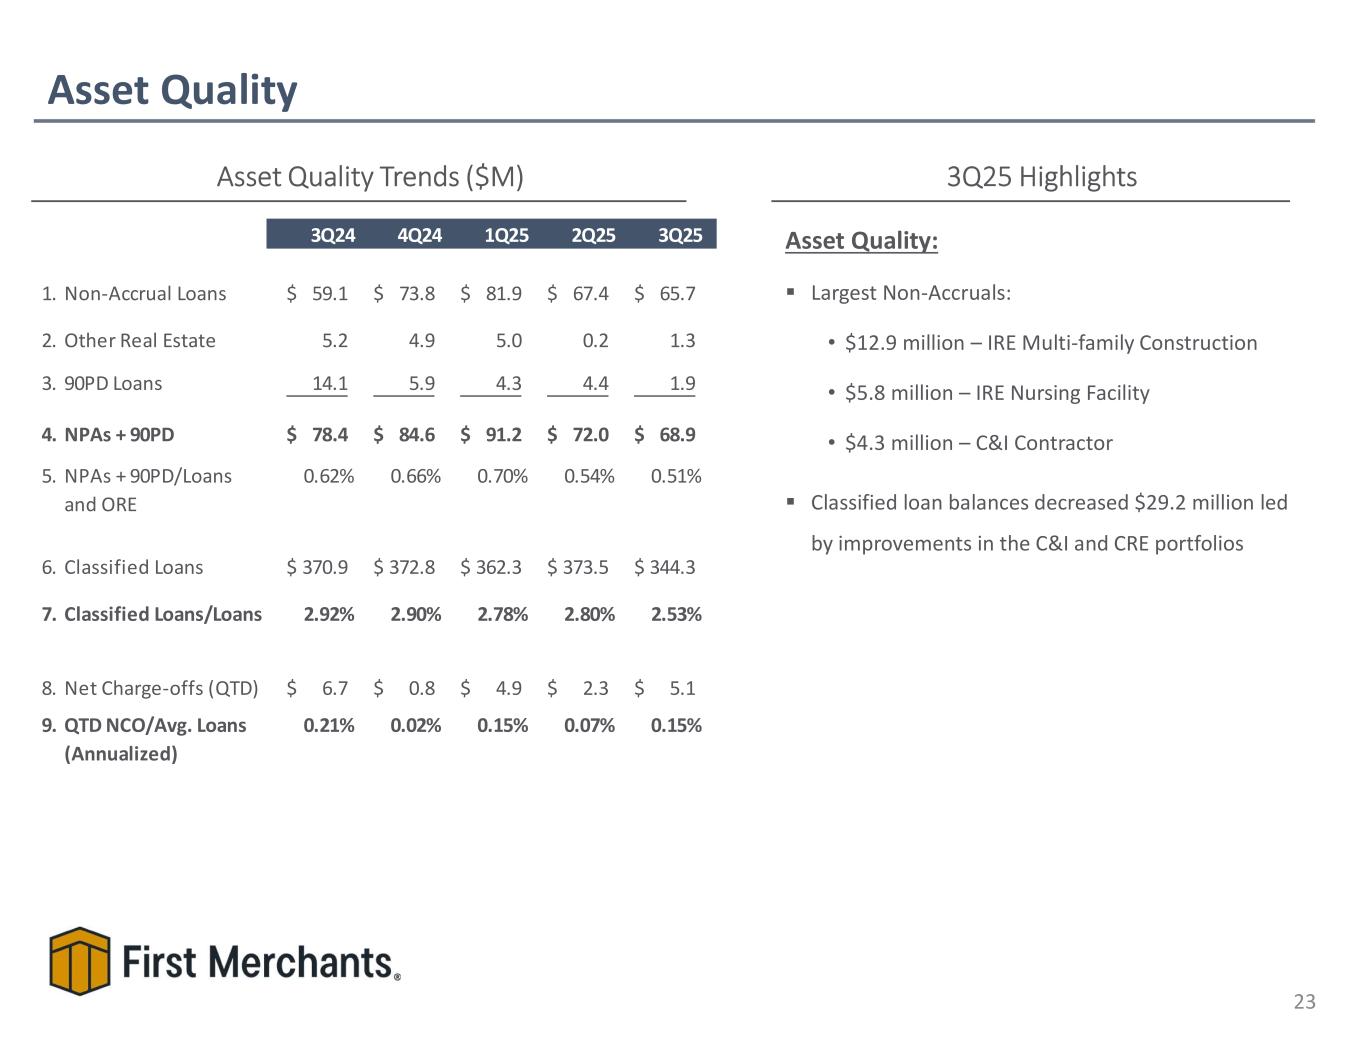
Asset Quality 23 Asset Quality Trends ($M) 3Q25 Highlights Asset Quality: Largest Non-Accruals: • $12.9 million – IRE Multi-family Construction • $5.8 million – IRE Nursing Facility • $4.3 million – C&I Contractor Classified loan balances decreased $29.2 million led by improvements in the C&I and CRE portfolios 3Q24 4Q24 1Q25 2Q25 3Q25 1. Non-Accrual Loans 59.1$ 73.8$ 81.9$ 67.4$ 65.7$ 2. Other Real Estate 5.2 4.9 5.0 0.2 1.3 3. 90PD Loans 14.1 5.9 4.3 4.4 1.9 4. NPAs + 90PD 78.4$ 84.6$ 91.2$ 72.0$ 68.9$ 5. NPAs + 90PD/Loans and ORE 0.62% 0.66% 0.70% 0.54% 0.51% 6. Classified Loans 370.9$ 372.8$ 362.3$ 373.5$ 344.3$ 7. Classified Loans/Loans 2.92% 2.90% 2.78% 2.80% 2.53% 8. Net Charge-offs (QTD) 6.7$ 0.8$ 4.9$ 2.3$ 5.1$ 9. QTD NCO/Avg. Loans (Annualized) 0.21% 0.02% 0.15% 0.07% 0.15%
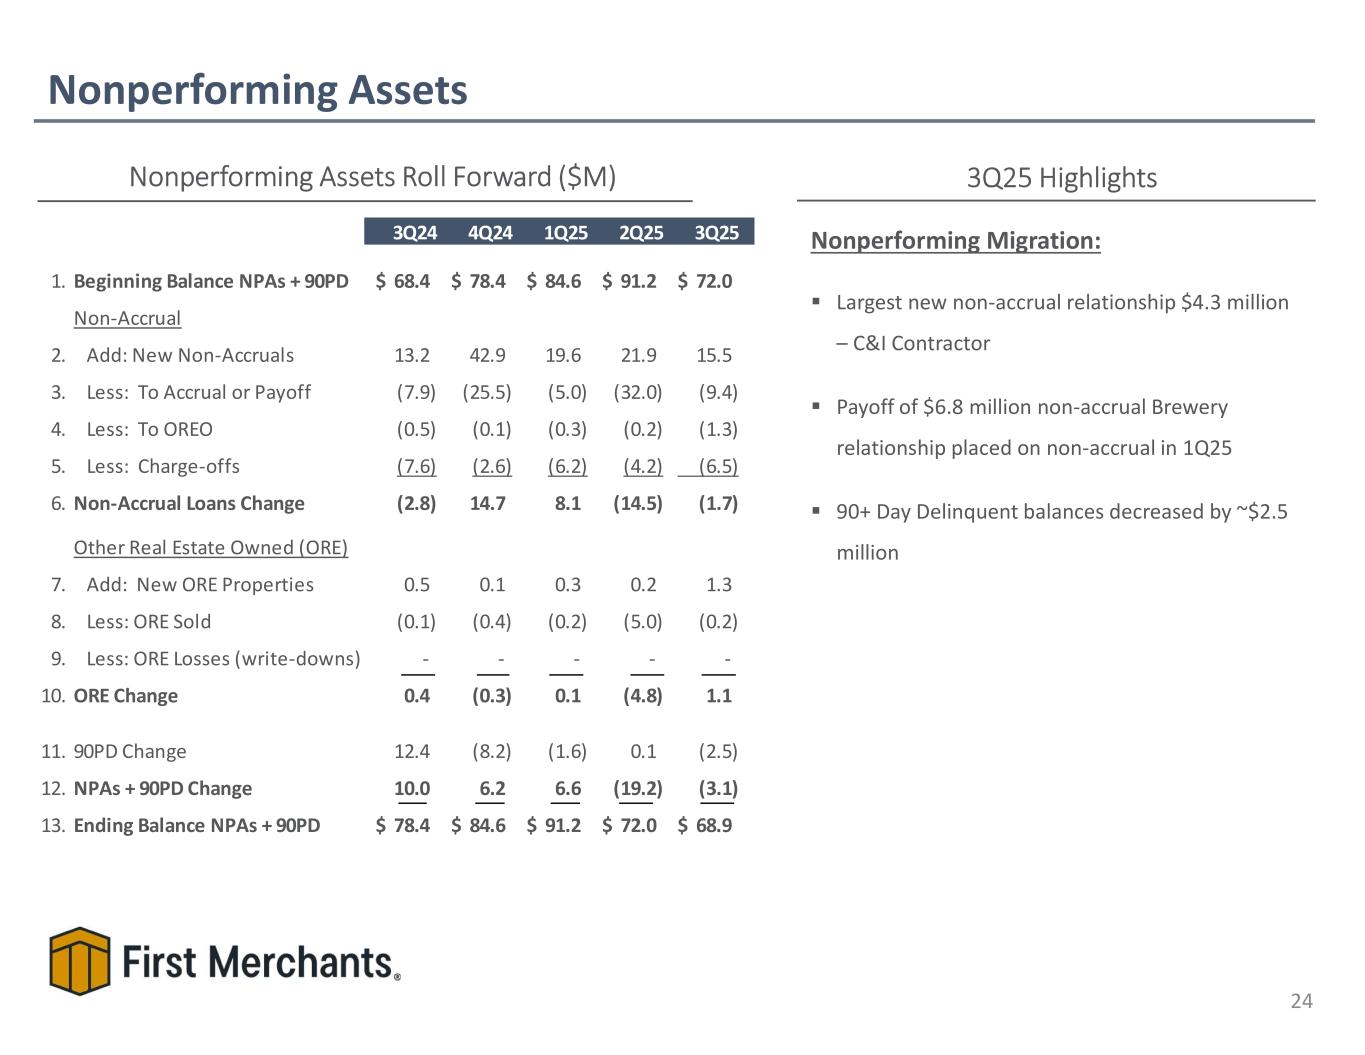
Nonperforming Assets 24 Nonperforming Assets Roll Forward ($M) 3Q25 Highlights Nonperforming Migration: Largest new non-accrual relationship $4.3 million – C&I Contractor Payoff of $6.8 million non-accrual Brewery relationship placed on non-accrual in 1Q25 90+ Day Delinquent balances decreased by ~$2.5 million 3Q24 4Q24 1Q25 2Q25 3Q25 1. Beginning Balance NPAs + 90PD 68.4$ 78.4$ 84.6$ 91.2$ 72.0$ Non-Accrual 2. Add: New Non-Accruals 13.2 42.9 19.6 21.9 15.5 3. Less: To Accrual or Payoff (7.9) (25.5) (5.0) (32.0) (9.4) 4. Less: To OREO (0.5) (0.1) (0.3) (0.2) (1.3) 5. Less: Charge-offs (7.6) (2.6) (6.2) (4.2) (6.5) 6. Non-Accrual Loans Change (2.8) 14.7 8.1 (14.5) (1.7) Other Real Estate Owned (ORE) 7. Add: New ORE Properties 0.5 0.1 0.3 0.2 1.3 8. Less: ORE Sold (0.1) (0.4) (0.2) (5.0) (0.2) 9. Less: ORE Losses (write-downs) - - - - - 10. ORE Change 0.4 (0.3) 0.1 (4.8) 1.1 11. 90PD Change 12.4 (8.2) (1.6) 0.1 (2.5) 12. NPAs + 90PD Change 10.0 6.2 6.6 (19.2) (3.1) 13. Ending Balance NPAs + 90PD 78.4$ 84.6$ 91.2$ 72.0$ 68.9$
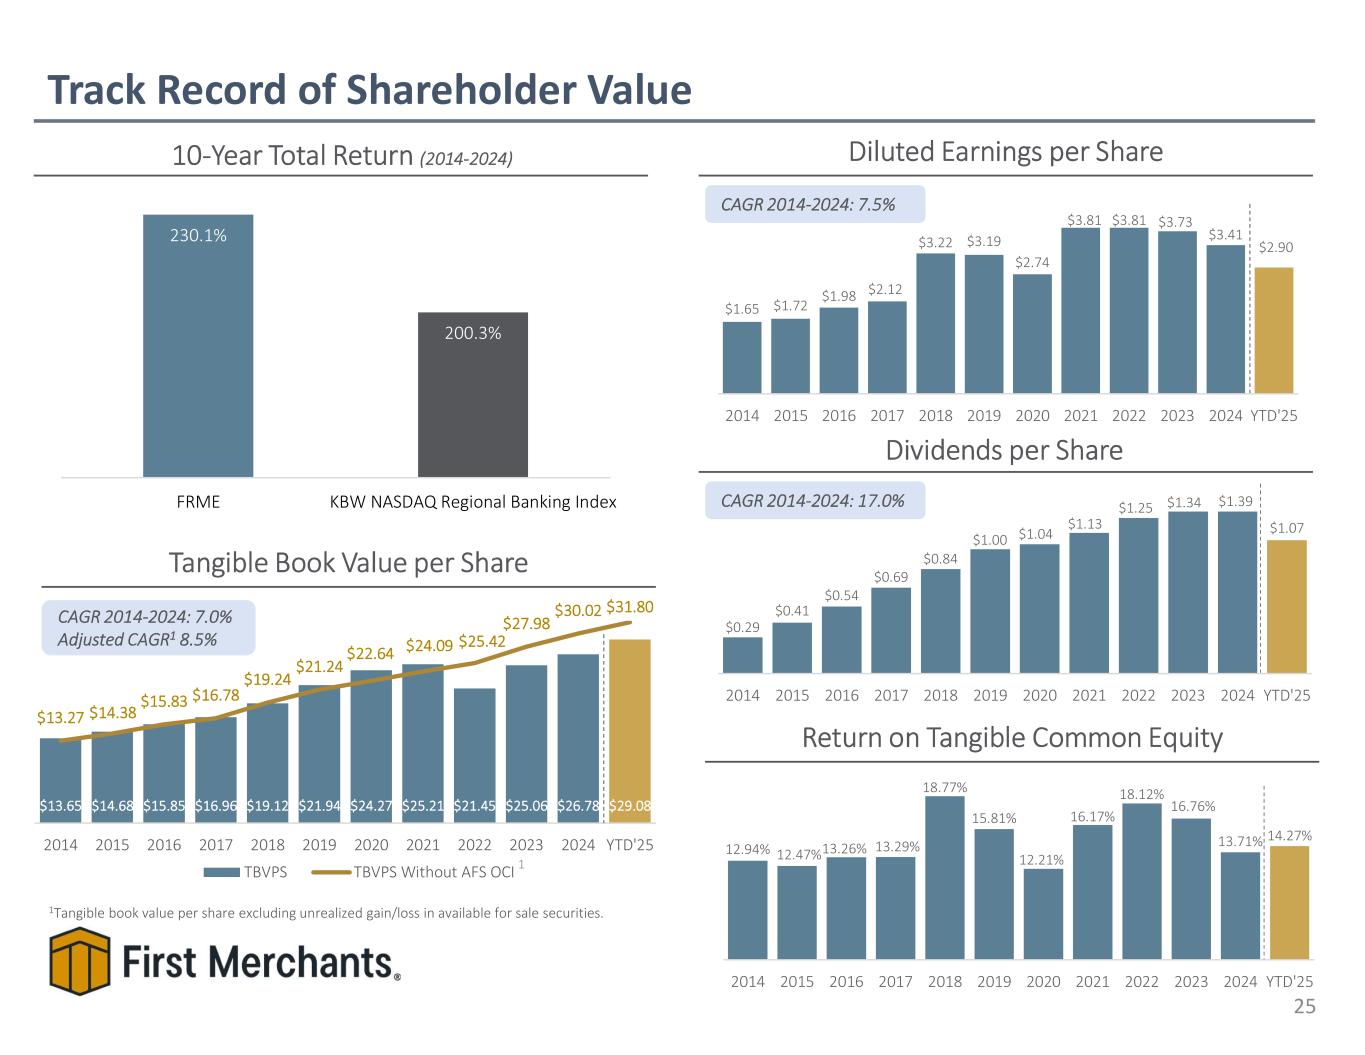
$13.65 $14.68 $15.85 $16.96 $19.12 $21.94 $24.27 $25.21 $21.45 $25.06 $26.78 $29.08 $13.27 $14.38 $15.83 $16.78 $19.24 $21.24 $22.64 $24.09 $25.42 $27.98 $30.02 $31.80 2014 2015 2016 2017 2018 2019 2020 2021 2022 2023 2024 YTD'25 TBVPS TBVPS Without AFS OCI Track Record of Shareholder Value 25 10-Year Total Return (2014-2024) Diluted Earnings per Share Tangible Book Value per Share Dividends per Share CAGR 2014-2024: 7.5% Return on Tangible Common Equity 1Tangible book value per share excluding unrealized gain/loss in available for sale securities. CAGR 2014-2024: 17.0% 1 CAGR 2014-2024: 7.0% Adjusted CAGR1 8.5% 230.1% 200.3% FRME KBW NASDAQ Regional Banking Index $0.29 $0.41 $0.54 $0.69 $0.84 $1.00 $1.04 $1.13 $1.25 $1.34 $1.39 $1.07 2014 2015 2016 2017 2018 2019 2020 2021 2022 2023 2024 YTD'25 12.94% 12.47%13.26% 13.29% 18.77% 15.81% 12.21% 16.17% 18.12% 16.76% 13.71% 14.27% 2014 2015 2016 2017 2018 2019 2020 2021 2022 2023 2024 YTD'25 $1.65 $1.72 $1.98 $2.12 $3.22 $3.19 $2.74 $3.81 $3.81 $3.73 $3.41 $2.90 2014 2015 2016 2017 2018 2019 2020 2021 2022 2023 2024 YTD'25
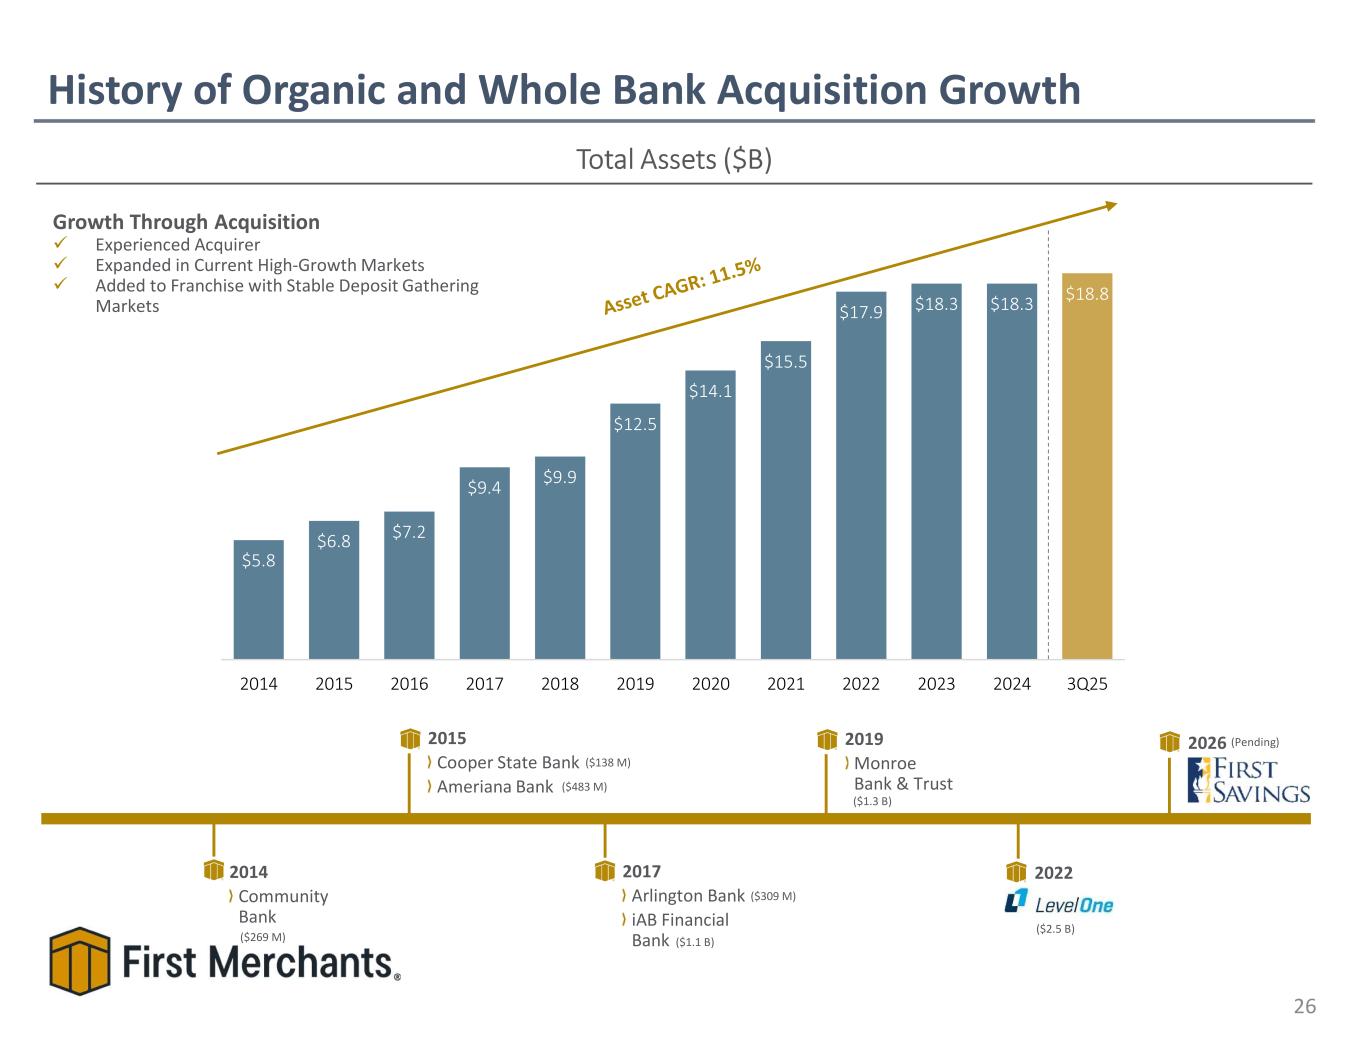
History of Organic and Whole Bank Acquisition Growth 26 Total Assets ($B) Growth Through Acquisition Experienced Acquirer Expanded in Current High-Growth Markets Added to Franchise with Stable Deposit Gathering Markets 2014 Community Bank 2015 Cooper State Bank Ameriana Bank 2017 Arlington Bank iAB Financial Bank 2019 Monroe Bank & Trust 2022 ($309 M) ($138 M) ($2.5 B) ($1.3 B) ($269 M) ($483 M) ($1.1 B) $5.8 $6.8 $7.2 $9.4 $9.9 $12.5 $14.1 $15.5 $17.9 $18.3 $18.3 $18.8 2014 2015 2016 2017 2018 2019 2020 2021 2022 2023 2024 3Q25 2026 (Pending)

Vision for the Future 27 Our Vision: To enhance the financial wellness of the diverse communities we serve. To be the most attentive, knowledgeable, and high-performing bank for our clients, teammates, and shareholders. Drive engagement through inclusivity, teamwork, performance management, career development, rewards, and work-life balance Produce organic growth across all lines of business and markets through focused, data- driven, industry-leading client acquisition, expansion, and retention activities Continued investment in the digitization of our delivery channels to simplify the client experience Maintain top-quartile financial results supported by industry-leading governance, risk, and compliance practices to ensure long-term sustainability Continue to leverage our core competency in acquisitions to enhance growth, efficiency, and high performance Cultivate a high-quality shareholder base that values our stakeholder-centric business model Strategic Imperatives: Our Mission:
APPENDIX
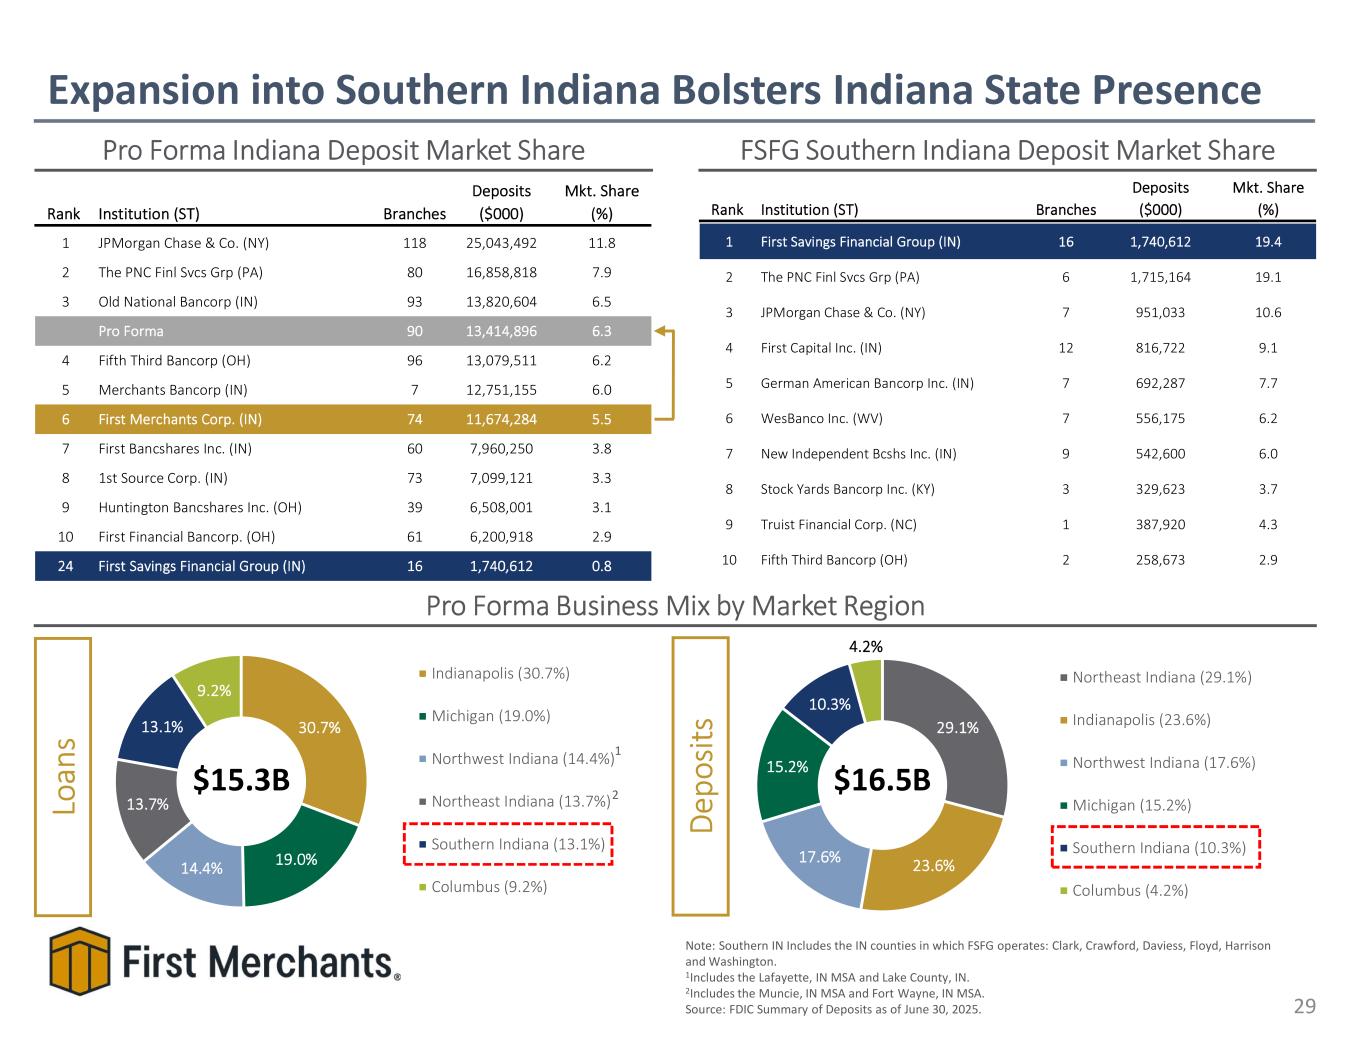
Deposits Mkt. Share Rank Institution (ST) Branches ($000) (%) 1 JPMorgan Chase & Co. (NY) 118 25,043,492 11.8 2 The PNC Finl Svcs Grp (PA) 80 16,858,818 7.9 3 Old National Bancorp (IN) 93 13,820,604 6.5 Pro Forma 90 13,414,896 6.3 4 Fifth Third Bancorp (OH) 96 13,079,511 6.2 5 Merchants Bancorp (IN) 7 12,751,155 6.0 6 First Merchants Corp. (IN) 74 11,674,284 5.5 7 First Bancshares Inc. (IN) 60 7,960,250 3.8 8 1st Source Corp. (IN) 73 7,099,121 3.3 9 Huntington Bancshares Inc. (OH) 39 6,508,001 3.1 10 First Financial Bancorp. (OH) 61 6,200,918 2.9 24 First Savings Financial Group (IN) 16 1,740,612 0.8 Expansion into Southern Indiana Bolsters Indiana State Presence 29 Deposits Mkt. Share Rank Institution (ST) Branches ($000) (%) 1 First Savings Financial Group (IN) 16 1,740,612 19.4 2 The PNC Finl Svcs Grp (PA) 6 1,715,164 19.1 3 JPMorgan Chase & Co. (NY) 7 951,033 10.6 4 First Capital Inc. (IN) 12 816,722 9.1 5 German American Bancorp Inc. (IN) 7 692,287 7.7 6 WesBanco Inc. (WV) 7 556,175 6.2 7 New Independent Bcshs Inc. (IN) 9 542,600 6.0 8 Stock Yards Bancorp Inc. (KY) 3 329,623 3.7 9 Truist Financial Corp. (NC) 1 387,920 4.3 10 Fifth Third Bancorp (OH) 2 258,673 2.9 FSFG Southern Indiana Deposit Market SharePro Forma Indiana Deposit Market Share Pro Forma Business Mix by Market Region 30.7% 19.0%14.4% 13.7% 13.1% 9.2% Indianapolis (30.7%) Michigan (19.0%) Northwest Indiana (14.4%) Northeast Indiana (13.7%) Southern Indiana (13.1%) Columbus (9.2%) 29.1% 23.6%17.6% 15.2% 10.3% 4.2% Northeast Indiana (29.1%) Indianapolis (23.6%) Northwest Indiana (17.6%) Michigan (15.2%) Southern Indiana (10.3%) Columbus (4.2%) $15.3B $16.5B 1 2Lo an s De po sit s Note: Southern IN Includes the IN counties in which FSFG operates: Clark, Crawford, Daviess, Floyd, Harrison and Washington. 1Includes the Lafayette, IN MSA and Lake County, IN. 2Includes the Muncie, IN MSA and Fort Wayne, IN MSA. Source: FDIC Summary of Deposits as of June 30, 2025.
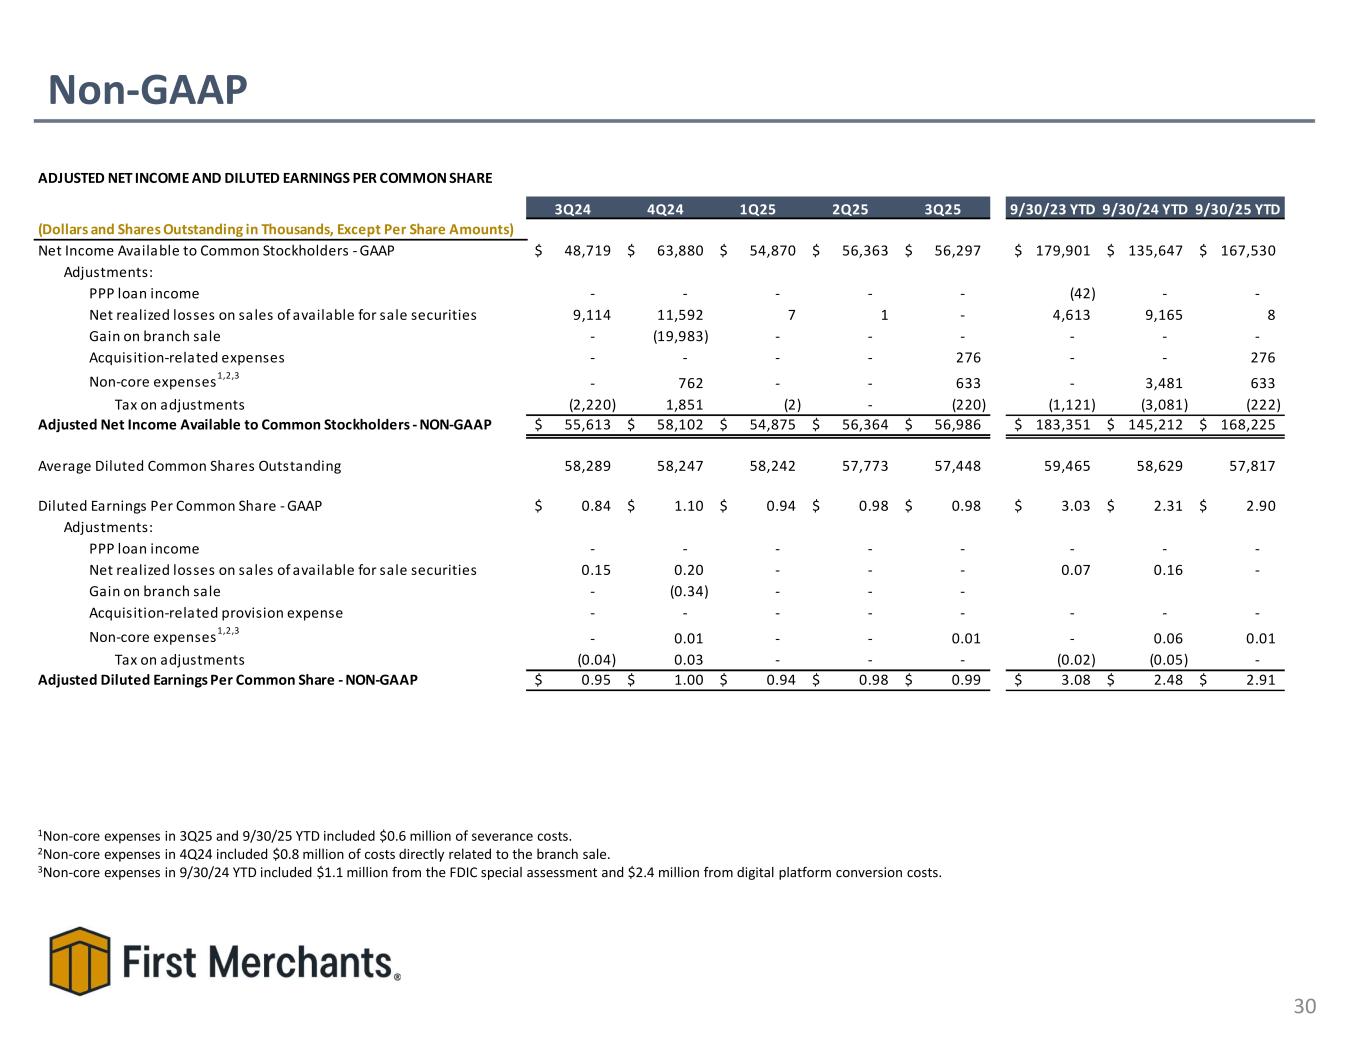
Non-GAAP 30 1Non-core expenses in 3Q25 and 9/30/25 YTD included $0.6 million of severance costs. 2Non-core expenses in 4Q24 included $0.8 million of costs directly related to the branch sale. 3Non-core expenses in 9/30/24 YTD included $1.1 million from the FDIC special assessment and $2.4 million from digital platform conversion costs. ADJUSTED NET INCOME AND DILUTED EARNINGS PER COMMON SHARE 3Q24 4Q24 1Q25 2Q25 3Q25 9/30/23 YTD 9/30/24 YTD 9/30/25 YTD (Dollars and Shares Outstanding in Thousands, Except Per Share Amounts) Net Income Available to Common Stockholders - GAAP 48,719$ 63,880$ 54,870$ 56,363$ 56,297$ 179,901$ 135,647$ 167,530$ Adjustments: PPP loan income - - - - - (42) - - Net realized losses on sales of available for sale securities 9,114 11,592 7 1 - 4,613 9,165 8 Gain on branch sale - (19,983) - - - - - - Acquisition-related expenses - - - - 276 - - 276 Non-core expenses1,2,3 - 762 - - 633 - 3,481 633 Tax on adjustments (2,220) 1,851 (2) - (220) (1,121) (3,081) (222) Adjusted Net Income Available to Common Stockholders - NON-GAAP 55,613$ 58,102$ 54,875$ 56,364$ 56,986$ 183,351$ 145,212$ 168,225$ Average Diluted Common Shares Outstanding 58,289 58,247 58,242 57,773 57,448 59,465 58,629 57,817 Diluted Earnings Per Common Share - GAAP 0.84$ 1.10$ 0.94$ 0.98$ 0.98$ 3.03$ 2.31$ 2.90$ Adjustments: PPP loan income - - - - - - - - Net realized losses on sales of available for sale securities 0.15 0.20 - - - 0.07 0.16 - Gain on branch sale - (0.34) - - - Acquisition-related provision expense - - - - - - - - Non-core expenses1,2,3 - 0.01 - - 0.01 - 0.06 0.01 Tax on adjustments (0.04) 0.03 - - - (0.02) (0.05) - Adjusted Diluted Earnings Per Common Share - NON-GAAP 0.95$ 1.00$ 0.94$ 0.98$ 0.99$ 3.08$ 2.48$ 2.91$
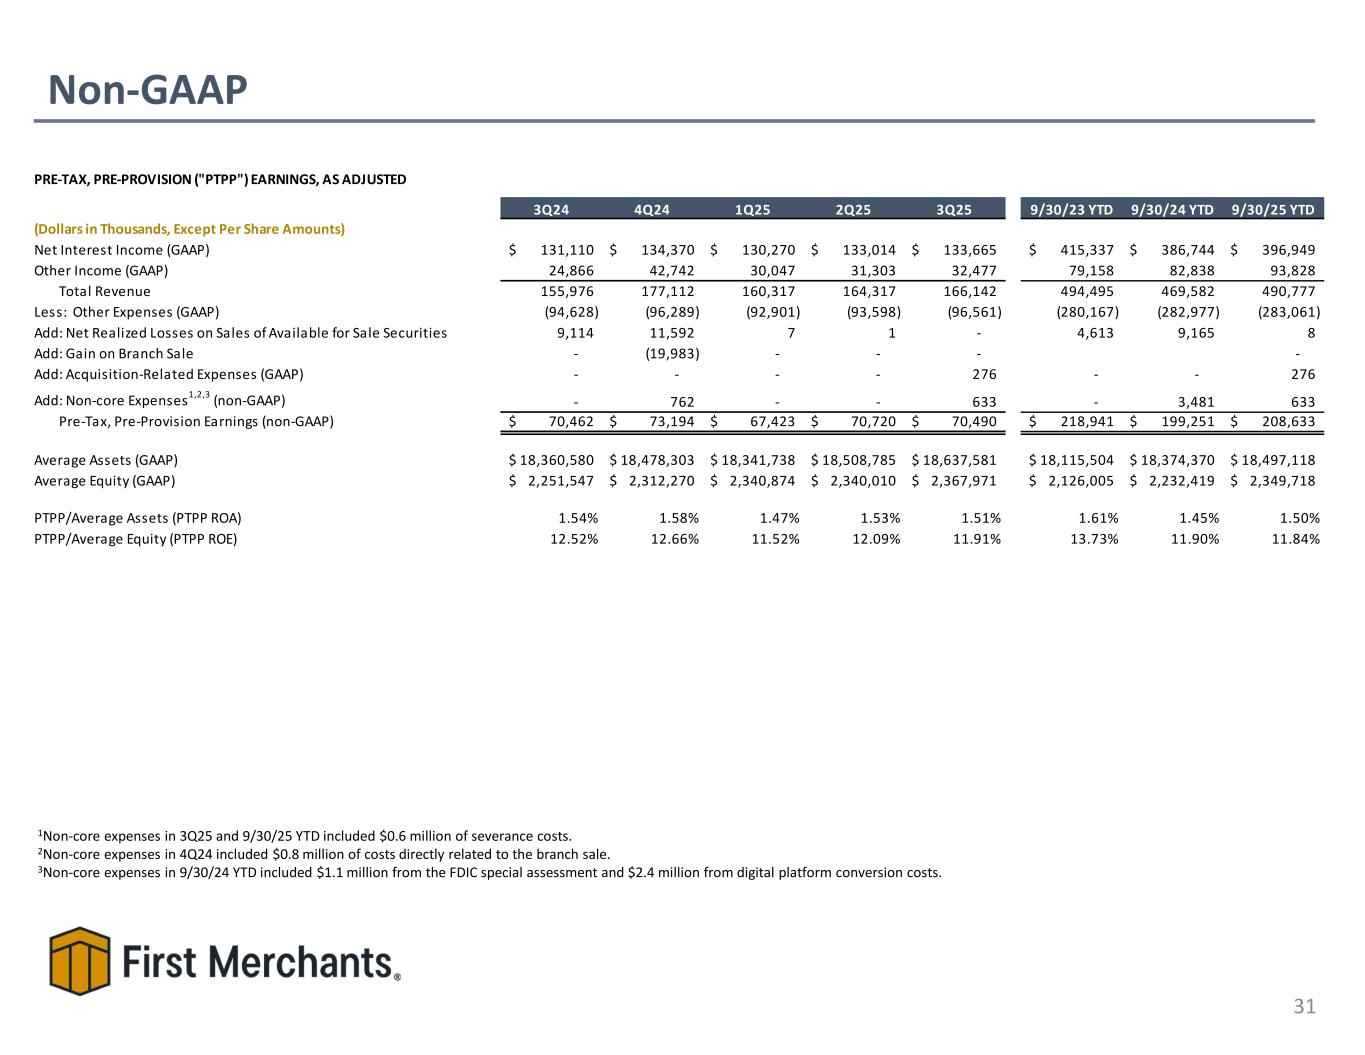
Non-GAAP 31 PRE-TAX, PRE-PROVISION ("PTPP") EARNINGS, AS ADJUSTED 3Q24 4Q24 1Q25 2Q25 3Q25 9/30/23 YTD 9/30/24 YTD 9/30/25 YTD (Dollars in Thousands, Except Per Share Amounts) Net Interest Income (GAAP) 131,110$ 134,370$ 130,270$ 133,014$ 133,665$ 415,337$ 386,744$ 396,949$ Other Income (GAAP) 24,866 42,742 30,047 31,303 32,477 79,158 82,838 93,828 Total Revenue 155,976 177,112 160,317 164,317 166,142 494,495 469,582 490,777 Less: Other Expenses (GAAP) (94,628) (96,289) (92,901) (93,598) (96,561) (280,167) (282,977) (283,061) Add: Net Realized Losses on Sales of Available for Sale Securities 9,114 11,592 7 1 - 4,613 9,165 8 Add: Gain on Branch Sale - (19,983) - - - - Add: Acquisition-Related Expenses (GAAP) - - - - 276 - - 276 Add: Non-core Expenses1,2,3 (non-GAAP) - 762 - - 633 - 3,481 633 Pre-Tax, Pre-Provision Earnings (non-GAAP) 70,462$ 73,194$ 67,423$ 70,720$ 70,490$ 218,941$ 199,251$ 208,633$ Average Assets (GAAP) 18,360,580$ 18,478,303$ 18,341,738$ 18,508,785$ 18,637,581$ 18,115,504$ 18,374,370$ 18,497,118$ Average Equity (GAAP) 2,251,547$ 2,312,270$ 2,340,874$ 2,340,010$ 2,367,971$ 2,126,005$ 2,232,419$ 2,349,718$ PTPP/Average Assets (PTPP ROA) 1.54% 1.58% 1.47% 1.53% 1.51% 1.61% 1.45% 1.50% PTPP/Average Equity (PTPP ROE) 12.52% 12.66% 11.52% 12.09% 11.91% 13.73% 11.90% 11.84% 1Non-core expenses in 3Q25 and 9/30/25 YTD included $0.6 million of severance costs. 2Non-core expenses in 4Q24 included $0.8 million of costs directly related to the branch sale. 3Non-core expenses in 9/30/24 YTD included $1.1 million from the FDIC special assessment and $2.4 million from digital platform conversion costs.
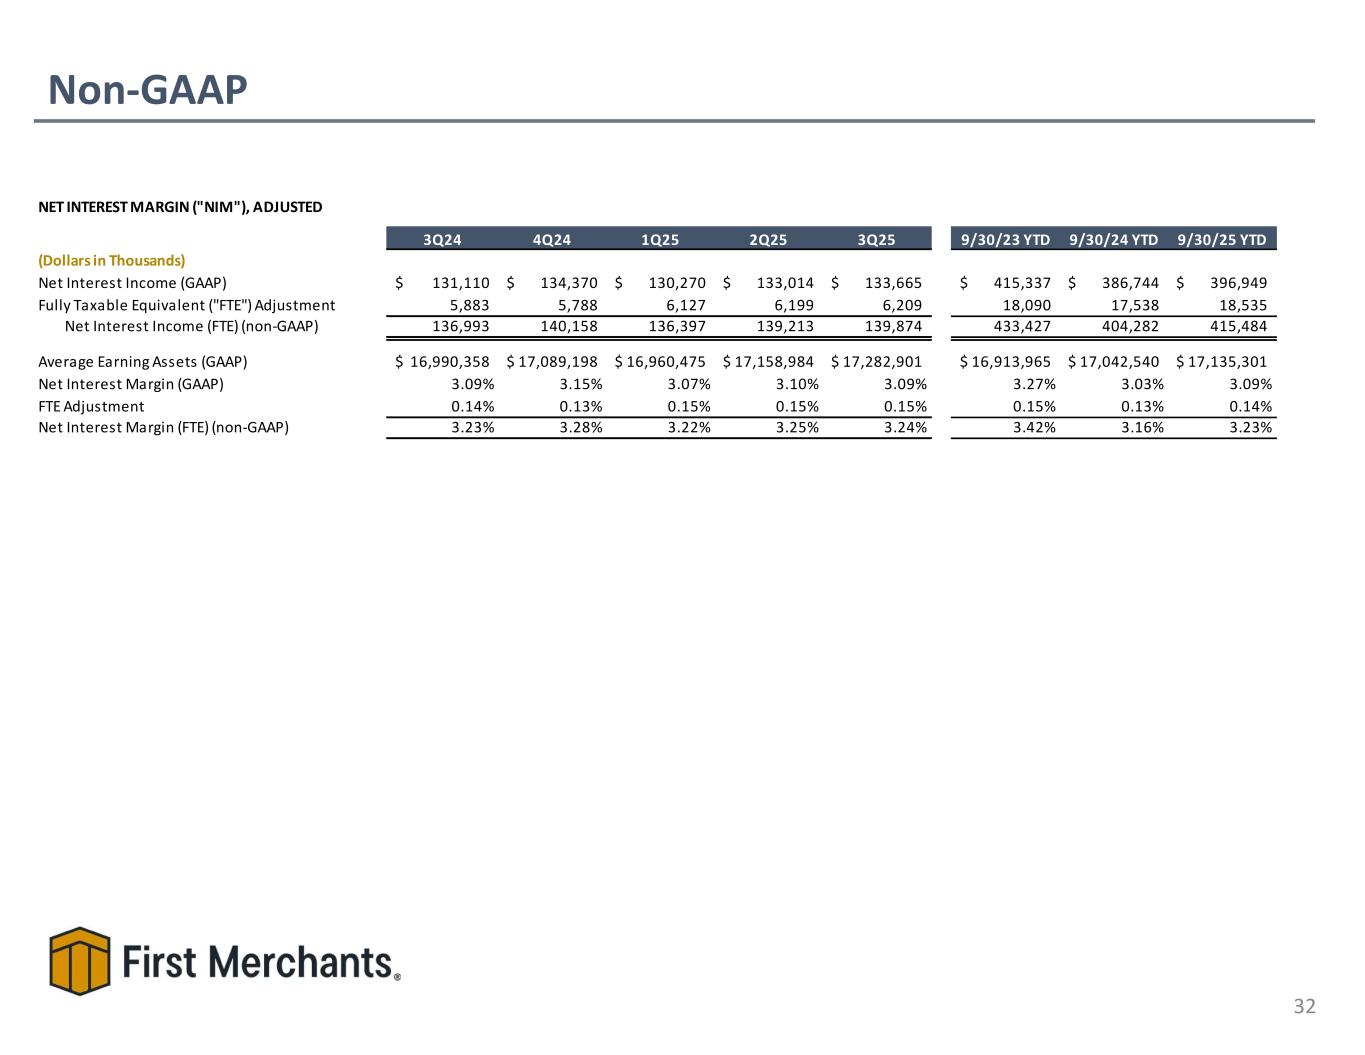
Non-GAAP 32 NET INTEREST MARGIN ("NIM"), ADJUSTED 3Q24 4Q24 1Q25 2Q25 3Q25 9/30/23 YTD 9/30/24 YTD 9/30/25 YTD (Dollars in Thousands) Net Interest Income (GAAP) 131,110$ 134,370$ 130,270$ 133,014$ 133,665$ 415,337$ 386,744$ 396,949$ Fully Taxable Equivalent ("FTE") Adjustment 5,883 5,788 6,127 6,199 6,209 18,090 17,538 18,535 Net Interest Income (FTE) (non-GAAP) 136,993 140,158 136,397 139,213 139,874 433,427 404,282 415,484 Average Earning Assets (GAAP) 16,990,358$ 17,089,198$ 16,960,475$ 17,158,984$ 17,282,901$ 16,913,965$ 17,042,540$ 17,135,301$ Net Interest Margin (GAAP) 3.09% 3.15% 3.07% 3.10% 3.09% 3.27% 3.03% 3.09% FTE Adjustment 0.14% 0.13% 0.15% 0.15% 0.15% 0.15% 0.13% 0.14% Net Interest Margin (FTE) (non-GAAP) 3.23% 3.28% 3.22% 3.25% 3.24% 3.42% 3.16% 3.23%
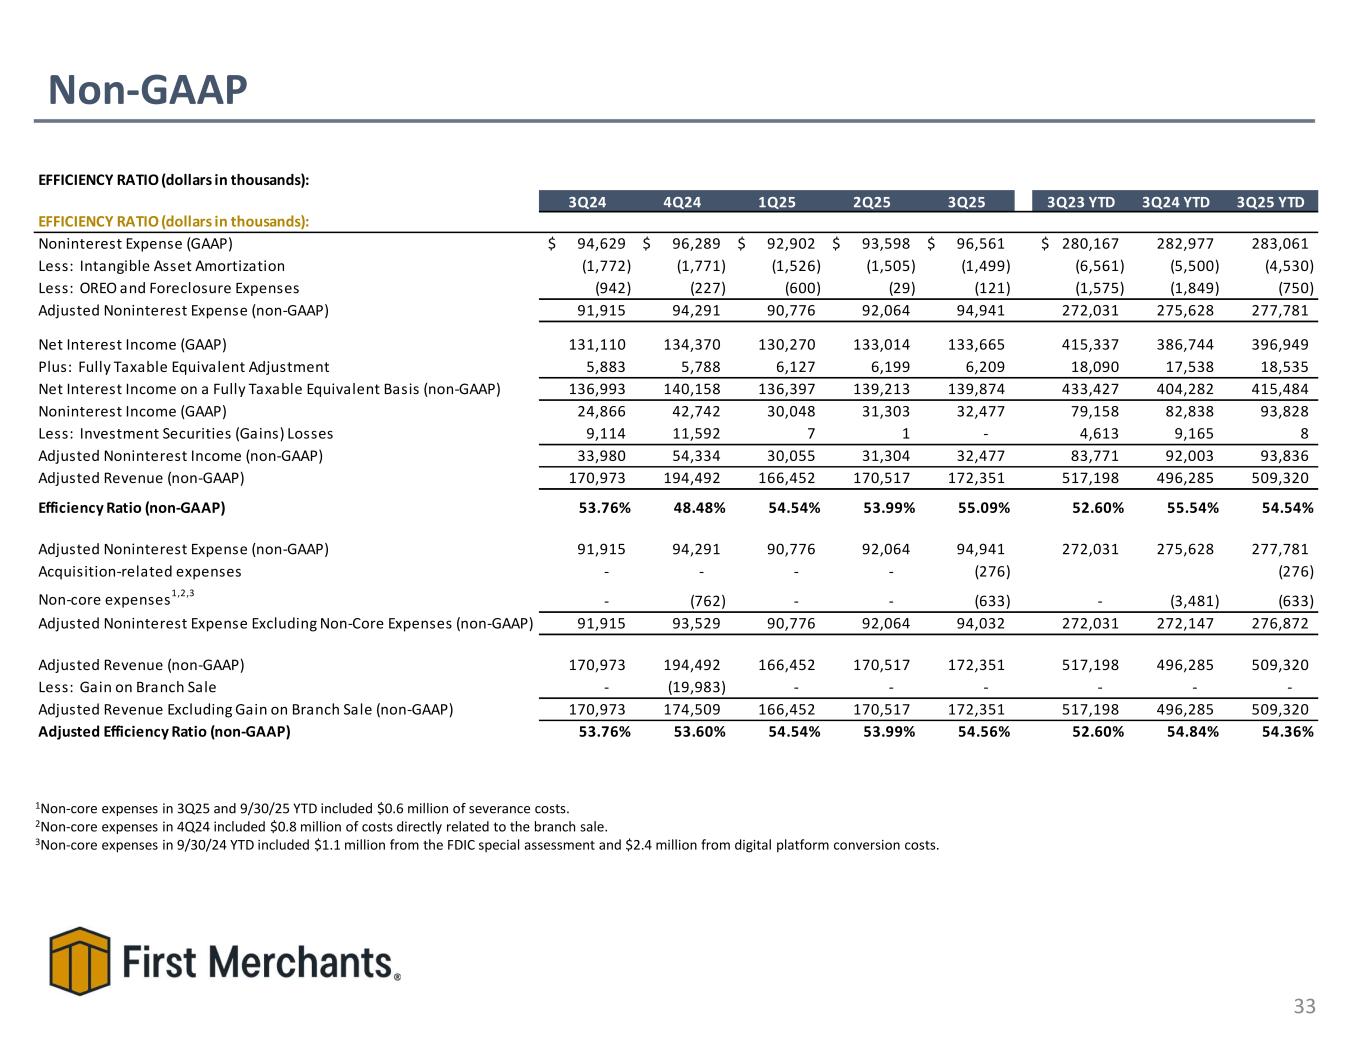
Non-GAAP 33 1Non-core expenses in 3Q25 and 9/30/25 YTD included $0.6 million of severance costs. 2Non-core expenses in 4Q24 included $0.8 million of costs directly related to the branch sale. 3Non-core expenses in 9/30/24 YTD included $1.1 million from the FDIC special assessment and $2.4 million from digital platform conversion costs. EFFICIENCY RATIO (dollars in thousands): 3Q24 4Q24 1Q25 2Q25 3Q25 3Q23 YTD 3Q24 YTD 3Q25 YTD EFFICIENCY RATIO (dollars in thousands): Noninterest Expense (GAAP) 94,629$ 96,289$ 92,902$ 93,598$ 96,561$ 280,167$ 282,977 283,061 Less: Intangible Asset Amortization (1,772) (1,771) (1,526) (1,505) (1,499) (6,561) (5,500) (4,530) Less: OREO and Foreclosure Expenses (942) (227) (600) (29) (121) (1,575) (1,849) (750) Adjusted Noninterest Expense (non-GAAP) 91,915 94,291 90,776 92,064 94,941 272,031 275,628 277,781 Net Interest Income (GAAP) 131,110 134,370 130,270 133,014 133,665 415,337 386,744 396,949 Plus: Fully Taxable Equivalent Adjustment 5,883 5,788 6,127 6,199 6,209 18,090 17,538 18,535 Net Interest Income on a Fully Taxable Equivalent Basis (non-GAAP) 136,993 140,158 136,397 139,213 139,874 433,427 404,282 415,484 Noninterest Income (GAAP) 24,866 42,742 30,048 31,303 32,477 79,158 82,838 93,828 Less: Investment Securities (Gains) Losses 9,114 11,592 7 1 - 4,613 9,165 8 Adjusted Noninterest Income (non-GAAP) 33,980 54,334 30,055 31,304 32,477 83,771 92,003 93,836 Adjusted Revenue (non-GAAP) 170,973 194,492 166,452 170,517 172,351 517,198 496,285 509,320 Efficiency Ratio (non-GAAP) 53.76% 48.48% 54.54% 53.99% 55.09% 52.60% 55.54% 54.54% Adjusted Noninterest Expense (non-GAAP) 91,915 94,291 90,776 92,064 94,941 272,031 275,628 277,781 Acquisition-related expenses - - - - (276) (276) Non-core expenses1,2,3 - (762) - - (633) - (3,481) (633) Adjusted Noninterest Expense Excluding Non-Core Expenses (non-GAAP) 91,915 93,529 90,776 92,064 94,032 272,031 272,147 276,872 Adjusted Revenue (non-GAAP) 170,973 194,492 166,452 170,517 172,351 517,198 496,285 509,320 Less: Gain on Branch Sale - (19,983) - - - - - - Adjusted Revenue Excluding Gain on Branch Sale (non-GAAP) 170,973 174,509 166,452 170,517 172,351 517,198 496,285 509,320 Adjusted Efficiency Ratio (non-GAAP) 53.76% 53.60% 54.54% 53.99% 54.56% 52.60% 54.84% 54.36%
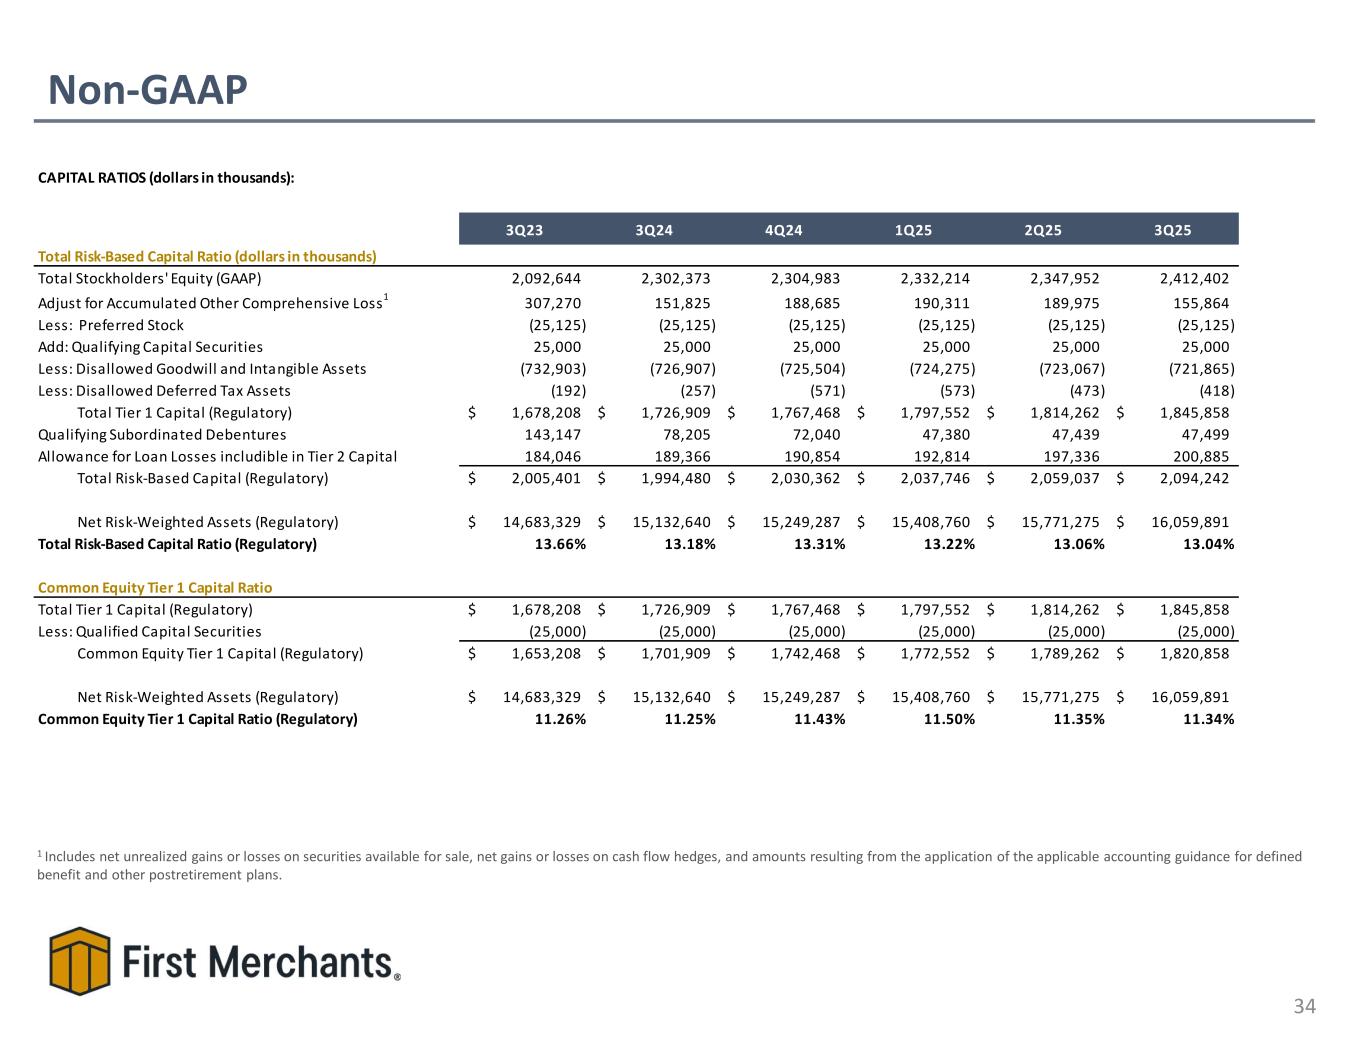
Non-GAAP 34 1 Includes net unrealized gains or losses on securities available for sale, net gains or losses on cash flow hedges, and amounts resulting from the application of the applicable accounting guidance for defined benefit and other postretirement plans. CAPITAL RATIOS (dollars in thousands): 3Q23 3Q24 4Q24 1Q25 2Q25 3Q25 Total Risk-Based Capital Ratio (dollars in thousands) Total Stockholders' Equity (GAAP) 2,092,644 2,302,373 2,304,983 2,332,214 2,347,952 2,412,402 Adjust for Accumulated Other Comprehensive Loss1 307,270 151,825 188,685 190,311 189,975 155,864 Less: Preferred Stock (25,125) (25,125) (25,125) (25,125) (25,125) (25,125) Add: Qualifying Capital Securities 25,000 25,000 25,000 25,000 25,000 25,000 Less: Disallowed Goodwill and Intangible Assets (732,903) (726,907) (725,504) (724,275) (723,067) (721,865) Less: Disallowed Deferred Tax Assets (192) (257) (571) (573) (473) (418) Total Tier 1 Capital (Regulatory) 1,678,208$ 1,726,909$ 1,767,468$ 1,797,552$ 1,814,262$ 1,845,858$ Qualifying Subordinated Debentures 143,147 78,205 72,040 47,380 47,439 47,499 Allowance for Loan Losses includible in Tier 2 Capital 184,046 189,366 190,854 192,814 197,336 200,885 Total Risk-Based Capital (Regulatory) 2,005,401$ 1,994,480$ 2,030,362$ 2,037,746$ 2,059,037$ 2,094,242$ Net Risk-Weighted Assets (Regulatory) 14,683,329$ 15,132,640$ 15,249,287$ 15,408,760$ 15,771,275$ 16,059,891$ Total Risk-Based Capital Ratio (Regulatory) 13.66% 13.18% 13.31% 13.22% 13.06% 13.04% Common Equity Tier 1 Capital Ratio Total Tier 1 Capital (Regulatory) 1,678,208$ 1,726,909$ 1,767,468$ 1,797,552$ 1,814,262$ 1,845,858$ Less: Qualified Capital Securities (25,000) (25,000) (25,000) (25,000) (25,000) (25,000) Common Equity Tier 1 Capital (Regulatory) 1,653,208$ 1,701,909$ 1,742,468$ 1,772,552$ 1,789,262$ 1,820,858$ Net Risk-Weighted Assets (Regulatory) 14,683,329$ 15,132,640$ 15,249,287$ 15,408,760$ 15,771,275$ 16,059,891$ Common Equity Tier 1 Capital Ratio (Regulatory) 11.26% 11.25% 11.43% 11.50% 11.35% 11.34%
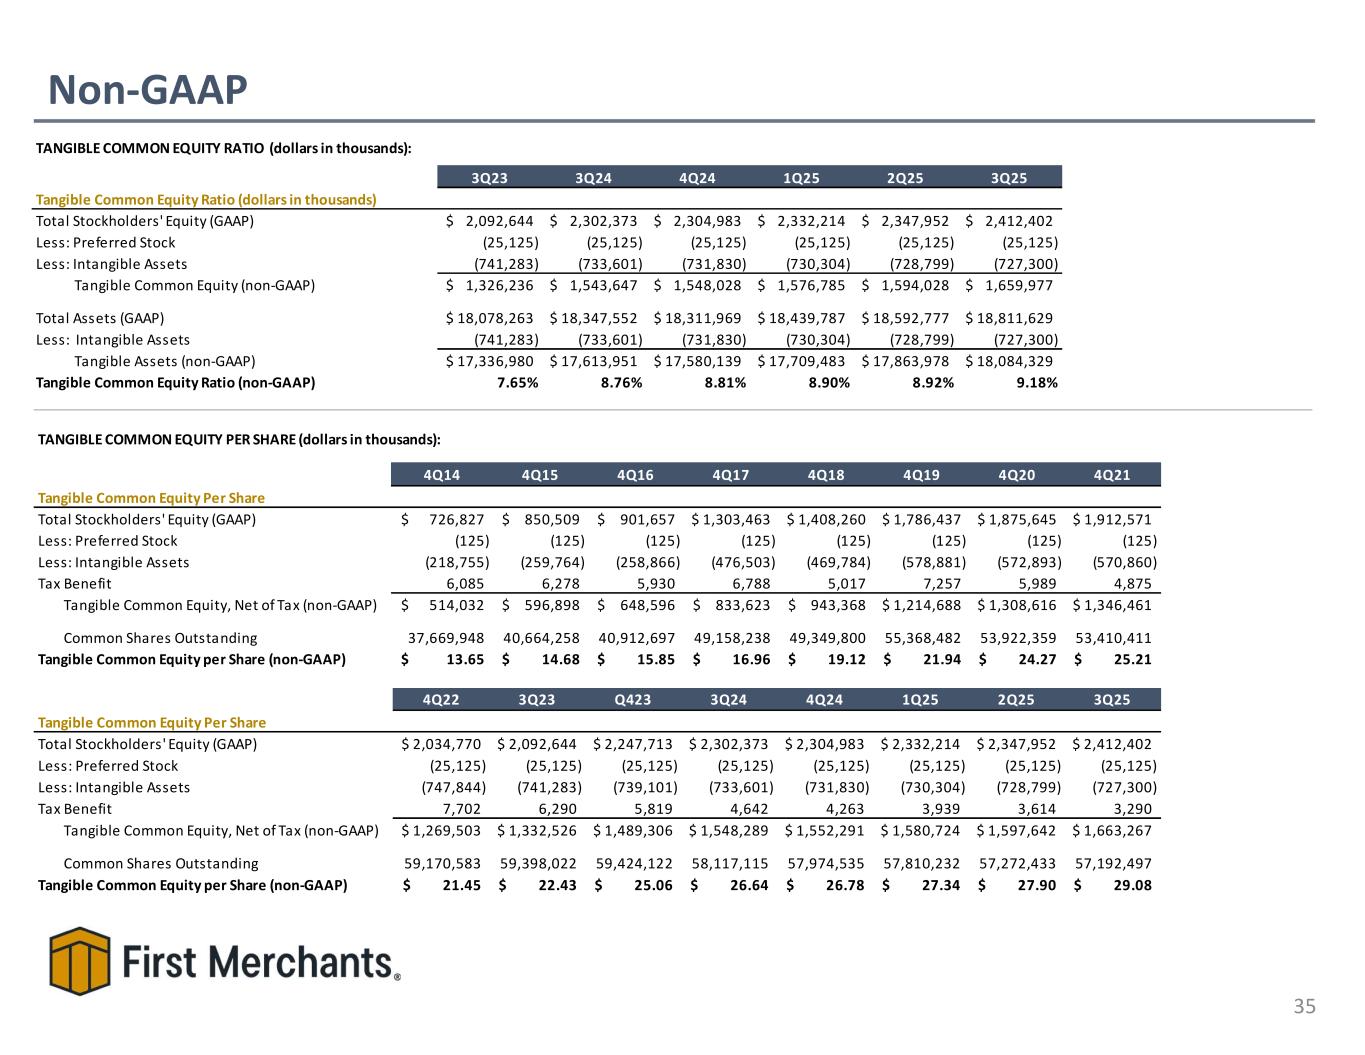
Non-GAAP 35 TANGIBLE COMMON EQUITY RATIO (dollars in thousands): 3Q23 3Q24 4Q24 1Q25 2Q25 3Q25 Tangible Common Equity Ratio (dollars in thousands) Total Stockholders' Equity (GAAP) 2,092,644$ 2,302,373$ 2,304,983$ 2,332,214$ 2,347,952$ 2,412,402$ Less: Preferred Stock (25,125) (25,125) (25,125) (25,125) (25,125) (25,125) Less: Intangible Assets (741,283) (733,601) (731,830) (730,304) (728,799) (727,300) Tangible Common Equity (non-GAAP) 1,326,236$ 1,543,647$ 1,548,028$ 1,576,785$ 1,594,028$ 1,659,977$ Total Assets (GAAP) 18,078,263$ 18,347,552$ 18,311,969$ 18,439,787$ 18,592,777$ 18,811,629$ Less: Intangible Assets (741,283) (733,601) (731,830) (730,304) (728,799) (727,300) Tangible Assets (non-GAAP) 17,336,980$ 17,613,951$ 17,580,139$ 17,709,483$ 17,863,978$ 18,084,329$ Tangible Common Equity Ratio (non-GAAP) 7.65% 8.76% 8.81% 8.90% 8.92% 9.18% TANGIBLE COMMON EQUITY PER SHARE (dollars in thousands): 4Q14 4Q15 4Q16 4Q17 4Q18 4Q19 4Q20 4Q21 Tangible Common Equity Per Share Total Stockholders' Equity (GAAP) 726,827$ 850,509$ 901,657$ 1,303,463$ 1,408,260$ 1,786,437$ 1,875,645$ 1,912,571$ Less: Preferred Stock (125) (125) (125) (125) (125) (125) (125) (125) Less: Intangible Assets (218,755) (259,764) (258,866) (476,503) (469,784) (578,881) (572,893) (570,860) Tax Benefit 6,085 6,278 5,930 6,788 5,017 7,257 5,989 4,875 Tangible Common Equity, Net of Tax (non-GAAP) 514,032$ 596,898$ 648,596$ 833,623$ 943,368$ 1,214,688$ 1,308,616$ 1,346,461$ Common Shares Outstanding 37,669,948 40,664,258 40,912,697 49,158,238 49,349,800 55,368,482 53,922,359 53,410,411 Tangible Common Equity per Share (non-GAAP) 13.65$ 14.68$ 15.85$ 16.96$ 19.12$ 21.94$ 24.27$ 25.21$ 4Q22 3Q23 Q423 3Q24 4Q24 1Q25 2Q25 3Q25 Tangible Common Equity Per Share Total Stockholders' Equity (GAAP) 2,034,770$ 2,092,644$ 2,247,713$ 2,302,373$ 2,304,983$ 2,332,214$ 2,347,952$ 2,412,402$ Less: Preferred Stock (25,125) (25,125) (25,125) (25,125) (25,125) (25,125) (25,125) (25,125) Less: Intangible Assets (747,844) (741,283) (739,101) (733,601) (731,830) (730,304) (728,799) (727,300) Tax Benefit 7,702 6,290 5,819 4,642 4,263 3,939 3,614 3,290 Tangible Common Equity, Net of Tax (non-GAAP) 1,269,503$ 1,332,526$ 1,489,306$ 1,548,289$ 1,552,291$ 1,580,724$ 1,597,642$ 1,663,267$ Common Shares Outstanding 59,170,583 59,398,022 59,424,122 58,117,115 57,974,535 57,810,232 57,272,433 57,192,497 Tangible Common Equity per Share (non-GAAP) 21.45$ 22.43$ 25.06$ 26.64$ 26.78$ 27.34$ 27.90$ 29.08$

Non-GAAP 36 RETURN ON TANGIBLE COMMON EQUITY (dollars in thousands): 2014 2015 2016 2017 2018 2019 2020 Return on Tangible Common Equity Total Average Stockholders' Equity (GAAP) 675,295$ 753,724$ 884,664$ 1,110,524$ 1,343,861$ 1,569,615$ 1,825,135$ Less: Average Preferred Stock (125) (125) (125) (125) (125) (125) (125) Less: Average Intangible Assets, Net of Tax (199,354) (215,281) (254,332) (360,005) (467,421) (499,622) (569,377) Average Tangible Common Equity, Net of Tax (non-GAAP) 475,816$ 538,318$ 630,207$ 750,394$ 876,315$ 1,069,868$ 1,255,633$ Net Income Available to Common Stockholders (GAAP) 60,162$ 65,384$ 81,051$ 96,070$ 159,139$ 164,460$ 148,600$ Plus: Intangible Asset Amortization, Net of Tax 1,395 1,720 2,542 3,670 5,307 4,736 4,730 Tangible Net Income (non-GAAP) 61,557$ 67,104$ 83,593$ 99,740$ 164,446$ 169,196$ 153,330$ Return on Tangible Common Equity (non-GAAP) 12.94% 12.47% 13.26% 13.29% 18.77% 15.81% 12.21% 2021 2022 3Q23 2023 YTD 2023 3Q24 2024 YTD Return on Tangible Common Equity Total Average Stockholders' Equity (GAAP) 1,866,632$ 1,972,445$ 2,154,232$ 2,126,005$ 2,127,262$ 2,251,547$ 2,232,419$ Less: Average Preferred Stock (125) (18,875) (25,125) (25,125) (25,125) (25,125) (25,125) Less: Average Intangible Assets, Net of Tax (567,512) (699,803) (735,787) (737,476) (736,601) (729,581) (730,993) Average Tangible Common Equity, Net of Tax (non-GAAP) 1,298,995$ 1,253,767$ 1,393,320$ 1,363,404$ 1,365,536$ 1,496,841$ 1,476,301$ Net Income Available to Common Stockholders (GAAP) 205,531$ 220,683$ 55,898$ 179,901$ 221,911$ 48,719$ 135,647$ Plus: Intangible Asset Amortization, Net of Tax 4,540 6,537 1,724 5,182 6,906 1,399 4,345 Tangible Net Income (non-GAAP) 210,071$ 227,220$ 57,622$ 185,083$ 228,817$ 50,118$ 139,992$ Return on Tangible Common Equity (non-GAAP) 16.17% 18.12% 16.54% 18.10% 16.76% 13.39% 12.64% 4Q24 2024 1Q25 2Q25 3Q25 2025 YTD Return on Tangible Common Equity Total Average Stockholders' Equity (GAAP) 2,312,270$ 2,252,491$ 2,340,874$ 2,340,010$ 2,367,971$ 2,349,718$ Less: Average Preferred Stock (25,125) (25,125) (25,125) (25,125) (25,125) (25,125) Less: Average Intangible Assets, Net of Tax (728,218) (730,295) (726,917) (725,813) (724,619) (725,775) Average Tangible Common Equity, Net of Tax (non-GAAP) 1,558,927$ 1,497,071$ 1,588,832$ 1,589,072$ 1,618,227$ 1,598,818$ Net Income Available to Common Stockholders (GAAP) 63,880$ 199,527$ 54,870$ 56,363$ 56,297$ 167,530$ Plus: Intangible Asset Amortization, Net of Tax 1,399 5,744 1,206 1,188 1,185 3,579 Tangible Net Income (non-GAAP) 65,279$ 205,271$ 56,076$ 57,551$ 57,482$ 171,109$ Return on Tangible Common Equity (non-GAAP) 16.75% 13.71% 14.12% 14.49% 14.21% 14.27%