0 0 Murphy January 2026 Investor Presentation Goldman Sachs Energy, CleanTech & Utilities Conference 2026 ERIC M. HAMBLY PRESIDENT AND CHIEF EXECUTIVE OFFICER January 7 th , 2026
1 1 Murphy January 2026 Investor Presentation CAUTIONARY STATEMENT Cautionary Note to US Investors – The United States Securities and Exchange Commission (SEC) requires oil and natural gas companies, in their filings with the SEC, to disclose proved reserves that a company has demonstrated by actual production or conclusive formation tests to be economically and legally producible under existing economic and operating conditions . We may use certain terms in this presentation, such as “resource”, “gross resource”, “recoverable resource”, “net risked PMEAN resource”, “recoverable oil”, “resource base”, “EUR” or “estimated ultimate recovery” and similar terms that the SEC’s rules prohibit us from including in filings with the SEC . The SEC permits the optional disclosure of probable and possible reserves in our filings with the SEC . Investors are urged to consider closely the disclosures and risk factors in our most recent Annual Report on Form 10 - K filed with the SEC and any subsequent Quarterly Report on Form 10 - Q or Current Report on Form 8 - K that we file, available from the SEC’s website . This presentation contains forward - looking statements within the meaning of the Private Securities Litigation Reform Act of 1995 . Forward - looking statements are generally identified through the inclusion of words such as “aim”, “anticipate”, “believe”, “drive”, “estimate”, “expect”, “expressed confidence”, “forecast”, “future”, “goal”, “guidance”, “intend”, “may”, “objective”, “outlook”, “plan”, “position”, “potential”, “project”, “seek”, “should”, “strategy”, “target”, “will” or variations of such words and other similar expressions . These statements, which express management’s current views concerning future events, results and plans, are subject to inherent risks, uncertainties and assumptions (many of which are beyond our control) and are not guarantees of performance . In particular, statements, express or implied, concerning the company’s future operating results or activities and returns or the company's ability and decisions to replace or increase reserves, increase production, generate returns and rates of return, replace or increase drilling locations, reduce or otherwise control operating costs and expenditures, generate cash flows, pay down or refinance indebtedness, achieve, reach or otherwise meet initiatives, plans, goals, ambitions or targets with respect to emissions, safety matters or other ESG (environmental/social/governance) matters, make capital expenditures or pay and/or increase dividends or make share repurchases and other capital allocation decisions are forward - looking statements . Factors that could cause one or more of these future events, results or plans not to occur as implied by any forward - looking statement, which consequently could cause actual results or activities to differ materially from the expectations expressed or implied by such forward - looking statements, include, but are not limited to : macro conditions in the oil and natural gas industry, including supply/demand levels, actions taken by major oil exporters and the resulting impacts on commodity prices ; geopolitical concerns ; increased volatility or deterioration in the success rate of our exploration programs or in our ability to maintain production rates and replace reserves ; reduced customer demand for our products due to environmental, regulatory, technological or other reasons ; adverse foreign exchange movements ; political and regulatory instability in the markets where we do business ; the impact on our operations or market of health pandemics such as COVID - 19 and related government responses ; other natural hazards impacting our operations or markets ; any other deterioration in our business, markets or prospects ; any failure to obtain necessary regulatory approvals ; any inability to service or refinance our outstanding debt or to access debt markets at acceptable prices ; or adverse developments in the U . S . or global capital markets, credit markets, banking system or economies in general, including inflation, trade policies, tariffs and other trade restrictions . For further discussion of factors that could cause one or more of these future events or results not to occur as implied by any forward - looking statement, see “Risk Factors” in our most recent Annual Report on Form 10 - K filed with the SEC and any subsequent Quarterly Report on Form 10 - Q or Current Report on Form 8 - K that we file, available from the SEC’s website and from Murphy Oil Corporation’s website at http : //ir . murphyoilcorp . com . Investors and others should note that we may announce material information using SEC filings, press releases, public conference calls, webcasts and the investors page of our website . We may use these channels to distribute material information about the company ; therefore, we encourage investors, the media, business partners and others interested in the company to review the information we post on our website . The information on our website is not part of, and is not incorporated into, this presentation . Murphy Oil Corporation undertakes no duty to publicly update or revise any forward - looking statements . Non - GAAP Financial Measures – This presentation contains certain non - GAAP financial measures that management believes are useful tools for internal use and the investment community in evaluating Murphy Oil Corporation’s overall financial performance . These non - GAAP financial measures are broadly used to value and compare companies in the crude oil and natural gas industry . Not all companies define these measures in the same way . In addition, these non - GAAP financial measures are not a substitute for financial measures prepared in accordance with US generally accepted accounting principles (GAAP) and should therefore be considered only as supplemental to such GAAP financial measures . Definitions and reconciliations of these measures are included in the appendix .
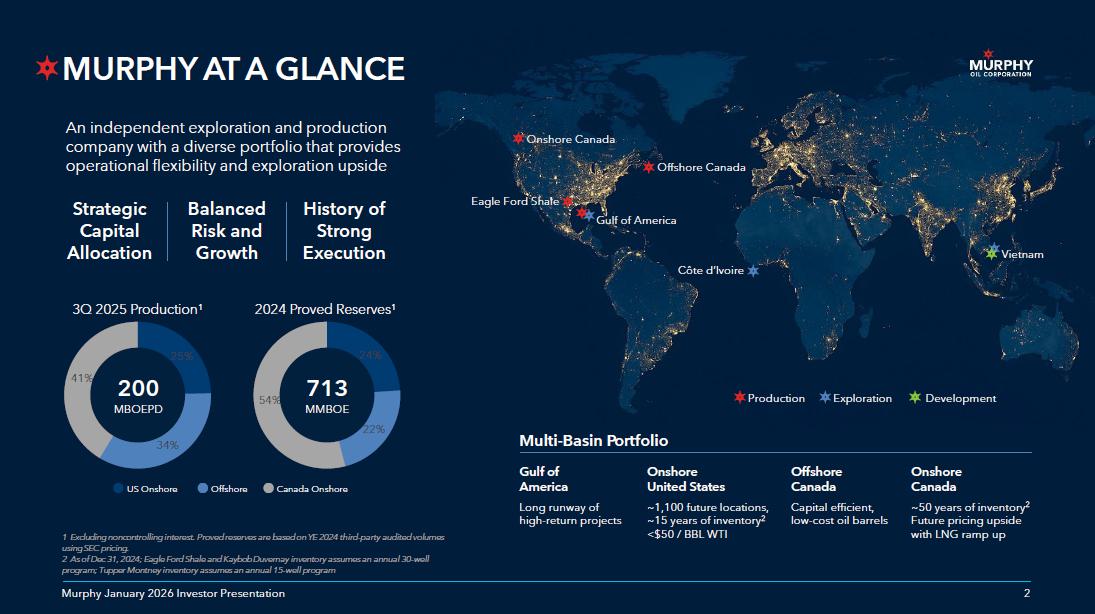
2 2 Murphy January 2026 Investor Presentation Eagle Ford Shale Gulf of America Offshore Canada Production Exploration Development Onshore Canada Côte d’Ivoire Vietnam MURPHY AT A GLANCE 2 Murphy January 2026 Investor Presentation An independent exploration and production company with a diverse portfolio that provides operational flexibility and exploration upside 1 Excluding noncontrolling interest. Proved reserves are based on YE 2024 third - party audited volumes using SEC pricing. 2 As of Dec 31, 2024; Eagle Ford Shale and Kaybob Duvernay inventory assumes an annual 30 - well program; Tupper Montney inventory assumes an annual 15 - well program Strategic Capital Allocation Balanced Risk and Growth History of Strong Execution Multi - Basin Portfolio Gulf of America Long runway of high - return projects Onshore United States ~1,100 future locations, ~15 years of inventory 2 <$50 / BBL WTI Offshore Canada Capital efficient, low - cost oil barrels Onshore Canada ~50 years of inventory 2 Future pricing upside with LNG ramp up 25% 34% 41% 3Q 2025 Production 1 24% 22% 54% 2024 Proved Reserves 1 US Onshore Offshore Canada Onshore 200 MBOEPD 713 MMBOE
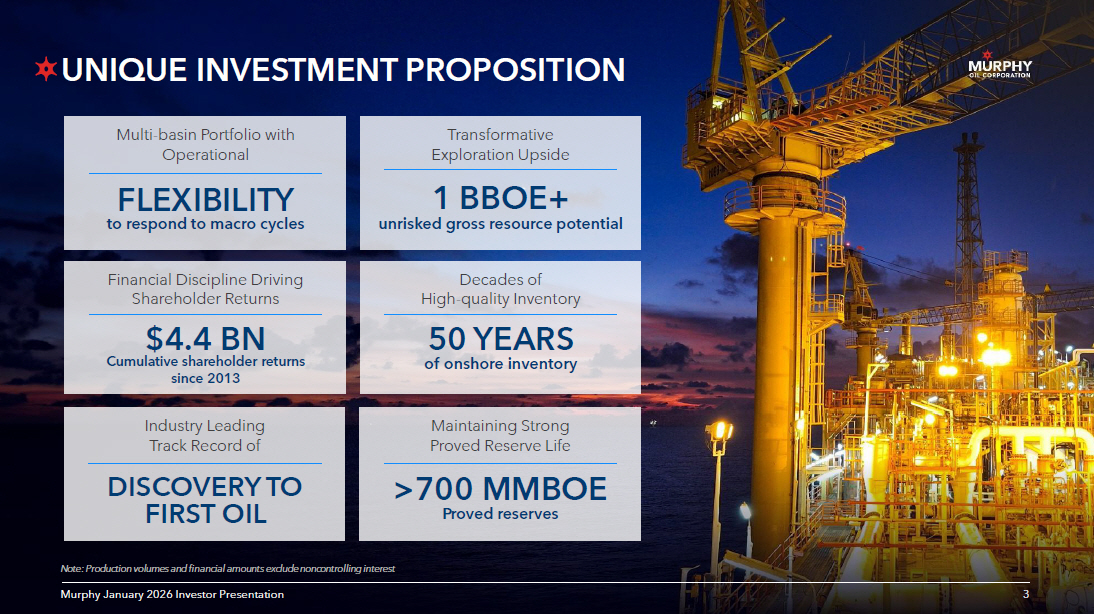
3 3 Murphy January 2026 Investor Presentation UNIQUE INVESTMENT PROPOSITION 3 Multi - basin Portfolio with Operational Financial Discipline Driving Shareholder Returns Industry Leading Track Record of Transformative Exploration Upside Decades of High - quality Inventory Maintaining Strong Proved Reserve Life Murphy January 2026 Investor Presentation Note: Production volumes and financial amounts exclude noncontrolling interest DISCOVERY TO FIRST OIL >700 MMBOE Proved reserves $4.4 BN Cumulative shareholder returns since 2013 FLEXIBILITY to respond to macro cycles 50 YEARS of onshore inventory 1 BBOE+ unrisked gross resource potential
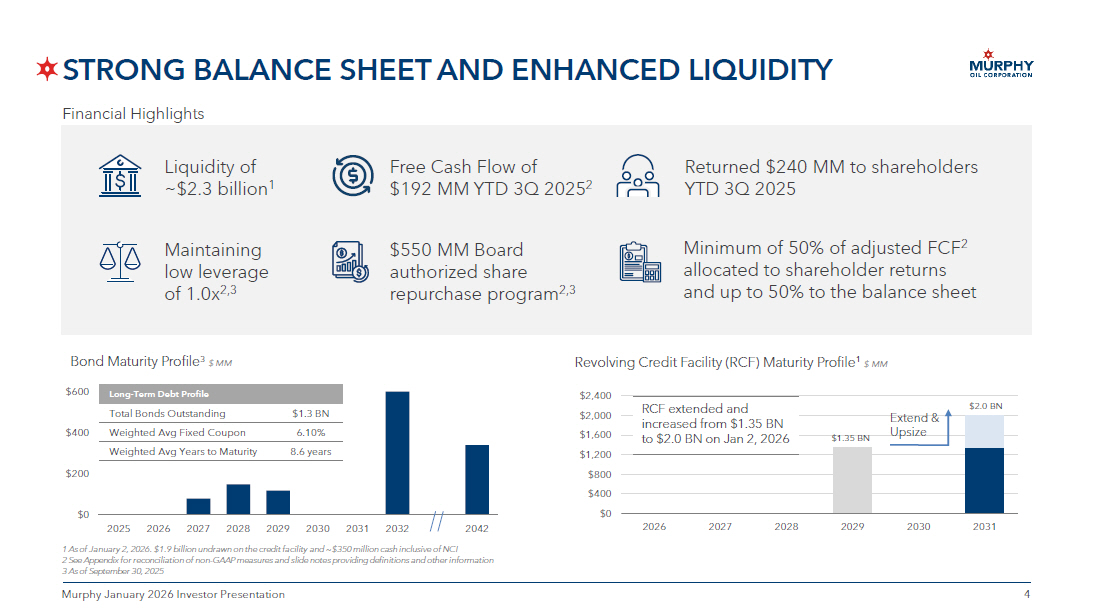
4 4 Murphy January 2026 Investor Presentation STRONG BALANCE SHEET AND ENHANCED LIQUIDITY Bond Maturity Profile 3 $ MM $0 $200 $400 $600 2025 2026 2027 2028 2029 2030 2031 2032 2042 Long - Term Debt Profile $1.3 BN Total Bonds Outstanding 6.10% Weighted Avg Fixed Coupon 8.6 years Weighted Avg Years to Maturity Financial Highlights 1 As of January 2, 2026. $1.9 billion undrawn on the credit facility and ~$350 million cash inclusive of NCI 2 See Appendix for reconciliation of non - GAAP measures and slide notes providing definitions and other information 3 As of September 30, 2025 Revolving Credit Facility (RCF) Maturity Profile 1 $ MM Liquidity of ~$2.3 billion 1 Maintaining low leverage of 1.0x 2,3 Free Cash Flow of $192 MM YTD 3Q 2025 2 Returned $240 MM to shareholders YTD 3Q 2025 $550 MM Board authorized share repurchase program 2,3 Minimum of 50% of adjusted FCF 2 allocated to shareholder returns and up to 50% to the balance sheet $0 $400 $800 $1,200 $1,600 $2,000 $2,400 2026 2027 2028 2029 2030 2031 Extend & Upsize $2.0 BN $1.35 BN RCF extended and increased from $1.35 BN to $2.0 BN on Jan 2, 2026
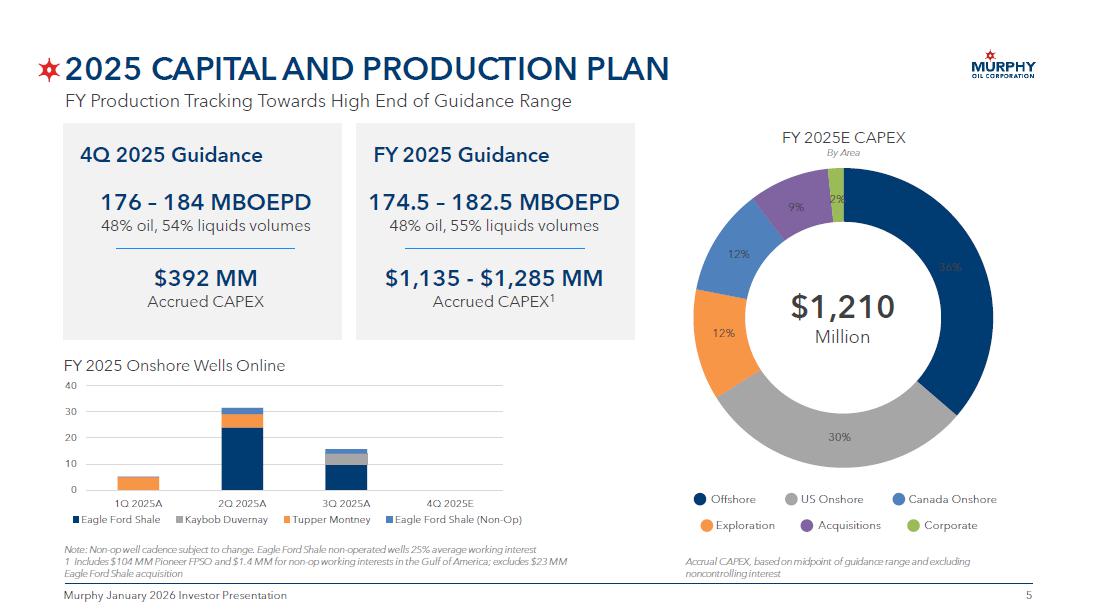
5 5 Murphy January 2026 Investor Presentation 2025 CAPITAL AND PRODUCTION PLAN Accrual CAPEX, based on midpoint of guidance range and excluding noncontrolling interest 36% 30% 12% 12% 9% 2% $ 1,210 Million FY 2025E CAPEX By Area FY 2025 Onshore Wells Online 0 10 20 30 40 1Q 2025A 2Q 2025A 3Q 2025A 4Q 2025E Eagle Ford Shale Kaybob Duvernay Tupper Montney Eagle Ford Shale (Non-Op) Note: Non - op well cadence subject to change . Eagle Ford Shale non - operated wells 25% average working interest 1 Includes $104 MM Pioneer FPSO and $1.4 MM for non - op working interests in the Gulf of America; excludes $23 MM Eagle Ford Shale acquisition 4Q 2025 Guidance FY 2025 Guidance 176 – 184 MBOEPD 48% oil, 54% liquids volumes $392 MM Accrued CAPEX 174.5 – 182.5 MBOEPD 48% oil, 55% liquids volumes $1,135 - $1,285 MM Accrued CAPEX 1 Offshore US Onshore Canada Onshore Exploration Corporate Acquisitions FY Production Tracking Towards High End of Guidance Range
6 6 Murphy January 2026 Investor Presentation OPERATIONS AND EXPLORATION UPDATE
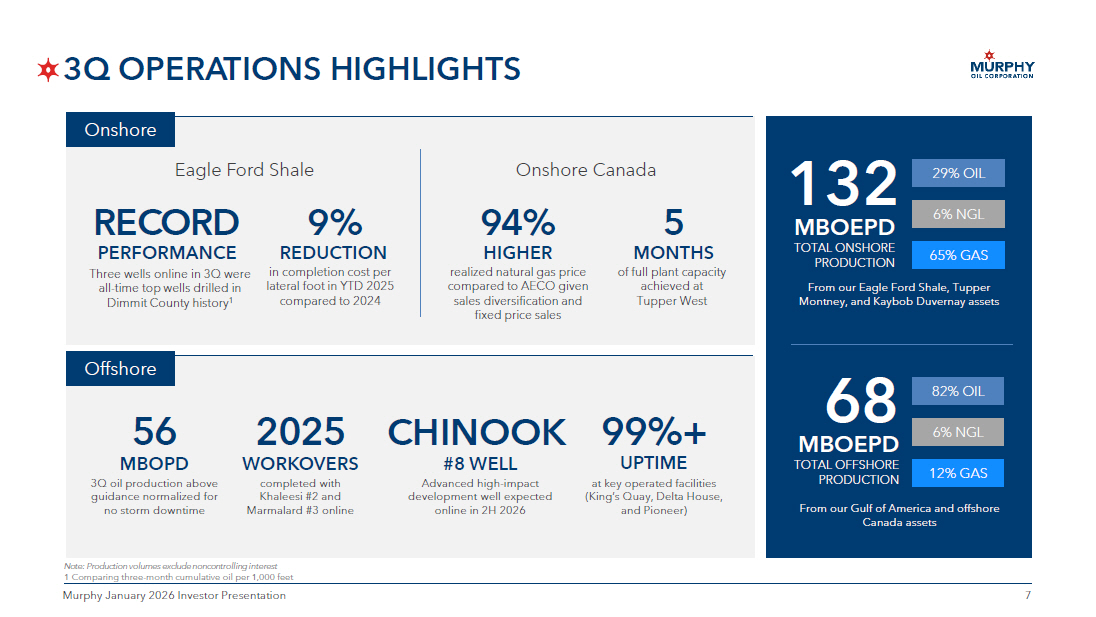
7 7 Murphy January 2026 Investor Presentation 3Q OPERATIONS HIGHLIGHTS 68 MBOEPD TOTAL OFFSHORE PRODUCTION 82% OIL 6% NGL 12% GAS 132 MBOEPD TOTAL ONSHORE PRODUCTION 29% OIL 6% NGL 65% GAS at key operated facilities (King’s Quay, Delta House, and Pioneer) 9 9%+ UPTIME From our Eagle Ford Shale, Tupper Montney, and Kaybob Duvernay assets From our Gulf of America and offshore Canada assets in completion cost per lateral foot in YTD 2025 compared to 2024 9 % REDUCTION of full plant capacity achieved at Tupper West 5 MONTHS PERFORMANCE Three wells online in 3Q were all - time top wells drilled in Dimmit County history 1 RECORD realized natural gas price compared to AECO given sales diversification and fixed price sales 3Q oil production above guidance normalized for no storm downtime 56 MBOPD Advanced high - impact development well expected online in 2H 2026 CHINOOK completed with Khaleesi #2 and Marmalard #3 online 2025 WORKOVERS Eagle Ford Shale Onshore Canada Onshore Offshore Note: Production volumes exclude noncontrolling interest 1 Comparing three - month cumulative oil per 1,000 feet 94 % HIGHER #8 WELL
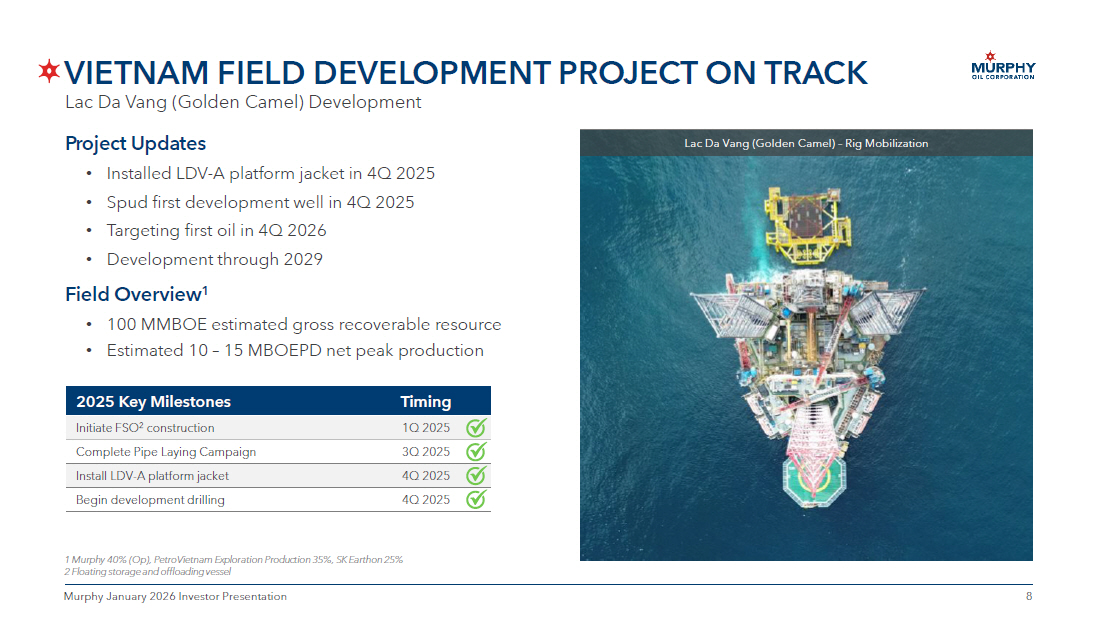
8 8 Murphy January 2026 Investor Presentation VIETNAM FIELD DEVELOPMENT PROJECT ON TRACK Lac Da Vang (Golden Camel) Development 1 Murphy 40% (Op), PetroVietnam Exploration Production 35%, SK Earthon 25% 2 Floating storage and offloading vessel Project Updates • Installed LDV - A platform jacket in 4Q 2025 • Spud first development well in 4Q 2025 • Targeting first oil in 4Q 2026 • Development through 2029 Field Overview 1 • 100 MMBOE estimated gross recoverable resource • Estimated 10 – 15 MBOEPD net peak production Timing 2025 Key Milestones 1Q 2025 Initiate FSO 2 construction 3Q 2025 Complete Pipe Laying Campaign 4Q 2025 Install LDV - A platform jacket 4Q 2025 Begin development drilling Lac Da Vang (Golden Camel) – Rig Mobilization
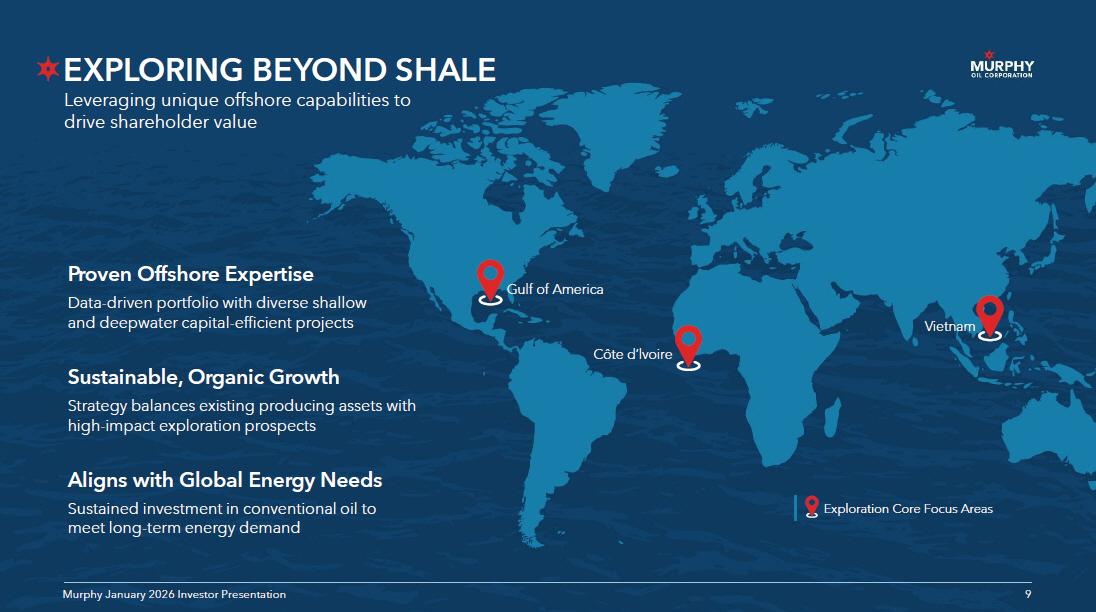
9 9 Murphy January 2026 Investor Presentation Proven Offshore Expertise Data - driven portfolio with diverse shallow and deepwater capital - efficient projects Aligns with Global Energy Needs Sustained investment in conventional oil to meet long - term energy demand Sustainable, Organic Growth Strategy balances existing producing assets with high - impact exploration prospects EXPLORING BEYOND SHALE 9 Murphy January 2026 Investor Presentation Leveraging unique offshore capabilities to drive shareholder value Gulf of America Côte d’lvoire Vietnam Exploration Core Focus Areas
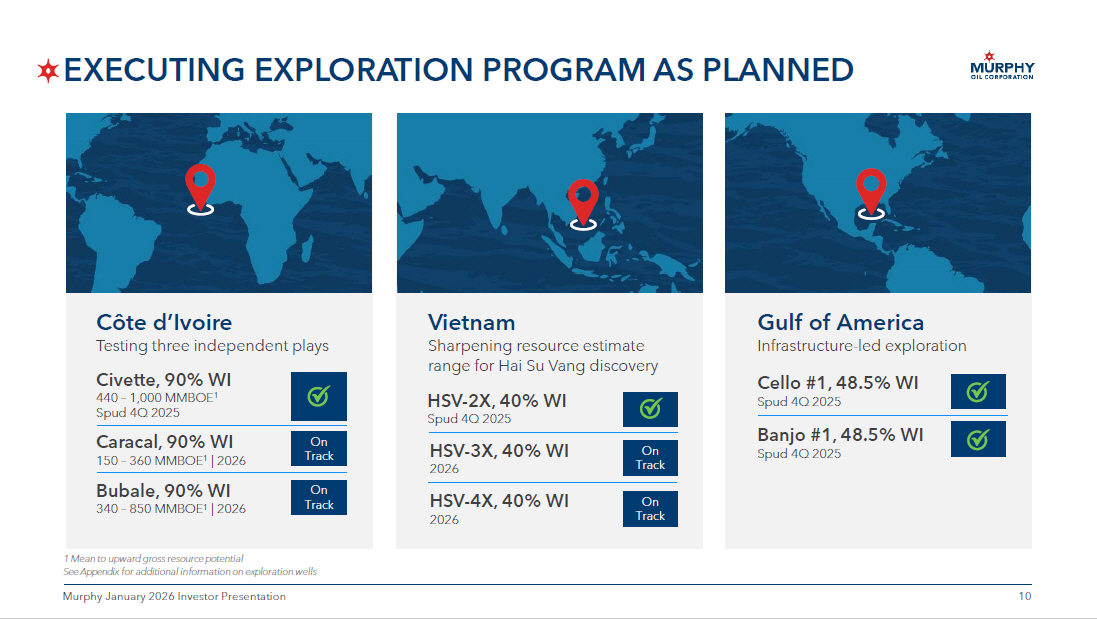
10 10 Murphy January 2026 Investor Presentation EXECUTING EXPLORATION PROGRAM AS PLANNED 1 Mean to upward gross resource potential See Appendix for additional information on exploration wells Vietnam Sharpening resource estimate range for Hai Su Vang discovery HSV - 2X, 40% WI Spud 4Q 2025 HSV - 3X, 40% WI 2026 HSV - 4X, 40% WI 2026 Gulf of America Infrastructure - led exploration Cello #1, 48.5% WI Spud 4Q 2025 Banjo #1, 48.5% WI Spud 4Q 2025 Côte d’Ivoire Testing three independent plays Civette, 90% WI 440 – 1,000 MMBOE 1 Spud 4Q 2025 Caracal, 90% WI 150 – 360 MMBOE 1 | 2026 Bubale, 90% WI 340 – 850 MMBOE 1 | 2026 On Track On Track On Track On Track
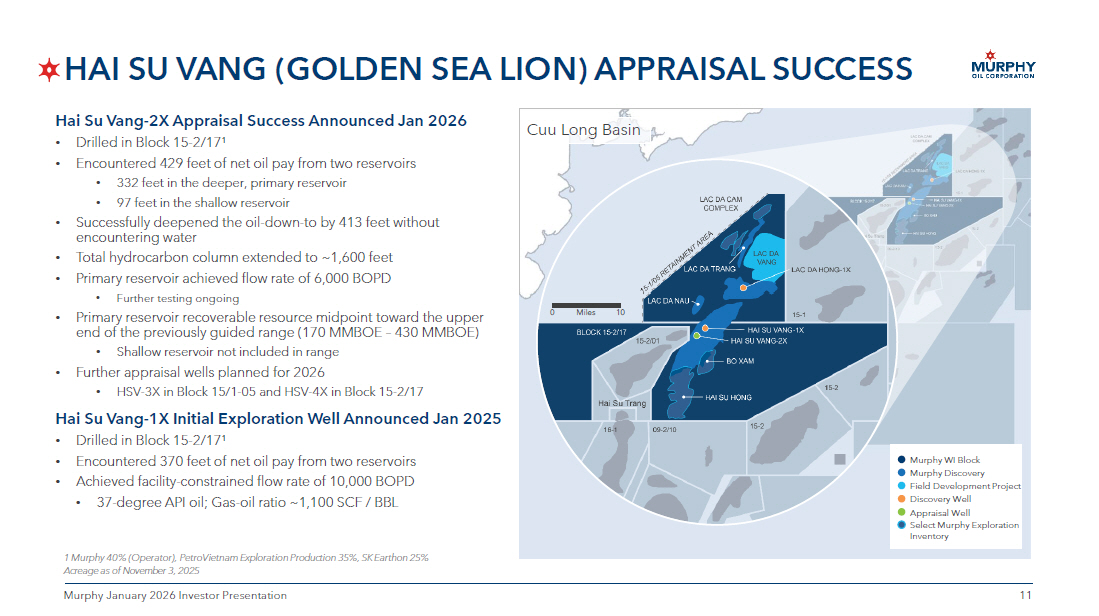
11 11 Murphy January 2026 Investor Presentation HAI SU VANG (GOLDEN SEA LION) APPRAISAL SUCCESS 1 Murphy 40% (Operator), PetroVietnam Exploration Production 35%, SK Earthon 25% Acreage as of November 3, 2025 Hai Su Vang - 2X Appraisal Success Announced Jan 2026 • Drilled in Block 15 - 2/17 1 • Encountered 429 feet of net oil pay from two reservoirs • 332 feet in the deeper, primary reservoir • 97 feet in the shallow reservoir • Successfully deepened the oil - down - to by 413 feet without encountering water • Total hydrocarbon column extended to ~1,600 feet • Primary reservoir achieved flow rate of 6,000 BOPD • Further testing ongoing • Primary reservoir recoverable resource midpoint toward the upper end of the previously guided range (170 MMBOE – 430 MMBOE) • Shallow reservoir not included in range • Further appraisal wells planned for 2026 • HSV - 3X in Block 15/1 - 05 and HSV - 4X in Block 15 - 2/17 Hai Su Vang - 1X Initial Exploration Well Announced Jan 2025 • Drilled in Block 15 - 2/17 1 • E ncountered 370 feet of net oil pay from two reservoirs • Achieved facility - constrained flow rate of 10,000 BOPD • 37 - degree API oil; Gas - oil ratio ~1,100 SCF / BBL Cuu Long Basin Discovery Well Appraisal Well Field Development Project Murphy Discovery Murphy WI Block Select Murphy Exploration Inventory Miles 10 0
12 12 Murphy January 2026 Investor Presentation APPENDIX
13 13 Murphy January 2026 Investor Presentation SUPPLEMENTAL INFORMATION Capital Allocation Plan The timing and magnitude of debt reductions and share repurchases will largely depend on oil and natural gas prices, developm ent costs and operating expenses, as well as any high - return investment opportunities. Because of the uncertainties around these matters, it is not poss ible to forecast how and when the company’s targets might be achieved. Share Repurchase Program The share repurchase program allows the company to repurchase shares through a variety of methods, including but not limited to open market purchases, privately negotiated transactions and other means in accordance with federal securities laws, such as through Rule 10b5 - 1 tradin g plans and under Rule 10b - 18 of the Exchange Act. This repurchase program has no time limit and may be suspended or discontinued completely at any tim e without prior notice as determined by the company at its discretion and dependent upon a variety of factors. Adjusted Free Cash Flow (Non - GAAP) Murphy defines adjusted free cash flow (a non - GAAP financial measure) as net cash provided by continuing operations activities, before non - cash working capital changes, less property additions and dry hole costs, acquisitions of oil and natural gas properties, distributions to NC I, dividends, withholding tax on stock - based inventive awards, and other payments such as debt tender and issuance costs and contingent consideration payments. S ee reconciliation slide for calculation. Leverage (Non - GAAP) Murphy defines leverage (a non - GAAP financial ratio) as total debt, including finance lease obligations, divided by adjusted ear nings before interest, taxes, depreciation and amortization (EBITDA) attributable to Murphy (non - GAAP). See reconciliation slide for calculation.
14 14 Murphy January 2026 Investor Presentation GLOSSARY OF ABBREVIATIONS AECO: Alberta Energy Company, the Canadian benchmark price for natural gas API : American Petroleum Institute BBL: Barrels (equal to 42 US gallons) BCF: Billion cubic feet BCFE: Billion cubic feet equivalent BN: Billions BOE: Barrels of oil equivalent (1 barrel of oil or 6,000 cubic feet of natural gas) BOEPD: Barrels of oil equivalent per day BOPD: Barrels of oil per day CAGR: Compound annual growth rate D&C: Drilling and completions DD&A: Depreciation, depletion and amortization EBITDA: Income from continuing operations before taxes, depreciation, depletion and amortization, and net interest expense EBITDAX: Income from continuing operations before taxes, depreciation, depletion and amortization, net interest expense, and exploration expenses EFS: Eagle Ford Shale EUR: Estimated ultimate recovery F&D: Finding and development G&A: General and administrative expenses GOA: Gulf of America IP: Initial production rate LOE: Lease operating expense MBO: Thousands barrels of oil MBOE: Thousands barrels of oil equivalent MBOEPD: Thousands of barrels of oil equivalent per day MBOPD: Thousands of barrels of oil per day MCF: Thousands of cubic feet MCFD: Thousands cubic feet per day MM: Millions MMBOE: Millions of barrels of oil equivalent MMCF: Millions of cubic feet MMCFD: Millions of cubic feet per day NGL: Natural gas liquids ROR: Rate of return R/P: Ratio of reserves to annual production SCF: Standard cubic feet TCF: Trillion cubic feet WI: Working interest WTI: West Texas Intermediate (a grade of crude oil)
15 15 Murphy January 2026 Investor Presentation NON - GAAP FINANCIAL MEASURE DEFINITIONS AND RECONCILIATIONS The following list of Non - GAAP financial measure definitions and related reconciliations is intended to satisfy the requirements of Regulation G of the Securities Exchange Act of 1934, as amended. This information is historical in nature. Murphy undertakes no obligation to publicly update or revise any Non - GAAP financial measure definitions and related reconciliations.

16 16 Murphy January 2026 Investor Presentation NON - GAAP RECONCILIATION Three Months Ended – Sept 30, 2024 Three Months Ended – Sept 30, 2025 (Millions of dollars) 429.0 339.4 Net Cash provided by continuing operations activities (GAAP) 1 (30.7) 28.4 Exclude: increase (decrease) in non - cash working capital 398.3 367.8 Operating cash flow excluding working capital adjustments (216.4) (149.0) Less: property additions and dry hole costs 181.9 218.8 Free Cash Flow (Non - GAAP) (44.7) (46.4) Less: cash dividend paid (35.4) (25.0) Less: distributions to noncontrolling interest - (23.0) Less: acquisition of oil and gas properties 101.8 124.4 Adjusted Free Cash Flow (Non - GAAP) 1 Includes noncontrolling interest in MP GOM Adjusted Free Cash Flow Murphy defines adjusted free cash flow (a non - GAAP financial measure) as net cash provided by continuing operations activities, before non - cash working capital changes, less property additions and dry hole costs, acquisitions of oil and natural gas properties, distributions to NCI, dividends, withh old ing tax on stock - based inventive awards, and other payments such as debt tender and issuance costs and contingent consideration payments. Management believes adjusted free cash flow is important information to provide as it is used by management to evaluate the C omp any’s ability to generate additional cash from business operations. Adjusted free cash flow is a non - GAAP financial measure and should not be considered a substitute for other financial measures as determined in accordance with accounting principles generally accepted in the United States of America (GAAP). Murphy’s definition of adjusted free cash flow is limited and does not represent residual cash flows available for discretion ary expenditures due to the fact that the measure does not deduct the payments required for debt service and other obligations or payments made for business acquisitions. Adjusted fre e cash flow as reported by Murphy may not be comparable to similarly titled measures used by other companies and should be considered in conjunction with other performanc e m easured prepared in accordance with GAAP. Therefore, we believe it is important to view adjusted free cash flow as supplemental to our entire statement of cash flows.
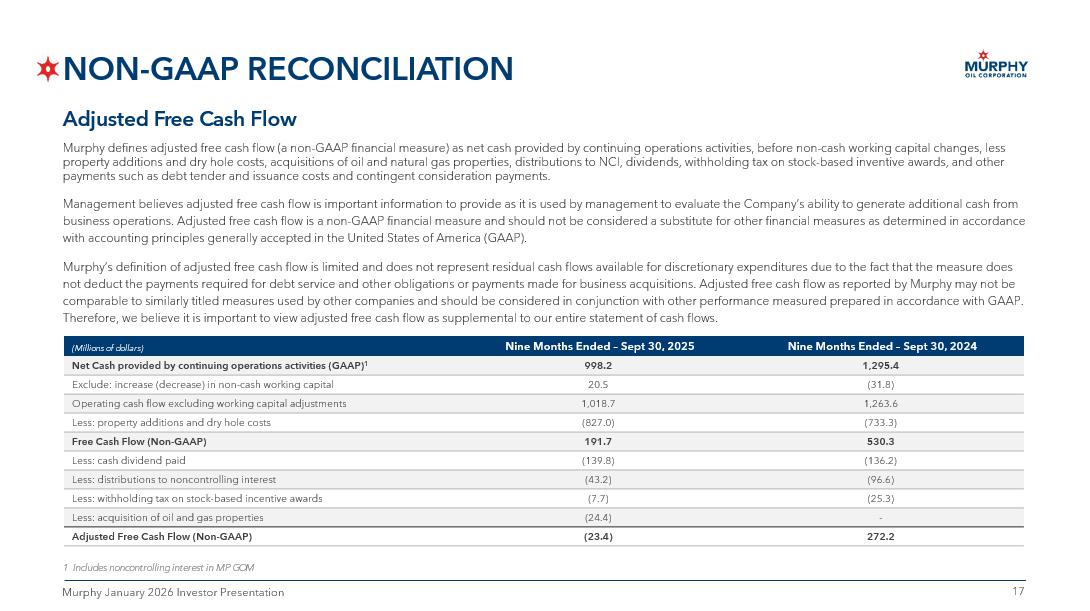
17 17 Murphy January 2026 Investor Presentation NON - GAAP RECONCILIATION Adjusted Free Cash Flow Murphy defines adjusted free cash flow (a non - GAAP financial measure) as net cash provided by continuing operations activities, before non - cash working capital changes, less property additions and dry hole costs, acquisitions of oil and natural gas properties, distributions to NCI, dividends, withh old ing tax on stock - based inventive awards, and other payments such as debt tender and issuance costs and contingent consideration payments. Management believes adjusted free cash flow is important information to provide as it is used by management to evaluate the C omp any’s ability to generate additional cash from business operations. Adjusted free cash flow is a non - GAAP financial measure and should not be considered a substitute for other financial measures as determined in accordance with accounting principles generally accepted in the United States of America (GAAP). Murphy’s definition of adjusted free cash flow is limited and does not represent residual cash flows available for discretion ary expenditures due to the fact that the measure does not deduct the payments required for debt service and other obligations or payments made for business acquisitions. Adjusted fre e cash flow as reported by Murphy may not be comparable to similarly titled measures used by other companies and should be considered in conjunction with other performanc e m easured prepared in accordance with GAAP. Therefore, we believe it is important to view adjusted free cash flow as supplemental to our entire statement of cash flows. Nine Months Ended – Sept 30, 2024 Nine Months Ended – Sept 30, 2025 (Millions of dollars) 1,295.4 998.2 Net Cash provided by continuing operations activities (GAAP) 1 (31.8) 20.5 Exclude: increase (decrease) in non - cash working capital 1,263.6 1,018.7 Operating cash flow excluding working capital adjustments (733.3) (827.0) Less: property additions and dry hole costs 530.3 191.7 Free Cash Flow (Non - GAAP) (136.2) (139.8) Less: cash dividend paid (96.6) (43.2) Less: distributions to noncontrolling interest (25.3) (7.7) Less: withholding tax on stock - based incentive awards - (24.4) Less: acquisition of oil and gas properties 272.2 (23.4) Adjusted Free Cash Flow (Non - GAAP) 1 Includes noncontrolling interest in MP GOM
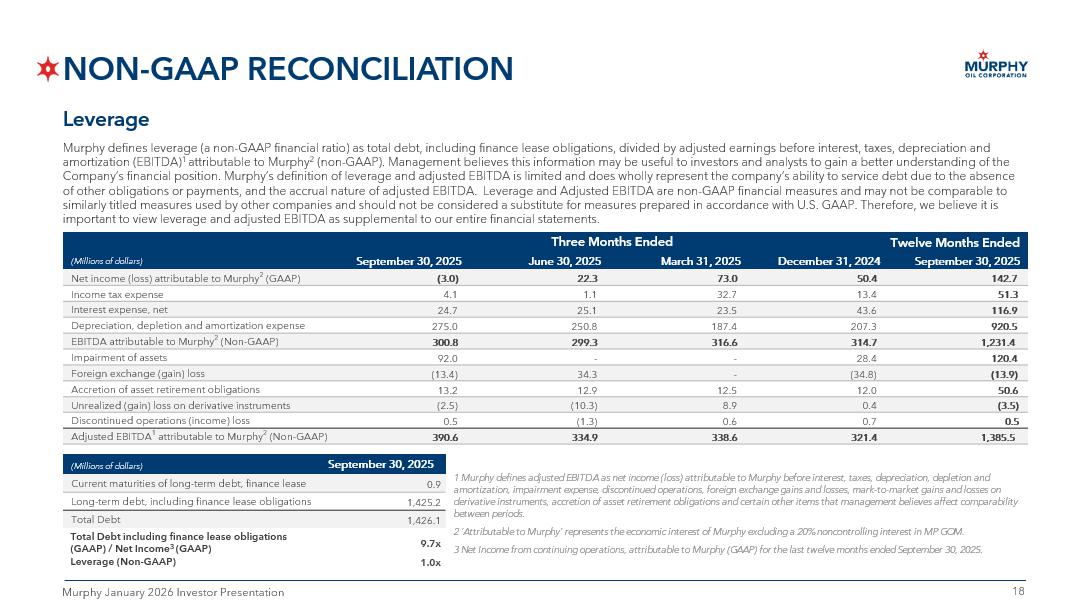
18 18 Murphy January 2026 Investor Presentation NON - GAAP RECONCILIATION Leverage Murphy defines leverage (a non - GAAP financial ratio) as total debt, including finance lease obligations, divided by adjusted ear nings before interest, taxes, depreciation and amortization (EBITDA) 1 attributable to Murphy 2 (non - GAAP). Management believes this information may be useful to investors and analysts to gain a better understanding of the Company’s financial position. Murphy’s definition of leverage and adjusted EBITDA is limited and does wholly represent the co mpa ny’s ability to service debt due to the absence of other obligations or payments, and the accrual nature of adjusted EBITDA. Leverage and Adjusted EBITDA are non - GAAP financia l measures and may not be comparable to similarly titled measures used by other companies and should not be considered a substitute for measures prepared in accordan ce with U.S. GAAP. Therefore, we believe it is important to view leverage and adjusted EBITDA as supplemental to our entire financial statements. Twelve Months Ended Three Months Ended September 30, 2025 December 31, 2024 March 31, 2025 June 30, 2025 September 30, 2025 (Millions of dollars) 142.7 50.4 73.0 22.3 (3.0) Net income (loss) attributable to Murphy 2 (GAAP) 51.3 13.4 32.7 1.1 4.1 Income tax expense 116.9 43.6 23.5 25.1 24.7 Interest expense, net 920.5 207.3 187.4 250.8 275.0 Depreciation, depletion and amortization expense 1,231.4 314.7 316.6 299.3 300.8 EBITDA attributable to Murphy 2 (Non - GAAP) 120.4 28.4 - - 92.0 Impairment of assets (13.9) (34.8) - 34.3 (13.4) Foreign exchange (gain) loss 50.6 12.0 12.5 12.9 13.2 Accretion of asset retirement obligations (3.5) 0.4 8.9 (10.3) (2.5) Unrealized (gain) loss on derivative instruments 0.5 0.7 0.6 (1.3) 0.5 Discontinued operations (income) loss 1,385.5 321.4 338.6 334.9 390.6 Adjusted EBITDA 1 attributable to Murphy 2 (Non - GAAP) 1 Murphy defines adjusted EBITDA as net income (loss) attributable to Murphy before interest, taxes, depreciation, depletion and amortization, impairment expense, discontinued operations, foreign exchange gains and losses, mark - to - market gains and losses on derivative instruments, accretion of asset retirement obligations and certain other items that management believes affect com par ability between periods. 2 ‘Attributable to Murphy’ represents the economic interest of Murphy excluding a 20% noncontrolling interest in MP GOM. 3 Net Income from continuing operations, attributable to Murphy (GAAP) for the last twelve months ended September 30, 2025. September 30, 2025 (Millions of dollars) 0.9 Current maturities of long - term debt, finance lease 1,425.2 Long - term debt, including finance lease obligations 1,426.1 Total Debt 9.7x Total Deb t including finance lease obligations (GAAP) / Net Income 3 (GAAP) 1.0x Leverage (Non - GAAP)
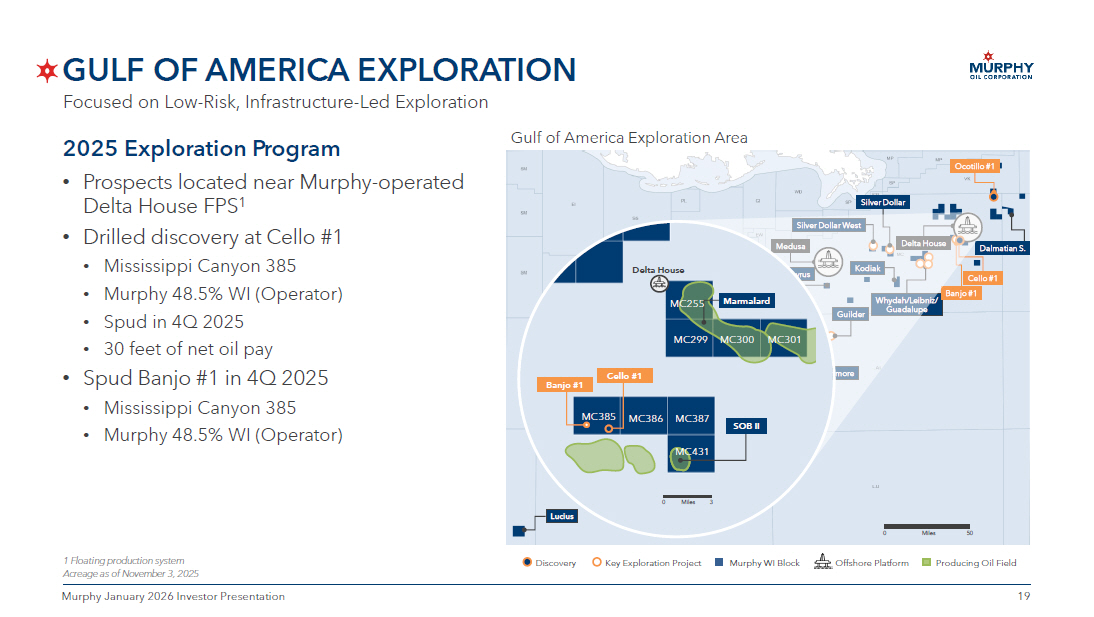
19 19 Murphy January 2026 Investor Presentation GULF OF AMERICA EXPLORATION 2025 Exploration Program • Prospects located near Murphy - operated Delta House FPS 1 • Drilled discovery at Cello #1 • Mississippi Canyon 385 • Murphy 48.5% WI (Operator) • Spud in 4Q 2025 • 30 feet of net oil pay • Spud Banjo #1 in 4Q 2025 • Mississippi Canyon 385 • Murphy 48.5% WI (Operator) 1 Floating production system Acreage as of November 3 , 2025 Gulf of America Exploration Area Miles 50 0 Offshore Platform Murphy WI Block Discovery Key Exploration Project Kodiak Front Runner Medusa Guilder Silver Dollar West Silver Dollar Liberty Longclaw Powerball Ninja Cascade Chinook Lucius St. Malo Whydah/Leibniz/ Guadalupe Delta House Rushmore King’s Quay Ocotillo #1 Dalmatian S. Banjo #1 Zephyrus Cello #1 Miles 3 0 Banjo #1 Cello #1 Delta House MC385 MC386 MC387 MC431 Marmalard MC255 MC299 MC300 SOB II MC301 Producing Oil Field Focused on Low - Risk, Infrastructure - Led Exploration
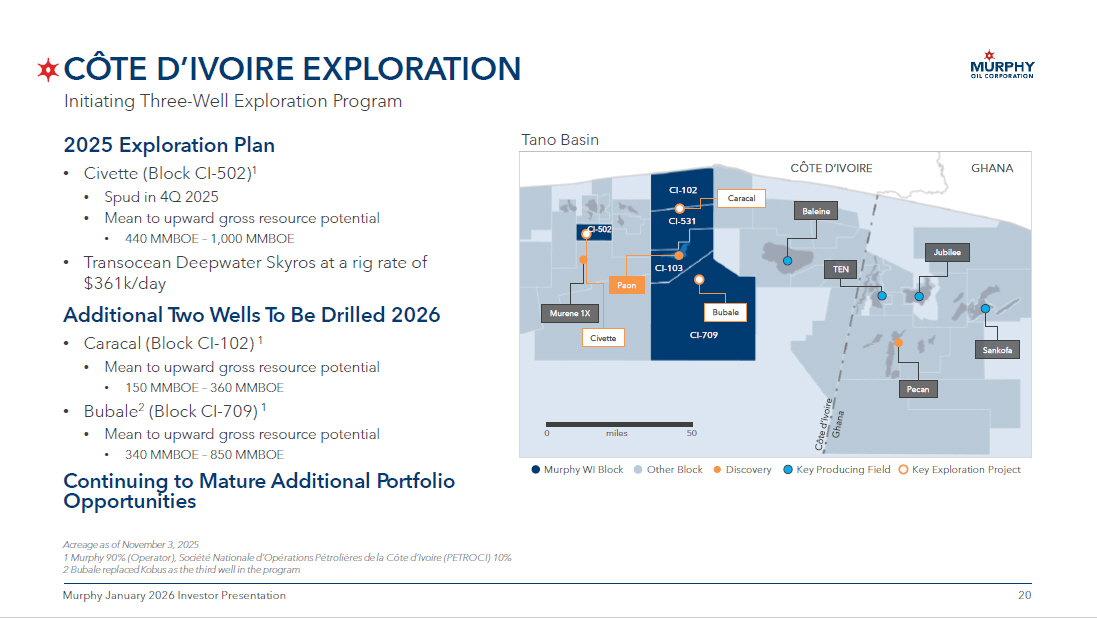
20 20 Murphy January 2026 Investor Presentation CÔTE D’IVOIRE EXPLORATION Tano Basin Murphy WI Block Other Block Discovery Key Producing Field Key Exploration Project Murene 1X CÔTE D’IVOIRE GHANA CI - 102 CI - 531 CI - 103 CI - 709 Baleine Pecan TEN Jubilee Sankofa Paon Civette CI - 502 50 0 miles Caracal Acreage as of November 3, 2025 1 Murphy 90% (Operator), Société Nationale d’Opérations Pétrolières de la Côte d’Ivoire (PETROCI) 10% 2 Bubale replaced Kobus as the third well in the program 2025 Exploration Plan • Civette (Block CI - 502) 1 • Spud in 4Q 2025 • Mean to upward gross resource potential • 440 MMBOE – 1,000 MMBOE • Transocean Deepwater Skyros at a rig rate of $361k/day Additional Two Wells To Be Drilled 2026 • Caracal (Block CI - 102) 1 • Mean to upward gross resource potential • 150 MMBOE – 360 MMBOE • Bubale 2 (Block CI - 709) 1 • Mean to upward gross resource potential • 340 MMBOE – 850 MMBOE Continuing to Mature Additional Portfolio Opportunities Initiating Three - Well Exploration Program Bubale
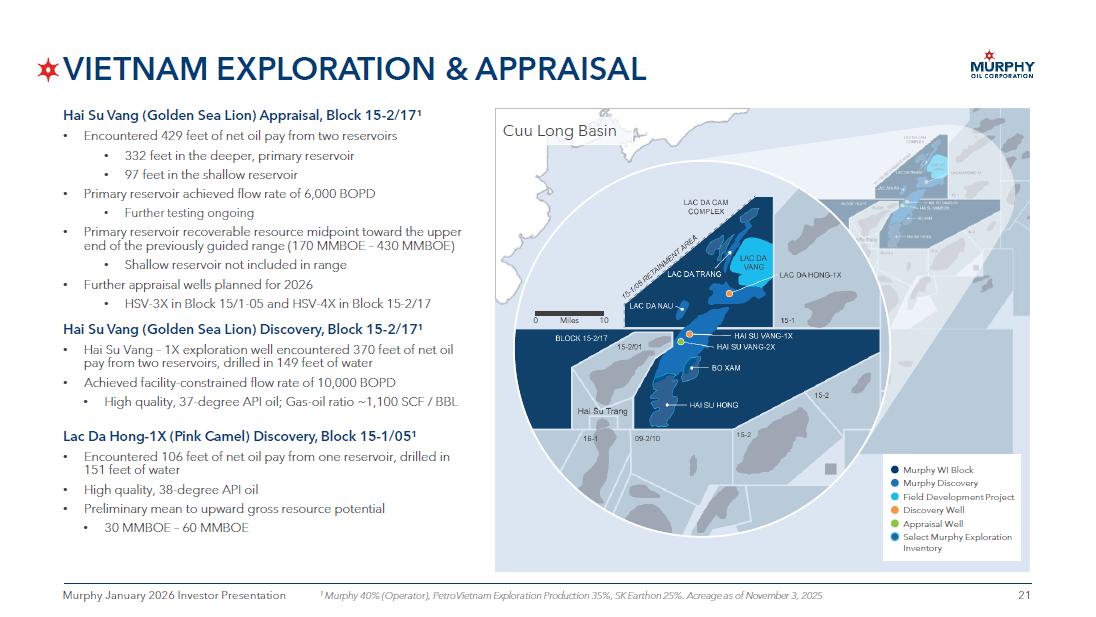
21 21 Murphy January 2026 Investor Presentation VIETNAM EXPLORATION & APPRAISAL 1 Murphy 40% (Operator), PetroVietnam Exploration Production 35%, SK Earthon 25%. Acreage as of November 3, 2025 Hai Su Vang (Golden Sea Lion) Appraisal, Block 15 - 2/17 1 • Encountered 429 feet of net oil pay from two reservoirs • 332 feet in the deeper, primary reservoir • 97 feet in the shallow reservoir • Primary reservoir achieved flow rate of 6,000 BOPD • Further testing ongoing • Primary reservoir recoverable resource midpoint toward the upper end of the previously guided range (170 MMBOE – 430 MMBOE) • Shallow reservoir not included in range • Further appraisal wells planned for 2026 • HSV - 3X in Block 15/1 - 05 and HSV - 4X in Block 15 - 2/17 Hai Su Vang (Golden Sea Lion) Discovery, Block 15 - 2/17 1 • Hai Su Vang – 1X exploration well encountered 370 feet of net oil pay from two reservoirs, drilled in 149 feet of water • Achieved facility - constrained flow rate of 10,000 BOPD • High quality, 37 - degree API oil; Gas - oil ratio ~1,100 SCF / BBL Lac Da Hong - 1X (Pink Camel) Discovery, Block 15 - 1/05 1 • Encountered 106 feet of net oil pay from one reservoir, drilled in 151 feet of water • High quality, 38 - degree API oil • Preliminary mean to upward gross resource potential • 30 MMBOE – 60 MMBOE Cuu Long Basin Discovery Well Appraisal Well Field Development Project Murphy Discovery Murphy WI Block Select Murphy Exploration Inventory Miles 10 0
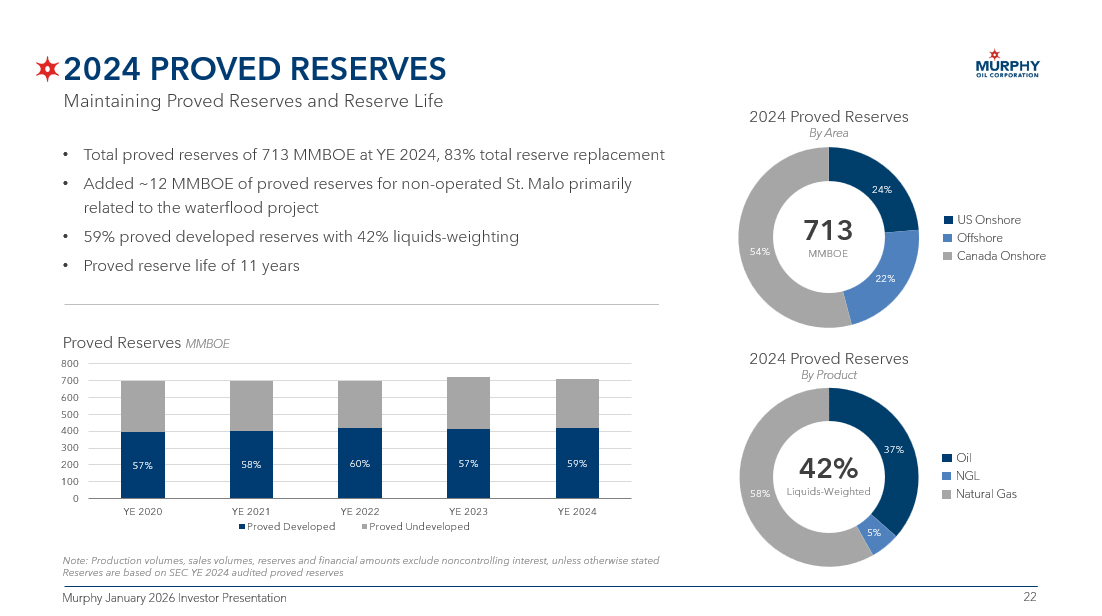
22 22 Murphy January 2026 Investor Presentation 2024 PROVED RESERVES • Total proved reserves of 713 MMBOE at YE 2024, 83% total reserve replacement • Added ~12 MMBOE of proved reserves for non - operated St. Malo primarily related to the waterflood project • 59% proved developed reserves with 42% liquids - weighting • Proved reserve life of 11 years Note: Production volumes, sales volumes, reserves and financial amounts exclude noncontrolling interest, unless otherwise sta ted Reserves are based on SEC YE 2024 audited proved reserves 713 MMBOE 2024 Proved Reserves By Area US Onshore Offshore Canada Onshore 57% 58% 60% 57% 59% 0 100 200 300 400 500 600 700 800 YE 2020 YE 2021 YE 2022 YE 2023 YE 2024 Proved Developed Proved Undeveloped Proved Reserves MMBOE 42 % Liquids - Weighted 2024 Proved Reserves By Product Oil NGL Natural Gas Maintaining Proved Reserves and Reserve Life
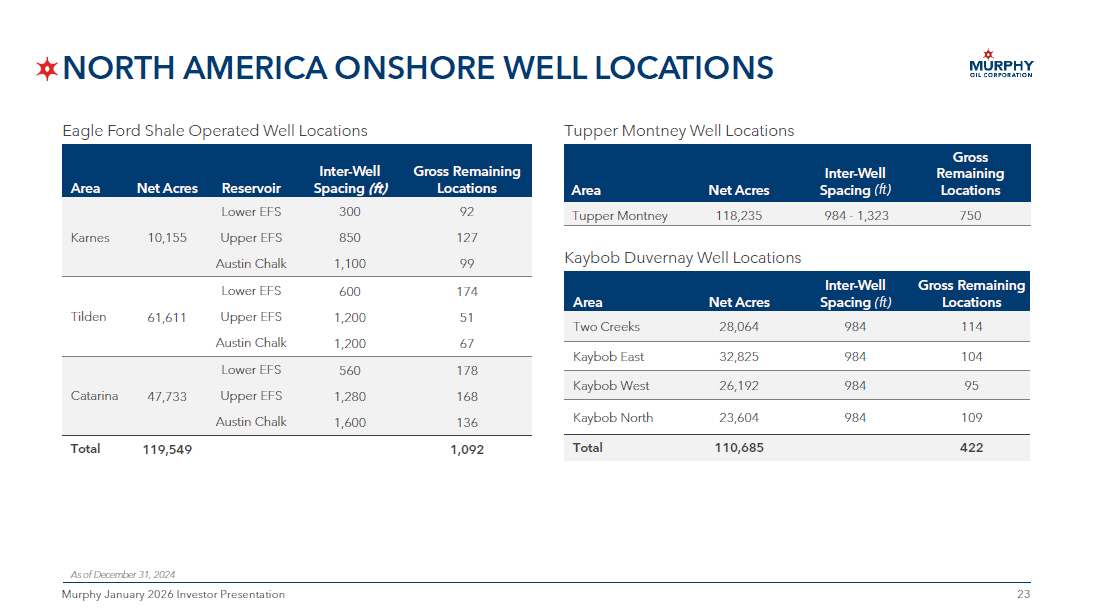
23 23 Murphy January 2026 Investor Presentation NORTH AMERICA ONSHORE WELL LOCATIONS Gross Remaining Locations Inter - Well Spacing (ft) Reservoir Net Acres Area 92 300 Lower EFS 10,155 Karnes 127 850 Upper EFS 99 1,100 Austin Chalk 174 600 Lower EFS 61,611 Tilden 51 1,200 Upper EFS 67 1,200 Austin Chalk 178 560 Lower EFS 47,733 Catarina 168 1,280 Upper EFS 136 1,600 Austin Chalk 1,092 119,549 Total Gross Remaining Locations Inter - Well Spacing (ft) Net Acres Area 114 984 28,064 Two Creeks 104 984 32,825 Kaybob East 95 984 26,192 Kaybob West 109 984 23,604 Kaybob North 422 110,685 Total Kaybob Duvernay Well Locations Eagle Ford Shale Operated Well Locations As of December 31, 2024 Gross Remaining Locations Inter - Well Spacing (ft) Net Acres Area 750 984 - 1,323 118,235 Tupper Montney Tupper Montney Well Locations
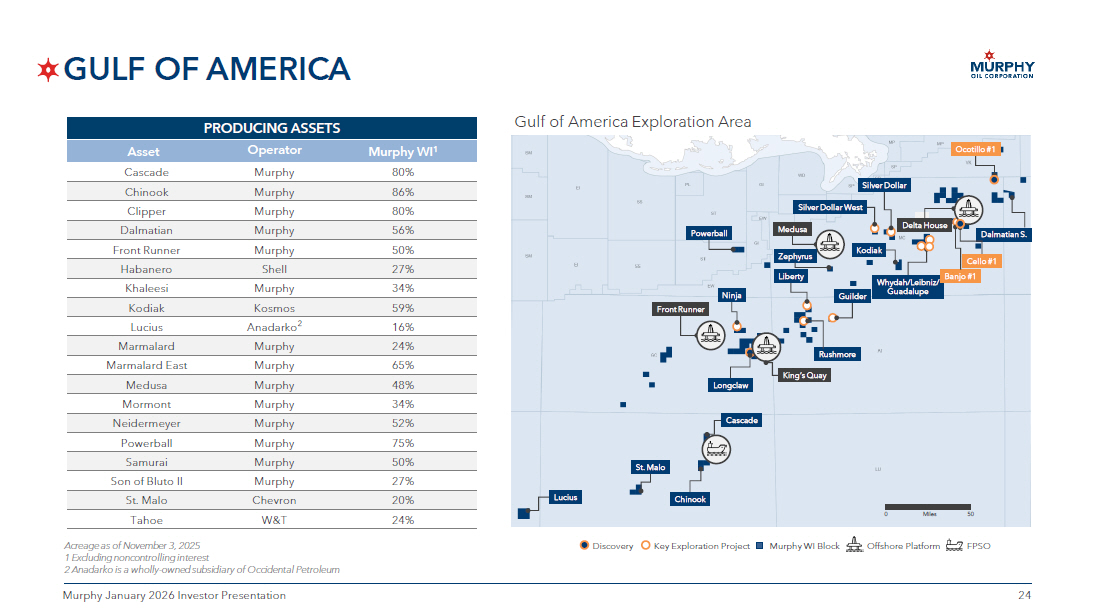
24 24 Murphy January 2026 Investor Presentation GULF OF AMERICA Acreage as of November 3 , 2025 1 Excluding noncontrolling interest 2 Anadarko is a wholly - owned subsidiary of Occidental Petroleum PRODUCING ASSETS Murphy WI 1 Operator Asset 80% Murphy Cascade 86% Murphy Chinook 80% Murphy Clipper 56% Murphy Dalmatian 50% Murphy Front Runner 27% Shell Habanero 34% Murphy Khaleesi 59% Kosmos Kodiak 16% Anadarko 2 Lucius 24% Murphy Marmalard 65% Murphy Marmalard East 48% Murphy Medusa 34% Murphy Mormont 52% Murphy Neidermeyer 75% Murphy Powerball 50% Murphy Samurai 27% Murphy Son of Bluto II 20% Chevron St. Malo 24% W&T Tahoe Gulf of America Exploration Area Offshore Platform FPSO Murphy WI Block Discovery Key Exploration Project Miles 50 0 Kodiak Front Runner Medusa Guilder Silver Dollar West Silver Dollar Liberty Longclaw Powerball Ninja Cascade Chinook Lucius St. Malo Whydah/Leibniz/ Guadalupe Delta House Rushmore King’s Quay Ocotillo #1 Dalmatian S. Zephyrus Banjo #1 Cello #1
25 25 Murphy January 2026 Investor Presentation Goldman Sachs Energy, CleanTech & Utilities Conference 2026 ERIC M. HAMBLY PRESIDENT AND CHIEF EXECUTIVE OFFICER January 7 th , 2026