Note A1, cont’d.
Contract asset is unbilled sales amount relating to performance obligation that has been
satisfied under customer contract but is conditional on terms other than only the passage of time before payment of the consideration is due. Under previous standards these unbilled sales balances have been included within trade receivables.
Contract liability relates to amounts that are paid by or due from customers for which performance obligations are unsatisfied or partially
satisfied. Under previous standards these balances have been disclosed as deferred revenue within other current liabilities, and the Company concluded that the balances meet the definition of contract liability under IFRS 15. Advances from customers
are also included in the contract liability balance.
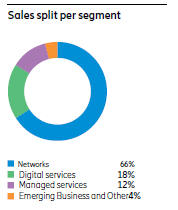
Segment reporting
An operating segment is a component of a company whose operating results are regularly reviewed by the Company’s chief operating decision maker, (CODM),
to make decisions about resources to be allocated to the segment and assess its performance. The President and the Chief Executive Officer is defined as the CODM function in the Company.
The segment presentation, as per each segment, is based on the Company’s accounting policies as disclosed in this note.
The Company’s segment disclosure about geographical areas is based on the country in which transfer of risks and rewards occur.
For further information, see Note B1, “Segment information.”
Inventories
Inventories are measured at the lower of
cost or net realizable value on a first-in, first-out (FIFO) basis.
Risks of obsolescence have been measured by estimating market value based on future customer demand and changes in technology and customer
acceptance of new products.
A significant part of Inventories is Contract work in progress (CWIP). Recognition and derecognition of
CWIP relates to the Company’s revenue recognition principles meaning that costs incurred under a customer contract are initially recognized as CWIP (see Revenue recognition policy). When the related revenue is recognized, CWIP is derecognized
and is instead recognized as Cost of sales.
In Note A2, “Critical accounting estimates and judgments,” further disclosure is
presented in relation to (i) key sources of estimation uncertainty and (ii) the decision made in relation to accounting policies applied.
Trade payables
See accounting policies under the
subheading for Financial instruments and risk management.
Long-term assets
For further disclosure, see the notes under section C
Goodwill
As from the acquisition date, goodwill acquired
in a business combination is allocated to each cash-generating unit (CGU) of the Company expected to benefit from the synergies of the combination.
An annual impairment test for the CGUs to which goodwill has been allocated is performed in the fourth quarter, or when there is an
indication of impairment. An impairment loss is recognized if the carrying amount of an asset or its cash-generating unit exceeds its recoverable amount. The recoverable amount is the higher of the value in use and the fair value less costs of
disposal. In assessing value in use, the estimated future cash flows after tax are discounted to their present value using an after-tax discount rate that reflects current market assessments of the time value
of money and the risks specific to the asset. Application of after tax amounts in calculation, both in relation to cash flows and discount rate is applied due to that available models for calculating discount rate include a tax component. The after-
tax discount rate applied by the Company is not materially different from a discounting based on before-tax future cash flows and before-tax discount rates, as required
by IFRS. An impairment loss in respect of goodwill is not reversed. Write-downs of goodwill are reported under other operating expenses.
Additional disclosure is required in relation to goodwill impairment testing: see Note A2, “Critical accounting estimates and
judgments” below and Note C1, “Intangible assets.”
Intangible assets
Intangible assets other than goodwill
Intangible assets
other than goodwill comprise intangible assets acquired through business combinations, such as patents, customer relations, trademarks and software, as well as capitalized development expenses and separately acquired intangible assets, mainly
consisting of software. At initial recognition, acquired intangible assets related to business combinations are stated at fair value and capitalized development expenses and software are stated at cost. Subsequent to initial recognition, these
intangible assets are stated at initially recognized amounts less accumulated amortization and any impairment. Amortization and any impairment losses are included in Research and development expenses, which mainly consists of capitalized development
expenses and technology; in Selling and administrative expenses, which mainly consists of expenses relating to customer relations and brands; and in Cost of sales.
Costs incurred for development of products to be sold, leased, or otherwise marketed or intended for internal use are capitalized as from
when technological and economic feasibility has been established until the product is available for sale or use. Research and development expenses directly related to orders from customers are accounted for as a part of Cost of sales. Other research
and development expenses are charged to income as incurred. Amortization of acquired intangible assets, such as patents, customer relations, trademarks, and software, is made according to the straight-line method over their estimated useful lives,
not exceeding ten years.
The Company has not recognized any intangible assets with indefinite useful life other than goodwill.
Impairment tests are performed whenever there is an indication of possible impairment. Tests are performed as for goodwill, see above.
However, intangible assets not yet available for use are tested annually.
Corporate assets have been allocated to cash-generating units
in relation to each unit’s proportion of total net sales. The amount related to corporate assets is not significant. Impairment losses recognized in prior periods are assessed at each reporting date for any indications that the loss has
decreased or no longer exists.
In Note A2, “Critical accounting estimates and judgments,” further disclosure is presented in
relation to (i) key sources of estimation uncertainty and (ii) the decision made in relation to accounting policies applied.
Property,
plant, and equipment
Property, plant, and equipment consist of real estate, machinery, servers and other technical assets, other equipment, tools and
installation and construction in process and advance payment. They are stated at cost less accumulated depreciation and any impairment losses.
Depreciation is charged to income, on a straight-line basis, over the estimated useful life of each component of an item of property, plant,
and equipment, including buildings. Estimated useful lives are, in general, 25–50 years for real estate and 3–10 years for machinery and equipment. Depreciation and any impairment charges are included in Cost of sales, Research and
development or Selling and administrative expenses.
The Company recognizes in the carrying amount of an item of property, plant, and
equipment the cost of replacing a component and derecognizes the residual value of the replaced component.
Impairment testing as
well as recognition or reversal of impairment of property, plant and equipment is performed in the same manner as for intangible assets other than goodwill, see description under “Intangible assets other than goodwill” above.
Gains and losses on disposals are determined by comparing the proceeds less cost to sell with the carrying amount and are recognized within
Other operating income and expenses in the income statement.
Leasing
Leasing when the Company is the lessee
Leases on terms in
which the Company assumes substantially all the risks and rewards of ownership are classified as finance leases. Upon initial recognition, the leased asset is measured at an amount equal to the lower of its fair value and the present value of the
minimum lease payments. Subsequent to initial recognition, the asset is accounted for in accordance with the accounting policy applicable to that type of asset, although the depreciation period must not exceed the lease term.
Other leases are operating leases, and the leased assets under such contracts are not recognized on the balance sheet. Costs under operating
leases