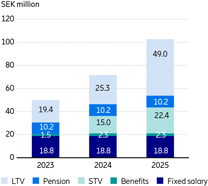
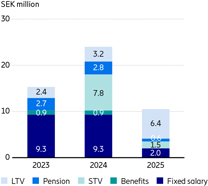
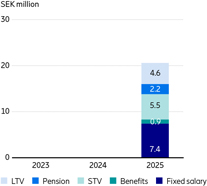
Long-Term Variable Compensation
All long-term variable compensation programs have been designed to form a part of a well-balanced total remuneration package and in general to span over a minimum of three years (service period). As these are variable compensation programs, the outcomes cannot be predicted when the programs are introduced and rewards depend on long-term personal commitment, corporate performance and the share price performance. Details of each respective LTV plan are described in the Remuneration report.
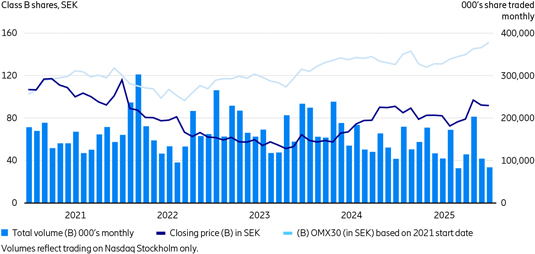
The LTV 2025 for Top Management will grant, vest and be delivered in Ericsson
Class B-shares.
All programs are share-based payment programs as defined by IFRS 2 “Share-based Payment,” either share- or cash-settled. The significant share-based payment programs are described below.
Share-Settled Programs
Long-Term Variable Compensation Program for Top Management
The Long-Term Variable Compensation Program for Top Management as approved by the shareholders, is designed to provide long-term incentives for Top Management, to incentivize the Company’s performance creating long-term value.
Awards under LTV (Performance Share Awards) are granted to the participants, provided that certain performance conditions are met, to receive a number of shares, free of charge, following expiration of a three-year vesting period (vesting period). Allotment of shares pursuant to Performance Share Awards are subject to the achievement of performance criteria which are defined specific to each year’s program when the program is introduced.
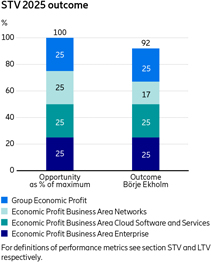
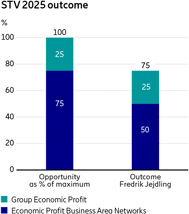
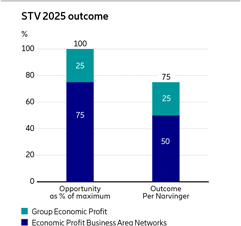
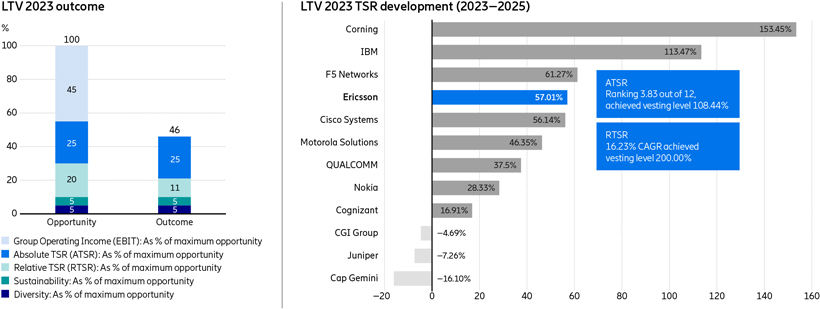
Which portion, if any, of the Performance Share Awards for LTV will vest is determined at the end of the relevant performance period based on the satisfaction of the predetermined performance criteria for that year’s LTV program (performance period). The performance criteria for the currently running LTV and EPP are summarized in the above table along with the satisfaction and achieved vesting levels for the ones where the performance period has lapsed. It is generally required that the participant retains his or her employment over a period of three years from the date of grant of awards to be eligible for receiving the performance awards.
Provided that the performance criteria have been met during the performance period and that the participant has retained his or her employment (unless special circumstances are at hand) during the service period, allotment of vested shares will take place as soon as practicably possible following the expiration of the vesting period.
When determining the final vesting level of Performance Share Awards, the Board of Directors examines whether the vesting level is reasonable considering the Company’s financial results and position, conditions on the stock market and other circumstances, and if not, reserves the right to reduce the vesting level to a lower level deemed appropriate.
In the event delivery of shares to the participants cannot take place under applicable law or at a reasonable cost and employing reasonable administrative measures, the Board of Directors is entitled to decide that participants may, instead, be offered cash settlement.
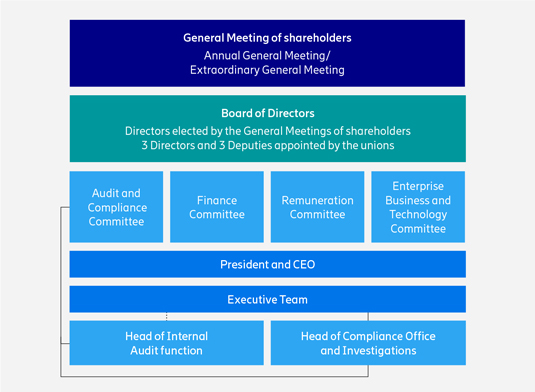
All major decisions relating to outcome of LTV are taken by the Remuneration Committee, with approval by the full Board of Directors as required.
2025 Long-Term Variable Compensation Program for
Top Management (LTV 2025)
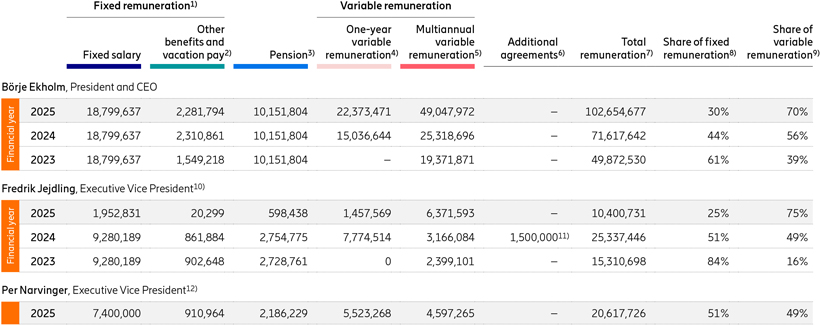
LTV 2025 was approved at the Annual General Meeting (AGM) of shareholders held in 2025 and includes all members of Top Management, a total of 172 members in 2025, including the President and CEO.
The participants were granted Performance Share Awards on May 12, 2025. The share price used to calculate the number of shares to which the Performance Share Awards entitles was calculated as the volume weighted average of the market price of Ericsson B shares on Nasdaq Stockholm during the five trading days immediately following the publication of the Company’s interim report for the fourth quarter of 2024.
The performance criteria for LTV 2025 along with the details on how the performance criteria will be calculated and measured are explained in minutes from the AGM 2025 under Item 16.
The Board of Directors resolved on the achieved vesting level as outlined in the table “LTV and EPP Performance criteria”.