.2
MD&A
Management’s discussion and analysis
In this management’s discussion and analysis (MD&A), we, us, our, BCE
and the company mean, as the context may require, either BCE Inc. or, collectively, BCE Inc., Bell Canada, their subsidiaries, joint arrangements and associates. Bell means, as the context may require, either Bell Canada or,
collectively, Bell Canada, its subsidiaries, joint arrangements and associates.
All amounts in this MD&A are in millions of Canadian dollars,
except where noted. Please refer to section 10.2, Non-GAAP financial measures and key performance indicators (KPIs) on pages 115 to 117 for a list of defined
non-GAAP financial measures and KPIs.
Please refer to BCE’s audited consolidated financial statements
for the year ended December 31, 2020 when reading this MD&A.
In preparing this MD&A, we have taken into account information available to us up to March 4,
2021, the date of this MD&A, unless otherwise stated.
You will find additional information relating to BCE, including BCE’s audited
consolidated financial statements for the year ended December 31, 2020, BCE’s annual information form for the year ended December 31, 2020, dated March 4, 2021 (BCE 2020 AIF) and recent financial reports, on BCE’s
website at BCE.ca, on SEDAR at sedar.com and on EDGAR
at sec.gov.
Documents and other
information contained in BCE’s website or in any other site referred to in BCE’s website or in this MD&A are not part of this MD&A and are not incorporated by reference herein.
This MD&A comments on our business operations, performance, financial position and other matters for the two years ended December 31, 2020
and 2019.
CAUTION REGARDING FORWARD-LOOKING STATEMENTS
BCE’s 2020 annual report, including this MD&A and, in particular, but without limitation,
section 1.3, Key corporate developments, section 1.4, Capital markets strategy, section 2, Strategic imperatives, section 3.1, Business outlook and assumptions, section 5, Business segment
analysis and section 6.7, Liquidity of this MD&A, contains forward-looking statements. These forward-looking statements include, without limitation, statements relating to our projected financial performance for 2021, BCE’s
dividend growth objective and 2021 annualized common share dividend, BCE’s anticipated capital expenditures and the benefits expected to result therefrom, including its two-year increased capital
investment program to accelerate fibre, Wireless Home Internet and Fifth Generation (5G) network expansion, BCE’s financial policy targets, the sources of liquidity we expect to use to meet our anticipated 2021 cash requirements, our
expected post-employment benefit plans funding, BCE’s business outlook, objectives, plans and strategic priorities, and other statements that do not refer to historical facts. A statement we make is forward-looking when it uses what we know and
expect today to make a statement about the future. Forward-looking statements are typically identified by the words assumption, goal, guidance, objective, outlook, project, strategy, target and
other similar expressions or future or conditional verbs such as aim, anticipate, believe, could, expect, intend, may, plan, seek, should, strive and will. All such
forward-looking statements are made pursuant to the safe harbour provisions of applicable Canadian securities laws and of the United States (U.S.) Private Securities Litigation Reform Act of 1995.
Unless otherwise indicated by us, forward-looking statements in BCE’s 2020 annual report, including in this MD&A, describe our expectations
as at March 4, 2021 and, accordingly, are subject to change after that date. Except as may be required by applicable securities laws, we do not undertake any obligation to update or revise any forward-looking statements, whether as a
result of new information, future events or otherwise.
Forward-looking statements, by their very nature, are subject to inherent risks and
uncertainties and are based on several assumptions, both general and specific, which give rise to the possibility that actual results or events could differ materially from our expectations expressed in, or implied by, such forward-looking
statements and that our business outlook, objectives, plans and strategic priorities may not be achieved. These statements are not guarantees of future performance or events,
and we caution you against relying on any of these forward-looking statements. Forward-looking statements
are presented in BCE’s 2020 annual report, including in this MD&A, for the purpose of assisting investors and others in understanding our objectives, strategic priorities and business outlook as well as our anticipated operating
environment. Readers are cautioned, however, that such information may not be appropriate for other purposes.
We have made certain economic, market
and operational assumptions in preparing the forward-looking statements contained in BCE’s 2020 annual report, including this MD&A, and, in particular, but without limitation, the forward-looking statements contained in the previously
mentioned sections of this MD&A. These assumptions include, without limitation, the assumptions described in the various sections of this MD&A entitled Business outlook and assumptions, which sections are incorporated by reference in
this cautionary statement. Subject to various factors including, without limitation, the future impacts of the COVID-19 pandemic, which are difficult to predict, we believe that our assumptions were reasonable
at March 4, 2021. If our assumptions turn out to be inaccurate, our actual results could be materially different from what we expect.
Important
risk factors that could cause actual results or events to differ materially from those expressed in, or implied by, the previously-mentioned forward-looking statements and other forward-looking statements contained in BCE’s 2020 annual
report, and in particular in this MD&A, include, but are not limited to: the COVID-19 pandemic and the adverse effects from the emergency measures implemented or to be implemented as a result thereof,
as well as other pandemics, epidemics and other health risks; adverse economic and financial market conditions, a declining level of retail and commercial activity, and the resulting negative impact on the demand for, and prices of, our products and
services; the intensity of competitive activity including from new and emerging competitors; the level of technological substitution and the presence of alternative service providers contributing to the acceleration of disruptions and
disintermediation in each of our business segments; changing viewer habits and the expansion of over-the-top (OTT) television (TV) and other alternative service
providers, as well as the fragmentation of, and changes in, the advertising market; rising content costs and challenges in our ability to acquire or develop key content; the proliferation of content piracy; higher Canadian smartphone
30 | BCE INC. 2020 ANNUAL REPORT


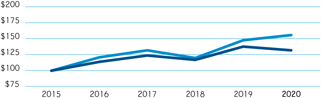
 BCE common shares
 S&P/TSX Composite Index