.2
MD&A
Management’s discussion
and analysis
Table of contents
| 5 |
Business segment analysis | 49 | ||||||
| 5.1 | Bell CTS | 49 | ||||||
| 5.2 | Bell Media | 62 | ||||||
| 6 |
Financial and capital management | 67 | ||||||
| 6.1 | Net debt | 67 | ||||||
| 6.2 | Outstanding share data | 68 | ||||||
| 6.3 | Cash flows | 69 | ||||||
| 6.4 | Post-employment benefit plans | 71 | ||||||
| 6.5 | Financial risk management | 72 | ||||||
| 6.6 | Credit ratings | 75 | ||||||
| 6.7 | Liquidity | 76 | ||||||
| 6.8 | Litigation | 78 | ||||||
| 7 |
Selected annual and quarterly information | 79 | ||||||
| 7.1 | Annual financial information | 79 | ||||||
| 7.2 | Quarterly financial information | 81 | ||||||
| 8 |
Regulatory environment | 84 | ||||||
| 8.1 | Canadian regulatory environment | 84 | ||||||
| 8.2 | U.S. regulatory environment | 89 | ||||||
| 9 |
Business risks | 91 | ||||||
| 10 |
Accounting policies | 104 | ||||||
| 11 |
Non-GAAP financial measures, other financial measures and key performance indicators (KPIs) | 108 | ||||||
| 11.1 | Non-GAAP financial measures | 108 | ||||||
| 11.2 | Non-GAAP ratios | 111 | ||||||
| 11.3 | Total of segments measures | 112 | ||||||
| 11.4 | Capital management measures | 113 | ||||||
| 11.5 | Supplementary financial measures | 113 | ||||||
| 11.6 | KPIs | 113 | ||||||
| 12 |
Effectiveness of internal controls | 114 | ||||||
| BCE INC. 2025 ANNUAL FINANCIAL REPORT | 5 |
MD&A
In this management’s discussion and analysis (MD&A), we, us, our, BCE and the company mean, as the context may require, either BCE Inc. or, collectively, BCE Inc., Bell Canada, their subsidiaries, joint arrangements and associates. Bell means, as the context may require, either Bell Canada or, collectively, Bell Canada, its subsidiaries, joint arrangements and associates.
All amounts in this MD&A are in millions of Canadian dollars, except where noted. Please refer to section 11, Non-GAAP financial measures, other financial measures and key performance indicators (KPIs) for a list of defined non-GAAP financial measures, other financial measures and KPIs.
Please refer to BCE’s audited consolidated financial statements for the year ended December 31, 2025 when reading this MD&A.
In preparing this MD&A, we have taken into account information available to us up to March 5, 2026, the date of this MD&A, unless otherwise stated.
You will find additional information relating to BCE, including BCE’s audited consolidated financial statements for the year ended December 31, 2025, BCE’s annual information form for the year ended December 31, 2025, dated March 5, 2026 (BCE 2025 AIF) and recent financial reports, on BCE’s website at BCE.ca, on SEDAR+ at sedarplus.ca and on EDGAR at sec.gov.
Documents and other information contained in BCE’s website or in any other site referred to in BCE’s website or in this MD&A are not part of this MD&A and are not incorporated by reference herein.
This MD&A comments on our business operations, performance, financial position and other matters for the two years ended December 31, 2025 and 2024.
| 6 | BCE INC. 2025 ANNUAL FINANCIAL REPORT |
MD&A
Caution regarding forward-looking statements
This MD&A and, in particular, but without limitation, section 1.3, Key corporate developments, section 1.4, Capital allocation strategy, section 1.6, Capitals and our corporate responsibility, section 2, Strategic priorities, section 3.2, Business outlook and assumptions, section 5, Business segment analysis, and section 6.7, Liquidity, contain forward-looking statements. These forward-looking statements include, without limitation, statements relating to: the proposed disposition of Northwestel Inc. (Northwestel) and the expected timing and completion thereof; the potential total number of combined Ziply Fiber-Network FiberCo fibre locations to be reached over the long term; BCE’s capital allocation priorities; our objective to create long-term value for our shareholders with strong free cash flow generation and a sustainable dividend; BCE’s common share dividend and dividend payout policy target; BCE’s expected dividend payout ratio level in the medium term; our objective to maintain investment-grade credit ratings for Bell Canada’s senior debt; BCE’s net debt leverage ratio expected by the end of 2027 and net debt leverage policy target expected by 2030; the intended use of the net proceeds of Bell Canada’s February 12, 2026 offering of junior subordinated debt securities; BCE’s network deployment plans in Canada and the United States (U.S.) and the benefits expected to result therefrom; BCE’s network reliability target; the launch of Unbreakable Internet in 2026; the successful development and implementation of artificial intelligence (AI) solutions, either by us or pursuant to certain partnerships entered into by BCE, as well as the responsible development and use of AI; our goal of $1.5 billion in cost savings by 2028 and the benefits expected to result therefrom; our projected financial performance; BCE’s planned capital expenditures; BCE’s expected post-employment benefit plans funding and the sources of liquidity we expect to use to meet our 2026 cash requirements; our sustainability objectives and the benefits expected to result therefrom, which include, without limitation, our objectives concerning customer satisfaction and service quality, privacy, information security vigilance, network reliability and energy intensity, our targeted reductions in the level of our greenhouse gas (GHG) emissions including, without limitation, our science-based targets and carbon abatement objectives, our objectives concerning reductions in waste to landfill, team member well-being and engagement, corporate governance and ethical business conduct leadership; BCE’s business outlook, objectives, plans and strategic priorities, and other statements that do not refer to historical facts. A statement we make is forward-looking when it uses what we know and expect today to make a statement about the future. Forward-looking statements are typically identified by the words assumption, goal, guidance, objective, outlook, project, strategy, target, commitment and other similar expressions or future or conditional verbs such as aim, anticipate, believe, could, expect, intend, may, plan, seek, should, strive and will. All such forward-looking statements are made pursuant to the safe harbour provisions of applicable Canadian securities laws and of the U.S. Private Securities Litigation Reform Act of 1995.
Unless otherwise indicated by us, forward-looking statements in this MD&A describe our expectations as at March 5, 2026 and, accordingly, are subject to change after that date. Except as may be required by applicable securities laws, we do not undertake any obligation to update or revise any forward-looking statements, whether as a result of new information, future events or otherwise.
Forward-looking statements, by their very nature, are subject to inherent risks and uncertainties and are based on several assumptions, both general and specific, which give rise to the possibility that actual results or events could differ materially from our expectations expressed in, or implied by, such forward-looking statements and that our business
outlook, objectives, plans and strategic priorities may not be achieved. These statements are not guarantees of future performance or events, and we caution you against relying on any of these forward-looking statements. Forward-looking statements are presented in this MD&A for the purpose of assisting investors and others in understanding our objectives, strategic priorities and business outlook as well as our anticipated operating environment. Readers are cautioned, however, that such information may not be appropriate for other purposes.
We have made certain economic, market, operational and other assumptions in preparing the forward-looking statements contained in this MD&A, and, in particular, but without limitation, the forward-looking statements contained in the previously mentioned sections of this MD&A. These assumptions include, without limitation, the assumptions described in the various sub-sections of this MD&A entitled Assumptions, which sub-sections are incorporated by reference in this cautionary statement. Subject to various factors, we believe that our assumptions were reasonable as at March 5, 2026. If our assumptions turn out to be inaccurate, actual results or events could be materially different from what we expect.
Important risk factors that could cause actual results or events to differ materially from those expressed in, or implied by, the previously mentioned forward-looking statements and other forward-looking statements contained in this MD&A, include, but are not limited to: the negative effect of adverse economic conditions, including the continuation or escalation of trade wars, recessions, U.S. tariffs and the unpredictability of future trade arrangements, inflation, the value of the Canadian dollar, reductions in immigration levels, high housing support costs relative to income, and financial and capital market volatility, and the resulting negative impact on customer spending, the resulting demand for our products and services, our customers’ financial condition, and the cost and amount of funding available in the capital markets; the negative effect of adverse conditions associated with geopolitical events, including financial and capital market volatility, broader geopolitical instability and armed conflicts, higher energy prices, inflationary pressures limiting consumer and business spending and increasing our operating costs, disruptions in our supply chains, and increased information security threats; the intensity of competitive activity in Canada and the U.S. and the failure to effectively respond to evolving competitive dynamics; the level of technological advancements and the presence of alternative service providers contributing to disruptions and disintermediation in each of our business segments; changing customer behaviour and the expansion of cloud-based, over-the-top (OTT) and other alternative solutions; advertising market pressures from economic conditions, fragmentation and non-traditional/global digital services; rising content costs and challenges in our ability to acquire or develop key content; high Canadian Internet and smartphone penetration; regulatory initiatives, proceedings and decisions, government consultations and government positions that negatively affect us and influence our business in Canada including, without limitation, concerning mandatory access to networks, spectrum auctions, the imposition of consumer-related codes of conduct, approval of acquisitions, broadcast and spectrum licensing, foreign ownership requirements, privacy and cybersecurity obligations, online streaming and digital services regulations, control of copyright piracy, and regulatory frameworks governing AI; the inability to implement enhanced compliance frameworks and to comply with legal and regulatory obligations, including the failure to monitor and comply with the U.S. legal and regulatory requirements to which Ziply Fiber is subject, which may reduce the amount of subsidies or revenues it receives,
| BCE INC. 2025 ANNUAL FINANCIAL REPORT | 7 |
MD&A
increase its compliance burdens or constrain its ability to compete; unfavourable resolution of legal proceedings; the inability to protect our assets and data from events such as information security attacks, unauthorized access or entry, fire, natural disasters, extreme weather events linked to climate change, power loss, building cooling loss, acts of war or terrorism, geopolitical conflict, sabotage, vandalism, actions of neighbours and other events; the failure to implement effective security, data and responsible AI governance frameworks; the inability to drive a positive customer experience; the failure to evolve and transform our networks, systems and operations using next-generation technologies while lowering our cost structure, including the failure to meet customer expectations of product and service experience; the use of AI technologies in our business solutions and operations, and by our customers, business partners and third-party vendors; the risk that we may need to incur significant capital expenditures to provide additional capacity and reduce network congestion; service interruptions or outages due to network failures or slowdowns; the complexity of our operations and information technology (IT) systems and the failure to implement, maintain or manage highly effective processes and IT systems; events affecting the functionality of and our ability to protect, test, maintain, replace and upgrade our networks, IT systems, equipment and other facilities; the failure by other telecommunications carriers on which we rely to provide services, to complete planned and sufficient testing, maintenance, replacement or upgrade of their networks, equipment and other facilities, which could disrupt our operations including through network or other infrastructure failures; in-orbit and other operational risks to which the satellites used to provide our satellite television (TV) services are subject; the failure to successfully expand Ziply Fiber’s fibre network; the inability of Ziply Fiber’s current and future initiatives or programs to generate the level of returns, or to occur on the timeline, we anticipate; there can be no assurance that the potential benefits expected to result from the formation of Network FiberCo will be realized; the failure to successfully integrate Ziply Fiber as a subsidiary of BCE, and to generate the anticipated benefits from the acquisition of Ziply Fiber; the inability to access adequate sources of capital and generate sufficient cash flows from operating activities to meet our cash requirements, fund capital expenditures and provide for planned growth; uncertainty as to whether our dividend payout policy will be maintained or achieved, or that the dividend on common shares will be maintained or dividends on any of BCE’s outstanding shares will be declared by BCE’s board of directors (BCE Board); the failure to reduce costs and adequately assess investment priorities, as well as unexpected increases in costs; the inability to manage various credit, liquidity and market risks; the failure to accurately anticipate fluctuations in the exchange rate between the Canadian dollar and U.S. dollar and our inability to successfully implement currency hedging strategies; the failure to evolve practices to effectively monitor and control fraudulent activities; new or higher taxes due to new tax laws, treaties, regulations or rules thereunder in Canada, the U.S. or other relevant jurisdictions, or changes thereto, or changes in their interpretation or enforcement by tax authorities, and the inability to predict the outcome of government audits; the impact on our financial statements and estimates from a number of factors; pension obligation volatility and increased contributions to post-employment benefit plans; the expected timing and completion of the proposed disposition of Northwestel are subject to closing conditions, termination rights and other risks and uncertainties, including, without limitation, the purchaser securing financing, which may affect its completion, terms or timing and, as such, there can be no assurance
that the proposed disposition will occur, or that it will occur on the terms and conditions, or at the time, currently contemplated, or that the potential benefits expected to result from the proposed disposition will be realized; the failure to attract, develop and retain a talented team capable of furthering our business strategy and operational transformation; the potential deterioration in employee morale and engagement resulting from staff reductions, cost reductions or reorganizations, and the de-prioritization of transformation initiatives due to staff reductions, cost reductions or reorganizations; the failure to adequately manage health and safety concerns; labour disruptions and shortages; reputational risks and the inability to meaningfully integrate sustainability considerations into our business strategy, operations and governance; the adverse impact of various internal and external factors on our ability to achieve our sustainability targets including, without limitation, those related to GHG reduction and supplier engagement; the failure to take appropriate actions to adapt to current and emerging environmental impacts, including climate change; the failure to develop and implement sufficient corporate governance practices; the inability to adequately manage social issues; health risks, including pandemics, epidemics and other health concerns, such as radio frequency emissions from wireless communications devices and equipment; our dependence on third-party suppliers, outsourcers and consultants to provide an uninterrupted supply of the products and services we need and comply with various obligations; the failure of our vendor selection, governance and oversight processes, including our management of supplier risk in the areas of security, data and AI governance, privacy and responsible procurement; the quality of our products and services and the extent to which they may be subject to defects or fail to comply with applicable government regulations and standards.
These and other risk factors that could cause actual results or events to differ materially from our expectations expressed in, or implied by, our forward-looking statements are discussed in this MD&A and, in particular, in section 9, Business risks, of this MD&A.
Forward-looking statements contained in this MD&A for periods beyond 2026 involve longer-term assumptions and estimates than forward-looking statements for 2026 and are consequently subject to greater uncertainty. Forward-looking statements for periods beyond 2026 further assume, unless otherwise indicated, that the risks described above and in section 9, Business risks, of this MD&A will remain substantially unchanged during such periods.
We caution readers that the risk factors described above and in the previously mentioned section and in other sections of this MD&A are not the only ones that could affect us. Additional risks and uncertainties not currently known to us or that we currently deem to be immaterial may also have a material adverse effect on our business, financial condition, liquidity, financial results or reputation. We regularly consider potential acquisitions, dispositions, mergers, business combinations, investments, monetizations, joint arrangements and other transactions, some of which may be significant. Except as otherwise indicated by us, forward-looking statements do not reflect the potential impact of any such transactions or of special items that may be announced or that may occur after March 5, 2026. The financial impact of these transactions and special items can be complex and depends on facts particular to each of them. We therefore cannot describe the expected impact in a meaningful way, or in the same way we present known risks affecting our business.
| 8 | BCE INC. 2025 ANNUAL FINANCIAL REPORT |
1 MD&A Overview
| 1 | Overview |
| 1.1 | Introduction |
At a glance
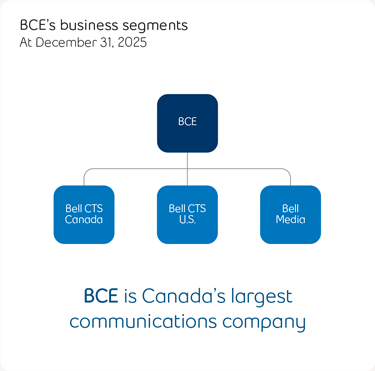
BCE is Canada’s largest communications company,(1) leading the way in advanced fibre and wireless networks, enterprise services and digital media. BCE delivers next-generation technology that leverages cloud-based and AI-driven solutions. BCE provides residential, business and wholesale customers with a wide range of solutions for all their communications needs. BCE’s shares are publicly traded on the Toronto Stock Exchange and on the New York Stock Exchange (TSX, NYSE: BCE).
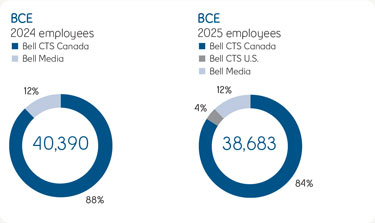
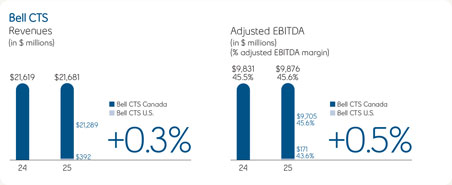
On August 1, 2025, BCE acquired Ziply Fiber, the leading fibre Internet provider in the Pacific Northwest of the U.S. providing wireline, Internet and TV services to residential, business and wholesale customers in this region. The results from the acquired Ziply Fiber operations are included in a new segment, Bell Communication and Technology Services (Bell CTS) U.S., from the date of acquisition.
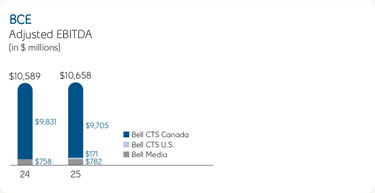
Our results are subsequently reported in three segments: Bell CTS Canada, Bell CTS U.S. and Bell Media. Our segments reflect how we manage our business and how we classify our operations for planning and measuring performance.
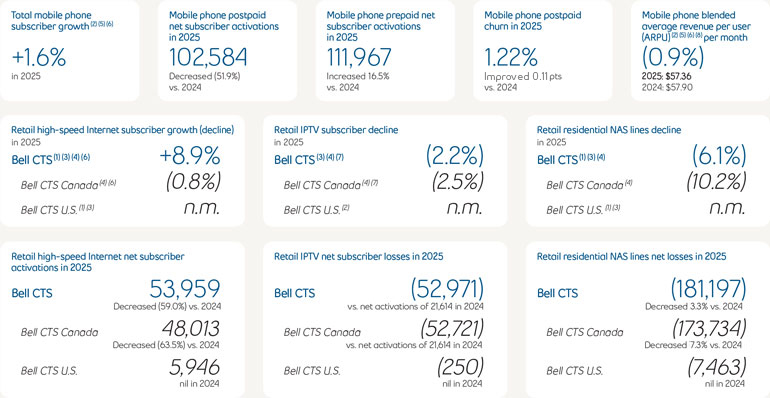
Bell CTS Canada provides a wide range of communication products and services to consumer, business and government customers across Canada. Wireless products and services include mobile data and voice plans, streaming services, and devices and are available nationally. Wireline products and services comprise data (including Internet access, Internet protocol television (IPTV), cloud-based services, AI-driven solutions and business solutions), voice, streaming services, and other communication services and products, which are available to our residential, small and medium-sized business and large enterprise customers primarily in Ontario, Québec, the Atlantic provinces and Manitoba, while satellite TV service and connectivity to business customers are available nationally across Canada. In addition, this segment includes our wholesale business, which buys and sells local telephone, long distance, data and other services from or to resellers and other carriers, as well as, in 2024, the results of operations of our national consumer electronics retailer, The Source (Bell) Electronics Inc. (The Source). In 2024, Bell wound down The Source head office and back office operations, as well as closed 107 The Source stores.
Bell CTS U.S., comprised of Ziply Fiber, provides wireline communication products and services over a combined fibre-based and copper-based network, to residential, business and wholesale customers in the Pacific Northwest of the U.S. Wireline products and services consist of data (including broadband Internet with varying speeds and value-added features, commercial ethernet, dedicated Internet-non-switched access and other data transport networking options) and voice (traditional and voice over Internet protocol (VoIP) voice services, including local, long distance, and unified communications as a service (UCaaS) and Video (IPTV)).
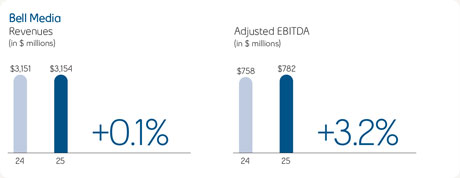
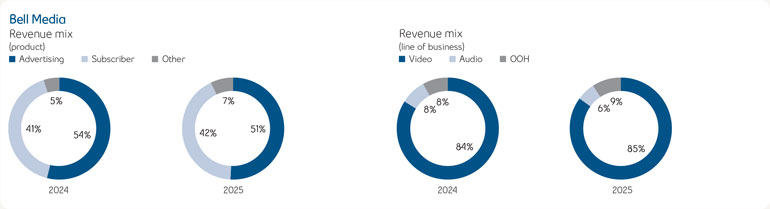
Bell Media holds a portfolio of assets providing premium video, audio, out-of-home (OOH) advertising, and digital media services to customers nationally across Canada.
We also hold investments in a number of other assets, including:
| • | a 50% indirect equity interest in Glentel Inc. (Glentel) |
| • | a 20.2% indirect equity interest in entities that operate the Montréal Canadiens Hockey Club, evenko and the Bell Centre in Montréal, Québec, as well as Place Bell in Laval, Québec |
| (1) | Based on total revenue and total combined customer connections. |
| BCE INC. 2025 ANNUAL FINANCIAL REPORT | 9 |
1 MD&A Overview
Our purpose
BCE’s purpose is to advance how people connect with each other and the world. Our brand platform, Connection is everything, underscores our fundamental role in facilitating connections – enabling individuals and businesses to forge meaningful relationships, opportunities and experiences with each other, their communities and the wider world.
As Canada’s largest communications company, we strive to create exceptional experiences and positive, lasting impacts for the customers, businesses and communities we serve. Reliable, high-performance connectivity and digital solutions are foundational to modern life, supporting economic growth, social inclusion and innovation across the country. By continuing to invest in world-class fibre and wireless networks and by deploying cloud-based, AI-enabled technologies, we aim to help individuals, businesses and public institutions thrive in an increasingly digital and data-driven world.
Our primary business objectives are to grow our subscriber base profitably and to maximize revenues, operating profit, free cash flow and return on invested capital. We pursue these objectives by
strengthening our position as the leading provider in Canada of comprehensive communications services to residential, business and wholesale customers; as a leading fibre Internet provider in the Pacific Northwest of the U.S. through Ziply Fiber; and as Canada’s leading media and entertainment company. Across our operations, we seek to leverage our scale, networks, infrastructure, distribution channels, brand and marketing capabilities to create value for customers, shareholders and other stakeholders.
Our strategy is guided by four interconnected priorities that bring our purpose to life while strengthening customer experience, improving operational efficiency and supporting long-term value creation. These priorities are underpinned by our unique and differentiated assets across fibre, wireless, enterprise and media, and are focused on driving sustainable growth through network leadership, digital transformation and customer-focused innovation. Execution of our strategy is supported by a disciplined capital allocation approach tailored to a reshaped operating environment, reinforcing our objective to driving total shareholder return.
Our alignment to the International Integrated Reporting Framework
Following the principles of the International Integrated Reporting Framework (<IR> Framework), now part of the IFRS® Foundation, Bell released, concurrently with this MD&A, an Integrated Annual Report which contains a strategic overview outlining our sustainable value creation process. This strategic overview discloses how we seek to generate sustainable value for our stakeholders as the result of our
business operations, guided by our strategic priorities and use of capitals. Our capitals are outlined below and serve as inputs that are transformed through our business strategy and strategic priorities resulting in outcomes that seek to create value for our stakeholders over time.
To increase the connectivity of information, we have incorporated the icons representing our six capitals described above throughout this MD&A to highlight the respective linkage between our capitals and the topics discussed.
| 10 | BCE INC. 2025 ANNUAL FINANCIAL REPORT |
1 MD&A Overview
BCE 2025 consolidated results
BCE customer connections
| (1) | Adjusted EBITDA is a total of segments measure, and adjusted net earnings and free cash flow are non-GAAP financial measures. See section 11.3, Total of segments measures and section 11.1, Non-GAAP financial measures in this MD&A for more information on these measures. |
| (2) | In Q4 2025, after a comprehensive review of Ziply Fiber subscriber accounts following our acquisition on August 1, 2025, we reduced our retail high-speed Internet and retail residential NAS subscriber bases, by 13,029 and 1,106 customers, respectively, to align with Bell methodology for customer deactivations. |
| (3) | In Q3 2025, Bell CTS Canada reduced its postpaid mobile phone and connected device subscriber bases by 51,541 and 7,867, respectively, following a review of a public sector customer account to eliminate subscribers with no usage. |
| (4) | In Q3 2025, as a result of the acquisition of Ziply Fiber on August 1, 2025, Bell CTS U.S. retail high-speed Internet, retail IPTV and retail residential NAS lines subscriber bases increased by 442,225, 6,089 and 84,440 subscribers, respectively. |
| (5) | In Q1 2025, we reduced our retail high-speed Internet, retail IPTV and retail residential NAS lines subscriber bases by 80,666, 441 and 14,150 subscribers, respectively, in Bell CTS Canada, as at March 31, 2025, as we stopped selling new plans for these services under the Distributel, Acanac, Oricom and B2B2C brands. Additionally, at the beginning of Q1 2025, we reduced our retail high-speed Internet subscriber base by 2,783 subscribers in Bell CTS Canada to adjust for prior year customer deactivations following a review of customer accounts. |
| (6) | In Q4 2024, we removed 124,216 Bell prepaid mobile phone subscribers from our prepaid mobile phone subscriber base in Bell CTS Canada as at December 31, 2024, as we stopped selling new plans for this service as of that date. |
| (7) | In Q3 2024, we removed 77,971 Virgin Plus prepaid mobile phone subscribers from our prepaid mobile phone subscriber base in Bell CTS Canada as at September 30, 2024, as we stopped selling new plans for this service as of that date. Additionally, as a result of a recent Canadian Radio-television and Telecommunications Commission (CRTC) decision on wholesale high-speed Internet access services, we are no longer able to resell cable Internet services to new customers in our wireline footprint as of September 12, 2024, and consequently, in Bell CTS Canada, we removed all of the existing 106,259 cable subscribers in our wireline footprint from our retail high-speed Internet subscriber base as of that date. |
| (8) | In Q2 2024, we increased our retail IPTV subscriber base by 40,997 in Bell CTS Canada to align the deactivation policy for our Fibe TV streaming services to our traditional Fibe TV service. |
| BCE INC. 2025 ANNUAL FINANCIAL REPORT | 11 |
1 MD&A Overview
| 1.2 | About BCE |
On August 1, 2025, BCE completed its acquisition of Ziply Fiber, the leading fibre Internet provider in the Pacific Northwest of the U.S. The results of the acquired Ziply Fiber operations are included, from the date of acquisition, in a new operating segment, Bell CTS U.S. The results of BCE’s Canadian wireless and wireline operations are reported under Bell CTS Canada.
BCE reports its 2025 results in three operating segments: Bell CTS Canada, Bell CTS U.S. and Bell Media. In this section, we describe the principal products and services offered by each segment to provide additional insight into our business and operations.
Our products and services
Bell CTS Canada
Segment description
| • | Provides a wide range of communication products and services to consumer, business and government customers across Canada |
| • | Wireless products and services include mobile data and voice plans, streaming services, and devices and are available nationally |
| • | Wireline products and services comprise data (including Internet access, IPTV, cloud-based services, AI-powered solutions and business solutions), streaming services, voice, and other communication services and products, which are available to our residential, small and medium-sized business and large enterprise customers primarily in Ontario, Québec, the Atlantic provinces and Manitoba, while satellite TV service and connectivity to business customers are available nationally across Canada |
| • | Enterprise solutions are delivered across four pillars: core communications services; AI automation, managed service and service integration through Ateko; cybersecurity through Bell Cyber; and full-stack AI solutions through Bell AI Fabric |
| • | Includes our wholesale business, which buys and sells local telephone, long distance, data and other services from or to resellers and other carriers, and the wireline operations of Northwestel, which provides telecommunications services in Canada’s Northern Territories (1) |
Our brands include
Our networks and reach
We hold wireless spectrum licences across multiple spectrum bands and regions throughout Canada, totalling more than 8.6 billion megahertz per population (MHz-Pop), corresponding to an average of approximately 234 megahertz (MHz) of spectrum per Canadian.
The vast majority of our wireless cell sites are connected by fibre-based backhaul, supporting higher capacity, faster speeds and improved network reliability. In addition, we continue to enhance in-building wireless coverage to strengthen LTE and Fifth Generation (5G) service performance.
We operate a nationwide Fourth Generation (4G) Long-Term Evolution (LTE) wireless broadband network compatible with global standards, delivering high-quality and reliable voice and high-speed data services to virtually all Canadians. We also operate 5G and 5G+ wireless networks, which offer faster speeds and lower latency, and continue to expand their coverage across Canada.
| • | Overall LTE coverage of more than 99% of Canada’s population, with LTE Advanced (LTE-A) covering 96% of the population, 5G covering 89% of the population and 5G+ covering 65% of the population at December 31, 2025 |
| • | Peak theoretical mobile data access download speeds: 5G+, up to 3.64 gigabit(s) per second (Gbps) in select markets; 5G, up to 1.7 Gbps (average expected speeds of 89 to 705 megabits per second (Mbps)) in markets across Canada; LTE-A, up to 1.5 Gbps (average expected speeds of 25 to 325 Mbps) in markets across Canada; LTE, up to 150 Mbps (expected average speeds of 18 to 40 Mbps); high-speed packet access plus (HSPA+), up to 42 Mbps (expected average speeds of 7 to 14 Mbps) (2) |
| • | Reverts to LTE/LTE-A technology and speeds when customers are outside 5G and 5G+ coverage areas |
| • | Bell also operates a LTE-category M1 (LTE-M) network, which is a subset of our LTE network, supporting low-power Internet of Things (IoT) applications with enhanced coverage, longer device battery life and enabling lower costs for IoT devices connecting to Bell’s national network. Our LTE-M network is available in most Canadian provinces. |
| • | Extensive local access network in Ontario, Québec, the Atlantic provinces and Manitoba, as well as in Canada’s Northern Territories |
| (1) | In June 2024, Bell Canada entered into an agreement for the disposition of Northwestel to Sixty North Unity, a consortium of Indigenous communities from the Yukon, the Northwest Territories and Nunavut, for up to $1 billion, subject to adjustments. We previously expected this transaction to close in 2025 and we continue to work with Sixty North Unity to close the transaction in 2026. The transaction remains subject to certain closing conditions, including securing financing by Sixty North Unity and, as such, there can be no assurance that the transaction will ultimately be consummated. The results of Northwestel are included in our Bell CTS Canada segment. |
| (2) | Network speeds vary with location, signal and customer device. Compatible device required. |
| 12 | BCE INC. 2025 ANNUAL FINANCIAL REPORT |
1 MD&A Overview
| • |
Fibre-to-the-premise (FTTP) footprint covering approximately 8 million homes and businesses in Ontario, Québec, the Atlantic provinces and Manitoba |
| • |
Wireless-to-the-premise (WTTP) footprint covering approximately 1 million locations primarily in rural areas. WTTP is 5G-capable fixed wireless technology delivered over Bell’s LTE wireless network that provides broadband residential Internet access to smaller and underserved communities. |
| • | Largest Internet protocol (IP) multi-protocol label switching footprint of any Canadian provider, enabling us to offer business customers a virtual private network (VPN) service for IP traffic and to optimize bandwidth for real-time voice and TV |
We have more than 7,000 retail points of distribution across Canada, including over 1,000 Bell, Virgin Plus, Lucky Mobile, Best Buy Express and Staples locations, as well as Glentel-operated locations (WIRELESSWAVE, Tbooth wireless and The Mobile Shop) and other third-party dealer and retail locations.
Our wireless products and services
| • | Data and voice plans: From plans focused on affordability to premium services, we have plans that cater to all customer segments, available on either postpaid or prepaid options, including unlimited data, shareable, device financing plans and Connect Everything plans. Our services provide fast Internet access for video, social networking, messaging and mobile applications, as well as a host of call features. |
| • | Specialized plans: for tablets, smartwatches, Connected Car, mobile Internet, trackers, laptops and security cameras |
| • | Extensive selection of devices: the latest 5G and 5G+ smartphones, tablets, smartwatches, mobile Internet devices and connected things (Bell Connected Car, trackers, connected home and lifestyle) |
| • | Travel: international roaming in over 230 destinations, with LTE roaming in 216 destinations and 5G roaming in 135 destinations |
| • | Mobile business solutions: push-to-talk, field service management, worker safety and mobility management |
| • | IoT solutions: fleet management, asset management, building and site management, municipal operations, integrated smart city ecosystem with Esri |
| • | Bundles: multi-product bundles of Internet, TV, streaming, home phone and mobility with monthly discounts |
Our wireline products and services
Residential
| • | Internet: High-speed Internet access delivered through fibre-optic broadband technology, 5G-capable WTTP technology or digital subscriber line (DSL), with a range of service options including Wi-Fi, unlimited usage and security features. Bell’s Internet service, marketed as Fibe Internet, offers symmetrical download and upload speeds of up to 8 Gbps using FTTP technology, and download speeds of up to 100 Mbps using fibre-to-the-node (FTTN). Bell also offers Wireless Home Internet (WHI), a fixed wireless service that delivers broadband download speeds of up to 50 Mbps in areas where fibre-based services are not available. |
| • | TV: IPTV service marketed as Fibe TV, as well as nationwide satellite TV service. Bell’s hardware-free, app-based Fibe TV service provides access to a broad selection of live and on-demand content, including content available in 4K resolution ultra-high-definition on compatible devices, without the need for traditional set-top boxes (STBs). Key features include cloud personal video recorder (PVR), restart and transactional video-on-demand (TVOD) functionality. The Fibe TV app is available on compatible Smart TVs and streaming devices, including Samsung, LG and Roku Smart TVs, as well as Amazon Fire TV, Google Chromecast, Roku Streaming Stick and Apple TV. |
| • | Streaming: Bell Streaming bundles access to premium streaming services, including Crave, Netflix and Disney+, and provides customers with monthly bundle discounts, simplified billing and the flexibility to manage and modify streaming subscriptions through Bell |
| • | Home Phone: local telephone service, long distance and a range of advanced calling features |
Business
| • | Internet and network solutions: Business Internet and advanced network solutions delivered through Bell’s end-to-end network, cloud and security capabilities. Offerings include business Internet access, Bell Managed Satellite Connect, Bell Managed SD-WAN, private networks, global network connectivity, managed services and professional services. |
| • | Voice and Collaboration: A range of voice and collaboration solutions, including UCaaS, traditional local and long distance voice services, cloud-based voice over VoIP services, and advanced calling solutions with customizable features |
| • | Cloud: Cloud and workflow solutions delivered through Ateko, Bell’s technology services brand, which operates as both a systems integrator and managed services provider. Cloud offerings also include public multi-access edge computing (MEC) services with Amazon Web Services (AWS) Wavelength, cloud connectivity solutions, and backup and disaster recovery services. |
| • | Cybersecurity: End-to-end cybersecurity solutions delivered through Bell Cyber, including Security-as-a-Service (SECaaS), real-time threat detection, and advanced Security Operations Centre (SOC) capabilities |
| • | Contact centre: Cloud-based contact centre solutions incorporating AI-powered features and advanced analytics to support customer engagement and operational efficiency |
| • | AI Fabric: Full-stack sovereign AI solutions, including purpose-built data centre infrastructure and access to an ecosystem of partners and solutions featuring advanced large language models (LLMs), high-performance graphics processing units (GPUs) and AI inferencing capabilities |
| BCE INC. 2025 ANNUAL FINANCIAL REPORT | 13 |
1 MD&A Overview
Bell CTS U.S.
Segment description
| • | On August 1, 2025, BCE completed its acquisition of Ziply Fiber, the leading fibre Internet provider in the Pacific Northwest of the U.S. The results of the acquired Ziply Fiber operations are included, from the date of acquisition, in a new operating segment, Bell CTS U.S. |
| • | Ziply Fiber provides wireline communication products and services to residential, business and wholesale customers in the Pacific Northwest of the U.S. |
| • | Wireline products and services primarily consist of data services, including broadband Internet access with a range of speed tiers and value-added features, commercial Ethernet, dedicated Internet access and other data transport solutions, as well as voice services delivered over IP-based networks |
Our brand
Our networks and reach
| • | FTTP network infrastructure serving approximately 1.4 million fibre passings across Washington, Oregon, Idaho and Montana |
| • | Purpose-built, IP-based fibre network architecture designed for scalability, redundancy, high reliability and long-term expansion |
| • | Fibre network infrastructure supporting residential, business and wholesale connectivity, including interconnection with other service providers and enterprise customers |
| • | Through Network FiberCo, (1) BCE has access to additional U.S. fibre routes and expansion opportunities, enabling accelerated fibre deployment beyond Ziply Fiber’s existing footprint |
Our wireline products and services
Residential
| • | Internet: High-speed FTTP Internet services delivering symmetrical download and upload speeds across a range of speed tiers, including multi-gigabit offerings of up to 50 Gbps |
| • | Voice: Fibre-based voice services offering local and long distance calling and a range of calling features, delivered over IP-based networks |
Business
| • | Connectivity solutions: Fibre-based connectivity solutions for enterprise and wholesale customers, including Internet access, Ethernet, wavelength, private line and IP transit services, as well as IP-based voice services and fibre connectivity to third-party data centres |
Bell Media
Segment description
| • | Canada’s leading media and entertainment company with a portfolio of assets in premium video, audio and OOH advertising, and digital media, monetized through traditional and digital platforms |
| • | Revenues are derived primarily from advertising and subscriber fees |
| • | Conventional TV, radio, and OOH revenues are derived from advertising |
| • | Distribution of our TV and video products through partners result in revenue derived from subscription fees and advertising |
| • | Direct-to-consumer (DTC) streaming services revenue is derived from subscription fees and advertising |
Our brands include
Our assets and reach
Video
| • | 35 conventional TV stations, including CTV, Canada’s #1 conventional network for 24 consecutive years in primetime A25-54, together with its digital platforms CTV.ca, Canada’s leading advertising-based video on demand (AVOD) platform, and CTVNews.ca, one of the country’s leading digital news destinations. Bell Media also operates the French-language Noovo network in Québec, including its popular AVOD platform and digital news destination, Noovo.info |
| • | 24 specialty TV channels, including TSN, one of Canada’s sports leaders and RDS, the top French-language sports network |
| • | 5 DTC streaming services, including Crave, the exclusive home of HBO and Max Originals in Canada, STARZ, TSN, TSN+, and RDS |
| • | 13 English and French-language free, ad-supported streaming television (FAST) channels, featuring a selection of acclaimed and fan-favourite entertainment, factual, news, and sports programming. All 13 channels are available on LG Channels, Samsung TV Plus, Plex, and The Roku Channel |
| (1) | Network FiberCo is a long-term strategic partnership between BCE and Public Sector Pension Investment Board (PSP Investments), one of Canada’s largest pension investors, established to accelerate the development of fibre infrastructure through Ziply Fiber in underserved markets in the U.S. |
| 14 | BCE INC. 2025 ANNUAL FINANCIAL REPORT |
1 MD&A Overview
Audio
| • | Bell Media owns the iHeartRadio Canada brand, with a wide range of content including more than 360 licensed Canadian radio stations across 170 markets, hundreds of thousands of podcasts, playlists, and on demand content. In September 2025, Bell Media and iHeartMedia announced a long-term extension of their exclusive partnership, also providing Bell Media with Canadian representation of iHeartRadio’s extensive podcast portfolio. |
| • | Bell Media also provides access to local radio programming and additional content live and on-demand via the iHeartRadio website and app. iHeartRadio Canada is advancing the digital transformation of Bell Media’s local radio stations, offering Canadian and international programming, curated playlists, and exclusive digital streaming channels. The iHeartRadio Canada app, which debuted a slate of new features in September 2025, includes custom push notifications, in-app messaging, presets, a live radio dial, lyrics, and real-time listener interaction through its ‘talkback’ service. |
OOH advertising
| • | Astral Media Inc. (Astral), among Canada’s leading OOH advertising companies, includes a network of strategically located advertising faces spanning across the country in 50 markets |
| • | Astral offers five product lines: outdoor advertising, street furniture, airport, large digital format and transit |
| • | In 2024, Bell Media completed its acquisition of OUTFRONT Media Inc.’s Canadian OOH media business, OUTEDGE Media Canada (OUTEDGE) |
Broadcast rights
| • | Sports: long-term media rights to key sports properties and official Canadian broadcaster of the Super Bowl, Grey Cup and International Ice Hockey Federation (IIHF) World Junior Championship. Live sports coverage includes the Montréal Canadiens, Winnipeg Jets, Ottawa Senators, and Toronto Maple Leafs, and Canadian Football League (CFL), National Football League (NFL), National Basketball Association (NBA), Professional Women’s Hockey League (PWHL), Major League Soccer (MLS), Fédération Internationale de Football Association (FIFA) World Cup events, Curling’s Season of Champions, Golf’s Majors, NASCAR, Formula 1 (F1), Grand Slam Tennis, National Collegiate Athletic Association (NCAA) March Madness, Northern Super League (NSL), FIBA Basketball, and more. |
| • | Warner Bros. Discovery: Crave extended a long-term licensing agreement with Warner Bros. Discovery that sees Crave continuing to be the home of HBO and Max Originals, as well as new cable series, library TV series, and pay and post-pay window rights for Warner Bros. films. The agreement also feeds CTV, and Bell Media’s suite of Specialty channels with Warner Bros. Discovery’s iconic content. |
| • | NBCUniversal Global TV Distribution: A licensing agreement with USA Network and Oxygen True Crime in Canada |
| • | STARZ: long-term agreement with Lionsgate for premium STARZ programming in Canada |
| • | iHeartRadio: exclusive partnership for digital and streaming music services in Canada |
Other assets
| • | Montréal’s Octane Racing Group Inc., promoter of the F1 Canadian Grand Prix, the largest annual sports and tourism event in the country |
| • | Majority interest in Sphere Abacus, a global content distribution company that serves as the primary international distributor of Bell Media’s owned rights |
| • | Equity interest in Dome Productions Partnership, one of North America’s leading providers of sports and other event production and broadcast facilities |
| • | Minority interest in Montréal’s Grandé Studios, a Montréal-based multipurpose TV, film and equipment company which provides production facilities, equipment rentals, and technical services |
Our products and services
| • | Varied and extensive array of video content to broadcast distributors across Canada |
| • | Advertising on our video, audio, digital and OOH properties to both local and national advertisers across a wide range of industry sectors |
| • | Strategic partnerships to advance advertising opportunities for clients, such as becoming the exclusive Canadian sales partner for Tubi; expanding its Outcomes Measurement offering through a partnership with Loblaw Advance; shoppable experiences with Shopsense AI; integrating tools from the Bell Marketing Platform (BMP) into The Trade Desk’s Kokai platform |
| • | Bell Ads for Business, an advertising platform that allows local businesses across Canada to utilize Bell’s premium Canadian data and target intended audiences |
| • | Crave is the largest Canadian-owned streamer delivering an unparalleled content offering with HBO and Max Originals, STARZ, Hollywood-hit movies, and more. It also boasts an ever-growing and globally renowned slate of English and French original series. Crave is offered through a number of Canadian TV providers and is available directly to all Canadian Internet subscribers as an OTT service. |
| • | TSN, TSN+, and RDS streaming services offering live and on-demand TSN and RDS content directly to consumers through an annual or monthly subscription on computers, tablets, mobile devices, Apple TV and other streaming devices, which can also be bundled with Crave |
Other BCE investments
BCE also holds investments in a number of other assets, including:
| • | a 50% indirect equity interest in Glentel, a Canadian-based connected services retailer |
| • | a 20.2% indirect equity interest in entities that operate the Montréal Canadiens Hockey Club, evenko (a promoter and producer of cultural and sports events) and the Bell Centre in Montréal, Québec, as well as Place Bell in Laval, Québec |
| BCE INC. 2025 ANNUAL FINANCIAL REPORT | 15 |
1 MD&A Overview
Our people
Employees
At the end of 2025, our team consisted of 38,683 employees, a decrease of 1,707 employees, compared to 40,390 employees at the end of 2024, driven by workforce reductions, natural attrition and retirements, partly offset by an increase in our employee base as a result of the acquisition of Ziply Fiber on August 1, 2025 and other small acquisitions made in the year.
Approximately 39% of total BCE employees were represented by labour unions at December 31, 2025.
Bell Code of Business Conduct
The ethical business conduct of our people is core to the integrity with which we operate our business. The Bell Code of Business Conduct sets out specific expectations and accountabilities, providing employees with practical guidelines to conduct business in an ethical manner. The Bell Code of Business Conduct applies to employees and directors, setting expectations for responsible behaviour and requiring annual training and attestations.
| 1.3 | Key corporate developments |
This section contains forward-looking statements, including statements relating to the potential total number of combined Ziply Fiber-Network FiberCo fibre locations to be reached over the long term. Refer to the section Caution regarding forward-looking statements at the beginning of this MD&A.
Completion of Ziply Fiber acquisition
On August 1, 2025, BCE completed its previously announced acquisition of Ziply Fiber, the leading fibre Internet provider in the Pacific Northwest of the U.S., for cash consideration of $3.64 billion in U.S. dollars ($5.01 billion in Canadian dollars), and the assumption of outstanding net debt (1) of approximately $1.9 billion in U.S. dollars ($2.6 billion in Canadian dollars) at closing. To accelerate expansion into the U.S. market, BCE and PSP Investments announced on May 8, 2025 the formation of Network FiberCo, a long-term strategic partnership to
accelerate the development of fibre infrastructure through Ziply Fiber, in underserved markets in the U.S. Combined with the completion of the Ziply Fiber acquisition, this long-term strategic partnership will enable Bell to potentially reach up to 8 million fibre locations in the U.S., reinforcing its position as the third-largest fibre Internet provider in North America. The results of Ziply Fiber are included in our Bell CTS U.S. segment.
Disposition of minority stake in MLSE
On July 1, 2025, BCE completed the previously announced sale of its 37.5% ownership stake in Maple Leaf Sports and Entertainment Ltd. (MLSE) for $4.7 billion to Rogers Communications Inc. (Rogers). BCE directed the net proceeds of this disposition towards its acquisition of
Ziply Fiber. As part of the MLSE transaction, Bell Media has secured access to content rights for the Toronto Maple Leafs and Toronto Raptors on TSN through the 2043/2044 season via a long-term agreement with Rogers.
BCE executive team update
On May 20, 2025, Mark McDonald was promoted to the role of Executive Vice-President (EVP) and Chief Technology Officer. In his new role, Mark is responsible for Bell’s network strategy and infrastructure, as well as maximizing the potential of key technologies like 5G and fibre.
Also on May 20, 2025, Hadeer Hassaan assumed an expanded role as EVP and Chief Information and Customer Experience Officer. In this role, Hadeer ensures Bell’s customer-first approach is supported by the right data and information, leveraging technology to create a seamless and positive experience for Bell’s customers. She also leads Bell’s cloud services strategy.
| (1) | Net debt is a non-GAAP financial measure. See section 11.1, Non-GAAP financial measures in this MD&A for more information on this measure. |
| 16 | BCE INC. 2025 ANNUAL FINANCIAL REPORT |
1 MD&A Overview
| 1.4 | Capital allocation strategy |
This section contains forward-looking statements, including statements relating to BCE’s capital allocation priorities; our objective to create long-term value for its shareholders with strong free cash flow generation and a sustainable dividend; BCE’s common share dividend and dividend payout policy target; BCE’s expected dividend payout ratio level in the medium term; our objective to maintain investment-grade credit ratings for Bell Canada’s senior debt; BCE’s net debt leverage ratio expected by the end of 2027 and net debt leverage policy target expected by 2030; the intended use of the net proceeds of Bell Canada’s February 12, 2026 offering of junior subordinated debt securities; and our business outlook, objectives, plans and strategic priorities. Refer to the section Caution regarding forward-looking statements at the beginning of this MD&A.
Our capital allocation priorities are focused on strengthening the balance sheet, funding our strategic priorities and returning capital to shareholders in a disciplined manner. We are executing against a clear framework designed for our current operating environment, with an emphasis on deleveraging, optimizing our cost of capital and maintaining financial flexibility. At the same time, we continue to invest in initiatives that support long-term growth, including AI-powered enterprise solutions, digital media and fibre expansion in the U.S. Our approach to capital allocation is underpinned by strong free cash flow generation and a sustainable dividend, and is focused on creating long-term value for shareholders.
Dividend and dividend payout policy
BCE has a long-standing objective of returning capital to shareholders through a sustainable common share dividend. Our dividend payout policy is an integral component of our capital allocation framework and is designed to balance shareholder returns with the funding requirements of our strategic priorities and the maintenance of a strong balance sheet.
In May 2025, following a comprehensive review of the macroeconomic, regulatory and competitive environments of BCE, the BCE Board established the annualized dividend at $1.75 per BCE common share effective starting from the July 15, 2025 dividend payment date. At the same time, BCE’s common share dividend payout policy was updated to target a dividend payout range of 40% to 55% of free cash flow. This revised policy reflects the BCE Board’s focus on enhancing financial flexibility, supporting accelerated deleveraging and optimizing BCE’s cost of capital in the current operating and capital market environment, while maintaining a meaningful and sustainable dividend for shareholders.
The dividend payout policy is designed to remain consistent in the long term. As a result, dividends are not automatically reduced in a year when free cash flow is lower or increased in a year when free cash flow is higher.
On February 5, 2026, the BCE Board declared a quarterly dividend of $0.4375 per common share, payable on April 15, 2026 to shareholders of record at the close of business on March 16, 2026.
For the year ended December 31, 2025, BCE’s dividend payout ratio (1) was approximately 64% of free cash flow, which is above the target policy range, reflecting the transitional nature of the year following the mid-year reset of the dividend level. The dividend payout ratio is expected to trend toward the target policy range over the medium term, supported by continued free cash flow generation, disciplined capital investment and our ongoing focus on balance sheet optimization.
As announced in May 2025, BCE committed to providing, on an annual basis, the implied dividend payout ratio calculated on the basis of free cash flow after payment of lease liabilities, in addition to the dividend payout ratio assessed against our policy framework. This financial measure is provided to enhance transparency for investors regarding cash available for dividend payments after lease repayments and does not form part of BCE’s dividend payout policy, which continues to be assessed against free cash flow.
For the year ended December 31, 2025, the implied dividend payout ratio based on free cash flow after payment of lease liabilities (1) was approximately 99%, reflecting the transitional nature of the year following the mid-year reset of the dividend level.
The dividend payout policy is intended to provide a long-term framework for BCE’s approach to allocating cash generated by the business, is not intended to restrict the discretion of the BCE Board in declaring dividends and does not bind BCE in declaring any set amount of dividend. BCE’s dividend policy, setting the common share dividend rate and the declaration of dividends are subject to the discretion of the BCE Board and, consequently, there can be no guarantee that BCE’s dividend payout policy will be maintained or achieved, that the dividend on common shares will be maintained, or that dividends will be declared. Dividend rates and the declaration of dividends by the BCE Board are ultimately dependent on BCE’s corporate strategy, operations, and financial results, which are, in turn, subject to various assumptions and risks, including those outlined in this MD&A.
| (1) | Dividend payout ratio and dividend payout ratio after payment of lease liabilities are non-GAAP ratios. Refer to section 11.2, Non-GAAP ratios in this MD&A for more information on these measures. |
| BCE INC. 2025 ANNUAL FINANCIAL REPORT | 17 |
1 MD&A Overview
Executive compensation alignment
BCE is focused on a pay-for-performance approach for all team members, including our executives. In order to attract, motivate and retain top talent, the company offers a competitive total compensation package.
| • | Base salary: rewards the scope and responsibilities of a position, with target positioning at the median of our comparator group |
| • | Annual incentive: encourages strong performance against yearly corporate and individual objectives |
| • | Long-term incentive: aligns with long-term interests of shareholders |
The mix of vehicles awarded under BCE’s long-term incentive plan favours the execution of multiple objectives. They are structured to create sustainable value for shareholders by attracting, motivating and retaining the executive officers needed to drive the business strategy, and rewarding them for delivering on our goal of advancing how people connect with each other and the world, through the successful execution of our strategic priorities. We have strong alignment of interest between shareholders and management through our equity-based incentive plans.
|
Best practices adopted by BCE for executive compensation |
• Stringent share ownership requirements
• Emphasis on pay at risk for executive compensation
• Double trigger change-in-control policy
• Anti-hedging policy on share ownership and incentive compensation
• Clawbacks for the President and Chief Executive Officer (CEO) and all EVPs
• Caps on BCE supplemental executive retirement plans and annual bonus payouts, in addition to long-term incentive grants
• Vesting criteria aligned to shareholder interests
|
Capital allocation priorities
Consistent with our capital markets objective to return capital to shareholders through a sustainable dividend, while maintaining appropriate levels of capital investment, investment-grade credit ratings for Bell’s senior debt and overall financial flexibility, we deploy excess free cash flow and divestiture proceeds, when available, in a balanced manner. Our capital allocation priorities include, but are not limited to, the following uses:
| • | Funding of strategic acquisitions and investments that support the growth of our business, including wireless spectrum purchases |
| • | Debt reduction, with a focus on strengthening the balance sheet and supporting deleveraging objectives |
| • | Share buybacks of preferred shares through a normal course issuer bid (NCIB) program, when appropriate |
In 2025, excess free cash flow (1) of $1,152 million, compared to negative $725 million in 2024, was deployed primarily toward acquisitions and strategic partnerships aligned with our strategic priorities, as well as the repayment of long-term debt. The year-over-year increase in excess free cash flow was attributable to lower cash dividends paid on common shares following the mid-year reset of the annualized common share dividend level, as well as higher free cash flow, primarily reflecting lower capital expenditures compared to the prior year.
This graph compares the yearly change in the cumulative annual total shareholder return of BCE common shares against the cumulative annual total return of the S&P Global Ratings Canada, a business unit of S&P Global Canada Corp. (S&P)/TSX Composite Index (3), for the five-year period ending December 31, 2025, assuming an initial investment of $100 on December 31, 2020 and the quarterly reinvestment of all dividends.
| (1) | Excess free cash flow is a non-GAAP financial measure. Refer to section 11.1, Non-GAAP financial measures in this MD&A for more information on this measure. |
| (2) | Based on BCE’s common share price on the TSX and assuming the reinvestment of dividends. |
| (3) | As the headline index for the Canadian equity market, the S&P/TSX Composite Index is the primary gauge against which to measure total shareholder return for Canadian-based, TSX-listed companies. |
| 18 | BCE INC. 2025 ANNUAL FINANCIAL REPORT |
1 MD&A Overview
Capital structure
BCE’s balance sheet is supported by a strong liquidity position and prudent financial risk management. At December 31, 2025, available liquidity (1) totalled $2.5 billion, comprised of $314 million in cash, $6 million in cash equivalents, $700 million available under our securitized receivables program, and $1.5 billion available under our $4.0 billion committed revolving and expansion credit facilities. We continue to monitor the capital markets for opportunities to lower our cost of debt
and optimize our cost of capital, while proactively managing financial risks, including foreign currency exposure on U.S. dollar denominated purchases, equity risk associated with long-term equity-based incentive plans, and interest rate and foreign currency exposure related to our debt portfolio. Maintaining investment-grade credit ratings for Bell’s senior debt remains a key financial objective.
Long-term public debt
maturity profile
| • | $750 million of publicly issued debt securities maturing in 2026 pre-financed and early redeemed |
| • | $1.5 billion of hybrid securities issued in February 2026 |
Liquidity position (2)
| • | $1.5 billion available under our $4.0 billion multi-year committed credit facilities |
| • | $700 million receivables securitization available capacity |
| • | $314 million cash |
| • | $6 million in cash equivalents |
Investment-grade credit ratings for Bell’s senior debt (2) (3)
| • | Long-term debt credit rating of BBB by DBRS Limited (DBRS), Baa 2 by Moody’s Investors Service, Inc. (Moody’s) and BBB by S&P |
We monitor our capital structure by using a number of measures, principally the net debt leverage ratio and dividend payout ratio.
At December 31, 2025, our net debt leverage ratio (4) was 3.78 times adjusted EBITDA, compared to 3.81 times adjusted EBITDA at December 31, 2024. This improvement occurred despite the closing of the Ziply Fiber acquisition, which was funded from the net proceeds of BCE’s divestiture of its ownership stake in MLSE, together with cash on hand. Our leverage levels remain above our internal net debt leverage policy target of approximately 3.0 times adjusted EBITDA, reflecting wireless spectrum purchases, significant capital expenditures to advance our network and transformation initiatives, and the financing of several strategic acquisitions over the past several years.
We have a target of achieving a net debt leverage ratio of approximately 3.5 times adjusted EBITDA by the end of 2027, and we intend to continue reducing leverage toward our policy level of approximately 3.0 times adjusted EBITDA by 2030, consistent with our capital allocation strategy. In addition, we intend to use the proceeds from the February 12, 2026 issuance of $1.5 billion aggregate principal amount of Fixed-to-Fixed Rate Junior Subordinated Notes in two series (D and E) (the Series D and E Notes) for the repurchase, redemption or repayment of Bell’s senior or subordinated indebtedness and for other general corporate purposes. The Series D and E Notes receive 50% equity treatment from the credit rating agencies and, consistent with their methodologies, only 50% of the principal amount is treated as debt in the calculation of our net debt leverage ratio.
| BCE credit ratios | 2027 target |
December 31, 2025 |
December 31, 2024 |
|||||||||
| Net debt leverage ratio |
3.5 | 3.78 | 3.81 | |||||||||
Bell Canada accessed the debt capital markets in February 2025, March 2025 and August 2025, raising gross proceeds of $2,250 million in U.S. dollars (approximately $3,187 million in Canadian dollars) from the
issuance in the U.S. of Fixed-to-Fixed Rate Junior Subordinated Notes in two series (A and B) (the Series A and B Notes), $1,250 million from the issuance in Canada of Series C Fixed-to-Fixed Rate Junior Subordinated Notes (the Series C Notes), and $2.0 billion from the issuance in Canada of medium-term note (MTN) debentures. The net proceeds were used to redeem, repay or repurchase Bell Canada’s senior indebtedness, fund the redemption of Ziply Fiber’s outstanding debt securities totalling $1.96 billion in U.S. dollars (approximately $2.7 billion in Canadian dollars), and for general corporate purposes. In March 2025 and June 2025, Bell Canada repurchased, pursuant to tender offers, U.S. notes and MTN debentures with an aggregate principal face amount of $3,036 million in Canadian dollars for an aggregate cash purchase price of $2,401 million in Canadian dollars, further supporting balance sheet optimization.
In February 2025, Bell Canada amended and restated its 2024 short form base shelf prospectus to, among other things, amend the description and characteristics of the debt securities that may be issued thereunder to provide for the issuance of subordinated (including junior subordinated) debt securities in Canada and the U.S. under one or more new trust indentures.
Subsequent to year-end, on February 12, 2026, Bell Canada completed an offering of $1.5 billion aggregate principal amount of Series D and E Notes. The $750 million Series D Notes, due 2056, bear interest at an initial annual rate of 5.375%, resetting every five years beginning May 12, 2031 at a rate equal to the five-year Government of Canada yield plus 2.388%, subject to a minimum reset rate of 5.375%. The $750 million Series E Notes, due 2056, bear interest at an initial annual rate of 5.875%, resetting every five years beginning May 12, 2036 at a rate equal to the five-year Government of Canada yield plus 2.440%, subject to a minimum reset rate of 5.875%.
Bell Canada may redeem either series, in whole or in part, at a redemption price equal to 100% of the principal amount commencing on the applicable first reset dates.
| (1) | Available liquidity is a non-GAAP financial measure. See section 11.1, Non-GAAP financial measures in this MD&A for more information on this measure. |
| (2) | As at December 31, 2025. |
| (3) | These credit ratings are not recommendations to buy, sell or hold any of the securities referred to, and they may be revised or withdrawn at any time by the assigning rating agency. Ratings are determined by the rating agencies based on criteria established from time to time by them, and they do not comment on market price or suitability for a particular investor. Each credit rating should be evaluated independently of any other credit rating. |
| (4) | Net debt leverage ratio is a capital management measure. See section 11.4, Capital management measures in this MD&A for more information on this measure. |
| BCE INC. 2025 ANNUAL FINANCIAL REPORT | 19 |
1 MD&A Overview
| 1.5 | Corporate governance and risk management |
Corporate governance philosophy
The BCE Board and management of the company believe that strong corporate governance practices contribute to superior results in creating and maintaining shareholder value. That is why we continually seek to strengthen our corporate governance practices and ethical business conduct by adopting best practices, and providing full transparency and accountability to our shareholders. The BCE Board is responsible for the supervision of the business and affairs of the company.
Below are our key BCE Board information and governance best practices:
|
✓ |
Directors are ALL Independent (except CEO) |
✓ |
BCE Board Renewal:
7 Non-Executive Director Nominees ≤ 7 Years Tenure
Average Tenure = 6.21 years | |||||
| 98.4% | 2025 BCE Board and Committee Director Attendance Record | |||||||
| ✓
|
BCE Board Committee Members are All Independent | ✓
|
Share Ownership Guideline for Directors and Executives | |||||
| ✓
|
BCE Board Diversity Policy and Target for Gender Representation | ✓
|
Code of Business Conduct and Ethics Program | |||||
| ✓
|
Annual Election of All Directors | ✓
|
Annual Advisory Vote on Executive Compensation | |||||
| ✓
|
Directors Elected Individually | ✓
|
Formal BCE Board Evaluation Process | |||||
| ✓
|
Majority Voting for Directors | ✓
|
BCE Board Risk Oversight Practices | |||||
| ✓
|
Separate Chair and CEO | ✓
|
Corporate Responsibility Strategy Reviewed by BCE Board | |||||
| ✓
|
BCE Board Interlocks Guidelines | ✓
|
Robust Succession Planning | |||||
| ✓
|
Directors’ Tenure Guidelines | |||||||
For more information, please refer to BCE’s most recent notice of annual general shareholder meeting and management proxy circular (the Proxy Circular) filed with the Canadian provincial securities regulatory authorities (available at sedarplus.ca) and furnished to the U.S. Securities and Exchange Commission (available at sec.gov), and available on BCE’s website at BCE.ca.
Risk governance framework
BCE Board oversight
The BCE Board is entrusted with the responsibility for identifying and overseeing the principal risks to which our business is exposed and seeking to ensure there are processes in place to effectively identify, monitor and manage them. These processes seek to mitigate rather than eliminate risk. A risk is the possibility that an event might happen in the future that could have a negative effect on our business, financial condition, liquidity, financial results or reputation. While the BCE Board has overall responsibility for risk, the responsibility for certain elements of the risk oversight program is delegated to BCE Board committees in order to ensure that they are treated with appropriate expertise, attention and diligence, with reporting to the BCE Board on a regular basis.
Risk information is reviewed by the BCE Board or the relevant committee throughout the year, and business leaders present regular updates on the execution of business strategies, risks and mitigation.
| • | The Risk and Pension Fund Committee has oversight responsibility for the organization’s risk governance framework, which exists to identify, assess, mitigate and report key risks to which BCE is exposed. As part of its Charter, the Risk and Pension Fund Committee is tasked with oversight of risks relating to network resiliency, business continuity plans, work stoppage and disaster recovery plans, regulatory and public policy, data governance and privacy, AI, information security (including cybersecurity), physical security, fraud, vendor management, reputation and sustainability, technology, safety, geopolitics, the pension fund and other risks as required. The Risk and Pension Fund Committee receives reports on security matters, including information security (including cybersecurity), and on environmental matters, each quarter, and on AI matters at least annually. |
| • | The Audit Committee is responsible for overseeing the integrity of our financial statements and related information, management’s assessment and reporting on the effectiveness of internal controls, and risk processes as they relate to financial reporting and management |
| • | The Management Resources and Compensation Committee (Compensation Committee) oversees risks relating to compensation, succession planning and workplace policies and practices |
| 20 | BCE INC. 2025 ANNUAL FINANCIAL REPORT |
1 MD&A Overview
| • | The Corporate Governance Committee (Governance Committee) assists the BCE Board in developing and implementing BCE’s corporate governance guidelines, identifying individuals qualified to become members of the BCE Board, and determining the composition of the BCE Board and its committees. The Governance Committee is responsible for oversight of our corporate responsibility programs and strategy to protect or enhance the company’s reputation, and their integration within our overall business strategy, and disclosure regarding sustainability matters. The Governance Committee is also responsible for oversight of the company’s policies concerning business conduct, ethics, public disclosure of material information and AI governance. |
Risk management culture
There is a strong culture of risk management at BCE that is actively promoted by the BCE Board, the Risk and Pension Fund Committee and the President and CEO, at all levels within the organization. It is a part of how the company operates on a day-to-day basis and is woven into its structure and operating principles, guiding the implementation of the organization’s strategic priorities.
The President and CEO, selected by the BCE Board, has set his strategic focus through the establishment of four strategic priorities and focuses risk management around the factors that could impact the achievement of those strategic priorities. While the constant state of change in the economic environment and the industry creates challenges that need to be managed, clarity around strategic objectives, performance expectations, risk management and integrity in execution ensures discipline and balance in all aspects of our business.
Risk management framework
While the BCE Board is responsible for BCE’s risk oversight program, operational business units are central to the proactive identification and management of risk. They are supported by a range of corporate support functions that provide independent expertise to reinforce implementation of risk management approaches in collaboration with the operational business units. The Internal Audit function provides a further element of expertise and assurance, working to provide insight and support to the operational business units and corporate support functions, while also providing the Audit Committee, the Risk and Pension Fund Committee, and other BCE Board committees, as required, with an independent perspective on the state of risk and control within the organization. Collectively, these elements can be thought of as a “three lines” approach to risk management. Although the risk management framework described in this section 1.5 is aligned with industry practices, there can be no assurance that it will be sufficient to prevent the occurrence of events that could have a material adverse effect on our business, financial condition, liquidity, financial results or reputation.
First line – operational business units
The first line refers to management within our operational business units, who are expected to understand their operations in great detail and the financial results that underpin them. There are regular reviews of operating performance involving the organization’s executive and senior management. The discipline and precision associated with this process, coupled with the alignment and focus around performance goals, creates a high degree of accountability and transparency in support of our risk management practices.
As risks emerge in the business environment, they are discussed in a number of regular forums to share details and explore their relevance across the organization. Executive and senior management are integral to these activities in driving the identification, assessment, mitigation and reporting of risks at all levels. Formal risk reporting occurs through strategic planning sessions, management presentations to the BCE Board and formal company risk reporting, which is shared with the BCE Board and the Risk and Pension Fund Committee during the year.
Management is also responsible for maintaining effective internal controls and for executing risk and control procedures on a day-to-day basis. Each operational business unit develops its own operating controls and procedures that fit the needs of its unique environment.
| BCE INC. 2025 ANNUAL FINANCIAL REPORT | 21 |
1 MD&A Overview
Second line – corporate support functions
BCE is a very large company, with 38,683 employees as at December 31, 2025, multiple business units and a diverse portfolio of risks that is constantly evolving based on internal and external factors. In a large organization, it is common to manage certain functions centrally for efficiency, scale and consistency. While the first line is often central to identification and management of business risks, in many instances operational management works collaboratively with, and also relies on, the corporate functions that make up the second line of support in these areas. These corporate functions include Regulatory, Finance, Corporate Security, Corporate Risk Management, Legal, Corporate Responsibility, Human Resources, Real Estate and Procurement.
Legal and Regulatory function: This function is responsible for the regulatory portfolio. BCE has developed, and maintains, an enhanced Data Governance Policy that encompasses the protection and appropriate use of data across its life cycle. A significant element of the data governance program relies on the Corporate Security activities outlined below, and these two functions work jointly with data owners, data custodians and other relevant employees to seek to ensure this policy is appropriately implemented. We recognize that a strong and consistently applied approach to data governance is essential to maintaining the social licence necessary to achieve our business objectives. For more information on our approach to privacy and data security, refer to section 1.6, Capitals and our corporate responsibility, in this MD&A.
Finance function: BCE’s Finance function plays a pivotal role in seeking to identify, assess and manage risks through a number of activities, which include financial performance management, external reporting, pension management, capital management, and oversight and execution practices related to the U.S. Sarbanes-Oxley Act of 2002 and equivalent Canadian securities legislation, including the establishment and maintenance of appropriate internal control over financial reporting. BCE has also established and maintains disclosure controls and procedures to seek to ensure that the information it publicly discloses is accurately recorded, processed, summarized and reported on a timely basis. For more details concerning BCE’s internal control over financial reporting and disclosure controls and procedures, refer to the Proxy Circular and section 12, Effectiveness of internal controls, in this MD&A.
Corporate Security function: This function is responsible for all aspects of security, which requires a deep understanding of the business, the risk environment and the external stakeholder environment. Based on this understanding, Corporate Security sets the standards of performance required across the organization through security policies and directives that define requirements to protect team members, company assets and information. In high and evolving risk areas such as information security, Corporate Security leverages its experience and competence to develop strategies intended to mitigate the organization’s risks. For instance, we have implemented security awareness training, policies and directives that seek to mitigate information security threats. We further rely on security assessments to identify risks and review projects with the objective of ensuring that systems are deployed with the appropriate level of control, including access management, vulnerability management, security monitoring and testing. We evaluate and seek to adapt our security policies and directives designed to protect our information and assets in light of the continuously evolving nature and sophistication of information security threats. However, given the complexity and scale of our business, network infrastructure,
technology and IT support systems, there can be no assurance that the security policies and directives that we implement will prevent the occurrence of all potential information security breaches. In addition, although BCE has contracted an insurance policy covering information security risk, there can be no assurance that any insurance we may have will cover the costs, damages, liabilities or losses that could result from the occurrence of any information security breach.
Corporate Risk Management function: This function works across the company to gather information and report on the organization’s assessment of its principal risks and the related exposures. Annually, senior management participate in a risk survey that provides an important reference point in the overall risk assessment process.
In addition to the activities described above, the second line is also critical in building and operating the oversight mechanisms that bring focus to relevant areas of risk and reinforce the bridges between the first and second lines, thereby seeking to ensure that there is a clear understanding of emerging risks, their relevance to the organization and the proposed mitigation plans.
To further coordinate efforts between the first and second lines, BCE has established a Risk Oversight Committee (ROC), which replaced the Health & Safety, Security, Environment and Compliance Oversight Committee in 2025. A significant number of BCE’s most senior leaders are members of the ROC, the purpose of which is to oversee areas that pose potential risks to BCE’s operations identified by management, including, but not limited to, security (including information security), environmental, health and safety, compliance, AI, data governance, and privacy. This cross-functional committee seeks to ensure that relevant risks are adequately recognized and mitigation activities are well integrated and aligned across the organization and are supported with sufficient resources. The ROC co-chairs report to the Risk and Pension Fund Committee, Governance Committee and Compensation Committee of the BCE Board.
We have also established management committees reporting to the ROC: (i) the Corporate Responsibility Board (CR Board) to support the evolution of our corporate responsibility strategy, and to proactively manage sustainability topics in an integrated fashion; the CR Board also reports to the BCE Disclosure and Compliance Committee with regard to the public disclosure of sustainability information; (ii) the Energy Board to ensure oversight of Bell’s overall energy consumption and progress towards meeting our GHG emissions reduction targets (science-based targets); (iii) the Climate Resiliency Taskforce to assist in building a climate resiliency governance to address the potential impacts of climate change; (iv) the Responsible AI Office to oversee AI programs, risks, our AI ethical framework implementation, developments in AI technologies and their applications and monitor legal and regulatory developments impacting AI; and (v) the CISO Partnership Program (CPP) to drive secure behaviours across the company.
Third line – internal audit function
Internal Audit is a part of the overall management information and control system and has the responsibility to act as an independent appraisal function. Its purpose is to provide the Audit Committee, the Risk and Pension Fund Committee, and other BCE Board committees, as required, and management with objective evaluations of the company’s risk and control environment, to support management in fulfilling BCE’s strategic priorities and to maintain an audit presence throughout BCE and its subsidiaries.
| 22 | BCE INC. 2025 ANNUAL FINANCIAL REPORT |
1 MD&A Overview
| 1.6 | Capitals and our corporate responsibility |
This section contains forward-looking statements, including statements relating to our sustainability objectives and the benefits expected to result therefrom. Refer to the section Caution regarding forward-looking statements at the beginning of this MD&A and to the sub-section Assumptions at the end of this section 1.6. For explanations of certain climate-related terms, metrics and targets used in this section 1.6 including, without limitation, science-based targets and net zero, please refer to Explanation of certain climate-related terms, metrics and targets at the end of this section 1.6.
Corporate responsibility supports our purpose to advance how people connect with each other and the world
Our corporate responsibility approach is informed by a set of guiding principles that support our corporate strategy and policies throughout the organization. Through our own internal processes along with stakeholder feedback, we have prioritized, and set objectives to address, sustainability issues and opportunities. We measure and report on our progress. We utilize this approach because we believe it is the right thing to do and because it creates long-term value for our stakeholders. Bell’s corporate responsibility initiatives focus on addressing social and environmental challenges, with the goal of delivering benefits for our customers, employees and the communities we serve. These benefits help support stronger operational performance, attract and retain talent, increase access to capital and strengthen risk management – ultimately seeking to generate sustainable returns for our shareholders and other stakeholders.
The Board has established clear oversight of our corporate responsibility programs and our approach to sustainability practices with primary accountability at the committee level. The Governance
Committee is responsible for oversight of our corporate responsibility strategy and disclosure. This includes the integration of corporate responsibility within our company strategy and monitoring the implementation of corporate responsibility programs, goals and key initiatives, including those related to climate change. Moreover, it is responsible for our governance practices and policies, including those concerning business conduct, ethics and AI. In addition, the Risk and Pension Fund Committee oversees risks that could impact our business, such as safety and security, business continuity, supply chain, AI and sustainability risks, while the Audit Committee monitors significant sustainability issues that could impact financial reporting, reviews audit activities in relation to corporate responsibility and approves our risks and assumptions disclosure. The Compensation Committee has oversight of human resource issues, including respectful and inclusive workplace practices, pay equity, team survey results, human rights, and health and safety.
We continue to share our performance in managing societal, environmental and business impacts following the <IR> Framework.
Our networks
Reliable network infrastructure and trusted data practices are foundational to the products and services we deliver every day. Network performance, data privacy and information security are central to customer experience, operational resilience and long-term value creation.
How reliable networks create value
Highly reliable network infrastructure helps support consistent service delivery, customer satisfaction and economic participation. Resilient design and proactive operations help reduce service interruptions, protect critical communications and support digital services that rely on consistent, high-quality connectivity.
Activities and outcomes
| • | Reliable service delivery: Our fibre and wireless networks support consumer, business and public-sector services, including voice, data, media, cloud connectivity and public-safety communications. Network quality, availability and reliability remain core performance indicators. |
| • | Resilient network design: Redundant transport routes, backup power systems and diversified network architecture help maintain service continuity and limit the impact of outages caused by extreme weather, infrastructure failures or other disruptions |
| BCE INC. 2025 ANNUAL FINANCIAL REPORT | 23 |
1 MD&A Overview
| • | Proactive operations: Continuous monitoring, automated diagnostics and AI-enabled network operations help detect, isolate and resolve issues more quickly, supporting stable performance as demand for secure, high-capacity connectivity grows |
| • | Infrastructure integrity: Ongoing investments in network security, capacity and resiliency help protect the integrity of services delivered over our infrastructure and support consistent reliability outcomes |
Key metric
| 2023 | 2024 | 2025 | ||||||||||
| Bell’s network reliability – high-speed fibre-to-the-home (FTTH) Internet connection | 99.99% | 99.99% | 99.99% | |||||||||
How protecting privacy creates value
Respecting customer privacy is essential to maintaining trust and our licence to operate. Strong privacy practices help reduce regulatory and reputational risk while enabling responsible use of data to improve products, services and customer experience.
Activities and outcomes
| • | Privacy governance: A comprehensive privacy framework governs the collection, use, retention and disclosure of personal information across its lifecycle and is integrated into business processes and decision-making |
| • |
Privacy-by-design: Privacy considerations are embedded into product development, service delivery and AI governance to help ensure personal information is protected from the outset |
| • | Policies and training: Mandatory training reinforces employee accountability for protecting personal information and complying with privacy requirements, supported by clear policies and guidance. Employees receive data governance training every two years through mandatory Code of Business Conduct training, reinforcing accountability for privacy compliance and responsible data use. |
| • | Issue management: Structured processes help support timely investigation, resolution and prevention of privacy incidents, reinforcing transparency and continuous improvement |
Key metric
| 2023 | 2024 | 2025 | ||||||||||
| Number of unresolved well-founded privacy complaints (1) from the Office of the Privacy Commissioner of Canada | – | – | – | |||||||||
How information security creates value
Strong information security practices seek to protect customer and company data, safeguards operations and supports trust in an increasingly digital environment. Effective security controls help reduce exposure to cyber threats, financial loss and service disruption.
Activities and outcomes
| • | Security governance and standards: Our information security program is informed by globally recognized frameworks, including ISO/IEC 27001, and supports a structured, risk-based approach to managing cyber threats |
| • | Prevention, detection and response: Integrated security controls across networks, cloud environments and platforms help prevent incidents, detect threats early and respond effectively to minimize impact |
| • | Employee awareness: Ongoing cybersecurity education, phishing simulations and regular training reinforce a strong security culture and employee engagement in protecting information |
| • | Continuous monitoring: A 24/7 security operations capability analyzes large volumes of threat signals, helping enable timely response to evolving risks and strengthening overall cyber resilience |
Key metric
| 2023 | 2024 | 2025 | ||||||||||
| Information security vigilance: phishing simulation report rate | 33% | 36% | 37% | |||||||||
Our customers and relationships
Strong, ethical relationships with customers, suppliers and partners underpin our ability to operate responsibly, manage risk and create long-term value. Our approach is grounded in business ethics and responsible procurement practices that promote trust, accountability and resilience across our value chain.
How responsible relationships create value
Clear standards for ethical conduct and responsible sourcing help strengthen operational reliability, reduce compliance and reputational risk and support sustainable innovation. Embedding these principles into governance and procurement processes enhances decision-making quality and enables long-term partnerships that create shared value for stakeholders across the markets we serve.
Activities and outcomes
| • | Ethical conduct and oversight: The Code of Business Conduct applies to employees and directors and defines expectations for responsible behaviour. Mandatory annual training and attestations reinforce a consistent ethical culture, while a confidential reporting channel enables employees and external stakeholders to raise concerns or seek guidance. All reports are reviewed and addressed as appropriate, supporting transparency and trust. |
| • | Governance-aligned policies: Policies governing lobbying, political activity and responsible AI reinforce accountability, compliance and responsible decision-making across operations and partnerships |
| (1) | This metric is the number of unresolved well-founded privacy complaints from the Privacy Commissioner of Canada as of December 31 of the reporting year. A complaint is considered well-founded if the Privacy Commissioner concluded that one or more of the allegations in the complaint has merit. |
| 24 | BCE INC. 2025 ANNUAL FINANCIAL REPORT |
1 MD&A Overview
| • | Customer-first experience and inclusive design: Ongoing modernization of platforms, processes and operating models seek to improve the customer experience by enabling faster, more consistent and scalable interactions. Transformations of core systems and service platforms, together with the application of accessibility, inclusive design principles and inclusive standards across product development, digital channels and internal practices, support more equitable, intuitive and reliable experiences for the customers we serve. |
| • | Clear supplier expectations: The Supplier Code of Conduct establishes requirements for environmental management, labour and human rights, health and safety, business ethics and data security. These expectations are embedded in supplier contracts and supported by ongoing oversight to promote responsible practices throughout the supply chain. |
| • | Due diligence and risk management: Supplier assessments, audits, sustainability attestations and escalation protocols help identify and mitigate ethical, environmental and human rights risks, including alignment with evolving forced-labour regulations, strengthening supply-chain resilience |
| • | Responsible supply chain practices: Environmental and social criteria are integrated into aspects of sourcing and contracting. Through active supplier engagement, these practices are intended to support progress on reducing indirect (Scope 3) emissions – which represent the majority of our total GHG emissions – by strengthening climate requirements and encouraging adoption of science-based targets. |
| • | Collaboration and continuous improvement: Participation in industry initiatives, including the Joint Alliance for Corporate Social Responsibility, supports alignment with leading practices and collective progress. Ongoing engagement with customers, suppliers, employees, investors, governments, community organizations and academic institutions informs sustainability priorities and helps ensure practices remain responsive to emerging risks and opportunities such as climate resilience, AI governance and data responsibility. |
Key metric
| 2023 | 2024 | 2025 | ||||||||||
| Bell’s share of complaints to the Commission for Complaints for Telecom-television Services (CCTS) (1) | 16.1% | 17.0% | 16.8% | |||||||||
Our products and services
Our products and services provide value to people by helping them both mitigate climate change and adapt to its impacts. Our solutions help enable customers to reduce energy needs, minimize their carbon footprint, enhance productivity and maintain services in the event of emergencies and extreme incidents.
How our products and services contributing to climate change mitigation and adaptation help create value
Bell products and services can help improve customers’ resilience to climate change and enhance business continuity while reducing their GHG emissions.
Activities and outcomes
An analysis by Groupe AGECO, a third-party consultant with expertise in GHG emissions quantification, and Bell found that Bell solutions enabled carbon abatement of nearly 1,193 kilotonnes of CO₂ equivalent for our customers in 2023, which is when our last analysis was performed. This is equal to 4.7 times Bell’s operational GHG (scope 1 and 2) emissions (2).
Key metric
Factor by which GHG emissions are estimated to have been avoided by our customers through the use of Bell’s products and services
| 2017 | 2020 | 2023 | ||||||||||
| Number of times by which GHG emissions are estimated to have been abated by our customers through the use of Bell’s technologies exceeded scope 1 and 2 GHG emitted by Bell’s operations (2) | 2.5 | 4.0 | 4.7 | |||||||||
| (1) | Bell’s customer satisfaction & service quality metric is based on the results from the CCTS report. The CCTS number/data only includes Bell Canada (this excludes Bell Aliant, Bell MTS, Virgin Plus, Lucky Mobile, PC Mobile). Report covers August 1 of the previous year to July 31 of the reporting year. |
| (2) | Taking into account the products and services for which Bell has developed the technology and plays a fundamental role in its delivery to clients, as well as the products and services for which Bell has not developed the technology but enables it by providing the network. GHG emitted by Bell’s operations refers to scope 1 emissions (direct GHG emissions from sources that are owned or controlled by Bell) and scope 2 emissions (indirect GHG emissions associated with the consumption of purchased electricity, heating/cooling and steam required by Bell’s activities). The analyses were performed based on 2017, 2020 and 2023 data, respectively. |
| BCE INC. 2025 ANNUAL FINANCIAL REPORT | 25 |
1 MD&A Overview
Our environment
We intend to manage environmental impacts in our operations and value chain through governance processes and measurable targets. Our focus is on addressing the risks posed by climate change and advancing circular economy practices to help support operational resilience, resource efficiency and long-term value creation.
Climate change
How addressing climate change creates value
Proactive climate action helps manage physical and transition risks, protect critical infrastructure, reduce energy costs and support reliable service in a changing climate.
Activities and outcomes
| • | Climate strategy and governance: Our climate strategy is guided by a three-pillar strategy – mitigate emissions, strengthen resilience and enable lower-carbon outcomes – supported by near-term science-based targets, annual objectives and BCE Board oversight |
| • | Operational decarbonization: We are seeking to manage GHG emissions through, where possible, energy-efficiency initiatives, real estate and infrastructure optimization, fleet right-sizing and electrification and renewable electricity procurement |
| • | Climate resilience and adaptation: Climate-risk considerations are embedded into network design, asset management and emergency preparedness. Actions include enhancing backup power, improving remote monitoring and strengthening infrastructure to support service continuity during extreme weather and climate-related events. |
| • | Low-carbon digital infrastructure: As digital demand grows, including AI-enabled products and services, environmental considerations are integrated, where practicable, into infrastructure planning, siting and design. Measures such as optimized cooling, efficient temperature management and lower-carbon electricity sourcing help manage energy demand. |
Key metrics
| 2023 | 2024 | 2025 | ||||||||||
| Operational (Scope 1 and 2 market-based) GHG emissions in tons of CO2e(1) | 256,366 | 195,805 | 166,926 | |||||||||
| Energy intensity: Energy consumption (Megawatt hours (MWh) equivalent) divided by network usage (petabytes) | 99 | 74 | 53 | |||||||||
Circular economy and
environmental stewardship
How circularity and environmental stewardship create value
Circular practices aim to reduce material use and waste, improve operational efficiency and lower lifecycle environmental impacts. Strong environmental stewardship helps support compliance, reduce risk and align with stakeholder expectations for responsible resource management.
Activities and outcomes
| • | ISO 14001 environmental management: Our ISO 14001-certified Environmental Management System (EMS) (2), guide how we identify risks, help ensure compliance and drive continuous improvement across key environmental areas |
| • |
Enviro-by-design: Environmental governance is reinforced through our enviro-by-design initiative, which embeds sustainability considerations into certain aspects of procurement, product development and network planning. |
| • | Extending asset life: By retaining ownership of customer equipment, we enable repair, refurbishment and redeployment, helping reduce material demand, waste and emissions associated with new manufacturing |
| • | E-waste stewardship and end-of-life responsibility: As the distributor of electronic devices, we take responsibility for supporting customers at end of life through accessible and regulated e-waste programs |
| • | Recovery, recycling and material reuse: We operate accessible device return and recovery programs and recover, refurbish or recycle a wide range of operational materials helping divert materials from landfill and recover embedded value |
| • | Waste reduction and circularity targets: We track waste streams across operations and continue progress toward our target of reducing waste sent to landfill by 30% by 2030 from a 2019 baseline, supported by monitoring and improvement initiatives |
Key metric
| 2023 | 2024 | 2025 | ||||||||||
| Number of customer devices recovered (include used TV receivers, modems, Wi-Fi pods and mobile phones) | 2,953,523 | 2,759,467 | 2,985,085 | |||||||||
| (1) | Performance is based on data from July 1 of the previous year to June 30 of the reporting year and, as a result, does not include GHG emissions associated with our AI data centres. |
| (2) | This certification covers Bell Canada’s internal governance to ensure execution of the EMS associated with the development of policies and procedures for the delivery of services by Bell Canada for business sectors network & broadband services (wireline, wireless, Internet, TV), cloud and data hosting, broadcast services (radio, digital platform & TV) and connectivity and advertising technology and event promotion. |
| 26 | BCE INC. 2025 ANNUAL FINANCIAL REPORT |
1 MD&A Overview
Our people
Our ability to deliver on our strategy depends on the engagement, skills and wellbeing of our team members. We are committed to fostering a safe, inclusive and high-performance workplace that supports continuous development, prepares employees for an AI-enabled future and empowers people to do their best work every day.
How investing in our people creates value
Engaged, healthy and future-ready teams drive service quality, innovation and operational resilience. By investing in skills development, wellbeing and leadership, we help strengthen productivity, reduce risk, support retention and build the capabilities needed to adapt in a rapidly evolving business and technology environment.
Activities and outcomes
| • | Health and safety: Our team is supported by enhanced safety awareness and engagement, refreshed training approaches that emphasize real-world application and increased leadership presence in the field. Together, these actions help embed safety into day-to-day operations and support more proactive risk management across the organization. |
| • | Mental health and total wellbeing: We promote wellbeing through inclusive benefits, unlimited mental health coverage, Employee and Family Assistance Program (EFAP) access and evidence-based training. Leadership programs and ongoing monitoring of psychosocial risk indicators encourage a psychologically safe and supportive workplace. |
| • | Skills development and AI readiness: As our business evolves, we are reshaping how we build skills through agile, just-in-time learning, digital platforms, certifications, mentorship and on-the-job experience. Team members have access to AI literacy and productivity learning pathways, enabling confident adoption of AI tools and more efficient ways of working. |
| • | Leadership, engagement and inclusion: Investment in leadership development, recognition programs and regular engagement surveys supports alignment, accountability and continuous improvement. Inclusive recruitment practices, accessibility training and employee-led networks foster belonging, while clear career pathways and early-career programs support growth, retention and the development of future leaders. |
Together, these actions help build a resilient, skilled and engaged workforce equipped to deliver strong performance today and adapt for the future.
Key metrics
| 2023 | 2024 | 2025 | ||||||||||
| Overall team member engagement score (1) | 73% | 65% | 65% | |||||||||
| People leaders who completed mandatory base training on mental health (2) | 94% | 93% | 96% | |||||||||
| (1) | The KPI is the average engagement score from the 2025 Bell Team Survey, conducted from September 23 to October 9, 2025. It reflects the percentage of employees who responded favourably (“Strongly Agree” or “Agree”) to four engagement questions identified by Bell’s Employee Listening team as key measures of engagement. The survey was designed by the Employee Listening team and administered by a third-party vendor specializing in employee satisfaction surveys. This metric includes active regular employees as of August 31, 2025, with more than three months’ tenure, a valid business email, and access to the survey platform. It excludes interns, students, employees on extended leave, and retirees |
| (2) | This KPI is calculated as the percentage of total current people leaders (having a minimum of one direct report) and senior leaders (director level and above) who have completed the Mental Health Core training (the first training course in the Workplace Mental Health Leadership certificate program). This metric includes full time employees that have access to Career Zone. |
| BCE INC. 2025 ANNUAL FINANCIAL REPORT | 27 |
1 MD&A Overview
Our financial resources
The financial resources of the company are addressed throughout this MD&A. In addition, in 2022 and 2023, we added sustainability-linked pricing to our committed credit facilities, to our securitization program and to certain derivatives, introducing price adjustments based on our performance of certain sustainability performance targets.
Assumptions
GHG emissions reduction and supplier engagement targets
Our GHG emissions reduction and supplier engagement targets are based on a number of assumptions including, without limitation, the following principal assumptions:
| • | Our ability to purchase a significant amount of renewable energy certificates (RECs) to reduce our GHG emissions |
| • | No significant increase in electricity grid emissions intensity over which we have no control |
| • | Anticipated GHG emissions from current and proposed Bell AI Fabric data centres are excluded from our near-term science-based targets |
| • | No new corporate initiatives, business acquisitions, business divestitures or technologies that would materially change our anticipated levels of GHG emissions. In particular, our GHG emissions reduction targets assume that the acquisition of Ziply Fiber, and the pending disposition of Northwestel, will not materially change our anticipated levels of GHG emissions. |
| • | Sufficient supplier engagement and collaboration in setting their own science-based targets |
| • | The successful and timely implementation of various corporate and business initiatives to reduce our electricity and fuel consumption, as well as reduce other direct and indirect GHG emissions enablers |
| • | Availability of sufficient funds to be allocated to the implementation of initiatives to reduce our electricity and fuel consumption |
| • | No significant cost increase in solutions and initiatives identified to be implemented to achieve our targets |
| • | No negative impact on the calculation of our GHG emissions from refinements in or modifications to international standards or the methodology we use for the calculation of such GHG emissions |
| • | No required changes to our science-based targets pursuant to the Science Based Target initiative (SBTi) methodology that would make the achievement of our science-based targets, as updated from time to time, more onerous or unachievable in light of business requirements |
| • | No significant change in the allocation of our spend by supplier and sufficient engagement and collaboration from the other participants across our whole value chain in reducing their own GHG emissions |
Explanation of certain climate-related terms, metrics and targets
Scope 1, 2 and 3 GHG emissions
Scope 1 emissions are direct GHG emissions from sources that are controlled by Bell and are associated with fuel consumed by fleet vehicles, buildings, telecommunication towers and generators. Scope 2 emissions are indirect GHG emissions, and are associated with the consumption of purchased electricity, heating/cooling and steam required by Bell’s activities. We use market-based GHG accounting (emission factors are specified within the contractual agreements with the applicable supplier) to evaluate our GHG targets. Scope 1 and 2 (market-based) emissions are sometimes collectively referred to in this MD&A as “operational emissions”. Scope 3 emissions cover all indirect emissions (not included in scope 2) that occur in our value chain, including both upstream and downstream emissions. GHG emissions from scope 3 occur from sources owned or controlled by other entities in Bell’s value chain (such as our suppliers, employees and customers). As a result, measuring scope 3 emissions is more complex than measuring scope 1 and scope 2 emissions, for which we are able to obtain primary data (such as liters of fuel consumed within our vehicle fleet and kilowatt-hours of electricity consumed within our buildings). For scope 3 categories for which primary data is not available, we have to rely on secondary data (such as financial data and industry-average data from published databases). The complexity of this data collection contributes to uncertainty in scope 3 emissions measurement. Scope 3 emissions represent the majority of BCE’s GHG emissions.
Science-based targets
Science-based targets provide a clearly-defined pathway to reduce GHG emissions. Targets are considered ‘science-based’ if they are in line with what the latest climate science deems necessary to meet the goals of the Paris Agreement, limiting global warming to 1.5°C above pre-industrial levels. The SBTi brings together a team of experts to provide companies with independent assessment and validation of targets.
Net zero target
Net-zero refers to the state in which an organization reduces GHG emissions in its entire value chain (i.e., scope 1, 2 and 3 GHG emissions) to as close to zero as possible (with a minimum reduction of at least 90%) and neutralizes (1) any remaining emissions such that its net global GHG emissions balance to zero. As of March 2026, BCE does not have a net-zero target.
| (1) | According to SBTi, neutralize means that carbon is removed from the atmosphere and permanently stored in geological, terrestrial, or ocean reservoirs, or in products. |
| 28 | BCE INC. 2025 ANNUAL FINANCIAL REPORT |
2 MD&A Strategic priorities
| 2 | Strategic priorities |
Our success is built on the BCE team’s dedicated execution of a clear strategy anchored in our purpose to advance how people connect with each other and the world. Our strategy is guided by four strategic priorities that focus on strengthening customer experience, improving operational efficiency and supporting long-term value creation, while leveraging our unique and differentiated assets across fibre, wireless, enterprise and media.
This section contains forward-looking statements, including statements relating to BCE’s network deployment plans in Canada and the U.S. and the benefits expected to result therefrom; BCE’s network reliability target; the launch of Unbreakable Internet in 2026; the successful development and implementation of AI solutions, either by us or pursuant to certain partnerships entered into by BCE, as well as the responsible development and use of AI; and our objectives, plans and strategic priorities. Refer to the section Caution regarding forward-looking statements at the beginning of this MD&A.
| 2.1 | Put the customer first |
|
|
Deliver simple, seamless and personalized experiences powered by data and AI to deliver service excellence, deepen relationships, reduce churn and increase lifetime value. |
2025 progress
| • | Improved wireless postpaid mobile phone churn (1) by 11 basis points in 2025, supported by year-over-year improvement achieved for three consecutive quarters through enhanced customer service and retention initiatives |
| • | Launched differentiated wireless plan tiers based on class of service, content and handset financing, providing customers with greater choice while supporting disciplined pricing and subscriber mix management |
| • | Expanded no name mobile prepaid distribution to all Maxi locations across Québec, extending access to affordable wireless services and strengthening Bell’s value-segment reach through a trusted retail partner |
| • | Our AI-powered virtual assistant handled approximately 15 million customer interactions in 2025, resolving more than half without the need for a live agent while providing 24/7 bilingual support |
| • | Began the rollout of a new AI-powered voice virtual assistant across Bell, Virgin Plus and Lucky Mobile to improve customer interactions, accelerate issue resolution and enhance the overall service experience |
| • | Achieved the lowest share of customer complaints among the three largest national telecom service providers, according to the 2024–2025 Annual Report of the CCTS |
2026 focus
| • | Continue expanding our AI-powered service capabilities with the rollout of a voice-enabled virtual assistant powered by generative AI, designed to further simplify how customers navigate services and access information |
| • | Scale AI-powered customer care and network automation capabilities to support improved service quality and operational efficiency |
| • | Enhance customer satisfaction through continued modernization of customer platforms, expanded use of AI-enabled service tools, and more seamless digital and human interactions |
| • | Strengthen privacy and information security by advancing governance, security controls and privacy-by-design practices to protect customer information and support trusted digital services |
| • | Advance accessibility initiatives through the next phase of Bell’s 2026 Accessibility Plan |
| 2.2 | Deliver the best fibre and wireless networks |
|
|
Deliver fast, reliable and resilient connectivity across Canada and the Pacific Northwest of the U.S. with leadership in fibre and 5G innovation. |
2025 progress
| • | Completed the acquisition of Ziply Fiber, the leading fibre Internet provider in the Pacific Northwest of the U.S., significantly expanding Bell’s fibre footprint and strengthening our position as the third-largest fibre Internet provider in North America |
| • | Formed Network FiberCo, a long-term strategic partnership designed to accelerate the development of fibre infrastructure through Ziply Fiber in underserved markets in the U.S., supporting scalable and capital-efficient network expansion |
| • | Continued to expand our FTTP network in Canada to more homes and businesses, reaching approximately 8 million locations at the end of 2025 and enabling multi-gigabit symmetrical Internet speeds that deliver superior performance compared to cable-based networks |
| • | Added 199,767 net retail fibre Internet subscribers in 2025, including the contribution from Ziply Fiber |
| (1) | Mobile phone churn is defined as the rate at which existing mobile phone subscribers cancel their services. Refer to section 11.6, KPIs in this MD&A for more information on this measure. |
| BCE INC. 2025 ANNUAL FINANCIAL REPORT | 29 |
2 MD&A Strategic priorities
| • | Bell Pure Fibre was ranked Canada’s fastest Internet in Ookla’s Q3-Q4 2025 Speedtest Awards report (1) and also received Best Internet, Best Internet Service Provider Gaming Experience and Top-Rated Internet honours (1) |
| • | Bell 5G was recognized as Canada’s Fastest and Best 5G wireless network, Best 5G Gaming Experience, Fastest Mobile Network and Best Mobile Gaming Experience in Ookla’s Q3-Q4 2025 Speedtest Awards report (1) |
| • | Expanded our 5G wireless network to reach 89% of Canada’s population |
| • | Expanded 5G+ service coverage, leveraging 3500 MHz and 3800 MHz spectrum, to reach 65% of Canada’s population |
| • | Added 214,551 total net postpaid and prepaid mobile phone subscribers in 2025, bringing Bell’s mobile phone customer base to 10,451,584 at December 31, 2025 |
| • | Announced a strategic partnership with AST SpaceMobile to advance space-based direct-to-cell connectivity, supporting future wireless coverage expansion in remote and underserved areas |
| • | Launched Wi-Fi 7 with the introduction of Giga Hub 2.0, delivering faster speeds, lower latency and improved in-home connectivity to support increasingly data-intensive applications and connected devices |
| • | Launched hardware-free Fibe TV, enabling customers in Ontario and Québec to access live and on-demand content on compatible smart TVs and streaming devices without the need for STBs, simplifying installation, reducing complexity, and supporting a scalable, capital-efficient service model |
| • | Launched Bell Streaming bundles, combining premium streaming services including Crave, Netflix and Disney+ into a single subscription with simplified billing, enhancing flexibility, value and ease of management within Bell’s TV and connectivity ecosystem |
2026 focus
| • | Expand Bell Internet availability in Alberta and British Columbia (B.C.) |
| • | Support fibre growth in the U.S. through Ziply Fiber, building long-term scale in the Pacific Northwest |
| • | Expand 5G and 5G+ availability and advance wireless network densification to enhance capacity, performance and reliability |
| • | Scale next-generation network capabilities, including Cloud radio access network (RAN), AI-based network automation and the deployment of new spectrum |
| • | Maintain a strong focus on network resiliency, with a target of delivering network reliability above 99.99% |
| • | Launch the Unbreakable Internet service proposition, leveraging Bell’s fibre and wireless networks to enhance Internet resiliency and support more reliable, always-connected customer experiences |
| • | Advance plans for satellite-enabled direct-to-cell services |
| • | Progress the decommissioning of legacy technologies, including the continued decommissioning of copper infrastructure and the wind-down of the 3G wireless network |
| 2.3 | Lead in enterprise with AI-powered solutions |
|
|
Enable businesses and governments to accelerate digital transformation with secure, scalable cloud, AI, cybersecurity, IoT and managed services that improve efficiency and competitiveness. |
2025 progress
| • | Introduced the Ateko brand, unifying Bell’s technology services capabilities into a single systems integration and managed services platform focused on AI automation and cloud solutions for enterprise customers |
| • | Launched the Bell Cyber brand, unifying Bell’s cybersecurity capabilities into a single, integrated platform to deliver end-to-end, AI-enabled security solutions for enterprise and public sector customers |
| • | Launched Bell AI Fabric, a full-stack sovereign AI platform providing secure, scalable, Canadian-controlled compute, data and network infrastructure to support AI workloads and data-intensive applications for enterprise and public sector customers |
| • | Delivered strong growth in AI-powered solutions revenues in 2025, reflecting increased enterprise demand across Ateko, Bell Cyber and Bell AI Fabric, and demonstrating continued momentum in Bell’s enterprise strategy |
| • | Acquired SDK Tek, a Calgary-headquartered data engineering and analytics provider, strengthening Bell’s AI data and analytics capabilities and enhancing our ability to deliver enterprise AI-powered solutions across advanced analytics platforms |
| • | Announced a strategic partnership with Cohere, a Canadian enterprise AI company, to support the delivery of secure, sovereign AI solutions by integrating Cohere’s large language models (LLMs) within Bell AI Fabric for enterprise and public sector customers |
| • | Announced strategic collaborations with leading Canadian universities, including Simon Fraser University and Queen’s University, to advance Canadian-controlled, sovereign AI supercomputing infrastructure and expand research, enterprise and public sector AI capabilities as part of Bell AI Fabric |
| (1) | As awarded by Ookla®, a global leader in fixed and mobile network testing and analysis, in their Speedtest AwardsTM. Based on Ookla® Speedtest Intelligence® data, 2H 2025. All rights reserved. |
| 30 | BCE INC. 2025 ANNUAL FINANCIAL REPORT |
2 MD&A Strategic priorities
2026 focus
| • | Scale Bell AI Fabric capacity across Canada to support growing enterprise and public sector demand for secure, sovereign AI compute and data-intensive workloads |
| • | Expand Ateko’s cloud, automation and workforce transformation services to deepen enterprise adoption of AI-enabled platforms and accelerate customer outcomes |
| • | Grow Bell Cyber’s managed security and threat intelligence offerings to address increasing cybersecurity requirements across enterprise and government customers |
| • | Support federal and provincial digital government modernization initiatives through integrated connectivity, cloud, cybersecurity and AI-enabled solutions |
| • | Advance private 5G and edge-compute deployments to enable AI-driven use cases across industrial, logistics, utilities and public sector environments |
| • | Strengthen sovereign AI capabilities through partnerships with Canadian AI leaders, including Cohere, BUZZ High Performance Computing (BUZZ HPC), Coveo and others, to expand the Bell AI ecosystem |
| • | Help enterprise and public sector customers develop and implement responsible AI governance frameworks to support secure, compliant and trusted AI adoption |
| 2.4 | Build a digital media and content powerhouse |
|
|
Engage audiences across platforms with trusted news, entertainment, sports and streaming experiences, supported by data-driven advertising and original content. |
2025 progress
| • | Grew Crave’s total subscriber base to 4.6 million in 2025, representing a 26% increase year over year, reflecting strong consumer demand for Bell’s premium streaming content and platform offering |
| • | Completed the largest expansion of the Crave platform in its history in 2025, increasing the content portfolio by 30% through the integration of live programming from CTV and Noovo, including news, select sports and entertainment events, and an enhanced kids’ content offering, supported by significant user experience (UX) improvements |
| • | Delivered record viewership on the Crave platform in 2025, with the year representing the most-watched in Crave’s streaming history for hours viewed |
| • | Delivered strong momentum for Crave Original programming in 2025, with Heated Rivalry achieving significant global traction, supported by international distribution and an early renewal for a second season |
| • | CTV remained Canada’s most-watched TV network in primetime for the 24th consecutive year among viewers A25-54 |
| • | Strengthened Bell Media’s long-term sports content strategy through its extended regional broadcast partnership with the Montréal Canadiens, securing premium live National Hockey League (NHL) programming across TSN, RDS and digital platforms |
| • | Extended Bell Media’s long-term regional broadcast rights with the Winnipeg Jets, securing continued access to live NHL programming across TSN and digital platforms |
| • | Launched new Disney+, Crave and TSN streaming bundles, expanding Bell Media’s bundled streaming distribution strategy and providing consumers with greater choice and value across premium entertainment and live sports content |
| • | Extended Bell Media’s long-term exclusive partnership with iHeartMedia, securing Canadian representation of iHeartRadio’s podcast portfolio and expanding audio and digital advertising opportunities across iHeartRadio Canada and Bell Media platforms |
| • | Entered into a long-term strategic ad sales and distribution partnership with Tubi, expanding the availability of Canadian content from Bell Media’s on-demand catalogue and FAST channel lineup, while creating new digital advertising opportunities |
| • | Advanced Bell Media’s global content distribution strategy through its majority ownership of Sphere Abacus, establishing Sphere Abacus as the primary international distributor of Bell Media’s owned distribution rights and expanding the global reach of Canadian content and creators through international sales and monetization |
2026 focus
| • | Scale Crave, TSN and RDS streaming services through expanded distribution, optimized content offerings and continued platform and UX enhancements, supporting growth in direct-to-consumer (DTC) and bundled subscriptions |
| • | Advance Bell Media’s digital-first media strategy by growing digital revenues, (1) increasing DTC subscribers, and scaling digital growth in the OOH business |
| • | Grow advertising revenue and expand market share by continuing to scale Connected TV, FAST and Dynamic Audio Ad Insertion (DAAI), and by enhancing data-driven advertising capabilities to deliver more precise targeting, measurement and attribution across linear and digital platforms |
| • | Strengthen Canadian storytelling and audience engagement, including continued investment in original French-language content and a focus on digital platforms such as Crave, Noovo.ca and iHeartRadio Canada to deliver more personalized experiences for French-language audiences |
| • | Optimize partnerships and strategic content investments to monetize content rights and Bell Media properties across all platforms and distribution channels |
| • | Expand global content distribution through Sphere Abacus, extending the international reach and monetization of Bell Media-owned and third-party content |
| (1) | Digital revenues are comprised of advertising revenue from digital platforms including web sites, mobile apps, ad-supported subscription tiers on Crave, connected TV apps and OOH digital assets/platforms, as well as advertising procured through Bell digital buying platforms and subscription revenue from DTC services and video on demand (VOD) services. |
| BCE INC. 2025 ANNUAL FINANCIAL REPORT | 31 |
3 MD&A Performance targets, outlook, assumptions and risks
| 3 | Performance targets, outlook, assumptions and risks |
This section provides information pertaining to our performance against 2025 targets,(1) (2) our consolidated business outlook and operating assumptions for 2025 and our principal business risks.
| 3.1 | BCE 2025 performance |
| Financial measure | 2025 target | 2025 performance and results | ||||
| Revenue growth Adjusted net earnings per share (adjusted EPS) (3) growth |
0% to 2% | 0.2% | BCE revenues increased by 0.2% in 2025, compared to 2024, driven by higher service revenues of 0.6%, partly offset by lower product revenues of 2.2%. This reflected greater revenues from Bell CTS, attributable to our new Bell CTS U.S. segment as a result of the acquisition of Ziply Fiber on August 1, 2025, partly offset by lower Bell CTS Canada revenues, along with a modest increase in Bell Media revenues. | |||
| Adjusted EBITDA growth | 0% to 2% | 0.7% | BCE adjusted EBITDA grew by 0.7% in 2025, compared to 2024, due to higher operating revenues and lower operating costs. The growth was attributable to Bell CTS driven by Bell CTS U.S. as a result of the acquisition of Ziply Fiber, partly offset by a reduction in Bell CTS Canada, along with a higher contribution from our Bell Media segment. | |||
| Net earnings growth | No target provided |
n.m. | In 2025, net earnings increased by $6,139 million, compared to 2024, mainly due to higher net gains on investments resulting from the sale of our minority stake in MLSE, lower impairment of assets primarily in our Bell Media segment as well as higher other income, partly offset by higher income taxes and higher depreciation and amortization. | |||
| Capital intensity (3) | Approx. 15% | 15.1% | BCE capital expenditures of $3,700 million in 2025, declined by $197 million compared to 2024, along with a corresponding capital intensity ratio of 15.1%, down 0.9 pts over last year. The year-over-year decline was consistent with a planned reduction in capital spending in Bell CTS Canada, primarily from slower FTTP footprint expansion in Canada, partly as a result of regulatory decisions that discourage network investment. The decline in capital spending was partly offset by capital investments in our new Bell CTS U.S. segment as a result of the acquisition of Ziply Fiber. Capital investments were focused on the continued expansion of Ziply Fiber’s FTTP network in the U.S. | |||
| Net earnings per share (EPS) growth | No target provided |
n.m. | Net earnings attributable to common shareholders in 2025 increased by $6,142 million, or $6.61 per common share, compared to 2024, mainly due to higher net gains on investments resulting from the sale of our minority stake in MLSE, lower impairment of assets primarily in our Bell Media segment as well as higher other income, partly offset by higher income taxes and higher depreciation and amortization. | |||
| Adjusted net earnings per share (adjusted EPS) (4) growth | (13%) to (10%) | (7.9%) | Excluding the impact of severance, acquisition and other costs, net mark-to-market gains (losses) on derivatives used to economically hedge equity settled share-based compensation plans, net equity gains (losses) on investments in associates and joint ventures, net gains (losses) on investments, net early debt redemption gains (costs) and impairment of assets, net of tax and non-controlling interest (NCI), adjusted net earnings in 2025 was $2,601 million, or $2.80 per common share, compared to $2,773 million, or $3.04 per common share, in 2024. | |||
| Cash flows from operating activities growth | No target provided |
0.1% | In 2025, BCE’s cash flows from operating activities of $6,993 million increased by $5 million, compared to 2024, mainly due to higher cash from working capital and lower income taxes paid, partly offset by settlements on derivatives used to economically hedge equity settled share-based compensation plans, higher severance and other costs paid and higher interest paid. | |||
| Free cash flow growth | 6% to 11% | 10.0% | Free cash flow of $3,178 million in 2025 increased by $290 million compared to 2024, mainly due to lower capital expenditures. | |||
| Annualized common dividend per share | $1.75 per share |
$1.75 per share |
Annualized dividend per BCE common share for 2025 decreased by $2.24, or 56.1%, to $1.75 compared to $3.99 per share in 2024. | |||
n.m.: not meaningful
| (1) | As announced in a news release issued on May 8, 2025, and available on SEDAR+ at www.sedarplus.ca, we revised our annualized common dividend per share guidance for 2025 downward from $3.99, previously announced on February 6, 2025, to $1.75. All other financial guidance targets remained unchanged at that time. |
| (2) | As announced in a news release issued on August 7, 2025, and available on SEDAR+ at www.sedarplus.ca, we revised our revenue growth, adjusted EBITDA growth, capital intensity, adjusted EPS growth and free cash flow growth guidance targets for 2025, previously announced on February 6, 2025, from ranges of (3%) to 1%, (2%) to 2%, approximately 14%, (13%) to (8%), and 11% to 19%, respectively, to ranges of 0% to 2%, 0% to 2%, approximately 15%, (13%) to (10%) and 6% to 11%, respectively. Annualized common dividend per share guidance remained unchanged at that time. |
| (3) | Capital intensity is defined as capital expenditures divided by operating revenues. Refer to section 11.6, KPIs in this MD&A for more information on this measure. |
| (4) | Adjusted EPS is a non-GAAP ratio. Refer to section 11.2, Non-GAAP ratios in this MD&A for more information on this measure. |
| 32 | BCE INC. 2025 ANNUAL FINANCIAL REPORT |
3 MD&A Performance targets, outlook, assumptions and risks
| 3.2 | Business outlook and assumptions |
This section contains forward-looking statements, including statements relating to our business outlook, our goal of $1.5 billion in cost savings by 2028 and the benefits expected to result therefrom, and our plans and strategic priorities. Refer to the section Caution regarding forward-looking statements at the beginning of this MD&A.
2026 outlook
BCE’s outlook for 2026 reflects execution against the three-year strategic and financial framework presented at our 2025 Investor Day. As the first year of this framework, the outlook is focused on scaling our core growth engines of fibre, wireless, AI-powered solutions and digital media, strengthening financial performance and maintaining disciplined capital allocation, while managing declines in higher-margin legacy services.
BCE expects to continue funding strategic growth initiatives while benefiting from efficiencies associated with prior network investments that reduce ongoing run-the-business capital requirements and provide increased flexibility to allocate capital toward higher-return opportunities.
BCE remains focused on transformation initiatives and operating efficiencies across the organization and continues to expect to deliver $1.5 billion in cost savings by 2028, which are expected to help mitigate the impact of legacy revenue declines.
Assumptions
Assumptions about the Canadian economy
Considerable uncertainty remains around the impact of U.S. trade policy on the Canadian economy. We have assumed:
| • | Modest economic growth, given the Bank of Canada’s most recent estimated growth in Canadian gross domestic product of 1.1% in 2026, representing a decrease from 1.7% in 2025 |
| • | Low population growth driven by government policies designed to reduce the inflow of newcomers |
| • | Modest growth in consumer spending supported by past interest rate cuts and higher equity prices |
| • | Soft growth in business investment, particularly in sectors most reliant on U.S. markets |
| • | Relatively stable level of consumer price index (CPI) inflation |
| • | Ongoing labour market softness |
| • | Interest rates expected to remain at or near current levels |
| • | Canadian dollar expected to remain near current levels. Further movements may be impacted by the degree of strength of the U.S. dollar, interest rates and changes in commodity prices. |
Assumptions about the U.S. economy
| • | Slowdown in consumer spending, offset by business investment |
| • | Ongoing uncertainty surrounding trade policy |
| • | Stable CPI inflation |
Canadian market assumptions
| • | A moderated level of wireless competition and sustained level of wireline competition in consumer markets |
| • | Higher, but slowing, wireless industry penetration |
| • | A shrinking data and voice connectivity market as business customers migrate to lower-priced telecommunications solutions or alternative OTT competitors |
| • | The advertising market is shifting towards digital platforms and most legacy Canadian TV and radio platforms are expecting impacts from flat to declining audiences |
| • | Increasing competition from the continued rollout of subscription video on demand (SVOD) streaming services together with further scaling of OTT aggregators is expected to result in further declines in broadcasting distribution undertaking (BDU) subscribers |
U.S. market assumptions
| • | A higher level of wireline pricing competition in consumer, business and wholesale markets |
| • | Increased demand for colocation and data centre connectivity services |
| • | A shrinking traditional voice services market as customers migrate to wireless or VoIP offerings |
Assumptions underlying expected continuing contribution holiday in 2026 in the majority of our pension plans
| • | At the relevant time, our defined benefit (DB) pension plans will remain in funded positions with going concern surpluses and maintain solvency ratios that exceed the minimum legal requirements for a contribution holiday to be taken for applicable DB and defined contribution (DC) components |
| • | No significant declines in our DB pension plans’ financial position due to declines in investment returns or interest rates |
| • | No material experience losses from other events such as through litigation or changes in laws, regulations or actuarial standards |
| BCE INC. 2025 ANNUAL FINANCIAL REPORT | 33 |
3 MD&A Performance targets, outlook, assumptions and risks
| 3.3 | Principal business risks |
Provided below is a summary description of certain of our principal business risks that could have a material adverse effect on all of our segments. Certain additional business segment-specific risks are reported in section 5, Business segment analysis. For a detailed description of the principal risks relating to our regulatory environment and of the other principal business risks that could have a material adverse effect on our business, financial condition, liquidity, financial results or reputation, refer to section 8, Regulatory environment, and section 9, Business risks, respectively.
General economic conditions and geopolitical events
Our business and financial results could be negatively affected by adverse economic conditions, including the continuation or escalation of trade wars and recessions. U.S. tariffs and the unpredictability of future trade arrangements could significantly affect economic growth, customer spending and confidence, inflation, and the value of the Canadian dollar. Given the high degree of uncertainty around the duration and extent of U.S. tariffs, it is difficult to predict how the effects
may impact the economy and our business. The global economic environment could further exacerbate pre-existing risk factors, including those described in this MD&A, in light of modest Canadian economic growth, reductions in immigration levels, high housing support costs relative to income, and financial and capital market volatility. All of these could negatively affect our business and financial results, including by adversely affecting customer spending, the resulting demand for our products and services, our customers’ financial condition, and the cost and amount of funding available in the financial markets.
Furthermore, risk factors could be exacerbated, or become more likely to materialize, as a result of geopolitical events, which could have an adverse impact on our business and financial results and related assumptions, the extent of which is difficult to predict. Geopolitical events could adversely impact the global economy and cause financial and capital market volatility, broader geopolitical instability and armed conflicts, higher energy prices, inflationary pressures limiting consumer and business spending and increasing our operating costs, disruptions in our supply chains, and increased information security threats.
Competitive environment
Competitive activity in our industry is intense and competitive dynamics are evolving, contributing to disruptions in each of our business segments
Our market landscape is being reshaped by changing macroeconomic and regulatory environments, increasing global and national competition, and evolving customer preferences. As our business evolves and technological advances drive new services, delivery models, and strategic partnerships, our competitive landscape continues to intensify and expand to include new and emerging competitors – certain of which were historically our partners or suppliers – as well as global-scale competitors, including, in particular, cloud and OTT service providers, data centres, IoT hardware and software security providers, VoIP providers, and other web-based and satellite-based players that are penetrating the communications space with significant resources and a large customer base over which to amortize costs. Certain of these competitors are changing the competitive landscape by establishing a material market presence, which has accelerated in recent years, and continues to evolve rapidly particularly as AI technology adoption accelerates. Established competitors further seek to consolidate or expand their product offerings through acquisitions in order to increase scale and market opportunities in light of these changes in market dynamics. Failure to effectively respond to such evolving competitive dynamics could adversely affect our business and financial results.
Technological advancements, IP networks, and recent regulatory decisions, in particular, continue to facilitate entry in our industry. In addition, the effects of government policies that result in the acquisition of spectrum at favourable pricing by regional facilities-based wireless service providers distort market dynamics. These factors have changed industry economics and allowed competitors to launch new products and services and gain market share with far less investment than has historically been required. In particular, with CRTC decisions mandating wholesale rates for wireline Internet and mobile virtual
network operator (MVNO) access, competitors can deliver their services over our networks, leveraging regulatory obligations applicable to us, thereby limiting their need to invest in building their own networks and impacting the network-based differentiation of our services and our ability to earn an appropriate return on investment in our networks. Such lower required investment by competitors, and the impact on our return on investment, challenges the monetization of our networks and our operating model. Moreover, foreign OTT players are currently not subject to the same Canadian content investment obligations as those imposed on Canadian domestic digital suppliers, which provides them with a competitive advantage over us.
If we are unable to develop and deploy new solutions in advance of, or concurrently with, our competitors, if the market does not adopt these new technologies in pace with our deployment of new solutions, or if we fail to adequately assess and manage the risks associated with these new solutions, our business and financial results could be adversely affected.
We expect these trends to continue in the future, and the increased competition we face as a result could negatively impact our business including, without limitation, in the following ways:
| • | Competitors’ aggressive market offers, combined with heightened customer sensitivity around pricing, could lead to pricing pressures, lower margins and increased costs of customer acquisition and retention, and our market share and sales volumes could decrease if we do not match competitors’ pricing levels or increase customer acquisition and retention spending |
| • | Adverse economic conditions, lower immigration levels, high interest rates and elevated inflation, adverse conditions in the financial markets, or a declining level of retail and commercial activity, could have a negative impact on the demand for, and prices of, our products and services, and improve the competitive position of lower-cost providers |
| 34 | BCE INC. 2025 ANNUAL FINANCIAL REPORT |
3 MD&A Performance targets, outlook, assumptions and risks
| • | CRTC decisions regarding wholesale access to our wireless and fibre networks could facilitate entry of new competitors, including OTT players, strengthen the market position of current competitors, or encourage existing competitors to expand beyond their traditional footprint, which may negatively impact our retail subscriber base in favour of lower-margin wholesale subscribers and thus could negatively impact our capacity to optimize scale and invest in our networks |
| • | The acceleration of disruptions and disintermediation in each of our business segments, due to technological advancements and affordability, could adversely affect our business and financial results |
| • | Should our value proposition on pricing, network, speed, service, or features not be considered sufficient for customers in light of available alternatives, or should our products and services not be provided over customers’ preferred delivery channels, this could lead to increased churn and slowing revenue growth |
| • | Increased embedded SIM (eSIM) adoption makes it easier for customers to change service providers and has the potential to upend existing distribution models, including negatively impacting roaming revenue |
| • | The shift to online transactions and digital self-serve could cause a reduction in in-store traffic, which could adversely impact our ability to leverage our extensive retail network to increase the number of subscribers and sell our products and services |
| • | The convergence of wireline and wireless services is impacting product purchase choice by customers and could increase product substitution in favour of lower-margin products as well as increase churn. These trends are expected to increase with the continued adoption of 5G and 5G+. |
| • | The extent and timely rollout of fibre networks and 5G and 5G+ mobile services may be adversely impacted by government and regulatory decisions, constraints on access to and price of network equipment, labour shortages, and potential operational challenges in delivering new technology |
| • | Cloud-based and OTT-based substitution, and the market expansion of lower-cost VoIP, collaboration, and software-defined networking in a wide area network (SD WAN) solutions offered by local and global competitors, such as traditional software players, are changing our approach to service offerings and pricing and could have an adverse effect on our business |
| • | The launch by competitors of low earth orbit (LEO) satellites, as well as partnerships between telcos and LEO satellite connectivity providers, and between governments and LEO satellite connectivity providers to provide connectivity, including in rural areas and in Northern Canada, continues to intensify competition, which could adversely affect our network deployment strategy in such areas and negatively impact demand for our connectivity services. The ability of our subsidiary Northwestel, operating in Canada’s North, to respond to the competitive threat from these providers is further hampered by CRTC retail Internet regulations. |
| • | Increased insolvency, spending rationalization, and consolidation by business customers could lead to further disruptions in our Bell CTS Canada and Bell CTS U.S. segments, driven by technology substitution, economic factors, and customers’ operational efficiencies |
| • | The pressure from simpler, lower-cost, agile service models is driving in-sourcing trends, which could have an adverse impact on our managed services business |
| • | Greater customer adoption of services like 5G, as well as IoT services and applications in the areas of retail, business, transportation, and urban city optimization, combined with the increased use of AI, is expected to accelerate competition in these areas |
| • | Subscriber and viewer growth and retention are challenged by changing viewer habits, optionality, higher costs for consumers and content providers, as well as the expansion and continued market penetration of global scale low-cost OTT content providers, OTT aggregators, and other alternative service providers, some of which may offer content and platforms as loss leaders to support their core business, as well as account stacking, CRTC arbitration, and a fragmentation of audiences due to an abundance of choices |
| • | Competition, with both global competitors and traditional Canadian TV competitors, for programming content could drive significant increases in content acquisition and development costs, as well as reduced access to key content as some competitors withhold content to enhance their OTT service offering |
| • | The proliferation of content piracy could negatively impact our ability to monetize products and services beyond our current expectations, while creating bandwidth pressure without corresponding revenue growth in the context of regulated wholesale high-speed Internet access rates |
| • | Our ability to grow digital and other alternative advertising revenue, in the context of a changing and fragmented advertising market, is being challenged by global-scale players |
| • | Traditional radio faces accelerated substitution from new music players and alternative streaming services such as those offered by global audio streaming players and those made available by new technologies, including smart car services |
| • | An increase in the number of competitors in the AI data centre provider market could have a material effect on our business, including, but not limited to, creating challenges in the allocation of adequate power resources for future developments, and creating downward pressure on our pricing and margins |
| • | Competition from both global and domestic system integrators driving pricing pressure across the industry |
Similarly to Canada, the U.S. market in which Ziply Fiber operates is highly competitive, rapidly evolving and fragmented, and subject to changing technology, shifting customer needs and frequent introductions of new products and services. Customers have alternatives in obtaining products and services from other providers, including competitive local exchange carriers, local telephone companies, Internet service providers, wireless companies, satellite companies, VoIP providers and cable companies. Some of these competitors may have market presence, engineering, technical and marketing capabilities and financial, personnel and other resources, in each case greater than those of Ziply Fiber. Additionally, some of Ziply Fiber’s competitors offer wireless services which may place them at a competitive advantage to Ziply Fiber as a result of their ability to offer bundled services and discounts. Our ability to innovate our own technology may also affect our ability to compete. Ziply Fiber’s ability to compete successfully may be affected by various competitive factors affecting the U.S. industry, including a changing regulatory environment that may affect our business and that of our competitors differently. Refer to section 8.2, U.S. regulatory environment, of this MD&A for more details. Loss of customers due to competition or renewal of customer agreements at lower rates could have a material adverse effect on Ziply Fiber’s business and consequently, adversely affect our financial performance. For a further discussion of our competitive environment and related risks, as well as a list of our main competitors, on a segmented basis, refer to Competitive landscape and industry trends and Principal business risks in section 5, Business segment analysis.
| BCE INC. 2025 ANNUAL FINANCIAL REPORT | 35 |
3 MD&A Performance targets, outlook, assumptions and risks
Regulatory environment and compliance
Our regulatory environment influences our strategies, and adverse governmental or regulatory decisions could have negative financial, operational, reputational or competitive consequences for our business
In Canada, although most of our retail services are not price-regulated, government agencies and departments such as the CRTC, Innovation, Science and Economic Development Canada (ISED), Canadian Heritage, and the Competition Bureau continue to play a significant role in regulatory matters, including establishing and modifying regulations for mandatory access to networks, spectrum auctions, the imposition of consumer-related codes of conduct, approval of acquisitions, broadcast and spectrum licensing, foreign ownership requirements, privacy and cybersecurity obligations, online streaming and digital services regulations, and control of copyright piracy. As with all regulated organizations, strategies are contingent upon regulatory decisions. Adverse decisions by governments or regulatory agencies, increased regulation, lack of effective anti-piracy remedies, intermittent policies, or reluctance to effectively regulate global-scale players in the broadcasting business could have negative financial, operational, reputational, or competitive consequences for our business.
Regulatory frameworks governing AI are evolving rapidly across the jurisdictions in which we operate. Governmental and regulatory bodies are introducing, or are expected to introduce, new rules addressing data privacy, algorithmic transparency, model training, safety testing, liability allocation, and the permissible use of automated decision-making systems. These emerging requirements may impose substantial compliance obligations on AI developers and operators. Non-compliance with current or future AI regulations could subject us to penalties, enforcement actions, and reputational harm.
In the U.S., some of the services we offer through Ziply Fiber are subject to extensive regulation from U.S. federal, state, and local authorities, including the Federal Communications Commission (FCC) and state regulatory agencies. As a result, Ziply Fiber faces numerous risks that may have a material adverse effect on its business and operations and, consequently, adversely affect our financial performance.
For a discussion of our regulatory environment in both Canada and the U.S., and the principal risks related thereto, refer to section 8, Regulatory environment, as well as the segment discussion under Principal business risks in section 5.1, Bell CTS.
Failure to proactively address our legal and regulatory obligations, and our involvement in various claims and legal proceedings, could have an adverse effect on our business, financial performance and reputation
Changes in laws or regulations, or in how they are interpreted, and the adoption of new laws or regulations, as well as pending or future litigation, could have an adverse effect on our business, financial performance, and reputation. The increase in laws and regulations around customer interactions, along with the technological evolution of our business, further create an environment of complex compliance requirements that must be adequately managed. Failure to monitor and comply with legal or regulatory obligations applicable to us could expose us to litigation, significant fines and penalties, and operational restrictions, as well as result in reputational harm. Heightened focus on consumer protection through legislation, regulatory consumer codes, as well as increased legal and regulatory pressure in the areas of privacy, accessibility, data and AI governance, cybersecurity, and other sustainability topics, require that we build and operationalize enhanced compliance frameworks and could further increase the company’s exposure to investigations, litigation, sanctions, fines, and reputational harm.
We become involved in various claims and legal proceedings as part of our business. For a description of important legal proceedings involving us, please see the section entitled Legal proceedings contained in the BCE 2025 AIF.
| 36 | BCE INC. 2025 ANNUAL FINANCIAL REPORT |
3 MD&A Performance targets, outlook, assumptions and risks
Security management and data governance
Our operations, service performance, reputation and business continuity depend on how well we protect our assets, including from information security threats
Our operations, service performance, reputation, and business continuity depend, in part, on how well we protect our assets and data, including networks, IT systems, offices, corporate stores, and sensitive information, from events such as information security attacks, unauthorized access or entry, fire, natural disasters, extreme weather events linked to climate change, power loss, building cooling loss, acts of war or terrorism, geopolitical conflict, sabotage, vandalism, actions of neighbours, and other events. The protection and effective organization of our systems, applications, and information repositories are central to the secure and continuous operation of our networks and business, as electronic and physical records of proprietary business and personal data, such as confidential customer and employee information, are all sensitive from a market and privacy perspective.
Information security breaches can result from increased adoption of AI tools and a growing number of sophisticated actors, including hackers, ransomware groups, organized criminals, state-sponsored organizations, and other parties. Information security attacks have grown in complexity, magnitude, and frequency in recent years, and are increasingly AI-driven and automated, heightening the potential for damage. Information security attacks may be perpetrated through a complex and evolving array of methods, including stolen credentials, social engineering (with or without deepfakes), computer viruses and other malware, phishing, and other attacks on information systems and networks. Information security attacks aim to achieve various malicious objectives, including unauthorized access to, theft of, and ransomware-driven encryption of confidential, proprietary, sensitive, or personal information, as well as extortion and business disruption.
Increased accessibility and capability of AI present security risks, as criminals and other malicious actors leverage these technologies to automate, scale, and enhance the sophistication of their operations, including developing more potent and evasive malware, automating the discovery of system vulnerabilities, conducting highly personalized and convincing phishing or social engineering attacks (including deepfake audio and video), and optimizing brute-force or credential-stuffing attempts at unprecedented speed and scale; and perpetrating large-scale identity theft, generating synthetic identities, and automating fraudulent transactions.
We are also exposed to information security threats as a result of actions that may be taken by our customers, suppliers, outsourcers, business partners, employees, or independent third parties, whether malicious or not, including as a result of the use of social media, cloud-based solutions, our AI-computing data centres, and IT consumerization. Our use of third-party suppliers and outsourcers, and reliance on business partners, which may similarly be subject to information security threats, also expose us to risks as we have less immediate oversight over their IT domains. Furthermore, the introduction of smartphones, 5G, cloud computing, and the proliferation of data services, including mobile TV, mobile commerce, mobile banking, and IoT applications, as well as increased digitization and the use or misuse of emerging technologies such as AI, robotics and smart contracts leveraging blockchain for digital certification, have significantly increased the threat surface of our networks and systems, resulting in higher complexity that needs to be carefully monitored and managed to minimize security threats. Failure to implement an information security program that efficiently
considers relationships and interactions with business partners, suppliers, customers, employees, and other third parties across all methods of communication, including social media and cloud-based solutions, could adversely affect our ability to successfully defend against information security attacks.
Changes in behaviour over the past years, as well as recent geopolitical events, have further increased our exposure to information security threats. Remote and hybrid work arrangements for our employees and those of our suppliers have increased remote connectivity to our systems and the potential use of unauthorized communications technologies. In addition, we have seen an increase in global criminal activity, including ransomware- and extortion-based attacks targeting critical infrastructure and telecommunications providers, which further strains our information security environment.
If information security threats were to become successful attacks resulting in information security breaches, they could harm our brand, reputation, and competitiveness; decrease customer and investor confidence; and adversely affect our business and financial results, given that they could lead to:
| • | Network operating failures and business disruptions, including those affecting emergency and public safety services, which could negatively impact our ability to sell products and services to our customers and adversely affect their ability to maintain normal business operations and deliver critical services, and/or the ability of third-party suppliers to deliver critical services to us |
| • | Unauthorized access to, and use of, proprietary or sensitive information, which could result in lost revenue, diminished competitive advantages, challenges in retaining or attracting customers after an incident, and loss of future business opportunities |
| • | Theft, loss, leak, destruction, encryption, corruption, unauthorized disclosure, and unauthorized access to, or use of, data and confidential information, including personal information about our customers or employees, that could result in financial loss, exposure to claims for damages by customers, employees and others, fines and/or penalties for non-compliance with applicable privacy legislation, extortion threats due to ransomware, notification and remediation costs, and difficulty in accessing materials to defend legal actions |
| • | Physical damage to network assets impacting service continuity |
| • | Fines and sanctions for failure to meet legislative requirements or from credit card providers for failing to comply with payment card industry data security standards for protection of cardholder data |
| • | Increased fraud as criminals leverage stolen information against our customers, our employees, or our company |
| • | Remediation costs, such as liability for stolen information, or deepfake-enabled impersonation, equipment repair and service recovery, and incentives offered to customers or business partners to maintain relationships after an incident |
| • | Increased information security protection costs, including the costs of deploying additional personnel and protection technologies, training and monitoring employees, implementing robust detection and response capabilities, and engaging third-party security experts and auditors |
| • | Changes in the terms, conditions, and pricing of customer, supplier and financial contracts and agreements that we may have |
| BCE INC. 2025 ANNUAL FINANCIAL REPORT | 37 |
3 MD&A Performance targets, outlook, assumptions and risks
In light of the evolving nature and sophistication of information security threats, our information security policies, procedures, and controls must continuously adapt and evolve in order to seek to mitigate risk and, consequently, require constant monitoring to ensure effectiveness. However, given the complexity and scale of our business, network infrastructure, technology, and IT supporting systems, there can be no assurance that the security policies, procedures, and controls that we implement will be effective against all information security attacks. In addition, there can be no assurance that any insurance we may have will cover all or part of the costs, damages, liabilities, or losses that could result from the occurrence of any information security breach.
Failure to implement effective security, data and responsible AI governance frameworks could harm our brand and reputation, expose us to regulatory pressure, fines and/or penalties, constrain our competitive opportunities, and adversely affect our business and financial results
To achieve our purpose of advancing how people connect with each other and the world, we must preserve the social licence from our customers to collect and use data in our operations. A strong and consistently applied approach to data governance across our company is critical to maintaining that social licence, requiring us to focus on respecting the privacy of our customers’ and employees’ data and protecting such data against information security threats, while enabling the responsible and ethical use of data and AI. As our operations involve receiving, processing, and storing such proprietary business and personal data, effective policies, procedures, and controls must be implemented to protect information systems and underlying data in accordance with applicable privacy legislation. Failure to meet customer and employee expectations regarding the appropriate use and protection of their data could have negative reputational, business, and financial consequences for the company.
There has also been increased regulatory scrutiny over the use, collection, and disclosure of personal information. We are subject to various privacy and marketing laws, including Canada’s Anti-Spam Legislation (CASL) and the Personal Information Protection and Electronic Documents Act; the U.S. Controlling the Assault of Non-Solicited Pornography And Marketing Act of 2003 (CAN-SPAM Act); and foreign privacy laws flowing through customers contracts, including the EU General Data Protection Regulation (GDPR). In the U.S., privacy is regulated through a patchwork of general consumer-protection authority, sector-specific federal statutes, and state comprehensive privacy laws. Global and domestic regulations governing privacy and data practices are evolving rapidly, and new or amended privacy laws have been proposed or adopted in Canada and in the U.S. at the federal level, in multiple Canadian provinces, as well as in U.S. states and local jurisdictions. These laws impose significant obligations, limitations on the use of personal information, fines and/or penalties, and often have short implementation timelines. Our data governance framework must not only meet applicable privacy requirements, but also be able to evolve for continuous improvement. Effective data governance is also a component of good sustainability practices, which are considered an increasingly important measure of corporate performance and value creation.
Failure to implement an effective data governance framework encompassing the protection and appropriate use of data across its life cycle, and incorporating data governance as a core consideration in our business initiatives and technology decisions, including AI-enabled solutions and partnerships, could harm our brand, reputation, and competitiveness; decrease customer and investor confidence; and adversely affect our business and financial results. It could give rise to litigation, investigations, fines and/or penalties, and liability for failure to comply with increasingly stringent privacy legislation, as well as increased audit and regulatory scrutiny that could divert resources from business operations.
Additionally, we have implemented an AI governance framework, and we seek to ensure the responsible development, procurement, and use of AI technologies by adhering to the guiding principles outlined in our Responsible AI Policy.
| 38 | BCE INC. 2025 ANNUAL FINANCIAL REPORT |
4 MD&A Consolidated financial analysis
| 4 | Consolidated financial analysis |
This section provides detailed information and analysis about BCE’s performance in 2025 compared with 2024. It focuses on BCE’s consolidated operating results and provides financial information for our Bell CTS Canada, Bell CTS U.S. and Bell Media business segments. For further discussion and analysis of our business segments, refer to section 5, Business segment analysis.
| 4.1 | Introduction |
BCE consolidated income statements
| 2025 | 2024 | $ change | % change | |||||||||||||
| Operating revenues |
||||||||||||||||
| Service |
21,207 | 21,073 | 134 | 0.6% | ||||||||||||
| Product |
3,261 | 3,336 | (75 | ) | (2.2% | ) | ||||||||||
| Total operating revenues |
24,468 | 24,409 | 59 | 0.2% | ||||||||||||
| Operating costs |
(13,810 | ) | (13,820 | ) | 10 | 0.1% | ||||||||||
| Adjusted EBITDA |
10,658 | 10,589 | 69 | 0.7% | ||||||||||||
| Adjusted EBITDA margin (1) |
43.6% | 43.4% | 0.2 pts | |||||||||||||
| Severance, acquisition and other costs |
(517 | ) | (454 | ) | (63 | ) | (13.9% | ) | ||||||||
| Depreciation |
(3,861 | ) | (3,758 | ) | (103 | ) | (2.7% | ) | ||||||||
| Amortization |
(1,377 | ) | (1,283 | ) | (94 | ) | (7.3% | ) | ||||||||
| Finance costs |
||||||||||||||||
| Interest expense |
(1,775 | ) | (1,713 | ) | (62 | ) | (3.6% | ) | ||||||||
| Net return on post-employment benefit plans |
102 | 66 | 36 | 54.5% | ||||||||||||
| Impairment of assets |
(1,027 | ) | (2,190 | ) | 1,163 | 53.1% | ||||||||||
| Net gains on investments |
5,217 | 57 | 5,160 | n.m. | ||||||||||||
| Other income (expense) |
287 | (362 | ) | 649 | n.m. | |||||||||||
| Income taxes |
(1,193 | ) | (577 | ) | (616 | ) | n.m. | |||||||||
| Net earnings |
6,514 | 375 | 6,139 | n.m. | ||||||||||||
| Net earnings attributable to: |
||||||||||||||||
| Common shareholders |
6,305 | 163 | 6,142 | n.m. | ||||||||||||
| Preferred shareholders |
155 | 181 | (26 | ) | (14.4% | ) | ||||||||||
| NCI |
54 | 31 | 23 | 74.2% | ||||||||||||
| Net earnings |
6,514 | 375 | 6,139 | n.m. | ||||||||||||
| Adjusted net earnings |
2,601 | 2,773 | (172 | ) | (6.2% | ) | ||||||||||
| EPS |
6.79 | 0.18 | 6.61 | n.m. | ||||||||||||
| Adjusted EPS |
2.80 | 3.04 | (0.24 | ) | (7.9% | ) | ||||||||||
| n.m.: not meaningful
(1) Adjusted EBITDA margin is defined as adjusted EBITDA divided by operating revenues. Refer to section 11.6, KPIs in this MD&A for more information on this measure. |
| |||||||||||||||
|
BCE statements of cash flows – selected information
|
|
|||||||||||||||
| 2025 | 2024 | $ change | % change | |||||||||||||
| Cash flows from operating activities |
6,993 | 6,988 | 5 | 0.1% | ||||||||||||
| Capital expenditures |
(3,700 | ) | (3,897 | ) | 197 | 5.1% | ||||||||||
| Free cash flow |
3,178 | 2,888 | 290 | 10.0% | ||||||||||||
| BCE INC. 2025 ANNUAL FINANCIAL REPORT | 39 |
4 MD&A Consolidated financial analysis
BCE operating revenues grew by 0.2% in 2025, compared to last year, from higher service revenues of 0.6%, partly offset by lower product revenues of 2.2%. The growth in service revenues was driven by the contribution from our new Bell CTS U.S segment, attributable to the acquisition of Ziply Fiber on August 1, 2025, coupled with the contribution from various other smaller acquisitions made in 2024 and 2025. Additionally, the year-over-year increase was led by higher Internet revenues reflecting the growth in our FTTP subscriber base, DTC streaming subscriber growth at Bell Media, along with higher digital video advertising revenues, and greater revenues from our AI-powered solutions business. (1) The growth in service revenues was moderated by the ongoing erosion in legacy voice, data and TV services and continued lower demand for traditional advertising. Wireless service revenues also declined year over year, due to greater competitive pricing pressures experienced throughout most of the year, although abating in the latter part of the year as wireless operating momentum improved. The decrease in product revenues was driven by lower wireless product revenues reflecting reduced consumer electronics sales due to permanent store closures of The Source in 2024.
In 2025, net earnings increased by $6,139 million, compared to 2024, mainly due to higher net gains on investments resulting from the sale of our minority stake in MLSE, lower impairment of assets primarily in our Bell Media segment as well as higher other income, partly offset by higher income taxes and higher depreciation and amortization.
BCE adjusted EBITDA increased by 0.7% in 2025, compared to last year, driven by the contribution from our Bell CTS U.S. segment due to the acquisition of Ziply Fiber, as well as from an increase in our Bell Media segment, partly offset by a decline in our Bell CTS Canada segment. The year-over-year growth in adjusted EBITDA was driven by higher operating revenues coupled with lower operating expenses, reflecting cost reduction initiatives driven by workforce reductions and cost containment, including technology and automation-enabled operating efficiencies across the organization. This drove an adjusted EBITDA margin of 43.6% in 2025, up 0.2 pts over 2024.
In 2025, BCE’s cash flows from operating activities increased by $5 million, compared to 2024, mainly due to higher cash from working capital and lower income taxes paid, partly offset by settlements on derivatives used to economically hedge equity settled share-based compensation plans, higher severance and other costs paid and higher interest paid.
Free cash flow increased by $290 million in 2025, compared to 2024, mainly due to lower capital expenditures.
| 4.2 | Customer connections |
Total BCE net activations (losses)
| 2025 | 2024 | % change | ||||||||||
| Mobile phone net subscriber activations |
214,551 | 309,517 | (30.7% | ) | ||||||||
| Postpaid |
102,584 | 213,408 | (51.9% | ) | ||||||||
| Prepaid |
111,967 | 96,109 | 16.5% | |||||||||
| Mobile connected device net subscriber activations |
324,002 | 310,882 | 4.2% | |||||||||
| Bell CTS retail high-speed Internet net subscriber activations |
53,959 | 131,521 | (59.0% | ) | ||||||||
| Bell CTS Canada |
48,013 | 131,521 | (63.5% | ) | ||||||||
| Bell CTS U.S. |
5,946 | – | n.m. | |||||||||
| Bell CTS retail IPTV net subscriber (losses) activations |
(52,971 | ) | 21,614 | n.m. | ||||||||
| Bell CTS Canada |
(52,721 | ) | 21,614 | n.m. | ||||||||
| Bell CTS U.S. |
(250 | ) | – | n.m. | ||||||||
| Bell CTS retail residential NAS lines net losses |
(181,197 | ) | (187,426 | ) | 3.3% | |||||||
| Bell CTS Canada |
(173,734 | ) | (187,426 | ) | 7.3% | |||||||
| Bell CTS U.S. |
(7,463 | ) | – | n.m. | ||||||||
| Total services net activations |
358,344 | 586,108 | (38.9% | ) | ||||||||
| n.m.: not meaningful |
||||||||||||
| (1) | AI-powered solutions revenues is comprised of revenues from Ateko, Bell Cyber, and Bell AI Fabric. |
| 40 | BCE INC. 2025 ANNUAL FINANCIAL REPORT |
4 MD&A Consolidated financial analysis
Total BCE customer connections
| 2025 | 2024 | % change | ||||||||||
| Mobile phone subscribers (2) (5) (6) |
10,451,584 | 10,288,574 | 1.6% | |||||||||
| Postpaid (2) |
9,581,479 | 9,530,436 | 0.5% | |||||||||
| Prepaid (5) (6) |
870,105 | 758,138 | 14.8% | |||||||||
| Mobile connected device subscribers (2) |
3,359,565 | 3,043,430 | 10.4% | |||||||||
| Bell CTS retail high-speed Internet subscribers (1) (3) (4) (6) |
4,890,602 | 4,490,896 | 8.9% | |||||||||
| Bell CTS Canada (4) (6) |
4,455,460 | 4,490,896 | (0.8% | ) | ||||||||
| Bell CTS U.S. (1) (3) |
435,142 | – | n.m. | |||||||||
| Retail IPTV subscribers (3) (4) (7) |
2,085,630 | 2,132,953 | (2.2% | ) | ||||||||
| Bell CTS Canada (4) (7) |
2,079,791 | 2,132,953 | (2.5% | ) | ||||||||
| Bell CTS U.S. (3) |
5,839 | – | n.m. | |||||||||
| Retail residential NAS lines (1) (3) (4) |
1,722,178 | 1,834,191 | (6.1% | ) | ||||||||
| Bell CTS Canada (4) |
1,646,307 | 1,834,191 | (10.2% | ) | ||||||||
| Bell CTS U.S. (1) (3) |
75,871 | – | n.m. | |||||||||
| Total services subscribers |
22,509,559 | 21,790,044 | 3.3% | |||||||||
n.m.: not meaningful
| (1) | In Q4 2025, after a comprehensive review of Ziply Fiber subscriber accounts following our acquisition on August 1, 2025, we reduced our retail high-speed Internet and retail residential NAS subscriber bases, by 13,029 and 1,106 customers, respectively, to align with Bell methodology for customer deactivations. |
| (2) | In Q3 2025, Bell CTS Canada reduced its postpaid mobile phone and connected device subscriber bases by 51,541 and 7,867, respectively, following a review of a public sector customer account to eliminate subscribers with no usage. |
| (3) | In Q3 2025, as a result of the acquisition of Ziply Fiber on August 1, 2025, Bell CTS U.S. retail high-speed Internet, retail IPTV and retail residential NAS lines subscriber bases increased by 442,225, 6,089 and 84,440 subscribers, respectively. |
| (4) | In Q1 2025, we reduced our retail high-speed Internet, retail IPTV and retail residential NAS lines subscriber bases by 80,666, 441 and 14,150 subscribers, respectively, in Bell CTS Canada as at March 31, 2025, as we stopped selling new plans for these services under the Distributel, Acanac, Oricom and B2B2C brands. Additionally, at the beginning of Q1 2025, we reduced our retail high-speed Internet subscriber base by 2,783 subscribers in Bell CTS Canada to adjust for prior year customer deactivations following a review of customer accounts. |
| (5) | In Q4 2024, we removed 124,216 Bell prepaid mobile phone subscribers from our prepaid mobile phone subscriber base in Bell CTS Canada as at December 31, 2024, as we stopped selling new plans for this service as of that date. |
| (6) | In Q3 2024, we removed 77,971 Virgin Plus prepaid mobile phone subscribers from our prepaid mobile phone subscriber base in Bell CTS Canada as at September 30, 2024, as we stopped selling new plans for this service as of that date. Additionally, as a result of a recent CRTC decision on wholesale high-speed Internet access services, we are no longer able to resell cable Internet services to new customers in our wireline footprint as of September 12, 2024, and consequently, in Bell CTS Canada, we removed all of the existing 106,259 cable subscribers in our wireline footprint from our retail high-speed Internet subscriber base as of that date. |
| (7) | In Q2 2024, we increased our retail IPTV subscriber base by 40,997 in Bell CTS Canada to align the deactivation policy for our Fibe TV streaming services to our traditional Fibe TV service. |
BCE total services net subscriber activations were 358,344 in 2025, down 38.9% compared to last year. The total services net subscriber activations in 2025 consisted of:
| • | 214,551 mobile phone net subscriber activations and 324,002 mobile connected device net subscriber activations |
| • | 53,959 Bell CTS retail high-speed Internet net subscriber activations, composed of: |
| • | Bell CTS Canada net subscriber activations of 48,013 |
| • | Bell CTS U.S. net subscriber activations of 5,946 |
| • | 52,971 Bell CTS retail IPTV net subscriber losses, composed of: |
| • | Bell CTS Canada net subscriber losses of 52,721 |
| • | Bell CTS U.S. net subscriber losses of 250 |
| • | 181,197 Bell CTS retail residential NAS lines net losses, composed of: |
| • | Bell CTS Canada net losses of 173,734 |
| • | Bell CTS U.S. net losses of 7,463 |
At December 31, 2025, BCE’s customer connections totalled 22,509,559, up 3.3% year over year, and consisted of:
| • | 10,451,584 mobile phone subscribers, up 1.6% year over year, and 3,359,565 mobile connected device subscribers, up 10.4% year over year |
| • | 4,890,602 Bell CTS retail high-speed Internet subscribers, up 8.9% year over year, composed of: |
| • | Bell CTS Canada subscribers of 4,455,460, down 0.8% year over year |
| • | Bell CTS U.S. subscribers of 435,142, compared to nil last year, as a result of the acquisition of Ziply Fiber on August 1, 2025 |
| • | 2,085,630 Bell CTS retail IPTV subscribers, down 2.2% year over year, composed of: |
| • | Bell CTS Canada subscribers of 2,079,791, down 2.5% year over year |
| • | Bell CTS U.S. subscribers of 5,839, compared to nil last year, as a result of the acquisition of Ziply Fiber |
| • | 1,722,178 Bell CTS retail residential NAS lines, down 6.1% year over year, composed of: |
| • | Bell CTS Canada lines of 1,646,307, down 10.2% year over year |
| • | Bell CTS U.S. lines of 75,871, compared to nil in last year, as a result of the acquisition of Ziply Fiber |
| BCE INC. 2025 ANNUAL FINANCIAL REPORT | 41 |
4 MD&A Consolidated financial analysis
| 4.3 | Operating revenues |
|
|
2025 | 2024 | $ change | % change | ||||||||||||||||
| Bell CTS | 21,681 | 21,619 | 62 | 0.3% | ||||||||||||||||
| Bell CTS Canada |
21,289 | 21,619 | (330 | ) | (1.5% | ) | ||||||||||||||
| Bell CTS U.S. |
392 | – | 392 | n.m. | ||||||||||||||||
| Bell Media | 3,154 | 3,151 | 3 | 0.1% | ||||||||||||||||
| Inter-segment eliminations | (367 | ) | (361 | ) | (6 | ) | (1.7% | ) | ||||||||||||
| Total BCE operating revenues | 24,468 | 24,409 | 59 | 0.2% | ||||||||||||||||
|
n.m.: not meaningful |
||||||||||||||||||||
BCE
BCE operating revenues increased by 0.2% in 2025, compared to last year, reflecting service revenues of $21,207 million, up 0.6% year over year and product revenues of $3,261 million, down 2.2% year over year. The growth in BCE operating revenues was driven by an increase in Bell CTS of 0.3% as a result of the contribution from our new Bell CTS
U.S. segment of $392 million, due to the acquisition of Ziply Fiber on August 1, 2025, moderated by a decline in our Bell CTS Canada segment of 1.5%, along with a modest increase in revenues from our Bell Media segment of 0.1%.
| 4.4 | Operating costs |
| 2025 | 2024 | $ change | % change | |||||||||||||
| Bell CTS |
(11,805 | ) | (11,788 | ) | (17 | ) | (0.1% | ) | ||||||||
| Bell CTS Canada |
(11,584 | ) | (11,788 | ) | 204 | 1.7% | ||||||||||
| Bell CTS U.S. |
(221 | ) | – | (221 | ) | n.m. | ||||||||||
| Bell Media |
(2,372 | ) | (2,393 | ) | 21 | 0.9% | ||||||||||
| Inter-segment eliminations |
367 | 361 | 6 | 1.7% | ||||||||||||
| Total BCE operating costs |
(13,810 | ) | (13,820 | ) | 10 | 0.1% | ||||||||||
| n.m.: not meaningful | ||||||||||||||||
| (1) | Cost of revenues includes costs of wireless devices and other equipment sold, network and content costs, and payments to other carriers. |
| (2) | Labour costs (net of capitalized costs) include wages, salaries and related taxes and benefits, post-employment benefit plans service cost, and other labour costs, including contractor and outsourcing costs. |
| (3) | Other operating costs include marketing, advertising and sales commission costs, bad debt expense, taxes other than income taxes, IT costs, professional service fees and rent. |
BCE
BCE operating costs remained relatively stable year over year, decreasing by 0.1% in 2025, compared to 2024, driven by lower costs in Bell Media of 0.9%, moderated by higher expenses in Bell CTS of 0.1%, due to greater costs from Bell CTS U.S. of $221 million, reflecting the operating costs of Ziply Fiber as a result of the acquisition on August 1, 2025, partly offset by reduced costs in Bell CTS Canada of 1.7%.
| 42 | BCE INC. 2025 ANNUAL FINANCIAL REPORT |
4 MD&A Consolidated financial analysis
| 4.5 | Net earnings |
|
|
In 2025, net earnings increased by $6,139 million, compared to 2024, mainly due to higher net gains on investments resulting from the sale of our minority stake in MLSE, lower impairment of assets primarily in our Bell Media segment as well as higher other income, partly offset by higher income taxes and higher depreciation and amortization. |
| 4.6 | Adjusted EBITDA |
| 2025 | 2024 | $ change | % change | |||||||||||||
| Bell CTS (1) |
9,876 | 9,831 | 45 | 0.5% | ||||||||||||
| Adjusted EBITDA margin |
45.6% | 45.5% | 0.1 pts | |||||||||||||
| Bell CTS Canada |
9,705 | 9,831 | (126 | ) | (1.3% | ) | ||||||||||
| Adjusted EBITDA margin |
45.6% | 45.5% | 0.1 pts | |||||||||||||
| Bell CTS U.S. |
171 | – | 171 | n.m. | ||||||||||||
| Adjusted EBITDA margin |
43.6% | – | 43.6 pts | |||||||||||||
| Bell Media |
782 | 758 | 24 | 3.2% | ||||||||||||
| Adjusted EBITDA margin |
24.8% | 24.1% | 0.7 pts | |||||||||||||
| Total BCE adjusted EBITDA |
10,658 | 10,589 | 69 | 0.7% | ||||||||||||
| Adjusted EBITDA margin |
43.6% | 43.4% | 0.2 pts | |||||||||||||
| n.m.: not meaningful |
||||||||||||||||
| (1) | Bell CTS adjusted EBITDA is a total of segments measure. See section 11.3, Total of segments measures in this MD&A for more information on this measure. |
BCE
BCE adjusted EBITDA increased by 0.7% in 2025, compared to last year, due to higher operating revenues and lower operating costs. The growth was driven by an increase in Bell CTS of 0.5% due to the contribution from our Bell CTS U.S. segment of $171 million as a result of the acquisition of Ziply Fiber on August 1, 2025, partly offset by a
decline in our Bell CTS Canada segment of 1.3%, along with an increase in our Bell Media segment of 3.2%. This drove an adjusted EBITDA margin of 43.6% in 2025 up 0.2 pts over 2024, resulting from cost reduction initiatives, mainly attributable to workforce reductions, cost containment and other operating efficiencies.
| BCE INC. 2025 ANNUAL FINANCIAL REPORT | 43 |
4 MD&A Consolidated financial analysis
| 4.7 | Severance, acquisition and other costs |
This category includes various income and expenses that are not related directly to the operating revenues generated during the year. This includes severance costs consisting of charges related to involuntary and voluntary employee terminations, as well as transaction costs, such as legal and financial advisory fees, related to completed or potential acquisitions, employee severance costs related to the purchase of a business, the costs to integrate acquired companies into our operations, costs related to litigation and regulatory decisions, when they are significant, and other costs.
|
|
2025
Severance, acquisition and other costs included:
• Severance costs of $380 million related to involuntary and voluntary employee terminations
• Acquisition and other costs of $137 million, including costs to acquire Ziply Fiber of $67 million
2024
Severance, acquisition and other costs included:
• Severance costs of $383 million related to involuntary and voluntary employee terminations
• Acquisition and other costs of $71 million |
| 4.8 | Depreciation and amortization |
|
|
The amount of our depreciation and amortization in any year is affected by:
• How much we invested in new property, plant and equipment and intangible assets in previous years
• How many assets we retired during the year
• Estimates of the useful lives of assets |
Depreciation
Depreciation in 2025 increased by $103 million, compared to 2024, mainly due to a higher asset base as a result of the acquisition of Ziply Fiber on August 1, 2025.
Amortization
Amortization in 2025 increased by $94 million, compared to 2024, mainly due to a higher asset base and as a result of the acquisition of Ziply Fiber on August 1, 2025.
| 44 | BCE INC. 2025 ANNUAL FINANCIAL REPORT |
4 MD&A Consolidated financial analysis
| 4.9 | Finance costs |
Interest expense
Interest expense in 2025 increased by $62 million, compared to 2024, mainly due to higher debt balances as a result of the acquisition of Ziply Fiber on August 1, 2025 and higher average cost of debt.
Net return on post-employment benefit plans
Net return on our post-employment benefit plans is based on market conditions that existed at the beginning of the year as well as the net post-employment benefit plan asset (liability). On January 1, 2025, the discount rate was 4.7% compared to 4.6% on January 1, 2024.
In 2025, net return on post-employment benefit plans increased by $36 million, compared to last year, as a result of a higher discount rate in 2025 and a higher net asset position.
The impacts of changes in market conditions during the year are recognized in Other comprehensive income (OCI).
| 4.10 | Impairment of assets |
2025
During the third quarter of 2025, we identified indicators of impairment for our Bell Media TV services, radio markets and OOH advertising business, due to a decline in legacy advertising demand and spending in the linear advertising market as we transition to digital. Accordingly, impairment testing was required for certain groups of cash-generating units (CGUs) as well as for goodwill for the Bell Media group of CGUs.
We recognized $976 million of impairment charges for English and French TV services, radio markets and our OOH advertising business within our Bell Media segment. These charges included $554 million allocated to indefinite-life intangible assets for broadcast licences, spectrum and other licences and brands, $250 million allocated to program and feature film rights, $103 million allocated to property, plant and equipment for network, infrastructure and equipment and assets under construction, $47 million allocated to software, $18 million allocated to prepaid expenses and inventory, and $4 million allocated to finite-life intangible assets mainly for trademarks.
There was no impairment of Bell Media goodwill.
We recorded $51 million of additional impairment charges in 2025 related to various assets within our Bell CTS Canada segment.
2024
During the third quarter of 2024, we identified indicators of impairment for our Bell Media TV services and radio markets, due to a further decline in advertising demand and spending in the linear advertising market. Accordingly, impairment testing was required for certain groups of CGUs as well as for goodwill for the Bell Media group of CGUs.
We recognized $958 million of impairment charges for English and French TV services and radio markets within our Bell Media segment. These charges included $627 million allocated to indefinite-life intangible assets for broadcast licences and brands, $144 million allocated to program and feature film rights, $85 million allocated to property, plant and equipment for network and infrastructure and equipment, $85 million allocated to software, $10 million allocated to finite-life intangible assets mainly for trademarks, and $7 million allocated to prepaid expenses.
In Q3 2024, we recorded $1,132 million of impairment charges for goodwill at Bell Media.
Additionally in 2024, we recorded impairment charges of $100 million related mainly to right-of-use assets for certain office spaces we ceased using as part of our real estate optimization strategy as a result of our hybrid work policy.
| BCE INC. 2025 ANNUAL FINANCIAL REPORT | 45 |
4 MD&A Consolidated financial analysis
| 4.11 | Net gains on investments |
|
|
2025
Net gains on investments of $5,217 million included a $5.2 billion gain on sale of our minority stake in MLSE on July 1, 2025.
2024
Net gains on investments of $57 million included a gain of $69 million related to an obligation to repurchase at fair value the minority interest in one of our subsidiaries. |
| 4.12 | Other income (expense) |
|
|
Other income (expense) includes income and expense items, such as:
• Net mark-to-market gains or losses on derivatives used to economically hedge equity settled share-based compensation plans
• Equity income or losses from investments in associates and joint ventures
• Gains or losses on retirements and disposals of property, plant and equipment and intangible assets
• Net early debt redemption gains or costs
• Interest income |
| For the year ended December 31 | 2025 | 2024 | ||||||
| Net early debt redemption gains |
249 | – | ||||||
| Interest income |
79 | 123 | ||||||
| Equity income (losses) from investments in associates and joint ventures |
||||||||
| Loss on investment |
– | (247 | ) | |||||
| Operations |
8 | 10 | ||||||
| Losses on retirements and disposals of property, plant and equipment and intangible assets |
(26 | ) | (38 | ) | ||||
| Net mark-to-market losses on derivatives used to economically hedge equity settled share-based compensation plans |
(9 | ) | (269 | ) | ||||
| Other |
(14 | ) | 59 | |||||
| Total other income (expense) |
287 | (362 | ) | |||||
2025
Other income of $287 million included early debt redemption gains due to the repurchase by Bell Canada, as a result of its cash tender offers, of a portion of its Series M-39, M-45, M-51 and M-55 MTN debentures, and a portion of its Series US-2, US-4, US-5, US-6, and US-7 Notes, and interest income, partly offset by early debt redemption costs due to the redemption by Bell Canada of the outstanding principal amount of the Secured Fiber Network Revenue Term Notes (Term Notes) originally issued by Ziply Fiber.
2024
Other expense of $362 million included net mark-to-market losses on derivatives used to economically hedge equity settled share-based compensation plans and losses on our equity investments in associates and joint ventures which included a loss on BCE’s share of an obligation to repurchase at fair value the minority interest in MLSE, partly offset by interest income.
| 46 | BCE INC. 2025 ANNUAL FINANCIAL REPORT |
4 MD&A Consolidated financial analysis
| 4.13 | Income taxes |
The following table reconciles the amount of reported income taxes in the consolidated income statements (income statements) with income taxes calculated at a statutory income tax rate of 26.8% for both 2025 and 2024.
| For the year ended December 31 | 2025 | 2024 | ||||||
| Net earnings |
6,514 | 375 | ||||||
| Add back income taxes |
1,193 | 577 | ||||||
| Earnings before income taxes |
7,707 | 952 | ||||||
| Applicable statutory tax rate |
26.8% | 26.8% | ||||||
| Income taxes computed at applicable statutory rates |
(2,065 | ) | (255 | ) | ||||
| Non-taxable portion of net gains on investments |
850 | 18 | ||||||
| Uncertain tax positions |
22 | 4 | ||||||
| Impairment of goodwill |
– | (303 | ) | |||||
| Change in estimate relating to prior periods |
– | 1 | ||||||
| Non-taxable portion of equity losses |
– | (66 | ) | |||||
| Previously unrecognized tax benefits |
– | 3 | ||||||
| Other |
– | 21 | ||||||
| Total income taxes |
(1,193 | ) | (577 | ) | ||||
| Average effective tax rate |
15.5% | 60.6% | ||||||
Income taxes in 2025 increased by $616 million, compared to 2024, mainly due to higher taxable income in 2025 as a result of the gain on sale of $5.2 billion that was recorded on the disposition of our minority stake in MLSE.
| 4.14 | Net earnings attributable to common shareholders and EPS |
Net earnings attributable to common shareholders in 2025 increased by $6,142 million, or $6.61 per common share, compared to 2024, mainly due to higher net gains on investments resulting from the sale of our minority stake in MLSE, lower impairment of assets primarily in our Bell Media segment as well as higher other income, partly offset by higher income taxes and higher depreciation and amortization.
Excluding the impact of severance, acquisition and other costs, net mark-to-market gains (losses) on derivatives used to economically hedge equity settled share-based compensation plans, net equity gains (losses) on investments in associates and joint ventures, net gains (losses) on investments, net early debt redemption gains (costs) and impairment of assets, net of tax and NCI, adjusted net earnings in 2025 was $2,601 million, or $2.80 per common share, compared to $2,773 million, or $3.04 per common share, in 2024.
| BCE INC. 2025 ANNUAL FINANCIAL REPORT | 47 |
4 MD&A Consolidated financial analysis
| 4.15 | Capital expenditures |
|
|
BCE capital expenditures of $3,700 million in 2025, declined by $197 million, compared to 2024, along with a corresponding capital intensity ratio of 15.1%, down 0.9 pts over last year. The year-over-year decline was consistent with a planned reduction in capital spending in Bell CTS Canada, primarily from slower FTTP footprint expansion in Canada, partly as a result of regulatory decisions that discourage network investment. The decline in capital spending was partly offset by capital investments in our new Bell CTS U.S. segment as a result of the acquisition of Ziply Fiber on August 1, 2025. Capital investments were focused on the continued expansion of Ziply Fiber’s FTTP network in the U.S. |
| 4.16 | Cash flows |
| In 2025, BCE’s cash flows from operating activities increased by $5 million, compared to 2024, mainly due to higher cash from working capital and lower income taxes paid, partly offset by settlements on derivatives used to economically hedge equity settled share-based compensation plans, higher severance and other costs paid and higher interest paid.
Free cash flow increased by $290 million in 2025, compared to 2024, mainly due to lower capital expenditures. |
|
| 48 | BCE INC. 2025 ANNUAL FINANCIAL REPORT |
5 MD&A Business segment analysis
| 5 | Business segment analysis |
| 5.1 | Bell CTS |
| Financial performance analysis
2025 performance highlights |
|
| (1) | In Q4 2025, after a comprehensive review of Ziply Fiber subscriber accounts following our acquisition on August 1, 2025, we reduced our retail high-speed Internet and retail residential NAS subscriber bases, by 13,029 and 1,106 customers, respectively, to align with Bell methodology for customer deactivations. |
| (2) | In Q3 2025, Bell CTS Canada reduced its postpaid mobile phone and connected device subscriber bases by 51,541 and 7,867, respectively, following a review of a public sector customer account to eliminate subscribers with no usage. |
| (3) | In Q3 2025, as a result of the acquisition of Ziply Fiber on August 1, 2025, Bell CTS U.S. retail high-speed Internet, retail IPTV and retail residential NAS lines subscriber bases increased by 442,225, 6,089 and 84,440 subscribers, respectively. |
| (4) | In Q1 2025, we reduced our retail high-speed Internet, retail IPTV and retail residential NAS lines subscriber bases by 80,666, 441 and 14,150 subscribers, respectively, in Bell CTS Canada as at March 31, 2025, as we stopped selling new plans for these services under the Distributel, Acanac, Oricom and B2B2C brands. Additionally, at the beginning of Q1 2025, we reduced our retail high-speed Internet subscriber base by 2,783 subscribers in Bell CTS Canada to adjust for prior year customer deactivations following a review of customer accounts. |
| (5) | In Q4 2024, we removed 124,216 Bell prepaid mobile phone subscribers from our prepaid mobile phone subscriber base in Bell CTS Canada as at December 31, 2024, as we stopped selling new plans for this service as of that date. |
| (6) | In Q3 2024, we removed 77,971 Virgin Plus prepaid mobile phone subscribers from our prepaid mobile phone subscriber base in Bell CTS Canada as at September 30, 2024, as we stopped selling new plans for this service as of that date. Additionally, as a result of a recent CRTC decision on wholesale high-speed Internet access services, we are no longer able to resell cable Internet services to new customers in our wireline footprint as of September 12, 2024, and consequently, in Bell CTS Canada, we removed all of the existing 106,259 cable subscribers in our wireline footprint from our retail high-speed Internet subscriber base as of that date. |
| (7) | In Q2 2024, we increased our retail IPTV subscriber base by 40,997 in Bell CTS Canada to align the deactivation policy for our Fibe TV streaming services to our traditional Fibe TV service. |
| (8) | Mobile phone blended ARPU is defined as Bell CTS Canada wireless external services revenues divided by the average mobile phone subscriber base for the specified period, expressed as a dollar unit per month. Refer to section 11.6, KPIs in this MD&A for more information on this measure. |
| BCE INC. 2025 ANNUAL FINANCIAL REPORT | 49 |
5 MD&A Business segment analysis
Revenues
Bell CTS
| 2025 | 2024 | $ change | % change | |||||||||||||
| Wireless |
7,118 | 7,149 | (31 | ) | (0.4% | ) | ||||||||||
| Wireline data |
8,441 | 8,117 | 324 | 4.0% | ||||||||||||
| Wireline voice |
2,520 | 2,672 | (152 | ) | (5.7% | ) | ||||||||||
| Other wireline services |
313 | 318 | (5 | ) | (1.6% | ) | ||||||||||
| External service revenues |
18,392 | 18,256 | 136 | 0.7% | ||||||||||||
| Inter-segment service revenues |
28 | 27 | 1 | 3.7% | ||||||||||||
| Operating service revenues |
18,420 | 18,283 | 137 | 0.7% | ||||||||||||
| Wireless |
2,634 | 2,715 | (81 | ) | (3.0% | ) | ||||||||||
| Wireline |
627 | 621 | 6 | 1.0% | ||||||||||||
| External/operating product revenues |
3,261 | 3,336 | (75 | ) | (2.2% | ) | ||||||||||
| Total external revenues |
21,653 | 21,592 | 61 | 0.3% | ||||||||||||
| Total operating revenues |
21,681 | 21,619 | 62 | 0.3% | ||||||||||||
Bell CTS operating revenues increased by 0.3% in 2025, compared to 2024, due to the contribution from Bell CTS U.S. of $392 million as a result of the acquisition of Ziply Fiber on August 1, 2025, partly offset by a year-over-year decline in Bell CTS Canada of 1.5%. The year-over-year revenue growth was driven by higher service revenues, moderated by lower product revenues.
Bell CTS Canada
| 2025 | 2024 | $ change | % change | |||||||||||||
| Wireless |
7,118 | 7,149 | (31 | ) | (0.4% | ) | ||||||||||
| Wireline data |
8,119 | 8,117 | 2 | – | ||||||||||||
| Wireline voice |
2,450 | 2,672 | (222 | ) | (8.3% | ) | ||||||||||
| Other wireline services |
313 | 318 | (5 | ) | (1.6% | ) | ||||||||||
| External service revenues |
18,000 | 18,256 | (256 | ) | (1.4% | ) | ||||||||||
| Inter-segment service revenues |
28 | 27 | 1 | 3.7% | ||||||||||||
| Operating service revenues |
18,028 | 18,283 | (255 | ) | (1.4% | ) | ||||||||||
| Wireless |
2,634 | 2,715 | (81 | ) | (3.0% | ) | ||||||||||
| Wireline |
627 | 621 | 6 | 1.0% | ||||||||||||
| External/operating product revenues |
3,261 | 3,336 | (75 | ) | (2.2% | ) | ||||||||||
| Total external revenues |
21,261 | 21,592 | (331 | ) | (1.5% | ) | ||||||||||
| Total operating revenues |
21,289 | 21,619 | (330 | ) | (1.5% | ) | ||||||||||
| 50 | BCE INC. 2025 ANNUAL FINANCIAL REPORT |
5 MD&A Business segment analysis
Bell CTS Canada operating revenues decreased by 1.5% in 2025, compared to last year, from both lower service and product revenues. The service revenues decline was driven by ongoing erosion in wireline voice revenues and lower wireless revenues, while wireline data revenues remained essentially stable year over year.
Bell CTS Canada operating service revenues declined by 1.4% in the year, compared to 2024.
| • | Wireless revenues decreased by 0.4% in 2025, compared to last year, driven by: |
| • | Competitive pricing pressures throughout most of the year, abating in the latter part, and greater discounting |
| • | Lower data overages driven by increased customer adoption of monthly plans with higher data thresholds, including unlimited plans |
| • | Lower roaming revenues mainly from reduced travel to the U.S. |
These factors were partly offset by:
| • | Continued growth in our mobile phone and connected device average subscriber bases coupled with the flow-through of rate increases |
| • | Revenues related to the 2025 G7 Summit |
| • | Wireline data revenues were essentially stable year over year, compared to 2024, mainly driven by: |
| • | Higher Internet revenues reflecting growth in our FTTP subscriber base coupled with the flow-through of rate increases, moderated by greater acquisition, retention and bundle discounts |
| • | Greater revenues from our AI-powered solutions business driven by growth in Bell Cyber, our cyber security business, and Ateko, our Systems Integrator and Managed Services practice, including the impact of small acquisitions made in 2024 and 2025 |
| • | Higher radio services sales to the government sector |
These factors were offset by:
| • | Lower TV revenues, mainly due to the erosion of our TV subscriber bases and lower IP broadband and legacy data revenues |
| • | Wireline voice revenues decreased by 8.3% in 2025, compared to 2024, primarily due to: |
| • | Ongoing retail residential NAS lines erosion, coupled with business voice declines, driven by technological substitution to wireless and Internet-based services unfavourably impacting local and access and long distance revenues |
| • | Higher acquisition, retention and bundle discounts on residential services |
These factors were partly offset by:
| • | Flow-through of residential rate increases |
Bell CTS Canada operating product revenues decreased by 2.2% in 2025, compared to last year.
| • | Wireless operating product revenues decreased by 3.0% in 2025, compared to 2024, from reduced consumer electronics sales due to permanent store closures of The Source, and lower device sales to the government sector, partly offset by higher wireless device sales to consumers mainly from greater upgrade volumes and favourable rate impact due to lower discounting |
| • | Wireline operating product revenues grew by 1.0%, compared to the same period last year, driven by the delivery of our first AI facility in Kamloops, B.C. in Q2 2025, along with greater product sales in Bell Cyber, partly offset by lower land mobile radio systems sales to the government sector and reduced equipment sales to large business customers |
Bell CTS U.S.
| 2025 | 2024 | $ change | % change | |||||||||||||
| Wireline data |
322 | – | 322 | n.m. | ||||||||||||
| Wireline voice |
70 | – | 70 | n.m. | ||||||||||||
| Total external/operating revenues |
392 | – | 392 | n.m. | ||||||||||||
n.m.: not meaningful
Bell CTS U.S. operating revenues were $392 million in 2025, compared with nil in 2024, due to the acquisition of Ziply Fiber on August 1, 2025. The operating revenues were comprised of service revenues, mainly from wireline data and voice.
| • | Wireline data revenues totalled $322 million in 2025, compared to nil last year and mainly consisted of: |
| • | Internet revenues generated from residential, business and wholesale broadband Internet services primarily delivered over Ziply Fiber’s fibre network which benefited from the continued expansion of their FTTP footprint |
| • | IP broadband revenues derived from the sale of commercial ethernet, dedicated Internet/non-switched access, and other data transport networking options |
| • | Modest TV revenues from the sale of IPTV service |
| • | Wireline voice revenues were $70 million in 2025, compared with nil in 2024. These revenues included traditional local and long distance wireline services, VoIP services, and a number of unified messaging services. Voice revenues were unfavourably impacted by ongoing losses due to technological substitution to wireless and Internet-based services. |
| BCE INC. 2025 ANNUAL FINANCIAL REPORT | 51 |
5 MD&A Business segment analysis
Operating costs and adjusted EBITDA
| 2025 | 2024 | $ change | % change | |||||||||||||
| Bell CTS operating costs |
(11,805 | ) | (11,788 | ) | (17 | ) | (0.1% | ) | ||||||||
| Bell CTS Canada |
(11,584 | ) | (11,788 | ) | 204 | 1.7% | ||||||||||
| Bell CTS U.S. |
(221 | ) | – | (221 | ) | n.m. | ||||||||||
| Bell CTS adjusted EBITDA |
9,876 | 9,831 | 45 | 0.5% | ||||||||||||
| Margin |
45.6% | 45.5% | 0.1 pts | |||||||||||||
| Bell CTS Canada |
9,705 | 9,831 | (126 | ) | (1.3% | ) | ||||||||||
| Margin |
45.6% | 45.5% | 0.1 pts | |||||||||||||
| Bell CTS U.S. |
171 | – | 171 | n.m. | ||||||||||||
|
Margin |
43.6% | – | 43.6 pts | |||||||||||||
n.m.: not meaningful
Bell CTS operating costs increased by 0.1% in 2025, compared to last year, due to greater costs from Bell CTS U.S. of $221 million, reflecting the operating expenses of Ziply Fiber as a result of the acquisition on August 1, 2025, partly offset by lower costs in Bell CTS Canada of 1.7%.
Bell CTS Canada operating costs decreased by 1.7% in 2025, compared to last year, due to:
| • | Cost reduction initiatives attributable to workforce reductions, savings from our customer service centres driven by improved call placement and reduced call volumes, permanent closures of The Source stores, as well as various other cost containment initiatives across the organization including, technology and automation-enabled operating efficiencies |
| • | Lower cost of goods sold associated with reduced product revenues |
| • | Decreased TV programming costs related to the lower revenues |
These factors were partly offset by:
| • | Greater commissions, payments to other carriers and bad debt expense |
| • | Increased expenses related to the revenues generated from the 2025 G7 summit, growth from our Bell AI-powered solutions business and from small acquisitions made in 2024 and 2025 |
Bell CTS U.S. operating costs were $221 million in 2025, compared with nil last year, reflecting the operating costs of Ziply Fiber due to the acquisition on August 1, 2025. The costs predominantly consisted of labour expenses, network-related costs, payments to other carriers, regulatory costs and various administrative and marketing costs. The expenses reflected operating efficiencies, primarily from simplification of systems and processes, as well as lower call volumes despite the expanding customer base.
Bell CTS adjusted EBITDA increased by 0.5% in 2025, compared to 2024, attributable to the contribution from Bell CTS U.S. of $171 million as a result of the acquisition of Ziply Fiber on August 1, 2025, partly offset by a decline in Bell CTS Canada of 1.3%. The year-over-year adjusted EBITDA growth was driven by higher operating revenues, partly offset by increased operating costs. Bell CTS adjusted EBITDA margin of 45.6% in 2025, remained essentially stable compared to the 2024 EBITDA margin of 45.5%.
Bell CTS Canada adjusted EBITDA decreased by 1.3% in 2025, compared to 2024, due to lower operating revenues, partly offset by reduced operating expenses. Adjusted EBITDA margin of 45.6% in 2025, remained essentially stable compared to 45.5% in 2024.
Bell CTS U.S. adjusted EBITDA was $171 million in 2025, compared to nil last year, due to the acquisition of Ziply Fiber on August 1, 2025. This corresponded to an adjusted EBITDA margin of 43.6%.
Bell CTS operating metrics
Wireless
| 2025 | 2024 | Change | % change | |||||||||||||
| Mobile phones |
||||||||||||||||
| Blended ARPU (1) (2) (3) ($/month) |
57.36 | 57.90 | (0.54 | ) | (0.9% | ) | ||||||||||
| Gross subscriber activations |
2,125,363 | 2,351,507 | (226,144 | ) | (9.6% | ) | ||||||||||
| Postpaid |
1,428,620 | 1,641,053 | (212,433 | ) | (12.9% | ) | ||||||||||
| Prepaid |
696,743 | 710,454 | (13,711 | ) | (1.9% | ) | ||||||||||
| Net subscriber activations |
214,551 | 309,517 | (94,966 | ) | (30.7% | ) | ||||||||||
| Postpaid |
102,584 | 213,408 | (110,824 | ) | (51.9% | ) | ||||||||||
| Prepaid |
111,967 | 96,109 | 15,858 | 16.5% | ||||||||||||
| Blended churn % (average per month) |
1.56% | 1.67% | 0.11 pts | |||||||||||||
| Postpaid |
1.22% | 1.33% | 0.11 pts | |||||||||||||
| Prepaid |
5.47% | 5.28% | (0.19) pts | |||||||||||||
| Subscribers (1) (2) (3) |
10,451,584 | 10,288,574 | 163,010 | 1.6% | ||||||||||||
| Postpaid (1) |
9,581,479 | 9,530,436 | 51,043 | 0.5% | ||||||||||||
| Prepaid (2) (3) |
870,105 | 758,138 | 111,967 | 14.8% | ||||||||||||
| Mobile connected devices |
||||||||||||||||
| Net subscriber activations |
324,002 | 310,882 | 13,120 | 4.2% | ||||||||||||
| Subscribers (1) |
3,359,565 | 3,043,430 | 316,135 | 10.4% | ||||||||||||
| (1) | In Q3 2025, Bell CTS Canada reduced its postpaid mobile phone and connected device subscriber bases by 51,541 and 7,867, respectively, following a review of a public sector customer account to eliminate subscribers with no usage. |
| (2) | In Q4 2024, we removed 124,216 Bell prepaid mobile phone subscribers from our prepaid mobile phone subscriber base in Bell CTS Canada as at December 31, 2024, as we stopped selling new plans for this service as of that date. |
| (3) | In Q3 2024, we removed 77,971 Virgin Plus prepaid mobile phone subscribers from our prepaid mobile phone subscriber base in Bell CTS Canada as at September 30, 2024, as we stopped selling new plans for this service as of that date. |
| 52 | BCE INC. 2025 ANNUAL FINANCIAL REPORT |
5 MD&A Business segment analysis
Mobile phone blended ARPU of $57.36 in 2025, declined 0.9%, compared to last year, attributable to:
| • | Competitive pricing pressures throughout most of the year, abating in the latter part, and greater discounting |
| • | Lower data overages due to greater customer adoption of monthly plans with higher data thresholds, including unlimited plans |
| • | Decreased roaming revenues mainly due to reduced travel to the U.S. |
These factors were partly offset by:
| • | Flow-through of rate increases |
| • | The favourable impact from 2024 adjustments to our mobile phone prepaid subscriber base and Q3 2025 adjustment to our mobile phone postpaid subscriber base to remove 202,187 and 51,541 subscribers, respectively |
| • | Revenues related to the G7 Summit in Q2 2025 |
Mobile phone gross subscriber activations decreased by 9.6% in 2025, compared to last year, due to both lower postpaid and prepaid gross subscriber activations.
| • | Mobile phone postpaid gross subscriber activations declined by 12.9% in 2025, compared to 2024, driven by lower market activity, slowing population growth mainly attributable to government immigration policies, fewer lower-value bring-your-own-device (BYOD) activations and reflects our focus on higher-value subscriber loadings led by growth in our Bell brand |
| • | Mobile phone prepaid gross subscriber activations decreased by 1.9% in 2025, compared to last year, due to slowing population growth, mainly from lower immigration, partly offset by effective Lucky Mobile promotional offers |
Mobile phone net subscriber activations decreased by 30.7% in 2025, compared to 2024, due to lower postpaid net subscriber activations, partly offset by higher prepaid net subscriber activations.
| • | Mobile phone postpaid net subscriber activations decreased by 51.9% in the year, compared to 2024, due to lower gross subscriber activations, partly offset by reduced subscriber deactivations |
| • | Mobile phone prepaid net subscriber activations increased by 16.5% in 2025, compared to 2024, due to lower subscriber deactivations, partly offset by lower gross subscriber activations |
Mobile phone blended churn of 1.56% in 2025, decreased by 0.11 pts, compared to 2024.
| • | Mobile phone postpaid churn of 1.22% in 2025, decreased by 0.11 pts, compared to last year, benefiting from our greater investment in customer retention and improvements to customer service |
| • | Mobile phone prepaid churn of 5.47% in 2025 increased by 0.19 pts, compared to 2024, due to greater market activity, as well as the impact of the 2024 adjustments to our mobile phone prepaid subscriber base to remove 202,187 subscribers |
Mobile phone subscribers at December 31, 2025 totalled 10,451,584, an increase of 1.6%, from 10,288,574 subscribers reported at the end of 2024. This consisted of 9,581,479 postpaid subscribers, an increase of 0.5% from 9,530,436 subscribers reported at the end of 2024, and 870,105 prepaid subscribers, an increase of 14.8% from 758,138 subscribers reported at the end of 2024. In Q3 2025, we reduced our postpaid mobile phone subscriber base by 51,541, following a review of a public sector customer account to eliminate subscribers with no usage.
Mobile connected device net subscriber activations increased by 4.2% in 2025, compared to last year, mainly due to lower data devices net losses and greater Connected Car net activations, partly offset by lower business IoT net activations.
Mobile connected device subscribers at December 31, 2025 totalled 3,359,565 up 10.4% from 3,043,430 subscribers reported at the end of 2024. In Q3 2025, we reduced our connected device subscriber base by 7,867, following a review of a public sector customer account to eliminate subscribers with no usage.
Wireline data
Retail high-speed Internet
| 2025 | 2024 | Change | % change | |||||||||||||
| Bell CTS retail high-speed Internet net subscriber activations |
53,959 | 131,521 | (77,562 | ) | (59.0% | ) | ||||||||||
| Bell CTS Canada |
48,013 | 131,521 | (83,508 | ) | (63.5% | ) | ||||||||||
| Bell CTS U.S. |
5,946 | – | 5,946 | n.m. | ||||||||||||
| Bell CTS retail high–speed Internet subscribers (1) (2) (3) (4) |
4,890,602 | 4,490,896 | 399,706 | 8.9% | ||||||||||||
| Bell CTS Canada (3) (4) |
4,455,460 | 4,490,896 | (35,436 | ) | (0.8% | ) | ||||||||||
| Bell CTS U.S. (1) (2) |
435,142 | – | 435,142 | n.m. | ||||||||||||
n.m.: not meaningful
| (1) | In Q4 2025, after a comprehensive review of Ziply Fiber subscriber accounts following our acquisition on August 1, 2025, we reduced our retail high-speed Internet subscriber base by 13,029 customers to align with Bell methodology for customer deactivations. |
| (2) | In Q3 2025, as a result of the acquisition of Ziply Fiber on August 1, 2025, Bell CTS U.S. retail high-speed Internet subscriber base increased by 442,225 subscribers. |
| (3) | In Q1 2025, we reduced our retail high-speed Internet subscriber base by 80,666 subscribers in Bell CTS Canada, as at March 31, 2025, as we stopped selling new plans for this service under the Distributel, Acanac, Oricom and B2B2C brands. Additionally, at the beginning of Q1 2025, we reduced our retail high-speed Internet subscriber base by 2,783 subscribers in Bell CTS Canada to adjust for prior year customer deactivations following a review of customer accounts. |
| (4) | As a result of a recent CRTC decision on wholesale high-speed Internet access services, we are no longer able to resell cable Internet services to new customers in our wireline footprint as of September 12, 2024, and consequently, in Bell CTS Canada, we removed all of the existing 106,259 cable subscribers in our wireline footprint from our retail high-speed Internet subscriber base as of that date. |
| BCE INC. 2025 ANNUAL FINANCIAL REPORT | 53 |
5 MD&A Business segment analysis
Bell CTS retail high-speed Internet net subscriber activations decreased by 59.0% in 2025, compared to last year, attributable to a decline in Bell CTS Canada of 63.5%, partly offset by the contribution from Bell CTS U.S of 5,946 net subscriber activations, as a result of the acquisition of Ziply Fiber on August 1, 2025
Bell CTS Canada retail high-speed Internet net subscriber activations decreased by 63.5% in 2025, compared to last year, driven by reduced activations attributable to ongoing aggressive promotional offers by competitors offering cable, wholesale fibre, fixed wireless and satellite Internet services, less new fibre footprint expansion and slowing market growth, due to lower immigration and slowing housing starts, mitigated in part, by fewer customer deactivations, particularly on fibre, and reflects our focus on customer retention.
Bell CTS U.S. retail high-speed Internet net subscriber activations were 5,946 in the year, compared to nil last year, as a result of the acquisition of Ziply Fiber on August 1, 2025. Net activations benefited from the continued expansion of the fibre footprint, coupled with strong fibre penetration, which more than offset the non-fibre disconnects.
Bell CTS retail high-speed Internet subscribers totalled 4,890,602 at December 31 2025, up 8.9% from 4,490,896 subscribers reported at the end of 2024, due to the contribution from Bell CTS U.S. as a result of the acquisition of Ziply Fiber on August 1, 2025, moderated by a decline in Bell CTS Canada. In Q1 2025, we reduced our retail high-speed Internet subscriber base by 80,666 subscribers in Bell CTS Canada, as at March 31, 2025, as we stopped selling new plans for this service under the Distributel, Acanac, Oricom and B2B2C brands.
Additionally, at the beginning of Q1 2025, we reduced our retail high-speed Internet subscriber base by 2,783 subscribers in Bell CTS Canada to adjust for prior year customer deactivations following a review of customer accounts. In Q3 2025, as a result of the acquisition of Ziply Fiber, Bell CTS U.S. retail high-speed Internet subscriber base increased by 442,225 subscribers. In Q4 2025, after a comprehensive review of Ziply Fiber subscriber accounts, we reduced our retail high-speed Internet subscriber base by 13,029 customers to align with Bell methodology for customer deactivations.
Bell CTS Canada retail high-speed Internet subscribers totalled 4,455,460 at December 31, 2025, down 0.8% from 4,490,896 subscribers reported at the end of 2024. In Q1 2025, we reduced our retail high-speed Internet subscriber base by 80,666 subscribers as at March 31, 2025, as we stopped selling new plans for this service under the Distributel, Acanac, Oricom and B2B2C brands. Additionally, at the beginning of Q1 2025, we reduced our retail high-speed Internet subscriber base by 2,783 subscribers to adjust for prior year customer deactivations following a review of customer accounts.
Bell CTS U.S. retail high-speed Internet subscribers totalled 435,142 at December 31, 2025. In Q3 2025, as a result of the acquisition of Ziply Fiber on August 1, 2025, our retail high-speed Internet subscriber base increased by 442,225 subscribers. In Q4 2025, after a comprehensive review of Ziply Fiber subscriber accounts, we reduced our retail high-speed Internet subscriber base by 13,029 customers to align with Bell methodology for customer deactivations.
Retail IPTV
| 2025 | 2024 | Change | % change | |||||||||||||
| Bell CTS retail IPTV net subscriber (losses) activations |
(52,971) | 21,614 | (74,585) | n.m. | ||||||||||||
| Bell CTS Canada |
(52,721) | 21,614 | (74,335) | n.m. | ||||||||||||
| Bell CTS U.S. |
(250) | – | (250) | n.m. | ||||||||||||
| Bell CTS retail IPTV subscribers (1) (2) (3) |
2,085,630 | 2,132,953 | (47,323) | (2.2%) | ||||||||||||
| Bell CTS Canada (2) (3) |
2,079,791 | 2,132,953 | (53,162) | (2.5%) | ||||||||||||
| Bell CTS U.S. (1) |
5,839 | – | 5,839 | n.m. | ||||||||||||
n.m.: not meaningful
| (1) | In Q3 2025, as a result of the acquisition of Ziply Fiber on August 1, 2025, Bell CTS U.S. retail IPTV subscriber base increased by 6,089 subscribers. |
| (2) | In Q1 2025, we reduced our retail IPTV subscriber base by 441 subscribers in Bell CTS Canada, as at March 31, 2025, as we stopped selling new plans for this service under the Distributel, Acanac, Oricom and B2B2C brands. |
| (3) | In Q2 2024, we increased our retail IPTV subscriber base by 40,997 in Bell CTS Canada to align the deactivation policy for our Fibe TV streaming services to our traditional Fibe TV service. |
Bell CTS retail IPTV net subscriber losses of 52,971 in 2025, deteriorated by 74,585 net subscribers compared to net subscriber activations of 21,614 in 2024, driven by a deterioration in Bell CTS Canada of 74,335 net subscribers and net subscriber losses in Bell CTS U.S. of 250, as a result of the acquisition of Ziply Fiber on August 1, 2025.
Bell CTS Canada retail IPTV net subscriber losses of 52,721 in 2025, deteriorated by 74,335 net subscribers, compared to net subscriber activations of 21,614 in 2024, attributable to reduced pull-through on fewer Internet activations, lower activations from our Fibe TV streaming services, reflecting our focus on growing higher-valued subscribers, greater competitive intensity and increased substitution with OTT services, partly offset by a lower number of customers coming off of promotional offers.
Bell CTS U.S. retail IPTV net subscriber losses were 250 in 2025, compared to nil last year, as a result of the acquisition of Ziply Fiber on August 1, 2025, attributable to greater deactivations as traditional IPTV services are challenged by customer adoption of OTT services.
Bell CTS retail IPTV subscribers at December 31, 2025 totalled 2,085,630, down 2.2% from 2,132,953 subscribers reported at the end of 2024, due to a decline in Bell CTS Canada, partly offset by the contribution from Bell CTS U.S. attributable to the acquisition of Ziply Fiber on August 1, 2025. In Q1 2025, we reduced our retail IPTV subscriber base by 441 subscribers in Bell CTS Canada, as at March 31, 2025, as we stopped selling new plans for this service under the Distributel, Acanac, Oricom and B2B2C brands. In Q3 2025, as a result of the acquisition of Ziply Fiber on August 1, 2025, Bell CTS U.S. retail IPTV subscriber base increased by 6,089 subscribers.
Bell CTS Canada retail IPTV subscribers at December 31, 2025 totalled 2,079,791 down 2.5% from 2,132,953 subscribers reported at the end of 2024. In Q1 2025, we reduced our retail IPTV subscriber base by 441 subscribers, as at March 31, 2025, as we stopped selling new plans for this service under the Distributel, Acanac, Oricom and B2B2C brands.
Bell CTS U.S. retail IPTV subscribers at December 31, 2025 totalled 5,839. In Q3 2025, as a result of the acquisition of Ziply Fiber on August 1, 2025, our retail IPTV subscriber base increased by 6,089 subscribers.
| 54 | BCE INC. 2025 ANNUAL FINANCIAL REPORT |
5 MD&A Business segment analysis
Wireline voice
| 2025 | 2024 | Change | % change | |||||||||||||
| Bell CTS retail residential NAS lines net losses |
(181,197 | ) | (187,426 | ) | 6,229 | 3.3% | ||||||||||
| Bell CTS Canada |
(173,734 | ) | (187,426 | ) | 13,692 | 7.3% | ||||||||||
| Bell CTS U.S. |
(7,463 | ) | – | (7,463 | ) | n.m. | ||||||||||
| Bell CTS retail residential NAS lines (1) (2) (3) |
1,722,178 | 1,834,191 | (112,013 | ) | (6.1% | ) | ||||||||||
| Bell CTS Canada (3) |
1,646,307 | 1,834,191 | (187,884 | ) | (10.2% | ) | ||||||||||
| Bell CTS U.S. (1) (2) |
75,871 | – | 75,871 | n.m. | ||||||||||||
n.m.: not meaningful
| (1) | In Q4 2025, after a comprehensive review of Ziply Fiber subscriber accounts following our acquisition on August 1, 2025, we reduced our retail residential NAS subscriber base by 1,106 customers to align with Bell methodology for customer deactivations. |
| (2) | In Q3 2025, as a result of the acquisition of Ziply Fiber on August 1, 2025, Bell CTS U.S. retail residential NAS lines increased by 84,440 subscribers. |
| (3) | In Q1 2025, we reduced our retail residential NAS lines by 14,150 subscribers in Bell CTS Canada, as at March 31, 2025, as we stopped selling new plans for this service under the Distributel, Acanac, Oricom and B2B2C brands. |
Bell CTS retail residential NAS lines net losses decreased by 3.3% in 2025, compared to last year, from lower net losses in Bell CTS Canada of 7.3%, partly offset by net losses in Bell CTS U.S. of 7,463, as a result of the acquisition of Ziply Fiber on August 1, 2025.
Bell CTS Canada retail residential NAS lines net losses decreased by 7.3% in 2025, compared to 2024, resulting from fewer customer deactivations, partly offset by reduced gross activations attributable to ongoing substitution to wireless and Internet-based technologies, combined with less pull-through on lower Internet activations.
Bell CTS U.S. retail residential NAS lines net losses were 7,463 in 2025, compared with nil last year, due to the acquisition of Ziply Fiber on August 1, 2025. The net losses were impacted by continued substitution to wireless and Internet-based technologies.
Bell CTS retail residential NAS lines of 1,722,178 at December 31, 2025, declined by 6.1% from 1,834,191 lines reported at the end of 2024, due to a decline in Bell CTS Canada, partly offset by the contribution from Bell CTS U.S. from the acquisition of Ziply Fiber on August 1, 2025. In Q1 2025, we reduced our retail residential NAS lines by 14,150 lines in
Bell CTS Canada, as at March 31, 2025, as we stopped selling new plans for this service under the Distributel, Acanac, Oricom and B2B2C brands. In Q3 2025, as a result of the acquisition of Ziply Fiber on August 1, 2025, Bell CTS U.S. retail residential NAS lines increased by 84,440 lines. In Q4 2025, after a comprehensive review of Ziply Fiber subscriber accounts, we reduced retail residential NAS lines by 1,106 lines, to align with Bell methodology for customer deactivations.
Bell CTS Canada retail residential NAS lines of 1,646,307 at December 31, 2025, declined by 10.2% from 1,834,191 lines reported at the end of 2024. In Q1 2025, we reduced our retail residential NAS lines by 14,150 subscribers, as at March 31, 2025, as we stopped selling new plans for this service under the Distributel, Acanac, Oricom and B2B2C brands.
Bell CTS U.S. retail residential NAS lines were 75,871 at December 31, 2025. In Q3 2025, as a result of the acquisition of Ziply Fiber on August 1, 2025, our retail residential NAS lines increased by 84,440 lines. In Q4 2025, after a comprehensive review of Ziply Fiber subscriber accounts, we reduced the retail residential NAS lines by 1,106 lines, to align with Bell methodology for customer deactivations.
Competitive landscape and industry trends
This section contains forward-looking statements, including statements relating to our business outlook. Refer to the section Caution regarding forward-looking statements at the beginning of this MD&A.
Competitive landscape
Bell CTS Canada
Wireless products and services
The Canadian wireless industry experienced flat service revenue growth in 2025, which was largely attributable to continued customer growth and penetration gains despite slowing immigration and population growth, offset by moderate pricing pressures. With penetration rates in other developed geographies (U.S., Europe and Asia) well above 100%, the Canadian mobile phone penetration rate is expected to continue to increase, above and beyond the approximate rate of 90% for 2025, in line with the trend toward multiple devices, and the ongoing adoption of mobile devices and services.
In 2025, the Canadian wireless industry continued to experience heightened levels of competition nationally, particularly amongst flanker brands, although the industry overall saw improving competitive dynamics through the second half of the year. The industry continued to see elevated levels of data allocation in monthly plans, including unlimited data plans and Canada-U.S.-Mexico roaming plans, in addition to other ongoing factors, such as: the popularity of data sharing plans, including family plans, and an evolving shift in the customer mix toward non-traditional mobile devices and tools such as video chats. The rollout of 5G network infrastructure continued in 2025, with 5G coverage
by the national carriers reaching approximately 90% of the Canadian population at the end of 2025, compared to approximately 88% at the end of 2024. For Bell, our long-standing focus on network excellence is reflected in the recognition we received from independent third-party sources, including being recognized as Canada’s Fastest and Best 5G wireless network by Ookla in its Q3-Q4 2025 Speedtest Awards report.
The Canadian wireless industry remains highly competitive and capital-intensive among facilities-based providers, as carriers continue to expand and enhance their broadband wireless networks, including the ongoing build-out of 5G and operationalization of spectrum.
Competitors for wireless products and services
| • | Facilities-based national wireless service providers Rogers, the Telus Corporation group of companies (Telus) and Québecor Inc. (Québecor) |
| • | Regional facilities-based wireless service providers Saskatchewan Telecommunications Holding Corporation, which provides service in Saskatchewan; Bragg Communications Inc. (Eastlink), which provides service in the three Maritime provinces |
| • | Cogeco Communications Inc. (Cogeco), which launched mobile service on a limited basis in select markets in Québec and Ontario in July 2025 as a MVNO, offering wireless services to its Internet customers |
| BCE INC. 2025 ANNUAL FINANCIAL REPORT | 55 |
5 MD&A Business segment analysis
Wireline products and services
An estimated 7.5 million Internet subscribers received their service over the networks of the three largest cable companies at the end of 2025, compared to an estimated 7.6 million subscribers at the end of 2024. Meanwhile, an estimated 7.7 million Internet subscribers received their service over the networks of incumbent local exchange carriers (ILECs) like Bell at the end of 2025, compared to approximately 7.7 million at the end of 2024. Bell continues to make gains in market share as a result of the ongoing expansion of our FTTP direct fibre network and increased customer penetration of bundled service offerings. Our ongoing focus on FTTP and its superior characteristics as compared to cable, such as higher and symmetrical download and upload speeds and greater reliability, has allowed us to connect approximately 8 million homes and businesses in Ontario, Québec, the Atlantic provinces and Manitoba to our pure fibre technology. Notably, Bell pure fibre Internet was awarded fastest in Canada in Ookla’s Q3-Q4 2025 Speedtest Awards report for the sixth consecutive reporting period. Bell Pure Fibre also received Best Internet, Best Internet Service Provider Gaming Experience and Top-Rated Internet honours from Ookla.
While many Canadians still watch conventional TV, digital streaming platforms are playing an increasingly important role in the broadcasting industry and in the distribution of content. Popular online video services are providing Canadians with more choice about where, when and how to access video content. In 2025, ILECs offering IPTV service had an estimated combined subscriber base of 3.4 million customers, or a 39% market share, unchanged compared to the end of 2024. Canada’s three largest cable companies had an estimated 4.3 million TV subscribers, or a 49% market share at the end of 2025, down slightly as compared to 50% at the end of 2024. The balance of industry subscribers were served by satellite TV and regional providers.
In recent years, two of Canada’s largest cable companies – Rogers and Québecor’s Vidéotron brand – have launched new television services based on the Comcast X1 video platform. Bell’s IPTV platform, Fibe TV, continues to offer several service advantages relative to cable-based offerings, including flexible pricing plans and packages, picture clarity and quality, a broad and deep content library, and multiple ways for customers to access content. These include hardware-free, app-based Fibe TV on devices customers already own, as well as features such as Restart TV and cloud PVR. Bell’s streaming bundles further enhance the value proposition by providing access to premium streaming services, including Crave, Netflix and Disney+, while offering monthly bundle discounts, simplified billing and the flexibility for customers to manage and modify their streaming subscriptions through Bell.
The financial performance of the overall Canadian wireline telecommunications market continues to be impacted by the ongoing declines in legacy voice service revenues resulting from technological substitution to wireless and OTT services, as well as by the ongoing conversion to IP-based data services and networks by large business customers. Canada’s three largest cable companies had an estimated combined base of approximately 2.3 million telephony subscribers at the end of 2025, representing a national residential market share of approximately 40%, compared to 41% at the end of 2024. Telecommunications companies had an estimated combined total of 2.8 million telephony subscribers at the end of 2025, representing a market share of approximately 50%, compared to approximately 49% at the end of 2024. Other non-facilities-based competitors also offer local and long distance VoIP services and resell high-speed Internet services.
Competitors for wireline products and services
| • | Cable TV providers offering cable TV, Internet and cable telephony services, including: |
| • | Rogers in Ontario, New Brunswick, Newfoundland and Labrador, B.C., Alberta, Saskatchewan and Manitoba |
| • | Vidéotron in Québec |
| • | Cogeco in Ontario and Québec |
| • | Shaw Direct, providing satellite TV service nationwide |
| • | Eastlink in every province except Saskatchewan, where it does not provide cable TV and Internet service |
| • | Telus provides residential voice, Internet and IPTV services in B.C., Alberta and Eastern Québec, and offers retail Internet services in parts of Eastern Canada using mandated wholesale access arrangements under the CRTC regulatory framework |
| • | Telus and Allstream Inc. (Allstream) provide wholesale products and business services across Canada |
| • | Various others such as TekSavvy Solutions and Vonage Canada (a division of Vonage Holdings Corp.) (Vonage) offer resale or VoIP-based local, long distance and Internet services |
| • | LEO satellite providers offering Internet services |
| • | OTT voice and/or video services, such as Zoom, Skype, Netflix, Prime Video, Disney+ and YouTube |
| • | Digital media streaming devices such as Apple TV, Roku and Google Chromecast |
| • | Other Canadian ILECs and cable TV operators |
| • | Substitution to wireless services, including those offered by Bell |
| • | Customized managed outsourcing solutions competitors, such as systems integrators CGI Inc. and IBM |
| • | Wholesale competitors include cable operators, domestic competitive local exchange carrier (CLEC)s, U.S. or other international carriers for certain services, and electrical utility-based telecommunications providers |
Bell CTS U.S.
Wireline products and services
The competitive landscape for Bell CTS U.S. is shaped primarily by competition in residential and business wireline data services, with increasing emphasis on high-bandwidth connectivity and fibre-based solutions.
In residential and small business markets, competition remains intense, with cable operators continuing to compete aggressively on pricing, promotions and marketing to defend market share. At the same time, FTTP technology is expected to maintain a structural competitive advantage over cable, offering lower latency, higher and more consistent speeds, and symmetrical upload and download capabilities. These attributes are increasingly important as customer demand for data-intensive applications continues to grow.
Wireless fixed broadband and satellite-based Internet services have expanded in recent years, primarily targeting lower-bandwidth or underserved customer segments. While these alternatives may address certain use cases, they typically exhibit capacity, latency or usage limitations compared to fibre-based connectivity and are not expected to replace fibre services for customers requiring high-performance broadband.
| 56 | BCE INC. 2025 ANNUAL FINANCIAL REPORT |
5 MD&A Business segment analysis
In business and wholesale markets, competition is driven by demand for high-capacity, reliable connectivity to support cloud adoption, data-intensive applications and the growing use of AI. Technology substitution from legacy copper-based services to fibre-based and IP-enabled solutions continues, increasing competitive pressure while also expanding the addressable market for advanced connectivity services. Competition in these markets includes national carriers, regional providers and competitive local exchange carriers offering Ethernet, wavelength, Internet access and IP-based voice services.
Across all customer segments, industry participants continue to invest in network expansion, automation, self-service capabilities and digital platforms to improve operating efficiency, service quality and the customer experience, while managing the capital intensity associated with fibre network deployment.
Competitors for wireline products and services
| • | Cable TV providers offering residential and small business video, Internet and telephony services, including Comcast and Charter, operating in various markets within Ziply Fiber’s footprint |
| • | Wireless service providers offering fixed wireless broadband services, including AT&T, Verizon and T-Mobile, primarily targeting lower-bandwidth residential and small business use cases |
| • | Satellite broadband providers, such as Starlink, offering Internet services primarily in rural and underserved areas |
| • | OTT video service providers, including Netflix, YouTube TV, YouTube, DirecTV Stream and Hulu, which compete for consumer video viewership |
| • | Commercial and wholesale Ethernet and wavelength service providers, including national carriers, regional providers and CLECs, such as Zayo, Lumen, AT&T, Verizon, Comcast, Charter and various local CLECs |
| • | Commercial IP voice service providers, including cloud-based communications providers such as Zoom, RingCentral, Nextiva and Vonage |
Industry trends
Bell CTS Canada
Wireless products and services
Growth in the Canadian wireless market continues to be supported by rising data usage and the ongoing adoption of data-intensive services. Key drivers include the continued uptake of higher-value smartphones, unlimited data plans, shared and family data offerings, IoT devices, as well as broader mobile access and related data services. These factors are expected to sustain demand for wireless data services over the medium to long term, particularly as usage patterns continue to evolve.
Wireless growth has also been influenced by population and household formation dynamics. As new Canadians become more established and expand their household connectivity needs, additional mobile devices are often added to existing accounts over time, contributing to incremental subscriber growth. However, recent government initiatives to moderate immigration levels, including reductions in international student permits, could weigh on industry subscriber additions in the near term and may contribute to heightened competitive intensity.
Following a period of elevated competition in 2023 and 2024, industry ARPU showed signs of stabilization in 2025. Despite this improvement, pricing pressures remain, driven in part by increased competitive activity and the continued shift toward BYOD plans. The greater prevalence of BYOD offerings has lowered barriers to switching and contributed to higher customer mobility across carriers.
While LTE and LTE-A technologies increase download speeds, encourage data usage and enhance the customer experience, growth in data traffic poses challenges to mobile access technology. To better manage this data traffic, Canadian providers continue to evolve their networks and deploy spectrum to support the shift to 5G. Although the millimetre wave (mmWave) band is important for the expansion of 5G networks, ISED has not yet indicated when the mmWave spectrum auction will commence.
IoT technologies enable communications-enabled devices to connect over wireless networks and exchange data, supporting automation, monitoring and data-driven decision-making across a wide range of applications. IoT platforms and networks are already well-established in sectors such as transportation, retail, manufacturing and natural resources, with adoption continuing to expand across additional industries. Organizations are increasingly integrating IoT solutions with other digital applications to support operational transformation, improve efficiency and generate incremental value from connected assets. As a result, IoT represents a growing opportunity for wireless connectivity, enabling service providers to deliver solutions that enhance security, productivity and service reliability. While IoT connectivity typically generates lower ARPU when sold as a stand-alone service, it supports broader revenue and margin growth by enabling the sale of value-added applications and complementary services. IoT solutions often deepen customer relationships by increasing account penetration and expanding the range of services provided to enterprise and public sector customers. In 2025, we added 324,002 mobile connected device subscribers, bringing our mobile connected device subscriber base to approximately 3.4 million, up 10.4% from 2024.
Wireline products and services
The wireline telecommunications market is expected to remain very competitive in 2026. Although the residential high-speed internet market is maturing, with a penetration rate of approximately 95% across Canada at the end of 2025, subscriber growth is expected to continue over the coming years. Technology substitution, including the growth of wireless and VoIP services, is expected to continue to replace higher-margin legacy voice revenues, while digital streaming services and other online content providers are expected to impact current linear TV services. Bell is an important provider of these substitution services and the decline in this legacy business is continuing as expected, although residential voice losses continued at a slower pace than earlier years, reflecting our success in bundling our home services.
The popularity of viewing television and on-demand content across multiple screens, particularly on handheld and connected devices, is expected to continue to grow as consumer viewing habits evolve. Streaming media providers continue to enhance their OTT and DTC offerings to compete for audience attention. Conventional television content providers are adapting their content and distribution strategies in response to these trends. Bell views OTT and streaming services as an opportunity to enhance our linear and on-demand offerings by providing customers with greater flexibility and choice, while encouraging increased usage of Bell’s high-speed Internet and wireless networks. In 2025, Bell expanded its bundled streaming offerings, including Crave bundles with Netflix and Disney+, as well as new subscription options combining Crave, TSN and RDS.
| BCE INC. 2025 ANNUAL FINANCIAL REPORT | 57 |
5 MD&A Business segment analysis
The Canadian ILECs continue to make significant capital investments in broadband networks, with a focus on FTTP, to maintain and enhance their ability to support advanced IP-based services and higher broadband speeds. Cable companies continue to evolve their cable networks with DOCSIS-related bandwidth enhancements and node splitting. Although the platform increases speed in the near term and is cost-efficient, it does not offer the advanced capabilities of FTTP over the longer term, such as fast symmetrical upload and download speeds.
In the business market, the convergence of IT and telecommunications, enabled by IP-based networks, continues to reshape the competitive landscape, with non-traditional providers increasingly blurring traditional industry boundaries. Telecommunications providers such as Bell are responding by delivering network-centric managed solutions that leverage FTTP investments alongside IT service providers bundling connectivity with software-as-a-service (SaaS) offerings. The evolution of IT has created opportunities for business market services such as cloud, cybersecurity, data and workflow automation solutions. In this context, Bell’s enterprise offerings, including Ateko and Bell Cyber, address customer demand for integrated digital solutions that combine connectivity, security and managed services. In parallel, the emergence of an AI-driven digital transformation is increasing requirements for secure, sovereign data infrastructure, high-performance computing and connectivity, creating opportunities for Bell AI Fabric to support enterprises and governments in deploying and scaling AI-enabled solutions within a Canadian sovereign framework.
Bell CTS U.S.
Wireline products and services
The U.S. residential wireline data telecommunications market is expected to remain highly competitive in 2026. Cable providers continue to respond to subscriber losses in traditional wireline services through pricing actions, promotional activity and increased marketing and retention efforts. At the same time, the limited availability of FTTP infrastructure across large portions of the U.S. continues to create
opportunities for fibre-based providers to differentiate on network performance and service capabilities.
Fibre technology is expected to maintain a structural advantage over cable, offering lower latency, higher and more consistent speeds, and symmetrical upload and download capabilities. These attributes support a broad range of use cases across residential, small business, enterprise and wholesale customers, and are increasingly important as data consumption and application requirements continue to grow.
Wireless fixed and satellite-based broadband offerings have entered the U.S. market in recent years, primarily targeting lower-bandwidth or underserved customer segments. While these services may address specific use cases, they typically exhibit higher latency, capacity constraints and usage limitations compared to fibre-based services, and are not expected to displace fibre connectivity for customers requiring high-performance broadband.
Technology substitution from legacy copper-based services to high-bandwidth IP-based solutions is expected to continue across residential and commercial markets. In the business market, demand for high-capacity connectivity is being driven by increased cloud adoption, data-intensive applications and the growing use of AI, which are increasing bandwidth requirements across organizations of all sizes. Fibre-based providers are expected to continue investing in network expansion and optimization to meet this demand.
In commercial markets, demand for data centre connectivity and colocation services is expected to remain strong, supported by capacity constraints at traditional facilities and increasing customer focus on cost efficiency, latency and network proximity. These trends are creating opportunities for alternative colocation and connectivity solutions that leverage existing fibre infrastructure.
Continued investment in automation, self-service capabilities, network monitoring and digital platforms across the industry is expected to support operating efficiencies, improve service quality and enhance the customer experience.
Business outlook and assumptions
This section contains forward-looking statements, including statements relating to our projected financial performance and network deployment plans, as well as our business outlook, objectives, plans and strategic priorities. Refer to the section Caution regarding forward-looking statements at the beginning of this MD&A.
2026 outlook
Bell CTS Canada
Our outlook for Bell CTS Canada in 2026 is underpinned by continued improvement in wireless performance and growth in AI-powered enterprise solutions, partially offset by ongoing declines in legacy data and voice services. The outlook also reflects an uncertain macroeconomic environment, continued regulatory pricing uncertainty and ongoing competitive pricing pressures. At the same time, the superiority of fibre over cable, our 5G wireless services, digital subscriptions and AI-powered solutions continue to present opportunities for growth.
Moderate wireless subscriber growth is expected in an environment of lower immigration, supported by a mix shift of subscribers toward the premium Bell brand, a continued focus on customer retention, and higher product intensity across converged mobility, Internet and content offerings. We will continue to grow our wireless mobile phone subscriber base in a disciplined and cost-conscious manner while managing heightened competitive intensity and promotional activity across all regions and market segments. Mobile phone blended ARPU is expected to decline modestly, reflecting the flow-through of prior-year competitive pricing pressures and lower data overage revenues resulting from continued adoption of unlimited plans, partially offset by pricing actions, increased subscriber volumes and higher product intensity. We also expect to increase revenues from IoT services and applications.
| 58 | BCE INC. 2025 ANNUAL FINANCIAL REPORT |
5 MD&A Business segment analysis
Growth in the fibre Internet subscriber base is expected to continue, supported by higher household penetration. Growth across the combined IPTV and streaming subscriber base is expected to be supported by the rollout of hardware-free Fibe TV and the adoption of bundled streaming services featuring Crave. Our strategy to increase product intensity by expanding the number of services per household remains a key driver of revenue growth, supported by our Internet speed advantage over cable, a strong customer experience, greater cross-sell penetration of higher-value mobility and Internet households, and the bundling of content.
In enterprise markets, we expect to build on momentum from 2025 by accelerating our AI-powered growth vectors – Ateko, Bell Cyber and Bell AI Fabric – while managing declines in legacy connectivity services. We expect higher product sales and project-based spending by medium and large enterprise and public sector customers, supported by continued wireless subscriber growth. However, as large enterprise customers seek to leverage lower-cost technologies to transform their workforces and respond to increased economic uncertainty, spending on core traditional telecommunications services and products is expected to remain variable.
We will continue to focus on our operating cost structure to help offset pressures from slowing customer growth, ongoing erosion of high-margin wireline voice and other legacy revenues, and competitive repricing pressures. Continued operating efficiencies enabled by our direct fibre footprint, changes in consumer behaviour and product innovation, digital and AI adoption, product and service enhancements, expanding self-serve capabilities, new call centre and digital investments, other improvements to the customer service experience, management workforce reductions including attrition and retirements, and lower contracted rates from our suppliers are expected to deliver meaningful cost savings and productivity gains across the organization.
Bell CTS U.S.
The outlook for Bell CTS U.S. reflects the incremental financial contribution of Ziply Fiber, with seven additional months of operations in 2026 compared to 2025. The outlook also reflects an uncertain macroeconomic environment, competitive pricing pressure from cable providers, and execution risks associated with permitting and pole attachments related to fibre expansion.
Ziply Fiber’s fibre build program is expected to accelerate in 2026 following the reprioritization of investment toward higher-growth markets. This is expected to drive higher year-over-year Internet net subscriber additions and support revenue and adjusted EBITDA growth, as the business continues to benefit from the operating leverage inherent in its fibre platform.
The outlook also reflects opportunities to increase penetration of residential and commercial data services across existing and newly built fibre assets. Demand for high-bandwidth commercial connectivity, including data centre and colocation services, is expected to support growth, driven by increased cloud adoption and data-intensive applications. Continued investments in automation, self-service and digital capabilities are expected to support operating efficiencies and enhance the customer experience.
Assumptions
Bell CTS Canada
| • | Stabilizing wireless market share of net additions as we manage increased competitive intensity and promotional activity across all regions and market segments |
| • | Ongoing expansion and deployment of 5G and 5G+ wireless networks, offering competitive coverage and quality |
| • | Continued diversification of our distribution strategy with a focus on expanding DTC and online transactions |
| • | Slightly declining mobile phone blended ARPU due to competitive pricing pressure |
| • | Continuing business customer adoption of advanced 5G, 5G+ and IoT solutions |
| • | Continued scaling of technology services from recent acquisitions made in the enterprise market through leveraging our sales channels with the acquired businesses’ technical expertise |
| • | Continued growth in retail fibre Internet subscribers |
| • | Increasing wireless and Internet-based technological substitution |
| • | Continued focus on the consumer household and bundled service offers for mobility, Internet and content services |
| • | Continued large business customer migration to IP-based systems |
| • | Ongoing competitive repricing pressures in our business and wholesale markets |
| • | Traditional high-margin product categories challenged by large global cloud and OTT providers of business voice and data solutions expanding into Canada with on-demand services, which, in many cases, are also sold as a service by Bell Business Markets (BBM) to ensure continuity of customer relationships and adjacent revenue growth opportunities |
| • | Increasing customer adoption of OTT services resulting in downsizing of TV packages and fewer consumers purchasing BDU subscriptions services |
| • | Realization of cost savings related to operating efficiencies enabled by our direct fibre footprint, changes in consumer behaviour and product innovation, digital and AI adoption, product and service enhancements, expanding self-serve capabilities, new call centre and digital investments, other improvements to the customer service experience, management workforce reductions including attrition and retirements, and lower contracted rates from our suppliers |
Bell CTS U.S.
| • | Continued growth in retail Internet customers with continued deployment of direct fibre to incremental homes and businesses both within our existing footprint and in new markets |
| • | Increasing retail Internet ARPU through continued migration of customers to higher speed tiers and rate increases |
| • | Ongoing competitive repricing pressures in our business and wholesale markets |
| • | Realization of cost savings related to operational efficiencies enabled by our direct fibre footprint, digital and AI adoption, expanding self service capabilities, and other improvements to the customer service experience |
| BCE INC. 2025 ANNUAL FINANCIAL REPORT | 59 |
5 MD&A Business segment analysis
Key growth drivers
Bell CTS Canada
| • | Increasing mix of customers on the main premium Bell brand |
| • | Higher product intensity across converged mobility, Internet and content offerings, driven by cross-selling to customers who do not currently take all of their telecommunications services from Bell |
| • | Continued expansion of the FTTP footprint, albeit at a slower pace than during the 2020–2025 period |
| • | Rising penetration of FTTP and WTTP services |
| • | Ongoing growth in retail fibre Internet subscriber base |
| • | Continued growth in AI-powered solutions in enterprise markets |
| • | Expansion of business customer relationships, driving higher revenue per customer |
| • | Ongoing service innovation and enhancements to the product suite |
Bell CTS U.S.
| • | Increased financial contribution from Ziply Fiber in 2026, reflecting seven additional months of operations compared to 2025 |
| • | Accelerated expansion of the Ziply Fiber build plan, supporting higher year-over-year fibre Internet subscriber additions |
| • | Increased penetration of residential and commercial data services within existing fibre assets |
| • | New customer acquisition in newly built fibre markets in 2026 |
| • | Expansion and deeper penetration in commercial verticals, including education, data centre and colocation customers |
| • | Ongoing service innovation and enhancements to the data and voice product suite |
Principal business risks
This section discusses certain principal business risks specifically related to the Bell CTS Canada and Bell CTS U.S. segments. For a detailed description of the other principal risks that could have a material adverse effect on our business, refer to section 9, Business risks.
Bell CTS Canada
Aggressive competition
Risk
| • | The intensity of competitive activity from national wireless operators, smaller or regional facilities-based wireless service providers, non-traditional players and resellers |
| • | The intensity of competitive activity coupled with the proliferation of instalment and/or buy and pay later plans, and new wireline product launches for residential customers (e.g., IoT, smart home systems and devices, innovative TV platforms, etc.) and business customers (e.g., OTT VoIP, collaboration and SD WAN solutions) from national operators, non-traditional players and wholesalers, including the expanded offering of retail services based on wholesale access by large facilities-based competitors |
| • | The competition from both global and domestic system integrators driving pricing pressure across the industry |
Potential impact
| • | Pressure on our revenue, adjusted EBITDA, ARPU, cash flows and churn would likely result if wireless competitors continue to aggressively pursue new types of price plans, increase discounts, offer shared plans based on sophisticated pricing requirements (e.g., instalments) or offer other incentives, such as cash-back for upgrade with old smartphone and multi-product bundles, in order to attract new customers |
| • | An increase in the intensity level of competitive activity for wireline services could result in lost revenue, higher churn and increased acquisition and retention expenses, all of which would put pressure on Bell CTS Canada’s adjusted EBITDA |
Regulatory environment
Risk
| • | Increased regulation of wireless services, pricing and infrastructure, such as additional mandated access to wireless networks, establishing rates for mandated wireless services that are materially different from the rates we propose, and limitations placed on future spectrum bidding |
| • | In an interim decision (Interim Decision), the CRTC determined that aggregated wholesale high-speed access to Bell Canada’s FTTP facilities in Ontario and Québec should be mandated on a temporary and expedited basis, and the CRTC set interim rates. Subsequently, in a final decision (Final Decision), the CRTC mandated the establishment of an aggregated wholesale high-speed access service available on FTTP facilities to be provided by large ILECs in all of their respective incumbent territories as of February 13, 2025. This new service materially improves the business position of our competitors. Several parties filed Part 1 applications asking the CRTC to review and vary several aspects of the Final Decision. On June 20, 2025, the CRTC issued Telecom Decision CRTC 2025-154 (the R&V Decision) denying all of the review and vary applications. In a motion dated July 18, 2025, Cogeco and Eastlink sought leave to appeal the R&V Decision to the Federal Court of Appeal, which was granted on September 10, 2025. Competitive Network Operators of Canada (CNOC), Cogeco, Eastlink, and Saskatchewan Telecommunications filed a joint appeal of the Final Decision to the Governor-in-Council, and on August 6, 2025, the Governor-in-Council announced that it had declined to alter the Final Decision. In September 2025, Cogeco, Eastlink and Saskatchewan Telecommunications, Rogers Communications Canada Inc., and CNOC filed appeals of the R&V Decision to the Governor-in-Council. The financial impact of these regulatory obligations will be determined in part by whether the CRTC establishes final rates that fully compensate Bell Canada for the significant costs and risks Bell Canada assumes in expanding and upgrading its networks. |
| 60 | BCE INC. 2025 ANNUAL FINANCIAL REPORT |
5 MD&A Business segment analysis
Potential impact
| • | Increased regulation could influence network investment and the market structure, limit our flexibility, improve the business position of our competitors, limit network-based differentiation of our services, and negatively impact the financial performance of our Bell CTS Canada segment |
| • | In respect of the new aggregated wholesale high-speed access service mandated on FTTP facilities: (i) the mandating of final rates that are materially different from the rates we proposed could have a financial impact, (ii) while we are able to make use of wholesale FTTP in the traditional territory of Telus Communications Inc., and vice versa, our traditional territory has a larger customer base than that of Telus Communications Inc., giving the latter access to a larger base of potential new customers than we will gain access to; (iii) we and our brands that resell wholesale high-speed access services over competitors’ cable are no longer allowed to sell those services to new customers within our traditional wireline incumbent serving territory, and (iv) in the case of our existing wholesale high-speed access service, the implementation of the rates for aggregated or disaggregated wholesale high-speed access services could change our investment strategy, especially in relation to investment in next-generation wireline networks in smaller communities and rural areas, improve the business position of our competitors, further accelerate penetration and disintermediation by OTT players, and negatively impact the financial performance of our business |
Market environment, technological advancement and changing customer behaviour
Risk
| • | Slower subscriber growth due to high Canadian Internet and smartphone penetration, combined with potential pressures from the economic environment and reduced discretionary spending, and reductions in immigration levels |
| • | With technological advancement, the traditional TV viewing model (i.e., a subscription for bundled channels) is challenged by an increasing number of legal and illegal viewing options available in the market offered by traditional, non-traditional and global players, as well as increasing cord-cutting and cord-shaving trends |
| • | The proliferation of network technologies impacts business customers’ decision to migrate to OTT, VoIP and/or leverage SD WAN architecture |
| • | Changing customer habits further contribute to the erosion of NAS lines |
Potential impact
| • | A maturing wireline and wireless market with reductions in immigration levels could challenge subscriber growth and the cost of subscriber acquisition and retention, putting pressure on the financial performance of our business |
| • | Our market penetration and number of TV subscribers could decline as a result of innovative offerings by BDUs and an increasing number of domestic and non-domestic unregulated OTT providers, as well as a significant volume of content piracy |
| • | The proliferation of IP-based products, including OTT content and OTT software offerings directly to consumers, may accelerate the disconnection of TV services or the reduction of TV spending, as well as the reduction in business IT investments by customers |
| • | The ongoing loss of NAS lines challenges our traditional voice revenues and compels us to develop other service offerings |
Bell CTS U.S.
Aggressive competition
Risk
| • | The intensity of competitive activity from national and regional wireless home broadband operators, satellite broadband providers and wired fibre overbuilders |
| • | The intensity of competitive activity coupled with aggressive rate actions from commercial and residential providers and migration from copper-based solutions |
Potential impact
| • | Pressure on our revenue, adjusted EBITDA, ARPU, cash flows and churn would likely result if wireless broadband, satellite broadband and wired cable competitors aggressively pursue new types of price plans and increase discounts, or offer other incentives, in order to attract new customers |
| • | An increase in the intensity level of competitive activity for wireline services could result in lost revenue, higher churn and increased acquisition and retention expenses, all of which would put pressure on Bell CTS U.S.’s adjusted EBITDA |
Regulatory environment
Risk
| • | U.S. regulatory agencies, states and local governments exercise significant control over Ziply Fiber’s operations, rates and infrastructure deployment |
Potential impact
| • | Increased state or local regulation, or modification of current obligations, could limit Ziply Fiber’s ability to deploy further infrastructure in a state or municipality, and delay expected build timeline |
Market environment, technological advancement and changing customer behaviour
Risk
| • | Slower subscriber growth due to new competitor entrants, combined with potential pressures from the economic environment and reduced discretionary spending |
| • | The competitive advancement of wireless and satellite broadband to compete with fibre offerings making them more attractive to the common users of broadband |
| • | Competitiveness of legacy switched-based services where fibre is not present will contribute to the erosion of legacy revenue |
Potential impact
| • | A maturing wireline and wireless market could challenge subscriber growth and the cost of subscriber acquisition and retention, putting pressure on the financial performance of our business |
| • | The ongoing loss of NAS lines challenges our traditional voice revenues and compels us to build fibre as a competitive offering |
| BCE INC. 2025 ANNUAL FINANCIAL REPORT | 61 |
5 MD&A Business segment analysis
| 5.2 | Bell Media |
Financial performance analysis
2025 performance highlights
Bell Media results
Revenues
| 2025 | 2024 | $ change | % change | |||||||||||||
| External revenues |
2,815 | 2,817 | (2 | ) | (0.1% | ) | ||||||||||
| Inter-segment revenues |
339 | 334 | 5 | 1.5% | ||||||||||||
| Bell Media operating revenues |
3,154 | 3,151 | 3 | 0.1% | ||||||||||||
Bell Media operating revenues were up a modest 0.1% in 2025, compared to last year, due to higher other and subscriber revenues, partly offset by the lower advertising revenues. This included year-over-year growth from digital revenues of 6.0% in 2025.
| • | Advertising revenues decreased by 5.6% in 2025, compared to last year, due to continued lower demand for traditional advertising impacting all traditional platforms, most notably, conventional and entertainment specialty channels. Additionally, the year-over-year decline in advertising revenues reflected reduced audio advertising revenues from the previously announced divestitures of 45 radio stations, partly offset by greater OOH advertising revenues which benefited from the acquisition of OUTEDGE in June 2024, as well as higher digital video advertising revenues from growth in Connected TV and ad-supported subscription tiers on Crave, underscoring Bell Media’s shift towards video, audio and OOH digital platforms. |
| • | Subscriber revenues increased by 2.7% in the year, compared to 2024, due to the growth in Crave and sports streaming revenues primarily from higher DTC streaming subscribers, moderated by ongoing erosion in BDU subscribers and the benefit in Q3 2024 from retroactive adjustments related to contracts with Canadian TV distributors |
| • | Other revenues increased in 2025, compared to last year, due to higher program sales, in part driven by the acquisition of Sphere Abacus, a global content distributor, in May 2025, and greater year-over-year revenues from the F1 Canadian Grand Prix 2025 |
| 62 | BCE INC. 2025 ANNUAL FINANCIAL REPORT |
5 MD&A Business segment analysis
Operating costs and adjusted EBITDA
| 2025 | 2024 | $ change | % change | |||||||||||||
| Operating costs |
(2,372 | ) | (2,393 | ) | 21 | 0.9% | ||||||||||
| Adjusted EBITDA |
782 | 758 | 24 | 3.2% | ||||||||||||
| Adjusted EBITDA margin |
24.8% | 24.1% | 0.7 pts | |||||||||||||
Bell Media operating costs decreased by 0.9% in 2025, compared to last year, due to:
| • | Content cost savings, partly offset by contractual sports broadcasting rights and programming cost increases |
| • | Savings from cost reduction initiatives, mainly workforce reductions and other operating efficiencies |
| • | Lower expenses related to the radio station divestitures |
These factors were partly offset by:
| • | The operating expenses of OUTEDGE and Sphere Abacus as a result of the acquisitions |
| • | Higher expenses associated with the revenue growth from the F1 Canadian Grand Prix 2025 |
Bell Media adjusted EBITDA increased by 3.2% in 2025, compared to the prior year, mainly driven by lower operating costs.
Bell Media operating metrics
| • | Total Crave subscribers at December 31, 2025, increased by 26% over last year to 4.6 million, driven by a 65% increase in Crave DTC streaming subscribers |
| • | For broadcast season 2024-25, CTV maintained its #1 ranking as the most-watched network in Canada for the 24th year in a row among total viewers in primetime, with 9 of the top 20 programs nationally among total viewers |
| • | English specialty and pay TV properties reached 68% of all Canadian English specialty and pay TV viewers in an average week among key viewers aged 25 to 54, while French specialty and pay TV properties reached 66% of Québec French specialty and pay TV viewers in an average week |
| • | Noovo had 2 out of the top 15 most watched regular shows on French conventional TV among viewers aged 25 to 54 |
| • | Canadians consume over 750 million hours of Bell Media content in the average month. Consumption of Bell Media content on digital platforms has increased by more than 50% year-over-year across our Crave, TSN, RDS and News brands. |
| • | Astral continues to be a leading OOH solution provider across Canada, offering a range of five product lines: outdoor advertising, street furniture, airport, large digital format and transit |
Competitive landscape and industry trends
This section contains forward-looking statements, including statements relating to our business outlook. Refer to the section Caution regarding forward-looking statements at the beginning of this MD&A.
Competitive landscape
Competition for content in the Canadian media industry continues to be increasingly concentrated among a small number of global competitors with significant scale and financial resources. Technological advances have enabled new entrants to become media players in their own right, while some incumbents have become more vertically integrated across traditional and emerging platforms to support the acquisition, distribution and monetization of premium content. Global aggregators have also emerged, competing for both content rights and audience attention.
Bell Media competes across the video, audio, OOH advertising and digital media markets:
| • | Video: The video market has become increasingly fragmented and is expected to continue to evolve as new services, platforms and technologies expand the range of information and entertainment options available to consumers. Competition for viewership continues to intensify across linear, on-demand and streaming services as consumer viewing habits shift. |
| • | Audio: Competition in the radio broadcasting industry occurs primarily at the local market level among individual stations, while the broader audio market is increasingly influenced by global streaming platforms offering music and podcast content |
| • | OOH: The Canadian OOH advertising market is fragmented, comprising a small number of large national operators alongside numerous regional and local providers operating in specific geographic markets |
| • | Digital media: Consumer demand for digital media, mobile content and on-demand services continues to grow, driving increased digital adoption across media products. As a result, advertisers are shifting spending toward premium digital video and audio formats on global digital platforms and social media that enable more targeted audience engagement compared to traditional mass-market advertising. In response, Bell Media and other media companies are enhancing their digital capabilities and selling advertising inventory through data-enabled and programmatic buying platforms that support more targeted and measurable advertising solutions. |
| BCE INC. 2025 ANNUAL FINANCIAL REPORT | 63 |
5 MD&A Business segment analysis
Competitors
Video
| • | Conventional Canadian TV stations (local and distant signals) and specialty and pay channels, such as those owned by Corus Entertainment Inc. (Corus), Rogers, Québecor and Canadian Broadcasting Corporation (CBC)/Société Radio-Canada |
| • | U.S. conventional TV stations and specialty channels |
| • | OTT streaming providers such as Netflix, Prime Video, Disney+, Apple TV+, Paramount +, Discovery+ and DAZN |
| • | Digital platforms such as YouTube, TikTok and Instagram |
| • | FAST channels |
Audio
| • | Large radio operators, such as Rogers, Corus, Cogeco and Stingray Group Inc. that also own and operate radio station clusters in various local markets |
| • | Radio stations in specific local markets |
| • | Satellite radio provider SiriusXM |
| • | Podcast networks and distributors |
| • | Music and podcast streaming services such as Spotify, Apple Music and Apple Podcasts |
| • | Music downloading services such as Apple’s iTunes Store |
| • | Other media such as newspapers, local weeklies, TV, magazines, outdoor advertising and the Internet |
OOH advertising
| • | Large outdoor and indoor advertisers, such as Allvision, Branded Cities, Lamar Advertising, Pattison Outdoor, Québecor, Vendo Media, REC Media, UB Media, Cineplex, and Rogers Sports & Media |
| • | Numerous smaller and local companies operating a limited number of faces in a few local markets |
| • | Other media such as video, audio, print media and the Internet |
Industry trends
Consumers continue to have access to a growing array of online entertainment and information options, with new services introduced regularly. This expansion has contributed to increased fragmentation in viewing and consumption habits. While traditional linear television continues to deliver higher overall viewership relative to other forms of video consumption, the gap is narrowing as audiences increasingly
consume content across a broader range of platforms and formats. Viewers are watching more content online, viewing less scheduled programming live, consuming more video on mobile and connected devices, and accessing expanded libraries of on-demand programming.
Streaming services such as Crave, Netflix, Prime Video, Disney+, Apple TV+ and YouTube are widely used by households to complement linear television viewing, with a growing number of consumers using these services as alternatives to traditional linear packages. As content becomes more widely distributed across providers, competition for viewership has intensified, contributing to higher content costs and increasing the need for consumers to subscribe to multiple services. In response, the industry has introduced bundled offerings, lower-priced ad-supported tiers and an expanded range of FAST channels, including platforms such as The Roku Channel, Tubi and Pluto TV. As of 2026, Bell Media operates 13 English- and French-language FAST channels featuring entertainment, factual, news and sports programming, available across multiple distribution platforms, including LG Channels, Samsung TV Plus, Plex, The Roku Channel, Tubi and Bell TV.
Premium video content remains a key differentiator for media companies seeking to attract and retain audiences and advertisers. Live sports and special events, in particular, are expected to continue to draw significant viewership. However, competition for premium content rights has intensified, with global players such as Netflix, Prime Video, Disney+, DAZN, Paramount+ and Apple TV+ increasing demand for content, contributing to higher program rights costs and increased competition for key properties.
Consumer behaviour continues to evolve, prompting media companies to adapt their content, distribution and product strategies. Many companies have expanded DTC offerings to better compete with non-traditional platforms, including Bell Media’s bilingual Crave service, TSN and RDS, which are available across a wide range of devices and platforms. While SVOD services continue to dominate the streaming landscape, AVOD and FAST services are experiencing strong growth, driven in part by demand from more price-conscious consumers.
In parallel, advertising buying patterns are shifting across all media platforms. Growth in digital consumption has increased demand for more targeted, data-driven advertising solutions, including self-serve and programmatic buying models. As a result, Bell Media and other media companies are enhancing their advertising platforms and capabilities to offer more targeted and measurable advertising solutions through data-enabled and programmatic channels.
| 64 | BCE INC. 2025 ANNUAL FINANCIAL REPORT |
5 MD&A Business segment analysis
Business outlook and assumptions
This section contains forward-looking statements, including statements relating to our projected financial performance and our business outlook, objectives, plans and strategic priorities. Refer to the section Caution regarding forward-looking statements at the beginning of this MD&A.
2026 outlook
Bell Media is targeting positive revenue growth in 2026, driven by continued scaling of digital advertising across Connected TV, DAAI, ad-supported Crave offerings, and growth in global content distribution through Sphere Abacus. The advertising market continues to shift toward digital platforms, while most legacy Canadian TV and radio platforms are experiencing flat to declining audiences. Subscriber revenue growth is expected to be supported by the continued scaling of Crave, TSN and RDS streaming services through expanded distribution, optimized content offerings and ongoing user experience (UX) enhancements. At the same time, continued shifts in media consumption toward competing OTT and digital platforms, as well as ongoing TV cord-shaving and cord-cutting, are expected to continue to pressure legacy media subscriber volumes and revenues.
Bell Media remains focused on advancing its digital-first media strategy, including growing digital revenues and DTC subscribers. The business also continues to emphasize cost discipline by pursuing productivity gains and operational efficiencies across its media properties, while maintaining investment in premium content across all screens and platforms.
Across its media portfolio, particularly in video, Bell Media intends to leverage its market position and enhanced audience targeting capabilities to offer advertisers premium opportunities to reach national and local audiences. Execution in this area depends on the continued acquisition of highly rated and differentiated programming, the maintenance of strategic content supply arrangements across platforms, and the production and commissioning of high-quality Canadian content. Bell Media also plans to continue scaling Connected TV and DAAI, enabling more precise advertising targeting and personalized ad experiences at the household and device level.
Bell Media’s sports offerings are expected to remain a significant driver of audience engagement, including coverage of major events such as the 2026 FIFA World Cup. These offerings, together with the continued integration of digital platforms, are central to the strategy to enhance viewership and engagement. Bell Media will also continue to invest in innovative, high-quality sports news and editorial programming.
In non-sports specialty TV, audience performance and advertising revenues are expected to be supported by continued investment in quality programming and original productions.
Crave, Bell Media’s bilingual premium streaming service, continues to be a central component of the digital strategy. Following its recent expansion to include additional content, including news, select sports and an expanded kids’ offering, Bell Media expects to continue leveraging its premium content portfolio – including HBO, Max, STARZ and original English- and French-language programming – to attract and retain DTC subscribers. Ongoing efforts will focus on expanded distribution and continued platform enhancements.
Bell Media will continue to support original French-language programming, with an emphasis on digital platforms such as Crave, Noovo.ca and iHeartRadio Canada, to better serve French-language audiences through more personalized digital experiences.
Global content distribution is expected to remain an important growth driver through Bell Media’s majority ownership of Sphere Abacus, which serves as the primary international distributor of Bell Media’s owned content rights. This platform is expected to expand global reach, enhance monetization opportunities and support the international distribution of Canadian content and creators.
In audio, Bell Media intends to continue offering advertisers attractive national and local opportunities, including the scaling of DAAI. In addition, Bell Media will pursue opportunities to leverage synergies across its video and audio properties, including content promotion, expanded content distribution through iHeartRadio Canada and continued operational efficiencies.
In OOH advertising, Bell Media continues to provide advertisers with exposure across key Canadian markets. The business will continue to pursue growth opportunities in digital OOH, including the conversion of select static outdoor structures to digital formats and the development of new digital locations to meet increasing advertiser demand.
Assumptions
| • | Overall digital revenue expected to reflect scaling of Connected TV, DTC advertising and subscriber growth, as well as digital growth in our OOH business contributing towards the advancement of our digital-first media strategy |
| • | Leveraging of first-party data to improve targeting, advertisement delivery including personalized viewing experience and attribution |
| • | Strategically managing escalating content acquisition and production costs to secure high-quality, differentiated programming across all screens and platforms |
| • | Continued scaling of Crave, TSN, and RDS through expanded distribution, partnerships, content offerings and UX improvements |
| • | Global content distribution growth through majority ownership of Sphere Abacus |
| • | Continued support in original French content with a focus on digital platforms such as Crave, Noovo.ca and iHeartRadio Canada, to better serve our French-language customers through a personalized digital experience |
| • | No adverse material financial, operational or competitive consequences of changes in or implementation of regulations affecting our media business |
| BCE INC. 2025 ANNUAL FINANCIAL REPORT | 65 |
5 MD&A Business segment analysis
Key growth drivers
| • | Continued scaling of Crave, TSN and RDS streaming through expanded distribution including bundles and partnerships |
| • | Continued growth in Connected TV, DAAI, Crave with Ads and FAST channels, as well as digital growth in our OOH business |
| • | Delivery of compelling content to maintain strength in audience performance and scale global content distribution |
| • | Growth in global content distribution through Sphere Abacus |
Principal business risks
This section discusses certain principal business risks specifically related to the Bell Media segment. For a detailed description of the other principal risks that could have a material adverse effect on our business, refer to section 9, Business risks.
Advertising and subscription revenue uncertainty
Risk
| • | Advertising is heavily dependent on economic conditions and viewership, and traditional media is under increasing pressure for advertising spend against dominant non-traditional/global digital services |
| • | The advertising market could be further impacted by canceled or delayed advertising campaigns from many sectors due to the economic environment |
| • | Bell Media has contracts with a variety of BDUs, under which monthly subscription fees for specialty and pay TV services are earned, which expire on a specific date |
Potential impact
| • | Economic uncertainty could continue to impact advertisers’ spending. Our failure to increase or maintain viewership or capture our share of the changing and fragmented advertising market, including digital revenues, could result in the loss of advertising revenue. |
| • | If we are not successful in obtaining favourable agreements with BDUs, it could result in the loss of subscription revenue |
Aggressive competition
Risk
| • | The intensity of competitive activity from new technologies and alternative distribution platforms such as unregulated OTT content offerings, VOD, personal video platforms, DTC distribution and pirated content, in addition to traditional TV services, in combination with the development of more aggressive product and sales strategies by non-traditional global players with a much larger scale |
Potential impact
| • | Increased competitive activity in combination with the development of more aggressive product and sales strategies could have an adverse impact on the level of subscriptions and/or viewership for Bell Media’s TV services and on Bell Media’s revenue streams |
Rising content costs and ability to secure key content
Risk
| • | Rising content costs, as an increasing number of domestic and global competitors seek to acquire the same content or to restrict content within their own ecosystems, and the ability to acquire or develop key differentiated content to drive revenues and subscriber growth |
Potential impact
| • | Rising programming costs could require us to incur unplanned expenses, which could result in negative pressure on adjusted EBITDA |
| • | Our inability to acquire or develop popular programming content could adversely affect Bell Media’s viewership and subscription levels and, consequently, advertising and subscription revenues |
| 66 | BCE INC. 2025 ANNUAL FINANCIAL REPORT |
6 MD&A Financial and capital management
| 6 | Financial and capital management |
This section tells you how we manage our cash and capital resources to carry out our strategy and deliver financial results. It provides an analysis of our financial condition, cash flows and liquidity on a consolidated basis.
| 6.1 | Net debt |
| 2025 | 2024 | $ change | % change | |||||||||||||
| Long-term debt |
34,904 | 32,835 | 2,069 | 6.3% | ||||||||||||
| Less: 50% of junior subordinated debt (1) |
(2,149 | ) | – | (2,149 | ) | n.m. | ||||||||||
| Debt due within one year |
6,155 | 7,669 | (1,514 | ) | (19.7% | ) | ||||||||||
| 50% of preferred shares (2) |
1,644 | 1,767 | (123 | ) | (7.0% | ) | ||||||||||
| Cash |
(314 | ) | (1,572 | ) | 1,258 | 80.0% | ||||||||||
| Cash equivalents |
(6 | ) | – | (6 | ) | n.m. | ||||||||||
| Short-term investments |
– | (400 | ) | 400 | 100.0% | |||||||||||
| Net debt (3) |
40,234 | 40,299 | (65 | ) | (0.2% | ) | ||||||||||
n.m.: not meaningful
| (1) | 50% of junior subordinated debt at December 31, 2025 is excluded as it has been afforded equity treatment by certain credit rating agencies. |
| (2) | 50% of outstanding preferred shares of $3,288 million and $3,533 million at December 31, 2025 and December 31, 2024, respectively, are classified as debt consistent with the treatment by some credit rating agencies. |
| (3) | Net debt is a non-GAAP financial measure. See section 11.1, Non-GAAP financial measures in this MD&A for more information on this measure. |
The decrease of $1,514 million in debt due within one year and the increase $2,069 million in long-term debt were due to:
| • | the issuance by Bell Canada of Series A Notes, with a total principal amount of $1,000 million in U.S. dollars ($1,416 million in Canadian dollars) |
| • | the issuance by Bell Canada of Series B Notes, with a total principal amount of $1,250 million in U.S. dollars ($1,771 million in Canadian dollars) |
| • | the issuance by Bell Canada of Series C Notes, with a total principal amount of $1,250 million |
| • | the issuance by Bell Canada of Series M-64 MTN debentures, with a total principal amount of $400 million |
| • | the issuance by Bell Canada of Series M-65 MTN debentures, with a total principal amount of $500 million |
| • | the issuance by Bell Canada of Series M-66 MTN debentures, with a total principal amount of $600 million |
| • | the issuance by Bell Canada of Series M-67 MTN debentures, with a total principal amount of $500 million |
| • | an increase in outstanding loans of $487 million in U.S. dollars ($678 million in Canadian dollars) under the Bell Canada unsecured committed term loan facility |
| • | an increase of $1,998 million in U.S. dollars ($2,757 million in Canadian dollars) due to the acquisition of Ziply Fiber comprised of Term Notes with an outstanding principal amount of $1,594 million in U.S. dollars ($2,199 million in Canadian dollars), Secured Fiber Network Revenue Funding Notes (Funding Notes) with an outstanding principal amount of $367 million in U.S. dollars ($506 million in Canadian dollars) and lease liabilities and other debt of $37 million in U.S. dollars ($52 million in Canadian dollars) |
| • | an increase in outstanding loans of $500 million in U.S. dollars ($697 million in Canadian dollars) under a new unsecured term loan facility |
| • | a increase in notes payable (net of repayments) of $452 million |
Partly offset by:
| • | the repayment at maturity of Series M-47 MTN debentures, with a total principal amount of $1,500 million |
| • | the repayment at maturity of Series M-49 MTN debentures, with a total principal amount of $600 million |
| • | the repurchase by Bell Canada, pursuant to tender offers, for an aggregate cash purchase price of $633 million in U.S. dollars ($903 million in Canadian dollars) of: |
| • | a principal amount of $174 million in U.S. dollars ($249 million in Canadian dollars) of its Series US-2 Notes, that had an outstanding principal amount of $600 million in U.S. dollars ($856 million in Canadian dollars) |
| • | a principal amount of $79 million in U.S. dollars ($112 million in Canadian dollars) of its Series US-4 Notes, that had an outstanding principal amount of $500 million in U.S. dollars ($713 million in Canadian dollars) |
| • | a principal amount of $183 million in U.S. dollars ($261 million in Canadian dollars) of its Series US-5 Notes, that had an outstanding principal amount of $600 million in U.S. dollars ($856 million in Canadian dollars) |
| • | a principal amount of $191 million in U.S. dollars ($273 million in Canadian dollars) of its Series US-6 Notes, that had an outstanding principal amount of $650 million in U.S. dollars ($927 million in Canadian dollars) |
| • | a principal amount of $217 million in U.S. dollars ($310 million in Canadian dollars) of its Series US-7 Notes, that had an outstanding principal amount of $750 million in U.S. dollars ($1,070 million in Canadian dollars) |
| BCE INC. 2025 ANNUAL FINANCIAL REPORT | 67 |
6 MD&A Financial and capital management
| • | the repurchase by Bell Canada, pursuant to tender offers, for an aggregate cash purchase price of $1,498 million of: |
| • | a principal amount of $105 million of its Series M-39 MTN debentures, that had an outstanding principal amount of $500 million |
| • | a principal amount of $100 million of its Series M-45 MTN debentures, that had an outstanding principal amount of $500 million |
| • | a principal amount of $1,166 million of its Series M-51 MTN debentures, that had an original outstanding principal amount of $1,250 million |
| • | a principal amount of $460 million of its Series M-55 MTN debentures, that had an outstanding principal amount of $550 million |
| • | a decrease in debt of $636 million due to an early debt redemption gain as a result of the tender offers described above |
| • | the repurchase by Bell Canada, in the open market, for a cash purchase price of $6 million, of a principal amount of $7 million of its Series M-55 MTN debentures, that had an outstanding principal amount of $90 million, following the tender offers described above |
| • | the redemption, prior to maturity, of Series M-41 MTN debentures that had an outstanding principal amount of $750 million, for an aggregate purchase price of $750 million |
| • | the repayment of the outstanding loan of $600 million in U.S. dollars ($814 million in Canadian dollars) under the Bell Mobility Inc. (Bell Mobility) trade loan agreement |
| • | the redemption, prior to maturity, of the outstanding principal amount of $1,594 million in U.S. dollars ($2,192 million in Canadian dollars) of Ziply Fiber’s Term Notes |
| • | the redemption, prior to maturity, of the outstanding principal amount of $367 million in U.S. dollars ($509 million in Canadian dollars) of Ziply Fiber’s Funding Notes |
| • | a net decrease of $1,058 million mainly due to lower lease liabilities and other debt and foreign exchange fluctuations on U.S. debt for which we have entered into hedges. Refer to section 6.5, Financial risk management, of this MD&A for more details. |
The decrease in cash of $1,258 million, the decrease in short-term investments of $400 million and the increase in cash equivalents of $6 million were mainly due to:
| • | $8,965 million of repayment of long-term debt, excluding principal payment of lease liabilities |
| • | $4,905 million for business acquisitions, mainly from the acquisition of Ziply Fiber |
| • | $3,700 million of capital expenditures |
| • | $2,026 million of dividends paid on BCE common shares |
| • | $1,127 million principal payment of lease liabilities |
| • | $216 million paid for the purchase on the open market of BCE common shares for the settlement of share-based payments |
| • | $189 million paid for other financing activities which includes early debt redemption costs at Ziply Fiber |
| • | $182 million paid for the repurchase of BCE preferred shares |
| • | $151 million of dividends paid on BCE preferred shares |
| • | $95 million paid for other investing activities which includes a pre-acquisition loan to Ziply Fiber |
Partly offset by:
| • | $7,809 million of issuance of long-term debt |
| • | $6,993 million of cash flows from operating activities |
| • | $4,684 million of decrease in investments due to the sale of our minority stake in MLSE |
| • | $452 million increase in notes payable (net of repayments) |
| • | $102 million of business dispositions mainly from the sale of our home security and monitored alarm assets and the sale of our Bell Media radio stations |
| 6.2 | Outstanding share data |
| Common shares outstanding |
Number of shares |
|||
| Outstanding, January 1, 2025 |
912,283,103 | |||
| Shares issued under deferred share plan |
715 | |||
| Shares issued under BCE’s Shareholder Dividend Reinvestment and Stock Purchase Plan (DRP) |
20,241,999 | |||
| Outstanding, December 31, 2025 |
932,525,817 | |||
| Stock options outstanding | Number of options |
Weighted average exercise price ($) |
||||||
| Outstanding, January 1, 2025 |
6,545,819 | 61 | ||||||
| Forfeited or expired |
(1,042,645 | ) | 57 | |||||
| Outstanding and exercisable, December 31, 2025 |
5,503,174 | 62 | ||||||
At March 5, 2026, 932,525,817 common shares and 8,803,902 stock options were outstanding.
Discounted Treasury Dividend Reinvestment Plan
In Q4 2024, BCE amended its DRP to provide, at the BCE Board’s discretion, for the issuance of new common shares from treasury at a 2% discount to the Average Market Price commencing with the dividend payable on January 15, 2025 to eligible shareholders as of the December 16, 2024 record date, and subsequent periods.
On January 15, 2025, 9,540,786 common shares were issued from treasury under the DRP to shareholders of record on December 16, 2024 holding 308,654,258 common shares, for $314 million.
On April 15, 2025, 10,701,213 common shares were issued from treasury under the DRP to shareholders of record on March 14, 2025 holding 312,818,741 common shares, for $319 million.
On May 7, 2025, the BCE Board determined that common shares distributed under BCE’s DRP will no longer be issued from treasury at a 2% discount to the average market price and will rather be purchased by BCE’s agent, TSX Trust Company, on the secondary market with cash provided by BCE. The modifications became effective commencing with the dividend payable on July 15, 2025 to eligible holders of common shares as of the June 16, 2025 record date, and subsequently until further notice.
| 68 | BCE INC. 2025 ANNUAL FINANCIAL REPORT |
6 MD&A Financial and capital management
| 6.3 | Cash flows |
| 2025 | 2024 | $ change | % change | |||||||||||||
| Cash flows from operating activities |
6,993 | 6,988 | 5 | 0.1% | ||||||||||||
| Capital expenditures |
(3,700 | ) | (3,897 | ) | 197 | 5.1% | ||||||||||
| Cash dividends paid on preferred shares |
(151 | ) | (187 | ) | 36 | 19.3% | ||||||||||
| Cash dividends paid by subsidiaries to NCI |
(51 | ) | (68 | ) | 17 | 25.0% | ||||||||||
| Acquisition and other costs paid |
87 | 52 | 35 | 67.3% | ||||||||||||
| Free cash flow |
3,178 | 2,888 | 290 | 10.0% | ||||||||||||
| Principal payment of lease liabilities |
(1,127 | ) | (1,142 | ) | 15 | 1.3% | ||||||||||
| Free cash flow after payment of lease liabilities (1) |
2,051 | 1,746 | 305 | 17.5% | ||||||||||||
| Business acquisitions |
(4,905 | ) | (624 | ) | (4,281 | ) | n.m. | |||||||||
| Business dispositions |
102 | – | 102 | n.m. | ||||||||||||
| Increase in investments |
(83 | ) | (34 | ) | (49 | ) | n.m. | |||||||||
| Decrease in investments |
4,684 | 12 | 4,672 | n.m. | ||||||||||||
| Acquisition and other costs paid |
(87 | ) | (52 | ) | (35 | ) | (67.3% | ) | ||||||||
| Decrease in short-term investments |
400 | 600 | (200 | ) | (33.3% | ) | ||||||||||
| Spectrum licences |
(3 | ) | (531 | ) | 528 | 99.4% | ||||||||||
| Other investing activities |
(95 | ) | 36 | (131 | ) | n.m. | ||||||||||
| Increase in notes payable |
452 | 1,945 | (1,493 | ) | (76.8% | ) | ||||||||||
| Issue of long-term debt |
7,809 | 3,834 | 3,975 | n.m. | ||||||||||||
| Repayment of long-term debt, excluding principal payment of lease liabilities |
(8,965 | ) | (2,161 | ) | (6,804 | ) | n.m. | |||||||||
| Purchase of shares for settlement of share-based payments |
(216 | ) | (235 | ) | 19 | 8.1% | ||||||||||
| Repurchase of preferred shares |
(182 | ) | (92 | ) | (90 | ) | (97.8% | ) | ||||||||
| Cash dividends paid on common shares |
(2,026 | ) | (3,613 | ) | 1,587 | 43.9% | ||||||||||
| Other financing activities |
(189 | ) | (31 | ) | (158 | ) | n.m. | |||||||||
| (3,304 | ) | (946 | ) | (2,358 | ) | n.m. | ||||||||||
| Effect of currency exchange rate changes on cash and cash equivalents |
1 | – | 1 | n.m. | ||||||||||||
| Net (decrease) increase in cash |
(1,258 | ) | 1,025 | (2,283 | ) | n.m. | ||||||||||
| Net increase (decrease) in cash equivalents |
6 | (225 | ) | 231 | n.m. | |||||||||||
n.m.: not meaningful
| (1) | Free cash flow after payment of lease liabilities is a non-GAAP financial measure. Refer to section 11.1, Non-GAAP financial measures in this MD&A for more information on this measure. |
Cash flows from operating activities and free cash flow
In 2025, BCE’s cash flows from operating activities increased by $5 million, compared to 2024, mainly due to higher cash from working capital and lower income taxes paid, partly offset by settlements on derivatives used to economically hedge equity settled share-based
compensation plans, higher severance and other costs paid and higher interest paid.
Free cash flow increased by $290 million in 2025, compared to 2024, mainly due to lower capital expenditures.
Capital expenditures
| 2025 | 2024 | $ change | % change | |||||||||||||
| Bell CTS |
3,541 | 3,746 | 205 | 5.5% | ||||||||||||
| Capital intensity |
16.3% | 17.3% | 1.0 pts | |||||||||||||
| Bell CTS Canada |
3,153 | 3,746 | 593 | 15.8% | ||||||||||||
| Capital intensity |
14.8% | 17.3% | 2.5 pts | |||||||||||||
| Bell CTS U.S. |
388 | – | (388 | ) | n.m. | |||||||||||
| Capital intensity |
99.0% | – | (99.0) pts | |||||||||||||
| Bell Media |
159 | 151 | (8 | ) | (5.3% | ) | ||||||||||
| Capital intensity |
5.0% | 4.8% | (0.2) pts | |||||||||||||
| BCE |
3,700 | 3,897 | 197 | 5.1% | ||||||||||||
| Capital intensity |
15.1% | 16.0% | 0.9 pts | |||||||||||||
n.m.: not meaningful
| BCE INC. 2025 ANNUAL FINANCIAL REPORT | 69 |
6 MD&A Financial and capital management
BCE capital expenditures of $3,700 million in 2025, declined by $197 million, compared to 2024, along with a corresponding capital intensity ratio of 15.1%, down 0.9 pts over last year. The year-over-year reduction in 2025 capital expenditures reflected the following:
| • | Lower capital investments in Bell CTS Canada of $593 million in 2025, compared to 2024, consistent with the planned reduction in capital spending in Canada, primarily from slower FTTP footprint expansion, partly as a result of regulatory decisions that discourage network investment |
| • | Capital expenditures of $388 million in Bell CTS U.S. in 2025, compared to nil last year, as a result of the acquisition of Ziply Fiber on August 1, 2025. Capital investments were focused on the continued expansion of Ziply Fiber’s FTTP network in the U.S. |
Business acquisitions
On August 1, 2025, Bell Canada completed the acquisition of Ziply Fiber, the leading fibre Internet provider in the Pacific Northwest of the U.S., for cash consideration of $3.64 billion in U.S. dollars ($5.01 billion in Canadian dollars) which was $3.52 billion in U.S. dollars net of cash acquired ($4.84 billion in Canadian dollars net of cash acquired).
On July 2, 2024, Bell Canada acquired Stratejm Inc. for cash consideration of $78 million ($73 million net of cash acquired) and additional cash consideration contingent on the achievement of certain performance
objectives. This contingent consideration is expected to be settled by 2027 and the maximum amount payable is $20 million.
On June 7, 2024, Bell Media completed the acquisition of OUTFRONT Media Inc.’s Canadian OOH media business, OUTEDGE, for cash consideration of $429 million ($418 million net of cash acquired). Pursuant to a consent agreement negotiated with the Competition Bureau, in April 2025, Bell Media disposed of 669 advertising displays in Québec and Ontario for proceeds of $14 million.
Business dispositions
In the first half of 2025, Bell Media completed the sale of substantially all of the 45 radio stations and related assets. Proceeds for the stations and other radio related assets are expected to be $53 million. As of December 31, 2025, Bell Media had received proceeds of $44 million.
In Q2 2025, BCE entered into an agreement to sell substantially all of its home security and monitored alarm assets to a.p.i. ALARM
Inc. On October 1, 2025, BCE completed the previously announced sale to a.p.i. ALARM Inc. for $170 million. We have received proceeds of $65 million and expect to receive $25 million in 2027 and up to $80 million will also be received in 2027 contingent on the achievement of certain performance objectives.
Decrease in investments
On July 1, 2025, BCE completed the previously announced disposition of its minority stake in MLSE. We recorded gross proceeds of $4.7 billion.
Spectrum licences
On November 30, 2023, Bell Mobility secured the right to acquire 939 licences of 3800 MHz spectrum across Canada for $518 million. On January 17, 2024, Bell made a first payment of $104 million to ISED. The remaining balance of $414 million was paid on May 29, 2024, at which time Bell acquired the 3800 MHz spectrum licences.
Debt instruments
We use a combination of short-term and long-term debt to finance our operations. Our short-term debt consists mostly of notes payable under commercial paper programs, loans securitized by receivables and wireless device financing plan receivables, and bank facilities. We usually pay fixed rates of interest on our long-term debt and floating rates on our short-term debt. As at December 31, 2025, all of our debt was denominated in Canadian dollars with the exception of our commercial paper, Bell Mobility trade loans, our U.S. Series of Notes, our U.S. Fixed-to-Fixed Rate Junior Subordinated Notes and certain loans under unsecured term loan agreements, which are denominated in U.S. dollars and have been hedged for foreign currency and interest rate fluctuations. Refer to section 6.5, Financial risk management, of this MD&A for more details.
2025
During 2025, we repaid debt, net of issuances. This included:
| • | $10,092 million repayment of long-term debt comprised of: |
| • | the repayment at maturity of Series M-47 MTN debentures with a total principal amount of $1,500 million |
| • | the repayment at maturity of Series M-49 MTN debentures with a total principal amount of $600 million |
| • | the repurchase by Bell Canada, pursuant to tender offers, for an aggregate cash purchase price of $633 million in U.S. dollars ($903 million in Canadian dollars), of an aggregate principal amount of $844 million in U.S. dollars ($1,205 million in Canadian dollars), representing part of the outstanding principal amount of five of its series of U.S. notes. Refer to section 6.1, Net debt, of this MD&A for more details. |
| • | the repurchase by Bell Canada, pursuant to tender offers, for an aggregate cash purchase price of $1,498 million, of an aggregate principal amount of $1,831 million representing part of the outstanding principal amount of four of its series of MTN debentures. Refer to section 6.1, Net Debt, of this MD&A for more details. |
| • | the repurchase by Bell Canada, in the open market, for a cash purchase price of $6 million, of a principal amount of $7 million of its Series M-55 MTN debentures, that had an outstanding principal amount of $90 million, following the tender offers described above |
| • | the redemption, prior to maturity, of Series M-41 MTN debentures that had an outstanding principal amount of $750 million, for an aggregate purchase price of $750 million |
| • | the repayment of the outstanding loan of $600 million in U.S. dollars ($814 million in Canadian dollars) under the Bell Mobility trade loan agreement |
| 70 | BCE INC. 2025 ANNUAL FINANCIAL REPORT |
6 MD&A Financial and capital management
| • | the redemption, prior to maturity, of the outstanding principal amount of $1,594 million in U.S. dollars ($2,192 million in Canadian dollars) of Ziply Fiber’s Term Notes |
| • | the redemption, prior to maturity, of the outstanding principal amount of $367 million in U.S. dollars ($509 million in Canadian dollars) of Ziply Fiber’s Funding Notes |
| • | principal payment of lease liabilities of $1,127 million |
| • | net payments of other debt of $193 million |
Partly offset by:
| • | $7,809 million issuance of long-term debt comprised of: |
| • | the issuance of Series A Notes with a total principal amount of $1,000 million U.S. dollars ($1,416 million in Canadian dollars) |
| • | the issuance of Series B Notes with a total principal amount of $1,250 million U.S. dollars ($1,771 million in Canadian dollars) |
| • | the issuance of Series C Notes with a total principal amount of $1,250 million |
| • | the issuance by Bell Canada of Series M-64 MTN debentures, with a total principal amount of $400 million |
| • | the issuance by Bell Canada of Series M-65 MTN debentures, with a total principal amount of $500 million |
| • | the issuance by Bell Canada of Series M-66 MTN debentures, with a total principal amount of $600 million |
| • | the issuance by Bell Canada of Series M-67 MTN debentures, with a total principal amount of $500 million |
| • | an increase in outstanding loans of $487 million in U.S. dollars ($678 million in Canadian dollars) under the Bell Canada unsecured committed term loan facility |
| • | an increase in outstanding loans of $500 million in U.S. dollars ($697 million in Canadian dollars) under a new unsecured term loan facility |
| • | the issuance of $3 million of other debt |
| • | partly offset by $6 million of discounts on our debt issuances |
| • | $452 million issuance (net of repayments) of notes payable |
2024
During 2024, we issued debt, net of repayments. This included:
| • | $3,834 million issuance of long-term debt comprised of: |
| • | the issuance of Series US-9 Notes with a total principal amount of $700 million in U.S. dollars ($942 million in Canadian dollars) |
| • | the issuance of Series US-10 Notes with a total principal amount of $750 million in U.S. dollars ($1,009 million in Canadian dollars) |
| • | the issuance of Series M-61 MTN debentures with a total principal amount of $400 million |
| • | the issuance of Series M-63 MTN debentures with a total principal amount of $1,100 million |
| • | the increase of $324 million in outstanding loans under the Bell Mobility uncommitted trade loan agreement |
| • | the issuance of other debt of $66 million, partly offset by $7 million of discounts on our debt issuances |
| • | $1,945 million issuance (net of repayments) of notes payable |
Partly offset by:
| • | $3,303 million repayment of long-term debt comprised of: |
| • | the repayment of Series M-44 MTN debentures with a total principal amount of $1,000 million |
| • | the repayment of Series US-3 Notes with a total principal amount of $600 million in U.S. dollars ($748 million in Canadian dollars) |
| • | the repayment of Series 10 Notes with a total principal amount of $225 million |
| • | principal payment of lease liabilities of $1,142 million |
| • | net payments of other debt of $188 million |
Repurchase of preferred shares
In 2025, BCE repurchased and canceled 9,848,200 First Preferred Shares under its NCIB for a total cost of $182 million.
Subsequent to year end, BCE repurchased and canceled 1,169,641 First Preferred Shares under its NCIB for a total cost of $24 million.
In 2024, BCE repurchased and canceled 5,346,488 First Preferred Shares under its NCIB for a total cost of $92 million.
Cash dividends paid on common shares
In 2025, cash dividends paid on common shares of $2,026 million decreased by $1,587 million, compared to 2024, as 20,241,999 common shares were issued from treasury under the DRP, for $633 million, and due to a lower dividend paid in 2025 of $2.87 per common share compared to $3.96 per common share in 2024.
| 6.4 | Post-employment benefit plans |
For the year ended December 31, 2025, we recorded an increase in our post-employment benefit plans and a gain, before taxes, in OCI of $859 million, mainly due to an increase in the discount rate to 4.9% at December 31, 2025, compared to 4.7% at December 31, 2024 and a higher-than-expected return on plan assets.
For the year ended December 31, 2024, we recorded an increase in our post-employment benefit plans and a gain, before taxes, in OCI of $796 million, due to a higher-than-expected return on plan assets, and an increase in the discount rate to 4.7% at December 31, 2024, compared to 4.6% at December 31, 2023, partly offset by an increase in the effect of the asset limit.
| BCE INC. 2025 ANNUAL FINANCIAL REPORT | 71 |
6 MD&A Financial and capital management
| 6.5 | Financial risk management |
Management’s objectives are to protect BCE and its subsidiaries on a consolidated basis against material economic exposures and variability of results from various financial risks, including credit risk, liquidity risk, foreign currency risk, interest rate risk, equity price risk and longevity risk. These risks are further described in Note 2, Material accounting policies, Note 10, Other income (expense), Note 28, Post-employment benefit plans and Note 30, Financial and capital management in BCE’s 2025 consolidated financial statements.
The following table outlines our financial risks, how we manage these risks and their financial statement classification.
| Financial risk | Description of risk | Management of risk and financial statement classification | ||
| Credit risk | We are exposed to credit risk from operating activities and certain customer financing activities, the maximum exposure of which is represented by the carrying amounts reported in the consolidated statements of financial position (statements of financial position). We are exposed to credit risk if counterparties to our trade and other receivables, contract assets, derivative instruments and long-term receivables, including wireless device financing plan receivables, are unable to meet their obligations. | • Large and diverse customer base
• Deal with institutions with investment-grade credit ratings
• Regularly monitor our credit risk and credit exposure, and consider, among other factors, the effects of changes in interest rates and inflation
• Our trade receivables and allowance for doubtful accounts balances at December 31, 2025, which both include the current portion of wireless device financing plan receivables, were $4,113 million and $164 million, respectively
• Our non-current wireless device financing plan receivables and allowance for doubtful accounts balances at December 31, 2025 were $399 million and $11 million, respectively
• Our contract assets balance at December 31, 2025 was $847 million, net of an allowance for doubtful accounts balance of $12 million | ||
| Liquidity risk | We are exposed to liquidity risk for financial liabilities. | • Our cash, cash equivalents, short-term investments, amounts available under our securitized receivables program, cash flows from operations and possible capital markets financing are expected to be sufficient to fund our operations and fulfill our obligations as they become due. Should our cash requirements exceed the above sources of cash, we would expect to cover such a shortfall by drawing on existing committed bank facilities and new debt, to the extent available
• Refer to section 6.7, Liquidity – Contractual obligations, for a maturity analysis of our recognized financial liabilities | ||
| Foreign currency risk | We are exposed to foreign currency risk related to anticipated purchases and certain foreign currency debt.
A 10% depreciation (appreciation) in the value of the Canadian dollar relative to the U.S. dollar would result in a loss of $22 million (loss of $15 million) recognized in net earnings at December 31, 2025 and a gain of $146 million (loss of $126 million) recognized in OCI at December 31, 2025, with all other variables held constant.
Refer to the following Fair value section for details on our derivative financial instruments. |
• At December 31, 2025, we had outstanding foreign currency forward contracts and options maturing from 2026 to 2028 of $4.2 billion in U.S. dollars ($5.7 billion in Canadian dollars) and ₱3.3 billion in Philippine pesos ($79 million in Canadian dollars), to manage foreign currency risk related to anticipated purchases and certain foreign currency debt
• For cash flow hedges relating to anticipated purchases denominated in foreign currencies, changes in the fair value of these derivatives are recognized in our statements of comprehensive income, except for any ineffective portion of the hedging relationship, which is recognized in Other income (expense) in the income statements. Realized gains and losses in Accumulated other comprehensive income (loss) (Accumulated OCI) are reclassified to the income statements or to the initial cost of the related non-financial asset in the same periods as the corresponding hedged transactions are recognized.
• For cash flow hedges relating to our U.S. dollar debt under our commercial paper program and securitization of receivables program, changes in the fair value of these derivatives are recognized in Other income (expense) in the income statements and offset the foreign currency translation adjustment on the related debt, except for any portion of the hedging relationship which is ineffective
• For economic hedges, changes in the fair value are recognized in Other income (expense) in the income statements
• At December 31, 2025, we had outstanding cross currency interest rate swaps with notional amounts of $7,584 million in U.S. dollars ($10,227 million in Canadian dollars) to hedge the U.S. currency exposure of our U.S. Notes maturing from 2030 to 2055
• For these cross currency interest rate swaps, changes in the fair value of these derivatives are recognized in OCI, except for amounts recorded in Other income (expense) in the income statements to offset the foreign currency translation adjustment on the related debt and any portion of the hedging relationship which is ineffective
• At December 31, 2025, we designated an unsecured term loan of $500 million in U.S. dollars ($697 million in Canadian dollars) to partially hedge the U.S. currency exposure related to our net investment in Ziply Fiber.
• Foreign currency translation gains and losses related to this U.S. dollar long-term debt are recognized in OCI to partially offset the corresponding cumulative translation adjustment.
• At December 31, 2025, we had outstanding amortizing cross currency interest rate swaps with a notional amount of $487 million in U.S. dollars ($678 million in Canadian dollars) to hedge the U.S. currency exposure on other debt maturing in 2029.
• For these amortizing cross currency interest rate swaps, changes in the fair value of these derivatives are recognized in OCI, except for amounts recorded in Other income (expense) in the income statements to offset the foreign currency translation adjustment on the related debt and any portion of the hedging relationship which is ineffective
• At December 31, 2025, we had outstanding foreign exchange swaps with notional amounts of $372 million in U.S. dollars ($521 million in Canadian dollars) to hedge the U.S. currency exposure of our U.S. Notes.
• For these foreign exchange swaps, changes in the fair value of these derivatives are recognized in OCI, except for amounts recorded in Other income (expense) in the income statements to offset the foreign currency translation adjustment on the related debt and any portion of the hedging relationship which is ineffective. | ||
| 72 | BCE INC. 2025 ANNUAL FINANCIAL REPORT |
6 MD&A Financial and capital management
| Financial risk | Description of risk | Management of risk and financial statement classification | ||
| Interest rate risk | We are exposed to risk on the interest rates of our debt, our post-employment benefit plans and on dividend rate resets on our preferred shares.
A 1% increase (decrease) in interest rates would result in a loss of $32 million (gain of $26 million) recognized in net earnings at December 31, 2025, and a gain of $3 million (loss of $4 million) recognized in OCI at December 31, 2025, with all other variables held constant.
Refer to the following Fair value section for details on our derivative financial instruments. |
• We use interest rate swaps, cross currency basis rate swaps, cross currency interest rate swaps, forward starting interest rate swaps, amortizing interest rate swaps, interest rate swaptions and interest rate floors to hedge interest rate exposure on existing and/or future debt issuances. We also use leveraged interest rate options to hedge economically the dividend rate resets on preferred shares.
• At December 31, 2025, we had outstanding interest rate swaps with a notional amount of $595 million to hedge the fair value of our Series M-62 MTN debentures maturing in 2029
• For interest rate swaps, changes in the fair value of these derivatives and the related debt are recognized in Other income (expense) in the income statements and offset each other, except for any ineffective portion of the hedging relationship
• At December 31, 2025, we had outstanding interest rate swaps with a notional amount of $250 million to hedge the fair value of our series M-52 MTN debentures maturing in 2030
• For interest rate swaps, changes in the fair value of these derivatives and the related debt are recognized in Other income (expense) in the income statements and offset each other, except for any ineffective portion of the hedging relationship
• At December 31, 2025, we had outstanding interest rate swaps with a notional amount of $350 million to hedge the fair value of our series M-57 MTN debentures maturing in 2032
• For interest rate swaps, changes in the fair value of these derivatives and the related debt are recognized in Other income (expense) in the income statements and offset each other, except for any ineffective portion of the hedging relationship
• At December 31, 2025, we had outstanding interest rate swaps with a notional amount of $372 million in U.S dollars ($531 million in Canadian dollars), maturing in 2035, to hedge the fair value of our Series B Notes maturing in 2055
• For interest rate swaps, changes in the fair value of these derivatives and the related debt are recognized in Other income (expense) in the income statements and offset each other, except for any ineffective portion of the hedging relationship
• At December 31, 2025, we had outstanding interest rate swaps with a notional amount of $300 million to hedge the fair value of our series M-66 MTN debentures maturing in 2036
• For interest rate swaps, changes in the fair value of these derivatives and the related debt are recognized in Other income (expense) in the income statements and offset each other, except for any ineffective portion of the hedging relationship
• At December 31, 2025, we had outstanding interest rate swaps with a notional amount of $300 million to hedge the fair value of our series M-65 MTN debentures maturing in 2033
• For interest rate swaps, changes in the fair value of these derivatives and the related debt are recognized in Other income (expense) in the income statements and offset each other, except for any ineffective portion of the hedging relationship
• At December 31, 2025, we had outstanding interest rate swaps with a notional amount of $200 million to hedge the fair value of our series M-45 MTN debentures maturing in 2047
• For interest rate swaps, changes in the fair value of these derivatives and the related debt are recognized in Other income (expense) in the income statements and offset each other, except for any ineffective portion of the hedging relationship
• At December 31, 2025, we had outstanding interest rate swaps with a notional amount of $200 million, maturing in 2028, to hedge the interest costs of our series M-45 MTN debentures maturing in 2047
• For interest rate swaps, changes in the fair value of these derivatives and the related debt are recognized in Other income (expense) in the income statements and offset each other, except for any ineffective portion of the hedging relationship
• At December 31, 2025, we had outstanding forward starting interest rate swaps, effective from 2028 with a notional amount of $125 million to hedge the fair value of our series M-59 MTN debentures maturing in 2053
• For forward starting interest rate swaps, changes in the fair value of these derivatives and the related debt are recognized in Other income (expense) in the income statements and offset each other, except for any ineffective portion of the hedging relationship
• At December 31, 2025, we had outstanding forward starting interest rate swaps, effective from 2028 with a notional amount of $400 million to hedge the fair value of our series M-61 MTN debentures maturing in 2053
• For forward starting interest rate swaps, changes in the fair value of these derivatives and the related debt are recognized in Other income (expense) in the income statements and offset each other, except for any ineffective portion of the hedging relationship
• At December 31, 2025, we had an outstanding amortizing interest rate swap with a notional amount of $69 million to hedge the interest rate exposure on other debt maturing in 2028
• For amortizing interest rate swaps, changes in the fair value of these derivatives are recognized in our statements of comprehensive income
• At December 31, 2025, we had outstanding leveraged interest rate options to hedge economically the dividend rate resets on $582 million of our preferred shares which had varying reset dates in 2021 for the periods ending in 2026
• For leveraged interest rate options, changes in the fair value of these derivatives are recognized in the income statements in Other income (expense)
• For our post-employment benefit plans, the interest rate risk is managed using a liability matching approach, which reduces the exposure of the DB plans to a mismatch between investment growth and obligation growth | ||
| BCE INC. 2025 ANNUAL FINANCIAL REPORT | 73 |
6 MD&A Financial and capital management
| Financial risk | Description of risk | Management of risk and financial statement classification | ||
| Equity price risk |
We are exposed to risk on our cash flow related to the settlement of equity settled share-based payment plans.
A 5% increase (decrease) in the market price of BCE’s common shares would result in a gain (loss) of $16 million recognized in net earnings at December 31, 2025, with all other variables held constant.
Refer to the following Fair value section for details on our derivative financial instruments. |
• At December 31, 2025, we had outstanding equity forward contracts with a fair value net liability of $187 million on BCE’s common shares to economically hedge the cash flow exposure related to the settlement of equity settled share-based compensation plans
• Changes in the fair value of these derivatives are recorded in the income statements in Other income (expense) | ||
| Longevity risk | We are exposed to life expectancy risk on our post-employment benefit plans. | • The Bell Canada Pension Plan has an investment arrangement which hedges part of its exposure to potential increases in longevity, which covers approximately $3 billion of post-employment benefit obligations
• Changes in the fair value of the longevity swap are recognized in our statements of comprehensive income | ||
Fair value
Fair value is the price that would be received to sell an asset or paid to transfer a liability in an orderly transaction between market participants at the measurement date.
Certain fair value estimates are affected by assumptions we make about the amount and timing of future cash flows and discount rates, all of which reflect varying degrees of risk. Income taxes and other expenses that may be incurred on disposition of financial instruments are not reflected in the fair values. As a result, the fair values may not be the net amounts that would be realized if these instruments were settled.
The carrying values of cash, cash equivalents, short-term investments, trade and other receivables, trade payables and other liabilities, interest payable, dividends payable, notes payable and loans secured by receivables approximate fair value as they are short-term. The carrying value of long-term receivables, including wireless device financing plan receivables, approximates fair value given that their average remaining duration is short and their carrying value is reduced by an allowance for doubtful accounts and an allowance for revenue adjustments. The carrying values of our term loan facilities and the Bell Mobility trade loans approximate fair value given they bear interest at a variable rate.
The following table provides the fair value details of other financial instruments measured at amortized cost in the statements of financial position.
| December 31, 2025 | December 31, 2024 | |||||||||||||||||||
| Classification | Fair value methodology | Carrying value | Fair value | Carrying value | Fair value | (1) | ||||||||||||||
| Debt securities and other debt |
Debt due within one year and long-term debt | Quoted market price of debt | 31,236 | 31,286 | 31,247 | 30,022 | ||||||||||||||
| (1) | We have presented amounts from the previous period to make them consistent with the presentation of the current period. |
The following table provides the fair value details of financial instruments measured at fair value in the statements of financial position.
| Fair value | ||||||||||||||||||
| Classification | |
Carrying value of asset (liability) |
|
|
Quoted prices in active markets for identical assets (level 1) |
|
|
Observable market data (level 2) |
(1) |
|
Non-observable market inputs (level 3) |
(2) | ||||||
| December 31, 2025 |
||||||||||||||||||
| Publicly-traded and |
Other non-current assets |
1,198 | 105 | – | 1,093 | |||||||||||||
| Derivative financial instruments |
Other current assets, trade payables and other liabilities, other non-current assets and liabilities |
(513 | ) | – | (513 | ) | – | |||||||||||
|
Investments |
Other non-current assets |
246 | – | 246 | – | |||||||||||||
| December 31, 2024 |
||||||||||||||||||
| Publicly-traded and |
Other non-current assets |
877 | 35 | – | 842 | |||||||||||||
| Derivative financial instruments |
Other current assets, trade payables and other liabilities, other non-current assets and liabilities |
(368 | ) | – | (368 | ) | – | |||||||||||
|
Investments |
Other non-current assets |
225 | – | 225 | – | |||||||||||||
| (1) | Observable market data such as equity prices, interest rates, swap rate curves and foreign currency exchange rates. |
| (2) | Non-observable market inputs such as discounted cash flows, prices of comparable investments and revenue and earnings multiples. For certain privately-held investments, changes in our valuation assumptions may result in a significant change in the fair value of our level 3 financial instruments. |
| (3) | Unrealized gains and losses are recorded in OCI in the statements of comprehensive income and are reclassified from Accumulated OCI to the Deficit in the statements of financial position when realized. |
| 74 | BCE INC. 2025 ANNUAL FINANCIAL REPORT |
6 MD&A Financial and capital management
| 6.6 | Credit ratings |
Credit ratings generally address the ability of a company to repay principal and pay interest on debt or dividends on issued and outstanding preferred shares.
Our ability to raise financing depends on our ability to access the public equity and debt capital markets, the money market, as well as the bank credit market. Our ability to access such markets and the cost and amount of funding available partly depend on our assigned
credit ratings at the time capital is raised. Investment grade credit ratings usually mean that when we borrow money, we can obtain lower interest rates than companies that have ratings lower than investment grade. A ratings downgrade could result in adverse consequences for our funding cost and capacity, and our ability to access the capital markets, the money market and/or bank credit market.
The following table provides BCE’s and Bell Canada’s credit ratings as at March 5, 2026 from DBRS, Moody’s and S&P.
Key credit ratings
| Bell Canada (1) | ||||||||||||
| March 5, 2026 | DBRS | Moody’s | S&P | |||||||||
| Commercial paper |
R-2 (middle) | P-2 | A-2 (Canadian scale) | |||||||||
| A-2 (Global scale) | ||||||||||||
| Senior (unsubordinated) long-term debt |
BBB | Baa2 | BBB | |||||||||
| Subordinated long-term debt |
BB (high) | Baa3 | BBB- | |||||||||
| Junior subordinated long-term debt |
BB (high) | Baa3 | BB+ | |||||||||
| BCE (1) | ||||||||||||
| DBRS | Moody’s | S&P | ||||||||||
| Preferred shares |
Pfd-3 | – | P-3 (High) (Canadian scale) | |||||||||
| BB+ (Global scale) | ||||||||||||
| (1) | These credit ratings are not recommendations to buy, sell or hold any of the securities referred to, and they may be revised or withdrawn at any time by the assigning rating agency. Ratings are determined by the rating agencies based on criteria established from time to time by them, and they do not comment on market price or suitability for a particular investor. Each credit rating should be evaluated independently of any other credit rating. |
On May 8, 2025, S&P revised its outlook on BCE and Bell Canada to negative from stable principally as a result of ongoing debt leverage above S&P’s thresholds for the current ratings. However, S&P affirmed all of BCE’s and Bell Canada’s existing ratings.
On May 16, 2025, DBRS downgraded Bell Canada’s issuer rating to BBB from BBB (high), senior (unsubordinated) long-term debt rating to BBB from BBB (high), subordinated long-term debt rating to BB (high) from BBB (low), junior subordinated long-term debt rating to BB (high) from BBB (low) and commercial paper rating to R-2 (middle) from R-2 (high). In addition, DBRS downgraded BCE’s issuer rating to BBB (low) from BBB. BCE’s preferred shares rating was confirmed at Pfd-3. Consequently, DBRS removed the credit ratings from “Under Review with Negative Implications”, where they were placed on November 5, 2024. The
outlook associated with the DBRS ratings is stable. The downgrades were principally as a result of ongoing debt leverage above DBRS’ thresholds for the prior ratings. All of the new ratings on Bell Canada’s senior (unsubordinated) long-term debt and commercial paper remain investment grade according to DBRS’ rating scale with DBRS’ BBB (low) rating representing its last investment grade rating rank for long-term debt and R-2 (low) rating representing its last investment grade rating rank for short-term debt. The new BB (high) rating for Bell Canada’s subordinated long-term debt and junior subordinated long-term debt is considered the highest rating below an investment grade rating on DBRS’ rating scale.
As of March 5, 2026, BCE’s and Bell Canada’s credit ratings also had a stable outlook from Moody’s.
| BCE INC. 2025 ANNUAL FINANCIAL REPORT | 75 |
6 MD&A Financial and capital management
| 6.7 | Liquidity |
This section contains forward-looking statements, including statements relating to our planned capital expenditures, our expected post-employment benefit plans funding, BCE’s common share dividend and common share dividend payout policy, and the sources of liquidity we expect to use to meet our 2026 cash requirements. Refer to the section Caution regarding forward-looking statements at the beginning of this MD&A.
Available liquidity
Total available liquidity at December 31, 2025 was $2.5 billion, comprised of $314 million in cash, $6 million in cash equivalents, $700 million available under our securitized receivables program and $1.5 billion available under our $4.0 billion committed revolving and expansion credit facilities (given $2.5 billion of commercial paper outstanding).
On July 1, 2025, BCE completed the previously announced disposition of its 37.5% ownership stake in MLSE for gross proceeds of $4.7 billion. BCE directed the net proceeds of this disposition towards the acquisition of Ziply Fiber.
We expect that our cash, cash equivalents, short-term investments, amounts available under our securitized receivables program, cash flows from operations and possible capital markets financings will permit us to meet our cash requirements in 2026 for capital expenditures, post-employment benefit plans funding, dividend payments, the payment of contractual obligations, maturing debt, ongoing operations and other cash requirements.
Should our 2026 cash requirements exceed our cash, cash equivalents, short-term investments, cash generated from our operations, and funds raised under capital markets financings and our securitized receivables program, we would expect to cover such a shortfall by drawing under committed credit facilities that are currently in place or through new facilities to the extent available.
In 2026, our cash flows from operations, cash, cash equivalents, short-term investments, capital markets financings, securitized receivables program and credit facilities should give us flexibility in carrying out our plans for business growth, including business acquisitions, as well as for the payment of contingencies.
We continuously monitor our operations, capital markets and the Canadian economy with the objective of maintaining adequate liquidity.
Securitization program
Our securitized receivables program is recorded as floating rate revolving loans secured by certain receivables. The securitization program includes a financing cost that varies based on our performance of certain sustainability performance targets.
We continue to service trade receivables and wireless device financing plan receivables under the securitization program, which matures in June 2027 unless terminated prior to maturity. The lenders’ interest in the collection of these receivables ranks ahead of our interests, which means that we are exposed to certain risks of default on the amounts securitized.
We have provided various credit enhancements in the form of overcollateralization and subordination of our retained interests.
The lenders have no further claim on our other assets if customers do not pay the amounts owed.
As of December 31, 2025, the balance of loans secured by receivables was $1.2 billion in U.S. dollars ($1.6 billion in Canadian dollars) and the total receivable balance collateralized under the program was $3.5 billion. The foreign currency risk on these loans is managed using foreign currency forward contracts. See section 6.5, Financial risk management in this MD&A for additional details.
Credit facilities
The table below is a summary of our total bank credit facilities at December 31, 2025.
| December 31, 2025 | Total available | Drawn |
Letters of credit |
Commercial paper outstanding |
Net available | |||||||||||||||
| Committed credit facilities |
||||||||||||||||||||
| Unsecured revolving and expansion credit facilities (1) (2) |
4,000 | – | – | 2,550 | 1,450 | |||||||||||||||
| Unsecured committed term loan facility |
960 | 668 | – | – | 292 | |||||||||||||||
| Unsecured term loan facility |
686 | 686 | – | – | – | |||||||||||||||
| Unsecured non-revolving credit facilities |
641 | 55 | – | – | 586 | |||||||||||||||
| Other |
106 | – | 71 | – | 35 | |||||||||||||||
| Total committed credit facilities |
6,393 | 1,409 | 71 | 2,550 | 2,363 | |||||||||||||||
| Non-committed credit facilities |
||||||||||||||||||||
| Bell Canada |
1,840 | – | 604 | – | 1,236 | |||||||||||||||
| Total non-committed credit facilities |
1,840 | – | 604 | – | 1,236 | |||||||||||||||
| Total committed and non-committed credit facilities |
8,233 | 1,409 | 675 | 2,550 | 3,599 | |||||||||||||||
| (1) | Bell Canada’s $2.7 billion committed revolving credit facility expires in December 2030 and its $1.3 billion committed expansion credit facility expires in December 2028. |
| (2) | As of December 31, 2025, Bell Canada’s outstanding commercial paper included $1,861 million in U.S. dollars ($2,550 million in Canadian dollars). All of Bell Canada’s commercial paper outstanding is included in Debt due within one year. |
| 76 | BCE INC. 2025 ANNUAL FINANCIAL REPORT |
6 MD&A Financial and capital management
Bell Canada may issue notes under its Canadian and U.S. commercial paper programs up to the maximum aggregate principal amount of $3.0 billion in either Canadian or U.S. currency provided that at no time shall such maximum amount of notes exceed $3.5 billion in Canadian currency.
On September 23, 2025, Bell Canada entered into a $500 million in U.S. dollars ($692 million in Canadian dollars) unsecured term loan agreement to finance certain transactions in the U.S. On September 26, 2025, $500 million in U.S. dollars ($697 million in Canadian dollars) was drawn under this loan agreement. The term loan is repayable at maturity in September 2032. The loan agreement has been designated as a net investment hedge of Bell Canada’s investment in Ziply Fiber.
On April 14, 2025, Bell Canada entered into a $700 million in U.S. dollars ($972 million in Canadian dollars) unsecured committed term loan agreement to finance certain purchase obligations. A first loan advance in the amount of $228 million in U.S. dollars ($315 million in Canadian dollars) was made on April 29, 2025. On August 19, 2025, a second loan advance in the amount of $148 million in U.S. dollars ($206 million in Canadian dollars) was made. On November 4, 2025, a third loan advance in the amount of $111 million in U.S. dollars ($157 million in Canadian dollars) was made. Subsequent to year end, on January 28, 2026, a fourth loan advance of $102 million in U.S. dollars ($139 million in Canadian dollars) was made. The term loans are repayable in multiple periodic installments between July 2026 until maturity of the credit facility in April 2029. The loan advances have been hedged for foreign currency fluctuations.
On November 1, 2024, Bell Canada entered into a commitment letter (Commitment Letter) for a $3,700 million unsecured term loan
facility (Ziply Term Facility) denominated in U.S. dollars ($5,048 million in Canadian dollars) that was available to be drawn to finance the acquisition of Ziply Fiber. In Q1 2025 and pursuant to the terms and conditions of the Commitment Letter, Bell Canada made reductions of $965 million in U.S. dollars ($1,387 million in Canadian dollars) in the aggregate amount of the Commitment Letter. On April 15, 2025, Bell Canada made further reductions of $225 million in U.S. dollars ($314 million in Canadian dollars) in the aggregate amount of the Commitment Letter. On July 2, 2025, Bell Canada terminated the Ziply Term Facility and canceled the remaining $2,510 million in U.S. dollars ($3,419 million in Canadian dollars) in the aggregate amount of the Commitment Letter as a result of the completion of the previously announced disposition of its minority stake in MLSE.
Some of our credit agreements require us to meet specific financial ratios and to offer to repay and cancel the credit agreement upon a change of control of BCE or Bell Canada. In addition, some of our debt agreements require us to make an offer to repurchase certain series of debt securities upon the occurrence of a change of control event as defined in the relevant debt agreements. We are in compliance with all conditions and restrictions under such agreements.
Supplier finance arrangements
Supplier finance arrangements are agreements whereby a finance provider pays amounts to a participating supplier in respect of invoices owed by BCE and receives the settlement from BCE at a later date. These arrangements have an average term of 5 years, whereas comparable trade payables would have payment terms between 30 and 60 days.
Cash requirements
Capital expenditures
In 2026, we expect our planned capital spending to be focused on our strategic priorities as outlined at our 2025 Investor Day, reflecting a reduction in Canada on capital spending attributable to slower FTTP footprint expansion, partly offset by an increase in annual spending allocated towards strategic investments, FTTP expansion in the U.S. and growth initiatives.
Post-employment benefit plans funding
Our post-employment benefit plans include DB pension and DC pension plans, as well as other post-employment benefits (OPEBs) plans. The funding requirements of our post-employment benefit plans, resulting from valuations of our plan assets and liabilities, depend on a number of factors, including actual returns on post-employment benefit plan assets, long-term interest rates, plan demographics, and applicable regulations and actuarial standards. Actuarial valuations were last performed for our significant post-employment benefit plans as at December 31, 2024.
We expect to contribute approximately $30 million to our DB pension plans in 2026, subject to actuarial valuations being completed. We expect to contribute approximately $5 million to the DC pension plans and to pay approximately $60 million to beneficiaries under OPEB plans in 2026.
Common share dividend
On February 5, 2026, the BCE Board declared a quarterly dividend of $0.4375 per common share, payable on April 15, 2026 to shareholders of record at the close of business on March 16, 2026. BCE’s dividend policy, setting the common share dividend rate and the declaration of dividends are subject to the discretion of the BCE Board and, consequently, there can be no guarantee that BCE’s dividend payout policy will be maintained or achieved, that the dividend on common shares will be maintained, or that dividends will be declared. Dividend rates and the declaration of dividends by the BCE Board are ultimately dependent on BCE’s corporate strategy, operations and financial results, which are in turn subject to various assumptions and risks, including those outlined in this MD&A.
| BCE INC. 2025 ANNUAL FINANCIAL REPORT | 77 |
6 MD&A Financial and capital management
Contractual obligations
The following table is a summary of our contractual obligations at December 31, 2025 that are due in each of the next five years and thereafter.
| At December 31, 2025 | 2026 | 2027 | 2028 | 2029 | 2030 | Thereafter | Total | |||||||||||||||||||||
| Recognized financial liabilities |
||||||||||||||||||||||||||||
| Total debt, excluding lease liabilities |
1,064 | 2,042 | 2,404 | 2,028 | 2,075 | 23,148 | 32,761 | |||||||||||||||||||||
| Lease liabilities (1) |
1,091 | 693 | 483 | 396 | 390 | 2,196 | 5,249 | |||||||||||||||||||||
| Notes payable |
2,566 | – | – | – | – | – | 2,566 | |||||||||||||||||||||
| Loan secured by receivables |
1,594 | – | – | – | – | – | 1,594 | |||||||||||||||||||||
| Interest payable on long-term debt, notes payable and loan secured by receivables |
1,675 | 1,533 | 1,470 | 1,363 | 1,272 | 17,258 | 24,571 | |||||||||||||||||||||
| Net payments (receipts) on cross currency interest rate swaps and interest rate swaps |
15 | (7 | ) | (13 | ) | (27 | ) | 74 | (491 | ) | (449 | ) | ||||||||||||||||
| Commitments |
||||||||||||||||||||||||||||
| Commitments for property, plant and equipment and intangible assets |
1,355 | 1,391 | 522 | 454 | 429 | 1,588 | 5,739 | |||||||||||||||||||||
| Purchase obligations |
893 | 607 | 464 | 398 | 343 | 642 | 3,347 | |||||||||||||||||||||
| Leases committed not yet commenced |
15 | 22 | 23 | 24 | 24 | 64 | 172 | |||||||||||||||||||||
|
Total |
10,268 | 6,281 | 5,353 | 4,636 | 4,607 | 44,405 | 75,550 | |||||||||||||||||||||
| (1) | Includes imputed interest of $940 million. |
We are also exposed to liquidity risk for financial liabilities due within one year as shown in the statements of financial position.
Our commitments for property, plant and equipment and intangible assets include program and feature film rights and investments to expand and update our networks to meet customer demand.
Purchase obligations consist of contractual obligations under service and product contracts for operating expenditures and other purchase obligations.
Our commitments for leases not yet commenced include real estate, OOH advertising spaces and fibre use. These leases are non-cancellable.
Indemnifications and guarantees
As a regular part of our business, we enter into agreements that provide for indemnifications and guarantees to counterparties in transactions involving business dispositions, sales of assets, sales of services, purchases and development of assets, securitization agreements and leases. While some of the agreements specify a maximum potential exposure, many do not specify a maximum amount or termination date.
We cannot reasonably estimate the maximum potential amount we could be required to pay counterparties because of the nature of almost all of these indemnifications and guarantees. As a result, we cannot determine how they could affect our future liquidity, capital resources or credit risk profile. We have not made any significant payments under indemnifications or guarantees in the past.
| 6.8 | Litigation |
In the ordinary course of business, we become involved in various claims and legal proceedings seeking monetary damages and other relief. In particular, because of the nature of our consumer-facing business, we are exposed to class actions pursuant to which substantial monetary damages may be claimed. Due to the inherent risks and uncertainties of the litigation process, we cannot predict the final outcome or timing of claims and legal proceedings. Subject to the foregoing, and based on information currently available and management’s assessment of the
merits of the claims and legal proceedings pending at March 5, 2026, management believes that the ultimate resolution of these claims and legal proceedings is unlikely to have a material and negative effect on our financial statements or operations. We believe that we have strong defences and we intend to vigorously defend our positions.
For a description of important legal proceedings pending at March 5, 2026, please see the section entitled Legal proceedings contained in the BCE 2025 AIF.
| 78 | BCE INC. 2025 ANNUAL FINANCIAL REPORT |
7 MD&A Selected annual and quarterly information
| 7 | Selected annual and quarterly information |
| 7.1 | Annual financial information |
The following table shows selected consolidated financial data of BCE for 2025, 2024 and 2023 based on the annual consolidated financial statements, which are prepared in accordance with IFRS® Accounting Standards as issued by the International Accounting Standards Board (IASB). We discuss the factors that caused our results to vary over the past two years throughout this MD&A.
| 2025 | 2024 | 2023 | ||||||||||
| Consolidated income statements |
||||||||||||
| Operating revenues |
||||||||||||
| Service |
21,207 | 21,073 | 21,154 | |||||||||
| Product |
3,261 | 3,336 | 3,519 | |||||||||
| Total operating revenues |
24,468 | 24,409 | 24,673 | |||||||||
| Operating costs |
(13,810 | ) | (13,820 | ) | (14,256 | ) | ||||||
| Adjusted EBITDA |
10,658 | 10,589 | 10,417 | |||||||||
| Severance, acquisition and other costs |
(517 | ) | (454 | ) | (200 | ) | ||||||
| Depreciation |
(3,861 | ) | (3,758 | ) | (3,745 | ) | ||||||
| Amortization |
(1,377 | ) | (1,283 | ) | (1,173 | ) | ||||||
| Finance costs |
||||||||||||
| Interest expense |
(1,775 | ) | (1,713 | ) | (1,475 | ) | ||||||
| Net return on post-employment benefit obligations |
102 | 66 | 108 | |||||||||
| Impairment of assets |
(1,027 | ) | (2,190 | ) | (143 | ) | ||||||
| Net gains on investments |
5,217 | 57 | 80 | |||||||||
| Other income (expense) |
287 | (362 | ) | (546 | ) | |||||||
| Income taxes |
(1,193 | ) | (577 | ) | (996 | ) | ||||||
| Net earnings |
6,514 | 375 | 2,327 | |||||||||
| Net earnings attributable to: |
||||||||||||
| Common shareholders |
6,305 | 163 | 2,076 | |||||||||
| Preferred shareholders |
155 | 181 | 187 | |||||||||
| NCI |
54 | 31 | 64 | |||||||||
| Net earnings |
6,514 | 375 | 2,327 | |||||||||
| Net earnings per common share – basic and diluted |
6.79 | 0.18 | 2.28 | |||||||||
|
Ratios |
||||||||||||
| Adjusted EBITDA margin (%) |
43.6% | 43.4% | 42.2% | |||||||||
| BCE INC. 2025 ANNUAL FINANCIAL REPORT | 79 |
7 MD&A Selected annual and quarterly information
| 2025 | 2024 | 2023 | ||||||||||
| Consolidated statements of financial position |
||||||||||||
| Property, plant and equipment |
33,541 | 30,001 | 30,352 | |||||||||
| Total assets |
80,165 | 73,485 | 71,940 | |||||||||
| Debt due within one year (including notes payable and loans secured by receivables) |
6,155 | 7,669 | 5,042 | |||||||||
| Long-term debt |
34,904 | 32,835 | 31,135 | |||||||||
| Total non-current liabilities |
43,999 | 41,279 | 39,276 | |||||||||
| Equity attributable to BCE shareholders |
23,020 | 17,071 | 20,229 | |||||||||
| Total equity |
23,310 | 17,360 | 20,557 | |||||||||
| Consolidated statements of cash flows |
||||||||||||
| Cash flows from operating activities |
6,993 | 6,988 | 7,946 | |||||||||
| Cash flows used in investing activities |
(3,600 | ) | (4,438 | ) | (5,781 | ) | ||||||
| Capital expenditures |
(3,700 | ) | (3,897 | ) | (4,581 | ) | ||||||
| Decrease (increase) in short-term investments |
400 | 600 | (1,000 | ) | ||||||||
| Business acquisitions |
(4,905 | ) | (624 | ) | (222 | ) | ||||||
| Business dispositions |
102 | – | 209 | |||||||||
| Increase in investments |
(83 | ) | (34 | ) | (55 | ) | ||||||
| Decrease in investments |
4,684 | 12 | 10 | |||||||||
| Spectrum licences |
(3 | ) | (531 | ) | (183 | ) | ||||||
| Cash flows used in financing activities |
(4,646 | ) | (1,750 | ) | (1,542 | ) | ||||||
| Increase (decrease) in notes payable |
452 | 1,945 | (646 | ) | ||||||||
| Issue of long-term debt |
7,809 | 3,834 | 5,195 | |||||||||
| Repayment of long-term debt, excluding principal payment of lease liabilities |
(8,965 | ) | (2,161 | ) | (809 | ) | ||||||
| Principal payment of lease liabilities |
(1,127 | ) | (1,142 | ) | (1,049 | ) | ||||||
| Repurchase of a financial liability |
– | – | (149 | ) | ||||||||
| Cash dividends paid on common shares |
(2,026 | ) | (3,613 | ) | (3,486 | ) | ||||||
| Cash dividends paid on preferred shares |
(151 | ) | (187 | ) | (182 | ) | ||||||
| Cash dividends paid by subsidiaries to NCI |
(51 | ) | (68 | ) | (47 | ) | ||||||
| Free cash flow |
3,178 | 2,888 | 3,144 | |||||||||
| Free cash flow after payment of lease liabilities |
2,051 | 1,746 | 2,095 | |||||||||
| Share information |
||||||||||||
| Weighted average number of common shares (millions) |
929.1 | 912.3 | 912.2 | |||||||||
| Common shares outstanding at end of year (millions) |
932.5 | 912.3 | 912.3 | |||||||||
| Market capitalization (1) |
30,530 | 30,398 | 47,595 | |||||||||
| Dividends declared per common share (dollars) |
2.31 | 3.99 | 3.87 | |||||||||
| Dividends declared on common shares |
(2,150 | ) | (3,646 | ) | (3,530 | ) | ||||||
| Dividends declared on preferred shares |
(155 | ) | (181 | ) | (187 | ) | ||||||
| Closing market price per common share (dollars) |
32.74 | 33.32 | 52.17 | |||||||||
|
Ratios |
||||||||||||
| Capital intensity (%) |
15.1% | 16.0% | 18.6% | |||||||||
| Price to earnings ratio (times) (2) |
4.82 | 185.11 | 22.88 | |||||||||
| Other data |
||||||||||||
| Number of employees (thousands) |
39 | 40 | 45 | |||||||||
| (1) | BCE’s common share price at the end of the year multiplied by the number of common shares outstanding at the end of the year. |
| (2) | Price to earnings ratio is defined as BCE’s common share price at the end of the year divided by EPS. |
| 80 | BCE INC. 2025 ANNUAL FINANCIAL REPORT |
7 MD&A Selected annual and quarterly information
| 7.2 | Quarterly financial information |
The following table shows selected BCE consolidated financial data by quarter for 2025 and 2024. This quarterly information is unaudited but has been prepared on the same basis as the annual consolidated financial statements. We discuss the factors that caused our results to vary over the past eight quarters throughout this MD&A.
| 2025 | 2024 | |||||||||||||||||||||||||||||||
| Q4 | Q3 | Q2 | Q1 | Q4 | Q3 | Q2 | Q1 | |||||||||||||||||||||||||
| Operating revenues |
||||||||||||||||||||||||||||||||
| Service |
5,439 | 5,329 | 5,267 | 5,172 | 5,287 | 5,286 | 5,308 | 5,192 | ||||||||||||||||||||||||
| Product |
965 | 720 | 818 | 758 | 1,135 | 685 | 697 | 819 | ||||||||||||||||||||||||
| Total operating revenues |
6,404 | 6,049 | 6,085 | 5,930 | 6,422 | 5,971 | 6,005 | 6,011 | ||||||||||||||||||||||||
| Adjusted EBITDA |
2,664 | 2,762 | 2,674 | 2,558 | 2,605 | 2,722 | 2,697 | 2,565 | ||||||||||||||||||||||||
| Severance, acquisition and other costs |
(147 | ) | (82 | ) | (41 | ) | (247 | ) | (154 | ) | (49 | ) | (22 | ) | (229 | ) | ||||||||||||||||
| Depreciation |
(1,002 | ) | (969 | ) | (949 | ) | (941 | ) | (933 | ) | (934 | ) | (945 | ) | (946 | ) | ||||||||||||||||
| Amortization |
(368 | ) | (340 | ) | (338 | ) | (331 | ) | (317 | ) | (325 | ) | (325 | ) | (316 | ) | ||||||||||||||||
| Finance costs |
||||||||||||||||||||||||||||||||
| Interest expense |
(453 | ) | (457 | ) | (442 | ) | (423 | ) | (431 | ) | (440 | ) | (426 | ) | (416 | ) | ||||||||||||||||
| Net return on post-employment benefit plans |
25 | 26 | 26 | 25 | 17 | 16 | 17 | 16 | ||||||||||||||||||||||||
| Impairment of assets |
(40 | ) | (970 | ) | (8 | ) | (9 | ) | (4 | ) | (2,113 | ) | (60 | ) | (13 | ) | ||||||||||||||||
| Net gains (losses) on investments |
52 | 5,175 | (8 | ) | (2 | ) | (1 | ) | 66 | (2 | ) | (6 | ) | |||||||||||||||||||
| Other income (expense) |
102 | (95 | ) | (30 | ) | 310 | (102 | ) | (129 | ) | (99 | ) | (32 | ) | ||||||||||||||||||
| Income taxes |
(201 | ) | (495 | ) | (240 | ) | (257 | ) | (175 | ) | (5 | ) | (231 | ) | (166 | ) | ||||||||||||||||
| Net earnings (loss) |
632 | 4,555 | 644 | 683 | 505 | (1,191 | ) | 604 | 457 | |||||||||||||||||||||||
| Net earnings (loss) attributable to common shareholders |
594 | 4,502 | 579 | 630 | 461 | (1,237 | ) | 537 | 402 | |||||||||||||||||||||||
| Net earnings (loss) per common share – Basic and diluted |
0.64 | 4.84 | 0.63 | 0.68 | 0.51 | (1.36 | ) | 0.59 | 0.44 | |||||||||||||||||||||||
| Weighted average number of common shares outstanding – basic (millions) |
932.5 | 932.5 | 930.9 | 920.3 | 912.3 | 912.3 | 912.3 | 912.3 | ||||||||||||||||||||||||
| Other information |
||||||||||||||||||||||||||||||||
| Cash flows from operating activities |
1,561 | 1,914 | 1,947 | 1,571 | 1,877 | 1,842 | 2,137 | 1,132 | ||||||||||||||||||||||||
| Free cash flow |
225 | 1,003 | 1,152 | 798 | 874 | 832 | 1,097 | 85 | ||||||||||||||||||||||||
| Capital expenditures |
(1,317 | ) | (891 | ) | (763 | ) | (729 | ) | (963 | ) | (954 | ) | (978 | ) | (1,002 | ) | ||||||||||||||||
Fourth quarter highlights
| Operating revenues | Q4 2025 | Q4 2024 | $ change | % change | ||||||||||||
| Bell CTS |
5,693 | 5,681 | 12 | 0.2% | ||||||||||||
| Bell CTS Canada |
5,461 | 5,681 | (220) | (3.9%) | ||||||||||||
| Bell CTS U.S. |
232 | – | 232 | n.m. | ||||||||||||
| Bell Media |
804 | 832 | (28) | (3.4%) | ||||||||||||
| Inter-segment eliminations |
(93) | (91) | (2) | (2.2%) | ||||||||||||
| Total BCE operating revenues |
6,404 | 6,422 | (18) | (0.3%) | ||||||||||||
|
|
||||||||||||||||
| Adjusted EBITDA | Q4 2025 | Q4 2024 | $ change | % change | ||||||||||||
| Bell CTS |
2,513 | 2,436 | 77 | 3.2% | ||||||||||||
| Bell CTS Canada |
2,413 | 2,436 | (23) | (0.9%) | ||||||||||||
| Bell CTS U.S. |
100 | – | 100 | n.m. | ||||||||||||
| Bell Media |
151 | 169 | (18) | (10.7%) | ||||||||||||
| Total BCE adjusted EBITDA |
2,664 | 2,605 | 59 | 2.3% | ||||||||||||
n.m.: not meaningful
| BCE INC. 2025 ANNUAL FINANCIAL REPORT | 81 |
7 MD&A Selected annual and quarterly information
Total operating revenues at BCE decreased by 0.3% in Q4 2025, compared to the same period last year, driven by lower Bell Media operating revenues of 3.4%, partly offset by greater Bell CTS operating revenues of 0.2%, due to the contribution from Bell CTS U.S. of $232 million as a result of the acquisition of Ziply Fiber on August 1, 2025, partly offset by lower year-over-year revenues from Bell CTS Canada of 3.9%. The year-over-year decline reflected lower product revenues of 15.0%, partly offset by greater service revenues of 2.9%.
BCE net earnings increased by 25.1% in Q4 2025, compared to Q4 2024, mainly due to higher other income from net mark-to-market gains on derivatives used to economically hedge equity settle share-based compensation plans, higher adjusted EBITDA and higher net gains on investments, partly offset by higher depreciation and amortization expense and higher impairment of assets.
BCE adjusted EBITDA increased by 2.3% in Q4 2025, compared to the same period last year, driven by an increase in Bell CTS of 3.2% due to the contribution from our Bell CTS U.S. segment of $100 million resulting from the acquisition of Ziply Fiber on August 1, 2025, partly offset by a decline in our Bell CTS Canada segment of 0.9%. Our Bell Media segment adjusted EBITDA declined by 10.7% year over year, reducing BCE’s adjusted EBITDA growth. The year-over-year increase in BCE adjusted EBITDA resulted from lower operating costs of 2.0%, moderated by lower operating revenues. This drove an adjusted EBITDA margin of 41.6% in Q4 2025, up 1.0 pts over the same period last year, due to the benefit from cost reduction initiatives and operating efficiencies, and reflected higher product margins, due to our disciplined approach to subscriber loadings over the holiday period.
Bell CTS operating revenues increased by 0.2% in Q4 2025, compared to the same period in 2024, due to higher service revenues of 4.0%, partly offset by product revenues decline of 15.0%. This reflected the contribution from Bell CTS U.S. of $232 million due to the acquisition of Ziply Fiber on August 1, 2025, partly offset by a year-over-year decline in Bell CTS Canada of 3.9%. The decline in Bell CTS Canada was driven by lower product revenues of 15.0% and reduced service revenues of 1.1%.
Bell CTS Canada operating revenues decreased by 3.9% in Q4 2025, compared to Q4 2024, mainly from lower product revenues of 15.0%, primarily due to decreased wireless product revenues from fewer contracted wireless device sales given greater sales mix of BYOD customer activations, moderated by less discounting, along with lower wireline product revenues from reduced land mobile radio systems sales to the government sector due to timing. Q4 2025 service revenues decreased by 1.1% year over year, driven by ongoing declines in legacy voice, data and TV services, partly offset by higher Internet revenues in our consumer, wholesale and large business markets, reflecting growth in FTTP subscribers, along with the flow-through of residential rate increases, moderated by greater residential acquisition, retention and bundle discounts. Higher revenues from our AI-powered solutions business, including the impact of small acquisitions made in 2025, also moderated the decline in service revenues. Modest decline in wireless service revenues reflecting ongoing but abating competitive pressures on base rate plan pricing and higher discounting, as well as lower overage and outbound roaming revenues.
Bell CTS U.S. operating revenues were $232 million in Q4 2025, compared with nil in the same period last year, due to the acquisition of Ziply Fiber on August 1, 2025. The operating revenues were comprised of service revenues, mainly data revenues of $193 million and voice revenues of $41 million.
Bell CTS adjusted EBITDA increased by 3.2% in Q4 2025, compared to Q4 2024, due to the contribution from our Bell CTS U.S. segment of $100 million, resulting from the acquisition of Ziply Fiber on August 1, 2025, partly offset by a decline in our Bell CTS Canada segment of 0.9%. The year-over-year growth in adjusted EBITDA reflected lower operating costs of 2.0%, coupled with higher operating revenues. This resulted in Bell CTS adjusted EBITDA margin of 44.1% in Q4 2025, up 1.2 pts over Q4 2024.
Bell CTS Canada adjusted EBITDA declined by 0.9% in Q4 2025, compared to the same period in 2024, due to decreased operating revenues, mitigated in part by lower operating costs. The decline in operating costs of 6.1% year over year, reflected lower cost of goods sold related to the lower product revenues, along with cost reduction initiatives, mainly attributable to workforce reductions and various other cost containment initiatives across the organization, including technology and automation-enabled operating efficiencies. This drove an adjusted EBITDA margin of 44.2% in Q4 2025, up 1.3 pts, compared to Q4 2024, due to the benefit from cost reduction initiatives and operating efficiencies, as well reflected higher product margins, due to our disciplined approach to subscriber loadings over the holiday period.
Bell CTS U.S. adjusted EBITDA was $100 million in Q4 2025, compared to nil in Q4 2024, due to the acquisition of Ziply Fiber on August 1, 2025. This corresponded to an adjusted EBITDA margin of 43.1% for the quarter.
Bell Media operating revenues decreased by 3.4% in Q4 2025, compared to the same period last year, driven by lower advertising revenues, partly offset by higher other and subscriber revenues. Operating revenues reflected growth from digital revenues of 3.4% year over year. Advertising revenues declined by 11.1% year over year in the quarter, due to continued lower demand for traditional advertising across all platforms and reduced audio advertising revenues attributable to the previously announced divestitures of 45 radio stations, partly offset by higher digital video advertising revenues from growth in ad-supported subscription tiers on Crave and Connected TV. Other revenues increased year over year, due to greater program sales, mainly from the acquisition of Sphere Abacus in May 2025. Subscriber revenues increased by 1.5% in Q4 2025, compared to the same period last year, due to the growth in Crave and sports streaming revenues, primarily from higher DTC streaming subscribers, partly offset by continued erosion in BDU subscribers.
Bell Media adjusted EBITDA declined by 10.7% in Q4 2025, compared to the same period last year, driven by lower operating revenues, partly offset by reduced operating costs. The decrease in operating costs of 1.5% reflected content cost savings, along with the benefit from cost reduction initiatives relating to workforce reductions and other operating efficiencies, as well as lower expenses associated with the radio station divestitures, partly offset by contractual sports broadcasting rights and programming cost increases, coupled with the operating expenses of Sphere Abacus as a result of the acquisition in 2025.
BCE capital expenditures of $1,317 million in Q4 2025, increased by $354 million year over year, corresponding to a capital intensity ratio of 20.6%, up 5.6 pts over the same period last year, due to capital investments of $260 million in Bell CTS U.S. as a result of the acquisition of Ziply Fiber on August 1, 2025, with investments focused on the continued expansion of Ziply Fiber’s FTTP network in the U.S. Additionally, Bell CTS Canada capital spending increased by $83 million year over year, mainly due to timing of spend and higher Bell Media capital expenditures of $11 million due to the growth in digital video, including Crave expansion and 2026 FIFA World Cup readiness.
| 82 | BCE INC. 2025 ANNUAL FINANCIAL REPORT |
7 MD&A Selected annual and quarterly information
BCE severance, acquisition and other costs of $147 million in Q4 2025 decreased by $7 million, compared to Q4 2024, mainly due to lower severance costs related to involuntary and voluntary employee terminations.
BCE depreciation of $1,002 million in Q4 2025 increased by $69 million, year over year, mainly due to a higher asset base as a result of the acquisition of Ziply Fiber on August 1, 2025.
BCE amortization of $368 million in Q4 2025 increased by $51 million, year over year, mainly due to a higher asset base and as a result of the acquisition of Ziply Fiber on August 1, 2025.
BCE interest expense of $453 million in Q4 2025 increased by $22 million, compared to Q4 2024, mainly due to higher average debt balances and higher average cost of debt.
BCE impairment of assets of $40 million in Q4 2025 increased by $36 million, compared to Q4 2024, mainly due to impairment charges on various assets within our Bell CTS Canada segment.
BCE net gains on investments of $52 million in Q4 2025 increased by $53 million, year over year, mainly due to the sale of substantially all of our home security and monitored alarm assets on October 1, 2025.
BCE other income of $102 million in Q4 2025 increased by $204 million, year over year, mainly due to net mark-to-market gains on derivatives used to economically hedge equity settle share-based compensation plans in 2025 compared to losses in 2024.
BCE income taxes of $201 million in Q4 2025 increased by $26 million, compared to Q4 2024, mainly due to higher taxable income.
BCE net earnings attributable to common shareholders of $594 million in Q4 2025, or $0.64 per share, were higher than the $461 million, or $0.51 per share, reported in Q4 2024. The year-over-year increase was mainly due to higher other income from net mark-to-market gains on derivatives used to economically hedge equity settle share-based compensation plans, higher adjusted EBITDA and higher net gains on investments, partly offset by higher depreciation and amortization expense and higher impairment of assets. Adjusted net earnings decreased to $643 million in Q4 2025, compared to $719 million in Q4 2024, and adjusted EPS decreased to $0.69 from $0.79 in Q4 2024.
BCE cash flows from operating activities was $1,561 million in Q4 2025 compared to $1,877 million in Q4 2024. The decrease was mainly attributed to higher income taxes paid, settlements on derivatives used to economically hedge equity settled share-based compensation plans and timing of supplier payments, partly offset by lower interest paid.
BCE free cash flow generated in Q4 2025 was $225 million, compared to $874 million in Q4 2024. The decrease was mainly attributable to higher capital expenditures and lower cash flows from operating activities, excluding cash from acquisition and other costs paid.
Seasonality considerations
Some of our revenues and expenses vary slightly by season, which may impact quarter-to-quarter financial results.
Wireless service and product revenues are influenced by the timing of new mobile device launches and seasonal promotional periods, such as back-to-school, Black Friday and the Christmas holiday period, as well as the level of overall competitive intensity. Because of these seasonal effects, subscriber additions and retention costs due to device upgrades related to contract renewals are typically higher in the third and fourth quarters. For ARPU, historically we have experienced seasonal sequential increases in the second and third quarters, due to higher levels of usage and roaming in the spring and summer months, followed by historical seasonal sequential declines in the fourth and first quarters. However, this seasonal effect on ARPU has moderated, as unlimited and larger capacity data options and North America wide plans have become more prevalent, resulting in less variability in chargeable data usage.
Wireline service and product revenues tend to be higher in the fourth quarter because of historically higher data and equipment product sales to business customers. However, this may vary from year to year depending on the strength of the economy and the presence of targeted sales initiatives, which can influence customer spending. Home Phone, TV and Internet subscriber activity is subject to modest seasonal fluctuations, attributable largely to residential moves during the summer months and the back-to-school period in the third quarter. Targeted marketing efforts conducted during various times of the year to coincide with special events or broad-based marketing campaigns also may have an impact on overall wireline service and product revenues.
Bell Media revenue and related expenses from TV and radio broadcasting are largely derived from the sale of advertising, the demand for which is affected by prevailing economic conditions as well as cyclical and seasonal variations. Seasonal variations in video are driven by the strength of TV ratings, particularly during the fall programming season, major sports league seasons and other special sporting events such as the Olympic Games, NHL and NBA playoffs and FIFA World Cup soccer, as well as fluctuations in consumer retail activity during the year.
| BCE INC. 2025 ANNUAL FINANCIAL REPORT | 83 |
8 MD&A Regulatory environment
| 8 | Regulatory environment |
| 8.1 | Canadian regulatory environment |
Introduction
This section describes certain legislation that governs our Canadian business and provides highlights of recent regulatory initiatives and proceedings, government consultations and government positions that affect us, influence our business and may continue to affect our ability to compete in the marketplace. Bell Canada and several of its direct and indirect subsidiaries, including Bell Mobility, Bell ExpressVu Limited Partnership (ExpressVu), Bell Media, NorthernTel, Limited Partnership (NorthernTel), Télébec, Limited Partnership (Télébec), Group Maskatel Québec LP (Maskatel) and Northwestel, are governed by the Telecommunications Act, the Broadcasting Act, the Radiocommunication Act and/or the Bell Canada Act. Our business is affected by regulations, policies and decisions made by various regulatory agencies, including the CRTC, a quasi-judicial agency of the Government of Canada responsible for regulating Canada’s telecommunications and broadcasting industries, and other federal government departments, in particular ISED and the Competition Bureau.
In particular, the CRTC regulates the prices we can charge for retail telecommunications services when it determines there is not enough competition to protect the interests of consumers. The CRTC has determined that competition is sufficient to grant forbearance from retail price regulation under the Telecommunications Act for the vast majority of our retail wireline and wireless telecommunications services. The CRTC can also mandate the provision of access by competitors
to our wireline and wireless networks and the rates we can charge them. Notably, it currently mandates wholesale high-speed access for wireline broadband as well as domestic wireless roaming services and a wholesale facilities-based MVNO access service. Lower mandated wholesale rates or the imposition of unfavourable terms for mandated services would undermine our incentives to invest in network improvements and extensions, limit our flexibility, influence the market structure, improve the business position of our competitors, limit network-based differentiation of our services and negatively impact the financial performance of our businesses. Our TV distribution and our TV and radio broadcasting businesses are subject to the Broadcasting Act and are, for the most part, not subject to retail price regulation.
Although most of our retail services are not price-regulated, government agencies and departments such as the CRTC, ISED, Canadian Heritage and the Competition Bureau continue to play a significant role in regulatory matters such as establishing and modifying regulations for mandatory access to networks, spectrum auctions, the imposition of consumer-related codes of conduct, approval of acquisitions, broadcast and spectrum licensing, foreign ownership requirements, privacy and cybersecurity obligations, and control of copyright piracy. Adverse decisions by governments or regulatory agencies, increasing regulation or a lack of effective anti-piracy remedies could have negative financial, operational, reputational or competitive consequences for our business.
Telecommunications Act
The Telecommunications Act governs telecommunications in Canada. It defines the broad objectives of Canada’s telecommunications policy and provides the Government of Canada with the power to give general direction to the CRTC on any of its policy objectives. It applies to several of the BCE group of companies and partnerships, including Bell Canada, Bell Mobility, NorthernTel, Télébec, Maskatel and Northwestel.
Under the Telecommunications Act, all facilities-based telecommunications service providers in Canada, known as telecommunications common carriers (TCCs), must seek regulatory approval for all telecommunications services, unless the services are exempt or forborne from regulation. Most retail services offered by the BCE group of companies are forborne from retail regulation. The CRTC may exempt an entire class of carriers from regulation under the Telecommunications Act if the exemption meets the objectives of Canada’s telecommunications policy. In addition, a few large TCCs, including those in the BCE group, must also meet certain Canadian ownership requirements. BCE monitors and periodically reports on the level of non-Canadian ownership of its common shares.
Review of mobile wireless services
In Q3 2023, we began providing MVNO access service on Bell Mobility’s network in certain regions. On July 13, 2023, the CRTC accepted a request from Québecor Media Inc. to initiate Final Offer Arbitration (FOA) in respect of rates for MVNO access service from Bell Mobility. On October 10, 2023, the CRTC selected the rate proposed by Bell Mobility. On August 29, 2024, the CRTC denied a Part 1 application from Québecor Media Inc. regarding the start date for the MVNO access service from Bell Mobility and set September 12, 2024 as the start date for Bell Mobility’s MVNO access service, directing the parties to enter into an MVNO access agreement by such date. Québecor Media Inc. is now receiving MVNO access from Bell Mobility under this agreement.
On November 27, 2024, Québecor Media Inc. asked the CRTC to review and vary its previous decision and to order Bell Mobility to reimburse them for the difference between the roaming fees Québecor Media Inc. paid from October 10, 2023 to September 12, 2024, and the amount Québecor Media Inc. would have paid if the MVNO access rate had been used during this time. On January 20, 2025, Bell Mobility submitted its response opposing Québecor Media Inc.’s request because it did not meet the CRTC’s established criteria for review. The CRTC has not yet issued its decision on Québecor Media Inc.’s application.
The CRTC previously accepted a request for FOA from Rogers Communications Canada Inc. and Québecor Media Inc. in respect of rates for MVNO access service from Rogers Communications Canada Inc. On July 24, 2023, the CRTC selected the rate proposed by Québecor Media Inc., making several findings downplaying the importance of incentives for investment in Canadian telecommunications networks. Rogers Communications Canada Inc. subsequently appealed the CRTC’s decision with the Federal Court of Appeal. On May 28, 2025, the Federal Court of Appeal upheld the CRTC’s decision, finding no errors in their selection of Québecor Media Inc.’s proposed rate. While the CRTC’s subsequent determination in Bell Mobility’s FOA with Québecor Media Inc. appears to have moderated this approach by highlighting the importance of providing a return on investment to facilities-based carriers, adverse regulatory decisions such as the Rogers Communications Canada Inc. and Québecor Media Inc. FOA decision are expected to impact how, where and when we invest in our future wireless and wireline networks.
| 84 | BCE INC. 2025 ANNUAL FINANCIAL REPORT |
8 MD&A Regulatory environment
CRTC examination of retail rates for international roaming
On October 7, 2024, the CRTC issued a letter to each of Bell Mobility, Rogers Communications Canada Inc. and Telus Communications Inc. (collectively, the Companies) indicating that following a review it had conducted of fees that Canadians pay when they travel internationally, it had certain concerns with respect to the choice available to Canadians when roaming and roaming rates. The CRTC indicated that it expected the Companies to report back to the CRTC by November 4, 2024 on the steps they are taking to respond to these concerns and that if it determines that sufficient action is not taken, it will launch a formal proceeding. Each of the Companies filed their responses on November 4, 2024 setting out their plans to the CRTC. On March 7, 2025, the CRTC responded that it was “encouraged” by some of the steps taken to date, while also setting its expectation for more progress on reducing roaming fees, including for pay-per-use offerings. It directed the Companies to provide further updates on May 5, 2025 and again on November 5, 2025, which the Companies delivered. On February 5, 2026, the CRTC requested supplemental information on the Companies’ roaming offerings, with a response due March 19, 2026. While the timing and outcome of any further CRTC process regarding our international roaming rates is currently unknown and it is unclear what impact, if any, such a process could have, any action by the CRTC to regulate the rates or attributes of the international roaming offerings of wireless carriers is likely to have a negative impact on our business and financial results.
Review of the wholesale high-speed access service framework
On November 6, 2023, in Telecom Decision CRTC 2023-358 (the Interim Decision), the CRTC determined that aggregated access to Bell Canada’s FTTP facilities in Ontario and Québec should be mandated on a temporary and expedited basis, and the CRTC set interim access rates.
On August 13, 2024, in Telecom Regulatory Policy CRTC 2024-180 (the Final Decision), the CRTC mandated that the interim obligation to provide wholesale aggregated access to Bell Canada’s FTTP facilities in Ontario and Québec, and to Telus Communications Inc.’s FTTP facilities in Québec, would be made final. Further, the Final Decision expanded the geographic scope of the Interim Decision such that Bell Canada was required to provide wholesale aggregated access to its FTTP facilities in Atlantic Canada and Manitoba by February 13, 2025. Telus Communications Inc. and Saskatchewan Telecommunications were also required to provide aggregated access to their respective FTTP facilities in Alberta, B.C., and Saskatchewan by the same date. This obligation does not apply to any new FTTP networks that Bell Canada, Telus Communications Inc., or Saskatchewan Telecommunications make available at retail during the five-year period between August 13, 2024 and August 12, 2029. However, this five-year period is not a continuously rolling period. Instead, all new FTTP locations, regardless of when they are made available at retail, will be subject to a wholesale aggregated access obligation as of August 12, 2029. Under the Final Decision, cable companies are exempt from wholesale FTTP obligations and, as such, are not required to provide wholesale access to their FTTP networks. Also, under the Final Decision, Bell Canada, Saskatchewan Telecommunications, Telus Communications Inc., Cogeco, Eastlink, Rogers Communications Canada Inc., Québecor Media Inc., and their respective affiliates are not eligible to buy mandated aggregated wholesale high-speed access, whether over copper, coaxial cable, or FTTP, within their traditional incumbent wireline footprints. As a result, Distributel and other Bell Canada brands were required to, and did, cease reselling wholesale high-speed access over coaxial cable to new customers after September 12, 2024.
In a motion dated September 12, 2024, Saskatchewan Telecommunications also sought leave to appeal the Final Decision to the Federal Court of Appeal.
Several parties, including CNOC, Cogeco, Eastlink, Rogers Communications Canada Inc. and TekSavvy Solutions Inc. filed Part 1 applications asking the CRTC to review and vary several aspects of the Final Decision. On June 20, 2025, the CRTC issued Telecom Decision CRTC 2025-154 (the R&V Decision) denying all of the review and vary applications. In a motion dated July 18, 2025, Cogeco and Eastlink sought leave to appeal the R&V Decision to the Federal Court of Appeal, which was granted on September 10, 2025.
CNOC, Cogeco, Eastlink, and Saskatchewan Telecommunications filed a joint appeal of the Final Decision to the Governor-in-Council. On August 6, 2025, the Governor-in-Council announced that it had declined to alter the Final Decision. In September 2025, Cogeco, Eastlink and Saskatchewan Telecommunications, Rogers Communications Canada Inc., and CNOC filed appeals of the R&V Decision to the Governor-in-Council.
On October 25, 2024, in Telecom Order CRTC 2024-261, the CRTC updated interim rates for Ontario and Quebec and set interim rates for the other provinces. If final rates are established that are different from the interim rates, there is a risk they will be applied retroactively.
The imposition of an aggregated access to FTTP facilities obligation, and, in particular, making Telus Communications Inc. and Rogers Communications Canada Inc. eligible to resell services on Bell Canada’s FTTP network, have undermined Bell Canada’s incentives to invest in next-generation wireline networks. As a direct result, Bell Canada has reduced its capital expenditures by $500 million in 2025 alone and by over $1.2 billion since the Interim Decision in November 2023. The financial impact of these regulatory obligations will be determined in part by whether the CRTC establishes final rates that fully compensate Bell Canada for the significant costs and risks Bell Canada assumes in expanding and upgrading its networks.
Implementing a retail Internet service subsidy in the Far North
On January 16, 2025, the CRTC issued a decision in its proceeding to review the regulatory framework for Northwestel and the state of telecommunications services in Canada’s North. In this decision, the CRTC announced that it would introduce a new retail Internet subsidy to improve affordability in the Far North, to be funded by the National Contribution Fund. On January 16, 2025, the CRTC initiated a new proceeding (TNC 2025-10) to consider the implementation details of that subsidy, including the amount. At this time, it is unclear what impact the CRTC’s decision in the subsidy proceeding could have on our business and financial results, including any potential incremental increase that BCE may have to pay to the National Contribution Fund as a result.
CRTC review of access to poles
On February 15, 2023, the CRTC issued a decision which included a number of determinations to facilitate access by third parties to poles owned by Canadian carriers or poles to which Canadian carriers control access. Among other directions, the CRTC’s decision: establishes new timelines for each step in the pole access permitting process; reduces the obligations of access seekers to pay costs for any pole repairs, upgrades or replacements required to accommodate the addition of the access seeker’s equipment; provides access seekers with greater flexibility to carry out pole repairs and upgrades themselves; maintains the circumstances under which pole owners may obtain priority access to poles or reserve capacity for their future use on poles; and imposes new notification and reporting obligations on pole owners. On April 3, 2023, large ILECs, including Bell Canada through Tariff Notices 977 and 978, updated their applicable tariffs to incorporate the new determinations and these tariffs were approved by the CRTC on January 28, 2025 through Telecom Order CRTC 2025-21.
| BCE INC. 2025 ANNUAL FINANCIAL REPORT | 85 |
8 MD&A Regulatory environment
On October 16, 2023, Bell Canada filed Tariff Notice 981 to revise the tariff pages for its National Services Tariff CRTC 7400 Item 901 – Support Structure Service to reflect an updated monthly pole rental rate per unit applicable in its Ontario and Québec serving area, and on March 11, 2025, in Telecom Order CRTC 2025-77, the CRTC made the existing pole rates interim. The CRTC issued its final decision on rates on October 17, 2025, establishing a final rate of $1.32 per billing unit per month for attachment to our poles, an increase from the previous $1.04 which will increase our revenues. Bell disagreed with certain adjustments made to its cost study and, on January 15, 2026, filed an application seeking a review and variance of this decision to correct these adjustments. Should the CRTC agree with these corrections, the rate and associated revenues would further increase.
Bill C-8, An Act Respecting Cyber Security
On June 18, 2025, the federal government introduced Bill C-8, An Act respecting cyber security, amending the Telecommunications Act and making consequential amendments to other Acts (Bill C-8). Excepting a few minor changes, Bill C-8 mirrors the language of Bill C-26, An Act Respecting Cyber Security, which died on the Order Paper with the call of the 2025 Federal election. Bill C-8 would enact the Critical Cyber Systems Protection Act, which would establish a regulatory framework requiring designated operators in the finance, telecommunications, energy and transportation sectors to protect their critical cyber systems. Bill C-8 also includes proposed changes to the Telecommunications Act that would establish new authorities that would enable the federal government to take action to promote the security of the Canadian telecommunications system, which could include measures with respect to high-risk suppliers, such as Huawei and ZTE. If enacted, Bill C-8 would give the federal cabinet and the ISED Minister additional order-making powers and establish greater supply chain scrutiny, incidence reporting and response, annual reviews and an enforcement regime under which the Minister responsible for ISED could impose administrative monetary penalties, among other actions. It is unclear at this time what impact the legislative changes could have on our business and financial results. Bill C-8 has passed the second reading stage in the House of Commons and has been referred to the Standing Committee on Public Safety and National Security for study.
CRTC proceedings resulting from recent amendments to the Telecommunications Act
On November 22, 2024, the CRTC launched three public consultations to consider enhanced measures under the Wireless and Internet Codes to give Canadians more flexibility to choose their mobile and Internet plans: Telecom Notice of Consultation CRTC 2024-293, Call for Comments – Making it easier to choose a wireless phone or Internet service – Enhancing customer notification; Telecom Notice of Consultation CRTC 2024-294, Call for comments – Making it easier to choose a wireless phone or Internet service – Removing barriers to switching plans; and Telecom Notice of Consultation CRTC 2024-295, Call for comments – Making it easier to choose a wireless phone or Internet service – Enhancing self-service mechanisms.
The consultations follow the passing of Bill C-69, An Act to implement certain provisions of the budget tabled in Parliament on April 16, 2024 (Bill C-69), which received royal assent on June 20, 2024. Bill C-69 includes amendments to the Telecommunications Act directing the CRTC to implement certain specific measures related to the arrangements between telecommunications providers and their customers, including prohibiting charging certain extra fees to switch carriers or modify service arrangements. The amendments require the CRTC to specify the type of fees to which the amendments will apply and the rules around how the amendments will be implemented.
On December 4, 2024, the CRTC issued another notice of consultation (TNC 2024-318, Making it easier for consumers to shop for Internet services) as a result of recent amendments to the Telecommunications Act through Bill C-288. It required the CRTC to hold public hearings, which took place from June 10, 2025 to June 13, 2025, to discuss how Internet service providers (ISPs) should make certain information on fixed broadband services available to the public.
The timing of any CRTC decision with respect to these proceedings is currently unknown and it is unclear what impact, if any, these proceedings could have on our business and financial results. Any action by the CRTC to regulate the fees charged by carriers, how customers switch between carriers or how ISPs must share information with customers is likely to have a negative impact on our business and financial results as a result of increased operational costs or other negative outcomes.
CRTC proceedings on outage reporting, consumer protections associated with outages and network resiliency
On September 4, 2025, the CRTC issued a decision and two consultations that could materially impact Bell Canada’s operational and compliance costs. Telecom Decision CRTC 2025-225 introduces mandatory outage reporting for telecommunications service providers, including new reporting thresholds tied to user-minutes which would significantly increase the amount of reporting by providers which had previously been set for outages that impact 100,000 users or more. The CRTC agreed to a request from a large group of providers to suspend the application of the new reporting thresholds pending its consideration of an application from that group seeking changes to the notification regime. While implementation is suspended pending review, Bell Canada anticipates incremental compliance costs for enhanced monitoring and reporting systems, as well as potential adverse publicity with respect to outages.
The CRTC also opened a consultation (Telecom Notice of Consultation CRTC 2025-226) on network resiliency standards. The consultation seeks input on measures intended to harden infrastructure, improve outage response, and enhance reliability across Canada’s telecommunications networks. Prescriptive requirements could drive additional capital expenditures to comply with regulatory mandates, particularly in rural and remote markets where construction is particularly cost-intensive.
The CRTC also seeks input on consumer protections during outages (Telecom and Broadcasting Notice of Consultation CRTC 2025-227), including potential compensation and/or notification frameworks. Depending on the outcome, Bell Canada may face new obligations for customer credits and communication protocols, which could increase operating expenses and require system changes, further increasing compliance costs and regulatory burden.
Canada’s telecommunications foreign ownership rules
Under the Telecommunications Act, there are no foreign investment restrictions applicable to TCCs that have less than a 10% share of the total Canadian telecommunications market as measured by annual revenues. However, foreign investment in telecommunications companies can still be refused by the government under the Investment Canada Act. The absence of foreign ownership restrictions on such small or new entrant TCCs could result in more foreign companies entering the Canadian market, including by acquiring spectrum licences or Canadian TCCs.
| 86 | BCE INC. 2025 ANNUAL FINANCIAL REPORT |
8 MD&A Regulatory environment
Broadcasting Act
The Broadcasting Act outlines the broad objectives of Canada’s broadcasting policy and assigns the regulation and supervision of the broadcasting system to the CRTC. Key policy objectives of the Broadcasting Act are to protect and strengthen the cultural, political, social and economic fabric of Canada and to encourage the development of Canadian expression.
Most broadcasting activities require a programming or distribution licence from the CRTC. The CRTC may exempt broadcasting undertakings from complying with certain licensing and regulatory requirements if it is satisfied that non-compliance will not materially affect the implementation of Canadian broadcasting policy. A corporation must also meet certain Canadian ownership and control requirements to obtain a programming or distribution licence, and corporations must have the CRTC’s approval before they can transfer effective control of a broadcasting licensee.
Our TV distribution operations and our TV and radio broadcasting operations are subject to the requirements of the Broadcasting Act, the policies and decisions of the CRTC and their respective broadcasting licences. Any changes in the Broadcasting Act, amendments to regulations or the adoption of new ones, or amendments to licences, could negatively affect our competitive position or the cost of providing services.
Broadcasting Notice of Consultation CRTC 2023-138
On May 12, 2023, the CRTC issued Broadcasting Notice of Consultation CRTC 2023-138, The Path Forward – Working towards a modernized regulatory framework regarding the contributions to support Canadian and Indigenous content. This Notice represents the first step to developing an updated regulatory framework for broadcasting undertakings, including online undertakings which were brought into the Broadcasting Act through Bill C-11, the Online Streaming Act. A key part of this new framework is to establish the conditions under which online services would be required to make financial contributions, including initial base contributions, to support the creation and discoverability of Canadian and Indigenous content. It will also determine who the recipients of the initial base contributions will be. On June 4, 2024, the CRTC released its decision, requiring foreign streamers to contribute 5% of their Canadian broadcasting revenue to various funds set out by the CRTC as of September 2024. However, Canadian streamers affiliated with a licensed broadcaster (for example, Bell Media’s linear Crave service available through cable companies) have been exempted from this requirement until the CRTC reviews the existing regulatory obligations of traditional media properties. Foreign streamers, specifically Amazon. com.ca ULC, Apple Canada Inc., the Motion Picture Association-Canada (which represents Netflix Studios, LLC, Paramount Pictures Corporation, Sony Pictures Entertainment Inc., Universal City Studios LLC, Walt Disney Studios Motion Pictures, and Warner Bros. Entertainment Inc.) and Spotify AB, have each sought leave to appeal and/or judicial review of the CRTC’s decision. Each company has challenged various different aspects of the decision, including, in some cases, the reasonableness of the CRTC exempting Canadian streamers affiliated with licensed broadcasters but not exempting foreign streamers. The CRTC has launched additional consultations, including on how to support the creation of Canadian and Indigenous content (both audio-visual and audio), as well as diversity, inclusion and discoverability issues (see Broadcasting Notice of Consultation CRTC 2024-288 and Broadcasting Notice of Consultation CRTC 2025-52 below). In addition, the CRTC has
initiated a consultation on ensuring a sustainable broadcasting system (see Broadcasting Notice of Consultation CRTC 2025-2 below). As a last step, the CRTC intends to finalize each undertaking’s or ownership group’s contribution requirements, presumably as part of our group licence renewal. The timing and outcome of all of these proceedings is unknown. Therefore, the impact that these regulatory changes could have on our business and financial results is unclear at this time.
Broadcasting Notice of Consultation CRTC 2024-288
On November 15, 2024, the CRTC issued Broadcasting Notice of Consultation CRTC 2024-288, The Path Forward – Defining “Canadian Program” and supporting the creation and distribution of Canadian programming in the audio-visual sector. This consultation will modernize the definition of Canadian content and will also explore the types of expenditures that traditional broadcasting undertakings and online undertakings should make towards this content. On November 18, 2025, the CRTC announced a revised definition of Canadian content, raising the required number of creative positions to be held by Canadians and implementing a graduated threshold for Canadian copyright ownership. In-house productions by Canadian broadcasters continue to qualify as Canadian content and remain exempt from the CRTC’s formal certification process. In addition, the CRTC determined that foreign streaming services must publicly release their Canadian broadcasting revenues and spending on Canadian content, which Canadian broadcasters currently do. A number of parties have sought leave to appeal the CRTC’s decision. The Canadian Media Producers Association has challenged the CRTC’s finding that Canadians only need to hold 20% copyright ownership in a production for it to qualify as Canadian content. In addition, the Motion Picture Association-Canada (which represents Netflix Studios, LLC, Paramount Pictures Corporation, Sony Pictures Entertainment Inc., Universal City Studios LLC, Walt Disney Studios Motion Pictures, and Warner Bros. Entertainment Inc.) and Apple Canada have challenged the requirement to release their financial information without confidentiality protections. Finally, a second CRTC decision is expected relating to the expenditures that Canadian broadcasting undertakings and online undertakings should make towards Canadian content. The outcome and timing of these proceedings is unknown. Therefore, the impact that these regulatory changes could have on our business and financial results is unclear at this time.
Broadcasting Notice of Consultation CRTC 2025-2
On January 9, 2025, the CRTC issued Broadcasting Notice of Consultation CRTC 2025-2, The Path Forward – Working towards a sustainable Canadian broadcasting system. This consultation will examine the market dynamics between programming undertakings, broadcasting distribution undertakings and online undertakings with a view to ensuring that the industry is able to meet the policy objectives set out in the Broadcasting Act. This proceeding will also look at all the regulatory tools that both programming undertakings (like Bell Media) and broadcasting distribution undertakings (like Bell TV) use in negotiations with other licensees for the carriage and distribution of programming services. The CRTC held a three-week hearing that began on June 18, 2025 to focus on these issues. The outcome and timing of this decision is unknown. Therefore, the impact that any regulatory changes could have on our business and financial results is unclear at this time.
| BCE INC. 2025 ANNUAL FINANCIAL REPORT | 87 |
8 MD&A Regulatory environment
Broadcasting Notice of Consultation CRTC 2025-52
On February 20, 2025, the CRTC issued Broadcasting Notice of Consultation CRTC 2025-52, The Path Forward – Supporting Canadian and Indigenous audio content. This consultation seeks to update the definition of what constitutes a Canadian musical selection, i.e., the Music, Artist, Performance, Lyrics system, and to provide a definition of French-language vocal music. In addition, the CRTC intends to explore how radio stations and audio streaming services can support the airplay of emerging artists as well as Indigenous artists, both potentially through exhibition and expenditure requirements. The CRTC held a hearing that began on September 18, 2025 to focus on these issues. The outcome and timing of this decision is unknown. Therefore, the impact that these regulatory changes could have on our business and financial results is unclear at this time.
Broadcasting and Telecom Notice of Consultation CRTC 2025-274
On October 17, 2025, the CRTC issued Broadcasting and Telecom Notice of Consultation CRTC 2025-274, Improving customer awareness of the CCTS. This consultation seeks comments on measures to improve customer awareness of the CCTS. The CRTC’s preliminary view is to amend the Internet Code, Wireless Code and Television Service Provider Code (the Consumer Protection Codes) to standardize how and when customers are advised about their right to take unresolved complaints to the CCTS. The Notice of Consultation set out a deadline for initial submissions of November 17, 2025. A large group of service providers, including Bell Canada, Rogers Communications Canada Inc., Telus Communications Inc., Cogeco, Québecor Media Inc., Bragg Communications Inc. carrying on business as Eastlink, Saskatchewan Telecommunications, and Xplore Inc., have jointly written to the CRTC expressing concern regarding the Notice of Consultation – including that the measures supported in the CRTC’s preliminary view cannot practically be implemented – and asked the CRTC to suspend the current timelines and establish a different process for considering the relevant issues. On November 12, 2025, the CRTC temporarily suspended all deadlines in the proceeding until further notice, commenting
that it would issue a new notice of consultation addressing the procedural requests.
The timing of any CRTC decision with respect to this proceeding is currently unknown and it is unclear what impact, if any, this proceeding could have on our business and financial results. Any action by the CRTC to require telecom service providers to implement new workflows within their complaint-resolution processes is likely to have a negative impact on our business and financial results as a result of increased operational costs or other negative outcomes.
CRTC examination of Bell’s device unlocking practices
On April 22, 2025, Bell advised the CRTC of a safety initiative launching that month to address rapidly increasing wireless device theft and fraud, under which new wireless devices would unlock automatically after 60 days, with no-cost early unlocking available upon request. On May 9, 2025, CRTC staff sought information from Bell on how its approach would remain compliant with the Wireless Code of Conduct (the Wireless Code), and Bell responded on May 16, 2025 outlining its approach and proposing paths to address any residual issues.
On November 28, 2025, the CRTC issued a letter suggesting Bell’s practice was inconsistent with the Wireless Code, directing Bell to cease selling locked devices and unlock impacted devices, while notifying any affected customers once it had done so. On December 22, 2025, Bell filed its response asking the CRTC to rescind the November letter or otherwise clarify it is not a binding CRTC decision. In the alternative, if the letter were to be treated by the CRTC as a decision, Bell applied to review and vary it, citing substantial doubt as to the decision’s correctness on factual, legal, and procedural grounds. In each case, Bell requested a stay pending disposition of the matter.
The timing of any final CRTC resolution of this matter is currently unknown. Any action by the CRTC that requires Bell to undo its current device unlocking practice is likely to negatively impact our business and financial results, including through increased costs related to fraud and other criminal activity or other adverse outcomes.
Radiocommunication Act
ISED regulates the use of radio spectrum under the Radiocommunication Act and Radiocommunication Regulations to ensure that radiocommunication in Canada is developed and operated efficiently. All companies wishing to operate radio apparatus in Canada must hold a radio licence or spectrum licence to do so. The Radiocommunication Regulations specify those persons (including corporations such as Bell Canada and Bell Mobility) who are eligible to be issued radio licences or spectrum licences.
Consultation on 26, 28 and 38 GHz (Millimeter Wave) spectrum licensing framework
On June 6, 2022, ISED initiated a consultation seeking input regarding a policy and licensing framework to govern the auction and use of spectrum licences in the 26, 28 and 38 Gigahertz (GHz) (Millimeter Wave) spectrum bands. The consultation paper seeks comments on the use of a spectrum set-aside for certain auction bidders, or a spectrum cap across the 26, 28 and 38 GHz spectrum bands. ISED proposes that the auctioned licences will have a 10-year term and that there will be limits on the extent of transferability of licences for the first five years of the licence term. In addition, ISED proposes that licensees will be required to deploy a certain number of sites in each licence area at five and nine and a half years following licence issuance. The consultation paper also seeks comments on the transition process for existing 38 GHz licensees from fixed to flexible use (i.e., mobile or fixed use), as well as the limitations on the use of 38 GHz spectrum by satellite earth stations.
On March 6, 2025, ISED initiated a consultation as an addendum to the 2022 Consultation on a Policy and Licensing Framework for Spectrum in the 26, 28 and 38 GHz Bands (2022 Millimetre Wave Licensing Consultation), seeking input regarding the repurposing of the lower 26 GHz spectrum band (formerly referred to as the 24 GHz spectrum band) for flexible use for fixed and mobile services and its inclusion in the 2022 Millimetre Wave Licensing Consultation. ISED proposes that 850 MHz of spectrum in the combined 26 GHz spectrum band be allocated for a non-competitive local licensing process and 2.4 GHz of the combined 26 GHz spectrum band be available for the auction process described in the 2022 Millimetre Wave Licensing Framework. The consultation paper also seeks comments on the use of a spectrum cap. ISED has not yet indicated a specific date when the auction will take place. It is unclear what impact the results of this consultation and future-related processes could have on our business and financial results.
On March 6, 2025, ISED released an Addendum to the Non-Competitive Local Licensing Framework to include Spectrum in the 27.5-28.35 GHz Band which states that ISED will make available 850 MHz of spectrum in the 28 GHz spectrum band for flexible use operations through a non-competitive local licensing process. Of the 850 MHz of spectrum available, 450 MHz of spectrum will be reserved for use by small operators, including small commercial mobile service providers, non-traditional users and wireless Internet service providers.
| 88 | BCE INC. 2025 ANNUAL FINANCIAL REPORT |
8 MD&A Regulatory environment
Bell Canada Act
Among other things, the Bell Canada Act limits how Bell Canada voting shares and Bell Canada facilities may be sold or transferred. Specifically, under the Bell Canada Act, the CRTC must approve any sale or other disposal of Bell Canada voting shares that are held by BCE, unless the sale or disposal would result in BCE retaining at least 80% of all
of the issued and outstanding voting shares of Bell Canada. Except in the ordinary course of business, the sale or other disposal of facilities integral to Bell Canada’s telecommunications activities must also receive CRTC approval.
Other
Bill C-18, the Online News Act
On June 22, 2023, Bill C-18, An Act respecting online communications platforms that make news content available to persons in Canada (the Online News Act), received royal assent. The Online News Act requires digital news intermediaries, such as Google, that share news content produced by other news outlets to negotiate commercial arrangements with those news outlets, compensating them for the news content shared on digital platforms. The legislation entitles Bell Media’s general news services, such as CTV and Noovo, to compensation. Further details regarding the compensation framework have been set out in regulations that were released on December 15, 2023 (the Regulations). The Regulations clarify that the Online News Act applies to search engines and social media sites that provide access to news content in Canada, provided these platforms earn at least $1 billion in annual global revenue and reach at least 20 million Canadians on a monthly basis. However, the Regulations also allow Google to apply to be exempt from parts of the Online News Act if it commits to pay $100 million annually (growing each year by inflation) to a collective (the Collective) which will then distribute it to eligible news outlets. On June 7, 2024, Google submitted an application for exemption to the CRTC and on October 28, 2024, the CRTC approved a five-year exemption for Google, which required Google to provide payment to the Collective by December 27, 2024 for calendar year 2024. Pursuant to the Regulations, of the $100 million to be paid by Google, news outlets that are also private broadcasters, such as CTV and Noovo, cannot receive more than 30% of the overall compensation available (with other news outlets, such as those associated with newspapers and public broadcasters, receiving the rest). For 2024, Bell Media received a total payment of $8,162,577. Bell Media’s application for compensation for 2025 is currently being assessed by the Collective; payment is expected by the end of the first quarter of 2026. Finally, on December 12, 2024, the CRTC established the mandatory bargaining process which would apply between news outlets and digital news intermediaries that are captured by the Online News Act. This framework was necessary for the CRTC to put into place in order to administer the Online News Act. However, while Google retains its exemption, the mandatory bargaining process is not expected to be utilized.
Bill C-2, the Strong Borders Act
On June 3, 2025, the federal government introduced Bill C-2, An Act respecting certain measures relating to the security of the border between Canada and the United States and respecting other related security measures (the Strong Borders Act), in response to calls from the U.S. administration for enhanced security along the U.S.-Canada border. Bill C-2 proposes the creation of a new Supporting Authorized Access to Information Act, as well as amendments to the Criminal Code and Canadian Security Intelligence Service Act, which would grant law enforcement and other government bodies broader authority to demand information – including a wider range of subscriber data – from service providers such as Bell Canada. In urgent situations, these demands could be made without a warrant. Additionally, Bill C-2 would require service providers to proactively develop, test, and maintain systems that enable the extraction and provision of information to law enforcement. Service providers would be obligated to facilitate access, support system testing, and comply with inspections/audits, significantly expanding our obligations beyond simply responding to requests. The legislation establishes a general framework for compensating service providers but leaves key details to future regulations and indicates compensation for Ministerial orders is discretionary. The expanded scope of lawful access requests will require us to increase staffing and incur new costs to meet the information demands. The legislation also includes fines and administrative monetary penalties for non-compliance. At this time, it is unclear how these legislative changes might affect our business operations and financial results.
On October 8, 2025, the federal government tabled the Strengthening Canada’s Immigration System and Borders Act (Bill C-12) as a streamlined version of Bill C-2 that focuses on border and immigration controls and omits the lawful access provisions that had raised opposition and civil liberties concerns. While it has not been formally withdrawn, the status of Bill C-2 is now unclear.
| 8.2 | U.S. regulatory environment |
Introduction
Certain services offered by Ziply Fiber in the U.S. are subject to extensive federal, state and local regulation, including oversight by the FCC, state public utility commissions, municipalities and other governmental authorities, which collectively influence the rates, terms, deployment, interconnection, certifications, and operational conditions applicable to our U.S. operations. As both an ILEC and a CLEC, we operate under regulatory frameworks that include carrier-of-last-resort obligations in certain states, service quality and reporting standards, and, price-cap
regulation, while municipalities and other local governmental bodies regulate access to public rights-of-way and may require franchises, licenses, permits, and compliance with local construction codes. The cumulative effect of these regimes, and any changes thereto, may increase compliance costs, constrain operational flexibility and rate adjustments, affect subsidy funding, and materially influence the competitive dynamics in Ziply Fiber’s markets.
| BCE INC. 2025 ANNUAL FINANCIAL REPORT | 89 |
8 MD&A Regulatory environment
U.S. regulatory developments and risks
The following highlights U.S. legal, regulatory and policy developments that affect, or could affect, Ziply Fiber’s business, financial condition and results of operations.
Federal and state subsidies; universal service programs; affordability programs
Ziply Fiber participates in U.S. federal and state subsidies targeted at high-cost, rural network deployment including legacy high-cost support, the Connect America Fund Phase II (CAF II) as well as its contemporary program, the Rural Digital Opportunity Fund (RDOF). These awards require satisfaction of buildout milestones, service obligations and reporting requirements; failure to comply may lead to penalties, forfeitures or disqualification from future programs. In addition, Ziply Fiber participates in U.S. federal and in multiple state low-income subsidy programs. Ongoing legal challenges to aspects of these universal service programs and potential policy changes could adversely affect both the availability of support and our ability to recover contributions. Further, the termination or material modification of federal affordability initiatives may affect demand dynamics, uptake by income-constrained customers, and associated reimbursements to participating providers.
ILEC/CLEC obligations; state service quality and price regulation
As an ILEC in several states, Ziply Fiber remains subject to service obligations, including carrier-of-last-resort requirements, and to various service quality standards and reporting, with potential penalties or other enforcement actions for non-compliance. We are subject to price cap or alternative rate plans for specific services, and program expirations may require renegotiation that could affect rates, infrastructure investment commitments, and operating performance. We continue to advocate for no or reduced regulation with the regulatory agencies in those states. Our CLEC operations are also subject to state certification, limited rate regulation and interconnection frameworks that govern how we interface with other carriers and access critical network elements.
Rights-of-way, franchises and local permitting
Our network deployment and operations depend on access to public rights-of-way, poles and conduits. Further, we are required to obtain local franchises/licenses, permits, and related approvals. Local authorities may attempt to revise, condition, or terminate existing rights or impose new fees, buildout or customer service obligations, which could materially increase costs or delay deployment. Judicial and FCC precedent concerning local rights-of-way fees remains unsettled, and future developments could increase our obligations or encourage additional competitive entry.
Pole attachments and access to utility infrastructure
Timely and cost-effective attachment to third-party poles and access to conduits remain critical inputs to our fibre deployment programs. However, we continue to face risks associated with extended make-ready intervals, fielding requirements, engineering disputes, and allocation of replacement costs, all of which can increase capital intensity and elongate build schedules. These risks can be more acute where municipalities, public utility districts, or electric cooperatives own poles that are not subject to uniform federal timelines or where local processes impose additional inspections, traffic management plans, or seasonal construction moratoria.
At the federal level, the FCC has adopted timelines and other procedural safeguards to accelerate access for large applications for certain applicants and has completed rulemakings aimed at streamlining attachments, including proposals relating to upfront make-ready
payments, true-up limits, contractor approval and onboarding, and standardized dispute-resolution tracks. Even with these measures, practical barriers – such as limited availability of qualified crews, sequential workflow requirements across multiple pole owners, and disagreements over cost responsibility for pole replacements or mid-span clearance work – can still materially delay projects and increase costs.
We also operate under a patchwork of state and local regimes that can diverge from federal pole-attachment rules, including jurisdictions with distinct “one-touch make-ready” procedures, separate safety or vegetation-management standards, or different approaches to allocating costs for pole replacements versus routine make-ready. In addition, large-scale public funding programs for broadband may strain pole-owner resources and permitting offices, potentially lengthening review cycles. We continue to use the FCC’s and state commissions’ complaint and mediation processes, where appropriate, while prioritizing negotiated joint-use and attachment agreements to support timely, efficient deployment.
Foreign ownership and national security commitments
Under FCC rules and associated executive branch policies associated with FCC authorizations held by Ziply Fiber, non-U.S. ownership of Ziply Fiber triggered certain special filing requirements, together with review of the transaction by the Committee for the Assessment of Foreign Participation in the United States Telecommunications Services Sector. To conclude that process, Ziply Fiber, BCE Holding Corporation, and BCE entered into a Letter of Agreement (LOA) with the Committee for the Assessment of Foreign Participation in the United States Telecommunications Services Sector, the U.S. Department of Justice and the U.S. Department of Homeland Security (commonly known as Team Telecom) under which they made certain commitments intended to ensure that the transaction would be consistent with U.S. national security, law enforcement, and similar interests. As is standard with such agreements involving foreign-owned U.S. carriers, the FCC made compliance with the LOA a condition of Ziply Fiber’s FCC authorizations. FCC rules also require Ziply Fiber to seek further approvals if any previously unapproved non-U.S. investor obtains, or seeks to obtain, direct or indirect interests in Ziply Fiber that exceed certain thresholds. If any new Ziply Fiber foreign ownership were to exceed such levels without further FCC authorization and/or if Ziply Fiber, BCE Holding Corporation, or BCE were to fail to meet their obligations under the LOA, the FCC could subject Ziply Fiber to a range of monetary and other penalties, which could (in extreme cases) include license revocation proceedings. Any such penalties could have a material adverse effect on Ziply Fiber’s business, financial condition and results of operations and consequently, adversely affect our financial performance.
Broadband classification and “net neutrality”
The regulatory status of broadband internet access service (BIAS) remains a source of uncertainty and risk for ISPs, with significant implications for network management flexibility, compliance burdens, and potential state-federal conflicts. While the FCC has, at times, treated BIAS as an unregulated information service with limited federal disclosure obligations, recent federal actions and court decisions have vacillated, and some states have adopted or considered state-level net neutrality or broadband affordability mandates, contributing to a patchwork of rules. In January 2025, the U.S. Court of Appeals for the Sixth Circuit invalidated an FCC order that reclassified broadband as a Title II telecommunications service and imposed associated “net neutrality” rules. The proliferation of state-level broadband regulations could increase compliance costs and operational complexity for ISPs operating across multiple jurisdictions.
| 90 | BCE INC. 2025 ANNUAL FINANCIAL REPORT |
9 MD&A Business risks
| 9 | Business risks |
A risk is the possibility that an event might happen in the future that could have a negative effect on our business, financial condition, liquidity, financial results or reputation. The actual effect of any event could be materially different from what we currently anticipate. The risks described in this MD&A are not the only ones that could affect us. Additional risks and uncertainties not currently known to us or that we currently deem to be immaterial may also materially and adversely affect our business, financial condition, liquidity, financial results or reputation.
This section describes the principal business risks that could have a material adverse effect on our business, financial condition, liquidity, financial results or reputation, and cause actual results or events to differ materially from our expectations expressed in, or implied by, our forward-looking statements. Certain of these principal business risks have already been discussed in other sections of this MD&A, and we refer the reader to those sections for a discussion of such risks. All of the risk discussions set out in the sections referred to in the table below, as well as the risk discussion relating to general economic conditions and geopolitical events set out in Section 3.3, Principal business risks, are incorporated by reference in this section 9.
| Risks discussed in other sections of this MD&A | Section references | |
| Competitive environment |
Section 3.3, Principal business risks | |
| Section 5, Business segment analysis (Competitive landscape and industry trends section for each segment) | ||
| Regulatory environment and compliance |
Section 3.3, Principal business risks | |
| Section 8, Regulatory environment | ||
|
Security management and data governance |
Section 3.3, Principal business risks | |
| Risks specifically relating to our Bell CTS Canada, Bell CTS U.S. and Bell Media segments |
Section 5, Business segment analysis (Principal business risks section for each segment) | |
The other principal business risks that could also have a material adverse effect on our business, financial condition, liquidity, financial results or reputation are discussed below.
Customer experience
Driving a positive customer experience in all aspects of our engagement with customers is important to avoid brand degradation and other adverse impacts on our business and financial performance
We aim to create best-in-class experiences across all channels to meet stakeholder expectations. This involves maintaining an omni-channel presence to provide necessary platforms for customers to research, interact, and purchase, while leveraging AI tools in all facets of our operations. As the bar continues to be raised by customers’ evolving expectations of service and value, failure to get ahead of such expectations and build a more robust and consistent service experience at a fair value proposition could hinder product and service differentiation and customer loyalty. The foundation of effective customer service is the ability to deliver high-quality, consistent, and simple solutions in an expeditious manner and on mutually agreeable terms. Although we seek to reduce complexity in our operations through our transformation initiatives, we operate with multiple technology platforms, ordering and billing systems, sales channels, marketing databases, and a myriad of rate plans, promotions, brands, and product offerings, in the context of a large customer base and a hybrid and remote workforce that continuously requires training, monitoring, and replacement. This may limit our ability to respond quickly to market changes and reduce costs, and may lead to customer confusion or billing, service, or other errors, which could adversely affect customer satisfaction, acquisition, and retention. Media attention to customer complaints could also erode our brand and reputation and adversely affect customer acquisition and retention. In addition, the current
global economic environment may bring about further workforce reduction initiatives or limit investments, which could negatively impact the rapidity of our response to customer demands and the overall customer experience.
With the proliferation of connectivity services, apps, and devices, customers are accustomed to doing things when, how, and where they want through websites, self-serve options, web chat, call centres, and social media forums. These customer demands have intensified over the years, with the resulting shift to online transactions and expectation of seamless digital self-service. We seek to provide the necessary platforms for customers to research, interact, purchase, and receive service, and to continuously improve our call centre experience and self-serve tools to improve customer service and drive household penetration. Customers’ journey is increasingly completed on mobile devices, requiring alignment of websites, customer support platforms, and marketing. Understanding the customer relationship as a whole in a multi-product environment and delivering a simple, seamless experience at a fair price is increasingly central to an evolving competitive dynamic. As part of our strategy to enhance service delivery and operational efficiency, we have increased our strategic partnerships with leading technology providers and have become increasingly reliant on cloud-based solutions and platforms. While these partnerships enable us to offer innovative services and improve scalability, they also create dependencies on third-party infrastructure and systems. Service outages or disruptions experienced by our technology partners, such as Google, Amazon, ServiceNow, or other cloud service providers, could adversely impact our ability to serve customers, process transactions,
| BCE INC. 2025 ANNUAL FINANCIAL REPORT | 91 |
9 MD&A Business risks
and maintain seamless operations, potentially leading to customer dissatisfaction, revenue loss, and reputational harm.
We constantly seek to innovate in the ways we engage with customers and deliver service and support in an omni-channel, streamlined, and simplified manner to reduce transaction friction and costs, enhance self-serve options, improve first call resolution, and reduce fraud attempts, such as spam and fraudulent calls or text messages, in order to build trust, improve our appeal, and reduce churn. This includes improvements to the range and capabilities of our call centres, our online self-serve and support options, and the deployment of innovative tools that use AI and machine learning technologies. While we have introduced new services and tools, we are unable to predict whether such services and tools will be sufficient to meet customer expectations. Failure to develop true omni-channel, streamlined and simplified capabilities and improve our customer experience by digitizing and developing a consistent, fast, and on-demand end-to-end experience before, during and after sales using new technologies such as AI and machine learning, in parallel with our network evolution, could also adversely affect our business, financial results, reputation, and brand value. Such development activities could further be challenged by the scarcity of skilled resources in a competitive labour market.
While AI, including the use of customer-facing chatbots, could provide for better, cost-effective, and convenient customer experiences, we must carefully assess the challenges associated with the use of such technology by us, such as the intentional or unintentional misuse of AI tools by our employees or third parties, model hallucinations, the provision by our AI systems of inaccurate information about our products or services to our customers, or the existence of an explicit or implicit bias in our AI models. Failure to do so could harm our brand and reputation, cause disruption to our business operations, and expose us to customer complaints, regulatory scrutiny, and litigation. Refer to the section entitled Transformation below for details regarding our AI-related risks.
Additionally, customers’ perception of our products, services, brand, and corporate image is also important. Embracing topics that matter to the stakeholder value proposition, such as sustainability practices and the reporting of such practices, adds an important layer to the customer perception of our company and thus to the overall customer experience. Failure to positively influence customer perceptions through effective communication, including through our use of social media and other communication media, or otherwise, could adversely affect our business, financial results, reputation, and brand value.
Transformation
The evolution and transformation of our networks, systems and operations using next-generation technologies, while lowering our cost structure, are essential to effective competition and customer experience
Globalization, increased competition, and ongoing technological advances are driving customer expectations for faster market responses, improved customer service, enhanced user experiences, and cost-effective delivery. Meeting these expectations requires the deployment of new service and product technologies, along with customer service tools that are network-neutral and based on a more collaborative and integrated development environment. The availability of improved networks and software technologies further provides the foundation for better and faster connections, which have, in turn, led to significant growth in IoT applications. Change can be difficult and may present unforeseen obstacles that might impact successful execution, and this transition is made more challenging by the complexity of our multi-product environment, combined with the complexity of our network and IT infrastructure.
We are pursuing an operational transformation, which entails improving the experience and value we deliver to customers, enabled by modernized infrastructure, simplified and automated business processes, and a right-sized cost model. Failure to successfully pursue this transformation and accurately assess the potential of new technologies, make critical updates to existing network capabilities, achieve cloud integration, fortify cybersecurity, and manage increasing interdependencies with third-party technology providers, or to invest and evolve in the appropriate direction in an environment of changing business models, could limit our ability to deliver value to our customers through easy and simple buy and support interactions, and through enabling them to get what they want much faster through any channel, as well as limit our customers’ ability to receive products, services, and content on any device or at any location regardless of network access type. As a result, this could have an adverse impact on our business and financial results.
Our network and IT evolution activities seek to leverage both new and emerging technologies, including network functions virtualization, AI and machine learning, process automation, software-defined networks, cloud technologies, multi-edge computing, open source software, “big data,” and IoT. These activities are designed to transform our networks and systems through consolidation, virtualization, and automation, enabling us to become more agile in our service delivery and operations, provide omni-channel capabilities for our customers, and drive lower costs. Our evolution efforts also focus on building next-generation converged wireline and wireless networks by leveraging smart-core technologies to deliver competitive quality and customer experience at an efficient cost structure amid rapidly growing capacity requirements. Alignment across technology platforms, product and service development, and operations is increasingly critical to ensure appropriate trade-offs and optimize capital allocation. Failure to adopt best-in-class technology practices in transforming our operations to enable a truly customer-centric service experience may hinder our ability to build customers’ trust in our innovation and technological capabilities, and to compete on footprint, service experience, and cost structure. It may also lead to missed opportunities and negatively impact business agility and growth. Planning and executing multiple complex projects within the desired delivery timelines can also be challenging. Any one or more of the above could have an adverse impact on our business, financial results, and reputation.
Customer retention and new customer acquisitions may be hindered during our transformation initiatives if such transformation causes poor service performance, which in turn may adversely affect our ability to achieve operational and financial objectives. Failure to quickly maximize adaptable infrastructures, processes, and technologies to efficiently respond to evolving customer patterns and behaviours, and to leverage IP and automation across many facets of our network, product, and service portfolio could inhibit a fully customer-centric approach. This could reduce our ability to provide comprehensive self-serve convenience, real-time provisioning, cost savings, and flexibility in delivery and consumption, leading to negative business and financial outcomes.
| 92 | BCE INC. 2025 ANNUAL FINANCIAL REPORT |
9 MD&A Business risks
We further seek to expand our network footprint to enhance our value proposition and meet customer needs while deploying technologies to support growth. However, adverse government, regulatory, or court decisions may impact the specific nature, magnitude, location, and timing of investment decisions. In particular, the requirement to provide aggregated access to our FTTP on a wholesale basis, lowering of rates by the CRTC of mandated wholesale services over FTTP and/or FTTN, the imposition of unfavourable terms or the adoption of unfavourable rates in arbitration processes associated with the facilities-based MVNO access service the CRTC has implemented, the potential for additional mandated access to our networks, or the imposition of broader wholesale obligations on wireless networks would undermine the incentives for facilities-based digital infrastructure providers to invest in next-generation wireline and wireless networks. Failure to continue investment in next-generation capabilities in a disciplined, timely, and strategic manner could limit our ability to compete effectively and to achieve desired business and financial results.
Other examples of risks that could affect the achievement of our desired transformation include the following:
| • | Failure to have our people, processes, and culture evolve to a cross-functional approach to eliminate business unit silos and promote a holistic “One Bell” mindset may impact our transformation initiatives |
| • | The current global economic environment, as well as geopolitical events, may bring about further incremental costs, delays, or unavailability of equipment, materials, and resources, which may impact our ability to continue building next-generation converged networks and drive other transformation initiatives |
| • | The costs of significant legacy networks, IT systems, and reliance on outsourced IT, as well as execution risk and lower or slower than expected savings achieved through targeted savings initiatives (e.g., vendor management, real estate optimization), could impact our ability to invest in our transformation |
| • | Failure to effectively engage with external partners and other industries, could hinder innovation and limit market opportunities |
| • | Challenges in hiring, retaining, insourcing, and developing technical and skilled resources could adversely impact transformation initiatives. Potential deterioration in employee morale and de-prioritization of transformation initiatives due to staff reductions, cost reductions, or reorganizations could adversely affect our transformation and financial results. |
| • | Suboptimal capital deployment in network build, infrastructure and process upgrades, and customer service improvements, could hinder our ability to compete effectively |
| • | A cloud-based strategy with multiple service providers requires a different architecture framework and execution for each service provider, which could slow the pace of our transformation |
| • | We, and other telecommunications carriers upon which we rely to provide services, may not be able to purchase high-quality, reputable network equipment and services from third-party suppliers on a timely basis and at a reasonable cost |
| • | Network construction and deployment on municipal or private property requires the issuance of municipal or property owner consents, respectively, for the installation of network equipment, which could increase the cost of, and cause delays in, fibre and wireless rollouts |
| • | The successful deployment of 5G mobile services could be impacted by various factors affecting coverage and costs |
| • | Higher demand for faster Internet speed and capacity, coupled with governmental policies and initiatives, creates tensions around FTTP deployment in terms of geographic preference and pace of rollout |
| • | The increasing dependence on applications for content delivery, sales, customer engagement, and service experience drives the need for new and scarce capabilities (sourced internally or externally) that may not be available, as well as the need for associated operating processes integrated into ongoing operations |
| • | New products, services, or applications could reduce demand for our existing, more profitable service offerings or cause prices for those services to decline, and could result in a shorter life cycle for existing or developing technologies, which could increase depreciation and amortization expenses |
| • | The decommissioning of legacy equipment could be challenged by customer and regulatory requirements to continue using older technologies, as well as inherent risks involved with transitioning to new systems |
| • | As content providers’ business models change, content consumption habits evolve, and viewing options increase, our ability to aggregate and distribute relevant content and our ability to develop alternative delivery vehicles to compete in new markets and increase customer engagement and revenue streams may be hindered by the significant software development and network investment required |
| • | Successfully managing the development and deployment of relevant product solutions on a timely basis to match the speed of adoption of IoT in the areas of retail, business, and government could be challenging |
| • | Customers continue to expect improvements in customer service, new functions and features, and reductions in the price charged to provide those services. Our ability to provide such improvements increasingly relies upon using a number of rapidly evolving technologies, including AI and machine learning. However, the use of such technologies is being increasingly scrutinized by legislators and regulators. If we cannot build market-leading competencies in the use of these emerging technologies in a way that respects societal values, we may not be able to continue to meet changing customer expectations and to continue to grow our business. |
We are using AI technologies in our business solutions and operations, which may present business, reputational, and compliance risks
We are focused on ensuring the responsible development and use of AI technologies, both within BCE and through our partnerships. In 2023, BCE adopted a Responsible AI Policy to proactively address AI-related risks. Our approach to the development and use of AI aligns with our ethics, privacy, and security requirements, as well as our broader sustainability objectives to foster customer, employee, and other stakeholder confidence in this technology.
We have implemented AI programs across various areas of our business, including customer experience, network quality, operational efficiency, agent training, and employee assistants. We also offer AI-powered solutions to our enterprise customers, including AI data centres. However, the expanded use of AI – particularly generative AI – also increases our exposure to business, reputational, and compliance risks.
| BCE INC. 2025 ANNUAL FINANCIAL REPORT | 93 |
9 MD&A Business risks
Accordingly, it is essential that we carefully assess and manage the challenges associated with our use of AI technologies, as well as by our customers, business partners and third-party vendors. These challenges include preventing the intentional or unintentional misuse of AI tools by employees, customers or third parties; ensuring that our AI systems do not provide inaccurate or misleading information to customers, employees and other users; avoiding explicit or implicit bias or discrimination in AI models; obtaining proper consent for the collection and use of personal data to train and operate AI systems; and preventing the generation of content that may infringe on third-party intellectual property rights. Failure to adequately address AI-related risks could result in the unauthorized disclosure of confidential information and personal data; theft, fraud, or cyberattacks; disruptions to our business operations; financial losses; harm to our brand and reputation; decreased customer and investor confidence; exposure to customer complaints, regulatory or legal action; and a loss of competitive advantage.
The increased use of AI by our third-party vendors may further elevate our exposure to these risks, as our risk profile would expand beyond our immediate control.
As the legal and regulatory framework for AI evolves, new requirements may increase our exposure to litigation and regulatory actions, increase compliance costs, limit our ability to integrate certain AI capabilities into our products and services, and have an adverse effect on customer demand and our financial performance.
We risk reputational damage if our AI initiatives do not achieve their intended objectives, are not seamlessly incorporated, or are perceived as unsuccessful. We also risk experiencing a decline in our competitive positioning if our competitors leverage AI more effectively to improve their internal processes or develop new or enhanced products or services that we cannot match. Should they succeed more than us in adopting and implementing AI, our ability to compete effectively may be affected, which could have an adverse effect on our business and financial results. Further, developing and implementing AI technologies in our business may require significant additional costs and resources and, if the expected benefits of the adoption of AI are not achieved, these costs may have a negative impact on our financial performance.
Failure to obtain or maintain a social license to operate AI data centres exposes us to operational, financial, and reputational risks, including delays, increased costs, financial losses, reduced confidence among customers, investors and the public, regulatory or legal action, difficulties attracting and retaining talent, loss of competitive advantage, and could ultimately lead to suspension or cancellation of planned AI data centres initiatives.
Furthermore, deploying AI solutions in our products or services in ways that are perceived as divisive – due to potential impacts on employment, data privacy, or human rights – could result in competitive disadvantages, reduced customer adoption, financial losses, harm to our brand and reputation, and legal or regulatory consequences.
Operational performance
Our networks and IT systems are the foundation of high-quality consistent services, which are critical to meeting service expectations
Our ability to develop and execute strategies against plans, and provide high-quality, consistent, reliable, and resilient wireless, wireline, media and AI services to customers in a complex and changing operating environment, is crucial for sustained success. It is therefore essential that we continuously refine our operating model in order to meet customer expectations for product and service experience at an efficient cost structure, while leveraging acquired businesses and skill sets, and proactively managing strategic partnerships.
Network capacity demands for content offerings and other bandwidth-intensive applications on our wireline and wireless networks have been growing at unprecedented rates. Unexpected capacity pressures on our networks may negatively affect our network performance and our ability to provide services. Evolving customer behaviour and their use of our networks, products, and services have created increased capacity pressure on certain areas of our wireless, wireline, and media networks, and there can be no certainty that our networks will continue to sustain such increased usage. In addition, we may need to incur significant capital expenditures in order to provide additional capacity and reduce network congestion. The trend for families to move from urban centres to less urbanized areas increases the need to develop and/or enhance our networks in areas that were not previously served or that were underserved.
Customers and other stakeholders expect that we deliver reliable service performance, enabled by our networks and other infrastructure, as well as the networks and other infrastructure of third-party providers on which we rely. Issues relating to network availability, speed, consistency, and traffic management, whether on our current or legacy networks, could adversely affect our customers, including by preventing the provision of critical services. Such issues could also have an adverse impact on our business, reputation, and financial performance. Heightened scrutiny by regulatory authorities with respect to network availability could lead to increased identification of non-compliance and potential fines. Furthermore, we may need to manage the possibility of instability in the context of our transformation initiatives, including as we transition towards converged wireline and wireless networks and newer technologies, such as software-defined networks leveraging open source software and cloud services, and increased reliance on third-party hyperscale cloud providers. Network failures and slowdowns, whether caused by internal or external forces, human error or threat, or external events, could adversely affect our brand and reputation, subscriber acquisition and retention, as well as our financial results. While we invest in the resiliency of our networks and other infrastructure, and establish response strategies and business continuity protocols to seek to maintain service consistency, there is no assurance that such investments and protocols will be sufficient to prevent network failure, or the failure of other infrastructure, or a disruption in the delivery of our services.
| 94 | BCE INC. 2025 ANNUAL FINANCIAL REPORT |
9 MD&A Business risks
In addition, we currently use a large number of interconnected internal and third-party operational and business support systems for provisioning, networking, distribution, broadcast management, ordering, billing, and accounting, which may hinder our operational efficiency. If we fail to implement, maintain, or manage highly effective IT systems supported by an effective governance and operating framework, and implement transformation initiatives to streamline and integrate our processes and systems, this may lead to inconsistent performance and dissatisfied customers, which over time could result in higher churn. It may also limit our cross-sell capabilities across our portfolio of products and services.
Further examples of risks to operational performance that could impact our reputation, business operations and financial performance include the following:
| • | The current global economic environment, as well as geopolitical events, may bring about further incremental costs, delays, or unavailability of equipment, materials, and resources, which may impact our ability to maintain or upgrade our networks in order to accommodate increased network usage and to provide the desired levels of customer service |
| • | Failure to maintain required service delivery amid operational challenges (including those related to targeted cost savings initiatives and the availability of employees with the required skill set), and a transformation of our infrastructure and technology, could adversely affect our brand, reputation, and financial results |
| • | We may lose sales should we fail to maximize channel efficiencies, including the increasingly important digital and self-serve channels, which could adversely affect our financial results |
| • | Corporate restructurings, system replacements and upgrades, process redesigns, staff reductions, and the integration of business acquisitions, may not deliver the benefits contemplated, or be completed when expected, and could adversely impact our ongoing operations |
| • | Failure to streamline our significant IT legacy system portfolio and proactively improve operating performance could adversely affect our business and financial results |
| • | We may experience more service interruptions or outages due to legacy infrastructure. In some cases, vendor support is no longer available or legacy vendor operations have ceased. Copper theft and vandalism to our telecommunications infrastructure may also cause service disruptions and jeopardize community safety. |
| • | An increase in lost-time accident rate by our employees could adversely impact our ongoing operations |
| • | There may be a lack of replacement parts and competent, cost-effective resources to perform the life cycle management and upgrades necessary to maintain the operational status of legacy networks and IT systems |
| • | Climate change increases the probability, frequency, intensity, and duration of severe weather-related events such as ice, snow, and windstorms; wildfires; flooding extended heat waves; hurricanes; tornadoes; and tsunamis, all of which could impact network availability and performance and drive more repairs of network equipment |
Our operations and business continuity depend on how well we protect, test, maintain, replace and upgrade our networks, IT systems, equipment and other facilities
Our operations, service performance, reputation, business continuity, and strategy depend on how well we and our contracted product and service providers, as well as other telecommunications carriers on which we rely to provide services, protect our or their networks and IT systems, as well as other infrastructure and facilities, from events such as information security attacks, unauthorized access or entry, fire, natural disasters, power loss, building cooling loss, acts of war or terrorism, sabotage, vandalism, actions of neighbours, and other events. Climate change could heighten the occurrence of certain of the above-mentioned risks. We must also manage business continuity issues caused by internal sources, including human error, human-caused threats, and inefficiencies. Establishing response strategies and business continuity protocols to maintain service consistency if any disruptive event materializes is critical to the achievement of effective customer service. Any of the above-mentioned events, as well as the failure by us, or by other telecommunications carriers on which we rely to provide services, to adequately complete planned and sufficient testing, maintenance, replacement, or upgrade of our or their networks, equipment and other facilities, which is, among other factors, dependent on our or their ability to purchase equipment and services from third-party suppliers, could disrupt our operations (including through disruptions such as network and other infrastructure failures, billing errors, or delays in customer service), require significant resources and result in significant remediation costs, which in turn could have an adverse effect on our business and financial performance, or impair our ability to keep existing subscribers or attract new ones.
In addition, the current global economic environment as well as geopolitical events may bring about further incremental costs, delays or unavailability of equipment, materials and resources, which could impact our operations and business continuity strategies.
Satellites used to provide our satellite TV services are subject to significant operational risks that could have an adverse effect on our business and financial performance
Pursuant to a set of commercial arrangements between ExpressVu and Telesat Canada (Telesat), we currently have satellites under contract with Telesat. Telesat operates or directs the operation of these satellites, which utilize highly complex technology and operate in the harsh environment of space, and are therefore subject to significant operational risks while in orbit. These risks include in-orbit equipment failures, malfunctions, and other problems, commonly referred to as anomalies, that could reduce the commercial usefulness of a satellite used to provide our satellite TV services. Acts of war or terrorism, magnetic, electrostatic, or solar storms, or space debris or meteoroids could also damage such satellites. Any loss, failure, manufacturing defect, damage, or destruction of these satellites, our terrestrial broadcasting infrastructure, or Telesat’s tracking, telemetry and control facilities to operate the satellites could have an adverse effect on our business and financial performance and could result in customers terminating their subscriptions to our satellite TV service.
| BCE INC. 2025 ANNUAL FINANCIAL REPORT | 95 |
9 MD&A Business risks
Ziply Fiber’s fibre expansion plan, and the benefits expected to result from the formation of Network FiberCo, are subject to risks and uncertainties
Under Ziply Fiber’s fibre expansion plan, we intend to grow Ziply Fiber’s fibre network to increase Ziply Fiber’s revenues and number of customers, and in turn, increase its profitability and cash flows. These programs and initiatives require significant investment and resources, and may divert attention from ongoing operations and other strategic initiatives. There can be no assurance that Ziply Fiber’s current and future initiatives and programs will be successful, or that the actual returns from these programs and initiatives will not be lower than anticipated or take longer to realize than we anticipate. For example, we may not reach our targets to expand and penetrate Ziply Fiber’s existing fibre network on the timelines we anticipate, or at all. If Ziply Fiber’s current and future programs and initiatives are unsuccessful, result in lower returns than we anticipate, or take longer than we anticipate, it could have a material adverse effect on Ziply Fiber’s results of operations and, consequently, adversely affect the financial performance of our Bell CTS U.S. segment.
Additionally, there can be no assurance that the benefits expected to result from the formation of Network FiberCo, a long-term strategic partnership between BCE and PSP Investments to accelerate the development of fibre infrastructure through Ziply Fiber, will be realized. Further, Network FiberCo is subject to many of the same risks as Ziply Fiber, including those with respect to regulatory matters, pole attachment agreements and licenses. Refer to section 8.2, U.S. regulatory environment, of this MD&A for more details.
The integration of Ziply Fiber as a subsidiary of BCE may not be as successful as anticipated and disruptions from the transaction could harm our business
The acquisition of Ziply Fiber (the Acquisition) involves strategic, financial, accounting, legal, tax, and other functions that must be integrated. Difficulties in integrating Ziply Fiber as a subsidiary of BCE may result in the combined company performing differently than expected. Our other businesses could also be negatively impacted by this acquisition. More specifically, potential difficulties that may be encountered in the integration process include, among other factors:
| • | The inability to successfully integrate Ziply Fiber as a BCE subsidiary in a manner that permits us to achieve the anticipated benefits from the Acquisition |
| • | Performance shortfalls at Ziply Fiber or BCE resulting from the diversion of management’s attention caused by the Acquisition |
| • | Funding the operations and planned capital expenditures of Ziply Fiber |
| • | The disruption of, or loss of momentum in, our business or inconsistencies in standards, controls, procedures, and policies |
| • | Integrating relationships with customers, vendors and business partners |
Financial management
If we are unable to raise the capital we need or generate sufficient cash flows from operating activities, we may need to limit our capital expenditures or our investments in new businesses, or try to raise capital by disposing of assets
Our ability to meet our cash requirements, fund capital expenditures and provide for planned growth depends on having access to adequate sources of capital and on our ability to generate cash flows from operating activities, which is subject to various risks, including those described in this MD&A.
Our ability to raise financing depends on our ability to access the public equity and debt capital markets, the money market, as well as the bank credit market. Our ability to access such markets and the cost and amount of funding available depend largely on prevailing market conditions and the outlook for our business and credit ratings at the time capital is raised.
Risk factors such as capital market disruptions; political, economic, and financial market instability in Canada, the U.S., or abroad; tariffs; government policies; central bank monetary policies; increasing interest rates; inflation; changes to bank capitalization or other regulations; reduced bank lending in general; or fewer banks as a result of reduced activity or consolidation could reduce capital available or increase the cost of such capital. In addition, an increased level of debt borrowings could result in lower credit ratings, increased borrowing costs, and a reduction in the amount of funding available to us, including through equity offerings. Business acquisitions could also adversely affect our outlook and credit ratings and have similar adverse consequences. There is no assurance that we will maintain our credit ratings, and a ratings downgrade could result in adverse consequences for our funding
cost and capacity, and our ability to access the capital markets, money market, and/or the bank credit market. In addition, participants in the public capital and bank credit markets have internal policies limiting their ability to invest in, or extend credit to, any single entity or entity group or a particular industry. Finally, with increasing emphasis by the capital markets on sustainability performance and reporting, there is a potential for the cost and availability of funding to be increasingly tied to the quality of our sustainability practices and related disclosed metrics.
Our bank credit facilities, including credit facilities supporting our commercial paper program, are provided by various financial institutions. While it is our intention to renew certain of such credit facilities from time to time, there is no assurance that these facilities will be renewed on favourable terms or in similar amounts.
Global financial markets have experienced, and could again experience, significant volatility and weakness as a result of market disruptions, including those relating to the economy, the imposition of tariffs, and geopolitical events. The current global economic environment could continue to negatively impact equity and debt capital markets, cause interest rate and currency volatility and movements, and adversely affect our ability to raise financing in the public capital, bank credit, and/or commercial paper markets, as well as the cost thereof. Additionally, the negative impact of the global economic environment and a potential recession, as well as elevated levels of inflation and interest rates affecting our customers’ financial condition, could adversely affect our ability to recover payments on receivables and lead to further increases in bad debts. This, in turn, could negatively impact our revenues and cash flows, as well as our position under our securitized receivables program.
| 96 | BCE INC. 2025 ANNUAL FINANCIAL REPORT |
9 MD&A Business risks
Differences between BCE’s actual or anticipated financial results and the published expectations of financial analysts, as well as events affecting our business or operating environment, may contribute to volatility in the market price of BCE’s securities. A major decline in the financial markets in general, or a decrease in the market price or fluctuations in trading volumes of BCE’s securities, may negatively affect our ability to raise debt or equity capital, retain senior executives and other key employees, make strategic acquisitions, or enter into joint arrangements.
If we cannot access the capital we need or generate cash flows to implement our business plan, or meet our financial obligations on acceptable terms, we may have to limit our ongoing capital expenditures and our investment in new businesses, or attempt to raise additional capital by selling or otherwise disposing of assets. Any of these actions could have an adverse effect on our cash flows from operating activities and on our growth prospects.
We cannot guarantee that our dividend payout policy will be maintained or achieved, or that dividends will be maintained or declared
Maintaining or achieving BCE’s dividend payout policy, maintaining the BCE common share dividend, as well as the declaration of dividends on any of BCE’s outstanding shares, are subject to the discretion of the BCE Board and, consequently, there can be no guarantee that BCE’s dividend payout policy will be maintained or achieved, that the dividend on common shares will be maintained or that dividends will be declared on any of BCE’s outstanding shares. Maintaining or achieving BCE’s dividend payout policy, maintaining dividends and the declaration of dividends by the BCE Board are ultimately dependent on BCE’s corporate strategy, operations and financial results which are, in turn, subject to various assumptions and risks, including those set out in this MD&A.
The failure to reduce costs, unexpected increases in costs and the failure to optimize capital spending, could adversely affect our ability to execute our business strategy and meet our financial guidance
Our objective to lower our cost structure and meet our deleveraging targets continues to be aggressive, with a company-wide focus on cost transformation and reduction, but there is no assurance that we will be successful in reducing costs or leverage. Examples of risks to our ability to reduce costs, meet our deleveraging targets or limit potential cost increases include the following:
| • | Inflation could continue to result in higher input costs for equipment, products, and services, and create increased pressure for wage increases |
| • | Increased costs related to tariffs and geopolitical events, in particular as they impact our supply chain, could persist for an undetermined period of time |
| • | Increasing or high interest rates could negatively impact our cost of financing |
| • | Our cost reduction objectives require aggressive negotiations with our suppliers, and there can be no assurance that such negotiations will be successful or that replacement products or services provided will not lead to operational issues |
| • | As suppliers continue to shorten software life cycles, the cost of seeking to maintain adequate information security solutions increases |
| • | Achieving timely cost reductions while moving to an IP-based network is dependent on disciplined network decommissioning, which can be delayed by customer contractual commitments, regulatory considerations, and other unforeseen obstacles |
| • | Failure to contain growing operational costs related to network sites, network performance and resiliency, footprint expansion, spectrum licences, insurance, and content and equipment acquisition could have a negative effect on our financial performance |
| • | In addition to the potential impact from the global economic environment and geopolitical events, fluctuations in energy prices are further partly influenced by government policies to address climate change, such as carbon pricing which, combined with growing data demand, including from AI data centres that increases our energy requirements, could increase our energy costs beyond our current expectations |
| • | Failure to successfully deliver on our contractual commitments, whether due to security events, operational challenges, or other reasons, may cause us to incur financial penalties and loss of revenues |
In addition, as part of our business operations and operational transformation, it is essential that we optimize capital spending and ensure appropriate trade-offs in our capital allocation. However, should we fail to adequately assess investment priorities and optimal trade-offs, our business and financial results could be negatively affected.
We are exposed to various credit, liquidity and market risks
Our exposure to credit, liquidity, and market risks, including equity price, interest rate, and currency fluctuations, is discussed in section 6.5, Financial risk management of this MD&A and in Note 30 to BCE’s 2025 consolidated financial statements.
Our sales have historically been denominated in Canadian dollars. However, as a result of the Ziply Fiber Acquisition, a portion of our revenues, assets, liabilities, and cost structure is now exposed to U.S. dollars. Consequently, an increase in the value of the Canadian dollar relative to the U.S. dollar may adversely affect our revenue and business. Selling products, providing services, or purchasing inventory or equipment in U.S. dollars could result in our exposure to foreign currency risk becoming more significant. In addition, Ziply Fiber’s employees are located in the U.S.; therefore, a portion of our payroll, as well as certain other operating expenses, are paid in U.S. dollars. Our operating results are denominated in Canadian dollars, and the difference in exchange rates from one period to another may directly impact period-to-period comparisons of our operating results. Furthermore, exchange rate fluctuations may make it difficult for us to predict our operating results. We may implement hedging strategies from time to time to mitigate risks related to the impact of fluctuations in exchange rates. However, not every exposure can be hedged, and where hedges are put in place based on expected foreign exchange exposure, they are based on forecasts that may vary or which may later prove to have been inaccurate. Failure to hedge successfully or to anticipate currency risks accurately could adversely affect our operating results.
Our failure to identify and manage our exposure to changes in interest rates, foreign exchange rates, BCE’s share price, and other market conditions could lead to missed opportunities, increased costs, reduced profit margins, cash flow shortages, an inability to complete planned capital expenditures, delays in our deleveraging initiatives, reputational damage, devaluation of equity and debt securities, and challenges in raising capital on market-competitive terms.
| BCE INC. 2025 ANNUAL FINANCIAL REPORT | 97 |
9 MD&A Business risks
The failure to evolve practices to effectively monitor and control fraudulent activities could result in financial loss and brand degradation
As a public company with a range of desirable and valuable products and services and a large number of employees, BCE requires a disciplined program covering governance, exposure identification and assessment, prevention, detection, and reporting that considers corruption, misappropriation of assets, and intentional manipulation of financial statements by employees and/or external parties. The current global economic environment and advances in AI technologies could lead to increased fraudulent activity, resulting in financial losses and brand degradation.
Specific examples relevant to us include:
| • | Copyright theft and other forms of unauthorized use that undermine the exclusivity of Bell Media’s content offerings, which could divert users to unlicensed or otherwise illegitimate platforms, thus impacting our ability to derive distribution and advertising revenues |
| • | Unauthorized individuals taking over an account owner’s online account without their permission in order to gain access to wireless products and goods via various means |
| • | Subscription fraud where fraudsters use their own, a stolen, or a synthetic identity to obtain mobile devices and services with no intention to pay |
| • | Network usage fraud, such as call/sell operations using our wireline or wireless networks, or incidents related to network components such as copper theft |
| • | Ongoing efforts to steal the services of TV distributors, including Bell Canada and ExpressVu, through compromise or circumvention of signal security systems, causing revenue loss |
| • | Organized criminal activities targeting and seizing high value inventory |
Income and commodity tax amounts may materially differ from the expected amounts
Our complex business operations are subject to various tax laws in Canada, the U.S., and other relevant jurisdictions, as well as to related tax treaties, regulations, rules, and administrative guidance. The adoption of new tax laws, treaties, regulations, or rules thereunder, or changes thereto, or changes in their interpretation or enforcement by tax authorities, could adversely affect our tax position, including by resulting in higher tax rates, new taxes, or other adverse tax implications. In addition, while we believe that we have adequately provided for all income and commodity taxes based on all of the information that is currently available, the calculation of income taxes and the applicability of commodity taxes in many cases require significant judgment in interpreting tax rules and regulations. Our tax filings are subject to government audits that could result in material changes to the amount of current and deferred income tax assets and liabilities and other liabilities, and could, in certain circumstances, result in an assessment of interest and penalties.
A number of factors could impact our financial statements and estimates
We base our estimates on a number of factors, including but not limited to historical experience, current events, and actions that the company may undertake in the future, as well as other assumptions that we believe are reasonable under the circumstances. A change in these assumptions may have an impact on our financial statements including but not limited to impairment testing, fair value determination, expected credit losses and discount rates used for the present value of cash flows. By their nature, these estimates and judgments are subject to measurement uncertainty and actual results could differ.
The economic environment, pension rules or ineffective governance could have an adverse effect on our pension obligations, and we may be required to increase contributions to our post-employment benefit plans
With a large pension plan membership and DB pension plans that are subject to the pressures of the global economic environment and changing regulatory and reporting requirements, our pension obligations are exposed to potential volatility. Failure to recognize and manage economic exposure and pension rule changes, or to ensure that effective governance is in place for the management and funding of pension plan assets and obligations, could have an adverse impact on our liquidity and financial performance.
The funding requirements of our post-employment benefit plans, based on valuations of plan assets and obligations, depend on a number of factors, including actual returns on post-employment benefit plan assets, long-term interest rates, inflation, plan demographics (including longevity), and applicable regulations and actuarial standards. Changes in these factors, including changes caused by the current global economic environment and recent geopolitical events, could cause future contributions to significantly differ from our current estimates, require us to increase contributions to our post-employment benefit plans in the future, and, therefore, have a negative effect on our liquidity and financial performance.
There is no assurance that the assets of our post-employment benefit plans will earn their assumed rate of return. A substantial portion of our post-employment benefit plans’ assets is invested in public and private equity and debt securities. As a result, the ability of our post-employment benefit plans’ assets to earn the rate of return that we have assumed depends significantly on the performance of capital markets. Market conditions also impact the discount rate used to calculate our pension plan solvency obligations and could therefore also significantly affect our cash funding requirements.
The expected timing and completion of the proposed disposition of Northwestel are subject to closing conditions and other risks and uncertainties
The expected timing and completion of the proposed disposition of Northwestel are subject to closing conditions, termination rights, and other risks and uncertainties, including, without limitation, the purchaser securing financing, which may affect its completion, terms or timing. Accordingly, there can be no assurance that the proposed disposition will occur, or that it will occur on the terms and conditions, or at the time, currently contemplated. The proposed disposition could be modified, restructured, or terminated. There can also be no assurance that the potential benefits expected to result from the proposed disposition will be realized.
| 98 | BCE INC. 2025 ANNUAL FINANCIAL REPORT |
9 MD&A Business risks
People
Attracting, developing and retaining a talented team capable of furthering our business strategy and operational transformation is essential to our success
Our business depends on the efforts, engagement, and expertise of our management and non-management employees and contractors, who must be able to operate efficiently and safely based on their responsibilities and working environment. Demand for highly skilled team members remains a concern, as the pace of technological advancement, retiring workers, varying levels of immigration, and an increase in remote-work arrangements, allowing for more global competition, have created an even more competitive marketplace. This underscores the importance of developing and maintaining a comprehensive and inclusive human resources strategy and employee value proposition to effectively compete for talent and to identify and secure high-performing candidates for a broad range of job functions, roles, and responsibilities. In addition, an appropriately skilled talent pool, achieved through hiring, insourcing, upskilling, and reskilling, is essential to support evolving business priorities in the context of an ongoing business transformation that is impacting job nature and required skill sets. Our objective to transform our business requires a cultural shift and the capacity to evolve, which impacts our recruitment strategy and resource deployment. We seek to have our employees adapt to new ways of working, as traditional telecommunications companies are moving toward flatter work structures, leveraging generative AI, with fewer silos and more cross-functional corporate structures. These shifts may require rapid reskilling and redeployment of employees and may increase workforce disruption risk. Failure to attract, appropriately train, motivate, remunerate, or deploy employees on initiatives that further our business strategy and operational transformation, or to efficiently replace departing employees, could adversely impact our ability to attract and retain talent and drive performance across the organization. A shortage of skilled labour could negatively affect our ability to implement our strategic priorities, as well as sell our products and services and, more generally, serve our customers.
Establishing a culture that drives inclusivity, employee engagement, development, and progression is essential to attracting and retaining talent. In addition, employees are typically more engaged at work when their values align with their employer’s corporate values. We have strengthened our employee training offerings to support our transformation, and we continually seek to establish and enhance programs and provide resources to support team members on a wide range of topics, including mental health services and support.
However, failure to establish robust programs and further enhance them to achieve these aspirations could adversely affect our ability to attract and retain team members. Failure to sufficiently address evolving employee expectations related to our culture and value proposition could also adversely affect our ability to attract and retain team members.
Other examples of people-related risks include the following:
| • | The increasing technical and operational complexity of our businesses, combined with high market demand for skilled resources in strategic areas, creates a challenging environment for hiring, developing, and retaining such talent |
| • | Failure to establish a complete and effective succession plan, including preparation of internal talent and identification of potential external candidates, where relevant, for senior executive and other key roles, could impair our business until qualified replacements are found |
| • | Ensuring the health and safety of our workforce operating in different environments, including manholes, telephone poles, cell towers, vehicles, foreign news bureaus, war zones, and during pandemics or severe weather events, requires focus, effective processes, and flexibility to avoid injury, illness, service interruption, fines, and reputational impact |
| • | Potential deterioration in employee morale and engagement resulting from staff reductions, cost reductions, or reorganizations could adversely affect our business and financial results |
Challenges related to collective agreements could adversely affect our business
Approximately 39% of BCE employees were represented by unions and were covered by collective agreements as of December 31, 2025. The positive engagement of our union-represented team members is contingent on negotiating collective agreements that deliver competitive labour conditions and uninterrupted service, both of which are critical to achieving our business objectives.
We cannot predict the outcome of collective agreement negotiations. The renewal of collective agreements could result in higher labour costs and may be challenging in the context of a declining workload due to transformation, a maturing footprint, improved efficiencies, and adverse government or regulatory decisions. If, during the bargaining process, there are project delays or work disruptions, including work stoppages or slowdowns, this could adversely affect service to our customers and, in turn, our customer relationships and financial performance.
Brand reputation
Our ability to maintain positive customer relationships is significantly influenced by our reputation
Understanding public perception is crucial for making investments in key areas such as customer experience, brand appeal, media coverage, social media, and marketing. Many customers’ decisions to purchase our products and services are directly related to their perception of our company. Accordingly, our ability to maintain positive customer relationships and to acquire or retain customers is significantly
influenced by our reputation. Our company faces many sources of reputational risk, as discussed in this MD&A. Should our perceived or actual outlook, plans, priorities, or actions, or those of our employees or suppliers, fail to align with stakeholders’ expectations, our reputation could be impacted. This, in turn, could have an adverse effect on our brand, our ability to retain or attract customers, and, more generally, on our business, financial condition, liquidity, and financial results.
| BCE INC. 2025 ANNUAL FINANCIAL REPORT | 99 |
9 MD&A Business risks
There is no assurance that we will succeed in meaningfully integrating sustainability considerations into our business strategy, operations, and governance to generate a positive outcome for stakeholders
While we seek to understand the evolving sustainability landscape and identify topics and activities that may expose us to sustainability risks, there is no assurance that we will succeed in meaningfully integrating sustainability considerations into our business strategy, operations, and governance to generate positive outcomes for stakeholders. Good sustainability practices are an important measure of corporate performance and value creation. As such, we are increasingly under scrutiny to address sustainability matters of importance to our stakeholders. A wide range of sustainability topics have progressively become important elements of corporate culture, and seeking to embrace them reinforces our value proposition to drive employee attraction and retention. Customers now factor broader considerations into purchase decisions and look for alignment between personal values and corporate behaviour. Investors increasingly link investment decisions to the quality of sustainability practices and related disclosed metrics. Moreover, we have directly linked some pricing elements in certain financing agreements to our performance on key sustainability targets. Legal and regulatory pressures have further intensified in the sustainability landscape, including, without limitation, in the areas of privacy, data governance, responsible AI, and climate change. Accordingly, failure to integrate sustainability considerations into our governance activities and effectively manage sustainability risks and opportunities could harm our brand and reputation, and lead to negative business, financial, legal, and regulatory consequences for the company. Perceived misalignment of our actions with stakeholder expectations could also harm our brand and reputation and lead to further financial and other consequences. Finally, enhanced sustainability-related disclosures could increase the company’s exposure to claims for misrepresentation in the primary or secondary market.
Various factors could negatively impact our ability to achieve our sustainability targets
We have set a number of sustainability targets to monitor our sustainability performance and align with our business strategy. However, our ability to achieve these targets depends on many factors and is subject to many risks that could cause our assumptions or estimates to be inaccurate and cause actual results or events to differ materially from those expressed in, or implied by, these targets. Failure to sufficiently address evolving expectations of employees, customers, investors, and other stakeholders through the achievement of our sustainability targets could harm our brand, reputation, and competitiveness, as well as lead to other negative business, financial, legal, and regulatory consequences for the company.
Important risk factors that could affect certain of our key sustainability targets are set out below.
GHG emissions reduction and supplier engagement targets
The achievement of our science-based target related to our scope 1 and 2 GHG emissions will require that we purchase a significant quantity of RECs. To achieve this science-based target, only RECs will be considered given that the SBTi standards do not enable carbon credits to be used for this target. Should a sufficient quantity of acceptable (according to the SBTi guidelines) RECs be unavailable, should their cost of acquisition be considered too onerous, should sufficient funds be unavailable, or should laws, regulations, applicable standards, public perception or other factors limit the number of RECs that we can purchase, in whole or in part, the achievement of our science-based target related to our scope 1 and 2 GHG emissions could be negatively impacted.
Our scope 2 and 3 GHG emissions reduction targets depend on the emissions intensity originating from the electricity grid in the jurisdictions where we operate and over which we have no control. Should a significant increase in such emissions intensity be recorded in one or more jurisdictions where we conduct our operations, the achievement of our science-based targets related to our scope 2 and 3 GHG emissions could be negatively impacted.
Further, our current and proposed development of AI data centres may significantly increase our scope 1, scope 2 and scope 3 GHG emissions. While we do not yet have sufficient data to quantify the impact of our AI data centres on our GHG emissions, AI data centres are known to be energy intensive due to the nature of their operations. The jurisdiction in which future AI data centres are developed could also have an impact on our GHG emissions if, for instance, AI data centres are developed in jurisdictions with electricity grids with high emissions intensity. If the impact of our AI data centres on our GHG emissions is significant, it could adversely affect our ability to achieve our GHG emissions reduction targets.
A portion of our GHG emissions reduction targets also depends on our ability to implement sufficient corporate and business initiatives in order to reduce GHG emissions to the desired levels. Failure to implement such initiatives according to planned schedules due to changes in business plans, our inability to implement requisite operational or technological changes, unavailability of capital, technologies, equipment or employees, cost allocations, actual costs exceeding anticipated costs, or other factors, or the failure of such initiatives, including of new technologies, to generate anticipated GHG emissions reductions, could negatively affect our ability to achieve our GHG emissions reduction targets. In addition, future corporate initiatives, such as business acquisitions and business dispositions, including the previously announced pending disposition of Northwestel, as well as our acquisition of Ziply Fiber, the development of AI data centres, and organic growth, could negatively affect our ability to achieve our targets, as would the adoption of new technologies that are carbon enablers or do not generate the anticipated energy savings.
A refinement in, or modifications to, international standards or to the methodology we use for the calculation of GHG emissions that would result in an increase in our GHG emissions could further impact our ability to achieve our targets. In addition, as it relates to our science-based targets specifically, the SBTi requires the recalculation of our targets upon the occurrence of certain events, such as business acquisitions or divestitures, or to conform to evolving SBTi methodology or standards. A recalculation resulting in the introduction of more ambitious targets could challenge our ability to achieve such updated targets.
The achievement of our science-based target relating to the level of our suppliers by spend covering purchased goods and services that have adopted science-based targets could be negatively impacted should we fail to achieve the required level of engagement and collaboration from our suppliers over which we have no control, despite the engagement measures that we may implement, or should we significantly change the allocation of our spend by supplier.
In addition, we have much less influence over the reduction of our scope 3 GHG emissions than over our scope 1 and scope 2 GHG emissions given that we must rely on the engagement and collaboration of our suppliers and other participants in our value chain in reducing their own GHG emissions. Accordingly, failure to obtain our suppliers’ and other participants’ engagement and collaboration could adversely affect our ability to meet our scope 3 GHG emissions reduction target.
| 100 | BCE INC. 2025 ANNUAL FINANCIAL REPORT |
9 MD&A Business risks
Failure to take appropriate actions to adapt to current and emerging environmental impacts, including climate change, could have an adverse effect on our business
We face risks related to environmental events, including climate-related events, which could impact our operations, service performance, reputation, business continuity, and cost and availability of insurance, and more generally have an adverse effect on our business, financial performance, and reputation. In particular, climate change poses potential risks to our business, our employees, our customers, our suppliers and outsourcers, and the communities in which we operate. Inadequate management of environmental issues associated with our company and our business, as well as those of our suppliers and other stakeholders, could also adversely affect our business, financial condition, liquidity, financial results, and reputation, given the implications for the company as well as various stakeholders.
Consistent with the International Sustainability Standards Board (ISSB) standards, we categorize climate-related risks into physical and transition risks:
| • | Physical risks are associated with the physical impacts from a changing climate and can either be event-driven (acute) or longer-term (chronic) shifts in climate patterns. Global scientific evidence suggests that climate change will increase both the frequency and severity of extreme weather events. This will include such events as floods, wildfires, and heatwaves, among others. These could have a destructive impact on our communications network infrastructure and facilities and, in turn, affect our ability to deliver services that are critical to our customers and society. A service disruption due to extreme weather events could lead to financial impacts, including an increase in capital expenditures from rebuilding and reinforcing infrastructure, as well as an increase in operating costs from maintenance and repairs, labour, heating and cooling, and equipment damage. Our insurance premiums could increase, or we could face reduced insurability in high-risk areas. Furthermore, this could jeopardize customer satisfaction and may result in a decrease in revenues. In addition, if average temperatures where we are operating are warmer or cooler year over year for longer periods of time, there will be an increasing need for cooling or heating capacity in our facilities. This will increase our energy consumption and associated operational costs. Furthermore, in order to remain resilient to these increasing or decreasing temperatures, we would need to increase our investments in our infrastructure to address its accelerated degradation, again leading to increased capital expenditures and operational costs. |
| • | Transition risks are associated with a transition to a lower-carbon economy, which may include extensive regulatory, technology, and market changes to address mitigation and adaptation requirements related to climate change. These risks may include increased capital expenditures required for equipment upgrades to comply with new energy efficiency standards and climate resilience regulations; increased operational costs driven by the rising price of energy due to carbon pricing regulations; energy market volatility and the shifting supply and demand for energy; increased grid emissions intensity, which could affect our ability to meet our GHG targets; increased operational costs related to outdated equipment and e-waste treatment programs and management systems; potential shortages or price increases for materials essential to low-carbon technologies that could affect service offerings and product development; and reputational risks related to our management of climate-related issues as well as to our level of disclosure related to such matters. There is also a reputational risk of not demonstrating our proactive behaviour towards climate change, which could affect customer perception and the cost and availability of funding that has the |
| potential to be increasingly tied to the quality of our sustainability practices and related disclosed metrics, all of which could have negative financial outcomes. |
Furthermore, climate-related events could also impact our suppliers and outsourcers, which in turn could impact our business. Given that some of our third-party suppliers and outsourcers are located in foreign countries that are more at risk of experiencing weather-related events, localized natural disasters in such countries could further negatively impact our business.
In addition, several areas of our operations raise other environmental considerations, such as fuel storage, GHG emissions and energy consumption reduction, water usage and discharge, waste management, disposal of hazardous residual materials, recovery and recycling of end-of-life electronic products we sell or lease, and other network-associated impacts (e.g., treated wood poles, manhole effluents, lead cables, etc.).
Our team members, customers, investors, and governments expect that we regard environmental protection as an integral part of doing business and that we seek to minimize the negative environmental impacts of our operations and create positive impacts where possible. Failure to recognize and adequately respond to their evolving expectations, to take action to reduce our negative impacts on the environment, to achieve our environmental objectives, and to effectively report on environmental matters, could result in fines, and could harm our brand, reputation and competitiveness, as well as lead to other negative business, financial, legal, and regulatory consequences for the company.
There can be no assurance that our corporate governance practices will be sufficient to prevent violations of legal and ethical standards
Our employees, officers, BCE Board members, suppliers, agents, and other business partners are expected, in Canada, the U.S., and abroad, to comply with applicable legal and ethical standards including, without limitation, anti-bribery laws, as well as with our governance policies and contractual obligations. Failure to comply with such laws, policies, standards, and contractual obligations could expose us to investigations or litigation and significant fines and penalties, and result in reputational harm or disqualification from bidding on contracts. While we have developed and implemented corporate governance practices, including through our Code of Business Conduct, which is updated regularly and subject to an annual review by team members, there can be no assurance that such practices and measures will be sufficient to prevent violations of legal and ethical standards. Any such failure or violation could have an adverse effect on our business, financial performance, and reputation.
Various social issues, if not adequately managed, could have an adverse effect on our business
Effective management of social risk is a component of good sustainability practices. Inadequate management of social issues associated with our company and our business, as well as those of our suppliers and other stakeholders, could adversely affect our business, financial condition, liquidity, financial results, and reputation. This may include social issues discussed elsewhere in this MD&A, such as employees’ well-being, health and safety, social licence to operate AI data centres, responsible procurement, as well as other social issues such as human rights, including Indigenous peoples’ rights, consultation and accommodation, and community acceptance and engagement. Failure to sufficiently address and report on our management of social issues, and to achieve our social objectives could harm our brand and reputation, and could lead to negative business, financial, legal, and regulatory consequences for the company.
| BCE INC. 2025 ANNUAL FINANCIAL REPORT | 101 |
9 MD&A Business risks
Health risks, including pandemics, epidemics, and other health concerns, such as radiofrequency emissions from wireless communications devices and equipment, could have an adverse effect on our business
Health risks, including pandemics and epidemics, could occur, any of which could adversely affect our ability to maintain operational networks and provide products and services to our customers, as well as the ability of our suppliers to provide us with the products and services we need to operate our business. Any such pandemics, epidemics and other health risks could have an adverse effect on the economy and financial markets, causing retail and commercial activity to decline, which could have a negative impact on the demand for, and prices of, our products and services.
Many studies have been performed or are ongoing to assess whether mobile communications devices, such as smartphones, as well as wireless networks and towers, pose a potential health risk. While some studies suggest links to certain conditions, others conclude there is no established causation between mobile phone usage and adverse health effects. The International Agency for Research on Cancer (IARC) of the World Health Organization classified radiofrequency electromagnetic fields from wireless phones as possibly carcinogenic to humans, but also indicated that chance, bias, or confounding could not be ruled
out with reasonable confidence. The IARC also called for additional research into long-term heavy use of mobile phones.
ISED is responsible for approving radiofrequency equipment and performing compliance assessments, and has chosen Health Canada’s Safety Code 6, which sets the limits for safe exposure to radiofrequency emissions at home or at work, as its exposure standard. This code also outlines safety requirements for the installation and operation of devices that emit radiofrequency fields, such as mobile communications devices, Wi-Fi technologies, and base station antennas. ISED has made compliance with Safety Code 6 mandatory for all proponents and operators of radio installations.
The following challenges, among others, could arise since our business is heavily dependent on radiofrequency technologies: we may face lawsuits relating to alleged adverse health effects on customers, as well as relating to our marketing and disclosure practices in connection therewith, and the likely outcome of such potential lawsuits is unpredictable and could change over time; changes in scientific evidence and/or public perceptions could lead to additional government regulations and costs for retrofitting infrastructure and handsets to achieve compliance; and public concerns could result in a slower deployment of, or in our inability to deploy, infrastructure necessary to maintain and/or expand our wireless network as required by market evolution. Any of these events could have an adverse effect on our business and financial performance.
Third-party vendor management
We depend on third-party suppliers, outsourcers and consultants, some of which are critical, to provide an uninterrupted supply of the products and services we need, as well as comply with various obligations
We depend on key third-party suppliers and outsourcers, over which we have no operational or financial control, for products and services, some of which are critical to our operations. If there are gaps in our vendor selection, governance, or oversight processes established to seek to ensure full risk transparency at point of purchase and throughout the relationship, including any contract renegotiations, there is the potential for a breakdown in supply, which could impact our ability to make sales, service customers, and achieve our business and financial objectives. In addition, any such gap could result in suboptimal management of our vendor base, increased costs, and missed opportunities. Ongoing relationships must also be adequately managed in order to address existing and new operational and compliance requirements. Some of our third-party suppliers and outsourcers are located in foreign countries, which increases the potential for a breakdown in supply due to the risks of operating in foreign jurisdictions with different laws, geopolitical environments, and cultures, as well as the potential for localized natural disasters. Concerns related to geopolitical events, such as conflicts, could put pressure on our supply chain and require increased focus on supply chain diversification to support continuity.
Increased market concentration among technology, equipment, software, cloud, and content suppliers may heighten single- or limited-source dependency risks and reduce negotiating leverage.
We may have to select different third-party suppliers for equipment or other products and services, or different outsourcers, in order to meet evolving internal company policies and guidelines, as well as legal and regulatory requirements. Should we decide, or be required
by a governmental authority or otherwise, to terminate our relationship with an existing supplier or outsourcer, this would decrease the number of available suppliers or outsourcers and could result in significantly increased costs, as well as transitional, support, service, quality, or continuity issues; delay our ability to deploy new network and other technologies and offer new products and services; and adversely affect our business and financial results.
The use of third-party suppliers and the outsourcing of services generally involve transfer of risks, and we must take appropriate steps to ensure that our suppliers’ and outsourcers’ approach to risk management is aligned with our own standards in order to maintain continuity of supply and brand strength. Increased focus on supplier risks in areas such as security, data and AI governance, privacy, responsible procurement and broader sustainability factors requires increased attention given that supplier actions or omissions could have significant impacts on our business, financial results, brand, and reputation. Furthermore, cloud-based supplier models have continued to evolve and grow and, while they offer many potential benefits, cloud-based services can also change the level or types of risks. Accordingly, our procurement and vendor management practices must also continue to evolve to fully take into account the potential risks of cloud-based services.
In addition, certain company initiatives rely heavily on professional consulting services provided by third parties, and a failure of such third-party services may not be reasonably evident until their work is delivered or delayed. Difficulties in implementing remedial strategies in respect of professional consulting services provided by third parties that are not performed in a proper or timely fashion could have an adverse effect on our ability to comply with various obligations, including applicable legal and accounting requirements.
| 102 | BCE INC. 2025 ANNUAL FINANCIAL REPORT |
9 MD&A Business risks
Other examples of risks associated with third-party suppliers and outsourcers include the following:
| • | We rely upon the successful implementation and execution of business continuity plans by our product and service suppliers. To the extent that such plans do not successfully mitigate the impacts of the current global economic environment, geopolitical events, or other events, and our suppliers or vendors experience operational failures or inventory constraints, such failures or constraints could result in, or amplify existing, supply chain disruptions that could adversely affect our business. Incremental costs, delays, or unavailability of equipment, materials, products, or services, as well as unavailability of our suppliers’ or contractors’ employees due to strikes, workforce reduction initiatives, or other factors, could impact sales and execution of our business strategy and adversely affect our business and financial results. |
| • | The current global economic environment and recent geopolitical events have given rise to inflationary pressures and sharp increases in prices, including the imposition of tariffs on certain products by some countries, which could further increase pressure on the global supply chain and purchasing costs |
| • | Demand for products and services available from only a limited number of suppliers, some of which dominate their global market, may lead to decreased availability, increased costs, or delays in the delivery of such products and services, since suppliers may choose to favour global competitors that are larger than we are and, accordingly, purchase a larger volume of products and services. In addition, production issues or geopolitical events affecting any such suppliers, or other suppliers, could result in decreased quantities or a total lack of supply of products or services. Any of these events could adversely impact our ability to meet customer commitments and demand. |
| • | Dependence on vendors that are new to evolving technology can create uncertainties and challenges due to an unproven track record and lack of alternate vendors, which could have an adverse effect on our operations |
| • | The cost of our transformation initiatives, due to significant legacy networks, IT systems, and a historical reliance on outsourced IT, could have an adverse effect on our financial results |
| • | Overreliance on, or insufficient visibility into, our third-party IT vendor relationships may expose us to operational IT risks, such as service disruptions and security vulnerabilities. Furthermore, unknown dependencies on third-party vendors can amplify these risks. Failure to adequately monitor and manage our direct and indirect IT vendor relationships could adversely affect our operations, data security, and overall business performance. |
| • | The increased use of AI by our third-party vendors may further elevate our exposure to business, reputational, and compliance risks |
| • | The insolvency of one or more of our suppliers could cause a breakdown in supply and have an adverse effect on our operations, including our ability to make sales or service customers, as well as on our financial results |
| • | A suboptimal outsourcing model could result in the loss of key corporate knowledge, reduced efficiency and effectiveness, and impede the agile delivery of new products or technology |
| • | Cloud-based solutions may increase the risk of security and data leakage exposure if security control protocols and configurations implemented by our cloud-based partners or suppliers, or by us where we retain responsibility for such protocols, are inadequate |
| • | If existing suppliers do not have appropriate alternative cloud-based products or services, our ability to complete desired migrations to the cloud could be limited or delayed |
| • | Failure to maintain strong discipline around vendor administration (especially around initial account setup) may mask potential financial or operational risks and complicate future problem resolutions |
| • | If products and services important to our operations have manufacturing defects or do not comply with applicable government regulations and standards (including product safety practices), our ability to sell products and provide services on a timely basis may be negatively impacted. We work with our suppliers to seek to identify serious product defects (including safety incidents) and develop appropriate remedial strategies, which may include a recall of products. To the extent that a supplier does not actively participate in, and/or bear primary financial responsibility for, a recall of its products, our ability to perform such recall programs at a reasonable cost and/or in a timely fashion may be negatively impacted. Any of the events referred to above could have an adverse effect on our business, reputation, and financial results. |
| • | Products (including software) and services supplied to us may contain security issues including, but not limited to, latent security issues that would not be apparent upon an inspection. Should we or a supplier fail to correct a security issue in a timely fashion, there could be an adverse effect on our business, reputation, and financial results. |
| • | We rely on other telecommunications carriers from time to time to deliver services. Should these carriers fail to roll out new networks or fail to upgrade existing networks, or should their networks be affected by operational failures or service interruptions, such issues could adversely affect our ability to provide services using such carriers’ networks and could, consequently, have an adverse effect on our business, reputation, and financial results. |
| • | BCE depends on call centre and technical support services provided by a number of external suppliers and outsourcers, some of which are located in foreign countries. These vendors have access to customer and internal BCE information necessary for the support services that they provide. Information access and service delivery issues that are not managed appropriately may have an adverse impact on our business, reputation, the quality and speed of services provided to customers, or our ability to address technical issues. |
| BCE INC. 2025 ANNUAL FINANCIAL REPORT | 103 |
10 MD&A Accounting policies
| 10 | Accounting policies |
This section discusses key estimates and assumptions that management has made and how they affect the amounts reported in the financial statements and notes. It also describes key changes in accounting standards and our accounting policies, and how they affect our financial statements.
We have prepared our consolidated financial statements using IFRS Accounting Standards. Other significant accounting policies, not involving the same level of measurement uncertainty as those discussed in this section, are nevertheless important to an understanding of our financial statements. See Note 2, Material accounting policies, in BCE’s 2025 consolidated financial statements for more information about the accounting principles we used to prepare our consolidated financial statements.
Critical accounting estimates and key judgments
When preparing the financial statements, management makes estimates and judgments relating to:
| • | reported amounts of revenues and expenses |
| • | reported amounts of assets and liabilities |
| • | disclosure of contingent assets and liabilities |
We base our estimates on a number of factors, including but not limited to historical experience, current events, economic and financial market conditions such as interest rates, inflation and the risk of recession, geopolitical events and supply chain disruptions, and actions that the company may undertake in the future, as well as other assumptions that we believe are reasonable under the circumstances. A change in these assumptions may have an impact on our financial statements including but not limited to impairment testing, fair value determination, expected credit losses and discount rates used for the present value of cash flows. By their nature, these estimates and judgments are subject to measurement uncertainty and actual results could differ.
We consider the estimates and judgments described in this section to be an important part of understanding our financial statements because they require management to make assumptions about matters that were highly uncertain at the time the estimates and judgments were made, and changes to these estimates and judgments could have a material impact on our financial statements and our segments.
Our senior management has reviewed the development and selection of the critical accounting estimates and judgments described in this section with the Audit Committee of the BCE Board.
Any sensitivity analysis included in this section should be used with caution as the changes are hypothetical and the impact of changes in each key assumption may not be linear.
Our more significant estimates and judgments are described below.
Estimates
Useful lives of property, plant and equipment and finite-life intangible assets
We review our estimates of the useful lives of property, plant and equipment and finite-life intangible assets on an annual basis and adjust depreciation or amortization on a prospective basis, as required.
Property, plant and equipment and finite-life intangible assets represent a significant proportion of our total assets. Changes in technology or our intended use of these assets, climate change and our sustainability initiatives as well as changes in business prospects or economic and industry factors, may cause the estimated useful lives of these assets to change.
The estimated useful lives of property, plant and equipment and finite-life intangible assets are determined by internal asset life studies, which take into account actual and expected future usage, physical wear and tear, replacement history and assumptions about technology evolution. When factors indicate that assets’ useful lives are different from the prior assessment, we depreciate or amortize the remaining carrying value prospectively over the adjusted estimated useful lives.
Business acquisitions
We use various estimates, including replacement costs, customer churn and discount rates, in determining the fair value assigned to assets acquired and liabilities assumed in business acquisitions, in particular for property, plant and equipment and intangible assets.
Post-employment benefit plans
The amounts reported in the financial statements relating to DB pension plans and OPEBs are determined using actuarial calculations that are based on several assumptions.
Our actuaries perform a valuation at least every three years to determine the actuarial present value of the accrued DB pension plan and OPEB obligations. The actuarial valuation uses management’s assumptions for, among other things, the discount rate, life expectancy, the rate of compensation increase, cost of living indexation rate, trends in healthcare costs and expected average remaining years of service of employees.
While we believe that these assumptions are reasonable, differences in actual results or changes in assumptions could materially affect post-employment benefit obligations and future net post-employment benefit plans cost.
We account for differences between actual and expected results in benefit obligations and plan performance in OCI, which are then recognized immediately in the deficit.
The most significant assumptions used to calculate the net post-employment benefit plans cost are the discount rate and life expectancy.
A discount rate is used to determine the present value of the future cash flows that we expect will be needed to settle post-employment benefit obligations.
The discount rate is based on the yield on long-term, high-quality corporate fixed income investments, with maturities matching the estimated cash flows of the post-employment benefit plans. Life expectancy is based on publicly available Canadian mortality tables and is adjusted for the company’s specific experience.
A lower discount rate and a higher life expectancy result in a higher net post-employment benefit obligation and a higher current service cost.
| 104 | BCE INC. 2025 ANNUAL FINANCIAL REPORT |
10 MD&A Accounting policies
Sensitivity analysis
The following table shows a sensitivity analysis of key assumptions used to measure the net post-employment benefit obligations and the net post-employment benefit plans cost for our DB pension plans and OPEB plans.
| Impact on net post-employment | Impact on post-employment benefit | |||||||||||||||||||
| benefit plans cost for 2025 – | obligations at December 31, 2025 – | |||||||||||||||||||
| increase (decrease) | increase (decrease) | |||||||||||||||||||
| Change in assumption |
Increase in assumption |
Decrease in assumption |
Increase in assumption |
Decrease in assumption |
||||||||||||||||
| Discount rate |
0.5% | (79) | 76 | (1,026) | 1,102 | |||||||||||||||
| Cost of living indexation rate |
0.5% | 54 | (42) | 997 | (800) | |||||||||||||||
| Life expectancy at age 65 |
1 year | 41 | (40) | 782 | (782) | |||||||||||||||
Revenue from contracts with customers
We are required to make estimates that affect the amount of revenue from contracts with customers, including estimating the stand-alone selling prices of products and services.
For bundled arrangements, we account for individual products and services when they are separately identifiable and the customer can benefit from the product or service on its own or with other readily available resources. The total arrangement consideration is allocated to each product or service included in the contract with the customer based on its stand-alone selling price. We generally determine stand-alone selling prices based on the observable prices at which we sell products separately without a service contract and prices for non-bundled service offers with the same range of services, adjusted for market conditions and other factors, as appropriate. When similar products and services are not sold separately, we use the expected cost plus margin approach to determine stand-alone selling prices. Products and services purchased by a customer in excess of those included in the bundled arrangement are accounted for separately.
Impairment of non-financial assets
Goodwill and indefinite-life intangible assets are tested for impairment annually and when there is an indication that the asset may be impaired. Property, plant and equipment and finite-life intangible assets are tested for impairment if events or changes in circumstances, assessed at each reporting period, indicate that their carrying amount may not be recoverable. For the purpose of impairment testing, assets other than goodwill are grouped at the lowest level for which there are separately identifiable cash inflows.
Impairment losses are recognized and measured as the excess of the carrying value of the assets over their recoverable amount. An asset’s recoverable amount is the higher of its fair value less costs of disposal and its value in use. Previously recognized impairment losses, other than those attributable to goodwill, are reviewed for possible reversal at each reporting date and, if the asset’s recoverable amount has increased, all or a portion of the impairment is reversed.
We make a number of estimates when calculating recoverable amounts using discounted future cash flows or other valuation methods to test for impairment. These estimates include the assumed growth rates for future cash flows, the number of years used in the cash flow model and the discount rate. When impairment charges occur they are recorded in Impairment of assets.
During the third quarter of 2025, we recognized $976 million of impairment charges for English and French TV services, radio markets and our OOH advertising business within our Bell Media segment. These charges included $554 million allocated to indefinite-life intangible assets for broadcast licences, spectrum and other licences and brands, $250 million allocated to program and feature film rights, $103 million allocated to property, plant and equipment for network, infrastructure and equipment and assets under construction, $47 million allocated to software, $18 million allocated to prepaid expenses and inventory, and $4 million allocated to finite-life intangible assets mainly for trademarks. The impairment was determined by comparing the carrying value of the CGUs to their fair value less cost of disposal. We estimated the fair value of the CGUs using discounted cash flows and market-based valuation models, which include five-year cash flow projections derived from business plans reviewed by senior management for the period of September 1, 2025 to December 31, 2030, using discount rates of 9% to 11% and perpetuity growth rates of (2%) to 2%, as well as market multiple data from public companies and market transactions. A negative change to any of these assumptions and projections may result in further impairment charges for certain groups of CGUs. After impairments, the carrying value of the impacted CGUs was $352 million.
We recorded $51 million of additional impairment charges in 2025 related to various assets within our Bell CTS Canada segment.
During the third quarter of 2024, we recognized $958 million of impairment charges for English and French TV services and radio markets within our Bell Media segment. These charges included $627 million allocated to indefinite-life intangible assets for broadcast licences and brands, $144 million allocated to program and feature film rights, $85 million allocated to property, plant and equipment for network and infrastructure and equipment, $85 million allocated to software, $10 million allocated to finite-life intangible assets mainly for trademarks, and $7 million allocated to prepaid expenses. The impairment was determined by comparing the carrying value of the CGUs to their fair value less cost of disposal. We estimated the fair value of the CGUs using both discounted cash flows and market-based valuation models, which include five-year cash flow projections derived from business plans reviewed by senior management for the period of September 1, 2024 to December 31, 2029, using discount rates of 9% to 11% and perpetuity growth rates of (2%) to 0%, as well as market multiple data from public companies and market transactions. After impairments, the carrying value of the impacted CGUs was $811 million.
Additionally in 2024, we recorded impairment charges of $100 million related mainly to right-of-use assets for certain office spaces we ceased using as part of our real estate optimization strategy as a result of our hybrid work policy.
| BCE INC. 2025 ANNUAL FINANCIAL REPORT | 105 |
10 MD&A Accounting policies
Goodwill impairment testing
We perform an annual test for goodwill impairment in the fourth quarter for each of our CGUs or groups of CGUs to which goodwill is allocated, and whenever there is an indication that goodwill might be impaired.
A CGU is the smallest identifiable group of assets that generates cash inflows that are independent of the cash inflows from other assets or groups of assets.
We identify any potential impairment by comparing the carrying value of a CGU or group of CGUs to its recoverable amount. The recoverable amount of a CGU or group of CGUs is the higher of its fair value less costs of disposal and its value in use. Both fair value less costs of disposal and value in use are based on estimates of discounted future cash flows or other valuation methods. Cash flows are projected based on past experience, actual operating results and business plans, including any impact from changes in interest rates and inflation. We recognize an impairment charge in the income statements by reducing the carrying value of goodwill when the recoverable amount of a CGU or group of CGUs to which goodwill is allocated is less than its carrying value. Any impairment charge in excess of the carrying value of the related goodwill reduces the carrying value of each of the other assets of the corresponding CGU or groups of CGUs on a pro rata basis, not below the recoverable amount of each asset.
For purposes of impairment testing of goodwill, our CGUs or groups of CGUs correspond to our reporting segments as disclosed in Note 3, Segmented information, in BCE’s 2025 consolidated financial statements.
Any significant change in each of the estimates used could have a material impact on the calculation of the recoverable amount and resulting impairment charge. As a result, we are unable to reasonably quantify the changes in our overall financial performance if we had used different assumptions.
We cannot predict whether an event that triggers impairment will occur, when it will occur or how it will affect the asset values we have reported.
We believe that any reasonable possible change in the key assumptions on which the estimate of recoverable amount of the Bell CTS Canada group of CGUs is based would not cause its carrying amount to exceed its recoverable amount.
For the Bell CTS U.S. group of CGUs, a decrease of 1.2% in the perpetuity growth rate or an increase of 1.0% in the discount rate would have resulted in its recoverable amount being equal to its carrying value.
For the Bell Media group of CGUs, a decrease of 2.1% in the perpetuity growth rate or an increase of 1.2% in the discount rate would have resulted in its recoverable amount being equal to its carrying value.
There were no goodwill impairment charges in 2025.
In Q3 2024, due to a continued decline in advertising demand and spending in the linear advertising market for Bell Media TV services and radio markets, there was an indicator that goodwill might be impaired for the Bell Media group of CGUs. Consequently, an impairment charge of $1,132 million was recognized in Impairment of assets in the income statements.
Deferred taxes
Deferred tax assets and liabilities are calculated at the tax rates that are expected to apply when the asset or liability is recovered or settled. Both our current and deferred tax assets and liabilities are calculated using tax rates that have been enacted or substantively enacted at the reporting date.
Deferred taxes are provided on temporary differences arising from investments in subsidiaries, joint arrangements and associates, except where we control the timing of the reversal of the temporary difference and it is probable that the temporary difference will not reverse in the foreseeable future.
The amounts of deferred tax assets and liabilities are estimated with consideration given to the timing, sources and amounts of future taxable income.
As required by IFRS Accounting Standards, we do not recognize or disclose information about deferred tax assets and liabilities related to the Pillar Two model rules published by the Organisation for Economic Co-operation and Development, including tax law that implements qualified domestic minimum top-up taxes described in those rules.
Leases
The application of IFRS 16 requires us to make estimates that affect the measurement of right-of-use assets and liabilities, including determining the appropriate discount rate used to measure lease liabilities. Lease liabilities are initially measured at the present value of the lease payments that are not paid at the commencement date, discounted using our incremental borrowing rate, unless the rate implicit in the lease is readily determinable. Our incremental borrowing rate is derived from publicly available risk-free interest rates, adjusted for applicable credit spreads and lease terms. We apply a single incremental borrowing rate to a portfolio of leases with similar characteristics.
Fair value of financial instruments
Certain financial instruments, such as investments in equity securities, derivative financial instruments and certain elements of borrowings, are carried in the statements of financial position at fair value, with changes in fair value reflected in the income statements and the statements of comprehensive income. Fair values are estimated by reference to published price quotations or by using other valuation techniques that may include inputs that are not based on observable market data, such as discounted cash flows and earnings multiples.
Contingencies
In the ordinary course of business, we become involved in various claims and legal proceedings seeking monetary damages and other relief. Pending claims and legal proceedings represent a potential cost to our business. We estimate the amount of a loss by analyzing potential outcomes and assuming various litigation and settlement strategies, based on information that is available at the time.
If the final resolution of a legal or regulatory matter results in a judgment against us or requires us to pay a large settlement, it could have a material adverse effect on our consolidated financial statements in the period in which the judgment or settlement occurs.
Onerous contracts
A provision for onerous contracts is recognized when the unavoidable costs of meeting our obligations under a contract exceed the expected benefits to be received under the contract. The provision is measured at the present value of the lower of the expected cost of terminating the contract and the expected net cost of completing the contract.
Judgments
Post-employment benefit plans
The determination of the discount rate used to value our post-employment benefit obligations requires judgment. The rate is set by reference to market yields of long-term, high-quality corporate fixed income investments at the beginning of each fiscal year. Significant judgment is required when setting the criteria for fixed income investments to be included in the population from which the yield curve is derived. The most significant criteria considered for the selection of investments include the size of the issue and credit quality, along with the identification of outliers, which are excluded.
| 106 | BCE INC. 2025 ANNUAL FINANCIAL REPORT |
10 MD&A Accounting policies
Income taxes
The calculation of income taxes requires judgment in interpreting tax rules and regulations. There are transactions and calculations for which the ultimate tax determination is uncertain. Our tax filings are also subject to audits, the outcome of which could change the amount of current and deferred tax assets and liabilities. Management believes that it has sufficient amounts accrued for outstanding tax matters based on information that is currently available.
Management judgment is used to determine the amounts of deferred tax assets and liabilities to be recognized. In particular, judgment is required when assessing the timing of the reversal of temporary differences to which future income tax rates are applied.
Leases
The application of IFRS 16 requires us to make judgments that affect the measurement of right-of-use assets and liabilities. A lease contract conveys the right to control the use of an identified asset for a period of time in exchange for consideration. At inception of the contract, we assess whether the contract contains an identified asset, whether we have the right to obtain substantially all of the economic benefits from use of the asset and whether we have the right to direct how and for what purpose the asset is used. In determining the lease term, we include periods covered by renewal options when we are reasonably certain to exercise those options. Similarly, we include periods covered by termination options when we are reasonably certain not to exercise those options. To assess if we are reasonably certain to exercise an option, we consider all facts and circumstances that create an economic incentive to exercise renewal options (or not exercise termination options). Economic incentives include the costs related to the termination of the lease, the significance of any leasehold improvements and the importance of the underlying assets to our operations.
Revenue from contracts with customers
The identification of performance obligations within a contract and the timing of satisfaction of performance obligations under long-term contracts requires judgment. For bundled arrangements, we account for individual products and services when they are separately identifiable and the customer can benefit from the product or service on its own or
with other readily available resources. When our right to consideration from a customer corresponds directly with the value to the customer of the products and services transferred to date, we recognize revenue in the amount to which we have a right to invoice. We recognize product revenues from the sale of wireless handsets and devices and wireline equipment when a customer takes possession of the product. We recognize service revenues over time, as the services are provided. Revenues on certain long-term contracts are recognized using output methods based on products delivered, performance completed to date, time elapsed or milestones met.
Additionally, the determination of costs to obtain a contract, including the identification of incremental costs, also requires judgment. Incremental costs of obtaining a contract with a customer, principally comprised of sales commissions, and prepaid contract fulfillment costs are included in Contract costs in the statements of financial position, except where the amortization period is one year or less, in which case costs of obtaining a contract are immediately expensed. Capitalized costs are amortized on a systematic basis that is consistent with the period and pattern of transfer to the customer of the related products or services.
CGUs
The determination of CGUs or groups of CGUs for the purpose of impairment testing requires judgment.
Contingencies
The determination of whether a loss is probable from claims and legal proceedings and whether an outflow of resources is likely requires judgment.
We accrue a potential loss if we believe a loss is probable and an outflow of resources is likely and can be reasonably estimated, based on information that is available at the time. Any accrual would be charged to earnings and included in Trade payables and other liabilities or Other non-current liabilities. Any payment as a result of a judgment or cash settlement would be deducted from cash from operating activities. We estimate the amount of a loss by analyzing potential outcomes and assuming various litigation and settlement strategies.
Future changes to accounting standards
The following accounting standard and amendments to accounting standards issued by the IASB have not yet been adopted by BCE.
| Standard | Description | Impact | Effective date | |||
| IFRS 18 – Presentation and Disclosure in Financial Statements | Sets out requirements and guidance on presentation and disclosure in financial statements, including:
• presentation in the income statements of income and expenses within defined categories – operating, investing, financing, income taxes and discontinued operations
• presentation in the income statements of new defined subtotals – operating profit and profit before financing and income taxes
• disclosure of explanations of management-defined performance measures that are related to the income statements
• enhanced guidance on aggregation and disaggregation of information and whether to provide information in the financial statements or in the notes
• disclosure of specified expenses by nature
IFRS 18 replaces IAS 1 – Presentation of Financial Statements but carries forward many of the requirements from IAS 1 unchanged.
|
We are currently assessing the impact of this standard. | Annual reporting periods beginning on or after January 1, 2027. Early application is permitted. | |||
| Amendments to the Classification and Measurement of Financial Instruments – Amendments to IFRS 9 and IFRS 7 | In particular, the amendments clarify:
• the classification of financial assets with environmental, social and corporate governance and similar features
• the derecognition date for financial liabilities and introduce an accounting policy option for financial liabilities settled using an electronic payment system if certain conditions are met
The amendments also require additional disclosures for financial instruments with contractual terms that reference a contingent event and equity instruments classified at fair value through OCI.
|
These amendments will not have a significant impact on our financial statements. | Annual reporting periods beginning on or after January 1, 2026. | |||
| BCE INC. 2025 ANNUAL FINANCIAL REPORT | 107 |
11 MD&A Non-GAAP financial measures, other financial measures and key performance indicators (KPIs)
| 11 | Non-GAAP financial measures, other financial measures and key performance indicators (KPIs) |
BCE uses various financial measures to assess its business performance. Certain of these measures are calculated in accordance with IFRS Accounting Standards or GAAP while certain other measures do not have a standardized meaning under GAAP. We believe that our GAAP financial measures, read together with adjusted non-GAAP and other financial measures, provide readers with a better understanding of how management assesses BCE’s performance.
National Instrument 52-112, Non-GAAP and Other Financial Measures Disclosure (NI 52-112), prescribes disclosure requirements that apply to the following specified financial measures:
| • | Non-GAAP financial measures |
| • | Non-GAAP ratios |
| • | Total of segments measures |
| • | Capital management measures |
| • | Supplementary financial measures |
This section provides a description and classification of the specified financial measures contemplated by NI 52-112 that we use to explain our financial results except that, for supplementary financial measures, an explanation of such measures is provided where they are first referred to in this MD&A if the supplementary financial measures’ labelling is not sufficiently descriptive.
| 11.1 | Non-GAAP financial measures |
A non-GAAP financial measure is a financial measure used to depict our historical or expected future financial performance, financial position or cash flow and, with respect to its composition, either excludes an amount that is included in, or includes an amount that is excluded from, the composition of the most directly comparable financial measure disclosed in BCE’s consolidated primary financial statements.
We believe that non-GAAP financial measures are reflective of our ongoing operating results and provide readers with an understanding of management’s perspective on and analysis of our performance.
Below are descriptions of the non-GAAP financial measures that we use to explain our results as well as reconciliations to the most directly comparable financial measures under IFRS Accounting Standards.
Adjusted net earnings
The term adjusted net earnings does not have any standardized meaning under IFRS Accounting Standards. Therefore, it is unlikely to be comparable to similar measures presented by other issuers.
We define adjusted net earnings as net earnings (loss) attributable to common shareholders before severance, acquisition and other costs, net mark-to-market losses (gains) on derivatives used to economically hedge equity settled share-based compensation plans, net equity losses (gains) on investments in associates and joint ventures, net losses (gains) on investments, net early debt redemption costs (gains), impairment of assets and discontinued operations, net of tax and NCI.
We use adjusted net earnings and we believe that certain investors and analysts use this measure, among other ones, to assess the performance of our businesses without the effects of severance, acquisition and other costs, net mark-to-market losses (gains) on derivatives used to economically hedge equity settled share-based compensation plans, net equity losses (gains) on investments in associates and joint ventures, net losses (gains) on investments, net early debt redemption costs (gains), impairment of assets and discontinued operations, net of tax and NCI. We exclude these items because they affect the comparability of our financial results and could potentially distort the analysis of trends in business performance. Excluding these items does not imply they are non-recurring.
The most directly comparable financial measure under IFRS Accounting Standards is net earnings (loss) attributable to common shareholders.
The following table is a reconciliation of net earnings attributable to common shareholders to adjusted net earnings on a consolidated basis.
| Q4 2025 | Q4 2024 | 2025 | 2024 | |||||||||||||
| Net earnings attributable to common shareholders |
594 | 461 | 6,305 | 163 | ||||||||||||
| Reconciling items: |
||||||||||||||||
| Severance, acquisition and other costs |
147 | 154 | 517 | 454 | ||||||||||||
| Net mark-to-market (gains) losses on derivatives used to economically hedge equity settled share-based compensation plans |
(2 | ) | 198 | 9 | 269 | |||||||||||
| Net equity losses on investments in associates and joint ventures |
– | – | – | 247 | ||||||||||||
| Net (gains) losses on investments |
(52 | ) | 1 | (5,217 | ) | (57 | ) | |||||||||
| Net early debt redemption gains |
(46 | ) | – | (249 | ) | – | ||||||||||
| Impairment of assets |
40 | 4 | 1,027 | 2,190 | ||||||||||||
| Income taxes for the above reconciling items |
(38 | ) | (99 | ) | 217 | (467 | ) | |||||||||
| NCI for the above reconciling items |
– | – | (8 | ) | (26 | ) | ||||||||||
| Adjusted net earnings |
643 | 719 | 2,601 | 2,773 | ||||||||||||
| 108 | BCE INC. 2025 ANNUAL FINANCIAL REPORT |
11 MD&A Non-GAAP financial measures, other financial measures and key performance indicators (KPIs)
Available liquidity
The term available liquidity does not have any standardized meaning under IFRS Accounting Standards. Therefore, it is unlikely to be comparable to similar measures presented by other issuers.
We define available liquidity as cash, cash equivalents, short-term investments and amounts available under our securitized receivables program and our committed bank credit facilities, excluding credit facilities that are available exclusively for a pre-determined purpose.
We consider available liquidity to be an important indicator of the financial strength and performance of our businesses because it shows the funds available to meet our cash requirements, including for, but not limited to, capital expenditures, post-employment benefit plans funding, dividend payments, the payment of contractual obligations, maturing debt, ongoing operations, the acquisition of spectrum, and other cash requirements. We believe that certain investors and analysts use available liquidity to evaluate the financial strength and performance of our businesses. The most directly comparable financial measure under IFRS Accounting Standards is cash.
The following table is a reconciliation of cash to available liquidity on a consolidated basis.
| December 31, 2025 | December 31, 2024 | |||||||
| Cash |
314 | 1,572 | ||||||
| Cash equivalents |
6 | – | ||||||
| Short-term investments |
– | 400 | ||||||
| Amounts available under our securitized receivables program (1) |
700 | 700 | ||||||
| Amounts available under our committed bank credit facilities (2) |
1,450 | 1,810 | ||||||
| Available liquidity |
2,470 | 4,482 | ||||||
| (1) | At December 31, 2025 and December 31, 2024, $700 million was available under our securitized receivables program, under which we borrowed $1,163 million in U.S. dollars ($1,594 million in Canadian dollars) and $1,112 million in U.S. dollars ($1,600 million in Canadian dollars) as at December 31, 2025 and December 31, 2024, respectively. Loans secured by receivables are included in Debt due within one year in our consolidated financial statements. |
| (2) | At December 31, 2025 and December 31, 2024, respectively, $1,450 million and $1,810 million were available under our committed bank credit facilities, given outstanding commercial paper of $1,861 million in U.S. dollars ($2,550 million in Canadian dollars) and $1,522 million in U.S. dollars ($2,190 million in Canadian dollars) as at December 31, 2025 and December 31, 2024, respectively. Commercial paper outstanding is included in Debt due within one year in our consolidated financial statements |
Free cash flow, free cash flow after payment of lease liabilities and excess free cash flow
The terms free cash flow, free cash flow after payment of lease liabilities and excess free cash flow do not have any standardized meaning under IFRS Accounting Standards. Therefore, they are unlikely to be comparable to similar measures presented by other issuers.
We define free cash flow as cash flows from operating activities, excluding cash from discontinued operations, acquisition and other costs paid (which include significant litigation costs) and voluntary pension funding, less capital expenditures, preferred share dividends and dividends paid by subsidiaries to NCI. We exclude cash from discontinued operations, acquisition and other costs paid and voluntary pension funding because they affect the comparability of our financial results and could potentially distort the analysis of trends in business performance. Excluding these items does not imply they are non-recurring.
We define free cash flow after payment of lease liabilities as cash flows from operating activities, excluding cash from discontinued operations, acquisition and other costs paid (which include significant litigation costs) and voluntary pension funding, less principal payment of lease liabilities, capital expenditures, preferred share dividends and dividends paid by subsidiaries to NCI. We exclude cash from discontinued operations, acquisition and other costs paid and voluntary pension funding because they affect the comparability of our financial results and could potentially distort the analysis of trends in business performance. Excluding these items does not imply they are non-recurring.
We define excess free cash flow as free cash flow less dividends paid on common shares.
We consider free cash flow, free cash flow after payment of lease liabilities and excess free cash flow to be important indicators of the financial strength and performance of our businesses. Free cash flow and free cash flow after payment of lease liabilities show how much cash is available to pay dividends on common shares, repay debt and reinvest in our company. Excess free cash flow shows how much cash is available to repay debt and reinvest in our company, after the payment of dividends on common shares. We believe that certain investors and analysts use free cash flow, free cash flow after payment of lease liabilities and excess free cash flow to value a business and its underlying assets and to evaluate the financial strength and performance of our businesses. The most directly comparable financial measure under IFRS Accounting Standards is cash flows from operating activities.
In Q1 2026, we will update our definitions of free cash flow, free cash flow after payment of lease liabilities and excess free cash flow to exclude income taxes paid on significant divestitures included within cash flows from operating activities. This change does not impact the amounts for free cash flow, free cash flow after payment of lease liabilities and excess free cash flow previously presented. We exclude this item as it could affect the comparability of our financial results and potentially distort the analysis of trends in business performance. Excluding this item does not imply it is non-recurring.
| BCE INC. 2025 ANNUAL FINANCIAL REPORT | 109 |
11 MD&A Non-GAAP financial measures, other financial measures and key performance indicators (KPIs)
The following tables provide reconciliations of cash flows from operating activities to free cash flow, free cash flow after payment of lease liabilities and excess free cash flow on a consolidated basis.
| 2025 | Q4 2025 | Q3 2025 | Q2 2025 | Q1 2025 | ||||||||||||||||||||
| Cash flows from operating activities |
6,993 | 1,561 | 1,914 | 1,947 | 1,571 | |||||||||||||||||||
| Capital expenditures |
(3,700 | ) | (1,317 | ) | (891 | ) | (763 | ) | (729 | ) | ||||||||||||||
| Cash dividends paid on preferred shares |
(151 | ) | (46 | ) | (28 | ) | (38 | ) | (39 | ) | ||||||||||||||
| Cash dividends paid by subsidiaries to NCI |
(51 | ) | (13 | ) | (25 | ) | – | (13 | ) | |||||||||||||||
| Acquisition and other costs paid |
87 | 40 | 33 | 6 | 8 | |||||||||||||||||||
| Free cash flow |
3,178 | 225 | 1,003 | 1,152 | 798 | |||||||||||||||||||
| Principal payment of lease liabilities |
(1,127 | ) | (248 | ) | (297 | ) | (278 | ) | (304 | ) | ||||||||||||||
| Free cash flow after payment of lease liabilities |
2,051 | (23 | ) | 706 | 874 | 494 | ||||||||||||||||||
| 2024 | Q4 2024 | Q3 2024 | Q2 2024 | Q1 2024 | 2023 | |||||||||||||||||||
| Cash flows from operating activities |
6,988 | 1,877 | 1,842 | 2,137 | 1,132 | 7,946 | ||||||||||||||||||
| Capital expenditures |
(3,897 | ) | (963 | ) | (954 | ) | (978 | ) | (1,002 | ) | (4,581 | ) | ||||||||||||
| Cash dividends paid on preferred shares |
(187 | ) | (53 | ) | (43 | ) | (45 | ) | (46 | ) | (182 | ) | ||||||||||||
| Cash dividends paid by subsidiaries to NCI |
(68 | ) | (12 | ) | (14 | ) | (28 | ) | (14 | ) | (47 | ) | ||||||||||||
| Acquisition and other costs paid |
52 | 25 | 1 | 11 | 15 | 8 | ||||||||||||||||||
| Free cash flow |
2,888 | 874 | 832 | 1,097 | 85 | 3,144 | ||||||||||||||||||
| Principal payment of lease liabilities |
(1,142 | ) | (270 | ) | (305 | ) | (270 | ) | (297 | ) | (1,049 | ) | ||||||||||||
| Free cash flow after payment of lease liabilities |
1,746 | 604 | 527 | 827 | (212 | ) | 2,095 | |||||||||||||||||
|
|
||||||||||||||||||||||||
| 2025 | Q4 2025 | Q3 2025 | Q2 2025 | Q1 2025 | ||||||||||||||||||||
| Cash flows from operating activities |
6,993 | 1,561 | 1,914 | 1,947 | 1,571 | |||||||||||||||||||
| Capital expenditures |
(3,700 | ) | (1,317 | ) | (891 | ) | (763 | ) | (729 | ) | ||||||||||||||
| Cash dividends paid on preferred shares |
(151 | ) | (46 | ) | (28 | ) | (38 | ) | (39 | ) | ||||||||||||||
| Cash dividends paid by subsidiaries to NCI |
(51 | ) | (13 | ) | (25 | ) | – | (13 | ) | |||||||||||||||
| Acquisition and other costs paid |
87 | 40 | 33 | 6 | 8 | |||||||||||||||||||
| Free cash flow |
3,178 | 225 | 1,003 | 1,152 | 798 | |||||||||||||||||||
| Dividends paid on common shares |
(2,026 | ) | (408 | ) | (408 | ) | (608 | ) | (602 | ) | ||||||||||||||
| Excess free cash flow |
1,152 | (183 | ) | 595 | 544 | 196 | ||||||||||||||||||
| 2024 | Q4 2024 | Q3 2024 | Q2 2024 | Q1 2024 | 2023 | |||||||||||||||||||
| Cash flows from operating activities |
6,988 | 1,877 | 1,842 | 2,137 | 1,132 | 7,946 | ||||||||||||||||||
| Capital expenditures |
(3,897 | ) | (963 | ) | (954 | ) | (978 | ) | (1,002 | ) | (4,581 | ) | ||||||||||||
| Cash dividends paid on preferred shares |
(187 | ) | (53 | ) | (43 | ) | (45 | ) | (46 | ) | (182 | ) | ||||||||||||
| Cash dividends paid by subsidiaries to NCI |
(68 | ) | (12 | ) | (14 | ) | (28 | ) | (14 | ) | (47 | ) | ||||||||||||
| Acquisition and other costs paid |
52 | 25 | 1 | 11 | 15 | 8 | ||||||||||||||||||
| Free cash flow |
2,888 | 874 | 832 | 1,097 | 85 | 3,144 | ||||||||||||||||||
| Dividends paid on common shares |
(3,613 | ) | (910 | ) | (910 | ) | (910 | ) | (883 | ) | (3,486 | ) | ||||||||||||
| Excess free cash flow |
(725 | ) | (36 | ) | (78 | ) | 187 | (798 | ) | (342 | ) | |||||||||||||
| 110 | BCE INC. 2025 ANNUAL FINANCIAL REPORT |
11 MD&A Non-GAAP financial measures, other financial measures and key performance indicators (KPIs)
Net debt
The term net debt does not have any standardized meaning under IFRS Accounting Standards. Therefore, it is unlikely to be comparable to similar measures presented by other issuers.
We define net debt as debt due within one year plus long-term debt and 50% of outstanding preferred shares, less 50% of junior subordinated debt included within long-term debt, and less cash, cash equivalents and short-term investments, as shown in BCE’s consolidated statements of financial position.
In Q1 2025, we updated our definition of net debt to include 50% of junior subordinated debt. This change does not impact the net debt amounts previously presented. We include 50% of outstanding preferred shares and 50% of junior subordinated debt in our net debt as it is consistent with the treatment by certain credit rating agencies and given structural features including priority of payments.
We, and certain investors and analysts, consider net debt to be an important indicator of the company’s financial leverage.
Net debt is calculated using several asset and liability categories from the statements of financial position. The most directly comparable financial measure under IFRS Accounting Standards is long-term debt. The following table is a reconciliation of long-term debt to net debt on a consolidated basis.
| December 31, 2025 | December 31, 2024 | |||||||
| Long-term debt |
34,904 | 32,835 | ||||||
| Less: 50% of junior subordinated debt |
(2,149 | ) | – | |||||
| Debt due within one year |
6,155 | 7,669 | ||||||
| 50% of preferred shares |
1,644 | 1,767 | ||||||
| Cash |
(314 | ) | (1,572 | ) | ||||
| Cash equivalents |
(6 | ) | – | |||||
| Short-term investments |
– | (400 | ) | |||||
| Net debt |
40,234 | 40,299 | ||||||
| 11.2 | Non-GAAP ratios |
A non-GAAP ratio is a financial measure disclosed in the form of a ratio, fraction, percentage or similar representation and that has a non-GAAP financial measure as one or more of its components.
Adjusted EPS
The term adjusted EPS does not have any standardized meaning under IFRS Accounting Standards. Therefore, it is unlikely to be comparable to similar measures presented by other issuers.
We define adjusted EPS as adjusted net earnings per BCE common share. Adjusted net earnings is a non-GAAP financial measure. For further details on adjusted net earnings, see section 11.1, Non-GAAP financial measures.
We use adjusted EPS, and we believe that certain investors and analysts use this measure, among other ones, to assess the performance of our businesses without the effects of severance, acquisition and other costs,
net mark-to-market losses (gains) on derivatives used to economically hedge equity settled share-based compensation plans, net equity losses (gains) on investments in associates and joint ventures, net losses (gains) on investments, net early debt redemption costs (gains), impairment of assets and discontinued operations, net of tax and NCI. We exclude these items because they affect the comparability of our financial results and could potentially distort the analysis of trends in business performance. Excluding these items does not imply they are non-recurring.
Dividend payout ratio and dividend payout ratio after payment of lease liabilities
The terms dividend payout ratio and dividend payout ratio after payment of lease liabilities do not have any standardized meaning under IFRS Accounting Standards. Therefore, they are unlikely to be comparable to similar measures presented by other issuers.
We define dividend payout ratio as dividends paid on common shares divided by free cash flow. We define dividend payout ratio after payment of lease liabilities as dividends paid on common shares divided by free cash flow after payment of lease liabilities. Free cash
flow and free cash flow after payment of lease liabilities are non-GAAP financial measures. For further details on free cash flow and free cash flow after payment of lease liabilities, see section 11.1, Non-GAAP financial measures.
We consider dividend payout ratio and dividend payout ratio after payment of lease liabilities to be important indicators of the financial strength and performance of our businesses because they show the sustainability of the company’s dividend payments.
| BCE INC. 2025 ANNUAL FINANCIAL REPORT | 111 |
11 MD&A Non-GAAP financial measures, other financial measures and key performance indicators (KPIs)
| 11.3 | Total of segments measures |
A total of segments measure is a financial measure that is a subtotal or total of 2 or more reportable segments and is disclosed within the Notes to BCE’s consolidated primary financial statements.
Adjusted EBITDA and Bell CTS adjusted EBITDA
We define adjusted EBITDA as operating revenues less operating costs.
We define Bell CTS adjusted EBITDA as BCE adjusted EBITDA less Bell Media adjusted EBITDA.
The most directly comparable financial measure under IFRS Accounting Standards is net earnings (loss). The following tables provide reconciliations of net earnings (loss) to BCE adjusted EBITDA and Bell CTS adjusted EBITDA.
| 2025 | Q4 2025 | Q3 2025 | Q2 2025 | Q1 2025 | ||||||||||||||||||||
| Net earnings |
6,514 | 632 | 4,555 | 644 | 683 | |||||||||||||||||||
| Severance, acquisition and other costs |
517 | 147 | 82 | 41 | 247 | |||||||||||||||||||
| Depreciation |
3,861 | 1,002 | 969 | 949 | 941 | |||||||||||||||||||
| Amortization |
1,377 | 368 | 340 | 338 | 331 | |||||||||||||||||||
| Finance costs |
||||||||||||||||||||||||
| Interest expense |
1,775 | 453 | 457 | 442 | 423 | |||||||||||||||||||
| Net return on post-employment benefit plans |
(102 | ) | (25 | ) | (26 | ) | (26 | ) | (25 | ) | ||||||||||||||
| Impairment of assets |
1,027 | 40 | 970 | 8 | 9 | |||||||||||||||||||
| Net (gains) losses on investments |
(5,217 | ) | (52 | ) | (5,175 | ) | 8 | 2 | ||||||||||||||||
| Other (income) expense |
(287 | ) | (102 | ) | 95 | 30 | (310 | ) | ||||||||||||||||
| Income taxes |
1,193 | 201 | 495 | 240 | 257 | |||||||||||||||||||
| BCE adjusted EBITDA |
10,658 | 2,664 | 2,762 | 2,674 | 2,558 | |||||||||||||||||||
| Less: Bell Media adjusted EBITDA |
(782 | ) | (151 | ) | (237 | ) | (235 | ) | (159 | ) | ||||||||||||||
| Bell CTS adjusted EBITDA |
9,876 | 2,513 | 2,525 | 2,439 | 2,399 | |||||||||||||||||||
| 2024 | Q4 2024 | Q3 2024 | Q2 2024 | Q1 2024 | 2023 | |||||||||||||||||||
| Net earnings (loss) |
375 | 505 | (1,191 | ) | 604 | 457 | 2,327 | |||||||||||||||||
| Severance, acquisition and other costs |
454 | 154 | 49 | 22 | 229 | 200 | ||||||||||||||||||
| Depreciation |
3,758 | 933 | 934 | 945 | 946 | 3,745 | ||||||||||||||||||
| Amortization |
1,283 | 317 | 325 | 325 | 316 | 1,173 | ||||||||||||||||||
| Finance costs |
||||||||||||||||||||||||
| Interest expense |
1,713 | 431 | 440 | 426 | 416 | 1,475 | ||||||||||||||||||
| Net return on post-employment benefit plans |
(66 | ) | (17 | ) | (16 | ) | (17 | ) | (16 | ) | (108 | ) | ||||||||||||
| Impairment of assets |
2,190 | 4 | 2,113 | 60 | 13 | 143 | ||||||||||||||||||
| Net (gains) losses on investments |
(57 | ) | 1 | (66 | ) | 2 | 6 | (80 | ) | |||||||||||||||
| Other expense |
362 | 102 | 129 | 99 | 32 | 546 | ||||||||||||||||||
| Income taxes |
577 | 175 | 5 | 231 | 166 | 996 | ||||||||||||||||||
| BCE adjusted EBITDA |
10,589 | 2,605 | 2,722 | 2,697 | 2,565 | 10,417 | ||||||||||||||||||
| Less: Bell Media adjusted EBITDA |
(758 | ) | (169 | ) | (254 | ) | (218 | ) | (117 | ) | (697 | ) | ||||||||||||
| Bell CTS adjusted EBITDA |
9,831 | 2,436 | 2,468 | 2,479 | 2,448 | 9,720 | ||||||||||||||||||
| 112 | BCE INC. 2025 ANNUAL FINANCIAL REPORT |
11 MD&A Non-GAAP financial measures, other financial measures and key performance indicators (KPIs)
| 11.4 | Capital management measures |
A capital management measure is a financial measure that is intended to enable a reader to evaluate our objectives, policies and processes for managing our capital and is disclosed within the Notes to BCE’s consolidated financial statements.
The financial reporting framework used to prepare the financial statements requires disclosure that helps readers assess the company’s capital management objectives, policies, and processes, as set out in IFRS Accounting Standards in IAS 1 – Presentation of Financial Statements. BCE has its own methods for managing capital and liquidity, and IFRS Accounting Standards do not prescribe any particular calculation method.
Net debt leverage ratio
The net debt leverage ratio represents net debt divided by adjusted EBITDA. Net debt used in the calculation of the net debt leverage ratio is a non-GAAP financial measure. For further details on net debt, see section 11.1, Non-GAAP financial measures. For the purposes of calculating our net debt leverage ratio, adjusted EBITDA is twelve-month trailing adjusted EBITDA.
We use, and believe that certain investors and analysts use, the net debt leverage ratio as a measure of financial leverage.
| 11.5 | Supplementary financial measures |
A supplementary financial measure is a financial measure that is not reported in BCE’s consolidated financial statements, and is, or is intended to be, reported periodically to represent historical or expected future financial performance, financial position, or cash flows.
An explanation of such measures is provided where they are first referred to in this MD&A if the supplementary financial measures’ labelling is not sufficiently descriptive.
| 11.6 | KPIs |
In addition to the non-GAAP financial measures and other financial measures described previously, we use the following KPIs to measure the success of our strategic priorities. These KPIs are not accounting measures and may not be comparable to similar measures presented by other issuers.
| KPI | Definition | |
| Adjusted EBITDA margin |
Adjusted EBITDA margin is defined as adjusted EBITDA divided by operating revenues. | |
| ARPU |
ARPU is defined as Bell CTS Canada wireless external services revenues divided by the average mobile phone subscriber base for the specified period, expressed as a dollar unit per month. | |
| Capital intensity |
Capital intensity is defined as capital expenditures divided by operating revenues. | |
| Churn |
Mobile phone churn is the rate at which existing mobile phone subscribers cancel their services. It is a measure of our ability to retain our customers. Mobile phone churn is calculated by dividing the number of mobile phone deactivations during a given period by the average number of mobile phone subscribers in the base for the specified period and is expressed as a percentage per month. | |
| Subscriber unit |
Mobile phone subscriber unit is comprised of a recurring revenue generating portable unit (e.g. smartphones and feature phones) on an active service plan, that has access to our wireless networks and includes voice, text and/or data connectivity. We report mobile phone subscriber units in two categories: postpaid and prepaid. Prepaid mobile phone subscriber units are considered active for a period of 90 days following the expiry of the subscriber’s prepaid balance.
Mobile connected device subscriber unit is comprised of a recurring revenue generating portable unit (e.g. tablets, wearables, mobile Internet devices and IoT) on an active service plan, that has access to our wireless networks and is intended for limited or no cellular voice capability.
Wireline subscriber unit consists of an active revenue-generating unit with access to our services, including retail Internet, IPTV, and/or residential NAS. A subscriber is included in our subscriber base when the service has been installed and is operational at the customer premise and a billing relationship has been established.
• Retail Internet and IPTV subscribers have access to stand-alone services, and are primarily represented by a dwelling unit or a business location
• Retail residential NAS subscribers are based on a line count and are represented by a unique telephone number | |
| BCE INC. 2025 ANNUAL FINANCIAL REPORT | 113 |
12 MD&A Effectiveness of internal controls
| 12 | Effectiveness of internal controls |
Disclosure controls and procedures
Our disclosure controls and procedures are designed to provide reasonable assurance that information required to be disclosed by us in reports filed or submitted under Canadian and U.S. securities laws is recorded, processed, summarized and reported within the time periods specified under those laws, and include controls and procedures that are designed to ensure that the information is accumulated and communicated to management, including BCE’s President and CEO and EVP and Chief Financial Officer (CFO), to allow timely decisions regarding required disclosure.
As at December 31, 2025, management evaluated, under the supervision of and with the participation of the CEO and the CFO, the effectiveness of our disclosure controls and procedures, as defined in Rule 13a-15(e) under the U.S. Securities Exchange Act of 1934, as amended, and under National Instrument 52-109 – Certification of Disclosure in Issuers’ Annual and Interim Filings.
The CEO and CFO of BCE Inc. have limited the scope of their design and evaluation of our disclosure controls and procedures to exclude the disclosure controls and procedures of Ziply Fiber, which we
acquired on August 1, 2025, to the extent such disclosure controls and procedures are subsumed by internal control over financial reporting. The contribution of Ziply Fiber operations to our consolidated financial statements for the year ended December 31, 2025 was approximately 2% of consolidated revenues and (1%) of consolidated net earnings. Additionally, at December 31, 2025, the current assets and current liabilities of Ziply Fiber represented approximately 2% and 2% of our consolidated current assets and current liabilities, respectively, and the non-current assets and non-current liabilities of Ziply Fiber represented approximately 12% and 1% of our consolidated non-current assets and non-current liabilities, respectively. The design and evaluation of the disclosure controls and procedures of Ziply Fiber will be completed for the third quarter of 2026. Further details related to the acquisition of Ziply Fiber are disclosed in Note 4, Business acquisitions and disposition, in BCE’s 2025 consolidated financial statements.
Based on that evaluation, which excluded the disclosure controls and procedures of Ziply Fiber, the CEO and CFO concluded that our disclosure controls and procedures were effective as at December 31, 2025.
Internal control over financial reporting
Management is responsible for establishing and maintaining adequate internal control over financial reporting, as defined in Rule 13a-15(f) under the U.S. Securities Exchange Act of 1934, as amended, and under National Instrument 52-109. Our internal control over financial reporting is a process designed under the supervision of the CEO and CFO, and effected by the Board, management and other personnel of BCE, to provide reasonable assurance regarding the reliability of financial reporting and the preparation of financial statements for external purposes in accordance with IFRS Accounting Standards as issued by the IASB. However, because of its inherent limitations, internal control over financial reporting may not prevent or detect misstatements on a timely basis.
Management evaluated, under the supervision of and with the participation of the CEO and the CFO, the effectiveness of our internal control over financial reporting as at December 31, 2025, based on the criteria established in Internal Control – Integrated Framework (2013) issued by the Committee of Sponsoring Organizations of the Treadway Commission (COSO). The CEO and CFO have limited the scope of their design and evaluation of our internal control over financial reporting to exclude the internal control over financial reporting of Ziply Fiber, as further discussed in Management’s report on internal control over financial reporting.
Based on that evaluation, which excluded the internal control over financial reporting of Ziply Fiber, the CEO and CFO concluded that our internal control over financial reporting was effective as at December 31, 2025.
Changes in internal control over financial reporting
No changes were made in our internal control over financial reporting during the year ended December 31, 2025 that have materially affected, or are reasonably likely to materially affect, our internal control over financial reporting.
| 114 | BCE INC. 2025 ANNUAL FINANCIAL REPORT |