|
|
SECURITIES AND EXCHANGE COMMISSION
|
Washington, D.C. 20549
FORM 10-K
þ ANNUAL REPORT PURSUANT TO SECTION 13 OR 15(d)
OF THE SECURITIES EXCHANGE ACT OF 1934
For the fiscal year ended December 31, 2013
o TRANSITION REPORT PURSUANT TO SECTION 13 OR 15(d)
OF THE SECURITIES EXCHANGE ACT OF 1934
Commission file number 001-09335

SCHAWK, INC.
(Exact name of Registrant as specified in its charter)
|
Delaware
|
66-0323724
|
|
|
(State or other jurisdiction of
|
(I.R.S. Employer
|
|
|
incorporation or organization)
|
Identification No.)
|
|
|
1695 South River Road
|
||
|
Des Plaines, Illinois
|
60018
|
|
|
(Address of principal executive office)
|
(Zip Code)
|
(Registrant’s telephone number, including area code)
Securities registered pursuant to Section 12 (b) of the Act:
|
Title of Each Class
|
Name of Exchange on Which Registered
|
|
Class A Common Stock, $0.008 par value
|
New York Stock Exchange
|
Indicate by check mark if the registrant is a well-known seasoned issuer, as defined in Rule 405 of the Securities Act. Yes o No ý
Indicate by check mark if the registrant is not required to file reports pursuant to Section 13 or Section 15(d) of the Act. Yes o No ý
Indicate by check mark whether the registrant (1) has filed all reports required to be filed by Section 13 or 15(d) of the Securities Exchange Act of 1934 during the preceding 12 months (or for such shorter period that the registrant was required to file such reports), and (2) has been subject to such filing requirements for the past 90 days. Yes ý No o
Indicate by check mark whether the registrant has submitted electronically and posted on its corporate website, if any, every Interactive Data File required to be submitted and posted pursuant to Rule 405 of Regulation S-T (§229.405 of this chapter) during the preceding 12 months (or for such shorter period that the registrant was required to submit and post such files). Yes ý No o
Indicate by check mark if disclosure of delinquent filers pursuant to Item 405 of Regulation S-K is not contained herein, and will not be contained, to the best of registrant’s knowledge, in definitive proxy or information statements incorporated by reference in Part III of this Form 10-K or any amendment to this Form 10-K. o
Indicate by check mark whether the registrant is a large accelerated filer, an accelerated filer, a non-accelerated filer or a smaller reporting company: See the definitions of “large accelerated filer,” “ accelerated filer” and “smaller reporting company” in Rule 12b-2 of the Exchange Act. (Check one):
Large accelerated filer o Accelerated filer ý Non- accelerated filer o Smaller reporting company o (Do not check if a smaller reporting company)
Indicate by check mark whether the registrant is a shell company (as defined in Rule 12b-2 of the Securities Act). Yes o No ý
The aggregate market value on June 30, 2013 of the voting and non-voting common equity stock held by non-affiliates of the registrant was approximately $128,161,418. The number of shares of the Registrant’s Common Stock outstanding as of February 26, 2014 was 26,217,667.
Documents Incorporated by Reference
Portions of the proxy statement for the Registrant’s 2014 Annual Meeting of Stockholders are incorporated by reference into Part III of this Form 10-K.
SCHAWK, INC.
FORM 10-K ANNUAL REPORT
DECEMBER 31, 2013
General
Schawk, Inc. and its subsidiaries (“SGK” or the “Company”) provide comprehensive brand development and brand deployment services to clients primarily in the consumer packaged goods, retail and life sciences markets. The Company creates and sells its clients’ brands, produces brand assets and protects brand equities to help clients drive brand performance. The Company currently delivers its services through more than 155 locations in over 20 countries across North and South America, Europe, Asia and Australia. The Company, headquartered in Des Plaines, Illinois, has been in operation since 1953 and is incorporated under the laws of the State of Delaware.
The Company believes that it is uniquely positioned to deliver these services to the marketplace. Aligned with this, the Company recently modified its market-facing naming convention to that of its ticker symbol, SGK. The Company’s Brand Development group includes Brandimage and Anthem, each of whom creates brand desirability to help clients drive topline growth. The Brand Deployment group delivers the Company’s legacy premedia expertise and efficiency to help clients improve their bottom line and is marketed under the Schawk! brand. By offering both brand development and brand deployment services to the marketplace, the Company can help its clients drive better overall brand performance.
Brandimage is a global consultancy comprised of brand equity architects and designers that creates brands that drive brand performance. Brandimage creates brand meaning and brand desirability, bringing brands “to the shelf.” Creating brand meaning refers to the creation of a brand’s story, which is built on a fundamental emotional consumer truth and expressed strategically, visually, verbally and structurally in the form of a singularly distinctive identity system. This service encapsulates the development of the intellectual property that define a brand as unique, such as its logo, colors, font and graphics. The services offered by Brandimage also include semiotic analysis, design and trend auditing ethnography, equity definition research, meaning perception research, brand positioning, brand meaning/purpose definition, brand architecture, design strategy, innovation strategy and visual positioning.
Anthem is a global creative agency that actively connects brands with consumers by amplifying desirability from package design to brand campaign; from “the shelf out.” Anthem’s services help drive brand performance by creating consumer desire and making emotional connections that inspire action. Anthem activates brands by expressing the brand’s meaning and its visual and verbal identity strategically and consistently across media channels such as packaging, advertising, web, social, mobile and print. The services offered by Anthem also include brand strategy, brand architecture, brand portfolio, design strategy, design, and research and insights.
Schawk! is a global cross-media production services provider that produces brand assets and protects brand equities to help make brands more profitable. Leveraging its more than 60 years of industry experience, Schawk! identifies and deploys scalable solutions to address a brand's complex production and delivery needs through proven expertise in workflow, resourcing, color management and imaging. The services offered by Schawk! focus on packaging, point of purchase/point of sale, digital, catalog, photography, advertising, circulars, direct mail, video, marketing collateral, continuous improvement and outsourcing. The Company owns and markets BLUE™, a cloud-based software platform that delivers a set of global capabilities to help brand-driven organizations control and manage brand development and brand deployment assets and activities to drive brand performance. The Company also owns and markets ColorDrive, print quality management software that is the first product of its kind to align measured and calibrated visual scores of color throughout the packaging development supply chain process to help brand driven organizations achieve color consistency for their brand colors worldwide.
The Company’s clients currently include approximately 20 percent of the Fortune 100 companies and approximately 10 percent of the Fortune 500 companies. These clients select SGK for its comprehensive brand development and/or brand deployment services as they seek to grow their topline through brand development and improve their bottom line by deploying their branding and marketing strategies on a global scale. The Company believes its clients are increasingly choosing to outsource their brand development and brand deployment needs to it for a variety of reasons, including the Company’s:
|
·
|
ability to service clients’ brand development and brand deployment requirements throughout the world;
|
|
·
|
rapid turnaround and delivery times;
|
|
·
|
comprehensive, up-to-date knowledge of the print specifications and capabilities of converters and printers located throughout the world;
|
|
·
|
high quality brand and design strategy and creative capabilities with integrated production art expertise;
|
|
·
|
consistent reproduction of brand equities across multiple packaging and promotional media;
|
|
·
|
global graphics process management technology;
|
|
·
|
efficient workflow management resulting in globally competitive overall cost to the client.
|
The Company’s Americas segment includes all of the Company’s operations located in North and South America, including its operations in the United States, Canada, Mexico and Brazil, its U.S. branding and design capabilities and its U.S. digital solutions business. Americas is the dominant segment with approximately 75 percent of consolidated revenues as of December 31, 2013. The Company’s Europe reportable segment includes all operations in Europe, including its European brand development capabilities and its digital solutions business in London. The Company’s Asia Pacific reportable segment includes all operations in Asia and Australia, including its Asia Pacific brand development capabilities.
Brand Performance
Brand Performance is an approach to brands and branding that recognizes the relationship between brand and business. It incorporates the cognitive, emotional, behavioral and financial nature of brands. Brand Performance has been developed in view of the changes in the marketplace-fragmented markets and media, the increasing power of the consumer, the rising importance of social media, the evolving role of shoppers and the changing nature of branding and brand management.
The core components of Brand Performance – for both activity and measurement – are Desirability and Profitability. While each of these measurements has distinct characteristics, the dynamic combination of the two is necessary to drive Brand Performance.
Desirability. Desirability represents the source of influence of a brand. Brands that add value to a product, tell a story about the buyer, or situate consumption on a hierarchy of intangible values, provide meaning for interest and consumption. Desirability makes consumers feel more passionate and involved in brands, because of what it does for them, and for their lives.
To achieve Desirability, brand owners must first understand a brand’s core meaning, or its brand truth. Brandimage helps marketers create this truth and Anthem helps them amplify it in the marketplace.
The foundation of Desirability resides in clearly defining the brand truth. A brand’s truth is composed of where it is right now (brand reality) and where it seeks to go (brand ambition). Getting this right is what makes brands successful. Clarity on the brand’s reality and its ambition informs all other aspects of the brand’s market-facing presence and creates a distinct roadmap for how it will evolve to achieve its ultimate ambitions.
Profitability. Profitability is defined as the ability of the brand owner to effectively and efficiently deliver consumer experiences that drive brand Desirability. The Company’s focus is on consistently and efficiently delivering the brand’s Desirability regardless of scale (amount of work, number of SKUs), complexity (diversity of media) or geography. Profitability in this context is a combination of brand appreciation, executional excellence and process efficiencies. Schawk! helps marketers drive brand profitability.
There is a keen understanding that the role of the medium is to simply deliver a expression of a clearly articulated message. The medium never overrides or supplants the brand truth, but rather exploits the medium’s unique attributes to reinforce the brand’s story. Profitability results from a delicate balance among time, resources and effort. Once a brand’s Desirability has been optimized and streamlined across media, it can deliver significant efficiencies and opportunities for improved profitability to the brand’s owners.
Graphic Services Industry
Industry services. The Company’s principal industry, premedia graphic services, includes the tasks involved in creating, manipulating and preparing tangible images and text for reproduction to exact specifications for a variety of media, including packaging for consumer products, point-of-sale displays, other promotional and/or advertising materials, and the internet. Packaging for consumer products encompasses folding cartons, boxes, trays, bags, pouches, cans, containers, packaging labels and wraps. Graphic services do not entail the actual printing or production of such packaging materials, but rather include the various preparatory steps such as art production, color separation and plate manufacturing services. While graphic services represent a relatively small percentage of overall product packaging and promotion costs, the visual impact and effectiveness of product packaging and promotions are dependent in part upon the quality of the graphic services that support the reproduction of the design on physical substrates or in online environments. These services assure the clarity and fidelity of images, the accuracy of text and the consistency of color.
Size of industry. The global graphic services industry has thousands of market participants, including independent premedia service providers, converters, printers and, to a lesser extent, advertising agencies. Most graphic services companies focus on publication work such as textbooks, advertising, catalogs, newspapers and magazines. The Company’s target markets, however, are high-end packaging, advertising and promotional applications for the consumer products, retail and life sciences industries. The Company believes the market for graphic services including publishing, advertising and promotional as well as packaging applications in North America may be as high as $8.0 billion and worldwide may be as high as $30.0 billion. Within the consumer products graphic industry, the market is highly fragmented with thousands of limited service partners, of which we believe only a small number of which have annual revenues exceeding $20.0 million.
While the cost of technology has reduced some of the barriers to entry in relation to equipment costs, the demand for expertise, systems, speed, consistency, accuracy and dependability that is scalable and can be delivered locally, regionally and globally has created a different and expanded set of entry barriers. As a result, the Company believes new start-ups have difficulty competing with it. Other barriers to entry include expanded restrictions and compliance requirements brought about by varying governmental regulations related to consumer products packaging, increasing customization demands of retailers, certainty of supply and many clients’ preference for established firms with a global reach. The Company believes that the number of graphic services providers to the consumer products industry will continue to diminish due to consolidation and attrition caused by competitive forces such as accelerating technological requirements for advanced systems, the need for highly skilled personnel and the growing demands of clients for full-service knowledge based regional and global capabilities.
Graphic services for consumer products companies. High quality graphic services are critical to the effectiveness of any consumer products’ marketing strategy. A strategic, creative or executional change in the graphic image of a package, advertisement or point-of-sale promotional display can dramatically increase sales of a particular product. New product development has become a vital strategy for consumer products companies, which introduce thousands of new products each year. In addition to introducing new products, consumer products companies are constantly redesigning their packaging, advertising and promotional materials for existing products to respond to rapidly changing consumer tastes (such as the fat or carbohydrate content of foods), current events (such as major sports championships and blockbuster film releases), changing regulatory requirements and consumer desire for greater personalization and customization on a mass scale. The speed and frequency of these changes and events have led to increased demand for shorter turnaround and delivery time between the creative design phase and the distribution of packaged products and related advertising and promotional materials that promote them. Moreover, the demand for global brand equity consistency between visuals and copy across media – a product package, point of sale, advertisement out of home advertising and more recently online media – continues to accelerate. The Company believes that all of these factors lead consumer products and retail companies to seek out larger graphics services companies capable of driving brand performance with a geographic reach that will enable them to brand their products more meaningfully, bring their brands to market more efficiently and amplify their brand’s truth more effectively in the marketplace.
Graphic services for consumer product packaging, whether it is an over-the-counter product on drug store shelves, a private label product on grocery store shelves, or a national food or beverage brand on discount retailers’ shelves, present specific challenges. Packaging requirements for consumer products are complex and demanding due to variations in package materials, shapes, sizes, substrates, custom colors, storage conditions, expanding regulatory requirements and marketing objectives. An ever-increasing number of stock-keeping units, or SKUs, compete for shelf space and market share, making product differentiation essential to our clients. In recent years consumer products companies have redirected significant portions of their marketing budgets toward package design and point-of-sale media as they recognize the power of point-of-sale marketing on consumer buying behavior. Because premedia services represent only a small portion (estimated to be less than 10 percent) of the overall cost of consumer products packaging, changes to the design have only a modest impact on overall costs. Recognizing this high benefit/low cost relationship and the continuous need to differentiate their offerings, consumer products companies change package designs frequently as part of their core marketing strategy.
Factors driving increased demand for our brand development and deployment services. Rapidly changing consumer tastes, shifting marketing budgets, the need for product differentiation, changing regulatory requirements, the relative cost-effectiveness of packaging redesign and other factors continue to drive increases in the volume and frequency of package design modifications. Additionally, progressive grocery retailers continue to develop private label brands, activate them in the marketplace and optimize their brand portfolios. As grocery and other retailers become more sophisticated marketers, the Company believes they are increasingly recognizing the benefit of SGK’s offering.
Our Services
SGK’s offerings include brand development and brand deployment services related to four core competencies: graphic services, brand and package strategy and design, digital promotion and advertising, and software. Graphic services, brand strategy and design and digital promotion and advertising represented approximately 96 percent of the Company’s revenues in 2013, with software sales representing the remaining 4 percent.
Graphic services. Under the Schawk! brand, the Company creates brand assets (photography and the retouching of photography) and protects brand equities (premedia, color management and graphics process and asset management). Graphic service operations are located throughout Americas, Europe and Asia.
Brand strategy and design services. Under the Brandimage and Anthem brands, the Company offers brand strategy and design for applications to consumer products companies, food and beverage retailers and mass merchandisers. While Brandimage creates brand meaning and Anthem amplifies that meaning in the marketplace, packaging design is a core capability of both. Brandimage is also known in the industry for its expertise in both retail environmental design and luxury branding. Anthem’s design capabilities span across a broader range of media with a specialized competency in digital media. Brandimage has offices in Chicago, Cincinnati, Hong Kong, Paris, Shanghai and Singapore. Anthem has offices in Atlanta, Brussels, Cincinnati, Hilversum, London, Melbourne, New Jersey, New York, San Francisco, Shanghai, Singapore, Sydney, Tokyo, and York (UK).
Digital media services. Under the Anthem brand, the Company offers digital media services in the United Kingdom and North American regions, which enables the Company to provide strategic, creative and technical services to the rapidly expanding world of social media and the deliverables it requires (ads, videos, images, etc.) As product manufacturers and retailers continue to use social media to engage with their consumers, SGK has invested in digital talent and capabilities to enhance the digital advertising capabilities it offers its clients today.
Software. Services that help differentiate SGK from its competitors are its software products that include graphic process management systems for brands that are comprised of digital asset management, workflow management, online proofing and intelligence performance management modules. These products are supported by services that include implementation, on-site management, validation for highly regulated environments, and support and training. SGK offers these products and services through Schawk Digital Solutions (“SDS”), its digital solutions subsidiary, a software development company that develops software solutions for the marketing services departments of consumer products companies, pharmaceutical/life sciences companies and retail companies. Since 2009, SDS has implemented for a number of clients an innovative Copy Management System that serves as a “single source of truth” for all copy and automates its placement on packaging mechanicals, simplifying complex workflows, improving time to market and reducing the risks that incorrect labeling presents to its clients. Through its integrated software solution, BLUE™, SDS works with clients to organize their digital assets, streamline their internal workflow, improve efficiency and accuracy, reduce waste, and help clients meet the requirements of regulatory bodies globally. The improved speed to market allows consumer products companies to increase the number of promotions without increasing costs. SGK’s software products are supported with managed services, asset optimization, implementation and support and training for clients.
To capitalize on market trends, management believes the Company must continue to provide clients with the ability to make numerous changes and enhancements while delivering additional value directed at meeting the expanded needs of its clients within increasingly shorter turnaround times. Accordingly, the Company focuses its efforts on improving its response times and continues to invest in rapidly emerging technology and the continuing education of its employees. The Company also educates its clients on the opportunities and complexities of state-of-the-art equipment and software. For example, the Company has anticipated the need to provide services to comply with expanded regulatory requirements related to proposed regulations regarding food, beverage and product safety. The Company believes that its ability to provide quick turnaround, expanded services and delivery times, dependability and value-added training and education programs will continue to give it a competitive advantage in serving clients who require high volume, high quality product imagery.
Over the course of our business history, the Company has developed strong relationships with many of the major converters and printers in the United States, Canada, Europe and Asia. As a result, the Company has compiled an extensive proprietary database containing detailed information regarding the specifications, capabilities and limitations of printing equipment in the markets it serves around the world. This database enables it to increase the overall efficiency of the printing process. Internal operating procedures and conditions may vary from printer to printer, affecting the quality of the color image. In order to minimize the effects of these variations, the Company makes necessary adjustments to the color separation work to account for irregularities or idiosyncrasies in the printing presses of each of the clients’ converters. The Company’s database also enhances its ability to ensure the consistency of its clients’ branding strategies. The Company strives to afford its clients total control over their imaging processes with customized and coordinated services designed to fit each individual client’s particular needs, all aimed at ensuring that the color quality, accuracy and consistency of a client’s printed matter are maintained.
Summary financial information for continuing operations by significant geographic area is contained in Item 8, Note 18 – Segment and Geographic Reporting to the Company’s consolidated financial statements.
Competitive Strengths
The Company believes that the following factors have been critical to its past success and represent the foundation for future growth:
The Company is a leader in a highly fragmented market. The Company is one of the world’s largest independent suppliers of integrated brand development and deployment services. There are thousands of independent market participants in its industry in the Americas and the vast majority of these are single-location, small niche firms with annual revenues of less than $20.0 million. The Company believes that its size, expertise, breadth of services and global presence represent a substantial competitive advantage in its industry.
The Company has direct client relationships. While many participants in the graphic services industry serve only intermediaries such as advertising firms and printers, the Company typically maintains direct relationships with its clients. As part of this focus on direct client relationships, the Company also deploys employees on-site at and near client locations, leading to faster turnaround and delivery times and deeper, longer-lasting client relationships. At December 31, 2013, the Company had approximately 110 sites at or near client locations staffed by approximately 400 SGK employees. The Company’s direct client relationships enable it to strengthen and expand client relationships by better and more quickly anticipating and adapting to clients’ needs.
The Company has a comprehensive service offering. The Company provides its clients with a comprehensive offering of integrated brand development and deployment services. The Company has built upon its core premedia (deployment) services by acquiring and integrating high value/high margin services such as brand strategy and design, creative services and workflow management software and services. In addition to generating more revenue, the increased breadth of its service offering enables it to manage brands through the development process (branding and design) and the deployment process (premedia). Additionally, as a result of recent investments, consistent with its strategy of capitalizing on its expertise in developing and deploying brands for clients across multiple mediums, the Company offers digital media services (including but not limited to social media), an area where the Company’s clients are increasingly shifting their marketing dollars.
The Company has unique global capabilities. The Company has more than 155 locations in over 20 countries across 5 continents. The Company has combined this global platform with its proprietary databases of printer assets across the world, ensuring that the Company provides consistent premedia services to clients on a local, regional and global basis. This enables the Company to protect brand equities and their financial value by delivering brand consistency as clients expand into markets, extend their brand platforms and engage with consumers in new media. It also allows us to nimbly scale up or down based on the needs of our clients at any particular time.
The Company generates strong cash flow. The Company has a history of generating strong cash flow through profitable growth in operating performance and a strong financial discipline. The Company has been able to manage its costs efficiently, address prevailing market conditions and avoid dependence on revenue growth to maintain or increase profitability. Also, historically, the Company has had only a modest need for maintenance capital investment. The Company believes that these factors should enable it to continue to generate strong cash flow.
Strategy
The Company seeks to enhance its leadership position in the graphic services industry. Its strategies to realize this objective include:
Capitalizing on our enhanced platform. The Company seeks to capitalize on the breadth of its services and its global presence. The Company’s dedicated business development team emphasizes the Company’s ability to tailor integrated solutions on a global scale to meet its clients’ specific needs. Its brand performance approach provides opportunities to expand service offerings to existing clients and provide global representation to clients previously using the Company’s services only in a single market.
Matching our services to the needs of our clients. The Company’s clients continually create new products and seek to extend and enhance their existing brands while maximizing brand equity consistency across the regions in which they sell their products, whether these regions are local, regional or global in nature. The Company matches its service offerings to meet its clients’ needs and, where necessary, adapt services as their needs change and grow. The Company’s adaptability is exemplified by its ability to scale its service offerings, shift employees among its locations to address surges in a client’s promotional activity, and originate services from additional global locations based on changes in a client’s global branding strategy. As the Company’s clients expand their use of digital mediums for communicating with their customers and consumers, the Company’s Anthem brand helps position the Company to be able to provide services across the rapidly growing digital communication mediums in the United Kingdom and United States.
Pursuing acquisitions opportunistically. Where opportunities arise and in response to emerging client trends, the Company seeks strategic acquisitions of selected businesses to broaden its service offerings, enhance its client base or build a new market presence. The Company believes that there will continue to be a number of attractive acquisition candidates in the fragmented and consolidating industry in which the Company operates. As discussed under “Management’s Discussion and Analysis of Financial Condition and Results of Operation – Liquidity and Capital Resources,” the Company’s current credit facility contains covenants that may limit its ability to make significant acquisitions.
Acquisitions
Since 1965, the Company has integrated approximately 60 graphic imaging, creative and design businesses into its operations, ranging in size from $2 million to $370 million in revenue. The Company typically has sought to acquire businesses that represent market niche companies with Fortune 1000 client lists, excellent client services or proprietary products, solid management and/or offer the opportunity to expand into new service or geographic markets.
The Company’s acquisitions during the last five years are noted below:
|
·
|
Effective October 19, 2011, the Company acquired substantially all of the assets of Lipson Associates, Inc. and Laga, Inc., which does business as Brandimage – Desgrippes & Laga (“Brandimage”). Brandimage is a leading independent branding and design network specializing in providing services that seek to engage and enhance the brand experience, including brand positioning and strategy, product development and structural design, package design and environmental design.
|
|
·
|
Effective November 10, 2010, the Company acquired Real Branding LLC, a United States-based digital marketing agency. Real Branding provides digital marketing services to consumer product and entertainment clients through its location in Chicago.
|
|
·
|
Effective September 17, 2010, the Company acquired the operating assets of Untitled London Limited, a United Kingdom-based agency that provides strategic, creative and technical services for digital marketing.
|
As discussed under “Management’s Discussion and Analysis of Financial Condition and Results of Operation – Liquidity and Capital Resources,” the Company’s current credit facility contains covenants that may limit its ability to make acquisitions.
Marketing and Distribution
The Company markets its services nationally and internationally through its website, social media, media engagement and highly focused marketing programs, targeted at existing and potential clients. The Company sells its services through a group of approximately 200 direct salespersons who call on consumer products manufacturers, including but not limited to those in the food and beverage, home products, and cosmetics industries, retailers and life sciences companies. The Company’s business development group and client engagement representatives share responsibility with the Company’s marketing department for marketing its offerings to existing and potential clients, thereby fostering long-term institutional relationships with our clients.
Clients
The Company’s clients consist of direct purchasers of graphic services, including end-use consumer product manufacturers in numerous categories such as food & beverage, personal care and household goods; retailers and e-tailers in categories such as mass merchandise, drugstore chain, warehouse clubs and specialty stores; and life sciences companies in categories such as medical devices, over-the-counter products and biotechnology. The Company’s clients also include to a lesser extent, converters and some advertising agencies.
Many of our clients, a number of whom are Fortune 1000 companies, have global operations and often use numerous converters both domestically and internationally. Because these clients desire uniformity of color and image quality across a variety of media, the Company plays a very important role in coordinating their printing activities by maintaining current equipment specifications regarding its clients and converters. Management believes that this role has enabled it to establish closer and more stable relationships with these clients. Converters have worked closely with the Company to reduce required lead-time, thereby lowering their costs. End-use clients often select and use SGK to ensure better control of their packaging or other needs and depend on Schawk! to act as their agent to ensure quality management of data along with consistency among numerous converters and packaging media. SGK has established approximately 110 on-site locations at or near clients that require high volume, specialized service. As its art production services continue to expand, the Company anticipates that it will further develop its on-site services.
Many clients purchase from SGK on a daily and weekly basis and work closely with it year-round as they frequently redesign product packaging or introduce new products. While certain promotional activities are seasonal, such as those relating to summer, back-to-school time and holidays, shorter technology-driven graphic cycle time has enabled consumer products manufacturers to tie their promotional activities to regional and/or current events (such as sporting events or motion picture releases). This prompts manufacturers to redesign their packages more frequently, resulting in a correspondingly higher number of packaging redesign assignments. This technology-driven trend toward more frequent packaging changes has offset previous seasonal fluctuations in the volume of SGK’s business. See “Seasonality and Cyclicality”.
Changes in regulatory requirements for packaging and food and product safety around the world also drive client activity at any given time. The requirements are often complex, the scope is often global in scale, the volume of components impacted is significant, the phased deadlines are fixed with the prospect of significant fines and potential legal issues for manufacturers that do not comply in accordance with federal directives. The regulatory requirements prompt manufacturers to redesign their packages at the same time, resulting in both more packaging design assignments and more premedia work for the Company.
In addition, consumer product manufacturers have a tendency to single-source their graphic work with respect to a particular product line so that continuity can be assured in changes to the product image. As a result, the Company developed a base of steady clients in the food and beverage, health and beauty and home care industries. In 2013 and 2012, its largest client accounted for approximately 9.9 percent and 8.1 percent of the Company’s total revenues, respectively. In 2013 and 2012, the 10 largest clients by sales in the aggregate accounted for approximately 48.4 percent and 46.9 percent of revenues, respectively.
Competition
Regarding production services, the Company’s competition comes primarily from other graphic service providers and converters and printers that have graphic service capabilities. The Company believes that converters and printers serve approximately one-half of its target market, and the other one-half is served by independent graphic service providers. Independent graphic service providers are companies whose business is performing graphic services for one or more of the principal printing processes. The Company believes that only two firms – Southern Graphics Systems and Matthews International Corporation – compete with it on a fully national or international basis in certain markets. The remaining independent graphic service providers are regional or local firms that compete in specific markets. To remain competitive, each firm must maintain client relationships and recognize, develop and capitalize on state-of-the-art technology and contend with the increasing demands for speed. These groups are primarily focused on traditional graphic services activities, while the Company continues to expand into adjacent activities to capitalize on trends, while managing risk of technology changes by moving into other mediums.
Regarding brand and packaging strategy, and creative design for print and digital work, competition currently comes from a variety of suppliers. However, the Company is not aware of any competitors who offer, on a global basis, the breadth or array of services that SGK does, from brand development through brand deployment. Most competitors focus on one or the other, providing half the value.
Some printers with graphic service capabilities compete with Schawk! by performing such services in connection with printing work. Independent graphic service providers, such as Schawk! however, may offer greater technical capabilities, image quality control and speed of delivery. In addition, printers often utilize the Company’s services because of the rigorous demands being placed on them by clients who are requiring faster turnaround times. Increasingly, printers are being required to invest in technology to improve speed in the printing process and have avoided spending on graphic services technology.
As requirements of speed, consistency and efficiency on a global scale continue to be critical, along with the recognition of the importance of focusing on their core competencies, the Company believes clients have increasingly recognized that SGK provides services at a rate and cost that makes outsourcing more cost effective and efficient.
Research and Development
The Company is dedicated to keeping abreast of and, in a number of cases, initiating technological process developments in its industry that have applications for a variety of purposes including, but not limited to, speed. The Company is actively involved in system and software technical evaluations of various computer systems and software manufacturers and also independently pursues software development for implementation at its operating facilities. The Company continually invests in new technology designed to support its high quality graphic services. The Company concentrates its efforts in understanding systems and equipment available in the marketplace and creating solutions using off-the-shelf products customized to meet a variety of specific client and internal requirements. BLUE™ and ColorDrive capabilities are examples of SGK’s commitment to research and development.
As an integral part of our commitment to research and development, the Company supports its internal Technical Advisory Board, as it researches and evaluates new technologies in the graphic arts and telecommunications industries. This board meets quarterly to review new equipment and programs, and then disseminates the information to the entire Company and to clients as appropriate.
Employees
As of December 31, 2013, SGK had approximately 3,600 employees worldwide. Of this number, approximately 7 percent are production employees represented by local units of the Graphic Communications Conference of the International Brotherhood of Teamsters and by local units of the Communications, Energy & Paperworkers Union of Canada and the GPMU in the UK. The percentage of employees covered by union contracts that expire within one year is approximately 2 percent. The Company’s union and non-union employees are vital to its operations. SGK considers its relationships with its employees and unions to be good.
Backlog
The Company does not maintain backlog figures as the rapid turn-around requirements of its clients result in little backlog. Basic graphic service projects are generally in and out of its facilities in five to seven days. More complex projects and orders are generally in and out of its facilities within two to four weeks. Approximately one-half of total revenues are derived from clients with whom the Company has entered into agreements that generally have terms of between one year and five years in duration. With respect to revenues from clients that are not under contract, SGK maintains client relationships by delivering timely graphic services, providing technology enhancements to make the process more efficient and bringing extensive experience with and knowledge of printers and converters.
Seasonality and Cyclicality
The Company’s business for the consumer product packaging graphic market is not currently seasonal because of the number of design changes that are able to be processed as a result of speed-to-market concepts and all-digital workflows. As demand for new products has increased, traditional cycles related to timing of major brand redesign activity have gone from a three to four year cycle to a much shorter cycle. With respect to the advertising markets, some seasonality has historically existed in that the months of December and January were typically the slowest months of the year in this market because advertising agencies and their clients typically finish their work by mid-December and do not start up again until mid-January. In recent years, late summer months have seen a slowdown brought about primarily as a result of SGK’s ability to turn work more efficiently and the holiday schedules of its client base. With respect to the fourth quarter, this seasonality in SGK’s business is expected to be offset by the increase in holiday-related business with respect to the retail portion of its business in the United States. Advertising spending is generally cyclical as the consumer economy is cyclical. When consumer spending and GDP decreases, advertising and marketing activity is often reduced or changed. As an example, this may result in fewer advertising and/or marketing campaigns and/or the reduction in print and broadcast media ads and the redeployment to online programs.
Purchasing and Raw Materials
The Company purchases photographic film and chemicals, storage media, ink, paper, plate materials and various other supplies and chemicals on consignment for use in its business. These items are purchased from a variety of sources and are available from a number of producers, both foreign and domestic. In 2013, materials and supplies accounted for $16 million or approximately 5.9 percent of the Company's cost of services, and no shortages are anticipated. Furthermore, as a growing proportion of the workflow is digital, the already small percentage of cost of services attributable to material costs is expected to decrease. Historically, the Company has negotiated and enjoys significant volume discounts on materials and supplies from most of its major suppliers.
Intellectual Property
The Company owns no significant patents. The trademarks “SGK,” “Schawk!,” “Schawk,” “Schawk Digital Solutions,” “Anthem!,” “Anthem,” “Anthem Worldwide,” “Brandimage,” “PaRTS,” “BLUE,” “BLUE DNA,” “ENVISION,” “MPX,” “MEDIALINK,” “MEDIALINK STUDIO,” “RPM (Retail Performance Manager),” “CPM (Campaign Performance Manager),” “BRANDSQUARE,” “AGT,” “APPLIED GRAPHICS TECHNOLOGIES,” and the trade names “Ambrosi,” “Anthem New Jersey,” “Anthem New York,” “Anthem Los Angeles,” “Anthem San Francisco,” “Anthem Toronto,” “Anthem Chicago,” “Anthem Singapore,” “Anthem Cincinnati,” “Anthem York,” “Schawkgraphics,” “Schawk Asia,” “Schawk Atlanta,” “Schawk Cactus,” “Schawk Canada,” “Schawk Cherry Hill,” “Schawk Chicago,” “Schawk Cincinnati 446,” “Schawk Cincinnati 447,” “Schawk Creative Imaging,” “Schawk Designer’s Atelier,” “Schawk India,” “Schawk Japan,” “Schawk Australia,” “Schawk Kalamazoo,” “Schawk Mexico,” “Schawk Milwaukee,” “Schawk Minneapolis,” “Schawk Los Angeles,” “Schawk San Francisco,” “Schawk UK Limited,” “Schawk New York,” “Schawk Penang,” “Schawk St. Paul,” “Schawk Toronto,” “Schawk Shanghai,” “Schawk Singapore,” “Schawk Stamford,” “Schawk 3D,” “Laserscan,” “Protopak,” “Seven,” “DJPA,” “Schawk Retail Marketing,” “Schawk Retail Marketing,” “Schawk Creative Solutions,” “Schawk Large Format,” “Schawk Prototypes,” “Winnetts,” “IDP (& Design),” “IDP,” “INNOVATION STREAM,” “LAGA (& Design),” “LAGA,” “LAGA LAB,” “MACROSCOPE,” “NAME STREAM,” “REAL BRANDING,” “RIGHT BRAND THINKING,” “TRENDENCIES,” “TRI LAB” and “NEURODESIGN” are the most significant trademarks and trade names used by the Company or its subsidiaries.
Available Information
The Company’s website is www.sgkinc.com, where investors can obtain copies of the Company’s annual reports on Form 10-K, quarterly reports on Form 10-Q, current reports on Form 8-K, and any amendments to those reports filed or furnished pursuant to Section 13(a) or 15(d) of the Securities Exchange Act of 1934, as amended, as soon as reasonably practicable after the Company has filed such materials with, or furnished them to, the SEC. The Company will also furnish a paper copy of such filings free of charge upon request.
The Company’s operating results can be adversely affected by economic conditions and events that adversely affect its clients’ spending decisions.
The Company’s revenues are derived from clients in a variety of industries and businesses, with consumer package goods (“CPG”) clients accounting for 86.8 percent of 2013 revenues. The Company’s clients, in particular its CPG clients, have product introduction, marketing and advertising spending levels that may significantly fluctuate or decline in reaction to changes in, among other things, competitive pressures, business and consumer confidence and spending, and economic conditions in the markets in which they sell their products or services. Accordingly, the Company’s operating results are sensitive to the effects that these changes have on its clients’ businesses. General economic or localized downturns or uncertainty in markets where the Company or its clients have operations or other circumstances that result in reductions in its clients’ investment in product introduction and innovation or marketing and advertising budgets can negatively impact the Company’s sales volume and revenues, its margins and its ability to respond to competition or to take advantage of business opportunities.
Prolonged weakness or uncertainty in global economic conditions and in the credit and capital markets and weak or stagnant consumer and business confidence can significantly impact the overall demand by clients for the Company’s services. As clients come under pressure or continue to operate in a weak or uncertain economic environment, it may result in, among other consequences, a further reduction in spending on the services that the Company provides, which could have a material adverse effect on its operating cash flows, financial condition or results of operations.
The Company’s business is subject to unpredictable order flows, which might cause its results to fluctuate significantly from period to period.
Although much of the Company’s revenue is derived from clients with whom the Company has contractual agreements ranging from one to five years in duration, individual assignments from clients under these contracts are on an “as needed”, project-by-project basis, with no minimum volume requirements. Additionally, the contracts are not exclusive and in certain circumstances may be terminated on short notice. Accordingly, depending on the level of activity from its clients, the Company can experience unpredictable order flows. While technological advances have enabled the Company to shorten considerably its production cycle to meet its clients’ increasing speed-to-market demands, the Company may in turn receive less advance notice from its clients of new projects or the cancellation, curtailment or postponement of anticipated or existing projects. Although the Company has established long-standing relationships with many of its clients and believes its reputation for quality service is excellent, the Company is not able to predict with certainty the volume of its business even in the near future and will remain susceptible to its client’s order patterns and unexpected fluctuations in client spending.
The Company operates in a highly competitive industry and if it does not continue to successfully compete, it could lose market share or fail to further grow its business.
The Company competes with other providers of graphic imaging, brand and packaging development and design services, and creative and advertising services. The market for these services is highly fragmented, with several national and many regional participants in the United States as well as in the foreign countries in which it operates. The Company faces, and will continue to face, competition in its business from many sources, including competitors that may have greater financial, marketing and other resources than the Company. In addition, local and regional firms specializing in particular markets compete on the basis of established long-term relationships or specialized knowledge of such markets. The introduction of new technologies also may create lower barriers to entry that may allow other firms to provide competing services.
It is possible that competitors will introduce services, products or technologies that achieve greater market acceptance than, or are technologically superior to, the Company’s current service offerings. The Company may be unable to continue to compete successfully, and increased competitive pressures may adversely affect its business, financial condition and results of operations.
The Company is dependent on a limited number of clients for a significant amount of its revenues, and the loss of, or significant reductions in business from, one or more key clients could have a material adverse effect on its revenues and results of operations.
In 2013 and 2012, the Company’s ten largest clients by revenue volume accounted for approximately 48.4 percent and 46.9 percent, respectively, of its revenues, and approximately 9.9 percent and 8.1 percent, respectively, of total revenues came from the Company’s largest single client. While the Company seeks to build long-term client relationships, revenues from any particular client may fluctuate from period to period due to such client’s purchasing patterns, which, with respect to the Company’s CPG clients, are driven by changes in their level of investment in brand enhancements, product introductions and product modifications. Additionally, the Company’s larger clients may seek to leverage their size to obtain more favorable pricing terms. Any termination of a business relationship with, or a significant sustained reduction in business received from, one or more of the Company’s principal clients could have a material adverse effect on the Company’s revenues and results of operations.
The Company may not realize expected benefits from its technology enhancement, cost reduction and capacity utilization initiatives.
In order to improve the efficiency of its operations, the Company implemented certain technology enhancement, cost reduction and capacity utilization activities in 2013 and in prior years, including workforce reductions and work site realignment, and has plans to continue these, or similar actions, throughout 2014 in order to achieve certain cost savings and to strategically realign its resources. The Company may not realize the expected cost savings or improve its operating performance as a result of its past, current and future cost reduction activities and technology enhancement initiatives. Certain technology enhancement initiatives, such as the Company’s ongoing initiative to improve its information technology and business process systems, contributed to an increase in the Company’s expenses in 2013 and likely will adversely impact expenses in 2014. The Company’s current and future cost reduction activities also could adversely affect its ability to retain key employees, the significant loss of whom could adversely affect its operating results. Further, as a result of its cost reduction activities, the Company may not have the appropriate level of resources and personnel to appropriately react to significant changes or fluctuations in its markets and in the level of demand for its services.
The Company may encounter difficulties arising from future acquisitions or consolidation efforts, which may adversely impact its business.
The Company has a history of making acquisitions and, over the past several years, has invested, and in the future may continue to invest, a substantial amount of capital in acquisitions. Acquisitions involve numerous risks, including:
|
|
·
|
inherent complexities and assumptions in valuing businesses to be acquired, such as customer and client relationships of acquired businesses;
|
|
|
·
|
difficulty in assimilating the operations and personnel of the acquired company with the Company’s existing operations and realizing anticipated synergies;
|
|
|
·
|
the loss of key employees or key clients of the acquired company;
|
|
|
·
|
difficulty in maintaining uniform standards, controls, procedures and policies; and
|
|
|
·
|
unrecorded liabilities of acquired companies that the Company failed to discover during its due diligence investigations.
|
The Company may be unable to realize the expected benefits from any future acquisitions or its existing operations may be harmed as a result of any such acquisitions. In addition, the cost of unsuccessful acquisition efforts could adversely affect its financial performance. The Company has undertaken consolidation efforts in the past in connection with its acquisitions, and in connection with any future acquisitions, the Company will likely undertake consolidation plans to eliminate duplicate facilities and to otherwise improve operating efficiencies. Any future consolidation efforts may divert the attention of management, disrupt the Company’s ordinary operations or those of its subsidiaries, result in charges and additional costs or otherwise adversely affect the Company’s financial performance.
Future acquisitions or organic growth also may place a strain on the Company’s financial and other resources. In order to manage future growth of its client services staff, the Company will need to continue to improve its operational, financial and other internal systems and incur expenses related to such improvements. If the Company’s management is unable to manage growth effectively or revenues do not increase sufficiently to cover its increased expenses, the Company’s results of operations could be adversely affected. The Company’s clients could shift a significant portion of their marketing and advertising dollars from print to online and digital environments at levels that exceed the Company’s current ability to deliver the online services they seek and in a manner that they require.
As digital media marketing and advertising opportunities continue to grow as a direct, measurable, and interactive way for the Company’s clients to reach consumers, companies continue to shift marketing dollars away from print to digital media environments. While the Company currently offers an array of services that seeks to meet its clients’ digital marketing and advertising needs, responding quickly, effectively and efficiently to client demand for more comprehensive interactive services might require further investment or the acquisition of additional talent or established interactive agencies. If the Company is unable to keep pace with or capitalize on these shifting marketing and advertising trends or if the Company’s clients perceive that the Company is not able to provide the comprehensive, digital, interactive services they seek, the Company’s business and revenues may be adversely affected.
The Company remains susceptible to risks associated with technological and industry changes, including risks based on the services it provides and may seek to provide in the future as a result of technological and industry changes.
The Company believes its ability to develop and exploit emerging technologies has contributed to its success and has demonstrated to its clients the value of using its services rather than attempting to perform these functions in-house or through lower-cost, reduced-service competitors. The Company believes its success also has depended in part on its ability to adapt its business as technology advances in its industry have changed the way graphics projects are produced. These changes include a shift from traditional production of images to offering more consulting and project management services to clients and, more recently, repositioning the Company in the marketplace to reflect the Company’s brand development and deployment services. Accordingly, the Company’s ability to grow will depend upon its ability to keep pace with technological advances, industry evolutions and client expectations on a continuing basis and to integrate available technologies and provide additional services commensurate with client needs in a commercially appropriate manner. Its business and operating results may be adversely affected if the Company is unable to keep pace with relevant technological and industry changes or if the technologies or business strategies that the Company adopts or services it promotes do not receive widespread market acceptance.
If the Company fails to maintain an effective system of disclosure and internal controls, it may not be able to accurately report its financial results and may incur substantial costs related to remediation of its internal controls.
In April 2008, the Company restated its 2006 and 2005 financial statements and its consolidated balance sheet at December 31, 2007 as a result of accounting errors that had been previously identified, and certain material weaknesses in the Company’s internal controls associated with those accounting errors as of December 31, 2007 and December 31, 2008 have since been remediated. If the Company were to determine that its previous material weaknesses were not properly rectified or fails to maintain the effectiveness of its internal controls, its operating results could be harmed and could result in further material misstatements in its financial statements. Inferior controls and procedures or the identification of additional accounting errors could cause the Company’s investors to lose confidence in its internal controls and question its reported financial information, which, among other things, could have a negative impact on the trading price of the Company’s stock, and subject the Company to increased regulatory scrutiny and a higher risk of stockholder litigation.
Additionally, the Company incurred significant costs in connection with remediating its former internal control weaknesses and may incur further significant costs to maintain and enhance its internal controls. There can be no assurances that it will not discover additional instances of significant deficiencies or material weaknesses in its internal controls and operations, which could have a further adverse effect on its financial results.
The Company’s operating results fluctuate from quarter to quarter, which may cause the value of its stock to decline.
The Company’s quarterly operating results have fluctuated in the past and may fluctuate in the future as a result of a variety of factors, many of which are outside of the Company’s control, including:
|
|
·
|
timing of the completion of particular projects or orders;
|
|
|
·
|
material reduction, postponement or cancellation of major projects, or the loss of a major client;
|
|
|
·
|
timing and amount of new business;
|
|
|
·
|
differences in order flows;
|
|
|
·
|
the effects of changing or stagnant economic conditions on its clients’ businesses;
|
|
|
·
|
the strength of the consumer products industry;
|
|
|
·
|
the relative mix of different types of work with differing margins;
|
|
|
·
|
costs relating to expansion or reduction of operations, including costs to integrate current and any future acquisitions;
|
|
|
·
|
changes in interest costs, foreign currency exchange rates and tax rates; and
|
|
|
·
|
costs associated with compliance with legal and regulatory requirements.
|
Because of this, fixed costs that are not in line with revenue levels may not be detected until late in any given quarter and operating results could be adversely affected. Due to these factors or other unanticipated events, the Company’s financial and operating results in any one quarter may not be a reliable indicator of its future performance.
Impairment charges have had and could continue to have a material adverse effect on the Company’s financial results.
The Company has recorded a significant amount of goodwill and other identifiable intangible assets, primarily customer relationships. Goodwill and other identifiable intangible assets were approximately $226 million as of December 31, 2013, or approximately 53 percent of total assets. Goodwill, which represents the excess of cost over the fair value of the net assets of the businesses acquired, was approximately $202 million as of December 31, 2013, or approximately 47 percent of total assets. Goodwill and other identifiable intangible assets are recorded at fair value on the date of acquisition and are reviewed at least annually for impairment. For the fiscal year ended December 31, 2013, the Company recorded $0.5 million of impairment charges related primarily to customer relationship intangible assets for which projected cash flows no longer supported the carrying values, and the Company has in prior years recorded significant impairment charges related to goodwill. Future events may occur that could adversely affect the value of the Company’s assets and require additional impairment charges. Such events may include, but are not limited to, strategic decisions made in response to changes in economic and competitive conditions, the impact of a deteriorating economic environment and decreases in the Company’s market capitalization due to a decline in the trading price of the Company’s common stock. If the price of the Company’s common stock were to experience a significant and other-than-temporary decline, the Company may be required in a future period to recognize an impairment of all or a portion of its goodwill. Any such impairment charge would have a negative effect on its stockholders’ equity and have a material adverse affect on the Company’s financial results.
Currency exchange rate fluctuations could have an adverse effect on the Company’s revenue, cash flows and financial results.
For the fiscal year ended December 31, 2013, consolidated net revenues from operations outside the United States were approximately $150 million, which represented approximately 34 percent of consolidated net revenues. Because the Company conducts a significant portion of its business outside the United States, it faces exposure to volatility in foreign currency exchange rates. Currency exchange rates fluctuate in response to, among other things, changes in local, regional or global economic conditions, changes in monetary or trade policies and unexpected changes in regulatory environments.
Fluctuations in currency exchange rates may affect the Company’s operating performance by impacting revenues and expenses outside of the United States due to fluctuations in currencies other than the U.S. dollar or where the Company translates into U.S. dollars for financial reporting purposes the assets and liabilities of its foreign operations conducted in local currencies. A weakened U.S. dollar will increase the cost of local operating expenses to the extent that the Company must purchase components in foreign currencies, while an increase in the value of the dollar could increase the real cost to its clients outside the United States where the Company sells services in U.S. dollars. Accordingly, the Company’s financial results could ultimately be materially adversely affected by fluctuations in foreign currency exchange rates.
Work stoppages and other labor relations matters, such as multiemployer pension withdrawal obligations, may make it substantially more difficult or expensive for the Company to produce its products and services, which could result in decreased sales or increased costs, either of which would negatively impact the Company’s financial condition and results of operations.
The Company is subject to risk of work stoppages and other labor relations matters, as approximately 7 percent of its employees worldwide are unionized. A prolonged work stoppage or strike at any one of the Company’s principal facilities could have a negative impact on its business, financial condition or results of operations. Also, periodic renegotiation of labor contracts may result in increased costs or charges to the Company.
In addition, the decision by the Company to terminate its participation in a multiemployer pension plan covering unionized employees at certain facilities, as discussed under “Management’s Discussion and Analysis of Financial Condition and Results of Operations – Multiemployer pension withdrawal expense,” may trigger additional liabilities. Even after the Company has withdrawn from the plan, if a plan termination or mass withdrawal occurs within three years of the Company’s withdrawal, the Company’s withdrawal liability may be larger than is currently estimated.
The Company’s foreign operations are subject to political, investment, currency, regulatory and other risks that could hinder it from transferring funds out of a foreign country, delay its debt service payments, cause its operating costs to increase and adversely affect its results of operations.
The Company presently operates in over 20 countries in the Americas, Europe, Asia and Australia and intends to continue expanding its global operations. As a result, the Company is subject to various risks associated with operating in numerous foreign countries, such as:
|
|
·
|
local economic and market conditions;
|
|
|
·
|
political, social and economic instability;
|
|
|
·
|
war, civil disturbance or acts of terrorism;
|
|
|
·
|
taking of property by nationalization or expropriation without fair compensation;
|
|
|
·
|
adverse or unexpected changes in government policies and regulations;
|
|
|
·
|
imposition of limitations on conversions of foreign currencies into U. S. dollars or remittance of dividends and other payments by foreign subsidiaries;
|
|
|
·
|
imposition or increase of withholding and other taxes on remittances and other payments by foreign subsidiaries;
|
|
|
·
|
rapidly rising inflation in certain foreign countries; and
|
|
|
·
|
impositions or increase of investment and other restrictions or requirements by foreign governments.
|
These and other risks could disrupt the Company’s operations or force it to incur unanticipated costs and have an adverse effect on its ability to make payments on its debt obligations.
Certain Schawk family members and affiliated trusts collectively own a significant interest in the Company and may collectively exercise their control in a manner that may be adverse to your interests.
Certain members of the Schawk family and certain Schawk family trusts collectively control a majority of the outstanding voting power of the Company. Therefore, the Schawk family has the power in most cases to determine the outcome of any matter that is required to be submitted to stockholders for approval, including the election of all the Company’s directors. Clarence W. Schawk and David A. Schawk, members of the Schawk family, also serve on the board of directors of the Company. Accordingly, it is possible that members of the Schawk family could influence or exercise their control over the Company in a manner that may be adverse to your interests.
In addition, as a result of the Schawk family’s controlling interest, as permitted under the corporate governance rules of the New York Stock Exchange (“NYSE”), the Company has elected “controlled company” status under those rules. As a controlled company, the Company may rely on exemptions from certain NYSE corporate governance requirements that otherwise would be applicable to a NYSE-listed company, including the requirements that (1) a majority of the board of directors consist of independent directors and (2) the Company have a separate nominating and corporate governance committee and a separate compensation committee, in each case composed entirely of independent directors and operating pursuant to written charters. The Company has relied on the controlled company exemption in the past and intends to continue to rely on it in the future. As a result, although the Company is listed on the NYSE, stockholders may not realize the benefits from the requirements and protections that these corporate governance rules impose on the significant number of NYSE-listed companies that do not operate under the controlled company exemption.
The Company is subject to debt covenants under its debt arrangements that may restrict its operational flexibility and limit the Company’s ability to take advantage of opportunities for growth.
As further discussed under “Management’s Discussion and Analysis of Financial Condition and Results of Operations - Liquidity and Capital Resources,” the Company’s current credit facility, as well as its outstanding senior notes, contain covenants that limit the extent to which it may, among other things, incur additional indebtedness, grant liens on its assets, increase dividends being paid on its common stock, repurchase its outstanding shares and make other restricted payments, sell its assets, make acquisitions or enter into consolidations or mergers. The credit facility also requires the Company to maintain specified financial ratios and satisfy financial condition tests. These ratios, tests and covenants could restrict the Company’s business plans or limit or prohibit its ability to take actions that the Company believes would be beneficial to the Company and its stockholders, including making significant acquisitions as opportunities arise. Additionally, these ratios, tests and covenants could place the Company at a competitive disadvantage to its competitors who may not be subject to similar restrictions and could limit the Company's ability to plan for or react to changes in industry and market conditions.
In the event the Company fails to comply with the debt covenants under its debt arrangements, it may not be able to obtain the necessary amendments or waivers, and its lenders could accelerate the payment of all outstanding amounts due under those arrangements.
The Company’s ability to meet the financial ratios and tests contained in its credit facility, its senior notes and other debt arrangements, and otherwise comply with debt covenants may be affected by various events, including those that may be beyond the Company’s control. A significant breach of any of these covenants, ratios, tests or restrictions, as applicable, could result in an event of default under the Company’s debt arrangements, which would allow its lenders to declare all amounts outstanding to be immediately due and payable. If the lenders were to accelerate the payment of the Company’s indebtedness, its assets may not be sufficient to repay in full the indebtedness and any other indebtedness that would become due as a result of any acceleration. Further, as a result of any breach and during any cure period or negotiations to resolve a breach or expected breach, the Company’s lenders may refuse to make further loans, which would materially affect its liquidity and results of operations.
In the event the Company were to fall out of compliance with one or more of its debt covenants in the future, it may not be successful in amending its debt arrangements or obtaining waivers for any such non-compliance. Even if it is successful in entering into an amendment or waiver, the Company could incur substantial costs in doing so, its borrowing costs could increase, and it may be subject to more restrictive covenants than the covenants under its existing amended debt arrangements. It is possible that any amendments to the Company’s credit facility or any restructured credit facility could impose covenants and financial ratios more restrictive than under its current facilities, and it may not be able to maintain compliance with those more restrictive covenants and financial ratios. In that event, the Company would need to seek another amendment to, or a refinancing of, its debt arrangements. Any of the foregoing events could have a material adverse impact on the Company’s business and results of operations, and there can be no assurance that it would be able to obtain the necessary waivers or amendments on commercially reasonable terms, or at all.
The loss of key personnel could adversely affect the Company’s current operations and its ability to achieve continued growth.
The Company is highly dependent upon the continued service and performance of the its senior management team and other key employees, in particular David A. Schawk, its Chief Executive Officer, Eric N. Ashworth, its President, A. Alex Sarkisian, its Senior Executive Vice President, and Timothy J. Cunningham, its Chief Financial Officer. The loss of any of these officers may significantly delay or prevent the achievement of the Company’s business objectives.
The Company’s continued success also will depend on retaining the highly skilled employees that are critical to the continued advancement, development and support of its client services and ongoing sales and marketing efforts. Any loss of a significant number of its client service, sales or marketing professionals could negatively affect its business and prospects. Although the Company generally has been successful in its recruiting efforts, it competes for qualified individuals with companies engaged in its business lines and with other technology, marketing and manufacturing companies. Accordingly, the Company may be unable to attract and retain suitably qualified individuals, and its failure to do so could have an adverse effect on its ability to implement its business plan. If, for any reason, these officers or key employees do not remain with the Company, operations could be adversely affected until suitable replacements with appropriate experience can be found.
The price for the Company’s common stock can be volatile and unpredictable.
The market price of the Company’s common stock can be volatile and may experience broad fluctuations over short periods of time. From January 1 through December 31, 2013, the high and low sales price of its common stock on the New York Stock Exchange ranged from $17.32 to $9.38 and the Company’s stock price experienced similar volatility in prior years. See the market price information under the caption “Stock Prices” under “Item 5. Market for the Registrant’s Common Stock, Related Stockholder Matters and Issuer Purchases of Equity Securities.” The market price of the Company’s common stock may continue to experience strong fluctuations due to unexpected events affecting the Company, variations in its operating results, analysts’ earnings estimates or investors’ expectations concerning its future results and its business generally, and such fluctuations may be exacerbated by limited market liquidity as a significant number of the Company’s outstanding shares are held by the Schawk family. In addition, the market price of its common stock may fluctuate due to broader market and industry factors, such as:
|
·
|
adverse information about, or the operating and stock price performance of, other companies in the Company’s industry or companies that comprise its client base, such as CPG companies;
|
|
·
|
deterioration or adverse changes in general economic conditions;
|
|
·
|
continued high levels of volatility in the stock markets due to, among other things, disruptions in the capital and credit markets; and
|
|
·
|
announcements of new clients or service offerings by the Company’s competitors.
|
These and other market and industry factors may seriously harm the market price of the Company’s common stock, regardless of its actual operating performance.
The Company may be subject to losses that might not be covered in whole or in part by existing insurance coverage. These uninsured losses could result in substantial liabilities to the Company that would negatively impact its financial condition.
The Company carries comprehensive liability, fire and extended coverage insurance on all of its facilities, and other specialized coverages, including errors and omissions coverage, with policy specifications and insured limits customarily carried for similar properties and purposes. There are certain types of risks and losses, however, that generally are not insured because they are either uninsurable or not economically insurable. In addition, there are some types of possible events or losses, such as a substantial monetary judgment stemming from a product liability claim or recall, that could exceed the Company’s policy limits. Should an uninsured loss or a loss in excess of insured limits occur, the Company could incur significant liabilities, and if such loss affects property the Company owns, the Company could lose capital invested in that property or the anticipated future revenues derived from the activities conducted at that property, while remaining liable for any lease or other financial obligations related to the property. In addition to substantial financial liabilities, an uninsured loss or a loss that exceeds the Company’s coverage could adversely affect its ability to replace property or capital equipment that is destroyed or damaged, and its productive capacity may diminish.
None.
As of December 31, 2013, the Company owns or leases the following office and operating facilities, in the respective business segment:
|
Location
|
Square
Feet
|
Owned/
Leased
|
Purpose
|
Lease
Expiration Date
|
Operating
Segment
|
|||||
|
Antwerp, Belgium
|
39,000
|
Owned
|
Operating Facility
|
N/A
|
Europe
|
|||||
|
Atlanta, Georgia
|
28,700
|
Leased
|
Operating Facility
|
March, 2017
|
Americas
|
|||||
|
Battle Creek, Michigan
|
7,300
|
Leased
|
Operating Facility
|
January, 2016
|
Americas
|
|||||
|
Brussels, Belgium
|
2,400
|
Leased
|
Operating Facility
|
January, 2022
|
Europe
|
|||||
|
Chennai, India
|
18,700
|
Leased
|
Operating Facility
|
October, 2014
|
Asia Pacific
|
|||||
|
Chicago, Illinois
|
68,100
|
Leased
|
Operating Facility
|
December, 2017
|
Americas
|
|||||
|
Chicago, Illinois
|
42,000
|
Leased
|
Vacant
|
June, 2019
|
Americas
|
|||||
|
Chicago, Illinois
|
58,800
|
Leased
|
Operating Facility
|
August, 2015
|
Americas
|
|||||
|
Cincinnati, Ohio
|
74,200
|
Leased
|
Operating Facility
|
August, 2014
|
Americas
|
|||||
|
Cincinnati, Ohio
|
32,600
|
Leased
|
Operating Facility
|
June, 2015
|
Americas
|
|||||
|
Cincinnati, Ohio
|
25,500
|
Leased
|
Vacant
|
November, 2014
|
Americas
|
|||||
|
Des Plaines, Illinois
|
18,200
|
Owned
|
Executive Offices
|
N/A
|
Corporate
|
|||||
|
Des Plaines, Illinois
|
54,800
|
Leased
|
Operating Facility
|
March, 2019
|
Americas
|
|||||
|
Hilversum, Netherlands
|
5,300
|
Leased
|
Operating Facility
|
October, 2016
|
Europe
|
|||||
|
Hong Kong, Hong Kong
|
3,400
|
Leased
|
Operating Facility
|
May, 2015
|
Asia Pacific
|
|||||
|
Kalamazoo, Michigan
|
67,000
|
Owned
|
Operating Facility
|
N/A
|
Americas
|
|||||
|
Leeds, U.K.
|
4,400
|
Leased
|
Operating Facility
|
December, 2015
|
Europe
|
|||||
|
London, U.K.
|
42,700
|
Leased
|
Operating Facility
|
March, 2015
|
Europe
|
|||||
|
Los Angeles, California
|
100,500
|
Owned
|
Operating Facility
|
N/A
|
Americas
|
|||||
|
Manchester, U.K.
|
45,200
|
Leased
|
Operating Facility
|
September, 2023
|
Europe
|
|||||
|
Melbourne, Australia
|
1,200
|
Leased
|
Operating Facility
|
November, 2014
|
Asia Pacific
|
|||||
|
Minneapolis, Minnesota
|
31,000
|
Owned
|
Operating Facility
|
N/A
|
Americas
|
|||||
|
Mississauga, Canada
|
58,000
|
Leased
|
Operating Facility
|
December, 2021
|
Americas
|
|||||
|
Mt. Olive, New Jersey
|
7,600
|
Leased
|
Operating Facility
|
September, 2017
|
Americas
|
|||||
|
New Berlin, Wisconsin
|
43,000
|
Leased
|
Operating Facility
|
June, 2023
|
Americas
|
|||||
|
New York, New York
|
15,000
|
Leased
|
Operating Facility
|
Month-to-month
|
Americas
|
|||||
|
New York, New York
|
5,000
|
Leased
|
Operating Facility
|
April, 2015
|
Americas
|
|||||
|
Newcastle, U.K.
|
17,800
|
Leased
|
Operating Facility
|
September, 2015
|
Europe
|
|||||
|
Northbrook, Illinois
|
36,200
|
Leased
|
Operating Facility
|
November, 2014
|
Americas
|
|||||
|
North Sydney, Australia
|
8,600
|
Leased
|
Operating Facility
|
September, 2017
|
Americas
|
|||||
|
Paris, France
|
7,300
|
Leased
|
Operating Facility
|
June, 2021
|
Europe
|
|||||
|
Penang, Malaysia
|
38,000
|
Owned
|
Operating Facility
|
N/A
|
Asia Pacific
|
|||||
|
Queretaro, Mexico
|
18,000
|
Owned
|
Operating Facility
|
N/A
|
Americas
|
|||||
|
Redmond, Washington
|
24,200
|
Leased
|
Operating Facility
|
April, 2017
|
Americas
|
|||||
|
San Francisco, California
|
20,100
|
Leased
|
Operating Facility
|
August, 2016
|
Americas
|
|||||
|
San Francisco, California
|
13,500
|
Leased
|
Operating Facility
|
September, 2014
|
Americas
|
|||||
|
São Paulo, Brazil
|
2,200
|
Leased
|
Operating Facility
|
October, 2016
|
Americas
|
|||||
|
Shanghai, China
|
22,100
|
Leased
|
Operating Facility
|
December, 2015
|
Asia Pacific
|
|||||
|
Shanghai, China
|
22,100
|
Leased
|
Operating Facility
|
August, 2018
|
Asia Pacific
|
|||||
|
Shenzhen, China
|
1,900
|
Leased
|
Operating Facility
|
December, 2014
|
Asia Pacific
|
|||||
|
Singapore, Singapore
|
7,700
|
Leased
|
Operating Facility
|
November, 2016
|
Asia Pacific
|
|||||
|
Stamford, Connecticut
|
9,500
|
Leased
|
Operating Facility
|
December, 2016
|
Americas
|
|||||
|
Sterling Heights, Michigan
|
26,400
|
Leased
|
Operating Facility
|
June, 2014
|
Americas
|
|||||
|
Swindon, U.K.
|
39,000
|
Leased
|
Subletting
|
September, 2018
|
Europe
|
|||||
|
Tokyo, Japan
|
7,000
|
Leased
|
Operating Facility
|
August, 2015
|
Asia Pacific
|
|||||
|
Toronto, Canada
|
7,300
|
Leased
|
Operating Facility
|
June, 2018
|
Americas
|
|||||
|
Waterbury, Vermont
|
1,100
|
Leased
|
Operating Facility
|
November, 2014
|
Americas
|
|||||
|
York, U.K.
|
2,300
|
Leased
|
Operating Facility
|
July, 2017
|
Europe
|
From time to time, the Company has been a party to routine pending or threatened legal proceedings and arbitrations. The Company insures some, but not all, of its exposure with respect to such proceedings. Based upon information presently available, and in light of legal and other defenses available to the Company, management does not consider the exposure from any pending litigation to be material to the Company.
Not applicable.
Stock Prices
The Company’s Class A common stock is listed on the New York Stock Exchange under the symbol “SGK”. The Company had approximately 788 stockholders of record as of February 28, 2014.
Set forth below are the high and low sales prices for the Company’s Class A common stock for each quarterly period within the two most recent fiscal years.
|
2013
|
2012
|
||||||||
|
Quarter Ended
|
High /Low
|
High /Low
|
|||||||
|
March 31
|
$ | 14.09-10.63 | $ | 14.55-10.51 | |||||
|
June 30
|
13.46- 9.38 | 13.98-10.57 | |||||||
|
September 30
|
15.55-10.70 | 14.50-10.80 | |||||||
|
December 31
|
17.32-14.12 | 14.60-10.55 | |||||||
|
Dividends Declared Per Class A Common Share
|
|||||||||
|
Quarter Ended
|
2013 | 2012 | |||||||
|
March 31
|
$ | 0.08 | $ | 0.08 | |||||
|
June 30
|
0.08 | 0.08 | |||||||
|
September 30
|
0.08 | 0.08 | |||||||
|
December 31
|
0.08 | 0.08 | |||||||
|
Total
|
$ | 0.32 | $ | 0.32 | |||||
The Company maintained quarterly dividends at the rate of $0.08 throughout 2012 and 2013. The Company expects quarterly dividends at this rate to continue throughout 2014, subject to declaration by the Board of Directors and its discretion to increase, decrease or eliminate such dividends.
The graph below compares the cumulative total shareholder return on the Company’s common stock for the last five fiscal years with (i) the cumulative total return of the Russell 2000 Index, a broad market index for small cap stocks, (ii) the Morgan Stanley Consumer Index, an index designed to measure the performance of consumer-oriented, stable growth industries and (iii) the S&P 500 Consumer Staples Index, an index that comprises those companies included in the S&P 500 that are classified as members of the GICS consumer staples sector.
For 2014 and subsequent years, the Company will be replacing the Morgan Stanley Consumer Index, which was terminated on October 18, 2013, with the S&P 500 Consumer Staples Index.
Comparison of 5 Year Cumulative Total Return
Assumes Initial Investment of $100*
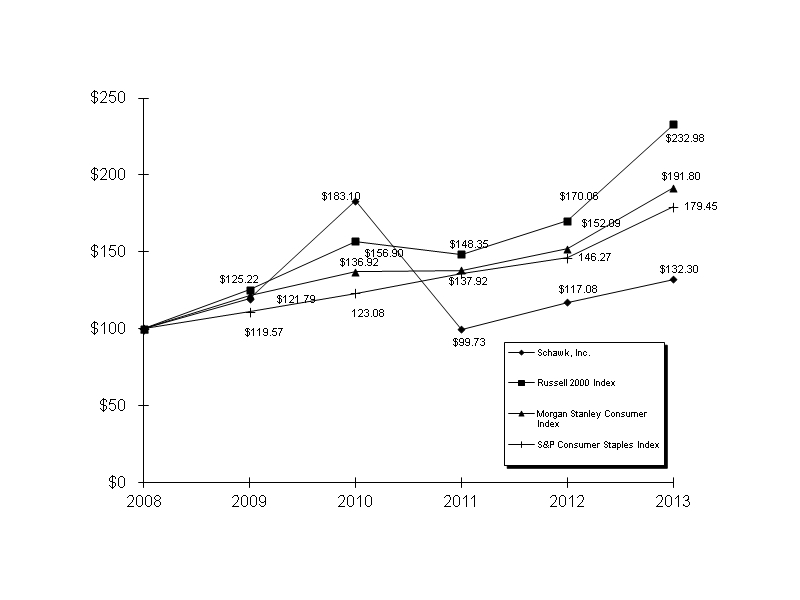
*Assumes $100 invested at the close of trading 12/08 in Schawk, Inc, common stock, Russell 2000 Index, Morgan Stanley Consumer Index and S&P 500 Consumer Staples Index. For the Morgan Stanley Consumer Index, the shareholder return for 2013 represents shareholder return as of October 18, 2013, the date the Morgan Stanley Consumer Index terminated. Cumulative total return assumes reinvestment of dividends.
Equity Compensation Plan Information
The following table summarizes information as of December 31, 2013, relating to equity compensation plans of the Company pursuant to which Common Stock is authorized for issuance (shares in thousands).
|
Plan Category
|
Number of securities to be issued upon exercise of outstanding options, warrants and rights
|
Weighted-average exercise price of outstanding options, warrants and rights
|
Number of securities remaining available for future issuance under
equity compensation plans (excluding shares reflected in the first column)
|
||||||||||
|
Equity compensation plans approved by security holders
|
1,531 | $ | 14.89 | 1,981 | |||||||||
|
Equity compensation plans not approved by security holders
|
-- | -- | -- | ||||||||||
|
Total
|
1,531 | $ | 14.89 | 1,981 | |||||||||
Purchases of Equity Securities by the Company
In November 2010, the Board of Directors of the Company reinstated the Company’s share repurchase program, which authorizes the Company to repurchase from time to time up to two million shares of Company common stock per year, subject to the Company’s compliance with the covenants of its credit facility. The Company did not repurchase any shares during the years ended December 31, 2013 or December 31, 2012. In addition, shares of common stock are occasionally tendered to the Company by certain employee and director stockholders in payment of stock options exercised. During the years ended December 31, 2013 and December 31, 2012, 4,333 and 5,089 shares, respectively, of Schawk, Inc. common stock were tendered to the Company in connection with stock option exercises. The Company records the receipt of common stock in payment for stock options exercised as a reduction of common stock issued and outstanding.
During the year ended December 31, 2013, certain officers of the Company tendered 39,739 shares of Schawk Inc. common stock to the Company in satisfaction of tax liabilities associated with retirement-age vesting provisions of their restricted stock awards. The shares tendered had a market value of $0.5 million based on a $13.38 per share closing price on the date the shares were tendered. The receipt of the shares was recorded by the Company as an addition to Treasury Stock and a reduction of a receivable from the Company officers.
|
Year Ended December 31,
|
|||||||||||||||||||||
|
(in thousands, except per share amounts)
|
2013
|
2012
|
2011
|
2010
|
2009
|
||||||||||||||||
|
Consolidated Statements of Comprehensive Income (Loss) Information
|
|||||||||||||||||||||
|
Net revenues
|
$ | 442,640 | $ | 441,282 | $ | 427,421 | $ | 428,657 | $ | 413,516 | |||||||||||
|
Operating income (loss)
|
$ | 24,189 | $ | (30,967 | ) | $ | 25,320 | $ | 47,890 | $ | 34,452 | ||||||||||
|
Income (loss) from continuing operations
|
$ | 13,218 | $ | (23,618 | ) | $ | 19,412 | $ | 31,414 | $ | 18,698 | ||||||||||
|
Income (loss) per common share from continuing operations :
|
|||||||||||||||||||||
|
Basic
|
$ | 0.50 | $ | (0.91 | ) | $ | 0.75 | $ | 1.23 | $ | 0.75 | ||||||||||
|
Diluted
|
$ | 0.50 | $ | (0.91 | ) | $ | 0.74 | $ | 1.21 | $ | 0.75 | ||||||||||
|
Consolidated Balance Sheet Information
|
|||||||||||||||||||||
|
Total assets
|
$ | 430,541 | $ | 458,821 | $ | 479,513 | $ | 449,859 | $ | 416,219 | |||||||||||
|
Long-term debt
|
$ | 56,636 | $ | 78,724 | $ | 73,737 | $ | 37,080 | $ | 64,707 | |||||||||||
|
Other Data
|
|||||||||||||||||||||
|
Cash dividends per common share
|
$ | 0.32 | $ | 0.32 | $ | 0.32 | $ | 0.20 | $ | 0.0625 | |||||||||||
Cautionary Statement Regarding Forward-Looking Information
Certain statements contained herein and in “Item 1. Business” that relate to the Company’s beliefs or expectations as to future events are not statements of historical fact and are forward-looking statements within the meaning of Section 27A of the Securities Act and Section 21E of the Exchange Act. The Company intends any such statements to be covered by the safe harbor provisions for forward-looking statements contained in the Private Securities Litigation Reform Act of 1995. Although the Company believes that the assumptions upon which such forward-looking statements are based are reasonable within the bounds of its knowledge of its industry, business and operations, it can give no assurance the assumptions will prove to have been correct and undue reliance should not be placed on such statements. Important factors that could cause actual results to differ materially and adversely from the Company’s expectations and beliefs include, among other things, the strength of the United States economy in general and, specifically, market conditions for the consumer products industry in the U.S. and abroad; the level of demand for the Company’s services; unfavorable foreign exchange fluctuations; changes in or weak consumer confidence and consumer spending; loss of key management and operational personnel; the ability of the Company to implement its business strategy and cost reduction plans and to realize anticipated cost savings; the ability of the Company to comply with the financial covenants contained in its debt agreements and obtain waivers or amendments in the event of non-compliance; the ability of the Company to maintain an effective system of disclosure and internal controls and the discovery of any future control deficiencies or weaknesses, which may require substantial costs and resources to rectify; the stability of state, federal and foreign tax laws; the ability of the Company to identify and capitalize on industry trends and technological advances in the imaging industry; higher than expected costs associated with compliance with legal and regulatory requirements; higher than anticipated costs or lower than anticipated benefits associated with the Company’s ongoing information technology and business process improvement initiative or unanticipated costs or difficulties associated with integrating acquired operations; any impairment charges due to declines in the value of the Company’s fixed and intangible assets, including goodwill; the stability of political conditions in foreign countries in which the Company has production capabilities; terrorist attacks and the U.S. response to such attacks; as well as other factors detailed in the Company’s filings with the Securities and Exchange Commission. The Company assumes no obligation to update publicly any of these statements in light of future events.
Executive Overview
Marketing, promotional and advertising spending by consumer products companies and retailers drives a majority of the Company’s revenues. The markets served are primarily consumer packaged goods, retail and life sciences. The Company’s principal business in this area involves producing graphic images for various applications.
Generally, the Company or a third party creates an image and then the image is manipulated to enhance the color and to prepare it for print. The applications vary from consumer product packaging, including food and beverage packaging images, to retail advertisements in newspapers, including freestanding inserts (FSIs), magazine advertisements and the internet. The graphics process is generally the same regardless of the application. The following steps in the graphics process must take place to produce a final image:
|
·
|
Strategic Analysis
|
|
·
|
Planning and Messaging
|
|
·
|
Conceptual Design
|
|
·
|
Content Creation
|
|
·
|
File Building
|
|
·
|
Retouching
|
|
·
|
Art Production
|
|
·
|
Pre-Media
|
The Company’s involvement with a client’s project may involve all of the above steps or just one of the steps, depending on the client’s needs. Each client assignment, or ‘‘job,’’ is a custom job in that the image being produced is unique, even if it only involves a small change from an existing image, such as adding a ‘‘low fat’’ banner on a food package. Essentially, such changes equal new revenue for the Company. The Company is paid for its graphic imaging work regardless of the success or failure of the food product, the promotion or the ad campaign.
Historically, a substantial majority of the Company’s revenues have been derived from providing graphic services for consumer product packaging applications. Packaging changes occur with regular frequency and lack of advance notice, and client turn-around requirements are tight, thereby creating little backlog. There are regular promotions throughout the year that create revenue opportunities for the Company, such as: Valentine’s Day, Easter, Fourth of July, Back-to-School, Halloween, Thanksgiving and Christmas. In addition, there are event-driven promotions that occur regularly, such as: the Super Bowl, Grammy Awards, World Series, Indianapolis 500 and the Olympics. Changing regulatory requirements also necessitate new packaging from time to time, as do the number of health related ‘‘banners’’ that are added to food and beverage packaging, such as ‘‘heart healthy,’’ ‘‘low in carbohydrates,’’ ‘‘enriched with essential vitamins,’’ ‘‘low in saturated fat’’ and ‘‘caffeine free.’’ All of these items require new product packaging designs or changes in existing designs, in each case creating additional opportunities for revenue. Graphic services for the consumer products packaging industry generally involve higher margins due to the substantial expertise necessary to meet consumer products companies’ precise specifications and to quickly, consistently and efficiently bring their products to market, as well as due to the complexity and variety of packaging materials, shapes and sizes, custom colors and storage conditions.
Through several acquisitions in 2004 and 2005, the Company increased the percentage of its revenue derived from providing graphics services to advertising and retail clients. These clients typically require high volume, commodity-oriented premedia graphic services. Graphic services for these clients typically yield relatively lower margins due to the lower degree of complexity in providing such services, and the number and size of companies in the industry capable of providing such services.
In 2013, approximately 9.9 percent of the Company’s total revenues came from its largest single client. While the Company seeks to build long-term client relationships, revenues from any particular client can fluctuate from period to period due to the client’s purchasing patterns. Any termination of or significant reduction in the Company business relationship with any of its principal clients could have a material adverse effect on its business, financial condition and results of operations.
During 2014, the Company expects to continue to implement operational and work force alignment actions, including continuing to focus on realigning the Company’s management and organizational structure to provide, among other things, greater consistency and more common approaches to the services the Company provides to its clients. While the Company anticipates these actions will benefit the Company and its clients, changes to its organizational structure also may result in increased or unanticipated short-term costs due to the realignment of responsibilities, roles and personnel functions.
Recent Acquisitions
The Company has completed approximately 60 acquisitions since 1965. The Company’s recent acquisitions have significantly expanded its service offerings and its geographic presence, making it the only independent premedia firm with substantial operations in the Americas, Europe, Asia and Australia. As a result of these acquisitions, the Company is able to offer a broader range of services to its clients. Its expanded geographic presence also allows us to better serve its multinational clients’ demands for global brand consistency.
Lipson Associates, Inc. and Laga, Inc. Effective October 19, 2011, the Company acquired substantially all of the assets of Lipson Associates, Inc. and Laga, Inc., which does business as Brandimage – Desgrippes & Laga (“Brandimage”) and the assumption of certain trade account and business related liabilities. Brandimage provides services that seek to engage and enhance the brand experience, including brand positioning and strategy, product development and structural design, package design and environmental design. Brandimage operates in Chicago, Cincinnati, Paris, Shanghai, and Hong Kong. Brandimage operates in conjunction with the Company's current brand development capabilities, which include the Company’s Anthem brand. The net assets and results of operations of Brandimage are included in the Consolidated Financial Statements as of October 19, 2011 in the Americas, Europe and Asia Pacific operating segments. The purchase price was $24.6 million, consisting of $27.0 million paid in cash at closing, less $2.4 million received for a net working capital adjustment.
Real Branding LLC. Effective November 10, 2010, the Company acquired Real Branding LLC (“Real Branding”), a United States - based digital marketing agency. Real Branding provides digital marketing services to consumer product and entertainment clients through its location in Chicago. The net assets and results of operations of Real Branding are included in the Consolidated Financial Statements as of November 10, 2010 in the Americas operating segment. This business was acquired to strengthen the Company’s ability to offer integrated strategic, creative and executional services across digital consumer touchpoints. The purchase price was $9.6 million, which included $3.4 million originally recorded as an estimated liability to the sellers for contingent consideration based on performance of the business for the years 2011 through 2014. The Company has determined, based on actual performance and current future projections, that no contingent consideration will be payable for any of the years covered by the acquisition agreement.
Untitled London Limited. Effective September 17, 2010, the Company acquired the operating assets of Untitled London Limited, a United Kingdom-based agency that provides strategic, creative and technical services for digital marketing. The net assets and results of operations of Untitled London Limited are included in the Consolidated Financial Statements in the Europe operating segment, effective September 17, 2010. This business was acquired to expand the Company’s digital marketing capabilities in Europe. The purchase price was approximately $0.9 million.
Discontinued Operations
On July 3, 2013, the Company completed the sale of various assets comprising its large-format printing business located in Los Angeles, California. The net assets of the large format printing business were considered to be held for sale as of June 30, 2013. The large-format printing business was considered to be outside of the Company’s core business and was included in the Americas segment. The aggregate selling price for the business was $10.4 million, comprised of $8.2 million in cash, $2.0 million in a secured subordinated note and $0.2 million accrued as a receivable from the buyer for an estimated net working capital adjustment, which was settled in the first quarter of 2014. The results of operations of the business sold are reported as discontinued operations for all periods presented in this annual report and the assets and liabilities of the discontinued operation, prior to disposal, have been segregated in the Consolidated Balance Sheets.
The Company recorded a loss of $6.3 million on the sale of the business, which is included in Income (loss) from discontinued operations on the Company’s Consolidated Statements of Comprehensive Income (Loss). Included in the net loss is a goodwill allocation of $7.0 million, representing a portion of the Company’s Americas reporting segment goodwill which was allocated to the large-format printing business.
Financial Results Overview
Net revenues for 2013 were $442.6 million compared to $441.3 million for 2012, an increase of $1.4 million, or 0.3 percent. The revenue increase in 2013 compared to the prior year reflects an increase in revenues from the Company’s consumer products packaging accounts partially offset by a decrease in revenues from the Company’s advertising and retail accounts. Revenues in 2013 compared to the prior year were negatively impacted by changes in foreign currency translation rates of approximately $2.6 million, as the U.S. dollar increased in value relative to the local currencies of certain of the Company’s non-U.S. subsidiaries. Net revenues increased in the Europe and Asia Pacific segments in 2013 compared to the prior year, but were partially offset by a decrease in revenues in the Americas segment. The Americas segment decreased by $2.1 million, or 0.6 percent. The Europe segment increased by $1.4 million, or 1.6 percent and the Asia Pacific segment increased by $3.5 million, or 9.1 percent. The Company’s unbilled services, composed primarily of unbilled labor and production overhead, decreased by $2.8 million at December 31, 2013 compared to December 31, 2012.
Consumer products packaging accounts revenues for 2013 were $384.1 million, or 86.8 percent of total revenues, as compared to $374.1 million, or 84.8 percent of total revenues, in the prior year, representing an increase of 2.7 percent. Retail and advertising accounts revenues of $58.5 million in 2013, or 13.2 percent of total revenues, decreased 12.9 percent from $67.2 million in the prior year. During 2013, the Company continued to see measured progress with its largest client channel, consumer packaged goods accounts, with their continued product and brand innovation activity in the areas of strategy and design.
Cost of services (excluding depreciation and amortization) was $270.6 million, or 61.1 percent of revenues, in 2013, a decrease of $9.3 million, or 3.3 percent, from $279.9 million, or 63.4 percent of revenues, in 2012. The decrease in cost of services during 2013 compared to 2012 was mainly due to a decrease in labor related expenses, reflecting the Company’s cost reduction and restructuring initiatives.
Operating income (loss) increased by $55.2 million to an operating income of $24.2 million in 2013 from an operating loss of $31.0 million in 2012. The operating income percentage was 5.5 percent for 2013 compared to an operating loss of 7.0 percent in 2012. A significant portion of the operating loss in 2012 is attributable to a charge of $31.7 million related to the Company’s decision to withdraw from a multiemployer pension plan, as further described below. The change to an operating income in the current year compared to an operating loss in the prior year is also due to the lower cost of services in 2013 compared to 2012, as well as to reduced business and systems integration expenses, reduced acquisition integration and restructuring expenses and lower impairment of long-lived assets.
Selling, general and administrative expenses (excluding depreciation and amortization) decreased $1.3 million, or 1.1 percent, in 2013 to $118.7 million from $120.0 million in 2012. Included in selling, general and administrative expenses is a credit to income of approximately $0.5 million in 2013 for the reversal of a liability recorded in purchase accounting for a recent acquisitions that is no longer needed due to statute expiration. Also included in selling, general and administrative expenses for 2013 is a credit to income of approximately $0.2 million for reserve reductions at certain of the Company’s vacant leased properties, for which changed circumstances and statute expirations required a revision in the estimate of future expenses related to the leases. These 2013 income credits compare to credits to income of approximately $0.6 million in 2012 for reversals of certain acquisition related liabilities, partially offset by an expense of approximately $0.5 million for reserve increases for certain of the Company’s vacant leased properties. Excluding the effect of these credits to income in each respective year, the selling, general and administrative expenses were essentially flat in 2013 compared to 2012.
The Company recorded a charge of $31.7 million in 2012 for a multiemployer pension plan withdrawal liability attributable to the Company’s decision to discontinue its participation in the GCC/IBT National Pension Plan. There was no similar charge in 2013, except for $0.8 million of accretion of the present value discount related to the multiemployer pension withdrawal liability, which is included in interest expense. Business and systems integration expenses, related to the Company’s information technology and business process improvement initiative, decreased $4.6 million to $7.5 million in 2013 from $12.1 million in 2012, as the Company’s investment in the system build phase is substantially complete. Acquisition integration and restructuring expenses, related to the Company’s cost reduction and capacity utilization initiatives, decreased $3.5 million to $1.8 million in 2013 from $5.3 million in 2012, due to a reduced level of restructuring activities. In addition, impairment of long-lived assets decreased $3.8 million to $0.5 million in 2013 from $4.3 million in 2012. The 2012 impairment charges included $3.8 million for customer relationship intangible assets at Company locations being restructured where projected cash flows did not support the carrying value of the assets and $0.5 million for fixed assets, mainly for real estate that was written down to its estimated market value. The 2013 impairment charges related primarily to a customer relationship intangible asset in the Americas segment where projected future cash flows did not support the carrying value. The Company recorded a net loss of $1.3 million on foreign exchange exposures in 2013 as compared to a net loss of $1.8 million in 2012. The net loss on foreign exchange exposures includes unrealized losses related primarily to currency exposure from intercompany debt obligations of the Company’s foreign subsidiaries.
Interest expense for 2013 was $4.3 million compared to $3.7 million for 2012, an increase of $0.7 million, or 18.4 percent. The increase in interest expense in 2013 compared to 2012 is primarily due to $0.8 million of interest related to accretion of the present value discount recorded at year-end 2012 in conjunction with the Company’s estimated multiemployer pension withdrawal liability.
In 2013, the Company recorded income from continuing operations of $13.2 million, or $0.50 per diluted share compared to a loss from continuing operations of $23.6 million, or $0.91 per diluted share in 2012. The increase in profitability, year-over-year, is due, in part, to the $31.7 million charge recorded in 2012 related to the Company’s multiemployer pension plan withdrawal liability, which did not repeat in 2013. In addition, the year-over-year reductions in business and systems integration expenses, acquisition integration and restructuring expenses and impairment of long-lived assets contributed to the increase in profitability in 2013 as compared to 2012.
In 2013, the Company recorded a $6.7 million loss, net of tax, from discontinued operations, or $0.25 per diluted share, compared to $0.2 million, or $0.01 per diluted share, of income, net of tax, from discontinued operations in 2012. The loss from discontinued operations in 2013 includes a $6.3 million loss from the sale of assets related to the Company’s large format printing operation.
In 2013, the Company recorded net income of $6.5 million, or $0.25 per diluted share, compared to a net loss of $23.4 million, or $0.90 per diluted share, in 2012.
Goodwill impairment
The Company’s intangible assets not subject to amortization consist entirely of goodwill. The Company performs a goodwill impairment test annually, or when events or changes in business circumstances indicate that the carrying value may not be recoverable. The Company performs its annual impairment test as of October 1 each year.
The Company performed the required goodwill impairment tests for 2013 and 2012 as of October 1, 2013 and October 1, 2012, respectively. The Company allocated its goodwill on a geographic basis to its operating segments, which were determined to be reporting units for goodwill impairment testing. Using projections of operating cash flow for each reporting unit, the Company performed a step one assessment of the fair value of each reporting unit as compared to the carrying value of each reporting unit. The step one impairment analysis indicated no impairment of the goodwill for either year.
Cost reduction and capacity utilization actions
Beginning in 2008 and continuing to-date, the Company incurred restructuring costs for employee terminations, obligations for future lease payments, fixed asset impairments, and other associated costs as part of its previously announced plan to reduce costs through a consolidation and realignment of its work force and facilities. The total expense recorded for 2013 was $1.8 million and is presented as Acquisition integration and restructuring expenses in the Consolidated Statements of Comprehensive Income (Loss).
The expense for the years 2008 through 2013 and the cumulative expense since the cost reduction program’s inception was recorded in the following operating segments:
|
Asia
|
|||||||||||||||||||||
|
(in millions)
|
Americas
|
Europe
|
Pacific
|
Corporate
|
Total
|
||||||||||||||||
|
Year ended December 31, 2013
|
$ | 1.4 | $ | 0.3 | $ | 0.1 | $ | -- | $ | 1.8 | |||||||||||
|
Year ended December 31, 2012
|
4.3 | 0.9 | 0.1 | -- | 5.3 | ||||||||||||||||
|
Year ended December 31, 2011
|
0.7 | 0.6 | -- | 0.1 | 1.4 | ||||||||||||||||
|
Year ended December 31, 2010
|
1.1 | 0.5 | -- | 0.5 | 2.1 | ||||||||||||||||
|
Year ended December 31, 2009
|
3.4 | 1.4 | 1.0 | 0.4 | 6.2 | ||||||||||||||||
|
Year ended December 31, 2008
|
5.5 | 3.6 | 0.2 | 0.9 | 10.2 | ||||||||||||||||
|
Cumalative since program inception
|
$ | 16.4 | $ | 7.3 | $ | 1.4 | $ | 1.9 | $ | 27.0 | |||||||||||
It is estimated that cost savings resulting from the 2013 cost reduction actions was approximately $2.8 million for 2013 and will be approximately $6.4 million for 2014. Cost savings resulting from the 2012 cost reduction actions is estimated to have been approximately $5.5 million for 2012 and $16.6 million annually over the subsequent two-year period. Cost savings resulting from the 2011 cost reduction actions is estimated to have been approximately $2.0 million for 2011 and $5.0 million annually over the subsequent two-year period. Cost savings resulting from the 2010 cost reduction actions is estimated to have been approximately $4.9 million during 2010 and $10.9 million annually over the subsequent two-year period. Cost savings resulting from the 2009 cost reduction actions is estimated to have been approximately $8.9 million during 2009 and $15.6 million annually over the subsequent two-year period. Cost savings resulting from the 2008 cost reduction actions is estimated to have been approximately $7.4 million during 2008 and $21.9 million annually over the subsequent two-year period.
Multiemployer pension withdrawal expense
The Company has eight bargaining units in the United States that participate in the GCC/IBT National Pension Plan pursuant to a number of collective bargaining agreements. In December 2012, the Company’s Board of Directors authorized management to enter into good faith negotiations with the local bargaining units to effect a complete withdrawal from the pension plan. The negotiations with the local bargaining units continued during 2013, with negotiations for withdrawal completed with all but one bargaining unit by year-end. The decision to exit the plan was made in order to mitigate potentially greater financial exposure to the Company in the future under the plan, which is significantly underfunded, and to facilitate the consideration of future changes to the Company’s operations in the United States. Based on an analysis prepared by an independent actuary, the Company recorded an estimated liability at December 31, 2012 for its withdrawal from the pension plan of $31.7 million, which was the present value of the estimated future payments required for withdrawal. The payments are expected to total approximately $41.2 million, payable $2.1 million per year over a 20 year period, with the annual cash payments expected to commence on or about May 1, 2014. These payments were discounted at a risk free rate of 2.54 percent. The 2012 expense associated with the pension withdrawal liability is reflected in Multiemployer pension withdrawal expense on the Consolidated Statements of Comprehensive Income (Loss). During 2013, the Company accreted $0.8 million of the present value discount, resulting in an estimated liability balance of $32.5 million at December 31, 2013, of which $1.3 million is included in Accrued expenses and $31.2 million is included in Other long-term liabilities on the Consolidated Balance Sheets as of December 31, 2013. The expense associated with the accretion of the present value discount is reflected in Interest expense on the Consolidated Statements of Comprehensive Income (Loss).
In 2011, the Company decided to terminate participation in the San Francisco Lithographers Pension Trust and provided notification that it would no longer be making contributions to the plan. Under the Employee Retirement Income Security Act of 1974, the Company’s decision triggered a withdrawal liability. The Company recorded an estimated liability of $1.8 million as of December 31, 2011 to reflect this obligation. The expense associated with the pension withdrawal liability is reflected in Multiemployer pension withdrawal expense on the Consolidated Statements of Comprehensive Income (Loss). The liability was settled during 2012 with a cash payment of $1.6 million, realizing a credit to income of $0.2 million thereon.
Impairment of long-lived assets
The following table summarizes the impairment of long-lived assets by asset category for the periods presented in this Form 10-K:
|
Year Ended December 31,
|
|||||||||||||
|
(in millions)
|
2013
|
2012
|
2011
|
||||||||||
|
Intangible assets, other than goodwill
|
$ | 0.5 | $ | 3.8 | $ | -- | |||||||
|
Land and buildings
|
-- | 0.5 | -- | ||||||||||
|
Total
|
$ | 0.5 | $ | 4.3 | $ | -- | |||||||
For the year ended December 31, 2013, impairment charges of $0.5 million related to intangible assets are included in Impairment of long-lived assets on the Consolidated Statements of Comprehensive Income (Loss). The intangible asset impairment charge is comprised primarily of $0.5 million in the Americas operating segment for a customer relationship intangible asset for which future cash flows do not support the carrying value.
For the year ended December 31, 2012, impairment charges of $4.3 million are included in Impairment of long-lived assets on the Consolidated Statements of Comprehensive Income (Loss). The impairment of long-lived assets includes $3.8 million related to impairments of intangible assets and $0.5 million related to impairment of fixed assets. The intangible asset impairment charges were for customer relationship intangible assets at Company locations being restructured for which projected cash flows did not support the carrying values. The Company recorded the customer relationship impairment charges in the Americas and Europe operating segments in the amounts of $2.4 million and $1.4 million, respectively. The fixed asset impairment charge of $0.5 million related to Company-owned real estate in the Corporate segment which was written down to its estimated market value in 2012, in anticipation of a sale which was finalized in 2013. In addition, for the year ended December 31, 2012, impairment charges of $0.2 million are included in Acquisition integration and restructuring expenses on the Consolidated Statements of Comprehensive Income (Loss). These impairment charges relate to building improvements at Company facilities in the Americas operating segment that were combined with other operating facilities or shut-down and relate to the Company’s ongoing restructuring and cost reduction initiatives.
During 2011, charges of less than $0.1 million were recorded for the impairment of various fixed assets. In addition, there were $0.3 million of impairments, primarily for leasehold improvements related to the Company’s cost reduction and capacity utilization initiatives which are included in Acquisition integration and restructuring expenses on the Consolidated Statements of Comprehensive Income (Loss).
Controls and Procedures
In connection with management’s assessment of the effectiveness of the Company’s internal control over financial reporting as of December 31, 2013, management has concluded that its internal control over financial reporting was effective as of the end of such period. See Item 9A. “Controls and Procedures.”
Results of Operations
Consolidated
The following table sets forth certain amounts, ratios and relationships from the Consolidated Statements of Comprehensive Income (Loss) for the Years Ended December 31, 2013 and 2012:
|
Comparative Consolidated Statements of Comprehensive Income (Loss)
Years Ended December 31, 2013 and 2012
|
|||||||||||||||||
|
(in thousands)
|
2013
|
2012
|
$
Change
|
%
Change
|
|||||||||||||
|
|
|||||||||||||||||
|
Net revenues
|
$ | 442,640 | $ | 441,282 | $ | 1,358 | 0.3 | % | |||||||||
|
Operating expenses:
|
|||||||||||||||||
|
Cost of services (excluding depreciation and
|
|||||||||||||||||
|
amortization)
|
270,559 | 279,901 | (9,342 | ) | (3.3 | ) | % | ||||||||||
|
Selling, general and administrative expenses (excluding
|
|||||||||||||||||
|
depreciation and amortization)
|
118,706 | 120,006 | (1,300 | ) | (1.1 | ) | % | ||||||||||
|
Depreciation and amortization
|
18,136 | 17,416 | 720 | 4.1 | % | ||||||||||||
|
Business and systems integration expenses
|
7,488 | 12,086 | (4,598 | ) | (38.0 | ) | % | ||||||||||
|
Acquisition integration and restructuring expenses
|
1,774 | 5,256 | (3,482 | ) | (66.2 | ) | % | ||||||||||
|
Foreign exchange loss
|
1,286 | 1,823 | (537 | ) | (29.5 | ) | % | ||||||||||
|
Impairment of long-lived assets
|
502 | 4,281 | (3,779 | ) | (88.3 | ) | % | ||||||||||
|
Multiemployer pension withdrawal expense
|
-- | 31,480 | (31,480 | ) |
nm
|
||||||||||||
|
Operating income (loss)
|
24,189 | (30,967 | ) | 55,156 |
nm
|
||||||||||||
|
Operating margin percentage
|
5.5 |
%
|
(7.0 | ) |
%
|
||||||||||||
|
Other income (expense):
|
|||||||||||||||||
|
Interest income
|
255 | 129 | 126 | 97.7 | % | ||||||||||||
|
Interest expense
|
(4,324 | ) | (3,652 | ) | (672 | ) | 18.4 | % | |||||||||
|
Income (loss) from continuing operations before income taxes
|
20,120 | (34,490 | ) | 54,610 |
nm
|
||||||||||||
|
Income tax provision (benefit)
|
6,902 | (10,872 | ) | 17,774 |
nm
|
||||||||||||
|
Income (loss) from continuing operations
|
13,218 | (23,618 | ) | 36,836 |
nm
|
||||||||||||
|
Income (loss) from discontinued operations, net of
taxes
|
(6,693 | ) | 202 | (6,895 | ) |
nm
|
|||||||||||
|
Net income (loss)
|
$ | 6,525 | $ | (23,416 | ) | $ | 29,941 |
nm
|
|||||||||
|
Expressed as a percentage of net revenues:
|
|||||||||||||||||
| Cost of services | 61.1 | % | 63.4 | % | (230 | ) | bp | ||||||||||
|
Selling, general and administrative expenses
|
26.8 |
%
|
27.2 |
%
|
(40 | ) | bp | ||||||||||
|
Depreciation and amortization
|
4.1 |
%
|
3.9 |
%
|
20 | bp | |||||||||||
|
Business and systems integration expenses
|
1.7 |
%
|
2.7 |
%
|
(100 | ) | bp | ||||||||||
|
Acquisition integration and restructuring expenses
|
0.4 |
%
|
1.2 |
%
|
(80 | ) | bp | ||||||||||
|
Foreign exchange loss
|
0.3 |
%
|
0.4 |
%
|
(10 | ) | bp | ||||||||||
|
Impairment of long-lived assets
|
0.1 |
%
|
1.0 |
%
|
(90 | ) | bp | ||||||||||
|
Multiemployer pension withdrawal expense
|
-- |
%
|
7.1 |
%
|
(710 | ) | bp | ||||||||||
|
Operating margin
|
5.5 |
%
|
(7.0 | ) |
%
|
1,250 | bp | ||||||||||
bp = basis points
nm = not meaningful
Net revenues for 2013 were $442.6 million compared to $441.3 million for 2012, an increase of $1.4 million, or 0.3 percent. The revenue increase in 2013 compared to the prior year reflects an increase in revenues from the Company’s consumer products packaging accounts partially offset by a decrease in revenues from the Company’s advertising and retail accounts. Revenues in 2013 compared to the prior year were negatively impacted by changes in foreign currency translation rates of approximately $2.6 million, as the U.S. dollar increased in value relative to the local currencies of certain of the Company’s non-U.S. subsidiaries. Net revenues increased in the Europe and Asia Pacific segments in 2013 compared to the prior year, but were partially offset by a decrease in revenues in the Americas segment. The Americas segment decreased by $2.1 million, or 0.6 percent. The Europe segment increased by $1.4 million, or 1.6 percent and the Asia Pacific segment increased by $3.5 million, or 9.1 percent. The Company’s unbilled services, composed primarily of unbilled labor and production overhead, decreased by $2.8 million at December 31, 2013 compared to December 31, 2012.
Consumer products packaging accounts revenues for 2013 were $384.1 million, or 86.8 percent of total revenues, as compared to $374.1 million, or 84.8 percent of total revenues, in the prior year, representing an increase of 2.7 percent. Retail and advertising accounts revenues of $58.5 million in 2013, or 13.2 percent of total revenues, decreased 12.9 percent from $67.2 million in the prior year. During 2013, the Company continued to see measured progress with its largest client channel, consumer packaged goods accounts, with their continued product and brand innovation activity in the areas of strategy and design.
Cost of services (excluding depreciation and amortization) was $270.6 million, or 61.1 percent of revenues, in 2013, a decrease of $9.3 million, or 3.3 percent, from $279.9 million, or 63.4 percent of revenues, in 2012. The decrease in cost of services during 2013 compared to 2012 was mainly due to a decrease in labor related expenses, reflecting the Company’s cost reduction and restructuring initiatives.
Operating income (loss) increased by $55.2 million to an operating income of $24.2 million in 2013 from an operating loss of $31.0 million in 2012. The operating income percentage was 5.5 percent for 2013 compared to an operating loss of 7.0 percent in 2012. A significant portion of the operating loss in 2012 is attributable to a charge of $31.7 million related to the Company’s decision to withdraw from a multiemployer pension plan, as further described below. The change to an operating income in the current year compared to an operating loss in the prior year is also due to the lower cost of services in 2013 compared to 2012, as well as to reduced business and systems integration expenses, reduced acquisition integration and restructuring expenses and lower impairment of long-lived assets.
Selling, general and administrative expenses (excluding depreciation and amortization) decreased $1.3 million, or 1.1 percent, in 2013 to $118.7 million from $120.0 million in 2012. Included in selling, general and administrative expenses is a credit to income of approximately $0.5 million in 2013 for the reversal of a liability recorded in purchase accounting for a recent acquisition that is no longer needed due to statute expiration. Also included in selling, general and administrative expenses for 2013 is a credit to income of approximately $0.2 million for reserve reductions at certain of the Company’s vacant leased properties, for which changed circumstances and statute expirations required a revision in the estimate of future expenses related to the leases. These 2013 income credits compare to credits to income of approximately $0.6 million in 2012 for reversals of certain acquisition related liabilities, partially offset by an expense of approximately $0.5 million for reserve increases for certain of the Company’s vacant leased properties. Excluding the effect of these credits to income in each respective year, selling, general and administrative expenses were essentially flat in 2013 compared to 2012.
The Company recorded a charge of $31.7 million in 2012 for a multiemployer pension plan withdrawal liability attributable to the Company’s decision to discontinue its participation in the GCC/IBT National Pension Plan. There was no similar charge in 2013, except for $0.8 million of accretion of the present value discount related to the multiemployer pension withdrawal liability, which is included in interest expense. Business and systems integration expenses, related to the Company’s information technology and business process improvement initiative, decreased $4.6 million to $7.5 million in 2013 from $12.1 million in 2012, as the Company’s investment in the system build phase is substantially complete. Acquisition integration and restructuring expenses, related to the Company’s cost reduction and capacity utilization initiatives, decreased $3.5 million to $1.8 million in 2013 from $5.3 million in 2012, due to a reduced level of restructuring activities. In addition, impairment of long-lived assets decreased $3.8 million to $0.5 million in 2013 from $4.3 million in 2012. The 2012 impairment charges included $3.8 million for customer relationship intangible assets at Company locations being restructured where projected cash flows did not support the carrying value of the assets and $0.5 million for fixed assets, mainly for real estate that was written down to its estimated market value. The 2013 impairment charges related primarily to a customer relationship intangible asset in the Americas segment where projected future cash flows did not support the carrying value. The Company recorded a net loss of $1.3 million on foreign exchange exposures in 2013 as compared to a net loss of $1.8 million in 2012. The net loss on foreign exchange exposures includes unrealized losses related primarily to currency exposure from intercompany debt obligations of the Company’s foreign subsidiaries.
Interest expense for 2013 was $4.3 million compared to $3.7 million for 2012, an increase of $0.7 million, or 18.4 percent. The increase in interest expense in 2013 compared to 2012 is primarily due to $0.8 million of interest related to accretion of the present value discount recorded at year-end 2012 in conjunction with the Company’s estimated multiemployer pension withdrawal liability.
Income tax provision (benefit) was a $6.9 million provision in 2013 compared to a $10.9 million benefit for 2012. The effective tax rate was 34.3 percent for 2013 compared to an effective tax rate of 31.5 percent in 2012.
Income (loss) from continuing operations was income of $13.2 million, or $0.50 per diluted share, in 2013 compared to a loss from continuing operations of $23.6 million, or $0.91 per diluted share in 2012. The increase in profitability, year-over-year, is due, in part, to the $31.7 million charge recorded in 2012 related to the Company’s multiemployer pension plan withdrawal liability, which did not repeat in 2013. In addition, the year-over-year reductions in business and systems integration expenses, acquisition integration and restructuring expenses and impairment of long-lived assets contributed to the increase in profitability in 2013 as compared to 2012.
Income (loss) from discontinued operations, net of tax was a loss of $6.7 million, or $0.25 per diluted share, in 2013 compared to $0.2 million, or $0.01 per diluted share, of income from discontinued operations, net of tax in 2012. The loss from discontinued operations in 2013 includes a $6.3 million loss from the sale of assets related to the Company’s large format printing operation.
Net income (loss) was $6.5 million of net income, or $0.25 per diluted share, in 2013 compared to a $23.4 million net loss, or $0.90 per diluted share, in 2012.
Other Information
Depreciation and amortization expense related to continuing operations was $18.1 million in 2013, compared to $17.4 million in 2012. The increase year-over-year is attributable in part to depreciation of certain portions of the Company’s new enterprise resource planning system which were placed into service during 2013.
Capital expenditures for 2013 were $13.2 million compared to $19.8 million in 2012. The capital expenditures in both periods principally reflect expenditures related to the Company’s ongoing information technology and business process improvement initiative designed to improve customer service, business effectiveness and internal controls, as well as to reduce operating costs and decreased year-over-year as the Company’s investment in the system build phase is substantially complete.
The following table sets forth certain amounts, ratios and relationships from the Consolidated Statements of Comprehensive Income (Loss) for the Years Ended December 31, 2012 and 2011:
|
Comparative Consolidated Statements of Comprehensive Income
Years Ended December 31, 2012 and 2011
|
||||||||||||||||
|
(in thousands)
|
2012
|
2011
|
$
Change
|
%
Change
|
||||||||||||
|
|
||||||||||||||||
|
Net revenues
|
$ | 441,282 | $ | 427,421 | $ | 13,861 | 3.2 | % | ||||||||
|
Operating expenses:
|
||||||||||||||||
|
Cost of services (excluding depreciation and
amortization)
|
279,901 | 265,333 | 14,568 | 5.5 | % | |||||||||||
|
Selling, general and administrative expenses (excluding
depreciation and amortization)
|
120,006 | 107,534 | 12,472 | 11.6 | % | |||||||||||
|
Multiemployer pension withdrawal expense
|
31,480 | 1,846 | 29,634 |
nm
|
||||||||||||
|
Depreciation and amortization
|
17,416 | 16,331 | 1,085 | 6.6 | % | |||||||||||
|
Business and systems integration expenses
|
12,086 | 8,467 | 3,619 | 42.7 | % | |||||||||||
|
Acquisition integration and restructuring expenses
|
5,256 | 1,438 | 3,818 |
nm
|
||||||||||||
|
Impairment of long-lived assets
|
4,281 | 40 | 4,241 |
nm
|
||||||||||||
|
Foreign exchange loss
|
1,823 | 1,112 | 711 | 63.9 | % | |||||||||||
|
Operating income
|
(30,967 | ) | 25,320 | (56,287 | ) |
nm
|
||||||||||
|
Operating margin percentage
|
(7.0 | ) |
%
|
5.9 |
%
|
|||||||||||
|
Other income (expense):
|
||||||||||||||||
|
Interest income
|
129 | 59 | 70 |
nm
|
||||||||||||
|
Interest expense
|
(3,652 | ) | (5,270 | ) | 1,618 | (30.7 | ) | % | ||||||||
|
Income from continuing operations before income taxes
|
(34,490 | ) | 20,109 | (54,599 | ) |
nm
|
||||||||||
|
Income tax provision
|
(10,872 | ) | 697 | (11,569 | ) |
nm
|
||||||||||
|
Income (loss) from continuing operations
|
(23,618 | ) | 19,412 | (43,030 | ) |
nm
|
||||||||||
|
Income (loss) from discontinued operations, net of tax
|
202 | 1,199 | (997 | ) | 83.2 | % | ||||||||||
|
Net income (loss)
|
$ | (23,416 | ) | $ | 20,611 | $ | (44,027 | ) |
nm
|
|||||||
|
Expressed as a percentage of revenues:
|
||||||||||||||||
|
Cost of services
|
63.4 |
%
|
62.1 |
%
|
130 | bp | ||||||||||
|
Selling, general and administrative expenses
|
27.2 |
%
|
25.2 |
%
|
200 | bp | ||||||||||
|
Multiemployer pension withdrawal expense
|
7.1 |
%
|
0.4 |
%
|
670 | bp | ||||||||||
|
Depreciation and amortization
|
3.9 |
%
|
3.8 |
%
|
10 | bp | ||||||||||
|
Business and systems integration expenses
|
2.7 |
%
|
2.0 |
%
|
70 | bp | ||||||||||
|
Acquisition integration and restructuring expenses
|
1.2 |
%
|
0.3 |
%
|
90 | bp | ||||||||||
|
Impairment of long-lived assets
|
1.0 |
%
|
-- |
%
|
100 | bp | ||||||||||
|
Foreign exchange loss (gain)
|
0.4 |
%
|
0.3 |
%
|
10 | bp | ||||||||||
|
Operating margin
|
(7.0 | ) |
%
|
5.9 |
%
|
(1,290 | ) | bp | ||||||||
bp = basis points
nm = not meaningful
Net revenues for 2012 were $441.3 million compared to $427.4 million for 2011, an increase of $13.9 million, or 3.2 percent. The revenue increase in 2012 compared to the prior year reflects an increase in revenues from the Company’s consumer products packaging accounts partially offset by a decrease in revenues from the Company’s advertising and retail accounts. The increase in revenue for 2012 attributable to the increase in revenues from acquisitions compared to 2011 was $22.5 million, or 5.1 percent of total revenues. Excluding the impact of acquisitions, revenue would have decreased by $8.6 million or 2.0 percent. Revenues in 2012 compared to the prior year were negatively impacted by changes in foreign currency translation rates of approximately $3.1 million, as the U.S. dollar increased in value relative to the local currencies of certain of the Company’s non-U.S. subsidiaries. Net revenues increased in all the segments in 2012 compared to the prior year. The Americas segment increased by $2.6 million, or 0.8 percent, the Europe segment increased by $9.9 million, or 13.0 percent and the Asia Pacific segment increased by $5.2 million, or 15.5 percent. The Company’s unbilled services, composed primarily of unbilled labor and production overhead, decreased by $2.1 million at December 31, 2012 compared to December 31, 2011.
Consumer products packaging accounts revenues for 2012 were $374.1 million, or 84.8 percent of total revenues, as compared to $349.2 million, or 81.7 percent of total revenues, in the prior year, representing an increase of 7.1 percent. Retail and advertising accounts revenues of $67.2 million in 2012, or 15.2 percent of total revenues, decreased 14.1 percent from $78.2 million in the prior year. During 2012, the Company continued to see measured progress with its largest client channel, consumer packaged goods accounts, with their continued product and brand innovation activity in the areas of strategy and design. However, new product introductions and packaging changes were slower than anticipated for the year as consumer packaged goods clients continue to exercise caution based on economic uncertainties and higher commodity prices.
Cost of services (excluding depreciation and amortization) was $279.9 million, or 63.4 percent of revenues, in 2012, an increase of $14.6 million, or 5.5 percent, from $265.3 million, or 62.1 percent of revenues, in 2011. The increase in cost of services in 2012 compared to the prior year was mainly due to an increase in labor costs and fringe benefits, reflecting the Company’s recent acquisitions and expansion of client service offerings. The increase in labor and fringe benefits in 2012 was partially offset by a decrease in production services purchased from outside contractors, as well as small decreases in various other production overhead expenses during 2012.
Operating income (loss) decreased by $56.3 million to an operating loss of $31.0 million in 2012 from an operating income of $25.3 million in 2011. The operating loss percentage was 7.0 percent for 2012 compared to an operating income of 5.9 percent in 2011. A significant portion of the operating loss in 2012 is attributable to a charge of $31.5 million related to the Company’s decision to withdraw from a multiemployer pension plan, as further described below. The remainder of the operating loss in 2012 compared to the prior year’s operating income was due to the increased cost of services in 2012 compared to the previous year as well as increases in certain operating expenses as further discussed below.
Selling, general and administrative expenses (excluding depreciation and amortization) increased $12.5 million, or 11.6 percent, in 2012 to $120.0 million from $107.5 million in 2011. Included in selling, general and administrative expenses for 2011 is a credit to income of approximately $3.3 million for a reduction in estimated contingent consideration payable related to the Company’s 2010 acquisition of Real Branding compared to a credit to income of approximately $0.2 million in 2012 for the reversal of the remaining estimated contingent consideration payable for this acquisition. Also included in selling, general and administrative expenses for 2011 is a credit to income of approximately $0.8 million for the settlement of a lawsuit related to enforcement of a non-compete agreement with the former owner of a business acquired by the Company. In addition, selling, general and administrative expenses for 2011 were reduced by approximately $1.0 million related to reserve reductions for certain of the Company’s vacant leased properties, for which changed circumstances required revisions in the estimates of future expenses related to the leases. This compares to an expense of approximately $0.5 million in 2012 for reserve increases for certain of the Company’s vacant leased properties, for which changed circumstances required revisions in the estimates of future expenses related to the leases. Also included in selling, general and administrative expenses for 2011 is a credit to income of approximately $0.8 million for a reduction in an employment tax reserve related to an acquisition completed in 2008 and for which the statute of limitations has partially expired. This compares to a credit to income of approximately $0.4 million in 2012 for a further reduction in this employment tax reserve due to additional statute of limitations lapses. Excluding the effect of these credits to income in each respective year, the increase in selling, general and administrative expenses in 2012 compared to 2011 is principally due to increases in employee-related costs.
The Company recorded a net charge of $31.5 million in 2012 for multiemployer pension plan withdrawals compared to charges of $1.8 million recorded in 2011, an increase in expense of $29.6 million. The expense in 2012 is principally due to the Company’s decision to discontinue its participation in the GCC/IBT National Pension Plan. The decision to exit the plan was made in order to mitigate potentially greater financial exposure to the Company in the future under the plan and to facilitate the consideration of future changes to the Company’s operations in the United States for its operating units that contribute to the plan. The $1.8 million expense in 2011 related to the Company’s decision to terminate participation in the San Francisco Lithographers Pension Trust.
Business and systems integration expenses, related to the Company’s information technology and business process improvement initiative, increased $3.6 million to $12.1 million in 2012 from $8.5 million in 2011. Acquisition integration and restructuring expenses, related to the Company’s cost reduction and capacity utilization initiatives, were $5.3 million in 2012 compared to $1.4 million in 2011. In addition, the Company recorded $4.3 million for impairment of long-lived assets in 2012, of which $3.8 million related to customer relationship intangible assets at Company locations being restructured where projected cash flows did not support the carrying value of the assets and $0.5 million for fixed assets, mainly for real estate that was written down to its estimated market value. In 2011, there were impairment charges of less than $0.1 million. The Company recorded a net loss of $1.8 million on foreign exchange exposures in 2012 as compared to a net loss of $1.1 million in 2011. The net loss on foreign exchange exposures includes unrealized losses related primarily to currency exposure from intercompany debt obligations of the Company’s foreign subsidiaries. In order to mitigate foreign exchange rate exposure, the Company entered into several forward contracts, designated as fair value hedges, which resulted in expense for 2012 of $0.4 million, compared to $0.9 million of expense from hedging activities during 2011. In May 2012, the Company discontinued its foreign currency hedging program using forward contracts.
Interest expense for 2012 was $3.7 million compared to $5.3 million for 2011, a decrease of $1.6 million, or 30.7 percent. The decrease in interest expense in 2012 compared to the prior year reflects $0.8 million of interest capitalized during 2012 in connection with the Company’s information technology and business process improvement initiative and lower interest rates resulting from the Company’s 2012 credit facility refinancing.
Income tax provision (benefit) was a $10.9 million benefit in 2012 compared to a $0.7 million provision for 2011. The effective tax rate was 31.5 percent for 2012 compared to an effective tax rate of 3.5 percent in 2011. The lower effective tax rate in 2011 was primarily due to the release of valuation allowances during 2011 and changes in the mix of domestic and foreign earnings.
Income (loss) from continuing operations was a loss of $23.6 million, or $0.91 per diluted share, in 2012 compared to income from continuing operations of $19.4 million, or $0.74 per diluted share in 2011. The decrease in profitability, year-over-year, is due, in part, to the $31.5 million charge recorded in 2012 related to the Company’s multiemployer pension plan withdrawals. In addition, the year-over-year increases in business and systems integration expenses, acquisition integration and restructuring expenses and impairment of long-lived assets contributed to the decrease in profitability in 2012 as compared to 2011.
Income (loss) from discontinued operations, net of tax was income of $0.2 million, or $0.01 per diluted share, in 2012 compared to $1.2 million, or $0.05 per diluted share, of income from discontinued operations, net of tax in 2011.
Net income (loss) was a $23.4 million net loss, or $0.90 per diluted share, in 2012 compared to $20.6 million of net income, or $0.79 per diluted share, in 2011.
Other Information
Depreciation and amortization expense related to continuing operations was $17.4 million in 2012, compared to $16.3 million in 2011.
Capital expenditures for 2012 were $19.8 million compared to $24.7 million in 2011. The capital expenditures in both periods principally reflect expenditures related to the Company’s ongoing information technology and business process improvement initiative designed to improve customer service, business effectiveness and internal controls, as well as to reduce operating costs.
Segment Information
During 2011, the Company renamed its North America operating segment to Americas to reflect its expansion into South America.
Americas Segment
The following table sets forth Americas segment results for the years ended December 31, 2013, 2012 and 2011.
|
2013 vs. 2012
|
2012 vs. 2011
|
||||||||||||||||||||
| Increase (Decrease) |
Increase (Decrease)
|
||||||||||||||||||||
| (in thousands) | 2013 | 2012 | 2011 | $ | % | $ | % | ||||||||||||||
|
Net revenues
|
$ | 331,380 | $ | 333,494 | $ | 330,879 | $ | (2,114 | ) | (0.6) | % | $ | 2,615 | 0.8 | % | ||||||
|
Cost of services
|
$ | 208,200 | $ | 217,808 | $ | 210,602 | $ | (9,608 | ) | (4.4) | % | $ | 7,206 | 3.4 | % | ||||||
| Selling, general and administrative expenses | $ | 54,713 | $ | 57,294 | $ | 61,654 | $ | (2,581 | ) | (4.5) | % | $ | (4,360 | ) | (7.6) | % | |||||
|
Acquisition integration and restructuring expenses
|
$ | 1,376 | $ | 4,245 | $ | 777 | $ | (2,869 | ) | (67.6) | % | $ | 3,468 |
nm
|
|||||||
|
Foreign exchange loss
|
$ | 5 | $ | 185 | $ | (109) | $ | (180 | ) | (97.3) | % | $ | 294 |
nm
|
|||||||
|
Multiemployer pension withdrawal expense
|
$ | -- | $ | 31,683 | $ | -- | (31,683 | ) |
nm
|
$ | 31,683 |
nm
|
|||||||||
|
Impairment of long-lived assets
|
$ | 466 | $ | 2,350 | $ | 40 | $ | (1,884 | ) | (80.2) | % | $ | 2,310 |
nm
|
|||||||
|
Depreciation and amortization
|
$ | 9,054 | $ | 9,406 | $ | 9,287 | $ | (352 | ) | (3.7) | % | $ | 119 | 1.3 | % | ||||||
|
Operating income
|
$ | 57,566 | $ | 10,523 | $ | 48,628 | $ | 47,043 | nm | $ | (38,105 | ) | (78.4) | % | |||||||
|
Operating margin
|
17.4 |
%
|
3.2 |
%
|
14.7 |
%
|
1,420 | bp | (1,150) | bp | |||||||||||
|
Capital expenditures
|
$ | 5,211 | $ | 5,648 | $ | 7,176 | $ | (437 | ) | (7.7) | % | $ | (1,528 | ) | (21.3) | % | |||||
|
Total assets
|
$ | 326,745 | $ | 359,014 | $ | 361,189 | $ | (32,269 | ) | (9.0) | % | $ | (2,175 | ) | (0.6) | % | |||||
bp = basis points
nm = not meaningful
2013 compared to 2012
Net revenues for the year ended December 31, 2013 for the Americas segment were $331.4 million compared to $333.5 million in the same period of the prior year, a decrease of $2.1 million or 0.6 percent. The revenue decrease in 2013 compared to the prior year reflects an increase in revenues from the Company’s consumer packaging accounts which was offset by a decrease in advertising and retail accounts. Revenues in the current year compared to the prior year were negatively impacted by changes in foreign currency transaction rates of $0.9 million, as the U.S. dollar increased in value relative to the local currencies of the Company’s non-U.S. subsidiaries.
Cost of services in the year 2013 was $208.2 million, or 62.8 percent of revenues, compared to $217.8 million, or 65.3 percent of revenues, in the prior year, a decrease of $9.6 million or 4.4 percent. The decrease in cost of services was mainly due to a decrease in labor related expenses, reflecting the Company’s cost reduction and restructuring initiatives.
Operating income was $57.6 million or 17.4 percent of revenues, in the year 2013 compared to $10.5 million, or 3.2 percent of revenues, in the year 2012, an increase of $47.0 million. The increase in operating income is principally due to the multiemployer pension withdrawal costs of $31.7 million in 2012 that did not occur in 2013, a decrease in cost of services noted above as well as lower acquisition and integration expenses and lower impairment of long-lived assets in 2013 compared to the prior year.
2012 compared to 2011
Net revenues for the year ended December 31, 2012 for the Americas segment were $333.5 million compared to $330.9 million in the prior year, an increase of $2.6 million or 0.8 percent. Revenues contributed by acquisitions, mainly for Brandimage, totaled $14.6 million for 2012 compared to $2.5 million in the prior year, an increase of $12.1 million. Excluding the impact of revenues contributed by acquisitions, revenues in 2012 decreased by $9.5 million compared to 2011. Revenues for 2012, as compared to the prior year’s period were negatively impacted by changes in foreign currency translation rates of approximately $0.7 million, as the U.S. dollar increased in value relative to the local currencies of certain of the Company’s non-US subsidiaries. The revenue decline in 2012, excluding the impact of acquisitions, compared to the prior year primarily reflects a reduction in promotional activity from the Company’s advertising and retail accounts, as well as a slower rate of new product introductions and packaging changes from the Company’s consumer packaged goods accounts as economic uncertainties continued.
Cost of services was $217.8 million, or 65.3 percent of revenues, in 2012 compared to $210.6 million, or 63.6 percent of revenues, in 2011, an increase of $7.2 million or 3.4 percent. The increase during 2012 was mainly due an increase in labor and fringe benefits reflecting the Company’s recent acquisitions and expansion of client service offerings.
Operating income was $10.5 million, or 3.2 percent of revenues, in 2012 compared to $48.6 million, or 14.7 percent of revenues, in 2011, a decrease of $38.1 million. The decrease in operating income is principally due to the increase in costs year-over-year related to the multiemployer pension withdrawal costs of $31.7 million, acquisition integration costs of $3.5 million and $2.3 million of impairment of long-lived assets.
Europe Segment
The following table sets forth Europe segment results for the years ended December 31, 2013, 2012 and 2011.
|
2013 vs. 2012
|
2012 vs. 2011
|
||||||||||||||||||||||
|
Increase (Decrease)
|
Increase (Decrease)
|
||||||||||||||||||||||
|
(in thousands)
|
2013
|
2012
|
2011
|
$ | % | $ | % | ||||||||||||||||
|
Net revenues
|
$ | 87,176 | $ | 85,763 | $ | 75,877 | $ | 1,413 | 1.6 | % | $ | 9,886 | 13.0 | % | |||||||||
|
Cost of services
|
$ | 56,485 | $ | 56,802 | $ | 49,714 | $ | (317 | ) | (0.6 | ) | % | $ | 7,088 | 14.3 | % | |||||||
| Selling, general and administrative expenses | $ | 22,146 | $ | 22,275 | $ | 16,241 | $ | (129 | ) | (0.6 | ) | % | $ | 6,034 | 37.2 | % | |||||||
|
Acquisition integration and restructuring expenses
|
$ | 293 | $ | 881 | $ | 586 | $ | (588 | ) | (66.7 | ) | % | $ | 295 | 50.3 | % | |||||||
|
Foreign exchange loss
|
$ | 113 | $ | 207 | $ | 49 | $ | (94 | ) | (45.4 | ) | $ | 158 |
nm
|
|||||||||
|
Impairment of long-lived assets
|
$ | -- | $ | 1,413 | $ | -- | $ | (1,413 | ) |
nm
|
$ | 1,413 |
nm
|
||||||||||
|
Depreciation and amortization
|
$ | 2,651 | $ | 3,206 | $ | 2,903 | $ | (555 | ) | (17.3 | ) | % | $ | 303 | 10.4 | % | |||||||
|
Operating income
|
$ | 5,488 | $ | 979 | $ | 6,384 | $ | 4,509 |
nm
|
% | $ | (5,405 | ) | (84.7 | ) | % | |||||||
|
Operating margin
|
6.3 |
%
|
1.1 |
%
|
8.4 |
%
|
520 | bp | (730 | ) | bp | ||||||||||||
|
Capital expenditures
|
$ | 2,111 | $ | 1,256 | $ | 1,813 | $ | 855 | 68.1 | % | $ | (557 | ) | (30.7 | ) | % | |||||||
|
Total assets
|
$ | 57,119 | $ | 54,746 | $ | 62,476 | $ | 2,373 | 4.3 | % | $ | (7,730 | ) | (12.4 | ) | % | |||||||
bp = basis points
nm = not meaningful
2013 compared to 2012
Net revenues in the Europe segment for the year ended December 31, 2013 were $87.2 million compared to $85.8 million in the prior year, an increase of $1.4 million or 1.6 percent. The net revenue increase is principally attributed to new product introductions and packaging changes, as well as the benefits of marketing partner consolidations by our clients. Revenues in the current year 2013 compared to the prior year were negatively impacted by changes in foreign currency translation rates of approximately $0.1 million, as the U.S. dollar increased in value relative to the local currencies of the Company’s non-U.S. subsidiaries.
The cost of services was $56.5 million, or 64.8 percent of revenues, in 2013, compared to $56.8 million or 66.2 percent of revenues in the prior year, a decrease of $0.3 million or 0.6 percent.
Operating income was $5.5 million, or 6.3 percent of revenues, in 2013, compared to operating income of $1.0 million or 1.1 percent of revenues in the prior year, an increase of $4.5 million. The increase in operating income in the current period compared to the prior year’s period is mainly due to an increase in revenue, a decrease in acquisition and integration expenses of $0.6 million, as well as an impairment charge of $1.4 million in the 2012 period that did not repeat in the 2013 period.
2012 compared to 2011
Net revenues in the Europe segment for the year ended December 31, 2012 were $85.8 million compared to $75.9 million in the prior year, an increase of $9.9 million or 13.0 percent. Revenues contributed by acquisitions totaled $10.2 million in 2012 compared to $2.2 million in the prior year, an increase of $8.0 million, mainly from the Brandimage acquisition. Excluding the revenues attributable to acquisitions, revenues would have increased by $1.9 million. Revenues for 2012, as compared to 2011, were negatively impacted by changes in foreign currency translation rates of approximately $2.2 million, as the U.S. dollar increased in value relative to the local currencies of certain of the Company’s non-U.S. subsidiaries.
Cost of services was $56.8 million, or 66.2 percent of revenues, in 2012 compared to $49.7 million, or 65.5 percent of revenues, in 2011, an increase of $7.1 million or 14.3 percent. The increase during 2012 was mainly due to an increase in labor and fringe benefits reflecting the Company’s recent acquisitions and expansion of client service offerings, as well as an increase in production services purchased from outside contractors and other Company locations.
Operating income was $1.0 million, or 1.1 percent of revenues, in 2012 compared to $6.4 million, or 8.4 percent of revenues in the prior year, a decrease of $5.4 million. The decrease in operating income in 2012 compared to the prior year is due primarily to the previously mentioned increase in cost of services and $1.4 million of impairment of long-lived assets recorded in 2012, as well as higher selling, general and administrative costs in 2012 relative to the prior year, mainly resulting from credits to income during 2011 for reserve adjustments that did not repeat in 2012.
Asia Pacific Segment
The following table sets forth Asia Pacific segment results for the years ended December 31, 2013, 2012 and 2011.
|
2013 vs. 2012
|
2012 vs. 2011
|
||||||||||||||||||||||
|
Increase (Decrease)
|
Increase (Decrease)
|
||||||||||||||||||||||
|
(in thousands)
|
2013
|
2012
|
2011
|
$ | % | $ | % | ||||||||||||||||
|
Net revenues
|
$ | 42,454 | $ | 38,923 | $ | 33,704 | $ | 3,531 | 9.1 | % | $ | 5,219 | 15.5 | % | |||||||||
|
Cost of services
|
$ | 24,244 | $ | 22,189 | $ | 18,056 | $ | 2,055 | 9.3 | % | $ | 4,133 | 22.9 | % | |||||||||
|
Selling, general and administrative expenses
|
$ | 13,529 | $ | 12,644 | $ | 10,095 | $ | 885 | 7.0 | % | $ | 2,549 | 25.3 | % | |||||||||
|
Acquisition integration and restructuring expenses
|
$ | 104 | $ | 129 | $ | -- | $ | (25 | ) | (19.4 | ) | $ | 129 |
nm
|
|||||||||
|
Foreign exchange (gain) loss
|
$ | (85 | ) | $ | 305 | $ | 63 | $ | (390 | ) |
nm
|
$ | 242 |
nm
|
|||||||||
|
Impairment of long lived assets
|
$ | 36 | $ | -- | $ | -- | $ | 36 |
nm
|
$ | -- | -- | |||||||||||
|
Depreciation and amortization
|
$ | 1,430 | $ | 1,532 | $ | 1,292 | $ | (102 | ) | (6.7 | ) | % | $ | 240 | 18.6 | % | |||||||
|
Operating income
|
$ | 3,196 | $ | 2,124 | $ | 4,198 | $ | 1,072 | 50.5 | % | $ | (2,074 | ) | (49.4 | ) | % | |||||||
|
Operating margin
|
7.5 |
%
|
5.5 |
%
|
12.5 |
%
|
200 | bp | (700 | ) | bp | ||||||||||||
|
Capital expenditures
|
$ | 825 | $ | 1,611 | $ | 1,108 | $ | (786 | ) | (48.8 | ) | % | $ | 503 | 45.4 | % | |||||||
|
Total assets
|
$ | 24,813 | $ | 27,193 | $ | 31,032 | $ | (2,380 | ) | (8.8 | ) | % | $ | (3,839 | ) | (12.4 | ) | % | |||||
bp = basis points
nm = not meaningful
2013 compared to 2012
Net revenues in the Asia Pacific segment for the year ended December 31, 2013 were $42.5 million compared to $38.9 million in the prior year, an increase of $3.5 million or 9.1 percent. The increase in net revenues was mainly attributable to increased promotional activity from the Company’s consumer products packaging accounts. Improvement in labor and capacity utilization of our Asian service capabilities and the reflection of declining hourly rates drove segment revenue reductions of $1.9 million in 2013, which benefit the Americas and Europe segments through reduced costs. Revenues in the current year 2013 compared to the prior year were negatively impacted by changes in foreign currency translation rates of approximately $1.6 million, as the U.S. dollar increased in value relative to the local currencies of the Company’s non-U.S. subsidiaries.
The cost of services was $24.2 million, or 57.1 percent of revenues, in 2013, compared to $22.2 million or 57.0 percent of revenues in the prior year, an increase of $2.1 million or 9.3 percent. The increase in cost of services during 2013 compared to 2012 was mainly due to an increase in labor costs.
Operating income was $3.2 million, or 7.5 percent of revenues, in 2013, compared to operating income of $2.1 million or 5.5 percent of revenues in the prior year, an increase of $1.1 million. The increase in operating income in the current period compared to the prior year’s period is due principally to the increase in net revenues.
2012 compared to 2011
Net revenues in the Asia Pacific segment for the year ended December 31, 2012 were $38.9 million compared to $33.7 million in the prior year, an increase of $5.2 million or 15.5 percent. Revenues contributed by acquisitions in 2012 totaled $3.0 million, compared to $0.6 million in 2011, an increase of $2.4 million, principally from the Brandimage acquisition. Excluding the revenues attributable to acquisitions, revenues would have increased by $2.8 million. Revenues for 2012, as compared to 2011, were negatively impacted by changes in foreign currency translation rates of approximately $0.2 million, as the U.S. dollar increased in value relative to the local currencies of certain of the Company’s non-U.S. subsidiaries.
Cost of services was $22.2 million, or 57.0 percent of revenues, in 2012 compared to $18.1 million, or 53.6 percent of revenues, in 2011, an increase of $4.1 million or 22.9 percent. The increase during 2012 was mainly due to an increase in labor and fringe benefits reflecting the Company’s recent acquisitions and expansion of client service offerings.
Operating income was $2.1 million in 2012, or 5.5 percent of revenues, as compared to $4.2 million, or 12.5 percent of revenues, in 2011, a decrease of 2.1 million or 49.4 percent. The decrease in operating income in 2012 compared to the prior year is due principally to the previously mentioned increase in production costs as well as increases in selling, general and administrative expenses partially offset by the increase in revenues year-over-year.
Liquidity and Capital Resources
The Company’s primary liquidity needs are to fund capital expenditures, support working capital requirements and service indebtedness. The Company’s principal sources of liquidity are cash generated from its operating activities and borrowings under its credit agreement. The Company’s total debt outstanding at December 31, 2013 was $57.9 million compared to $83.0 million at December 31, 2012 and $95.2 million at December 31, 2011. The decrease in debt during 2013 and 2012 primarily reflects the Company’s paydown of outstanding amounts under its revolving credit facility and private placement debt using cash generated from operations. Debt was also reduced by $8.2 million due to cash proceeds from the sale of the Company's large format operation in 2013.
As of December 31, 2013, the Company had $6.2 million in consolidated cash and cash equivalents, compared to $9.7 million at December 31, 2012 and $13.7 million at December 31, 2011. The Company’s non-U.S. cash balances were $5.6 million at December 31, 2013, compared to $6.7 million at December 31, 2012 and $13.7 million at December 1, 2011. The decrease in cash and cash equivalents during 2013 and 2012 reflects the Company’s efforts to minimize cash on hand in order to pay down its revolving credit facility.
Cash provided by operating activities. Cash provided by operating activities was $31.2 million in 2013 compared to $31.1 million in 2012. The cash provided by operating activities in 2013 compared to 2012 reflects the increase in net income, from a net loss of $23.4 million in 2012 to net income of $6.5 million for 2013. The 2013 period includes a $6.3 million non-cash charge for a loss realized from the sale of a business, reflecting the Company’s sale of its large format printing operation. The 2012 period included a $4.4 million non-cash charge for impairment of long-lived assets compared to $0.5 million in 2013. The cash provided from operations in 2013 compared to 2012 also reflects less favorable changes in the operating assets and liabilities during 2013 compared to 2012. The year-over-year change in operating assets and liabilities includes a decrease in cash provided by operating activities attributable to an increase in trade accounts receivable of $7.3 million in 2013 compared to an increase in cash provided by operating activities attributable to a decrease in trade accounts receivable of $7.5 million in 2012. In addition, there was an increase in cash provided by operating activities in 2012 attributable to an increase in multiemployer pension withdrawal liabilities of $29.8 million during the year, which did not repeat in 2013. At year-end 2012, the Company recorded a $31.7 million estimated liability for a multiemployer pension withdrawal, which remained unchanged during 2013 except for $0.8 million of accretion of the present value discount related to the estimated liability. The cash provided by operating activities in 2012 also reflected a decrease in operating cash attributable to a $10.5 million deferred income tax benefit related primarily to the multiemployer pension withdrawal liability.
Cash provided by operating activities was $31.1 million in 2012 compared to $9.5 million in 2011. The cash provided by operating activities in 2012 compared to 2011 reflects the decrease in net income, from net income of $20.6 million for 2011 to a net loss of $23.4 million for 2012. The cash decrease attributable to the decline in net income year-over-year was partially offset by increases in non-cash expenses in 2012. The 2012 period includes a $4.4 million non-cash charge for impairment of long-lived assets as well as higher non-cash expenses for depreciation and stock based compensation as compared to the prior period. The cash provided from operations in 2012 also reflects changes in operating assets and liabilities that increased operating cash by $38.3 million during 2012. The 2012 increase in operating assets and liabilities includes an increase in multiemployer pension withdrawal liability of $29.8 million, reflecting $31.7 million recorded as an estimated multiemployer pension withdrawal liability in 2012, partially offset by a $1.8 million settlement during 2012 of a multiemployer pension withdrawal liability recorded in 2011. In addition, the 2012 change in operating assets and liabilities includes a $5.7 million decrease in trade accounts payable, accrued expenses and other liabilities during 2012, reflecting a decrease in various accrued expenses and other liabilities. The 2012 change in operating assets and liabilities also reflects an increase in cash provided by operating activities attributable to a decrease in trade accounts receivable of $7.5 million, reflecting the Company’s improvement in cash collections, and a decrease in inventory, principally composed of the cost of unbilled client services, of $2.8 million. The cash provided by operating activities in 2012 also reflects a decrease in operating cash attributable to a $10.5 million deferred income tax benefit related primarily to the multiemployer pension withdrawal liability recorded in 2012.
Depreciation and intangible asset amortization expense in 2013 was $14.7 million and $4.1 million, respectively, as compared to $13.7 million and $5.2 million, respectively, in 2012 and $12.9 million and $5.2 million, respectively, in 2011.
Cash used in investing activities.
Cash used in investing activities was $4.6 million in 2013 compared to $17.3 million in 2012. Capital expenditures were $13.2 million in 2013 compared to $19.8 million in 2012. The capital expenditures in both periods principally reflect expenditures related to the Company’s ongoing information technology and business process improvement initiative designed to improve customer service, business effectiveness and internal controls, as well as to reduce operating costs and decreased year-over-year as the Company’s investment in the system build phase is substantially complete. Partially offsetting the cash used in investing activities related to capital expenditures during 2013 was $8.2 million received from the sale of the Company’s large format printing operation. Over the next five years, assuming no significant business acquisitions, routine capital expenditures are expected to be in the range of $9.0 to $11.0 million annually.
Cash used in investing activities was $17.3 million in 2012 compared to $49.8 million in 2011. Capital expenditures were $19.8 million in 2012 compared to $24.7 million in 2011, with both periods principally reflecting expenditures related to the Company’s ongoing information technology and business process improvement initiative. The decrease in cash used in investing activities during 2012 compared to 2011 reflects the decrease in capital expenditures during 2012 compared to 2011, as well as a decrease in cash used for acquisitions. Cash paid for acquisitions in 2011 was $25.2 million, principally reflecting the acquisition of Brandimage. Cash received during 2012 related to acquisitions reflects $2.4 million received in 2012 for a net working capital adjustment related to the Brandimage acquisition.
Cash (used in) provided by financing activities.
Cash used in financing activities in 2013 was $31.2 million compared to $18.9 million during 2012. The cash used in financing activities in 2013 reflects $24.9 million of net payments of debt compared to $12.4 million of net payments of debt during 2012. The decrease in debt during both 2013 and 2012 reflects the Company’s paydown of outstanding amounts under its revolving credit facility and private placement debt using cash generated from operations. The Company received proceeds of $1.8 million from the issuance of common stock during 2013 compared to $2.4 million during 2012. The issuance of common stock in both periods is attributable to stock option exercises and issuance of shares pursuant to the Company’s employee stock purchase plan. Dividend payments on common stock at $0.08 per share quarterly were $8.4 million for 2013 compared to $8.3 million in 2012. Subject to a declaration at the discretion of the Board of Directors, the Company expects quarterly dividends at $0.08 per share to continue for 2014.
Cash used in financing activities in 2012 was $18.9 million compared to cash provided by financing activities of $17.8 million during 2011. The cash used in financing activities in 2012 reflects $12.4 million of net payments of debt compared to $28.6 million of net proceeds of debt during 2011. The increase in debt during 2011 reflects the Company’s purchase of Brandimage in the fourth quarter of that year. The Company received proceeds of $2.4 million from the issuance of common stock during 2012 compared to $1.2 million during 2011. The Company did not repurchase any shares of its common stock in 2012, whereas $4.1 million was used to repurchase shares during 2011. Dividend payments on common stock at $0.08 per share quarterly were $8.3 million for 2012 compared to $8.2 million during 2011.
Credit Facility and Senior Notes
Revolving Credit Facility
Amended and Restated Credit Facility. On January 27, 2012, the Company entered into a Second Amended and Restated Credit Agreement (the “2012 Credit Agreement”), among the Company, certain subsidiary borrowers of the Company, the financial institutions party thereto as lenders, JPMorgan Chase Bank, N.A., on behalf of itself and the other lenders as agent, and PNC Bank, National Association, on behalf of itself and the other lenders as syndication agent, in order to amend and restate the Company’s prior credit agreement that was scheduled to terminate on July 12, 2012.
The 2012 Credit Agreement provides for a five-year unsecured, multicurrency revolving credit facility in the principal amount of $125.0 million (the “Credit Facility”), including a $10.0 million swing-line loan subfacility and a $10.0 million subfacility for letters of credit. The Company may, at its option and subject to certain conditions, increase the amount of the Credit Facility by up to $50.0 million by obtaining one or more new commitments from new or existing lenders to fund such increase. Loans under the Credit Facility generally bear interest at a LIBOR or Federal funds rate plus a margin that varies with the Company’s cash flow leverage ratio, in addition to applicable commitment fees, with a maximum rate of LIBOR plus 225 basis points. At closing, the applicable margin on LIBOR-based loans was 175 basis points. The unutilized portion of the Credit Facility will be used primarily for general corporate purposes, such as working capital and capital expenditures, and, to the extent opportunities arise, acquisitions and investments.
At December 31, 2013, there was $25.0 million outstanding under the LIBOR portion of the facility at an interest rate of approximately 1.88 percent. At the Company’s option, loans under the facility can bear interest at prime plus 1.5 percent. At December 31, 2013, there was $6.3 million of prime rate borrowing outstanding at an interest rate of 4.00 percent. The Company’s Canadian subsidiary borrowed under the revolving credit facility in the form of bankers’ acceptance agreements and prime rate borrowings. At December 31, 2013, there was $0.3 million outstanding under prime rate borrowings at an interest rate of approximately 3.75 percent.
The 2012 Credit Agreement contains various customary affirmative and negative covenants and events of default. Under the terms of the 2012 Credit Agreement, the Company is not subject to restrictive covenants on permitted capital expenditures. Certain restricted payments, such as regular dividends and stock repurchases, are permitted provided that the Company maintains compliance with its minimum fixed-charge coverage ratio (with respect to regular dividends) and a specified maximum cash-flow leverage ratio (with respect to other permitted restricted payments). Other covenants include, among other things, restrictions on the Company’s and in certain cases its subsidiaries’ ability to incur additional indebtedness; dispose of assets; create or permit liens on assets; make loans, advances or other investments; incur certain guarantee obligations; engage in mergers, consolidations or acquisitions, other than those meeting the requirements of the 2012 Credit Agreement; engage in certain transactions with affiliates; engage in sale/leaseback transactions; and engage in certain hedging arrangements. The 2012 Credit Agreement also requires compliance with specified financial ratios and tests, including a minimum fixed-charge coverage ratio and a maximum cash-flow ratio.
Amendment to the 2012 Credit Agreement. On September 12, 2012, the Company entered into Amendment No. 1 (the “Credit Agreement Amendment”) to the 2012 Credit Agreement. The Credit Agreement Amendment amended the definition of “EBITDA” in the 2012 Credit Agreement to permit the Company, for purposes of calculating EBITDA for financial covenant compliance, to add back certain expenses associated with the Company’s enterprise resource planning system up to certain amounts as specified in the Credit Agreement Amendment.
Senior Notes
In 2003, the Company entered into a private placement of debt to provide long-term financing in which it issued senior notes pursuant to note purchase agreements, which have since been amended as further discussed below. The senior note that was outstanding at December 31, 2013 bears interest at 8.98 percent. The remaining aggregate balance of the note, $1.2 million, is included in Current portion of long-term debt on the December 31, 2013 Consolidated Balance Sheets.
Amended and Restated Private Shelf Agreement. Concurrently with its entry into the 2012 Credit Agreement, on January 27, 2012, the Company entered into an Amended and Restated Note Purchase and Private Shelf Agreement with Prudential Investment Management, Inc. (“Prudential”) and certain existing noteholders and note purchasers named therein (the “Private Shelf Agreement”), which provides for a $75.0 million private shelf facility for a period of up to three years (the “Private Shelf Facility”). At closing, the Company issued $25.0 million aggregate principal amount of its 4.38% Series F Senior Notes due January 27, 2019 (the “Notes”) under the Private Shelf Agreement, which principal amount remained outstanding at December 31, 2013.
The Private Shelf Agreement contains financial and other covenants that are the same or substantially equivalent to covenants under the 2012 Credit Agreement described above. Notes issued under the Private Shelf Facility may have maturities of up to ten years and are unsecured. Either the Company or Prudential may terminate the unused portion of the Private Shelf Facility prior to its scheduled termination upon 30 days’ written notice. Any future borrowings under the Private Shelf Facility may be used for general corporate purposes, such as working capital and capital expenditures.
Amendment to Note Purchase Agreement. Concurrently with the entry into the Private Shelf Agreement, the Company entered into the Fifth Amendment (the “Fifth Amendment”) to the Note Purchase Agreement, dated as of December 23, 2003, as amended (the “Note Purchase Agreement”), with the noteholders party thereto (the “Mass Mutual Noteholders”). The Fifth Amendment amended certain financial and other covenants in the Note Purchase Agreement so that such financial and other covenants are the same or substantially equivalent to covenants under the 2012 Credit Agreement described above. The Fifth Amendment also amended certain provisions contained in the Note Purchase Agreement to reflect that amounts due under existing senior notes issued to the Mass Mutual Noteholders are no longer secured.
Amendments to Private Shelf Agreement and Note Purchase Agreement. Concurrently with its entry into the Credit Agreement Amendment, the Company entered into (i) the First Amendment (the “First Amendment”) to the Private Shelf Agreement and (ii) the Sixth Amendment (the “Sixth Amendment”) to the Note Purchase Agreement. The First Amendment and the Sixth Amendment amend the respective definitions of “EBITDA” in the Private Shelf Agreement and the Note Purchase Agreement to conform to the amended EBITDA definition contained in the Credit Agreement Amendment.
Debt Covenant Compliance and Noteholders Consent
The Company was in compliance with all covenant obligations under the aforementioned credit and note purchase agreements at December 31, 2013. In connection with its compliance with the covenant obligations as of December 31, 2012, the Company received a consent from its lender group to make a partial or complete withdrawal from the GCC/IBT National Pension Plan, and in connection with such withdrawal the Company recorded, as of December 31, 2012, a withdrawal liability with an estimated present value of $31.7 million. The lender group agreed to waive any event of default under the credit agreement that might occur as a result of such withdrawal and the incurrence of such withdrawal liability and acknowledged that the withdrawal liability incurred by the Company will not constitute indebtedness. See Note 20 – Multiemployer Pension Plans for more information regarding the withdrawal liability.
Other Debt Arrangements
In July 2013, the Company’s Belgium subsidiary entered into a financing arrangement for the purchase of production equipment in the amount of $0.1 million, with monthly payments over a three year period ending in June 2016. The balance outstanding at December 31, 2013 is $0.1 million, of which less than $0.1 million is included in Current portion of long-term debt and $0.1 million is included in Long-term debt.
Management believes that the level of working capital is adequate for the Company's liquidity needs related to normal operations both currently and in the foreseeable future, and that the Company has sufficient resources to support its operations, either through currently available cash and cash generated from future operations, or pursuant to its current credit facility. The Company’s ability to realize its near-term business objectives is subject to, among other things, its ability to remain in compliance with its covenants under its debt arrangements. Based on its 2013 business plan, which contains a number of assumptions related to economic trends and the Company’s business and operations, the Company presently expects to remain in compliance with its debt covenants for the foreseeable future; however compliance in 2014 and thereafter remains subject to many variables, including those described under “Risk Factors” contained in this report.
The Company operates in over 20 countries. The Company currently believes that there are no political, economic or currency restrictions that materially limit the Company’s flexibility in managing its global cash resources.
Seasonality
The seasonal fluctuations in business generally result in lower revenues in the first quarter as compared to the other quarters of the year ended December 31.
Off-Balance Sheet Arrangements and Contractual Obligations
The Company does not have any material off-balance sheet arrangements that have, or are reasonably likely to have, a current or future effect on its financial condition, changes in financial condition, revenue or expenses, results of operations, liquidity, capital expenditures or capital resources.
Cash flows from its historically profitable operations have permitted the Company to re-invest in the business through capital expenditures and acquisitions of complementary businesses. Over the next five years, assuming no significant business acquisitions, routine capital expenditures are expected to be in the range of $9.0 to $11.0 million annually. The Company’s revolving credit facility, which was amended and restated in January 2012, expires in three years and all of its long-term private placement debt matures over the next six years. The Company’s total contractual obligations total approximately $140 million, including all debt obligations (see contractual obligation table below.) At this time, the Company believes that cash flow from operations and its continued ability to refinance its maturing debt obligations will be sufficient to finance the Company during the next five years, assuming no significant business acquisitions. If a significant acquisition is undertaken in the next five years, the Company would likely need to access the debt and equity markets to finance such an acquisition.
The following table summarizes the effect that minimum debt, lease and other material noncancelable commitments are expected to have on the Company’s cash flow in the future periods:
|
Payments Due by Period
|
|||||||||||||||||||||
|
(in thousands)
|
Less
|
More
|
|||||||||||||||||||
|
than 1
|
1-3 | 3-5 |
than 5
|
||||||||||||||||||
|
Contractual Obligations
|
Total
|
Year
|
years
|
years
|
years
|
||||||||||||||||
|
Debt obligations
|
$ | 57,902 | $ | 1,266 | $ | 56 | $ | 31,580 | $ | 25,000 | |||||||||||
|
Interest on debt (1)
|
5,804 | 1,150 | 2,190 | 2,190 | 274 | ||||||||||||||||
|
Operating lease obligations
|
41,157 | 12,709 | 16,224 | 7,769 | 4,455 | ||||||||||||||||
|
Purchase obligations (2)
|
32,114 | 13,799 | 9,788 | 8,527 | -- | ||||||||||||||||
|
Deferred compensation
|
2,595 | 112 | 100 | 32 | 2,351 | ||||||||||||||||
|
Uncertain tax positions (3)
|
-- | -- | -- | -- | -- | ||||||||||||||||
|
Total
|
$ | 139,572 | $ | 29,036 | $ | 28,358 | $ | 50,098 | $ | 32,080 | |||||||||||
|
(1)
|
Reflects scheduled interest payments on fixed-rate debt. Variable-rate interest on approximately $31,580 of variable rate debt under its revolving credit agreement as of December 31, 2013 is excluded because regular interest payments are not scheduled and fluctuate depending on outstanding principal balance and market-rate interest levels.
|
|
(2)
|
Purchase obligations consist primarily of commitments relating to software maintenance, software hosting, consulting fees, and other purchase commitments.
|
|
(3)
|
As of December 31, 2013, the Company’s total liability for uncertain tax positions was $1,826, including $178 of accrued interest and penalties. It is expected that the amount of unrecognized tax benefits that will change in the next twelve months attributable to the anticipated settlement of examinations or statute closures will be in the range of $750 to $1,700.
|
Purchase obligations resulting from purchase orders entered in the normal course of business are not significant. The Company’s major service cost is employees’ labor.
The Company expects to fund future contractual obligations through funds generated from operations, together with general company financing transactions.
Critical accounting policies and estimates
The discussion and analysis of the Company’s financial condition and results of operations are based upon its consolidated financial statements, which have been prepared in accordance with accounting principles generally accepted in the United States. The preparation of these financial statements requires the Company to make estimates and judgments that affect the reported amount of assets and liabilities, revenues and expenses, and related disclosure of contingent assets and liabilities at the date of its financial statements. Actual results may differ from these estimates under different assumptions or conditions. Critical accounting estimates are defined as those that are reflective of significant judgments and uncertainties, and potentially result in materially different results under different assumptions and conditions. The Company believes that the following are the most critical accounting estimates that could have an effect on its reported results.
Accounts Receivable. The Company’s clients are primarily consumer product manufacturers, retailers and life science companies. Accounts receivable consist primarily of amounts due to the Company from its normal business activities. The Company’s allowance for doubtful accounts is determined using assumptions of minimum reserve requirement percentages applied to the aging of the Company’s trade accounts receivable, along with specific reserves for known collection issues. For example, the aging-based portion of the Company’s reserve is determined by applying a 25 percent reserve to amounts overdue by more than 120 days, a 60 percent reserve to amounts overdue by more than 180 days and a 100 percent reserve for amounts overdue by more than 365 days. In the Company’s experience, this policy as supplemented by specific reserves for known collection issues, broadly captures the credit risk in its receivables. Based on the Company’s estimates and assumptions, an allowance for doubtful accounts of $2.0 million was recorded at December 31, 2013, compared to an allowance of $2.1 million at December 31, 2012. A change in the Company’s assumptions would result in the Company recovering an amount of its accounts receivable that differs from the carrying value. Any difference could result in an increase or decrease in bad debt expense.
Impairment of Long-Lived Assets. The Company records impairment losses on long-lived assets used in operations when events and circumstances indicate that the assets might be impaired. Events that may indicate that certain long-lived assets might be impaired might include a significant downturn in the economy or the consumer packaging industry, a loss of a major customer or several customers, a significant decrease in the market value of an asset, a significant adverse change in the manner in which an asset is used or an adverse change in the physical condition of an asset. The Company tests long-lived assets for impairment when facts and circumstances have changed and a potential impairment trigger is indicated. Impairment is evaluated by a comparison of the carrying value of an asset to the estimated future net undiscounted cash flows expected to be generated by the asset. If this comparison indicates that an asset is impaired, the loss recognized is the amount by which the carrying value exceeds the estimated fair value.
The Company’s impairment losses in regard to long-lived assets have in recent years primarily related to surplus properties resulting from restructuring (i.e., facility consolidation) actions and customer relationship intangible assets. For significant losses, the Company estimates fair value based on market valuation studies performed by qualified third-party valuation experts. Assumptions used in estimating cash flows include among other things those assumptions concerning periods of operation and projections of revenues and costs of revenues, industry trends and market interest rates. There are inherent uncertainties associated with the judgments and estimates used in assessing asset impairment and it is possible that impairment charges recognized in a given period would differ if the assessment was made in a different period. During 2013, the Company recorded $0.5 million for impairment of long-lived assets related to customer relationship intangible assets at Company locations where projected cash flows did not support the carrying value of the assets. The expense is reflected as an Impairment of long-lived assets in the Consolidated Statements of Comprehensive Income (Loss) at December 31, 2013. A change in the Company’s business climate in future periods, including a significant downturn in the Company’s operations, could lead to a required assessment of the recoverability of the Company’s long-lived assets, resulting in future additional impairment charges.
Goodwill and Other Acquired Intangible Assets. The Company has made acquisitions in the past that included a significant amount of goodwill, customer relationships and, to a lesser extent, other intangible assets. Goodwill is subject to an annual (or under certain circumstances more frequent) impairment test based on its estimated fair value. Other intangible assets, including customer relationships, are amortized over their useful lives and are tested for impairment when facts and circumstances have changed and a potential impairment trigger is indicated. Events that may indicate potential impairment include a loss of, or a significant decrease in volume from, a major customer, a change in the expected useful life of an asset, a change in the market value of an asset, a significant adverse change in legal factors or business climate, unanticipated competition relative to a major customer or the loss of key personnel relative to a major customer. Impairment is evaluated in a recoverability test including a comparison of the carrying value of an asset to the future net undiscounted cash flows expected to be generated by the asset. If this comparison indicates that an acquired intangible asset is impaired, the loss recognized is the amount by which the carrying value exceeds the estimated fair value.
The Company performs a goodwill impairment test annually, or when events or changes in business circumstances indicate that the carrying value may not be recoverable. The Company performs its annual impairment test as of October 1 each year.
The Company performed its 2013 and 2012 goodwill impairment tests as of October 1, 2013 and 2012, respectively, and determined that no impairment of goodwill was indicated for either year. For both years, the Company performed its annual impairment review on a geographic basis at the operating segment level. The Company has determined that its operating segments are also its reporting units for goodwill testing. Using projection of operating cash flow for each reporting unit, the Company performed a step one assessment of the fair value of each reporting unit using the income approach (i.e. discounted cash flow, or “DCF”), as compared to the carrying value of each reporting unit. In addition, the Company utilized a market approach, which assumes that companies operating in the same industry will share similar characteristics and the company values will correlate to those characteristics, to validate the results of the income approach valuations. However, due to lack of comparable industry data, the Company ultimately relied on the income approach in arriving at the fair value of the reporting units. The DCF method was used due to company specific growth and profitability factors best captured in management’s projections, which are considered most representative of the future outlook for the reporting units.
The step one impairment analysis for the October 1, 2013 test indicated no potential impairment of the assigned goodwill. The following table summarizes the results of the Company’s step one impairment analysis as of October 1, 2013:
|
(in millions)
|
Americas
|
Europe
|
Asia Pacific
|
Total
|
||||||||||||||
|
Fair value of reporting unit
|
$ | 349.9 | $ | 56.9 | $ | 35.9 | $ | 442.7 | ||||||||||
|
Carrying value of reporting unit
|
$ | 206.8 | $ | 27.6 | $ | 12.0 | $ | 246.4 | ||||||||||
|
Percentage fair value over carrying value
|
69.2 |
%
|
106.3 |
%
|
197.8 |
%
|
79.6 | % | ||||||||||
|
Goodwill allocated to reporting unit
|
$ | 181.9 | $ | 14.1 | $ | 7.8 | $ | 203.8 | ||||||||||
Based on the October 1, 2013 closing price of the Company’s common stock, the Company had a market capitalization of $394.6 million, compared to its estimated fair value of $442.7 million, which indicates an implied control premium of approximately 12.2 percent.
The discounted cash flow model used for the income valuation approach was based on the Company’s ten-year projections of operating income for each reporting unit. The Company’s ten-year projection assumes revenue growth of 3 to 4 percent annually, with a commensurate increase in operating expenses. The discount rates used for the cash flow model varied from 14 percent to 16 percent, by reporting unit.
In evaluating the recoverability of goodwill, it is necessary to estimate the fair value of the reporting units. In making this assessment, the Company’s management relies on a number of factors to discount anticipated future cash flows, including operating results, business plans and present value techniques. There are inherent uncertainties in the assumptions and estimates used in developing future cash flows and management’s judgment is required in applying these assumptions and estimates to the analysis of goodwill impairment, including projecting revenues and profits, interest rates, cost of capital, tax rates, the corporation’s stock price and the allocation of shared or corporate items. Many of the factors used in assessing fair value are outside the control of management and it is reasonably likely that assumptions and estimates will change from period to period. These changes may result in future impairments. For example, the Company’s revenue growth rate could be lower than projected due to economic, industry or competitive factors or the discount rate used in the Company’s cash flow model could increase due to a change in market interest rates. Additionally, future goodwill impairment charges may be necessary if the Company’s market capitalization decreased due to a decline in the trading price of the Company’s common stock.
Income Taxes. Deferred tax assets and liabilities are determined based on the difference between the financial statement and tax basis of assets and liabilities using tax rates in effect for the year in which the differences are expected to reverse. A valuation allowance is provided when it is more likely than not that some portion of the deferred tax assets arising from temporary differences and net operating losses will not be realized. Federal, state and foreign tax authorities regularly audit The Company, like other multi-national companies, and tax assessments may arise several years after tax returns have been filed. The Company uses a two-step approach to recognizing and measuring uncertain tax positions. The first step is to evaluate the tax position for recognition by determining whether it is more likely than not that the position will be sustained on audit, including resolution of related appeals or litigation processes, if any. The second step is to measure the tax benefit as the largest amount that is more than 50 percent likely of being realized upon ultimate settlement.
The Company considers many factors when evaluating and estimating its tax positions and tax benefits, which may require periodic adjustments and which may not accurately anticipate actual outcomes. Actual outcomes could result in a change in reported income tax expense for a particular period. For example, the Company’s effective tax rates could be adversely affected by earnings being lower than anticipated in countries which have lower statutory rates and higher than anticipated in countries which have higher statutory rates, by changes in the valuation of deferred tax assets and liabilities, or by changes in the relevant tax, accounting or other laws, regulations, principles and interpretations. The Company is subject to audit in various jurisdictions, and such jurisdictions may assess additional income tax against it. Although the Company believes its tax estimates are reasonable, the final determination of tax audits and any related litigation could be materially different from its historical income tax provisions and accruals. The results of an audit or litigation could have a material effect on the Company’s operating results or cash flows in the period or periods for which that determination is made.
See Item 8, Note 12 – Income Taxes to the Consolidated Financial Statements for further discussion.
The Company has provided valuation allowances against deferred tax assets, primarily arising from the acquisition of Seven in 2005, due to the dormancy of the companies generating the tax assets or due to income tax rules limiting the availability of the losses to offset future taxable income. During 2011, the Company released approximately $6.4 million of certain valuation allowances that were no longer needed, principally for certain of the Company’s United Kingdom and Australian subsidiaries.
Exit Reserves. The Company records reserves for the consolidation of workforce and facilities of acquired companies. The exit plans are approved by company management prior to, or shortly after, the acquisition date. The exit plans provide for severance pay, lease abandonment costs and other related expenses. A change in any of the assumptions used to estimate the exit reserves that result in a decrease to the reserve would result in a decrease to goodwill. Any change in assumptions that result in an increase to the exit reserves would result in a charge to income. Exit reserves are adjusted when facts regarding a particular reserve have changed, indicating that the original reserve assumptions are no longer valid. For example, the sublease assumptions originally used in computing a reserve for a vacant leased property could become invalid because of a change in circumstances of a sublease tenant, requiring a recalculation of the correct reserve balance. During 2013, the Company reached an agreement for an early termination of the remaining lease related to exit reserves for acquisitions completed in 2004 and 2005 and the remaining reserve balance was reversed. See Item 8, Note 2 – Acquisitions to the Consolidated Financial Statements for further discussion.
Multiemployer Pension Plans. The Company contributes to a number of multiemployer defined benefit plans under the terms of collective bargaining agreements that cover its union-represented employees. Management monitors financial exposure to the Company and the strength of participating plans under the Pension Protection Act Zone Status hierarchy. At the direction of the Company’s Board of Directors, Management may enter into good faith bargaining to exit participating plans if a plan is severely underfunded. The Company records liabilities to exit a participating plan when an exit becomes both probable and estimable. Independent actuaries are engaged by the Company to estimate potential withdrawal liabilities.
During the fourth quarter of 2012, the Company recorded a $31.7 million withdrawal liability, which was the then present value of the estimated future payments required for withdrawal discounted at a risk free rate. The liability is $32.5 million at December 31, 2013, due to accretion of the present value discount of $0.8 million during 2013. See Item 8, Note 20 – Multiemployer Pension Plans to the Consolidated Financial Statements for further discussion.
Recent Accounting Pronouncements
In July 2013, the FASB issued ASU No. 2013-11, Income Taxes (Topic 740). The amendments in ASU 2013-11 provide guidance on the presentation of an unrecognized tax benefit when a net operating loss carryforward, a similar tax loss, or a tax credit carryforward exists. The amendments in ASU 2013-11 are effective prospectively for fiscal years, and interim periods within those years, beginning after December 15, 2013. The Company will be adopting ASU 2013-11 effective January 1, 2014. The adoption of this standard is not expected to have a material impact on the Company’s consolidated financial statements.
In February 2013, the FASB issued ASU No. 2013-02, Comprehensive Income (Topic 220). The amendments in ASU 2013-02 supersede and replace the presentation requirements for reclassifications out of accumulated other comprehensive income in ASU 2011-05 and ASU 2011-12 for all public and private organizations. The amendments would require an entity to provide additional information about reclassifications out of accumulated other comprehensive income. The amendments in ASU 2013-02 are effective prospectively for fiscal years, and interim periods within those years, beginning after December 15, 2012. The Company adopted ASU 2013-02 effective January 1, 2013. The adoption of this standard did not have a material impact on the Company’s consolidated financial statements.
Impact of Inflation
The Company believes that over the past three years inflation has not had a significant impact on the Company's results of operations.
Interest Rate Exposure
The Company has $31.6 million of variable rate debt outstanding at December 31, 2013 and expects to use its variable rate credit facilities during 2014 and beyond primarily for general corporate purposes, cash flow needs, and, to the extent opportunities arise, acquisitions and investments. The debt is variable to the Euro currency, Canadian and U.S. prime rates. Assuming interest rate volatility in the future is similar to what has been seen in recent years, the Company does not anticipate that short-term changes in interest rates will materially affect its consolidated financial position, results of operations or cash flows. An adverse change of 10 percent in interest rates (from 2.3 percent at December 31, 2013 to 2.6 percent) would add approximately $0.1 million of interest cost annually based on the variable rate debt outstanding at December 31, 2013. The Company’s $26.2 million in outstanding fixed rate debt at December 31, 2013 is fixed at rates that range from 4.38 percent to 8.98 percent.
Foreign Exchange Exposure
The Company is subject to changes in various foreign currency exchange rates. The Company’s principal currency exposures relate to the British Pound, Canadian Dollar, Euro, Chinese Yuan Renminbi, Malaysian Ringgit, Japanese Yen, Indian Rupee and the Australian Dollar. The Company’s 2013 results of operations were negatively affected by an increase in the average value of the U.S. dollar relative to most foreign currencies. An adverse change of 10 percent in exchange rates would have resulted in a decrease in sales of $15.0 million, or 3.4 percent, and a decrease in income before income taxes of $1.9 million, or 9.3 percent, for the year ended December 31, 2013.
For the years ended December 31, 2013 and December 31, 2012, the Company recorded pre-tax foreign exchange losses of $1.3 million and $1.8 million, respectively. These losses were recorded by international subsidiaries primarily for currency exposure arising from intercompany debt obligations. These losses are included in Foreign exchange loss in the Consolidated Statements of Comprehensive Income (Loss). In order to mitigate foreign exchange rate exposure, the Company entered into several forward contracts, designated as fair value hedges, during 2012. See Item 8, Note 19 – Derivative Financial Instruments for more information.
|
Index to Financial Statements
|
|||||
|
Page
|
|||||
| 47 | |||||
|
Financial Statements:
|
|||||
| 48 | |||||
| 49 | |||||
| 50 | |||||
| 51 | |||||
| 52 | |||||
|
Financial Statement Schedule:
|
|||||
| 93 | |||||
To the Board of Directors and Stockholders of Schawk, Inc.
We have audited the accompanying consolidated balance sheets of Schawk, Inc. as of December 31, 2013 and 2012, and the related consolidated statements of comprehensive income (loss), stockholders’ equity, and cash flows for each of the three years in the period ended December 31, 2013. Our audits also included the financial statement schedule listed in the Index at Item 15(a)(2). These financial statements and schedule are the responsibility of Schawk Inc.’s management. Our responsibility is to express an opinion on these financial statements and schedule based on our audits.
We conducted our audits in accordance with the standards of the Public Company Accounting Oversight Board (United States). Those standards require that we plan and perform the audit to obtain reasonable assurance about whether the financial statements are free of material misstatement. An audit includes examining, on a test basis, evidence supporting the amounts and disclosures in the financial statements. An audit also includes assessing the accounting principles used and significant estimates made by management, as well as evaluating the overall financial statement presentation. We believe that our audits provide a reasonable basis for our opinion.
In our opinion, the financial statements referred to above present fairly, in all material respects, the consolidated financial position of Schawk, Inc. at December 31, 2013 and 2012, and the consolidated results of its operations and its cash flows for each of the three years in the period ended December 31, 2013, in conformity with U.S. generally accepted accounting principles. Also, in our opinion, the related financial statement schedule, when considered in relation to the basic financial statements taken as a whole, presents fairly in all material respects the information set forth therein.
We also have audited, in accordance with the standards of the Public Company Accounting Oversight Board (United States), Schawk, Inc.’s internal control over financial reporting as of December 31, 2013, based on criteria established in Internal Control-Integrated Framework issued by the Committee of Sponsoring Organizations of the Treadway Commission (1992 framework) and our report dated March 5, 2014 expressed an unqualified opinion thereon.
/s/ Ernst & Young LLP
Chicago, Illinois
March 5, 2014
Schawk, Inc.
(In thousands, except share amounts)
|
December 31,
|
December 31,
|
|||||||
|
2013
|
2012
|
|||||||
|
Assets
|
||||||||
|
Current assets:
|
||||||||
|
Cash and cash equivalents
|
$ | 6,171 | $ | 9,651 | ||||
|
Trade accounts receivable, less allowance for doubtful accounts
of $2,040 in 2013 and $2,052 in 2012
|
96,559 | 91,234 | ||||||
|
Unbilled services
|
18,095 | 20,924 | ||||||
|
Prepaid expenses and other current assets
|
8,584 | 10,100 | ||||||
|
Income tax receivable
|
2,053 | 3,032 | ||||||
|
Deferred income taxes
|
1,227 | 235 | ||||||
|
Current assets of discontinued operations
|
-- | 3,854 | ||||||
|
Total current assets
|
132,689 | 139,030 | ||||||
|
Property and equipment, net
|
59,003 | 60,583 | ||||||
|
Goodwill, net
|
201,913 | 211,903 | ||||||
|
Other intangible assets, net:
|
||||||||
|
Customer relationships
|
24,035 | 28,781 | ||||||
|
Other
|
461 | 633 | ||||||
|
Deferred income taxes
|
4,218 | 5,983 | ||||||
|
Other assets
|
8,222 | 6,771 | ||||||
|
Long term assets of discontinued operations
|
-- | 5,137 | ||||||
|
Total assets
|
$ | 430,541 | $ | 458,821 | ||||
|
Liabilities and stockholders’ equity
|
||||||||
|
Current liabilities:
|
||||||||
|
Trade accounts payable
|
$ | 17,132 | $ | 17,833 | ||||
|
Accrued expenses
|
51,137 | 55,218 | ||||||
|
Deferred income taxes
|
215 | 2,175 | ||||||
|
Income taxes payable
|
3,902 | 609 | ||||||
|
Current portion of long-term debt
|
1,266 | 4,262 | ||||||
|
Current liabilities of discontinued operations
|
-- | 1,134 | ||||||
|
Total current liabilities
|
73,652 | 81,231 | ||||||
|
Long-term liabilities:
|
||||||||
|
Long-term debt
|
56,636 | 78,724 | ||||||
|
Deferred income taxes
|
8,759 | 2,044 | ||||||
|
Other long-term liabilities
|
40,647 | 44,875 | ||||||
|
Long-term liabilities of discontinued operations
|
-- | 1,164 | ||||||
|
Total long-term liabilities
|
106,042 | 126,807 | ||||||
|
Stockholders’ equity:
|
||||||||
|
Common stock, $0.008 par value, 40,000,000 shares authorized, 31,321,010 and
31,172,666 shares issued at December 31, 2013 and 2012, respectively, 26,226,303
and 26,113,544 shares outstanding at December 31, 2013 and 2012, respectively
|
229 | 227 | ||||||
|
Additional paid-in capital
|
213,247 | 209,556 | ||||||
|
Retained earnings
|
92,000 | 93,897 | ||||||
|
Accumulated other comprehensive income, net
|
10,605 | 11,859 | ||||||
|
Treasury stock, at cost, 5,094,707 and 5,059,122 shares of common
stock at December 31, 2013 and 2012, respectively
|
(65,234 | ) | (64,756 | ) | ||||
|
Total stockholders’ equity
|
250,847 | 250,783 | ||||||
|
Total liabilities and stockholders’ equity
|
$ | 430,541 | $ | 458,821 | ||||
The Notes to Consolidated Financial Statements are an integral part of these consolidated statements.
Schawk, Inc.
(In thousands, except per share amounts)
|
Years Ended December 31,
|
|||||||||||||
|
2013
|
2012
|
2011
|
|||||||||||
|
Net revenues
|
$ | 442,640 | $ | 441,282 | $ | 427,421 | |||||||
|
Operating expenses:
|
|||||||||||||
|
Cost of services (excluding depreciation and amortization)
|
270,559 | 279,901 | 265,333 | ||||||||||
|
Selling, general, and administrative expenses (excluding depreciation and amortization)
|
118,706 | 120,006 | 107,534 | ||||||||||
|
Depreciation and amortization
|
18,136 | 17,416 | 16,331 | ||||||||||
|
Business and systems integration expenses
|
7,488 | 12,086 | 8,467 | ||||||||||
|
Acquisition integration and restructuring expenses
|
1,774 | 5,256 | 1,438 | ||||||||||
|
Foreign exchange loss
|
1,286 | 1,823 | 1,112 | ||||||||||
|
Impairment of long-lived assets
|
502 | 4,281 | 40 | ||||||||||
|
Multiemployer pension withdrawal expense
|
-- | 31,480 | 1,846 | ||||||||||
|
Operating income (loss)
|
24,189 | (30,967 | ) | 25,320 | |||||||||
|
Other income (expense):
|
|||||||||||||
|
Interest income
|
255 | 129 | 59 | ||||||||||
|
Interest expense
|
(4,324 | ) | (3,652 | ) | (5,270 | ) | |||||||
|
Income (loss) from continuing operations before income taxes
|
20,120 | (34,490 | ) | 20,109 | |||||||||
|
Income tax provision (benefit)
|
6,902 | (10,872 | ) | 697 | |||||||||
|
Income (loss) from continuing operations
|
13,218 | (23,618 | ) | 19,412 | |||||||||
|
Income (loss) from discontinued operations, net of tax
|
(6,693 | ) | 202 | 1,199 | |||||||||
|
Net income (loss)
|
$ | 6,525 | $ | (23,416 | ) | $ | 20,611 | ||||||
|
Earnings (loss) per share:
|
|||||||||||||
|
Basic:
|
|||||||||||||
|
Income (loss) from continuing operations
|
$ | 0.50 | $ | (0.91 | ) | $ | 0.75 | ||||||
|
Income (loss) from discontinued operations
|
(0.25 | ) | 0.01 | 0.05 | |||||||||
|
Net income (loss) per common share
|
$ | 0.25 | $ | (0.90 | ) | $ | 0.80 | ||||||
|
Diluted:
|
|||||||||||||
|
Income (loss) from continuing operations
|
$ | 0.50 | $ | (0.91 | ) | $ | 0.74 | ||||||
|
Income (loss) from discontinued operations
|
(0.25 | ) | 0.01 | 0.05 | |||||||||
|
Net income (loss) per common share
|
$ | 0.25 | $ | (0.90 | ) | $ | 0.79 | ||||||
|
Weighted average number of common and common equivalent shares outstanding:
|
|||||||||||||
|
Basic
|
26,286 | 25,924 | 25,790 | ||||||||||
|
Diluted
|
26,354 | 25,924 | 26,080 | ||||||||||
|
Dividends per Class A common share
|
$ | 0.32 | $ | 0.32 | $ | 0.32 | |||||||
|
Net income (loss)
|
$ | 6,525 | $ | (23,416 | ) | $ | 20,611 | ||||||
|
Foreign currency translation adjustments
|
(1,117 | ) | 2,779 | (2,167 | ) | ||||||||
|
Pension liability adjustments
|
(137 | ) | -- | -- | |||||||||
|
Comprehensive income (loss)
|
$ | 5,271 | $ | (20,637 | ) | $ | 18,444 | ||||||
The Notes to Consolidated Financial Statements are an integral part of these consolidated statements.
Schawk, Inc.
(In thousands)
|
Years Ended December 31,
|
|||||||||||||
|
2013
|
2012
|
2011
|
|||||||||||
|
Cash flows from operating activities
|
|||||||||||||
|
Net income (loss)
|
$ | 6,525 | $ | (23,416 | ) | $ | 20,611 | ||||||
|
Adjustments to reconcile net income to cash provided by operating activities:
|
|||||||||||||
|
Depreciation
|
14,713 | 13,709 | 12,892 | ||||||||||
|
Amortization
|
4,108 | 5,208 | 5,165 | ||||||||||
|
Impairment of long-lived assets
|
502 | 4,356 | 40 | ||||||||||
|
Non-cash restructuring charge
|
-- | 246 | 287 | ||||||||||
|
Deferred income taxes
|
4,123 | (10,524 | ) | (1,159 | ) | ||||||||
|
Amortization of deferred financing fees
|
262 | 301 | 606 | ||||||||||
|
Accretion of discount on multiemployer pension liability
|
833 | -- | -- | ||||||||||
|
Loss on sale of property and equipment
|
88 | 23 | 137 | ||||||||||
|
Loss realized from sale of business
|
6,251 | -- | -- | ||||||||||
|
Stock-based compensation expense
|
1,644 | 3,129 | 2,098 | ||||||||||
|
Tax benefit from stock options exercised
|
(247 | ) | (244 | ) | (293 | ) | |||||||
|
Changes in operating assets and liabilities, net of effects from acquisitions:
|
|||||||||||||
|
Trade accounts receivable
|
(7,264 | ) | 7,471 | (349 | ) | ||||||||
|
Unbilled services
|
2,792 | 2,769 | (2,393 | ) | |||||||||
|
Prepaid expenses and other current assets
|
863 | 1,234 | (818 | ) | |||||||||
|
Trade accounts payable, accrued expenses and other liabilities
|
(8,631 | ) | (5,669 | ) | (17,387 | ) | |||||||
|
Multiemployer pension plan withdrawal liability
|
-- | 29,837 | (7,004 | ) | |||||||||
|
Income taxes refundable (payable)
|
4,621 | 2,626 | (2,926 | ) | |||||||||
|
Net cash provided by operating activities
|
31,183 | 31,056 | 9,507 | ||||||||||
|
Cash flows from investing activities
|
|||||||||||||
|
Proceeds from sale of business
|
8,247 | -- | -- | ||||||||||
|
Proceeds from sales of property and equipment
|
412 | 31 | 157 | ||||||||||
|
Purchases of property and equipment
|
(13,211 | ) | (19,764 | ) | (24,721 | ) | |||||||
|
Acquisitions, net of cash acquired
|
-- | 2,449 | (25,232 | ) | |||||||||
|
Net cash used in investing activities
|
(4,552 | ) | (17,284 | ) | (49,796 | ) | |||||||
|
Cash flows from financing activities
|
|||||||||||||
|
Issuance of common stock
|
1,802 | 2,374 | 1,216 | ||||||||||
|
Proceeds from issuance of long-term debt
|
170,463 | 220,965 | 220,868 | ||||||||||
|
Payments of long-term debt including current portion
|
(195,337 | ) | (233,362 | ) | (192,257 | ) | |||||||
|
Tax benefit from stock options exercised
|
247 | 244 | 293 | ||||||||||
|
Payment of deferred financing fees
|
-- | (857 | ) | (21 | ) | ||||||||
|
Cash dividends paid
|
(8,368 | ) | (8,252 | ) | (8,199 | ) | |||||||
|
Purchase of common stock
|
-- | -- | (4,053 | ) | |||||||||
|
Net cash (used in) provided by financing activities
|
(31,193 | ) | (18,888 | ) | 17,847 | ||||||||
|
Effect of foreign currency rate changes
|
1,082 | 1,035 | (715 | ) | |||||||||
|
Net decrease in cash and cash equivalents
|
(3,480 | ) | (4,081 | ) | (23,157 | ) | |||||||
|
Cash and cash equivalents beginning of period
|
9,651 | 13,732 | 36,889 | ||||||||||
|
Cash and cash equivalents end of period
|
$ | 6,171 | $ | 9,651 | $ | 13,732 | |||||||
|
Supplementary cash flow disclosures:
|
|||||||||||||
|
Dividends issued in the form of Class A common stock
|
$ | 54 | $ | 54 | $ | 51 | |||||||
|
Cash paid for interest
|
$ | 3,006 | $ | 3,778 | $ | 3,840 | |||||||
|
Cash paid (refunds received) for income taxes, net
|
$ | (1,400 | ) | $ | (3,524 | ) | $ | 5,224 | |||||
The Notes to Consolidated Financial Statements are an integral part of these consolidated statements
|
Schawk, Inc.
|
|
Years Ended December 31, 2011, 2012 and 2013
|
|
(In thousands, except share amounts)
|
|
Class A
Common
Shares
Outstanding
|
Class A
Common
Stock
|
Additional
Paid-In
Capital
|
Retained
Earnings
|
Accumulated
Other
Comprehensive
Income (Loss)
|
Treasury
Stock
|
Total
Stockholders
Equity
|
|||||||||||||||
|
Balance at December 31, 2010
|
25,761,334 | $ | 224 | $ | 200,205 | $ | 113,258 | $ | 11,247 | $ | (60,808 | ) | $ | 264,126 | |||||||
|
Net income
|
-- | -- | -- | 20,611 | -- | -- | 20,611 | ||||||||||||||
|
Foreign currency translation adjustment
|
-- | -- | -- | -- | (2,167 | ) | -- | (2,167) | |||||||||||||
|
Sale of Class A common stock
|
226,917 | 1 | 783 | -- | -- | -- | 784 | ||||||||||||||
|
Tax benefit from stock options exercised
|
-- | -- | 293 | -- | -- | -- | 293 | ||||||||||||||
|
Stock issued under employee stock purchase plan
|
33,348 | -- | 432 | -- | -- | -- | 432 | ||||||||||||||
|
Stock-based compensation expense
|
-- | -- | 2,098 | -- | -- | -- | 2,098 | ||||||||||||||
|
Purchase of Class A treasury stock
|
(322,241 | ) | -- | -- | -- | -- | (4,053 | ) | (4,053) | ||||||||||||
|
Issuance of Class A common stock
under dividend reinvestment program
|
3,767 | -- | -- | (51 | ) | -- | 51 | -- | |||||||||||||
|
Cash dividends
|
-- | -- | -- | (8,199 | ) | -- | -- | (8,199) | |||||||||||||
|
Balance at December 31, 2011
|
25,703,125 | 225 | 203,811 | 125,619 | 9,080 | (64,810 | ) | 273,925 | |||||||||||||
|
Net loss
|
-- | -- | -- | (23,416 | ) | -- | -- | (23,416) | |||||||||||||
|
Foreign currency translation adjustment
|
-- | -- | -- | -- | 2,779 | -- | 2,779 | ||||||||||||||
|
Sale of Class A common stock
|
373,091 | 2 | 1,969 | -- | -- | -- | 1,971 | ||||||||||||||
|
Tax benefit from stock options exercised
|
-- | -- | 244 | -- | -- | -- | 244 | ||||||||||||||
|
Stock issued under employee stock purchase plan
|
33,058 | -- | 403 | -- | -- | -- | 403 | ||||||||||||||
|
Stock-based compensation expense
|
-- | -- | 3,129 | -- | -- | -- | 3,129 | ||||||||||||||
|
Issuance of Class A common stock
under dividend reinvestment program
|
4,270 | -- | -- | (54 | ) | -- | 54 | -- | |||||||||||||
|
Cash dividends
|
-- | -- | -- | (8,252 | ) | -- | -- | (8,252) | |||||||||||||
|
Balance at December 31, 2012
|
26,113,544 | 227 | 209,556 | 93,897 | 11,859 | (64,756 | ) | 250,783 | |||||||||||||
|
Net income
|
-- | -- | -- | 6,525 | -- | -- | 6,525 | ||||||||||||||
|
Foreign currency translation adjustment
|
-- | -- | -- | -- | (1,117 | ) | -- | (1,117) | |||||||||||||
|
Pension liability adjustment
|
-- | -- | -- | -- | (137 | ) | -- | (137) | |||||||||||||
|
Sale of Class A common stock
|
120,133 | 2 | 1,447 | -- | -- | -- | 1,449 | ||||||||||||||
|
Tax benefit from stock options exercised
|
-- | -- | 247 | -- | -- | -- | 247 | ||||||||||||||
|
Stock issued under employee stock purchase plan
|
28,211 | -- | 353 | -- | -- | -- | 353 | ||||||||||||||
|
Stock-based compensation expense
|
-- | -- | 1,644 | -- | -- | -- | 1,644 | ||||||||||||||
|
Purchase of Class A treasury stock
|
(39,739 | ) | -- | -- | -- | -- | (532 | ) | (532) | ||||||||||||
|
Issuance of Class A common stock
under dividend reinvestment program
|
4,154 | -- | -- | (54 | ) | -- | 54 | -- | |||||||||||||
|
Cash dividends
|
-- | -- | -- | (8,368 | ) | -- | -- | (8,368) | |||||||||||||
|
Balance at December 31, 2013
|
26,226,303 | $ | 229 | $ | 213,247 | $ | 92,000 | $ | 10,605 | $ | (65,234 | ) | $ | 250,847 | |||||||
The Notes to Consolidated Financial Statements are an integral part of these financial statements.
Schawk, Inc.
(In thousands, except per share data)
Note 1 - Significant Accounting Policies
Basis of Presentation
The Company’s consolidated financial statements have been prepared pursuant to the rules and regulations of the Securities and Exchange Commission (“SEC”). Certain previously reported immaterial amounts have been reclassified to conform to the current-period presentation. Other than as disclosed, there have been no material events subsequent to the balance sheet date that would have affected the amounts recorded or disclosed in the Company’s financial statements.
Principles of Consolidation
The consolidated financial statements include the accounts of all wholly and majority owned subsidiaries. All intercompany accounts and transactions have been eliminated in consolidation.
Cash Equivalents
Cash equivalents include highly liquid debt instruments and time deposits having an original maturity at the date of purchase of three months or less. Cash equivalents are stated at cost, which approximates fair value.
Accounts Receivable and Concentration of Credit Risk
The Company sells its products to a wide range of clients in the consumer products, retail and advertising industries. The Company performs ongoing credit evaluations of its clients and does not require collateral. An allowance for doubtful accounts and credit memos is maintained at a level management believes is sufficient to cover potential losses. The Company evaluates the collectability of its accounts receivable based on the length of time the receivable is past due and its historic experience of write-offs. Trade accounts receivable are charged to the allowance when the Company determines that the receivable will not be collectible. Trade accounts receivable balances are determined to be delinquent when the amount is past due, based on the payment terms with the customer. An allowance for credit memos is maintained based upon historical credit memo issuance.
Unbilled Services
The Company’s unbilled services include made-to-order graphic designs, images and text for a variety of media in the consumer products and retail and advertising industries. The costs of unbilled services consist primarily of deferred labor, overhead costs, and production supplies that are direct and incremental relating to customer arrangements, and realizable based on projected net revenues to be recognized on completion of the services underlying the arrangement. The overhead pool of costs includes costs associated with direct labor employees (including direct labor costs not chargeable to specific jobs, which are also consider a direct cost of production) and all indirect costs associated with the production/creative design process, excluding any selling, general and administrative costs.
Property and Equipment
Property and equipment is stated at cost, less accumulated depreciation and amortization, and is being depreciated and amortized using the straight-line method over the estimated useful lives of the assets or the term of the leases, ranging from three to thirty years.
Goodwill
Acquired goodwill is subject to an annual impairment test and subject to testing at other times during the year if certain events occur indicating that the carrying value of goodwill may be impaired. Goodwill must be tested for impairment at the reporting unit level. For the purposes of the goodwill impairment test, the reporting units of the Company are defined on a geographic basis corresponding to the Company’s operating and reportable segments: Americas, Europe and Asia Pacific.
If the carrying amount of the reporting unit is greater than the fair value, goodwill impairment may be present. The Company measures the goodwill impairment based upon the fair value of the underlying assets and liabilities of the reporting unit and estimates the implied fair value of goodwill. Fair value is determined considering both the income approach (discounted cash flow), and the market approach. An impairment charge is recognized to the extent the recorded goodwill exceeds the implied fair value of goodwill.
The Company performs its annual goodwill impairment test as of October 1 each year. The Company performed its 2013 and 2012 goodwill test as of October 1, 2013 and 2012, respectively, and determined that no potential impairment of goodwill was indicated.
Software Developed for Internal Use
The Company capitalizes certain direct development costs associated with internal-use computer software. These costs are incurred during the application development stage of a project and include external direct costs of services and payroll costs for employees devoting time to the software projects principally related to software coding, designing system interfaces and installation and testing of the software. The costs capitalized are primarily employee compensation and outside consultant fees incurred to develop the software prior to implementation. These costs are recorded as fixed assets in computer software and licenses and are amortized over a period of from three to seven years beginning when the asset is substantially ready for use. Costs incurred during the preliminary project stage, as well as maintenance and training costs, are expensed as incurred.
Software Developed for Sale to Customers
All costs incurred to establish the technological feasibility of a computer software product to be sold, leased, or otherwise marketed are charged to expense when incurred. The costs of producing product masters incurred subsequent to establishing technological feasibility are capitalized. Those costs include coding and testing performed subsequent to establishing technological feasibility.
Long-lived Assets
The recoverability of long-lived assets, including amortizable intangibles, is evaluated by comparing their carrying value to the expected future undiscounted cash flows to be generated from such assets when events or circumstances indicate that impairment may have occurred. The Company also re-evaluates the periods of amortization of long-lived assets to determine whether events and circumstances warrant revised useful lives. If impairment has occurred, the carrying value of the long-lived asset is adjusted to its fair value, generally equal to the future estimated discounted cash flows associated with the asset.
Revenue Recognition
The Company derives revenue primarily from providing products and services to its clients on a custom-job basis using the completed performance method. Revenue is recognized when persuasive evidence of an arrangement exists, delivery has occurred or services performed, the fee is fixed or determinable, and collectability is reasonably assured. The Company records a revenue accrual entry at each month-end for jobs that meet these four criteria, but which have not yet been invoiced to the client. Revenue for services is recognized when the services are provided to the customer.
The Company also derives revenue through its Digital Solutions businesses from the sale of software, software implementation services, technical support services and managed application service provider services. The Company allocates revenue in an arrangement using its best estimate of selling price if neither vendor specific objective evidence “VSOE” nor third party evidence of selling price exists. In multiple-element software arrangements, the Company allocates revenue to each element based on its relative fair value. The fair value of any undelivered element is determined using VSOE or, in the absence of VSOE for all elements, the residual method when VSOE exists for all of the undelivered elements. In the absence of fair value for a delivered element, the Company first allocates revenue based on VSOE of the undelivered elements and the residual revenue to the delivered elements. Where VSOE of the undelivered elements cannot be determined, which is the case for the majority of the Company’s software revenue arrangements, the Company defers revenue for the delivered elements until undelivered elements are delivered and revenue is recognized ratably over the term of the underlying client contract, when obligations have been satisfied. For services performed on a time and materials basis where no other elements are included in the client contract, revenue is recognized upon performance once the revenue recognition criteria has been met.
Vendor Rebates
The Company has entered into agreements with several of its major suppliers for fixed rate discounts and volume discounts, primarily received in cash, on materials used in its production process. Some of the discounts are determined based upon a fixed discount rate, while others are determined based upon the purchased volume during a given period, typically one year. The Company recognizes the amount of the discounts as a reduction of the cost of materials either included in Unbilled services or as a credit to Cost of services to the extent that the product has been sold to a client. The Company recognizes the amount of volume discounts based upon an estimate of purchasing levels for a given period, typically one year, and past experience with a particular vendor. Some rebate payments are received monthly while others are received quarterly. Historically, the Company has not recorded significant adjustments to estimated vendor rebates.
Customer Rebates
The Company has rebate agreements with certain clients. The agreements offer discount pricing based on volume over a multi-year period. The Company accrues the estimated rebates over the term of the agreement. The Company accounts for changes in the estimated rebate amounts when it has been determined that the estimated sales for the rebate period have changed.
Shipping and Handling Fees and Costs
Shipping and handling fees billed to customers for product shipments are recorded in Net revenues in the Consolidated Statements of Comprehensive Income (Loss). Shipping and handling costs are included in unbilled services for jobs-in-progress and included in Cost of services in the Consolidated Statements of Comprehensive Income (Loss) when jobs are completed and revenue is recognized.
Income Taxes
Income taxes are accounted for using the asset and liability approach. Deferred tax assets and liabilities are determined based on the difference between the financial statement and tax basis of assets and liabilities using enacted tax rates in effect for the year in which the differences are expected to reverse. A valuation allowance is provided if, based on available evidence, it is more likely than not that some portion of the deferred tax assets will not be realized.
Foreign subsidiaries are taxed according to regulations existing in the countries in which they do business. Provision has not been made for United States income taxes on certain earnings of foreign subsidiaries that are considered to be permanently reinvested overseas.
The Company, like other multi-national companies, is regularly audited by federal, state and foreign tax authorities, and tax assessments may arise several years after tax returns have been filed. The Company addresses the determination of whether tax benefits claimed or expected to be claimed on a tax return should be recorded in the financial statements. The Company may recognize the tax benefit from an uncertain tax position only if it is more likely than not that the tax position will be sustained on examination by the taxing authorities, based on the technical merits of the position. The tax benefits recognized in the financial statements from such a position should be measured based on the largest benefit that has a greater than fifty percent likelihood of being realized upon ultimate settlement. The Company follows applicable guidance on de-recognition, classification, interest and penalties on income taxes, accounting in interim periods and disclosures of unrecognized tax benefits.
Use of Estimates
The preparation of financial statements in conformity with accounting principles generally accepted in the United States requires management to make estimates and assumptions that affect the reported amounts of assets and liabilities at the date of the financial statements and the reported amounts of revenues and expenses during the reporting period. Actual results could differ from those estimates.
Foreign Currency Translation
The Company's foreign subsidiaries use the local currency as their functional currency. Accordingly, foreign currency assets and liabilities are translated at the rate of exchange existing at the balance sheet date and income and expense amounts are translated at the average of the monthly exchange rates. Adjustments resulting from the translation of foreign currency financial statements into United States dollars are included in Accumulated other comprehensive income, net as a component of Stockholders’ equity.
Fair Value Measurements
Fair value is defined as the exchange price that would be received for an asset or paid to transfer a liability (an exit price) in the principal or most advantageous market for the asset or liability in an orderly transaction between market participants on the measurement date. Valuation techniques used to measure fair value must maximize the use of observable inputs and minimize the use of unobservable inputs. The Company uses a fair value hierarchy based on three levels of inputs, of which the first two are considered observable and the last unobservable.
|
·
|
Level 1 – Quoted prices in active markets for identical assets or liabilities. These are typically obtained from real-time quotes for transactions in active exchange markets involving identical assets.
|
|
·
|
Level 2 – Inputs, other than quoted prices included within Level 1, which are observable for the asset or liability, either directly or indirectly. These are typically obtained from readily-available pricing sources for comparable instruments.
|
|
·
|
Level 3 – Unobservable inputs, where there is little or no market activity for the asset or liability. These inputs reflect the reporting entity’s own assumptions of the data that market participants would use in pricing the asset or liability, based on the best information available in the circumstances.
|
For purposes of financial reporting, the Company has determined that the fair value of financial instruments including cash and cash equivalents, accounts receivable, accounts payable and long-term debt approximates carrying value at December 31, 2013 and 2012, except as follows:
|
December 31,
|
|||||||||
|
(in thousands)
|
2013
|
2012
|
|||||||
|
Fair value of fixed-rate notes payable
|
$ | 26,707 | $ | 30,392 | |||||
|
Carrying value of fixed-rate notes payable
|
$ | 26,229 | $ | 29,301 | |||||
The carrying value of amounts outstanding under the Company’s revolving credit agreement is considered to approximate fair value as interest rates vary, based on prevailing market rates. The fair value of the Company’s fixed rate notes payable is based on quoted market prices (Level 1 within the fair value hierarchy). Entities are permitted to choose to measure many financial instruments and certain other items at fair value. The Company did not elect the fair value measurement option for any of its financial assets or liabilities.
The Company’s multiemployer pension withdrawal liability is recorded at fair value and is categorized as Level 3 within the fair value hierarchy. The fair value of the multiemployer pension withdrawal liability was estimated using a present value analysis as of December 31, 2013. See Note 20 – Multiemployer Pension Plans for more information regarding the multiemployer pension withdrawal liability.
The following table summarizes the fair value as of December 31, 2013:
|
Level 1
|
Level 2
|
Level 3
|
Total
|
||||||||||||||
|
Multiemployer pension withdrawal liability
|
$ | -- | $ | -- | $ | 32,516 | $ | 32,516 | |||||||||
The following table summarizes the changes in the fair value of the Company’s multiemployer pension withdrawal liability during 2013:
|
Fair Value
|
|||||
|
Liability balance at January 1, 2013
|
$ | 31,683 | |||
|
Accretion of present value discount
|
833 | ||||
|
Liability balance at December 31, 2013
|
$ | 32,516 | |||
During 2013 and 2012, the Company has undertaken restructuring activities, as discussed in Note 4 – Acquisition Integration and Restructuring, tested its goodwill as discussed in Note 8 – Goodwill and Other Intangible Assets, and recorded certain asset impairments as discussed in Note 7 – Impairment of Long-Lived Assets. These activities required the Company to perform fair value measurements, based on Level 3 inputs, on a non-recurring basis, on certain asset groups to test for potential impairment. Certain of these fair value measurements indicated that the asset groups were impaired and, therefore, the assets were written down to fair value. Once an asset has been impaired, it is not remeasured at fair value on a recurring basis; however, it is still subject to fair value measurements to test for recoverability of the carrying amount.
Derivative Financial Instruments and Hedging Activities
To mitigate the risk of fluctuations associated with certain balance sheet items, the Company has implemented a derivative financial instruments management strategy that incorporates the use of derivative instruments to minimize significant unplanned fluctuations in earnings caused by volatility. The Company’s goal is to manage volatility by modifying the re-pricing characteristics of certain balance sheet items so that fluctuations are not, on a material basis, adversely affected by movements in the underlying factors. The Company may designate hedge accounting, for qualifying hedging instruments, based on the facts and circumstances surrounding a derivative financial instrument. In general, a derivative financial instrument is reported as an asset or a liability at its fair value. Changes in a derivative financial instrument’s fair value are reported in earnings unless the derivative has been designated in a qualifying hedging relationship for accounting purposes. During 2012, the Company entered into several forward contracts designated as fair value hedges at inception; however, as of May 2012, the Company discontinued its use of forward contracts and does not presently have hedges in place with regard to foreign currency.
Stock Based Compensation
The Company recognizes the cost of employee services received in exchange for awards of equity instruments, over the requisite service period, based upon the grant date fair value of those awards.
Recent Accounting Pronouncements
In July 2013, the FASB issued ASU No. 2013-11, Income Taxes (Topic 740). The amendments in ASU 2013-11 provide guidance on the presentation of an unrecognized tax benefit when a net operating loss carryforward, a similar tax loss, or a tax credit carryforward exists. The amendments in ASU 2013-11 are effective prospectively for fiscal years, and interim periods within those years, beginning after December 15, 2013. The Company will be adopting ASU 2013-11 effective January 1, 2014. The adoption of this standard is not expected to have a material impact on the Company’s consolidated financial statements.
In February 2013, the FASB issued ASU No. 2013-02, Comprehensive Income (Topic 220). The amendments in ASU 2013-02 supersede and replace the presentation requirements for reclassifications out of accumulated other comprehensive income in ASU 2011-05 and ASU 2011-12 for all public and private organizations. The amendments would require an entity to provide additional information about reclassifications out of accumulated other comprehensive income. The amendments in ASU 2013-02 are effective prospectively for fiscal years, and interim periods within those years, beginning after December 15, 2012. The Company adopted ASU 2013-02 effective January 1, 2013. The adoption of this standard did not have a material impact on the Company’s consolidated financial statements.
Note 2 - Acquisitions
Lipson Associates, Inc. and Laga, Inc.
Effective October 19, 2011, the Company acquired substantially all of the domestic assets and assumed certain trade account and business related liabilities of Lipson Associates, Inc. and Laga, Inc., as well as the stock of their foreign operations. Lipson Associates, Inc. and Laga, Inc. does business as Brandimage – Desgrippes & Laga (“Brandimage”).
Brandimage is a leading branding and design network specializing in providing services that seek to engage and enhance the brand experience, including brand positioning and strategy, product development and structural design, package design and environmental design. Brandimage has operations in Chicago, Cincinnati, Paris, Shanghai, and Hong Kong. The net assets and results of operations of Brandimage are included in the Consolidated Financial Statements as of October 19, 2011 in all three of the Company’s operating segments: Americas, Europe and Asia Pacific. The Brandimage business was acquired to enhance the Company’s service offerings related to branding and design and operates in conjunction with the Company's legacy brand development capabilities, which include its Anthem brand.
The purchase price of $24,562 consisted of $27,011 paid in cash at closing, less $2,449 received in 2012 for a net working capital adjustment. The Company recorded a final purchase price allocation in 2012 based on a fair value appraisal performed by an independent consulting company. In 2013, the Company corrected the purchase price allocation, reflecting the reversal of a liability and a reduction in goodwill, in the amount of $1,436. The goodwill ascribed to this acquisition consists largely of expected profitability from future services and is deductible for tax purposes to the extent related to the U.S. assets acquired.
A summary of the final fair values assigned to the acquired assets is as follows:
|
Accounts receivable
|
$ | 4,939 | |||
|
Inventory
|
4,117 | ||||
|
Prepaid expenses and other current assets
|
1,365 | ||||
|
Income tax receivable
|
8 | ||||
|
Property and equipment
|
482 | ||||
|
Goodwill
|
17,494 | ||||
|
Customer relationships
|
5,457 | ||||
|
Trade name
|
729 | ||||
|
Other assets
|
241 | ||||
|
Trade accounts payable
|
(3,247 | ) | |||
|
Accrued expenses
|
(7,192 | ) | |||
|
Notes payable
|
(23 | ) | |||
|
Deferred income taxes
|
(247 | ) | |||
|
Other long term liabilities
|
(1,522 | ) | |||
|
Total cash paid, net of $1,961 cash acquired
|
$ | 22,601 |
The weighted average amortization periods of the customer relationships intangible asset and the trade name intangibles asset is 8.0 years and 5.0 years, respectively. The intangible asset amortization expense related to the customer relationships intangible asset and the trade name intangible asset was $901, $830 and $250 for the years ended December 31, 2013, December 31, 2012, and December 31, 2011, respectively. The intangible asset amortization expense will be approximately $823 in 2014 and 2015, $794 in 2016 and $679 in both 2017 and 2018. Supplemental pro-forma information is not presented because the acquisition is considered to be immaterial to the Company’s consolidated financial statements.
Exit Reserves from Prior Acquisitions
The Company recorded exit reserves related to its acquisitions of Weir Holdings Limited and Seven Worldwide Holdings, Inc., which occurred in 2004 and 2005, respectively. The major expenses included in the exit reserves were employee severance and lease termination expenses. The exit reserve balances related to employee severance were paid in prior years. The exit reserve for lease termination expenses related to a facility with a lease expiring in 2014. During 2013, the Company reached an agreement with the landlord for an early termination of the lease and the remaining reserve balance was reversed.
The following table summarizes the reserve activity from 2011 through 2013:
|
Beginning of Period
|
Adjustments
|
Payments
|
End of Period
|
||||||||||||||
|
2011
|
$ | 780 | $ | (246 | ) | $ | (167 | ) | $ | 367 | |||||||
|
2012
|
$ | 367 | $ | 44 | $ | (87 | ) | $ | 324 | ||||||||
|
2013
|
$ | 324 | $ | (283 | ) | $ | (41 | ) | $ | -- | |||||||
Note 3 - Sale of Business and Discontinued Operations
On July 3, 2013, the Company completed the sale of various assets comprising its large-format printing business located in Los Angeles, California. The net assets of the large format printing business were considered to be held for sale as of June 30, 2013. The large-format printing business was considered to be outside of the Company’s core business and was included in the Americas segment. The aggregate selling price for the business was $10,444, comprised of $8,247 in cash, $2,000 in a secured subordinated note and $197 accrued as a receivable from the buyer for an estimated net working capital adjustment, which was settled in the first quarter of 2014. The results of operations of the business sold are reported as discontinued operations for all periods presented in this annual report and the assets and liabilities of the discontinued operation, prior to disposal, have been segregated in the Consolidated Balance Sheets.
The Company recorded a loss of $6,251 on the sale of the business during 2013, which is included in Income (loss) from discontinued operations on the Company’s Consolidated Statements of Comprehensive Income (Loss). Included in the net loss is a goodwill allocation of $7,000, representing a portion of the Company’s Americas reporting segment goodwill which was allocated to the large-format printing business.
The carrying amounts of the assets and liabilities sold, excluding allocated goodwill, were as follows:
|
Trade accounts receivable
|
$ | 3,956 | |||
|
Unbilled services
|
945 | ||||
|
Prepaid expenses and other current assets
|
58 | ||||
|
Current assets of discontinued operations
|
4,959 | ||||
|
Property and equipment, net
|
4,360 | ||||
|
Long term assets of discontinued operations
|
4,360 | ||||
|
Trade accounts payable
|
205 | ||||
|
Accrued expenses
|
670 | ||||
|
Current liabilities of discontinued operations
|
875 | ||||
|
Net assets of discontinued operations
|
$ | 8,444 | |||
Operating results for the discontinued operations for the periods presented in this annual report are as follows:
|
Years ended December 31,
|
|||||||||||||
|
2013
|
2012
|
2011
|
|||||||||||
|
Net revenues
|
$ | 8,772 | $ | 19,448 | $ | 27,872 | |||||||
|
Operating expenses:
|
|||||||||||||
|
Cost of services (excluding depreciation and amortization)
|
6,113 | 13,795 | 18,352 | ||||||||||
|
Selling, general and administrative expenses (excluding depreciation and amortization)
|
1,864 | 3,889 | 6,171 | ||||||||||
|
Depreciation and amortization
|
685 | 1,268 | 1,319 | ||||||||||
|
Acquisition integration and restructuring expenses
|
4 | 114 | 32 | ||||||||||
|
Impairment of long-lived assets
|
-- | 75 | -- | ||||||||||
|
Loss on sale of business
|
6,251 | -- | -- | ||||||||||
|
Operating income (loss)
|
$ | (6,145 | ) | $ | 307 | $ | 1,998 | ||||||
|
Income (loss) before income taxes
|
$ | (6,145 | ) | $ | 307 | $ | 1,998 | ||||||
|
Income tax provision
|
548 | 105 | 799 | ||||||||||
|
Income (loss) from discontinued operations, net of tax
|
$ | (6,693 | ) | $ | 202 | $ | 1,199 | ||||||
|
December 31,
2012
|
|||||
|
Trade accounts receivable, net
|
$ | 2,462 | |||
|
Unbilled services
|
1,197 | ||||
|
Prepaid expenses and other current assets
|
56 | ||||
|
Income tax receivable
|
139 | ||||
|
Current assets of discontinued operations
|
3,854 | ||||
|
Property and equipment, net
|
4,908 | ||||
|
Other assets
|
229 | ||||
|
Long term assets of discontinued operations
|
5,137 | ||||
|
Trade accounts payable
|
304 | ||||
|
Accrued expenses
|
523 | ||||
|
Deferred income taxes
|
307 | ||||
|
Current liabilities of discontinued operations
|
1,134 | ||||
|
Deferred income taxes
|
1,164 | ||||
|
Long-term liabilities of discontinued operations
|
1,164 | ||||
|
Net assets of discontinued operations
|
$ | 6,693 | |||
Note 4 - Acquisition Integration and Restructuring
In 2008, the Company initiated a cost reduction and restructuring plan involving a consolidation and realignment of its workforce and incurred costs for employee terminations, obligations for future lease payments, fixed asset impairments, and other associated costs. The Company continued its cost reduction efforts and incurred additional costs for facility closings and employee termination expenses during the years 2009 through 2013.
The following table summarizes the accruals recorded, adjustments, and the cash payments during the years ended December 31, 2013, 2012, and 2011 related to the cost reduction actions initiated during the years 2008 through 2013. The adjustments are comprised of reversals of previously recorded expense accruals and foreign currency translation adjustments. The remaining reserve balance of $3,719 is included on the Consolidated Balance Sheets at December 31, 2013 as follows: $3,155 in Accrued expenses and $564 in Other long-term liabilities.
|
Employee
Terminations
|
Lease
Obligations
|
Total
|
|||||||||||
|
Actions Initiated in 2008
|
|||||||||||||
|
Liability balance at December 31, 2010
|
$ | 142 | $ | 3,368 | $ | 3,510 | |||||||
|
New accruals
|
-- | -- | -- | ||||||||||
|
Adjustments
|
4 | 108 | 112 | ||||||||||
|
Cash payments
|
(146 | ) | (687 | ) | (833 | ) | |||||||
|
Liability balance at December 31, 2011
|
-- | 2,789 | 2,789 | ||||||||||
|
New accruals
|
-- | -- | -- | ||||||||||
|
Adjustments
|
-- | 562 | 562 | ||||||||||
|
Cash payments
|
-- | (590 | ) | (590 | ) | ||||||||
|
Liability balance at December 31, 2012
|
-- | 2,761 | 2,761 | ||||||||||
|
New accruals
|
-- | -- | -- | ||||||||||
|
Adjustments
|
-- | 346 | 346 | ||||||||||
|
Cash payments
|
-- | (850 | ) | (850 | ) | ||||||||
|
Liability balance at December 31, 2013
|
$ | -- | $ | 2,257 | $ | 2,257 | |||||||
|
Actions Initiated in 2009
|
|||||||||||||
|
Liability balance at December 31, 2010
|
$ | 104 | $ | -- | $ | 104 | |||||||
|
New accruals
|
21 | -- | 21 | ||||||||||
|
Adjustments
|
(1 | ) | -- | (1 | ) | ||||||||
|
Cash payments
|
(124 | ) | -- | (124 | ) | ||||||||
|
Liability balance at December 31, 2011
|
-- | -- | -- | ||||||||||
|
New accruals
|
-- | -- | -- | ||||||||||
|
Adjustments
|
-- | -- | -- | ||||||||||
|
Cash payments
|
-- | -- | -- | ||||||||||
|
Liability balance at December 31, 2012
|
-- | -- | -- | ||||||||||
|
New accruals
|
-- | -- | -- | ||||||||||
|
Adjustments
|
-- | -- | -- | ||||||||||
|
Cash payments
|
-- | -- | -- | ||||||||||
|
Liability balance at December 31, 2013
|
$ | -- | $ | -- | $ | -- | |||||||
|
Employee
Terminations
|
Lease
Obligations
|
Total
|
|||||||||
| Actions Initiated in 2010 | |||||||||||
|
Liability balance at December 31, 2010
|
$
|
570
|
$
|
--
|
$
|
570
|
|||||
|
New accruals
|
13
|
--
|
13
|
||||||||
|
Adjustments
|
(37)
|
--
|
(37)
|
||||||||
|
Cash payments
|
(138)
|
--
|
(138)
|
||||||||
|
Liability balance at December 31, 2011
|
408
|
--
|
408
|
||||||||
|
New accruals
|
10
|
--
|
10
|
||||||||
|
Adjustments
|
8
|
--
|
8
|
||||||||
|
Cash payments
|
(24)
|
--
|
(24)
|
||||||||
|
Liability balance at December 31, 2012
|
402
|
--
|
402
|
||||||||
|
New accruals
|
--
|
--
|
--
|
||||||||
|
Adjustments
|
(8)
|
--
|
(8)
|
||||||||
|
Cash payments
|
(394)
|
--
|
(394)
|
||||||||
|
Liability balance at December 31, 2013
|
$
|
--
|
$
|
--
|
$
|
--
|
|||||
|
Actions Initiated in 2011
|
|||||||||||
|
Liability balance at December 31, 2010
|
$
|
--
|
$
|
--
|
$
|
--
|
|||||
|
New accruals
|
957
|
--
|
957
|
||||||||
|
Adjustments
|
(15)
|
--
|
(15)
|
||||||||
|
Cash payments
|
(817)
|
--
|
(817)
|
||||||||
|
Liability balance at December 31, 2011
|
125
|
--
|
125
|
||||||||
|
New accruals
|
--
|
--
|
--
|
||||||||
|
Adjustments
|
(7)
|
--
|
(7)
|
||||||||
|
Cash payments
|
(103)
|
--
|
(103)
|
||||||||
|
Liability balance at December 31, 2012
|
15
|
--
|
15
|
||||||||
|
New accruals
|
--
|
--
|
--
|
||||||||
|
Adjustments
|
(15)
|
--
|
(15)
|
||||||||
|
Cash payments
|
--
|
--
|
--
|
||||||||
|
Liability balance at December 31, 2013
|
$
|
--
|
$
|
--
|
$
|
--
|
|||||
|
Employee
Terminations
|
Lease
Obligations
|
Total | |||||||||||
|
Actions Initiated in 2012
|
|||||||||||||
|
Liability balance at December 31, 2011
|
$ | -- | $ | -- | $ | -- | |||||||
|
New accruals
|
3,006 | 1,535 | 4,541 | ||||||||||
|
Adjustments
|
(26 | ) | 219 | 193 | |||||||||
|
Cash payments
|
(1,594 | ) | (567 | ) | (2,161 | ) | |||||||
|
Liability balance at December 31, 2012
|
1,386 | 1,187 | 2,573 | ||||||||||
|
New accruals
|
50 | -- | 50 | ||||||||||
|
Adjustments
|
(63 | ) | 214 | 151 | |||||||||
|
Cash payments
|
(1,347 | ) | (744 | ) | (2,091 | ) | |||||||
|
Liability balance at December 31, 2013
|
$ | 26 | $ | 657 | $ | 683 | |||||||
|
Actions Initiated in 2013
|
|||||||||||||
|
Liability balance at December 31, 2012
|
$ | -- | $ | -- | $ | -- | |||||||
|
New accruals
|
1,144 | 384 | 1,528 | ||||||||||
|
Adjustments
|
-- | -- | -- | ||||||||||
|
Cash payments
|
(669 | ) | (80 | ) | (749 | ) | |||||||
|
Liability balance at December 31, 2013
|
$ | 475 | $ | 304 | $ | 779 | |||||||
The combined expenses for the cost reduction and restructuring actions initiated in 2008 through 2011, shown in the tables above, were $1,050 for the year ended December 31, 2011. In addition, the Company recorded $388 for impairment charges, relocation expenses, and legal fees related to the Company’s restructuring activities during the year. For the year ended December 31, 2011, the total expense of $1,438 is presented as Acquisition integration and restructuring expense in the Consolidated Statements of Comprehensive Income (Loss).
The combined expenses for the cost reduction and restructuring actions initiated in 2008 through 2012, shown in the tables above, were $5,307 for the year ended December 31, 2012. In addition, the Company recorded $246 related to leasehold improvements at facilities being combined or closed, $197 for consulting, retention and other costs associated with facilities being combined or closed, and reversed reserves totaling $494 related to unfavorable leases and accrued property tax. For the year ended December 31, 2012, the total expense of $5,256 is presented as Acquisition integration and restructuring expense in the Consolidated Statements of Comprehensive Income (Loss).
The combined expenses for the cost reduction and restructuring actions initiated in 2008 through 2013, shown in the above table, were $2,052 for the year ended December 31, 2013. In addition, the Company recorded legal costs of $19 and reversed $40 related to a facility closure. For the year ended December 31, 2013, the total expense of $2,031 is presented in the Consolidated Statements of Comprehensive Income (Loss) as follows: $1,774 as Acquisition integration and restructuring expense and $257 as Interest expense.
The expense for the years 2008 through 2013 and the cumulative expense since the cost reductions program’s inception was recorded in the following operating segments:
|
Year ended December 31,
|
Americas
|
Europe
|
Asia
Pacific
|
Corporate
|
Total
|
||||||||||||||||
|
2013
|
$ | 1,376 | $ | 293 | $ | 104 | $ | 1 | $ | 1,774 | |||||||||||
|
2012
|
4,245 | 881 | 129 | 1 | 5,256 | ||||||||||||||||
|
2011
|
777 | 586 | -- | 75 | 1,438 | ||||||||||||||||
|
2010
|
1,136 | 555 | (70 | ) | 493 | 2,114 | |||||||||||||||
|
2009
|
3,398 | 1,400 | 992 | 453 | 6,243 | ||||||||||||||||
|
2008
|
5,460 | 3,552 | 248 | 889 | 10,149 | ||||||||||||||||
|
Cumulative since program inception
|
$ | 16,392 | $ | 7,267 | $ | 1,403 | $ | 1,912 | $ | 26,974 | |||||||||||
Note 5 – Unbilled Services
Unbilled services consist of the following:
| December 31, | |||||||||
| 2013 | 2012 | ||||||||
|
Unbilled services
|
$ | 16,476 | $ | 19,187 | |||||
|
Production supplies
|
1,619 | 1,737 | |||||||
|
Total
|
$ | 18,095 | $ | 20,924 | |||||
Note 6 - Property and Equipment
Property and equipment consists of the following:
|
December 31,
|
||||||||||
|
Useful Life
|
2013
|
2012
|
||||||||
|
Land and improvements
|
10-15 years
|
$ | 5,853 | $ | 6,295 | |||||
|
Buildings and improvements
|
15-30 years
|
18,035 | 17,917 | |||||||
|
Machinery and equipment
|
3-7 years
|
76,751 | 77,808 | |||||||
|
Leasehold improvements
|
Life of lease
|
22,174 | 21,478 | |||||||
|
Computer software and licenses
|
3-7 years
|
54,123 | 49,157 | |||||||
| 176,936 | 172,655 | |||||||||
|
Accumulated depreciation and amortization
|
(117,933 | ) | (112,072 | ) | ||||||
|
Total
|
$ | 59,003 | $ | 60,583 | ||||||
Computer software and licenses includes $195 and $846 of interest capitalized by the Company during 2013 and 2012, respectively, in connection with its information technology and business process improvement initiative.
Note 7 - Impairment of Long-lived Assets
The following table summarizes the impairment of long-lived assets by asset category for the periods presented in this Form 10-K:
|
Years Ended December 31,
|
|||||||||||||
|
2013
|
2012
|
2011
|
|||||||||||
|
Intangible assets, other than goodwill
|
$ | 502 | $ | 3,763 | $ | -- | |||||||
|
Land and buildings
|
-- | 518 | -- | ||||||||||
|
Other fixed assets
|
-- | -- | 40 | ||||||||||
|
Total
|
$ | 502 | $ | 4,281 | $ | 40 | |||||||
For the year ended December 31, 2013, impairment charges of $502 related to intangible assets are included in Impairment of long-lived assets on the Consolidated Statements of Comprehensive Income (Loss). The intangible asset impairment charge is comprised of $466 in the Americas operating segment for a customer relationship intangible asset for which future cash flows do not support the carrying value and $36 for customer relationship and trade name assets in the Asia Pacific operating segment, reflecting the Company’s decision to close the Seoul, Korea office acquired in its 2011 Brandimage acquisition.
For the year ended December 31, 2012, impairment charges of $4,281 are included in Impairment of long-lived assets on the Consolidated Statements of Comprehensive Income (Loss). The impairment of long-lived assets includes $3,763 related to impairments of intangible assets and $518 related to impairment of fixed assets. The intangible asset impairment charges were for customer relationship intangible assets at Company locations being restructured for which projected cash flows did not support the carrying values. The Company recorded the customer relationship impairment charges in the Americas and Europe operating segments in the amounts of $2,350 and $1,413, respectively. The fixed asset impairment charge of $518 related to Company-owned real estate in the Corporate segment which was written down to its estimated market value in 2012, in anticipation of a sale which was finalized in 2013.
In addition, for the year ended December 31, 2012, impairment charges of $246 are included in Acquisition integration and restructuring expenses on the Consolidated Statements of Comprehensive Income (Loss). These impairment charges relate to building improvements at Company facilities in the Americas operating segment that were combined with other operating facilities or shut-down and relate to the Company’s ongoing restructuring and cost reduction initiatives. See Note 4 – Acquisition Integration and Restructuring for further information.
During 2011, $40 was recorded for the impairment of various fixed assets. The expense for these write-downs is included in Impairment of long-lived assets in the Consolidated Statements of Comprehensive Income (Loss) in the Americas operating segment. In addition, there were $287 of impairments, primarily for leasehold improvements related to the Company’s cost reduction and capacity utilization initiatives which are included in Acquisition integration and restructuring expenses on the Consolidated Statements of Comprehensive Income (Loss). These charges were principally incurred in the Americas operating segment. Refer to Note 4 – Acquisition Integration and Restructuring for further information.
Note 8 - Goodwill and Other Intangible Assets
The Company’s intangible assets not subject to amortization consist entirely of goodwill. Under current accounting guidance, the Company’s goodwill is not amortized throughout the period, but is subject to an annual impairment test. The Company performs an impairment test annually, or when events or changes in business circumstances indicate that the carrying value may not be recoverable. The Company performs its annual impairment test as of October 1 each year.
The Company performed the required goodwill impairment tests for 2013 and 2012 as of October 1 of each year. The Company allocated its goodwill on a geographic basis to its operating segments, which were determined to be its reporting units for goodwill impairment testing. Using projections of operating cash flow for each reporting unit, the Company performed a step one assessment of the fair value of each reporting unit as compared to the carrying value of each reporting unit. The step one impairment analysis indicated no potential impairment of the assigned goodwill for either year.
The estimates and assumptions used by the Company to test its goodwill are consistent with the business plans and estimates used to manage operations and to make acquisition and divestiture decisions. The use of different assumptions could impact whether an impairment charge is required and, if so, the amount of such impairment. If the Company fails to achieve estimated volume and pricing targets, experiences unfavorable market conditions or achieves results that differ from its estimates, then revenue and cost forecasts may not be achieved, and the Company may be required to recognize impairment charges. Additionally, future goodwill impairment charges may be necessary if the Company’s market capitalization decreases due to a decline in the trading price of the Company’s common stock.
On July 3, 2013, the Company sold the operating assets, net of certain liabilities, of its large format printing business located in Los Angeles, California. The net assets of the large format printing business were considered to be held for sale as of June 30, 2013 and a portion of the goodwill in the Americas reporting unit was allocated to the business held for sale in the quarter ended June 30, 2013. The amount allocated to the large format printing business was $7,000 and this pretax amount is included in Income (loss) from discontinued operations, net of tax on the Consolidated Statements of Comprehensive Income (Loss) for the year ended December 31, 2013.
The changes in the carrying amount of goodwill by operating segment during the years ended December 31, 2013 and 2012 were as follows:
|
Asia
|
|||||||||||||||||
|
Americas
|
Europe
|
Pacific
|
Total
|
||||||||||||||
|
Cost:
|
|||||||||||||||||
|
December 31, 2011
|
$ | 198,510 | $ | 40,364 | $ | 10,037 | $ | 248,911 | |||||||||
|
Acquisitions
|
673 | -- | -- | 673 | |||||||||||||
|
Additional purchase accounting adjustments
|
4,301 | 1,368 | (430 | ) | 5,239 | ||||||||||||
|
Foreign currency translation
|
503 | 1,293 | 223 | 2,019 | |||||||||||||
|
December 31, 2012
|
203,987 | 43,025 | 9,830 | 256,842 | |||||||||||||
|
Goodwill allocated to business sold
|
(7,000 | ) | -- | -- | (7,000 | ) | |||||||||||
|
Additional purchase accounting adjustments
|
-- | (1,436 | ) | -- | (1,436 | ) | |||||||||||
|
Foreign currency translation
|
(1,512 | ) | 1,096 | (1,066 | ) | (1,482 | ) | ||||||||||
|
December 31, 2013
|
$ | 195,475 | $ | 42,685 | $ | 8,764 | $ | 246,924 | |||||||||
|
Accumulated impairment:
|
|||||||||||||||||
|
December 31, 2011
|
$ | (14,422 | ) | $ | (27,878 | ) | $ | (1,246 | ) | $ | (43,546 | ) | |||||
|
Foreign currency translation
|
(118 | ) | (1,251 | ) | (24 | ) | (1,393 | ) | |||||||||
|
December 31, 2012
|
(14,540 | ) | (29,129 | ) | (1,270 | ) | (44,939 | ) | |||||||||
|
Foreign currency translation
|
355 | (610 | ) | 183 | (72 | ) | |||||||||||
|
December 31, 2013
|
$ | (14,185 | ) | $ | (29,739 | ) | $ | (1,087 | ) | $ | (45,011 | ) | |||||
|
Net book value:
|
|||||||||||||||||
|
December 31, 2011
|
$ | 184,088 | $ | 12,486 | $ | 8,791 | $ | 205,365 | |||||||||
|
December 31, 2012
|
$ | 189,447 | $ | 13,896 | $ | 8,560 | $ | 211,903 | |||||||||
|
December 31, 2013
|
$ | 181,290 | $ | 12,946 | $ | 7,677 | $ | 201,913 | |||||||||
The Company’s other intangible assets subject to amortization are as follows:
|
December 31, 2013
|
||||||||||||||
|
Weighted
Average Life
|
Cost
|
Accumulated
Amortization
|
Net
|
|||||||||||
|
Customer relationships
|
13.9 years
|
$ | 55,377 | $ | (31,342 | ) | $ | 24,035 | ||||||
|
Digital images
|
5.0 years
|
450 | (450 | ) | -- | |||||||||
|
Developed technologies
|
3.0 years
|
712 | (712 | ) | -- | |||||||||
|
Non-compete agreements
|
3.6 years
|
827 | (790 | ) | 37 | |||||||||
|
Trade names
|
3.9 years
|
1,434 | (1,010 | ) | 424 | |||||||||
|
Contract acquisition cost
|
3.0 years
|
1,220 | (1,220 | ) | -- | |||||||||
|
13.1 years
|
$ | 60,020 | $ | (35,524 | ) | $ | 24,496 | |||||||
|
December 31, 2012
|
||||||||||||||
|
Weighted
Average Life
|
Cost
|
Accumulated
Amortization
|
Net
|
|||||||||||
|
Customer relationships
|
13.7 years
|
$ | 57,343 | $ | (28,562 | ) | $ | 28,781 | ||||||
|
Digital images
|
5.0 years
|
450 | (450 | ) | -- | |||||||||
|
Developed technologies
|
3.0 years
|
712 | (712 | ) | -- | |||||||||
|
Non-compete agreements
|
3.6 years
|
877 | (821 | ) | 56 | |||||||||
|
Trade names
|
3.9 years
|
1,469 | (892 | ) | 577 | |||||||||
|
Contract acquisition cost
|
3.0 years
|
1,220 | (1,220 | ) | -- | |||||||||
|
13.0 years
|
$ |
62,071
|
$ | (32,657 | ) | $ | 29,414 | |||||||
Other intangible assets were recorded at fair market value as of the dates of the acquisitions based upon independent third party appraisals. The fair values and useful lives assigned to customer relationship assets are based on the period over which these relationships are expected to contribute directly or indirectly to the future cash flows of the Company. The acquired companies typically have had key long-term relationships with Fortune 500 companies lasting 15 years or more. Because of the custom nature of the work that the Company does, it has been its experience that clients are reluctant to change suppliers.
During the year ended December 31, 2013, the Company recorded impairment charges of $502, comprised of a charge of $466 in the Americas operating segment for a customer relationship intangible asset for which future cash flows did not support the carrying value and a charge of $36 for customer relationship and trade name assets in the Asia Pacific operating segment, reflecting the Company’s decision to close the Seoul, Korea office acquired in its 2011 Brandimage acquisition.
During 2012, the Company recorded impairment charges of $2,350 and $1,413, in the Americas and Europe operating segments, respectively, for customer relationship assets for which projected cash flows did not support the carrying values. The impairment charges are included in Impairment of long-lived assets in the Consolidated Statements of Comprehensive Income (Loss). See Note 7 – Impairment of Long-lived Assets for more information.
Amortization expense for continuing operations was $4,089, $5,170 and $5,127 for 2013, 2012 and 2011, respectively. Amortization expense for each of the next five years is expected to be approximately $3,933 for 2014, $3,746 for 2015, $3,696 for 2016, $3,508 for 2017 and $3,434 for 2018.
Note 9 - Accrued Expenses
Accrued expenses consist of the following:
|
December 31,
|
|||||||||
|
2013
|
2012
|
||||||||
|
Accrued employee compensation
|
$ | 15,539 | $ | 14,689 | |||||
|
Other payroll-related expenses
|
9,980 | 12,085 | |||||||
|
Deferred revenue
|
8,813 | 10,229 | |||||||
|
Restructuring reserves
|
3,155 | 3,814 | |||||||
|
Accrued professional fees
|
2,624 | 3,066 | |||||||
|
Accrued customer rebates
|
1,629 | 2,154 | |||||||
|
Accrued sales and use taxes
|
1,564 | 1,729 | |||||||
|
Multiemployer pension withdrawal
|
1,261 | -- | |||||||
|
Vacant property reserve
|
725 | 1,535 | |||||||
|
Deferred lease costs
|
607 | 700 | |||||||
|
Accrued property taxes
|
575 | 568 | |||||||
|
Accrued interest
|
228 | 257 | |||||||
|
Facility exit reserve
|
-- | 120 | |||||||
|
Other
|
4,437 | 4,272 | |||||||
|
Total
|
$ | 51,137 | $ | 55,218 | |||||
Note 10 - Other Long-Term Liabilities
|
Other long-term liabilities consist of the following:
|
|
December 31,
|
|||||||||
|
2013
|
2012
|
||||||||
|
Multiemployer pension withdrawal
|
$ | 31,255 | $ | 31,683 | |||||
|
Deferred compensation
|
4,239 | 3,574 | |||||||
|
Reserve for uncertain tax positions
|
1,826 | 2,343 | |||||||
|
Deferred lease costs
|
904 | 1,339 | |||||||
|
Vacant property reserve
|
885 | 880 | |||||||
|
Restructuring reserve
|
564 | 1,941 | |||||||
|
Reserve for filing penalties
|
-- | 1,379 | |||||||
|
Employment tax reserve
|
520 | 1,018 | |||||||
|
Deferred revenue
|
380 | 439 | |||||||
|
Facility exit reserve
|
-- | 204 | |||||||
|
Other
|
74 | 75 | |||||||
|
Total
|
$ | 40,647 | $ | 44,875 | |||||
During 2013 and 2012, the Company recorded adjustments to several vacant property and exit reserves. The adjustments reflect changes in the projections of future costs for the vacant facilities due to reoccupation of vacated space, new sublease agreements executed and other changes in future cost and sublease income assumptions. During 2013, the Company recorded a $204 credit to income for the net effect of vacant property and exit reserve adjustments compared to expense of $476 recorded during 2012.
Note 11 - Debt
Debt obligations consist of the following:
|
December 31,
|
|||||||||
|
2013
|
2012
|
||||||||
|
Revolving credit agreement
|
$ | 31,580 | $ | 52,495 | |||||
|
Series A senior note payable - Tranche A
|
-- | 1,843 | |||||||
|
Series A senior note payable - Tranche B
|
1,229 | 2,458 | |||||||
|
Series F senior note payable
|
25,000 | 25,000 | |||||||
|
Other
|
93 | 1,190 | |||||||
|
Total
|
57,902 | 82,986 | |||||||
|
Less amounts due in one year or less
|
(1,266 | ) | (4,262 | ) | |||||
|
Long-term debt
|
$ | 56,636 | $ | 78,724 | |||||
Annual maturities of debt obligations at December 31, 2013 are as follows:
|
2014
|
$ | 1,266 | |||
|
2015
|
37 | ||||
|
2016
|
19 | ||||
|
2017
|
31,580 | ||||
|
2018
|
-- | ||||
|
Thereafter
|
25,000 | ||||
| $ | 57,902 |
Credit Facility and Senior Notes
Revolving Credit Facility
Amended and Restated Credit Facility. On January 27, 2012, the Company entered into a Second Amended and Restated Credit Agreement (the “2012 Credit Agreement”), among the Company, certain subsidiary borrowers of the Company, the financial institutions party thereto as lenders, JPMorgan Chase Bank, N.A., on behalf of itself and the other lenders as agent, and PNC Bank, National Association, on behalf of itself and the other lenders as syndication agent, in order to amend and restate the Company’s prior credit agreement that was scheduled to terminate on July 12, 2012.
The 2012 Credit Agreement provides for a five-year unsecured, multicurrency revolving credit facility in the principal amount of $125,000 (the “Credit Facility”), including a $10,000 swing-line loan subfacility and a $10,000 subfacility for letters of credit. The Company may, at its option and subject to certain conditions, increase the amount of the Credit Facility by up to $50,000 by obtaining one or more new commitments from new or existing lenders to fund such increase. Loans under the Credit Facility generally bear interest at a LIBOR or Federal funds rate plus a margin that varies with the Company’s cash flow leverage ratio, in addition to applicable commitment fees, with a maximum rate of LIBOR plus 225 basis points. At closing, the applicable margin on LIBOR-based loans was 175 basis points. The unutilized portion of the Credit Facility will be used primarily for general corporate purposes, such as working capital and capital expenditures, and, to the extent opportunities arise, acquisitions and investments.
At December 31, 2013, there was $25,000 outstanding under the LIBOR portion of the U.S. facility at an interest rate of approximately 1.88 percent. At the Company’s option, loans under the facility can bear interest at prime plus 1.5 percent. At December 31, 2013, there was $6,300 of prime rate borrowing outstanding at an interest rate of 4.00 percent. The Company’s Canadian subsidiary borrowed under the revolving credit facility in the form of bankers’ acceptance agreements and prime rate borrowings. At December 31, 2013, there was $280 outstanding under prime rate borrowings at an interest rate of approximately 3.75 percent.
The 2012 Credit Agreement contains various customary affirmative and negative covenants and events of default. Under the terms of the 2012 Credit Agreement, the Company is no longer subject to restrictive covenants on permitted capital expenditures. Certain restricted payments, such as regular dividends and stock repurchases, are permitted provided that the Company maintains compliance with its minimum fixed-charge coverage ratio (with respect to regular dividends) and a specified maximum cash-flow leverage ratio (with respect to other permitted restricted payments). Other covenants include, among other things, restrictions on the Company’s and in certain cases its subsidiaries’ ability to incur additional indebtedness; dispose of assets; create or permit liens on assets; make loans, advances or other investments; incur certain guarantee obligations; engage in mergers, consolidations or acquisitions, other than those meeting the requirements of the 2012 Credit Agreement; engage in certain transactions with affiliates; engage in sale/leaseback transactions; and engage in certain hedging arrangements. The 2012 Credit Agreement also requires compliance with specified financial ratios and tests, including a minimum fixed-charge coverage ratio and a maximum cash-flow ratio.
Amendment to the 2012 Credit Agreement. On September 12, 2012, the Company entered into Amendment No. 1 (the “Credit Agreement Amendment”) to the 2012 Credit Agreement. The Credit Agreement Amendment amended the definition of “EBITDA” in the 2012 Credit Agreement to permit the Company, for purposes of calculating EBITDA for financial covenant compliance, to add back certain expenses associated with the Company’s enterprise resource planning system up to certain amounts as specified in the Credit Agreement Amendment.
Senior Notes
In 2003, the Company entered into a private placement of debt to provide long-term financing in which it issued senior notes pursuant to note purchase agreements, which have since been amended as further discussed below. The senior note that was outstanding at December 31, 2013 bears interest at 8.98 percent. The remaining aggregate balance of the note, $1,229, is included in Current portion of long-term debt on the December 31, 2013 Consolidated Balance Sheets.
Amended and Restated Private Shelf Agreement. Concurrently with its entry into the 2012 Credit Agreement, on January 27, 2012, the Company entered into an Amended and Restated Note Purchase and Private Shelf Agreement with Prudential Investment Management, Inc. (“Prudential”) and certain existing noteholders and note purchasers named therein (the “Private Shelf Agreement”), which provides for a $75,000 private shelf facility for a period of up to three years (the “Private Shelf Facility”). At closing, the Company issued $25,000 aggregate principal amount of its 4.38% Series F Senior Notes due January 27, 2019 (the “Notes”) under the Private Shelf Agreement.
The Private Shelf Agreement contains financial and other covenants that are the same or substantially equivalent to covenants under the 2012 Credit Agreement described above. Notes issued under the Private Shelf Facility may have maturities of up to ten years and are unsecured. Either the Company or Prudential may terminate the unused portion of the Private Shelf Facility prior to its scheduled termination upon 30 days’ written notice. Any future borrowings under the Private Shelf Facility may be used for general corporate purposes, such as working capital and capital expenditures.
Amendment to Note Purchase Agreement. Concurrently with the entry into the Private Shelf Agreement, the Company entered into the Fifth Amendment (the “Fifth Amendment”) to the Note Purchase Agreement, dated as of December 23, 2003, as amended (the “Note Purchase Agreement”), with the noteholders party thereto (the “Mass Mutual Noteholders”). The Fifth Amendment amended certain financial and other covenants in the Note Purchase Agreement so that such financial and other covenants are the same or substantially equivalent to covenants under the 2012 Credit Agreement described above. The Fifth Amendment also amended certain provisions contained in the Note Purchase Agreement to reflect that amounts due under existing senior notes issued to the Mass Mutual Noteholders are no longer secured.
Amendments to Private Shelf Agreement and Note Purchase Agreement. Concurrently with its entry into the Credit Agreement Amendment, the Company entered into (i) the First Amendment (the “First Amendment”) to the Private Shelf Agreement and (ii) the Sixth Amendment (the “Sixth Amendment”) to the Note Purchase Agreement. The First Amendment and the Sixth Amendment amend the respective definitions of “EBITDA” in the Private Shelf Agreement and the Note Purchase Agreement to conform to the amended EBITDA definition contained in the Credit Agreement Amendment.
Debt Covenant Compliance and Noteholders Consent
The Company was in compliance with all covenant obligations under the aforementioned credit and note purchase agreements at December 31, 2013. In connection with its compliance with the covenant obligations as of December 31, 2012, the Company received a consent from its lender group to make a partial or complete withdrawal from the GCC/IBT National Pension Plan, and in connection with such withdrawal the Company recorded, as of December 31, 2012, a withdrawal liability with an estimated present value of $31,683. The lender group agreed to waive any event of default under the credit agreement that might occur as a result of such withdrawal and the incurrence of such withdrawal liability and acknowledged that the withdrawal liability incurred by the Company will not constitute indebtedness. See Note 20 – Multiemployer Pension Plans for more information regarding the withdrawal liability.
Other Debt Arrangements
In July 2013, the Company’s Belgium subsidiary entered into a financing arrangement for the purchase of production equipment in the amount of $110, with monthly payments over a three year period ending in June 2016. The balance outstanding at December 31, 2013 is $93, of which $37 is included in Current portion of long-term debt and $56 is included in Long-term debt.
Deferred Financing Fees
At December 31, 2013, the Company had $671 of unamortized deferred financing fees related to prior revolving credit facility and note purchase agreement amendments. The total amortization of deferred financing fees was $262, $301, and $606 for the years ended December 31, 2013, December 31, 2012 and December 31, 2011, respectively, and is included in Interest expense on the Consolidated Statements of Comprehensive Income (Loss).
Note 12 - Income Taxes
The domestic and foreign components of income (loss) from continuing operations before income taxes are as follows:
|
Years Ended December 31,
|
|||||||||||||
|
2013
|
2012
|
2011
|
|||||||||||
|
United States
|
$ | 13,015 | $ | (38,375 | ) | $ | 9,326 | ||||||
|
Foreign
|
7,105 | 3,885 | 10,783 | ||||||||||
|
Total
|
$ | 20,120 | $ | (34,490 | ) | $ | 20,109 | ||||||
The provision (benefit) for income taxes is comprised of the following:
|
Years Ended December 31,
|
|||||||||||||
|
2013
|
2012
|
2011
|
|||||||||||
| Current: | |||||||||||||
|
Federal
|
$ | 505 | $ | (2,601 | ) | $ | 104 | ||||||
|
State
|
419 | 484 | (299 | ) | |||||||||
|
Foreign
|
1,855 | 2,014 | 2,335 | ||||||||||
| 2,779 | (103 | ) | 2,140 | ||||||||||
|
Deferred:
|
|||||||||||||
|
Federal
|
1,977 | (8,676 | ) | 3,365 | |||||||||
|
State
|
905 | (2,319 | ) | 985 | |||||||||
|
Foreign
|
1,241 | 226 | (5,793 | ) | |||||||||
| 4,123 | (10,769 | ) | (1,443 | ) | |||||||||
|
Total
|
$ | 6,902 | $ | (10,872 | ) | $ | 697 | ||||||
The Company’s effective tax rate on continuing operations for the year ended December 31, 2013 is 34.3 percent as compared with 31.5 percent for 2012. The current year’s effective tax rate increase over the prior year was primarily the result of changes in valuation allowances offset by the utilization of tax credits during the year.
Reconciliation between the provision (benefit) for income taxes computed by applying the United States (“U.S.”) federal statutory tax rate to income (loss) from continuing operations before incomes taxes and the actual provision (benefit) is as follows:
|
Years ended December 31,
|
|||||||||||||
|
2013
|
2012
|
2011
|
|||||||||||
|
Income taxes at U.S. Federal statutory rate
|
35.0 | % | 35.0 | % | 35.0 | % | |||||||
|
Foreign rate differential
|
(15.6 | ) | 7.9 | (9.4 | ) | ||||||||
|
Valuation allowances
|
14.4 | (6.1 | ) | (32.0 | ) | ||||||||
|
Nondeductible expenses
|
6.5 | (3.6 | ) | 7.2 | |||||||||
|
Tax credits
|
(4.7 | ) | 1.3 | (2.2 | ) | ||||||||
|
Changes in estimates related to prior years
|
(4.5 | ) | (0.3 | ) | 0.4 | ||||||||
|
State income taxes
|
3.6 | 3.5 | 1.9 | ||||||||||
|
Uncertain tax positions
|
(2.6 | ) | (1.3 | ) | 0.9 | ||||||||
|
Others, net
|
2.2 | (4.9 | ) | 1.7 | |||||||||
| 34.3 | % | 31.5 | % | 3.5 | % | ||||||||
Temporary differences and carryforwards giving rise to deferred income tax assets and liabilities are as follows:
| December 31, | |||||||||
| 2013 | 2012 | ||||||||
| Deferred income tax assets: | |||||||||
|
Operating loss carryforwards
|
$ | 19,010 | $ | 27,492 | |||||
|
Multiemployer pension withdrawal liability
|
12,427 | 12,075 | |||||||
|
Income tax credit carryforwards
|
7,944 | 8,051 | |||||||
|
Capital loss carryforwards
|
5,353 | 6,029 | |||||||
|
Accruals and reserves not currently deductible
|
4,516 | 3,357 | |||||||
|
Deferred expenses
|
1,981 | 1,701 | |||||||
|
Restructuring reserves
|
1,462 | 2,201 | |||||||
|
Other
|
3,125 | 4,475 | |||||||
|
Deferred income tax assets
|
55,818 | 65,381 | |||||||
|
Valuation allowances
|
(23,864 | ) | (36,099 | ) | |||||
|
Deferred income tax assets, net
|
31,954 | 29,282 | |||||||
|
Deferred income tax liabilities:
|
|||||||||
|
Domestic subsidiary stock
|
(12,525 | ) | (8,208 | ) | |||||
|
Depreciation and amortization
|
(11,174 | ) | (7,544 | ) | |||||
|
Intangible assets
|
(6,046 | ) | (5,163 | ) | |||||
|
Inventory
|
(4,370 | ) | (5,286 | ) | |||||
|
Other
|
(1,368 | ) | (1,082 | ) | |||||
|
Deferred income tax liabilities
|
(35,483 | ) | (27,283 | ) | |||||
|
Net deferred tax asset (liability)
|
$ | (3,529 | ) | $ | 1,999 | ||||
As of December 31, 2013, the Company has U.S. state net operating loss carryforwards of $62,488, foreign net operating loss carryforwards of $62,708, foreign capital loss carryforwards of $26,639, and various U.S. and non–U.S. income tax credit carryforwards of $3,164 and $4,780, respectively, which will be available to offset future income tax liabilities. If not used, state net operating losses will begin to expire in 2017, and foreign net operating losses have no expiration period. Certain of these carryforwards are subject to limitations on use due to tax rules affecting acquired tax attributes, loss sharing between group members, and business continuation, and therefore the Company has established tax-effected valuation allowances against these tax benefits in the amount of $23,864 at December 31, 2013. The Company has total foreign tax credit carryforwards of $2,823, offset by a valuation allowance of $2,035 in 2013. The Company has the ability to claim a deduction for these credits prior to expiration, and thus the net carrying value of the credits of $788 assumes that a deduction would be claimed instead of a tax credit. If unutilized, these U.S. foreign tax credits will begin to expire in 2016.
The undistributed earnings of foreign subsidiaries were approximately $59,769 and $42,943 at December 31, 2013 and 2012, respectively. No income taxes are provided on the undistributed earnings because they are considered permanently reinvested. It is not practicable to estimate the additional income taxes, including applicable withholding taxes, that would be payable if such remittance of undistributed earnings occurred.
It is expected that the amount of unrecognized tax benefits that will change in the next twelve months attributable to the anticipated settlement of examinations or statute closures will be in the range of $750 to $1,700. Of the total amount of unrecognized tax benefits of $1,758, approximately $1,620 would reduce the effective tax rate.
The Company’s U.S. federal income tax returns are open for examination from 2009 forward. State income tax returns are generally subject to examination for a period of 3 to 5 years after filing of the respective return. The impact of any federal changes remains subject to examination by various states for a period of up to one year after formal notification to the states. The Company has various state income tax returns in the process of examination, administrative appeals or litigation.
The Company recognizes accrued interest related to unrecognized tax benefits and penalties in income tax expense in the Consolidated Statements of Comprehensive Income (Loss). During the years ended December 31, 2013 and 2012, the Company recognized $(176) and $81 in net interest (benefit) expense, respectively. The Company had approximately $178 and $360 of accrued interest expense and penalties for December 31, 2013, and 2012, respectively.
A reconciliation of the beginning and ending amount of gross unrecognized tax benefits is as follows:
|
2013
|
2012
|
2011
|
||||||||||
|
Balance at January 1
|
$ | 2,093 | $ | 1,362 | $ | 4,249 | ||||||
|
Reductions related to settlements
|
-- | (31 | ) | -- | ||||||||
|
Additions related to tax positions in current year
|
351 | -- | 181 | |||||||||
|
Additions related to tax positions in prior years
|
162 | 888 | 91 | |||||||||
|
Reductions due to statute closures
|
(383 | ) | (141 | ) | (3,184 | ) | ||||||
|
Reductions for tax positions in prior years
|
(444 | ) | -- | -- | ||||||||
|
Foreign currency translation
|
(21 | ) | 15 | 25 | ||||||||
|
Balance at December 31
|
$ | 1,758 | $ | 2,093 | $ | 1,362 | ||||||
Note 13 - Related Party Transactions
The Company leases land and a building from a related party. See Note 14 – Leases.
Note 14 - Leases
The Company leases land and a building in Des Plaines, Illinois from a related party. Total rent expense incurred under this operating lease was $585 in 2013, $585 in 2012, and $583 in 2011.
The Company leases various plant facilities and equipment under operating leases that cannot be cancelled and expire at various dates through September 2023. Some of the leases contain renewal options and leasehold improvement incentives. Leasehold improvement incentives received from landlords are deferred and recognized as a reduction of rent expense over the respective lease term. Rent expense is recorded on a straight-line basis, taking into consideration lessor incentives and scheduled rent increases. Total rent expense incurred under all operating leases was approximately $13,553, $14,376, and $13,325 for the years ended December 31, 2013, 2012 and 2011, respectively.
Future minimum payments under leases with terms of one year or more are as follows at December 31, 2013:
|
Operating Leases
|
||||||||||||
|
Gross rents
|
Subleases
|
Net rents
|
||||||||||
|
2014
|
$ | 14,127 | $ | (1,418 | ) | $ | 12,709 | |||||
|
2015
|
9,844 | (641 | ) | 9,203 | ||||||||
|
2016
|
7,630 | (609 | ) | 7,021 | ||||||||
|
2017
|
5,474 | (429 | ) | 5,045 | ||||||||
|
2018
|
2,903 | (179 | ) | 2,724 | ||||||||
|
Thereafter
|
4,455 | -- | 4,455 | |||||||||
| $ | 44,433 | $ | (3,276 | ) | $ | 41,157 | ||||||
Note 15 - Employee Benefit Plans
The Company has various defined contribution plans for the benefit of its employees. The Company’s 401(k) Plan, which covers mainly non-union employees in the United States, provides for a match of employee contributions based on the Company’s performance to a target of earnings before interest, taxes, depreciation and amortization. The matching contribution was 1.5 percent of compensation for 2013. Contributions to the plans were $1,027, $1,432, and $1,743 in 2013, 2012 and 2011, respectively. In addition, the Company’s European subsidiaries contributed $898, $897 and $816 to several defined-contribution plans for their employees in 2013, 2012 and 2011, respectively. The Company also maintains a defined benefit pension plan covering employees at its Brandimage French subsidiary and has recorded a liability of $1,128 and $867, as of December 31, 2013, and December 31, 2012, respectively, for this plan.
The Company established an employee stock purchase plan on January 1, 1999 that permits employees to purchase common shares of the Company through payroll deductions. The number of shares issued for this plan was 28 in 2013, 33 in 2012, and 33 in 2011. The shares were issued at a 5 percent discount from the end-of-quarter closing market price of the Company’s common stock. The discount from market value was $19, $21 and $23 in 2013, 2012 and 2011, respectively.
The Company also has a non-qualified income deferral plan for which certain highly-compensated employees are eligible. The plan allows eligible employees to defer a portion of their compensation until retirement or separation from the Company. The plan is unfunded and is an unsecured liability of the Company. The Company’s liability under the plan was $1,697 and $1,591 at December 31, 2013 and December 31, 2012, respectively, and is included in Other long-term liabilities on the Consolidated Balance Sheets.
The Company has a deferred compensation agreement with the Chairman of the Board of Directors dated June 1, 1983 which was ratified and included in a restated employment agreement dated October 1, 1994. The agreement provides for deferred compensation for 10 years equal to 50 percent of final salary and was modified on March 9, 1998 to determine a fixed salary level for purposes of this calculation. The Company has a deferred compensation liability equal to $815 at December 31, 2013 and December 31, 2012 which is included in Other long-term liabilities on the Consolidated Balance Sheets. The liability was calculated using the net present value of ten annual payments at a 6 percent discount rate assuming, for calculation purposes only, that payments begin one year from the balance sheet date.
The Company has collective bargaining agreements with production employees representing approximately 7 percent of its workforce. The significant contracts are with local units of the Graphic Communications Conference of the International Brotherhood of Teamsters, the Communications, Energy & Paperworkers Union of Canada and the GPMU union in the UK and expire in 2014 through 2017. The percentage of employees covered by contracts expiring within one year is approximately 2 percent.
The Company is required to contribute to certain union sponsored defined benefit pension plans under various labor contracts covering union employees. Pension expense related to the union plans, which is determined based upon payroll data, was approximately $602, $813 and $912 in 2013, 2012 and 2011, respectively. See Note 20 - Multiemployer Pension Plans for additional information.
Note 16 - Stock Based Compensation
The Company recognizes the cost of employee services received in exchange for awards of equity instruments based upon the grant date fair value of those awards.
2006 Long-Term Incentive Plan
Effective May 17, 2006, the Company’s stockholders approved the Schawk Inc. 2006 Long-Term Incentive Plan (“2006 Plan”). The 2006 Plan provides for the grant of stock options, stock appreciation rights, restricted stock, restricted stock units, performance-based awards and other cash and stock-based awards to officers, other employees and directors of the Company. Options and stock appreciation rights granted under the plan have an exercise price equal to the market price of the underlying stock at the date of grant and are exercisable for a period of ten years from the date of grant. Options and stock appreciation rights granted pursuant to the 2006 Plan vest over a three-year period. The total number of shares of common stock available for issuance under the 2006 Plan is 1,377 as of December 31, 2013.
The equity compensation grants made by the Company during 2013, with the exception of non-qualified stock options granted to its outside directors, were in the form of stock-settled stock appreciation rights and restricted stock units, rather than stock options and shares of restricted stock, as had been granted in prior periods.
The Company issued 176, 130 and 111 stock options or stock appreciation rights, as well as 145, 149 and 126 restricted shares or restricted stock units, during the years ended December 31, 2013, 2012 and 2011, respectively, under the 2006 Plan.
Options and Stock Appreciation Rights
The Company has granted stock options and stock-settled stock appreciation rights under several stock-based compensation plans. The Company’s 2003 Equity Option Plan provides for the granting of options and stock appreciation rights to purchase up to 6,452 shares of Class A common stock to key employees. The Company also adopted an Outside Directors’ Formula Stock Option Plan authorizing unlimited grants of options to purchase shares of Class A common stock to outside directors. Options granted under both plans have an exercise price equal to the market price of the underlying stock at the date of grant and are exercisable for a period of ten years from the date of grant. Options and stock appreciation rights granted pursuant to the 2003 Equity Option Plan vest over a three-year period. Options granted pursuant to the Outside Directors Stock Option Plan vest over a two-year period. The Company issues new shares of its Class A common stock for option and stock appreciation rights exercises.
The Company issued 15, 17 and 15 stock options during 2013, 2012 and 2011, respectively, to its directors under the Outside Directors Stock Option Plan.
The Company recorded $692, $780 and $888 of compensation expense relating to outstanding options and stock appreciation rights during the years ended December 31, 2013, 2012, and 2011, respectively.
The Company records compensation expense for employee stock options and stock appreciation rights based on the estimated fair value of the options and stock appreciation rights on the date of grant using the Black-Scholes option-pricing model with the assumptions included in the table below. The Company uses historical data among other factors to estimate the expected price volatility, the expected option life and the expected forfeiture rate. The risk-free rate is based on the U.S. Treasury yield curve in effect at the time of grant for the estimated life of the option.
The following assumptions were used to estimate the fair value of options and stock appreciation rights granted during the years ended December 31, 2013, 2012 and 2011 using the Black-Scholes option pricing model:
| 2013 | 2012 | 2011 | |||||||||||||
|
Expected dividend yield
|
2.78 - 2.84 |
%
|
2.73 |
%
|
1.57 - 2.66 | % | |||||||||
|
Expected stock price volatility
|
54.61 - 56.36 |
%
|
53.52 - 57.19 |
%
|
48.80 - 53.21 | % | |||||||||
|
Risk-free interest rate range
|
1.26 - 1.68 |
%
|
1.24 - 1.33 |
%
|
1.33 - 2.84 | % | |||||||||
|
Weighted-average expected life
|
6.47 - 7.59 |
years
|
6.21 - 7.70 |
years
|
6.28 - 7.63 | years | |||||||||
|
Forfeiture rate
|
1.00 - 2.50 |
%
|
1.00 - 3.00 |
%
|
1.00 - 3.00 | % | |||||||||
|
Total fair value of grants
|
$ | 908 | $ | 727 | $ | 995 |
The following table summarizes the Company’s activities with respect to its stock options and stock appreciation rights for 2013, 2012 and 2011 (in thousands, except price per share and contractual term):
|
Number of
Shares
|
Weighted Average
Exercise Price
Per Share
|
Weighted Average
Remaining
Term
|
Aggregate
Intrinsic
Value
|
|||||
|
Outstanding December 31, 2010
|
2,054
|
$
|
13.77
|
4.85
|
$
|
13,978
|
||
|
Granted
|
126
|
$
|
17.62
|
|||||
|
Exercised
|
(121)
|
$
|
9.27
|
|||||
|
Cancelled
|
(1)
|
$
|
8.90
|
|||||
|
Outstanding December 31, 2011
|
2,058
|
$
|
14.28
|
3.94
|
$
|
1,496
|
||
|
Granted
|
147
|
$
|
12.00
|
|||||
|
Exercised
|
(272)
|
$
|
9.39
|
|||||
|
Cancelled
|
(113)
|
$
|
9.98
|
|||||
|
Outstanding December 31, 2012
|
1,820
|
$
|
15.08
|
3.71
|
$
|
1,520
|
||
|
Granted
|
191
|
$
|
11.29
|
|||||
|
Exercised
|
(164)
|
$
|
10.18
|
|||||
|
Cancelled
|
(316)
|
$
|
16.51
|
|||||
|
Outstanding December 31, 2013
|
1,531
|
$
|
14.89
|
4.26
|
$
|
2,369
|
||
|
Vested at December 31, 2013
|
1,204
|
$
|
15.63
|
|||||
|
Exercisable at December 31, 2013
|
1,204
|
$
|
15.63
|
3.03
|
$
|
1,378
|
The weighted-average grant-date fair value of options and stock appreciation rights granted during the years ended December 31, 2013, 2012 and 2011 was $4.75, $4.95 and $7.90, respectively. The total intrinsic value for options exercised during the years ended December 31, 2013, 2012 and 2011, respectively, was $484, $988 and $908.
Cash received from option exercises under all plans for the years ended December 31, 2013, 2012 and 2011 was approximately $1,618, $2,681 and $1,073, respectively. The actual tax benefit realized for the tax deductions from option exercises under all plans totaled approximately $247, $244 and $293, respectively, for the years ended December 31, 2013, 2012 and 2011.
The following table summarizes information concerning outstanding and exercisable options and stock appreciation rights at December 31, 2013:
|
Outstanding
|
Exercisable
|
||||||||||||
|
Range of
exercise price
|
Number
outstanding
|
Weighted
average
remaining
contractual life
(years)
|
Weighted
average
exercise
price
|
Number
exercisable
|
Weighted
average
exercise
price
|
||||||||
| $6.20-$8.26 |
116
|
5.3
|
$
|
6.96
|
116
|
$
|
6.96
|
||||||
| 8.26-10.33 |
53
|
9.3
|
$
|
10.02
|
--
|
$
|
--
|
||||||
| 10.33-12.39 |
255
|
8.7
|
$
|
11.58
|
43
|
$
|
11.72
|
||||||
| 12.39-14.45 |
353
|
1.8
|
$
|
13.86
|
337
|
$
|
13.90
|
||||||
| 14.45-16.52 |
165
|
5.2
|
$
|
15.82
|
147
|
$
|
15.90
|
||||||
| 16.52-18.58 |
213
|
4.3
|
$
|
18.09
|
194
|
$
|
18.08
|
||||||
| 18.58-20.65 |
361
|
2.0
|
$
|
18.93
|
352
|
$
|
18.93
|
||||||
| 20.65-21.08 |
15
|
5.8
|
$
|
21.04
|
15
|
$
|
21.04
|
||||||
|
1,531
|
1,204
|
||||||||||||
As of December 31, 2013, 2012 and 2011 there was $986, $880 and $959, respectively, of total unrecognized compensation cost related to nonvested options and stock appreciation rights outstanding. That cost is expected to be recognized over a weighted average period of approximately 1.9 years. A summary of the Company’s nonvested option and stock appreciation rights activity for the years ended December 31, 2013, 2012 and 2011 is as follows (in thousands, except price per share and contractual term):
|
Number of
Shares
|
Weighted Average
Grant Date
Fair Value
Per Share
|
||||||||
|
Nonvested at January 1, 2011
|
320 | $ | 4.93 | ||||||
|
Granted
|
126 | $ | 7.90 | ||||||
|
Vested
|
(185 | ) | $ | 4.95 | |||||
|
Nonvested at December 31, 2011
|
261 | $ | 6.35 | ||||||
|
Granted
|
147 | $ | 4.95 | ||||||
|
Vested
|
(152 | ) | $ | 5.36 | |||||
|
Forfeited
|
(4 | ) | $ | 5.60 | |||||
|
Nonvested at December 31, 2012
|
252 | $ | 6.12 | ||||||
|
Granted
|
191 | $ | 4.75 | ||||||
|
Vested
|
(108 | ) | $ | 6.60 | |||||
|
Forfeited
|
(8 | ) | $ | 7.82 | |||||
|
Nonvested at December 31, 2013
|
327 | $ | 5.11 | ||||||
Restricted Stock and Restricted Stock Units
As discussed above, the Company’s 2006 Long-Term Incentive Plan provides for the grant of various types of stock-based awards, including restricted shares and restricted stock units. Restricted shares and restricted stock units are valued at the price of the common stock on the date of grant and vest at the end of a three-year period. For restricted shares, during the vesting period, the participant has the rights of a shareholder in terms of voting and dividend rights but is restricted from transferring the shares. Holders of restricted stock units do not have voting rights but are entitled to dividend equivalent payments. The expense for both types of grants is recorded on a straight-line basis over the vesting period.
The Company recorded $952, $2,349 and $1,210 of compensation expense relating to restricted stock and restricted stock units during years ended December 31, 2013, 2012 and 2011, respectively. The expense in 2012 reflects an increase in the level of grants and increased expense attributable to retirement-age vesting provisions.
A summary of the restricted share and restricted stock unit activity for the years ended December 31, 2013, 2012 and 2011 is presented below:
|
Number of
Shares
|
Weighted Average
Grant Date
Fair Value
per share
|
||||||||
|
Outstanding at January 1, 2011
|
276 | $ | 10.90 | ||||||
|
Granted
|
126 | $ | 15.86 | ||||||
|
Vested – restriction lapsed
|
(59 | ) | $ | 15.90 | |||||
|
Outstanding at December 31, 2011
|
343 | $ | 11.86 | ||||||
|
Granted
|
149 | $ | 11.84 | ||||||
|
Vested – restriction lapsed
|
(136 | ) | $ | 6.94 | |||||
|
Outstanding at December 31, 2012
|
356 | $ | 13.72 | ||||||
|
Granted
|
145 | $ | 11.15 | ||||||
|
Vested – restriction lapsed
|
(81 | ) | $ | 13.88 | |||||
|
Forfeited
|
(30 | ) | $ | 13.00 | |||||
|
Outstanding at December 31, 2013
|
390 | $ | 12.81 | ||||||
As of December 31, 2013, 2012 and 2011, there was $1,699, $1,438 and $1,984, respectively, of total unrecognized compensation cost related to the outstanding restricted shares and restricted stock units that will be recognized over a weighted average period of approximately 1.9 years.
Employee Stock-based Compensation Expense
The Company recorded $1,644, $3,129 and $2,098 for stock-based compensation during years ended December 31, 2013, 2012 and 2011, respectively. The expense is included in selling, general and administrative expenses in the Consolidated Statements of Comprehensive Income (Loss). There were no amounts related to employee stock-based compensation capitalized as assets during the three years ended December 31, 2013.
Note 17 - Earnings Per Share
Basic earnings (loss) per share from continuing operations, discontinued operations and from net income (loss) per common share are computed by dividing income (loss) from continuing operations, income (loss) from discontinued operations and net income (loss), respectively, by the weighted average shares outstanding for the period. Diluted earnings (loss) per share from continuing operations, discontinued operations and from net income (loss) per common share are computed by dividing income (loss) from continuing operations, income (loss) from discontinued operations and net income (loss), respectively, by the weighted average number of common shares, including common stock equivalent shares (stock options and stock-settled stock appreciation rights) outstanding for the period. Certain share-based payment awards which entitle holders to receive non-forfeitable dividends before vesting are considered participating securities and are included in the calculation of basic earnings (loss) per share. There were no reconciling items to net income to arrive at income (loss) available to common stockholders.
The following table sets forth the number of common and common stock equivalent shares used in the computation of basic and diluted earnings (loss) per share:
| Years ended December 31, | ||||||||||||
|
2013
|
2012
|
2011
|
||||||||||
|
Income (loss) from continuing operations
|
$ | 13,218 | $ | (23,618 | ) | $ | 19,412 | |||||
|
Income (loss) from discontinued operations
|
(6,693 | ) | 202 | 1,199 | ||||||||
|
Net income (loss)
|
$ | 6,525 | $ | (23,416 | ) | $ | 20,611 | |||||
|
Weighted average shares-Basic
|
26,286 | 25,924 | 25,790 | |||||||||
|
Effect of dilutive stock options
|
68 | -- | 290 | |||||||||
|
Weighted average shares-Diluted
|
26,354 | 25,924 | 26,080 | |||||||||
|
Basic:
|
||||||||||||
|
Income (loss) from continuing operations
|
$ | 0.50 | $ | (0.91 | ) | $ | 0.75 | |||||
|
Income (loss) from discontinued operations
|
(0.25 | ) | 0.01 | 0.05 | ||||||||
|
Net income (loss) per common share
|
$ | 0.25 | $ | (0.90 | ) | $ | 0.80 | |||||
| Diluted: | ||||||||||||
|
Income (loss) from continuing operations
|
$ | 0.50 | $ | (0.91 | ) | $ | 0.74 | |||||
|
Income (loss) from discontinued operations
|
(0.25 | ) | 0.01 | 0.05 | ||||||||
|
Net income (loss) per common share
|
$ | 0.25 | $ | (0.90 | ) | $ | 0.79 | |||||
Since the Company was in a net loss position for the year ended December 31, 2012, there was no difference between the number of shares used to calculate basic and diluted loss per share for the year ended December 31, 2012. There were 121 potentially dilutive stock options not included in the diluted per share calculation because they would be anti-dilutive.
In addition, the following table presents the potentially dilutive outstanding stock options excluded from the computation of diluted earnings per share for each period because they would be anti-dilutive:
|
Years ended December 31,
|
|||||||||||||
|
2013
|
2012
|
2011
|
|||||||||||
|
Anti-dilutive options
|
1,356 | 1,530 | 782 | ||||||||||
|
Exercise price range
|
$ | 10.02 – 21.08 | $ | 11.71 – 21.08 | $ | 12.02 –21.08 | |||||||
|
Date of last option expiration
|
December 16, 2023
|
December 19, 2022
|
August 17, 2021
|
||||||||||
Note 18 - Segment and Geographic Reporting
The Company’s service offerings include brand development and brand deployment services related to four core competencies: graphic services, brand and package strategy and design, digital promotion and advertising, and software. Graphic services, brand strategy and design and digital promotion and advertising represented approximately 96 percent of the Company’s revenues in 2013, with software sales representing the remaining 4 percent. The nature of the Company’s core service offerings creates significant overlap across competencies such that it is impracticable to report revenues for each of its service offerings.
These services are provided to clients primarily in the consumer packaged goods, retail and life sciences markets. In 2013 and 2012, the Company’s largest client accounted for approximately $43,872, or 9.9 percent, and $35,739, or 8.1 percent, respectively, of its total revenues. In 2013 and 2012, the 10 largest clients in the aggregate accounted for 48.4 percent and 46.9 percent, respectively, of revenues. The Company’s services are provided with an employment force of approximately 3,600 employees worldwide, of which approximately 7 percent are production employees represented by labor unions. The percentage of employees covered by union contracts that expire within one year is approximately 2 percent.
The Company organizes and manages its operations primarily by geographic area and measures profit and loss of its segments based on operating income (loss). The accounting policies used to measure operating income of the segments are the same as those used to prepare the consolidated financial statements.
Accounting guidance requires that a public business enterprise report financial information about its reportable operating segments. Operating segments are components of an enterprise about which separate financial information is available that is evaluated regularly by the chief operating decision maker (“CODM”) in deciding how to allocate resources and in assessing performance.
The Company’s Americas segment includes all of the Company’s operations located in North and South America, including its operations in the United States, Canada, Mexico and Brazil, its U.S. branding and design capabilities and its U.S. digital solutions business. The Company’s Europe segment includes all operations located in Europe, including its European branding and design capabilities and its digital solutions business in London. The Company’s Asia Pacific segment includes all operations in Asia and Australia, including its Asia Pacific branding and design capabilities. The Company has determined that each of its operating segments is also a reportable segment.
Corporate consists of unallocated general and administrative activities and associated expenses, including executive, legal, finance, information technology, human resources and certain facility costs. In addition, certain costs and employee benefit plans are included in Corporate and not allocated to operating segments.
The Company has disclosed operating income (loss) as the primary measure of segment profitability. This is the measure of profitability used by the Company’s CODM and is most consistent with the presentation of profitability reported within the consolidated financial statements.
The segment revenue disclosure for the years ended December 31, 2012 and December 31, 2011 have been reclassified to conform to the current presentation of segment revenue as presented for the year ended December 31, 2013. The Americas segment revenue and intersegment revenue elimination originally reported for the year ended December 31, 2012 and December 31, 2011, have been reduced by $30,051 and $25,859, respectively, to reflect the elimination of intra-segment revenue within the Americas segment.
Segment information relating to results of operations from continuing operations was as follows:
| 2013 | 2012 | 2011 | |||||||||||
| Net revenues: | |||||||||||||
|
Americas
|
$ | 331,380 | $ | 333,494 | $ | 330,879 | |||||||
|
Europe
|
87,176 | 85,763 | 75,877 | ||||||||||
|
Asia Pacific
|
42,454 | 38,923 | 33,704 | ||||||||||
|
Intersegment revenue elimination
|
(18,370 | ) | (16,898 | ) | (13,039 | ) | |||||||
|
Total
|
$ | 442,640 | $ | 441,282 | $ | 427,421 | |||||||
| Operating segment income (loss): | |||||||||||||
|
Americas
|
$ | 57,566 | $ | 10,523 | $ | 48,628 | |||||||
|
Europe
|
5,488 | 979 | 6,384 | ||||||||||
|
Asia Pacific
|
3,196 | 2,124 | 4,198 | ||||||||||
|
Corporate
|
(42,061 | ) | (44,593 | ) | (33,890 | ) | |||||||
|
Operating income (loss)
|
24,189 | (30,967 | ) | 25,320 | |||||||||
|
Interest expense, net
|
(4,069 | ) | (3,523 | ) | (5,211 | ) | |||||||
|
Income (loss) from continuing operations, before income taxes
|
$ | 20,120 | $ | (34,490 | ) | $ | 20,109 | ||||||
| Depreciation and amortization expense: | |||||||||||||
|
Americas
|
$ | 9,054 | $ | 9,406 | $ | 9,287 | |||||||
|
Europe
|
2,651 | 3,206 | 2,903 | ||||||||||
|
Asia Pacific
|
1,430 | 1,532 | 1,292 | ||||||||||
|
Corporate
|
5,001 | 3,272 | 2,849 | ||||||||||
|
Total
|
$ | 18,136 | $ | 17,416 | $ | 16,331 | |||||||
The Corporate operating loss for 2013 includes $7,488 of business systems integration expense, related to the Company’s information technology and business process improvement initiative. In addition, the Corporate operating loss for 2013 includes a credit to income of approximately $518 for the reversal of a liability recorded in purchase accounting for a recent acquisition that is no longer needed due to statute expiration.
The Americas operating income for 2012 includes $31,683 of multiemployer pension withdrawal expense. The 2012 expense represents an estimated withdrawal liability recorded at December 31, 2012, pursuant to the Company’s decision to withdraw from the GCC/IBT National Pension Fund.
The Corporate operating loss for 2012 includes $12,086 of business systems integration expense, related to the Company’s information technology and business process improvement initiative.
The Corporate operating loss for 2011 includes $8,467 of business and systems integration expense, related to the Company’s information technology and business process improvement initiative, and $1,846 of multiemployer pension withdrawal expense. Partially offsetting the expense increases were credits to income of $3,320 for the reduction of contingent consideration payable related to a 2010 acquisition and $825 related to the reduction of an employment tax reserve for a 2008 acquisition.
|
Segment information related to total assets and expenditure for long-lived assets was as follows:
|
|||||||||
|
2013
|
2012
|
||||||||
|
Total Assets:
|
|||||||||
|
Americas (1)
|
$ | 326,745 | $ | 359,014 | |||||
|
Europe
|
57,119 | 54,746 | |||||||
|
Asia Pacific
|
24,813 | 27,193 | |||||||
|
Corporate
|
21,864 | 17,868 | |||||||
|
Total
|
$ | 430,541 | $ | 458,821 | |||||
|
(1)
|
Decrease in total assets for the Americas segment includes $8,444 for the sale of net assets of large-format printing operation, $7,210 for the write-off of goodwill and other intangible assets related to the large-format printing operation and $7,307 for the transfer of real estate related to the large-format printing operation to the Corporate segment.
|
| 2013 | 2012 | 2011 | |||||||||||
| Expenditures for long-lived assets: | |||||||||||||
|
Americas
|
$ | 5,211 | $ | 5,648 | $ | 7,176 | |||||||
|
Europe
|
2,111 | 1,256 | 1,813 | ||||||||||
|
Asia Pacific
|
825 | 1,611 | 1,108 | ||||||||||
|
Corporate
|
5,030 | 9,615 | 14,546 | ||||||||||
|
Total
|
$ | 13,177 | $ | 18,130 | $ | 24,643 | |||||||
Summary financial information by geographic location for 2013, 2012 and 2011 is as follows:
|
United States
|
Canada
|
Europe
|
Other
|
Total
|
|||||||||||||||||
|
2013
|
|||||||||||||||||||||
|
Revenues
|
$ | 292,215 | $ | 29,651 | $ | 84,963 | $ | 35,811 | $ | 442,640 | |||||||||||
|
Long-lived assets
|
$ | 53,972 | $ | 2,013 | $ | 5,589 | $ | 5,651 | $ | 67,225 | |||||||||||
|
2012
|
|||||||||||||||||||||
|
Revenues
|
$ | 293,600 | $ | 30,570 | $ | 83,857 | $ | 33,254 | $ | 441,282 | |||||||||||
|
Long-lived assets
|
$ | 55,582 | $ | 1,812 | $ | 4,808 | $ | 5,152 | $ | 67,354 | |||||||||||
|
2011
|
|||||||||||||||||||||
|
Revenues
|
$ | 294,118 | $ | 29,939 | $ | 74,741 | $ | 28,623 | $ | 427,421 | |||||||||||
|
Long-lived assets
|
$ | 50,032 | $ | 2,335 | $ | 5,008 | $ | 5,463 | $ | 62,838 | |||||||||||
Sales are attributed to countries based on the point of origin of the sale. Approximately 9.9 percent of total revenues came from the Company’s largest single client for the year ended December 31, 2013.
Long-lived assets include property, plant and equipment assets stated at net book value and other non-current assets that are identified with the operations in each country.
Note 19 - Derivative Financial Instruments
Fair Value Hedge
In order to mitigate foreign exchange rate exposure, the Company entered into several forward contracts during 2011 and 2012. The forward contracts were designated as fair value hedges at inception. The derivative fair value gains or losses from these fair value hedges are recorded as a component of Foreign exchange loss in the Consolidated Statements of Comprehensive Income (Loss). The forward contracts are measured at fair value on a recurring basis and are classified as Level 2 inputs under the fair value hierarchy established in Note 1 – Significant Accounting Policies. In May 2012, the Company discontinued its foreign currency hedging program using forward contracts. There was no effect on earnings related to derivative instruments for the year ended December 31, 2013. The effect on earnings of the derivative instruments on the Consolidated Statements of Comprehensive Income (Loss) for the years ended December 31, 2012 and 2011 was a loss of $438 and $868, respectively.
Note 20 - Multiemployer Pension Plans
The Company has participated in the Graphic Communications Conference International Brotherhood of Teamsters National Pension Fund (“NPF”), formerly known as the Graphic Communications Conference International Brotherhood of Teamsters Supplemental Retirement and Disability Fund (“SRDF”), pursuant to collective bargaining agreements at eight locations. In the fourth quarter of 2012, the Company’s Board of Directors executed a resolution to authorize management to enter into good faith negotiations with the local bargaining units to effect a complete withdrawal from the NPF. The negotiations with the local bargaining units continued during 2013, with negotiations for withdrawal completed with all but one bargaining unit by year-end. The decision to exit the NPF was made in order to mitigate potentially greater financial exposure to the Company in the future under the plan, which is significantly underfunded, and to facilitate the consideration of future changes to the Company’s operations in the United States. A withdrawal liability should be recorded if circumstances that give rise to an obligation become probable and estimable. Management concluded that a complete withdrawal from the NPF was both probable and estimable, subject to the Company’s good faith bargaining obligations. Based on an analysis prepared by an independent actuary, the Company recorded an estimated liability for its withdrawal from the NPF of $31,683, which was the present value of the estimated future payments required for withdrawal. The payments are expected to total approximately $41,186, payable $2,059 per year over a 20 year period, with the payments expected to commence on or about May 1, 2014. These payments were discounted at a risk free rate of 2.54 percent. Even after the Company has withdrawn from the plan, if a plan termination or mass withdrawal occurs, the Company’s withdrawal liability may be larger than it is currently estimated. The Company believes the likelihood of a plan termination or mass withdrawal occurring within the next few years to be remote.
The expense of $31,683 associated with the pension withdrawal liability is reflected in Multiemployer pension withdrawal expense for the year ended December 31, 2012 on the Consolidated Statements of Comprehensive Income (Loss). During 2013, the company accreted $833 of the present value discount resulting in an estimated liability of $32,516 at December 31, 2013, which is included on the Consolidated Balance Sheets at December 31, 2013 as follows: $1,261 in Accrued expenses and $31,255 in Other long-term liabilities. The expense associated with the accretion of the present value discount is reflected in Interest expense on the Consolidated Statements of Comprehensive Income (Loss).
The Company previously participated in the San Francisco Lithographers Pension Trust (“SF LPT”) pursuant to collective bargaining agreements with the Teamsters Local 853. Effective June 30, 2011, the Company decided to terminate participation in the SF LPT and provided notification that it would no longer be making contributions to the plan. The Company’s decision triggered a withdrawal liability. The Company recorded an estimated liability of $1,846 as of June 30, 2011 to reflect this obligation. The expense associated with the pension withdrawal liability is reflected in Multiemployer pension withdrawal expense (income) for the year ended December 31, 2011 on the Consolidated Statements of Comprehensive Income (Loss). The Company made a payments totaling $1,643 during 2012 to settle the liability in full. The $203 reduction from the initial liability of $1,846 is recorded as a credit to Multiemployer pension withdrawal expense for the year ended December 31, 2012 on the Consolidated Statements of Comprehensive Income (Loss).
The Company contributes to a number of multiemployer defined benefit pension plans under the terms of collective-bargaining agreements that cover its union-represented employees. The risks of participating in these multiemployer plans are different from single-employer plans in the following aspects:
|
a.
|
Assets contributed to the multiemployer plan by one employer may be used to provide benefits to employees of other participating employers.
|
|
b.
|
If a participating employer stops contributing to the plan, the unfunded obligations of the plan may be borne by the remaining participating employers.
|
|
c.
|
If the Company chooses to stop participating in one of its multiemployer plans, it may be required to pay the plan an amount based on the underfunded status of the plan, referred to as withdrawal liability.
|
The Company’s participation in these plans for the annual period ended December 31, 2013, is outlined in the table below. The “EIN/Pension Plan Number” row provides the Employee Identification Number (“EIN”) and the three-digit plan number, if applicable. Unless otherwise noted, the most recent Pension Protection Act (“PPA”) zone status available in 2013 and 2012 is for the plan’s year-end at April 30, 2013 and April 30, 2012, respectively, if applicable. The zone status is based on information that the Company received from the plan and is certified by the plan’s actuary. Among other factors, plans in the red zone are generally less than 65 percent funded, plans in the yellow zone are less than 80 percent funded, and plans in the green zone are at least 80 percent funded. The “FIP/RP Status Pending/implemented” row indicates plans for which a financial improvement plan (“FIP”) or a rehabilitation plan (“RP”) is either pending or has been implemented. The last row lists the expiration dates of the collective-bargaining agreements to which the plans are subject. There have been no significant changes, affecting period-to-period comparability of contributions, to the number of employees covered by the Company’s multiemployer plans from 2011 to 2013.
|
Pension Fund
|
Graphic Communications Conference
International Brotherhood of Teamsters
National Pension Fund
|
CEP Multi-Employer Pension Plan
|
||
|
Country
|
United States of America
|
Canada
|
||
|
EIN/Pension Plan Number
|
52-6118568-001
|
RN 0542696
|
||
|
Pension Protection Act Zone Status:
|
||||
|
2013
|
Red
|
At least 80% funded
|
||
|
2012
|
Red
|
At least 80% funded
|
||
|
FIP/RP Status Pending/Implemented
|
Yes
|
N/A
|
||
|
Contributions of Schawk, Inc.:
|
||||
|
2013
|
$
|
527
|
$
|
76
|
|
2012
|
$
|
686
|
$
|
85
|
|
2011
|
$
|
844
|
$
|
85
|
|
Surcharge Imposed
|
No
|
No
|
||
|
Expiration Dates of Collective-
Bargaining Agreements
|
N/A
|
May 1, 2014
|
||
The Company’s contributions did not represent more than five percent of total contributions to the NPF as indicated in the NPF’s Form 5500 for the plan year ending April 30, 2012 (the Plan’s most recently available annual report). Based on preliminary information, it is anticipated the Company’s contributions will not represent more than five percent of total contributions to the NPF for the plan year ending April 30, 2013.
Note 21 - Quarterly Financial Data (unaudited)
Schawk, Inc maintains its financial records on the basis of a fiscal year ending December 31. The unaudited quarterly data for 2013 and 2012 is presented below:
| Year 2013 | March 31, 2013 (1) | ||||||||
|
(in thousands, except per share amounts)
|
Previously
Reported
|
Reclassified | |||||||
|
Net revenues
|
$ | 111,003 | $ | 107,158 | |||||
|
Operating expenses:
|
|||||||||
|
Cost of services (excluding depreciation and amortization)
|
73,052 | 68,106 | |||||||
|
Selling, general and administrative expenses (excluding depreciation and amortization)
|
33,281 | 30,521 | |||||||
|
Depreciation and amortization
|
-- | 4,096 | |||||||
|
Business and systems integration expenses
|
2,658 | 2,658 | |||||||
|
Acquisition integration and restructuring expenses
|
247 | 243 | |||||||
|
Impairment of long-lived assets
|
36 | 36 | |||||||
|
Foreign exchange gain
|
(242 | ) | (242 | ) | |||||
|
Operating income
|
1,971 | 1,740 | |||||||
|
Other income (expense):
|
|||||||||
|
Interest income
|
26 | 26 | |||||||
|
Interest expense
|
(1,095 | ) | (1,095 | ) | |||||
|
Income from continuing operations before
|
|||||||||
|
income taxes
|
902 | 671 | |||||||
|
Income tax benefit
|
(553 | ) | (651 | ) | |||||
|
Income from continuing operations
|
1,455 | 1,322 | |||||||
|
Income from discontinued operations, net of tax
|
-- | 133 | |||||||
|
Net income
|
$ | 1,455 | $ | 1,455 | |||||
|
Earnings per share:
|
|||||||||
|
Basic:
|
|||||||||
|
Income from continuing operations
|
$ | 0.06 | $ | 0.05 | |||||
|
Income from discontinued operations
|
-- | 0.01 | |||||||
|
Net income per common share
|
$ | 0.06 | $ | 0.06 | |||||
|
Diluted
|
|||||||||
|
Income from continuing operations
|
$ | 0.06 | $ | 0.05 | |||||
|
Income from discontinued operations
|
-- | 0.01 | |||||||
|
Net income per common share
|
$ | 0.06 | $ | 0.06 | |||||
|
(1)
|
In the second quarter of 2013, the Company reclassified the Consolidated Statements of Comprehensive Income (Loss) to disaggregate the discontinued operations related to the sale of its large format printing operation, which was sold on July 3, 2013. In addition, in the second quarter of 2013, the Company changed the presentation of certain expense items on the Consolidated Statements of Comprehensive Income (Loss). The Company previously presented cost of goods sold with a sub-total for gross profit; however, in order to be consistent with how management views the business, production expenses are now presented as cost of services and the gross profit sub-total has been eliminated. In addition, depreciation and amortization is now excluded from and presented separately for both cost of services and selling, general and administrative expenses. Accordingly, in this Form 10-K, the financial data for quarters which have not previously been reported have been reclassified to conform with the current presentation regarding discontinued operations and the revised expense format.
|
| Year 2013 | Quarters ended | ||||||||||
| June 30, | September 30, | December 31, | |||||||||
| (in thousands, except per share amounts) | 2013 | 2013 | 2013 (2) | ||||||||
|
Net revenues
|
$ | 110,510 | $ | 110,692 | $ | 114,280 | |||||
|
Operating expenses:
|
|||||||||||
|
Cost of services (excluding depreciation and amortization)
|
66,569 | 67,872 | 68,012 | ||||||||
|
Selling, general and administrative expenses (excluding depreciation and amortization)
|
30,245 | 29,448 | 28,492 | ||||||||
|
Depreciation and amortization
|
4,680 | 4,782 | 4,578 | ||||||||
|
Business and systems integration expenses
|
1,683 | 1,992 | 1,155 | ||||||||
|
Acquisition integration and restructuring expenses
|
311 | 674 | 546 | ||||||||
|
Impairment of long-lived assets
|
466 | -- | -- | ||||||||
|
Foreign exchange loss
|
734 | 132 | 662 | ||||||||
|
Operating income
|
5,822 | 5,792 | 10,835 | ||||||||
|
Other income (expense):
|
|||||||||||
|
Interest income
|
21 | 108 | 100 | ||||||||
|
Interest expense
|
(1,135 | ) | (1,073 | ) | (1,021 | ) | |||||
|
Income from continuing operations before
|
|||||||||||
|
income taxes
|
4,708 | 4,827 | 9,914 | ||||||||
|
Income tax provision
|
2,104 | 1,291 | 4,158 | ||||||||
|
Income from continuing operations
|
2,604 | 3,536 | 5,756 | ||||||||
|
Loss from discontinued operations, net of tax
|
(6,738 | ) | (3 | ) | (85 | ) | |||||
|
Net income (loss)
|
$ | (4,134 | ) | $ | 3,533 | $ | 5,671 | ||||
|
Earnings (loss) per share:
|
|||||||||||
|
Basic:
|
|||||||||||
|
Income from continuing operations
|
$ | 0.10 | $ | 0.13 | $ | 0.22 | |||||
|
Loss from discontinued operations
|
(0.26 | ) | -- | -- | |||||||
|
Net income (loss) per common share
|
$ | (0.16 | ) | $ | 0.13 | $ | 0.22 | ||||
|
Diluted
|
|||||||||||
|
Income from continuing operations
|
$ | 0.10 | $ | 0.13 | $ | 0.22 | |||||
|
Loss from discontinued operations
|
(0.26 | ) | -- | (0.01 | ) | ||||||
|
Net income (loss) per common share
|
$ | (0.16 | ) | $ | 0.13 | $ | 0.21 | ||||
(2) Results for the fourth quarter of 2013 were favorably impacted by a credit to income of approximately $518 for the reversal of a liability recorded in purchase accounting for a recent acquisition that is no longer needed due to statute expiration in the current quarter, and a credit to income of approximately $425 for net reserve reductions at certain of the Company’s vacant leased properties, for which a change in circumstances in the current quarter required a revision in the estimate of future expenses related to the leases. In addition, results in the current quarter were favorably impacted by a credit to income of approximately $736 for the correction on an error in the valuation of unbilled services that was immaterial to all prior periods presented.
|
Year 2012
|
March 31, 2012 (3) | ||||||||
|
(in thousands, except per share amounts)
|
Previously
Reported
|
Reclassified | |||||||
|
Net revenues
|
$ | 112,750 | $ | 107,387 | |||||
|
Operating expenses:
|
|||||||||
|
Cost of services (excluding depreciation and amortization)
|
75,750 | 69,676 | |||||||
|
Selling, general and administrative expenses (excluding depreciation and amortization)
|
33,862 | 30,279 | |||||||
|
Depreciation and amortization
|
-- | 4,349 | |||||||
|
Business and systems integration expenses
|
3,170 | 3,170 | |||||||
|
Acquisition integration and restructuring expenses
|
1,084 | 1,062 | |||||||
|
Foreign exchange loss
|
470 | 470 | |||||||
|
Operating loss
|
(1,586 | ) | (1,619 | ) | |||||
|
Other income (expense):
|
|||||||||
|
Interest income
|
16 | 16 | |||||||
|
Interest expense
|
(842 | ) | (842 | ) | |||||
|
Loss from continuing operations before
|
|||||||||
|
income taxes
|
(2,412 | ) | (2,445 | ) | |||||
|
Income tax benefit
|
(805 | ) | (818 | ) | |||||
|
Loss from continuing operations
|
(1,607 | ) | (1,627 | ) | |||||
|
Income from discontinued operations, net of tax
|
-- | 20 | |||||||
|
Net loss
|
$ | (1,607 | ) | $ | (1,607 | ) | |||
|
Earnings (loss) per share:
|
|||||||||
|
Basic:
|
|||||||||
|
Loss from continuing operations
|
$ | (0.06 | ) | $ | (0.06 | ) | |||
|
Income from discontinued operations
|
-- | -- | |||||||
|
Net loss per common share
|
$ | (0.06 | ) | $ | (0.06 | ) | |||
|
Diluted
|
|||||||||
|
Loss from continuing operations
|
$ | (0.06 | ) | $ | (0.06 | ) | |||
|
Income from discontinued operations
|
-- | -- | |||||||
|
Net loss per common share
|
$ | (0.06 | ) | $ | (0.06 | ) | |||
(3) In the second quarter of 2013, the Company reclassified the Consolidated Statements of Comprehensive Income (Loss) to
disaggregate the discontinued operations related to the sale of its large format printing operation, which was sold on July 3, 2013. In addition, in the second quarter of 2013, the Company changed the presentation of certain expense items on the Consolidated Statements of Comprehensive Income (Loss). The Company previously presented cost of goods sold with a sub-total for gross profit; however, in order to be consistent with how management views the business, production expenses are now presented as cost of services and the gross profit sub-total has been eliminated. In addition, depreciation and amortization is now excluded from and presented separately for both cost of services and selling, general and administrative expenses. Accordingly, in this Form 10-K, the financial data for quarters which have not previously been reported have been reclassified to conform with the current presentation regarding discontinued operations and the revised expense format.
| Year 2012 | Quarters ended | ||||||
|
(in thousands, except per share amounts)
|
June 30,
2012
|
September 30,
2012
|
|||||
|
Net revenues
|
$ | 110,760 | $ | 106,009 | |||
|
Operating expenses:
|
|||||||
|
Cost of services (excluding depreciation and amortization)
|
70,151 | 65,829 | |||||
|
Selling, general and administrative expenses (excluding depreciation and amortization)
|
30,548 | 29,347 | |||||
|
Depreciation and amortization
|
4,451 | 4,171 | |||||
|
Multiemployer pension withdrawal income
|
-- | (203) | |||||
|
Business and systems integration expenses
|
4,292 | 2,997 | |||||
|
Acquisition integration and restructuring expenses
|
2,416 | 1,218 | |||||
|
Impairment of long-lived assets
|
-- | 4,281 | |||||
|
Foreign exchange loss (gain)
|
90 | (12) | |||||
|
Operating loss
|
(1,188) | (1,619) | |||||
|
Other income (expense):
|
|||||||
|
Interest income
|
9 | 57 | |||||
|
Interest expense
|
(917) | (917) | |||||
|
Loss from continuing operations before
|
|||||||
|
income taxes
|
(2,096) | (2,479) | |||||
|
Income tax benefit
|
(513) | (184) | |||||
|
Loss from continuing operations
|
(1,583) | (2,295) | |||||
|
Income from discontinued operations, net of tax
|
87 | 82 | |||||
|
Net loss
|
$ | (1,496) | $ | (2,213) | |||
|
Earnings (loss) per share:
|
|||||||
|
Basic:
|
|||||||
|
Loss from continuing operations
|
$ | (0.06) | $ | (0.09) | |||
|
Income from discontinued operations
|
-- | -- | |||||
|
Net loss per common share
|
$ | (0.06) | $ | (0.09) | |||
|
Diluted:
|
|||||||
|
Loss from continuing operations
|
$ | (0.06) | $ | (0.09) | |||
|
Income from discontinued operations
|
-- | -- | |||||
|
Net loss per common share
|
$ | (0.06) | $ | (0.09) | |||
| Year 2012 | December 31, 2012 (4) (5) | |||||||
|
(in thousands, except per share amounts)
|
Previously
Reported
|
Reclassified
|
||||||
|
Net revenues
|
$ | 120,880 | $ | 117,126 | ||||
|
Operating expenses:
|
||||||||
|
Cost of services (excluding depreciation and amortization)
|
79,764 | 74,245 | ||||||
|
Selling, general and administrative expenses (excluding depreciation and amortization)
|
32,380 | 29,832 | ||||||
|
Depreciation and amortization
|
-- | 4,445 | ||||||
|
Multiemployer pension withdrawal expense
|
31,683 | 31,683 | ||||||
|
Business and systems integration expenses
|
1,627 | 1,627 | ||||||
|
Acquisition integration and restructuring expenses
|
596 | 560 | ||||||
|
Impairment of long-lived assets
|
75 | -- | ||||||
|
Foreign exchange loss
|
1,275 | 1,275 | ||||||
|
Operating loss
|
(26,520 | ) | (26,541 | ) | ||||
|
Other income (expense):
|
||||||||
|
Interest income
|
47 | 47 | ||||||
|
Interest expense
|
(976 | ) | (976 | ) | ||||
|
Loss from continuing operations before
|
||||||||
|
income taxes
|
(27,449 | ) | (27,470 | ) | ||||
|
Income tax benefit
|
(9,349 | ) | (9,357 | ) | ||||
|
Loss from continuing operations
|
(18,100 | ) | (18,113 | ) | ||||
|
Income from discontinued operations, net of tax
|
-- | 13 | ||||||
|
Net loss
|
$ | (18,100 | ) | $ | (18,100 | ) | ||
|
Earnings (loss) per share:
|
||||||||
|
Basic:
|
||||||||
|
Loss from continuing operations
|
$ | (0.69 | ) | $ | (0.69 | ) | ||
|
Income from discontinued operations
|
-- | -- | ||||||
|
Net loss per common share
|
$ | (0.69 | ) | $ | (0.69 | ) | ||
|
Diluted
|
||||||||
|
Income (loss) from continuing operations
|
$ | (0.69 | ) | $ | (0.69 | ) | ||
|
Income (loss) from discontinued operations
|
-- | -- | ||||||
|
Net income (loss) per common share
|
$ | (0.69 | ) | $ | (0.69 | ) | ||
(4) In the second quarter of 2013, the Company reclassified the Consolidated Statements of Comprehensive Income (Loss) to
disaggregate the discontinued operations related to the sale of its large format printing operation, which was sold on July 3, 2013. In addition, in the second quarter of 2013, the Company changed the presentation of certain expense items on the Consolidated Statements of Comprehensive Income (Loss). The Company previously presented cost of goods sold with a sub-total for gross profit; however, in order to be consistent with how management views the business, production expenses are now presented as cost of services and the gross profit sub-total has been eliminated. In addition, depreciation and amortization is now excluded from and presented separately for both cost of services and selling, general and administrative expenses. Accordingly, in this Form 10-K, the financial data for quarters which have not previously been reported have been reclassified to conform with the current presentation regarding discontinued operations and the revised expense format.
(5) Results for the fourth quarter of 2012 were unfavorably impacted by the Company’s decision to withdraw from the Graphic Communications Conference International Brotherhood of Teamsters National Pension Fund. An estimated withdrawal liability of $31,683 was recorded in the fourth quarter of 2012.
None.
Evaluation of Disclosure Controls and Procedures
The Company conducted an evaluation of the effectiveness of the Company’s disclosure controls and procedures (as defined in Rules 13a-15(e) and 15d-15(e) under the Securities Exchange Act of 1934, as amended (“Exchange Act”) as of the end of the period covered by this Form 10-K. The evaluation was conducted by management under the supervision of the Audit Committee, and with the participation of the Chief Executive Officer and Chief Financial Officer. Based on that evaluation, the Chief Executive Officer and Chief Financial Officer have concluded that the Company’s disclosure controls and procedures were effective as of the end of the period covered by this Form 10-K.
Management’s Report on Internal Control Over Financial Reporting
Our management is responsible for establishing and maintaining effective internal control over financial reporting, as defined in Rule 13a-15(f) under the Securities and Exchange Act of 1934. Internal control over financial reporting is a process designed by, or under the supervision of, the principal executive and financial officers, or persons performing similar functions, and effected by the board of directors, management and other personnel, to provide reasonable assurance regarding the reliability of financial reporting and the preparation of financial statements for external purposes in accordance with generally accepted accounting principles in the United States (“GAAP”). Internal control over the financial reporting includes those policies and procedures that: (i) pertain to the maintenance of records that in reasonable detail, accurately and fairly, reflect the transactions and dispositions of the assets of the company; (ii) provide reasonable assurance that transactions are properly recorded to permit preparation of financial statements in accordance with GAAP, and that receipts and expenditures of the company are being made only in accordance with authorizations of management and directors of the Company; and (iii) provide reasonable assurance regarding prevention or timely detection of unauthorized acquisition, use or disposition of the Company’s assets that could have a material effect on the financial statements.
Because of its inherent limitations, internal control over financial reporting may not prevent or detect misstatements. Also, projections of any evaluation of effectiveness to future periods are subject to the risk that controls may become inadequate because of changes in conditions, or that the degree of compliance with the policies or procedures may deteriorate.
Management assessed the effectiveness of the Company’s internal control over financial reporting as of December 31, 2013. In making this assessment, management used the control criteria framework of the Committee of Sponsoring Organizations (COSO) of the Treadway Commission published in its report entitled Internal Control-Integrated Framework. Based on its evaluation, management concluded that the Company’s internal control over financial reporting was effective as of December 31, 2013.
Ernst & Young LLP, the independent registered public accounting firm that audited the financial statements included in this annual report, has issued an auditors’ report on the Company’s internal control over financial reporting as of December 31, 2013.
Changes in Internal Control Over Financial Reporting
Other than as follows, there have been no changes in our internal control over financial reporting during the quarter ended December 31, 2013 that have materially affected, or are reasonably likely to materially affect, our internal control over financial reporting:
In connection with the Company’s information technology and business process improvement initiative, the Company is currently implementing a new global Enterprise Resource Planning (“ERP”) system, which will replace multiple legacy financial systems used for job production and invoicing, and which includes upgrades to the Company’s general accounting, financial reporting and human resource systems. The first phase of the new ERP system, consisting principally of an upgrade of the Company’s general accounting, human resources and financial reporting systems, was implemented during 2012. In addition, during the second half of 2012 and continuing through 2013, the Company implemented job production and invoicing modules at certain of the Company’s locations. In 2014, additional phases of the ERP system are anticipated to be implemented, including the job production and invoicing modules at the remainder of the Company’s locations. As a result of the implementation of the new ERP system, certain of the Company’s internal controls over financial reporting and related processes will be modified or redesigned to conform with and support the new ERP system.
Report of Independent Registered Public Accounting Firm
To the Board of Directors and Stockholders of
Schawk, Inc.
We have audited Schawk, Inc.’s internal control over financial reporting as of December 31, 2013 based on criteria established in Internal Control – Integrated Framework issued by the Committee of Sponsoring Organizations of the Treadway Commission (1992 framework) (the COSO criteria). Schawk, Inc.’s management is responsible for maintaining effective internal control over financial reporting, and for its assessment of the effectiveness of internal control over financial reporting included in the accompanying Management’s Report on Internal Control Over Financial Reporting. Our responsibility is to express an opinion on Schawk Inc.’s internal control over financial reporting based on our audit.
We conducted our audit in accordance with the standards of the Public Company Accounting Oversight Board (United States). Those standards require that we plan and perform the audit to obtain reasonable assurance about whether effective internal control over financial reporting was maintained in all material respects. Our audit included obtaining an understanding of internal control over financial reporting, assessing the risk that a material weakness exists, testing and evaluating the design and operating effectiveness of internal control based on the assessed risk, and performing such other procedures as we considered necessary in the circumstances. We believe that our audit provides a reasonable basis for our opinion.
A company’s internal control over financial reporting is a process designed to provide reasonable assurance regarding the reliability of financial reporting and the preparation of financial statements for external purposes in accordance with generally accepted accounting principles. A company’s internal control over financial reporting includes those policies and procedures that (1) pertain to the maintenance of records that, in reasonable detail, accurately and fairly reflect the transactions and dispositions of the assets of the company; (2) provide reasonable assurance that transactions are recorded as necessary to permit preparation of financial statements in accordance with generally accepted accounting principles, and that receipts and expenditures of the company are being made only in accordance with authorizations of management and directors of the company; and (3) provide reasonable assurance regarding prevention or timely detection of unauthorized acquisition, use, or disposition of the company’s assets that could have a material effect on the financial statements.
Because of its inherent limitations, internal control over financial reporting may not prevent or detect misstatements. Also, projections of any evaluation of effectiveness to future periods are subject to the risk that controls may become inadequate because of changes in conditions, or that the degree of compliance with the policies or procedures may deteriorate.
In our opinion, Schawk, Inc., maintained, in all material respects, effective internal control over financial reporting as of December 31, 2013, based on the COSO criteria.
We also have audited, in accordance with the standards of the Public Company Accounting Oversight Board (United States), the consolidated balance sheets of Schawk, Inc., as of December 31, 2013 and December 31, 2012, and the related consolidated statements of comprehensive income (loss), stockholders’ equity, and cash flows for each of the three years in the period ended December 31, 2013, and our report dated March 5, 2014 expressed an unqualified opinion thereon.
/s/ Ernst & Young LLP
Chicago, Illinois
March 5, 2014
None.
The information contained in the Company’s proxy statement for the 2014 annual meeting of stockholders (the “2014 Proxy Statement”) regarding the Company’s directors and executive officers, committees of the Company’s board of directors, audit committee financial experts, Section 16(a) beneficial ownership reporting compliance and stockholder director nomination procedures set forth under the captions and subcaptions “Directors and Executive Officers,” “Corporate Governance,” and “Section 16(a) Beneficial Ownership Reporting Compliance” is incorporated herein by reference.
The Company has adopted a code of ethics (the “Code of Ethics”), as required by the listing standards of the New York Stock Exchange and the rules of the SEC. This Code of Ethics applies to all of the Company’s directors, officers and employees. The Company has also adopted a charter for its Audit Committee. The Company has posted the Code of Ethics and the Audit Committee Charter on its website (www.sgkinc.com) and will post on its website any amendments to, or waivers from, its Code of Ethics applicable to any of the Company’s directors or executive officers. The foregoing information will also be available in print to any stockholder who requests such information.
As required by New York Stock Exchange rules, in 2013 the Company’s Chief Executive Officer submitted to the NYSE the annual certification relating to the Company’s compliance with NYSE’s corporate governance listing requirements.
The information contained in the Company’s 2014 Proxy Statement under the captions “Compensation Discussion and Analysis” and “Executive Compensation,” including under the subcaptions “Director Compensation,” “Compensation Committee Interlocks and Insider Participation” and “Compensation Committee Report” is incorporated herein by reference (except that the Compensation Committee Report shall not be deemed to be “filed” with the Securities and Exchange Commission).
The information contained in the Company’s 2014 Proxy Statement under the caption “Security Ownership of Certain Beneficial Owners and Management” is incorporated herein by reference. The information regarding securities authorized for issuance under the Company’s equity compensation plans is incorporated herein by reference to Part II, Item 5, “Market for Registrant’s Common Equity, Related Stockholder Matters and Issuer Purchasers of Equity Securities,” of this Form 10-K.
The information contained in the Company’s 2014 Proxy Statement under the caption “Transactions with Related Persons” and the information related to director independence under the caption “Corporate Governance” is incorporated herein by reference.
The information contained in the Company’s 2014 Proxy Statement under the caption “Independent Public Accountants” is incorporated herein by reference.
|
Page
|
|||
|
(a)
|
1.
|
The following financial statements of Schawk, Inc. are filed as part of this
|
|
|
report under Item 8-Financial Statements and Supplementary Data:
|
|||
|
2.
|
Financial statement schedules required to be filed by Item 8 of this form, and by Item 15(b) below:
|
||
|
3.
|
Exhibits
|
|
Exhibit
|
Description
|
Incorporated herein by reference (1)
|
|||
|
3.1
|
Certificate of Incorporation of Schawk, Inc., as amended.
|
Exhibit 4.2 to Registration Statement No. 333-39113
|
|||
|
3.3
|
By-Laws of Schawk, Inc., as amended.
|
Exhibit 3.1 to Form 8-K filed with the SEC January 10, 2014
|
|||
|
4.1
|
Specimen Class A Common Stock Certificate.
|
Exhibit 4.1 to Registration Statement No. 33-85152
|
|||
|
10.3
|
Form of Amended and Restated Employment Agreement between Clarence W. Schawk and Schawk, Inc.*
|
Registration Statement No. 33-85152
|
|||
|
10.3.1
|
Addendum to Restated Employment Agreement dated March 9, 1998 between Schawk, Inc. and Clarence W. Schawk.*
|
Exhibit 10.4.1 to Form 10-K filed with the SEC on April 28, 2008
|
|||
|
10.4
|
Form of Amended and Restated Employment Agreement between David A. Schawk and Schawk, Inc.*
|
Registration Statement No. 33-85152
|
|||
|
10.6
|
Schawk, Inc. Retirement Trust effective January 1, 1996.*
|
Exhibit 10.37 to Form 10-K filed with the SEC on March 28, 1996
|
|||
|
10.7
|
Schawk, Inc. Retirement Plan for Imaging Employees Amended and Restated effective January 1, 1996.*
|
Exhibit 10.38 to Form 10-K filed with the SEC on March 28, 1996
|
|||
|
10.8
|
Stockholder Investment Program dated July 28, 1995.
|
Registration Statement No. 33-61375
|
|||
|
10.9
|
Schawk, Inc. Employee Stock Purchase Plan effective January 1, 1999.*
|
Registration Statement No. 333-68521
|
|||
|
10.10
|
Note Purchase Agreement dated as of December 23, 2003 by and between Schawk, Inc. and Massachusetts Mutual Life Insurance Company.
|
Exhibit 10.47 to Form 10-K filed with the SEC on March 8, 2004
|
|||
| 10.12 | Schawk, Inc. 2003 Equity Option Plan. |
Appendix A to Proxy Statement filed with the SEC
on April 16, 2003
|
|||
| 10.13 |
Amended and Restated Registration Rights Agreement, dated as of
January 31, 2005, among Schawk, Inc. and certain principal
stockholders of Schawk, Inc.
|
Exhibit 10.1 to Form 8-K filed with the SEC on
February 2, 2005
|
|||
| 10.14 |
First Amendment, dated as of January 28, 2005, to Note Purchase
Agreement dated as of December 23, 2003 among Schawk, Inc. and the
noteholders party thereto.
|
Exhibit 10.6 to Form 8-K filed with the SEC on
February 2, 2005
|
|||
| 10.15 | Schawk, Inc. 2006 Long-term Incentive Plan. |
Annex A to the Proxy Statement filed with the SEC
on April 21, 2006
|
| Exhibit | Description | Incorporated herin by reference (1) | |||
| 10.16 | Employment Agreement dated as of September 18, 2008 between
Timothy J. Cunningham and Schawk, Inc. *
|
Exhibit 10.1 to Form 8-K filed with the SEC on
September 23, 2008
|
|||
|
10.17
|
Second Amendment, dated as of June 12, 2009, to Note Purchase Agreement dated as of December 23, 2003 among Schawk, Inc. and the noteholders party thereto.
|
Exhibit 10.3 to Form 8-K filed with the SEC on June 12, 2009
|
|||
|
10.18
|
Third Amendment, dated as of January 12, 2010, to Note Purchase Agreement dated as of December 23, 2003 among Schawk, Inc. and the noteholders party thereto.
|
Exhibit 10.3 to Form 8-K filed with the SEC on January 14, 2010
|
|||
|
10.19
|
Commercial Lease, dated as of March 23, 2010, between Schawk, Inc. and Graphics IV Limited Partnership.
|
Exhibit 10.5 to Form 10-Q filed with the SEC on May 5, 2010
|
|||
|
10.20
|
Outside Directors’ Formula Stock Option Plan, as amended and restated.
|
Exhibit 10.1 to Form 10-Q filed with the SEC on August 4, 2010
|
|||
|
10.22
|
Fourth Amendment, dated as of November 17, 2010, to Note Purchase Agreement dated as of December 23, 2003, as amended.
|
Exhibit 10.3 to Form 8-K filed with the SEC on November 18, 2010
|
|||
|
10.23
|
Amended and Restated Employee Stock Purchase Plan.
|
Appendix B to the Proxy Statement filed with the SEC on April 18, 2011
|
|||
|
10.25
|
Second Amended and Restated Credit Agreement, dated as of January 27, 2012, among Schawk, Inc., certain subsidiary borrowers of Schawk, Inc., the financial institutions party thereto as lenders, JPMorgan Chase Bank, N.A., on behalf of itself and the other lenders as agent, and PNC Bank, National Association, on behalf of itself and the other lenders as syndication agent
|
Exhibit 10.1 to Form 8-K filed with the SEC on February 1, 2012
|
|||
|
10.26
|
Amended and Restated Note Purchase and Private Shelf Agreement, dated as of January 27, 2012, among Schawk, Inc., Prudential Investment Management, Inc., and the noteholders party thereto
|
Exhibit 10.2 to Form 8-K filed with the SEC on February 1, 2012
|
|||
|
10.27
|
Fifth Amendment, dated as of January 27, 2012, to Note Purchase Agreement dated as of December 23, 2003 among Schawk, Inc. and the noteholders party thereto.
|
Exhibit 10.3 to Form 8-K filed with the SEC on February 1, 2012
|
|||
| 10.28 | Amendment to the Schawk, Inc. 2006 Long-term Incentive Plan | Appendix A to the proxy statement filed with the SEC on April 17, 2012. | |||
| 10.29 | Amendment No. 1, dated as of September 6, 2012, to the Second Amended and Restated Credit Agreement dated as of January 27, 2012, among Schawk, Inc., certain subsidiary borrowers of Schawk, Inc., the financial institutions party thereto as lenders, JPMorgan Chase Bank, N.A., on behalf of itself and the other lenders as agent, and PNC Bank, National Association, on behalf of itself and the other lenders as syndication agent. | Exhibit 10.1 to Form 8-K filed with the SEC on September 14, 2012. | |||
| 10.30 | First Amendment, dated as of September 6, 2012, to the Amended and Restated Note Purchase and Private Shelf Agreement dated as of January 27, 2012, among Schawk, Inc., Prudential Investment Management, Inc., and the noteholders party thereto. | Exhibit 10.2 to Form 8-K filed with the SEC on September 14, 2012. | |||
| 10.31 | Sixth Amendment, dated as of September 5, 2012, to the Note Purchase Agreement dated as of September 23, 2003, among Schawk, Inc. and the noteholders party thereto. | Exhibit 10.3 to Form 8-K filed with the SEC on September 14, 2012. |
|
Exhibit
|
Description
|
Incorporated herein by reference (1)
|
|||
|
10.32
|
Consent Memorandum, dated as of February 27, 2013, among Schawk, Inc., certain subsidiary borrowers of Schawk, Inc., and the lenders under the Second Amended and Restated Credit Agreement, dated as of January 27, 2012, as amended.
|
Exhibit 10.32 to Form 10-K filed with the SEC on March 7, 2013.
|
|||
|
10.33
|
Consent, dated as of February 27, 2013, among Schawk, Inc., certain subsidiary borrowers of Schawk, Inc., Prudential Investment Management, Inc. and the other noteholders party thereto.
|
Exhibit 10.33 to Form 10-K filed with the SEC on March 7, 2013.
|
|||
|
10.34
|
Consent, dated as of February 27, 2013, among Schawk, Inc., certain subsidiary borrowers of Schawk, Inc., Massachusetts Mutual Life Insurance Company and the other noteholders party thereto.
|
Exhibit 10.34 to Form 10-K filed with the SEC on March 7, 2013.
|
|||
|
10.35
|
Letter and Relocation Agreement between Eric N. Ashworth and Schawk, Inc. dated May 1, 2012*
|
Exhibit 10.4 to Form 10-Q filed with the SEC on May 1, 2013.
|
|||
|
10.36
|
Form of Restricted Stock Unit Award Agreement*
|
Exhibit 10.5 to Form 10-Q filed with the SEC on May 1, 2013.
|
|||
|
10.37
|
Form of Stock-Settled Stock Appreciation Rights Award Agreement*
|
Exhibit 10.6 to Form 10-Q filed with the SEC on May 1, 2013.
|
|||
|
10.38
|
Form of Long-Term Cash Incentive Award Agreement*
|
Exhibit 10.7 to Form 10-Q filed with the SEC on May 1, 2013.
|
|||
|
10.39
|
Amendment, dated January 21, 2014, to Employment Agreement dated September 18, 2008 between Timothy J. Cunningham and Schawk Inc. **
|
||||
|
21
|
List of Subsidiaries.**
|
||||
|
23
|
Consent of Independent Registered Public Accounting Firm.**
|
||||
|
31.1
|
Certification of Chief Executive Officer pursuant to Rule 13a-14(a) and Rule 15d-14(a) of the Securities Exchange Act of 1934, as amended.**
|
||||
| 31.2 | Certification of Chief Financial Officer pursuant to Rule 13a-14(a) and rule 15d-14(a) of the Securities Exchange Act of 1934, as amended.** | ||||
| 32 | Certification of Chief Executive Officer and Chief Financial Officer pursuant to 18 U.S.C. 1350, as adopted pursuant to Section 906 of the Sarbanes-Oxley Act of 2002.** | ||||
| 101 | The following financial information from the Company’s Annual Report on Form 10-K for the year ended December 31, 2013, formatted in XBRL (eXtensible Business Reporting Language): (i) Consolidated Balance Sheets (ii) Consolidated Statements of Comprehensive Income (Loss) (iii) Consolidated Statements of Cash Flows, (iv) Consolidated Statements of Shareholders’ Equity and (v) Notes to Consolidated Financial Statements. | ||||
(1) The file number of each report or filing referred to herein is 001-09335 unless otherwise noted.
|
*
|
Represents a management contract or compensation plan or arrangement required to be identified and filed pursuant to Items 15(a)(3) and 15(b) of Form 10-K.
|
|
**
|
Document filed herewith.
|
|
(in thousands)
|
|||||||||||||||||
|
Provision
|
Other | ||||||||||||||||
|
Balance at
|
Charged
|
Write-offs /
|
Additions
|
||||||||||||||
|
Allowance for Doubtful Accounts
|
Beginning
|
(Credited)
|
Allowances
|
(Deductions)
|
Balance at
|
||||||||||||
|
|
of Year
|
to Expense
|
Taken (1)
|
(2)
|
End of Year
|
||||||||||||
|
2013
|
$ | 2,052 | $ | 302 | $ | (321 | ) | $ | 7 | $ | 2,040 | ||||||
|
2012
|
$ | 1,926 | $ | 143 | $ | (25 | ) | $ | 8 | $ | 2,052 | ||||||
|
2011
|
$ | 1,525 | $ | 364 | $ | 40 | $ | (3 | ) | $ | 1,926 | ||||||
|
Provision
|
Other | ||||||||||||||||
|
Balance at
|
Charged
|
Additions
|
|||||||||||||||
|
Deferred Tax Asset Valuation Allowance
|
Beginning
|
(Credited) to
|
Allowance
|
(Deductions)
|
Balance at
|
||||||||||||
|
|
of Year
|
Expense (4)
|
Changes (3)
|
(2)
|
End of Year
|
||||||||||||
|
2013
|
$ | 36,099 | $ | (12,948 | ) | $ | (229 | ) | $ | 942 | $ | 23,864 | |||||
|
2012
|
$ | 23,723 | $ | 11,807 | $ | (129 | ) | $ | 698 | $ | 36,099 | ||||||
|
2011
|
$ | 28,123 | $ | (6,442 | ) | $ | 1,693 | $ | 349 | $ | 23,723 | ||||||
|
(1)
|
Net of collections on accounts previously written off.
|
|
(2)
|
Consists principally of adjustments related to foreign exchange.
|
|
(3)
|
Allowance changes arising from reductions in net operating loss carry forwards which are precluded from use and purchase accounting adjustments.
|
|
(4)
|
Credit to expense in 2013 relates primarily to a decrease in foreign net operating loss carryforwards which are precluded from use. Additionally, valuation allowances were released on the Company's French subsidiary and recorded on the Company's Japan subsidiary. Charge to expense in 2012 relates primarily to the increase in foreign net operating loss carryforwards which are precluded from use. Credit to expense in 2011 relates to the release of certain valuation allowances, principally for the Company’s United Kingdom and Australian subsidiaries.
|
Pursuant to the requirement of Section 13 or 15(d) of the Securities Exchange Act of 1934, the registrant has duly caused this report to be signed on its behalf by the undersigned, thereunto duly authorized, in Cook County, State of Illinois, on the 5th day of March 2014.
Schawk, Inc.
By: /s/ John B. Toher
John B. Toher
Vice President and
Corporate Controller
Pursuant to the requirements of the Securities Exchange Act of 1934, this report has been signed below by the following persons on behalf of the registrant and in the capacities indicated on the 5th day of March 2014.
|
/s/ Clarence W. Schawk
|
Chairman of the Board and Director
|
|
|
Clarence W. Schawk
|
||
|
/s/ David A. Schawk
|
Chief Executive Officer and Director
|
|
|
David A. Schawk
|
(Principal Executive Officer)
|
|
|
/s/ Eric N. Ashworth
|
President
|
|
|
Eric N. Ashworth
|
||
|
/s/ A. Alex Sarkisian, Esq.
|
Senior Executive Vice President and Director
|
|
|
A. Alex Sarkisian
|
||
|
/s/ Timothy J. Cunningham
|
Executive Vice President and Chief Financial Officer
|
|
|
Timothy J. Cunningham
|
(Principal Financial Officer)
|
|
|
/s/ John B. Toher
|
Vice President and Corporate Controller
|
|
|
John B. Toher
|
(Principal Accounting Officer)
|
|
|
/s/ John T. McEnroe, Esq.
|
Director and Assistant Secretary
|
|
|
John T. McEnroe, Esq.
|
||
|
/s/ Leonard S. Caronia
|
Director
|
|
|
Leonard S. Caronia
|
||
|
/s/ Patrick J. O’Brien
|
Director
|
|
|
Patrick J. O’Brien
|
||
|
/s/ Hollis W. Rademacher
|
Director
|
|
|
Hollis W. Rademacher
|
||
|
/s/ Michael G. O’Rourke
|
Director
|
|
|
Michael G. O’Rourke
|
||
|
/s/ Stanley N. Logan
|
Director
|
|
|
Stanley N. Logan
|
94