| 154 WESTPAC GROUP 2024 ANNUAL REPORT EXHIBIT 15.2 Westpac Group 2024 Annual Report on Form 20-F Section 1 156 Strategic review 156 Corporate governance 196 Directors’ report 222 Remuneration report 236 Information on Westpac 263 Section 2 270 Reading this report 271 Group performance 276 Performance summary 276 Key financial information 277 Impact of Notable Items 278 Review of earnings 280 Credit quality 291 Balance sheet and funding 294 Capital and dividends 297 Segment reporting 302 Consumer 304 Business and Wealth 306 Westpac Institutional Bank (WIB) 308 Westpac New Zealand 310 Group Businesses 313 Risk factors 317 Section 3 Financial statements 333 Section 4 334 Shareholding information 335 Additional information 350 Glossary of abbreviations and defined terms 363 |
| FINANCIAL STATEMENTS EXHIBITS INDEX STRATEGIC REVIEW PERFORMANCE REVIEW SHAREHOLDER INFORMATION 155 This page has been intentionally left blank. |

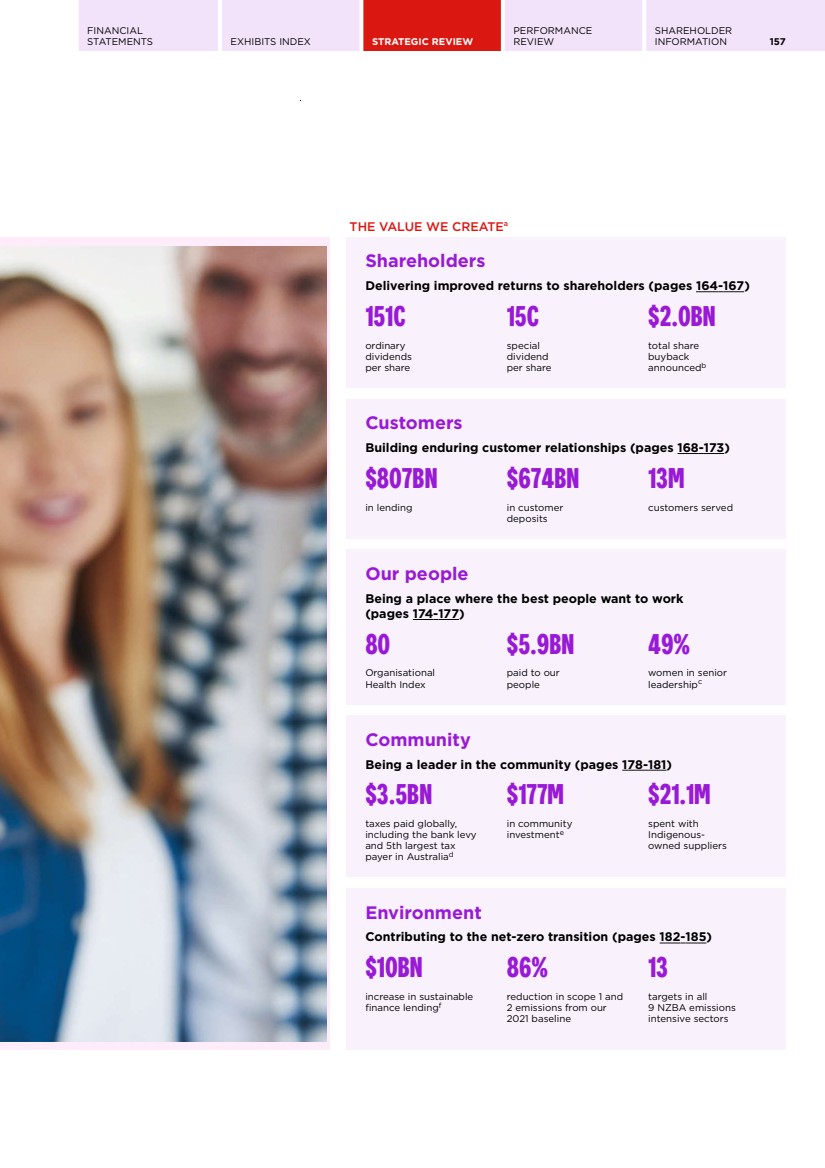
| 156 WESTPAC GROUP 2024 ANNUAL REPORT HOW WE CREATE VALUE OUR FOUNDATIONS OUR BUSINESS THE VALUE WE CREATEa Passionate people who make a difference Data-informed insights and decision making Proactive risk management and risk culture Strong balance sheet Shareholders Delivering improved returns to shareholders (pages 164-167) 151C 15C $2.0BN ordinary dividends per share special dividend per share total share buyback announced b Customers Building enduring customer relationships (pages 168-173) $807BN $674BN 13M in lending in customer deposits customers served Our people Being a place where the best people want to work (pages 174-177) 80 $5.9BN 49% Organisational Health Index paid to our people women in senior leadership c Community Being a leader in the community (pages 178-181) $3.5BN $177M $21.1M taxes paid globally, including the bank levy and 5th largest tax payer in Australiad in community investmente spent with Indigenous-owned suppliers Environment Contributing to the net-zero transition (pages 182-185) $10BN 86% 13 increase in sustainable finance lendingf reduction in scope 1 and 2 emissions from our 2021 baseline targets in all 9 NZBA emissions intensive sectors a. Comparisons are to the 12 months ended 30 September 2023, unless otherwise stated. b. Includes $1.0 billion announced in May 2024 and $1.0 billion announced in November 2024. c. Senior Leadership includes the Executive Team, General Managers and their direct reports (excluding administrative or support roles). d. Based on the ATO's Corporate Tax Transparency Report for the 2021-22 Income Year, published in November 2023. e. Figure includes commercial sponsorships and foregone fee revenue. f. Total committed exposure for lending assessed as sustainable finance in line with our Sustainable Finance Framework – movement in balance over FY24. |

| FINANCIAL STATEMENTS EXHIBITS INDEX STRATEGIC REVIEW PERFORMANCE REVIEW SHAREHOLDER INFORMATION 157 OUR FOUNDATIONS OUR BUSINESS THE VALUE WE CREATEa Passionate people who make a difference Data-informed insights and decision making Proactive risk management and risk culture Strong balance sheet Shareholders Delivering improved returns to shareholders (pages 164-167) 151C 15C $2.0BN ordinary dividends per share special dividend per share total share buyback announcedb Customers Building enduring customer relationships (pages 168-173) $807BN $674BN 13M in lending in customer deposits customers served Our people Being a place where the best people want to work (pages 174-177) 80 $5.9BN 49% Organisational Health Index paid to our people women in senior leadershipc Community Being a leader in the community (pages 178-181) $3.5BN $177M $21.1M taxes paid globally, including the bank levy and 5th largest tax payer in Australiad in community investmente spent with Indigenous-owned suppliers Environment Contributing to the net-zero transition (pages 182-185) $10BN 86% 13 increase in sustainable finance lendingf reduction in scope 1 and 2 emissions from our 2021 baseline targets in all 9 NZBA emissions intensive sectors a. Comparisons are to the 12 months ended 30 September 2023, unless otherwise stated. b. Includes $1.0 billion announced in May 2024 and $1.0 billion announced in November 2024. c. Senior Leadership includes the Executive Team, General Managers and their direct reports (excluding administrative or support roles). d. Based on the ATO's Corporate Tax Transparency Report for the 2021-22 Income Year, published in November 2023. e. Figure includes commercial sponsorships and foregone fee revenue. f. Total committed exposure for lending assessed as sustainable finance in line with our Sustainable Finance Framework – movement in balance over FY24. |
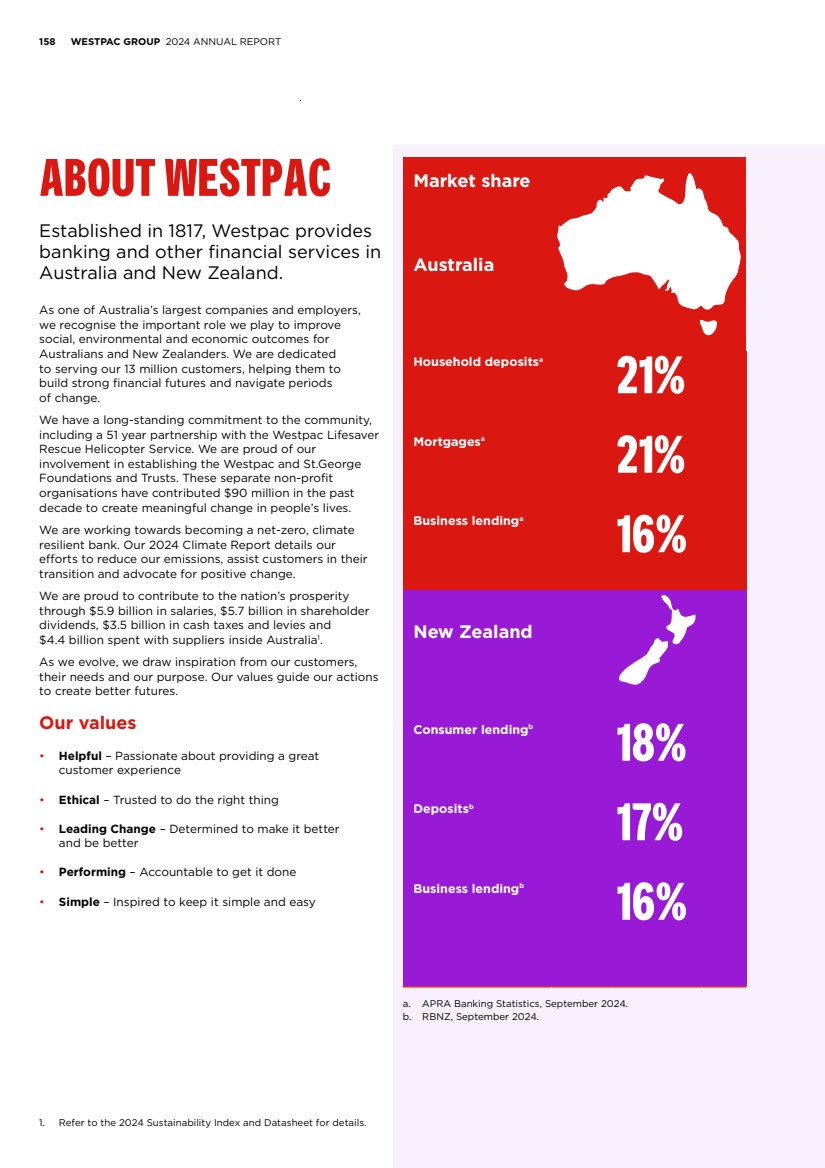
| 158 WESTPAC GROUP 2024 ANNUAL REPORT ABOUT WESTPAC Established in 1817, Westpac provides banking and other financial services in Australia and New Zealand. As one of Australia’s largest companies and employers, we recognise the important role we play to improve social, environmental and economic outcomes for Australians and New Zealanders. We are dedicated to serving our 13 million customers, helping them to build strong financial futures and navigate periods of change. We have a long-standing commitment to the community, including a 51 year partnership with the Westpac Lifesaver Rescue Helicopter Service. We are proud of our involvement in establishing the Westpac and St.George Foundations and Trusts. These separate non-profit organisations have contributed $90 million in the past decade to create meaningful change in people’s lives. We are working towards becoming a net-zero, climate resilient bank. Our 2024 Climate Report details our efforts to reduce our emissions, assist customers in their transition and advocate for positive change. We are proud to contribute to the nation’s prosperity through $5.9 billion in salaries, $5.7 billion in shareholder dividends, $3.5 billion in cash taxes and levies and $4.4 billion spent with suppliers inside Australia1 .. As we evolve, we draw inspiration from our customers, their needs and our purpose. Our values guide our actions to create better futures. Our values • Helpful – Passionate about providing a great customer experience • Ethical – Trusted to do the right thing • Leading Change – Determined to make it better and be better • Performing – Accountable to get it done • Simple – Inspired to keep it simple and easy Market share Australia Household depositsaa 21% Mortgagesa 21% Business lendinga 16% New Zealand Consumer lendingbb 18% Depositsb 17% Business lendingb 16% a. APRA Banking Statistics, September 2024. b. RBNZ, September 2024. 1. Refer to the 2024 Sustainability Index and Datasheet for details. |
| FINANCIAL STATEMENTS EXHIBITS INDEX STRATEGIC REVIEW PERFORMANCE REVIEW SHAREHOLDER INFORMATION 159 Our four operating segments Consumer Business & Wealth Westpac Institutional Bank (WIB) Westpac New Zealand Helping more Australians into their home, save for the future and manage their money with a range of banking products under the brands of Westpac, St.George, BankSA and Bank of Melbourne. Serving the needs of small to medium businesses and commercial and agribusiness customers across Australia. This segment also includes Private Wealth and BT Financial Group, along with our operations in Fiji and Papua New Guinea. Delivering a broad range of financial services to corporate, institutional and government customers operating in, and with connections to, Australia and New Zealand. Providing banking and wealth services to consumer, business and institutional customers in New Zealand. Our foundations Passionate people who make a difference Data-informed insights and decisioning Proactive risk management and risk culture Strong balance sheet The value we create Shareholders Customers People Community Environment Delivering sustainable returns to more than 585,000 shareholders Creating better futures for the 13 million customers we serve Helping over 35,000 people in our workforce to reach their potential Investing to create stronger, more inclusive communities Supporting global efforts towards net-zero by 2050 Pages 164-167 Pages 168-173 Pages 174-177 Pages 178-181 Pages 182-185 |

| 160 WESTPAC GROUP 2024 ANNUAL REPORT OUR STRATEGY Our strategy for growth and return is guided by our purpose and supports our ambition to be our customers' #1 bank and partner through life. Built on four pillars, it focuses on developing strong customer relationships to drive growth in target markets and improve returns. In turn, this helps us to create positive change and better futures by using our influence to support communities, the economy and the environment. Customer Easy Expert Advocate Customers are at the heart of what we do. We value the entire customer relationship and are working hard to anticipate their needs, including through delivering personalised experiences, offers and insights. Transaction accounts and payments are at the centre of our customer relationships, enabling us to build early and deeper connections. We’re making banking easier, more intuitive and digital. We’re simplifying our bank – solving pain points, removing manual processes, making banking safer and automating workflows. We’re aiming to create a seamless customer experience across our channels. We deliver expert solutions and tools to guide customers in making better decisions. We help them manage their money every day as well as plan ahead by sharing our insights. Our people work alongside customers to tackle some of the issues, including managing the cost of living and transitioning to net-zero. We advocate for positive change and speak up for what’s right. We’re advocating for financial inclusion, greater accountability for social media platforms promoting scams, on climate and safer digital services across our business, industry and communities. Measures Return on tangible equity (ROTE) Market position Sustainability Aligned with our purpose and the pillars of our strategy, our sustainability approach is shaped by key material topics and guided by the UN Sustainable Development Goals. Detailed information about our sustainability strategy, including metrics from our 2024 Sustainability Index and Datasheet, is available on our website. Following the Global Reporting Initiative (GRI) Universal Standards, we annually identify the most significant sustainability topics to guide our strategy and focus on areas with the greatest impact on our stakeholders. The process and details of these material topics are also outlined on our website. |

| FINANCIAL STATEMENTS EXHIBITS INDEX STRATEGIC REVIEW PERFORMANCE REVIEW SHAREHOLDER INFORMATION 161 A STRATEGY FOR GROWTH AND RETURN: PROGRESS The strength of our customer relationships is crucial to our long term success. By enhancing products and services, we are creating exceptional banking experiences that help to drive growth. Combined with initiatives that intend to reduce our costs relative to peers, we aim to improve our market position and ROTE, the key measures of the strategy. Shareholders Delivering improved returns to shareholders See pages 164-167 There was a modest decline in ROTE however we grew our businesses and maintained a strong financial position. This was reflected in higher fully franked ordinary dividends along with $2.3 billion of capital returned to shareholders comprising a $0.5 billion in special dividend and the purchase of $1.8 billion of sharesa through an on market buyback. a. As at 30 September 2024. Customers Building enduring customer relationships See pages 168-173 We have enhanced customer experiences and protections against scams through digital innovation. This has helped make banking easier, safer and more personalised for customers. Consistent and simple everyday banking offers resulted in higher deposits, while improved processing times stabilised our share of home loans. New convenient payments and merchant technology saw us attract new business customers in Australia and New Zealand. Business lending grew above system. People Being a place where the best people want to work See pages 174-177 Our Organisational Health Index (OHI) improved by five points to 80, placing us in the top quartile globally. We attract and retain talented people by investing in training and career development while supporting wellbeing. We are a proudly inclusive employer, committed to fostering a safe and inclusive workplace. Community Being a leader in the community See pages 178-181 Our success is intrinsically linked with the success of the economy and communities. We have a proud legacy of community support through workplace giving, volunteering, community initiatives and the separate Westpac Foundation, St.George Foundationa and Trusts. We helped to keep cash circulating in society and made progress against our objectives for advancing human rights and supporting reconciliation. a. Includes BankSA Foundation and Bank of Melbourne Foundation. Environment Contributing to the net-zero transition See pages 182-185 We made progress on our climate strategy, shifting our focus to supporting customers with their transition plans. Our Scope 1 and 2 emissions have reduced by 86% from our 2021 baseline, achieving our 2030 targeta .. With 13 targets across the 9 most emission-intensive sectors under the NZBA framework, we are engaging our customers to help them move towards lower emission practices. a. Refer to the 2024 Sustainability Index and Datasheet for more information. |

| 162 WESTPAC GROUP 2024 ANNUAL REPORT OUR OPERATING ENVIRONMENT1 Australian economic growth was subdued The Australian economy has experienced an extended period of below trend growth, particularly in the private sector. Government spending has provided some support, alongside a tight labour market and elevated terms of trade. However, strong population growth has masked the weakest period of per capita growth in decades. Australian economic growth is projected to recover from 1.5% this year to 2.5% in 2025. Households absorbed squeeze to incomes Real household incomes have faced the negative shocks of high interest rates, cost of living pressures and higher taxes. This has translated into pessimism and weaker consumption. The impact has been uneven with younger and lower incomes households disproportionately affected. Mortgage stress, while rising during the year, remains low. Some relief has arrived in the form of declining inflation and tax cuts. The undersupply of housing and continued house price growth has resulted in a recovery in housing credit growth from an annualised trough below 4% to more than 5% through the year. System credit growth of approximately 5% is expected for 2025. Strong business growth exceeded expectations Australian businesses have navigated challenging operating conditions of weaker demand and cost pressures. Profitability has eased to levels consistent with the decade prior to COVID-19. Smaller businesses, particularly those exposed to consumer discretionary sectors, experienced a more difficult trading environment. Strong financial positions, high capacity use and population growth have boosted credit demand, especially in infrastructure, health, education and technology investments. While overall business investment has slowed, credit demand is expected to grow by approximately 6% in 2025. The New Zealand economy weakened New Zealand’s economy stagnated due to significant monetary tightening aimed at combating inflationary pressures. The Reserve Bank of New Zealand began lowering interest rates in August 2024 in response to weaker economic activity, rising unemployment and receding inflation. The easing of financial conditions is expected to result in improved economic activity into 2025. Global economy on track for a soft landing Global economic prospects have improved with inflation, which is under control across major developed economies, declining from more than 8% in 2022 to below 3% by mid-2024. This allowed G7 central banks, except Japan, to ease monetary policy. The downside risk posed by weakness of the Chinese economy is expected to be mitigated by the announcement of significant stimulus measures. Notwithstanding the structural challenges that China will be required to address in the medium term, its activity will be supported in the short term. Global economic growth is expected to exceed 3% in 2025. 1. All references are to calendar years unless otherwise stated. |

| FINANCIAL STATEMENTS EXHIBITS INDEX STRATEGIC REVIEW PERFORMANCE REVIEW SHAREHOLDER INFORMATION 163 We regularly review our operating environment to identify changes, emerging risks and opportunities. This helps us to evolve our strategy and approach to current and future key risks. Below are some of the factors1 that could affect Westpac’s ability to create value in the short, medium or long term. Our major risk categories, mitigation strategies and areas of focus are detailed in Risk Management (page 188). For further information, see 2024 Risk Factors. Rising threat: Scams and fraud become more sophisticated Fraud and scams are increasing with more sophisticated methods targeting a wider range of individuals and businesses. Over the past two years, Westpac invested more than $100 million in new prevention and detection measures to support customers, such as Westpac SaferPay and Westpac Verify. We are working closely with government and industry to further strengthen our defences and make Australia a harder target for scammers. See Operational Risk, Cyber Risk and Creating value for customers (page 168) Supporting financial stability: Prudent lending and customer assistance Maintaining prudent lending practices and policies are critical to safeguarding our financial stability and profitability. Our Customer and Business Assist teams in Australia provided 47,500 hardship and disaster support packages. Factors including cost of living pressures and higher interest rates contributed to this increase. We continue to provide a range of support to help customers get back on track. See Credit Risk and Creating value for customers (page 168) Rising to the challenge: Expectations in addressing climate change Climate change continues to have significant global impacts. Banks play an important role in supporting the transition and helping customers become more climate resilient. New mandatory climate-related reporting requirements will require companies to disclose climate-related risks, opportunities and emissions across their value chain. We are strengthening our approach to managing climate change, as outlined in our 2024 Climate Report. See Credit Risk, Reputational and Sustainability Risk and Creating value for the environment (page 182) Navigating competition: The importance of strategic customer focus Nearly one hundred banks, including many foreign ones, now operate in Australia. Westpac is one of four major banks and has been serving customers for more than 200 years. The landscape is evolving and competition has intensified, particularly in mortgages. We are investing in technology and our people, leveraging the advantages and scale that come with being a major bank, to deliver great service and benefits to our customers. See Strategic Risk and Creating value for customers (page 168) Protecting reputation: Strong risk management for better outcomes Managing and responding to expectations from regulators and the community requires strong risk management. Poor conduct, negative customer experience, or failing to adequately respond to risks such as scams can impact our integrity and the trust of our stakeholders. Through the Integrated Plan of the CORE Program, we have strengthened our risk governance, accountability and risk culture to drive better customer outcomes. See Reputational and Sustainability Risk and Compliance and Conduct Risk (page 190) 1. Not exhaustive. See Risk Management (page 188) for full table of risk categories. |

| 164 WESTPAC GROUP 2024 ANNUAL REPORT CREATING VALUE FOR SHAREHOLDERS We are committed to delivering long term value for shareholders by focusing on providing great customer service, maintaining a strong balance sheet and delivering sustainable returns above our cost of capital. Key highlights 151c FULL YEAR ORDINARY DIVIDENDS 58% TOTAL SHAREHOLDER RETURN 15c SPECIAL DIVIDEND $2.0BN TOTAL SHARE BUYBACK ANNOUNCED1 1. $1.0 billion announced in May 2024 and $1.0 billion announced in November 2024. |

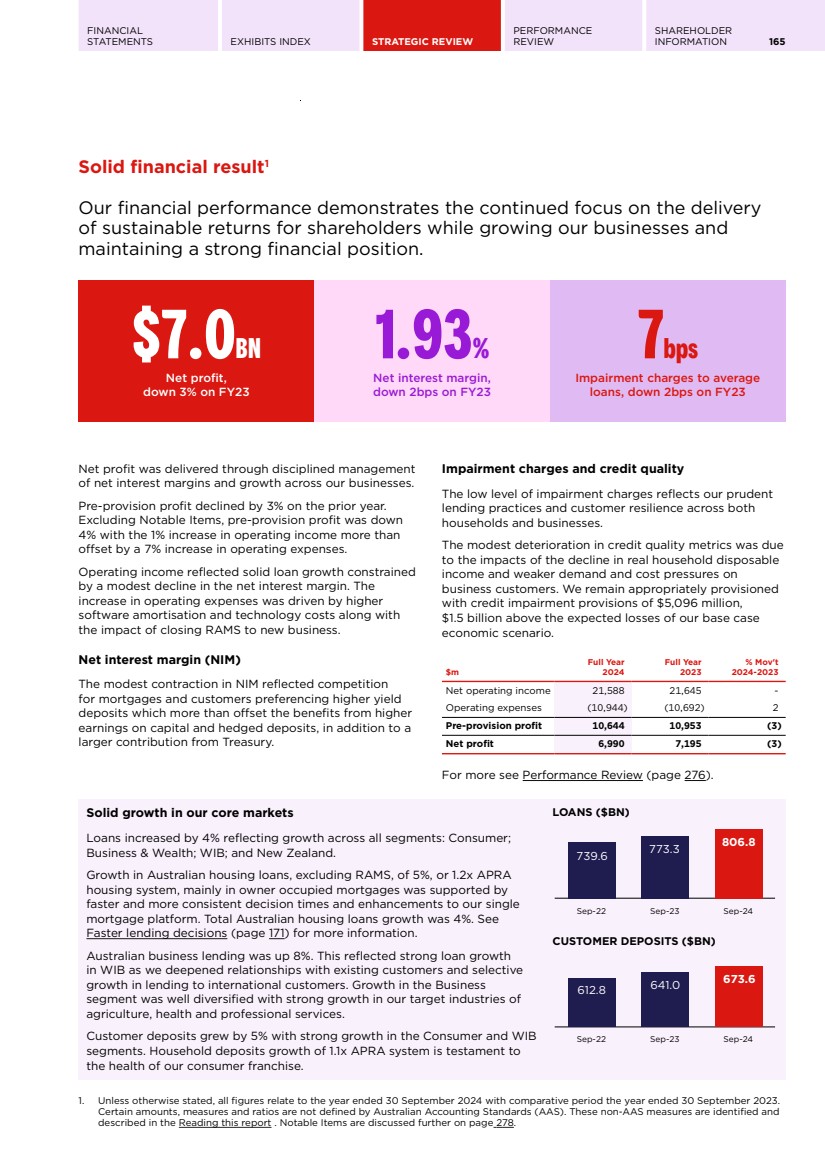
| FINANCIAL STATEMENTS EXHIBITS INDEX STRATEGIC REVIEW PERFORMANCE REVIEW SHAREHOLDER INFORMATION 165 Solid financial result1 Our financial performance demonstrates the continued focus on the delivery of sustainable returns for shareholders while growing our businesses and maintaining a strong financial position. $7.0BN Net profit, down 3% on FY23 1.93% Net interest margin, down 2bps on FY23 7bps Impairment charges to average loans, down 2bps on FY23 Net profit was delivered through disciplined management of net interest margins and growth across our businesses. Pre-provision profit declined by 3% on the prior year. Excluding Notable Items, pre-provision profit was down 4% with the 1% increase in operating income more than offset by a 7% increase in operating expenses. Operating income reflected solid loan growth constrained by a modest decline in the net interest margin. The increase in operating expenses was driven by higher software amortisation and technology costs along with the impact of closing RAMS to new business. Net interest margin (NIM) The modest contraction in NIM reflected competition for mortgages and customers preferencing higher yield deposits which more than offset the benefits from higher earnings on capital and hedged deposits, in addition to a larger contribution from Treasury. Impairment charges and credit quality The low level of impairment charges reflects our prudent lending practices and customer resilience across both households and businesses. The modest deterioration in credit quality metrics was due to the impacts of the decline in real household disposable income and weaker demand and cost pressures on business customers. We remain appropriately provisioned with credit impairment provisions of $5,096 million, $1.5 billion above the expected losses of our base case economic scenario. $m Full Year 2024 Full Year 2023 % Mov't 2024-2023 Net operating income 21,588 21,645 - Operating expenses (10,944) (10,692) 2 Pre-provision profit 10,644 10,953 (3) Net profit 6,990 7,195 (3) For more see Performance Review (page 276). Solid growth in our core markets Loans increased by 4% reflecting growth across all segments: Consumer; Business & Wealth; WIB; and New Zealand. Growth in Australian housing loans, excluding RAMS, of 5%, or 1.2x APRA housing system, mainly in owner occupied mortgages was supported by faster and more consistent decision times and enhancements to our single mortgage platform. Total Australian housing loans growth was 4%. See Faster lending decisions (page 171) for more information. Australian business lending was up 8%. This reflected strong loan growth in WIB as we deepened relationships with existing customers and selective growth in lending to international customers. Growth in the Business segment was well diversified with strong growth in our target industries of agriculture, health and professional services. Customer deposits grew by 5% with strong growth in the Consumer and WIB segments. Household deposits growth of 1.1x APRA system is testament to the health of our consumer franchise. LOANS ($BN) 739.6 773.3 806.8 Sep-22 Sep-23 Sep-24 CUSTOMER DEPOSITS ($BN) 612.8 641.0 673.6 Sep-22 Sep-23 Sep-24 1. Unless otherwise stated, all figures relate to the year ended 30 September 2024 with comparative period the year ended 30 September 2023. Certain amounts, measures and ratios are not defined by Australian Accounting Standards (AAS). These non-AAS measures are identified and described in the Reading this report . Notable Items are discussed further on page 278. |
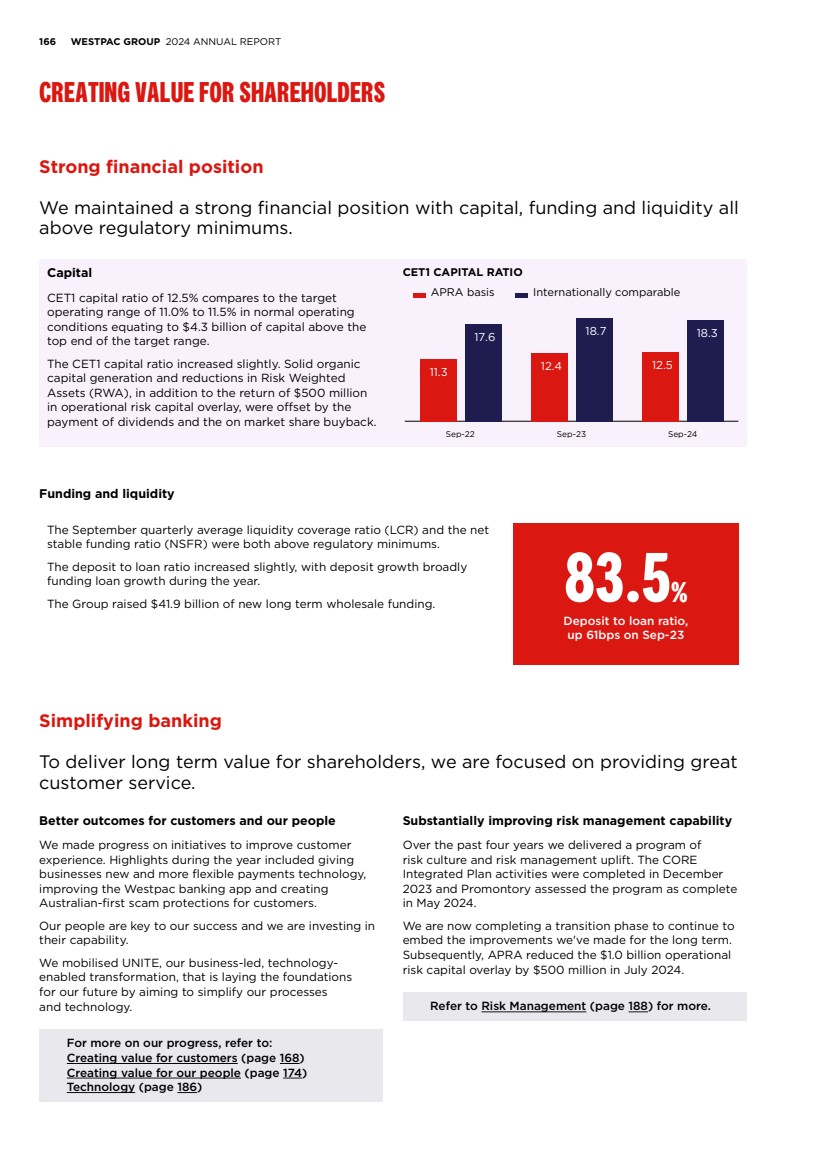
| 166 WESTPAC GROUP 2024 ANNUAL REPORT CREATING VALUE FOR SHAREHOLDERS Strong financial position We maintained a strong financial position with capital, funding and liquidity all above regulatory minimums. Capital CET1 capital ratio of 12.5% compares to the target operating range of 11.0% to 11.5% in normal operating conditions equating to $4.3 billion of capital above the top end of the target range. The CET1 capital ratio increased slightly. Solid organic capital generation and reductions in Risk Weighted Assets (RWA), in addition to the return of $500 million in operational risk capital overlay, were offset by the payment of dividends and the on market share buyback. CET1 CAPITAL RATIO 11.3 12.4 12.5 17.6 18.7 18.3 APRA basis Internationally comparable Sep-22 Sep-23 Sep-24 Funding and liquidity The September quarterly average liquidity coverage ratio (LCR) and the net stable funding ratio (NSFR) were both above regulatory minimums. The deposit to loan ratio increased slightly, with deposit growth broadly funding loan growth during the year. The Group raised $41.9 billion of new long term wholesale funding. 83.5% Deposit to loan ratio, up 61bps on Sep-23 Simplifying banking To deliver long term value for shareholders, we are focused on providing great customer service. Better outcomes for customers and our people We made progress on initiatives to improve customer experience. Highlights during the year included giving businesses new and more flexible payments technology, improving the Westpac banking app and creating Australian-first scam protections for customers. Our people are key to our success and we are investing in their capability. We mobilised UNITE, our business-led, technology-enabled transformation, that is laying the foundations for our future by aiming to simplify our processes and technology. For more on our progress, refer to: Creating value for customers (page 168) Creating value for our people (page 174) Technology (page 186) Substantially improving risk management capability Over the past four years we delivered a program of risk culture and risk management uplift. The CORE Integrated Plan activities were completed in December 2023 and Promontory assessed the program as complete in May 2024. We are now completing a transition phase to continue to embed the improvements we've made for the long term. Subsequently, APRA reduced the $1.0 billion operational risk capital overlay by $500 million in July 2024. Refer to Risk Management (page 188) for more. |
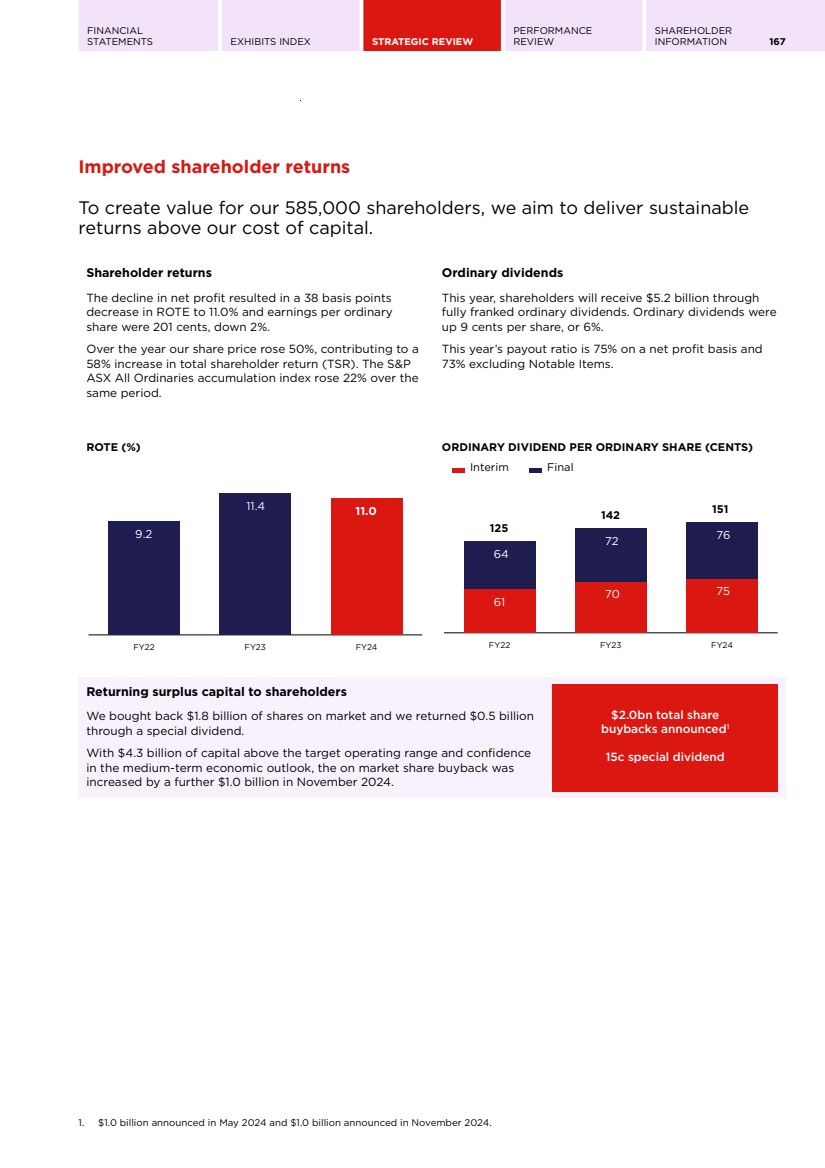
| FINANCIAL STATEMENTS EXHIBITS INDEX STRATEGIC REVIEW PERFORMANCE REVIEW SHAREHOLDER INFORMATION 167 Improved shareholder returns To create value for our 585,000 shareholders, we aim to deliver sustainable returns above our cost of capital. Shareholder returns The decline in net profit resulted in a 38 basis points decrease in ROTE to 11.0% and earnings per ordinary share were 201 cents, down 2%. Over the year our share price rose 50%, contributing to a 58% increase in total shareholder return (TSR). The S&P ASX All Ordinaries accumulation index rose 22% over the same period. Ordinary dividends This year, shareholders will receive $5.2 billion through fully franked ordinary dividends. Ordinary dividends were up 9 cents per share, or 6%. This year’s payout ratio is 75% on a net profit basis and 73% excluding Notable Items. ROTE (%) 9.2 11.4 11.0 FY22 FY23 FY24 ORDINARY DIVIDEND PER ORDINARY SHARE (CENTS) 125 142 151 61 70 75 64 72 76 Interim Final FY22 FY23 FY24 Returning surplus capital to shareholders We bought back $1.8 billion of shares on market and we returned $0.5 billion through a special dividend. With $4.3 billion of capital above the target operating range and confidence in the medium-term economic outlook, the on market share buyback was increased by a further $1.0 billion in November 2024. $2.0bn total share buybacks announced1 15c special dividend 1. $1.0 billion announced in May 2024 and $1.0 billion announced in November 2024. |
| 168 WESTPAC GROUP 2024 ANNUAL REPORT CREATING VALUE FOR CUSTOMERS Delivering great customer service motivates our people and brings our purpose to life. Through better products and services, technology and fraud and scams protection, we're supporting customers through life's challenges to help them realise their financial goals. Key highlights 13M CUSTOMERS # 1 BANKING APP1 21% AUSTRALIAN MORTGAGE MARKET SHARE2 +4 CONSUMER NPS3 RANKED THIRD AMONG MAJOR PEERS 1. The Forrester Digital Experience Review: Australian Mobile Banking Apps, Q3 2024. 2. APRA Banking Statistics, September 2024. 3. Source: Fifth Dimension for September 2024, 6MR. MFI customers. |

| FINANCIAL STATEMENTS EXHIBITS INDEX STRATEGIC REVIEW PERFORMANCE REVIEW SHAREHOLDER INFORMATION 169 Number one banking app Our banking app won awards for its simple design and rich functionality, including #1 mobile app by Forrester1 .. As one of our customers' preferred banking channels, we have continued to invest in its capabilities to make it simpler, secure and more personalised, directly contributing to long term customer satisfaction and loyalty. Our banking app offers essential everyday banking and money management tools. More than 1 million customers2 are using money management features such as Net Worth view and Financial Wellbeing to help them budget, manage their finances and understand their financial position. The Savings Finder automatically calculates a customer’s annual spending on subscriptions and regular bills, helping to identify those that could be reduced or cancelled. Other features include Smart Search and a Cards Hub where customers can manage their debit and credit cards. Customers can easily switch between personal and business banking within the app to manage their finances in one place. Westpac SaferPay and Westpac SafeCall are new Australian-first innovations we designed to help customers avoid scams. To further enhance digital card security, dynamic CVC refreshes every 24 hours, reducing fraud and unauthorised access. See Protecting customers and preventing crime (page 173) for more information Building financial literacy We are committed to supporting our customers and the broader community in building financial confidence. This helps customers to manage their finances more effectively which builds trust and ultimately drives the sustained growth of our business. In addition to the money management features, we introduced a Pocket Money and Chores feature in our banking app. Parents or guardians can use this to set up regular or one-off Pocket Money payments to a child's account to manage chores, develop their money skills and encourage saving. This helps to teach children the value of money and how to spend and save responsibly. We also saw positive momentum in use of the savings account features, in particular the safety features available within the Youth Debit card. We launched a new Property Dashboard in our digital banking channels, offering customers a snapshot of their property portfolio linked to Westpac loans. This provides valuable insights such as estimated property values and home equity to help customers understand their financial position. To further build financial confidence and wellbeing, we offer a range of resources to customers, employees and the community. Through Westpac Master Your Money and the Finlit program, designed for younger adults, we provide interactive webinars, online learning modules, articles and tools. In New Zealand, more than 12,000 people participated in Managing Your Money workshops, alongside targeted seminars for businesses and corporate customers, including through our partnership with key Chambers of Commerce across the country. 1. The Forrester Digital Experience Review: Australian Mobile Banking Apps, Q3 2024. 2. In the 90 days to 30 September 2024. WESTPAC SAFERPAY: MULTI-LAYERED PROTECTION After researching investment opportunities, a Queensland couple transferred $350,000 to an account to invest in government bonds. The transfer, made on a Friday afternoon, was flagged by our SaferPay technology as a high scam risk. Fortunately, SaferPay placed a 24-hour hold on the transfer, protecting the couple’s funds. After speaking with the couple, our Fraud and Scams Operations Team was able to cancel the transaction for the customer. |

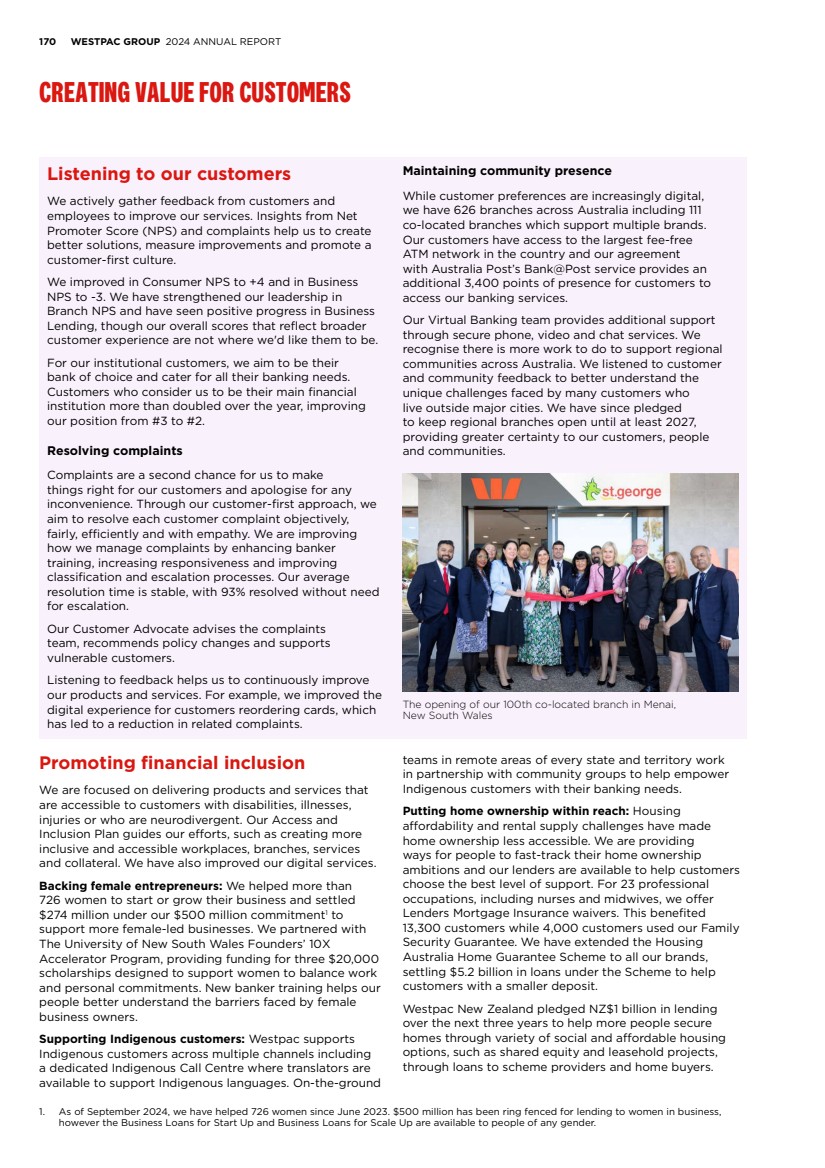
| 170 WESTPAC GROUP 2024 ANNUAL REPORT CREATING VALUE FOR CUSTOMERS Listening to our customers We actively gather feedback from customers and employees to improve our services. Insights from Net Promoter Score (NPS) and complaints help us to create better solutions, measure improvements and promote a customer-first culture. We improved in Consumer NPS to +4 and in Business NPS to -3. We have strengthened our leadership in Branch NPS and have seen positive progress in Business Lending, though our overall scores that reflect broader customer experience are not where we'd like them to be. For our institutional customers, we aim to be their bank of choice and cater for all their banking needs. Customers who consider us to be their main financial institution more than doubled over the year, improving our position from #3 to #2. Resolving complaints Complaints are a second chance for us to make things right for our customers and apologise for any inconvenience. Through our customer-first approach, we aim to resolve each customer complaint objectively, fairly, efficiently and with empathy. We are improving how we manage complaints by enhancing banker training, increasing responsiveness and improving classification and escalation processes. Our average resolution time is stable, with 93% resolved without need for escalation. Our Customer Advocate advises the complaints team, recommends policy changes and supports vulnerable customers. Listening to feedback helps us to continuously improve our products and services. For example, we improved the digital experience for customers reordering cards, which has led to a reduction in related complaints. Maintaining community presence While customer preferences are increasingly digital, we have 626 branches across Australia including 111 co-located branches which support multiple brands. Our customers have access to the largest fee-free ATM network in the country and our agreement with Australia Post’s Bank@Post service provides an additional 3,400 points of presence for customers to access our banking services. Our Virtual Banking team provides additional support through secure phone, video and chat services. We recognise there is more work to do to support regional communities across Australia. We listened to customer and community feedback to better understand the unique challenges faced by many customers who live outside major cities. We have since pledged to keep regional branches open until at least 2027, providing greater certainty to our customers, people and communities. The opening of our 100th co-located branch in Menai, New South Wales Promoting financial inclusion We are focused on delivering products and services that are accessible to customers with disabilities, illnesses, injuries or who are neurodivergent. Our Access and Inclusion Plan guides our efforts, such as creating more inclusive and accessible workplaces, branches, services and collateral. We have also improved our digital services. Backing female entrepreneurs: We helped more than 726 women to start or grow their business and settled $274 million under our $500 million commitment1 to support more female-led businesses. We partnered with The University of New South Wales Founders’ 10X Accelerator Program, providing funding for three $20,000 scholarships designed to support women to balance work and personal commitments. New banker training helps our people better understand the barriers faced by female business owners. Supporting Indigenous customers: Westpac supports Indigenous customers across multiple channels including a dedicated Indigenous Call Centre where translators are available to support Indigenous languages. On-the-ground teams in remote areas of every state and territory work in partnership with community groups to help empower Indigenous customers with their banking needs. Putting home ownership within reach: Housing affordability and rental supply challenges have made home ownership less accessible. We are providing ways for people to fast-track their home ownership ambitions and our lenders are available to help customers choose the best level of support. For 23 professional occupations, including nurses and midwives, we offer Lenders Mortgage Insurance waivers. This benefited 13,300 customers while 4,000 customers used our Family Security Guarantee. We have extended the Housing Australia Home Guarantee Scheme to all our brands, settling $5.2 billion in loans under the Scheme to help customers with a smaller deposit. Westpac New Zealand pledged NZ$1 billion in lending over the next three years to help more people secure homes through variety of social and affordable housing options, such as shared equity and leasehold projects, through loans to scheme providers and home buyers. 1. As of September 2024, we have helped 726 women since June 2023. $500 million has been ring fenced for lending to women in business, however the Business Loans for Start Up and Business Loans for Scale Up are available to people of any gender. |
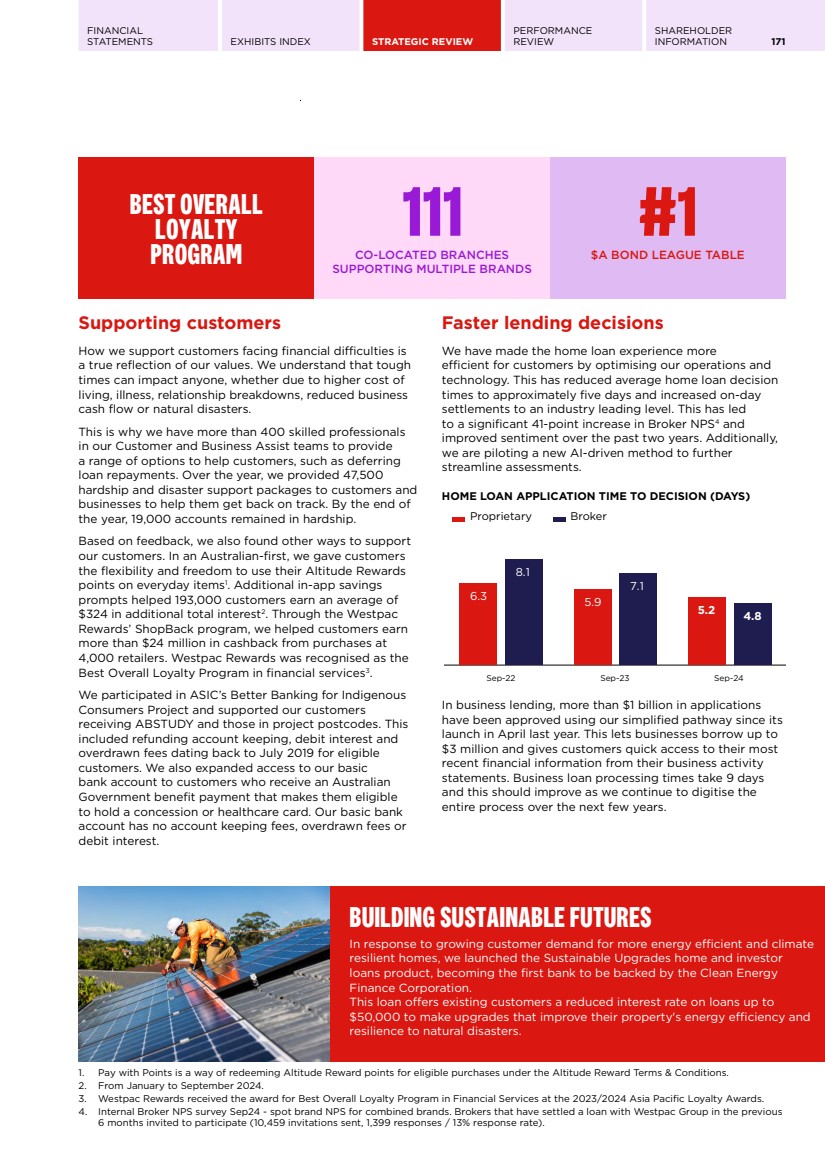
| FINANCIAL STATEMENTS EXHIBITS INDEX STRATEGIC REVIEW PERFORMANCE REVIEW SHAREHOLDER INFORMATION 171 Supporting customers How we support customers facing financial difficulties is a true reflection of our values. We understand that tough times can impact anyone, whether due to higher cost of living, illness, relationship breakdowns, reduced business cash flow or natural disasters. This is why we have more than 400 skilled professionals in our Customer and Business Assist teams to provide a range of options to help customers, such as deferring loan repayments. Over the year, we provided 47,500 hardship and disaster support packages to customers and businesses to help them get back on track. By the end of the year, 19,000 accounts remained in hardship. Based on feedback, we also found other ways to support our customers. In an Australian-first, we gave customers the flexibility and freedom to use their Altitude Rewards points on everyday items1 .. Additional in-app savings prompts helped 193,000 customers earn an average of $324 in additional total interest2 .. Through the Westpac Rewards’ ShopBack program, we helped customers earn more than $24 million in cashback from purchases at 4,000 retailers. Westpac Rewards was recognised as the Best Overall Loyalty Program in financial services3 .. We participated in ASIC’s Better Banking for Indigenous Consumers Project and supported our customers receiving ABSTUDY and those in project postcodes. This included refunding account keeping, debit interest and overdrawn fees dating back to July 2019 for eligible customers. We also expanded access to our basic bank account to customers who receive an Australian Government benefit payment that makes them eligible to hold a concession or healthcare card. Our basic bank account has no account keeping fees, overdrawn fees or debit interest. Faster lending decisions We have made the home loan experience more efficient for customers by optimising our operations and technology. This has reduced average home loan decision times to approximately five days and increased on-day settlements to an industry leading level. This has led to a significant 41-point increase in Broker NPS4 and improved sentiment over the past two years. Additionally, we are piloting a new AI-driven method to further streamline assessments. HOME LOAN APPLICATION TIME TO DECISION (DAYS) 6.3 5.9 5.2 8.1 7.1 4.8 Proprietary Broker Sep-22 Sep-23 Sep-24 In business lending, more than $1 billion in applications have been approved using our simplified pathway since its launch in April last year. This lets businesses borrow up to $3 million and gives customers quick access to their most recent financial information from their business activity statements. Business loan processing times take 9 days and this should improve as we continue to digitise the entire process over the next few years. 1. Pay with Points is a way of redeeming Altitude Reward points for eligible purchases under the Altitude Reward Terms & Conditions. 2. From January to September 2024. 3. Westpac Rewards received the award for Best Overall Loyalty Program in Financial Services at the 2023/2024 Asia Pacific Loyalty Awards. 4. Internal Broker NPS survey Sep24 - spot brand NPS for combined brands. Brokers that have settled a loan with Westpac Group in the previous 6 months invited to participate (10,459 invitations sent, 1,399 responses / 13% response rate). BEST OVERALL LOYALTY PROGRAM 111 CO-LOCATED BRANCHES SUPPORTING MULTIPLE BRANDS #1 $A BOND LEAGUE TABLE BUILDING SUSTAINABLE FUTURES In response to growing customer demand for more energy efficient and climate resilient homes, we launched the Sustainable Upgrades home and investor loans product, becoming the first bank to be backed by the Clean Energy Finance Corporation. This loan offers existing customers a reduced interest rate on loans up to $50,000 to make upgrades that improve their property's energy efficiency and resilience to natural disasters. |
| 172 WESTPAC GROUP 2024 ANNUAL REPORT CREATING VALUE FOR CUSTOMERS Driving efficiency for businesses Small businesses make a significant contribution to our economy, representing 97% of all Australian businesses1 .. We offer a range of working capital solutions to give customers confidence, whether they’re starting up or growing their business. In response to customer feedback, we established a dedicated Bank Guarantee Specialist Team that allows customers to obtain a bank guarantee in less than 24 hours. We have continuously enhanced our merchant technology for businesses since launching Australia’s first EFTPOS machine 40 years ago. Our latest high-speed, cost-effective merchant terminal, EFTPOS Flex integrates with more than 550 Point of Sale systems. We offered EFTPOS Air to more customers, allowing businesses to accept instant payments through their phone or tablet. We are working to make it safer for businesses to manage their recurring payments through real-time control over payment agreements, reducing the risk of errors and fraud. We extended this benefit to our commercial and institutional customers. The acquisition of HealthPoint, which offers instant e-health claiming to small business and commercial customers, recognises the growth of the healthcare sector as the population ages. To make employee spending easier and more secure for large businesses, new Dynamic Virtual Cards can be issued to their people on the go. This removes the need to issue physical cards or cash while enabling control and transparency over spending. To support our ambition to restore our institutional bank to the number one position, we have employed more bankers to provide deeper support to new and existing customers. Our financial markets franchise continues to perform, with a leading position in fixed income markets2 and #1 rank on the $A bond league table3 .. We were joint lead manager on the Australian Office of Financial Management’s (AOFM) first green bond issuance. Please see Collaborating for impact (page 185) for more information. Combating financial abuse We stand against financial abuse and our specialist teams are trained to support customers experiencing vulnerability, including domestic and family violence, financial abuse and problem gambling. We continue to embed Safety by Design principles into our product design and provided customer safety training to an additional 1,200 employees. See Respecting and advancing human rights (page 180) for more information. We enhanced our protection measures to include: • Education and Awareness: Westpac partnered with Legal Aid NSW and OurWatch to enhance the education on the Westpac website relating to financial abuse, elder financial abuse and gambling. • Gambling Block: Customers can apply an instant block on certain gambling-related transactions through Westpac’s mobile or online banking. • Parental controls and child education: To help young people learn how to manage their money safely - while giving parents the opportunity to act as banking ‘safety nets’ - we’ve added push notifications, restrictions on online payments and daily payment limits of $50 for under 14 years olds to our Choice Youth everyday account and Bump Savings account. • Power of attorney account monitoring: While the vast majority of attorneys act in the best interests of account holders, sadly this is not always the case. We have added an extra layer of transaction monitoring to flag unusual transactions from these accounts. This allows our specialist teams to step in and support customers and their attorneys regarding their rights and obligations. • Updated Terms & Conditions for savings, transaction, personal loan and credit card products highlight to customers that we have a zero-tolerance for products being misused for financial abuse. 1. Source: Australian Bureau of Statistics, describing small business as those with less than 20 employees. 2. #1 market share in bonds and semis, #1 market share in investment grade corporate bonds, =#1 market share in interest rate swaps, #1 market share in OIS, #1 market share in asset-backed bonds – 2023 Peter Lee Associates Fixed Income Survey, ranking against all banks. 3. Bloomberg Australian Bonds League table (excluding self-led issuance), YTD as at 27 September 2024. CUSTOMER SPOTLIGHT: SLOANEBUILT Sloanebuilt, based in Western Sydney, has been a leading manufacturer of heavy vehicle trailers for more than three decades. CEO Fred Marano attributes the company’s success to two core values: producing high-quality products and delivering first-class customer service. After visiting Sloanebuilt's operations, Anthony Miller, Chief Executive of Business & Wealth (pictured), said: “It’s a real privilege for Westpac to support a business like Sloanebuilt. They are a significant local employer in Western Sydney, committed to training and hiring many apprentices. Their dedication to employees and contribution to Australia’s manufacturing industry is truly commendable.” |

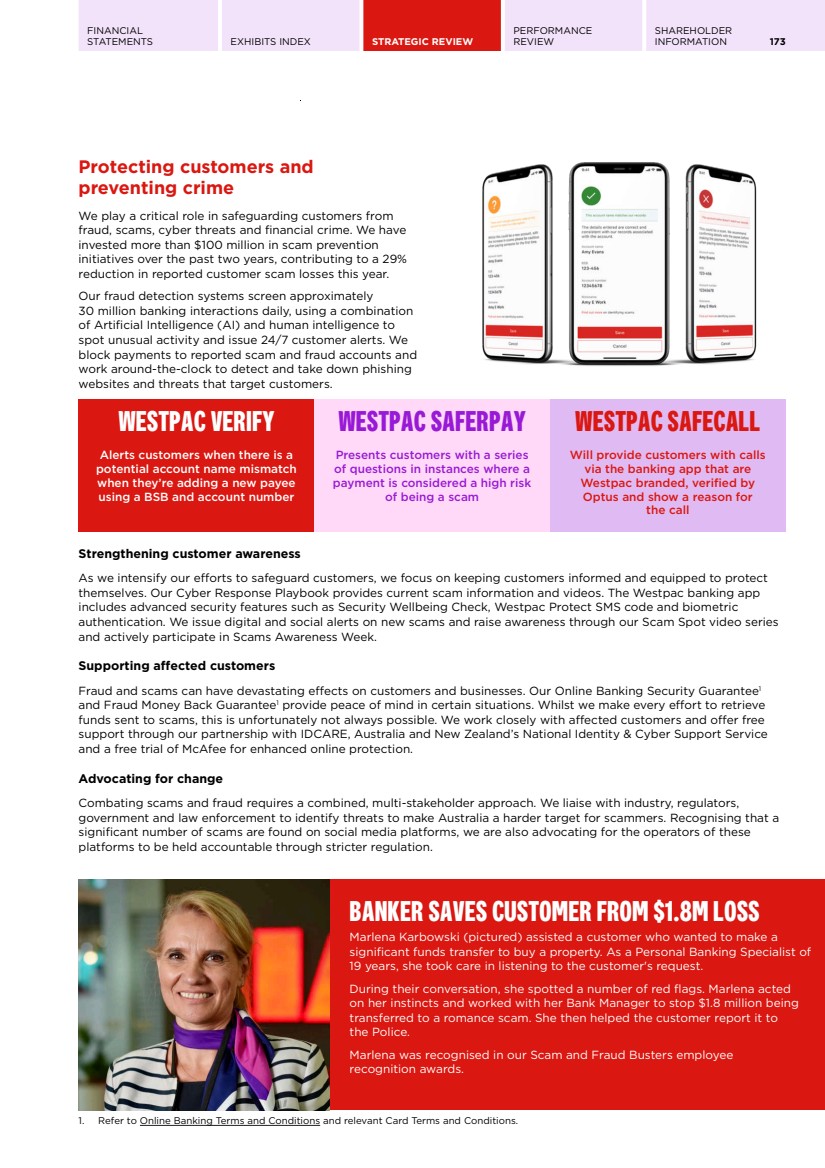
| FINANCIAL STATEMENTS EXHIBITS INDEX STRATEGIC REVIEW PERFORMANCE REVIEW SHAREHOLDER INFORMATION 173 Protecting customers and preventing crime We play a critical role in safeguarding customers from fraud, scams, cyber threats and financial crime. We have invested more than $100 million in scam prevention initiatives over the past two years, contributing to a 29% reduction in reported customer scam losses this year. Our fraud detection systems screen approximately 30 million banking interactions daily, using a combination of Artificial Intelligence (AI) and human intelligence to spot unusual activity and issue 24/7 customer alerts. We block payments to reported scam and fraud accounts and work around-the-clock to detect and take down phishing websites and threats that target customers. WESTPAC VERIFY Alerts customers when there is a potential account name mismatch when they’re adding a new payee using a BSB and account number WESTPAC SAFERPAY Presents customers with a series of questions in instances where a payment is considered a high risk of being a scam WESTPAC SAFECALL Will provide customers with calls via the banking app that are Westpac branded, verified by Optus and show a reason for the call Strengthening customer awareness As we intensify our efforts to safeguard customers, we focus on keeping customers informed and equipped to protect themselves. Our Cyber Response Playbook provides current scam information and videos. The Westpac banking app includes advanced security features such as Security Wellbeing Check, Westpac Protect SMS code and biometric authentication. We issue digital and social alerts on new scams and raise awareness through our Scam Spot video series and actively participate in Scams Awareness Week. Supporting affected customers Fraud and scams can have devastating effects on customers and businesses. Our Online Banking Security Guarantee1 and Fraud Money Back Guarantee1 provide peace of mind in certain situations. Whilst we make every effort to retrieve funds sent to scams, this is unfortunately not always possible. We work closely with affected customers and offer free support through our partnership with IDCARE, Australia and New Zealand’s National Identity & Cyber Support Service and a free trial of McAfee for enhanced online protection. Advocating for change Combating scams and fraud requires a combined, multi-stakeholder approach. We liaise with industry, regulators, government and law enforcement to identify threats to make Australia a harder target for scammers. Recognising that a significant number of scams are found on social media platforms, we are also advocating for the operators of these platforms to be held accountable through stricter regulation. 1. Refer to Online Banking Terms and Conditions and relevant Card Terms and Conditions. BANKER SAVES CUSTOMER FROM $1.8M LOSS Marlena Karbowski (pictured) assisted a customer who wanted to make a significant funds transfer to buy a property. As a Personal Banking Specialist of 19 years, she took care in listening to the customer's request. During their conversation, she spotted a number of red flags. Marlena acted on her instincts and worked with her Bank Manager to stop $1.8 million being transferred to a romance scam. She then helped the customer report it to the Police. Marlena was recognised in our Scam and Fraud Busters employee recognition awards. |
| 174 WESTPAC GROUP 2024 ANNUAL REPORT CREATING VALUE FOR OUR PEOPLE Our people are key to our success. We are investing in their careers and building an inclusive and diverse workplace, with strong leadership and opportunities to grow. Key highlights 80 ORGANISATIONAL HEALTH INDEX 49% WOMEN IN SENIOR LEADERSHIP1 $5.9BN PAID IN SALARIES 35,240 EMPLOYEES2 1. Senior Leadership includes Executive Team, General Managers and their direct reports (excluding administrative or support roles). 2. Refers to Full-Time Equivalent as at 30 September 2024. |

| FINANCIAL STATEMENTS EXHIBITS INDEX STRATEGIC REVIEW PERFORMANCE REVIEW SHAREHOLDER INFORMATION 175 ~3,000 Leaders participated in Leader Forums 11,200 People in Employee Advocacy Groups 138 New graduates joined Westpac Embedding cultural change We have made significant progress in improving our culture and the way we manage risk. This progress is reflected in both the final independent report of our CORE program and positive engagement results from our annual employee survey, Voice+. As role models, our leaders continue to play a critical role in embedding positive change. Our senior leaders are encouraging behaviours that focus on: • consistent, high-quality customer experiences; • excellent performance; and • confidently managing risks. At our Leader Forums, our Executives engaged approximately 3,000 leaders to share views on practical ways to drive positive customer and risk outcomes. Our third cohort of General Managers completed the Horizon Leadership Program and we launched a Better Leaders Program for our broader leadership group. We reinforce desired risk behaviours through our regular ‘Skill Boosts’ learning modules. Meanwhile, our 200 volunteer Culture Champions act as internal ambassadors, promoting a proactive risk and customer-focused culture with their peers. Our performance management framework ensures our employees understand what is expected of them. It also motivates our employees through clear goal setting and regular feedback. All employees have defined risk goals and 621 employees received additional variable reward for achieving great risk outcomes. Individuals and teams were also recognised by their peers or leaders via our recognition platform, with nearly 115,000 actions to recognise positive risk management and risk behaviours. Our employee survey Voice+ provides a holistic picture of employee engagement and includes the Organisational Health Index (OHI) global benchmarking measure. This year's results showed a significant improvement to 80 (+5) which places Westpac in the global top quartile. It also showed an improvement in our risk culture. These results reflect the positive impact of our organisation’s strategic direction, as well as customer, cultural and employee initiatives that have been implemented throughout the year. Building future skills Equipping our people with the skills and capabilities needed for both today and tomorrow is central to our learning and talent strategy. We are focusing on upskilling our organisation in critical skills areas such as data, digital and AI. An additional 2,300 employees completed the Data and Digital Capability Program, bringing the total to more than 6,200 individuals who have earned external badge qualifications in the past two years. 98% of participants reported that the program provided them with skills, knowledge and tools they'll find useful for the next three years. Our skills based strategy helps us define the skills needed to meet workforce demand and identify specific pathways in critical areas such as relationship management, sustainability, cyber security and data management. All employees complete mandatory cyber awareness, data protection and cyber threat training. Meanwhile, new learning modules on generative AI are helping our people to learn and build confidence with emerging technologies. INVESTING IN CAREERS We are future-proofing the skills of our people to support careers and improve customer service. We provided online sustainability training to 1,155 employees in wholesale and institutional banking, covering climate transition plans, sustainable finance and sustainability reporting. |
| 176 WESTPAC GROUP 2024 ANNUAL REPORT CREATING VALUE FOR OUR PEOPLE Attracting and recognising talent We are committed to creating better futures for our people by ensuring they thrive, feel inspired to do their best work and have opportunities to advance their careers. Our refreshed employer brand - Passionate people who make a difference - positions Westpac as a great place to work. We are proud to have attracted 138 bright minds through our industry-recognised1 graduate program of which more than 40% have degrees in STEM fields. Our commitment to diversity and inclusion is reflected in this year’s cohort, with 57% graduates being women. We have continued to invest in hiring engineering and data professionals, welcoming more than 350 engineers and 130 data specialists to the organisation. Our award-winning2 Mob Tech program offers an alternative pathway for First Nations people to gain comprehensive training in cloud computing, security, data analytics and web development. The program has been highly successful, with all 28 participants from the pilot cohort transitioning into ongoing technology roles at Westpac. We continue to invest in our people to help them achieve their career and learning goals. We expanded our Career Planning resources which now provides guidance to 11,600 individuals on their potential next role and pathways to success. Additionally, 384 permanent full-time and part-time employees utilised our study and graduation leave options. Updating our recruitment policies resulted in a 28% increase in the visibility of internal opportunities, encouraging our top talent to stay and grow their careers. Promoting employee wellbeing Fostering a flexible, safe and healthy workplace is a core part of our people strategy. We know that enhancing our employees’ work experience and supporting positive mental health are fundamental to creating an environment where everyone can thrive. Our Chief Mental Health Officer leads the strategy to support our people's mental health, focusing on prevention, early intervention and connected care. We conduct workplace assessments and offer targeted resources, support and education to promote employee wellbeing. This year, we completed a comprehensive review of factors that may influence wellbeing. This enabled us to provide tailored solutions to support our people's mental health and wellbeing, as well as their broader experience at work. To ensure successful implementation., we leveraged the expertise of psychologists and safety specialists. Employees have access to 24/7 confidential counselling support and other resources for both personal and professional support. Our workplace flexibility, wide range of leave options, banking benefits and private health care discounts further support employee wellbeing. For example, we offer parental leave (including support for those who experience pregnancy loss), cultural, wellbeing and lifestyle leave, uncapped domestic and family violence support leave, gender affirmation leave and Sorry Business leave. EMPOWERING WOMEN The EmPOWERUP Tech Returnship program provides a pathway for women to reignite their technology careers. We proudly welcomed 37 talented women to Westpac, offering them extensive support and training during their first 24 weeks. With more than 1,000 applicants, this program continues to strengthen our female talent pipeline. EmPOWERUP fosters individual growth, flexible working and networking opportunities while enriching our workplace with diverse perspectives and skills. 1. 2024 Australian HR Awards – Best Graduate Development Program. 2. 2024 Women in Banking and Finance Awards – Winner of the Inclusive Workplace of the Year. |

| FINANCIAL STATEMENTS EXHIBITS INDEX STRATEGIC REVIEW PERFORMANCE REVIEW SHAREHOLDER INFORMATION 177 3,000+ Leaders completed inclusive leadership training 24/7 COUNSELLING SUPPORT Supporting positive mental health 1.08% First nations people in our workforce UPSTANDER INITIATIVE Speaking up and acting against racism and discrimination Strengthening diversity, equity and inclusion Westpac is a proudly inclusive employer, committed to fostering a safe and inclusive workplace for everyone, regardless of background, gender or identity. We want our people to feel valued, respected and safe to be themselves at work. We have 10 Employee Advocacy Groups that connect more than 11,200 people on matters they are passionate about. Our zero tolerance approach to all forms of discrimination and harassment is reinforced through our Code of Conduct and Discrimination, Bullying and Harassment policy. Our commitment is supported by training for leaders and employees, dedicated reporting channels, investigation and support processes. This year, more than 5,000 employees participated in the Upstander initiative, which encourages our people to speak up against inappropriate behaviours. Our industry-recognised1 programs and initiatives are informed by the views of our people, captured in the annual Inclusion and Diversity survey. Examples included: Learning and development to support marginalised groups. We have introduced mandatory training for leaders to provide the necessary tools and capabilities to support people with diverse views, experiences and backgrounds. Prioritising cultural diversity and increasing culturally diverse leaders. Our partnerships with the Asian Leadership Project and Dr. John Yu Fellowship offer future leaders through networking, mentorship and career development opportunities. Helping First Nations people to build meaningful careers. As outlined in our Reconciliation Action Plan (RAP), we are committed to helping First Nations People build meaningful careers. This year, we improved representation to 1.08% and aim to increase this to 1.5% next year. Refer to Creating value for the community (page 178) for more information. Providing inclusive career opportunities for candidates with disability. As the first financial institution in Australia to obtain Disability Confident Recruiter accreditation, we ensure equitable hiring processes for individuals with disability, including neurodivergent candidates. We have also partnered with People with Disability Australia to launch a program advancing women with disability, a first for Westpac. Taking action to support women to advance their careers. We support the 40:40 Vision and are proud to have 49% women in senior leadership positionsa .. The Illuminate program supports 82 aspiring female leaders in Australia, Fiji, PNG, Singapore and New Zealand through General Manager sponsorship. We are also the first bank to join Diversity Council Australia’s RISE Project, helping culturally diverse women to advance their leadership careers. Our EmPOWERUp program creates a pathway for women to reignite their careers after an extended leave break (see Empowering Women case study on page 176). We are committed to paying our people fairly and equitably. However, we recognise there is more work to do. As reported to the Workplace Gender Equality Agency, we have a median gender gap of 29.3%. For more information on this gap and our strategy to increase women's representation in key roles refer to our Gender Pay Statement on our website. a. Senior Leadership includes Executive Team, General Managers and their direct reports (excluding administrative or support roles). Further information is set out in the 2024 Sustainability Index and Datasheet. 1. Global recognition of Westpac's diversity, inclusion and equity practices includes Equileap’s 2024 report, the Australian Workplace Equality Index (AWEI), the Australian Disability Network INDEX and the Australian Defence Force Reserves and Employer Support Awards. |
| 178 WESTPAC GROUP 2024 ANNUAL REPORT CREATING VALUE FOR THE COMMUNITY We are determined to create meaningful impact by supporting people, community organisations and social enterprises that are building better futures for Australians. #1 BANK FOR CORPORATE GIVING1 73,000 HOURS VOLUNTEERED BY WESTPAC EMPLOYEES $177M IN COMMUNITY INVESTMENT2 $37.9M SPENT WITH DIVERSE SUPPLIERS3 1. Westpac was named the #1 Bank for Corporate Giving in 2024 by Forbes Australia. 2. Figure includes commercial sponsorships and foregone fee revenue. 3. Refer to the 2024 Sustainability Index and Datasheet for definition. |

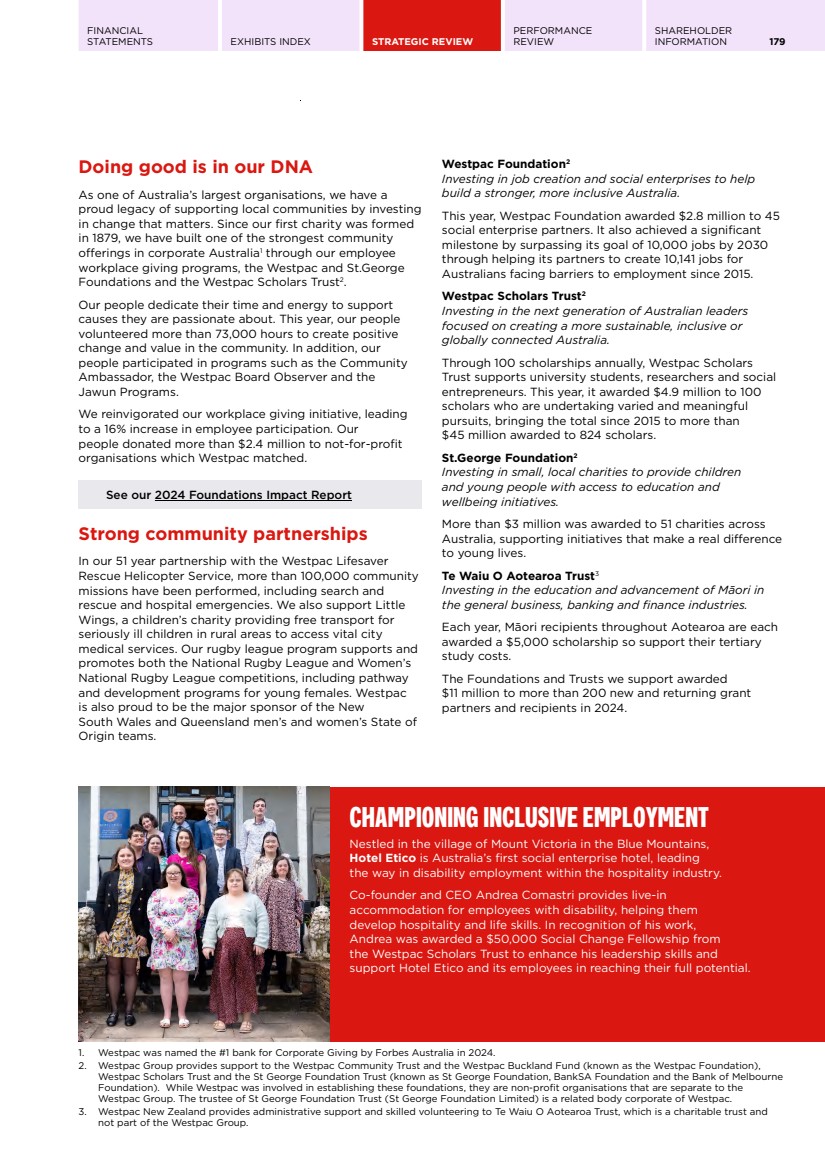
| FINANCIAL STATEMENTS EXHIBITS INDEX STRATEGIC REVIEW PERFORMANCE REVIEW SHAREHOLDER INFORMATION 179 Doing good is in our DNA As one of Australia’s largest organisations, we have a proud legacy of supporting local communities by investing in change that matters. Since our first charity was formed in 1879, we have built one of the strongest community offerings in corporate Australia1 through our employee workplace giving programs, the Westpac and St.George Foundations and the Westpac Scholars Trust2 .. Our people dedicate their time and energy to support causes they are passionate about. This year, our people volunteered more than 73,000 hours to create positive change and value in the community. In addition, our people participated in programs such as the Community Ambassador, the Westpac Board Observer and the Jawun Programs. We reinvigorated our workplace giving initiative, leading to a 16% increase in employee participation. Our people donated more than $2.4 million to not-for-profit organisations which Westpac matched. See our 2024 Foundations Impact Report Strong community partnerships In our 51 year partnership with the Westpac Lifesaver Rescue Helicopter Service, more than 100,000 community missions have been performed, including search and rescue and hospital emergencies. We also support Little Wings, a children’s charity providing free transport for seriously ill children in rural areas to access vital city medical services. Our rugby league program supports and promotes both the National Rugby League and Women’s National Rugby League competitions, including pathway and development programs for young females. Westpac is also proud to be the major sponsor of the New South Wales and Queensland men’s and women’s State of Origin teams. Westpac Foundation2 Investing in job creation and social enterprises to help build a stronger, more inclusive Australia. This year, Westpac Foundation awarded $2.8 million to 45 social enterprise partners. It also achieved a significant milestone by surpassing its goal of 10,000 jobs by 2030 through helping its partners to create 10,141 jobs for Australians facing barriers to employment since 2015. Westpac Scholars Trust2 Investing in the next generation of Australian leaders focused on creating a more sustainable, inclusive or globally connected Australia. Through 100 scholarships annually, Westpac Scholars Trust supports university students, researchers and social entrepreneurs. This year, it awarded $4.9 million to 100 scholars who are undertaking varied and meaningful pursuits, bringing the total since 2015 to more than $45 million awarded to 824 scholars. St.George Foundation2 Investing in small, local charities to provide children and young people with access to education and wellbeing initiatives. More than $3 million was awarded to 51 charities across Australia, supporting initiatives that make a real difference to young lives. Te Waiu O Aotearoa Trust3 Investing in the education and advancement of Māori in the general business, banking and finance industries. Each year, Māori recipients throughout Aotearoa are each awarded a $5,000 scholarship so support their tertiary study costs. The Foundations and Trusts we support awarded $11 million to more than 200 new and returning grant partners and recipients in 2024. 1. Westpac was named the #1 bank for Corporate Giving by Forbes Australia in 2024. 2. Westpac Group provides support to the Westpac Community Trust and the Westpac Buckland Fund (known as the Westpac Foundation), Westpac Scholars Trust and the St George Foundation Trust (known as St George Foundation, BankSA Foundation and the Bank of Melbourne Foundation). While Westpac was involved in establishing these foundations, they are non-profit organisations that are separate to the Westpac Group. The trustee of St George Foundation Trust (St George Foundation Limited) is a related body corporate of Westpac. 3. Westpac New Zealand provides administrative support and skilled volunteering to Te Waiu O Aotearoa Trust, which is a charitable trust and not part of the Westpac Group. CHAMPIONING INCLUSIVE EMPLOYMENT Nestled in the village of Mount Victoria in the Blue Mountains, Hotel Etico is Australia’s first social enterprise hotel, leading the way in disability employment within the hospitality industry. Co-founder and CEO Andrea Comastri provides live-in accommodation for employees with disability, helping them develop hospitality and life skills. In recognition of his work, Andrea was awarded a $50,000 Social Change Fellowship from the Westpac Scholars Trust to enhance his leadership skills and support Hotel Etico and its employees in reaching their full potential. |
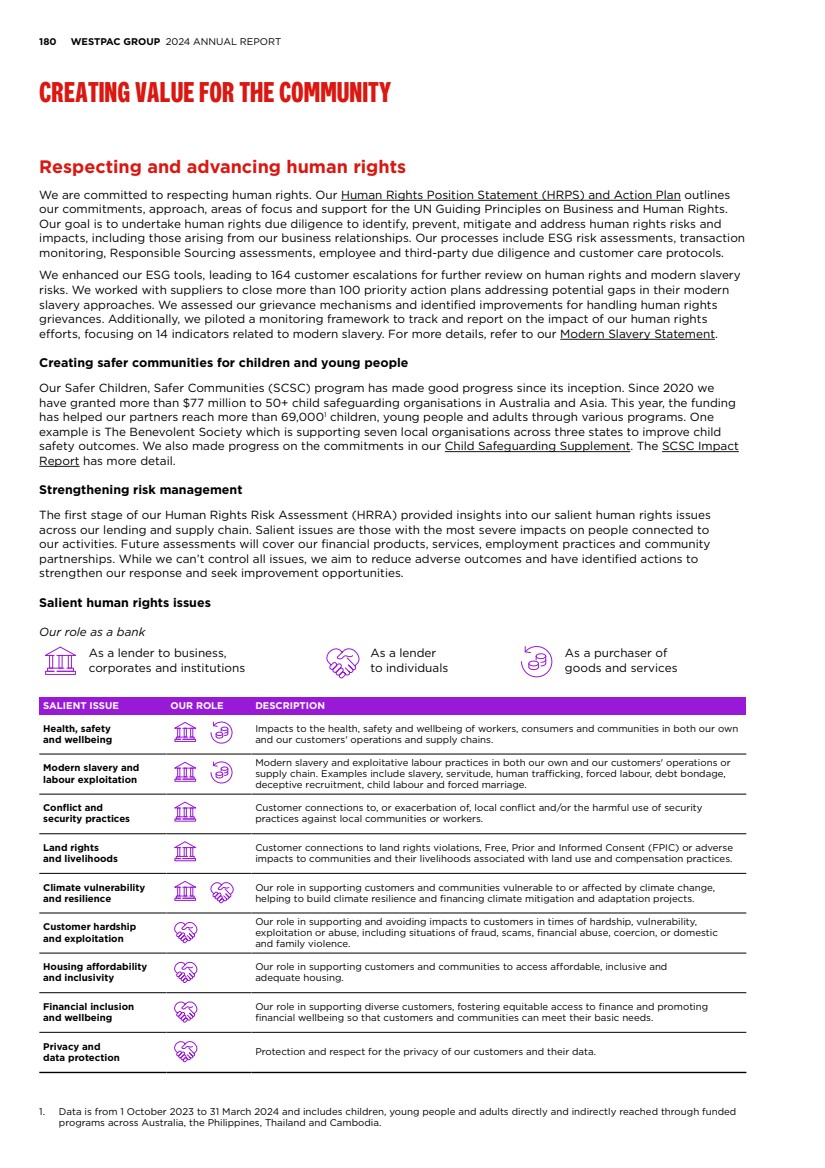
| 180 WESTPAC GROUP 2024 ANNUAL REPORT CREATING VALUE FOR THE COMMUNITY Respecting and advancing human rights We are committed to respecting human rights. Our Human Rights Position Statement (HRPS) and Action Plan outlines our commitments, approach, areas of focus and support for the UN Guiding Principles on Business and Human Rights. Our goal is to undertake human rights due diligence to identify, prevent, mitigate and address human rights risks and impacts, including those arising from our business relationships. Our processes include ESG risk assessments, transaction monitoring, Responsible Sourcing assessments, employee and third-party due diligence and customer care protocols. We enhanced our ESG tools, leading to 164 customer escalations for further review on human rights and modern slavery risks. We worked with suppliers to close more than 100 priority action plans addressing potential gaps in their modern slavery approaches. We assessed our grievance mechanisms and identified improvements for handling human rights grievances. Additionally, we piloted a monitoring framework to track and report on the impact of our human rights efforts, focusing on 14 indicators related to modern slavery. For more details, refer to our Modern Slavery Statement. Creating safer communities for children and young people Our Safer Children, Safer Communities (SCSC) program has made good progress since its inception. Since 2020 we have granted more than $77 million to 50+ child safeguarding organisations in Australia and Asia. This year, the funding has helped our partners reach more than 69,0001 children, young people and adults through various programs. One example is The Benevolent Society which is supporting seven local organisations across three states to improve child safety outcomes. We also made progress on the commitments in our Child Safeguarding Supplement. The SCSC Impact Report has more detail. Strengthening risk management The first stage of our Human Rights Risk Assessment (HRRA) provided insights into our salient human rights issues across our lending and supply chain. Salient issues are those with the most severe impacts on people connected to our activities. Future assessments will cover our financial products, services, employment practices and community partnerships. While we can’t control all issues, we aim to reduce adverse outcomes and have identified actions to strengthen our response and seek improvement opportunities. Salient human rights issues Our role as a bank As a lender to business, corporates and institutions As a lender to individuals As a purchaser of goods and services SALIENT ISSUE OUR ROLE DESCRIPTION Health, safety and wellbeing Impacts to the health, safety and wellbeing of workers, consumers and communities in both our own and our customers' operations and supply chains. Modern slavery and labour exploitation Modern slavery and exploitative labour practices in both our own and our customers' operations or supply chain. Examples include slavery, servitude, human trafficking, forced labour, debt bondage, deceptive recruitment, child labour and forced marriage. Conflict and security practices Customer connections to, or exacerbation of, local conflict and/or the harmful use of security practices against local communities or workers. Land rights and livelihoods Customer connections to land rights violations, Free, Prior and Informed Consent (FPIC) or adverse impacts to communities and their livelihoods associated with land use and compensation practices. Climate vulnerability and resilience Our role in supporting customers and communities vulnerable to or affected by climate change, helping to build climate resilience and financing climate mitigation and adaptation projects. Customer hardship and exploitation Our role in supporting and avoiding impacts to customers in times of hardship, vulnerability, exploitation or abuse, including situations of fraud, scams, financial abuse, coercion, or domestic and family violence. Housing affordability and inclusivity Our role in supporting customers and communities to access affordable, inclusive and adequate housing. Financial inclusion and wellbeing Our role in supporting diverse customers, fostering equitable access to finance and promoting financial wellbeing so that customers and communities can meet their basic needs. Privacy and data protection Protection and respect for the privacy of our customers and their data. 1. Data is from 1 October 2023 to 31 March 2024 and includes children, young people and adults directly and indirectly reached through funded programs across Australia, the Philippines, Thailand and Cambodia. |
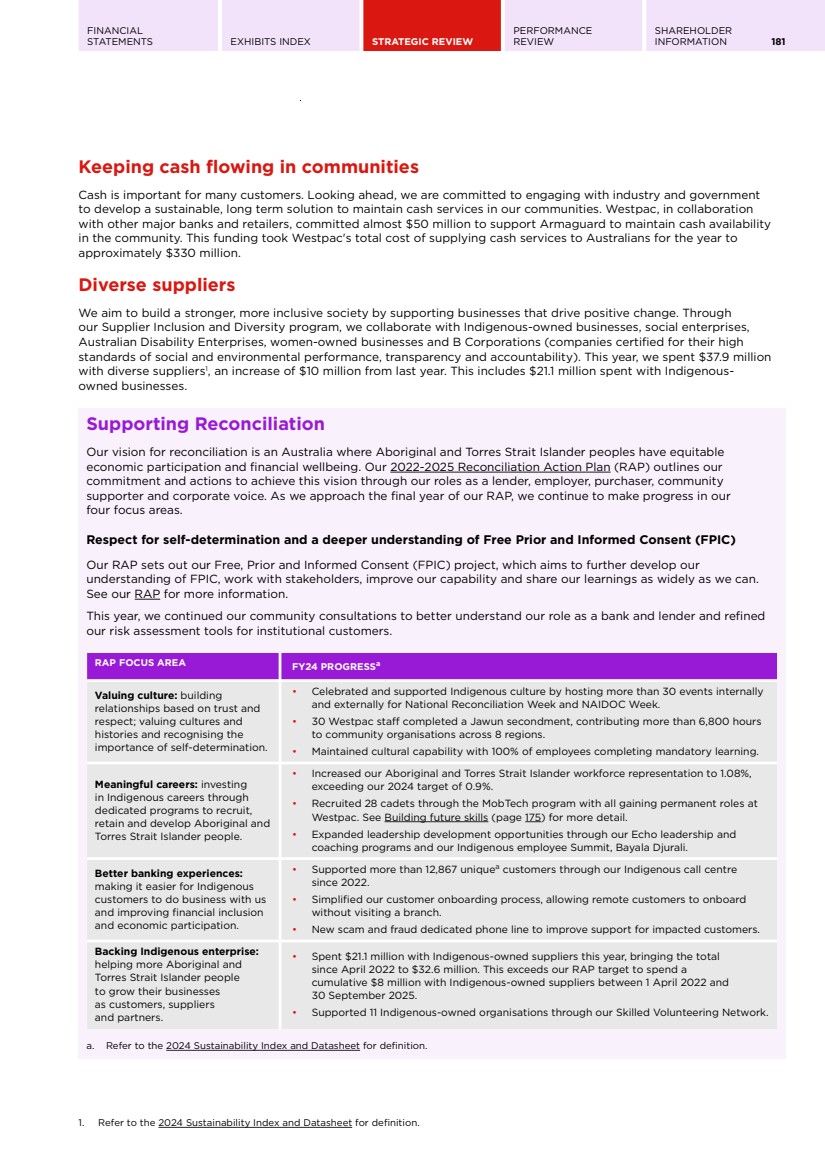
| FINANCIAL STATEMENTS EXHIBITS INDEX STRATEGIC REVIEW PERFORMANCE REVIEW SHAREHOLDER INFORMATION 181 Keeping cash flowing in communities Cash is important for many customers. Looking ahead, we are committed to engaging with industry and government to develop a sustainable, long term solution to maintain cash services in our communities. Westpac, in collaboration with other major banks and retailers, committed almost $50 million to support Armaguard to maintain cash availability in the community. This funding took Westpac's total cost of supplying cash services to Australians for the year to approximately $330 million. Diverse suppliers We aim to build a stronger, more inclusive society by supporting businesses that drive positive change. Through our Supplier Inclusion and Diversity program, we collaborate with Indigenous-owned businesses, social enterprises, Australian Disability Enterprises, women-owned businesses and B Corporations (companies certified for their high standards of social and environmental performance, transparency and accountability). This year, we spent $37.9 million with diverse suppliers1 , an increase of $10 million from last year. This includes $21.1 million spent with Indigenous-owned businesses. Supporting Reconciliation Our vision for reconciliation is an Australia where Aboriginal and Torres Strait Islander peoples have equitable economic participation and financial wellbeing. Our 2022-2025 Reconciliation Action Plan (RAP) outlines our commitment and actions to achieve this vision through our roles as a lender, employer, purchaser, community supporter and corporate voice. As we approach the final year of our RAP, we continue to make progress in our four focus areas. Respect for self-determination and a deeper understanding of Free Prior and Informed Consent (FPIC) Our RAP sets out our Free, Prior and Informed Consent (FPIC) project, which aims to further develop our understanding of FPIC, work with stakeholders, improve our capability and share our learnings as widely as we can. See our RAP for more information. This year, we continued our community consultations to better understand our role as a bank and lender and refined our risk assessment tools for institutional customers. RAP FOCUS AREA FY24 PROGRESSa Valuing culture: building relationships based on trust and respect; valuing cultures and histories and recognising the importance of self-determination. • Celebrated and supported Indigenous culture by hosting more than 30 events internally and externally for National Reconciliation Week and NAIDOC Week. • 30 Westpac staff completed a Jawun secondment, contributing more than 6,800 hours to community organisations across 8 regions. • Maintained cultural capability with 100% of employees completing mandatory learning. Meaningful careers: investing in Indigenous careers through dedicated programs to recruit, retain and develop Aboriginal and Torres Strait Islander people. • Increased our Aboriginal and Torres Strait Islander workforce representation to 1.08%, exceeding our 2024 target of 0.9%. • Recruited 28 cadets through the MobTech program with all gaining permanent roles at Westpac. See Building future skills (page 175) for more detail. • Expanded leadership development opportunities through our Echo leadership and coaching programs and our Indigenous employee Summit, Bayala Djurali. Better banking experiences: making it easier for Indigenous customers to do business with us and improving financial inclusion and economic participation. • Supported more than 12,867 uniquea customers through our Indigenous call centre since 2022. • Simplified our customer onboarding process, allowing remote customers to onboard without visiting a branch. • New scam and fraud dedicated phone line to improve support for impacted customers. Backing Indigenous enterprise: helping more Aboriginal and Torres Strait Islander people to grow their businesses as customers, suppliers and partners. • Spent $21.1 million with Indigenous-owned suppliers this year, bringing the total since April 2022 to $32.6 million. This exceeds our RAP target to spend a cumulative $8 million with Indigenous-owned suppliers between 1 April 2022 and 30 September 2025. • Supported 11 Indigenous-owned organisations through our Skilled Volunteering Network. a. Refer to the 2024 Sustainability Index and Datasheet for definition. 1. Refer to the 2024 Sustainability Index and Datasheet for definition. |
| 182 WESTPAC GROUP 2024 ANNUAL REPORT CREATING VALUE FOR THE ENVIRONMENT We are committed to global efforts in achieving net-zero by 2050 through our operations, helping customers to transition and collaborating for impact. Key highlights1 13 TARGETS IN ALL 9 NZBA EMISSIONS-INTENSIVE SECTORS2 86% REDUCTION IN SCOPE 1 AND 2 EMISSIONS SINCE 2021 $29BN IN SUSTAINABLE FINANCE LENDING (TCE) $13.7BN IN BOND FACILITATION SINCE THE START OF FY22 1. Refer to our 2024 Climate Report for definitions and detail. 2. Westpac joined the Net-Zero Banking Alliance (NZBA) in 2022. |
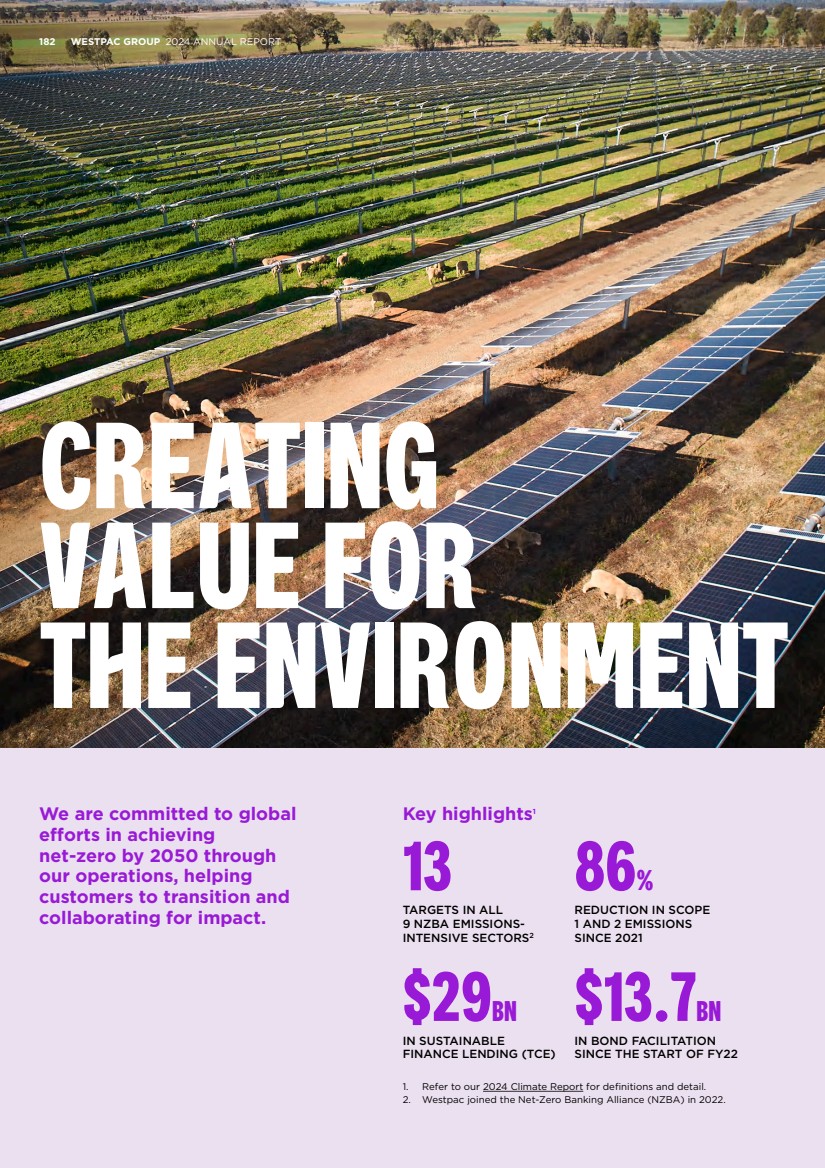
| FINANCIAL STATEMENTS EXHIBITS INDEX STRATEGIC REVIEW PERFORMANCE REVIEW SHAREHOLDER INFORMATION 183 In line with our purpose of creating better futures together, we are progressing our climate transition plan with the ambition to become a Net-Zero, climate resilient bank. Our approach to climate change, detailed in our Climate Report, guides our carbon footprint reduction efforts across the organisation. We've continued to make progress against our three action areas. Further details on our targets and plans are available in our 2024 Climate Report. 1. Net-zero, climate resilient operations We are committed to reducing the climate change impacts of our operations through the reduction of our scope 1, 2 and scope 3 upstream emissions. This year, we reduced our total operational emissions (scope 1, 2 and scope 3 upstream) by a further 19% largely due to meeting our renewable energy goals ahead of schedule. Our scope 1 and 2 emissions are now 86% lower than our 2021 baseline1 which surpasses our 2030 target of a 76% reduction, six years ahead of schedule. To further reduce our scope 1 emissions, we have installed electric vehicle (EV) charging stations in more workplaces and commenced including EVs in our fleet. Scope 3 upstream emissions are now 41% lower than our 2021 baseline1 , positioning us well against our 2030 target for a 50% reduction. We developed a new program which will support employees reduce their home emissions by switching to renewable electricity contracts with retailers. WESTPAC'S OPERATIONAL EMISSIONS (Tonnes of CO2 equivalent) TITLE 1 TITLE 7,851 7,297 6,559 6,262 53,981 36,734 14,489 2,303 71,738 63,377 61,044 57,655 Scope 1 emissions Scope 2 emissions Scope 3 upstream emissions 2021¹ 2022 2023 2024 TITLE 2. Supporting customers’ transition to net-zero and to build their climate resilience More than 99% of our carbon footprint is derived from financed emissions, which are the emissions associated with the activities of the customers we lend to. Reducing the emissions intensity of our loan portfolio by mobilising capital to support customers in their transition is one of the most significant roles we can play as a bank. This supports the transition to a net-zero economy and helps us to reduce our financed emissions. To guide our efforts, we joined the NZBA and have set 2030 targets for some of the most emissions intensive sectors in our lending. We made progress last year with an improved emissions profile in 11 of our 12 sectors where we have targets. This year, we introduced a new aluminium sector target, bringing us to a total of 13 targets across emissions intensive sectors under our NZBA commitment. Up to 54% of our estimated scope 3 financed emissions from the scope 1 and 2 emissions of our customers at a Group level for FY23 relate to customers and industries captured in our NZBA sector targets. We engaged just over 150 institutional customers on their climate transition plans and found that 84% of customers had a public transition plan. As part of our engagement, we provided insights on industry best practice, climate strategy and ESG trends. Other areas of progress include: • Launching the Sustainable Upgrades home and investor loans with the support of the Clean Energy Finance Corporation’s $1 billion Household Energy Upgrades Fund, for customers to install new features or technology to improve the energy efficiency or climate resilience of their properties. • Building on the success of New Zealand’s Sustainable Farm Loan and Sustainable Finance Business Loan launched last year, we introduced a new Sustainable Equipment Finance Loan. This initiative supports more businesses in reducing their climate impacts through a range of sustainable assets, such as electric vehicles. • We reviewed our loans and bond facilitation activities against our Sustainable Finance Framework. At 30 September 2024 we had $29 billion in lending while the cumulative total of bond facilitation since the start of FY22 was $13.7 billion. This puts us on track to meet our 2030 targets of $55 billion and $40 billion respectively. Refer to the 2024 Climate Report for further information about our financed emissions at an industry level 1. The 2021 baselines for these targets is different from what is in this figure as data was adjusted for COVID-19 pandemic and other impacts. |
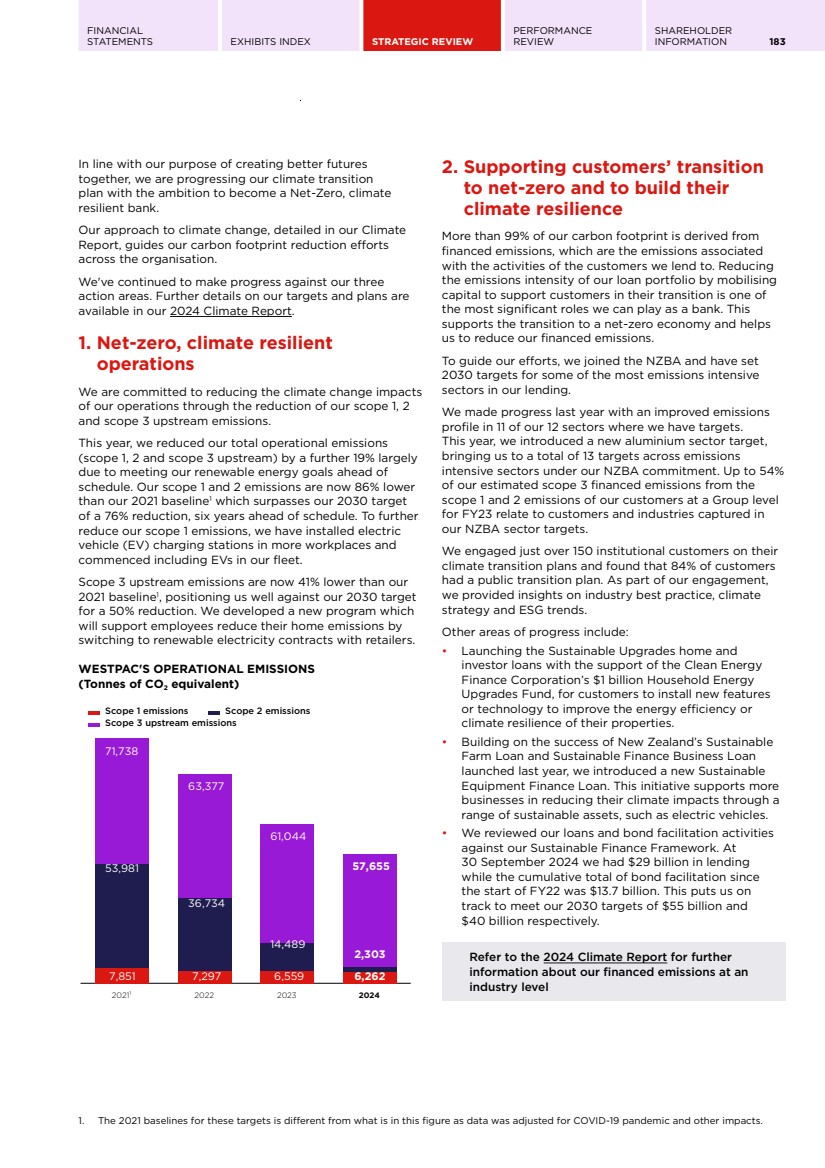
| 184 WESTPAC GROUP 2024 ANNUAL REPORT CREATING VALUE FOR THE ENVIRONMENT GROUP FINANCED EMISSIONS AND PROGRESS ON OUR NZBA SECTOR TARGETS Financed emissions are our estimated share of customers’ scope 1, 2 and, for certain sectors, scope 3 emissions - collectively referred to as our scope 3 financed emissions. In FY23, the financed emissions for our portfolio were estimated at 26.2 MtCO2-e (customers' scope 1 and 2), up 6% over FY22 partly due to a 3% rise in TCE over the year. Our NZBA sector targets are set over subsets of the sectors in our portfolio. The progress metrics for these targets are calculated using different methodologies to those used to calculate our Group financed emissions. Calculations typically rely on more granular data, including customer or related asset emissions. Given the complexity of the calculations and the time needed to collect customers' information, our estimated Group portfolio financed emissions and progress of our NZBA sector targets are reported one year in arrears, for the period ended 30 September 2023, unless otherwise indicated. The below table summarises our progress on our NZBA sector targets. See our 2024 Climate Report for more information. PROGRESS ON OUR NZBA SECTOR TARGETS NZBA SECTOR WESTPAC SECTOR TYPE OF TARGET CUMULATIVE CHANGE IN EMISSIONS FROM BASELINE YEAR (%)a PROGRESS FY22 PROGRESS FY23 IMPLIED 2030 TARGET Power generation Power Generation Intensity -12 -23 -62 Cement Cement Production Intensity 0 -5 -14 Oil and Gas Upstream Oil and Gas Absolute -18 -45 -23 Coal Thermal Coal Mining Absolute -23 -81 -100 Transport Aviation (Passenger Aircraft Operations) Intensity -18 -45 -60 Iron and Steel Steel Production Intensity In FY23, we are on track to achieve our 2030 target and progress remains below our emissions pathway. Given the small number of customers, this information is not publicly disclosed. Aluminium Aluminiuma Intensity The baseline year for this target is 2023. Given the small number of customers, this information is not publicly disclosed. Commercial and Residential Real Estate Commercial Real Estate (Offices)a Intensity NA - baseline year is 2022 -18 -59 Residential Real Estate (Australia)a Intensity NA - baseline year is 2022 -11 -56 Agriculture Australia Beef and Sheep Intensity +4 +4 -9 Australia Dairy Intensity -7 -8 -10 New Zealand Beef and Sheep Intensity -1 -4 -9 New Zealand Dairy Intensity +4 -7 -10 a. Baseline year for Commercial Real Estate and Residential Real Estate targets is 2022. Baseline year for Aluminium is 2023. Baseline year for all other NZBA sector targets is 2021. Baseline and progress metrics for Residential Real Estate target are as at 31 August. |

| FINANCIAL STATEMENTS EXHIBITS INDEX STRATEGIC REVIEW PERFORMANCE REVIEW SHAREHOLDER INFORMATION 185 3. Collaborating for impact Transitioning to net-zero requires collaboration across all sectors of the global economy. We collaborate with governments, industry associations, NGOs, communities and international bodies while participating in the initiatives of several standard setting bodies. This included: • participating in consultations for the AASB climate-related disclosures standards and the Climate Active program through our Australian Banking Association (ABA) membership; • participating in the development of the Australian Sustainable Finance Taxonomy through our Australian Sustainable Finance Institute (ASFI) membership; and • co-chairing the Banking Board of the United Nations Environment Programme Finance Initiative (UNEP FI) which oversees the Principles for Responsible Banking (PRBs) and being involved in steering and principals groups that govern the NZBA. We’ve committed to invest in a new fund by Virescent Ventures focused on in early-stage climate technologies. This investment, alongside the Clean Energy Finance Corporation, will provide insights into emerging technologies and help us to assist customers, especially in hard-to-abate sectors, as they progress their transition plans. SUPPORTING THE TRANSITION TO A SUSTAINABLE FUTURE Westpac supported the Australian Office of Financial Management (AOFM) as Joint Lead Manager, with their first 10-year A$7 billion Green Treasury Bond. AOFM manages the Australian Government’s debt portfolio. The green bond’s proceeds will be allocated to projects that drive Australia’s transition to net-zero by 2050 and aim to deliver lower greenhouse gas emissions, increases in renewable energy production and bolstering biodiversity conservation, restoration and adaptation NATURAL CAPITAL The world’s natural capital is under threat as natural resources decline and critical habitats are placed under pressure. As with climate change, we have a role to play in supporting customers to conserve nature and reduce natural capital loss. We released our Natural Capital Position Statement (NCPS) last year and are working to further build our understanding of nature-related dependencies, impacts, risks and opportunities. According to the Task Force on Nature-related Financial Disclosures (TNFD)’s reference sectors, we estimate that more than 13% of our lending is to sectors with significant nature-related dependencies and impacts. We are further developing our geospatial capabilities and piloting TNFD LEAP (Locate, Evaluate, Assess and Prepare) assessments for material sectors. This is helping to set the baselines for additional work. As our customers and investors become more aware of nature-related risks and opportunities, we continue to engage with them to support their journey and deepen our understanding of these impacts. In FY24, we supported the Australian Sustainable Finance Institute’s (ASFI) Valuing Natural Capital program as part of their Natural Capital Advisory Group. We are developing foundational training for front line bankers and participation in external learning, such as workshops by the Principles for Responsible Banking. Next year, we aim to foster greater awareness amongst other employees, management and the Board on nature-related topics. EXPOSURE TO TNFD REFERENCE SECTORS TNFD REFERENCE SECTORSa 2024 % OF GROUP TCEb Automobiles and Components 0.07 Consumer Durables & Apparel 0.34 Consumer Services, Consumer Staples Distribution and Retail 1.71 Energy 0.62 Food & Beverage 2.74 Household & Personal Products 0.01 Materials 1.12 Pharmaceuticals & Biotechnology 0.09 Real Estate Management & Development, Equity Real Estate Investment Trusts (REITs), Home building and Capital Goods 2.83 Semiconductors & Semiconductor Equipment 0.13 Transportation 2.09 Utilities, Commercial and Professional Services 1.54 Total 13.29 a. Reference sectors set out within Annex 1 of the TNFD Sector guidance, Additional guidance for financial institutions Version 2.0 June 2024. Refer to the glossary of the 2024 Sustainability Index and Datasheet for further details. b. Represents the TCE for customers in each reference sector, excluding exposures for the committed portion of secondary market trading and underwriting risk, as a percentage of TCE for Westpac. |
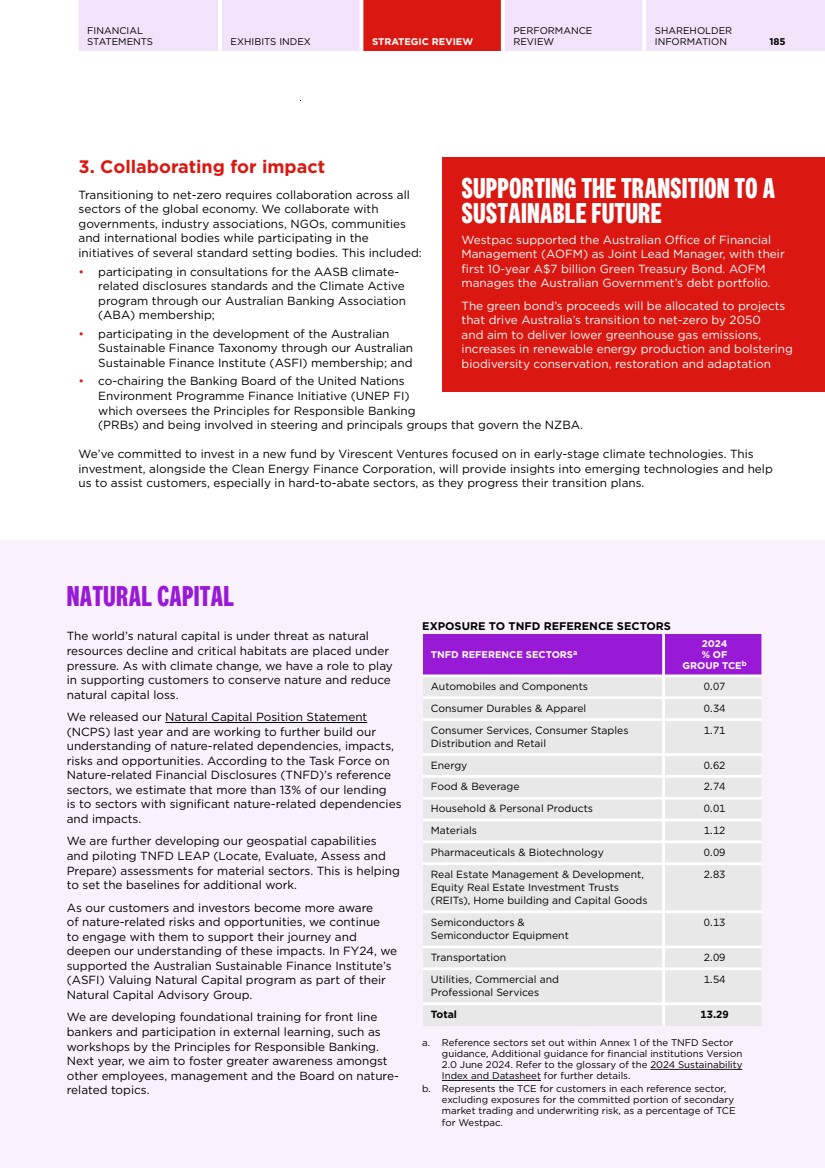
| 186 WESTPAC GROUP 2024 ANNUAL REPORT TECHNOLOGY SIMPLIFY MODERNISE INNOVATE Accelerating simplification We are taking significant steps to rationalise our technology and reduce costs. UNITE, our business-led, technology-enabled transformation program, aims to simplify our processes and systems to build a strong foundation for future growth. The multi-year program intends to deliver progressive benefits to customers, employees and shareholders by reducing the number of our technology platforms and business complexity in the longer term. Our objective is to have an efficient technology environment, allowing us to be faster in responding to customer needs and technological changes. We have begun 39 initiatives under UNITE, including streamlining the way we verify customer identification (see case study). We are giving our bankers and lenders across St.George, Bank of Melbourne and BankSA a new Customer Relationship Management system to improve service. We have decommissioned more than 200 applications and are well-progressed on launching a unified platform to provide better support to collections and hardship customers. We undertook other major simplification projects, including one that halved our data centres and consolidated nine networks into one, earning recognition as Australia’s best technology project.1 Technology simplification will remain a priority for Westpac, driving operational efficiency and enhancing our ability to create long term value for stakeholders. STREAMLINED ID VERIFICATION We are consolidating 22 customer verification processes into a single digital identification solution, which includes biometrics. Customers will be able to verify their identity through the Westpac App or Online Banking using acceptable forms of ID such as an Australian driver’s licence, passport, or Medicare card. This will help make the crucial ID verification step faster, easier and more secure for new customers. UNITE objectives Better customer experience UNITE aims to deliver all customers Westpac’s best experience, including access to Australia’s best banking app leading to improved customer experience, NPS and customer loyalty. Improved employee experience UNITE aims to give us one best way to serve and support our customers across the entire bank leading to more time with customers, fewer systems to navigate, easier processes and increased employee engagement. Increased shareholder return UNITE aims to reduce business complexity leading to lower run costs and spend on transformation leading to close the cost to income ratio gap to peers. 1. 2024 Australian Institute of Project Management National Awards. |
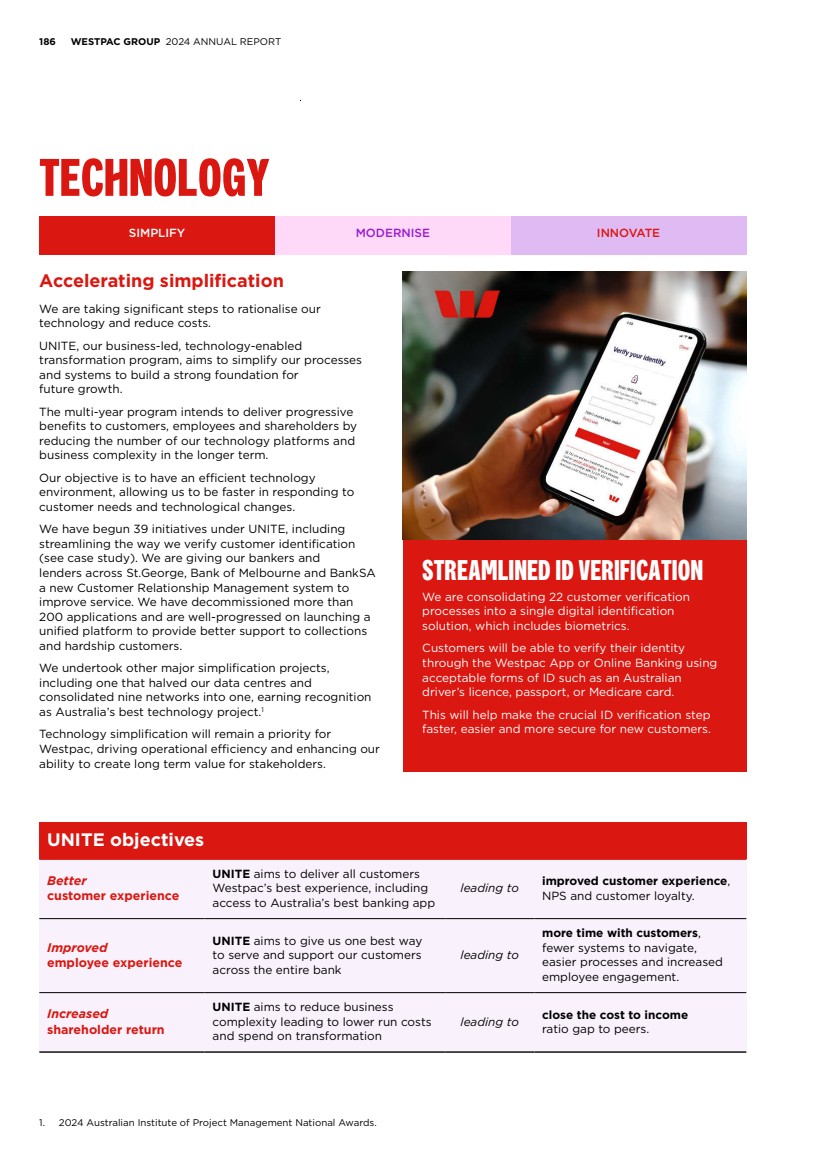
| FINANCIAL STATEMENTS EXHIBITS INDEX STRATEGIC REVIEW PERFORMANCE REVIEW SHAREHOLDER INFORMATION 187 Modernising for superior experiences While simplifying our technology, we are also modernising to deliver market-leading products and experiences to customers. • Our online banking app was rated #1 by Forrester for the second year, with enhanced security and features such as Westpac SaferPay and Westpac Verify. See Creating value for customers (page 168) for more information. • BT Panorama won best wealth management platform at the Australian Wealth Management Awards. • Robotic automation across consumer, business and institutional lending saved bankers 20,000 administration hours to focus on customer service. • Our new Digital Banker platform will enable our bankers to better support and service customers. • Westpac Mesh, our world-class technology development platform, grew from 85 million in daily transactions in FY23 to more than 120 million. Our Mesh engineers rank in the top 20% globally for productivity1 .. • We strengthened our defences against customer fraud, scams and cyber-attacks by investigating over 11,000 alerts and using a combination of Artificial Intelligence and automation to detect suspicious patterns and risks. Innovating to drive intelligent banking Our emphasis on AI, data analytics and advanced workforce practices is making Westpac a more efficient, insights-driven bank, capable of delivering more personalised customer experiences and efficient operations. LEVERAGING THE POWER OF AI We are using AI to develop new capabilities that deliver benefits to our customers, people and organisation. Our new AI platform is the foundation of our progress, hosting multiple AI-based solutions and enabling the seamless integration of new applications. Advanced AI models are used in home lending to verify customer income and expense information, making the home loan process more efficient for customers, brokers and our people by reducing rework. Our use of AI assists thousands of our software engineers, boosting their productivity by between 10 and 25% in coding output and quality. AI powers our Everyday Banking chatbots, providing 24/7 support and resolving 70% of customer queries without escalation. We are also trialling new internal chatbots for financial market dealers and mortgage lenders. Other opportunities include using ‘AI agents’ that are capable of executing multi-step actions to drive operational efficiencies and improved service to our customers. We are committed to the responsible use of AI, ensuring our initiatives align with our principles, policies, values and Code of Conduct. Data: The foundation of intelligent banking Data is critical to every aspect of our business, empowering informed decision-making. We have made significant progress in migrating our data to the cloud, a major milestone in simplifying Westpac’s data ecosystem, reducing risk and enabling our team to create value at scale through data products. Our customer insights platform continues to evolve, offering a comprehensive view of our customers and delivering hyper-personalised experiences. We have defined our approach to information security, including our alignment with international and industry standards, in our Cybersecurity Statement. Investing in our technology workforce To drive our technology ambitions, we’re investing in our people. Over the course of the year, we brought on close to 1,000 engineers2 and we’re upskilling our team while attracting new talent through initiatives like EmPOWERUP and MobTech. For more details, please see Creating value for our people (page 174). 1. BlueOptima software development metrics. 2. Figure includes all employment types, including contractors. |

| 188 WESTPAC GROUP 2024 ANNUAL REPORT RISK MANAGEMENT Proactive risk management and risk culture are fundamental to our bank. They underpin our strength and resilience, shape the way we operate and provide clear parameters for decision-making. Strengthening risk management remains a priority as the nature of the risks we face may change and evolve. We manage risks through a Risk Management Framework (Framework) which is centred around customers, a strong risk culture and the Three Lines of Defence (3LoD) model. These are surrounded by nine elements that work together to guide how we manage risk and deliver fair customer outcomes. We regularly review these elements to ensure the Framework operates effectively. The Framework is approved by the Board and implemented through our Risk Management Strategy, which is supported by our risk class frameworks, policies and risk appetite statements. To manage sustainability risks, the Framework is supported by a Sustainability Risk Management Framework (SRMF) and related policies to guide how we manage risks such as climate change and human rights across our operations, lending and supply chain. For further information on risks we face, see 2024 Risk Factors. RISK MANAGEMENT FRAMEWORK COMPONENTS Governance and Management Control Business Strategy Risk Identification Risk Appetite Stress and Scenarios Analysis People and Infrastructure Control Definition and Effectiveness Monitoring and Reporting Actions and Response Westpac’s business plans are shaped considering the risks associated with its strategic objectives Identifying existing and emerging risks in our business from internal and external environments Setting risk appetite to provide clarity on the level of risk we are prepared to take Performing stress tests and scenario analysis to assess potential impacts that changes to existing and emerging risks may have on the Group, including on our capital Having appropriate capability, people, data and systems to support effective risk management and decision making Embedding appropriate Frameworks, policies, standards and controls to manage the risks we take Risks are assessed through ongoing monitoring, management, reporting and assurance Appropriate action plans are implemented to improve our risk profile Ensuring that appropriate data, analysis and recommendations flow to appropriate people and forums on a timely basis to support decision making Customers Risk Culture Board approved 7 March 2024 (no changes from 2023) |
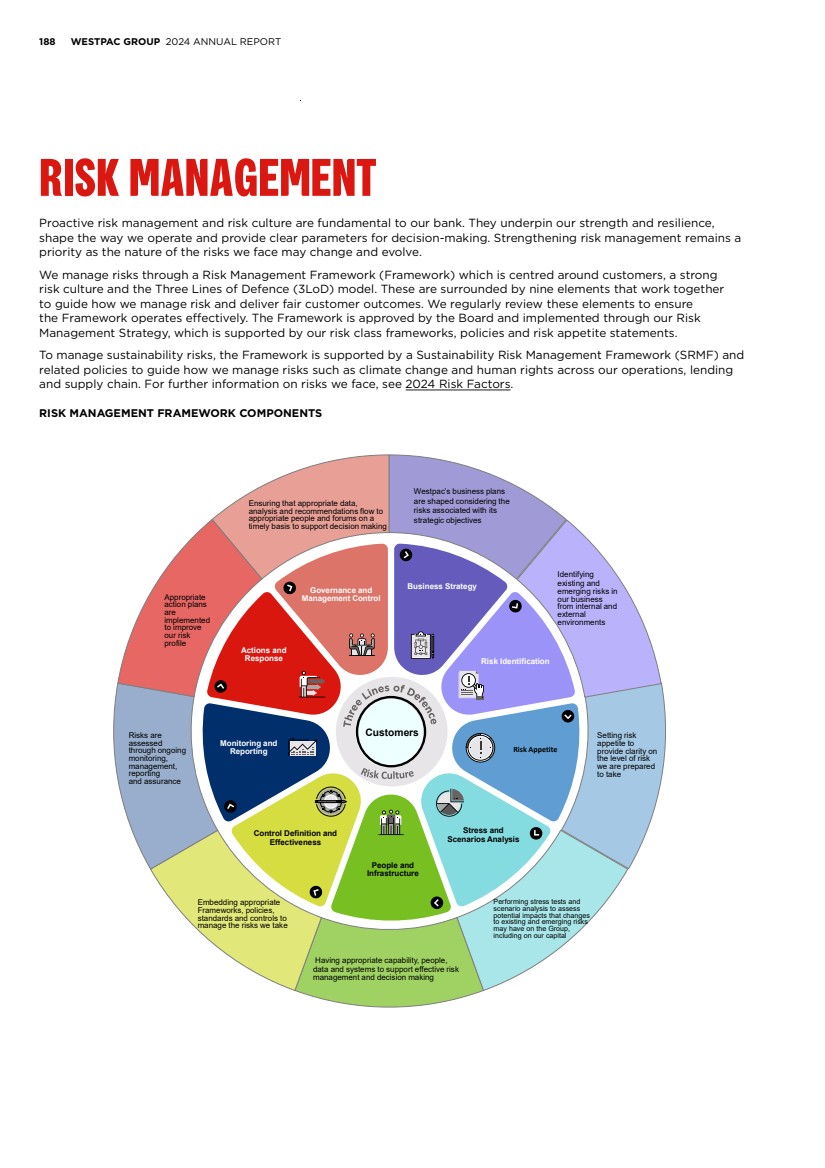
| FINANCIAL STATEMENTS EXHIBITS INDEX STRATEGIC REVIEW PERFORMANCE REVIEW SHAREHOLDER INFORMATION 189 Strengthening risk management We implemented a comprehensive Integrated Plan (IP), through the CORE program, to strengthen risk management practices. The completion of the three year plan on 31 December 2023, marked a significant milestone in strengthening our risk culture, governance and accountability. Promontory Australia, the independent reviewer of our IP, have noted the progress in its final report. Subsequently, APRA reduced Westpac’s total operational risk capital overlay from $1 billion to $500 million. We are now completing a transition phase to continue to embed the improvements we've made for the long term and demonstrate their sustainability and effectiveness. Three Lines of Defence The 3LOD work together to make sound risk-based decisions through: • Strong and proactive engagement, communication, trust and collaboration; • Management information that is reliable, coherent and transparent; and • Alignment of activities across the 3LOD to avoid unnecessary duplication, overlap or gaps. WESTPAC THREE LINES OF DEFENCE WESTPAC THREE LINES OF DEFENCE The 3LoD work together to deliver effective risk management outcomes. The 3LoD work together to make sound risk-based decisions through: — strong and proactive engagement, communication, trust and collaboration — management information that is reliable, coherent and transparent. There must also be alignment of activities across the 3LoD to avoid unnecessary duplication, overlap or gaps. Risk identification: Major risk categories We have defined 11 major risks that impact our business. These major risks represent only the most material risks to the Group and are not exhaustive. Major risk categories 1 Capital Adequacy 2 Funding & Liquidity Risk 3 Credit Risk 4 Market Risk 5 Strategic Risk 6 Risk Culture 7 Operational Risk 8 Compliance & Conduct Risk 9 Financial Crime Risk 10 Cyber Risk 11 Reputational & Sustainability Risk For each major risk category, the Board establishes a risk appetite, which is articulated in the Board Risk Appetite Statement (RAS). The RAS lists the Group’s major risks and the measures and tolerances used to monitor these risks. Most of these measures are monitored by ‘amber’ and ‘red’ tolerances which indicate when risks are close to, or over, the Board’s approved appetite. The following provides an explanation of our major risk categories, considerations for risk appetite and examples of areas of focus which illustrate the operation of the Risk Management Framework. RISK MANAGEMENT 42 WESTPAC GROUP 2023 ANNUAL REPORT Embedded sustainability practices Dedicated ESG specialists are integrated within our Business & Wealth, WIB and Westpac New Zealand operating segments. The ESG Risk team, as a second line of defence, performs independent monitoring and oversight of risk profiles to ensure that risk and control assessments accurately reflect our sustainability risks. Our approach to managing climate-related risks and opportunities, including assessing physical and transition climate risks, is outlined in the 2024 Climate Report. |
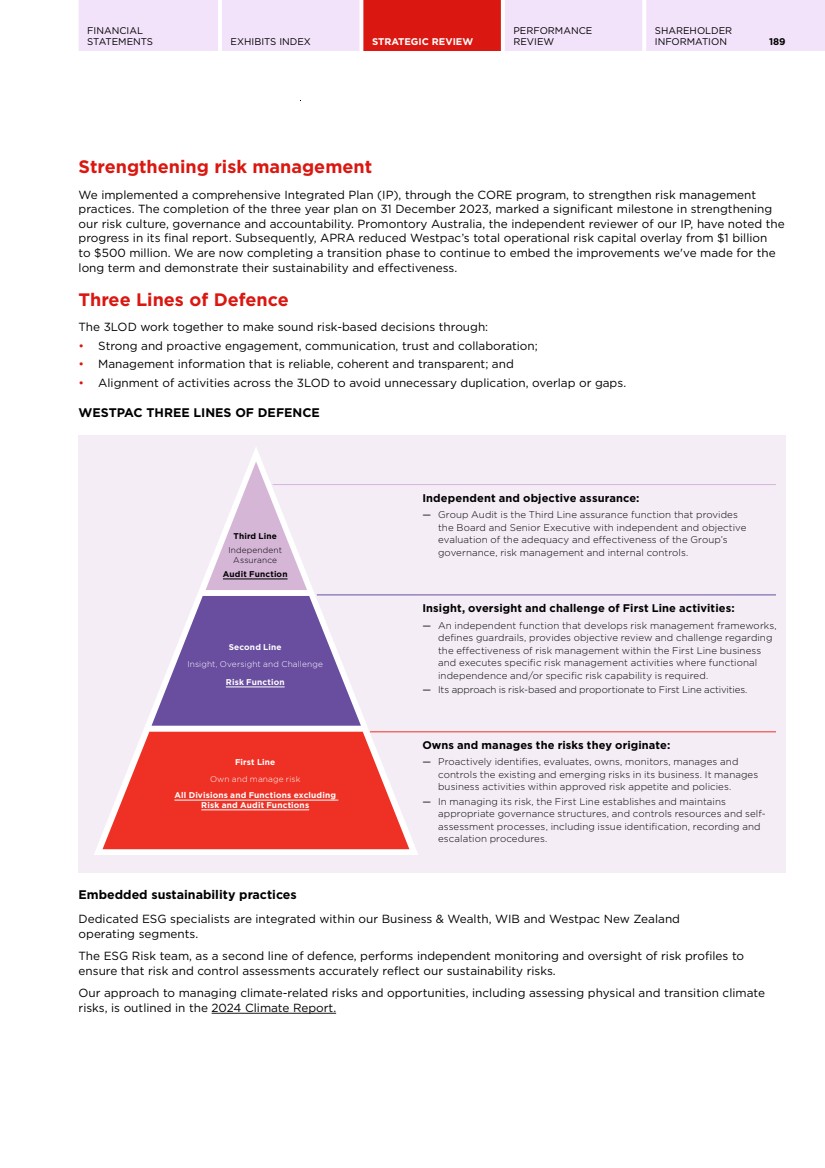
| 190 WESTPAC GROUP 2024 ANNUAL REPORT RISK MANAGEMENT Risk assessment In line with our Risk Management Framework, we regularly assess the risks that could impact Westpac’s strategic objectives. This process involves workshops with first and second line defence teams to identify potential risks, assess their impact and outline how we manage, monitor and report them with the controls in place. Emerging risks and changes to the external environment are considered as part of the assessment. For material non-financial risks, we generate a risk profile which enables each risk to be rated from ‘Low’ to ‘Very high’. Each risk is also assessed for its financial, customer, staff, regulatory, reputation, social and environmental impact. Major risk categories We have identified 11 major risk categories, among other potential risks, that could impact Westpac. Sustainability risks, including climate change, have the potential to affect the company in various ways with the main impacts classified under the material risks of Credit Risk (as a financial risk) and Reputation and Sustainability Risk (as a non-financial risk). 1 Capital Adequacy 2 Funding and Liquidity Risk 3 Credit Risk 4 Market Risk 5 Strategic Risk 6 Risk Culture 7 Operational Risk 8 Compliance & Conduct Risk 9 Financial Crime Risk 10 Cyber Risk 11 Reputational and Sustainability Risk For each major risk category, the Board establishes a risk appetite which is articulated in the Board Risk Appetite Statement (RAS). The RAS lists our major risks, along with the measures and tolerances used to monitor each risk. Most of these measures are monitored by 'green', ‘amber’ and ‘red’ tolerances which indicate when risks are close to, or over, the Board’s approved appetite. The following table provides more detail on the major risk categories. MAJOR RISK CATEGORIES 1 Capital Adequacy The risk that Westpac has an inadequate level or composition of capital to support its normal business activities and to meet its regulatory capital requirements. Risk Appetite and Mitigation We aim to maintain a strong balance sheet including under stressed scenarios. We evaluate capital management through our Internal Capital Adequacy Assessment Process, features of which include: • Capital management strategy • Considering economic and regulatory requirements and stakeholder perspectives • Stress-testing considerations • Target operating range for key capital ratios. Areas of focus include: • Continuous monitoring of capital forecasts • Considerations of capital headwinds • Actively monitoring the economic outlook and credit risk arising from higher interest rates and cost-of-living pressures. Example of a Risk Appetite measure • CET1 capital ratio – a measure which shows a bank’s capacity to absorb losses. |
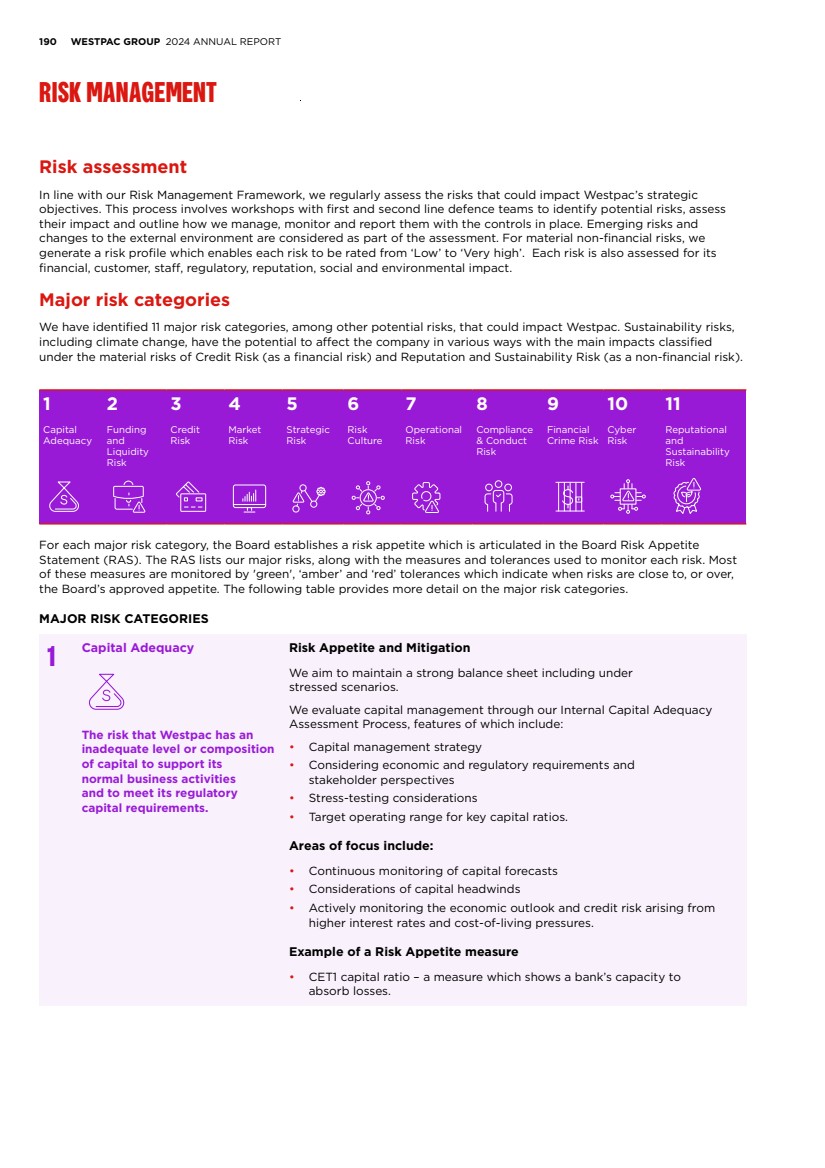
| FINANCIAL STATEMENTS EXHIBITS INDEX STRATEGIC REVIEW PERFORMANCE REVIEW SHAREHOLDER INFORMATION 191 2 Funding and Liquidity Risk The risk that Westpac cannot meet its payment obligations or that it does not have the appropriate amount, tenor and composition of funding and liquidity to support its assets. Risk Appetite and Mitigation We aim to manage our balance sheet such that we: • Maintain a diversified, stable and cost-effective funding base • Can source funding as and when needed • Have sufficient securable assets to meet our funding and repurchase agreement requirements • Fund lending growth with stable funding sources. Further information on funding and liquidity risk management is in Note 21 (page 74). Areas of focus include: • Executing the wholesale funding plan to support balance sheet growth and refinance maturing debt • Managing liquidity risk to meet regulatory requirements and Westpac’s liquidity needs in line with market conditions. Examples of a Risk Appetite measure • Net Stable Funding Ratio (NFSR) • Liquidity Coverage Ratio (LCR). 3 Credit Risk The risk of financial loss where a customer or counterparty fails to meet their financial obligations to Westpac. Risk Appetite and Mitigation We manage credit risk using either a Program-managed approach for high-volume homogeneous credit risk or Transaction-managed approach for individual customers. These approaches include: • Setting boundaries to guide appropriate credit risk conscious strategic choices, including for changes in the operating environment • A range of policies, processes, systems, risk-delegated authorities and Board-approved credit risk limits. Further information on credit risk management and provisioning is in Note 10 (page 34) and Note 11 (page 44) to the financial statements and in the September 2024 Pillar 3 report. Areas of focus include: • Responding to heightened credit risk from the rapid interest rate tightening cycle, ongoing geopolitical risks, an uncertain economic environment and inflationary pressures • Stress testing our credit portfolio for climate change including the transition to net-zero emissions • Assessing the impact of any external events that may impact our credit portfolio (i.e. geopolitical events, industry specific events), on the adequacy of the overall expected credit loss provision. Example of a Risk Appetite measure • Top 10 exposures to Corporates and Non-Bank Financial Institutions as a % of Total Committed Exposure. |
| 192 WESTPAC GROUP 2024 ANNUAL REPORT RISK MANAGEMENT 4 Market Risk The risk of an adverse impact on our financial performance or financial position resulting from changes in market factors, such as foreign exchange rates, commodity prices, equity prices, credit spreads and interest rates. This includes interest rate risk in the banking book. Risk Appetite and Mitigation We have appetite for market risk in approved products within our limit framework. We manage market risk through the employment of prudent risk management strategies and active monitoring of Board-approved metrics that capture the potential risk of adverse movements in financial markets. The Board has approved a risk appetite for traded and non-traded risks via the measurement of Value at Risk (VaR), Stressed VaR (SVaR), Net Income at Risk (NaR) and risk sensitivities to interest rates for capital hedges and to credit spreads for the liquid securities portfolio. The management of market risk is supported by the Market Risk Management Framework and associated policies, limits, processes, systems and delegated authorities. Further information on market risk management is in Note 21 (page 74). Areas of focus include: • Upgrading/replacing market risk systems and supporting infrastructure • Implementing regulatory change related to prudential market risk standards. Example of a Risk Appetite measure • Value at Risk (VaR), a statistic that quantifies the extent of possible financial losses arising from the Bank’s Financial Markets business. 5 Strategic Risk The risk that Westpac makes inappropriate strategic choices, does not implement its strategies successfully, or does not respond effectively to changes in the environment. Risk Appetite and Mitigation We aim to grow through well-considered initiatives aligned to our strategy and risk appetite. We aim to manage the impact of threats from changes in the environment, which could significantly impact our ability to implement our strategies. We continually evaluate our performance against plans and in light of changes, we must respond to such factors in a timely manner. Areas of focus include: • Accelerating technology simplification and transformation agenda • Appropriate funding, resourcing and delivery of regulatory commitments • Continuing to invest in digital and data journey, improving the customer experience. Example of a Risk Appetite measure • Actual ROTE against the Target ROTE. 6 Risk Culture The risk that our culture does not promote and reinforce behavioural expectations and structures to identify, understand, discuss and act on risks. Risk Appetite and Mitigation We promote a risk culture that supports our purpose, strategy and values and our ability to manage risk effectively. We regularly assess our risk culture and undertake initiatives to continually improve. Areas of focus include: • Maintaining and continuing to review and improve our tools and processes to support risk culture • Supporting improved capability across key behavioural change areas, including decision making, ownership, challenge and reinforcement and maturing action planning to drive behavioural change • Continuing to align to the broader organisational culture plan to support driving change at all levels. Example of a Risk Appetite measure • Internal Voice+ survey results – % of respondents who feel safe calling out risks and/or concerns. |
| FINANCIAL STATEMENTS EXHIBITS INDEX STRATEGIC REVIEW PERFORMANCE REVIEW SHAREHOLDER INFORMATION 193 7 Operational Risk The risk of loss resulting from inadequate or failed internal processes, people and systems or from external events. Risk Appetite and Mitigation We aim to be resilient to operational risk and minimise risk through robust processes and controls. We aim to quickly and effectively remediate material operational issues and incidents. Areas of focus include: • Maturing our Operational Risk Management Framework and practices to continuously strengthen risk management across the organisation • Strengthening the control environment, including risk prevention and automation • Strengthening our operational resilience and adopting a cross-organisation view of events to fully understand underlying issues. Areas of focus include data, records management and third-party risk. Example of a Risk Appetite measure • % of key controls assessed as ‘Unsatisfactory’. 8 Compliance and Conduct Risk The risk of failing to abide by compliance obligations required of us, or otherwise failing to have behaviours and practices that deliver suitable, fair and clear outcomes for customers and that support market integrity. Risk Appetite and Mitigation We establish robust controls and systems to manage compliance and conduct risk. We aim to promptly own, investigate and remediate incidents of non-compliance. We aim to eliminate: • Any breaches of regulatory requirements • Conduct that causes unsuitable, unfair or unclear customer outcomes or adversely impacts the integrity of markets • Complicated systems or processes that could lead to systemic or material breaches of regulatory requirements. Areas of focus include: • Strengthening the management of our conflicts of interest, product governance and privacy risks • Improving our tools and processes to support alignment of our business practices to fair customer outcomes and market integrity • Applying the Code of Conduct including our ‘Should We?’ Test to deliver better outcomes for our customers, our communities and each other. Example of a Risk Appetite measure • Average calendar days to complete all Compliance Assessments |
| 194 WESTPAC GROUP 2024 ANNUAL REPORT RISK MANAGEMENT 9 Financial Crime Risk The risk that Westpac fails to prevent financial crime and/or fails to comply with applicable global financial crime regulatory obligations. Financial Crime includes bribery and corruption, money laundering, sanctions and export control violations, tax evasion, fraud and scams, terrorist financing and proliferation. Risk Appetite and Mitigation Westpac helps prevent financial crime by proactively identifying, assessing, mitigating and reporting financial crime risks and complying with all applicable global and local financial crime regulatory obligations. This means that our financial crime risks must be managed through robust controls and systems and that we must promptly own, investigate and remediate financial crime incidents where they do occur. Areas of focus include: • Simplification and embedding strategic capabilities, improving detection and surveillance capabilities and expanding the use of network analytics • Collaboration through involvement in Public and Private sector partnerships and other intelligence bodies to disrupt financial crime • Continued Know your Customer (KYC) identity checks, including remediation of pre-commencement customers and enhancing customer lifecycle management through digital capabilities and automated controls. Pre-commencement customers are customers who were onboarded before KYC requirements came into effect on 12 December 2007. Example of a Risk Appetite measure • Number of high rated Issues which haven’t been remediated within the initially agreed timeframe. 10 Cyber Risk The risk that Westpac’s or its third parties’ data or technology are inappropriately accessed, manipulated or damaged from cyber threats or vulnerabilities. Risk Appetite and Mitigation We proactively manage our cyber risk exposure, to ensure that we are resilient to cyber threats and vulnerabilities. In managing our cyber risk, we aim to ensure that: • We manage our risks within the appropriate regulatory frameworks • We do not undermine our strategic, financial, reputational or regulatory standing • We implement cyber controls commensurate to the cyber threats we respond to. We recognise that cyber events may occur, however incidents must be managed timely and effectively to limit impact and future likelihood. Areas of focus include: • Enhancing cybersecurity capability including data security controls, application protection controls, identity and access management and strengthening our network perimeters • Embedding a consistent cyber risk management framework. Examples of a Risk Appetite measure • Control effectiveness against external cyber threats • Supplier security assessment outcomes. |
| FINANCIAL STATEMENTS EXHIBITS INDEX STRATEGIC REVIEW PERFORMANCE REVIEW SHAREHOLDER INFORMATION 195 11 Reputational and Sustainability Risk The risk of failing to recognise or address environmental, social or governance (ESG) issues as well as the risk that an action, inaction, transaction, investment or event will reduce trust in Westpac’s integrity and competence. Risk Appetite and Mitigation We aim to maintain the confidence of all stakeholders by fostering trust in our integrity and competence. Our approach aims to balance the commercial aspects of decisions with stakeholder expectations, while considering potential impacts on people, communities or the environment. We recognise that ESG issues can involve complex, interconnected and sometimes competing considerations. In our lending The ESG Credit Risk Policy supports the SRMF and forms part of our credit risk assessment process. ESG risk assessment tools are used within the business and institutional banking teams to assess ESG risks associated with customers, transactions and the activity being supported. These assessments are performed for new-to-bank opportunities and for existing customers as part of periodic risk reviews or where there are major changes to facilities. When potential ESG risks remain, they are escalated to a Customer and Transaction Risk Escalation Committee for additional review in the relevant business unit. The Climate Change Credit Risk Committee provides portfolio oversight, informing accountable individuals in making appropriate climate-related credit risk decisions. In our supply chain We require suppliers to adhere to Westpac’s Responsible Sourcing Code of Conduct by completing an assessment that outlines our standards for ethical, social and environmental business practices. Areas of focus include: • Improving tools and processes to understand sustainability risks associated with our lending and supply chain • Building our understanding of the nature-related risks, consistent with our Natural Capital Position Statement • Embedding findings of our salient human rights risk assessment into risk management processes. See page 180 for more information. Examples of a Risk Appetite measure • Reputation ranking from RepTrak (a firm providing an independent assessment of a company’s reputation, brand and ESG) • Progress against our NZBA targets. |
| 196 WESTPAC GROUP 2024 ANNUAL REPORT CORPORATE GOVERNANCE OUR APPROACH TO GOVERNANCE Corporate governance is the framework of systems, policies and processes by which we operate and through which our people are both empowered and accountable for making decisions that affect our business, operations, customers and stakeholders. The framework establishes the roles and responsibilities of Westpac’s Board, management team, employees and suppliers. It also establishes the systems, policies and processes for monitoring and evaluating Board and management performance, and the practices for corporate reporting, disclosure, remuneration, risk management and engagement of security holders. Our approach to corporate governance is based on a set of values and behaviours that underpin our day-to-day activities. Our values and behaviours are designed to promote transparency, fair dealing, and the protection of stakeholder interests, including our customers, our shareholders, our employees and our community. We aspire to the highest standards of corporate governance, which Westpac sees as fundamental to the sustainability of our business and our performance. As Westpac’s principal listing is on the Australian Securities Exchange (ASX), we have followed the ASX Corporate Governance Principles and Recommendations (fourth edition) (ASXCGC Recommendations) published by the ASX Limited’s Corporate Governance Council (ASXCGC) throughout the year. Westpac’s ordinary shares are also quoted on the NZX Main Board, which is the main board equity security market operated by NZX Limited. BOARD AREAS OF FOCUS IN FY24 This year the Board (including with assistance from its Board Committees) has focused on overseeing: • our UNITE program which is focused on making our processes, systems and technology simpler and improving service to customers; • the Group’s financial and operating performance, including progress in improving the Group’s financial performance relative to peers; • ongoing initiatives that are designed to support our customers experiencing hardship and to help protect our customers from scams; • completion of the Integrated Plan under the Customer Outcomes and Risk Excellence (CORE) program, as well as the transition phase that is focused on sustainably embedding changes implemented by the CORE program; • management of current and emerging risks arising from the evolving economic, geopolitical, regulatory, and competitive environment; • Westpac’s capital position and various capital management initiatives; • consideration and assessment of the resilience of the Group’s systems and response to potential cyber incidents and data breaches; • priorities outlined in our Sustainability Strategy and our Climate Change Position Statement and Action Plan; and • ongoing consideration of Board and senior executive succession, as well as Board Committee composition. |
| FINANCIAL STATEMENTS EXHIBITS INDEX STRATEGIC REVIEW PERFORMANCE REVIEW SHAREHOLDER INFORMATION 197 THE BOARD Board of Directors The Board is comprised of nine independent Non-executive Directors and the Managing Director and Chief Executive Officer (CEO). A profile of each Director can be found on our website at: www.westpac.com.au/about-westpac/ westpac-group/ board-of-directors/. STEVEN GREGG Chairman and Independent Non-executive Director PETER KING Managing Director and Chief Executive Officer TIM BURROUGHS Independent Non-executive Director NERIDA CAESAR Independent Non-executive Director AUDETTE EXEL Independent Non-executive Director ANDY MAGUIRE Independent Non-executive Director PETER NASH Independent Non-executive Director NORA SCHEINKESTEL Independent Non-executive Director MARGARET (MARGIE) SEALE Independent Non-executive Director MICHAEL ULLMER Independent Non-executive Director |

| 198 WESTPAC GROUP 2024 ANNUAL REPORT CORPORATE GOVERNANCE ROLES AND RESPONSIBILITES The Board The role of the Board is to provide leadership and strategic guidance for Westpac and its related bodies corporate, in addition to overseeing the sound and prudent management of the Westpac Group. The Board Charter outlines the roles and responsibilities of the Board. Key responsibilities are: • approving and overseeing management’s implementation of the strategic direction of the Westpac Group, its business plan and significant corporate strategic initiatives; • appointing the CEO and Chief Financial Officer (CFO), and approving the appointment of Group Executives, the General Manager, Group Audit and any other person the Board determines; • overseeing culture across the Group by setting the tone from the top, approving Westpac Group’s Code of Conduct and Values and receiving reporting on the Group’s culture; • assessing and reviewing the performance of the Board, its Board Committees, the CEO and the Group Executives; • providing oversight of the Group’s technology strategy and the implementation of key technology initiatives; • approving the Westpac Director Appointment & Renewal Policy and determining Board size and composition; • approving the Westpac Group Remuneration Policy; • approving, in accordance with the Westpac Group Remuneration Policy, remuneration arrangements, variable remuneration outcomes and adjustments to variable remuneration where appropriate for Group Executives, other employees who are accountable persons under the Financial Accountability Regime (FAR) (Accountable Person), any person performing a role specified by the Australian Prudential Regulation Authority (APRA) and any other person the Board determines; • approving the annual financial targets and financial statements, and monitoring financial performance against forecast and prior periods; • determining our dividend policy and the amount, nature and timing of dividends to be paid; • approving the Internal Capital Adequacy Assessment Process, including reviewing Group stress testing outcomes/scenarios, and approving recovery and resolution plans; • considering and approving our overall risk management framework for managing financial and non-financial risk; • approving the Group Risk Management Framework, the Group Risk Management Strategy and the Board Risk Appetite Statement and monitoring the effectiveness of risk management by the Group; • forming a view of our risk culture and overseeing the identification of, and steps taken to address any desirable changes to risk culture; • considering the social, ethical and environmental impact of our activities including the effects of climate change, and setting standards and monitoring compliance with our sustainability policies and practices; • overseeing and monitoring workplace health and safety (WHS) issues in the Group and considering appropriate WHS reports and information; and • meeting with representatives from our principal regulators on a regular basis. The Board Charter is available on our website at: www.westpac.com.au/about-westpac/westpac-group/ corporate-governance/constitution-board/. WESTPAC’S BOARD AND BOARD COMMITTEE STRUCTURE BOARD COMMITTEES Provide relevant periodic assurances and reports (as appropriate) Provide assurance on the remuneration disclosures in the Remuneration Report Provide assurance on risk components of the annual report and interim financial results announcement Delegation Assurance, Oversight through Reporting Accountability Accountability Delegation Delegation Board Committees will refer matters to the Board or other Board Committees where appropriate. Specific reporting as shown above BOARD Independent Assurance and Advice External Auditors Group Audit Independent Assurance and External Advice Chief Executive Officer Group Executives Remuneration Audit Nominations & Governance Risk |
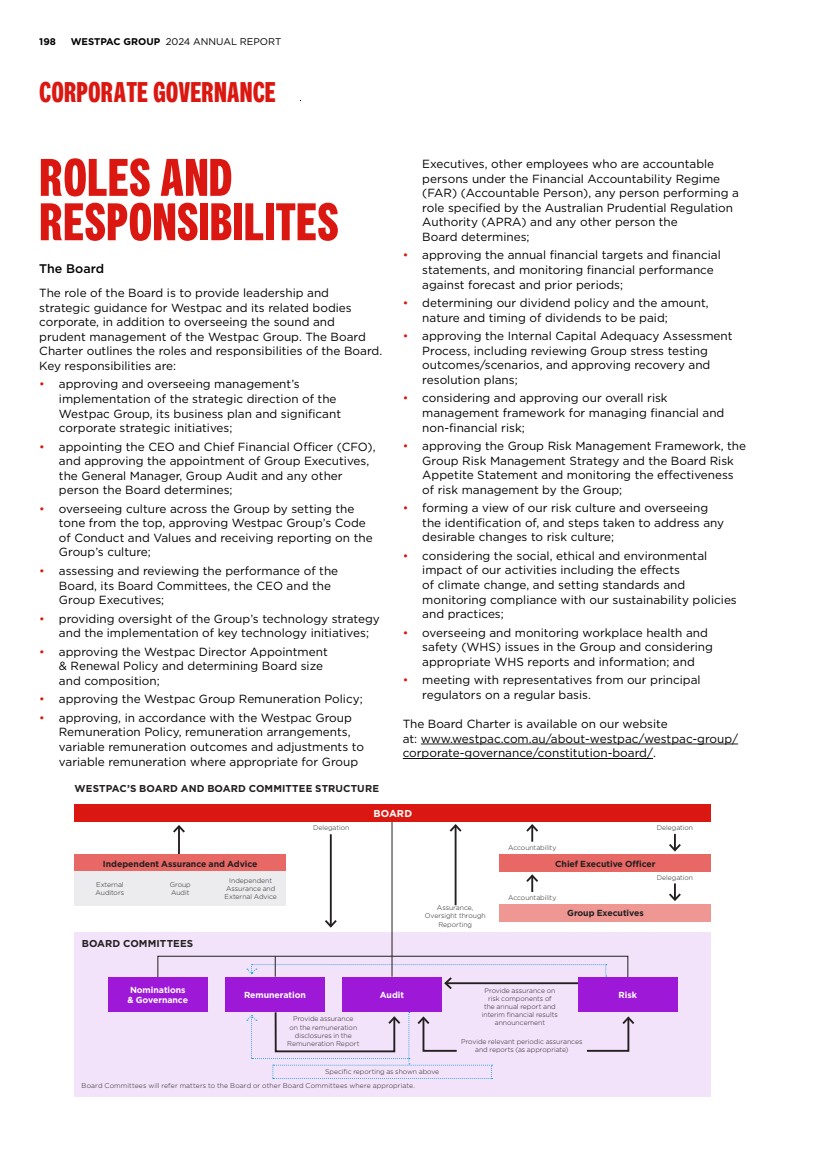
| FINANCIAL STATEMENTS EXHIBITS INDEX STRATEGIC REVIEW PERFORMANCE REVIEW SHAREHOLDER INFORMATION 199 The Board has delegated to the CEO, and through the CEO to the Executive Team, responsibility for the day-to-day management of Westpac’s business. These delegations are subject to the limitations and restrictions contained in the delegation instruments. The Board is assisted in meeting its roles and responsibilities by its four standing Board Committees. Further information about each of the Board Committees is set out in the section titled ‘Role of the Board Committees’. Chairman The Board elects one of the independent Non-executive Directors as Chairman. Our Chairman is Steven Gregg. His role includes: • providing effective leadership to the Board in relation to all Board matters; • guiding the agenda and conducting all Board meetings to facilitate discussions, challenge and decision-making; • in conjunction with the Company Secretary, arranging regular Board meetings throughout the year and confirming that minutes of meetings accurately record decisions taken and, as required, the views of individual Directors; • overseeing the process for appraising Directors and the Board as a whole; • overseeing Board succession, including in relation to the Board Chair and Board Committee Chair roles; • acting as a conduit between management and the Board, and being the primary point of communication between the Board and CEO; • representing the views of the Board to the public; and • taking a leading role in creating and maintaining an effective corporate governance system. CEO Our Managing Director and CEO is Peter King1 .. His role includes: • leadership of the Executive Team and, with the Board, overseeing succession planning for the Executive Team; • developing strategic objectives for the business and achievement of the planned results; and • the day-to-day management of the Westpac Group’s operations, subject to the specified delegations of authority approved by the Board. 1. On 9 September 2024, Westpac announced that Anthony Miller will succeed Peter King as CEO and Managing Director. Mr Miller’s appointment will commence on 16 December 2024 following Mr King’s retirement as CEO and Managing Director. |

| 200 WESTPAC GROUP 2024 ANNUAL REPORT CORPORATE GOVERNANCE Board skills, experience and attributes Westpac seeks to maintain a Board of Directors with a broad range of relevant financial and other skills, knowledge, and experience necessary to guide the business of the Group. The Board uses a skills matrix to illustrate the key skills and experience the Westpac Board is seeking to achieve in its membership collectively and the number of Directors with each skill and experience. The skills matrix also assists to identify focus areas for the continuing education and professional development of Directors. For example, in FY24 these focus areas included cyber risk, technology developments, crisis management and key environmental, social and governance topics (amongst others). The skills matrix also assists to identify areas where it may be desirable for specialist external expertise to be retained to supplement the Board’s skills and experience. The skills matrix is set out in Figure 1. FIGURE 1 – BOARD SKILLS, EXPERIENCE AND ATTRIBUTES AS AT 30 SEPTEMBER 2024 SKILLS AND EXPERIENCE DESCRIPTION NUMBER OF DIRECTORS Customer focus Experience in developing and overseeing the embedding of a strong customer-focused culture in large and complex organisations, and a demonstrable commitment to achieving customer outcomes Strategy An ability to define strategic objectives, constructively question business plans, oversee the implementation of strategy using commercial judgement and bring a global perspective to bear Financial services Experience working in, or advising, the banking and financial services industry with strong knowledge of its economic drivers and global business perspectives Financial acumen Highly proficient in accounting or related financial management and reporting for businesses of significant size Risk Experience in anticipating, recognising and managing risks, including financial, non-financial and emerging risks, and monitoring risk management frameworks and controls Technology, digital and data Experience in developing or overseeing the application of technology in large and complex businesses, with particular reference to technology - innovation, disruptive technologies, data, cyber-security, digital transformation and customer experience Governance Experience as a Director of a listed entity, with detailed knowledge of governance issues, with particular reference to the legal, compliance, regulatory and voluntary frameworks applicable to listed entities and highly regulated industries Environment and social Experience in understanding and identifying potential risks and opportunities arising from environmental and social issues, including the transition to a climate resilient future, management of biodiversity, and addressing human rights and modern slavery within supply chains People and culture Experience in people matters including workplace health and safety, cultures, morale, inclusion and diversity, management development, succession, remuneration and talent retention initiatives Executive leadership Having held a CEO or a similar senior leadership role in a large complex organisation, and having experience in managing the business through periods of significant change and delivering desired business outcomes Deep experience and knowledge General working experience and knowledge Limited working experience and knowledge In addition to the skills outlined above, the Westpac Board seeks to ensure that it operates as a cohesive team, bringing together a range of perspectives to guide the Group and oversee management. The Westpac Board also expects its members to be committed to supporting our Purpose and upholding our Values. |
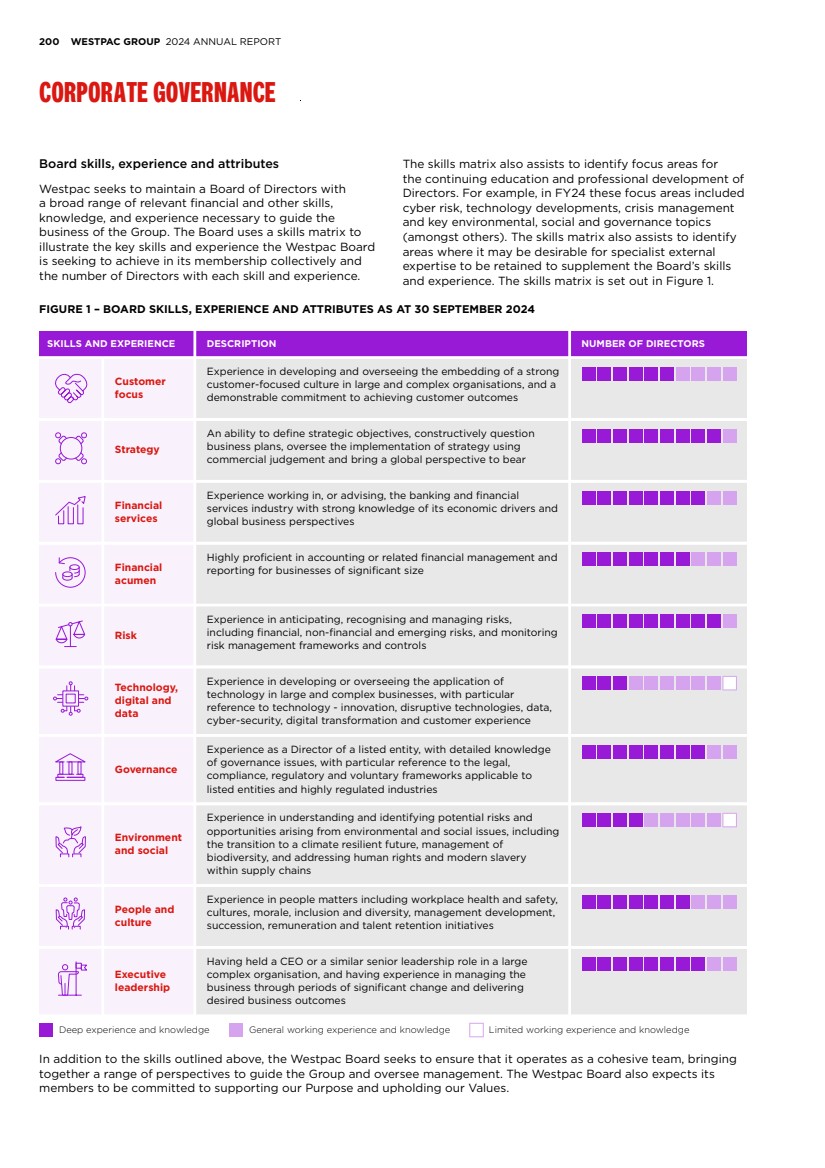
| FINANCIAL STATEMENTS EXHIBITS INDEX STRATEGIC REVIEW PERFORMANCE REVIEW SHAREHOLDER INFORMATION 201 Board diversity A diverse group of skilled Directors helps us be a stronger organisation that makes better decisions. In relation to gender diversity, for 2024, the Board Nominations & Governance Committee confirmed its objective of 40% women, 40% men and 20% any gender for the composition of the Westpac Board. As Westpac has met its 2024 objective for Board gender diversity, the focus is on maintaining alignment with this objective, noting that our performance against it will vary at any given time depending on the timing of Board renewal and Board composition changes. The Board gender diversity as at 30 September 2024 is set out below. NUMBER OF FEMALE DIRECTORS ON THE BOARD (4 OUT OF 10) 40% FEMALE DIRECTORS Female Male Independence All Non-executive Directors satisfy our criteria for independence, which aligns with the guidance provided in the ASXCGC Recommendations. The Board assesses the independence of our Non-executive Directors on appointment and annually. Each Non-executive Director provides an annual attestation of their interests and independence. Directors are considered to be independent if they are independent of management and free from any business or other relationship that could materially interfere with, or could reasonably be perceived to materially interfere with: • the exercise of their unfettered and independent judgement; and • their ability to act in the best interests of Westpac as a whole rather than the interests of another party. Materiality is assessed on a case-by-case basis by reference to each Non-executive Director’s individual circumstances rather than by applying general materiality thresholds. Each Non-executive Director is required to disclose any business or other relationship that they have directly, or as a partner, shareholder or officer of a company or other entity that has an interest or a business or other relationship with Westpac or a Group entity. The Board considers information about any such interests or relationships, including any related financial or other details, when it assesses the Non-executive Director’s independence. APPOINTMENT OF DIRECTORS The Board Nominations & Governance Committee considers and makes recommendations to the Board on candidates for appointment as Directors. Such recommendations pay particular attention to: • the mix of skills, experience, expertise, diversity, independence, and other qualities of existing Directors; and • how the candidate’s attributes will balance and complement those skills and qualities, and address any potential skills gaps in relation to the current and future composition of the Board. Subject to the Constitution and ASX Listing Rules, the Board may appoint a Director, either to fill a casual vacancy or as an addition to the existing Directors. Except for the CEO, a Director appointed by the Board holds office only until the close of the next annual general meeting (AGM) but is eligible for election by shareholders at that meeting. Our Constitution states that a Director (except for the CEO) must not hold office (without re-election) past the third AGM following their appointment or last election, or for more than three years, whichever is longer. Retiring Directors hold office until the conclusion of the meeting at which they retire but are eligible for re-election at that meeting. Our Constitution also provides that at least one Director must stand for election or re-election at each AGM. This requirement could be satisfied by a person standing for election as a new Director; a Director who has been appointed to fill a casual vacancy seeking election; or a Director seeking re-election because of the tenure limitation (referred to in the paragraph above). If there are no such Directors required to stand for election or re-election at the AGM, and no Director volunteers to stand for re-election, the Director who has served the longest in office since their last election or re-election must retire and stand for re-election. The CEO is not required to stand for re-election. Prior to a Director’s appointment or consideration for election or re-election by shareholders, the Board conducts due diligence and considers the results of the Board performance evaluation conducted during the year. Where a Director is seeking election or re-election, Westpac provides shareholders with all material information relevant to a decision on whether or not to elect or re-elect a Director. New Directors receive an induction pack and letter of appointment setting out the expectations of the role, and conditions of appointment including the expected term of appointment and remuneration. This letter aligns to the ASXCGC Recommendations. All new Directors participate in an induction program to familiarise themselves with our business and strategy, culture and values and any current issues before the Board/Board Committees. The induction program includes an opportunity to review key |
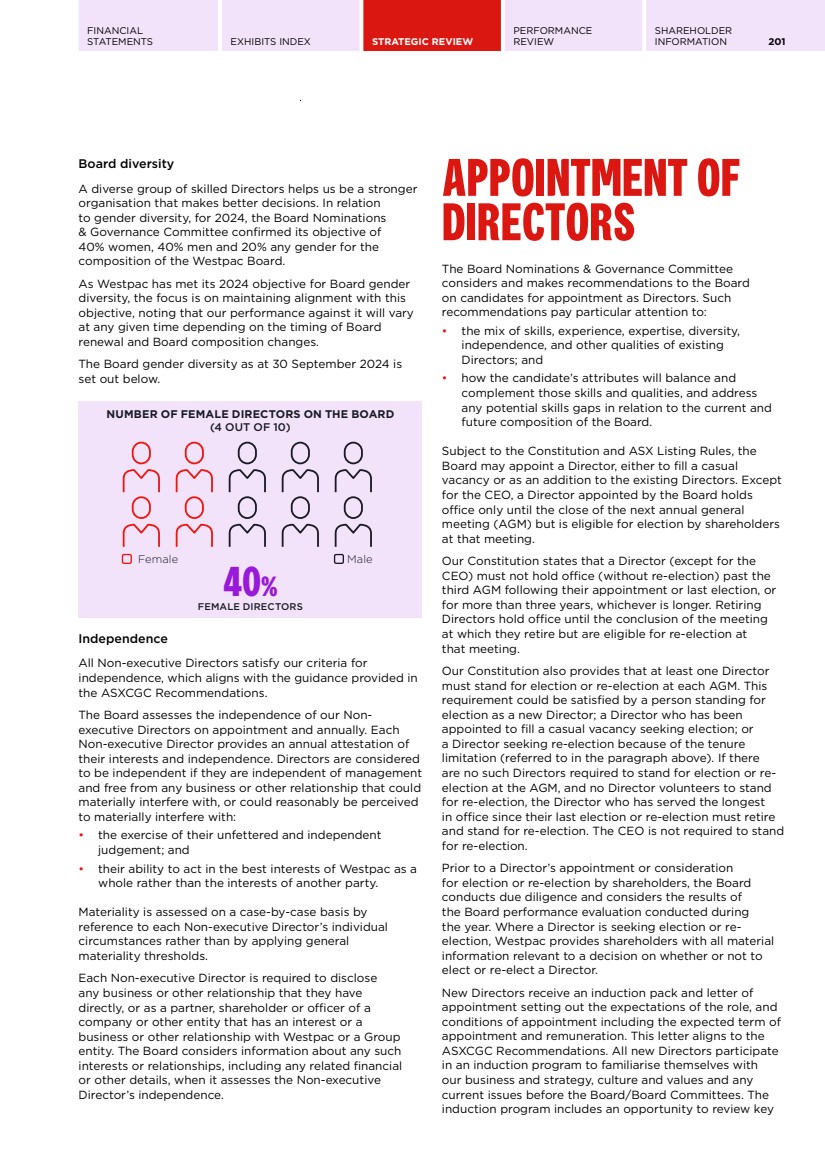
| 202 WESTPAC GROUP 2024 ANNUAL REPORT CORPORATE GOVERNANCE documents and meet with a range of representatives from the organisation, including the Chairman, the CEO, the Board Committee Chairs and each Group Executive. The Westpac Director Appointment & Renewal Policy limits the tenure of office that any Non-executive Directors other than the Chairman may serve to 9 years, from the date of first election by shareholders. The maximum tenure for the Chairman is 12 years (which includes any term served as a Director prior to being elected as Chairman), from the date of first election by shareholders. The Board, on an exceptional basis, may extend the maximum terms specified above where it considers the extension would benefit the Group. The Board may exercise this discretion on an annual basis, and the Director concerned will be required to stand for re-election annually. The average Board tenure as at 30 September 2024 is set out below. The length of service of each Director is set out in the Directors’ report in our 2024 Annual Report. AVERAGE BOARD TENURE 3.5 YEARS AVERAGE BOARD TENURE 0-3 years 40% 3-6 years 40% 6-9 years 20% Conflicts of interest All Directors are required to disclose to the Board any actual, potential or apparent conflicts of interest upon appointment and are required to keep these disclosures up to date. Any Director with a material personal interest in a matter being considered by the Board must declare their interest and may not be present during any related boardroom discussions nor vote on the matter unless the Board resolves otherwise. Continuing education Directors undertake continuing education and training to develop and maintain the skills and knowledge needed to perform their role effectively, including by participating in workshops held throughout the year, attending relevant site visits, and undertaking relevant external education. These activities are planned each year and are included in the Board’s/Board Committees’ calendars. In addition, the Board and Board Committees consider whether additional education and professional development opportunities should be offered as part of the annual Board Effectiveness Review. Access to information All Directors have unrestricted access to company records and information required to perform their duties, and receive regular detailed financial and operational reports from senior management. Each Director also enters into an access and indemnity agreement, which among other things, provides for access to documents for up to seven years after their retirement as a Director. The Chairman and other Non-executive Directors regularly consult with the CEO, CFO and other senior executives, and may consult with, and request additional information from, any of our employees. Access to advice All Directors have access to advice from senior internal legal advisers including the Group General Counsel. The Board collectively, and all Directors individually, can also seek independent professional advice, at Westpac's expense, to help them carry out their responsibilities. While the Chairman’s prior approval is needed, it may not be unreasonably withheld. Remuneration framework Information about our remuneration framework, including policies and practices regarding the remuneration of Non-executive Directors, the CEO and other senior executives, is included in the Remuneration Report in the Directors’ report (which is located in our 2024 Annual Report). Westpac does not provide performance-based remuneration or retirement benefits (other than superannuation) to Non-executive Directors. The Remuneration Report also includes details of Westpac’s hedging policy, which prohibits participants in equity plans from entering into transactions that mitigate the risk associated with the equity award. |
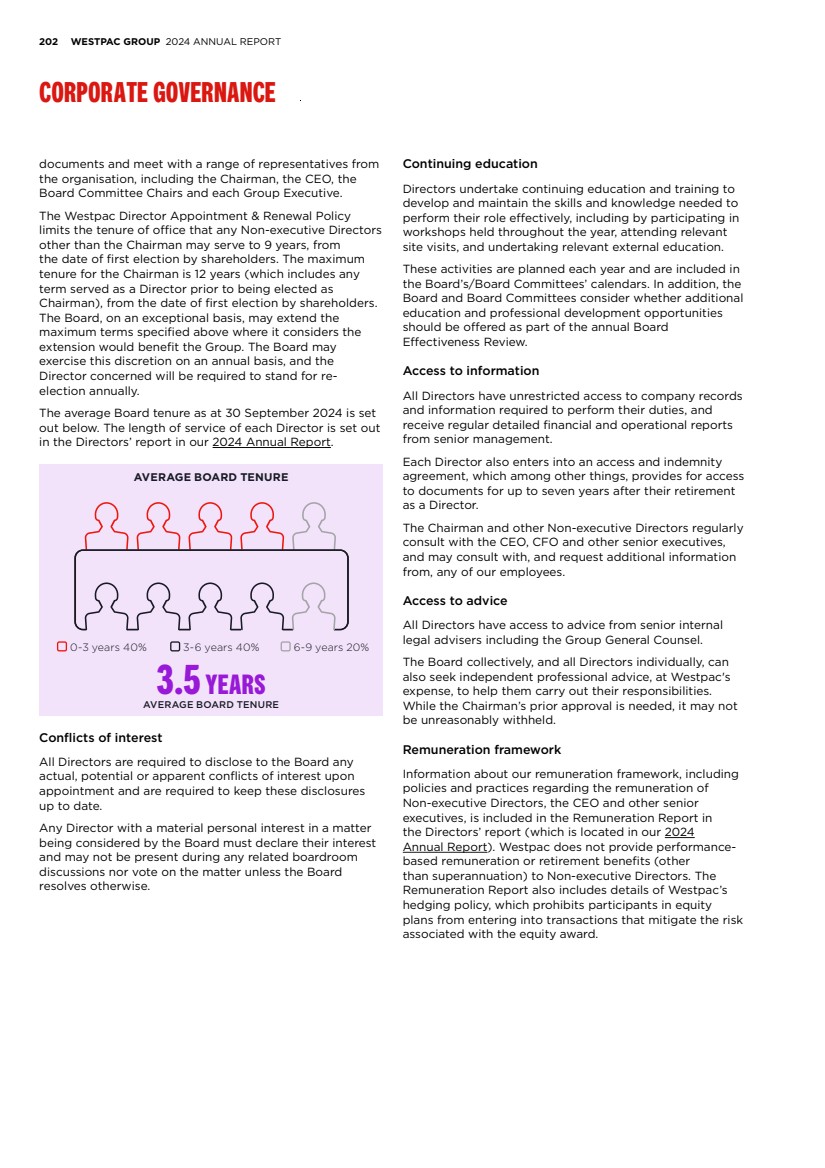
| FINANCIAL STATEMENTS EXHIBITS INDEX STRATEGIC REVIEW PERFORMANCE REVIEW SHAREHOLDER INFORMATION 203 PERFORMANCE REVIEWS Board, Board Committees and Directors The Board undertakes ongoing self-assessment as well as an annual performance review, which is periodically conducted by an independent consultant. The review process includes an assessment of the performance of the Board, the Board Committees and each Director, with outputs collected, analysed and presented to the Board. The Board will discuss the results and agree follow-up actions. Actions from the previous review related to matters regarding Board processes, ongoing succession planning and creating further opportunities to increase the connection between the Board and the Group’s businesses and operations. Directors meet individually with the Chairman to discuss performance feedback (and in the case of the Chairman, performance is discussed with another Board Committee Chair). At the time of this Corporate Governance Statement, the 2024 financial year evaluation is being finalised and will be completed prior to the end of the 2024 calendar year. Board assessment of management performance The Board, in conjunction with its Board Remuneration Committee, is responsible for: • selecting, appointing, and determining terms of appointment of, the CEO and the CFO; • determining the CEO’s goals and objectives, and evaluating the CEO’s performance in light of these objectives; • approving the appointment of Group Executives, the General Manager Group Audit, and any other person the Board determines; and • approving individual remuneration arrangements, and adjustments to variable remuneration where appropriate for Group Executives and certain other senior employees, including in light of relevant matters brought to the attention of the Board Remuneration Committee from the CEO, Chief Risk Officer, Group Executive, Human Resources, General Manager Group Audit, and Chairs of the Board Risk Committee and Board Audit Committee. All new senior executives receive an employment contract setting out the terms and conditions of their employment, and those that are Accountable Persons also receive an Accountability Statement for their respective role. Briefing sessions are scheduled to discuss our strategies and operations, and the respective roles and responsibilities of the Board and senior management. Under Westpac’s executive remuneration framework, the performance of senior executives is assessed annually. Management performance evaluations for the financial year ended 30 September 2024 were conducted following the end of the financial year. The process for reviewing the performance of senior executives, as well as further information on Westpac’s executive remuneration framework, FY24 performance objectives and performance achieved, is contained in the Remuneration Report in the Directors’ report (which is located in our 2024 Annual Report). |
| 204 WESTPAC GROUP 2024 ANNUAL REPORT CORPORATE GOVERNANCE ROLE OF THE BOARD COMMITTEES The Board is assisted by its four standing Board Committees and the key roles, responsibilities, and composition requirements of each of the Board Committees are outlined in their respective Charter and are summarised in the table below. The Board Committee Charters are available on our website at www.westpac.com.au/about-westpac/westpac-group/ corporate-governance/constitution-board/. All of the Board Committees are currently comprised of independent Non-executive Directors. Board Committee members are chosen for the skills and experience they can contribute to the respective Board Committees and their qualifications are set out in the Directors’ report, in our 2024 Annual Report. COMMITTEE KEY RESPONSIBILITIES COMPOSITION REQUIREMENTS MEMBERSHIP Board Risk Committee (BRiskC) To assist the Board to: • review and approve the Group’s overall risk management framework for managing financial and non-financial risks as well as emerging risks; • oversee the risk culture across the Group; • review and approve the Group Risk Management Framework, the Group Risk Management Strategy, and the Board Risk Appetite Statement; and • make its annual declaration to APRA on risk management under APRA prudential standard CPS 220 Risk Management. The Committee is also responsible for: • reviewing and monitoring the risk profile and controls of the Group for consistency with the Board Risk Appetite Statement; • reviewing and approving other risk management frameworks for financial and non-financial risks and reviewing the monitoring of performance under those frameworks (as appropriate); • reviewing and approving the limits and conditions that apply to the delegated credit risk and market risk approval authorities; • reviewing and recommending for approval the Internal Capital Adequacy Assessment Process, including target capital ranges (where appropriate), and reviewing and monitoring capital levels for consistency with the Board Risk Appetite Statement; • reviewing stress testing results, monitoring management responses and, together with the Board, providing recommendations for future scenarios; • reviewing and recommending recovery and resolution plans to the Board for approval, as required; • reviewing Group cyber risk and cybersecurity reporting, including information on the monitoring and performance of the Group’s cyber risk management and controls; • providing oversight of risks associated with the Group’s approach to customer remediation activities, the management of customer complaints and hardship; • providing oversight of the Group’s management of other financial and non-financial risks including financial crime risk, reputation and sustainability risks including climate risk; and • monitoring changes anticipated for the economic and business environment, including consideration of emerging risks and other factors. At least three Non-executive Directors. Majority of Committee members must be independent. An independent Non-executive Director must be the Committee Chairman, who is not the Board Chairman. At least one member of the Board Audit Committee and at least one member of the Board Remuneration Committee must be members. • Audette Exel (Chair) • Tim Burroughs • Peter Nash • Nora Scheinkestel • Michael Ullmer |
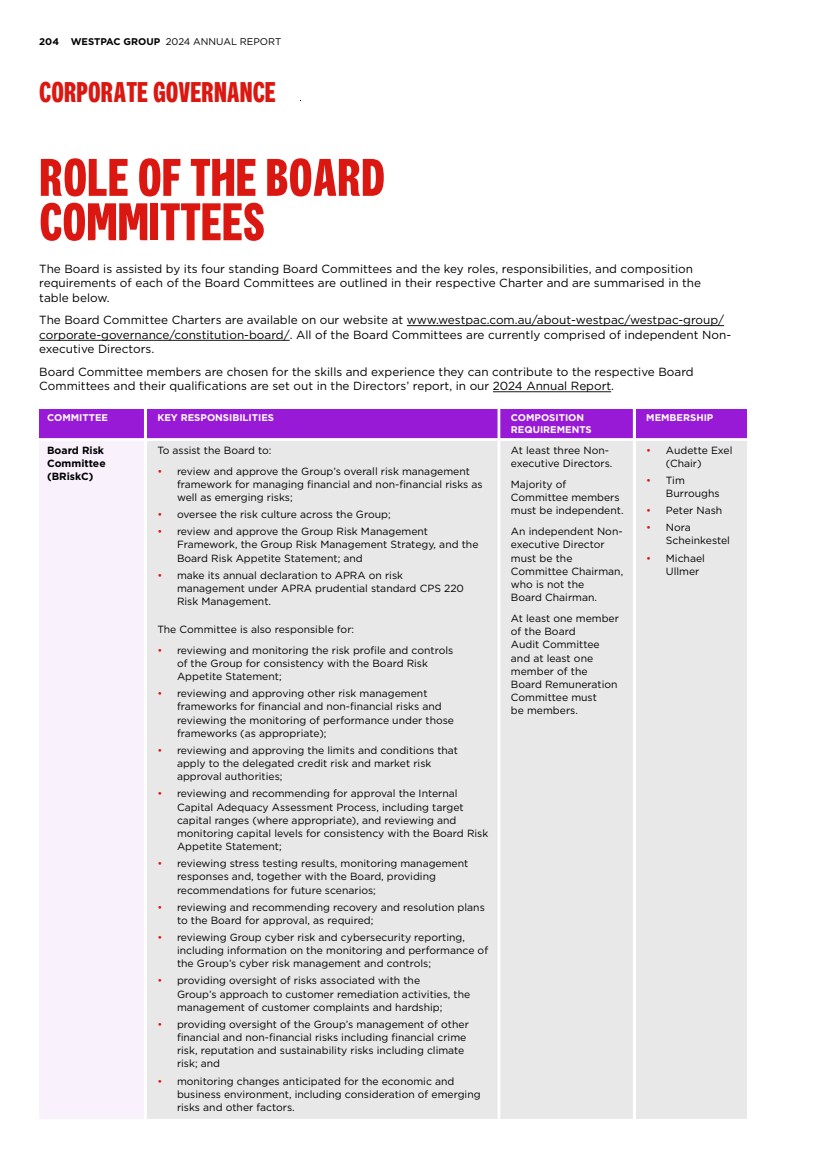
| FINANCIAL STATEMENTS EXHIBITS INDEX STRATEGIC REVIEW PERFORMANCE REVIEW SHAREHOLDER INFORMATION 205 COMMITTEE KEY RESPONSIBILITIES COMPOSITION REQUIREMENTS MEMBERSHIP Board Audit Committee (BAC) To assist the Board by: • overseeing the integrity of financial statements and financial reporting systems of Westpac and its related bodies corporate; • maintaining oversight of the external audit engagement, including by making recommendations to the Board on the external auditor’s appointment and removal (including the rotation of the lead audit engagement partner), and overseeing the external auditor’s qualifications, performance, independence and fees; • overseeing the performance of the internal audit function; • overseeing the integrity of the Group’s corporate reporting including the Group‘s financial reporting and compliance with prudential regulatory reporting and professional accounting requirements; • reviewing and discussing with management and the external auditor half and full year financial statements, Annual Report disclosures (including sustainability disclosures) and the Climate Report (or any other periodic sustainability reports agreed with the Committee from time to time) and recommending their approval to the Board; and • reviewing and discussing the process by which management assures the integrity of information on Westpac Group earnings and key sustainability metrics. At least three Non-executive Directors. Majority of Committee members must be independent. An independent Non-executive Director must be the Committee Chairman, who is not the Board Chairman. • Peter Nash (Chairman) • Nerida Caesar • Audette Exel • Michael Ullmer Board Remuneration Committee (BRemC) To assist the Board by reviewing and making recommendations in relation to: • the Group’s remuneration framework (as articulated in the Group Remuneration Policy), as well as assessing its compliance with laws, regulations and prudential standards; • individual remuneration arrangements and variable remuneration outcomes for the CEO, Group Executives, other Accountable Persons, and any other person the Board determines; • the remuneration framework, policies, and fee levels (including superannuation) for Non-executive Directors on the Board and subsidiary Boards; • remuneration arrangements on a cohort basis (including variable remuneration outcomes) for certain employees; • in conjunction with the Board Chairman, evaluating the performance of the CEO, including their goals and objectives as assessed against the Group Performance Review; and • the design and terms of all equity plans. At least three Non-executive Directors. Majority of Committee members must be independent. An independent Non-executive Director must be the Committee Chairman, who is not the Board Chairman. • Nora Scheinkestel (Chair) • Tim Burroughs • Margaret Seale Board Nominations & Governance Committee (BNGC) To assist the Board, including by: • recommending candidates for appointment as Non-executive Directors to the Board and the Boards of significant subsidiaries; • reviewing the process for the orientation and continuing education of Directors; • considering succession planning for Non-executive Directors; • assessing the overall skills, experience, expertise and diversity of the Board; • reviewing annually diversity generally within the Group, including approving measurable objectives for achieving diversity and the Group’s progress in achieving such objectives; • reviewing annually the time required to be committed to Westpac business by Non-executive Directors on the Board, including reviewing the other commitments of those Non-executive Directors; and • reviewing and, where required, approving the Group’s corporate governance policies. At least three Non-executive Directors. Majority of Committee members must be independent. The Board Chairman will be the Committee Chairman. • Steven Gregg (Chairman) • Peter Nash • Margaret Seale |
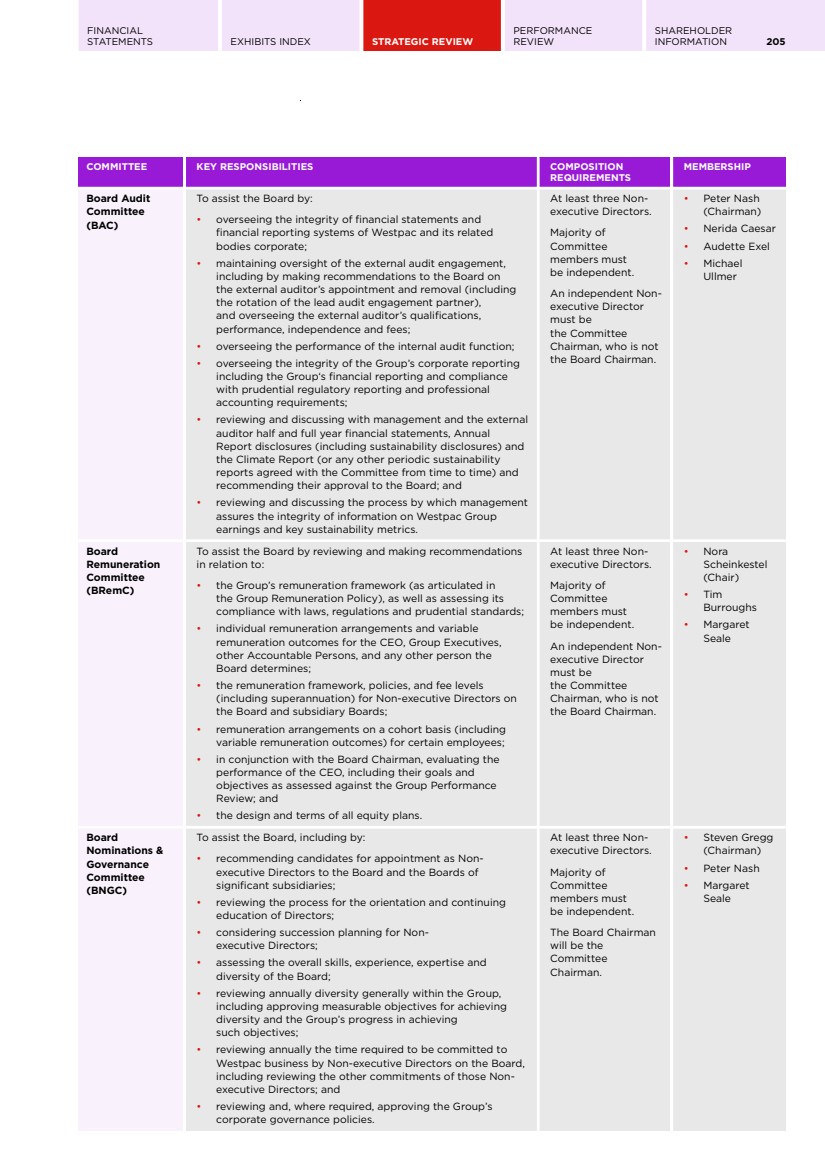
| 206 WESTPAC GROUP 2024 ANNUAL REPORT CORPORATE GOVERNANCE Information about Board Committee composition changes in FY24 can be found in the Directors' meetings section of the Directors’ report, in our 2024 Annual Report. From time to time, the Board may form other Committees or request Directors to undertake specific extra duties. In addition, the Board may participate (either directly or through representatives) in due diligence committees in relation to strategic decisions and capital and funding activities. Each Board Committee: • will refer to the Board or other Board Committee any matter that comes to their attention that is relevant for the Board or respective Board Committee; and • is entitled to the resources and information it requires and has direct access to our employees and advisers. Board and Board Committee meetings The number of meetings of the Board and Board Committees for the financial year ended 30 September 2024, and each Director’s attendance is reported in the Directors' meetings section of the Directors’ report, in our 2024 Annual Report. Scheduled meetings of the Board Committees occur at least quarterly, with the Board Risk Committee meeting at least five times annually. All Board Committees can meet more frequently as necessary. Non-executive Directors regularly meet without management present, so they can discuss issues appropriate to such a forum. Senior executives and other selected employees are invited, where considered appropriate, to participate in Board and Board Committee meetings. They are also available to be contacted by Directors between meetings. All Directors can receive all Board Committee papers and can attend any Board Committee meeting, provided there is no conflict of interest. The CEO attends all Board Committee meetings, except where they have a material personal interest in a matter being considered. Board Audit Committee financial knowledge All Board Audit Committee members have appropriate financial experience, an understanding of the financial services industry and satisfy the independence requirements under the ASXCGC Recommendations, Securities Exchange Act of 1934 (US) (as amended) and its related rules. The Board has determined that Mr Nash is an ‘audit committee financial expert’ and independent in accordance with US securities law. The designation of Mr Nash as an audit committee financial expert does not impose duties, obligations or liability on him that are greater than those imposed on him as a Board Audit Committee member, and does not affect the duties, obligations or liability of any other Board Audit Committee member or Board member. Audit committee financial experts are not deemed as an ‘expert’ for any other purpose. Meeting with Regulators The Directors met with representatives from the Australian Securities and Investments Commission (ASIC) and APRA during the course of the year. Role of the Company Secretary Westpac’s Company Secretary attends Board and Board Committee meetings and is responsible for the operation of the Secretariat function, including advising the Board on governance and, in conjunction with management, giving practical effect to the Board’s decisions. The Company Secretary is accountable to the Board, through the Chairman, on all matters to do with the proper functioning of the Board. A profile for the Company Secretary can be found in the Directors’ report, in our 2024 Annual Report. |
| FINANCIAL STATEMENTS EXHIBITS INDEX STRATEGIC REVIEW PERFORMANCE REVIEW SHAREHOLDER INFORMATION 207 DIVERSITY At Westpac we’re focused on building a workplace that fosters a diverse and inclusive workforce where our people feel valued, respected and safe. We seek to embrace everything that makes people unique in their identity like age, cultural background, disability, ethnicity, sex, gender identity, marital or family status, religious belief, sexual orientation or socio-economic background. Our Diversity, Equity & Inclusion Strategy and Policy aims to put people at the heart of everything we do and sets out our objective to encourage a more inclusive workplace for our people to support our customers. We are focused on hiring, developing and retaining diverse talent in a culture that embraces and celebrates differences, and allows people to feel safe at work. Our Diversity, Equity, and Inclusion priorities for FY23-25 Our Executive Team oversees the Group-wide Diversity, Equity, and Inclusion Strategy and reviews progress at least annually. Our FY23-25 Strategy seeks to create an inclusive environment for all employees by aspiring to: • support our employees in the moments that matter to them in both their career and personal lives; • grow a workforce that takes action and advocates for a more equitable and inclusive society – shifting from being bystanders to upstanders; and • build a workplace where it is safe to be yourself and where your unique identity is celebrated through trusted communities and allies. Making Inclusion happen We expect all employees to foster a culture which values diversity and includes everybody. The Board Nominations & Governance Committee annually reviews diversity within the Group, including approving diversity and inclusion objectives and overseeing progress in achieving these objectives. Westpac is a signatory to the 40:40 Vision, and the Board Nominations & Governance Committee confirmed the Group’s measurable objectives (which were in place for this reporting period) for achieving gender diversity in the composition of the Board, Executive Team, General Managers, and workforce generally as follows: • achieve 40:40:20 on the Westpac Board; • achieve 40:40:20 in our Executive Team1 ; • achieve 40% (+/- 2%) women in our General Manager population; • achieve 50% (+/- 2%) women in our Senior Leadership2 ; and • maintain at least 50% women in our workforce generally. More information is set out in the table below. % FEMALES SEP-23 SEP-24 TARGET TARGET MET Westpac Board 40 40 40:40:20a Met Executive Team 50 50 40:40:20a Met General Managers 40 39 40 +/- 2% Met Senior Leadership 49 49 50 +/- 2% Met Westpac workforce 54 54 50 Met a. 40% women, 40% men and 20% of any gender 1. Includes the full Executive Team other than the CEO. 2. Senior Leadership refers to the proportion of women (permanent and maximum term) in senior leadership roles across the Group. It includes the Executive Team, General Managers, and direct reports to General Managers, excluding administrative or support roles. |
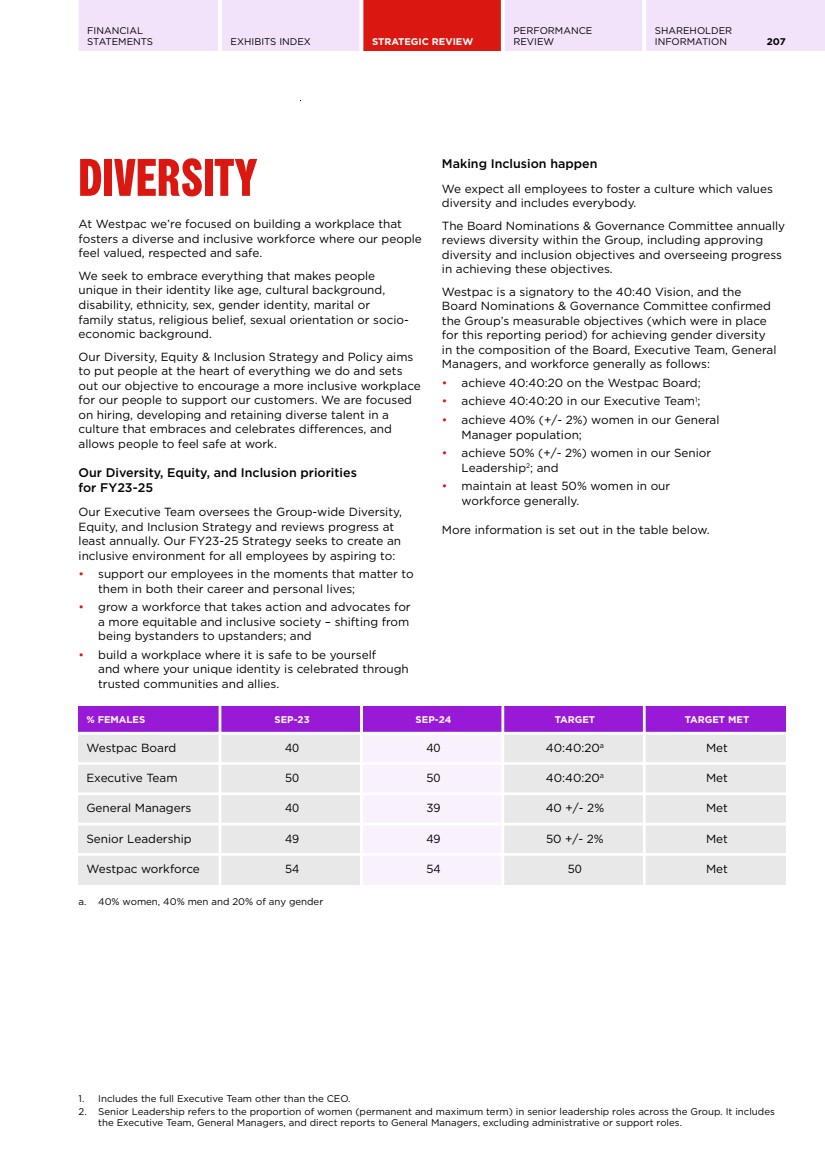
| 208 WESTPAC GROUP 2024 ANNUAL REPORT CORPORATE GOVERNANCE We are committed to achieving pay equity. We undertake like-for-like and by-level analysis to identify potential gender-based pay equity issues and take action when needed. Our focus is on improving the gender pay gap by increasing participation of women in senior roles as well as specialist areas such as institutional banking and technology. We continue to seek to uphold a zero-tolerance approach to all forms of discrimination, bullying and harassment, including sexual harassment. Our Discrimination, Bullying and Harassment and Sexual Harassment policies are available at the following link www.westpac.com.au/about-westpac/inclusion-and-diversity/. Our ‘Upstander’ initiative aims to grow employee confidence and capability to speak up and take action against behaviours and activities that negatively impact others. We have also introduced online inclusive leadership modules which are mandatory for all people leaders to complete. We have made progress against our commitments in our fifth Reconciliation Action Plan. We have increased our Aboriginal and Torres Strait Islander workforce representation to 1.08%, exceeding our 2024 target of 0.9%. We have introduced measures to support our Aboriginal and Torres Strait Islander employees including expanding leadership development opportunities. These measures include our Echo programs (designed to support emerging leaders by building leadership capability and career progression) and our Indigenous employee summit (Bayala Djurali). We provide an online Indigenous cultural learning program to our employees, with face to face options also available. We believe there is much work to be done to progress reconciliation and move forward together and acknowledge that we may at times fall short of the standards we expect of ourselves. However, where we misstep, we aim to swiftly set things right. Our ten Employee Advocacy Groups help us strengthen an inclusive culture by building trusted communities that celebrate and advocate for gender, LGBTQIA+, young and mature-age employees, cultural diversity in leadership, accessibility, Indigenous employees, veterans, skilled volunteering and supporting victims of domestic and family violence. Westpac offers workplace flexibility and provides employees with a variety of leave options such as parental leave (including support for those who experience pregnancy loss), fertility leave, carers’ leave, wellbeing and lifestyle leave, career breaks, purchased leave, uncapped domestic and family violence support leave, gender affirmation leave, Sorry Business leave, volunteer leave and emergency services leave. Further information on our inclusion and diversity programs and performance, as well as a copy of our Diversity, Equity & Inclusion Policy and Westpac’s Workplace Gender Equality Agency (WGEA) report, can be found on our website at www.westpac.com.au/about-westpac/inclusion-and-diversity/. |

| FINANCIAL STATEMENTS EXHIBITS INDEX STRATEGIC REVIEW PERFORMANCE REVIEW SHAREHOLDER INFORMATION 209 ETHICAL DECISION MAKING Ethical and responsible decision making is critical to decision-making at Westpac. Our Purpose, Values and Behaviours, together with our Code of Conduct and related policies and frameworks, are focused on instilling and reinforcing an ethical and responsible decision-making culture across the Group. Purpose, Values and Behaviours Westpac’s purpose is creating better futures together. In working to fulfill our purpose, we are guided by our ‘HELPS’ values. Our Purpose, Values and Behaviours set the direction for our culture by providing clarity about what is valued most and what our people need to do. FIGURE 2 – PURPOSE, VALUES AND BEHAVIOURS OUR PURPOSE Creating better futures together Helpful Passionate about providing a great customer experience Ethical Trusted to do the right thing Leading Change Determined to make it better and be better Performing Accountable to get it done Simple Inspired to keep it simple and easy OUR VALUES OUR BEHAVIOURS ˃ I care, listen and act, providing consistently great service to our customers ˃ I always ask, ‘Should We?’, speaking up, seeking feedback and applying judgement ˃ I collaborate and look for ways to innovate, embracing new ways of working and technologies ˃ I set stretch targets and am empowered to take ownership and deliver outcomes for our customers and shareholders ˃ I always ask ‘can this be simpler’, I clear the way to problem solve to make it easier and quicker Underpinning our 5 values are our behavioural statements (see Figure 2 above). These statements are expressed in simple, action-orientated language and address important themes such as speaking up, ownership, collaboration and empowerment. We embed our Purpose, Values and Behaviours through employee and leadership initiatives and align them with the systems, processes and policies that impact our day-to-day activities. |

| 210 WESTPAC GROUP 2024 ANNUAL REPORT CORPORATE GOVERNANCE Code of Conduct The Westpac Group Code of Conduct (Code) sets out a consistent standard and establishes the expectations of our people to do what is right. The Code goes beyond an obligation to comply with laws and policies and is a key aspect of improving conduct to seek to ensure fair outcomes for customers, communities and each other. The Code requires us to apply the ‘Should We?’ Test (see Figure 3 below) when making decisions and encourages our people to speak up when our standards are not being met. We take non-compliance with the Code seriously. Material breaches of the Code are reported to the Board Risk Committee. Supporting the Code are numerous frameworks and policies outlining our commitment to sustainable business practices and behaviours. These include our Purpose, Values and Behaviours, policies and position statements addressing sustainability themes such as human rights, climate change and other environmental and social impacts. The Code is available on our website at: www.westpac.com.au/about-westpac/westpac-group/corporate-governance/ principles-policies/. FIGURE 3 – THE ‘SHOULD WE?’ TEST |
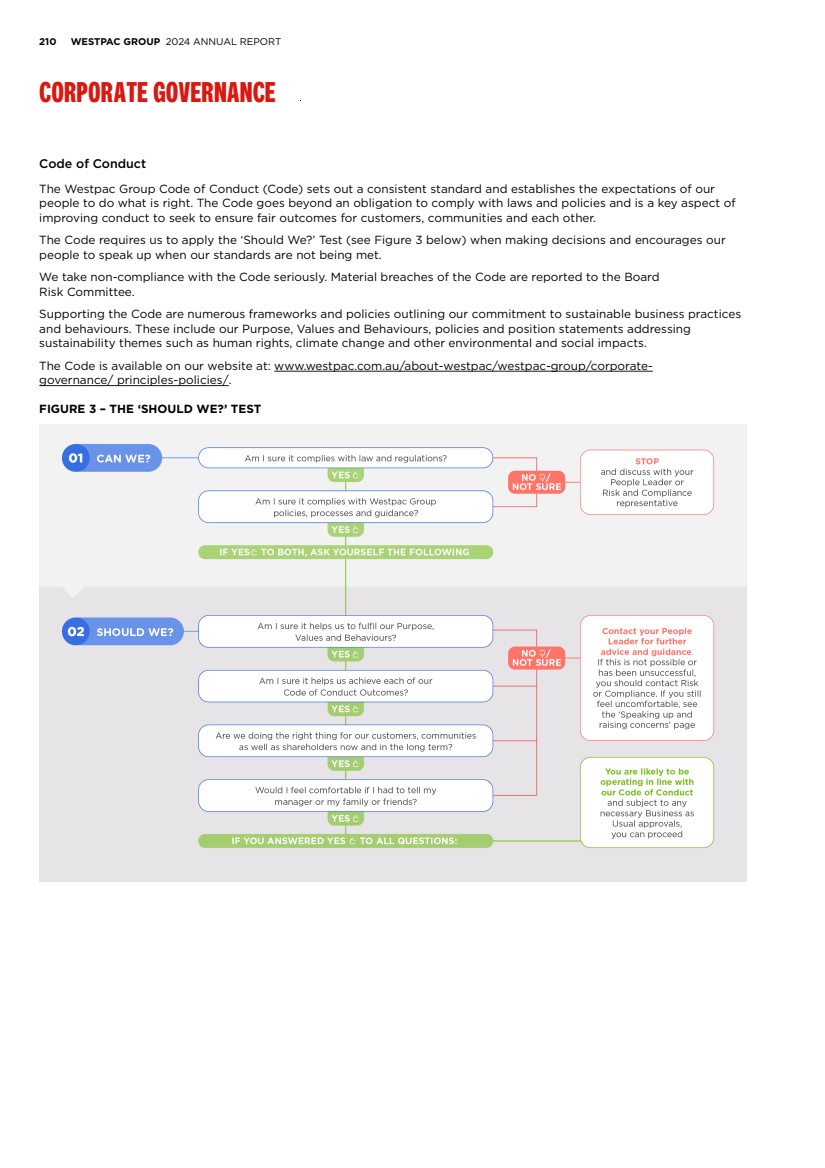
| FINANCIAL STATEMENTS EXHIBITS INDEX STRATEGIC REVIEW PERFORMANCE REVIEW SHAREHOLDER INFORMATION 211 KEY POLICIES We have a number of key policies that seek to manage our regulatory compliance and human resource requirements. We are also subject to a range of external industry codes, such as the Banking Code of Practice and the ePayments Code. Code of Ethics for Senior Finance Officers Our Code of Accounting Practice and Financial Reporting (COAPFR) complements our Code of Conduct. It is designed to assist our CEO, CFO and other principal financial officers to apply the highest ethical standards to their duties and responsibilities with respect to accounting and financial reporting. The COAPFR requires those officers to: • act honestly and ethically, including in the handling of actual or apparent conflicts of interest between personal and professional relationships; • provide full, fair, accurate, timely and understandable disclosure in reporting and other communications; • comply with applicable laws, rules and regulations; • promptly report violations of the COAPFR; and • be accountable for adherence to the COAPFR. The COAPFR is available on our website at www.westpac.com.au/about-westpac/westpac-group/ corporate- governance/principles-policies/. Delegated authority The Delegated Authority Policy outlines key principles (and forms part of a framework) governing decision-making within the Westpac Group, including channels of escalation and reporting to the Board. The scope of, and limitations to, authority delegated by the Board to the CEO and through the CEO to other Group Executives, is articulated in delegation instruments and covers areas such as expenditure, funding and securitisation, and lending. These delegations have been implemented with a view to balancing effective oversight with appropriate empowerment and accountability of management. Any matters or transactions outside the delegations of authority given to management are required to be referred to the Board or relevant Board Committee for approval. Securities trading Westpac’s Group Securities Trading Policy prohibits Directors, employees, secondees and contractors from trading in any securities and other financial products that they possess inside information on. They are also prohibited from passing on inside information to others who may use that information to trade in securities or from procuring others to trade. The policy requirements also apply to associate accounts. In addition, Directors and any employees, secondees or contractors who, because of their seniority or the nature of their position, may have access to material non-public information about Westpac (known as Prescribed Employees) are subject to further restrictions, including prohibitions on trading prior to and immediately following annual and half year results announcements. These restrictions also apply to their associates. The Westpac Group Securities Trading Policy is available in the Corporate Governance section of our website at www.westpac.com.au/about-westpac/westpac-group/corporate-governance/principles-policies/. Concern reporting and whistleblower protection The Westpac Group Speaking Up Policy encourages our employees, contractors, secondees, former employees, brokers, service providers and suppliers to raise any concerns about our activities or behaviours that may be unlawful or unethical. Our senior management are committed to supporting those who speak up. Westpac does not tolerate detrimental conduct related to a Speaking Up report. A person can raise a concern using our whistleblowing channels, including our reporting system ‘Concern Online’ and our Whistleblower Hotline. Both channels enable anonymous reporting. Westpac’s Whistleblower Protection Officers are responsible for providing protections to whistleblowers who are concerned about potentially experiencing detrimental conduct because of speaking up. They also engage directly with whistleblowers to address risks of reprisal. Whistleblowers may raise a concern directly with a Whistleblower Protection Officer. The Westpac Group Speaking Up Policy requires that we investigate concerns in a confidential, fair and objective manner. If the investigation shows that wrongdoing occurred, we are committed to taking action, such as changing our processes and imposing consequences on those involved in wrongdoing. Outcomes may also involve reporting the matter to relevant authorities and regulators. The Board Audit Committee, in conjunction with the Board Risk Committee, oversees Westpac’s Whistleblower Program. Material whistleblower matters raised under the Westpac Group Speaking Up Policy are reported to the Board Risk Committee. The Board Risk Committee also receives regular reporting on whistleblowing, including key metrics, measures and themes that provide insights into the performance of the Whistleblower Program. The Westpac Group Speaking Up Policy is available on our website at www.westpac.com.au/about-westpac/westpac-group/corporate-governance/principles-policies/. Anti-Bribery and Corruption The Westpac Group has an Anti-Bribery and Corruption (ABC) Policy and related bribery and corruption prevention standards, procedures and systems. Material breaches of the ABC Policy are reported to the Board Risk Committee. The ABC Policy is available on our website at www.westpac.com.au/ about-westpac/westpac-group/ corporate-governance/ anti-bribery-corruption-policy-procedures/. Westpac has no tolerance for any form of bribery or corruption. This includes a ban on facilitation payments and offering or soliciting secret commissions. |
| 212 WESTPAC GROUP 2024 ANNUAL REPORT CORPORATE GOVERNANCE Westpac is committed to preventing, detecting and deterring bribery and corruption by managing its bribery and corruption risk and complying with relevant ABC legislation in all jurisdictions in which it operates or has dealings. This includes the Australian Criminal Code Act 1995 (Cth), the Bribery Act 2010 (UK) and the Foreign Corrupt Practices Act 1977 (US). Under the ABC Policy, Westpac expects that its officers, Directors, employees, agents, contractors, service providers, subsidiaries and third parties acting for or on behalf of Westpac will comply with all applicable ABC laws and will not offer, provide, authorise, request or receive a bribe or anything which may be viewed as a bribe. Fit and Proper Person assessments Westpac’s Board-approved Group Fit and Proper Policy (F&P Policy) outlines how we assess the fitness and propriety of our Directors, Accountable Persons, and other individuals in key positions of responsibility. The F&P Policy supports Westpac in complying with APRA Prudential Standards CPS 520 and SPS 520, the Banking Act 1959 (Cth), Financial Accountability Regime Act 2023 (Cth), Superannuation Industry (Supervision) Act 1993 (Cth), relevant ASIC licensing requirements (Australian Financial Services Licence and Australian Credit Licence) and equivalent offshore regulations as applicable. The Chairman of the Board is responsible for assessing the fitness and propriety of our CEO and Non-executive Directors. The Board (as a collective) is responsible for assessing the fitness and propriety of the Chairman. A Fit and Proper Committee is responsible under delegated authority from the Board for undertaking a fit and proper assessment of all other individuals in key positions of responsibility. In all cases, a fit and proper assessment will be undertaken prior to their initial appointment and they will be re-assessed annually. This involves the relevant individual providing a declaration and background checks (including police and bankruptcy checks) being undertaken as appropriate. Conflicts of interest Westpac’s conflicts of interest framework is designed to identify and manage actual, potential and perceived conflicts of interest. The conflicts of interest framework includes the Group Conflicts of Interest Policy, along with supporting policies, standards and procedures. Under our conflicts of interest framework, any person who acts on behalf of the Westpac Group must: • promptly identify, declare, assess, manage and record conflicts of interest appropriately; • discharge their duties concerning conflicts of interest with integrity, fairness, honesty and due skill, care and diligence; • avoid a conflict of interest where it cannot be effectively managed; and • not solicit, accept or offer money, gifts, favours or entertainment that might influence, or might be seen to influence, their professional judgement. Modern Slavery Under the Australian Modern Slavery Act 2018 (Cth) and Modern Slavery Act 2015 (UK), Westpac is required to prepare an annual statement describing the risks of modern slavery across our operations and supply chain, and the actions taken to address the risks. Westpac published a joint statement for FY23 on behalf of itself and certain reporting entities within the Group that addresses the requirements of both Acts. The Westpac Group’s 2023 Modern Slavery Statement was published in March 2024 and can be located at www. westpac.com.au/content/dam/ public/wbc/documents/pdf/aw/sustainability/wbc-2023- modern-slavery- statement.pdf. Customer Advocate Westpac’s Customer Advocate provides advice and guidance to our complaints team regarding complaints raised by customers in relation to personal banking and small business matters. In addition, the Customer Advocate recommends changes to policies, procedures and processes, arising from the complaints made by customers, and in particular focuses on how we can best support our vulnerable customers. |
| FINANCIAL STATEMENTS EXHIBITS INDEX STRATEGIC REVIEW PERFORMANCE REVIEW SHAREHOLDER INFORMATION 213 SUSTAINABILITY We view sustainable and responsible business practices as important for our business and our stakeholders. Sustainability is about managing environmental and social risks and opportunities across our business in a way that seeks to balance the needs of our stakeholders – our customers, employees, suppliers, investors and the communities in which we operate. We aim to address the matters we believe are the most material for our business and our stakeholders, now and in the future. Environmental and social risks and opportunities continue to evolve so we seek to monitor these developments while aiming to embed sustainability into our business practices. We participate in a number of voluntary initiatives including the Global Reporting Initiative (GRI), the UN Global Compact and the recommendations of the Taskforce on Climate-Related Financial Disclosures (TCFD) (which have now been incorporated into the International Sustainability Standards Board (ISSB) standards). We report on the most material sustainability topics, identified in our annual materiality assessment and aligned with the GRI standards, in our Annual Report. Our Annual Report and Climate Report include sustainability governance and risk management and are available on our website at www.westpac.com.au/2024annualreport/. Material exposure to sustainability risks and other categories of risks Westpac is exposed to environmental and social risks such as climate change risk. We seek to manage our material exposures to these risks, as well as other material risks we face, in accordance with our risk management strategy and frameworks. Further details about the risks we face, and how we seek to manage them, are in our 2024 Annual Report (see sections on 'Creating Value for the Community', 'Creating Value for the Environment' and 'Risk Management') and our 2024 Risk Factors. In addition, our Climate Change Position Statement and Action Plan, our Climate Report, our Human Rights Position Statement and Action Plan, and our Modern Slavery Statement are available on our website at www.westpac.com.au/about-westpac/sustainability/. RISK MANAGEMENT Westpac's Risk Management Framework describes the material risks faced by our business and how they are managed. With customers at the centre, there are nine components to the framework that are underpinned by a strong risk culture and a Three Lines of Defence model. These components are represented in the diagram on page 214. Effective risk management requires all the elements of our framework to operate independently and interactively to provide a complete approach for managing risk and to deliver fair customer outcomes. As part of the CORE program transition phase, Westpac has continued to focus on the sustainability and effectiveness of the uplift delivered under the Integrated Plan. For further information about the CORE program, refer to the Strategic review in our 2024 Annual Report. The Group’s Risk Management Framework, Risk Management Strategy and Board Risk Appetite Statement are reviewed annually by the Board Risk Committee. The Board Risk Committee also oversees that Westpac is operating with due regard to risk appetite. The review of the Risk Management Framework includes consideration of whether the framework continues to be sound. The Risk Management Framework, Risk Management Strategy and Board Risk Appetite Statement were approved by the Board, on the recommendation of the Board Risk Committee, during the financial year ended 30 September 2024. The CEO and Executive Team are responsible for implementing our Risk Management Framework and Risk Management Strategy, and for developing frameworks, policies, controls, processes and procedures for identifying and managing risk in Westpac’s activities. To support our management of risk, Westpac has an Executive risk committee (RISKCO) that assists accountable individuals in making risk-related decisions in respect of the Group. It monitors material risk exposures, their alignment to risk appetite approved by the Board and related actions. RISKCO also oversees the implementation and performance of the Risk Management Framework and Risk Management Strategy, as well as required controls and actions. RISKCO is supported by a number of management subcommittees. RISKCO and these subcommittees provide an important channel for senior management to communicate and report on risk matters. |
| 214 WESTPAC GROUP 2024 ANNUAL REPORT CORPORATE GOVERNANCE RISK MANAGEMENT FRAMEWORK COMPONENTS Governance and Management Control Business Strategy Risk Identification Risk Appetite Stress and Scenarios Analysis People and Infrastructure Control Definition and Effectiveness Monitoring and Reporting Actions and Response Westpac’s business plans are shaped considering the risks associated with its strategic objectives Identifying existing and emerging risks in our business from internal and external environments Setting risk appetite to provide clarity on the level of risk we are prepared to take Performing stress tests and scenario analysis to assess potential impacts that changes to existing and emerging risks may have on the Group, including on our capital Having appropriate capability, people, data and systems to support effective risk management and decision making Embedding appropriate Frameworks, policies, standards and controls to manage the risks we take Risks are assessed through ongoing monitoring, management, reporting and assurance Appropriate action plans are implemented to improve our risk profile Ensuring that appropriate data, analysis and recommendations flow to appropriate people and forums on a timely basis to support decision making Customers Risk Culture Board approved 7 March 2024 (no changes from 2023) |
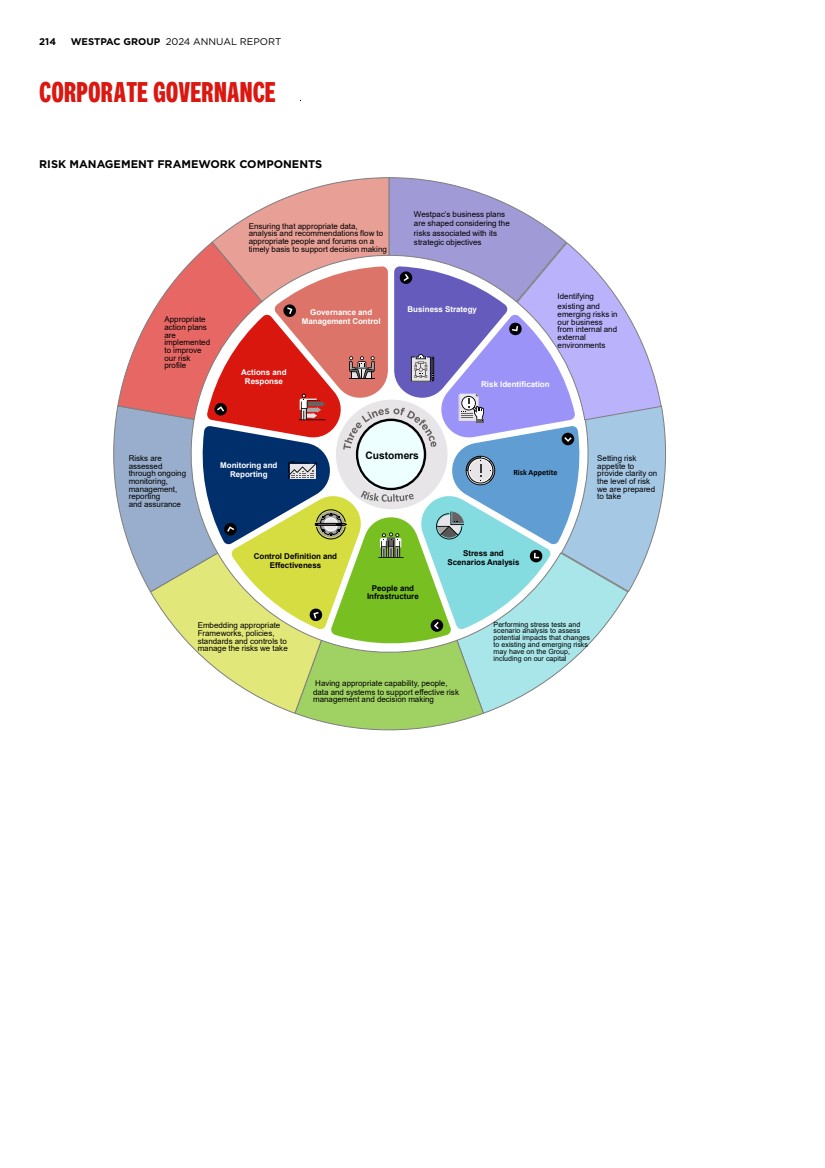
| FINANCIAL STATEMENTS EXHIBITS INDEX STRATEGIC REVIEW PERFORMANCE REVIEW SHAREHOLDER INFORMATION 215 Risk Culture Westpac considers that a strong risk culture is essential for the Group’s Risk Management Framework to operate effectively. Building and maintaining a strong risk culture is a continuing focus of the Board and will help us remain a simpler, stronger bank. Through the frameworks established under the CORE program, Westpac has embedded processes and tools to continue to improve risk culture, and track progress towards our goal of a risk culture that proactively identifies, manages and mitigates risks, learns from risk events and continuously anticipates new risks and opportunities. We have also implemented a Group-wide learning program which provides an opportunity for employees to spend time on the specifics of risk management. Further information about this work is available in the Strategic review in our 2024 Annual Report. Three Lines of Defence We have adopted and continue to embed a Three Lines of Defence model which is designed to enable all our people to understand their own role and responsibilities in the active management of risk (see Figure 4 below). |
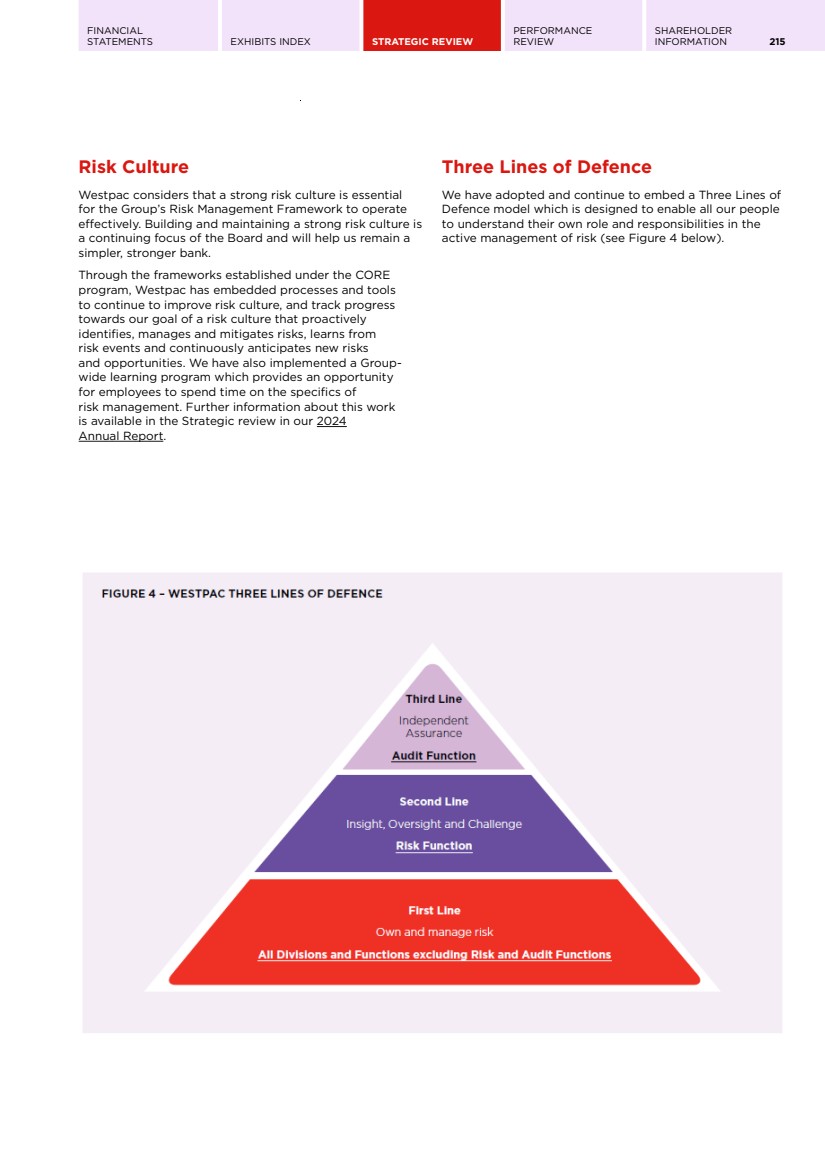
| 216 WESTPAC GROUP 2024 ANNUAL REPORT CORPORATE GOVERNANCE FINANCIAL REPORTING AND AUDIT Approach to financial reporting Our approach to financial reporting reflects three core principles: • that our financial reports present a true and fair view of our financial position and performance; • that our accounting methods comply with applicable accounting standards and policies; and • that our external auditor is independent and serves security holders’ interests. The Board, through the Board Audit Committee, has regard to Australian and international developments relevant to these principles when reviewing our practices. The Board delegates oversight responsibility for the integrity of financial statements and financial reporting systems to the Board Audit Committee. The Board Risk Committee provides relevant periodic assurances and reports (as appropriate) to the Board Audit Committee. Similarly, the Board delegates oversight responsibility for the preparation of remuneration reports and disclosures to the Board Remuneration Committee, which recommends remuneration reports and related disclosures, and provides relevant assurances, through the Board Audit Committee to the Board for approval. CEO and CFO assurance The Board receives regular reports from management about our financial condition and operational results. Before the Board approves the half year and full year financial statements, the CEO and the CFO declare to the Board that in all material respects: • Westpac’s financial records: – correctly record and explain its transactions, and financial position and performance; – enable true and fair financial statements to be prepared and audited; and – are retained for seven years after the transactions covered by the records are completed; • the financial statements and notes comply with applicable accounting standards; • the financial statements and notes give a true and fair view of Westpac’s financial position and performance; • (in relation to full year financial statements), the consolidated entity disclosure statement is true and correct; • any other matters that are prescribed by the Corporations Act 2001 (Cth) and regulations as they relate to the financial statements and notes are satisfied; and • the declarations above have been formed on the basis of a sound system of risk management and internal control, and that the system is operating effectively in all material respects in relation to financial reporting risks. The CEO and CFO have provided such statements for the financial year ended 30 September 2024. External auditor Our external auditor (for the 2024 financial year) is PricewaterhouseCoopers (PwC), appointed by shareholders at the 2002 AGM. Prior to 2002, individuals who were partners of PwC or its antecedent firms were our external auditors from 1968. Our PwC lead audit partner is Mr Colin Heath. Mr Heath assumed responsibility for this role in December 2021. Westpac commenced a tender for its external audit services in November 2023, which was considered to be reflective of best practice for audit firm rotation. Due to PwC’s tenure as the Group’s external auditor, PwC was not invited to participate in the tender. Following completion of our tender process in March 2024, Westpac has confirmed KPMG as the preferred firm to be appointed as its external auditor from the 2025 financial year. The approval of Westpac shareholders to appoint KPMG as its external auditor will be sought at the 2024 AGM. The external auditor receives all Board Audit Committee and Board Risk Committee papers, attends all meetings of these committees and is available to Committee members at any time. The external auditor also attends the AGM to answer questions from shareholders regarding the conduct of its audit, the audit report and financial statements and its independence. The external auditor is required to confirm its independence and compliance with specified independence standards at our half and full financial year, however in practice it confirms its independence on a quarterly basis. We strictly govern our relationship with the external auditor, including restrictions on employment, business relationships, financial interests and use of our financial products by the external auditor. Periodically, the Board Audit Committee consults with the external auditor without the presence of management about internal controls over financial information, reporting and disclosure and the fullness and accuracy of the Group’s financial statements. The Board Audit Committee also meets with the General Manager, Group Audit without other members of management being present. Engagement of the external auditor To avoid possible independence or conflict issues, our ‘Pre-approval of engagement of external auditor for audit and non-audit services’ policy (NAS Policy) prohibits the external auditor from carrying out certain types of non-audit services for Westpac. The NAS Policy also limits the extent to which the external auditor can perform other non-audit services. Use of the external auditor for any non-audit services must be assessed and approved in accordance with the pre-approval process set out in the NAS Policy. |
| FINANCIAL STATEMENTS EXHIBITS INDEX STRATEGIC REVIEW PERFORMANCE REVIEW SHAREHOLDER INFORMATION 217 Group Audit (internal audit) Group Audit is independent of the first and second lines of defence and provides independent and objective assurance and insight on the adequacy and effectiveness of the Group’s governance, risk management and internal controls to the Board and management. Group Audit is governed by a charter approved by the Board Audit Committee that sets out its purpose, role, scope and responsibilities. Group Audit seeks to conduct its activities in line with regulatory standards and adheres to The Institute of Internal Auditors’ mandatory guidance, including the Core Principles for the Professional Practice of Internal Auditing, Definition of Internal Auditing, the Code of Ethics, and the International Standards for the Professional Practice of Internal Auditing. Group Audit is structured to support its independence from management, with the General Manager, Group Audit having a direct reporting line into the Board Audit Committee, through the Chairman of the Board Audit Committee and, for administrative purposes only, to the CFO. Group Audit has the right to unrestricted and private access to the CEO and Senior Executive team, the Board Chairman and Chairman of the Board Audit Committee, other Board members where relevant and external regulators. Group Audit’s responsibilities include attending and presenting reports relevant to the Board and Management committees, on the Group’s Risk Management Framework. Board Audit Committee dialogue with management, external audit and Group audit The Board Audit Committee maintains an ongoing dialogue with management, the external auditor and Group Audit, including regarding those matters that are likely to be designated as Key Audit Matters in the external auditor’s report. Key Audit Matters are those matters which, in the opinion of the external auditor, are of the most significance in their audit of the financial report. As part of its oversight responsibilities, the Board Audit Committee also conducts discussions with a wide range of internal and external stakeholders including: • the external auditor, about our major financial reporting risk exposures and the steps management has taken to monitor and control such exposures; • Group Audit and the external auditor concerning their reports regarding significant findings in the conduct of their audits, and overseeing that any issues identified are rectified by management in an appropriate and timely way or reported to the Board Risk Committee (with the Board Risk Committee overseeing management's response to rectifying those issues); • management and the external auditor concerning the half year and full year financial statements; • management and the external auditor regarding any correspondence with regulators or government agencies, and any published reports which raise material issues or could impact on matters regarding the Westpac Group’s financial statements or accounting policies; and • the Group General Counsel regarding any legal matters that may have a material impact on, or require disclosure in, the financial statements. MARKET DISCLOSURE AND SHAREHOLDER COMMUNICATION Verification of periodic corporate reports For periodic corporate reports released to the market which are not required to be audited or reviewed by our external auditor, we have verification and approval processes to support the integrity of the information disclosed. The process varies depending on the report and generally involves the individuals with responsibility for the information confirming to the best of their knowledge that the information is accurate and not misleading. The process may also involve review by internal subject matter experts (and as appropriate, our external advisers); and review by and confirmation from the individual responsible for the corporate report that it is appropriate for release. Such periodic corporate reports may also be required to be approved by the Disclosure Committee or the Disclosure Officer (or delegate) or the Board under our Market Disclosure Policy – as described below. Market disclosure We seek to provide all investors with equal, timely, accurate and balanced disclosure. Our Board-approved Market Disclosure Policy governs how we communicate with our shareholders and the investment community. Our Market Disclosure Policy is available on our website at www.westpac.com.au/about-westpac/westpac-group/ corporate-governance/principles-policies/. The policy provides a framework for how we manage our disclosure obligations and satisfy the disclosure requirements of the ASX, NZX, and other relevant offshore securities exchanges, as well as relevant securities and corporations legislation. Under our policy, and in accordance with our obligations, information that a reasonable person would expect to have a material effect on the price or value of our securities must immediately be disclosed via the ASX unless an exception applies under regulatory requirements. Certain disclosure decisions are the responsibility of the Board (for example, relating to matters of fundamental importance to the Group such as material transactions or material changes in strategic direction). For other decisions, our Disclosure Committee is responsible for determining whether matters should be disclosed publicly under the policy, and for assisting employees in understanding what information may require disclosure to the market on the basis that it is market sensitive. |
| 218 WESTPAC GROUP 2024 ANNUAL REPORT CORPORATE GOVERNANCE The Disclosure Committee is comprised of the Disclosure Officer (who is the CFO), the Group General Counsel and at least one of the following: the CEO, the Chief Risk Officer, the Group Executive, Customer & Corporate Services, the Company Secretary of Westpac and the General Manager, Investor Relations. The Disclosure Officer is ultimately responsible for all disclosure-related communication with relevant securities exchanges. The Company Secretary or their delegate is authorised to lodge ASX announcements once they have been approved. A copy of announcements on material issues will also be provided to the Board promptly after release to the ASX, unless previously provided. Before Westpac gives a new and substantive investor or analyst presentation, we will release a copy of that presentation to the market. Once relevant information is disclosed to the market and available to investors, it may also be published on our website. This includes investor discussion packs and presentations on our financial results. Our website also contains Annual Reports, results announcements, speeches and support material given at investor conferences or presentations, notices of meetings and key media releases. Shareholder communication and participation We are committed to keeping shareholders fully informed about Westpac in compliance with our obligations – from our strategy, operations and performance, to our governance and sustainability approach. As part of our investor relations program – and consistent with our Market Disclosure Policy – we carry out a range of activities to facilitate two-way communication with shareholders, including: • providing relevant company information online via our Investor Centre on our website; • giving shareholders the option to receive information and communications electronically or via hard copy; • responding to shareholder queries directly via phone, email and mail; and • enabling shareholders to view major market briefings and maintaining that information in our Investor Centre. Our financial calendar in our Investor Centre lists all major market briefings and shareholder meetings. Announcements on these events may also be made on the ASX. Westpac seeks to facilitate shareholder participation at general meetings. We aim to choose a time and location that is convenient for shareholders, and we typically move our AGMs across capital cities. We provide explanatory notes in the Notice of Meeting to shareholders, and the AGM is also webcast live with a replay available for viewing in our Investor Centre. Westpac engages with shareholders and shareholder groups throughout the year to gather feedback and allow them to ask questions. This feedback assists the Group’s decision making and allows us to address any key themes in our reporting and/or at our meeting. Westpac intends to hold a ‘hybrid AGM’ this year, with shareholders being able to attend the AGM venue in person or participate online or via the telephone. Shareholders taking part in our 2024 AGM online (and their proxies, corporate representatives and attorneys) will be able to ask questions and make comments (either through the AGM Online Platform or via the telephone) and vote on the resolutions. In addition, shareholders can lodge a direct vote before the AGM. Consistent with our practice for voting at meetings of shareholders, voting on all resolutions is conducted by a poll. |
| FINANCIAL STATEMENTS EXHIBITS INDEX STRATEGIC REVIEW PERFORMANCE REVIEW SHAREHOLDER INFORMATION 219 SUSTAINABILITY GOVERNANCE The Board is responsible for considering the social, ethical and environmental impact of our activities. The Board helps to set Westpac's strategic priorities for Sustainability by approving key policies such as the Climate Change Position Statement and Human Rights Position Statement. It monitors progress against our Net-Zero Banking Alliance commitment, as well as overseeing risks and opportunities. The Board Risk Committee reviews and approves the Sustainability Risk Management Framework every two years and reviews the monitoring of reputation and sustainability risk performance. See Risk Management (page 188) for more information. In relation to Board skills, the ‘Environment & Social’ category in the Board skills matrix in Corporate Governance (page 196) reflects four directors with deep experience and knowledge and five with general working experience and knowledge. The Board and its Committees receive regular reports on climate-related matters from the CEO, Group Executives, and other functions. The Board and Committee charters are available on our website. Key sustainability-related agenda items for the Board and its Committees in FY24 Board • Provided oversight of the sustainability strategy, including receiving updates on sustainability-related strategic initiatives; • Approved the Climate Report; • Approved Board Risk Appetite Statement which includes measures related to ESG scores by sustainability rating agencies; • Received updates on progress against NZBA sector targets; and • Received training on environmental and social topics, including climate change and human rights. Board Risk Committee • Reviewed and recommended the Board Risk Appetite Statement to the Board for approval, which included measures related to climate change risk; and • Reviewed and monitored the Credit Risk and Reputation and Sustainability risk classes, including measures related to climate risk. Board Audit Committee • Received updates on sustainability reporting and standards (including climate standards); and • Provided oversight of the Climate Report, including recommending the Climate Report to the Board for approval. Board Remuneration Committee • Recommended a new climate change measure for the Group Short Term Variable scorecard (STVR). Role of management The day-to-day management of Westpac’s approach to sustainability is the responsibility of the CEO and is delegated to Group Executives and senior management where appropriate. The CEO and senior management work to integrate the risks and opportunities of sustainability, including climate change, into our operations and ensure our people understand their role in supporting the Group’s sustainability ambitions. Several management committees help assess climate-related matters and support Executive management in their decision making. These are summarised in the following chart. Climate measures in executive remuneration The Group STVR Scorecard includes a climate-related measure for the CEO and certain Group Executives, aimed at delivering the climate transition plan. This measure is part of the broader ‘Strategic Execution’ key priority. 2024 progress is assessed using three measures: 1. The number of 2030 targets set for NZBA carbon-intensive sectors; 2. The number of top emitters engaged on transition plans; and 3. Performance against our annual plan of the 2030 Sustainable Finance Target. Refer to the Remuneration Report (page 236) for information on performance against these measures. |
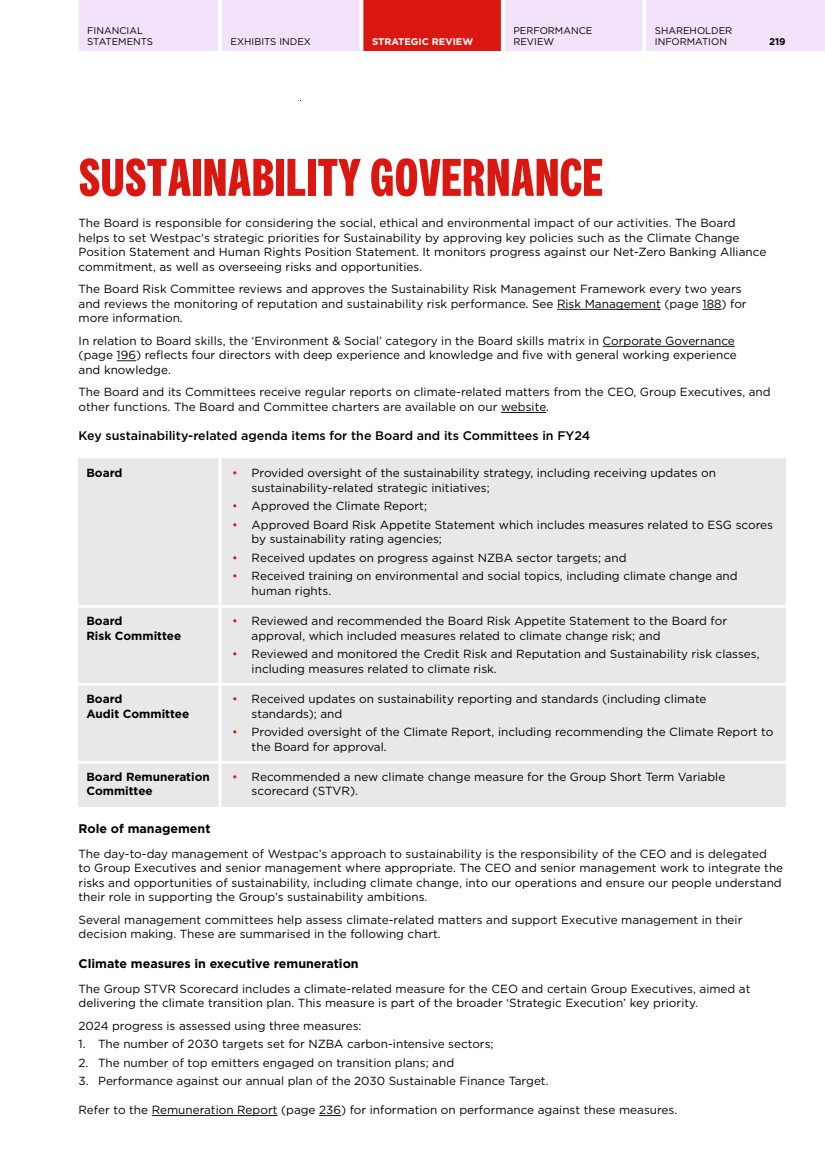
| 220 WESTPAC GROUP 2024 ANNUAL REPORT SUSTAINABILITY GOVERNANCE Sustainability Governance Structure KEY Flow of information relating to climate change-related targets and strategies. Flow of information relating to climate-related disclosures. Flow of information relating to the climate change-related risk management. Participating Group departments in committees (including papers) BOARD LEVEL Board Approves material sustainability positions (CCPS, NCPS, HRPS) Approves Board Risk Appetite Statement (Board RAS), RMF, RMS ESG & Reputation Committee Meets at least 5 times per year. Chaired by CEO Supports decision making on significant sustainability and reputation related matters, including monitoring of NZBA targets. Approves our key sustainability positions Group Executive Risk Committee Meets at least 7 times per year. Chaired by Chief Risk O cer Review RMF, RMS, SRMF and Board RAS Oversee the implementation and performance of the SRMF and key supporting policies / controls and actions MANAGEMENT LEVEL Board Risk Committee Approves Sustainability Risk Management Framework (SRMF) and Credit Risk Management Framework (CRMF) at least biennially Reviews Board RAS, RMF, RMS annually ESG Council Chaired by divisional Chief Executive Supports coordination and prioritisation of group-wide ESG priorities Group Credit Risk Committee Chaired by Deputy Chief Risk O cer Review and provide input on the CRMF and Credit Risk Appetite Statement (CRAS) for inclusion in the Board RAS ESG Risk Line 2 risk function, Risk Class Owner of Reputation and Sustainability Risk. Oversight and challenge the management of sustainability risk. Sets the Group’s approach for sustainability risks, including related frameworks and policies such as the SRMF ESG Disclosure and Reporting Under Group Finance. Leads the Climate Report and external sustainability reporting. Works to improve the Group’s alignment with ESG related standards. Calculate and report Group financed emissions. Divisions Manage sustainability risk and opportunities. Set NZBA targets and baselines and reports on progress. Lead customer engagement and assess risk and opportunities in transactions Group Sustainability Develops and maintains the Group Sustainability Strategy, Group Position Statements, Sustainable Finance Taxonomy and Modern Slavery Statement. Leads the Group approach for Climate, Nature and Human Rights and leads external engagement on sustainability matters. Group Property, Procurement and Protective Services Manages the environmental performance of the Group’s operations. Works to reduce the Group’s direct environmental footprint. Supports key suppliers with sustainability strategies Divisional Risk Committees Chaired by divisional Chief Executive Considers material sustainability risks for division, including risk profile assessments, and risk appetite Board Audit Committee Reviews the sustainability disclosures in the Annual Report and Climate Report and recommends their approval to the Board Executive Team (CEO / divisional Chief Executives). Oversee Sustainability Strategy implementation Board Remuneration Committee Assists the Board by overseeing the design, operation and monitoring of the remuneration framework GROUP DEPARTMENTS WITH SUSTAINABILITY RESPONSIBILITIES Informs Customer & Transaction Risk Escalation Committee Chaired by divisional Chief Executive. Meets weekly (WIB) or as required (B&W) – to escalate key transactions to relevant executives for ESG review and decision Climate Change Credit Risk Committee Chaired by Deputy Chief Risk O cer Review and provide input to the Group’s risk appetite measures and thresholds related to climate-related risk in CRAS and Board RAS |
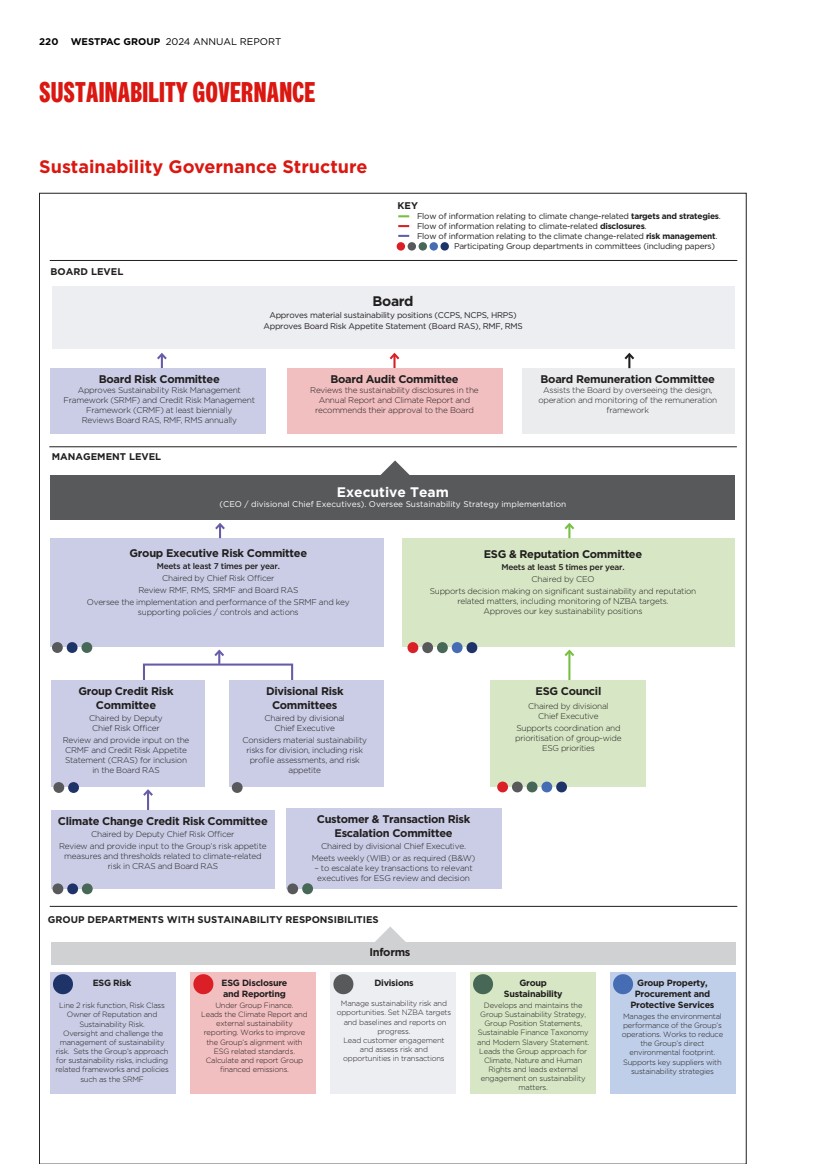
| FINANCIAL STATEMENTS EXHIBITS INDEX STRATEGIC REVIEW PERFORMANCE REVIEW SHAREHOLDER INFORMATION 221 This page has been intentionally left blank. |

| 222 WESTPAC GROUP 2024 ANNUAL REPORT DIRECTORS' REPORT Our Directors present their report together with the financial statements of the Group for the financial year ended 30 September 2024. Directors The names of the persons who have been Directors, or appointed as Directors, during the period since 1 October 2023 and up to the date of this report are: Steven Gregg (appointed as a Director on 7 November 2023 and appointed Chairman on 14 December 2023), Peter King, John McFarlane (appointed as a Director on 17 February 2020, appointed as Chairman on 2 April 2020 and retired as Chairman and as a Director on 14 December 2023), Tim Burroughs, Nerida Caesar, Audette Exel AO, Andy Maguire (appointed as a Director 15 July 2024), Christopher Lynch (appointed as a Director on 1 September 2020 and retired as a Director on 14 December 2023), Peter Nash, Nora Scheinkestel, Margaret Seale and Michael Ullmer AO. Particulars of the skills, experience, expertise and responsibilities of the Directors at the date of this report, including all directorships of other listed companies held by a Director at any time in the three years immediately before 30 September 2024, and the period for which each directorship has been held, are set out in the following pages. Board Committee Member Key Chair of each Committee is noted with a red icon. Board Audit Board Nominations & Governance Board Remuneration Board Risk Board of Directors Steven Gregg BCom Age: 63 CHAIRMAN AND INDEPENDENT NON-EXECUTIVE DIRECTOR Appointed: Director since November 2023 and Chairman since December 2023. Board Committees: Chairman of the Board Nominations & Governance Committee. Experience: Steven has more than 35 years' experience in global financial services, strategy consulting and professional services across Australia, Asia, Europe and the US. Steven has extensive experience in global investment banking, including through senior roles with ABN Amro, Chase Manhattan, Lehman Brothers and AMP Morgan Grenfell. His most recent executive role was as a partner at McKinsey & Company where he advised clients in Financial Services and other sectors, primarily in Australia and Asia. Steven has served as Chairman and Director for companies across various sectors and is currently Chairman of Ampol Limited and the Lorna Hodgkinson Foundation (and a Director of Unisson Disability Limited). Steven is also a Director of William Inglis & Son Limited. Steven was formerly the Chairman of The Lottery Corporation, Tabcorp Holdings Limited, Goodman Fielder Limited and Austock Group Limited, and formerly a Non-executive Director at Challenger Limited. Directorships of listed entities over the past three years: Ampol Limited (since October 2015), The Lottery Corporation Limited (May 2022 to March 2024), Challenger Limited (October 2012 to October 2023) and Tabcorp Holdings Limited (July 2012 to May 2022). Other principal directorships and interests: Chairman of the Lorna Hodgkinson Foundation (and a Director of Unisson Disability Limited). Board Committees: |
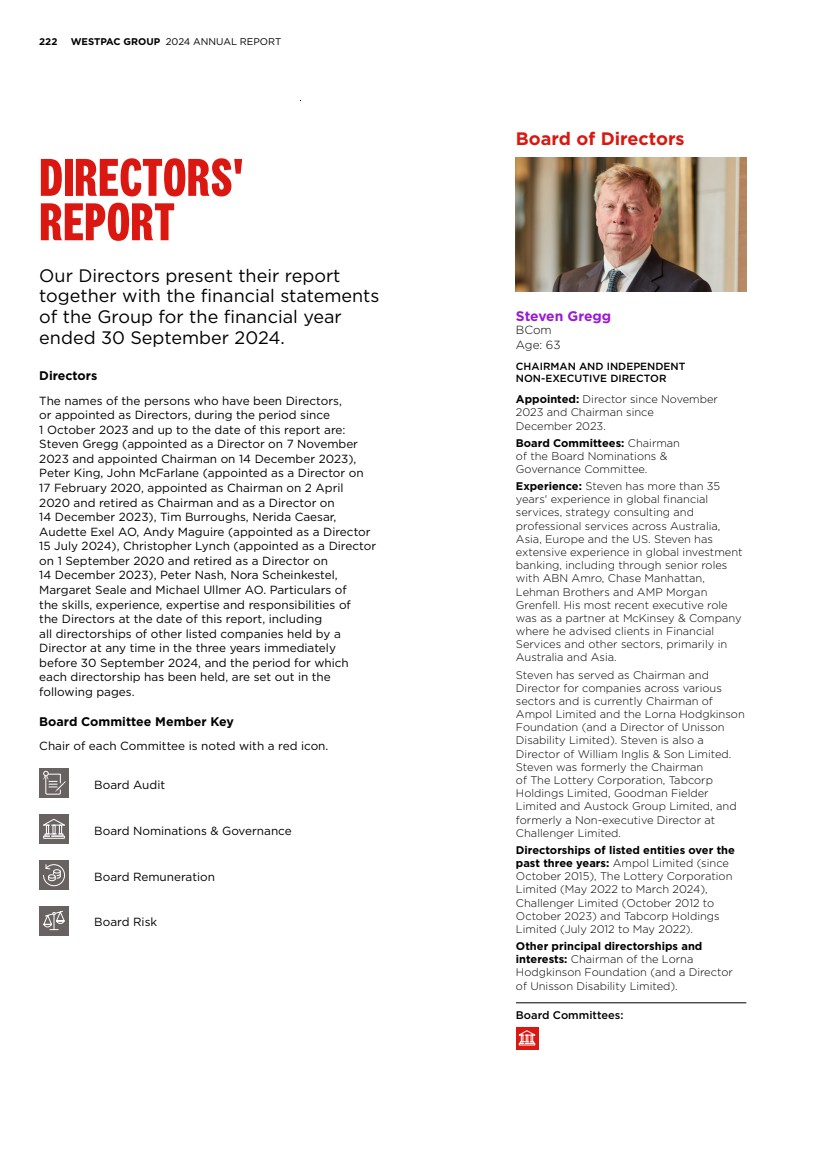
| FINANCIAL STATEMENTS EXHIBITS INDEX STRATEGIC REVIEW PERFORMANCE REVIEW SHAREHOLDER INFORMATION 223 Peter King BEc, FCA Age: 54 MANAGING DIRECTOR AND CHIEF EXECUTIVE OFFICER Appointed: Director since December 2019. Board Committees: Nil. Experience: Peter was appointed Westpac Group Chief Executive Officer in April 2020. Peter previously held this role on an acting basis between December 2019 and March 2020. Since joining the Westpac Group in 1994, Peter also held senior finance roles including Chief Financial Officer with responsibility for Westpac’s Finance, Tax, Treasury and Investor Relations functions. He has worked in senior finance roles across the Group including in Group Finance, Business and Consumer Banking, Business and Technology Services, Treasury and Financial Markets. Peter commenced his career at Deloitte Touche Tohmatsu. He has a Bachelor of Economics from Sydney University and completed the Advanced Management Programme at INSEAD. He is a Director of the Australian Banking Association (ABA) and also a Fellow of the Institute of Chartered Accountants. Directorships of listed entities over the past three years: Nil. Other principal directorships and interests: Director of the Australian Banking Association Incorporated, Director of the Institute of International Finance, Director of Financial Markets Foundation for Children and Director of Jawun. Board Committees: Nil. Tim Burroughs MA (Hons), B Psy (Hons), FCA, FAICD Age: 70 INDEPENDENT NON-EXECUTIVE DIRECTOR Appointed: Director since March 2023. Board Committees: Member of the Board Remuneration and Board Risk Committee. Experience: Tim has over 40 years' experience in finance, international banking and mergers and acquisitions. Tim was formerly Chairman of Investment Banking at Goldman Sachs Australia, where he worked for 11 years. Prior to this, Tim held senior positions at Merrill Lynch including Chairman of Mergers and Acquisitions. From 1993 to 1997, Tim was Principal at Centaurus Corporate Finance, a leading independent advisory firm. Over the course of his career, Tim has specialised in providing strategic financial advice to major corporations and their boards. He has advised on capital restructures, capital raisings and more than 100 public company acquisitions. Tim has an engineering degree from Cambridge University and is a Fellow of the Institute of Chartered Accountants. Tim has also studied and taught Psychology at Macquarie University. Directorships of listed entities over the past three years: Nil. Other principal directorships and interests: Panel member of Adara Partners (Australia) Pty Ltd. Board Committees: Nerida Caesar BCom, MBA, GAICD Age: 60 INDEPENDENT NON-EXECUTIVE DIRECTOR Appointed: Director since September 2017. Board Committees: Member of the Board Audit Committee. Experience: Nerida has over 38 years of broad ranging commercial and business management experience, with particular depth in technology-led businesses. Nerida was Group Managing Director and Chief Executive Officer, Australia and New Zealand, of Equifax (formerly the ASX-listed Veda Group Limited) and was also a former director of Genome One Pty Ltd and Stone and Chalk Limited. Before joining Equifax, Nerida held several senior management roles at Telstra, including Group Managing Director, Enterprise and Government and Group Managing Director, Wholesale. Nerida also held several executive and senior management positions with IBM within Australia and internationally, including as Vice President of IBM’s Intel Server Division for the Asia Pacific region. Directorships of listed entities over the past three years: Nil. Other principal directorships and interests: Co-Chair of Good2Give and its subsidiaries Workplace Giving Australia, Good2Give Research & Technology Fund and ShareGift. Director of NBN Co Ltd, Director of CreditorWatch and Director of O’Connell Street Associates Pty Ltd. Advisor to startups in the technology sector. Board Committees: |

| 224 WESTPAC GROUP 2024 ANNUAL REPORT DIRECTORS' REPORT Audette Exel AO BA, LLB (Hons) Age: 61 INDEPENDENT NON-EXECUTIVE DIRECTOR Appointed: Director since September 2021. Board Committees: Chair of the Board Risk Committee, Member of the Board Audit Committee. Experience: Audette has more than 35 years' experience in the global financial services markets as a senior executive, a non-executive director and as a social entrepreneur. Audette was formerly the Managing Director of BSX-listed Bermuda Commercial Bank (1993 to 1996), Chair of the Bermuda Stock Exchange (1995 to 1996) and a Director and Chair of the Investment Committee of the Bermuda Monetary Authority (1999 to 2005). She was a Director and Chair of the Investment Committee of Steamship Mutual (1999 to 2017). She began her career as a lawyer specialising in international finance. Audette is the founder and Chair of the Adara Group, a pioneering social enterprise which exists to support people living in extreme poverty and is the Chief Executive Officer of its corporate advice businesses. She is the recipient of numerous awards, including an honorary Order of Australia for service to humanity. Directorships of listed entities over the past three years: Nil. Other principal directorships and interests: Founder and Chair of Adara Development Australia, Adara Development USA, Adara Development Bermuda, Adara Development UK and Adara Development Uganda. CEO and Director of Adara Advisors Pty Limited and Adara Partners (Australia) Pty Limited. Board Committees: Andy Maguire BA, BAI Age: 58 INDEPENDENT NON-EXECUTIVE DIRECTOR Appointed: Director since July 2024. Board Committees: Nil. Experience: Andy has more than 35 years' experience in financial services and began his career in banking at Lloyds Banking Group. From 2014 to 2020, he was Group Chief Operating Officer at HSBC Holdings plc with responsibility for operations, technology, real estate, change and transformation and operational resilience. Previously he spent 16 years with the Boston Consulting Group, where he became Managing Partner of the London office covering the UK and Ireland, and a member of the firm’s global executive committee, as well as formerly serving as Global Head of Retail Banking. Andy is currently Chairman of UK banking software fintech Thought Machine Group. He is also an independent Non-executive Director of AIB Group plc, a financial services group operating predominantly in the Republic of Ireland and the UK. Andy previously held Chair positions with RegTech compliance company Napier AI and IT service management provider CX Holdings (Cennox Group). Directorships of listed entities over the past three years: AIB Group plc (since March 2021). Other principal directorships and interests: Chairman of Thought Machine Group. Board Committees: Nil. Peter Nash BCom, FCA, F Fin Age: 62 INDEPENDENT NON-EXECUTIVE DIRECTOR Appointed: Director since March 2018. Board Committees: Chair of the Board Audit Committee. Member of the Board Risk and Board Nominations & Governance Committees. Experience: Peter was formerly a Senior Partner with KPMG, having been admitted to the Australian partnership in 1993. He served as the National Chairman of KPMG Australia and served on KPMG’s Global and Regional Boards. His previous positions with KPMG included Regional Head of Audit for Asia Pacific, National Managing Partner for Audit in Australia and head of KPMG Financial Services. Peter has worked in geographically diverse and complex operating environments providing advice on a range of topics including business strategy, risk management, internal controls, business processes and regulatory change. He has also provided financial and commercial advice to many State and Federal Government businesses. Peter is a former member of the Business Council of Australia and its Economic and Regulatory Committee. Directorships of listed entities over the past three years: Johns Lyng Group Limited (Chairman since October 2017), Mirvac Group (since November 2018) and ASX Limited (since June 2019). Other principal directorships and interests: Director of the General Sir John Monash Foundation. Board Committees: |

| FINANCIAL STATEMENTS EXHIBITS INDEX STRATEGIC REVIEW PERFORMANCE REVIEW SHAREHOLDER INFORMATION 225 Nora Scheinkestel LLB (Hons), PhD, FAICD Age: 64 INDEPENDENT NON-EXECUTIVE DIRECTOR Appointed: Director since March 2021. Board Committees: Chair of the Board Remuneration Committee. Member of the Board Risk Committee. Experience: Nora is an experienced company director with a background as a senior banking executive in international and project financing. Nora has served as Chairman and Director in a range of companies across various industry sectors and in the public, private and government arena. Previously, Nora was a director of a number of other major ASX-listed companies, was formerly a member of the Takeovers Panel and was an Associate Professor in the Melbourne Business School at Melbourne University. In 2003, Nora was awarded a centenary medal for services to Australian society in business leadership. Directorships of listed entities over the past three years: Qantas Airways Limited (since March 2024), Brambles Limited (since June 2020), Origin Energy Limited (since March 2022), Telstra Corporation Limited (August 2010 to October 2022) and AusNet Services Ltd (November 2016 to February 2022). Other principal directorships and interests: Nil. Board Committees: Margaret (Margie) Seale BA, FAICD Age: 64 INDEPENDENT NON-EXECUTIVE DIRECTOR Appointed: Director since March 2019. Board Committees: Member of the Board Remuneration and Board Nominations & Governance Committees. Experience: Margie has more than 25 years' experience in senior executive roles in Australia and overseas, including in consumer goods, global publishing, sales and marketing, and the successful transition of traditional business models to digital environments. Prior to her non-executive career, Margie was the Managing Director of Random House Australia and New Zealand and President, Asia Development for Random House Inc. Margie was a Director and then Chair of Penguin Random House Australia Pty Limited, and a Director of Telstra Corporation Limited, Ramsay Health Care Limited, Bank of Queensland Limited and the Australian Publishers’ Association. She also served on the Boards of Chief Executive Women (chairing its Scholarship Committee), the Powerhouse Museum, and the Sydney Writers Festival. Directorships of listed entities over the past three years: Scentre Group Limited (since February 2016) and Telstra Corporation Limited (May 2012 to October 2021). Other principal directorships and interests: Director of Westpac Scholars Limited, Seaborn Broughton & Walford Pty Limited, Pinchgut Opera Limited and Jana Investment Advisers Pty Ltd. Board Committees: Michael Ullmer AO BSc, FAICD, FCA, SF Fin Age: 73 INDEPENDENT NON-EXECUTIVE DIRECTOR Appointed: Director since April 2023. Board Committees: Member of the Board Audit and Board Risk Committees. Experience: Michael has more than 40 years' experience in international banking, finance and professional services. Michael was formerly the Deputy Group Chief Executive Officer of the National Australia Bank (NAB) from 2007 until he retired from the Bank in August 2011. He joined NAB in 2004 as Finance Director and held a number of key positions including Chairman of the subsidiaries Great Western Bank (US) and JB Were. Prior to NAB, Michael was at Commonwealth Bank of Australia, initially as Group Chief Financial Officer and then Group Executive with responsibility for Institutional and Business Banking. Before that, he was a Partner at accounting firms KPMG (1982 to 1992) and Coopers & Lybrand (1992 to 1997). From a philanthropic perspective, throughout his career Michael has been heavily involved in supporting the Arts and Education sectors. Directorships of listed entities over the past three years: Lendlease Corporation Limited (Director since December 2011 and Chairman since November 2018) and Woolworths Limited (January 2012 to October 2021). Other principal directorships and interests: Member of the National Gallery of Victoria Foundation Board. Board Committees: |

| 226 WESTPAC GROUP 2024 ANNUAL REPORT DIRECTORS' REPORT Executive Team Peter King BEc, FCA Age: 54 MANAGING DIRECTOR AND CHIEF EXECUTIVE OFFICER, WESTPAC GROUP Peter was appointed Westpac Group Chief Executive Officer in April 2020, after holding the role on an acting basis between December 2019 and March 2020. Since joining Westpac in 1994, Peter has held senior finance roles including Chief Financial Officer with responsibility for Westpac’s Finance, Group Audit, Tax, Treasury and Investor Relations functions. He has worked in senior finance roles across the Group including in Group Finance, Business and Consumer Banking, Business and Technology Services, Treasury and Financial Markets. Peter commenced his career at Deloitte Touche Tohmatsu. He has a Bachelor of Economics from Sydney University and completed the Advanced Management Programme at INSEAD. Peter is a Director of the Australian Banking Association (ABA) and he is also a Fellow of the Institute of Chartered Accountants. Scott Collary BA, Humanities Age: 60 GROUP CHIEF INFORMATION OFFICER, TECHNOLOGY Scott was appointed as the Group’s Chief Information Officer in August 2023. Prior to this, he held the role of Group Executive, Customer Services & Technology after joining Westpac as Chief Operating Officer in November 2020. Scott has over 37 years' global banking experience, with a breadth of expertise across technology, operations, risk mitigation and commercial functions. Before joining Westpac, Scott was Chief Information & Operations Officer for North America Consumer, Business, Wealth and Global Asset Management Businesses at Bank of Montreal, Canada. Prior to that, Scott held senior executive positions at a number of multinational financial institutions including ANZ, Citibank, Fifth Third Bank and Bank of America. Scott holds a Bachelor’s Degree from the University of Maryland, College Park in the United States. Shannon Finch BA (Hons), LLB (Hons), FGIA Age: 54 GROUP GENERAL COUNSEL Shannon joined Westpac in November 2021 and leads Westpac’s legal function globally. Shannon has nearly 30 years legal experience including with the Commonwealth Attorney General’s Department Corporations Law Simplification Unit, Mallesons Stephen Jaques (now King & Wood Mallesons) in Canberra, London and Sydney, including as head of the Sydney office, and as a senior partner of global corporate law firm Jones Day. Shannon is a member of the Business Law Executive of the Law Council of Australia, the Advisory Committee to the Australian Law Reform Commission’s Review of the Legislative Framework for Corporations and Financial Services Regulation and the Australian Institute of Company Directors (AICD) Law Committee. Shannon has experience as a Non-executive Director, is a member of the AICD and Chief Executive Women, and is a Fellow of the Governance Institute of Australia. Shannon has a Bachelor of Arts (Hons) and Bachelor of Laws (Hons) from the Australian National University. Nell Hutton BCom (Hons), MPhil, GAICD Age: 48 CHIEF EXECUTIVE, WESTPAC INSTITUTIONAL BANK Nell was appointed Chief Executive, Westpac Institutional Bank in October 2023. The Institutional Bank provides a range of banking services to Commercial, Corporate, Institutional and Public Sector customers with connections to Australia, New Zealand, Asia, Europe and US markets. Nell first joined Westpac in February 2021 as Managing Director, Financial Markets, after 21 years at Goldman Sachs in London and Australia, most recently as Head of the Global Markets division in Australia and New Zealand. She holds a Master of Philosophy in Finance and Economics from Cambridge University and a Bachelor of Commerce (First Class Honours) from the University of Sydney. Nell is Deputy Chair of the Australian Financial Markets Association, and a member of the AICD and Chief Executive Women. |

| FINANCIAL STATEMENTS EXHIBITS INDEX STRATEGIC REVIEW PERFORMANCE REVIEW SHAREHOLDER INFORMATION 227 Carolyn McCann BBus (Com), BA, GradDipAppFin, GAICD Age: 52 GROUP EXECUTIVE, CUSTOMER & CORPORATE SERVICES Carolyn has been part of the Westpac Group Executive team since 2018 and is currently Group Executive, Customer & Corporate Services, responsible for operations and customer support services. The division brings together customer solutions, fraud prevention, customer operations, property, procurement and protective services, corporate affairs, HR and Finance Services. Carolyn has more than 27 years’ experience in financial services. Carolyn joined Westpac in 2013, as General Manager, Corporate Affairs and Sustainability. Prior to joining Westpac, Carolyn spent 13 years at Insurance Australia Group in various positions, including Group General Manager, Corporate Affairs and Investor Relations. She began her career in consulting in financial services. Carolyn has a Bachelor of Arts from The University of Queensland, a Bachelor of Business from Queensland University of Technology, and a Graduate Diploma of Applied Finance and Investment from the Securities Institute of Australia. She is a member of the Australian Institute of Company Directors (AICD) and Chief Executive Women (CEW). Catherine McGrath LLB/BCom Age: 53 CHIEF EXECUTIVE OFFICER, WESTPAC NEW ZEALAND Catherine was appointed Chief Executive Officer of Westpac New Zealand in November 2021. She has more than 25 years' experience working in financial services, spanning business, operational and people leadership roles to which she has driven significant people, structural, technology and strategic change. Prior to joining Westpac, Catherine led large-scale transformations at some of the world’s best known banks including Barclays Group and Lloyds TSB in the UK. This included various positions such as Head of Channels, Managing Director of Transaction Products and Payments, and Transaction Banking Director. Earlier in her career she worked at BNZ, ASB and the Prudential Group. Catherine was raised in New Zealand. She graduated from Canterbury University with a Bachelor of Law and a Bachelor of Commerce. Anthony Miller LLB (Hons), BA Age: 54 CHIEF EXECUTIVE, BUSINESS & WEALTH1 Anthony Miller first joined Westpac Group in 2020 and was appointed Chief Executive, Business & Wealth in August 2023. He has responsibility for providing a range of banking and wealth services for small to medium and commercial sized businesses, merchants, private wealth, sustainability, Westpac’s Pacific banking business and BT. Previously he was the Chief Executive of Westpac’s Institutional Bank. Before joining Westpac Group, Anthony was CEO of Australia & New Zealand and Co-Head of Investment Bank, Asia Pacific at Deutsche Bank from 2017. Prior to Deutsche Bank, Anthony was a partner at Goldman Sachs based in Hong Kong within the investment banking division and previously held several roles at Goldman Sachs in Australia and New Zealand having joined the organisation in 2001. Before joining Goldman Sachs, Anthony worked at Credit Suisse. Anthony holds a Bachelor of Law (Honours) from Queensland University of Technology, and Bachelor of Arts (Japanese Language, Modern Asian Studies) from Griffith University. Christine Parker BGDipBus (HRM) Age: 64 GROUP EXECUTIVE, HUMAN RESOURCES2 Christine was appointed to Westpac Group’s Executive Team in October 2011. Christine holds leadership responsibility for the Human Resources function across the Westpac Group. She is responsible for the Westpac Group’s human resources strategy and management, including reward and recognition, safety, learning and development, careers and talent, employee relations and employment policy. Christine is also responsible for the office of the Financial Accountability Regime (FAR) and supports the CEO and Board on culture and conduct. Since joining Westpac in 2007, Christine has held a variety of senior leadership roles including Group General Manager, Human Resources and General Manager, Human Resources for Westpac New Zealand Limited. Before joining Westpac, Christine held senior HR roles in a number of high profile organisations and across a range of industries, including Carter Holt Harvey and Restaurant Brands New Zealand. Christine is currently Chair of the St.George Foundation and a Director of Westpac New Zealand. Previously, Christine was a Director of Orygen Youth Mental Health Foundation and Women’s Community Shelters and a member of the Veterans’ Employment Industry Advisory Committee. 1. On 9 September 2024, Westpac announced that Anthony Miller will succeed Peter King as CEO and Managing Director. Mr Miller's appointment will commence on 16 December 2024 following Mr King's retirement as CEO and Managing Director. Commencing on 5 November 2024, Peter Herbert, the Chief Operating Officer, Business & Wealth, will become the Acting Chief Executive, Business & Wealth. 2. On 5 November 2024, Westpac announced that Christine Parker will retire as Group Executive, Human Resources. Ms Parker will remain in the role while a search is undertaken for a successor. |

| 228 WESTPAC GROUP 2024 ANNUAL REPORT DIRECTORS' REPORT Michael Rowland B.Comm, FCA Age: 63 CHIEF FINANCIAL OFFICER Michael joined Westpac Group as Chief Financial Officer in September 2020. He is responsible for Westpac’s Finance, Group Audit, Investor Relations, Tax, Treasury, Group Business Controls and Management and Corporate and Business Development functions. Before joining Westpac, Michael was a Partner in Management Consulting at KPMG. Before that he held a number of senior executive positions at ANZ from 1999 to 2013. These included CFO Institutional Banking, CFO Wealth, CFO New Zealand, CFO Personal Financial Services, and business leadership roles as CEO Pacific, Managing Director Mortgages and General Manager, Transformation. Michael commenced his career at KPMG, where he was promoted to become a Tax Partner in 1993. Michael holds a Bachelor of Commerce from the University of Melbourne and a Graduate Diploma of Taxation Law from Monash University. He is a Fellow of the Institute of Chartered Accountants in Australia and New Zealand. Jason Yetton B.Comm (Finance & Mktg), GradDipAppFin Age: 53 CHIEF EXECUTIVE, CONSUMER Jason was appointed Chief Executive, Consumer in August 2023. The Consumer segment provides a full range of banking products and services including mortgages, credit cards, personal loans and deposits to customers in Australia. Previously he led the Group’s Specialist Businesses Division overseeing a number of investments and business divestments to create a simpler, stronger bank. He has also held a number of Group Executive roles with Westpac at different times for more than 20 years including Group Strategy, Westpac Retail and Business Banking, and senior positions in BT Financial Group. Outside of Westpac, Jason has been Chief Executive Officer NewCo, CBA, where he was appointed to lead the demerger of its wealth management and mortgage broking businesses. Prior to that, he was Chief Executive Officer and Managing Director, SocietyOne, an early financial services disrupter and consumer finance marketplace lender. Jason holds a Bachelor of Commerce (Marketing and Finance) from the University of New South Wales and a Graduate Diploma in Applied Finance and Investment from the Securities Institute of Australia. Ryan Zanin CFA Age: 62 CHIEF RISK OFFICER Ryan was appointed Chief Risk Officer in April 2022. Ryan is responsible for risk management across the Group, which includes credit risk, operational risk, financial crime, compliance and conduct. Ryan has over 30 years experience in financial services specialising in risk management. Prior to joining Westpac Group, Ryan was Executive Vice President and Chief Risk Officer at Fannie Mae overseeing the company’s governance and strategy for global risk management. Prior to Fannie Mae, Ryan held senior positions at GE Capital, Wells Fargo & Company and Deutsche Bank. Ryan has also been on the Board of Fannie Mae and General Electric Capital Corporation. A Canadian, Ryan began his career at the Bank of Montreal before taking on various roles across Citibank and Bankers Trust Company. Ryan is a Chartered Financial Analyst. Tim Hartin LLB (Hons.) Age: 49 COMPANY SECRETARY Tim was appointed Company Secretary in November 2011. Before that appointment, Tim was Head of Legal – Risk Management & Workouts, Counsel & Secretariat and prior to that, he was Counsel, Corporate Core. Before joining Westpac in 2006, Tim was a Consultant with Gilbert + Tobin, where he provided corporate advisory services to ASX-listed companies. Tim was previously a lawyer at Henderson Boyd Jackson W.S. in Scotland and in London in Herbert Smith’s corporate and corporate finance division. |

| FINANCIAL STATEMENTS EXHIBITS INDEX STRATEGIC REVIEW PERFORMANCE REVIEW SHAREHOLDER INFORMATION 229 Executive Team POSITION YEAR JOINED GROUP YEAR APPOINTED TO POSITION Peter King Managing Director & Chief Executive Officer 1994 2020 Scott Collary Group Chief Information Officer, Technology 2020 2023 Shannon Finch Group General Counsel 2021 2021 Nell Hutton Chief Executive, Westpac Institutional Bank 2021 2023 Carolyn McCann Group Executive, Customer & Corporate Services 2013 2023 Catherine McGrath Chief Executive Officer, Westpac New Zealand 2021 2021 Anthony Miller Chief Executive, Business & Wealth 2020 2023 Christine Parker Group Executive, Human Resources 2007 2011 Michael Rowland Chief Financial Officer 2020 2020 Jason Yetton Chief Executive, Consumer 2020 2023 Ryan Zanin Chief Risk Officer 2022 2022 |
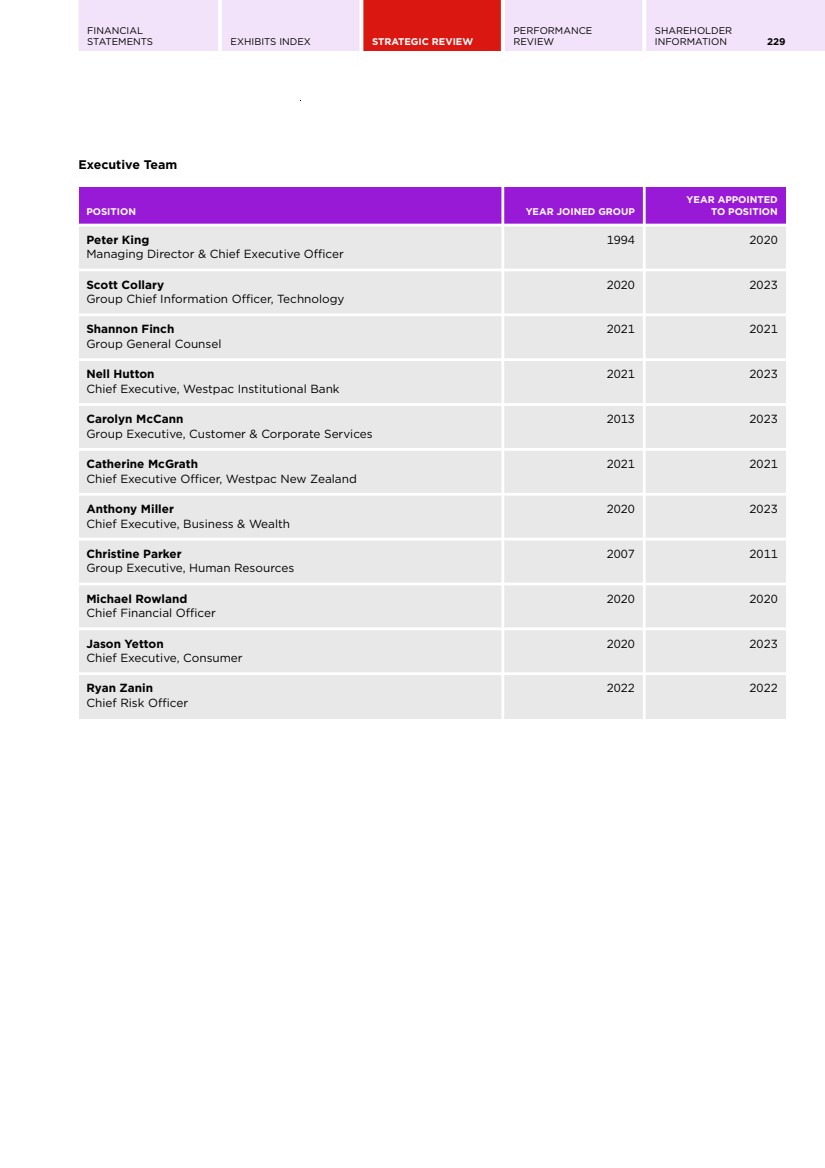
| 230 WESTPAC GROUP 2024 ANNUAL REPORT DIRECTORS' REPORT Operating and financial review Principal activities The principal activities of the Group during the financial year ended 30 September 2024 were the provision of financial services including lending, deposit taking, payments services, investment platforms, leasing finance, general finance, interest rate risk management and foreign exchange services. There have been no significant changes in the nature of the principal activities of the Group during 2024. Operations and financial performance Net profit for 2024 was $6,990 million, a decrease of 3% compared to 2023, which reduced basic earnings per share by 2%. The decrease in net profit reflects lower income and higher expenses partly offset by a decrease in credit impairment charges. The following is a summary of the movements in major line items in net profit for 2024 compared to 2023. Net interest income increased by $436 million or 2% driven by growth in average interest earning assets of 3%, which was tempered by a 2 basis point contraction in net interest margin. Key movements in net interest margin included: • Lower spreads on loans mainly reflecting competition for mortgages; • Benefits from the investment of capital in a rising rate environment; and • The impact of higher unrealised losses of $171 million (2023: $113 million) on fair value movements of non-hedge accounted economic hedges. Non-interest income was $493 million or 15% lower. The key movements included: • Lower contribution from our wealth management business following business sales in 2023, with businesses sold contributing $140 million in 2023; • No gains on sales of controlled entities and other businesses, compared to gains of $268 million in 2023; and • Adverse market movements impacted the value of financial instruments measured at fair value in 2024 by $24 million, compared to a gain of $78 million in 2023. Operating expenses were $252 million or 2% higher. The key movements included: • A $279 million increase in amortisation and impairment of software assets from projects completed; and • A $136 million increase in technology services expenses from inflationary pressure and the impact of our UNITE program; partly offset by • Reduced employee costs of $199 million mainly from lower restructuring costs. Credit impairment charges of $537 million represented 7 basis points of average gross loans compared to 9 basis points of average gross loans in 2023. The decrease primarily reflected lower collectively assessed provisions. The effective tax rate was 30.84% in 2024 was slightly higher than the Australian corporate tax rate of 30%, due to certain non tax deductible expenses. A review of the operations of the Group and its segments and their results for the financial year ended 30 September 2024 is set out in the sections Group performance (pages 276-301) and Segment reporting (pages 302-313), which form part of this Directors' report. Further information about our financial position and financial results is included in the Financial Statements (pages 2- 135) which form part of this Directors' report. Dividends Westpac has announced a final ordinary dividend of 76 cents per Westpac ordinary share, totalling approximately $2,615 million. The dividend will be fully franked and will be paid on 19 December 2024. In 2024, an interim ordinary dividend of 75 cents and a special dividend of 15 cents per Westpac ordinary share totalling $3,125 million was paid as a fully franked dividend on 25 June 2024 (2023: 70 cents totalling to $2,456 million was paid as interim ordinary dividend). For the year ended 30 September 2023, a fully franked final dividend of 72 cents per ordinary share totalling $2,527 million was paid on 19 December 2023. |
| FINANCIAL STATEMENTS EXHIBITS INDEX STRATEGIC REVIEW PERFORMANCE REVIEW SHAREHOLDER INFORMATION 231 Significant changes in state of affairs and events during and since the end of the 2024 financial year Significant changes in the state of affairs of the Group during the financial year ended 30 September 2024, or that have occurred since that date, were: • On 14 December 2023, at the conclusion of the AGM, Steven Gregg succeeded John McFarlane as Chairman of the Board following Mr McFarlane’s retirement. • The announcement that Anthony Miller will succeed Peter King as CEO and Managing Director, effective following Mr King’s retirement as CEO and Managing Director. • The commencement of UNITE, a multi-year programme of work to accelerate our technology and business simplification. • The announcement by APRA on 19 July 2024 of its decision to reduce Westpac’s total operational risk capital overlay from $1 billion to $500 million. • The delivery of the CORE program and completion of the Integrated Plan required by the 2020 enforceable undertaking with APRA in relation to our risk governance remediation, and supporting the strengthening of our risk governance, accountability, and culture. We are continuing to focus on the sustainability and effectiveness of the uplift delivered by the Integrated Plan through a transition phase. For a discussion of these changes and other significant developments, please refer to Significant developments (pages 263-265) which forms part of this Directors' report. The Directors are not aware of any other matter or circumstance that has occurred since 30 September 2024 that has significantly affected or may significantly affect the operations of the Group, the results of these operations or the state of affairs of the Group in subsequent financial years. Business strategies, developments and expected results Our business strategies, prospects and likely major developments in the Group’s operations in future financial years and the expected results of those operations are discussed in the Strategic Review (pages 156- 269) and in Significant developments (pages 263-265) which forms part of this Directors' report. Further information on our business strategies and prospects for the future financial years and likely developments in our operations and the expected results of operations have not been included in this report because the Directors believe it would be likely to result in unreasonable prejudice to Westpac. Risks to our financial performance, position and our operations Our financial position, our future financial results, our operations and the success of our strategy are subject to a range of risks. These risks are set out and discussed in the Risk Management section (pages 188-195) which forms part of the Directors' report. For additional information on risks relating to Westpac, refer to "2024 Risk Factors" as disclosed on the ASX on the same date as this report. |
| 232 WESTPAC GROUP 2024 ANNUAL REPORT DIRECTORS' REPORT Directors’ interests Directors’ interests in securities The following particulars for each Director are set out in the Remuneration Report (pages 236- 261) of the Directors’ report for the year ended 30 September 2024 and/or in the table below: • Their relevant interests in our shares or the shares of any of our related bodies corporate; • Their relevant interests in debentures of, or interests in, a registered scheme made available by us or any of our related bodies corporate; • Their rights or options over shares in, debentures of, or interests in, any registered scheme made available by us or any of our related bodies corporate; and • Any contracts: – To which the Director is a party or under which they are entitled to a benefit; and – That confer a right to call for or deliver shares in, debentures of, or interests in, a registered scheme made available by us or any of our related bodies corporate. Directors’ interests in Westpac and related bodies corporate as at 3 November 2024 Number of Relevant Interests in Westpac Ordinary Shares Number of Westpac Share Rights Westpac Banking Corporation Current Directors Steven Gregg 75,208 - Peter King 262,333a 541,684b Tim Burroughs 67,302 - Nerida Caesar 13,583 - Audette Exel 11,952 - Andy Maguire - - Peter Nash 15,260 - Nora Scheinkestel 17,225 Margaret Sealec 10,438 - Michael Ullmerd 12,570 - Former Directors John McFarlanee 45,000 Chris Lynchf 13,090 - a. Peter King’s interest in Westpac ordinary shares includes 24,403 restricted shares held under the Equity Incentive Plan. b. Share rights issued under the Long Term Variable Reward Plan and Equity Incentive Plan. c. Margaret Seale and her related bodies corporate also hold relevant interests in 100 Westpac Capital Notes 7 (ASX: WBCPJ). d. Michael Ullmer and his related bodies corporate also hold relevant interests in 800 Westpac Capital Notes 5 (ASX:WBCPH), 300 Westpac Capital Notes 9 (WBCPL) and 1,000 Westpac Subordinated Notes. e. Figure displayed is as at John McFarlane’s retirement date of 14 December 2023. f. Figure displayed is as at Chris Lynch’s retirement date of 14 December 2023. In addition, Chris Lynch and his related bodies corporate also held relevant interests in 1,137 Westpac Capital Notes 5 (ASX:WBCPH) as at his retirement date of 14 December 2023. Note: Certain subsidiaries of Westpac offer a range of registered schemes. The Directors may from time to time invest in these schemes and are required to provide a statement to the ASX when any of their interests in these schemes change. ASIC has exempted each Director from the obligation to notify the ASX of a relevant interest in a security that is an interest in BT Cash Management Trust (ARSN 087 531 539), BT Premium Cash Fund (ARSN 089 299 730), BT Investor Choice Cash Management Trust (formerly Westpac Cash Management Trust) (ARSN 088 187 928) or Advance Cash Multi-Blend Fund (ARSN 094 113 050). |
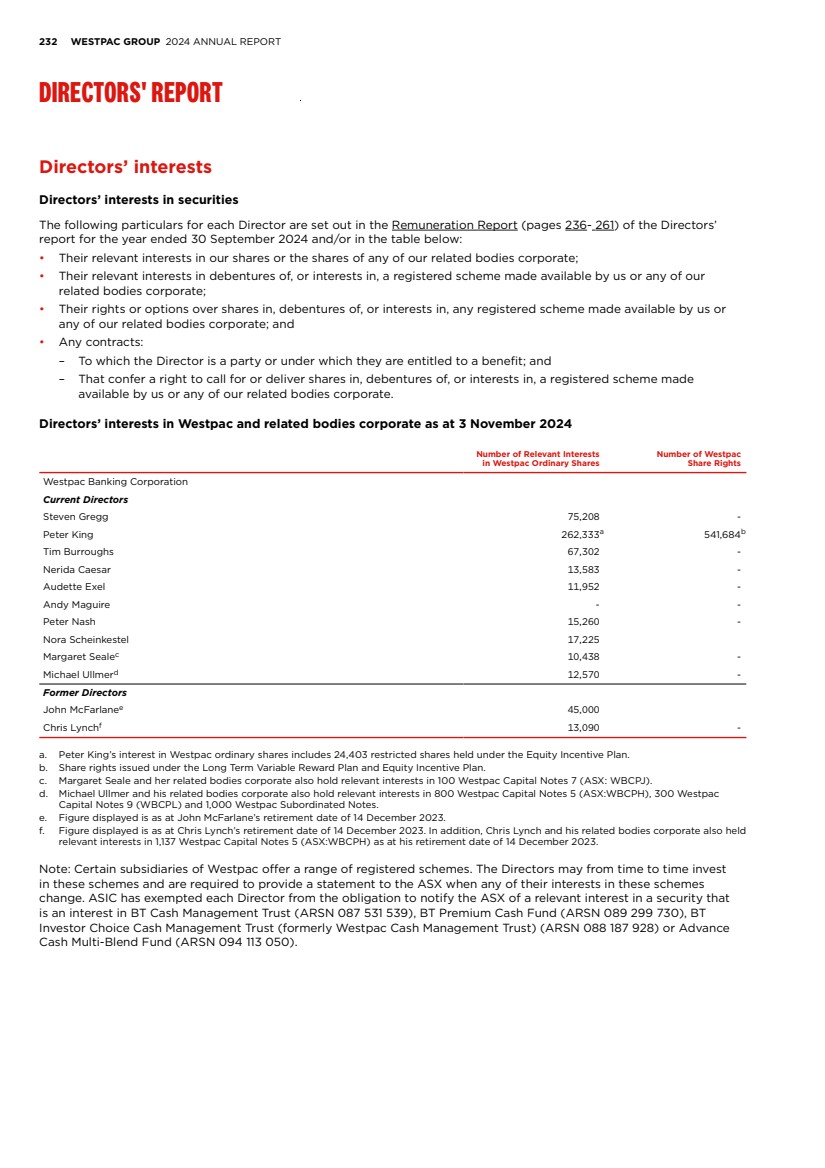
| FINANCIAL STATEMENTS EXHIBITS INDEX STRATEGIC REVIEW PERFORMANCE REVIEW SHAREHOLDER INFORMATION 233 Indemnities and insurance Under the Westpac Constitution, unless it is forbidden or would be made void by statute, we indemnify any person who is or has been a Director or Company Secretary of Westpac and of each of our related bodies corporate (except related bodies corporate listed on a recognised stock exchange), any person who is or has been an employee of Westpac or our subsidiaries (except subsidiaries listed on a recognised stock exchange), and any person who is or has been acting as a responsible manager under the terms of an Australian Financial Services Licence of any of Westpac’s wholly-owned subsidiaries against every liability (other than a liability for legal costs) incurred by each such person in their capacity as director, company secretary, employee or responsible manager, as the case may be; and all legal costs incurred in defending or resisting (or otherwise in connection with) proceedings, whether civil or criminal or of an administrative or investigatory nature, in which the person becomes involved because of that capacity. Each of the Directors named in this Directors’ report and the Company Secretary of Westpac has the benefit of this indemnity. Consistent with shareholder approval at the 2000 Annual General Meeting, Westpac has entered into a Deed of Access and Indemnity with each of the Directors, which includes indemnification in identical terms to that provided in the Westpac Constitution. Westpac also executed a deed poll in September 2009 providing indemnification equivalent to that provided under the Westpac Constitution to individuals who are or have been acting as: • statutory officers (other than as a director) of Westpac; • directors and other statutory officers of wholly-owned subsidiaries of Westpac; and • directors and statutory officers of other nominated companies as approved by Westpac in accordance with the terms of the deed poll and Westpac’s Contractual Indemnity Policy. Some employees of Westpac’s related bodies corporate and responsible managers of Westpac and its related bodies corporate are also currently covered by a deed poll that was executed in November 2004, which is on similar terms to the September 2009 deed poll. The Westpac Constitution also permits us, to the extent permitted by law, to pay or agree to pay premiums for contracts insuring any person who is or has been a Director or Company Secretary of Westpac or any of its related bodies corporate against liability incurred by that person in that capacity, including a liability for legal costs, unless: • we are forbidden by statute to pay or agree to pay the premium; or • the contract would, if we paid the premium, be made void by statute. Under the September 2009 deed poll, Westpac also agrees to provide directors’ and officers’ liability insurance to Directors of Westpac and Directors of Westpac’s wholly-owned subsidiaries (except wholly-owned subsidiaries listed on a recognised stock exchange). For the year ended 30 September 2024, the Group has insurance cover which, in certain circumstances, will provide reimbursement for amounts which we have to pay under the indemnities set out above. That cover is subject to the terms and conditions of the relevant insurance, including but not limited to the limit of indemnity provided by the insurance. The insurance policies prohibit disclosure of the premium payable and the nature of the liabilities covered. Share rights outstanding As at the date of this report there are 4,291,291 share rights outstanding in relation to Westpac ordinary shares, held by 99 holders. The latest dates for exercise of the share rights range between 17 December 2024 and 1 October 2038. Holders of outstanding share rights in relation to Westpac ordinary shares do not have any rights under the share rights to participate in any share issue or interest of Westpac or any other body corporate. Proceedings on behalf of Westpac No application has been made and no proceedings have been brought or intervened in, on behalf of Westpac under section 237 of the Corporations Act. |
| 234 WESTPAC GROUP 2024 ANNUAL REPORT DIRECTORS' REPORT Environmental disclosure The Westpac Group’s environmental disclosure is summarised in this Annual Report and detailed in our 2024 Climate Report and our 2024 Sustainability Index and Datasheet. Additional disclosure on environmental matters includes our Climate Change Position Statement and Action Plan and our Natural Capital Position Statement, which looks at how we are considering the risks and opportunities associated with climate and nature. We participate in a number of sustainability initiatives and standards including: the Global Reporting Initiative (GRI), the Equator Principles, the Principles for Responsible Banking, the Net-Zero Banking Alliance, the United Nations Global Compact, the RE100, the Sustainability Accounting Standards Board (SASB), International Sustainability Standards Board (ISSB) Sustainability Disclosure Standards, the Taskforce on Nature-related Financial Disclosures (TNFD) and the Australian Government Climate Active Carbon Neutral Standard for Organisations. In Australia we report our scope 1 and 2 greenhouse gas emissions, energy consumption and production under the National Greenhouse and Energy Reporting (NGER) scheme for the period 1 July through 30 June each year. The Financial Markets Conduct Act 2013 (New Zealand) sets disclosure requirements for 'climate reporting entities', including large, registered banks and large listed issuers, for accounting periods commencing from 1 January 2023. The External Reporting Board (XRB) published Aotearoa New Zealand Climate Standards ('NZCS') for mandatory climate-related disclosures. Westpac is a climate reporting entity and is therefore required to prepare climate-related disclosures that comply with NZCS. It has relied on the exemptions in clause 8 and clause 10 of the Financial Markets Conduct (Climate-related Disclosures for Foreign Listed Issuers) Exemption Notice 2024. These exemptions allow Westpac to produce a climate report only for the Group's New Zealand business other than Westpac New Zealand Limited and BT Funds Management (NZ) Limited, each of which are climate reporting entities and prepare their own climate-related disclosures. Westpac Group will also need to comply with the new climate related disclosure standard AASB S2 by FY26 and work is underway to meet the new requirements. We are not aware of the Group incurring any material liability (including for rectification costs) under any environmental legislation. Westpac’s environment disclosures are available in the Creating value for the environment (pages 182-185) section of this Annual Report, and in our 2024 Climate Report. Westpac's climate-related disclosures for its New Zealand business for the year ended 30 September 2024 will be published by 31 January 2025 and, when published, will be available at https://www.westpac.co.nz/about-us/legal-information-privacy/disclosure-statement/. The climate reports prepared by Westpac New Zealand Limited and BT Funds Management (NZ) Limited also contain information about the climate-related risks and opportunities of the Westpac Group's New Zealand businesses. The Climate Statements for BT Funds Management (NZ) Limited's three schemes for the scheme year ended 31 March 2024 are available at https://www.westpac.co.nz/kiwisaver-investments/investor-document-centre/filter?tags%5b%5d=climate-statements. Westpac New Zealand Limited's Climate Report for the year ended30 September 2024 will be published by 31 January 2025 and, when published, will be available at https:// www.westpac.co.nz/about-us/legal-information-privacy/disclosure-statements/. Human rights disclosure Our Human Rights Position Statement and 2026 Action Plan sets out Westpac Group's commitments and approach to respecting and advancing human rights. It outlines the actions we are taking across our roles as a financial services provider, lender, purchaser of goods and services, employer, and supporter of communities, as well as integrating our position on child safeguarding. Under the Modern Slavery Act 2018 (Cth) and Modern Slavery Act 2015 (UK), Westpac is required to prepare an annual statement describing the risks of modern slavery across our operations and supply chain, and the actions taken to address the risks. Westpac published a joint statement for FY23 on behalf of itself and certain reporting entities that addressed the requirements of both Acts. For more information, see the Westpac Group’s 2023 Modern Slavery Statement, published in March 2024. We will release the Group’s FY24 Modern Slavery Statement in March 2025. Rounding of amounts Westpac is an entity to which ASIC Corporations Instrument 2016/191 dated 24 March 2016, relating to the rounding of amounts in directors’ reports and financial reports, applies. Pursuant to this Instrument, amounts in this Directors’ report and the accompanying financial report have been rounded to the nearest million dollars, unless indicated to the contrary. |
| FINANCIAL STATEMENTS EXHIBITS INDEX STRATEGIC REVIEW PERFORMANCE REVIEW SHAREHOLDER INFORMATION 235 Political engagement In line with Westpac policy, no cash donations were made to political parties during the financial year ended 30 September 2024. Westpac does participate in political engagement activities assessed as directly relevant to the bank and or the banking industry. Such activities include business observer programs attached to annual party conferences, policy dialogue forums and other political engagement activities, such as speeches and events with industry participants. Westpac attends these events to put forward its position on policy matters of importance to our customers, suppliers, shareholders and our employees. Political expenditure on these events in Australia for the financial year ended 30 September 2024 was $172,513. In New Zealand, political expenditure for the financial year ended 30 September 2024 was NZ$ 3,000. Directors’ meetings The Westpac Banking Corporation Board met 15 times during the financial year ended 30 September 2024. In addition, Directors attended Board strategy sessions and special purpose committee meetings during the financial year. The following table includes: • Names of the Directors that held office at any time during, or since the end of, the financial year. • The number of Board and Board Committee meetings held during the financial year that each Director, as a member of the Board or Board Committee, was eligible to attend, and the number of meetings attended by each Director. The table excludes the attendance of those Directors who attended meetings of Board Committees of which they are not a member. Board Committees Scheduled meetings Unscheduled meetingsa Risk Audit Remuneration Nominations & Governance Heldb Attendedc Heldb Attendedc Heldb Attendedc Heldb Attendedc Heldb Attendedc Heldb Attendedc Director Steven Greggd 8 7 5 5 n/a n/a n/a n/a n/a n/a 3 3 Peter King 10 10 3 3 n/a n/a n/a n/a n/a n/a n/a n/a Tim Burroughse 10 10 5 5 8 8 n/a n/a 4 4 n/a n/a Nerida Caesarf 10 10 5 5 n/a n/a 5 5 n/a n/a n/a n/a Audette Exelg 10 10 5 5 8 8 5 5 n/a n/a n/a n/a Andy Maguireh 2 1 4 4 n/a n/a n/a n/a n/a n/a n/a n/a Peter Nashi 10 10 5 5 8 8 5 5 n/a n/a 4 4 Nora Scheinkestelj 10 9 5 5 8 7 n/a n/a 8 7 n/a n/a Margaret Sealek 10 10 5 5 n/a n/a n/a n/a 8 8 4 4 Michael Ullmerl 10 10 5 5 8 8 5 5 n/a n/a n/a n/a Former Director John McFarlanem 4 4 0 0 n/a n/a n/a n/a n/a n/a 1 1 Chris Lynchm 4 4 0 0 n/a n/a 1 1 4 4 n/a n/a a. Out of cycle meetings normally called for a special purpose that do not form part of the Board’s forward agenda. b. The number of meetings held during the time the Director was a member of the Board or Board Committee and that the Director was eligible to attend as a member. c. The number of Board Committee meetings that the Director attended as a member. d. Appointed as a Director on 7 November 2023 and appointed Chairman of the Board and Chair of the Board Nominations & Governance Committee following completion of the 2023 Annual General Meeting on 14 December 2023. e. Member of the Board Risk Committee. Appointed as a member of the Board Remuneration Committee with the appointment taking effect following completion of the 2023 Annual General Meeting on 14 December 2023. f. Member of the Board Audit Committee. g. Chair of the Board Risk Committee and member of the Board Audit Committee. h. Appointed as a Director on 15 July 2024. i. Chair of the Board Audit Committee and member of the Board Risk Committee and Board Nominations & Governance Committee. j. Chair of the Board Remuneration Committee and member of the Board Risk Committee. k. Member of the Board Nominations & Governance Committee and Board Remuneration Committee. l. Member of the Board Audit Committee and the Board Risk Committee. m. Retired as a Director following the completion of the 2023 Annual General Meeting on 14 December 2023. |
| 236 WESTPAC GROUP 2024 ANNUAL REPORT DIRECTORS' REPORT Remuneration Report LETTER FROM THE CHAIR of the Board Remuneration Committee Dear shareholders, Group performance In 2024, Westpac made good progress on all our key priorities. We delivered against our financial targets in a competitive market while maintaining a strong balance sheet and capital position. Our investment in customer experience and our focus on supporting customers continued. This was reflected in above system household and business deposit growth and improved customer advocacy metrics, albeit not at the level we aspire to. We achieved growth in our key markets while also managing margins with net interest margin (NIM), excluding Notable Items, down 1 basis point and above target. Expenses were higher than target, mostly due to the wind down of the RAMS business and technology costs. The commencement of the UNITE program, our business led technology simplification program, will be critical in reducing the cost of complexity across the Group and, in turn, reducing the cost to income gap to peers over time. Impairments were lower than target due to better than expected key economic indicators and outcomes. Credit quality remained resilient, despite a rise in stressed exposures. We delivered value to shareholders with dividends at the upper end of the payout range, the announcement of $2 billion in on market share buybacks and a 1H24 special dividend of 15 cents per share. Importantly, we delivered a significant uplift in risk management, completing the three year Customer Outcomes and Risk Excellence (CORE) program. Westpac delivered all activities under the CORE program within the timeframes committed to. All activities and deliverables were assessed and independently reviewed and confirmed as complete by Promontory Australia. In recognition of this progress, APRA reduced the operational risk capital overlay by $500 million. We continue this year in a transition phase with independent reviews by Promontory Australia, to ensure that our risk management capabilities are embedded as part of business as usual. This work is on track to complete by end of calendar year 2024. Executive performance and remuneration outcomes Having introduced our new remuneration framework for 2024, including the addition of a restricted rights component in the Long Term Variable Reward (LTVR) plan, the main focus for the Remuneration Committee and Board this year was on assessing performance to determine Short Term Variable Reward (STVR) outcomes. The 2024 STVR Scorecard focused on five key priority areas: Financial performance, Risk management, Strategic execution, Serving customers and People. Details of the assessment are shown in Section 3.3. The Board assessed Group performance at 101% of target and the CEO's STVR outcome at 104% of his target opportunity and 83% of maximum opportunity. This was in recognition of Peter King's leadership in completing the CORE program and setting up the organisation to execute the UNITE program. His STVR will be paid 50% in cash and 50% will be deferred over one and two years. For Group Executives, STVR outcomes ranged from 87% to 110% of target opportunity or 70% to 88% of maximum opportunity, reflecting the differentiation of performance outcomes for their respective divisions and individual performance, including assessments of leadership behaviours. The 2021 LTVR was tested against a relative TSR measure compared to our financial services comparator group. The Group delivered a TSR of 113% over the 4 year performance period resulting in a 50th percentile ranking relative to the comparator group. As a result, the CEO and all eligible Group Executives received 50% of their award. It is pleasing that improved performance has led to a return to vesting of the LTVR. The Board granted the incoming CEO and all Group Executives their allocation of 2025 LTVR restricted rights under the revised LTVR plan, having completed the pre-grant assessment and assessed our risk culture maturity as having been maintained. CEO transition In September 2024, we announced that Anthony Miller, currently Chief Executive, Business & Wealth, will be appointed as the Managing Director & CEO commencing 16 December 2024. Anthony will succeed Peter King who will retire after a 30 year career at Westpac, including five years as CEO. Anthony has a vision to return Westpac to a position of leadership and build on the foundational work of the past five years. As an internal appointment Anthony knows what needs to be done and will move at pace, ensuring a seamless transition. Anthony's remuneration package will be the same as the current CEO's remuneration package. Upon retirement, Peter will receive remuneration in line with his contract and relevant variable reward plans. Please refer to the ASX release dated 9 September 2024 for further details. The 2025 Remuneration Report will contain further details of Anthony's and Peter's remuneration for 2025. |
| FINANCIAL STATEMENTS EXHIBITS INDEX STRATEGIC REVIEW PERFORMANCE REVIEW SHAREHOLDER INFORMATION 237 Remuneration for our people Risk and remuneration In 2025, we will increase the capped variable reward opportunity for home finance manager roles from 50% to 80% of fixed pay in response to the change made by CBA and NAB. We need to remain competitive in our markets, attract talent and reward for outperformance. Before making this decision, we carefully considered our risk and conduct management maturity and controls framework. Good risk management, including embedded controls and processes to manage conduct risk, is central to our culture and a fundamental consideration in how we structure and manage remuneration and reward. We continue to work hard to ensure that our controls are appropriate, and that we can manage and keep our people and customers safe. We continue to look for ways to reinforce our risk, compliance and conduct expectations. This year, while ensuring that appropriate action is taken when required to adjust remuneration for adverse outcomes, we looked to enhance how we recognise great risk behaviours. We provide a platform for our people to recognise their peers when they make a positive impact on Westpac and our customers through their risk management and risk behaviours. Our people recorded nearly 115,000 recognition actions this year and Board Directors also personally recognised over 60 people. Enterprise Agreement We were pleased to conclude a new Enterprise Agreement with our people this year, subject to Fair Work Commission approval. We listened to and consulted with our people to put together a comprehensive range of benefits and arrangements that builds on our current Enterprise Agreement. 87% of employees who voted supported the proposal. We thank the Finance Sector Union for their constructive engagement. Gender pay We are committed to paying our people fairly and equitably. Our overall average difference (by level, weighted by number of people) for gender pay equity is less than 2%. Where we identify a pay difference that cannot be explained by individual skills, experience or performance, we take action. We have more work to do on our gender pay gap. As reported to the Workplace Gender Equality Agency, we have a median gender pay gap of 29.3%. This is the difference between the median total remuneration of men compared to that of women. We have strategies to increase women's representation in key cohorts and we have set clear objectives to reduce the gap. For more information on this gap and our strategies, please refer to the 'Creating value for our people' section of the Annual Report. Looking ahead 2025 LTVR performance rights comparator group During the year, we reviewed the relative TSR comparator group for the LTVR performance rights taking into account market practice, external feedback and our assessment of the comparator group’s continued relevance. We decided to make two changes for the 2025 LTVR performance rights. First, we will reduce the current comparator group to a streamlined group of five companies that are focused on the banking market in Australia. The five companies in the banking comparator group will be ANZ, Bank of Queensland, Bendigo & Adelaide Bank, CBA and NAB. Secondly, we will introduce an additional general ASX comparator group comprising the 20 largest companies on the ASX by market capitalisation, excluding resource companies, to reflect a broader benchmark of performance. The companies will be determined at the start of each performance period. The LTVR performance rights will be tested against the two comparator groups, equally weighted and tested independently. 2025 total target remuneration The Board reviewed total target remuneration packages for the Executive Team against market benchmarks. Reflecting market comparisons and role accountabilities, we awarded increases for four Group Executives for 2025, ranging from approximately 2% to 10%. Further information will be provided in the 2025 Remuneration Report. We hope you find the report informative and always welcome your feedback. Nora Scheinkestel CHAIR BOARD REMUNERATION COMMITTEE CONTENTS 1. Snapshot of remuneration for 2024 238 5. Further detail on executive remuneration arrangements 249 2. Key Management Personnel 240 6. Non-executive Director remuneration 253 3. 2024 remuneration outcomes and alignment to performance 241 7. Statutory remuneration details 254 4. Remuneration governance 247 |
| 238 WESTPAC GROUP 2024 ANNUAL REPORT DIRECTORS' REPORT 1. Snapshot of remuneration for 2024 OUR REMUNERATION STRATEGY AND PRINCIPLES Our remuneration strategy is to attract and retain talented employees. We reward them for achieving high performance and delivering superior long term results for our customers and shareholders. Promote our purpose, values and behaviours Align with our strategy and create sustainable shareholder value Offer market competitive and equitable pay Reward financial and non-financial performance including customer outcomes and risk excellence Reinforce our risk and conduct expectations OUR EXECUTIVE REMUNERATION FRAMEWORK A revised executive remuneration framework was introduced effective from 1 October 2023. It is designed to align with our strategy, market practice, investor expectations and compliance with CPS 511. Component Purpose Year 1 Year 2 Year 3 Year 4 Year 5 Year 6 FIXED REMUNERATION 100% cash (including superannuation) Provide market competitive remuneration reflecting role scope and accountabilities Salary and superannuation Vesting point Performance assessment and grant SHORT TERM VARIABLE REWARD 50% cash 50% restricted shares Reward executives for delivering financial and non-financial annual objectives Performance assessed against a balanced scorecard 100% of cash is paid at Year 1 50% restricted shares vesting at Year 2 50% restricted shares vesting at Year 3 Pre-grant assessment Pre-vest assessment LONG TERM VARIABLE REWARD 50% restricted rights Reward executives for sustainable risk culture and for creating shareholder value over the long term Performance assessed against risk culture at grant and at Year 4 CEO: 50% vesting at Year 4 and 50% at Year 5 Group Executives: 100% vesting at Year 4 Grant Performance assessment LONG TERM VARIABLE REWARD 50% performance rights Reward executives for creating shareholder value over the long term Performance assessed against relative total shareholder return (TSR) at Year 4 CEO: 100% vesting at Year 6 Group Executives: 100% vesting at Year 5 cash shares shares rights rights rights rights Minimum shareholding requirement is equivalent to two times fixed remuneration for the CEO and one times fixed remuneration for the Group Executives. Refer to Section 5.5 for further details. REMUNERATION MIX The remuneration mix is designed with a significant proportion of variable reward at risk and based on performance. The graphic below sets out the maximum remuneration mix1 showing the relative proportion of each component in the executive remuneration framework as a percentage of total maximum opportunity. Refer to Section 5 for further details of executive remuneration arrangements. Component Purpose Year 1 Year 2 Year 3 Year 4 Year 5 Year 6 FIXED REMUNERATION 100% cash (including superannuation) Provide market competitive remuneration reflecting role scope and accountabilities Salary and superannuation Vesting point Performance assessment and grant SHORT TERM VARIABLE REWARD 50% cash 50% restricted shares Reward executives for delivering financial and non-financial annual objectives Performance assessed against a balanced scorecard 50% restricted shares vesting at Year 2 50% restricted shares vesting at Year 3 Pre-grant assessment Pre-vest assessment LONG TERM VARIABLE REWARD 50% restricted rights Reward executives for sustainable risk culture and for creating shareholder value over the long term Performance assessed against risk culture at grant and at Year 4 CEO: 50% vesting at Year 4 and 50% at Year 5 Group Executives: 100% vesting at Year 4 Grant Performance assessment LONG TERM VARIABLE REWARD 50% performance rights Reward executives for creating shareholder value over the long term Performance assessed against relative total shareholder return (TSR) at Year 4 CEO: 100% vesting at Year 6 Group Executives: 100% vesting at Year 5 FIXED REMUNERATION 30% STVR 28% LTVR RESTRICTED RIGHTS 21% LTVR PERFORMANCE RIGHTS 21% 94% of fixed remuneration 44% cash 56% equity 70% of fixed remuneration 70% of fixed remuneration At risk performance based variable remuneration (70%) 1. The mix shown in the graphic above applies to 7 of 10 KMP roles. The remaining 3 roles (Chief Financial Officer, Chief Risk Officer and the Group Executive, Human Resources) are on a similar maximum remuneration mix comprised of 33% fixed remuneration, 31% maximum STVR, 18% LTVR restricted rights and 18% LTVR performance rights. The remaining 3 roles will transition to the above remuneration mix over time. |
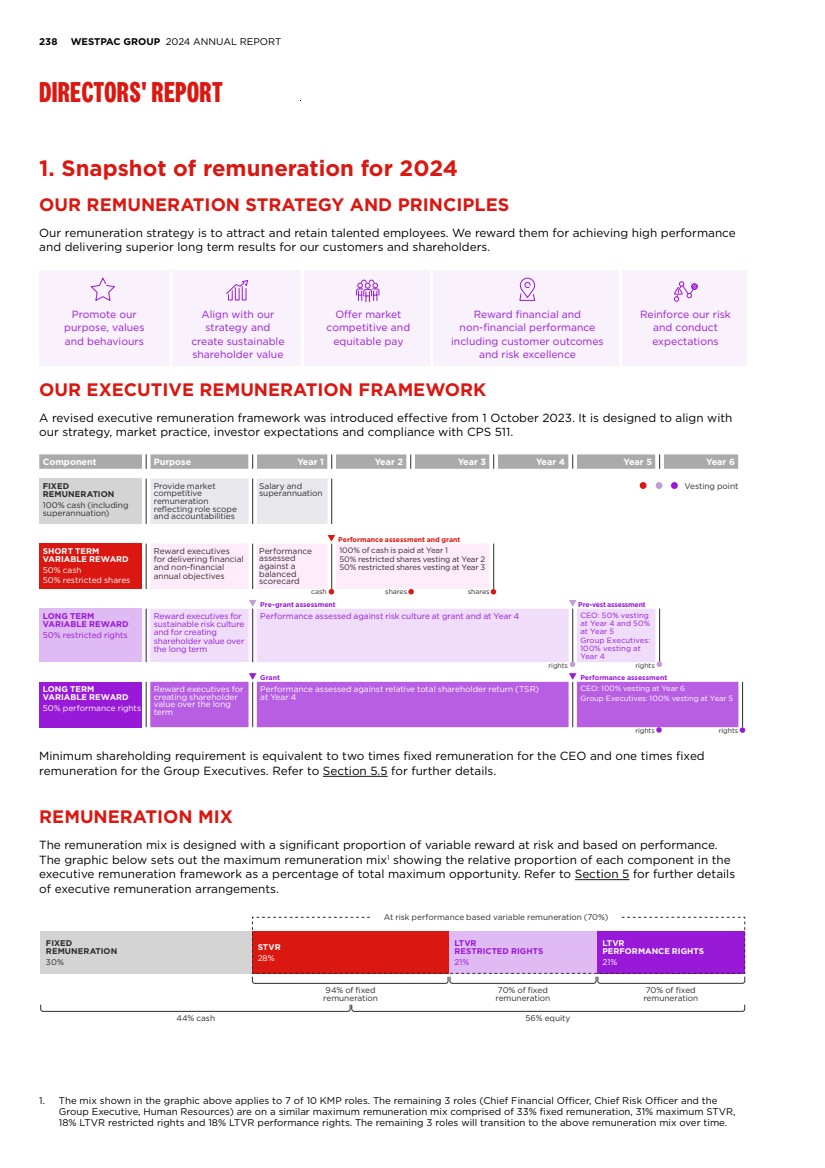
| FINANCIAL STATEMENTS EXHIBITS INDEX STRATEGIC REVIEW PERFORMANCE REVIEW SHAREHOLDER INFORMATION 239 PERFORMANCE SNAPSHOT Financial performance $7,113m NPAT Excluding Notable Items. 11.21% ROTE Excluding Notable Items. Risk management 100% CORE completion Integrated Plan activities and deliverables assessed and closed. $500m capital release Reduction to the $1bn total operational risk capital overlay. Strategic execution Significant transformation delivery Significant progress on transaction and payments capability, mobilised UNITE. $9.6bn sustainable finance lending And $4.9bn in bond facilitation. Over 150 customers engaged on transition plans. Serving customers +1 in Consumer NPS Relative to the major bank average increase. +1 in Business NPS Relative to the major bank average increase. People 80 OHI (+5) Up from 75 in 2023. Above top quartile globally (76). 49% women in senior leadership In line with target of 50% +/- 2. Performance achieved Target Further detail on performance against all measures of the Group STVR Scorecard is set out in Section 3.3. REMUNERATION OUTCOMES 104% CEO's 2024 STVR outcome as a % of target, or 83% as a % of maximum. 87% to 110% Group Executive STVR outcomes Range of STVR outcomes as a % of target, or 70% to 88% as % of maximum. 50% LTVR vesting outcome 2021 LTVR vesting outcome. Reflects a TSR of 113% over the four year performance period. |
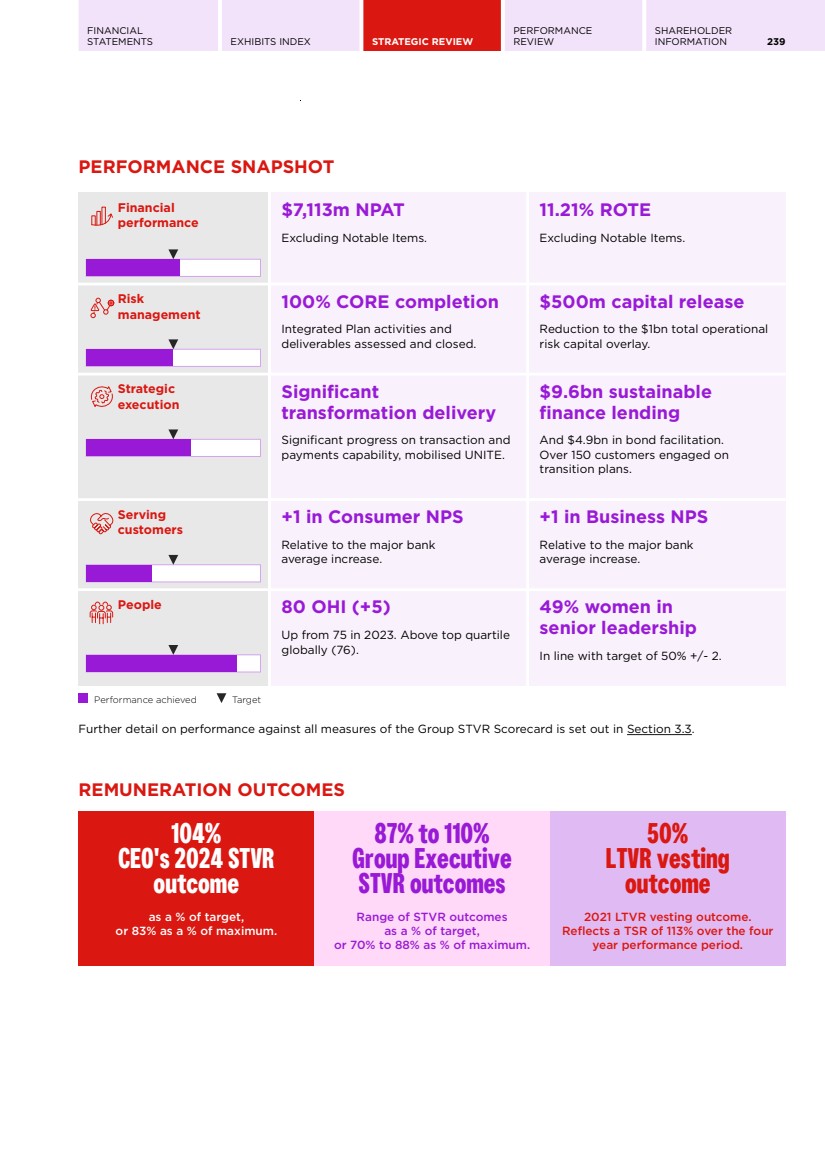
| 240 WESTPAC GROUP 2024 ANNUAL REPORT DIRECTORS' REPORT 2. Key Management Personnel The remuneration of KMP is disclosed in this Report. Disclosures related to former KMP that ceased prior to 1 October 2023 are included in the 2023 Remuneration Report. KMP are defined as those persons that have the authority and responsibility for planning, directing and controlling the activities of an entity, directly or indirectly, including any director (whether executive or otherwise) of that entity. Name Position Term as KMP Managing Director & Chief Executive Officer Peter King Managing Director & Chief Executive Officer Full Year Group Executivesa Scott Collary Chief Information Officer Full Year Nell Hutton Chief Executive, Westpac Institutional Bank Full Year Carolyn McCann Group Executive, Customer & Corporate Services Full Year Catherine McGrath Chief Executive Officer, Westpac New Zealand Full Year Anthony Miller Chief Executive, Business & Wealth Full Year Christine Parker Group Executive, Human Resources Full Year Michael Rowland Chief Financial Officer Full Year Jason Yetton Chief Executive, Consumer Full Year Ryan Zanin Chief Risk Officer Full Year Current Non-executive Directors Steven Gregg Chair Commenced as Non-executive Director and Chair-Elect on 7 November 2023 and as Chair on 14 December 2023 following completion of the 2023 Annual General Meeting Tim Burroughs Director Full Year Nerida Caesar Director Full Year Audette Exel AO Director Full Year Andy Maguire Director Commenced on 15 July 2024 Peter Nash Director Full Year Nora Scheinkestel Director Full Year Margaret Seale Director Full Year Michael Ullmer AO Director Full Year Former Non-executive Directors John McFarlane Chair Retired on 14 December 2023 following completion of the 2023 Annual General Meeting Chris Lynch Director Retired on 14 December 2023 following completion of the 2023 Annual General Meeting a. References to Group Executives in this Report refer to Group Executives who are in KMP roles. |
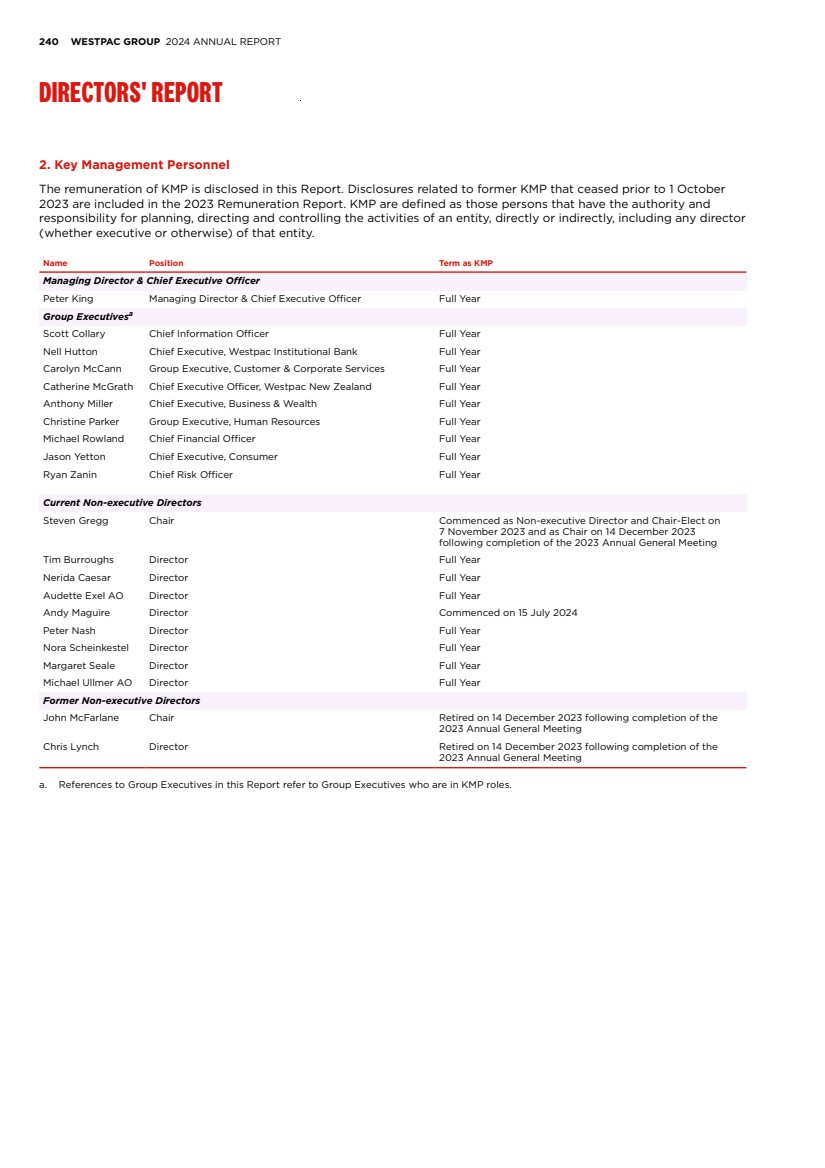
| FINANCIAL STATEMENTS EXHIBITS INDEX STRATEGIC REVIEW PERFORMANCE REVIEW SHAREHOLDER INFORMATION 241 3. 2024 remuneration outcomes and alignment to performance 3.1. Group performance The table below summarises variable reward outcomes and Group performance over the last five years. Years ended 30 September 2024 2023 2022 2021 2020 CEO STVR outcome (% of maximum)a 83% 60% 52% 47% 0% CEO STVR outcome (% of target)b 104% 90% 78% 70% 0% Average Group Executive STVR outcome (% of maximum)a 82% 60% 53% 48% 0% Average Group Executive STVR outcome (% of target)b 102% 89% 79% 73% 0% LTVR outcome (% vested) 50% 0% 0% 0% 0% Net profit after tax attributable to owners of WBC ($m) 6,990 7,195 5,694 5,458 2,290 Net profit after tax (excluding Notable Items) ($m)c 7,113 7,368 6,568 6,953 5,227 Return on tangible equity (ROTE) (statutory basis) 11.01% 11.39% 9.17% 8.82% 3.92% Return on tangible equity (ROTE) (excluding Notable Items)c 11.21% 11.67% 10.58% 11.23% 8.95% TSR – four years 113.10% (9.27%) (11.15%) (1.95%) (27.28%) TSR – five years 34.24% (4.05%) (13.82%) 10.34% (27.87%) Total ordinary dividend (cents per share) 151 142 125 118 31 Special dividend (cents per share) 15 0 0 0 0 Share price – close $31.72 $21.15 $20.64 $26.00 $16.84 a. From 2024, maximum STVR opportunity was reduced from 150% to 125% of target STVR. b. From 2024, target STVR opportunity was reduced from approximately 100% to 75% of fixed remuneration for business roles, and maintained at 75% for functional roles. c. Refer to the 'Additional information for non-AAS financial measures' section of the Annual Report for a reconciliation of this measure. 3.2. 2021 LTVR vesting outcome We tested the 2021 LTVR on 1 October 20241 .. Our TSR for the 4 year performance period was 113% resulting in a 50th percentile ranking relative to the comparator group. This resulted in 50% of the 2021 LTVR award vesting. Performance range Performance hurdle Performance start date Test date Threshold Maximum Outcome % Vested % Lapsed TSR (100% of award) 1 October 2020 1 October 2024 Percentile ranking is at the median Percentile ranking is at the 75th percentile or higher 50th percentile ranking relative to the comparator group 50% 50% NPAT (EXCLUDING NOTABLE ITEMS) AND CEO STVR OUTCOME NPAT (excluding Notable Items) ($m) CEO STVR (%) NPAT (excluding Notable Items) ($m) CEO STVR outcome (% of target) CEO STVR outcome (% of maximum) 2020 2021 2022 2023 2024 0 2,000 4,000 6,000 8,000 0 40 80 120 ROTE (EXCLUDING NOTABLE ITEMS) AND CEO STVR OUTCOME ROTE (excluding Notable Items) (%) CEO STVR (%) ROTE (excluding Notable Items) CEO STVR outcome (% of target) CEO STVR outcome (% of maximum) 2020 2021 2022 2023 2024 0 4 8 12 0 40 80 120 TSR TSR (%) WBC Peer 1 Peer 2 Peer 3 2021 2022 2023 2024 0 80 160 40 120 TSR AND LTVR VESTING OUTCOME (percentile rank over the prior 4 year period) TSR over 4 years (percentile rank) LTVR award (% vested) TSR over 4 years (percentile rank) LTVR award (% vested) 2020 2021 2022 2023 2024 0 40 80 20 60 100 0 40 80 20 60 100 1. In addition, we tested the pro rata 2020 LTVR award granted to Jason Yetton and tested additional 2020 LTVR awards granted to Peter King, Carolyn McCann and Jason Yetton for changes to their total target remuneration. The awards were granted on the same terms and conditions as the 2020 LTVR. The awards lapsed in full as they were tested on 1 April 2024 and did not meet the TSR performance condition. |
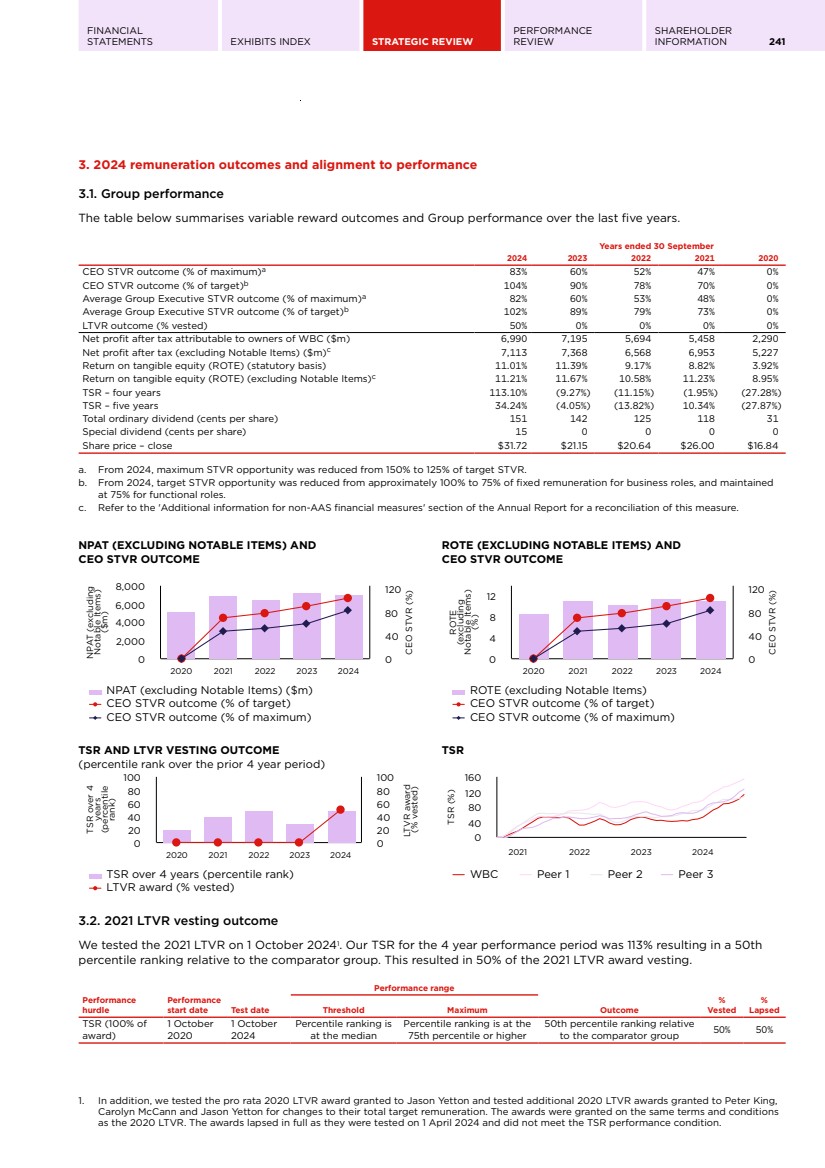
| 242 WESTPAC GROUP 2024 ANNUAL REPORT DIRECTORS' REPORT 3.3. 2024 Group STVR Scorecard The Group’s priorities are set out in the Group STVR Scorecard, which forms part of the CEO’s Scorecard. Common elements appear in Group Executive Scorecards together with individual objectives reflecting Divisional measures. A summary of the performance assessment is provided below and is designed to be read over two pages. Where appropriate, individual measures have been assessed against a 'Threshold', 'Target' and 'Stretch' rating scale as outlined in the key. Each priority has also been assessed in totality using the same key. Key priority Measure Outcome Outcome commentary Key: Threshold 50-99% Stretch 101-125% Target 100% Performance assessment Financial performance (45%) Deliver current year financial performance: • Net profit after tax (excluding Notable Items)a -5% $7,013m +5% $7,113m result was above target. The only Notable Items in 2024 were from the timing impact of hedge accounting items. We delivered our financial targets in a competitive market. NPAT (excluding Notable Items) was $7,113m which was above target. Pre-provision profit was $10,819m which was below target. ROTE (excluding Notable Items) was 11.21% which was above target. We achieved growth in our key markets while also managing margins with net interest margin (NIM), excluding Notable Items, down 1 basis point and above target. Expenses were higher than target, mostly due to the wind down of the RAMS business and technology costs. The commencement of the UNITE program, our business led technology simplification program, will be critical in reducing the cost of complexity across the Group and, in turn, reducing the cost to income gap to peers over time. Impairments were lower than targeted due to key economic indicators being better than forecast and lower individual provisions. Credit quality remained resilient, notwithstanding a rise in stressed exposures. We assessed Financial performance at just above target. • Pre-provision profit (excluding Notable Items)a -5% $10,949m +5% $10,819m result was below target. • Return on tangible equity (excluding Notable Items)a -5% 11.0% +5% 11.21% result was above target. Risk management (20%) Deliver the Customer Outcomes and Risk Excellence (CORE) program and embed and sustain improvements in risk management, capability and culture - Target - All activities and deliverables in the CORE Integrated Plan were assessed and closed by Promontory Australia. Practices and improvements in risk management, governance and culture sustained post end of the CORE program evidenced by Promontory Australia reports and internal measures. Focus remained on uplifting our risk management with achievement of the major milestone of the completion of the CORE program, on time and assessed by Promontory Australia as complete. APRA recognised the progress and improvements we have made and partially reduced the level of our operational risk capital overlay from $1 billion to $500 million. With CORE complete, we are now focused on completion of the transition to business as usual which is progressing to plan. Delivery of the UNITE program will be critical to further reducing the risk of complexity across the Group. We assessed Risk management at target. Strategic execution (15%) Deliver the significant change initiatives to transform the bank - Target - Delivered transformation change initiatives in line with targets. Significant delivery of payments capability including delivery of PayTo, international payment processor migration, corporate cash management platform and improving payments for merchants. Mobilised UNITE technology simplification plan. We made good progress across the Group’s transformation agenda. Highlights during the year included mobilising UNITE, tangible delivery across our payments and transaction banking capability and extending scam protection for our customers. We made demonstrable progress in improving our capabilities including PayTo for Billers, extending PayTo for business customers, launching Pay with Points, launching EFTPOS Flex, extending EFTPOS Air coverage, tracking well to deliver international payment processor migration and progressing well in the implementation of the corporate cash management platform (Westpac One Core program in Westpac Institutional Bank). The UNITE program comprises circa 60 initiatives of which 39 have commenced and 2 have been completed as at 30 September 2024. On delivering our climate transition plan, we finished the year with 13 targets in all 9 emission-intensive sectors under the NZBA framework. We have focused on operationalising our sector targets. We engaged with over 150 institutional customers on their climate transition plans and found that 84% had a public transition plan. We have increased our sustainable finance lending and bond facilitation this year by $9.6bn and $4.9bn respectively and are on track to meet our 2030 targets. We assessed Strategic execution at above target. Deliver the climate transition plan - Target - 2030 targets set in 9 NZBA carbon intensive sectors. Engaged over 150 institutional customers on their climate transition plans. Above target on sustainable finance measures for the year. Serving customers (10%) Improve customer advocacy of Westpac Group (measured in points relative to major bank average change) 0 +2 +4 Consumer NPS was +1 relative to the major bank average change, which was below our target. Our Australian Consumer NPS score increased over the year but not at the pace we want. We have seen improvements in product and channel NPS, however these are yet to flow through to the overall brand NPS measures. In Australian Business, our score increased over the year and achieved target. We have more work to do on customer journeys and servicing customers. Our Institutional customers remain strong advocates. WNZL Consumer NPS remains #5 and grew in line with the market average. We have progressed in other areas of customer service such as progressing well on consolidating 22 customer verification processes into a single digital identification solution, being recognised by Forrester as the #1 mobile banking app (second year in a row) and improving security features, such as SafeCall and SaferPay. Customer losses from scams are down almost 30% year-on-year. Our average customer complaint resolution time is stable with 93% resolved by our people in the moment without the need for escalation. From a market share perspective, we have maintained momentum with growth across the business. We grew in deposits, critical to customer primacy and relationship banking. Growth in Australian mortgages was 0.8x of ADI financial system growth, which was below target. Growth in Australian business lending was 1.3x of ADI financial system growth, which was at stretch. We assessed Serving customers at below target. 0 +1 +2 Business NPS was +1 relative to the major bank average change, which was in line with our target. Grow market share in key segments compared to system growth 0.8x 1.0x 1.2x Growth in Australian mortgages was 0.8x of ADI financial system growth, which was below target. Growth in Australian business lending was 1.3x of ADI financial system growth, which was at stretch. People (10%) Improve organisational health as measured through the Organisational Health Index (OHI) 75 76 77 Westpac Group OHI was 80, which was at stretch and up from 75 last year. We continue to invest in our people and their development. Our people are more engaged with the OHI score up 5 points over the year to 80, which now sees us in the top quartile globally. We improved OHI in all large divisions. We continue to develop our leaders and enhance our executive bench strength. All Group Executive and critical General Manager roles were mapped with at least one emergency successor. Women in senior leadership is at 49% at the end of 2024, within the 48-52% target range. We assessed People at above target. OVERALL GROUP STVR SCORECARD PERFORMANCE ASSESSMENT 101% OF TARGET 81% OF MAXIMUM The STVR Scorecard has a modifier that allows the Board to take into account risk and reputation, people management and any other matters as determined by the Board. Refer to Section 3.5 for further detail on individual outcomes. a. Refer to the 'Additional information for non-AAS financial measures' section of the Annual Report for a reconciliation of this measure. |
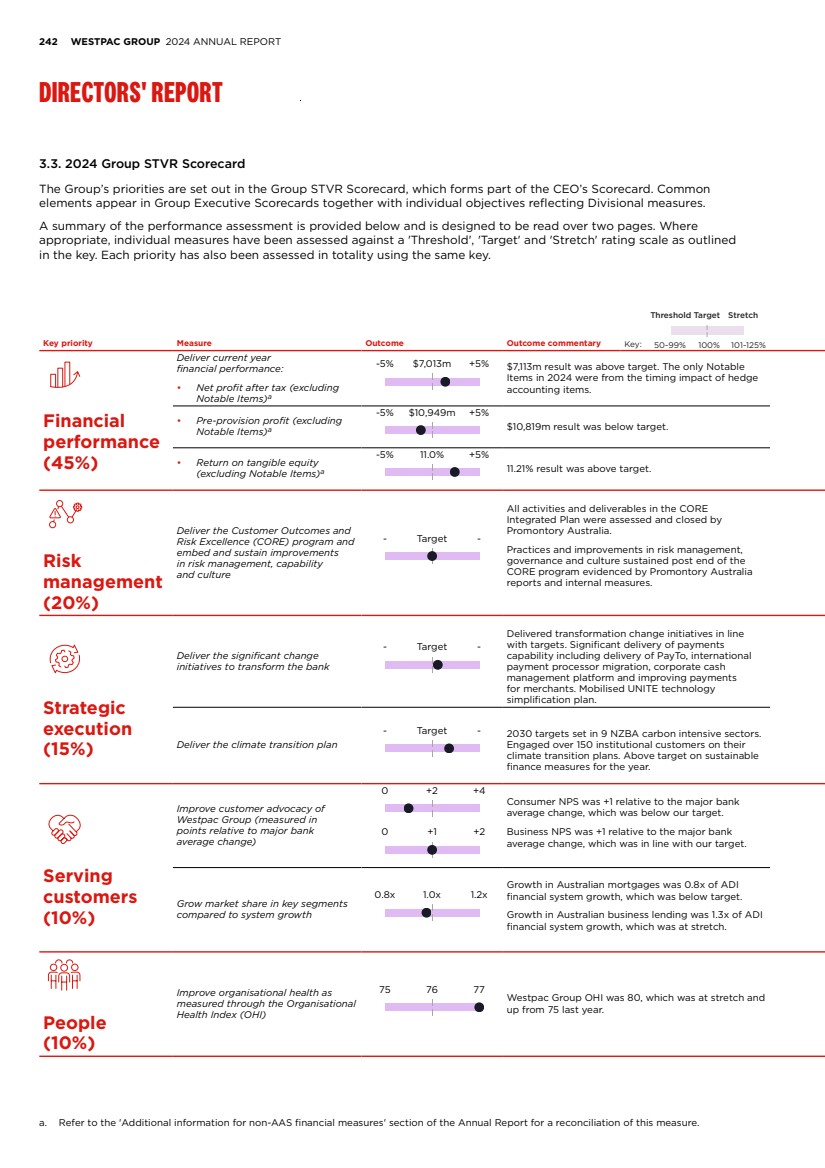
| FINANCIAL STATEMENTS EXHIBITS INDEX STRATEGIC REVIEW PERFORMANCE REVIEW SHAREHOLDER INFORMATION 243 KEY CHANGES TO THE 2024 GROUP STVR SCORECARD Given the progress on the Customer Outcomes and Risk Excellence program, we reviewed the Scorecard weightings for 2024. We decided to reduce the weighting to Risk management by 10% and increase the weighting to Financial performance and Strategic execution by 5% each. Key priority Measure Outcome Outcome commentary Key: Threshold 50-99% Stretch 101-125% Target 100% Performance assessment Financial performance (45%) Deliver current year financial performance: • Net profit after tax (excluding Notable Items) a -5% $7,013m +5% $7,113m result was above target. The only Notable Items in 2024 were from the timing impact of hedge accounting items. We delivered our financial targets in a competitive market. NPAT (excluding Notable Items) was $7,113m which was above target. Pre-provision profit was $10,819m which was below target. ROTE (excluding Notable Items) was 11.21% which was above target. We achieved growth in our key markets while also managing margins with net interest margin (NIM), excluding Notable Items, down 1 basis point and above target. Expenses were higher than target, mostly due to the wind down of the RAMS business and technology costs. The commencement of the UNITE program, our business led technology simplification program, will be critical in reducing the cost of complexity across the Group and, in turn, reducing the cost to income gap to peers over time. Impairments were lower than targeted due to key economic indicators being better than forecast and lower individual provisions. Credit quality remained resilient, notwithstanding a rise in stressed exposures. We assessed Financial performance at just above target. • Pre-provision profit (excluding Notable Items) a -5% $10,949m +5% $10,819m result was below target. • Return on tangible equity (excluding Notable Items) a -5% 11.0% +5% 11.21% result was above target. Risk management (20%) Deliver the Customer Outcomes and Risk Excellence (CORE) program and embed and sustain improvements in risk management, capability and culture - Target - All activities and deliverables in the CORE Integrated Plan were assessed and closed by Promontory Australia. Practices and improvements in risk management, governance and culture sustained post end of the CORE program evidenced by Promontory Australia reports and internal measures. Focus remained on uplifting our risk management with achievement of the major milestone of the completion of the CORE program, on time and assessed by Promontory Australia as complete. APRA recognised the progress and improvements we have made and partially reduced the level of our operational risk capital overlay from $1 billion to $500 million. With CORE complete, we are now focused on completion of the transition to business as usual which is progressing to plan. Delivery of the UNITE program will be critical to further reducing the risk of complexity across the Group. We assessed Risk management at target. Strategic execution (15%) Deliver the significant change initiatives to transform the bank - Target - Delivered transformation change initiatives in line with targets. Significant delivery of payments capability including delivery of PayTo, international payment processor migration, corporate cash management platform and improving payments for merchants. Mobilised UNITE technology simplification plan. We made good progress across the Group’s transformation agenda. Highlights during the year included mobilising UNITE, tangible delivery across our payments and transaction banking capability and extending scam protection for our customers. We made demonstrable progress in improving our capabilities including PayTo for Billers, extending PayTo for business customers, launching Pay with Points, launching EFTPOS Flex, extending EFTPOS Air coverage, tracking well to deliver international payment processor migration and progressing well in the implementation of the corporate cash management platform (Westpac One Core program in Westpac Institutional Bank). The UNITE program comprises circa 60 initiatives of which 39 have commenced and 2 have been completed as at 30 September 2024. On delivering our climate transition plan, we finished the year with 13 targets in all 9 emission-intensive sectors under the NZBA framework. We have focused on operationalising our sector targets. We engaged with over 150 institutional customers on their climate transition plans and found that 84% had a public transition plan. We have increased our sustainable finance lending and bond facilitation this year by $9.6bn and $4.9bn respectively and are on track to meet our 2030 targets. We assessed Strategic execution at above target. Deliver the climate transition plan - Target - 2030 targets set in 9 NZBA carbon intensive sectors. Engaged over 150 institutional customers on their climate transition plans. Above target on sustainable finance measures for the year. Serving customers (10%) Improve customer advocacy of Westpac Group (measured in points relative to major bank average change) 0 +2 +4 Consumer NPS was +1 relative to the major bank average change, which was below our target. Our Australian Consumer NPS score increased over the year but not at the pace we want. We have seen improvements in product and channel NPS, however these are yet to flow through to the overall brand NPS measures. In Australian Business, our score increased over the year and achieved target. We have more work to do on customer journeys and servicing customers. Our Institutional customers remain strong advocates. WNZL Consumer NPS remains #5 and grew in line with the market average. We have progressed in other areas of customer service such as progressing well on consolidating 22 customer verification processes into a single digital identification solution, being recognised by Forrester as the #1 mobile banking app (second year in a row) and improving security features, such as SafeCall and SaferPay. Customer losses from scams are down almost 30% year-on-year. Our average customer complaint resolution time is stable with 93% resolved by our people in the moment without the need for escalation. From a market share perspective, we have maintained momentum with growth across the business. We grew in deposits, critical to customer primacy and relationship banking. Growth in Australian mortgages was 0.8x of ADI financial system growth, which was below target. Growth in Australian business lending was 1.3x of ADI financial system growth, which was at stretch. We assessed Serving customers at below target. 0 +1 +2 Business NPS was +1 relative to the major bank average change, which was in line with our target. Grow market share in key segments compared to system growth 0.8x 1.0x 1.2x Growth in Australian mortgages was 0.8x of ADI financial system growth, which was below target. Growth in Australian business lending was 1.3x of ADI financial system growth, which was at stretch. People (10%) Improve organisational health as measured through the Organisational Health Index (OHI) 75 76 77 Westpac Group OHI was 80, which was at stretch and up from 75 last year. We continue to invest in our people and their development. Our people are more engaged with the OHI score up 5 points over the year to 80, which now sees us in the top quartile globally. We improved OHI in all large divisions. We continue to develop our leaders and enhance our executive bench strength. All Group Executive and critical General Manager roles were mapped with at least one emergency successor. Women in senior leadership is at 49% at the end of 2024, within the 48-52% target range. We assessed People at above target. OVERALL GROUP STVR SCORECARD PERFORMANCE ASSESSMENT 101% OF TARGET 81% OF MAXIMUM The STVR Scorecard has a modifier that allows the Board to take into account risk and reputation, people management and any other matters as determined by the Board. Refer to Section 3.5 for further detail on individual outcomes. a. Refer to the 'Additional information for non-AAS financial measures' section of the Annual Report for a reconciliation of this measure. |
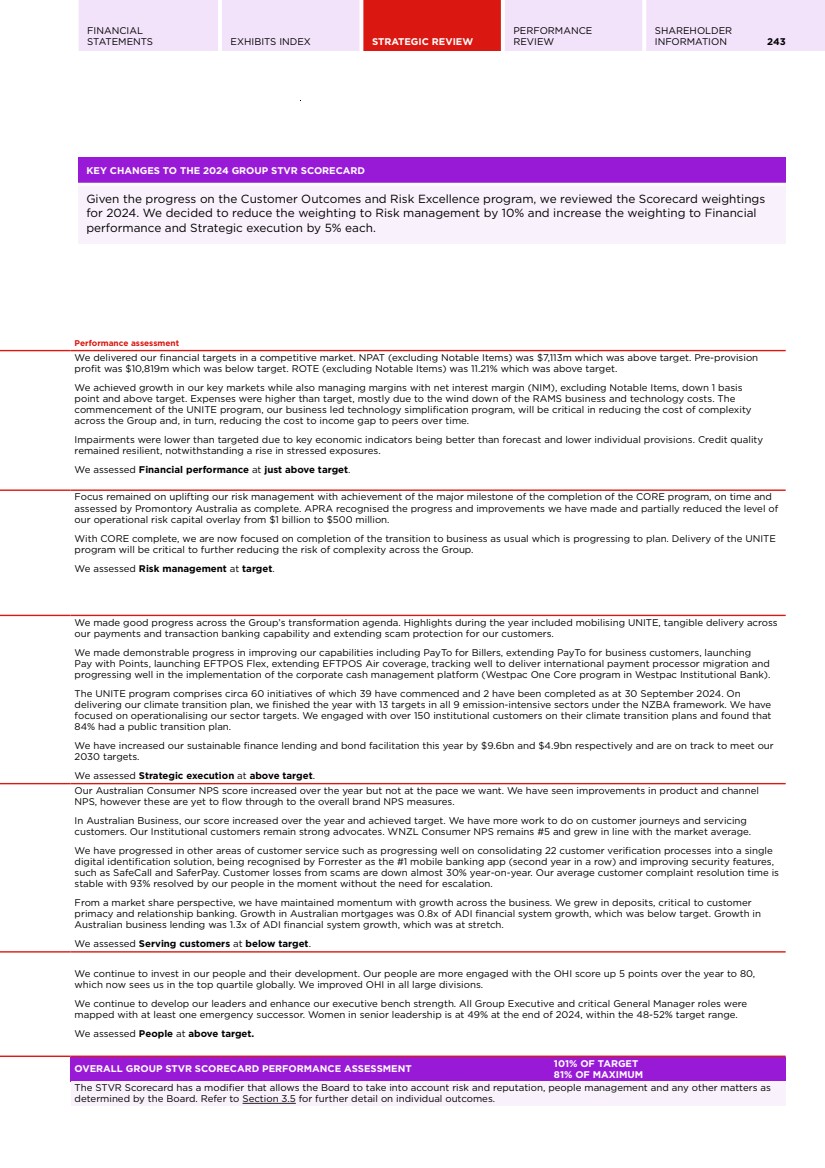
| 244 WESTPAC GROUP 2024 ANNUAL REPORT DIRECTORS' REPORT 3.4. Total realised remuneration – Chief Executive Officer and Group Executives The table below details the actual remuneration paid and equity1 that vested or lapsed in 2024 and 2023 related to KMP roles. It does not include termination payments and buy out awards. This table is not prepared in accordance with Australian Accounting Standards which differs from the disclosure in Section 7. Fixed remuneration Cash STVR payments Vesting of prior year deferred STVR awards Vesting of prior year LTVR awards Total realised remuneration Prior year LTVR lapsed Name $ $ $ $ $ $ Managing Director & Chief Executive Officer Peter King, Managing Director & Chief Executive Officer 2024 2,502,920 975,000 1,442,898 2,990,401 7,911,219 3,314,178 2023 2,507,497 1,125,000 861,964 - 4,494,461 1,878,389 Group Executives Scott Collary, Chief Information Officera 2024 1,293,976 508,500 706,444 1,927,412 4,436,332 1,927,412 2023 1,234,741 508,500 458,147 - 2,201,388 - Nell Hutton, Chief Executive, Westpac Institutional Bank 2024 1,278,338 502,000 - - 1,780,338 - 2023 --------------------- Not a KMP in 2023 --------------------- Carolyn McCann, Group Executive, Customer & Corporate Services 2024 1,062,447 437,500 484,098 1,149,441 3,133,486 1,269,346 2023 1,019,918 380,000 289,602 - 1,689,520 743,801 Catherine McGrath, Chief Executive Officer, Westpac New Zealand 2024 981,129 311,189 502,028 - 1,794,346 - 2023 890,307 350,356 152,519 - 1,393,182 - Anthony Miller, Chief Executive, Business & Wealthb 2024 1,277,944 478,000 706,795 1,925,462 4,388,201 1,925,462 2023 1,198,066 611,000 384,960 - 2,194,026 - Christine Parker, Group Executive, Human Resources 2024 1,041,206 417,000 513,821 1,459,709 3,431,736 1,459,677 2023 1,007,812 392,000 321,423 - 1,721,235 1,104,203 Michael Rowland, Chief Financial Officer 2024 1,274,390 500,500 577,773 1,588,668 3,941,331 1,588,636 2023 1,263,779 446,500 381,624 - 2,091,903 - Jason Yetton, Chief Executive, Consumer 2024 1,277,944 443,000 782,285 2,009,165 4,512,394 3,432,493 2023 1,198,066 611,000 548,354 - 2,357,420 - Ryan Zanin, Chief Risk Officerc 2024 1,699,186 674,000 504,105 - 2,877,291 - 2023 1,691,361 503,500 102,432 - 2,297,293 - a. In addition, Scott Collary had 45,879 restricted shares vest in December 2023 in relation to a buy out award. b. In addition, Anthony Miller received a deferred cash payment of $1,003,290 in March 2024 and had 46,798 restricted shares vest in March 2024 in relation to a buy out award. c. In addition, Ryan Zanin received deferred cash payments of $196,839 in January 2024, $64,623 in April 2024 and $64,623 in June 2024 in relation to a buy out award. Explanation of total realised remuneration Component Explanation Fixed remuneration Represents salary and superannuation paid during the financial year. Cash STVR payments Represents the cash portion of the STVR outcome for the financial year. This represents 50% of the overall STVR outcome as the remaining 50% is deferred and vests in equal portions over two years. Vesting of prior year deferred STVR awards Represents the portions of STVR that were deferred in prior years and vested during the financial year. Vesting of prior year LTVR awards Represents the LTVR that was deferred in prior years and vested during the financial year, if the performance conditions were met. Total realised remuneration Sum of the above components. Prior year LTVR lapsed Represents the LTVR from prior years that lapsed or was determined to be lapsed. 1. Equity that vested in October 2024 is included in the 2024 figures. Equity that vested in October 2023 is included in the 2023 figures. The value of deferred STVR is based on the number of restricted shares or share rights multiplied by the five day volume weighted average price (VWAP) up to and including the scheduled date of vesting. The value of LTVR is based on the number of share rights multiplied by the five day VWAP up to and including the scheduled date of testing. The value of equity differs from the disclosure in Section 7. |
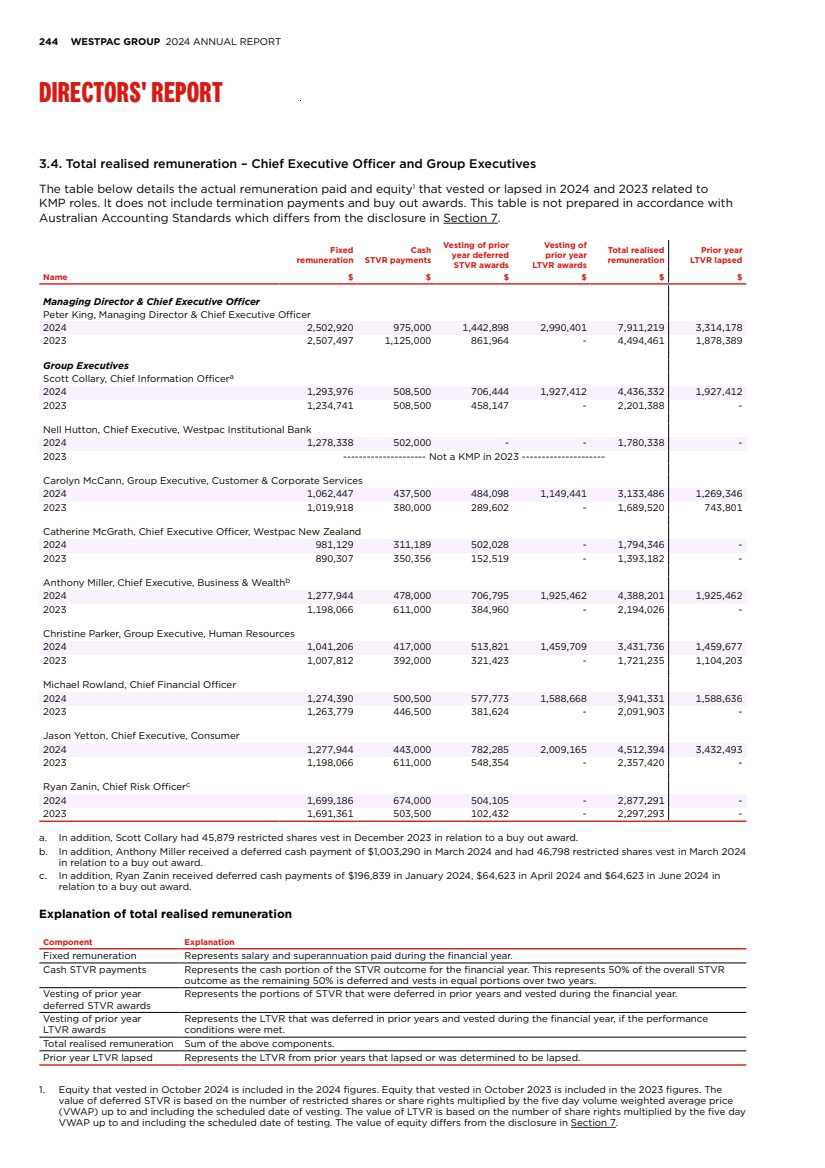
| FINANCIAL STATEMENTS EXHIBITS INDEX STRATEGIC REVIEW PERFORMANCE REVIEW SHAREHOLDER INFORMATION 245 3.5. Variable reward awarded for 2024 The table below shows the variable reward awarded1 to the CEO and Group Executives for 2024, including: • STVR outcomes for 2024 (including the cash and deferred equity components); and • equity granted as 2024 LTVR in January 2024. The 2024 LTVR grants shown at face value in the table below will be tested on 1 October 2027. For the CEO, the Board assessed his Scorecard at 104% (+3% on the Group STVR Scorecard) of his target STVR opportunity. This was in recognition of Peter King's leadership in completing the CORE program and setting up the organisation to execute the UNITE program. In addition, the Board made a downward adjustment to the 2024 STVR outcome for a Group Executive based on an assessment of leadership behaviours. There were no risk related adjustments for the CEO or Group Executives. 2024 STVR award 2024 LTVR award Name Target STVR opportunity ($) Maximum STVR opportunity ($) STVR outcome (% of target) STVR outcome (% of maximum) STVR outcome ($) Maximum STVR foregone ($) Restricted rights ($)a Performance rights ($)a Managing Director & Chief Executive Officer Peter King 1,875,000 2,343,750 104% 83% 1,950,000 393,750 1,750,000 1,750,000 Group Executives Scott Collary Chief Information Officer 968,600 1,210,750 105% 84% 1,017,000 193,750 904,000 904,000 Nell Hutton Chief Executive, Westpac Institutional Bank 956,250 1,195,313 105% 84% 1,004,000 191,313 892,500 892,500 Carolyn McCann Group Executive, Customer & Corporate Services 795,000 993,750 110% 88% 875,000 118,750 742,000 742,000 Catherine McGrath Chief Executive Officer, Westpac New Zealand 715,734 894,667 87% 70% 622,377 272,290 668,018 668,018 Anthony Miller Chief Executive, Business & Wealth 956,250 1,195,313 100% 80% 956,000 239,313 892,500 892,500 Christine Parker Group Executive, Human Resources 779,300 974,125 107% 86% 834,000 140,125 571,500 571,500 Michael Rowland Chief Financial Officer 953,600 1,192,000 105% 84% 1,001,000 191,000 699,300 699,300 Jason Yetton Chief Executive, Consumer 956,250 1,195,313 93% 74% 886,000 309,313 892,500 892,500 Ryan Zaninb Chief Risk Officer 1,271,500 1,589,375 106% 85% 1,348,000 241,375 932,400 932,400 Average Group Executive STVR outcome 102% 82% a. The face value is calculated by multiplying the number of rights by the five day VWAP up to the commencement of the performance period. The five day VWAP was $21.09 for awards made in January 2024. b. In addition, Ryan Zanin was awarded a grant of restricted shares of $500,000 on 19 January 2024. The award recognises the importance of his role in completing a critical risk management and risk culture transformation, and increases alignment with shareholders through greater equity holdings. The award is subject to service conditions and remuneration adjustments. It will vest in three tranches in January 2026, January 2028 and January 2029. 1. The final value of equity received will depend on the share price at the time of vesting and the number of restricted shares or share rights that vest subject to performance conditions (where applicable), service conditions and remuneration adjustments. The value of equity differs from the disclosure in Section 7 which provides the annualised accounting value for unvested equity awards prepared in accordance with Australian Accounting Standards. |
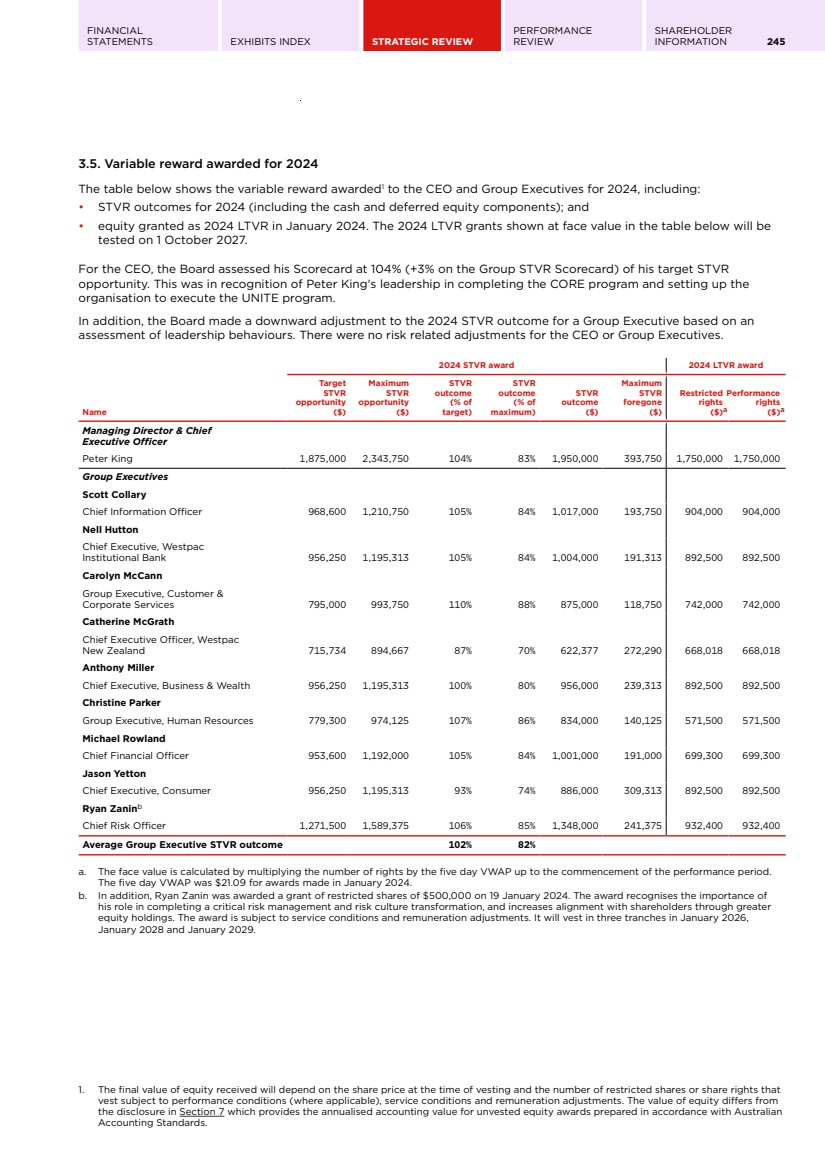
| 246 WESTPAC GROUP 2024 ANNUAL REPORT DIRECTORS' REPORT 2024 LTVR restricted rights pre-grant assessment We awarded the 2024 LTVR restricted rights, outlined in Section 3.5 above, following the pre-grant assessment which was completed in October 2023. The Board determined that no adjustment was required. Further details are available in the 2023 Remuneration Report. 2025 LTVR restricted rights pre-grant assessment The pre-grant assessment for the 2025 LTVR restricted rights was completed in October 2024. The Board determined that no adjustment was required and the 2025 LTVR restricted rights will be granted in full. The prudential soundness gate was satisfied by reviewing the key capital and liquidity ratios, including CET1, LCR and NSFR. The ratios are all above minimum prudential requirements. Group risk culture maturity was assessed as 'Maintained'. The Board had regard to the Group level rating arising from the annual Risk Culture Self-Assessment which was stable at ‘Systematic’, improved results in risk culture questions as indicated through our annual employee survey, Voice+, and other evidence points informing the CPS 220 Risk Management Declaration including risk management framework maturity, root cause analyses, prudential attestations, audit and assurance findings and regulatory reviews. There were no significant risk outcomes or serious misconduct issues that arose that were not sufficiently addressed elsewhere. The LTVR restricted rights remain subject to the pre-vest assessment after the four year performance period ending 30 September 2028. The restricted rights also remain subject to remuneration adjustments during and after this period. Pre-grant assessment Outcome Step 1: Assessment Prudential soundness gate: Has Westpac remained safe and secure, taking into account capital position and liquidity? Met Group risk culture: Has Group risk culture maturity been maintained or improved, considering both executive actions or inactions? Maintained Significant risk outcomes: Have risk outcomes arisen that have a significant and material impact on the Group, not sufficiently addressed elsewhere? No adjustment Serious misconduct: Has Westpac suffered from a serious misconduct issue, not sufficiently addressed elsewhere? No adjustment Step 2: Consider Board discretion No adjustment Overall pre-grant assessment Grant in full |
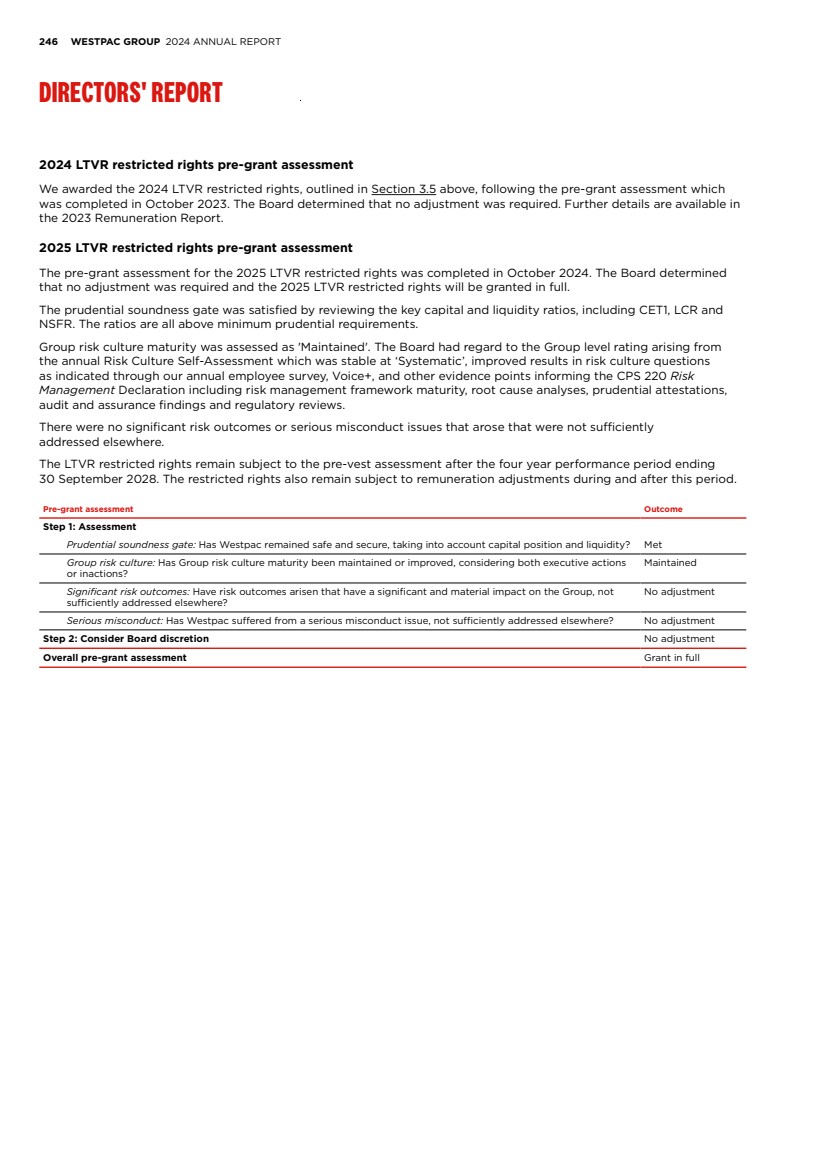
| FINANCIAL STATEMENTS EXHIBITS INDEX STRATEGIC REVIEW PERFORMANCE REVIEW SHAREHOLDER INFORMATION 247 4. Remuneration governance 4.1. Group remuneration policy The Group remuneration policy sets out information in relation to remuneration design, arrangements and outcomes across Westpac. The policy is supported by an established governance structure, plans and frameworks. The policy supports our compliance with legal and regulatory requirements. Remuneration strategy Our remuneration strategy is to attract and retain talented employees. We reward them for achieving high performance and delivering superior long term results for our customers and shareholders. Remuneration principles • Promote our purpose, values and behaviours; • Align with our strategy and create sustainable shareholder value; • Offer market competitive and equitable pay; • Reward financial and non-financial performance, including customer outcomes and risk excellence; and • Reinforce our risk and conduct expectations. 4.2. Group remuneration governance The Board has overall accountability for the remuneration framework and its application. As set out in the Board Charter (and as supported by the Board Remuneration Committee Charter), without limiting its role the Board approves (following recommendation from the Board Remuneration Committee): the Group remuneration policy; the size of the annual Group variable reward pool; performance objectives and remuneration outcomes for the CEO; remuneration arrangements and outcomes for accountable persons, specified roles and any other person the Board determines; and equity-based plans. The Board has the discretion to defer, adjust or withdraw aggregate and individual variable reward. Further detail is contained in the Board and Committee Charters which are available on Westpac’s website: https://www.westpac.com.au/about-westpac/westpac-group/corporate-governance/constitution-board/ The Board Remuneration Committee assists the Board to discharge its responsibility by overseeing the design, operation and monitoring of the remuneration framework. Members of the Board Remuneration Committee are independent Non-executive Directors. The Board and the Board Remuneration Committee have free and unfettered access to internal and external personnel in carrying out their respective duties. Further detail is contained in the Board Remuneration Committee Charter which is available on Westpac’s website: https://www.westpac.com.au/about-westpac/westpac-group/corporate-governance/constitution-board/ The Board and the Board Remuneration Committee receive support from internal groups and committees including, but not limited to, the Group Remuneration Oversight Committee and business specific remuneration oversight committees. The Board or the Board Remuneration Committee may engage a remuneration consultant to directly provide specialist information on remuneration for key management personnel. The Chair of the Board Remuneration Committee oversees the engagement and associated costs. The Board Remuneration Committee seeks feedback from and considers matters raised by other Board Committees (as appropriate) with respect to remuneration outcomes, adjustments to remuneration in light of relevant matters and alignment of remuneration with the risk management framework. Cross membership of the Board Remuneration Committee and the Board Risk Committee also supports alignment between risk and remuneration. Independent input is received from the Chief Risk Officer on risk, compliance and conduct matters that may need to be considered in remuneration outcomes. Use of remuneration consultants: In 2024, the Board engaged Ernst & Young to provide market benchmarking information on Non-executive Director and Group Executive remuneration. Ernst & Young did not provide any remuneration recommendations as prescribed under the Corporations Act 2001 (Cth) (Corporations Act) in 2024. |
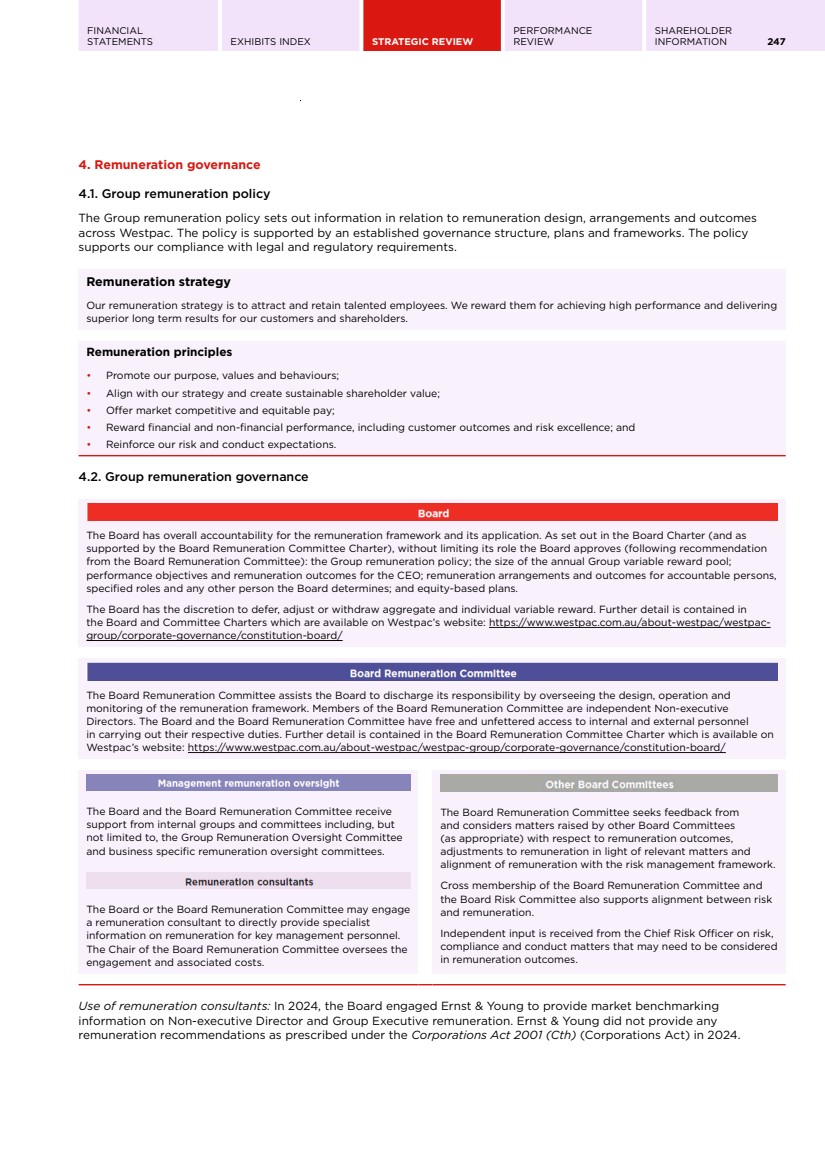
| 248 WESTPAC GROUP 2024 ANNUAL REPORT DIRECTORS' REPORT 4.3. Our approach to remuneration adjustments Remuneration adjustment is one of the ways we reinforce our risk, compliance and conduct expectations. This includes downward adjustments for adverse outcomes, as well as upward adjustment to reward positive risk behaviours. Significant risk, compliance or conduct matters We have guidelines in place to support the consistent application of proportionate adjustments for significant risk, compliance or conduct matters. SEVERITY OF IMPACT BASED ON: Customer People Reputation Regulatory Financial ACCOUNTABILITY Action or inaction of the individual Quantum of adjustment Indicative order of downward adjustments 1. Current year STVR 2. Unvested deferred STVR (malus) 3. Unvested LTVR (malus) 4. Unvested retention awards (malus) 5. Unvested buy out awards (malus) 6. Vested or paid VR (clawback) We apply judgement to consider whether the size of the adjustment is proportionate and fair, taking into consideration the severity of the matter and level of individual accountability and any mitigating factors, such as the context of the matter and how the individual responded. The quantum of the remuneration adjustment increases with the severity of impact and individual accountability. To ensure remuneration adjustments are proportionate to accountability, we consider various facts specific to the matter including (but not limited to) the individual’s contribution and proximity to the direct and root causes of the matter, time in role, relative level of influence, findings of previous reviews and previous adjustments for related matters. Other risk, compliance or conduct matters In addition to assessing significant matters, we also assess other matters including less material risk, compliance or conduct matters and can apply remuneration adjustments and non-financial consequences for conduct that does not meet our expectations. We set conduct standards expected of our people through our code of conduct. Our expectations are in place to support our people, culture and good conduct outcomes. They are non-negotiable and our people must comply with these, regardless of their role or responsibilities. Recognising positive risk behaviours and outcomes We recognise and reward our people who role model positive risk behaviours and outcomes. This reinforces the behaviour we expect of all of our people. We do this through a number of ways including through our recognition platform or an upward adjustment to variable reward. An upward adjustment in variable reward may be considered for exceptional risk performance not already reflected in the delivery of agreed performance objectives. In addition, Directors can recognise people who have demonstrated positive risk behaviours and outcomes. We have a mechanism in place to provide the Board and each Committee with regular visibility of people who have demonstrated positive risk behaviours. Adjustment and consequence outcomes during 2024 Senior leadersa that received downward remuneration adjustments 2 Senior leaders that received upward remuneration adjustments 9 Employees identified as not having met risk expectations during performance assessments 1,538 Employees that received downward remuneration adjustments 235 Employees leaving due to consequence outcomes 160 Actions to recognise positive risk management and risk behaviours through our recognition platform 114,350 Employees that received an additional variable reward for achieving great risk outcomes 621 a. These employees are the most senior leaders of Westpac, defined as the Chief Executive Officer, Group Executives and General Managers. |
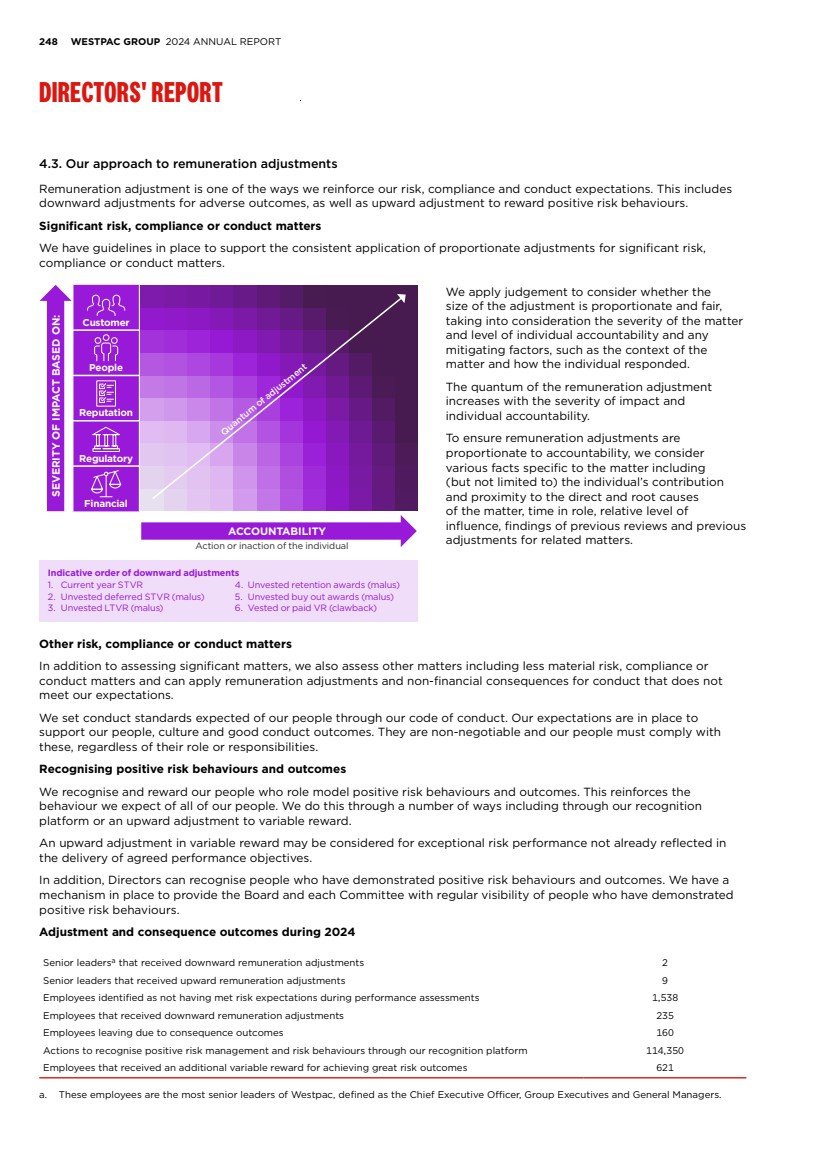
| FINANCIAL STATEMENTS EXHIBITS INDEX STRATEGIC REVIEW PERFORMANCE REVIEW SHAREHOLDER INFORMATION 249 5. Further detail on executive remuneration arrangements 5.1. Fixed remuneration The table below sets out the key design features of fixed remuneration. Fixed remuneration Purpose Provide market competitive remuneration reflecting role scope and accountabilities. Opportunity and benchmarking Set with reference to market benchmarks in the financial services industry and large corporates in Australia as appropriate. We also consider the size, responsibilities and complexity of the role, and the skills and experience of the executive. 5.2. Short term variable reward The table below sets out the key design features of the 2024 STVR. Short term variable reward Purpose Reward executives for delivering financial and non-financial annual objectives. Structure and delivery 50% of STVR is awarded in cash and 50% is deferred into equity in the form of restricted shares (or unhurdled share rights for the Group Executive based outside of Australia). One restricted share provides the holder with one Westpac ordinary share at no cost subject to trading restrictions until the time of vesting. One unhurdled share right entitles the holder to one ordinary share at the time of vesting with no exercise cost. Dividends are paid on restricted shares from the grant date. Target and maximum opportunity The target opportunity for the CEO and Group Executives is expressed as a percentage of fixed remuneration and is set at 75% of fixed remuneration (inclusive of superannuation as at 1 October 2023). The target opportunity is set considering a range of factors including market competitiveness. Target STVR: awarded for the delivery of agreed targets for financial and non-financial measures. A reduced outcome can be determined for threshold performance. Maximum STVR: up to 125% of target STVR, awarded in circumstances where outcomes are achieved over and above target. Performance measures STVR awards are determined based on meeting minimum behaviour and risk and compliance gate openers, and performance against a scorecard designed to align with shareholder interests. The STVR Scorecard comprises three components: • Values and behaviours assessment: Demonstration of behaviours in line with Westpac's values of 'Helpful, Ethical, Leading change, Performing and Simple'; • Focus areas: Performance is assessed against a balance of financial and non-financial measures that support the effective execution of Westpac’s strategy; and • Modifier: The modifier allows adjustment upwards or downwards (including to zero), for risk and reputation and people management considerations and any other matters as determined by the Board. Further information on the 2024 Group STVR Scorecard is provided in Section 3.3. Deferral period 50% of STVR is deferred into equity for a period of up to two years, which aligns executive remuneration with shareholder interests and acts as a retention mechanism. Deferred STVR vests in equal portions after one and two years, subject to service conditions and adjustment. Delayed vesting Refer to Section 5.4 for further information. Treatment of awards on cessation of employment Refer to Section 5.4 for further information. Remuneration adjustments Refer to Section 5.4 for further information. |
| 250 WESTPAC GROUP 2024 ANNUAL REPORT DIRECTORS' REPORT 5.3. Long term variable reward LTVR is comprised of two components, which are equally weighted, comprising LTVR restricted rights and LTVR performance rights. The tables below set out the key design features of the 2024 LTVR awarded in January 2024, as determined by the Board in October 2023. 5.3.1. Long term variable reward restricted rights for 2024 Long term variable reward restricted rights Purpose Reward executives for sustainable risk culture and for creating shareholder value over the long term. Structure and delivery 50% of the LTVR is awarded in restricted share rights (known as restricted rights). For the CEO, 50% vest after four years and 50% vest after five years. For Group Executives, 100% vest after four years. One restricted right provides the holder with one Westpac ordinary share at the time of vesting with no exercise cost. Executives receive dividend equivalent payments as outlined below. Award opportunity The value of LTVR restricted rights awarded to the CEO and Group Executives is expressed as a percentage of fixed remuneration. The value of LTVR restricted rights is set considering a range of factors including market competitiveness. The face value of the 2024 LTVR restricted rights opportunity for the CEO and Group Executives in business roles is 70% of fixed remuneration (inclusive of superannuation as at 1 October 2023). The face value of the LTVR restricted rights opportunity for Group Executives in functional roles is 55% of fixed remuneration (inclusive of superannuation as at 1 October 2023). Allocation methodology The number of restricted rights each executive receives will be determined by dividing the dollar value of the LTVR restricted rights award by the face value of a restricted right. The face value of a restricted right is the five day VWAP up to the commencement of the performance period (which is 1 October 2023 for the 2024 LTVR grant). Performance condition The restricted rights are subject to performance conditions which are assessed prior to the grant and prior to vesting. These assessments are known as the pre-grant assessment and the pre-vest assessment. The assessment is focused on maintaining or improving Group risk culture. The assessment will be primarily based on the assessment of collective Group risk culture as part of the Board’s annual attestation to APRA required under Prudential Standard CPS 220 Risk Management, which is a multi factorial, evidence based process. A prudential soundness gate applies. The Board will also consider if there have been any significant risk outcomes or any serious misconduct that have not been sufficiently addressed through performance management or STVR outcomes. Step 1: Assessment of risk factors 1. Prudential soundness gate: Has Westpac remained safe and secure, taking into account capital position and liquidity? Prudential soundness is measured through the common equity tier 1 capital ratio, liquidity coverage ratio and the net stable funding ratio. 2. Group risk culture: Has Group risk culture maturity been maintained or improved, considering both executive actions or inactions? The risk culture assessment involves a series of inputs, a review process and a Board assessment of Group risk culture. 3. Significant risk outcomes: Have risk outcomes arisen that have a significant and material impact on the Group, not sufficiently addressed elsewhere? 4. Serious misconduct: Has Westpac suffered from a serious misconduct issue, not sufficiently addressed elsewhere? Step 2: Consider Board discretion Considerations to guide the application of discretion and the overall assessment include: • The materiality of the adverse impact on Westpac’s financial position, or reputation, or customers, or shareholders, or employees or regulatory standing. • Whether the outcome was specific to Westpac, the banking industry or the broader market. • The extent to which performance and reward outcomes are already impacted (e.g. through remuneration adjustments), at a collective or individual level. • Whether any adjustment should be made on a collective or individual basis. Given the focus on maintaining or improving Group risk culture over the performance period, adjustments are unlikely at the pre-grant assessment and any potential adjustment is more likely at the pre-vest assessment. Assessment of performance outcomes LTVR restricted rights are assessed against risk culture at grant and following a four year performance period. The assessment of performance includes an assessment of risk factors and considers Board discretion. Dividend equivalent payments Dividend equivalent payments are payable to the extent that LTVR vests. For LTVR restricted rights, these are accrued for the performance period and the further deferral period after the performance period (if applicable), and paid at the end of the deferral period. Dividend equivalent payments are calculated by multiplying the number of LTVR restricted rights eligible to vest by the declared dividend price on each respective record date during the applicable period. The calculation excludes franking credits. Exercise period Vested rights may be exercised up to a maximum of two years from the vesting date of the award and will be auto-exercised if not exercised within the period. The exercise price for the rights is zero. No re-testing There is no re-testing. Awards that have not vested after the peformance period are lapsed. Early vesting Unvested awards may vest (unless prevented by law) before the performance test date in the event of a change of control in Westpac as determined at the discretion of the Board or where employment ceases due to death or disability. Delayed vesting Refer to Section 5.4 for further information. Treatment of awards on cessation of employment Refer to Section 5.4 for further information. Remuneration adjustments Refer to Section 5.4 for further information. |
| FINANCIAL STATEMENTS EXHIBITS INDEX STRATEGIC REVIEW PERFORMANCE REVIEW SHAREHOLDER INFORMATION 251 5.3.2. Long term variable reward performance rights for 2024 Long term variable reward performance rights Purpose Reward executives for creating shareholder value over the long term. Structure and delivery 50% of the LTVR is awarded in performance share rights (known as performance rights) which vest after six years for the CEO and five years for Group Executives. One performance right provides the holder with one Westpac ordinary share at the time of vesting with no exercise cost. Executives receive dividend equivalent payments as outlined below. Award opportunity The value of LTVR performance rights awarded to the CEO and Group Executives is expressed as a percentage of fixed remuneration. The value of LTVR performance rights is set considering a range of factors including market competitiveness. The face value of the 2024 LTVR performance rights opportunity for the CEO and Group Executives in business roles is 70% of fixed remuneration (inclusive of superannuation as at 1 October 2023). The face value of the LTVR performance rights opportunity for Group Executives in functional roles is 55% of fixed remuneration (inclusive of superannuation as at 1 October 2023). Allocation methodology The number of performance rights each executive receives will be determined by dividing the dollar value of the LTVR performance rights award by the face value of a performance right. The face value of a performance right is the five day VWAP up to the commencement of the performance period (which is 1 October 2023 for the 2024 LTVR grant). Performance condition LTVR performance rights are subject to a relative TSR performance condition that aims to achieve long term growth in shareholder value and support alignment between executive reward and shareholder interests. Relative TSR is a measure of the total return delivered to shareholders over the performance period assuming dividends are reinvested, relative to that of peers. The performance condition measures Westpac’s TSR performance against eight Australian financial services companies using a percentile ranking vesting schedule as outlined below. Westpac’s TSR performance Indicative vesting percentage At the 75th percentile or higher 100% Between the median and the 75th percentile Pro-rata vesting between 50% and 100% At the median 50% Below the median 0% The comparator group of companies comprise: AMP Limited, Australia & New Zealand Banking Group Limited, Bank of Queensland Limited, Bendigo and Adelaide Bank Limited, Commonwealth Bank of Australia, Macquarie Group Limited, National Australia Bank Limited and Suncorp Group Limited. The Board retains discretion to amend the comparator group and determine the overall vesting outcome as appropriate. Assessment of performance outcomes LTVR performance rights are subject to relative TSR performance following a four year performance period. The relative TSR result is calculated independently to ensure external objectivity before being provided to the Board to determine the vesting outcome. The Board may exercise discretion in determining the final vesting outcome. Dividend equivalent payments Dividend equivalent payments are payable to the extent that LTVR vests. For LTVR performance rights, these are only accrued for the further deferral period after the performance period and paid at the end of the deferral period. Dividend equivalent payments are calculated by multiplying the number of LTVR performance rights eligible to vest by the declared dividend price on each respective record date during the applicable period. The calculation excludes franking credits. Exercise period Vested rights may be exercised up to a maximum of two years from the vesting date of the award and will be auto-exercised if not exercised within the period. The exercise price for the rights is zero. No re-testing There is no re-testing. Awards that have not vested after the performance period are lapsed. Early vesting Unvested awards may vest (unless prevented by law) before the performance test date in the event of a change of control in Westpac as determined at the discretion of the Board or where employment ceases due to death or disability. Delayed vesting Refer to Section 5.4 for further information. Treatment of awards on cessation of employment Refer to Section 5.4 for further information. Remuneration adjustments Refer to Section 5.4 for further information. 5.4. Common design features for variable reward Delayed vesting The Board has discretion (subject to law) to delay vesting of variable reward if the individual is under investigation for adverse risk or conduct events including misconduct, is the subject of or implicated in legal or regulatory proceedings, if the Board considers it reasonable to delay vesting, or if delayed vesting is otherwise required by law. Treatment of awards on cesssation of employment Unvested variable reward lapses where the CEO or a Group Executive resigns or otherwise leaves the Group (except for the reasons listed below) before vesting occurs unless the Board determines that some of the unvested variable reward should remain on foot. If the CEO or a Group Executive ceases employment because of death or total and permanent disability, all unvested variable reward immediately vests or becomes exercisable unless prevented by law. If the CEO or a Group Executive ceases employment because they retire, are retrenched or cease employment by agreed separation, unvested variable reward stays on foot subject to applicable performance conditions and subject to any reduction determined by the Board. Remuneration adjustments The Board has discretion to adjust variable reward (including current year STVR) downwards, including to zero, in specified circumstances including serious misconduct, if serious circumstances or new information come to light which mean that in the Board’s view all or part of the award was not appropriate, or where required by law or prudential standards. The Board will typically apply the adjustment to unvested deferred STVR where an adjustment to current year STVR is considered insufficient or unavailable, followed by an adjustment to unvested LTVR where an adjustment to current and deferred STVR is considered insufficient or unavailable. Clawback may also apply to vested variable reward, to the extent legally permissible and practicable. Refer to Section 4.3 for further information on our approach to remuneration adjustments. |
| 252 WESTPAC GROUP 2024 ANNUAL REPORT DIRECTORS' REPORT 5.5. Executive minimum shareholding requirements and current compliance The CEO and Group Executives are required to build and maintain a significant Westpac shareholding to strengthen alignment with shareholder interests. LTVR restricted rights and LTVR performance rights are not included in the calculation of shareholdings until performance conditions are met. At 30 September 2024, the CEO and Group Executives comply with or are on track to meet the requirements. Aspect of the requirements Description Requirement level CEO: Two times fixed remuneration including superannuation. Group Executives: One times fixed remuneration including superannuation. Sale restrictions Executives are restricted from selling vested equity, other than for the purpose of meeting tax obligations, as follows: • For LTVR awards granted from 1 October 2021 onwards, until the required shareholding level is met; and • For STVR awards, where the required shareholding level is not met at the end of the accumulation period. Accumulation period Within five years of 1 October 2022 (i.e. by 1 October 2027), or appointment to their role, whichever is later. The Board Remuneration Committee retains discretion to make adjustments in exceptional circumstances. Calculation of shareholdings Unvested LTVR (including restricted rights and performance rights) is not included in the calculation of shareholdings until performance conditions are met. Other shareholdings are recognised. This includes: • Shares held in an employee share plan (including deferred STVR); • Shares held outright in the individual’s name either solely or jointly with another person; and • Shares held in a family trust or a self-managed superannuation fund. 5.6. Hedging policy Participants in Westpac’s equity plans are prohibited from entering, either directly or indirectly, into hedging arrangements for unvested awards. No financial products may be used to mitigate the risk associated with these awards. Any attempt to hedge awards will result in forfeiture and the Board may consider other disciplinary action. These restrictions satisfy the requirements of the Corporations Act which prohibits hedging of unvested awards. 5.7. Employment agreements The remuneration and other terms of employment for the CEO and Group Executives are formalised in their employment agreements. Each agreement provides for the payment of fixed remuneration (including superannuation contributions), variable reward and other benefits such as death and disablement insurance cover. The table below details the key terms including termination provisions of the employment agreements for the CEO and Group Executives. Term Conditions Duration of agreement Ongoing until notice given by either party. Notice (by the executive or the Group) to terminate employment 12 months.a Termination payments on termination without causeb Deferred STVR (which may be awarded on a pro rata basis for the part year served) and unvested LTVR will be treated in accordance with the applicable equity plan rules, and will remain subject to remuneration adjustments if the award is retained. Termination for cause Occurs immediately for misconduct. Deferred STVR and LTVR is forfeited, noting the Board has discretion to determine otherwise. Post-employment restraints CEO: 12 months non-compete and non-solicitation restraints. Group Executives: 6 months non-compete and 12 months non-solicitation restraints. a. Payment in lieu of notice may in certain circumstances be approved by the Board for some or all of the notice period. b. The maximum aggregate liability for termination benefits in respect of notice periods for the CEO and Group Executives at 30 September 2024 was $12.5 million (2023: $11.0 million). |
| FINANCIAL STATEMENTS EXHIBITS INDEX STRATEGIC REVIEW PERFORMANCE REVIEW SHAREHOLDER INFORMATION 253 6. Non-executive Director remuneration 6.1. Structure and policy Non-executive Director fees are not related to Westpac’s results. Fees are paid in cash and no discretionary payments are made for performance. Non-executive Directors are required to build and maintain a minimum shareholding from their own funds to align their interests with those of shareholders (refer to Section 6.3 for further details). The table below sets out the components of Non-executive Director remuneration. Non-executive Director remuneration Base fees Relate to service on the Westpac Banking Corporation Board. The base fee for the Chair covers all responsibilities, including for Board Committees. Committee fees Additional fees are paid to Non-executive Directors (other than the Board Chair) for chairing or being a member of Board Committees, other than the Board Nominations & Governance Committee. Employer superannuation contributions Reflects statutory superannuation contributions which are capped at the superannuation maximum contributions base as prescribed under the superannuation guarantee legislation. 6.2. Non-executive Director remuneration in 2024 The table below sets out the annual Board and standing Committee fees (exclusive of superannuation). Changes in Board and Committee composition during the year are set out in the overview of Directors' meetings in Section 9 of the Directors' report. For 2024, $3.3 million (72%) of the fee pool was used. The fee pool of $4.5 million per annum was approved by shareholders at the 2008 Annual General Meeting and includes employer superannuation contributions. The members of the Nominations & Governance Committee do not receive any additional fees for their roles on the Committee. Base and Committee fees Annual fee $ (exclusive of superannuation) Chair 823,000 Other Non-executive Directors 215,000 Committee Chair fees Board Audit Committee 69,000 Board Risk Committee 69,000 Board Remuneration Committee 59,000 Committee membership fees Board Audit Committee 31,000 Board Risk Committee 31,000 Board Remuneration Committee 28,000 During the year, we benchmarked Non-executive Director fees. As a result, we increased all Committee fees to $34,000. We also increased the Board Remuneration Committee Chair fee to $69,000 to align to market, reflecting increased regulatory complexity in financial services remuneration oversight. Both changes are effective from 1 October 2024. Non-executive Directors may also receive fees for additional duties which are paid at a per meeting rate of $2,000 for Committee members and $4,000 for Committee Chairs (excluding superannuation). During the reporting period, Peter Nash received additional fees of $12,000 for responsibilities and participation in a Due Diligence Committee and Margaret Seale received additional fees of $20,000 for assistance in recruitment of the new Chair. In addition, to support the technology transformation being delivered through the UNITE program, a UNITE Oversight Group was established in May 2024 comprising three Non-executive Directors (Nerida Caesar, Andy Maguire and Peter Nash). To recognise the additional workload, these Non-executive Directors each receive an additional fee of $34,000 (excluding superannuation) per annum effective from 1 June 2024. 6.3. Non-executive Director minimum shareholding requirement Non-executive Directors are required to build and maintain a holding in Westpac ordinary shares with a value not less than the Board base fee (and in case of the Chair, the Chair's fee), within five years of appointment to the Board. At 30 September 2024, all Non-executive Directors comply with or are on track to meet the requirement. |
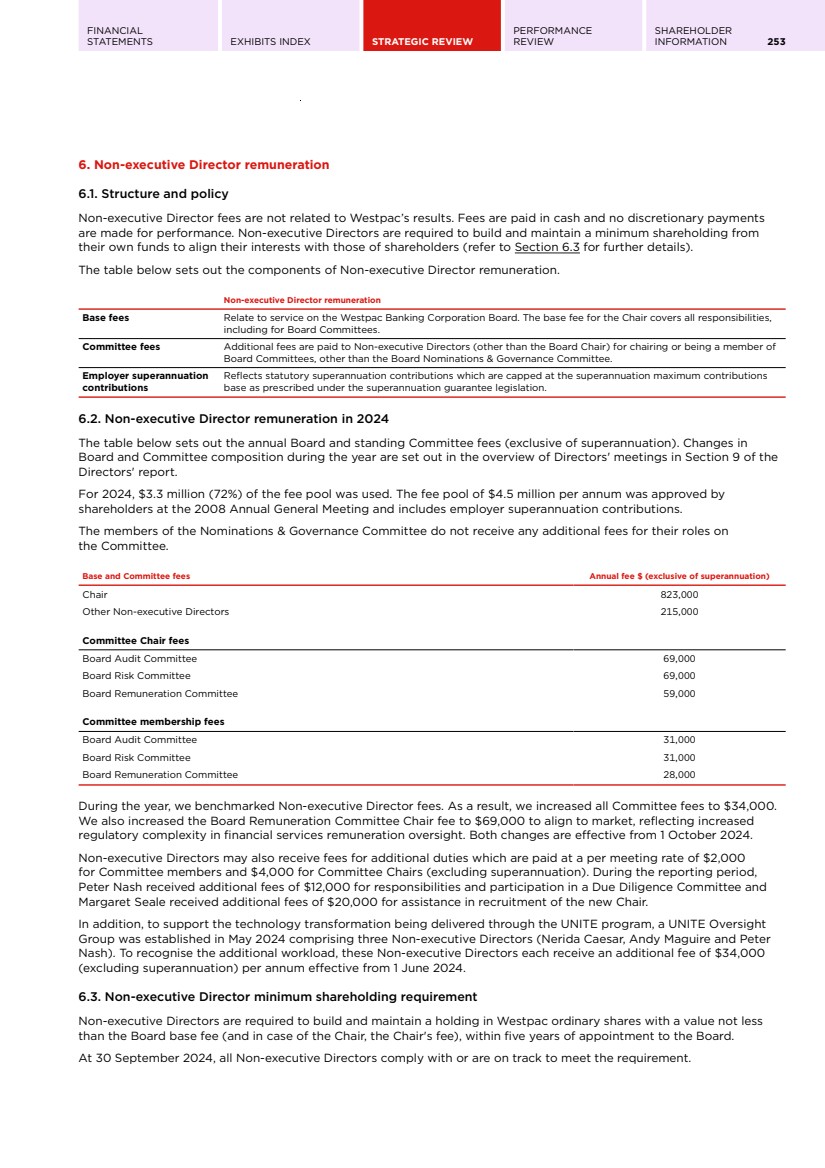
| 254 WESTPAC GROUP 2024 ANNUAL REPORT DIRECTORS' REPORT 7. Statutory remuneration details 7.1. Details of Non-executive Director remuneration The table below details Non-executive Director remuneration. Short-term benefits Post-employment benefits Westpac Banking Corporation Board feesa Non-monetary benefitsb Superannuation Total Name $ $ $ $ Current Non-executive Directors Steven Gregg, Chairc 2024 680,727 5,893 30,017 716,637 2023 --------------------- Not a KMP in 2023 --------------------- Tim Burroughs 2024 269,410 - 28,054 297,464 2023 138,123 - 14,163 152,286 Nerida Caesar 2024 258,208 - 27,674 285,882 2023 240,392 - 24,901 265,293 Audette Exel AO 2024 316,232 - 28,211 344,443 2023 302,177 - 26,020 328,197 Andy Maguirec 2024 53,631 - 6,168 59,798 2023 --------------------- Not a KMP in 2023 --------------------- Peter Nash 2024 339,478 - 28,316 367,795 2023 316,177 - 25,851 342,028 Nora Scheinkestel 2024 340,346 - - 340,346 2023 306,951 - 25,076 332,027 Margaret Seale 2024 263,977 - 26,459 290,436 2023 270,731 - 25,452 296,183 Michael Ullmer AO 2024 300,846 - 8,214 309,060 2023 134,764 - 6,323 141,087 Former Non-executive Directors John McFarlanec 2024 170,927 1,756 4,761 177,444 2023 824,177 8,335 25,909 858,421 Chris Lynchc 2024 56,904 - 6,155 63,059 2023 275,177 - 25,846 301,023 Total fees 2024 3,050,685 7,649 194,029 3,252,364 2023d 3,082,704 8,335 210,822 3,301,861 a. Includes base fees, Committee fees and any other fees. b. Non-monetary benefits are determined on the basis of the cost to the Group including associated fringe benefits tax (FBT) where applicable and includes bank funded car parking. c. The information relates to the period the individual was a KMP. Refer to Section 2 for further details. d. Total fees for 2023 shown as reported in the 2023 Annual Report. The total fees for 2023 include individuals that are not KMP in 2024 and therefore their individual remuneration is not included in the above table. |
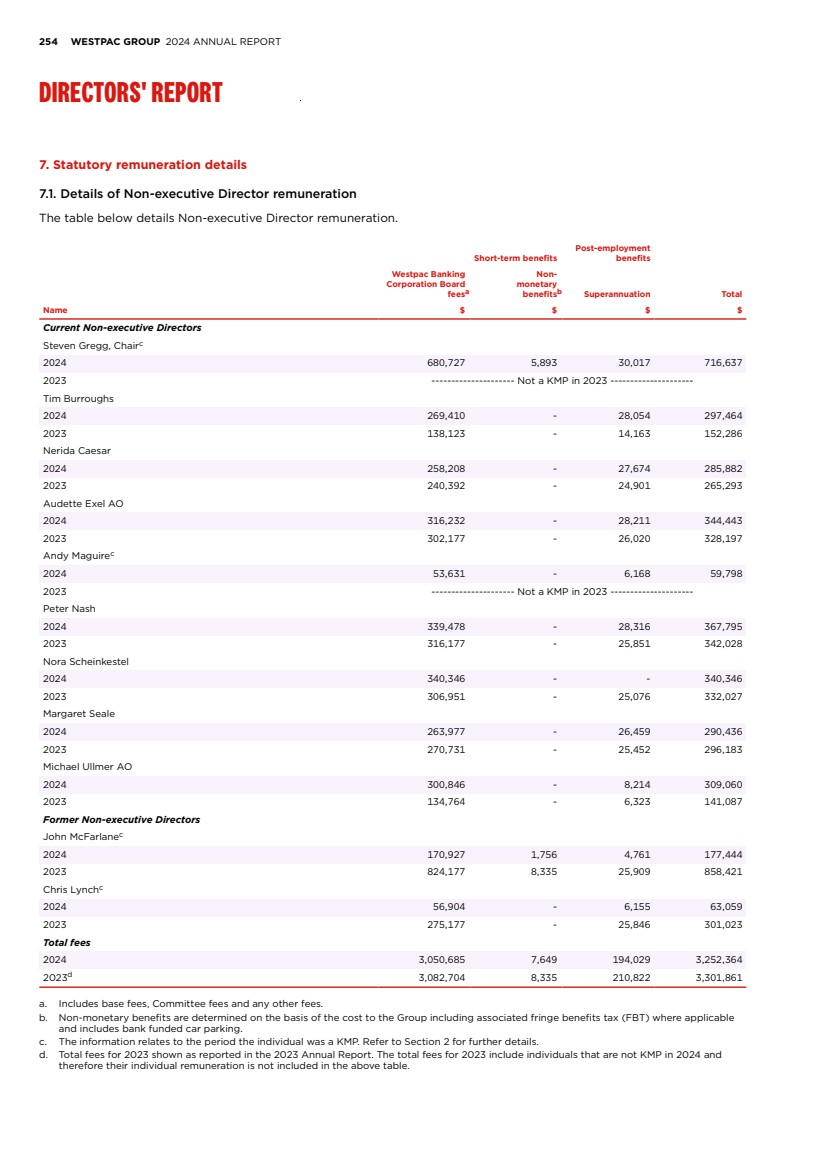
| FINANCIAL STATEMENTS EXHIBITS INDEX STRATEGIC REVIEW PERFORMANCE REVIEW SHAREHOLDER INFORMATION 255 7.2. Statutory remuneration details – Chief Executive Officer and Group Executives The table below details remuneration for the CEO and Group Executives prepared and audited in accordance with Australian Accounting Standards. Short term benefits Post-employment benefits Other long term benefits Share-based payments Fixed remunerationa Cash STVR awardb Non-monetary benefitsc Other paymentsd Superannuation benefitse Long service leave Restricted sharesf Restricted rightsg Performance rightsg Totalh $ $ $ $ $ $ $ $ $ Managing Director & Chief Executive Officer Peter King, Managing Director & Chief Executive Officeri 2024 2,418,943 975,000 20,823 - 48,249 22,024 1,198,595 728,328 1,521,487 6,933,449 2023 2,437,773 1,125,000 30,873 - 45,676 37,773 982,267 - 1,084,059 5,743,421 Group Executives Scott Collary, Chief Information Officer 2024 1,300,753 508,500 8,333 - 34,739 21,537 563,784 241,512 740,674 3,419,832 2023 1,187,292 508,500 19,658 - 33,161 18,593 806,081 - 631,647 3,204,932 Nell Hutton, Chief Executive, Westpac Institutional Bank 2024 1,230,101 502,000 5,359 - 35,046 17,352 1,132,285 238,441 105,932 3,266,516 2023 ------------------------------------------------------- Not a KMP in 2023 ------------------------------------------------------- Carolyn McCann, Group Executive, Customer & Corporate Services 2024 1,038,679 437,500 5,359 - 36,479 15,727 398,684 198,233 482,393 2,613,054 2023 1,014,216 380,000 5,631 - 29,927 21,684 329,981 - 449,375 2,230,814 Catherine McGrath, Chief Executive Officer, Westpac New Zealand 2024 857,768 311,189 8,386 - 119,894 - - 523,182 388,367 2,208,786 2023 816,255 350,356 11,050 - 114,168 - - 281,725 308,247 1,881,801 Anthony Miller, Chief Executive, Business & Wealth 2024 1,279,390 478,000 3,315 166,277 37,898 19,056 684,787 238,441 717,728 3,624,892 2023 1,195,992 611,000 4,489 404,713 35,432 21,539 851,380 - 610,124 3,734,669 Christine Parker, Group Executive, Human Resources 2024 1,045,623 417,000 3,315 - 32,976 16,896 401,268 152,684 524,412 2,594,174 2023 995,877 392,000 3,306 - 30,305 15,183 353,590 - 534,136 2,324,397 Michael Rowland, Chief Financial Officer 2024 1,249,398 500,500 3,315 - 34,007 18,870 465,327 186,823 579,245 3,037,485 2023 1,207,072 446,500 4,888 - 31,278 19,038 404,955 - 494,888 2,608,619 Jason Yetton, Chief Executive, Consumer 2024 1,200,082 443,000 3,315 - 38,009 19,050 539,012 238,441 770,574 3,251,483 2023 1,175,407 611,000 4,489 - 35,495 22,119 559,508 - 702,392 3,110,410 Ryan Zanin, Chief Risk Officer 2024 1,663,065 674,000 151,817 116,682 2,097 25,268 730,310 249,101 541,063 4,153,403 2023 1,737,772 503,500 81,424 594,277 9,482 25,453 319,974 - 429,219 3,701,101 a. Fixed remuneration is the total cost of cash salary, salary sacrificed benefits and an accrual for annual leave. Superannuation in excess of the maximum contribution base that is paid as cash is also included. b. The cash STVR award is typically paid in December following the end of the financial year. A downward adjustment was applied to the cash and deferred portions of the 2024 STVR award for one Group Executive based on an assessment of leadership behaviours. c. Non-monetary benefits are determined on the basis of the cost to the Group (including associated FBT, where applicable) and may include annual health checks, provision of taxation advice, bank funded car parking, executive life insurance as well as relocation costs and travel allowances. Cash relocation allowances are recognised as an expense from the commencement date as a KMP to the end of a clawback period. d. Includes payments on termination or other contracted amounts for current KMP. The cash portion of buy out arrangements is recognised as an expense from commencement date as a KMP to the end of the deferral period. For Anthony Miller, the cash buy out arrangement was agreed on 25 March 2021, 29% of the cash portion of the buy out was paid in 2024 and the remaining cash portions of the award are due to be paid through to March 2025. For Ryan Zanin, the cash buy out arrangement was agreed on 30 August 2022, 31% of this award was paid in 2024 and the remaining portions of the award are due to be paid through to December 2024. e. Includes Group life and salary continuance insurance cover provided at no cost to the individual. Superannuation benefits have been calculated consistent with AASB 119 Employee Benefits. f. The amortisation approach for restricted shares commences from the service period when the award was earned through to the end of the deferral period. A portion of the restricted shares held by Scott Collary, Nell Hutton and Anthony Miller represent an allocation made to compensate them for remuneration foregone from their previous employer on resignation to join Westpac. The restricted shares replicate the deferral periods of the equity foregone. g. Equity-settled remuneration is based on the amortisation over the performance and the deferral period. It is calculated using the fair value at the grant date of hurdled and unhurdled share rights granted during the financial year up to 30 September 2024. Fair value is calculated |
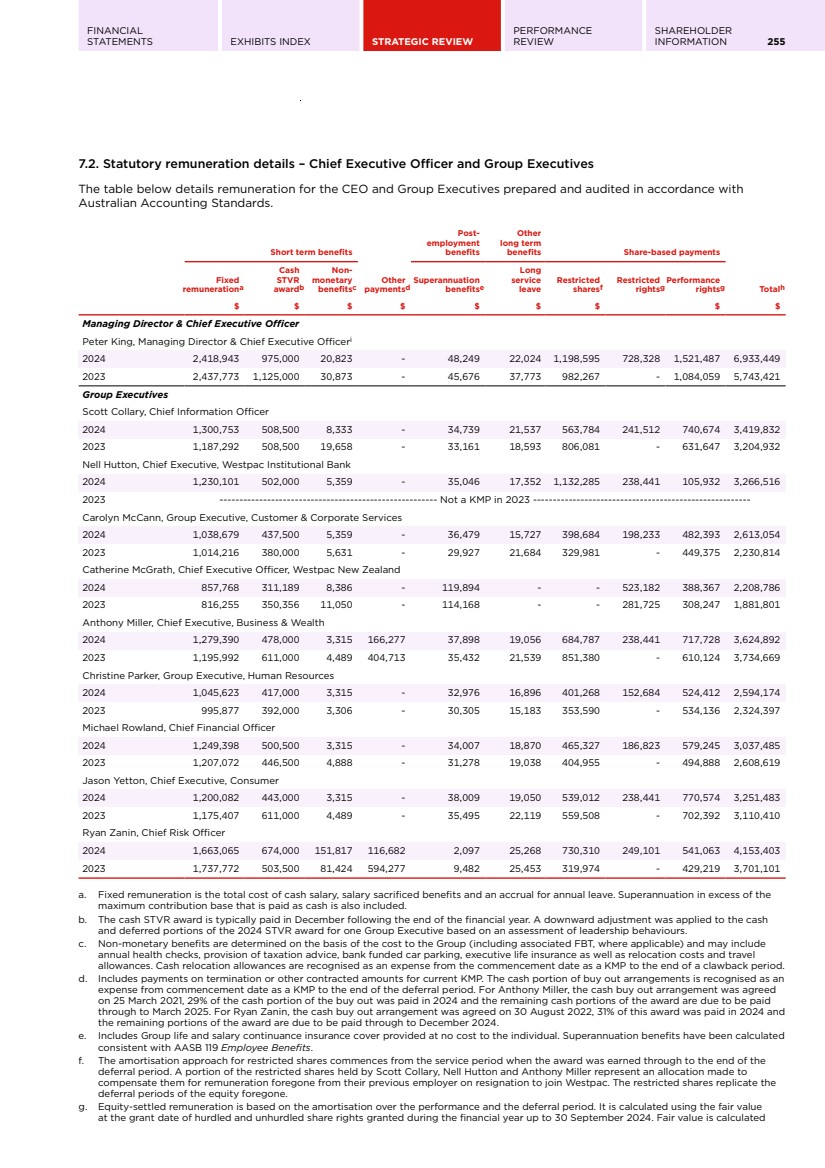
| 256 WESTPAC GROUP 2024 ANNUAL REPORT DIRECTORS' REPORT using an external valuation based on the invitation opt out date. The 2024 value for Catherine McGrath includes 38% attributed to deferred STVR awards. h. The table includes remuneration details of individuals that are KMP for 2024, whereas the totals presented in Note 34 to the financial statements includes former KMP who ceased as KMP in 2023. The percentage of total remuneration which is performance related (i.e. cash STVR plus share-based payments) was: Peter King 64%, Scott Collary 60%, Nell Hutton 61%, Carolyn McCann 58%, Catherine McGrath 55%, Anthony Miller 58%, Christine Parker 58%, Michael Rowland 57%, Jason Yetton 61% and Ryan Zanin 53%. The percentage of total remuneration delivered in the form of share rights was: Peter King 32%, Scott Collary 29%, Nell Hutton 11%, Carolyn McCann 26%, Catherine McGrath 41%, Anthony Miller 26%, Christine Parker 26%, Michael Rowland 25%, Jason Yetton 31% and Ryan Zanin 19%. i. Peter King intends to retire as CEO on 15 December 2024. His 2024 statutory remuneration includes $3,448,410 related to the amortisation of share-based payments. As a result of his intention to retire on 15 December 2024, the amortisation of these share-based payments (restricted shares, restricted rights and performance rights) is being recognised over an accelerated vesting period. This resulted in additional accounting amortisation of $850,382 recognised in 2024 across all share-based payments. The remaining accounting amortisation relating to these awards will be recognised in 2025. The full value will be recognised for these awards over this accelerated vesting period regardless of whether the awards ultimately vest. The awards remain subject to the existing performance conditions and may or may not vest subject to meeting these performance conditions. Refer to the ASX release dated 9 September 2024 for further information of Peter King’s exit arrangement. In addition, in July 2024, Peter King received the standard service recognition award of $3,000 for when an employee reaches 30 years of service at Westpac. |

| FINANCIAL STATEMENTS EXHIBITS INDEX STRATEGIC REVIEW PERFORMANCE REVIEW SHAREHOLDER INFORMATION 257 7.3. Movement in equity-settled instruments during the year The table below shows the movements in the number and value of equity instruments for the CEO and Group Executives during 2024. Name Type of equity-based instrument Number granteda Number vestedb Number exercisedc Value granted $ d Value exercised $ e Value forfeited or lapsed $ e Managing Director & Chief Executive Officer Peter King Restricted shares 48,806 40,821 - 1,132,299 - - Restricted rights 82,977 - - 1,925,066 - - Performance rights 82,978 - - 1,062,948 - 2,228,805 Group Executives Scott Collary Restricted shares 22,060 67,576 - 511,792 - - Restricted rights 42,863 - - 994,422 - - Performance rights 42,864 - - 549,088 - - Nell Hutton Restricted shares 54,229 8,983 - 1,258,113 - - Restricted rights 42,318 - - 981,778 - - Performance rights 42,319 - - 542,106 - - Carolyn McCann Restricted shares 16,485 13,715 - 382,452 - - Restricted rights 35,182 - - 816,222 - - Performance rights 35,183 - - 450,694 - 873,728 Catherine McGrath Unhurdled share rights 16,597 7,223 - 360,951 - - Restricted rights 31,670 - - 734,744 - - Performance rights 31,670 - - 405,693 - - Anthony Miller Restricted shares 26,507 65,029 - 614,962 - - Restricted rights 42,318 - - 981,778 - - Performance rights 42,319 - - 542,106 - - Christine Parker Restricted shares 17,006 15,222 - 394,539 - - Restricted rights 27,098 - - 628,674 - - Performance rights 27,098 - - 347,125 - 1,107,043 Michael Rowland Restricted shares 19,370 18,073 - 449,384 - - Restricted rights 33,157 - - 769,242 - - Performance rights 33,158 - - 424,754 - - Jason Yetton Restricted shares 26,507 25,969 - 614,962 - - Restricted rights 42,318 - - 981,778 - - Performance rights 42,319 - - 542,106 - 1,519,196 Ryan Zanin Restricted shares 43,534 4,851 - 1,009,989 - - Restricted rights 44,210 - - 1,025,672 - - Performance rights 44,211 - - 566,343 - - a. Restricted rights and performance rights granted to the CEO are approved by shareholders at the Annual General Meeting each year under ASX Listing Rule 10.14. We do not grant options. We award deferred STVR in the form of restricted shares (or unhurdled share rights for KMP in New Zealand). 2023 deferred STVR was awarded on 19 January 2024 for the CEO and Group Executives, the deferral period commenced on 1 October 2023, 50% of the award vested on 1 October 2024 and 50% will vest on 1 October 2025 (subject to service conditions and remuneration adjustments). b. No performance rights granted in 2019 vested in October 2023 when assessed against the relative TSR performance condition. 100% of the deferred STVR due to vest in 2023 vested at the end of the deferral period. For Scott Collary, 45,879 of the 67,576 restricted shares that vested were in relation to a buy out award which represents 61% of the total number of shares allocated for that award which has now vested in full. For Anthony Miller, 46,798 of the 65,029 restricted shares that vested were in relation to a buy out award which represents 38% of the total number of shares allocated for that award and the remaining portions of the award are due to vest through to March 2025. For Nell Hutton, the restricted shares that were granted relate to awards for her prior role before becoming a KMP. c. Vested share rights granted prior to September 2023 may be exercised up to a maximum of 15 years from their commencement date. Vested share rights granted after September 2023 may be exercised up to two years following the vesting date, otherwise the share rights will be auto-exercised at the end of the term. d. For performance rights, the value granted represents the number of securities granted multiplied by the fair value per instrument as set out in the table in the sub-section titled ‘Overview of unvested equity awards’. For restricted shares and restricted rights, the value granted represents the number of rights granted multiplied by the closing price of a Westpac ordinary share on the date the awards were granted ($23.20). These values, which represent the full value of the equity-based awards made to the CEO and Group Executives in 2024, do not reconcile with the amount shown in the table in Section 7.2 which shows the amount amortised in the current year. The minimum total value of the grants for future financial years is zero and an estimate of the maximum possible total value in future financial years is the fair value, as shown above. This includes Ryan Zanin’s additional grant of restricted shares and their estimated maximum possible total value is the fair value of $500,000. e. The value of each share right exercised, forfeited or lapsed is calculated based on the closing price of a Westpac ordinary share on the date of exercise (or forfeiture or lapse). The overall values reflect forfeitures or lapses as a result of a failure to meet performance conditions. |
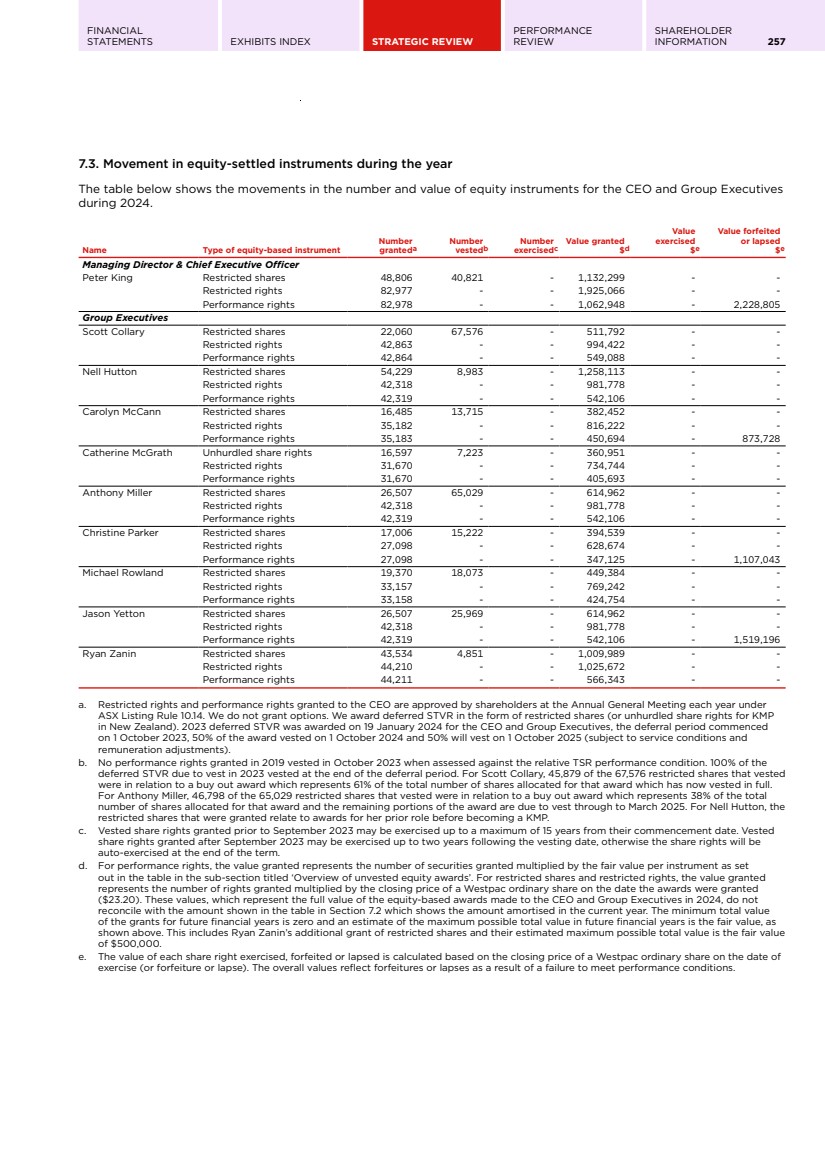
| 258 WESTPAC GROUP 2024 ANNUAL REPORT DIRECTORS' REPORT 7.3.1 Overview of unvested equity awards The table below outlines key details of unvested STVR and LTVR as at 30 September 2024 awarded to the CEO and Group Executives while in KMP roles1 .. All awards are subject to service conditions, performance conditions (where applicable), deferral periods and remuneration adjustments. Further details of the awards can be located in prior Annual Reports. Fair values Fair values are determined in accordance with the requirements of AASB 2 Share-based Payment. For STVR and LTVR restricted rights, the fair value is calculated using the closing price of the grant date, which for accounting purposes is the invitation opt out date. For LTVR performance rights, fair values are independently calculated by PFS Consulting at the grant date (which is the invitation opt out date) using a Monte Carlo simulation pricing model. Allocation values The value granted to executives for remuneration purposes differs from the fair value used for accounting purposes. For STVR grants, the allocation is determined by dividing the dollar value of the STVR award by the five day VWAP up to the grant date. Refer to Section 5.2 for further details of STVR. For LTVR grants, the allocation is determined by dividing the dollar value of the LTVR awards by the face value of a share right. The face value of a share right is the five day VWAP up to the commencement of the performance period. Refer to Section 5.3 for further details of LTVR. Award name Grant date Performance period start date Performance period end date Deferral period end date Expiry Fair value Performance conditions 2023 STVR 19 Jan 2024 1 Oct 2022 30 Sep 2023 1 Oct 2024 (tranche one) and 1 Oct 2025 (tranche two) N/A $23.20 Service (noting STVR Scorecard assessment was completed) 2022 STVR 15 Dec 2022 1 Oct 2021 30 Sep 2022 1 Oct 2024 (tranche two) N/A $23.50 Service (noting STVR Scorecard assessment was completed) 2024 LTVR performance rights 19 Jan 2024 1 Oct 2023 30 Sep 2027 CEO: 15 Nov 2029 Group Executives: 15 Nov 2028 CEO: 15 Nov 2031 Group Executives: 15 Nov 2030 $12.81 Relative TSR 2024 LTVR restricted rights 19 Jan 2024 1 Oct 2023 30 Sep 2027 CEO: 50% on 15 Nov 2027 (tranche one) and 50% on 15 Nov 2028 (tranche two) Group Executives: 15 Nov 2027 CEO: 15 Nov 2029 (tranche one) and 15 Nov 2030 (tranche two) Group Executives: 15 Nov 2029 $23.20 Pre-vest assessment of risk culture (noting a pre-grant assessment was completed) 2023 LTVR performance rights 15 Dec 2022 1 Oct 2022 30 Sep 2026 25 Oct 2026 1 Oct 2037 $11.90 Relative TSR 2022 LTVR performance rights CEO: 16 Dec 2021 Group Executives: 15 Dec 2021 1 Oct 2021 30 Sep 2025 1 Nov 2025 1 Oct 2036 CEO: $5.81 Group Executives: $5.82 Relative TSR 2021 LTVR performance rightsa CEO: 16 Dec 2020 Group Executives: 11 Dec 2020 1 Oct 2020 30 Sep 2024 31 Oct 2024 1 Oct 2035 CEO: $6.35 Group Executives: $6.40 Relative TSR a. We tested the 2021 LTVR performance rights on 1 October 2024. Our TSR for the 4 year performance period was 113% resulting in a 50th percentile ranking relative to the comparator group. This resulted in 50% of the 2021 LTVR award vesting. 1. In addition, Anthony Miller was granted a buy out award on 8 April 2021 at a fair value of $18.73 that will vest in March 2025. Carolyn McCann was granted an additional 2022 LTVR award on 4 March 2022 to recognise an expanded role at a fair value of $8.05. Ryan Zanin's pro rata 2022 LTVR award was granted on 17 May 2022 at a fair value of $9.32 given his commencement date with Westpac was in April 2022, which was after the grant of 2022 LTVR to other Group Executives in December 2021. Ryan Zanin was awarded a grant of restricted shares of $500,000 on 19 January 2024 at a fair value of $23.20. The award recognises the importance of his role in completing a critical risk management and risk culture transformation, and increases alignment with shareholders through greater equity holdings. The award is subject to a service condition until January 2026 and remuneration adjustments and scheduled to vest in three tranches on January 2026, January 2028 and January 2029. |
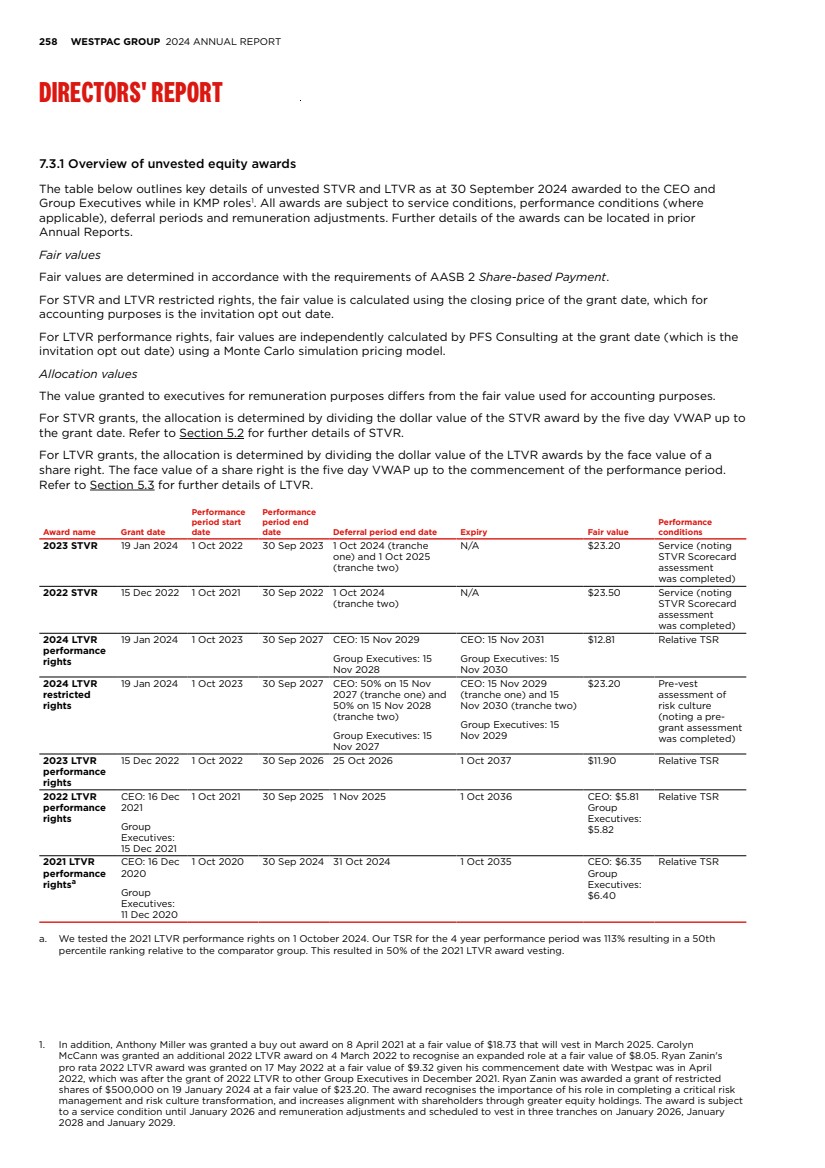
| FINANCIAL STATEMENTS EXHIBITS INDEX STRATEGIC REVIEW PERFORMANCE REVIEW SHAREHOLDER INFORMATION 259 7.4. Details of Westpac equity holdings of Non-executive Directors The table below sets out details of relevant interests in Westpac ordinary shares held by Non-executive Directors (including their related parties) during the year ended 30 September 20241 .. Number held at start of the year Changes during the year Number held at end of the year Current Non-executive Directors Steven Gregga n/a - 75,208 Tim Burroughs 67,302 - 67,302 Nerida Caesar 13,583 - 13,583 Audette Exel AO 11,562 390 11,952 Andy Maguirea n/a - - Peter Nash 15,360 - 15,360 Nora Scheinkestel 14,874 2,351 17,225 Margaret Sealeb 26,158 - 26,158 Michael Ullmer AOc 12,570 - 12,570 Former Non-executive Directors John McFarlanea 50,000 - n/a Chris Lyncha,d 13,090 - n/a a. The information relates to the period the individual was a KMP. Refer to Section 2 for further details. b. In addition to holding ordinary shares, Margaret Seale and her related parties held interests in 100 Westpac Capital Notes 7 (ASX: WBCPJ) at year end. c. In addition to holding ordinary shares, Michael Ullmer AO and his related parties held interests in 800 Westpac Capital Notes 5 (ASX: WBCPH), 300 Westpac Capital Notes 9 (ASX: WBCPL) and 1,000 Westpac Subordinated Notes at year end. d. In addition to holding ordinary shares, Chris Lynch and his related parties held interests in 1,137 Westpac Capital Notes 5 (ASX: WBCPH) as at his retirement date of 14 December 2023. 1. Other than as disclosed above, no share interests include non-beneficially held shares. |
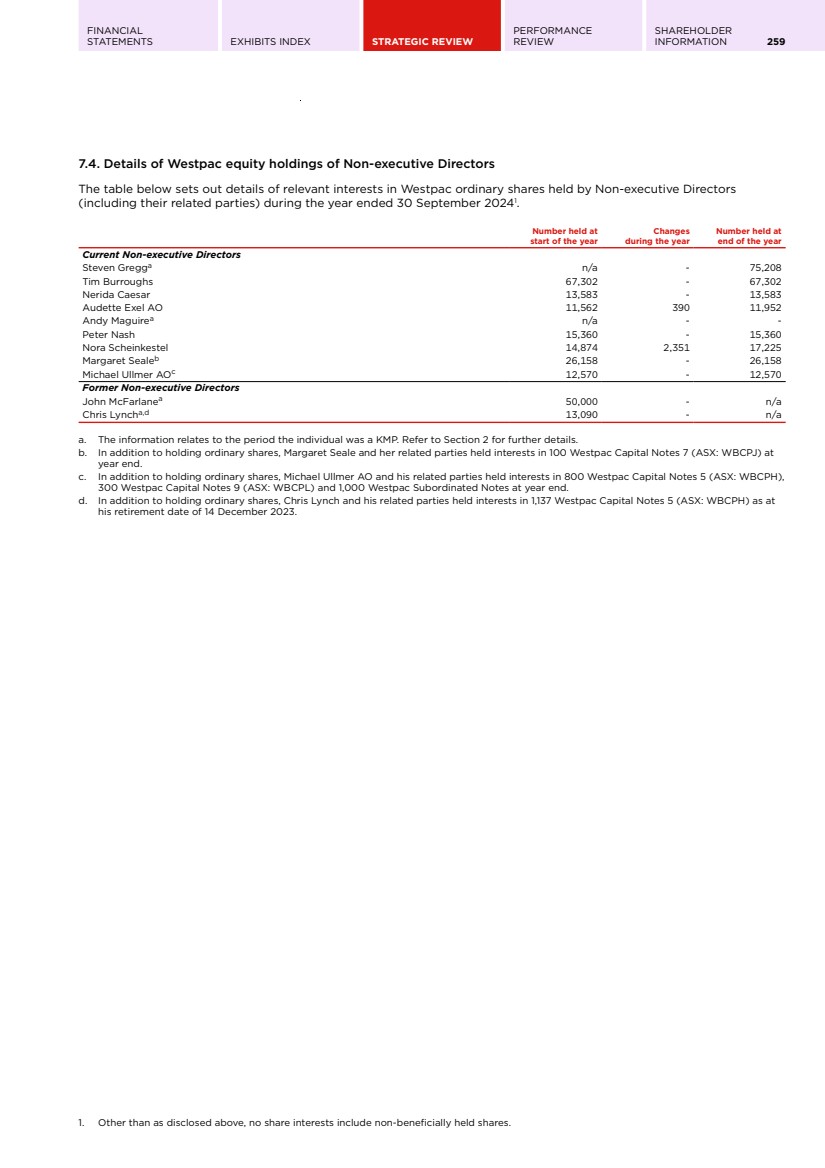
| 260 WESTPAC GROUP 2024 ANNUAL REPORT DIRECTORS' REPORT 7.5. Details of Westpac equity holdings of executive Key Management Personnel The table below details Westpac equity held and movement in that equity by the CEO and Group Executives (including their related parties) for the year ended 30 September 20241 .. Name Type of equity-based instrument Number held at start of the yeara Number granted during the year as remuneration Received on exercise and/or exercised during the year Number forfeited or lapsed during the yearb Other changes during the year Number held at end of the year Number vested and exercisable at end of the year Managing Director & Chief Executive Officer Peter King Ordinary shares 213,527 48,806 - - - 262,333 - Restricted rights - 82,977 - - - 82,977 - Performance rights 570,644 82,978 - (101,348) - 552,274 - Group Executives Scott Collary Ordinary shares 118,483 22,060 - - - 140,543 - Restricted rights - 42,863 - - - 42,863 - Performance rights 315,956 42,864 - - - 358,820 - Nell Hutton Ordinary shares 119,814 54,229 - - (8,983) 165,060 - Restricted rights - 42,318 - - - 42,318 - Performance rights - 42,319 - - - 42,319 - Carolyn McCann Ordinary shares 94,606 16,485 - - - 111,091 - Restricted rights - 35,182 - - - 35,182 - Performance rights 230,274 35,183 - (39,815) - 225,642 - Catherine McGrath Ordinary shares - - - - - - - Unhurdled share rights 14,874 16,597 - - - 31,471 7,223 Restricted rights - 31,670 - - - 31,670 - Performance rights 133,483 31,670 - - - 165,153 - Anthony Miller Ordinary shares 159,756 26,507 - - - 186,263 - Restricted rights - 42,318 - - - 42,318 - Performance rights 307,152 42,319 - - - 349,471 - Christine Parker Ordinary shares 53,401 17,006 - - - 70,407 - Restricted rights - 27,098 - - - 27,098 - Performance rights 279,248 27,098 - (52,293) - 254,053 - Michael Rowland Ordinary shares 36,146 19,370 - - - 55,516 - Restricted rights - 33,157 - - - 33,157 - Performance rights 250,480 33,158 - - - 283,638 - Jason Yetton Ordinary shares 51,939 26,507 - - - 78,446 - Restricted rights - 42,318 - - - 42,318 - Performance rights 366,861 42,319 - (54,471) - 354,709 - Ryan Zanin Ordinary shares 9,702 43,534 - - - 53,236 - Restricted rights - 44,210 - - - 44,210 - Performance rights 150,934 44,211 - - - 195,145 - a. Ordinary shares held at the start of the year have been revised to reflect updated balances during the current reporting period for two KMP. b. Forfeitures or lapses during the year are as a result of a failure to meet performance conditions. 1. The highest number of shares held by an individual in the table is 0.0076% of total Westpac ordinary shares outstanding as at 30 September 2024. |
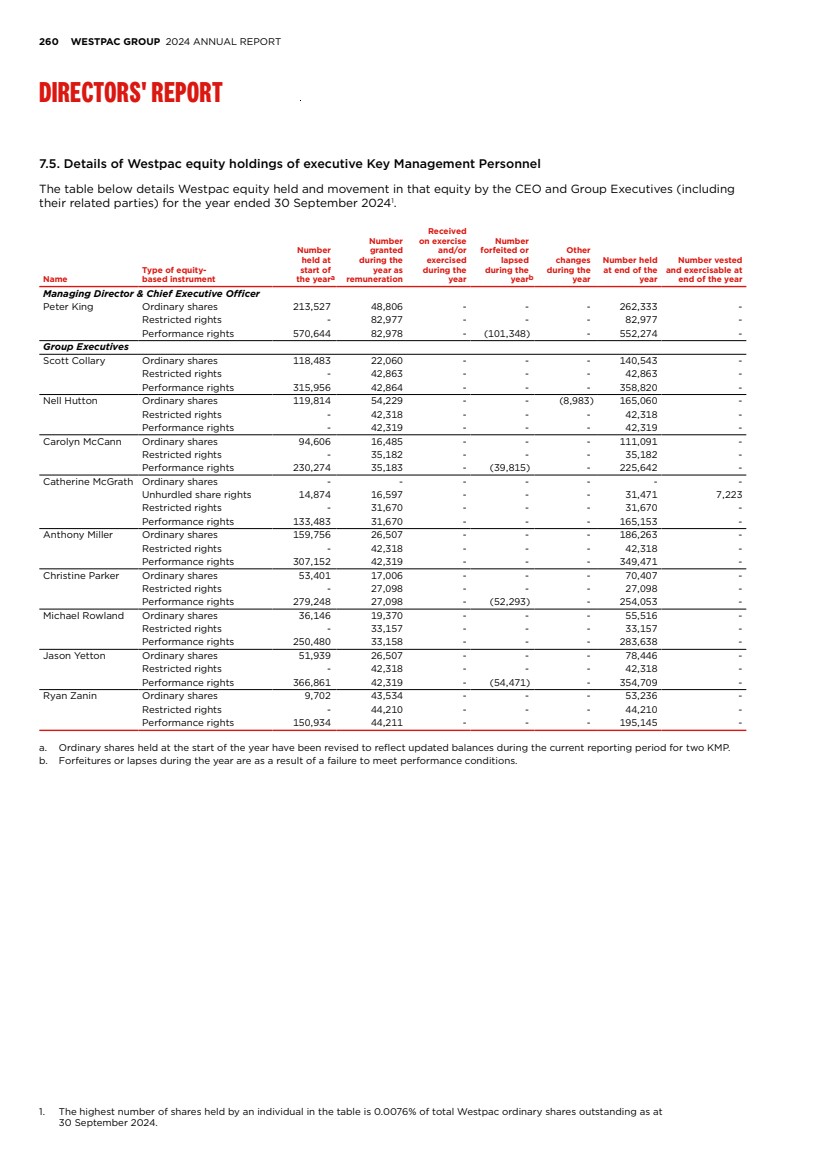
| FINANCIAL STATEMENTS EXHIBITS INDEX STRATEGIC REVIEW PERFORMANCE REVIEW SHAREHOLDER INFORMATION 261 7.6. Loans to Non-executive Directors and executive Key Management Personnel Financial instrument transactions are provided in the ordinary course of business. These transactions are at arm's-length on terms and conditions as they apply to all employees. The table below details loans to Non-executive Directors, the CEO and Group Executives (including their related parties) of the Group. Balance at start of the year $ a Interest paid and payable for the year $ Interest not charged during the year $ Balance at end of the year $ Number in Group at end of the year Non-executive Directors 4,507,501 191,280 - 3,012,367 3 CEO and Group Executives 30,377,545 839,000 - 29,051,817 7 Total 34,885,046 1,030,280 - 32,064,184 10 a. Balances at start of the year have been revised for updated balances during the reporting period. The table below details KMP (including their related parties) with aggregate loans above $100,000 during 2024. Balance at start of the year $ a Interest paid and payable for the year $ Interest not charged during the year $ Balance at end of the year $ Highest indebtedness during the year $ Non-executive Directors Peter Nash 2,364,821 149,359 - 2,498,978 3,023,589 Nora Scheinkestel n/a - - 100,000 1,600,000 Margaret Seale 620,442 29,989 - 413,389 655,094 Former Non-executive Directors Chris Lynchb 1,522,238 11,932 - n/a 1,522,238 CEO and Group Executives Peter King 1,158,000 10,492 - 1,158,000 1,159,175 Scott Collary 2,294,958 40,606 - 2,166,513 2,289,315 Nell Hutton 14,441,500 303,040 - 14,432,940 14,471,500 Carolyn McCann 3,396,296 121,040 - 3,250,672 3,401,353 Anthony Miller 2,277,513 8,591 - 1,389,164 3,716,759 Christine Parker 5,434,278 269,863 - 5,396,236 5,471,019 Jason Yetton 1,375,000 85,368 - 1,258,292 1,425,371 a. Balances at start of the year have been revised for updated balances during the reporting period. b. The information relates to the period the individual was a KMP. Refer to Section 2 for further details. Other transactions relating to KMP Accrual for dividend equivalent payments The non-current liability owing as a result of dividend equivalent payments that have been accrued for the 2024 LTVR restricted rights was $381,700 as at 30 September 2024. Details of the LTVR restricted rights can be found in Section 5.3.1. |
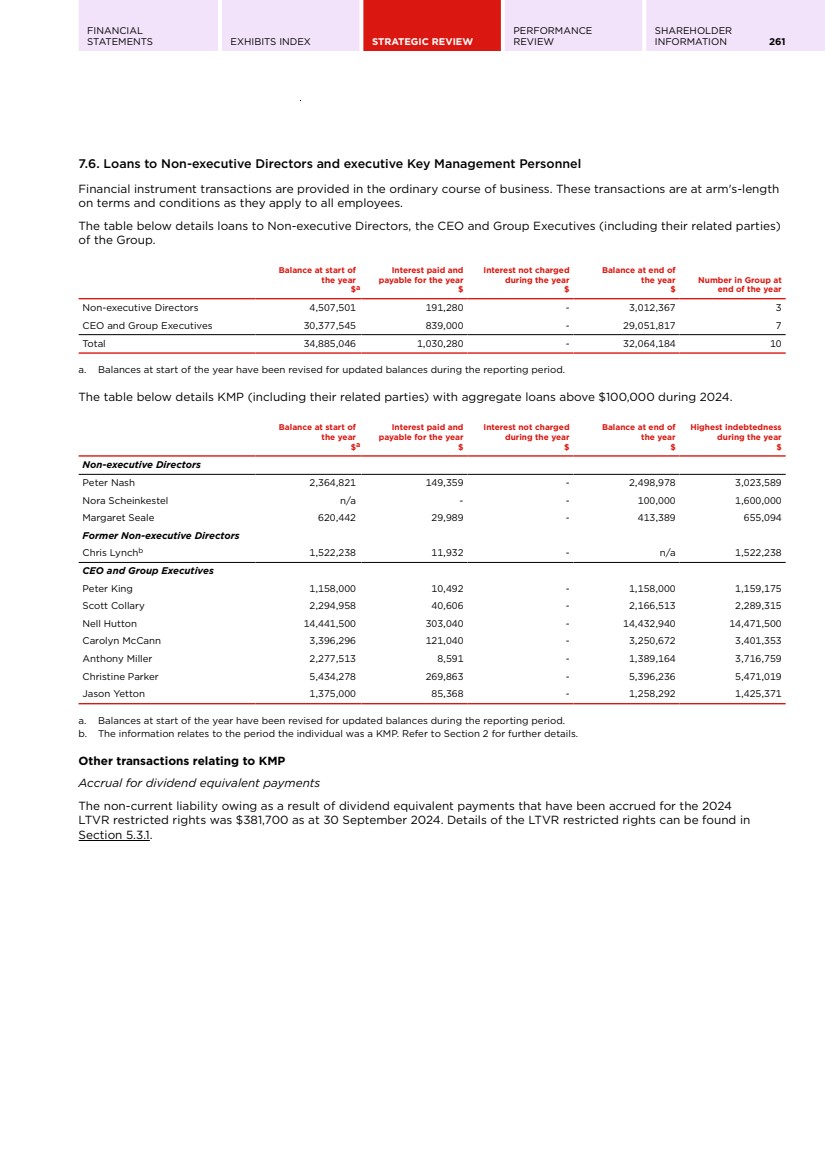
| 262 WESTPAC GROUP 2024 ANNUAL REPORT DIRECTORS' REPORT Auditor Non-audit services We may decide to engage PwC on assignments additional to their statutory audit duties where their expertise or experience with Westpac or a controlled entity is important. Details of the non-audit service amounts paid or payable to PwC for non-audit services provided during the 2024 and 2023 financial years are set out in Note 33 (page 121) to the financial statements. PwC also provides audit and non-audit services to non-consolidated entities, non-consolidated trusts of which a Westpac Group entity is trustee, manager or responsible entity and non-consolidated superannuation funds or pension funds. The fees in respect of these services were approximately $6.6 million in total (2023: $8.7 million). PwC may also provide audit and non-audit services to other entities in which Westpac holds a minority interest and which are not consolidated. Westpac is not aware of the amount of any fees paid to PwC by those entities. Westpac has a policy on engaging PwC, details of which are set out in its 2024 Corporate Governance Statement in the section ‘Engagement of the external auditor’. The Board has considered the position and, in accordance with the advice received from the Board Audit Committee, is satisfied that the provision of the non-audit services during 2024 by PwC is compatible with the general standard of independence for auditors imposed by the Corporations Act. The Directors are satisfied, in accordance with advice received from the Board Audit Committee, that the provision of non-audit services by PwC, as set out above, did not compromise the auditor independence requirements of the Corporations Act for the following reasons: • all non-audit services provided by PwC for the year have been reviewed by the Board Audit Committee, which is of the view that they do not impact the impartiality and objectivity of PwC; and • based on Board quarterly independence declarations made by PwC to the Board Audit Committee during the year, none of the services undermine the general principles relating to auditor independence including reviewing or auditing PwC’s own work, acting in a management or a decision-making capacity for the company, acting as advocate for the company or jointly sharing economic risk and rewards. The Directors’ Report is signed in accordance with a resolution of the Board of Directors. Steven Gregg Chairman 3 November 2024 Peter King Managing Director & Chief Executive Officer 3 November 2024 |
| FINANCIAL STATEMENTS EXHIBITS INDEX STRATEGIC REVIEW PERFORMANCE REVIEW SHAREHOLDER INFORMATION 263 INFORMATION ON WESTPAC Significant developments Westpac significant developments – Australia Changes to Chairman, CEO and Board of Directors On 14 December 2023, at the conclusion of the AGM, Mr Steven Gregg succeeded Mr McFarlane as Chairman of the Board following Mr McFarlane’s retirement. On 9 September 2024, Westpac announced that Anthony Miller will succeed Peter King as CEO and Managing Director, effective 16 December 2024 following Mr King’s retirement as CEO and Managing Director. Independent Non-executive Director Chris Lynch retired from the Board at the conclusion of the AGM on 14 December 2023. On 15 July 2024, Mr Andy Maguire commenced as an independent Non-executive Director of the Board. On market buyback As at 30 September 2024, Westpac had completed $1.8 billion of the $2.5 billion on-market share buyback previously announced, with 67.7 million Westpac shares purchased at an average price of $26.78. The shares bought back were subsequently cancelled. On 4 November 2024, Westpac announced an increase in the amount of Westpac shares it intends to buyback by up to a further $1.0 billion, to an aggregate total buyback amount of up to $3.5 billion of Westpac shares. Westpac reserves the right to vary, suspend or terminate the buyback at any time. External auditor rotation On 8 March 2024, Westpac announced that KPMG was the preferred firm to be appointed as Westpac’s external auditor for the 2025 financial year, beginning 1 October 2024. This appointment is subject to the approval of Westpac shareholders at the 2024 AGM. Technology simplification On 27 March 2024, Westpac provided an update on its technology simplification project, UNITE, a multi-year program of work commenced in FY24. Closure of RAMS to new business On 6 August 2024, Westpac announced that it had completed its strategic review of RAMS Financial Group Pty Limited (RAMS) and would close RAMS to new home loan applications. Existing RAMS customers continue to be serviced, and their loans remain in place. Regulatory and risk developments Enforceable undertaking on risk governance remediation, Integrated Plan and CORE program In December 2023, Westpac completed the Integrated Plan (IP) required under the enforceable undertaking (EU) entered into with APRA in December 2020 in relation to our risk governance remediation and supporting the strengthening of our risk governance, accountability and culture. In its final report issued 30 April 2024, the Independent Reviewer (Promontory Australia) confirmed that Westpac has successfully completed the IP. Promontory Australia’s final report, along with reports issued previously, are available on our website at https://www.westpac.com.au/about-westpac/ media/core/. Westpac is continuing to focus on the sustainability and effectiveness of the uplift delivered by the IP through a transition phase. APRA releases final Prudential Standard CPS 230 Operational Risk Management On 17 July 2023, APRA released the final version of the Prudential Standard CPS 230 Operational Risk Management which will come into effect from 1 July 2025. CPS 230 brings new and enhanced requirements for our operational risk management, material service provider management and business continuity planning; and we are undertaking a programme of work to assist in implementing these requirements. Details about operational risk and the consequences of failing to comply with regulatory requirements are set out in the 2024 Risk Factors. Financial crime We continue to make progress on improving our financial crime risk management with significant ongoing work, as we implement a multi-year program of work (including AML/CTF, Sanctions, Anti-Bribery and Corruption, the US Foreign Account Tax Compliance Act (FATCA) and Common Reporting Standard (CRS)). Through this work, we continue to undertake activities to strengthen our AML/CTF Program, including our Transaction Monitoring Program, and remediate and improve our financial crime controls in multiple areas including: initial, enhanced and ongoing customer due diligence and associated record keeping; upgrading customer and payment screening, enhancing transaction monitoring and associated processes; improving Electronic Funds Transfer Instruction processes; establishing data reconciliations and checks to ensure the completeness of data feeding into our financial crime systems; and improving regulatory reporting, including in relation to International Funds Transfer Instructions, Threshold Transaction Reports, Suspicious Matter Reports (including ‘tipping off’ controls), and FATCA and CRS reporting and equivalent reports in jurisdictions outside Australia. On 11 September 2024, the Anti-Money Laundering and Counter-Terrorism Financing Amendment Bill 2024 was introduced into Parliament. The Bill seeks to modernise and overhaul the AML/CTF regime, to ensure Australia continues to effectively deter, detect and disrupt financial crime. We are considering the potential impacts of the |
| 264 WESTPAC GROUP 2024 ANNUAL REPORT INFORMATION ON WESTPAC proposed Bill, including on our policies, procedures, systems and controls. With increased focus on financial crime, further areas of potential non-compliance have been, and may continue to be identified, and we continue to liaise with AUSTRAC and the ATO and local regulators in jurisdictions outside Australia, as appropriate, including to remediate findings and adopt recommendations from regulators with significant ongoing programmes of work across the Group. Details about the consequences of failing to comply with financial crime obligations are set out in the 2024 Risk Factors. Scams In September 2024, the Australian Government released draft legislation to implement the Scams Prevention Framework (SPF). The SPF outlines the responsibilities of designated sectors (initially banks, telecommunications, and digital platform service providers) to prevent, detect, report, disrupt and respond to scams in Australia. We are considering the potential impacts of the SPF if adopted as drafted, including on our policies, procedures, systems and controls. New climate reporting standards New mandatory climate-related reporting standards have been finalised by the Australian Accounting Standards Board and legislation requiring compliance has been passed by the Australian Parliament. Westpac will report against these new requirements from its financial year ending 30 September 2026. As of 4 April 2024, new SEC rules in relation to the disclosure of climate-related information that were expected to apply to Westpac from FY26 have been stayed pending the outcome of a lawsuit challenging the rules in the United States Court of Appeals for the Eighth Circuit. APRA capital requirements Operational risk capital overlays In 2019 APRA applied $1 billion of additional capital overlays to our operational risk capital requirement. These overlays were applied through an increase in risk weighted assets (RWA). On 19 July 2024, APRA announced its decision to reduce Westpac’s total operational risk capital overlay from $1 billion to $500 million. The impact of the $500 million overlay reduction on our Level 2 common equity Tier 1 (CET1) capital ratio at 30 September 2024 was an increase of 18 basis points. APRA Discussion Paper on Replacement of Additional Tier 1 Capital On 10 September 2024, APRA released a discussion paper titled “A more effective capital framework for a crisis” (APRA Discussion Paper) outlining potential amendments to APRA’s prudential framework and seeking feedback on a proposal for banks to phase out Additional Tier 1 (AT1) capital and replace it with greater amounts of Tier 2 capital and CET1 capital. The APRA Discussion Paper follows APRA’s September 2023 discussion paper relating to improving the effectiveness of AT1 capital instruments. APRA’s proposed approach (applicable to large, internationally active banks such as Westpac) would replace the existing 1.5% AT1 capital with 0.25% CET1 and 1.25% Tier 2 capital, which would see the total minimum CET1 requirement (including regulatory buffers) increase from 10.25% to 10.50%. This includes increasing the minimum CET1 requirement from 4.5% to 6.0% but offsetting this increase by removing the Advanced portion of the capital conservation buffer (CCB) of 1.25% in order to maintain a minimum Tier 1 capital ratio of 6.0% and a minimum 2.5% CCB in line with the Basel minimum standards. The proposed changes, if implemented as set out in the APRA Discussion Paper, would commence from 1 January 2027. In addition, from this date existing AT1 instruments would be eligible to be included as Tier 2 capital, until their first scheduled call date. All existing AT1 instruments (issued by any Australian bank) would reach their first scheduled call date by 2032 at the latest. APRA is seeking feedback on the APRA Discussion Paper by 8 November 2024 and intends to provide an update on the consultation process in late 2024 and formally consult on any proposed amendments to APRA’s prudential framework in 2025. Westpac significant developments – New Zealand RBNZ review of overseas bank branches On 21 August 2024 the RBNZ released the proposed Branch Standard under the Deposit Takers Act 2023 which will implement decisions made as part of the review of its policy for branches of overseas banks. The proposed Branch Standard will require that overseas bank branches only conduct business with wholesale clients; the total size of an overseas bank’s branch cannot exceed NZ$15 billion in total assets; and dual-operating branches (such as Westpac’s New Zealand Branch) only conduct business with “large” corporate and institutional clients. It is proposed that “large” means those with consolidated annual turnover of over NZ$50 million, total assets of over NZ$75 million or total assets under management of over NZ$1 billion (for funds management entities only). The implementation date is expected to be in July 2028. Westpac’s New Zealand Branch currently provides financial markets, trade finance and international payment products and services to customers referred by WNZL. We expect the RBNZ’s Branch Standard will require changes to the activities Westpac’s New Zealand Branch undertakes, and as a result, WNZL may also make changes to the scope of the activities it undertakes. General regulatory changes affecting our businesses Cyber security Regulators have continued their focus on cyber security due to high profile cyber-related incidents. APRA is seeking to ensure that regulated entities improve their cyber security practices, focusing on the effective implementation of ongoing compliance with Prudential Standard CPS 234 Information Security. APRA has been actively communicating with entities to |
| FINANCIAL STATEMENTS EXHIBITS INDEX STRATEGIC REVIEW PERFORMANCE REVIEW SHAREHOLDER INFORMATION 265 emphasise the importance of cyber resilience, including releasing two letters in June and August 2024 to regulated entities highlighting expectations about the effective implementation of cyber controls including data backups, security in configuration management, privileged access management, and security testing. Similarly, ASIC is emphasising improved cybersecurity at the companies it regulates and has indicated a focus on improving cyber resilience through proposed testing strategies. The Australian Signals Directorate and the Australian Cyber Security Centre are increasingly providing threat intelligence and tailored guidance to help organisations enhance their information security measures. We will continue to engage with regulators and the government more broadly regarding cyber-related regulation, legislation and policy. We continue to work on enhancing our systems and processes to mitigate cyber security risks, including those related to third parties, and to respond to changes in regulation. Details about operational risks and information security risks, including cyberattacks, are set out in the 2024 Risk Factors. Artificial Intelligence On 5 September 2024 the Australian Government published: • a voluntary AI Safety Standard, implementing risk- based guardrails for how Australian organisations should safely and responsibly use AI; and • a consultation for introducing mandatory guardrails on how to use AI safely and responsibly when developing and deploying AI in Australia in high-risk settings (consultation submissions closed 4 October 2024). We continue to work on enhancing our systems and processes to mitigate risks that may be amplified by AI and collaborating with industry and government to shape development of AI regulation, including by making a submission as part of the consultation. Details about operational risks and information security risks, including AI, are set out in the 2024 Risk Factors. Details about how we are leveraging the power of AI are outlined in the Technology section (page 186). Reforms to the Privacy Act On 12 September 2024, the Federal Attorney-General introduced into Parliament the Privacy and Other Legislation Amendment Bill 2024 (Cth) which implements the first tranche of agreed recommendations from the Australian Government’s Privacy Act Review. Key changes introduced by the first tranche include the following: • a new statutory tort for serious invasions of privacy; • greater transparency for individuals regarding the use of their personal information in automated decisions that impact them; • new criminal offences for the malicious release of personal data (known as doxxing); and • enhanced enforcement powers and new civil penalties which can be tailored according to the seriousness of a privacy breach. A number of proposed reforms from the Privacy Act Review have been deferred, with the expectation that a draft Tranche 2 will be developed for consultation at a later stage. Revised Banking Code of Practice On 27 June 2024, ASIC approved a new version of the Australian Banking Association’s Banking Code of Practice (the Code) with an implementation date of 28 February 2025 for each bank that has adopted the Code (including Westpac). The strengthened Code reflects the consultations both the ABA and ASIC conducted with stakeholders, consumer representatives and the BCCC, and includes uplifts to existing provisions and additional protections for small business customers, guarantors, vulnerable customers and customers requiring additional support. These updates include: • an expanded small business definition that increases the borrowing limit from $3 million to $5 million which is anticipated to provide up to 10,000 more small businesses with access to the Code protections; • a new obligation to ensure that a meeting is held with a guarantor in the absence of the borrower before signing a guarantee; • an updated vulnerability definition that expands the categories of vulnerability and recognises that a customer can become vulnerable at any time; • updated provisions for managing deceased estates; and • an uplift of the inclusivity and accessibility provisions to expressly include LGBTQIA+ persons and a new commitment to organise or refer customers to free support services. Legal proceedings Our entities are parties to legal proceedings from time to time arising from the conduct of our business. Certain litigation (including regulatory proceedings) and class actions are described as required in Note 25 to the financial statements (page 97). Supervision and regulation Australia Within Australia, we are subject to supervision and regulation by seven principal agencies and bodies: the Australian Prudential Regulation Authority (APRA); the Reserve Bank of Australia (RBA); the Australian Securities and Investments Commission (ASIC); Australian Securities Exchange Limited (ASX); the Australian Competition and Consumer Commission (ACCC); the Australian Transaction Reports and Analysis Centre (AUSTRAC) and the Office of the Australian Information Commissioner (OAIC). APRA is the prudential regulator of the Australian financial services industry. As an ADI, we report prudential information to APRA, including information in relation to capital adequacy, large exposures, credit quality and liquidity. The RBA is responsible for monetary policy, maintaining financial system stability and promoting the safety and |
| 266 WESTPAC GROUP 2024 ANNUAL REPORT INFORMATION ON WESTPAC efficiency of the payments system. The RBA is an active participant in the financial markets, manages Australia’s foreign reserves, issues Australian currency notes and serves as banker to the Australian Government. ASIC is Australia’s corporate, markets, financial services and consumer credit regulator. It is responsible for the regulation of Australian companies and consumer protection within the financial sector. ASIC is an independent Australian government body and was established under the Australian Securities and Investments Commission Act 2001 (Cth). It carries out most of its regulatory functions and supervision under the Corporations Act 2001 (Cth) (Corporations Act). ASX operates Australia’s primary national market for trading of securities issued by listed companies. Some of our securities (including our ordinary shares) are listed on the ASX and we therefore have obligations to comply with the ASX Listing Rules, which have statutory backing under the Corporations Act. The ACCC is the federal regulator responsible for the regulation and prohibition of anti-competitive and unfair market practices and mergers and acquisitions in Australia. Its broad objective is to administer the Competition and Consumer Act 2010 (Cth) and related legislation to bring greater competitiveness, fair trading, consumer protection and product safety to the Australian economy. AUSTRAC oversees the compliance of Australian reporting entities (including Westpac) with the requirements under the Anti-Money Laundering and Counter-Terrorism Financing Act 2006 (Cth) and the Financial Transaction Reports Act 1988 (Cth). These requirements include: • implementing programs for identifying and monitoring customers, and for managing the risks of money laundering and terrorism financing; • reporting suspicious matters, threshold transactions and international funds transfer instructions; and • submitting an annual compliance report. The OAIC is responsible for the regulation of privacy and information rights, including under the Privacy Act 1988 (Cth) (Privacy Act). Its functions include handling complaints about the handling of personal information, conducting investigations and undertaking enforcement actions in relation to potential breaches of the Privacy Act. New Zealand The Reserve Bank of New Zealand (RBNZ) is responsible for supervising New Zealand registered banks and protects the financial stability of New Zealand through the application of minimum prudential obligations. The New Zealand prudential supervision regime requires that registered banks publish disclosure statements, which contain information on financial performance and risk positions as well as attestations by the directors about the bank’s compliance with its conditions of registration and certain other matters. The Financial Markets Authority (FMA) and the New Zealand Commerce Commission (NZCC) are the two primary conduct and enforcement regulators. The FMA and NZCC are responsible for ensuring that markets are fair and transparent and are supported by confident and informed investors and consumers. Regulation of markets and their participants is undertaken through a combination of market supervision, corporate governance and licensing approvals. In New Zealand, other relevant regulator mandates include those relating to taxation, privacy and foreign affairs and trade. Banks in New Zealand are also subject to a number of self-regulatory regimes. Examples include Payments NZ, the New Zealand Bankers’ Association (NZBA) and the Financial Services Council (FSC). Examples of industry agreed codes include the NZBA’s Code of Banking Practice and FSC’s Code of Conduct. United States Our New York branch is a US federally licensed branch and therefore is subject to supervision, examination and regulation by the US Office of the Comptroller of the Currency and the Board of Governors of the Federal Reserve System (the US Federal Reserve) under the US International Banking Act of 1978 (IBA) and related regulations. A US federal branch must maintain, with a US Federal Reserve member bank, a capital equivalency deposit as prescribed by the US Comptroller of the Currency, which is at least equal to 5% of its total liabilities (including acceptances, but excluding accrued expenses, and amounts due and other liabilities to other branches, agencies and subsidiaries of the foreign bank). In addition, a US federal branch is subject to periodic onsite examination by the US Comptroller of the Currency. Such examination may address risk management, operations, asset quality, compliance with the record keeping and reporting, and any additional requirements prescribed by the US Comptroller of the Currency from time to time. A US federal branch of a foreign bank is, by virtue of the IBA, subject to the receivership powers exercisable by the US Comptroller of the Currency. As of 22 June 2016, we elected to be treated as a financial holding company in the US pursuant to the Bank Holding Company Act of 1956 and Federal Reserve Board Regulation Y. Our election will remain effective so long as we meet certain capital and management standards prescribed by the US Federal Reserve. Westpac and some of its affiliates are engaged in various activities that are subject to regulation by other US federal regulatory agencies, including the US Securities and Exchange Commission, US Financial Industry Regulatory Authority, the US Commodity Futures Trading Commission and the National Futures Association. Section 219 of the Iran Threat Reduction and Syria Human Rights Act of 2012 added Section 13(r) to the U.S. Securities Exchange Act of 1934, as amended, requiring each SEC reporting issuer to disclose in its annual and, if applicable, quarterly reports whether it or any of its affiliates have knowingly engaged in specified activities, transactions or dealings relating to Iran or with the Government of Iran or certain designated persons or entities involved in terrorism or the proliferation of weapons of mass destruction during the period covered |
| FINANCIAL STATEMENTS EXHIBITS INDEX STRATEGIC REVIEW PERFORMANCE REVIEW SHAREHOLDER INFORMATION 267 by the report. Section 219 requires disclosure even of certain activities not prohibited by U.S. or other law and even if such activities were conducted outside the United States by non-U.S. affiliates in compliance with local law. Westpac and WNZL have engaged in activity that is relevant for this purpose. WBC and WNZL (as a wholly owned subsidiary) maintain compliance policies and procedures to comply with all applicable economic sanctions laws and regulations. In that context, and only after confirming that such transactions did not involve prohibited or sanctionable activity under U.S. or other economic sanctions, the above Westpac Group entities outside the United States engaged in a limited number of activities reportable under Section 219 during the period covered by this annual report, as described below. No U.S. persons or entities, or entities owned or controlled by U.S. persons were involved in these activities. There are two matters requiring disclosure for this reporting period 1 October 2023 to 30 September 2024: 1. Payments to the Embassy of Iran in Australia. During 1 October 2023 to 30 September 2024, retail and business customers of WBC remitted AUD payments from their accounts at WBC to accounts of the Embassy of Iran in Australia at an unaffiliated bank in Australia. It was observed that the purpose of these transactions was generally related to consular purposes of the Embassy, such as obtaining travel visas or mandatory travel insurance for travel to Iran. WBC is not a U.S. person or owned or controlled by U.S. persons and therefore its transactions that do not include any U.S. jurisdictional elements are not subject to the Iranian Transactions and Sanctions Regulations (ITSR) at Part 560 of title 31, Code of Federal Regulations, issued by the U.S. Department of the Treasury’s Office of Foreign Assets Control. In addition, transactions that are “ordinarily incident to travel to” Iran are exempt from the ITSR (at 31 Code of Federal Regulations Section 560.210(d). All payments were facilitated through the NPP domestic payments platform. This activity contributed an insignificant amount of gross revenues and net profit to the Westpac Group. 2. Payments to the Embassy of Iran in New Zealand. During 1 October 2023 to 30 September 2024, New Zealand based customers of WNZL remitted domestic NZD payments from their accounts at WNZL to accounts of the Embassy of Iran in New Zealand at an unaffiliated bank in New Zealand. It was observed that the purpose of these transactions was generally related to diplomatic and consular duties of the Embassy. All payments were facilitated through the WNZL domestic NZD payments platform. This activity contributed an insignificant amount of gross revenues and net profit to the Group. WNZL is not a U.S. Person or owned or controlled by U.S. Persons and therefore its transactions that do not include any U.S. Jurisdictional elements are not subject to the ITSR at Part 560 of title 31, Code of Federal Regulations, issued by the U.S. Department of the Treasury's Office of Foreign Assets Control. In addition, transactions that are "ordinarily incident to travel to" Iran are exempt from the ITSR (at 31 Code of Federal Regulations Section 560.210(d)). Westpac and WNZL intend to continue to process payments to the Embassies of Iran in Australia and New Zealand but only under limited circumstances where Westpac Group believes the funds transfers conform to its compliance policies, procedures and all applicable sanctions laws and regulations. Anti-money laundering regulation and related requirements Australia Westpac has a Group-wide program to manage its obligations under the Anti-Money Laundering and Counter- Terrorism Financing Act 2006 (Cth). We continue to actively engage with the regulator, AUSTRAC, on our activities. Our Anti-Money Laundering and Counter-Terrorism Financing Policy (AML/CTF Policy) sets out how the Westpac Group complies with its legislative obligations. The AML/CTF Policy applies to all business segments and employees (permanent, temporary and third party providers) working in Australia, New Zealand and overseas. United States The USA PATRIOT Act of 2001 requires US financial institutions, including the US branches of foreign banks, to take certain steps to prevent, detect and report individuals and entities involved in international money laundering and the financing of terrorism. The required actions include verifying the identity of financial institutions and other customers and counterparties, terminating correspondent accounts for foreign ‘shell banks’ and obtaining information about the owners of foreign bank clients and the identity of the foreign bank’s agent for service of process in the US. The anti-money laundering compliance requirements of the USA PATRIOT Act include requirements to appoint a qualified BSA Officer, adopt and implement an effective anti-money laundering program, report suspicious transactions or activities, and implement due diligence procedures for correspondent and other customer accounts in line with the CDD rule. Westpac’s New York Branch and Westpac Capital Markets LLC maintain an anti-money laundering compliance program designed to address US legal requirements. US economic and trade sanctions, as administered by the Office of Foreign Assets Control (OFAC), prohibit or significantly restrict US financial institutions, including the US branches and operations of foreign banks, and other US persons from doing business with certain persons, entities and jurisdictions. Westpac’s New York Branch and Westpac Capital Markets LLC maintain compliance programs designed to comply with OFAC sanctions programs, and Westpac has a Group-wide program to ensure adequate compliance. Legal proceedings Our entities are parties from time to time in legal proceedings arising from the conduct of our business. Material legal proceedings, if any, are described in Note 25 to the financial statements and/or under the Significant |
| 268 WESTPAC GROUP 2024 ANNUAL REPORT INFORMATION ON WESTPAC developments section above. Where appropriate as required by the accounting standards, a provision has been raised in respect of these proceedings and disclosed in the financial statements. Cybersecurity management and governance The Group Chief Information Security Officer (CISO) reports to the Chief Information Officer, a member of the Executive Team. The CISO is a member of key cybersecurity governance forums and is responsible for leading and managing the cybersecurity function, setting the cybersecurity strategy and direction, and overseeing the implementation, operation and execution of the cybersecurity policies, standards, controls, and capabilities, including for third parties who are engaged to manage Westpac’s information assets. We have implemented a range of cybersecurity processes, technologies, and controls to facilitate our efforts to assess, identify, and manage such risks, including regular network and endpoint monitoring, access controls, vulnerability assessments, penetration testing, annual information security training for employees, and tabletop cybersecurity incident response exercises. We have an Incident Response Plan which guides the actions we are to take in the event of a suspected or confirmed cybersecurity incident. The plan includes processes to triage, investigate, contain, and remediate the incident. The plan is designed to contain and minimise the impact of a cybersecurity incident on our customers. We also maintain a Business Continuity Plan, which provides procedures for maintaining the continuity of critical business processes in the event of business interruption, including any that involve cybersecurity incidents which may significantly impact our operations. Our cybersecurity team is informed about and monitors the prevention, mitigation, detection and remediation of cybersecurity threats through their management of, and participation in, the strategy processes. The CISO and the cybersecurity team have relevant expertise and experience in various aspects of cybersecurity, such as strategy, governance, risk management, threat intelligence, incident response, security operations, architecture, engineering, testing and awareness. The CISO has extensive experience in information technology and cybersecurity. The cybersecurity team consists of qualified and competent professionals who have diverse backgrounds and skills in cybersecurity. The cybersecurity team regularly participates in training, education, and development programs to enhance their knowledge and skills to keep up with the evolving cybersecurity landscape. As part of its cybersecurity risk management, Westpac engages with third parties for independent reviews and assessments of its cybersecurity policies, standards, controls, and capabilities. These third parties include external auditors, industry bodies, consultants, and specialists. The purpose of these engagements is to obtain assurance, validation, benchmarking and improvement recommendations on Westpac's cybersecurity posture and maturity. Westpac holds ISO27001, PCI-DSS and SOC 2 Type 2 certifications for areas of the Group. The CISO escalates key cybersecurity risk and control issues, as appropriate, to the Technology Risk Committee (TRC) or to the appropriate Line of Business and Divisional Committees. The TRC, a senior management committee, oversees the technology function and technology risk management. The TRC reports to the Group Executive Risk Committee (GRISKCO), the executive management committee responsible for overseeing the group's strategy, performance, and risk management. The Board of Directors receives periodic updates from the CIO and the CISO regarding cybersecurity matters. The Board is ultimately responsible for the oversight of the cybersecurity risk management. The Board delegates some of its oversight responsibilities to the Board Risk Committee, which assists the Board in the oversight of cybersecurity risk management. During the period covered by this 2024 Annual Report, we have not experienced any cybersecurity incidents which have materially affected or are reasonably likely to materially affect our business strategy, results of operations, or financial condition. However, institutions like ours, as well as our employees, service providers and other third parties have experienced a significant increase in information security and cybersecurity risk in recent years and will likely continue to be the target of increasing sophisticated cyber-related attacks. Change In Registrant’s Certifying Accountant On 8 March 2024, Westpac announced that KPMG was the preferred firm to be appointed as Westpac’s external auditor for the 2025 financial year, beginning 1 October 2024. This appointment is subject to the approval of Westpac shareholders at the Westpac Annual General Meeting (AGM), scheduled for 13 December 2024. The selection and change in external auditor was adopted by the Westpac Board at the recommendation of Westpac’s Board Audit Committee following a competitive tender process. PwC was not invited to participate in this audit tender process, having regard to best practice for audit firm rotation and PwC’s tenure as the Group’s external auditor. Accordingly, PwC, subject to approval by the Westpac shareholders at the AGM of KPMG’s appointment, will resign as Westpac’s external auditor, effective from the close of that meeting. The audit reports of PwC dated 3 November 2024 and 5 November 2023 did not contain any adverse opinion or disclaimer of opinion and were not qualified or modified as to uncertainty, audit scope or accounting principles. During the fiscal years ended 30 September 2024 and 2023, there has not been any disagreement on any matter of accounting principles or practices, financial statement disclosure, or auditing scope or procedure, which disagreement, if not resolved to the satisfaction of PwC, would have caused them to make reference to the subject matter of the disagreement in connection with their reports, nor has there been an “reportable event” as described in Item 16F(a)(1)(v) of Form 20-F. Further, during the fiscal years ended 30 September 2024 and 2023, neither Westpac, nor anyone on its behalf, consulted with KPMG regarding (i) the application of |
| FINANCIAL STATEMENTS EXHIBITS INDEX STRATEGIC REVIEW PERFORMANCE REVIEW SHAREHOLDER INFORMATION 269 accounting principles to a specified transaction, either completed or proposed, or the type of audit opinion that might be rendered with respect to Westpac’s consolidated financial statements and either a written report was provided to Westpac or oral advice was provided that KPMG concluded was an important factor considered by Westpac in reaching a decision as to the accounting, auditing or financial reporting issue; or (ii) any matter that was either the subject of a disagreement, as that term is defined in Item 16F(a)(1)(iv) of Form 20-F and the related instructions, or a “reportable event” as described in Item 16F(a)(1)(v) of Form 20-F. Westpac has provided PwC with a copy of the foregoing disclosure and has requested that PwC furnish Westpac with a letter addressed to the SEC stating whether it agrees with such disclosure. A copy of the letter, dated 5 November 2024, is filed herewith as Exhibit 16.1. |

| 270 WESTPAC GROUP 2024 ANNUAL REPORT PERFORMANCE REVIEW READING THIS REPORT GROUP PERFORMANCE Performance summary Key financial information Impact of Notable Items Review of earnings Credit quality Balance sheet and funding Capital and dividends SEGMENT REPORTING REVIEW OF EARNINGS: 2023 VS 2022 RISK FACTORS Limitation on Independent Registered Public Accounting Firm’s Liability FINANCIAL STATEMENTS |

| FINANCIAL STATEMENTS EXHIBITS INDEX STRATEGIC REVIEW PERFORMANCE REVIEW SHAREHOLDER INFORMATION 271 READING THIS REPORT Disclosure regarding forward-looking statements This 2024 Annual Report contains statements that constitute ‘forward-looking statements’ within the meaning of Section 21E of the US Securities Exchange Act of 1934. Forward-looking statements are statements that are not historical facts. Forward-looking statements appear in a number of places in this 2024 Annual Report and include statements regarding our current intent, belief or expectations with respect to our business and operations, macro and micro economic and market conditions, results of operations and financial condition and performance, capital adequacy and liquidity and risk management, including, without limitation, future loan loss provisions and financial support to certain borrowers, forecasted economic indicators and performance metric outcomes, indicative drivers, climate- and other sustainability-related statements, commitments, targets, projections and metrics, and other estimated and proxy data. Words such as ‘will’, ‘may’, ‘expect’, ‘intend’, ‘seek’, ‘would’, ‘should’, ‘could’, ‘continue’, ‘plan’, ‘estimate’, ‘anticipate’, ‘believe’, ‘probability’, ‘indicative’, ‘risk’, ‘aim’, ‘outlook’, ‘forecast’, ‘assumption’, ‘projection’, ‘target’, ‘goal’, ‘guidance’, ‘objective’, ‘ambition’ or other similar words, are used to identify forward-looking statements. These statements reflect our current views on future events and are subject to change, certain known and unknown risks, uncertainties and assumptions and other factors which are, in many instances, beyond our control (and the control of our officers, employees, agents, and advisors), and have been made based on management’s current expectations or beliefs concerning future developments and their potential effect upon Westpac. Forward-looking statements may also be made, verbally or in writing, by members of Westpac’s management or Board in connection with this 2024 Annual Report. Such statements are subject to the same limitations, uncertainties, assumptions and disclaimers set out in this document. There can be no assurance that future developments or performance will align with our expectations or that the effect of future developments on us will be those anticipated. Actual results could differ materially from those we expect or which are expressed or implied in forward-looking statements, depending on various factors including, but not limited to: • information security breaches, including cyber attack events • the effect of, and changes in, laws, regulations, regulatory policy, taxation or accounting standards or practices, and government and central bank monetary policies, including changes to liquidity, leverage and capital requirements • regulatory investigations, reviews (including industry reviews) and other actions, inquiries, litigation, fines, penalties, restrictions or other regulator-imposed conditions, including from our actual or alleged failure to comply with laws, regulations or regulatory policy • the effectiveness of our risk management practices, including our framework, policies, processes, systems and employees • the reliability and security of Westpac’s technology and risks associated with changes to technology systems • geopolitical events or other changes in countries in which Westpac or its customers or counterparties operate • climate-related risks (including physical, transition and liability risks) that may arise from changing climate patterns, and risks associated with the transition to a lower carbon economy (including Westpac’s ambition to become a net-zero, climate resilient bank) or risks from legal and regulatory action, or risks from other sustainability factors such as human rights and natural capital • the failure to comply with financial crime obligations (including anti-money laundering and counter-terrorism financing laws, anti-bribery and corruption laws, sanctions laws and tax transparency laws), which has had, and could further have, adverse effects on our business and reputation • internal and external events which may adversely impact our reputation • litigation and other legal proceedings and regulator investigations and enforcement actions (including the liability of Westpac to pay significant monetary settlements and legal costs in order to resolve a dispute) • market volatility and disruptions, including uncertain conditions in funding, equity and asset markets and any losses or business impacts we or our customers or counterparties may experience • the incidence of inadequate capital levels • changes in economic conditions, consumer or business spending, saving and borrowing habits in Australia, New Zealand and other countries in which we or our customers or counterparties operate and our ability to maintain or to increase market share, margins and fees, and control expenses • adverse asset, credit or capital market conditions or an increase in defaults, impairments and provisioning because of a deterioration in economic conditions • sovereign risks, including the risk that governments will default on their debt obligations, fail to perform contractual obligations, or be unable to refinance their debts • changes to Westpac’s credit ratings or the methodology used by credit rating agencies • the effects of market competition and competition regulatory policy impacting the areas in which we operate • operational risks resulting from ineffective processes and controls • levels of inflation, changes to interest rates, exchange rates and market and monetary fluctuations and volatility • poor data quality, data availability or data retention |
| 272 WESTPAC GROUP 2024 ANNUAL REPORT READING THIS REPORT Disclosure regarding forward-looking statements (Continued) • strategic decisions including diversification, innovation, retention, divestment, acquisitions, expansion activity, integration and decisions to shut down some operations • failure to recruit and retain key executives, employees and Directors • changes to our critical accounting assumptions and estimates and changes to the value of our intangible assets; and • various other factors including those beyond Westpac’s control. The above list is not exhaustive. For certain other factors that may impact on forward-looking statements made by Westpac, refer to Risk Management (page 188) and the 2024 Risk Factors. When relying on forward-looking statements to make decisions with respect to Westpac, investors and others relying on information in this 2024 Annual Report should carefully consider the foregoing factors and other uncertainties and events. Except as required by law, we assume no obligation to revise or update any forward-looking statements in this 2024 Annual Report, whether from new information, future events, conditions, or otherwise, after the date of this 2024 Annual Report. Further important information regarding climate change and sustainability-related statements This 2024 Annual Report contains forward-looking statements and other representations relating to ESG topics, including but not limited to climate change, net zero, climate resilience, natural capital, emissions intensity, human rights and other sustainability-related statements, commitments, targets, projections, scenarios, risk and opportunity assessments, pathways, forecasts, estimated projections and other proxy data. These are subject to known and unknown risks, and there are significant uncertainties, limitations, risks and assumptions in the metrics and modelling on which these statements rely. In particular, the metrics, methodologies and data relating to climate and sustainability are rapidly evolving and maturing, including variations in approaches and common standards in estimating and calculating emissions, and uncertainty around future climate- and sustainability-related policy and legislation. There are inherent limits in the current scientific understanding of climate change and its impacts. Some material contained in this 2024 Annual Report may include information including, without limitation, methodologies, modelling, scenarios, reports, benchmarks, tools and data, derived from publicly available or government or industry sources that have not been independently verified. No representation or warranty is made as to the accuracy, completeness or reliability of such information. There is a risk that the estimates, judgements, assumptions, views, models, scenarios or projections used by Westpac may turn out to be incorrect. These risks may cause actual outcomes, including the ability to meet commitments and targets, to differ materially from those expressed or implied in this 2024 Annual Report and the 2024 Risk Factors. The climate- and sustainability-related forward-looking statements made in this 2024 Annual Report and the 2024 Risk Factors are not guarantees or predictions of future performance and Westpac gives no representation, warranty or assurance (including as to the quality, accuracy or completeness of these statements), nor guarantee that the occurrence of the events expressed or implied in any forward-looking statement will occur. There are usually differences between forecast and actual results because events and actual circumstances frequently do not occur as forecast and these differences may be material. Westpac will continue to review and develop its approach to ESG as this subject area matures. Currency of presentation, exchange rates and certain definitions In this Annual Report, ‘financial statements’ means our audited consolidated balance sheets as at 30 September 2024 and 30 September 2023 and income statements, statements of comprehensive income, changes in equity and cash flows for each of the years ended 30 September 2024, 2023 and 2022 together with accompanying notes which are included in this Annual Report. Our financial year ends on 30 September. As used throughout this Annual Report, the financial year ended 30 September 2024 is referred to as 2024 and other financial years are referred to in a corresponding manner. All dollar values in this report are in Australian dollars unless otherwise noted or the context otherwise requires, references to ‘dollars’, ‘dollar amounts’, ‘$’, ‘AUD’ or ‘A$’ are to Australian dollars. References to ‘US$’, ‘USD’ or ‘US dollars’ are to United States dollars, references to ‘NZ$’, ‘NZD’ or ‘NZ dollars’ are to New Zealand dollars and references to 'GBP' are to British Pound Sterling. Refer to Exchange rates (page 353) for information regarding the rates of exchange between the Australian dollar and the US dollar applied by Westpac as part of its operating activities for 2024, 2023 and 2022. Any discrepancies between totals and sums of components in tables contained in this Annual Report are due to rounding. Percentage (%) movements are shown as % unless otherwise stated to all the tables in this document and represent the percentage change between 2024 and 2023. Information on terms, acronyms and calculations used in this report are provided in the Glossary of Abbreviations and Defined Terms (pages 363-367). |
| FINANCIAL STATEMENTS EXHIBITS INDEX STRATEGIC REVIEW PERFORMANCE REVIEW SHAREHOLDER INFORMATION 273 Selected consolidated financial and operating data We have derived the following selected financial information, as of, and for the financial years ended, 30 September 2024, 2023 and 2022 from our consolidated financial statements and related notes, except for certain data such as market share information, and other regulatory information which are derived from filings with our regulators and are unaudited. This information should be read together with our audited consolidated financial statements and the accompanying notes included elsewhere in this Annual Report. Only the Financial Statements are audited PricewaterhouseCoopers has audited the financial statements, accompanying notes and the Consolidated Entity Disclosure Statement contained within the Financial Statements (pages 2- 135 ) of this Annual Report and has issued an unmodified audit report. All other sections of the Annual Report have not been subject to audit by PricewaterhouseCoopers. The financial information contained in this Annual Report includes information extracted from the audited financial statements together with information that has not been audited. Non-AAS financial measures Westpac’s statutory results are prepared in accordance with AAS and are also compliant with IFRS. In assessing Westpac’s performance and that of our operating segments we use a number of financial measures, including amounts, measures and ratios that are presented on a non-AAS basis, as described below. Non-AAS financial measures and ratios do not have standardised meanings under AAS. As such they are unlikely to be directly comparable to similar measures presented by other companies and should not be viewed in isolation from, or as a substitute for, the AAS results. Our non-AAS measures fall within the following categories: MEASURE/RATIO DESCRIPTION FURTHER INFORMATION Performance measures excluding the impact of Notable Items, businesses sold The net interest income, non-interest income, operating expenses and segment reporting sections of this report include performance measures that exclude Notable Items, businesses sold and/or held-for-sale. Notable Items are items that management believes are not reflective of Westpac’s ongoing business performance. Details of Notable Items are included in Impact of Notable Items (page 278). Businesses sold reflect the contribution to Westpac’s results in the period sold prior to their sale. It also includes any gains/ losses related to their sale but excludes items that have been identified as Notable Items. Performance measures which are adjusted for one or more of these items include: • Net interest income • Non-interest income (including net fee income, net wealth management and insurance income, trading income and other income) • Operating expenses (including staff expenses, occupancy expenses, technology expenses and other expenses) • Pre-provision profit • Net profit • Net profit attributable to owners of WBC • Return on average ordinary equity • Return on tangible ordinary equity Management considers this information useful as these measures provide a view that reflects Westpac’s ongoing business performance. See pages 160-161, 164-167, 276-301, 302-313, and 357-358. |
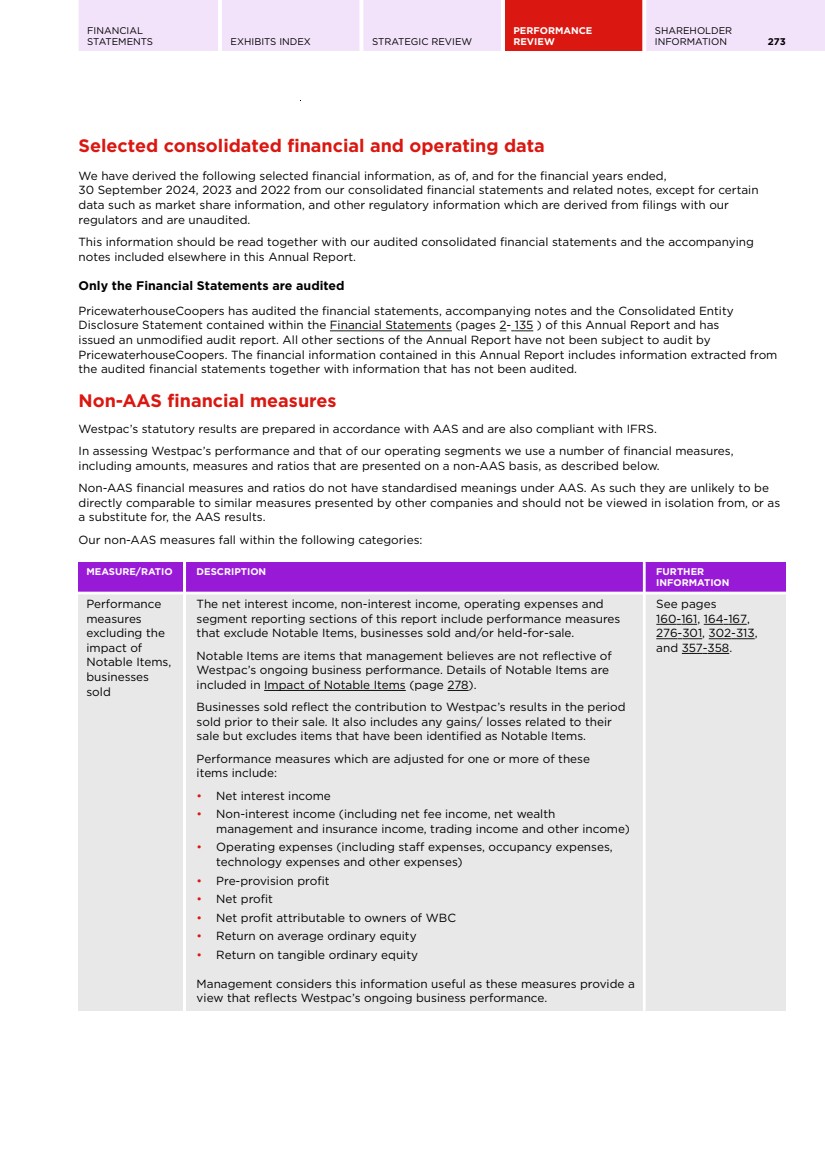
| 274 WESTPAC GROUP 2024 ANNUAL REPORT READING THIS REPORT Non-AAS financial measures (Continued) MEASURE/RATIO DESCRIPTION FURTHER INFORMATION Pre-provision profit Pre-provision profit is net profit/(loss) excluding credit impairment (charges)/benefits and income tax (expense)/benefit. This is calculated as net interest income plus non-interest income less operating expenses. This includes (charges)/benefits relating to provisions and impairment other than from expected credit losses. Management considers this information useful as this measure provides readers with a view of the impact of the operating performance of Westpac. See pages 164-167, 276-301, 302-313, and 357-358. Basic earnings per share (excluding Notable Items) and Diluted earnings per share (excluding Notable Items) Basic earnings per share (excluding Notable Items) is calculated as net profit attributable to owners of WBC (adjusted for RSP dividends) excluding Notable items divided by the weighted average number of ordinary shares on issue during the period, adjusted for treasury shares. Diluted earnings per share is calculated by adjusting the basic earnings per share (excluding Notable Items) by assuming all dilutive potential ordinary shares are converted. Management considers this information useful as these measures provide a view of the basic and diluted earnings per share based on the ongoing operating performance of Westpac. See pages 277 and 357-358 Core net interest income and core net interest margin (NIM) Core net interest income is calculated as net interest income excluding Notable Items, and Treasury and Markets income. Core NIM is calculated as core net interest income (annualised where applicable) divided by average interest earning assets. Management considers this information useful as these measures provide a view of the underlying performance of Westpac’s net interest income and margin, for lending, deposit and wholesale funding. See pages 164-167, 277 and 280. Dividend payout ratio (excluding Notable Items) Calculated as ordinary dividend paid/declared on issued shares (net of Treasury shares) divided by the net profit attributable to owners of WBC excluding Notable Items. Management considers this information useful as it provides a view of the dividend payout ratio based on the ongoing operating performance of Westpac. See pages 277 and 357-358. Expense to income ratio (excluding Notable Items) Calculated as operating expenses excluding Notable Items divided by net operating income excluding Notable Items. Management considers this information useful as this measure provides a view of the efficiency of the ongoing operating performance of Westpac. See pages 164-167, 277, 288-289 and 357-358. Average tangible ordinary equity and Return on average tangible ordinary equity (ROTE) Average tangible ordinary equity is calculated as average ordinary equity less average goodwill and other intangible assets (excluding capitalised software). Return on average tangible ordinary equity is calculated as net profit attributable to owners of WBC adjusted for RSP dividends (annualised where applicable) divided by average tangible ordinary equity. Management considers this information useful as these measures are commonly used as a performance measure by WBC, investors, analysts and others in assessing Westpac's application of equity. See pages 160-161, 164-167, 277 and 357-358. Presentation changes In 2024, we have made changes to both the composition of our segments and the measurement of segment performance. Comparatives have been restated to align to the current period presentation. Refer to Segment Reporting (pages 302-313) for further details. Certain comparative information has also been revised where appropriate to conform to changes in presentation in the current period to enhance comparability. |
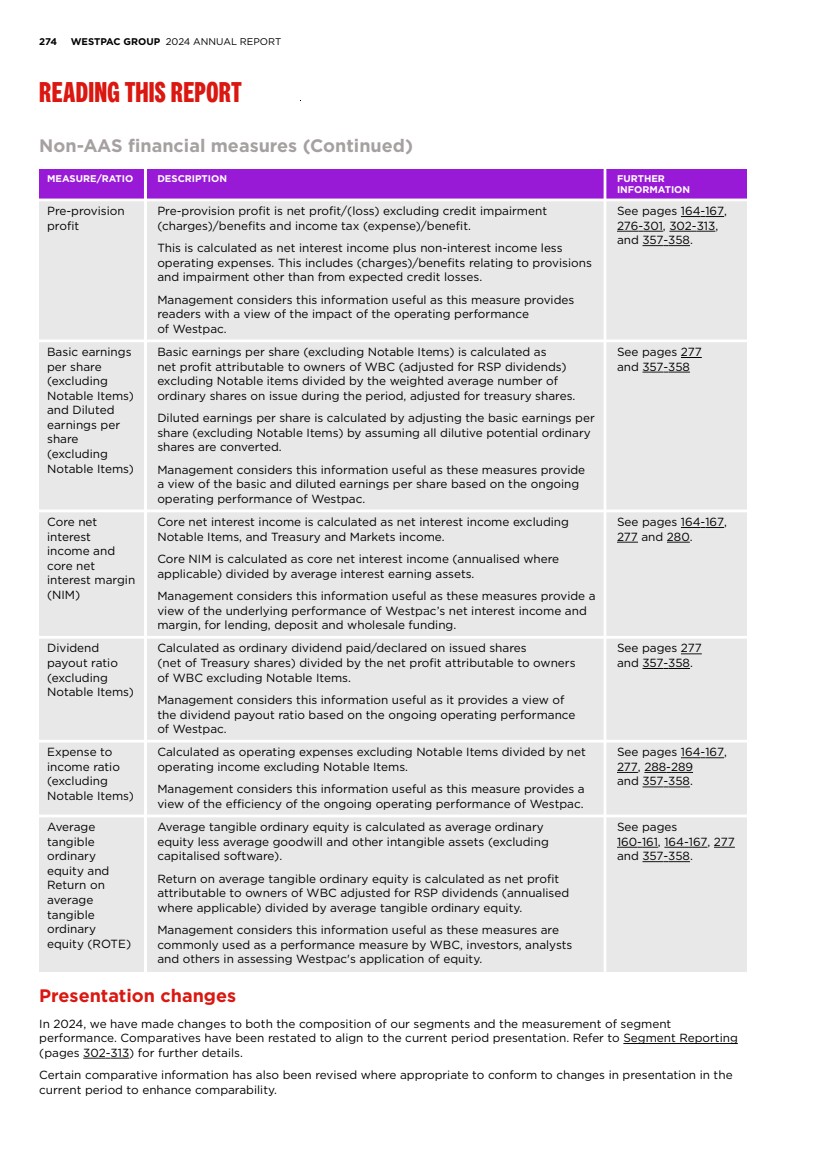
| FINANCIAL STATEMENTS EXHIBITS INDEX STRATEGIC REVIEW PERFORMANCE REVIEW SHAREHOLDER INFORMATION 275 References to websites Information contained in or accessible through the websites mentioned in this Annual Report does not form part of this Annual Report unless we specifically state that it is incorporated by reference and forms part of this Annual Report. |

| 276 WESTPAC GROUP 2024 ANNUAL REPORT GROUP PERFORMANCE Performance summary $m 2024 2023 2022 % Mov't 2024 - 2023 Net interest income 18,753 18,317 17,161 2 Non-interest income 2,835 3,328 2,445 (15) Net operating income 21,588 21,645 19,606 - Operating expenses (10,944) (10,692) (10,802) 2 Pre-provision profit 10,644 10,953 8,804 (3) Impairment (charges)/benefits (537) (648) (335) (17) Profit before income tax expense 10,107 10,305 8,469 (2) Income tax expense (3,117) (3,104) (2,770) - Profit after income tax expense 6,990 7,201 5,699 (3) Profit attributable to non-controlling interests (NCI) - (6) (5) (100) Net profit attributable to owners of WBC 6,990 7,195 5,694 (3) Notable Items (123) (173) (874) (29) Effective tax rate 30.84% 30.12% 32.71% 72 bps Performance Summary excluding Notable Items $m 2024 2023 2022 % Mov't 2024 - 2023 Net interest income 18,916 18,414 16,606 3 Non-interest income 2,847 3,128 3,299 (9) Net operating income 21,763 21,542 19,905 1 Operating expenses (10,944) (10,232) (10,181) 7 Pre-provision profit 10,819 11,310 9,724 (4) Impairment (charges)/benefits (537) (648) (335) (17) Profit before income tax expense 10,282 10,662 9,389 (4) Income tax expense (3,169) (3,288) (2,816) (4) Profit after income tax expense 7,113 7,374 6,573 (4) Profit attributable to non-controlling interests (NCI) - (6) (5) (100) Net profit attributable to owners of WBC 7,113 7,368 6,568 (3) |
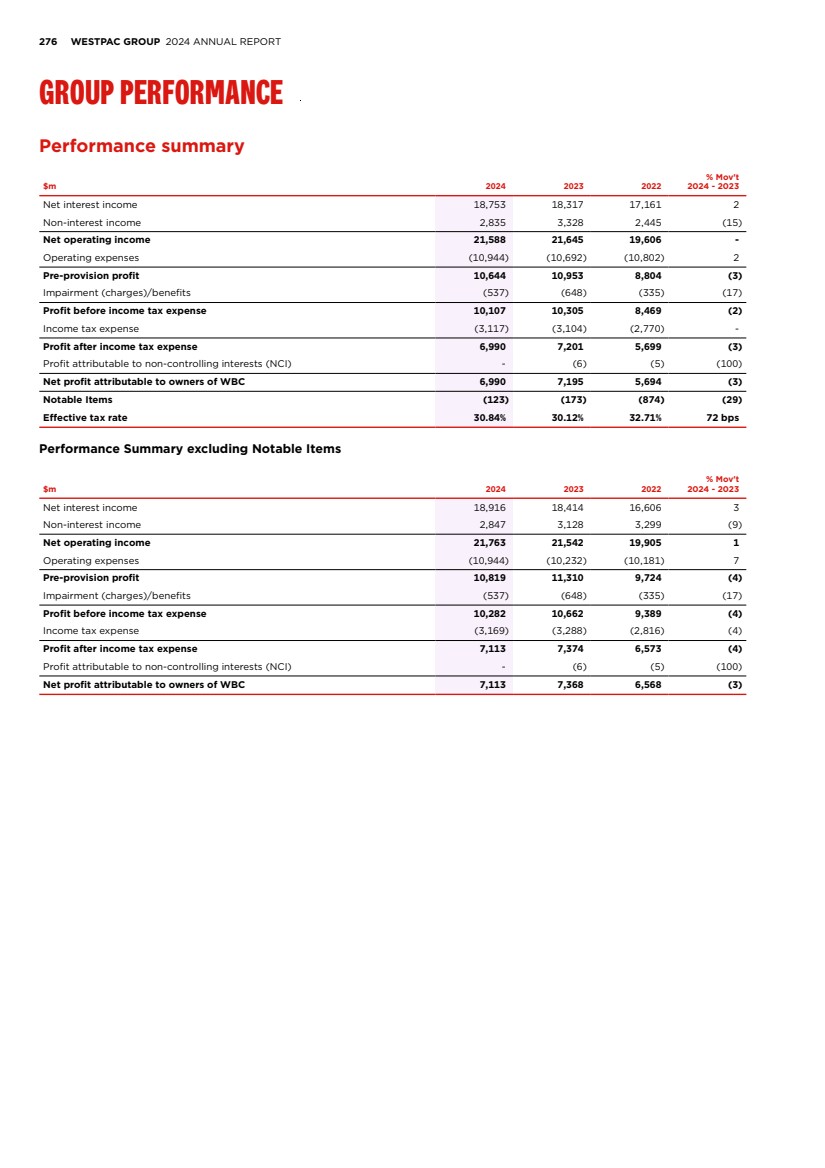
| FINANCIAL STATEMENTS EXHIBITS INDEX STRATEGIC REVIEW PERFORMANCE REVIEW SHAREHOLDER INFORMATION 277 Key financial information 2024 2023 2022 % Mov't 2024 - 2023 Shareholder value Basic earnings per ordinary share (cents) 200.9 205.3 159.9 (2) Basic earnings per ordinary share (ex Notable Items) (cents) 204.4 210.3 184.5 (3) Diluted earnings per ordinary share (cents) 191.7 195.2 152.4 (2) Diluted earnings per ordinary share (ex Notable Items) (cents) 194.8 199.6 174.9 (2) Weighted average ordinary shares (millions) 3,476 3,502 3,559 (1) Fully franked ordinary dividends per share (cents) 151 142 125 6 Fully franked special dividend per share (cents) 15 - - - Dividend payout ratioa 74.62% 69.20% 76.79% large Dividend payout ratio (ex Notable Items)a 73.32% 67.57% 66.57% large Return on average ordinary equity 9.77% 10.09% 8.10% (32 bps) Return on average ordinary equity (ex Notable Items) 9.94% 10.34% 9.34% (40 bps) Return on average tangible equity (ROTE)b 11.01% 11.39% 9.17% (38 bps) ROTE (ex Notable Items) 11.21% 11.67% 10.58% (46 bps) Average ordinary equity ($m) 71,493 71,229 70,268 - Average tangible ordinary equity ($m) 63,415 63,117 62,078 - Average total equity ($m) 71,549 71,274 70,323 - Net tangible asset per ordinary share ($) 17.75 17.58 17.18 1 Business performance Group NIM 1.93% 1.95% 1.94% (2 bps) Core NIMb 1.82% 1.86% 1.76% (4 bps) Treasury & markets impact on NIMb 0.13% 0.10% 0.12% 3 bps Notable Items impact on NIM (0.02%) (0.01%) 0.06% (1 bps) Average interest-earning assets ($m)c 970,055 940,449 886,205 3 Return on average assets 0.66% 0.70% 0.58% (4 bps) Expense to income ratio 50.69% 49.40% 55.10% 129 bps Expense to income ratio (ex Notable Items) 50.29% 47.50% 51.15% 279 bps Full time equivalent employees (FTE) 35,240 36,146 37,476 (3) Revenue per FTE ($'000's) 612 577 508 6 Capital, funding and liquidity Level 2 common equity Tier 1 capital ratio: - Australian Prudential Regulation Authority (APRA) 12.49% 12.38% 11.29% 11 bps - Internationally comparable 18.27% 18.73% 17.57% (46 bps) Credit RWA ($m) 345,964 339,758 362,098 2 Total risk weighted assets (RWA) ($m) 437,430 451,418 477,620 (3) Liquidity coverage ratio (LCR) 133% 134% 132% (59 bps) Net stable funding ratio (NSFR) 112% 115% 121% (261 bps) Deposit to loan ratio 83.50% 82.89% 82.85% 61 bps Credit quality and impairment charges Gross impaired exposures to gross loans 0.24% 0.17% 0.20% 7 bps Gross impaired exposures provisions to gross impaired exposures 41.28% 43.47% 47.95% (219 bps) Collectively assessed provisions to credit RWA 132 bps 135 bps 116 bps (3 bps) Total provisions to credit RWA 147 bps 145 bps 128 bps 2 bps Total committed exposure (TCE) ($bn) 1,252 1,218 1,186 3 Total stressed exposures as a % of TCE 1.45% 1.26% 1.07% 19 bps Total provision to gross loans 63 bps 63 bps 62 bps - Mortgages 90+ day delinquencies 1.05% 0.81% 0.69% 24 bps Other consumer loans 90+ day delinquencies 1.40% 1.28% 1.56% 12 bps Impairment charges/(benefits) to average loans 7 bps 9 bps 5 bps (2 bps) Balance sheet ($m) Loans 806,767 773,254 739,647 4 Total assets 1,077,544 1,029,774 1,014,198 5 Customer deposits 673,615 640,951 612,834 5 a. Excludes the impact of special dividends and the dividend component of the off-market share buyback in 2022. b. Comparatives have been revised to align with current period presentation. c. Net of average mortgage offset balances. |
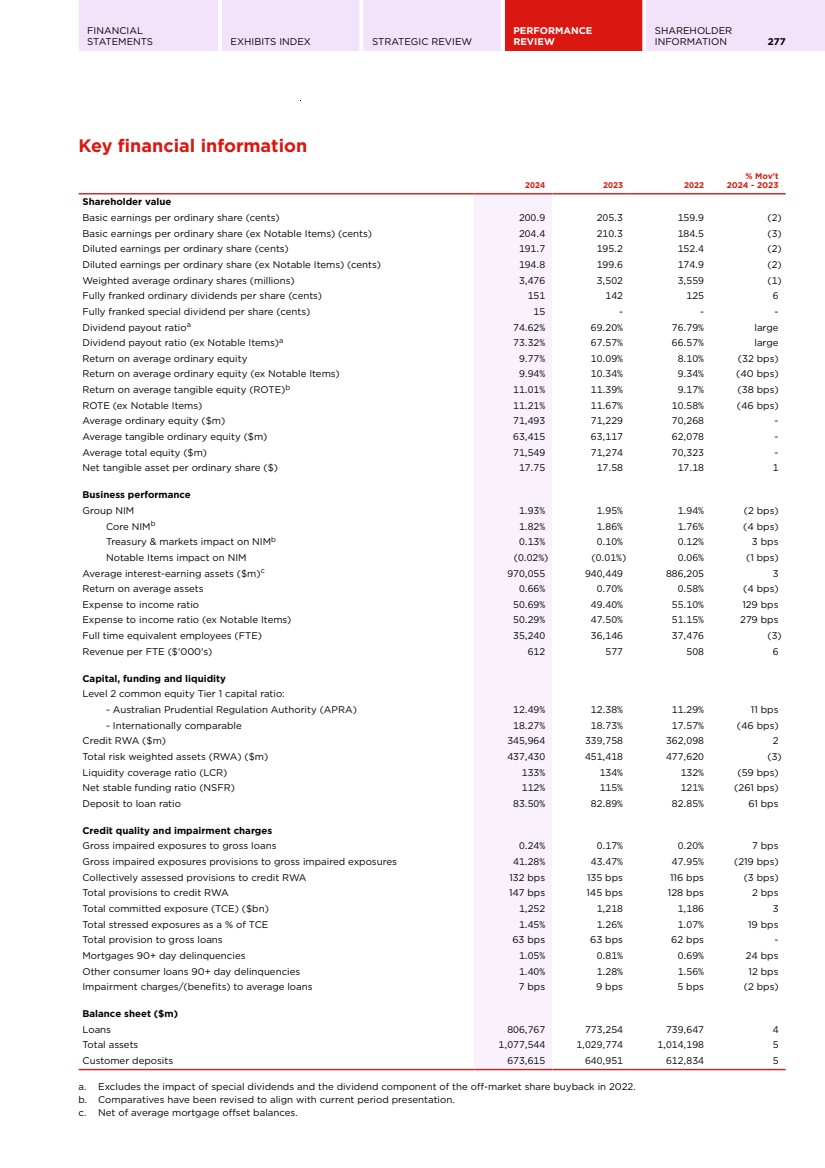
| 278 WESTPAC GROUP 2024 ANNUAL REPORT GROUP PERFORMANCE Impact of Notable Items To assist in explaining our financial performance, we report Notable Items, which represent certain items that are not considered to be reflective of Westpac's ongoing business performance. Notable Items broadly fall into the following categories: • Unrealised fair value gains/(losses) on economic hedges that do not qualify for hedge accounting • Net ineffectiveness on qualifying hedges • Large items that are not reflective of Westpac's ordinary operations. In individual reporting periods large items may include: – Provisions for remediation, litigation, fines and penalties – The impact of asset sales and revaluations – The write-down of assets (including goodwill and capitalised software) – Restructuring costs In determining dividends, the impact of Notable Items is typically excluded. Notable Items reduced net profit after tax in 2024 by $123 million (2023: $173 million, 2022: $874 million). Details of Notable Items (post tax) impacting on 2024 and 2023 results are presented below: Category Net profit impact Detail 2024 Unrealised fair value gains/ (losses) on economic hedges that do not qualify for hedge accounting $128 million reduction The unrealised fair value loss on hedges of accrual accounted term funding transactions for the year was $128 million. This represents a timing difference for the statutory results but does not affect profits over the life of the hedge. Net ineffectiveness on qualifying hedges $5 million benefit The net ineffectiveness on qualifying hedges of $5 million for the period arises from the fair value movement in these hedges which reverses over time and therefore does not affect profits over time. Total Notable Items $123 million reduction 2023 The impact of asset sales and revaluations $256 million benefit Gain on the sale of Advance Asset Management Limited of $243 million. This also includes a tax refund related to transaction and separation costs. Provision for remediation, litigation, fines and penalties $176 million reduction Net operating income - $103 million • Decrease in revenue due to additional repayments to institutional, business and superannuation customers. Expenses - $132 million • An increase in provisions for costs associated with customer remediation programs, regulatory investigations and litigation of $90 million. • Estimated costs for the one-off levy for the Commonwealth’s Compensation Scheme of Last Resort of $42 million. Restructuring costs $140 million reduction Costs associated with accelerating organisation simplification and the discontinuance of specialist businesses. The write-down of assets $87 million reduction The write-down of property assets and costs related to the reduction in corporate office space and accelerated consolidation of branches. Unrealised fair value gains/ (losses) on economic hedges that do not qualify for hedge accounting $92 million reduction The unrealised fair value loss on hedges of accrual accounted term funding transactions for the year was $92 million. This represents a timing difference for the statutory results but does not affect profits over the life of the hedge. Net ineffectiveness on qualifying hedges $66 million benefit The net ineffectiveness on qualifying hedges of $66 million for the period arises from the fair value movement in these hedges which reverses over time and therefore does not affect profits over time. Total Notable Items $173 million reduction |
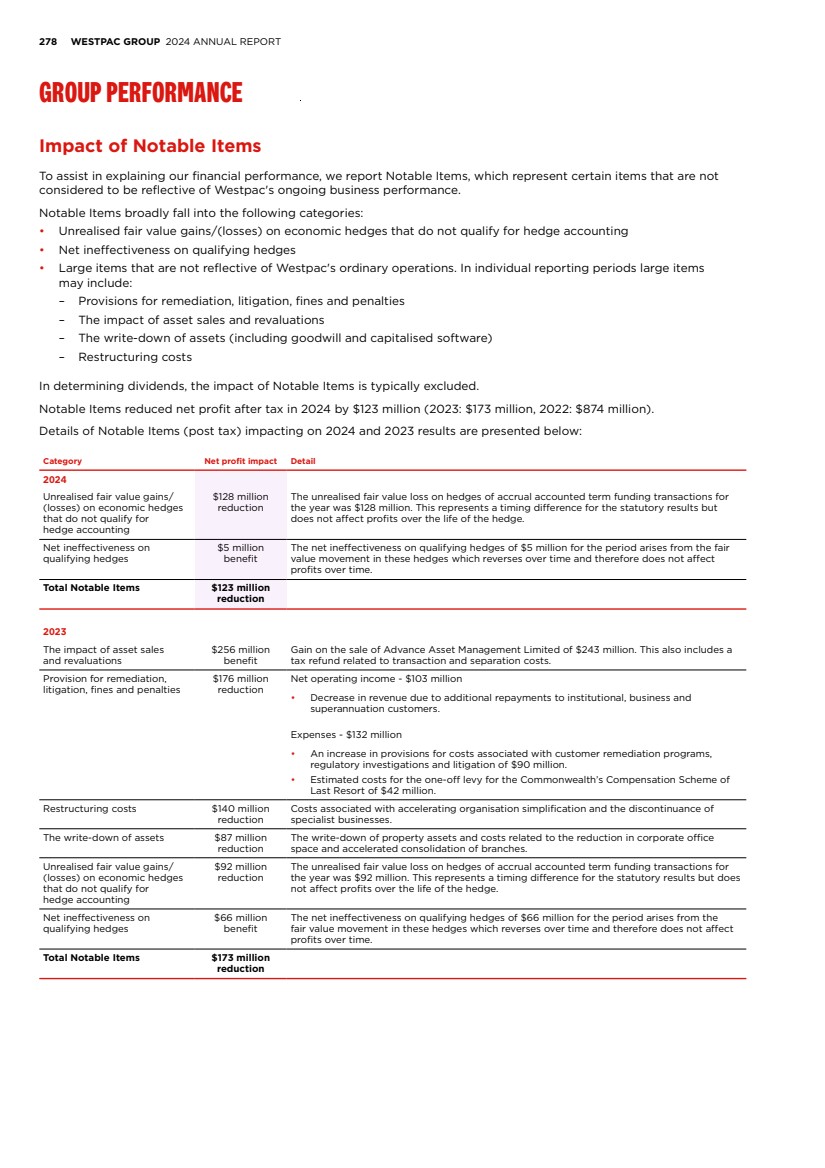
| FINANCIAL STATEMENTS EXHIBITS INDEX STRATEGIC REVIEW PERFORMANCE REVIEW SHAREHOLDER INFORMATION 279 Impact of Notable Items (Continued) A summary of 2024, 2023 and 2022 Notable Items is presented below: $m Economic hedges Hedge ineffectiveness Provisions for remediation, litigation, fines and penalties Asset sales and revaluations The write-down of assets Restructuring costs Total 2024 Net interest income (171) 8 - - - - (163) Non-interest income (12) - - - - - (12) Net operating income (183) 8 - - - - (175) Operating expenses - - - - - - - Pre-provision profit (183) 8 - - - - (175) Income tax (expense)/benefit and NCI 55 (3) - - - - 52 Net profit/(loss) (128) 5 - - - - (123) 2023 Net interest income (113) 94 (78) - - - (97) Non-interest income (18) - (25) 243 - - 200 Net operating income (131) 94 (103) 243 - - 103 Operating expenses - - (132) - (126) (202) (460) Pre-provision profit (131) 94 (235) 243 (126) (202) (357) Income tax (expense)/benefit and NCI 39 (28) 59 13 39 62 184 Net profit/(loss) (92) 66 (176) 256 (87) (140) (173) 2022 Net interest income 633 (77) (1) - - - 555 Non-interest income 39 - (52) (841) - - (854) Net operating income 672 (77) (53) (841) - - (299) Operating expenses - - (126) (144) (351) - (621) Pre-provision profit 672 (77) (179) (985) (351) - (920) Income tax (expense)/benefit and NCI (202) 25 46 109 68 - 46 Net profit/(loss) 470 (52) (133) (876) (283) - (874) |
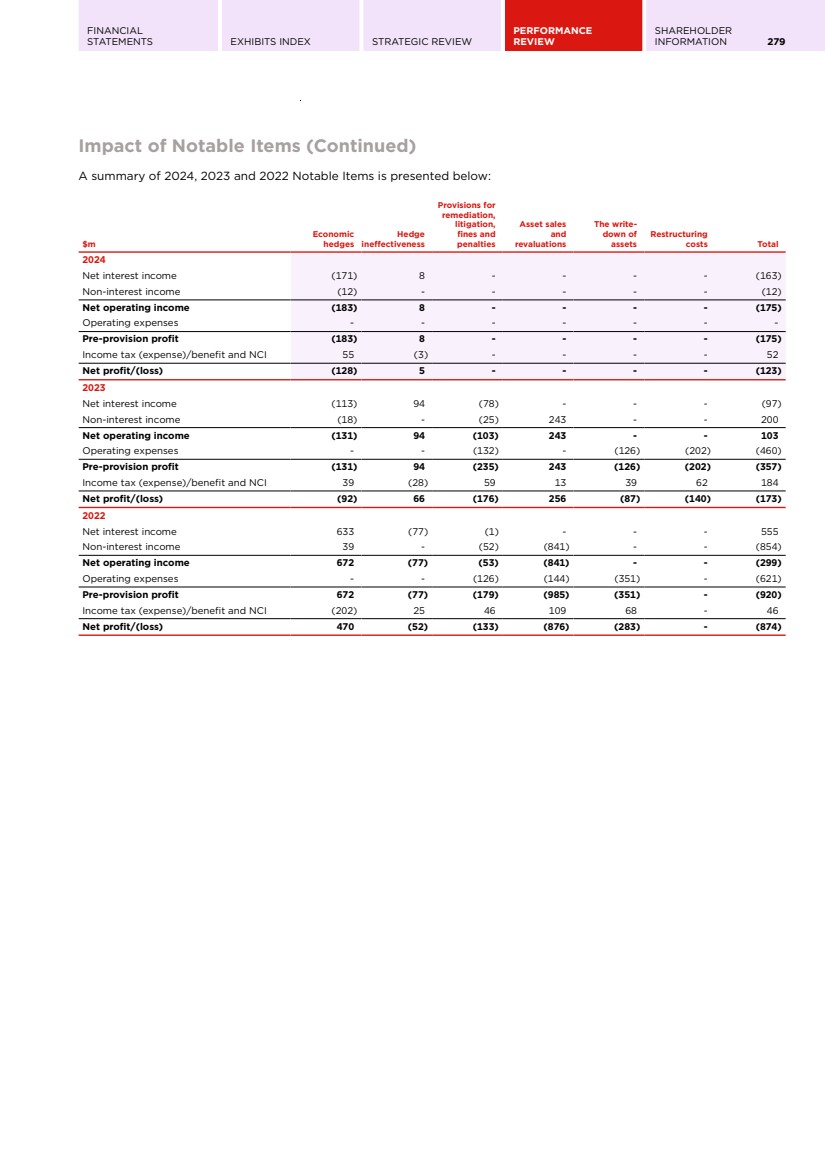
| 280 WESTPAC GROUP 2024 ANNUAL REPORT GROUP PERFORMANCE Review of earnings Pages 280 to 301 provides a comparative discussion of Westpac’s performance for the financial year ended 30 September 2024 compared to 2023, unless otherwise specified. Factors that relate primarily to a single business segment are discussed in more detail in Segment Reporting (pages 302-313). Net interest income 2024 2023 2022 % Mov't 2024 - 2023 Net interest Income ($m) Net interest income 18,753 18,317 17,161 2 Core net interest incomea 17,608 17,519 15,532 1 Notable Items (163) (97) 555 68 Treasurya,b 1,056 729 951 45 Marketsa 252 166 123 52 Average interest earning assets ($m)c Loans 732,660 703,832 676,469 4 Housinga,d 500,338 484,214 469,492 3 Personal 11,754 13,055 15,043 (10) Business 220,568 206,563 191,934 7 Liquid assets 206,266 210,960 191,749 (2) Other interest-earning assets 31,129 25,657 17,987 21 Average interest earning assets 970,055 940,449 886,205 3 NIM (%) NIM 1.93% 1.95% 1.94% (2 bps) Core NIMa 1.82% 1.86% 1.76% (4 bps) Treasury & Markets impact on NIMa 0.13% 0.10% 0.12% 3 bps Notable Items impact on NIM (0.02%) (0.01%) 0.06% (1 bps) a. Comparatives have been revised to align with current period presentation. b. Treasury net interest income excludes capital benefit. c. Includes assets held for sale. d. Net of average mortgage offset balances. Net interest income increased 2% to $18,753 million. Key drivers included: • Higher core net interest income, up 1% to $17,608 million, due to balance sheet growth which was partly offset by lower net interest margin; • Notable Items reduced income by $163 million compared to a reduction of $97 million in the prior year; and • Treasury and Markets income, up 46% to $1,308 million due to stronger performance by Treasury which was well positioned for interest rate volatility. Average interest-earning assets increased by 3% to $970.1 billion, including growth of 7% in business and 3% in housing loans respectively. This was partially offset by the reduction in Personal loans which included auto finance loan runoff. Average liquid assets declined by 2% while other interest-earning assets increased by 21% due to increased holdings of trading securities, mainly relating to holdings of reverse repurchase agreements in Markets to facilitate client transactions. |
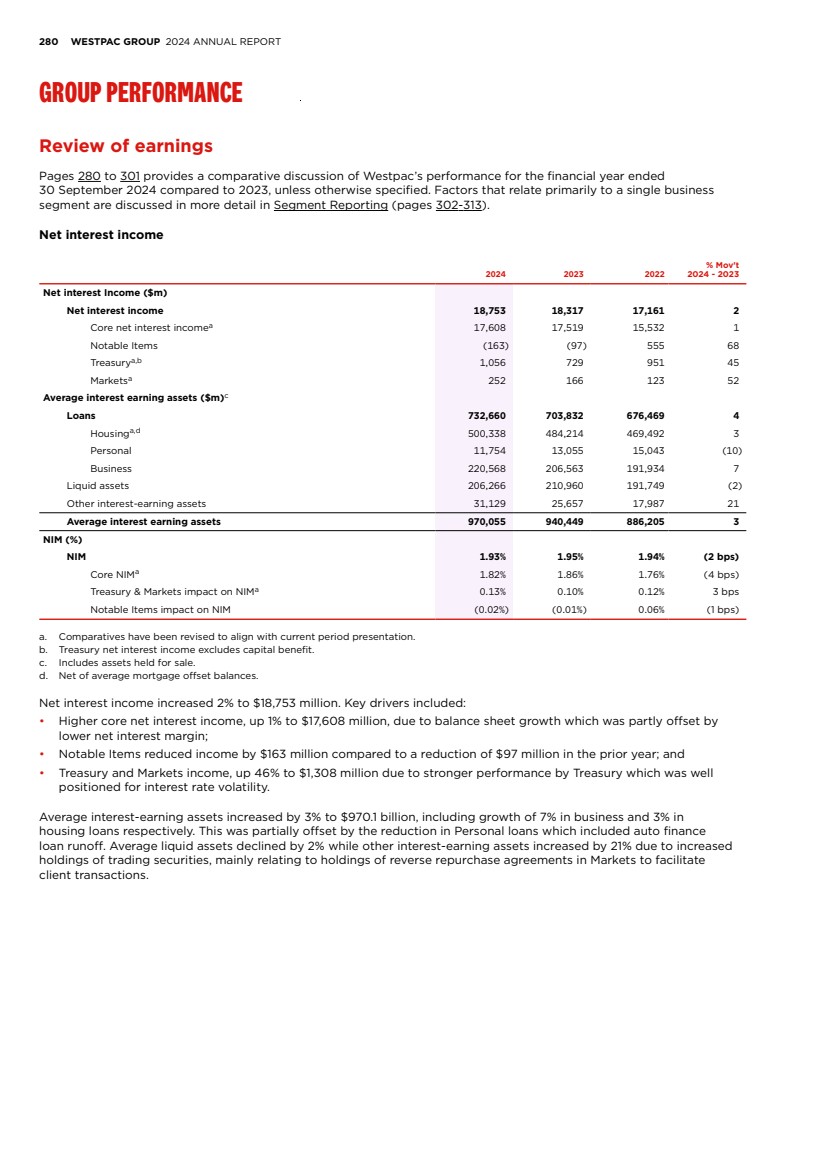
| FINANCIAL STATEMENTS EXHIBITS INDEX STRATEGIC REVIEW PERFORMANCE REVIEW SHAREHOLDER INFORMATION 281 Review of earnings (Continued) Net interest margin T&M2 (1bps) 0.09 0.11 1.82 Notable Items 2024 1.86 2023 (10bps) (1bp) Deposits 2bps Loans Liquid Assets WSF1 1.95 3bps 1.93 (2bps) 7bps Capital & Other NIM down 2bps Net interest margin movement (%) Full Year 2023 – Full Year 2024 Core NIM down 4bps 1. Wholesale Funding Cost. 2. Treasury & Markets contribution. Notable Items, Treasury & Markets Core NIM • The NIM decreased by 2 basis points to 1.93%. NIM comprised: – Core NIM of 1.82%, down 4 basis points with key drivers described below; – Treasury and Markets added 13 basis points, up 3 basis points due to a higher Treasury contribution from favourable positioning for interest rate volatility; and – Notable Items from unrealised fair value losses for accounting purposes related to economic hedges of term funding detracted 2 basis points, having detracted 1 basis point in the prior year. • The 4 basis points decrease in Core NIM comprised the following movements: – Loan interest spread: 10 basis point decrease mainly from tighter spreads on mortgage lending in Australia due to competition for new and existing customers. Spreads on credit cards and business loans also contributed to margin decline. The contraction slowed through the period, with loan interest spreads down 1 basis point in the Second Half 2024; – Wholesale funding: 2 basis point decrease as spreads on new term wholesale funding were higher than maturing facilities, which included the Term Funding Facility (TFF); – Deposit interest spread: 1 basis point decrease included the impacts of a mix shift towards lower spread savings and term deposit accounts. Earnings on hedged deposits were higher; – Liquid Assets: 2 basis point increase from a reduction in liquid asset balances; and – Capital and Other: 7 basis point increase primarily from higher earnings on capital balances as a result of higher interest rates. |
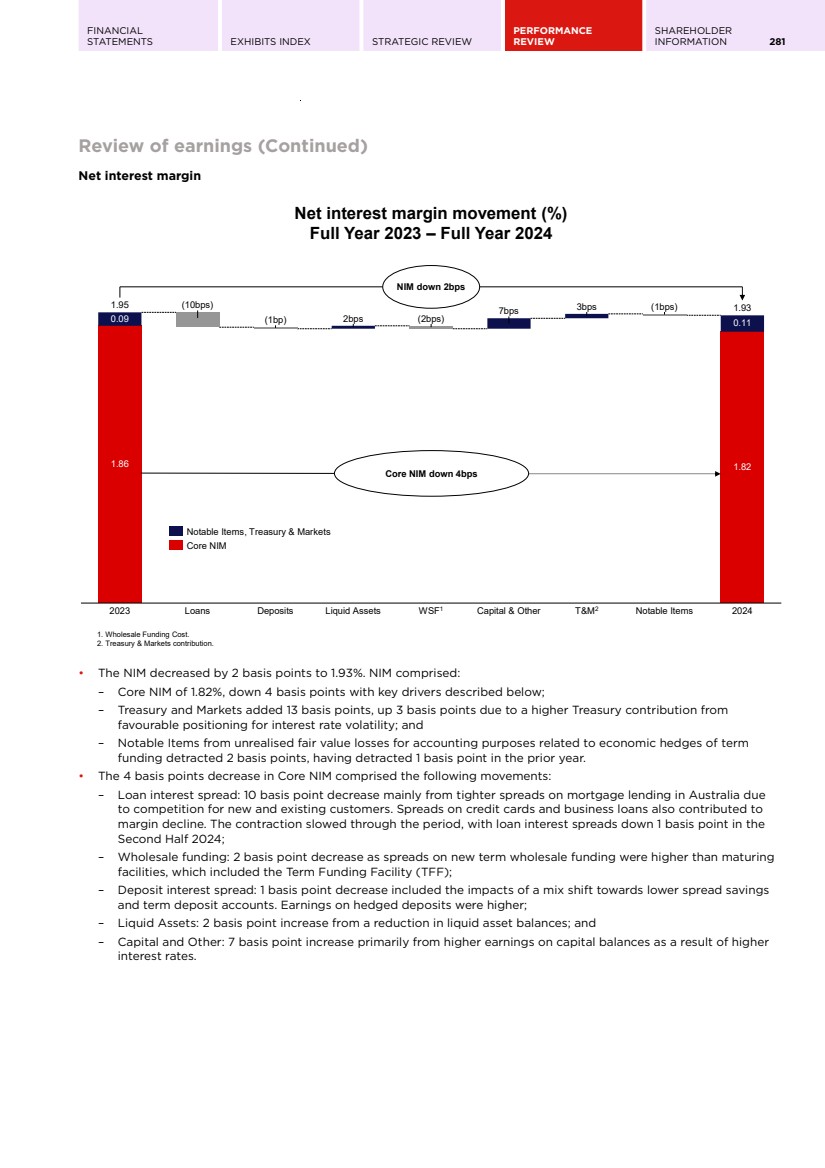
| 282 WESTPAC GROUP 2024 ANNUAL REPORT GROUP PERFORMANCE Review of earnings (Continued) Average Balance Sheet 2024 2023 2022 Average balance Interest income Average rate Average balance Interest income Average rate Average balance Interest income Average rate $m $m % $m $m % $m $m % Assets Interest earning assets Loansa 732,660 44,460 6.1 703,832 35,582 5.1 676,054 21,096 3.1 Housinga 500,338 28,560 5.7 484,214 22,360 4.6 469,492 13,666 2.9 Personal 11,754 1,137 9.7 13,055 1,104 8.5 15,043 1,200 8.0 Businessa 220,568 14,763 6.7 206,563 12,118 5.9 191,519 6,230 3.3 Trading securities and financial assets measured at FVIS 36,350 1,600 4.4 30,086 1,143 3.8 22,836 347 1.5 Investment securities 93,925 3,494 3.7 74,877 2,037 2.7 77,781 1,126 1.4 Other interest earning assetsb 107,120 4,793 4.5 131,654 4,990 3.8 109,109 676 0.6 Assets held for sale - - - - - - 425 6 1.4 Total interest earning assets and interest incomea 970,055 54,347 5.6 940,449 43,752 4.7 886,205 23,251 2.6 Non-interest earning assets Derivative financial instruments 16,786 23,423 23,395 Assets held for sale - - 2,444 All other assetsa,c 70,468 59,356 62,719 Total non-interest earning assetsa 87,254 82,779 88,558 Total assets 1,057,309 1,023,228 974,763 Liabilities Interest bearing liabilities Deposits and other borrowingsd 574,119 23,657 4.1 544,041 16,918 3.1 508,950 3,209 0.6 Certificates of deposit 48,889 2,386 4.9 47,887 1,921 4.0 47,308 395 0.8 Transactions 131,894 4,529 3.4 139,275 3,412 2.4 141,643 709 0.5 Savings 208,866 7,667 3.7 185,211 5,182 2.8 181,918 791 0.4 Term 184,470 9,075 4.9 171,668 6,403 3.7 138,081 1,314 1.0 Repurchase agreements 26,551 937 3.5 39,652 556 1.4 37,779 150 0.4 Loan capital 40,212 1,848 4.6 34,384 1,448 4.2 30,708 1,026 3.3 Other interest bearing liabilitiese 185,809 9,152 4.9 176,699 6,513 3.7 158,251 1,705 1.1 Total interest bearing liabilities and interest expensed 826,691 35,594 4.3 794,776 25,435 3.2 735,688 6,090 0.8 Non-interest bearing liabilities Deposits and other borrowingsd 131,632 131,043 136,251 Derivative financial instruments 21,413 26,353 24,750 Liabilities held for sale - - 682 All other liabilities 6,024 (218) 7,069 Total non-interest bearing liabilitiesd 159,069 157,178 168,752 Total liabilities 985,760 951,954 904,440 Shareholders' equity 71,493 71,229 70,268 Non-controlling interests 56 45 55 Total equity 71,549 71,274 70,323 Total liabilities and equity 1,057,309 1,023,228 974,763 Loansa Australia 633,772 37,865 6.0 607,154 30,164 5.0 582,456 17,694 3.0 New Zealand 92,222 6,155 6.7 90,130 5,028 5.6 87,236 3,203 3.7 Other overseas 6,666 440 6.6 6,548 390 6.0 6,362 199 3.1 Deposits and other borrowingsd Australia 489,693 19,413 4.0 460,149 13,544 2.9 427,097 2,249 0.5 New Zealand 65,070 3,220 4.9 63,760 2,464 3.9 60,678 765 1.3 Other overseas 19,356 1,024 5.3 20,132 910 4.5 21,175 195 0.9 a. Certain portions of loans are non-interest bearing and are presented below in All other assets. The non-interest bearing portion represents the impact of mortgage offset deposits which are taken into consideration when calculating interest charged on loans. In 2024, offset loans within New Zealand were reclassified and presented within All other assets. Comparatives have been revised to align with current period presentation. b. Interest income includes net ineffectiveness on qualifying hedges. c. Includes property and equipment, intangible assets, deferred tax assets, non-interest earning loans relating to mortgage offset accounts and all other non-interest earning assets. Mortgage offset balances were $54,980 million (2023: $48,022 million, 2022: $45,996 million). d. In 2024, certain deposit products were reclassified between Savings and Transactions to align with how they are marketed to customers. The Group has also revised the attribution of certain deposit products between interest bearing and non-interest bearing. Comparatives have been revised to align with current period presentation. e. Interest expense includes the net impact of Treasury balance sheet management activities and the bank levy. |
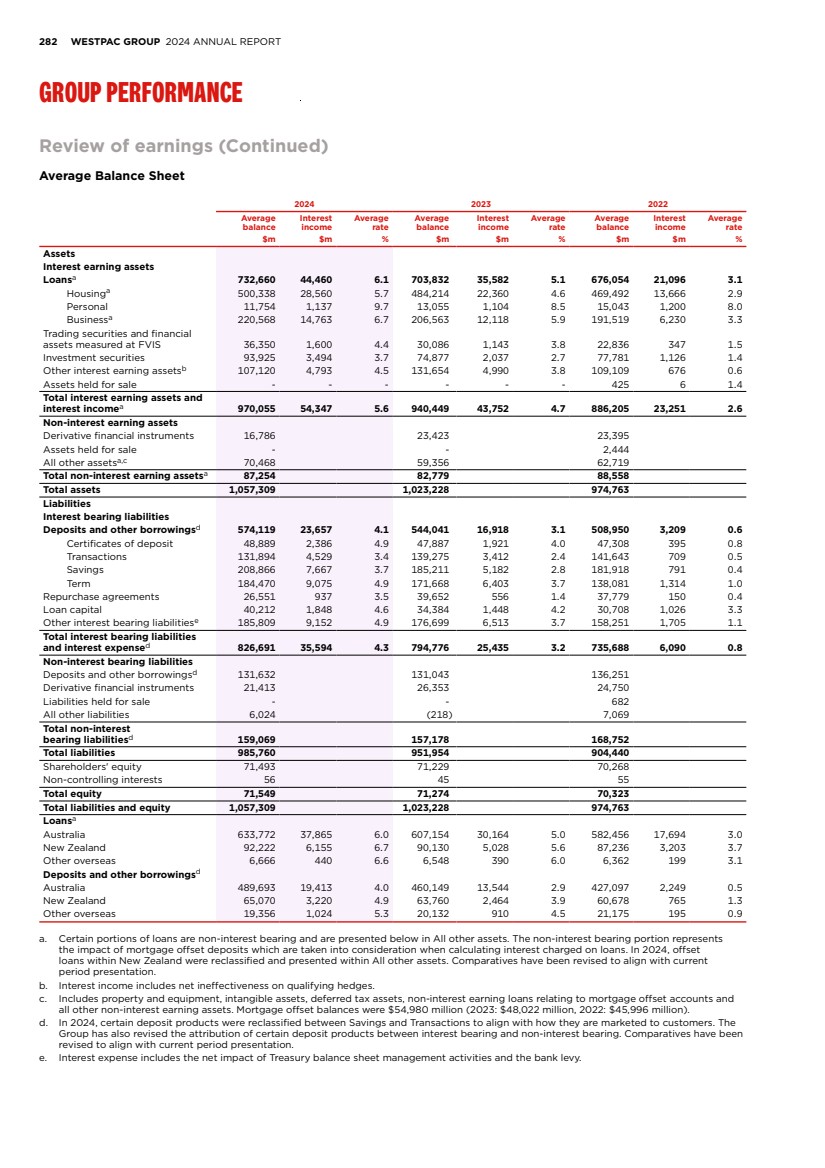
| FINANCIAL STATEMENTS EXHIBITS INDEX STRATEGIC REVIEW PERFORMANCE REVIEW SHAREHOLDER INFORMATION 283 Review of earnings (Continued) Loans $m 2024 2023 2022 % Mov't 2024 - 2023 Australia 704,907 674,422 647,122 5 Housing 473,435 449,509 431,538 5 RAMS (in runoff) 29,836 35,965 35,844 (17) Personal 9,403 9,638 9,722 (2) Business 194,138 178,965 166,402 8 Auto finance (in runoff)a 2,116 4,195 7,344 (50) Provisions (4,021) (3,850) (3,728) 4 New Zealand (A$) 94,137 92,854 85,772 1 New Zealand (NZ$) 102,463 99,711 97,393 3 Housing 68,011 65,757 63,827 3 Personal 1,151 1,163 1,202 (1) Business 33,802 33,298 32,764 2 Provisions (501) (507) (400) (1) Other overseas (A$) 7,723 5,978 6,753 29 Total loans 806,767 773,254 739,647 4 a. Includes personal and business auto finance loans. Loans increased by 4% to $806.8 billion and comprised the following movements: • Australian housing loans excluding RAMS grew by 5% to $473.4 billion or 1.2x APRA housing system, with faster growth in owner occupied mortgages. Customers continue to prefer variable rate mortgages which now account for 90% of total mortgages, up from 76% in September 2023; • RAMS housing loans were down 17% to $29.8 billion as the portfolio is closed to new business; • Contraction in Australian personal lending of 2% to $9.4 billion due to higher paydown and subdued new lending, particularly in personal loans; • Growth in Australian business lending of 8% to $194.1 billion. The strong loan growth in WIB was primarily driven by deepening relationships with existing customers in the institutional property, industrials & infrastructure sectors. Additionally, Business segment loan growth was diversified with growth in our target industries of agriculture, health and professional services; • Auto finance loans were down 50% to $2.1 billion as the portfolio continued to runoff. The sale of this portfolio was announced post balance date in October 2024; • Growth in New Zealand lending of 3% to $102.5 billion in NZ$ terms, driven by growth in mortgages of 3% and business lending of 2%; and • Growth in other overseas loan balances of 29% to $7.7 billion. This reflected growth in lending to US customers. |
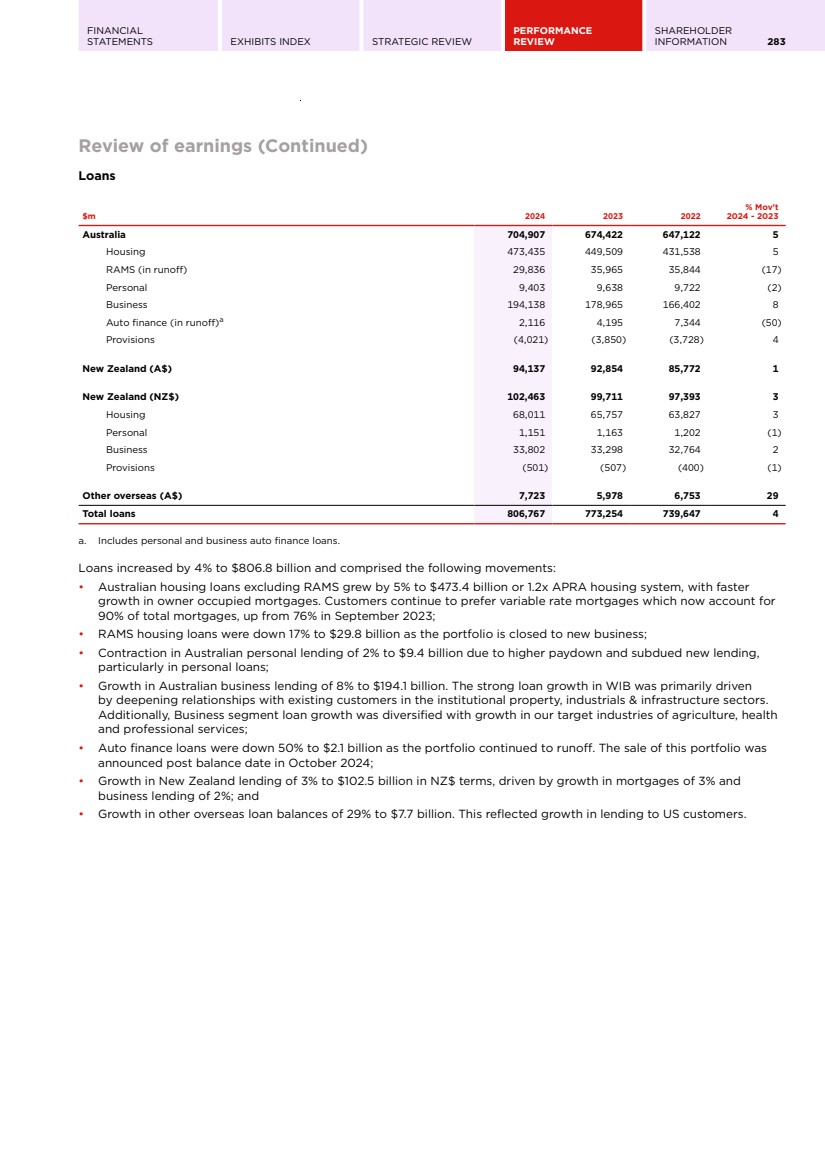
| 284 WESTPAC GROUP 2024 ANNUAL REPORT GROUP PERFORMANCE Review of earnings (Continued) Deposits and other borrowings $m 2024 2023 2022 % Mov't 2024 - 2023 Customer deposits Australia 593,795 557,781 535,645 6 Transactionsa 110,393 114,097 137,361 (3) Savingsa 197,415 179,110 148,153 10 Term 157,282 144,220 127,921 9 Non-interest bearinga 128,705 120,354 122,210 7 New Zealand (A$) 73,201 74,297 68,614 (1) New Zealand (NZ$) 79,676 79,783 77,910 - Transactionsa 9,595 8,762 9,609 10 Savingsa 19,433 20,185 21,423 (4) Term 39,451 38,472 32,273 3 Non-interest bearinga 11,197 12,364 14,605 (9) Other overseas (A$) 6,619 8,873 8,575 (25) Total customer deposits 673,615 640,951 612,834 5 Certificates of deposit 46,874 47,217 46,295 (1) Australia 33,215 32,947 30,507 1 New Zealand (A$) 1,711 2,247 2,588 (24) Other overseas (A$) 11,948 12,023 13,200 (1) Total deposits and other borrowings 720,489 688,168 659,129 5 a. Comparatives have been revised to align with current period presentation. Customer deposits grew by 5% to $673.6 billion and comprised the following movements: • Australian deposits up 6% to $593.8 billion, mainly from growth in higher interest bearing products in the Consumer and WIB segments. Non-interest bearing deposits were up 7% to $128.7 billion, due to an increase in mortgage offset balances, supported by customer preference for variable rate loans and customers shifting from fixed rate loans; • New Zealand deposits was stable at $79.7 billion in NZ$ terms from an increase in term deposits offset by a decline in non-interest bearing deposits; and • Decrease in other overseas deposits by 25% to $6.6 billion, primarily in WIB term deposits due to competition. The deposit to loan ratio of 83.5% was higher than 30 September 2023, with deposit growth broadly funding loan growth during the year. |
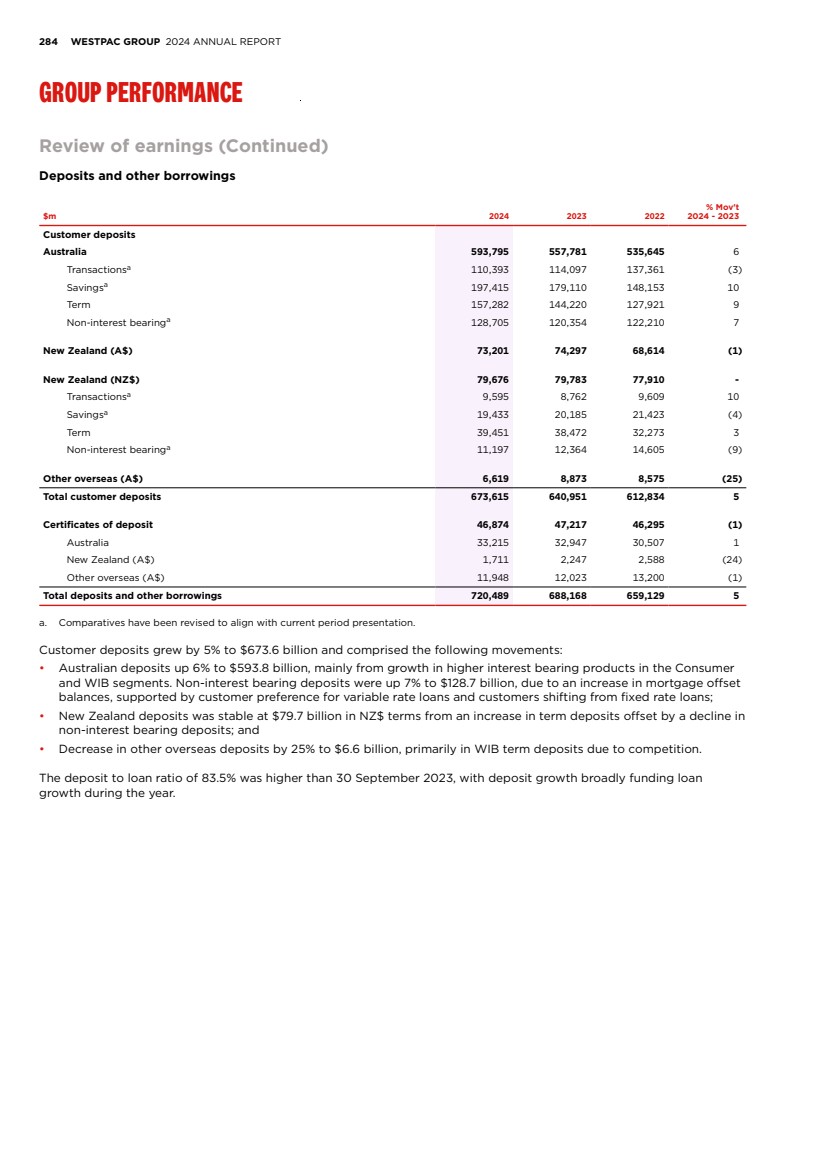
| FINANCIAL STATEMENTS EXHIBITS INDEX STRATEGIC REVIEW PERFORMANCE REVIEW SHAREHOLDER INFORMATION 285 Review of earnings (Continued) Loans and deposits market share and system multiple metrics 2024 2023 2022 Market Share Australia ADI System (APRA) Housing credit 21% 21% 22% Personal credit cards 21% 21% 21% Business credita 16% 15% 15% Household deposits 21% 21% 20% Business depositsb 18% 18% 18% Financial system (Reserve Bank of Australia (RBA)) Housing credit 20% 21% 21% Business creditc 14% 15% 15% Retail and business depositsd 19% 19% 20% New Zealand (Reserve Bank of New Zealand (RBNZ))e Consumer lending 18% 18% 18% Business lending 16% 16% 16% Deposits 17% 18% 18% System multiples Australia ADI System (APRA) Housing credit 0.8 0.8 0.5 Personal credit cardsf n/a 0.5 0.7 Business credita 1.2 0.8 0.9 Household deposits 1.1 1.3 0.7 Business depositsb,f 1.5 n/a 0.8 Financial system (RBA) Housing credit 0.8 0.9 0.5 Business creditc 0.7 0.7 0.8 Retail and business depositsd 1.1 0.6 0.8 New Zealand (RBNZ)e Consumer lending 0.9 0.8 1.0 Business lending 0.9 1.6 0.8 Depositsf n/a 0.9 0.5 a. Westpac Group’s business credit growth rate and multiples are based on ADI System published by APRA in the Monthly ADI statistics. Business credit includes loans with Non-Financial businesses and Community service organisations across all segments. b. Westpac Group’s business deposit growth rate and multiples are based on ADI System published by APRA in the Monthly ADI statistics. Business deposits include deposits from Non-Financial businesses and Community service organisations across all segments. c. Westpac Group’s business credit growth rate and multiples are based on Financial System as published in the RBA Lending and Credit Aggregates. Business credit includes loans with Non-financial businesses, Community service organisations, and select Financial Institutions. d. Retail and business deposits include deposits from Households, Non-financial businesses, and select Financial institutions as defined in the RBA Monetary Aggregates. e. New Zealand comprises New Zealand banking operations. f. n/a indicates that system growth and/or Westpac growth was negative. |
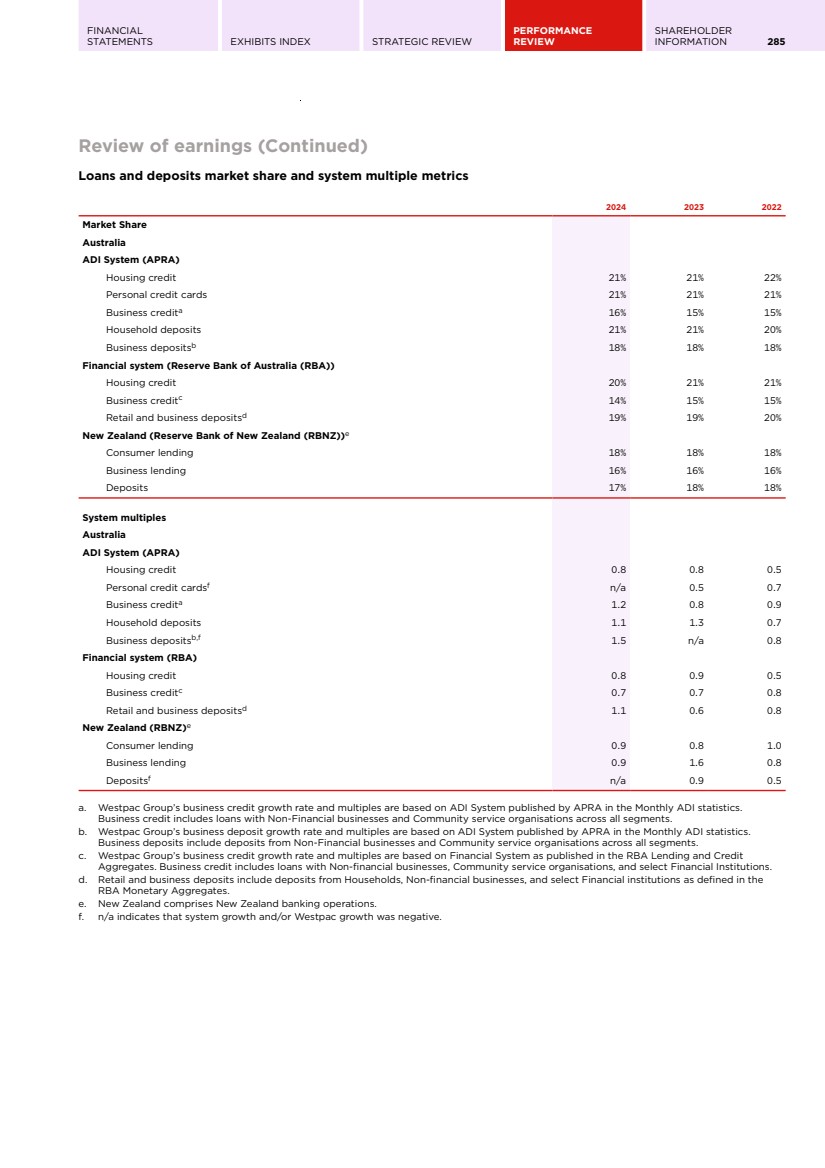
| 286 WESTPAC GROUP 2024 ANNUAL REPORT GROUP PERFORMANCE Review of earnings (Continued) Non-interest income $m 2024 2023 2022 % Mov't 2024 - 2023 Net fee income 1,672 1,645 1,671 2 Net wealth management and insurance incomea 441 562 808 (22) Trading income 704 717 664 (2) Other income 18 404 (698) (96) Total non-interest income 2,835 3,328 2,445 (15) a. Following the sales of our insurance businesses in 2023, insurance income was nil for Full Year 2024. Non-interest income is comprised of: $m 2024 2023 2022 % Mov't 2024 - 2023 Non-interest income (Ex Notable Items and Businesses sold) Net fee income 1,672 1,645 1,672 2 Net wealth management and insurance incomea 441 457 467 (4) Trading income 716 750 620 (5) Other income 18 136 148 (87) Non-interest income (Ex Notable Items and Businesses sold) 2,847 2,988 2,907 (5) Notable Items Net fee income - - (1) - Net wealth management and insurance incomea - (10) (51) (100) Trading income (12) (33) 44 (64) Other income - 243 (846) (100) Total non-interest income - Notable Items (12) 200 (854) large Businesses sold Net wealth management and insurance incomea - 115 392 (100) Other income - 25 - (100) Total non-interest income - Businesses sold - 140 392 (100) Total non-interest income 2,835 3,328 2,445 (15) a. Following the sales of our insurance businesses in 2023, insurance income was nil for Full Year 2024. Non-interest income decreased by 15% to $2,835 million. Excluding Notable Items and the impact of businesses sold, non-interest income decreased by 5% to $2,847 million. Net fee income Net fee income increased by 2% to $1,672 million. Key movements included: • Higher Institutional lending fees of $59 million from increased underwriting activity and loan growth; • Lower Australian merchants income of $16 million due to lower volumes; and • Lower auto finance income of $14 million due to runoff of the portfolio. Net wealth management income Net wealth management income decreased by 22% to $441 million. Excluding Notable Items and the impact of businesses sold, net wealth management income decreased by 4% to $441 million with platforms margin compression more than offsetting higher funds under administration. Trading income Trading income decreased by 2% to $704 million. Excluding Notable Items, Trading income decreased by 5% to $716 million primarily due to lower foreign exchange (FX) trading in WIB reflecting tighter spreads and reduced derivative valuation adjustments (DVA). This was partly offset by the impact of hedges on commodity and FX derivatives. |
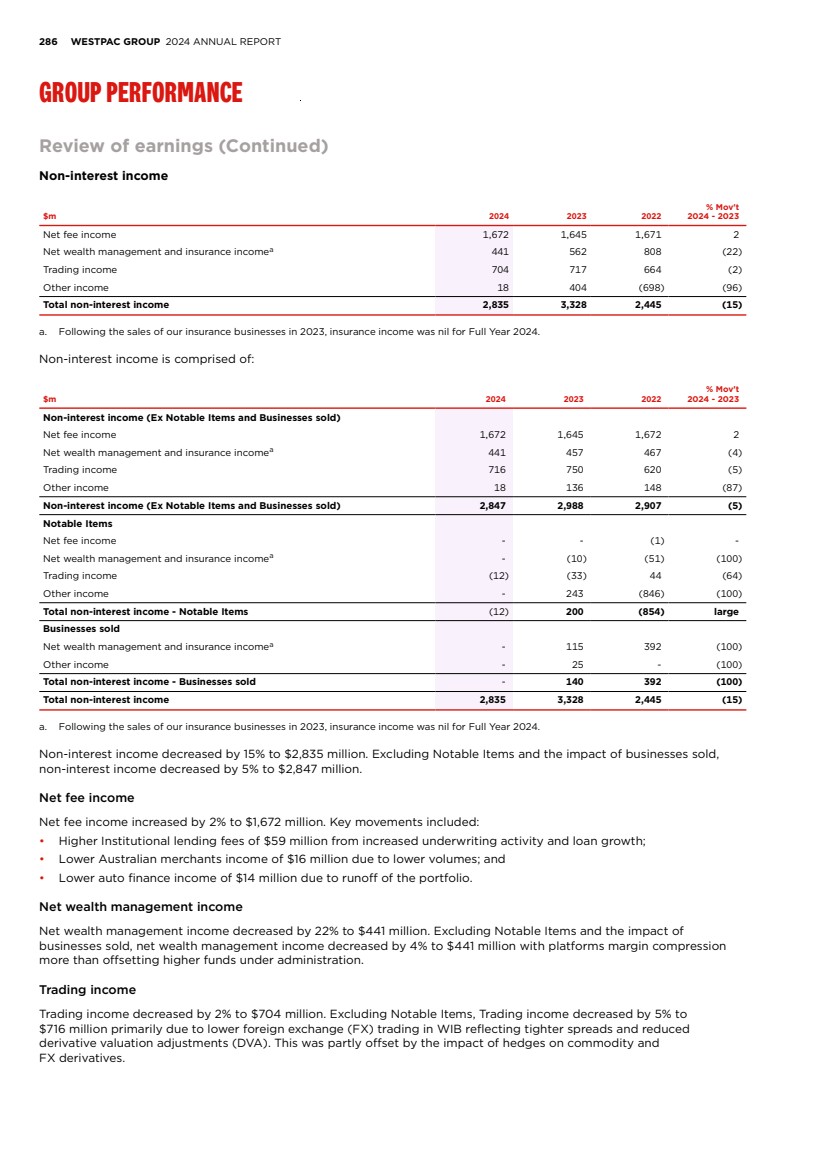
| FINANCIAL STATEMENTS EXHIBITS INDEX STRATEGIC REVIEW PERFORMANCE REVIEW SHAREHOLDER INFORMATION 287 Review of earnings (Continued) Other income Other income decreased by $386 million. Excluding Notable Items and the impact of businesses sold, Other income decreased by $118 million primarily attributable to losses on commodity and FX derivatives. Businesses sold No business were sold in FY24. In October 2024, Westpac entered into an agreement to sell the auto finance portfolio to Resimac Group Limited. The sale is expected to be completed in the first half of 2025, with an expected transaction value of $1.4-$1.6 billion. Past contribution to revenue from businesses sold totalled $140 million in FY23. This related to Advance Asset Management Limited, BT's Superannuation business and Westpac Life Insurance Ltd prior to their exit. For further details of the contribution of each business refer to Net profit contribution of businesses sold (page 356). Markets related income1 $m 2024 2023 2022 % Mov't 2024 - 2023 Net interest incomea 252 166 123 52 Non-interest income 677 858 619 (21) Markets income 929 1,024 742 (9) Sales and risk management income 937 968 773 (3) Derivative valuation adjustment (8) 56 (31) large Markets income 929 1,024 742 (9) a. Comparatives have been revised to align with current period presentation. Markets income comprises sales and risk management revenue derived from the creation, pricing and distribution of risk management products to Westpac's customers. Dedicated relationship specialists provide product solutions to these customers to help manage their interest rate, foreign exchange, commodity, credit and structured products exposures. Markets income decreased by 9% to $929 million. Sales and risk management income decreased by 3% to $937 million. Income from continued strong customer volumes and effective risk management in fixed income products was more than offset by lower FX trading income. DVA had a negative impact of $8 million compared to a $56 million positive contribution in the prior year. This was driven by the non-repeat of tightening counterparty credit spreads in the prior year. 1. Markets income includes financial markets income derived by WIB, Business & Wealth and Westpac New Zealand excluding Debt Capital Market activities. |
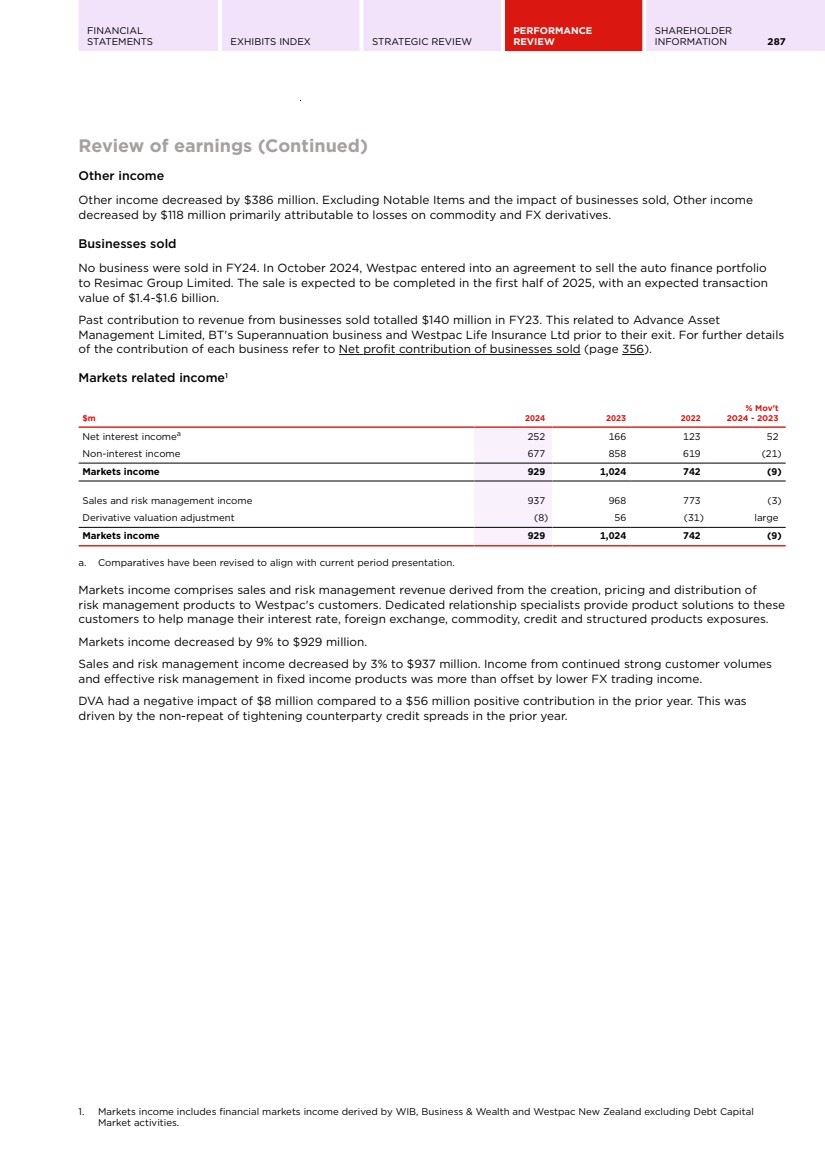
| 288 WESTPAC GROUP 2024 ANNUAL REPORT GROUP PERFORMANCE Review of earnings (Continued) Operating expenses $m 2024 2023 2022 % Mov't 2024 - 2023 Staff expenses (5,899) (6,098) (5,866) (3) Occupancy expenses (700) (786) (914) (11) Technology expenses (2,764) (2,211) (2,203) 25 Other expenses (1,581) (1,597) (1,819) (1) Total operating expenses (10,944) (10,692) (10,802) 2 Excluding Notable Items Staff expenses (5,899) (5,863) (5,758) 1 Occupancy expenses (700) (722) (788) (3) Technology expenses (2,764) (2,178) (2,106) 27 Other expenses (1,581) (1,469) (1,529) 8 Total operating expenses excluding Notable Items (10,944) (10,232) (10,181) 7 Operating expenses - Businesses sold - 46 (127) (100) Operating expenses excluding Notable Items and Business sold (10,944) (10,278) (10,054) 6 Full Time Equivalent (FTE) employees Number of FTE 2024 2023 2022 % Mov't 2024 - 2023 Permanent employees 33,583 33,664 33,774 - Temporary employees 1,657 2,482 3,702 (33) FTE 35,240 36,146 37,476 (3) Average FTE 35,254 37,503 38,573 (6) Total operating expenses increased 2% to $10,944 million. Excluding Notable Items, operating expenses increased 7% to $10,944 million. The increase was mainly attributable to higher software amortisation, higher third-party technology vendor expenses and costs related to closing RAMS to new business. Cost Reset actions provided a partial offset. The expense to income ratio excluding Notable Items was 50.3%, up from 47.5%. Staff expenses decreased by 3% to $5,899 million. Excluding Notable Items, staff expenses increased by 1% due to the impact of wage growth, continued step up in superannuation rates and RAMS restructuring costs. The 6% decline in average FTE provided a partial offset, reflecting the continued impact of Cost Reset actions and our commitment to improving efficiency. Occupancy expenses decreased by 11% to $700 million. Excluding Notable Items, occupancy expenses decreased by 3% with further reductions in the Group's corporate and branch footprint, including the closure of 18 branches and establishment of 29 co-locations. Technology expenses increased 25% to $2,764 million. Excluding Notable Items, technology expenses were 27% higher due to: • Increased software amortisation of $268 million related to the completion of major projects; • Higher software expenses across the Consumer and Westpac New Zealand segments; and • Higher costs related to third-party vendor contract renewals and UNITE. Other Expenses decreased 1% to $1,581 million. Excluding Notable Items, other expenses increased by 8% to $1,581 million mainly due to the RAMS brand write-off of $32 million, increased scams and fraud expenses and litigation provisions. |

| FINANCIAL STATEMENTS EXHIBITS INDEX STRATEGIC REVIEW PERFORMANCE REVIEW SHAREHOLDER INFORMATION 289 Review of earnings (Continued) Investment spend $m 2024 2023 2022 % Mov't 2024 - 2023 Expensed 992 816 883 22 Capitalised software, fixed assets and prepayments 764 1,106 1,104 (31) Total 1,756 1,922 1,987 (9) UNITE 147 - - - Growth and productivity 550 728 675 (24) Risk and regulatory 1,059 1,194 1,312 (11) Total 1,756 1,922 1,987 (9) Investment spend totalled $1,756 million in 2024, 9% lower than the prior year. The decline reflects the completion of several large programs in 2023. Of the investment spend, UNITE accounted for 8%, 32% was directed towards growth and productivity and 60% was focused on risk and regulatory initiatives. UNITE commenced in 2024 to accelerate technology simplification. See page 186 for more information. Growth and Productivity investments included: • New features in the Westpac App. Refer to Number one banking app (page 169) for more information; • Enhanced transactional banking and merchant service experience. Refer to Driving efficiency for businesses (page 172) for more information; • Pay with Points, enabling customers to use their points to pay for credit card purchases; • Enhanced international payments capability with the roll out of fixed FX payments, enabling customers to schedule an international payment for a future date with an agreed exchange rate; • The launch of Sustainable Upgrades home and investor loans for customers looking to make energy efficient upgrades to their home; • Commencing development of the integrated business lending origination platform; and • Continued development of the corporate cash management platform. Risk and Regulatory spend included: • Completion of all the CORE Integrated Plan activities. Westpac is now in a transition phase, which is focused on ensuring the sustainability and effectiveness of changes we have made to strengthen risk management and risk culture across Westpac; • Extending our scam prevention capabilities. Refer to Protecting customers and preventing crime (page 173) for more information; • Continued upgrade of international payments infrastructure; • Maintaining New Payments Platform Australia scheme compliance and improving payments resilience, stability, and risk; • Continued simplification of our data environment to reduce risk and provide high-quality data for consumption; and • Implementing changes to comply with Prudential Standard CPS 230, Operational Risk Management, in 2025. The new standard requires entities to better manage operational risks and respond to business disruptions. Capitalised software $m 2024 2023 2022 % Mov't 2024 - 2023 Balance as at beginning of the year 2,797 2,264 1,840 24 Total additions 792 1,141 1,101 (31) Amortisation expense (889) (621) (545) 43 Impairment expense (19) (8) (110) 138 Foreign exchange movements (6) 21 (22) large Balance as at end of the year 2,675 2,797 2,264 (4) Average amortisation period (years) 3.1 3.6 3.2 (0.5) years Capitalised software decreased $122 million or 4% compared to September 2023. The decrease reflects increased amortisation due to the completion of key projects such as One Banking Platform, payments and investment to comply with RBNZ’s outsourcing policy, BS11. Lower additions were driven by lower investment spend as focus turned towards the planning phase of the Technology simplification program, UNITE. This has resulted in average amortisation period reducing by 0.5 years to 3.1 years from September 2023. |
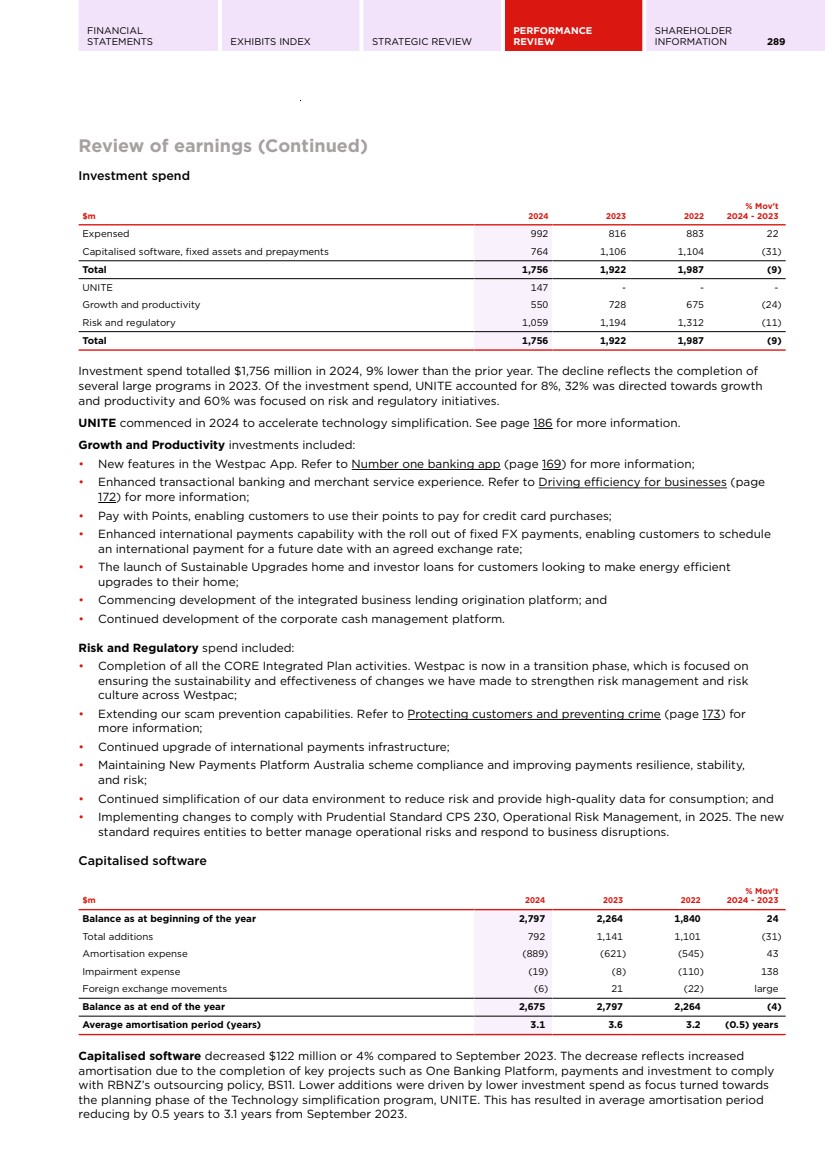
| 290 WESTPAC GROUP 2024 ANNUAL REPORT GROUP PERFORMANCE Review of earnings (Continued) Credit impairment charges $m 2024 2023 2022 % Mov't 2024 - 2023 Individually assessed provisions (IAPs) New IAPs (423) (197) (220) 115 Write-backs 93 127 115 (27) Recoveries 190 191 189 (1) Total IAPs, write-backs and recoveries (140) 121 84 large Collectively assessed provisions (CAPs) Write-offs (486) (440) (446) 10 Other changes in CAPs 89 (329) 27 large Total CAPs (397) (769) (419) (48) Total impairment (charges)/benefits (537) (648) (335) (17) Impairment charges/(benefits) to average loans 7 bps 9 bps 5 bps (2 bps) Net write-offs to average gross loans 5 bps 5 bps 10 bps - The credit impairment charge of $537 million represented 7 basis points of average loans, down from 9 basis points in the prior year. The impairment charge was driven by a lower CAP charge of $397 million and IAP charge of $140 million. This compared to a CAP charge of $769 million and an IAP benefit of $121 million in the prior year. The CAP charge of $397 million comprised write-offs of $486 million partly offset by a benefit in other changes in CAP of $89 million. The other changes in CAP were due to: • A reduction in portfolio overlays of $253 million driven by the partial release of mortgage related overlays; • A reduction in the downside scenario weight of 2.5% in First Half 2024 reflecting a modest reduction in macroeconomic uncertainty at that time; • An increase in mortgage 90+ day delinquencies from 0.81% to 1.05%; and • Less favourable outlook for commercial property prices and GDP along with a delay in the expected timing of interest rate declines. The IAP charge of $140 million comprised: • New IAPs of $423 million, mostly in the wholesale & retail trade and manufacturing sectors and the mortgage portfolio; • Recoveries of $190 million, mostly in the credit card and personal loan portfolios; and • Write-backs of $93 million, mostly within the Business & Wealth segment. Income tax expense The effective tax rate of 30.84% in 2024 (2023: 30.12%) was higher as 2023 included accounting gains from the sale of Advance Asset Management Limited that were not taxable. The effective tax rates are both above the Australian corporate tax rate of 30% Non-controlling interests During the year, Westpac New Zealand Limited issued a NZ$375 million perpetual preference shares which are recognised as Additional Tier 1 capital for Westpac New Zealand Limited. For Westpac, the terms of this instrument do not satisfy APRA's capital requirements and are deemed to be a non-controlling interests as they are equity instruments issued by a wholly owned subsidiary that are held by external investors with no contractual obligation on Westpac to repay in an adverse event. In addition, Westpac acquired 8.74% of the non-controlling shares of Westpac Bank-PNG-Limited, which will raise our controlling interest to 98.65%. |
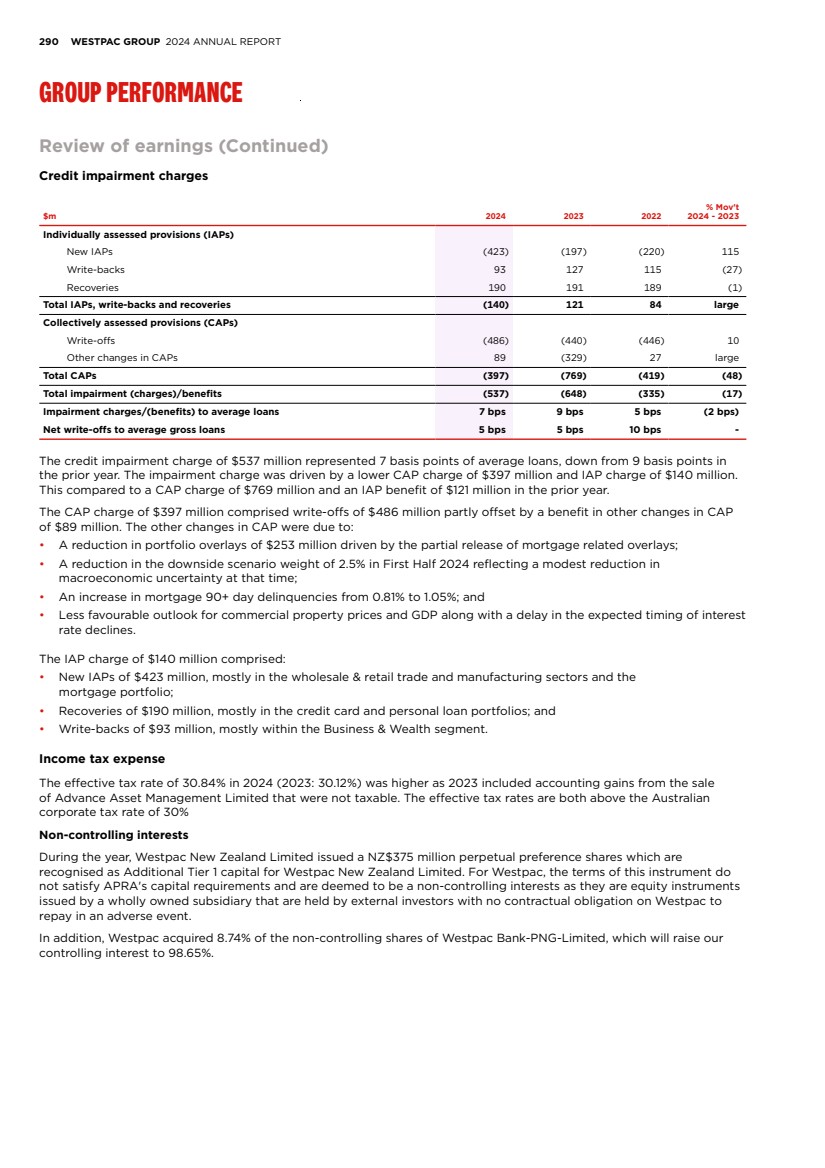
| FINANCIAL STATEMENTS EXHIBITS INDEX STRATEGIC REVIEW PERFORMANCE REVIEW SHAREHOLDER INFORMATION 291 Credit quality Credit quality key metrics 2024 2023 2022 % Mov't 2024 - 2023 Stressed exposures by credit grade as a % of TCE: Impaired 0.16% 0.11% 0.13% 5 bps Non performing, 90 days past due 0.47% 0.39% 0.32% 8 bps Non performing, less than 90 days past due 0.23% 0.22% 0.19% 1 bps Watchlist and substandard 0.59% 0.54% 0.43% 5 bps Total stressed exposures 1.45% 1.26% 1.07% 19 bps Gross impaired exposures to TCE for business and institutional: Business Australia 0.65% 0.44% 0.55% 21 bps Business New Zealand 0.32% 0.12% 0.16% 20 bps Institutional 0.04% 0.02% 0.05% 2 bps Mortgage 90+ day delinquencies: Group 1.05% 0.81% 0.69% 24 bps Australia 1.12% 0.86% 0.75% 26 bps New Zealand 0.49% 0.33% 0.22% 16 bps Other consumer loans 90+ day delinquencies: Group 1.40% 1.28% 1.56% 12 bps Australia 1.47% 1.32% 1.60% 15 bps New Zealand 0.87% 0.92% 1.03% (5 bps) Other: Gross impaired exposures to gross loans 0.24% 0.17% 0.20% 7 bps Gross impaired exposure provisions to gross impaired exposures 41.28% 43.47% 47.95% (219 bps) Total provisions to gross loans 63 bps 63 bps 62 bps - Collectively assessed provisions to credit risk weighted assets 132 bps 135 bps 116 bps (3 bps) Total provisions to credit risk weighted assets 147 bps 145 bps 128 bps 2 bps Movement in gross impaired exposures $m 2024 2023 2022 % Mov't 2024 - 2023 Balance as at beginning of the year 1,302 1,514 2,142 (14) New and increased - individually managed 701 367 430 91 Write-offs (620) (601) (934) 3 Returned to performing or repaid (288) (449) (436) (36) Portfolio managed - new/increased/returned/repaid 870 468 296 86 Exchange rate and other adjustments (10) 3 16 large Balance as at end of the year 1,955 1,302 1,514 50 Loan quality Housing and personal loans that were past due can be dis-aggregated based on days overdue as follows: Consolidated 2024 2023 $m 30-89 days 90+ days Total 30-89 days 90+ days Total Loans Loans - housing 3,890 5,914 9,804 3,644 4,385 8,029 Loans - personal 125 143 268 128 144 272 Total 4,015 6,057 10,072 3,772 4,529 8,301 |
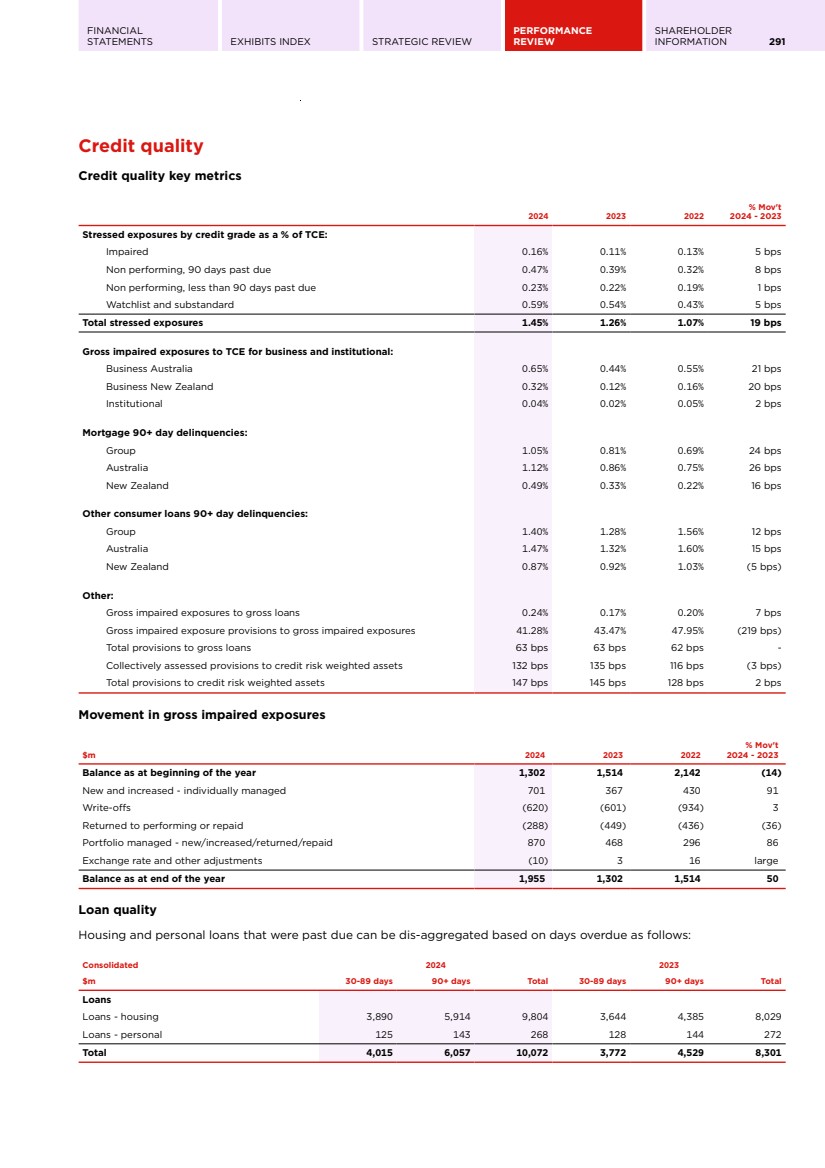
| 292 WESTPAC GROUP 2024 ANNUAL REPORT GROUP PERFORMANCE Credit quality (Continued) Credit quality remained resilient, notwithstanding a rise in stressed exposures as a percentage of total committed exposures (TCE) of 19 basis points to 1.45%. The composition and drivers of stressed exposures were: • Impaired exposures of 16 basis points: a 5 basis point increase reflecting higher impaired balances in the mortgage portfolio and the wholesale & retail trade and manufacturing sectors. • Non-performing, 90+ days past due and not impaired exposures of 47 basis points: a 8 basis point increase reflecting higher mortgage 90+ day delinquencies; • Non-performing not 90 days past due and not impaired exposures of 23 basis points: a 1 basis point increase; and • Watchlist and substandard exposures of 59 basis points: a 5 basis point increase relating to the wholesale & retail trade and manufacturing sectors. Gross impaired exposures to gross loans were 7 basis points higher at 0.24%, driven by higher impaired exposures in the mortgage portfolio and the wholesale & retail trade and manufacturing sectors. The provision coverage of the impaired portfolio was 41%, down from 43% at 30 September 2023. Impaired exposures have an appropriate level of provision cover. Portfolio segments Stressed exposures in WIB increased by 18 basis points to 0.76%, driven by increases in substandard exposures in the trade and property sectors. Impaired exposures to TCE remain low at 0.05%. Australian business stressed exposure increased by 29 basis points to 5.24% driven by downgrades to watchlist in the wholesale & retail trade and transport & storage sectors. Impaired exposures to TCE increased 20 basis points to 0.65% with deterioration in the wholesale & retail trade and agriculture, forestry & fishing sectors. Australian mortgage 90+ day delinquencies increased 26 basis points to 1.12% due to elevated interest rates and cost of living pressures. Hardship increased by 43 basis points to 1.14% as customers required additional assistance. Properties in possession were 201, a reduction of 9 compared to 30 September 2023 reflecting increased turnover and price momentum in the residential property market. Australian other consumer 90+ day delinquencies increased 15 basis points to 1.47% driven by cost of living pressures impacting the cards and personal loans portfolios. In New Zealand, stressed exposure to TCE increased by 24 basis points to 1.73%. This was driven by a 10 basis point increase in impaired exposure to 0.16%, mostly within the manufacturing sector, and increases in watchlist and substandard exposures in the agriculture, forestry & fishing sector. New Zealand mortgage 90+ day delinquencies were up 16 basis points to 0.49%. This increase reflected the impact of cost of living pressures. Other consumer 90+ day delinquencies were 5 basis points lower at 0.87% reflecting a lower level of delinquency in the personal loans portfolio. The number of hardship cases has remained stable over the period. |
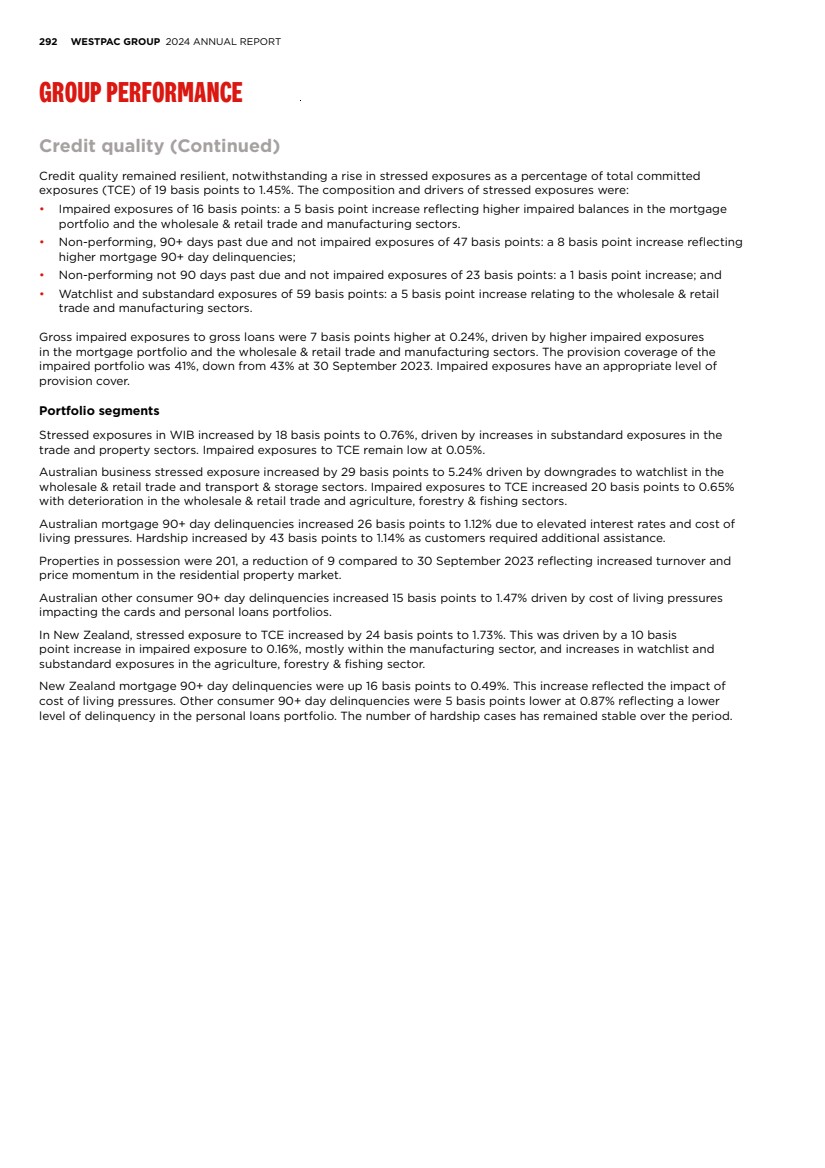
| FINANCIAL STATEMENTS EXHIBITS INDEX STRATEGIC REVIEW PERFORMANCE REVIEW SHAREHOLDER INFORMATION 293 Credit quality (Continued) Provisioning $m 2024 2023 2022 % Mov't 2024 - 2023 Provision for expected credit losses (ECL) on loans and credit commitments Collectively assessed provisions Modelled provision 4,369 4,147 3,473 5 Overlays 179 432 700 (59) Total collectively assessed provisions 4,548 4,579 4,173 (1) Individually assessed provisions 536 351 452 53 Total provision for ECL on loans and credit commitments 5,084 4,930 4,625 3 Provision for ECL on debt securities at amortised cost 6 6 6 - Provision for ECL on debt securities at FVOCIa 6 5 4 20 Total provision for ECL 5,096 4,941 4,635 3 a. FVOCI represents fair value through other comprehensive income. Total provisions increased 3% to $5,096 million. The increase was driven by a higher IAP. The increase in the IAP of $185 million was driven by new IAPs in the mortgage portfolio and the wholesale & retail trade and manufacturing sectors. CAP was $31 million lower, reflecting higher modelled provisions more than offset by a reduction in portfolio overlays and a reduction in the downside scenario weight. Modelled provisions were higher due to: • Less favourable outlook for commercial property prices, GDP and interest rates; and • Higher levels of stress in the portfolio, particularly mortgage 90+ day delinquencies. This was partly offset by a 2.5% reduction in the downside scenario weight to 42.5% in First Half 2024, reflecting a reduction in macroeconomic uncertainty in First Half 2024. In the Second Half 2024 the scenario weights remained unchanged. Portfolio overlays were $253 million lower as the expected risk did not materialise or is now reflected in modelled outcomes. The reduction reflects partial release of mortgage related overlays. Scenario weightings (%) 2024 2023 2022 Upside 5.0 5.0 5.0 Base 52.5 50.0 50.0 Downside 42.5 45.0 45.0 |
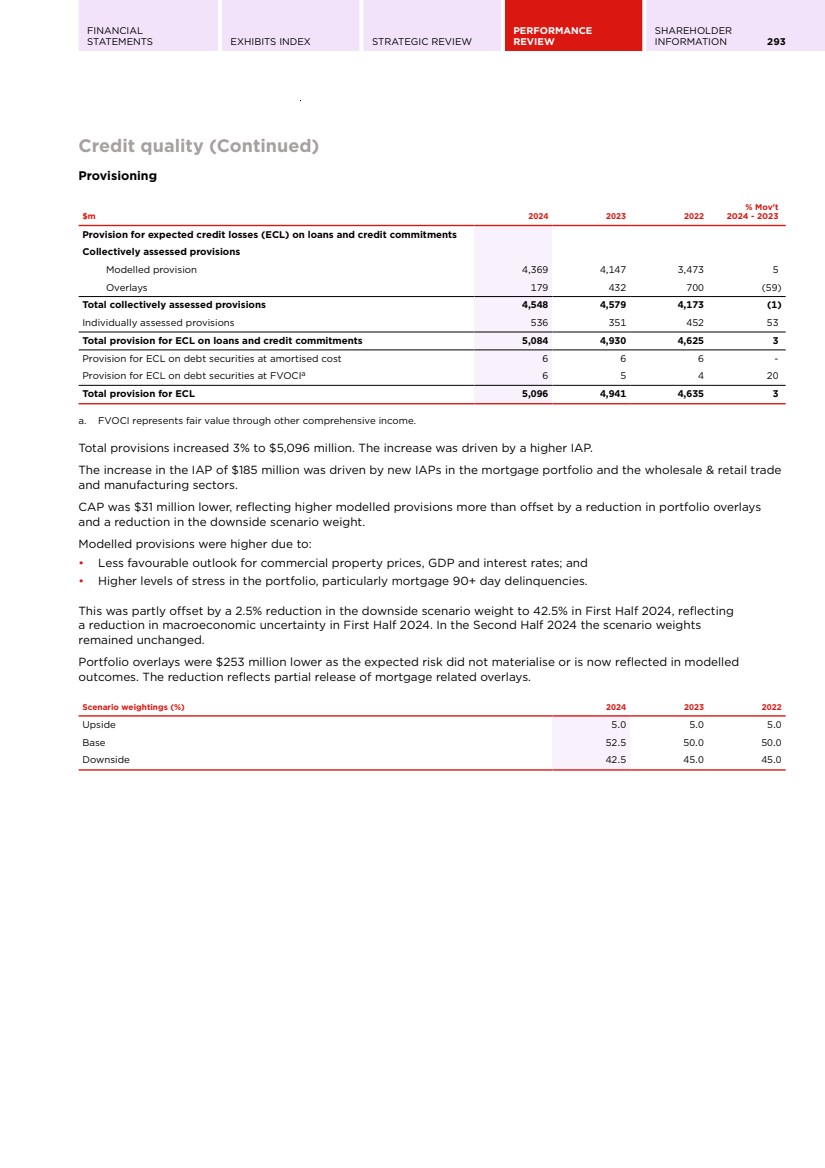
| 294 WESTPAC GROUP 2024 ANNUAL REPORT GROUP PERFORMANCE Balance sheet and funding Balance sheet The detailed components of the balance sheet are set out in the notes to the financial statements. $m 2024 2023 2022 % Mov't 2024 - 2023 Assets Loans 806,767 773,254 739,647 4 Housing 566,081 547,074 523,952 3 Personal 11,238 12,379 13,897 (9) Business 234,016 218,234 206,004 7 Provision for expected credit losses (4,568) (4,433) (4,206) 3 Liquid assets 200,682 196,720 194,058 2 Assets held for sale - - 75 - All other assets 70,095 59,800 80,418 17 Total assets 1,077,544 1,029,774 1,014,198 5 Liabilities Customer deposits 673,615 640,951 612,834 5 Transactionsa 119,944 123,046 146,759 (3) Savingsa 216,256 198,909 167,966 9 Term 197,230 185,770 161,858 6 Non-interest bearinga 140,185 133,226 136,251 5 Certificates of deposit 46,874 47,217 46,295 (1) Debt issues 169,284 156,573 144,868 8 Term funding from central banks 2,777 16,586 33,277 (83) Loan capital 37,883 33,176 31,254 14 Liabilities held for sale - - 32 - All other liabilities 75,059 62,732 75,129 20 Total liabilities 1,005,492 957,235 943,689 5 Equity Total equity attributable to owners of WBC 71,705 72,495 70,452 (1) Non-controlling interestsb 347 44 57 large Total equity 72,052 72,539 70,509 (1) a. Comparatives have been revised to align with current period presentation. b. Westpac recognises the perpetual preference shares issued by Westpac New Zealand Limited as non-controlling interests. Funding and liquidity risk management Liquidity risk is the risk that a bank will be unable to fund assets and meet obligations as they become due. This risk is inherent for all banks as intermediaries between depositors and borrowers. Westpac has a Liquidity Risk Management Framework which seeks to ensure we meet our cash flow obligations under a wide range of market conditions and scenarios, as well as meeting the requirements of the LCR and NSFR. The Liquidity Risk Management Framework is approved by the Board and sets out the funding and liquidity risk appetite. It also determines the roles and responsibilities of key people managing funding and liquidity risk, risk reporting and control processes. In addition, it sets out the limits and targets used to manage Westpac’s balance sheet, including wholesale funding limits, liquidity risk limits and stress testing. A strong liquidity position and a conservative funding profile were maintained over the year, with key ratios and metrics remaining comfortably above minimum requirements. Reflecting Westpac’s low risk profile, the credit ratings for some term funding and capital instruments were upgraded by key ratings agencies in March and April 2024. |
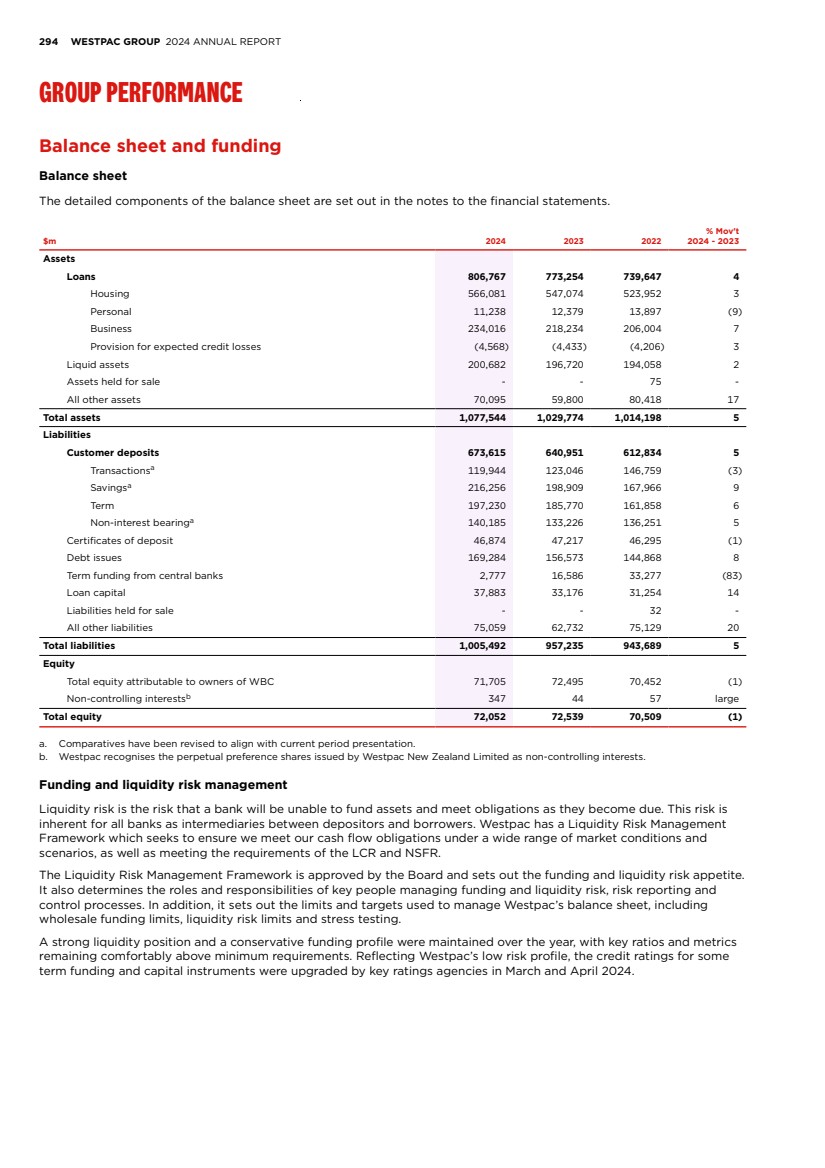
| FINANCIAL STATEMENTS EXHIBITS INDEX STRATEGIC REVIEW PERFORMANCE REVIEW SHAREHOLDER INFORMATION 295 Balance sheet and funding (Continued) LCR $m 2024 2023 2022 % Mov't 2024 - 2023 High Quality Liquid Assets (HQLA) 172,722 181,882 175,595 (5) Committed Liquidity Facility (CLF) - - 15,512 - Total LCR liquid assets 172,722 181,882 191,107 (5) Cash outflows in a modelled 30-day APRA defined stressed scenario Customer deposits 95,133 95,008 101,271 - Wholesale funding 8,715 11,249 12,975 (23) Other flowsa 26,067 29,943 31,051 (13) Total 129,915 136,200 145,297 (5) LCRb 133% 134% 132% (59 bps) a. Other flows include credit and liquidity facilities, collateral outflows, inflows from customers and TFF maturities. b. Calculated on a quarterly average basis for the quarter ended 30 September. The LCR is designed to enhance banks’ short-term resilience, by measuring the level of HQLA, as defined, held against its liquidity needs for a 30 calendar day period under a regulator-defined stress scenario. The average LCR for the quarter ended 30 September 2024 was 133%, little changed compared to the quarter ended 30 September 2023 due to reductions in both liquid assets and net cash outflows. The ratio remains well above the regulatory minimum of 100%. The average HQLA held in the September 2024 quarter was $173 billion, which provides approximately $43 billion in HQLA above the 100% LCR minimum. The portfolio of HQLA provides a buffer against periods of liquidity stress, as well as meeting regulatory requirements. HQLA include cash, deposits with central banks, government and semi-government securities, and are recognised in the LCR calculation at market value. Derivatives are used to hedge the interest rate risk of the liquid asset portfolio and reduce exposure to changes in fair value. Changes in the fair value of liquid assets are recognised in Other Comprehensive Income through the relevant equity reserve. Westpac also has access to non-HQLA and other assets that are eligible for re-purchase with a central bank under certain conditions and provide a source of additional liquidity. These assets include private securities and self-originated AAA-rated mortgage-backed securities. NSFR $m 2024 2023 2022 % Mov't 2024 - 2023 Available stable funding 736,202 707,893 687,442 4 Required stable funding 654,798 615,341 570,185 6 Net stable funding ratio 112% 115% 121% (261 bps) The NSFR is designed to encourage banks’ longer-term funding resilience. To comply, banks are required to maintain an NSFR of at least 100% at all times. The NSFR was 112% at 30 September 2024, well above the 100% minimum and within the Group's normal operating range. There has been little change to our liquidity risk or structural term profile. The ratio was down from 115% at 30 September 2023. Available stable funding increased due to growth in customer deposits. This was offset by the increase in required stable funding due to growth in lending and TFF maturities, as mortgages backing those facilities are no longer used as collateral for the TFF. |
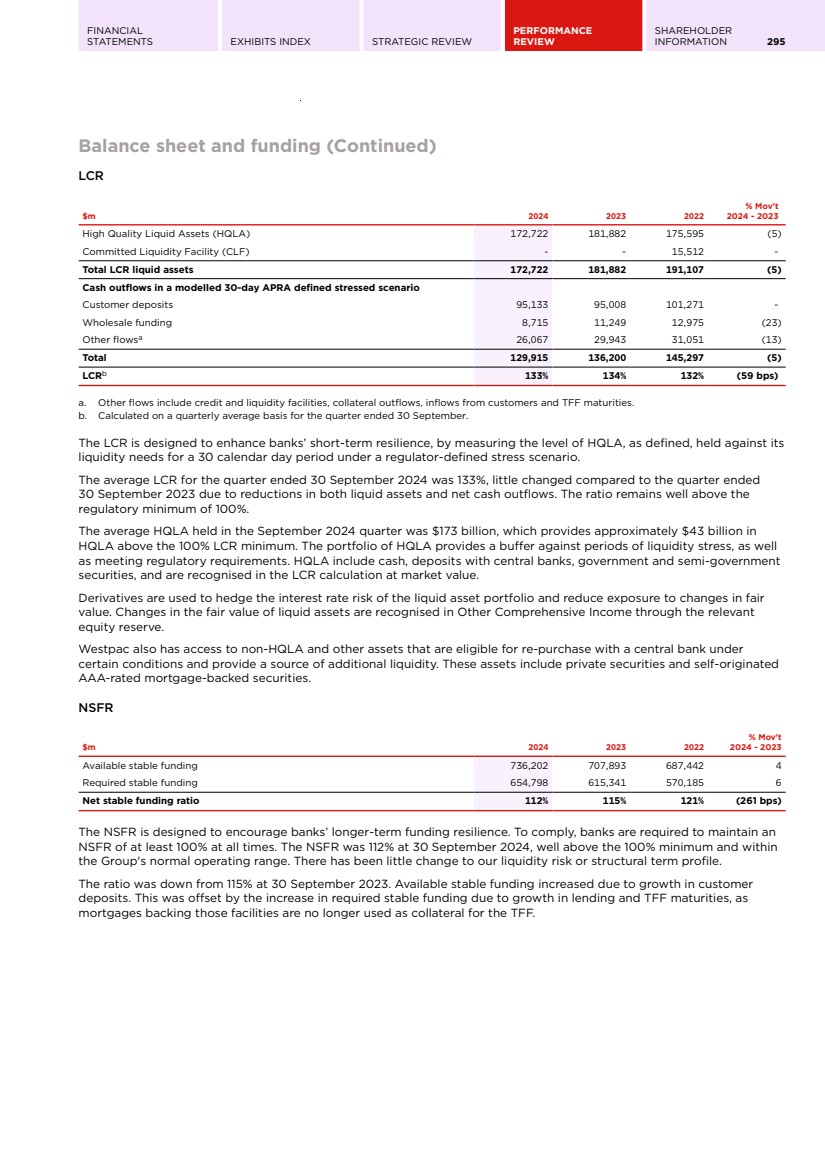
| 296 WESTPAC GROUP 2024 ANNUAL REPORT GROUP PERFORMANCE Balance sheet and funding (Continued) Funding The composition and stability of the Group's funding is monitored to comply with its funding risk appetite and the regulatory requirements of both the LCR and NSFR. A stable funding profile was maintained during the year with constructive credit market conditions providing opportunities to refinance wholesale maturities and remain responsive to balance sheet needs. Funding by residual maturity 2024 2023 2022 $m Ratio % $m Ratio % $m Ratio % Customer deposits 673,615 66.9 640,951 66.0 612,834 65.1 Wholesale funding Short term 82,590 8.2 79,181 8.1 79,098 8.4 Long term - less than or equal to one year residual maturity 31,790 3.2 40,607 4.2 38,896 4.1 Long term - more than one year residual maturity 140,458 13.9 133,979 13.8 136,586 14.5 Securitisation 5,539 0.6 4,298 0.4 4,973 0.5 Total wholesale funding 260,377 25.9 258,065 26.5 259,553 27.5 Equitya 72,052 7.2 72,543 7.5 69,967 7.4 Total funding 1,006,044 100.0 971,559 100.0 942,354 100.0 a. Includes total share capital, share-based payment reserve and retained profits. Long term wholesale funding Long term funding with a residual maturity greater than 12 months made up 13.9% of total funding at 30 September 2024, up from 13.8% at 30 September 2023. Funding from securitisation accounted for a further 0.6% of total funding, an increase compared to 0.4% at 30 September 2023, reflecting the $2.75 billion transaction issued in February 2024. In total, $41.9 billion of long term wholesale funding was raised in 2024, including $5.1 billion issued by Westpac New Zealand Limited. Leveraging the scale and diversity of the Group's wholesale funding franchise, new issuance included senior unsecured and covered bonds, RMBS and capital securities, including $5.4 billion in Tier 2 capital securities and $2.1 billion in Additional Tier 1 capital securities. New long term issuance was raised across a range of tenors and currencies, although almost half was raised in Australian dollars, benefiting from the continued depth of the Australian bond market. Short term wholesale funding Short term wholesale funding accounted for 8.2% of total funding at 30 September 2024, up from 8.1% at 30 September 2023. Long term funding where the residual maturity is less than one year, reduced to 3.2% at 30 September 2024, from 4.2% at 30 September 2023 mainly due to the repayment of TFF maturities. The short term wholesale funding portfolio, including long term funding with a residual maturity of less than one year, had a weighted average maturity of 151 days, up from 149 days at 30 September 2023. Deposit to loan ratio 2024 2023 2022 $m Ratio % $m Ratio % $m Ratio % Customer deposits 673,615 640,951 612,834 Loans 806,767 83.50 773,254 82.89 739,647 82.85 Customer deposits Customer deposits accounted for 66.9% of the total funding at 30 September 2024, compared to 66.0% at 30 September 2023. Over the year, customer deposits grew $32.7 billion compared to loan growth of $33.5 billion. As the growth in customer deposit was 5.1% relative to the growth in loans of 4.3%, the deposit to loan ratio rose to 83.5%. Equity Funding from equity made up 7.2% of total funding at 30 September 2024, compared to 7.5% at 30 September 2023. This reflects the impact of the on market share buyback conducted during the year. |
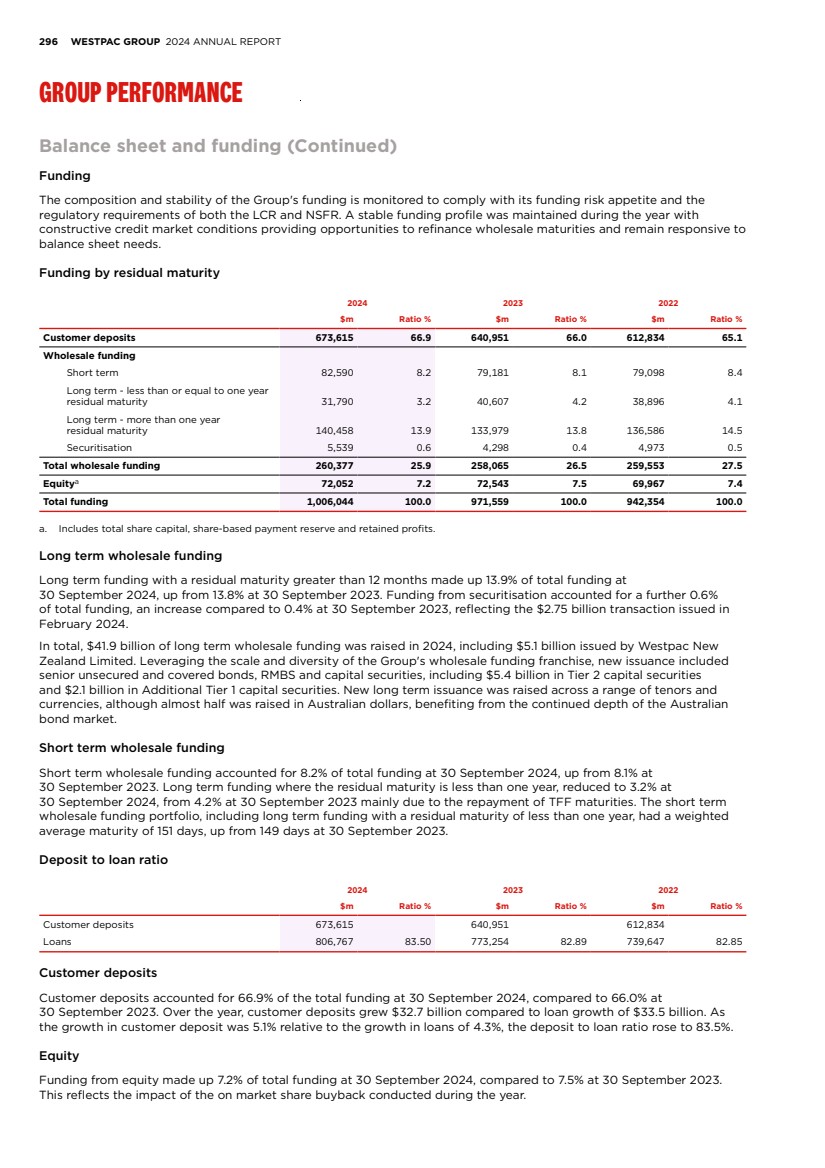
| FINANCIAL STATEMENTS EXHIBITS INDEX STRATEGIC REVIEW PERFORMANCE REVIEW SHAREHOLDER INFORMATION 297 Capital and dividends 2024 2023 2022a % Mov't 2024 - 2023 Level 2 regulatory capital structure Common equity Tier 1 (CET1) capital after deductions ($m) 54,648 55,885 53,943 (2) Risk weighted assets (RWA) ($m) 437,430 451,418 477,620 (3) CET1 capital ratio 12.49% 12.38% 11.29% 11 bps Additional Tier 1 capital ratio 2.33% 2.21% 2.10% 12 bps Tier 1 capital ratio 14.82% 14.59% 13.39% 23 bps Tier 2 capital ratio 6.56% 5.86% 5.01% 70 bps Total regulatory capital ratio 21.38% 20.45% 18.40% 93 bps APRA leverage ratio 5.30% 5.50% 5.61% (20 bps) Level 1 regulatory capital structure CET1 capital after deductions ($m) 50,454 52,273 50,722 (3) Risk weighted assets ($m) 397,719 414,293 447,010 (4) Level 1 CET1 capital ratio 12.69% 12.62% 11.35% 7 bps a. APRA’s revised capital framework (Basel III) became effective on 1 January 2023 and included updated prudential standards for capital adequacy and credit risk capital. The reported 2022 comparatives have not been restated to align to the current capital framework. Capital management strategy The capital management strategy is reviewed on an ongoing basis, including through an annual Internal Capital Adequacy Assessment Process. Key considerations include: • Regulatory capital minimums together with the capital conservation buffer and countercyclical capital buffer comprise the Total CET1 Requirement. The Total CET1 Requirement for domestic systemically important banks (D-SIBs), including Westpac, is at least 10.25%;1 • Strategy, business mix and operations and contingency plans; • Perspectives of external stakeholders including rating agencies as well as equity and debt investors; and • A stress testing framework that tests our resilience under a range of adverse economic scenarios. The Board has determined a target CET1 capital operating range of between 11.0% and 11.5%, in normal operating conditions. LEVEL 2 CET1 CAPITAL RATIO MOVEMENT FOR 2024 12.38% 160bps (117bps) 36bps (11bps) (3bps) (54bps) 12.49% Sep-23 Net profit Ordinary dividends RWA movement Capital deductions and other items FX translation impacts Capital return Sep-24 The Level 2 CET1 capital ratio was 12.49% at 30 September 2024, 11 basis points higher than 30 September 2023. Key movements include: • 2024 net profit: 160 basis points increase; • Payment of the 2023 final ordinary dividend and the 2024 interim ordinary dividend: 117 basis points reduction; 1. Noting that APRA may apply higher CET1 requirements for an individual ADI. |
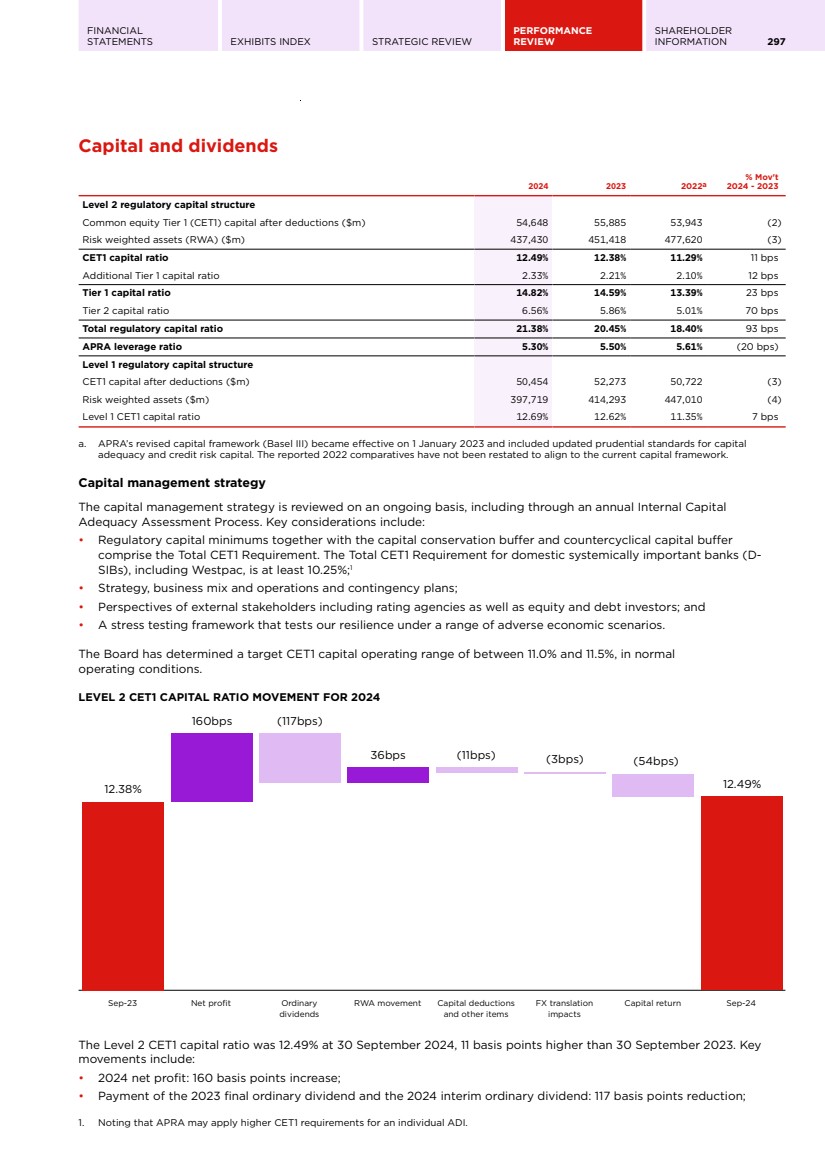
| 298 WESTPAC GROUP 2024 ANNUAL REPORT GROUP PERFORMANCE Capital and dividends (Continued) • RWA movement: 36 basis points increase due to non-credit RWA decrease of 57 basis points partly offset by credit RWA increase of 21 basis points; • Capital deductions and other items: 11 basis points decrease mainly due to other reserve movements and a higher deduction for deferred tax assets; • Foreign currency translation impacts: 3 basis points reduction mainly from the appreciation of the A$ against the US$; and • Capital return: 54 basis points reduction comprising a $0.5 billion special dividend and approximately $1.8 billion of on market share buybacks. The Level 1 CET1 capital ratio was 12.69% at 30 September 2024, 7 basis points higher than 30 September 2023 with movements mostly in line with Level 2. Additional Tier 1 and Tier 2 capital movement for 2024 During the year, Westpac issued $1.75 billion of APRA qualifying Additional Tier 1 instruments and redeemed $1.4 billion, excluding issuance and redemption of Additional Tier 1 instruments by Westpac New Zealand Limited. The net impact of these transactions was an increase in the Tier 1 capital ratio of approximately 7 basis points. Westpac issued $5.4 billion of Tier 2 capital instruments and redeemed $1.35 billion over the year. The net impact of these transactions was an increase in the total regulatory capital ratio of approximately 92 basis points. Domestic systemically important banks (D-SIBs), including Westpac, have a total capital requirement of 18.25% from 1 January 2026. Westpac's total regulatory capital ratio was 21.38% at 30 September 2024. Leverage ratio The leverage ratio represents the amount of Tier 1 capital relative to exposure1 .. At 30 September 2024, the leverage ratio was 5.30%, down 20 basis points from 30 September 2023, and above APRA's regulatory minimum requirement of 3.5%. The decrease in the leverage ratio is mainly due to lower Tier 1 regulatory capital as a result of the on market share buybacks completed during the year. Internationally comparable capital ratios APRA’s capital adequacy requirements are more conservative than those of the Basel Committee on Banking Supervision, leading to lower reported capital ratios when compared to international peers. International comparable capital ratios have been calculated using the methodology outlined in the Australian Banking Association study released on 10 March 2023. The 2022 comparatives have not been restated and capital ratios are reported under the APRA study published in July 2015. % 2024 2023 2022 % Mov't 2024 - 2023 Internationally comparable capital ratios CET1 capital ratio 18.27% 18.73% 17.57% (46 bps) Tier 1 capital ratio 21.33% 21.76% 20.57% (43 bps) Total regulatory capital ratio 29.93% 29.87% 27.75% 6 bps Leverage ratio 5.78% 5.98% 6.00% (20 bps) 1. As defined under Attachment D of APS110: Capital Adequacy. |
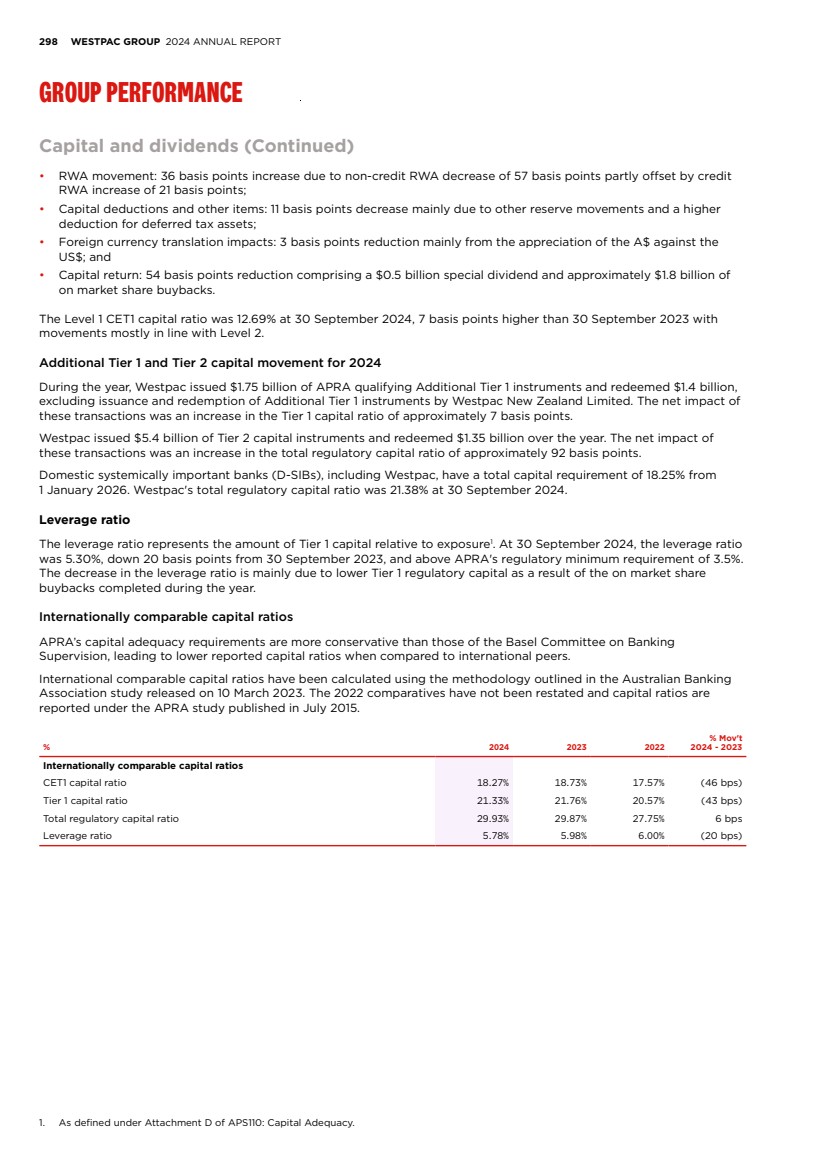
| FINANCIAL STATEMENTS EXHIBITS INDEX STRATEGIC REVIEW PERFORMANCE REVIEW SHAREHOLDER INFORMATION 299 Capital and dividends (Continued) Risk Weighted Assets (RWA) $m 2024 2023 2022a % Mov't 2024 - 2023 Credit risk: Corporate 25,976 24,818 5 Business lending 25,033 23,860 5 Property finance 32,196 30,416 6 Large corporate 21,035 20,570 2 Sovereign 2,047 2,143 (4) Financial institution 13,694 13,457 2 Residential mortgages 116,228 112,948 3 Australian credit cards 3,565 3,712 (4) Other retail 3,995 4,607 (13) Small business 17,123 17,040 - Specialised lending 3,695 3,065 21 Securitisation 7,821 7,661 2 Standardised 25,414 28,813 (12) New Zealandb 48,142 46,648 3 Total credit risk 345,964 339,758 362,098 2 Market risk 9,555 11,538 9,290 (17) Operational risk 48,196 55,175 59,063 (13) Interest rate risk in the banking book (IRRBB) 27,955 40,138 42,782 (30) Other 5,760 4,809 4,387 20 Total risk weighted assets 437,430 451,418 477,620 (3) a. APRA’s revised capital framework (Basel III) became effective on 1 January 2023 and included updated prudential standards for capital adequacy and credit risk capital. Credit classes for 2022 do not align to the current capital framework and therefore have not been included in the table. b. Includes credit and securitisation exposures regulated under RBNZ prudential requirements. Total RWA decreased by 3.1% to $437.4 billion over the year largely due to the decrease in non-credit RWA. Credit RWA increased by 1.8% or $6.2 billion. Key movements included: • A $6.9 billion increase from higher lending primarily in Corporate, Large Corporate and Property Finance; • A $8.1 billion increase due to deterioration in credit quality mainly from an increase in delinquencies in Residential Mortgages and New Zealand exposures: • A $7.2 billion decrease from data refinements mainly related to Residential Mortgages, Corporate and Large Corporate exposures; • A $0.3 billion decrease from counterparty credit risk and mark-to-market related credit risk from changes in underlying foreign currency rates; and • A $1.3 billion decrease from foreign currency translation impacts, predominantly the appreciation of the A$ against the US$. Non-credit RWA were $20.2 billion lower. Key movements included: • IRRBB RWA: $12.2 billion decrease mainly due to: – A decrease of $17.1 billion due to lower interest rates and a revised IRRBB model, resulting in an embedded gain of $1.3 billion for 30 September 2024 compared to a $15.9 billion loss at September 2023; and – A $4.9 billion increase in repricing and yield curve, basis and optionality risk in line with underlying banking book positions. • Operational RWA: $7.0 billion decrease mainly driven by a reduction in the APRA capital overlay; and • Market RWA: $2.0 billion decrease due to reduced market volatility in the one-year historical VaR window as market events rolled out of the observation period, a decrease in Stressed Value at Risk (SVaR) from lower market risk exposures and a reduction in the Risks not in VaR (RNIV) add-on. |
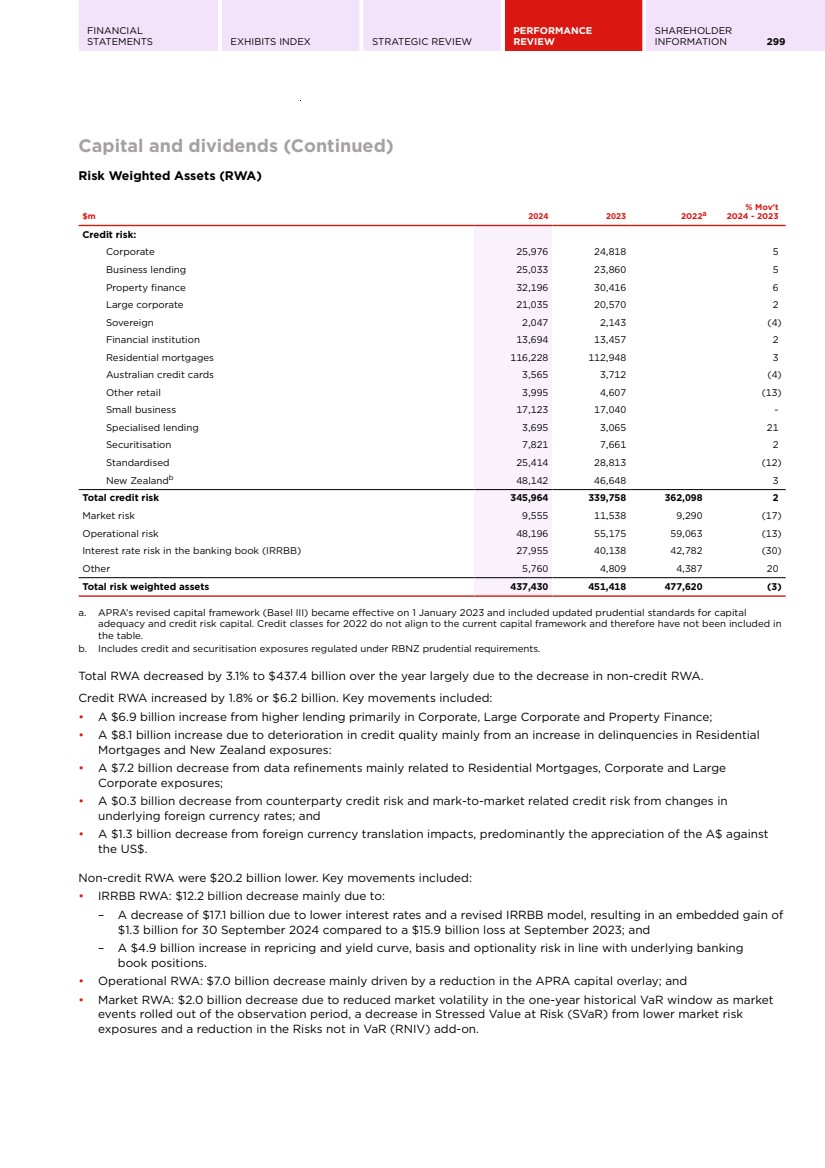
| 300 WESTPAC GROUP 2024 ANNUAL REPORT GROUP PERFORMANCE Capital and dividends (Continued) Capital adequacy $m 2024 2023 2022 % Mov't 2024 - 2023 Tier 1 capital CET1 capital Paid up ordinary capital 37,958 39,826 39,666 (5) Treasury shares (815) (759) (712) 7 Equity based remuneration 2,028 1,929 1,843 5 Foreign currency translation reserve (471) (171) (537) 175 Accumulated other comprehensive income (617) (221) 28 179 Non-controlling interests - other 8 44 57 (82) Retained earnings 32,773 31,436 29,063 4 Less retained earnings in life and general insurance, funds management and securitisation entities (357) (369) (300) (3) Deferred fees 350 334 300 5 Total CET1 capital 70,857 72,049 69,408 (2) Deductions from CET1 capital Goodwill (excluding funds management entities) (7,922) (7,940) (7,914) - Deferred tax assets (2,377) (2,144) (1,746) 11 Goodwill in life and general insurance, funds management and securitisation entities (149) (149) (204) - Capitalised expenditure (2,349) (2,375) (2,148) (1) Capitalised software (2,668) (2,797) (2,263) (5) Investments in subsidiaries not consolidated for regulatory purposes (154) (76) (316) 103 Regulatory expected downturn loss in excess of eligible provisions - - (144) - Securitisation (9) (16) - (44) Defined benefit superannuation fund surplus (215) (217) (219) (1) Equity investments (235) (228) (187) 3 Regulatory adjustments to fair value positions (131) (222) (324) (41) Total deductions from CET1 capital (16,209) (16,164) (15,465) - Total CET1 capital after deductions 54,648 55,885 53,943 (2) Additional Tier 1 capital Basel III complying instruments 10,225 10,037 10,021 2 Total Additional Tier 1 capital 10,225 10,037 10,021 2 Deductions from Additional Tier 1 capital Holdings of own and other financial institutions Additional Tier 1 capital instruments (30) (46) (25) (35) Total deductions from Additional Tier 1 capital (30) (46) (25) (35) Net Additional Tier 1 regulatory capital 10,195 9,991 9,996 2 Net Tier 1 regulatory capital 64,843 65,876 63,939 (2) Tier 2 capital Basel III complying instruments 28,293 25,740 23,791 10 Eligible general reserve for credit loss 770 1,051 411 (27) Total Tier 2 capital 29,063 26,791 24,202 8 Deductions from Tier 2 capital Holdings of own and other financial institutions Tier 2 capital instruments (368) (370) (243) (1) Total deductions from Tier 2 capital (368) (370) (243) (1) Net Tier 2 regulatory capital 28,695 26,421 23,959 9 Total regulatory capital 93,538 92,297 87,898 1 Risk weighted assets 437,430 451,418 477,620 (3) CET1 capital ratio 12.49% 12.38% 11.29% 11 bps Additional Tier 1 capital ratio 2.33% 2.21% 2.10% 12 bps Tier 1 capital ratio 14.82% 14.59% 13.39% 23 bps Tier 2 capital ratio 6.56% 5.86% 5.01% 70 bps Total regulatory capital ratio 21.38% 20.45% 18.40% 93 bps |
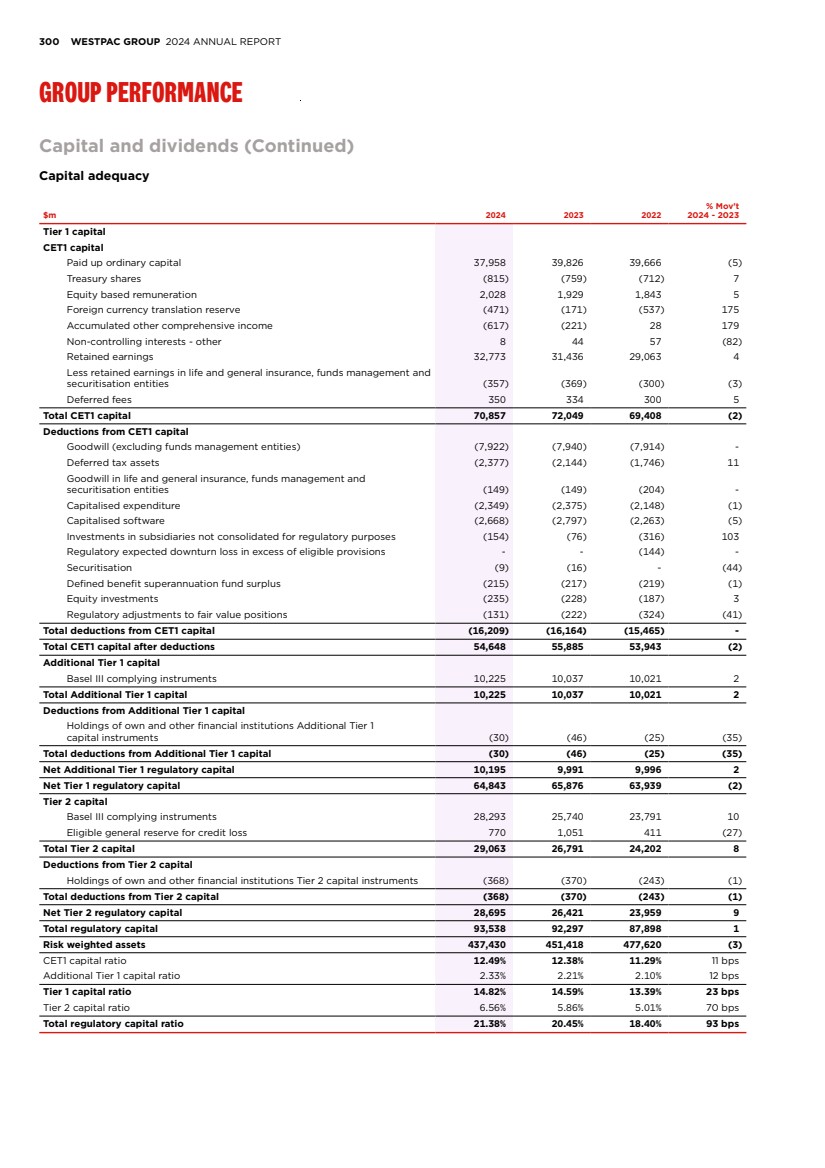
| FINANCIAL STATEMENTS EXHIBITS INDEX STRATEGIC REVIEW PERFORMANCE REVIEW SHAREHOLDER INFORMATION 301 Capital and dividends (Continued) Dividends 2024 2023 2022 % Mov't 2024 - 2023 Ordinary dividend - Interim (cents per share) 75 70 61 7 Ordinary dividend - Final (cents per share) 76 72 64 6 Total ordinary dividend (cents per share) 151 142 125 6 Special dividend (cents per share) 15 - - - Ordinary dividend payout ratioa 74.62% 69.20% 76.79% large Ordinary dividend payout ratio (ex Notable Items) 73.32% 67.57% 66.57% large Adjusted franking credit balance ($m) 3,504 3,520 3,298 - a. Payout ratio excludes the dividend component of completed off-market share buyback announced on 14 February 2022. The Board has determined a fully franked final ordinary dividend of 76 cents per share, to be paid on 19 December 2024 to shareholders on the register at the record date of 8 November 2024. The 2024 interim and final ordinary dividends represent a payout ratio of 73.32% excluding Notable Items. In addition to being fully franked, the final ordinary dividend will also carry NZ$0.06 in New Zealand imputation credits that may be used by New Zealand tax residents. The Board has determined to satisfy the DRP for the final ordinary dividend by arranging for the purchase of shares in the market by a third party. The market price used to determine the number of shares provided to DRP participants will be set over the 15 trading days commencing 13 November 2024 and will not include a discount. The Board has also determined to increase the on-market share buyback by a further $1.0 billion, in addition to the previously announced on-market share buyback of up to $2.5 billion. In aggregate, this represents a share buyback of up to $3.5 billion. Capital deduction for regulatory expected credit loss For capital adequacy purposes APRA requires the amount of regulatory expected credit losses in excess of eligible provisions to be deducted from CET1 capital. The table below shows the calculation of this capital deduction. $m 2024 2023 2022 % Mov't 2024 - 2023 Provisions associated with eligible portfolios Total provisions for expected credit losses 5,096 4,941 4,635 3 plus provisions associated with partial write-offs 290 292 377 (1) less ineligible provisionsa (201) (192) (143) 5 Total eligible provisions 5,185 5,041 4,869 3 Regulatory expected downturn loss 4,486 4,078 4,690 10 Excess/(shortfall) in eligible provisions compared to regulatory expected downturn loss 699 963 179 (27) CET1 capital deduction for regulatory expected downturn loss in excess of eligible provisionsb - - (144) - a. Provisions associated with portfolios subject to the Basel standardised approach to credit risk are not eligible. b. Regulatory expected loss is calculated for portfolios subject to the Basel advanced capital IRB approach to credit risk. The comparison between regulatory expected loss and eligible provisions is performed separately for defaulted and non-defaulted exposures. |
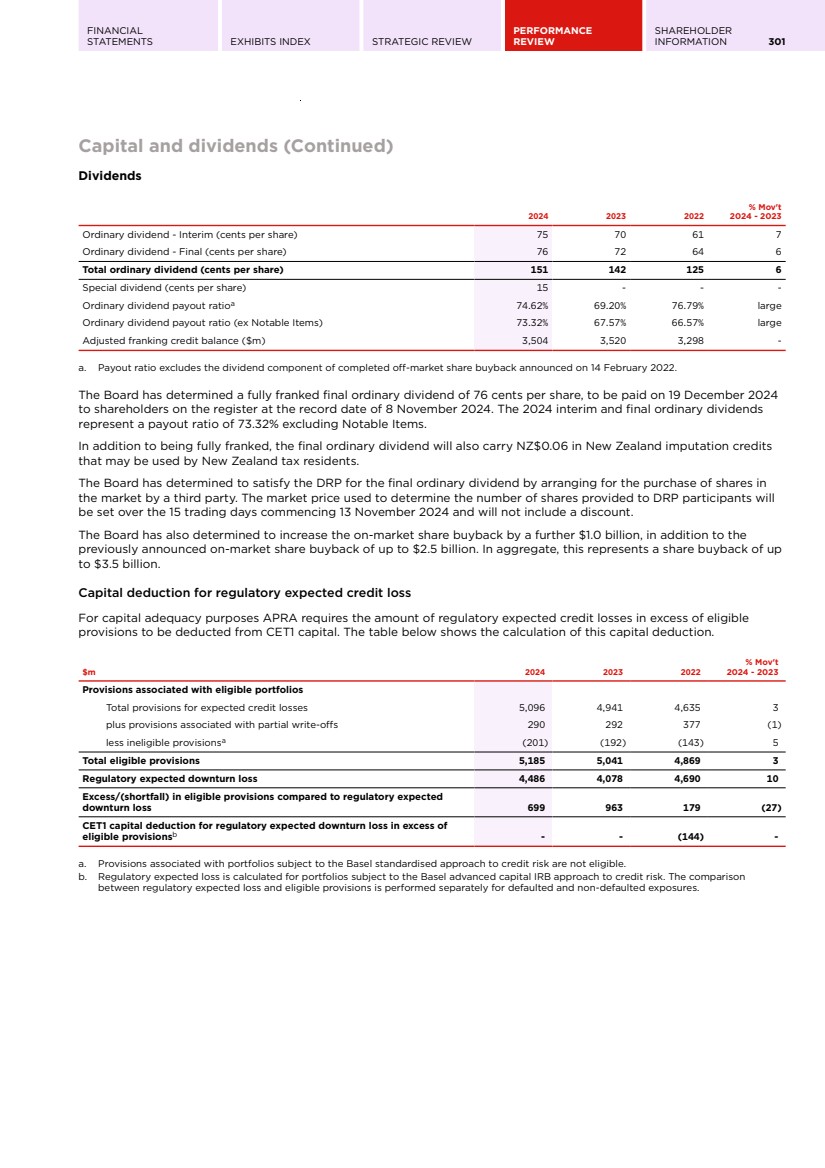
| 302 WESTPAC GROUP 2024 ANNUAL REPORT SEGMENT REPORTING For reporting purposes, Westpac identifies the impact of Notable Items on income and expenses and includes a subtotal titled “Pre-provision profit”. Pre-provision profit represents profit before impairment charges and income tax expenses. In 2024, Westpac established a new operating segment called Business & Wealth and dissolved the Specialist Business Division (SBD). The remaining operating businesses of SBD, which included the Platforms business, Pacific Banking, Margin lending and the auto finance portfolio were aggregated into the Business & Wealth segment. The past contribution from SBD’s sold businesses were aggregated with Group Businesses. In addition, we have made some changes to enhance performance reporting and assessment: • Funds transfer pricing: The methodology by which the costs of wholesale funding and liquidity are allocated to segments has been refined. • Capital allocations: Revised capital allocations to align to the Basel III framework adopted in January 2023. • Expense allocations: Reallocation of the activities and expenses of Enterprise functions across segments. These changes have been reflected in segment reporting so that the information presented aligns with information reported internally to key decision makers. Comparatives have been restated to align with the current period presentation. $m Consumer Business & Wealth Westpac Institutional Bank Westpac New Zealand (A$)a Group Businesses Group 2024 Net interest income 7,632 5,338 2,240 2,388 1,318 18,916 Non-interest income 528 798 1,265 257 (1) 2,847 Notable Items - - - (8) (167) (175) Net operating income 8,160 6,136 3,505 2,637 1,150 21,588 Operating expenses (4,787) (2,626) (1,465) (1,262) (804) (10,944) Total operating expenses (4,787) (2,626) (1,465) (1,262) (804) (10,944) Pre-provision profit 3,373 3,510 2,040 1,375 346 10,644 Impairment (charges)/benefits (248) (142) (120) (25) (2) (537) Profit before income tax (expense)/benefit 3,125 3,368 1,920 1,350 344 10,107 Income tax (expense)/benefit and NCIb (941) (1,012) (553) (377) (234) (3,117) Net profit/(loss) 2,184 2,356 1,367 973 110 6,990 Net profit includes impact of: Notable Items (post tax)b - - - (6) (117) (123) 2023 Net interest income 8,177 4,992 1,926 2,317 1,002 18,414 Non-interest income 524 844 1,367 240 153 3,128 Notable Items - (88) - - 191 103 Net operating income 8,701 5,748 3,293 2,557 1,346 21,645 Operating expenses (4,533) (2,459) (1,316) (1,186) (738) (10,232) Notable Items (202) (64) (15) (9) (170) (460) Total operating expenses (4,735) (2,523) (1,331) (1,195) (908) (10,692) Pre-provision profit 3,966 3,225 1,962 1,362 438 10,953 Impairment (charges)/benefits (179) (257) (87) (124) (1) (648) Profit before income tax (expense)/benefit 3,787 2,968 1,875 1,238 437 10,305 Income tax (expense)/benefit and NCIb (1,142) (882) (538) (350) (198) (3,110) Net profit/(loss) 2,645 2,086 1,337 888 239 7,195 Net profit includes impact of: Notable Items (post tax)b (148) (107) (10) (7) 99 (173) Profit/(loss) attributable to businesses soldc - - - - 131 131 a. Refer to the Westpac New Zealand NZ$ segment reporting for further details. b. Includes tax benefits on Notable Items of $52 million in 2024 (2023: $184 million). c. Refer to Additional Information for further details. |
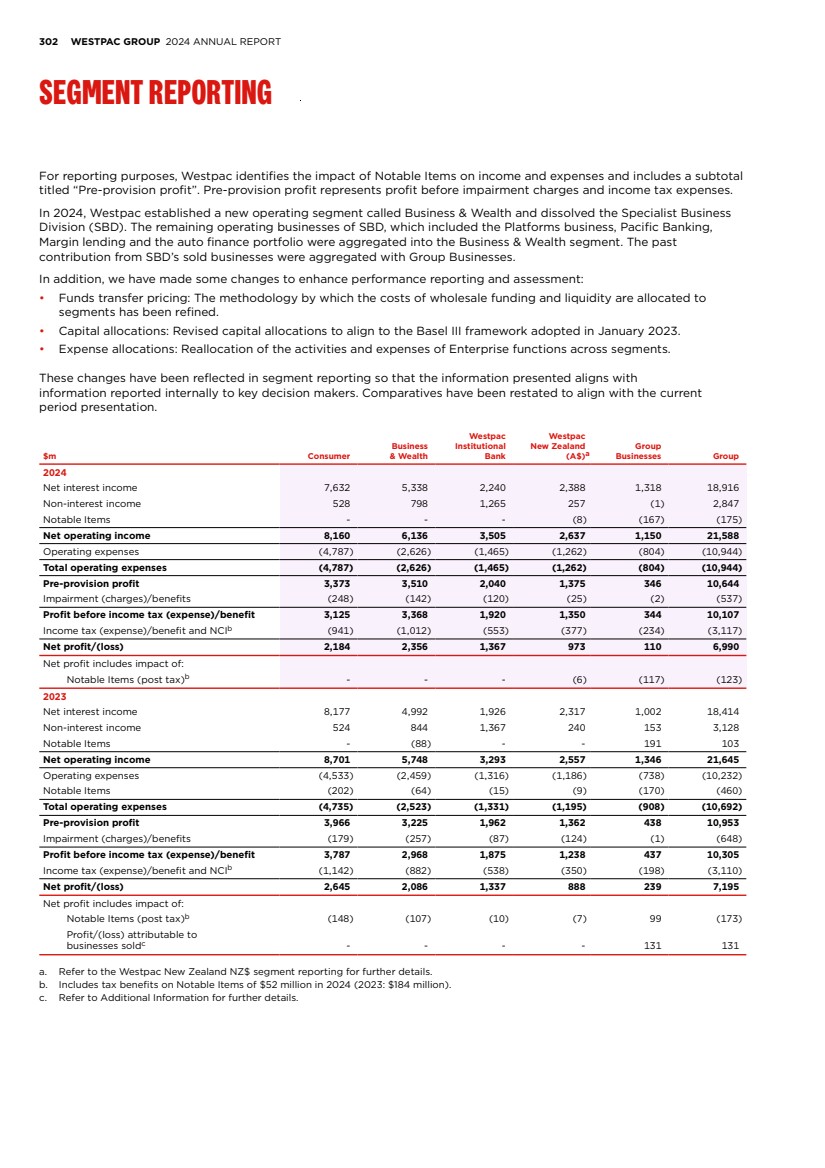
| FINANCIAL STATEMENTS EXHIBITS INDEX STRATEGIC REVIEW PERFORMANCE REVIEW SHAREHOLDER INFORMATION 303 $m Consumer Business & Wealth Westpac Institutional Bank Westpac New Zealand (A$)a Group Businesses Group 2022 Net interest income 8,473 3,508 1,438 2,107 1,080 16,606 Non-interest income 557 881 1,150 279 432 3,299 Notable Items - (1) - 120 (418) (299) Net operating income 9,030 4,388 2,588 2,506 1,094 19,606 Operating expenses (4,411) (2,446) (1,265) (1,072) (987) (10,181) Notable Items (66) (13) - - (542) (621) Total operating expenses (4,477) (2,459) (1,265) (1,072) (1,529) (10,802) Pre-provision profit 4,553 1,929 1,323 1,434 (435) 8,804 Impairment (charges)/benefits (187) (97) (85) 25 9 (335) Profit before income tax (expense)/benefit 4,366 1,832 1,238 1,459 (426) 8,469 Income tax (expense)/benefit and NCIb (1,314) (557) (372) (382) (150) (2,775) Net profit/(loss) 3,052 1,275 866 1,077 (576) 5,694 Net profit includes impact of: Notable Items (post tax)b (47) (9) - 119 (937) (874) Profit/(loss) attributable to businesses soldc - - - 18 168 186 a. Refer to the Westpac New Zealand NZ$ segment reporting for further details. b. Includes tax benefits on Notable Items of $46 million. c. Refer to Additional Information for further details. Businesses sold The table below shows the profit/(loss) attributable to businesses sold on the segments by the relevant period. No businesses were sold in FY24. Further details are provided in Net profit contribution of businesses sold (page 356). $m Consumer Business & Wealth Westpac Institutional Bank Westpac New Zealand (A$) Group Businesses Group 2023 Net interest income - - - - - - Non-interest income - - - - 140 140 Net operating income - - - - 140 140 Operating expenses - - - - 46 46 Pre-provision profit - - - - 186 186 Impairment (charges)/benefits - - - - - - Profit before income tax (expense)/benefit - - - - 186 186 Income tax (expense)/benefit and NCI - - - - (55) (55) Net profit - - - - 131 131 2022 Net interest income - - - - 6 6 Non-interest income - - - 28 364 392 Net operating income - - - 28 370 398 Operating expenses - - - (3) (124) (127) Pre-provision profit - - - 25 246 271 Impairment (charges)/benefits - - - - 7 7 Profit before income tax (expense)/benefit - - - 25 253 278 Income tax (expense)/benefit and NCI - - - (7) (85) (92) Net profit - - - 18 168 186 |
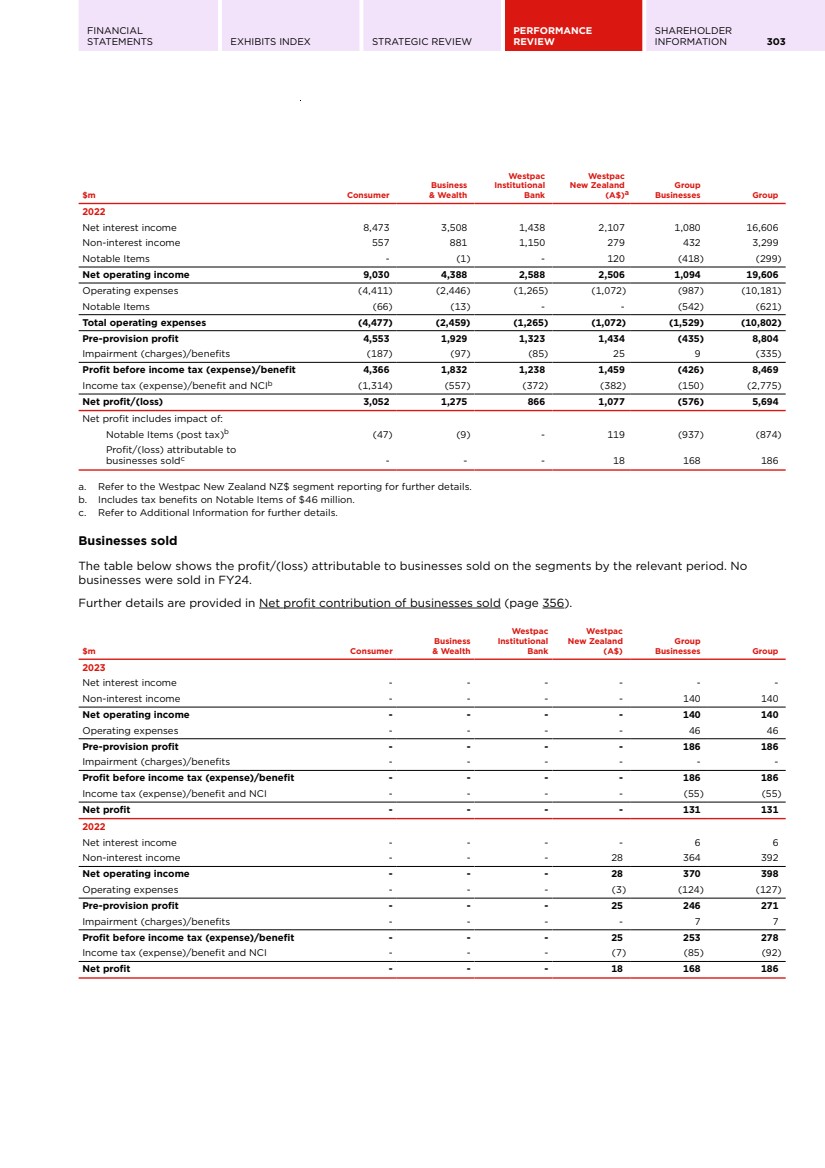
| 304 WESTPAC GROUP 2024 ANNUAL REPORT SEGMENT REPORTING Consumer The Consumer segment provides a full range of banking products and services to customers in Australia. Products and services are provided through a portfolio of brands comprising Westpac, St.George, BankSA and Bank of Melbourne using digital channels, call centres, mobile bankers, branches and third-party brokers. It also includes the RAMS business, which is closed to new business. $m 2024 2023 2022 % Mov't 2024 - 2023 Net interest income 7,632 8,177 8,473 (7) Non-interest income 528 524 557 1 Net operating income 8,160 8,701 9,030 (6) Operating expenses (4,787) (4,533) (4,411) 6 Notable Items - (202) (66) (100) Total operating expenses (4,787) (4,735) (4,477) 1 Pre-provision profit 3,373 3,966 4,553 (15) Impairment (charges)/benefits (248) (179) (187) 39 Profit before income tax expense 3,125 3,787 4,366 (17) Income tax expense and NCI (941) (1,142) (1,314) (18) Net profit 2,184 2,645 3,052 (17) Notable Items (post tax) - (148) (47) (100) Expense to income ratio (Ex Notable Items) 58.66% 52.10% 48.85% large Net interest margin (Ex Notable Items) 1.70% 1.88% 2.00% (18 bps) FTE 12,042 12,534 13,189 (4) $bn 2024 2023 2022 % Mov't 2024 - 2023 Customer deposits Transactions 46.6 49.5 61.3 (6) Savings 159.0 138.3 103.1 15 Term 65.6 63.9 62.1 3 Mortgage offsets 63.3 56.6 54.0 12 Total customer deposits 334.5 308.3 280.5 8 Loans Housing 473.5 449.6 431.8 5 RAMS (in runoff) 29.8 36.0 35.8 (17) Other 8.8 8.9 8.8 (1) Provisions (1.8) (1.8) (1.8) - Total loans 510.3 492.7 474.6 4 Deposit to loan ratio 65.54% 62.58% 59.11% 296 bps Total assets 521.8 504.2 486.0 3 TCE 594.2 577.7 562.3 3 Risk weighted assets 174.4 174.7 180.2 - Average interest earning assets 449.9 435.3 422.7 3 Average allocated capital 24.0 24.3 24.0 (1) Credit quality Impairment charges/(benefits) to average loans 0.05% 0.04% 0.04% 1 bps Mortgage 90+ day delinquencies 1.12% 0.86% 0.75% 26 bps Other consumer loans 90+ day delinquencies 1.23% 1.01% 1.35% 22 bps Total stressed exposures to TCE 1.10% 0.86% 0.67% 24 bps |
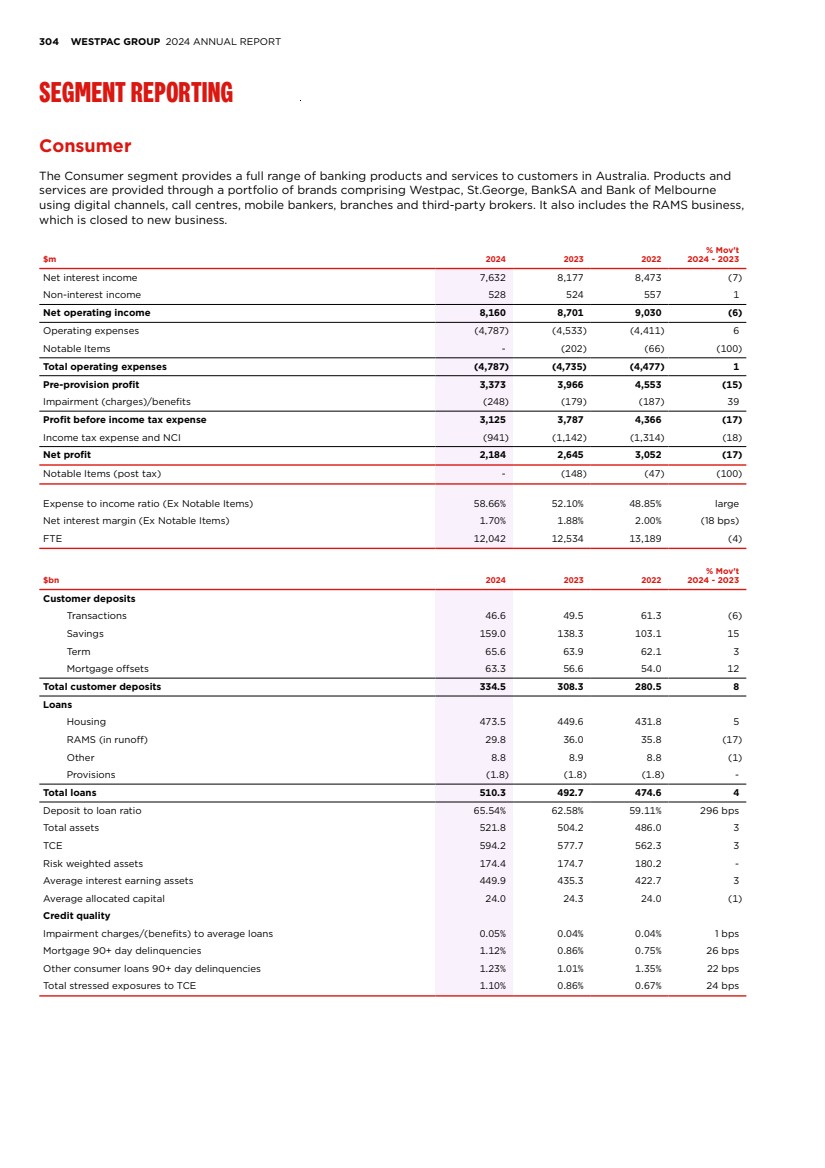
| FINANCIAL STATEMENTS EXHIBITS INDEX STRATEGIC REVIEW PERFORMANCE REVIEW SHAREHOLDER INFORMATION 305 Consumer (Continued) Net profit decreased 17% to $2,184 million. Pre-provision profit declined by 15% to $3,373 million. Excluding Notable Items in Full Year 2023 associated with restructuring charges and the branch transformation program, pre-provision profit declined by 19% with operating income falling 6% and operating expenses rising 6%. The decline in operating income reflected continued contraction of the net interest margin while expenses rose due to costs associated with the closure of the RAMS business, inflationary pressures, higher investment spend and amortisation. Net interest income down 7% • The net interest margin contracted by 18 basis points, slowing through the period, with margins increasing 1 basis point in Second Half 2024. Price competition for new mortgages and the impact of lower mortgage rates offered to retain customers looking to refinance were the largest contributors to the contraction. Narrower deposit spreads, largely the impact of a mix shift towards higher interest rate, lower margin savings accounts, were offset by higher returns on hedged deposits and capital; • Net loans increased by 4% to $510.3 billion. Mortgage growth of 4% was below system, reflecting the decision to close the RAMS business. Excluding this impact, mortgages grew 5%, mostly in owner occupied variable rate mortgages, representing 1.2x APRA housing system growth. Variable rate mortgages increased from 76% to 91% of the portfolio following most of the $65 billion of expiring fixed rate loans being retained and rolling onto on variable rates, coupled with almost all new loans on variable rates; • Deposits were up 8% to $334.5 billion representing 1.1x APRA household deposits system growth. Growth in savings balances of $20.7 billion more than offset the decline in transaction balances of $2.9 billion, as customer preference continued to shift towards higher yielding products. Mortgage offset balances increased by 12% to $63.3 billion as fixed rate mortgage customers shifted onto variable rate mortgages with deposit offset features; and • With deposit growth continuing to exceed loan growth, the deposit to loan ratio improved 296 basis points to 65.5% Non-interest income up 1% • Non-interest income increased 1% to $528 million due to higher credit card fees which was partly offset by higher customer remediation costs. Expenses up 1% • Operating expenses excluding Notable Items increased 6%. This was driven by: – The decision to close RAMS to new business resulted in impairment of the RAMS brand, technology and software assets and restructuring costs; – Inflationary pressures from both wages and salaries and third-party vendor costs; and – Higher amortisation costs. • Higher expenses were partly offset by benefits from a simpler operating model following the implementation of the One Bank Platform and a smaller property footprint, including our corporate office and branches which included the benefit of an additional 29 co-locations. Impairment charge of $248 million • Impairment charges to average loans were 5 basis points, up 1 basis point from the prior year. The charge reflects higher mortgage and other consumer loans delinquencies, which was partly offset by reductions in the mortgage overlay and the downside scenario weight; and • Stressed exposure to TCE deteriorated by 24 basis points to 1.10%. Mortgage 90+ day delinquencies increased 26 basis points to 1.12%, reflecting higher mortgage interest rates and the higher cost of living. Other consumer loan 90+ day delinquencies increased 22 basis points to 1.23%, due to cost of living pressures impacting customers. |
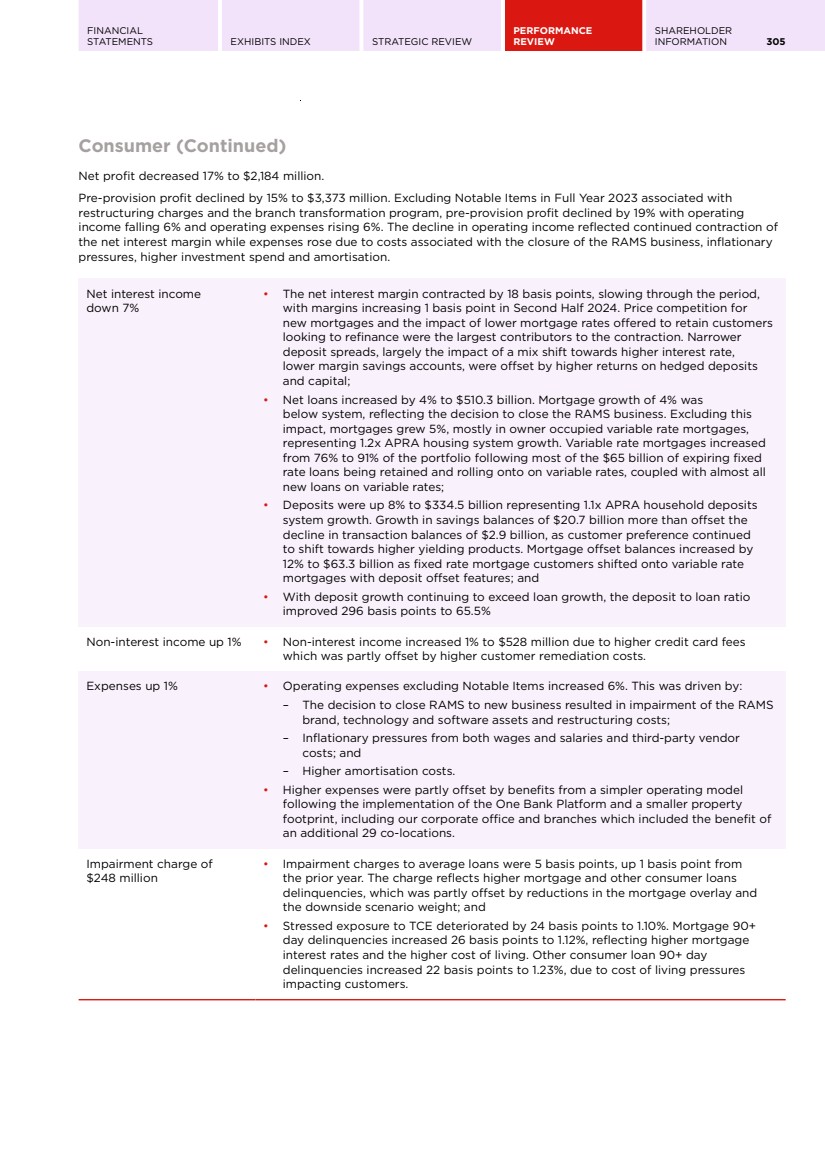
| 306 WESTPAC GROUP 2024 ANNUAL REPORT SEGMENT REPORTING Business & Wealth The Business & Wealth segment provides banking products and services to customers in Business Banking, Wealth Management, Private Wealth and Westpac Pacific. Business Banking offers lending generally up to $200 million in exposure, merchant services using eCommerce solutions and transaction banking services. Customers are categorised by commercial businesses, small to medium businesses and agribusiness. The segment includes Private Wealth, supporting the needs of high-net-worth individuals, as well as BT Financial Group, which provides wealth management platform services. It also includes Westpac Pacific and our auto finance portfolio, which has been in runoff. In October 2024, we entered into an agreement to sell the auto finance portfolio. Subject to regulatory approval, the sale is expected to be completed in the first half of 2025. The segment operates under the Westpac, St.George, BankSA, Bank of Melbourne and BT brands. $m 2024 2023 2022 % Mov't 2024 - 2023 Net interest income 5,338 4,992 3,508 7 Non-interest income 798 844 881 (5) Notable Items - (88) (1) (100) Net operating income 6,136 5,748 4,388 7 Operating expenses (2,626) (2,459) (2,446) 7 Notable Items - (64) (13) (100) Total operating expenses (2,626) (2,523) (2,459) 4 Pre-provision profit 3,510 3,225 1,929 9 Impairment (charges)/benefits (142) (257) (97) (45) Profit before income tax expense 3,368 2,968 1,832 13 Income tax expense and NCI (1,012) (882) (557) 15 Net profit 2,356 2,086 1,275 13 Notable Items (post tax) - (107) (9) (100) Expense to income ratio (Ex Notable Items) 42.80% 42.14% 55.73% 66 bps Net interest margin (Ex Notable Items) 5.35% 5.17% 3.70% 18 bps FTE 6,851 6,954 7,118 (1) $bn 2024 2023 2022 % Mov't 2024 - 2023 Customer deposits Transactions 65.2 64.8 76.1 1 Savings 29.1 31.3 35.1 (7) Term 50.0 44.4 30.9 13 Total customer deposits 144.3 140.5 142.1 3 Loans Commercial/SME 99.1 90.5 86.4 10 Pacific 1.3 1.2 1.1 8 Business lending 100.4 91.7 87.5 9 Other 1.4 1.5 1.8 (7) Auto finance (in runoff)a 2.1 4.2 7.3 (50) Provisions (1.9) (1.9) (1.8) - Total loans 102.0 95.5 94.8 7 Deposit to loan ratio 141.48% 147.08% 149.97% large Total assets 107.1 101.2 100.7 6 TCE 137.8 129.7 127.0 6 Risk weighted assets 92.9 87.1 95.8 7 Average interest earning assets 99.7 96.6 94.8 3 Average allocated capital 11.6 11.3 11.0 3 Credit quality Impairment charges/(benefits) to average loans 0.14% 0.27% 0.10% (13 bps) Impaired exposures to TCE 0.68% 0.52% 0.66% 16 bps Total stressed exposures to TCE 5.56% 5.46% 5.44% 10 bps a. Includes personal and business loans. |
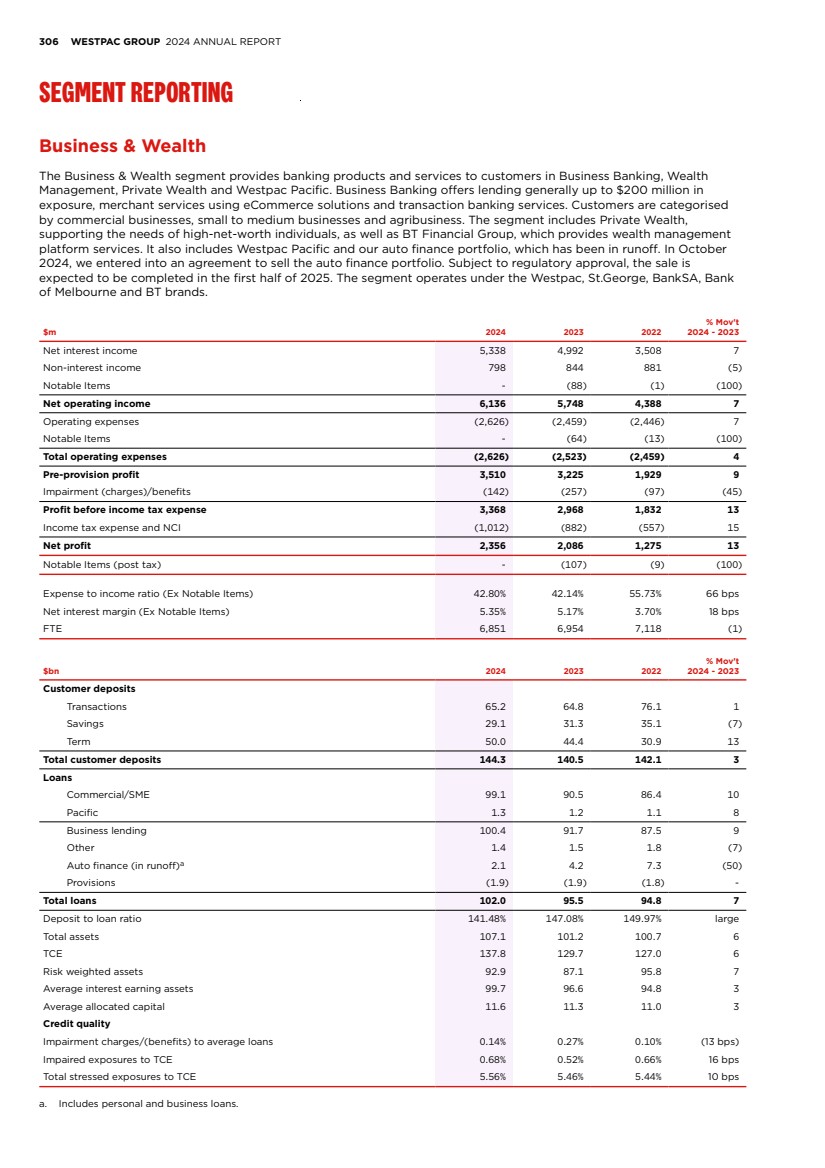
| FINANCIAL STATEMENTS EXHIBITS INDEX STRATEGIC REVIEW PERFORMANCE REVIEW SHAREHOLDER INFORMATION 307 Business & Wealth (Continued) Net profit increased 13% to $2,356 million. Pre-provision profit rose 9% to $3,510 million. Excluding Notable Items in Full Year 2023 associated with remediation provisions and restructuring charges, pre-provision profit increased by 4% with a 5% increase in operating income more than offsetting a 7% rise in operating expenses. A higher net interest margin and lending growth increased operating income while higher operating expenses reflected an increase in bankers and wages, higher technology costs, increased investment spend and an increase in litigation provisions. Net interest income up 9% • Excluding the impact of Notable Items in Full Year 2023, net interest income was up 7%; • The net interest margin was up 18 basis points excluding Notable Items. The averaging impact of previous interest rate rises generated wider deposit spreads and returns on both hedged deposits and capital. This more than offset the mix shift to higher interest rate, lower margin term deposits and the compression of lending spreads due to price competition in an increasingly contested sector and the runoff of the higher spread auto finance portfolio; • Net loans increased by 7% to $102.0 billion. Business lending growth of 9% was diversified with strong growth in our target industries of agriculture, health and professional services. This was partly offset by the continued run down of the auto finance portfolio to $2.1 billion; and • Deposits were up 3% to $144.3 billion. Growth in term deposits of $5.6 billion offset the decline in at call balances of $1.8 billion, as customer preference continued to shift towards higher yielding products. Within the business segment, growth in commercial customers was more than offset by reduction in small and medium business customers from softer economic and trading conditions. Non-interest income down 4% • Non-interest income excluding Notable Items decreased 5% due to lower merchants income, the wind down of the auto finance portfolio and lower platform revenue. Expenses up 4% • Operating expenses excluding Notable Items increased 7%. Excluding the increase in litigation provisions operating expenses increased 5% reflecting: – Inflationary pressures on wages and salaries and third-party technology vendor costs; – Higher investment spend from the initiation and integration of our new business origination platform BizEdge, HealthPoint, UNITE and upgrade of merchant terminals; and – Investment in business bankers to drive growth. Impairment charge of $142 million • The impairment charge of 14 basis points of average loans compared to 27 basis points in the prior year. The charge reflects new IAPs and a modest increase in CAP as a less favourable outlook for commercial property was largely offset by a reduction in the downside scenario weight in First Half 2024; and • Credit quality metrics deteriorated with stressed exposures to TCE up 10 basis points to 5.56%, mostly within the wholesale & retail trade sector. The proportion of impaired loans to TCE increased 16 basis points to 0.68%. Platforms and Investments $bn 2024 Inflows Outflows Net Flows Other Mov't 2023 % Mov't 2024 - 2023 Platforms 150.8 20.5 (23.6) (3.1) 18.2 135.7 11 Packaged funds - - (1.4) (1.4) (0.1) 1.5 (100) Total funds 150.8 20.5 (25.0) (4.5) 18.1 137.2 10 BT & Private Wealth platform funds under administration increased 11% to $150.8 billion during 2024 reflecting higher equity market valuations and dividend distributions. Net flows were negative reflecting pension outflows, excluding this impact net flows were positive $3.4 billion. BT packaged funds under administration decreased by $1.5 billion during 2024, reflecting the completion of the sale of the private portfolio management business. |
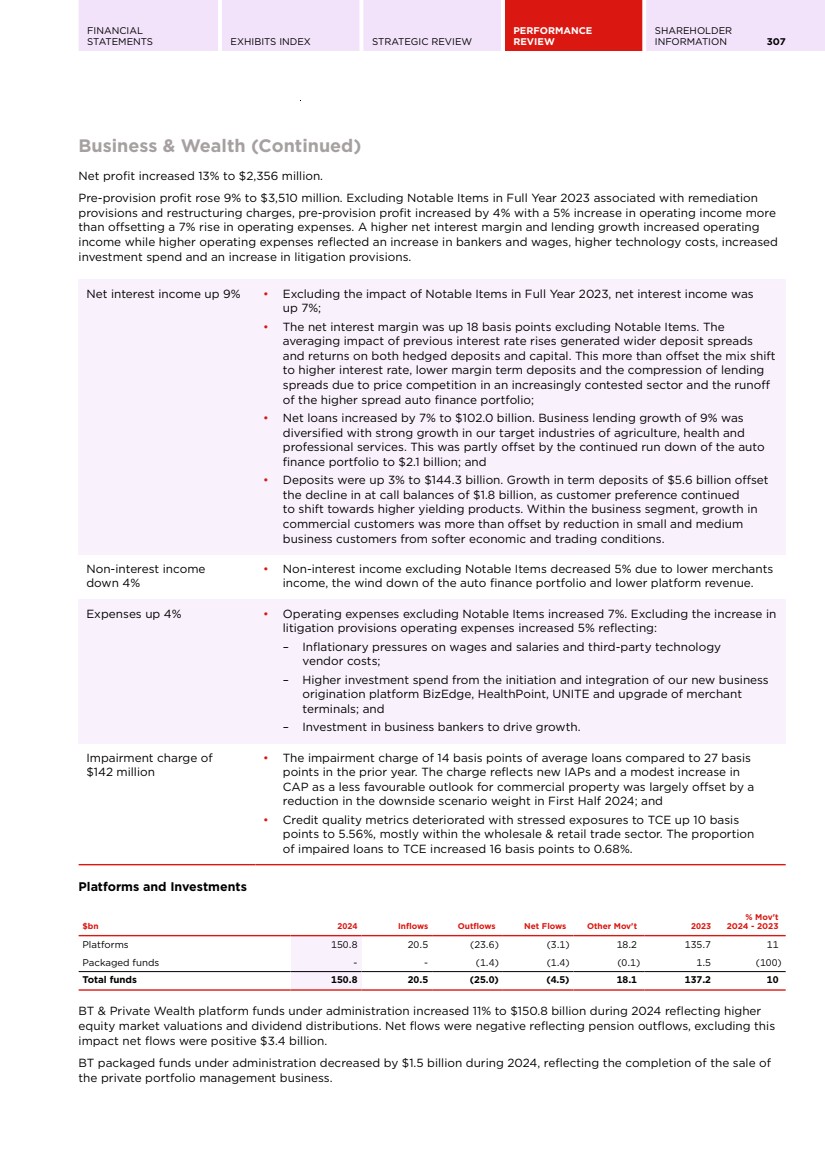
| 308 WESTPAC GROUP 2024 ANNUAL REPORT SEGMENT REPORTING Westpac Institutional Bank (WIB) Westpac Institutional Bank (WIB) services predominantly corporate, institutional and government clients through three areas of specialisation: Corporate & Institutional Banking (CIB); Global Transaction Services (GTS); and Financial Markets (FM). CIB uses dedicated industry relationship and specialist product teams to support clients’ borrowing needs. GTS is responsible for the provision of payments and liquidity management solutions to WIB’s clients and Westpac's domestic and international payments infrastructure. FM provides a range of risk management, investment and debt capital markets solutions to WIB clients and access to financial markets products for consumer and business customers. Clients are supported throughout Australia and via branches and subsidiaries located in New Zealand, New York, London, Frankfurt and Singapore. $m 2024 2023 2022 % Mov't 2024 - 2023 Net interest income 2,240 1,926 1,438 16 Non-interest income 1,265 1,367 1,150 (7) Net operating income 3,505 3,293 2,588 6 Operating expenses (1,465) (1,316) (1,265) 11 Notable Items - (15) - (100) Total operating expenses (1,465) (1,331) (1,265) 10 Pre-provision profit 2,040 1,962 1,323 4 Impairment (charges)/benefits (120) (87) (85) 38 Profit before income tax expense 1,920 1,875 1,238 2 Income tax expense and NCI (553) (538) (372) 3 Net profit 1,367 1,337 866 2 Notable Items (post tax) - (10) - (100) Expense to income ratio (Ex Notable Items) 41.80% 39.96% 48.88% 184 bps Net interest margin (Ex Notable Items) 1.83% 1.89% 1.63% (6 bps) FTE 2,870 2,776 2,689 3 $bn 2024 2023 2022 % Mov't 2024 - 2023 Customer deposits Transactions and others 64.2 64.2 66.1 - Savings 10.4 10.5 11.0 (1) Term 45.2 41.4 40.2 9 Total customer deposits 119.8 116.1 117.3 3 Loans Loans 101.0 92.9 85.5 9 Provisions (0.4) (0.3) (0.3) 33 Total loans 100.6 92.6 85.2 9 Deposit to loan ratio 119.10% 125.37% 137.65% large Total assets 137.2 106.3 106.2 29 TCE 216.2 207.4 199.3 4 Risk weighted assets 83.0 82.1 94.8 1 Average interest earning assets 122.2 101.7 88.2 20 Average allocated capital 9.6 9.2 7.8 4 Credit quality Impairment charges to average loans 0.13% 0.10% 0.11% 3 bps Impaired exposures to TCE 0.05% 0.04% 0.10% 1 bps Total stressed exposures to TCE 0.76% 0.58% 0.35% 18 bps |
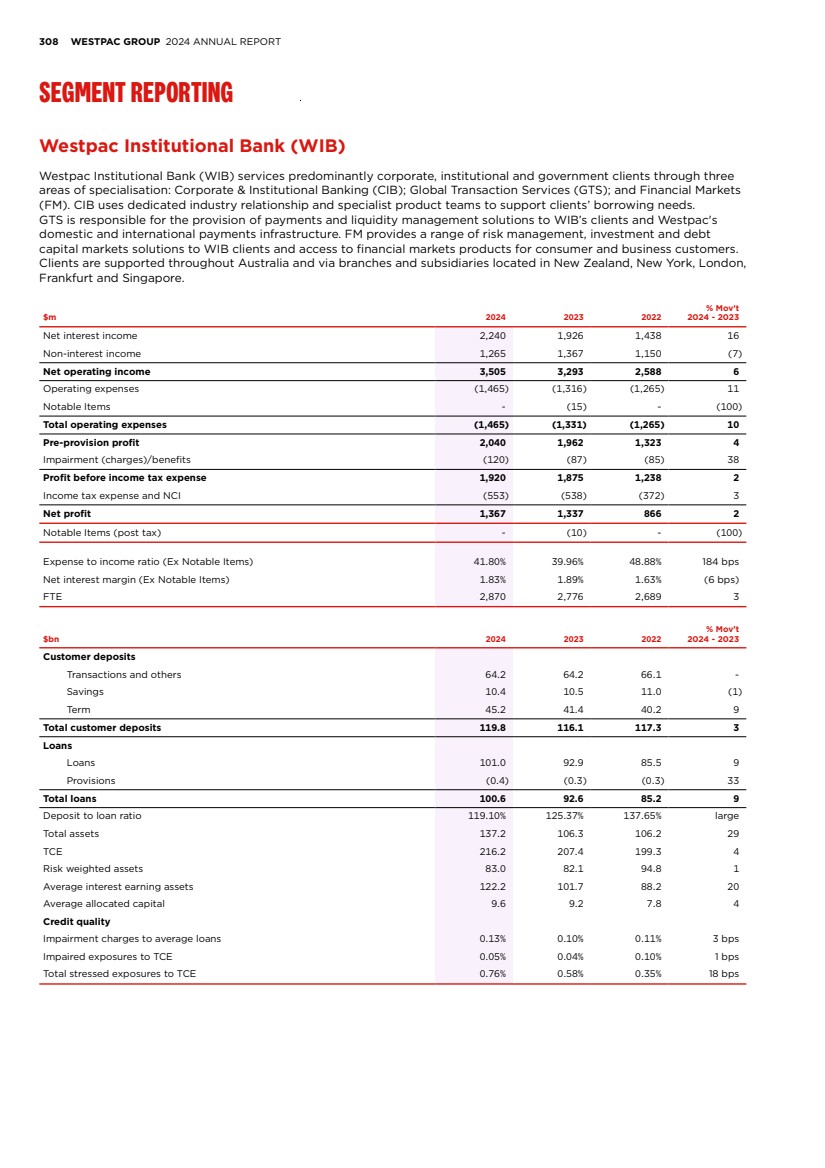
| FINANCIAL STATEMENTS EXHIBITS INDEX STRATEGIC REVIEW PERFORMANCE REVIEW SHAREHOLDER INFORMATION 309 Westpac Institutional Bank (WIB) (Continued) Net operating income contribution1 $m 2024 2023 2022 % Mov't 2024 - 2023 Lending and deposit revenue 2,561 2,339 1,994 9 Sales and risk management income 846 886 695 (5) DVA (8) 56 (31) large Othera 106 12 (70) large Net operating income contribution 3,505 3,293 2,588 6 a. Includes capital benefit and Bank Levy Net profit increased 2% to $1,367 million. Pre-provision profit increased 4% to $2,040 million. Excluding Notable Items in 2023, pre-provision profit increased 3% with operating income rising 6% and expenses increasing 11%. The growth in operating income reflects growth in lending and deposits, while the rise in operating expenses was driven by increased software amortisation and higher staffing and third party vendor costs to support growth. Net interest income up 16% • The net interest margin decreased 6 basis points reflecting an increase in trading securities related to reverse repurchase agreements in Markets. Excluding this, the net interest margin expanded 4 basis points reflecting improved loan spreads and the benefit of higher interest rates on hedged capital. These impacts were partly offset by a shift in deposits towards lower margin term deposits and higher funding costs; • Average interest earning assets rose by 20% reflecting the impact of strong lending growth of 9% and additional trading assets for Markets customers; • Net loans increased 9% to $100.6 billion from deepening relationships with existing customers, predominantly in the property, infrastructure and industrial sectors; and • Deposits increased 3% to $119.8 billion driven by term deposit growth in the second half achieved through increased customer activity. Non-interest income down 7% • Non-interest income declined 7% to $1,265 million. Key drivers included: – Lower sales and risk management income, including foreign exchange; – Higher fee income from increased underwriting activity and a larger loan book; and – A $66 million reduction from DVA, driven by the non-repeat of tightening counterparty credit spreads in the prior year. Expenses up 10% • Expenses excluding Notable Items were up 11% to $1,465 million. Movements reflected: – Higher software amortisation costs from major technology infrastructure investments including payments; – Higher wages and salaries costs including hiring of new front-line staff to support relationships and lending growth. Impairment charge of $120 million • The impairment charge to average loans was 13 basis points, compared to a 10 basis point charge in the prior year. The charge was driven by one new IAP and a small CAP charge due to an increase in stressed exposures and revised economic projections; and • Stressed exposures to TCE deteriorated 18 basis points to 0.76%, reflecting higher watchlist and substandard exposures in the wholesale & retail trade and property sectors. The proportion of impaired exposures to TCE deteriorated modestly to 0.05%. 1. DVA includes Funding Value Adjustment (FVA) and Credit Value Adjustment (CVA). Sales and risk management income includes both customer and non-customer income. |
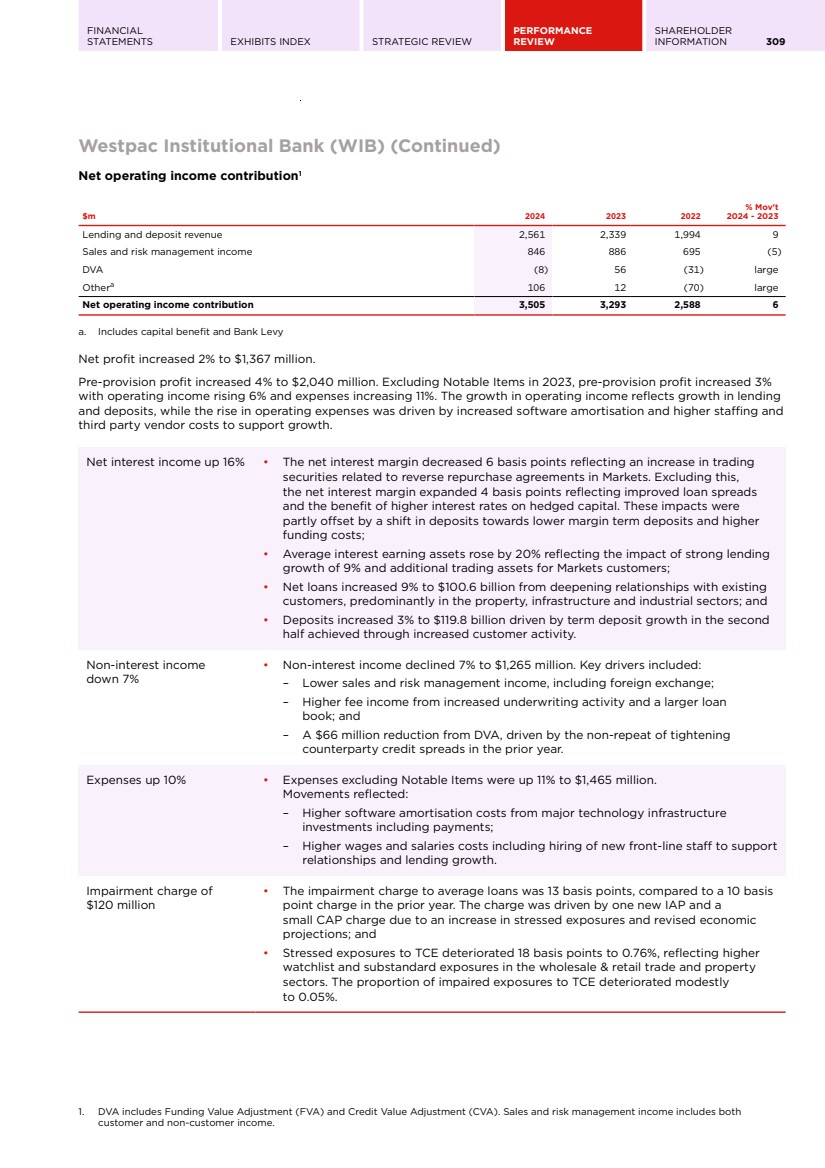
| 310 WESTPAC GROUP 2024 ANNUAL REPORT SEGMENT REPORTING Westpac New Zealand Westpac New Zealand provides banking and wealth products and services for consumer, business and institutional customers in New Zealand. All figures are in NZ$ unless noted otherwise. NZ$m 2024 2023 2022 % Mov't 2024 - 2023 Net interest income 2,590 2,514 2,280 3 Non-interest income 279 261 306 7 Notable Items (9) - 127 - Net operating income 2,860 2,775 2,713 3 Operating expenses (1,369) (1,286) (1,158) 6 Notable Items - (10) - (100) Total operating expenses (1,369) (1,296) (1,158) 6 Pre-provision profit 1,491 1,479 1,555 1 Impairment (charges)/benefits (27) (135) 27 (80) Profit before income tax expense 1,464 1,344 1,582 9 Income tax expense and NCI (409) (381) (414) 7 Net profit 1,055 963 1,168 10 Notable Items (post tax) (6) (7) 127 (14) Profit/(loss) attributable to businesses sold - - 19 - Expense to income ratio (Ex Notable Items) 47.72% 46.34% 44.78% 138 bps Net interest margin (Ex Notable Items) 2.17% 2.13% 2.02% 4 bps FTE 5,221 5,288 5,070 (1) NZ$bn 2024 2023 2022 % Mov't 2024 - 2023 Customer deposits Transactions and others 20.8 21.1 24.2 (1) Savings 19.4 20.2 21.4 (4) Term 39.5 38.5 32.3 3 Total customer deposits 79.7 79.8 77.9 - Loans Mortgages 68.0 65.8 63.8 3 Business 33.4 32.8 32.2 2 Other 1.2 1.2 1.2 - Provisions (0.5) (0.5) (0.4) - Total loans 102.1 99.3 96.8 3 Deposit to loan ratio 78.06% 80.36% 80.48% (230 bps) Total assets 123.5 121.8 119.2 1 TCE 147.3 147.1 144.6 - Risk weighted assets 62.0 60.3 53.6 3 Liquid assets 17.8 19.2 18.4 (7) Average interest earning assets 119.2 118.0 113.0 1 Average allocated capital 8.2 7.9 7.2 4 Total funds 13.2 11.4 10.9 16 Credit quality Impairment charges/(benefits) to average loans 0.03% 0.14% (0.03%) (11 bps) Mortgage 90+ day delinquencies 0.49% 0.33% 0.22% 16 bps Other consumer loans 90+ day delinquencies 0.87% 0.92% 1.03% (5 bps) Impaired exposures to TCE 0.16% 0.06% 0.06% 10 bps Total stressed exposures to TCE 1.73% 1.49% 0.97% 24 bps |
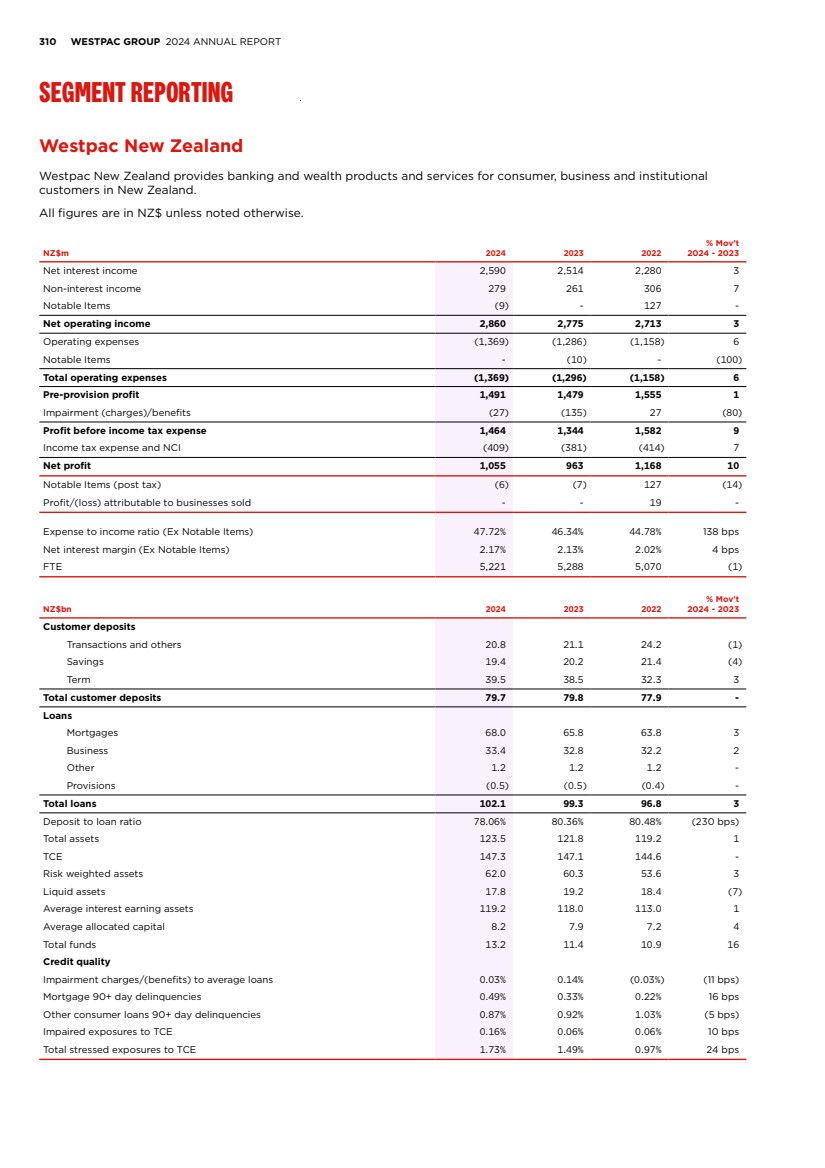
| FINANCIAL STATEMENTS EXHIBITS INDEX STRATEGIC REVIEW PERFORMANCE REVIEW SHAREHOLDER INFORMATION 311 Westpac New Zealand (Continued) Net profit increased 10% to $1,055 million. Pre-provision profit increased 1% to $1,491 million, reflecting a 3% increase in operating income which more than offset a 6% increase in operating expenses. Operating income reflected growth in lending and a higher net interest margin, while operating expenses were driven by increased technology and onshoring costs, software amortisation and inflationary pressures. Net interest income up 3% • The net interest margin was up 4 basis points. Higher returns on both transaction deposits and capital balances were partly offset by the shift in customer preference to higher interest earning term deposit accounts and narrower lending spreads driven by price competition. • Net loans increased 3%, reflecting slowing system lending growth as the challenging macroeconomic environment reduced demand for credit. Key drivers included: – Mortgage growth of 3% represents 0.9x RBNZ housing system growth. Expectations for the RBNZ to continue to cut interest rates drove a shift in customers preference to shorter fixed rate tenors and variable rate loans; and – Business lending increased 2% driven by higher corporate and institutional lending, up 1.7x system. • Deposits decreased slightly to $79.7 billion reflecting a decrease in transaction and savings accounts as customers preference increased towards higher yielding term deposits. Term deposits grew $1.0 billion with an increase in household term deposit accounts partly offset by a reduction in institutional term products. Non-interest income up 7% • Non-interest income increased 7% to $279 million reflecting higher investment income and business fees from increased activity. Expenses up 6% • Operating expenses excluding Notable Items increased 6%, reflecting: – Higher wages and salaries and third-party vendor costs; and – Increase in technology investment and amortisation costs and ongoing operational support costs following the completion of activities to comply with the RBNZ's outsourcing policy. Impairment charge of $27 million • The impairment charge to average loans was 3 basis points, compared to a charge of 14 basis points in the prior year. The lower charge is due to decreases in CAP which was offset by increases in IAP within the business portfolio. • Stressed exposures to TCE increased 24 basis points to 1.73% mostly due to deterioration in mortgage 90+ day delinquencies and higher impaired balances as consumers and businesses feel the stress of higher interest rates and the challenging economic environment. |
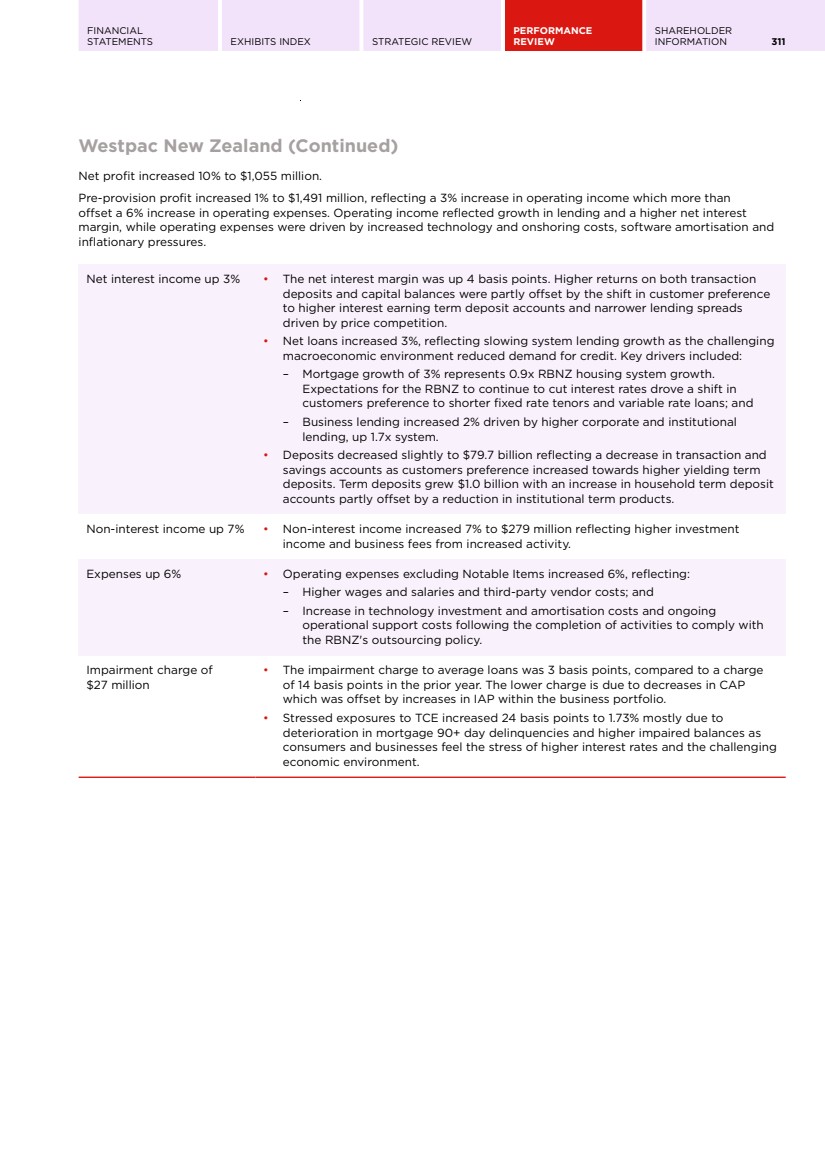
| 312 WESTPAC GROUP 2024 ANNUAL REPORT SEGMENT REPORTING Westpac New Zealand (Continued) Westpac New Zealand segment performance (A$ Equivalent) Results have been translated into Australian dollars (A$) at the average exchange rates for each reporting period, 2024: $1.0846 (2023: $1.0846 ; 2022: $1.0831). Unless otherwise stated, assets and liabilities have been translated at spot rates as at the end of the period, 2024: $1.0885 (2023: $1.0738 ; 2022: $1.1355). $m 2024 2023 2022 % Mov't 2024 - 2023 Net interest income 2,388 2,317 2,107 3 Non-interest income 257 240 279 7 Notable Items (8) - 120 - Net operating income 2,637 2,557 2,506 3 Operating expenses (1,262) (1,186) (1,072) 6 Notable Items - (9) - (100) Total operating expenses (1,262) (1,195) (1,072) 6 Pre-provision profit 1,375 1,362 1,434 1 Impairment (charges)/benefits (25) (124) 25 (80) Profit before income tax expense 1,350 1,238 1,459 9 Income tax expense and NCI (377) (350) (382) 8 Net profit 973 888 1,077 10 Notable Items (post tax) (6) (7) 119 (14) Profit/(loss) attributable to businesses sold - - 18 - Expense to income ratio (Ex Notable Items)a 47.72% 46.34% 44.78% 138 bps Net interest margin (Ex Notable Items)a 2.17% 2.13% 2.02% 4 bps a. Ratios calculated using NZ$. $bn 2024 2023 2022 % Mov't 2024 - 2023 Customer deposits 73.2 74.3 68.6 (1) Loans 93.8 92.5 85.3 1 Deposit to loan ratioa 78.06% 80.36% 80.48% (230 bps) Total assets 113.5 113.5 105.0 - TCE 135.3 136.9 127.3 (1) Risk weighted assets 56.9 56.2 47.2 1 Liquid assets 16.3 17.9 16.2 (9) Average interest earning assetsb 110.0 108.8 104.4 1 Average allocated capitalb 7.5 7.3 6.6 3 Total funds 12.1 10.6 9.6 14 a. Ratios calculated using NZ$. b. Averages are converted at applicable average rates. |
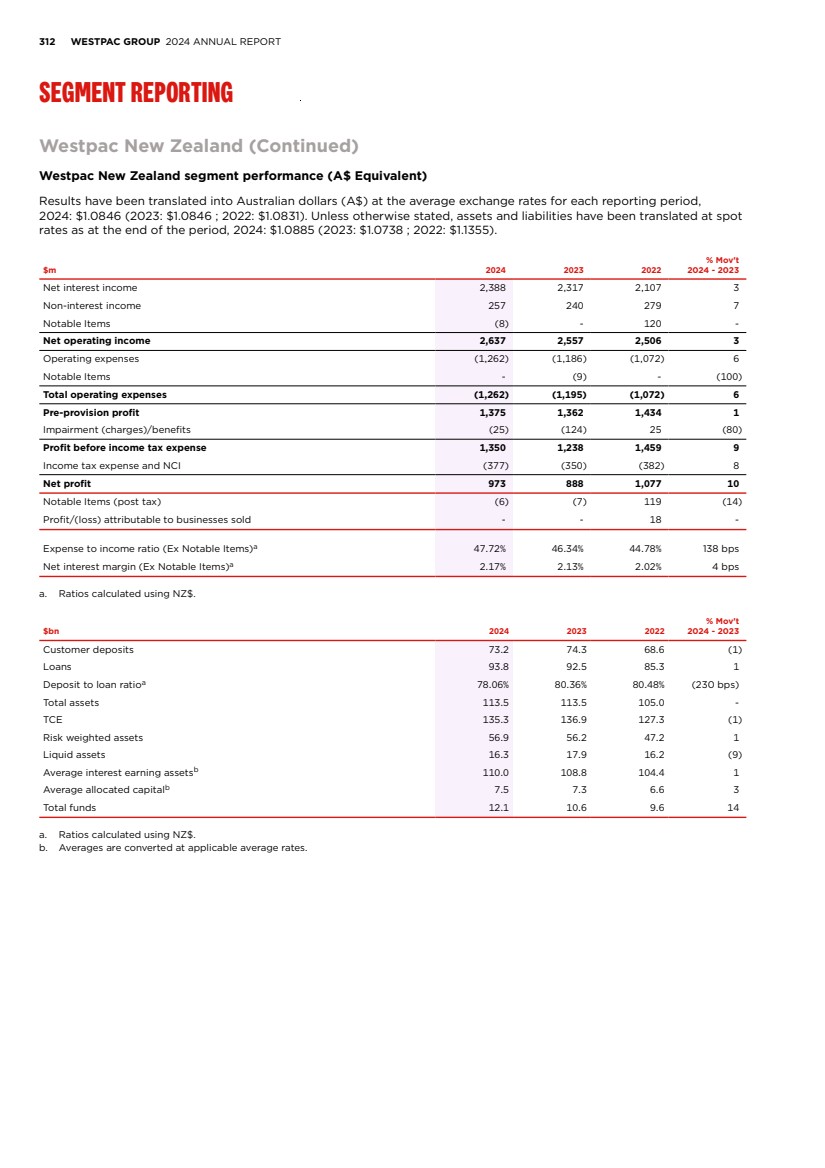
| FINANCIAL STATEMENTS EXHIBITS INDEX STRATEGIC REVIEW PERFORMANCE REVIEW SHAREHOLDER INFORMATION 313 Group Businesses The segment comprises: • Treasury, which is responsible for the management of Westpac’s balance sheet including wholesale funding, capital, and liquidity. Treasury also manages interest rate risk and foreign exchange risks associated with wholesale funding; • Enterprise services, which include earnings on capital not allocated to segments, certain intra-group transactions and gains/losses from asset sales, earnings and costs associated with Westpac’s fintech investments; and • Other costs which include expenses not directly attributable to segments including Corporate Affairs, a portion of enterprise technology costs related to UNITE, certain customer remediation expenses and enterprise provisions. $m 2024 2023 2022 % Mov't 2024 - 2023 Net interest income 1,318 1,002 1,080 32 Non-interest income (1) 153 432 large Notable Items (167) 191 (418) large Net operating income 1,150 1,346 1,094 (15) Operating expenses (804) (738) (987) 9 Notable Items - (170) (542) (100) Total operating expenses (804) (908) (1,529) (11) Pre-provision profit 346 438 (435) (21) Impairment (charges)/benefits (2) (1) 9 100 Profit before income tax expense 344 437 (426) (21) Income tax expense and NCI (234) (198) (150) 18 Net profit/(loss) 110 239 (576) (54) Notable Items (post tax) (117) 99 (937) large Profit/(loss) attributable to business sold - 131 168 (100) Treasury $m 2024 2023 2022 % Mov't 2024 - 2023 Net interest income 1,054 665 979 58 Non-interest income 20 14 21 43 Notable Items (158) (20) 553 large Net operating income 916 659 1,553 39 Net profit 484 319 960 52 Net profit of $110 million compared to a net profit of $239 million in the prior year. Pre-provision profit of $346 million was lower than the profit of $438 million in the prior year. Excluding Notable Items, pre-provision profit was $513 million compared with a $417 million profit in the prior year. Net operating income down 15% • Excluding Notable Items, income was up 14% to $1,317 million. Movements included: – Higher Treasury contribution from favourable positioning for interest rate volatility; – Lower income due to businesses that were exited in the prior year; and – Lower realised gains on sale of liquid assets. Expenses down 11% • Excluding Notable Items, expenses were up 9% to $804 million primarily driven by higher technology investment spend relating to the technology simplification program, UNITE. |

| 314 WESTPAC GROUP 2024 ANNUAL REPORT REVIEW OF EARNINGS: 2023 VS 2022 Group performance Performance overview Net profit for 2023 was $7,195 million, an increase of $1,501 million or 26% compared to 2022. The increase in net profit was predominantly due to an increase in operating income and reduction in operating expenses, partly offset by higher credit impairment charges. The following is a summary of the movements in major line items in net profit. Group NIM increased by 1 basis points to 1.95%. Key movements included: • Core NIM: 10 basis point increase. Wider deposit spreads in the first half of the year and higher returns on both hedged deposits and capital as a result of rising interest rates more than offset tighter lending spreads and competition increased; and • Notable Items: 7 basis point decline reflecting unrealised fair value losses related to economic hedges of our term funding. Net interest income increased $1,156 million or 7% over 2023 with a higher net interest margin and balance sheet growth offsetting a decline in Treasury and Markets income. Average interest earning assets increased 6% with growth in owner-occupied mortgages, institutional lending and commercial property. Customer deposits increased 5% over the year, fully funding loan growth and maintaining the customer deposit to loan ratio to 82.9%. Non-interest income increased by 36% to $3,328 million. Notable Items and the impact of businesses sold increased non-interest income by $340 million or 10% in 2023 reflecting the gain on the sale of Advance Asset Management Limited of $243 million. Excluding Notable Items and businesses sold, non-interest income increased 3% to $2,988 million driven by higher trading income from higher credit spreads and foreign exchange sales. Operating expenses were $110 million or 1% lower compared to 2022. The decrease was mainly due to: • Lower occupancy costs associated with a reduction in corporate and branch footprint including the closure of 88 branches and establishment of 55 co-locations; and • Reduced use of third-party and consulting services. The reduction in operating expenses was partly offset by: • Inflationary pressures across salaries and wages and software maintenance and license costs; and • Higher software amortisation of approximately $80 million related to growth, productivity and regulatory and risk investments. Credit impairment charges were $648 million in 2023, compared to a credit impairment charge of $335 million in 2022. The charge in 2023 represented 9 basis points of average gross loans and is still below long-term historical averages. The charge in 2023 reflected the impact of: • Higher inflation, interest rates rising and expectation of slowing economic activity; and • Deterioration in credit quality metrics through the year including increased stressed exposures in mortgages and institutional lending. The effective tax rate of 30.1% in 2023 was slightly above the Australian corporate tax rate of 30% due to some non-deductible expenses and hybrid capital distributions. The effective tax rate was higher in 2022 due to some non-deductible expenses including the loss on sale of our Australian life insurance business. In 2023, the Board determined a final dividend of 72 cents per ordinary share. The FY23 ordinary dividends of $1.42 were higher than the ordinary dividends declared in 2022 and represented a payout ratio of 69.20%. The 2023 final ordinary dividend was fully franked. Consumer Net profit of $2,645 million was $407 million or 13% lower in 2023. Excluding Notable Items associated with restructuring charges and the branch transformation program, net profit decreased $306 million or 10%. The following is a summary of the movements in major line items in net profit: • Net-interest income declined 3% reflecting a 12 basis point reduction in the net interest margin which more than offset volume growth; • Non-interest income declined 6% reflecting the non-recurrence of a payment received from the distribution agreement for general insurance in the prior year as well as lower cards and share trading income; • Operating expenses rose 3% driven by higher wage and vendor services inflation and increased amortisation costs; and |
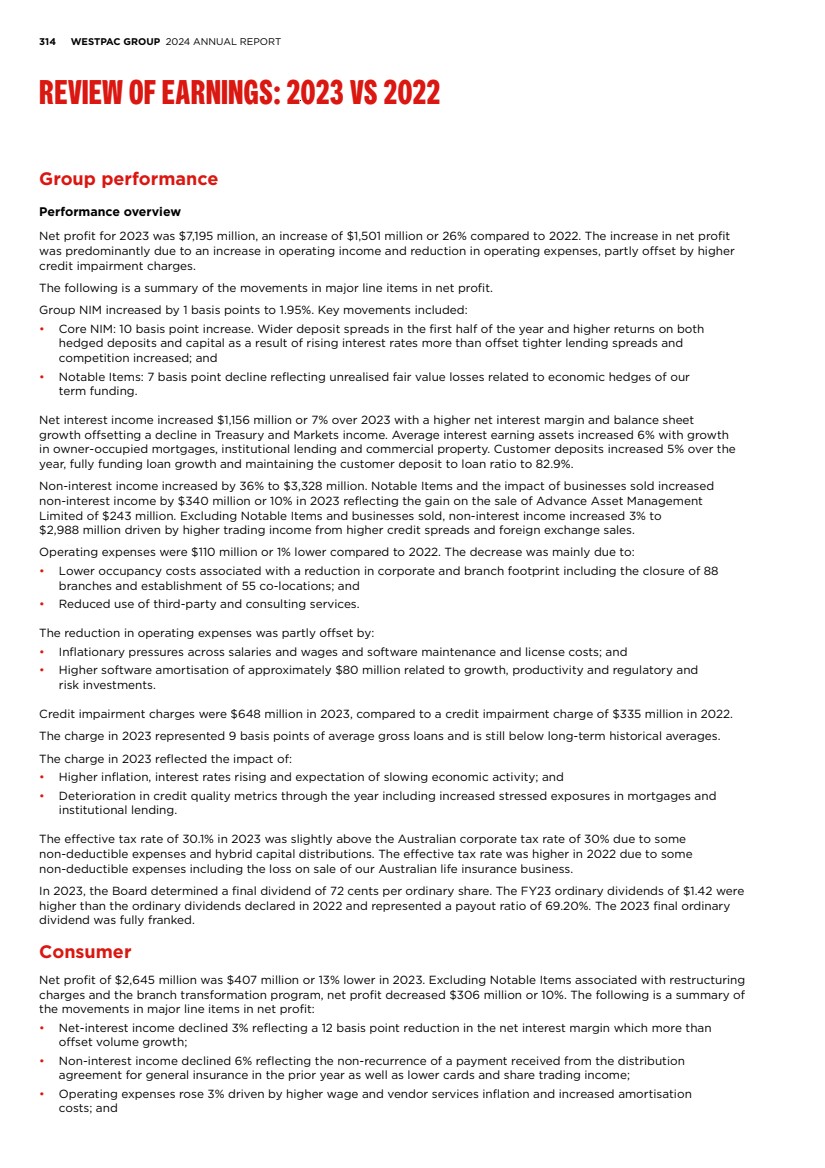
| FINANCIAL STATEMENTS EXHIBITS INDEX STRATEGIC REVIEW PERFORMANCE REVIEW SHAREHOLDER INFORMATION 315 • Impairments charge of $179 million was slightly lower than previous year driven by a CAP benefit that was driven by a reduction in overlays which more than offset the deteriorating credit risk metrics in the mortgage portfolio. Business and Wealth Net profit of $2,086 million was $811 million, or 64% higher than 2022. Excluding notable items associated with remediation charges, net profit increased $909 million. The following is a summary of the movements in major line items in net profit: • Net-interest income increased 42% reflecting 147 basis point increase to net interest margin as rising interest rates supported higher deposit spreads and returns on both hedged deposits and capital; • Non-interest income declined 4% due to lower merchant fees and auto finance fees; • Operating expenses increased 1% due to unfavourable FX translation impact and increased inflation; and • Impairment charge of $257 million reflected a deteriorating economic environment and worsening credit quality metrics with stressed exposures rising to 5.46% of total committed exposures. Auto finance continued to run-down with $4.2 billion remaining at 30 September 2023. Platforms funds under advisement increased by 7% reflecting higher equity markets and dividend distributions. Westpac Institutional Bank Net profit of $1,337 million was $471 million higher than 2022. Excluding Notable Items associated with restructuring charges, net profit rose $481 million. The following is a summary of the movements in major line items in net profit: • Net-interest income increased by 34% driven by growth in loans of 9% and 26 basis point increase to net interest margin which benefited from higher interest rates supported loan and deposit spreads and returns on capital; • Non-interest income increased 19% driven by positive impact from derivative valuation adjustments and higher credit and foreign exchange sale volumes; • Operating expenses increased by 4% reflecting inflationary pressures on salaries and wages and third party vendor costs which more than offset cost reset outcomes; and • Impairment charge of $87 million was slightly higher than previous year driven by higher CAP charge reflecting an increase in customers entering watchlist. Westpac New Zealand Net profit of NZ$963 million was NZ$205 million, or 18% lower than 2022, primarily driven by higher expenses on regulatory, risk and compliance spending and higher loan impairment charges due to emerging stress in the portfolio and deteriorating economic outlook. This was partly offset by higher net-interest income benefiting from rising rates. Group Businesses Net profit of $239 million was $815 million higher than 2022. The following is a summary of the movements in major line items in net profit: • Lower net-interest income reflecting decline in treasury earnings due to market volatility and lower realised gains on sales of liquid assets; and • Lower operating expenses due to favourable employee provision movements, lower consulting and third-party costs and reduced costs for the Banking as a Service (BaaS) platform. For further discussion and analysis of the financial year ended 30 September 2023 compared to 2022, please refer to “Group Performance” and “Segment Reporting” on pages 259-301 in our Annual Report on Form 20-F for the fiscal year ended 30 September 2023, which was filed with the US Securities and Exchange Commission on 7 November 2023 and which sections are incorporated herein by reference. |
| 316 WESTPAC GROUP 2024 ANNUAL REPORT REVIEW OF EARNINGS: 2023 VS 2022 Impact of Notable Items Details of Notable Items (post tax) impacting on 2022 results are presented below: Category Net profit impact Detail 2022 The impact of asset sales and revaluations $876 million reduction • Loss on sale of Australian life insurance of $1,112 million in non-interest income, $1,120 million after tax; • Expenses and revaluations associated with asset sales, including of Advance Asset Management and successor funds transfer of BT’s personal and corporate superannuation funds of $125 million, $101 million after tax; and • Other costs associated with the divestments of the Group’s businesses; partly offset by: • Gain on the sale of NZ life insurance; and • Gain on sale of the Group’s motor vehicle dealer finance and novated leasing business. This also includes a tax refund related to transaction and separation costs relating to the Group’s motor vehicle dealer finance, novated leasing business and vendor finance businesses. The write-down of assets $283 million reduction • Write-down of assets related to our superannuation business in preparation for its exit. This included all goodwill attributable to the business along with some capitalised software of $167 million in costs, $154 million after tax; • Write-down of assets from a reduction in corporate office space required. Reduced space requirements are from business sales, reduced headcount, and more flexible working. The write-down considers the capitalised value of the remaining term of the lease less likely sublease income, $118 million in costs, $82 million after tax; and • Expenses associated with the accelerated consolidation of branches that has progressed more rapidly than recent years of $66 million in costs, $47 million after tax. Provision for remediation, litigation, fines and penalties $133 million reduction • Additional provisions for estimated customer refunds: – remediation for premium increases on certain life insurance products issued by Australian life insurance; and – additional wealth related remediation; partly offset by release of provisions for customer remediation in Westpac New Zealand. • Additional costs for our customer remediation program; and • Increase in litigation provisions. Hedging items $418 million addition The unrealised fair value gains and loss on economic hedges of accrual accounted term funding transactions for the period and the net ineffectiveness on qualifying hedges. There is no impact to Westpac’s profit over time as the hedges reverse. Total Notable Items $874 million reduction |
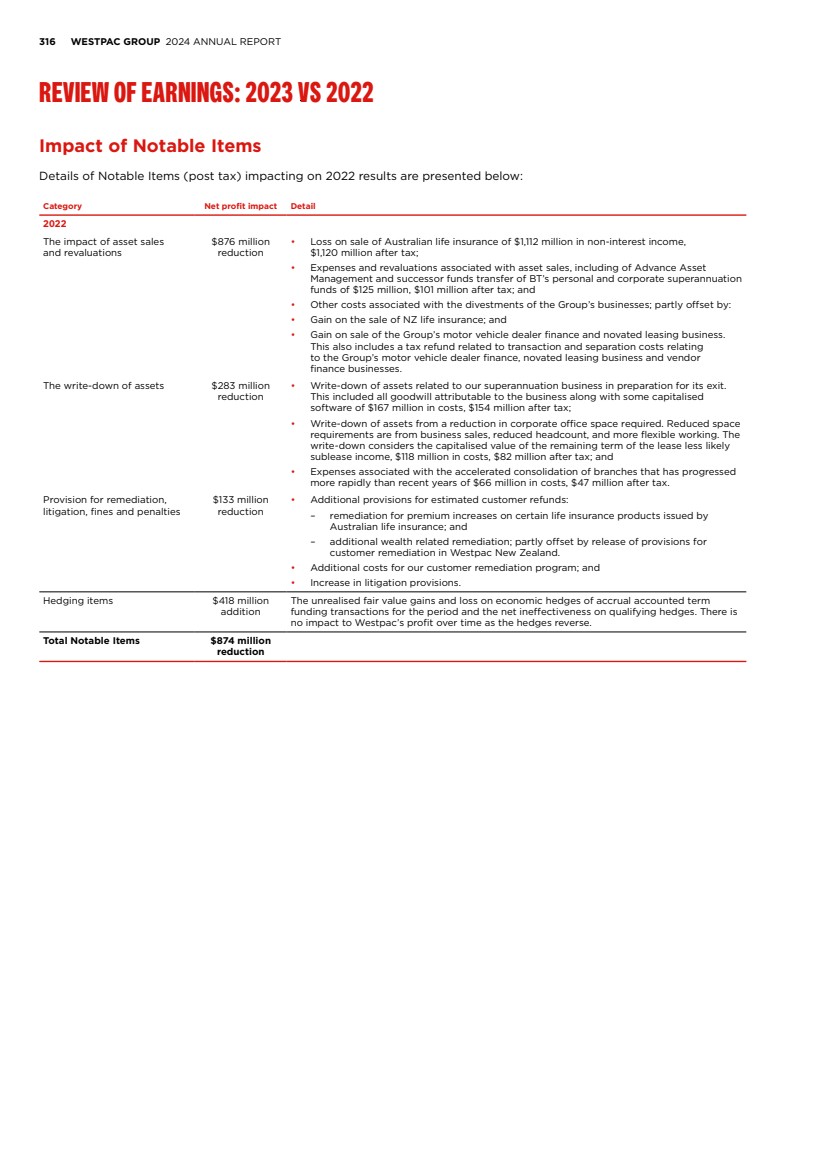
| FINANCIAL STATEMENTS EXHIBITS INDEX STRATEGIC REVIEW PERFORMANCE REVIEW SHAREHOLDER INFORMATION 317 RISK FACTORS Risk factors Our business is subject to risks that can adversely impact our financial performance, financial condition and future performance. Our 2024 Annual Report sets out the 11 major risk categories that impact our business, our approach to managing risks, as well as key focus areas. The 2024 Risk Factors provides our investors (and potential investors) with further information in relation to the current and future risks we face, as well as potential consequences if those risks materialise. The content of the 2024 Risk Factors is current as of the date of publication, and it is important to note that subsequent developments may impact its relevance. Risks and risk management strategies are inherently dynamic, evolving alongside changes in the external environment, market conditions and organisational priorities. The risks and uncertainties described below can emerge together or quickly in succession in a fashion that is uncorrelated with the order in which they are presented below, and they are not the only ones we face. Additional risks and uncertainties that we are unaware of, or that we currently deem to be immaterial, may also become important factors that affect us. If any of the following risks materialise, our business, prospects, reputation, financial performance or financial condition could be materially adversely affected, which may subsequently cause the price of our securities or the level of dividends to decline and, as a security holder, you could lose all, or part, of your investment. You should carefully consider the risks described (individually and in combination) and the other information in the 2024 Risk Factors and in our 2024 Annual Report and subsequent disclosures before investing in, or continuing to own, our securities. Risks relating to our business We have experienced, and could in the future experience, information security risks, including cyberattacks - Cyber risk - Cyber attacks - Operational risk - Information security risks - Data breaches - Third party risk Our operations depend on the secure processing, storage and transmission of information on our systems and those of external suppliers. Despite our measures to protect the confidentiality, availability and integrity of our information, our information assets may face security breaches, unauthorised access, malware, social engineering, denial of service attacks, ransomware, destructive attacks, employee misconduct, human error or other external and internal threats. These could adversely impact our and others’ confidential information and system availability. Information security risks are heightened by factors such as new technologies, increased digitisation, larger volumes of sensitive data, sophisticated cyber crime, supply chain disruptions, remote and hybrid working, targeting of critical infrastructure providers, geopolitical tensions, terrorism, state sponsored attacks, and the use of AI in cyberattacks (which can increase the speed, complexity and effectiveness of cyberattacks), each of which could compromise our information assets and interrupt our usual operations and those of our customers, suppliers and counterparties. Adverse events like data breaches, cyberattacks, espionage and errors (including human-related), are increasing in frequency and impact. These can cause a range of impacts including financial instability, reputational damage, disruption to services, contagion risk, in addition to economic and non-economic losses to us, our customers, shareholders, suppliers, counterparties and others. Our systems and processes designed to protect against and respond to these threats have not always been, and may not always be, effective and human error can occur. Westpac, its customers and other stakeholders could suffer losses from cyberattacks, information security breaches or ineffective cyber resilience. Consequences could be severe if customer data is being held in breach of legal or regulatory obligations and that data is compromised as part of an information security incident. We may not always be able to anticipate and prevent or effectively respond to such incidents , or effectively respond to and/or rectify the resulting damage. Our suppliers, counterparties, and other parties involved in or who facilitate our activities, financial platforms and infrastructure as well as our customers’ suppliers and counterparties are also at risk, which could impact us. As cyberattacks increase globally, there is a higher likelihood of regulatory enforcement and legal action for information security failures from customers or shareholders. This could include class action litigation for issues such as information security risk management failures, misleading statements about our information security practices or for deficiencies in our response to cyberattacks and information security threats (including any delayed, deficient or misleading notifications). Consequences of successful attacks could include damage to technology infrastructure, government intervention, service disruptions, loss of customers and market share, data loss, cyber extortion, customer remediation and/or compensation, breaches of the law, vulnerability to fraud or scams, litigation, fines, and increased regulatory scrutiny or other enforcement action. |
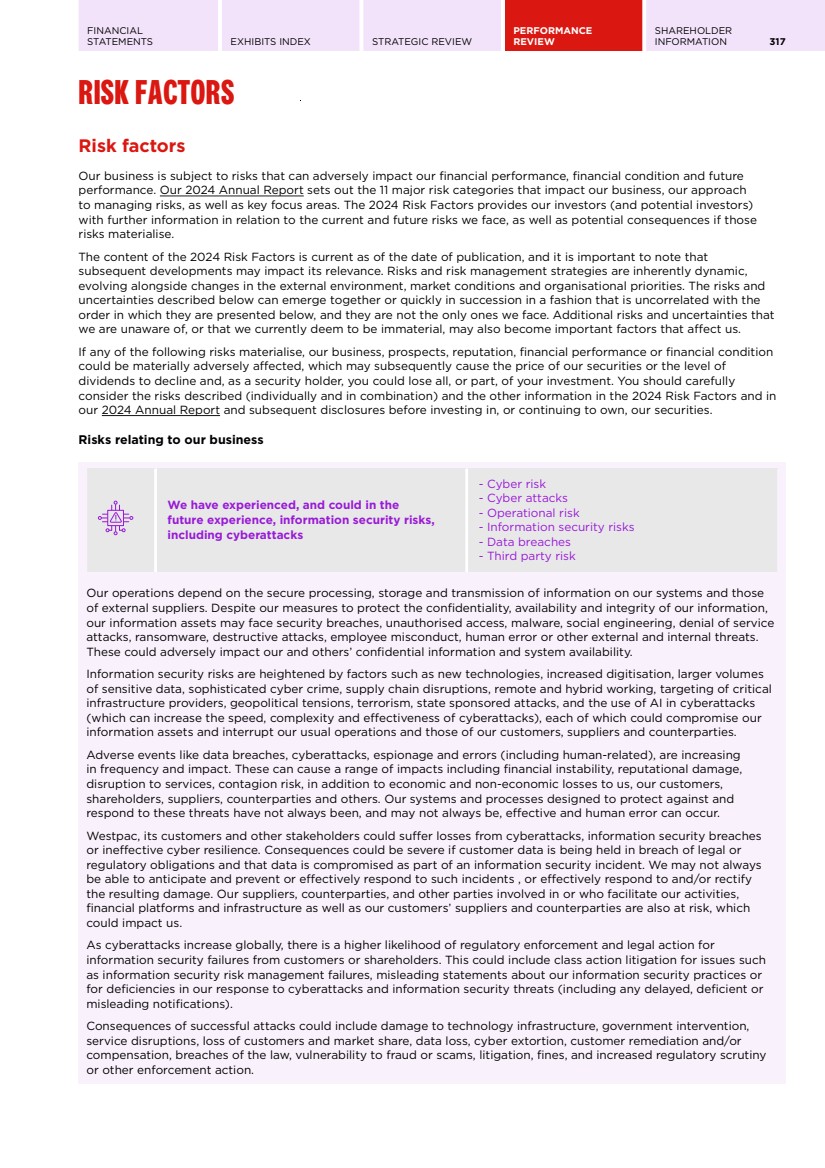
| 318 WESTPAC GROUP 2024 ANNUAL REPORT RISK FACTORS Risk factors (Continued) These potential consequences could negatively affect our business, prospects, reputation, financial performance or financial condition. As cyber threats evolve, we may need to allocate significant resources and incur additional costs to enhance our systems, address vulnerabilities or incidents and respond to regulatory changes. We could be adversely affected by legal or regulatory change - Compliance and conduct risk - Regulators' expectations - Legal and regulatory change - Fines, penalties, other costs and capital overlays We operate in a highly regulated industry with an environment of sustained legal and regulatory change and ongoing scrutiny of financial services providers. Our business, prospects, reputation, financial performance and financial condition have been, and could in the future be, adversely affected by domestic and international changes to law, regulation, policies, supervisory activities, regulator expectations, and the requirements of industry codes of practice, such as the Banking Code of Practice. Such changes may affect how we operate and have altered, and may in the future alter, the way we provide our products and services, in some cases requiring us to change or discontinue our offerings. This includes possible future changes in laws, regulations, policy or regulatory expectations arising from industry-wide reviews and inquiries. The effects of such changes and reviews in the past have included, and could continue to include, limiting our flexibility, requiring us to incur substantial costs (such as costs of systems changes, the levies associated with the Compensation Scheme of Last Resort, or if our liability for scams or operational costs relating to scam management or other industry wide issues are increased as a result of legal or regulatory change), absorbing specialist resources, impacting the profitability of our businesses, requiring us to retain additional capital, impacting our ability to pursue strategic initiatives or implement other changes, resulting in us being unable to increase or maintain market share and/or creating pressure on margins and fees. A failure to manage legal or regulatory changes effectively and in the timeframes required has resulted, and could in the future result, in the Group not meeting its compliance obligations. It could also result in enforcement action, penalties, fines, civil litigation, capital impacts and ultimately loss of business licences. Managing large volumes of regulatory change contributes to execution risk. Updates to our technology, systems and processes to keep pace with legal and regulatory change may not always be successful, and such changes can increase the risk of flaws, human error or unintended consequences. This is exacerbated by frequent requirements for change. Significant management attention, costs and resources may be required to update existing, or implement new, processes to comply with such changes. The availability of skilled personnel required to implement changes may be limited. There is additional information on certain aspects of regulatory changes affecting the Group in the Significant developments section and in the sections ‘Critical accounting assumptions and estimates’ and ‘Future developments in accounting standards’ in Note 1 to the financial statements in the 2024 Annual Report. We have been and could be adversely affected by failing to comply with laws, regulations or regulatory policy - Compliance and conduct Risk - Regulators' expectations - Legal and regulatory - Industry codes - Fines, penalties and capital overlays We are responsible for ensuring that we comply with all applicable legal and regulatory requirements and industry codes of practice in the jurisdictions in which we operate or obtain funding. We are subject to compliance and conduct risks. These risks are exacerbated by the complexity and volume of regulation, and the level of ongoing regulatory change, including where we interpret our obligations and rights differently to regulators or a Court, tribunal or other body, or where applicable laws (in different jurisdictions or between regimes in Australia) conflict. The potential for this is heightened when regulation is new, untested or is not accompanied by extensive regulatory guidance, or where industry consultation is limited. Our compliance and conduct management system (which is designed to support our commitment to satisfying regulatory requirements and the effective management of compliance and conduct risk for the benefit of customers, other stakeholders and financial markets) has not always been, and may not always be, effective. Breakdowns have occurred, and may in the future occur, including due to a failure to exercise good judgement in the decisions we make, flaws in the design or implementation of controls or processes, or when new measures are implemented. These factors can result in a failure by the Group to meet its compliance obligations (including obligations to report or provide information to regulators). As reviews and change programs are progressed, compliance issues have been, and will likely continue to be, identified. |

| FINANCIAL STATEMENTS EXHIBITS INDEX STRATEGIC REVIEW PERFORMANCE REVIEW SHAREHOLDER INFORMATION 319 Risk factors (Continued) Conduct risk has occurred, and could continue to occur, through the provision of products and services to customers (including vulnerable customers and customers in hardship) that do not meet their needs or do not meet the expectations of the market. It has occurred, and could continue to occur, through the deliberate, reckless, negligent, accidental or unintentional conduct of our employees, contractors, agents, authorised representatives, credit representatives and/or external services providers that results in the circumvention or inadequate implementation of our controls, processes, policies or procedures. This could occur through a failure to meet professional obligations to specific clients (including fiduciary, suitability, responsible lending and hardship requirements), weakness in risk culture, corporate governance or organisational culture, poor product design and implementation, failure to adequately consider customer needs or selling products and services outside of customer target markets, or human error. These risks are heightened where there has been, or is in the future, inadequate supervision and oversight of our distribution channels. A failure by our people to comply with the behaviours we expect, our policies and procedures, or the law, could also negatively impact other employees, which could lead to outcomes including litigation and reputational damage for Westpac. Where third parties have contributed to conduct risk (for example, where customers misrepresent their position on product applications and we have failed to identify it), Westpac and its related entities may have limited recourse against these third parties, and regulatory outcomes may not be mitigated by third party culpability. These factors have resulted, and could continue to result, in poor customer outcomes (including for vulnerable customers and customers in hardship), a failure by the Group to meet its compliance obligations (or to promptly detect, report and/or remedy non-compliance) and other outcomes including impacts which may compromise the integrity of the markets in which we operate or data we report, reputational damage, increased regulatory surveillance or investigation and employment disputes in relation to consequence management. We are currently subject to a number of investigations, reviews and industry inquiries by, and have and continue to respond to a number of requests from, domestic and international regulators including APRA, ASIC, the ATO, the ACCC, AUSTRAC, BCCC, FINRA, AFCA, RBNZ and the Fair Work Ombudsman, BaFin and BPNG’s Financial Analysis and Supervision Unit, involving significant resources and costs (which may divert specialist resources from other programs of work). Regulatory reviews and investigations have in the past, and may in the future, result in a regulator taking administrative or enforcement action against the Group and/or its representatives. Regulators have broad powers, and in certain circumstances, can issue directions to us (including in relation to product design and distribution and remedial action). Regulators could also pursue civil or criminal proceedings, seek substantial fines, civil penalties, compliance regimes or other enforcement outcomes. Penalties can be (and have been) more significant where it has taken some time to identify contraventions, or to investigate, correct or remediate contraventions, where there are patterns of similar conduct, or where there has been awareness of contraventions. These risks are heightened where we fail to meet our obligations (or the expectations of regulators) in areas of particular regulatory focus. For example, in relation to vulnerable customers, customers in hardship and indigenous customers or where regulators consider issues to be material or indicate systemic issues. In addition, regulatory investigations may lead to adverse findings against directors and management, including potential disqualification. The allocation of resources to regulatory reviews and investigations can also impede other activities, including change, simplification and remediation activities. APRA can also require the Group to hold additional capital either through a capital overlay or higher risk weighted assets (including in response to a failure to comply with prudential standards and/or expectations including in relation to, for example, stress testing and liquidity management). Following the commencement of civil penalty proceedings, APRA imposed a A$500 million Culture, Governance and Accountability Review overlay and a further A$500 million Risk Governance overlay to our required operational risk capital in 2019. On 19 July 2024, APRA announced the reduction of the Group’s total operational risk capital overlay from A$1 billion to A$500m. This increased the Common Equity Tier 1 (CET1) capital ratio by approximately 18 basis points, reflecting a reduction in risk weighted assets of $6,250 million. This change was applied with immediate effect. If the Group incurs additional capital overlays, we may need to raise additional capital, which could have an adverse impact on our financial performance. The political and regulatory environment that we operate in has seen (and may continue to see) the expansion of powers of regulators along with materially increased civil penalties and fines for corporate and financial sector misconduct or non-compliance and an increase in criminal prosecutions against institutions and/or their employees and representatives (including where there is no fault element). This could also result in reputational damage and impact the willingness of customers, investors and other stakeholders to deal with Westpac. Given the size of Westpac and scale of its activities, a failure by Westpac may result in multiple contraventions, which could lead to significant financial and other penalties. The introduction of the Financial Accountability Regime may heighten these risks as it imposes a strengthened responsibility and accountability framework. Regulatory investigations or actions commenced against the Group have exposed, and may in the future expose, the Group to an increased risk of litigation brought by third parties (including through class action proceedings), which may require us to pay compensation to third parties and/or to undertake further remediation activities. In some cases, the amounts claimed and/or to be paid may be substantial. Market developments suggest the scope and nature of potential claims is expanding, including in relation to cyber incidents, financial crime and environmental, social and governance issues. We have incurred significant remediation costs on a number of occasions (including compensation payments and costs of correcting issues) and new issues may arise requiring remediation. We have faced, and may continue to face, challenges in effectively and reliably scoping, quantifying and implementing remediation activities, |

| 320 WESTPAC GROUP 2024 ANNUAL REPORT RISK FACTORS Risk factors (Continued) including determining how to compensate impacted parties properly, fairly and in a timely way. Remediation activities may be affected or delayed by a number of factors including the number of customers (or other parties) affected, the commencement of investigations or litigation (including regulatory or class action proceedings), requirements of regulators (including as to the method or timeframe for remediation) or difficulties in locating or contacting affected parties and any reluctance of affected parties to respond to contact. Investigation of the underlying issue may be impeded due to the passage of time, technical system constraints, or inadequacy of records. Remediation programs may not prevent regulatory action or investigations, litigation or other proceedings from being pursued, or sanctions being imposed. Regulatory investigations, inquiries, litigation, fines, penalties, infringement notices, revocation, suspension or variation of conditions of regulatory licences or other enforcement or administrative action or agreements (such as enforceable undertakings) have and could, either individually or in aggregate with other regulatory action, adversely affect our business, prospects, reputation, financial performance or financial condition and increases class action risk. There is additional information on certain regulatory and other matters that may affect the Group (including class actions) in the Significant developments section and in the sections ‘Critical accounting assumptions and estimates’ and ‘Future developments in accounting standards’ in Note 1 to the financial statements in the 2024 Annual Report. We have suffered, and in the future could suffer, losses and be adversely affected by the failure to implement effective risk management - Risk management - Controls and processes - Risk culture - Risk governance - Fines, penalties Our risk management framework has not always been, and may not in the future be, fully effective. The resources we have in place for identifying, measuring, evaluating, monitoring, reporting and controlling or mitigating material risks may not always be adequate. This may arise due to inadequacies in the design of the framework or key risk management policies, controls and processes, the design or operation of our remuneration structures and consequence management processes, technology failures, our corporate structure, incomplete implementation or embedment, or failure by our people (including contractors, agents, authorised representatives and credit representatives) to comply with or properly implement our policies and processes. The potential for these types of failings is heightened if we do not have appropriately skilled, trained and qualified people in key positions or we do not have sufficient capacity, including people, processes and technology, to appropriately manage risks. There are also inherent limitations with any risk management framework. Risks may exist, or emerge in the future, that we have not anticipated or identified. The risk management framework may also prove ineffective because of weaknesses in risk culture or risk governance practices and policies. For example, where there is a lack of awareness of our policies, controls and processes or where they are not adequately complied with, monitored, audited or enforced. This may result in poor decision-making or risk and control weaknesses not being identified, escalated or acted upon. We periodically review our risk management framework to determine if it remains appropriate. Our ongoing analysis and reviews, in addition to regulatory feedback, have highlighted that while there have been improvements, the risk management framework is still not operating satisfactorily in a number of respects and needs continued focus. As part of our risk management framework, we measure and monitor risks against our risk appetite. When a risk is out of appetite, we aim to take steps to bring this risk back into appetite. This may include improving the design of our risk management framework and supporting policies. However, we may not always be able to bring a risk back within appetite within proposed timeframes or implement effective improvements. This may occur because, for example, the required changes involve significant complexity, or because we experience delays in enhancing our information technology systems, or we do not have sufficient appropriately trained staff for required activities (including where staff are occupied by other regulatory change or remediation projects), or because of an operational failure. It is also possible that due to external factors beyond our control, certain risks may be inherently outside of appetite for periods of time. Westpac developed the Integrated Plan (IP) to address the root causes of our risk governance shortcomings which led to the Enforceable Undertaking (EU) with APRA in December 2020 in relation to our risk governance remediation and supporting the strengthening of our risk governance, accountability and culture. We completed the IP in December 2023, as committed. Promontory Australia (as Independent Reviewer) issued its final report on 30 April 2024 confirming that Westpac has successfully completed the IP. This report and previously issued reports are published on our website at https://www.westpac.com.au/about-westpac/media/core/. Westpac is continuing to focus on the sustainability and effectiveness of the uplift delivered by the Integrated Plan through a transition phase in 2024. |

| FINANCIAL STATEMENTS EXHIBITS INDEX STRATEGIC REVIEW PERFORMANCE REVIEW SHAREHOLDER INFORMATION 321 Risk factors (Continued) If any of our governance or risk management processes and procedures prove ineffective or inadequate or are otherwise not appropriately implemented or we do not bring risks into appetite, we could be exposed to higher levels of risk than expected and sustained or increased regulatory scrutiny and action. While improvements in risk culture can drive early and increased self-identification and remediation of compliance concerns, this can also highlight concerns that may lead to further regulatory action. This may result in financial losses, imposition of capital requirements, breaches of compliance obligations, fines and reputational damage, and significant remediation which could adversely affect our business, prospects, financial performance or financial condition. We could suffer losses due to technology failures - Operational risk - Information and technology - Change management - Technology failure - Outages Maintaining the reliability, availability, integrity, confidentiality, security and resilience of our information and technology is crucial to our business. While the Group has a number of processes in place to preserve and monitor the availability, and facilitate the recovery, of our systems, there is a risk that our information and technology systems may be inadequate, fail to operate properly or result in outages, including from events wholly or partially beyond our control. If we experience a technology failure, we may fail to meet a compliance obligation (such as a requirement to retain records and/or data for a certain period, or to destroy records and/or data after a certain period, or other risk management, privacy, business continuity management or outsourcing obligations), or our employees and our customers may be adversely affected, including through the inability for them to access our products and services, privacy breaches, or the loss of personal data. This could result in reputational damage, remediation costs and a regulator commencing an investigation and/or taking action, or others commencing litigation, against us. Technology issues in the financial sector can also affect multiple institutions. This means we could impact, or be impacted by, other institutions. The use of legacy systems, as well as work underway to uplift our technological capabilities, may heighten the risk of a technology failure, change management issues and the risk of non-compliance with our regulatory obligations or poor customer outcomes. Projects aimed at simplifying/streamlining our systems (including our UNITE program) will require the allocation of significant resources (including specialist expertise) and incur costs. In addition, the risk of technology failure, regulatory non-compliance or poor customer outcomes may be heightened while those projects are being undertaken, or post-implementation where there are unanticipated outcomes or impacts. We are also exposed to the risk that such projects may not be completed on time or may require further resources or funding than anticipated. The success of such projects relies in part on having robust governance arrangements and appropriate oversight at board and senior executive level, and the risk of regulatory non-compliance, poor customer outcomes, delays, increased cost or demand on resources can be heightened where we fall short in these areas. Failure to regularly renew and enhance our technology to deliver new products and services, comply with regulatory obligations and ongoing regulatory changes, improve automation of our systems and controls, and meet our customers’ and regulators’ expectations, or to effectively implement new technology projects, could result in cost overruns, technology failures (including due to human error in implementation), reduced productivity, outages, operational failures or instability, compliance failures, reputational damage and/or the loss of market share. This could place us at a competitive disadvantage and also adversely affect our business, prospects, financial performance or financial condition. We could suffer losses due to geopolitical events - Geopolitical risks - Conflicts - Operational risk - Credit risk We, our customers and our suppliers operate businesses and hold assets in different geographic locations. Significant risks remain including from geopolitical instability, conflicts, trade tensions, tariffs, sanctions, social disruption, civil unrest, war, terrorist activity, acts of international hostility, and complicity with or reluctance to take action against certain types of crimes. Such events could affect domestic and international economic stability and impact consumer and investor confidence which in turn could disrupt industries, businesses, service providers and supply chains and ultimately adversely impact economic activity. This could lead to shortages of materials and labour, higher energy costs and commodity prices, volatility in markets and damage to property. This in turn could affect asset values and impact customers’ ability to |
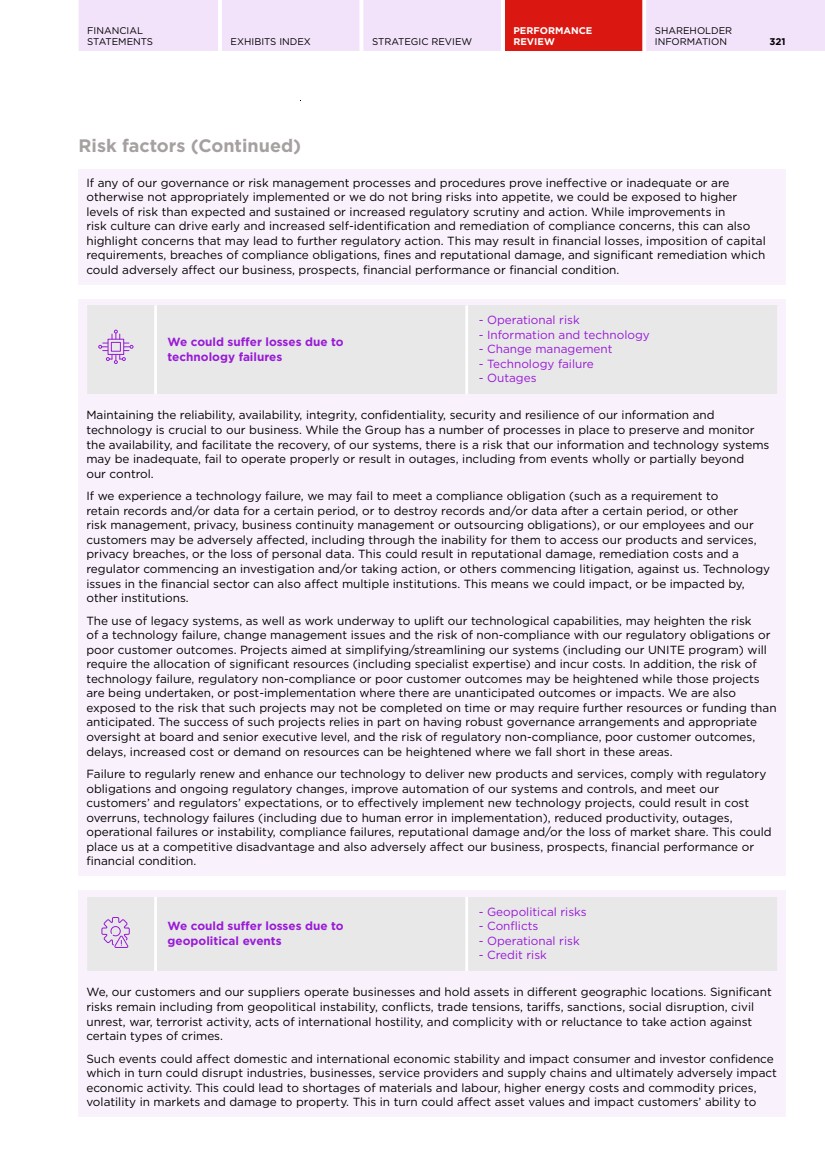
| 322 WESTPAC GROUP 2024 ANNUAL REPORT RISK FACTORS Risk factors (Continued) repay amounts owing to us, and our ability to recover amounts owing. All of these impacts could adversely affect our business, prospects, financial performance or financial condition. The current global landscape is marked by significant conflict and heightened tensions, which have the potential to further intensify these impacts. Climate change and other sustainability factors such as human rights and natural capital may have adverse effects on our business - Climate and nature risks - Physical and transition risks - Social and human rights risks - Credit risk - Operational risk - Reputational and sustainability risk - Compliance and conduct risks Climate and other sustainability-related risks have had and are likely to have adverse effects on us, our customers, external suppliers, and the communities in which we operate. Managing these risks is challenging given the significant uncertainties in modelling climate and other sustainability-related risks and opportunities and in assessing their impact. Climate related risks may manifest as physical risks, transition risks, and risks related to legal and regulatory action. Physical risks from climate change include risks to us directly, as well as to customers, suppliers and other stakeholders that may impact us due to disruption or changes to business activities, income, business models, asset values, insurability of assets (or the availability/affordability of insurance), and frequency or extent of damage to assets. These risks could arise from increases and variability in temperatures, changes in precipitation, rising sea levels, loss of natural capital (including biodiversity loss), and more severe and frequent climatic events, including fires, storms, floods and droughts. Such events could also increase human rights risk and/or increase customer vulnerability. Transition risks are risks that the transition to a lower carbon economy could impact Westpac. This could occur from climate change mitigation, obsolescence of certain businesses including from energy transition, changes in investor appetite, shifting customer preferences, technology developments and changes in regulatory expectations/policy. Transition risks could emerge through our lending to certain customers that experience reduced revenues or asset values or increased costs, which in turn impacts our credit risk. Westpac may also be directly impacted by transition risks, or be unable to reduce our exposure to impacted customers, suppliers and other third parties. Our ambition to become a net-zero, climate resilient bank, has led and will lead to changes in policies and processes which may present associated execution risk. Our ability to meet our commitments and targets is in part dependent on the orderly transition of the economy towards net-zero, which may be impacted by external factors including (but not limited to) government and other policies, investment, electricity grid capacity, and constraints in the development and supply of technology, infrastructure and the skilled labour required to deliver the necessary change. Our ability to transition, including to meet our targets and commitments, may also be impacted by challenges faced by customers in meeting their own transition plans and commitments. The high dependency of the economy on nature means natural capital loss is a risk to us, primarily through our exposure to customers that are materially dependent or impact on nature. Natural capital refers to the stock of renewable and non-renewable natural resources (e.g. plants, animals, air, water, soils, minerals) that combine to yield a flow of benefits to people. Natural capital loss can also contribute to, and be accelerated by, climate change. Increasing recognition and responses to this risk also create heightened regulatory and stakeholder expectations on Westpac. As with our climate ambitions, our ambition to become a nature positive bank will lead to changes to policies and processes which may present associated execution risk, and our ability to meet those ambitions will be impacted by external factors outside our control. Global strategies and standards for nature positivity are at an early stage, which increases regulatory risk and uncertainty. Our business may be exposed to social and human rights risks through our operations, our supply chain and in the provision of financial services. If we fail to adequately identify and manage these risks, we may cause, contribute to, or be directly linked to adverse social and human rights impacts. This includes a risk that we provide financial services to, or use services provided by, parties involved in human rights abuses or criminal activity, or that our platforms and products may be exploited for criminal purposes. While we seek to manage and assess social risks and act if we identify risks, we cannot be certain that our assessment will uncover these risks and/or enable us to act. This could be because of the increasing sophistication of perpetrators and/or our monitoring systems and analytics have not kept pace with change. Data relevant to our assessment and management of climate, and other sustainability-related risks continues to mature. In some cases, we require data from third parties to estimate our exposure and risks. If those data sources are not sufficiently available or reliable, there is a risk that our decision making, including target setting and reporting, could be affected and we may not be able to meet our targets and commitments. Associated risks increase where disclosure of data is required by mandatory reporting. |

| FINANCIAL STATEMENTS EXHIBITS INDEX STRATEGIC REVIEW PERFORMANCE REVIEW SHAREHOLDER INFORMATION 323 Risk factors (Continued) Failure or perceived failure to adapt the Group’s strategy, governance, procedures, systems and/or controls to proactively manage or disclose climate and other sustainability-related risks and opportunities (including, for example, perceived misstatement of, or failure to adequately implement or meet, sustainability claims, commitments and/or targets) may give rise to business, reputational, legal and regulatory risks. This includes financial and credit risks that may impact our profitability and outlook, and the risk of regulatory action or litigation (including class actions) against us and/or our customers. We may also be subject, from time to time, to legal and business challenges due to actions instituted by activist or other groups. Examples of areas which have attracted activism and challenges include: the financing of businesses perceived to be at greater risk from climate-related physical and transition risks and/or perceived not to demonstrate responsible management of climate or other sustainability issues; and climate and sustainability related disclosures (including net-zero or emissions reduction strategies, targets and policies). Scrutiny from regulators, shareholders, activists and other stakeholders on climate-related risk management practices, lending policies, targets and commitments, and other sustainability products, claims and marketing practices will likely remain high. Applicable legal and regulatory regimes, policies, and reporting and other standards are also evolving. For example, in Australia, mandatory climate reporting has been introduced, and there is an increased compliance and enforcement focus by ASIC and ACCC on a range of issues related to sustainability, sustainable finance, and monitoring/investigation of related claims. This increases compliance, legal and regulatory risks, and costs. For further detail on the identification, assessment and management of these risks, please refer to our 2024 Climate Report, and the Creating Value for the Community, Creating Value for the Environment, Risk Management and Sustainability Governance sections of the 2024 Annual Report. The failure to comply with financial crime obligations has had, and could have further, adverse effects on our business and reputation - Financial crime risk - Bribery and corruption - Tax evasion - Money laundering and terrorism financing - Economic and trade sanctions The Group is subject to anti-money laundering and counter-terrorism financing (AML/CTF) laws, anti-bribery and corruption laws, economic and trade sanctions laws and tax transparency laws in the jurisdictions in which it operates (Financial Crime Laws). These laws can be complex and, in some circumstances, impose a diverse range of obligations. As a result, regulatory, operational and compliance risks are heightened. In some jurisdictions (e.g. the Pacific region) financial crime risks are elevated beyond the Group’s risk appetite requiring an appropriate action plan to reduce risk, and return to within appetite. Financial Crime Laws require us to report certain matters and transactions to regulators (such as international funds transfer instructions, threshold transaction reports, suspicious matter reports, FATCA and CRS reports) and ensure that we know who our customers are and that we have appropriate ongoing customer due diligence in place. The failure to comply with some of these laws has had, and in the future could have, adverse impacts for the Group. The Group operates within a landscape that is constantly changing, particularly with the emergence of new payment technologies, ongoing legislative reform impacting Financial Crime Laws, increased regulatory focus on digital assets, and increasing reliance on economic and trade sanctions to manage issues of international concern. These developments bring with them new financial crime risks for the Group (as well as other risks including scams and fraud, and criminal activity that utilises a variety of technology and platforms), which may require adjustments to the Group’s systems, policies, processes and controls. There has been, and continues to be, a focus on compliance with financial crime obligations, with regulators globally commencing investigations and taking enforcement action for identified non-compliance (often seeking significant penalties). Due to the Group’s scale of operations, an undetected failure or the ineffective implementation, monitoring or remediation of a system, policy, process or control (including a regulatory reporting obligation) has resulted, and could in the future result, in a significant number of breaches of AML/CTF or other Financial Crime Laws. This in turn could lead to significant financial penalties and other adverse impacts for the Group, such as reputational damage and litigation risk. While the Group has systems, policies, processes and controls in place designed to manage its financial crime obligations (including reporting obligations), these have not always been, and may not in the future always be, effective. This could be for a range of reasons including, for example, a deficiency in the design of a control or a technology failure or a change in financial crime risks or typologies. Our analysis and reviews, in addition to regulator feedback, have highlighted that our systems, policies, processes and controls are not always operating satisfactorily in a number of respects and require improvement. We continue to have an increased focus on financial crime risk management and, as such, further issues requiring attention have been identified and may continue to be identified. |

| 324 WESTPAC GROUP 2024 ANNUAL REPORT RISK FACTORS Risk factors (Continued) Although the Group provides updates to various regulators on its remediation and other program activities, there is no assurance that those or other regulators will agree that its remediation and program update activities will be adequate or effectively enhance the Group’s compliance programs. If we fail to comply with our financial crime obligations, we have faced, and could in the future face, significant regulatory enforcement action and other consequences (as discussed in the risk factor entitled ‘We have been and could be adversely affected by failing to comply with laws, regulations or regulatory policy’) and increased reputational risks (as discussed in the risk factor entitled ‘Reputational damage has harmed, and could in the future harm, our business and prospects’). There is additional information on financial crime matters in the Significant developments section in the 2024 Annual Report. Reputational damage has harmed, and could in the future harm, our business and prospects - Reputational and sustainability risk - Negative customer outcomes Reputational risk arises where there are differences between stakeholders’ current and emerging perceptions, beliefs and expectations and our past, current and planned activities, processes, performance and behaviours. Potential sources of reputational damage include where our actions (or those of our contractors, agents, authorised representatives and credit representatives) cause, or are perceived to cause, a negative outcome for customers, shareholders, stakeholders or the community. Reputational damage could also arise from the failure to effectively manage risks, failure to comply with legal and regulatory requirements, enforcement or supervisory action by regulators, adverse findings from regulatory reviews, failure or perceived failure to adequately prevent or respond to community, environmental, social and ethical issues or expectations and cyber incidents, and inadequate record-keeping, which may prevent Westpac from demonstrating that, or determining if, a past decision was appropriate at the time it was made. We are also exposed to contagion risk from incidents in (or affecting) other financial institutions and/or the financial sector more broadly (for example, issues affecting the cash-in-transit industry and the potential for disruption to the availability of cash, as well as flow on consequences including runs on cash). There are potential reputational consequences (together with other potential commercial and operational consequences) of failing to appropriately identify, assess and manage environmental, social and governance related risks, or to respond effectively to evolving standards and stakeholder expectations. Our reputation could also be adversely affected by the actions of customers, suppliers, contractors, authorised representatives, credit representatives, joint-venture partners, strategic partners or other counterparties. Failure, or perceived failure, to address issues that could or do give rise to reputational risk, has created, and could in the future create, additional legal risk, subject us to regulatory investigations, regulatory enforcement actions, fines and penalties or litigation or other actions brought by third parties (including class actions), and the requirement to remediate and compensate customers, including prospective customers, investors and the market. It could also result in the loss of customers or restrict the Group’s ability to efficiently access capital markets. This could adversely affect our business, prospects, financial performance or financial condition. We have and could suffer losses due to litigation - Compliance and conduct risk - Enforcement action - Litigation - Class actions - Substantial fines and penalties Litigation has been, and could in the future be, commenced against us by a range of plaintiffs, such as customers, shareholders, employees, suppliers, counterparties, activists and regulators and may, either individually or in aggregate, adversely affect the Group’s business, operations, prospects, reputation or financial condition. In recent years, there has been an increase in class action proceedings in the broader market, many of which have resulted in significant monetary settlements. The risk of class actions has been heightened by a number of factors, including regulatory enforcement actions, an increase in the number of regulatory investigations and inquiries, a greater willingness on the part of regulators to commence court proceedings, more intense media scrutiny, the increasing prospect of regulatory reforms which might eliminate some of the current barriers to such litigation, and the growth of third party litigation funding and other funding arrangements. Class actions commenced against a competitor could also lead to similar proceedings against Westpac and a competitor’s response to those actions may impact attitudes of counterparties to Westpac proceedings. Activism strategies directed at financial institutions, particularly in the area of climate change, sustainability and energy transition, have also increased globally in recent years, where the focus, including through the commencement |

| FINANCIAL STATEMENTS EXHIBITS INDEX STRATEGIC REVIEW PERFORMANCE REVIEW SHAREHOLDER INFORMATION 325 Risk factors (Continued) of proceedings, may be to publicly highlight particular issues, to enforce legal or regulatory standards, or to influence the financial institution to change its operations and activities. Westpac is currently, and in the future may be, exposed to such litigation and/or strategies employed by activist shareholders or organisations. Litigation is subject to many uncertainties and the outcome may not be predicted accurately. Furthermore, the Group’s ability to respond to and defend litigation may be adversely affected by inadequate record keeping. The Group’s ability to settle litigation on reasonable terms will be affected by attitudes of counterparties. Depending on the outcome of any litigation, the Group has been, and may in the future be, required to comply with broad court orders, including compliance orders, enforcement orders or otherwise pay significant damages, fines, penalties or legal costs. There is a risk that the actual penalty or damages paid following a settlement or determination by a Court for any legal proceedings may be materially higher or lower than any relevant provision (where applicable) or that any contingent liability may be larger than anticipated. There is also a risk that additional litigation or contingent liabilities arise, all of which could adversely affect our business, prospects, reputation, financial performance or financial condition. There is additional information on certain legal proceedings that may affect the Group in the Significant developments section and in Note 25 to the financial statements in the 2024 Annual Report. We are exposed to adverse funding market conditions - Market risk - Volatility and disruption - Funding and liquidity risk - Credit risk We rely on deposits, global money markets and global capital markets to fund our business and source liquidity. Our liquidity and costs of obtaining funding are related to funding market and general economic conditions, in addition to our creditworthiness and credit profile. Funding sources can be unpredictable and experience periods of extreme volatility, disruption and decreased liquidity. Market conditions, and the behaviour of market participants, can shift significantly over very short periods of time. The main risks we face are damage to market confidence, changes to the access and cost of funding and reduction in appetite for exposure to Westpac, as well as the potential impacts arising from broader macroeconomic themes. Additionally, a shift in investment preferences could result in deposit withdrawals that would increase our need for funding from other sources. These other sources may offer lower levels of liquidity and increase costs. If market conditions deteriorate due to economic, political, regulatory, or other reasons (including those idiosyncratic to Westpac), there may also be a loss of confidence in bank deposits leading to unexpected withdrawals. These events can transpire quickly and be exacerbated by information transmission on social media. This could increase funding costs, constrain our liquidity, funding and lending activities and threaten our financial solvency. In such events, even robust levels of capital may not be sufficient to safeguard Westpac against detrimental loss of funding. If our current sources of funding prove to be insufficient, we may need to seek alternatives which will depend on factors such as market conditions, our credit ratings, reputation and confidence issues and market capacity. Even if available, these alternatives may be more expensive or on unfavourable terms, which could adversely affect our financial performance, liquidity, capital resources or financial condition. If we are unable to source appropriate funding, we may be forced to reduce business activities (e.g. lending) or operate with smaller liquidity buffers. This may adversely impact our business, liquidity, capital resources, financial performance or financial condition. If we are unable to source appropriate funding for an extended period, or if we can no longer realise liquidity, we may not be able to pay our debts as and when they fall due or meet other contractual obligations. We also enter into collateralised derivative obligations, which may require us to post additional collateral based on market movements. This has the potential to adversely affect our liquidity or ability to use derivatives to hedge interest rate, currency and other financial risks. We could be adversely affected by the risk of inadequate capital levels - Capital adequacy - Capital risk - Regulatory capital requirements The Group is subject to the risk of an inadequate level or composition of capital to support our business activities and meet regulatory capital requirements under normal operating environments or stressed conditions, and to maintain our solvency. Even robust levels of capital may not be sufficient to ensure the ongoing sustainability of Westpac in the event of a bank run, where depositors quickly withdraw funds because of concerns about bank failure. |
| 326 WESTPAC GROUP 2024 ANNUAL REPORT RISK FACTORS Risk factors (Continued) Our capital levels are determined by regulation and risk appetite and informed by stress testing. Buffers on regulatory requirements have been built to assist in maintaining capital adequacy during stressed times. We determine our management buffers taking into consideration various factors. These include our balance sheet, forecasts, portfolio mix, potential capital headwinds (including real estate valuations, inflation and rising rates) and stressed outcomes, (also noting that models and assumptions may or may not be accurate in predicting the nature and magnitude of particular stress events). The macroeconomic environment, stressed conditions and/or regulatory framework could result in a material increase to risk weighted assets or impact our capital adequacy, trigger capital distribution constraints, threaten our financial viability and/or require us to undertake a highly dilutive capital raising. Capital distribution constraints apply when an ADI’s Common Equity Tier 1 Capital ratio is within the prudential capital buffer range (consisting of the Capital Conservation Buffer plus any Countercyclical Capital Buffer). Such constraints could impact future dividends and distributions on Additional Tier 1 (AT1) capital instruments. Should AT1 and Tier 2 capital securities that we have issued be converted into ordinary shares (for example where our CET 1 ratio falls below a certain level or APRA determines we would become non-viable without conversion of capital instruments or equivalent support), this could significantly dilute the value of existing ordinary shares. Additionally, it should be noted that APRA is currently consulting on a proposal to phase out AT1 capital instruments (see further discussion in the Significant developments section in the 2024 Annual Report). Our business is substantially dependent on the Australian and New Zealand economies, and could be adversely affected by a material downturn or shock to these economies or other financial systems - Strategic risk - Macroeconomic risks - Market disruption - Domestic and international economic conditions - Geopolitical risks - Credit risk Our revenues and earnings are dependent on domestic and international economic activity, business conditions and the level of financial services our customers require. Most of our business is conducted in Australia and New Zealand so our performance is influenced by the level and cyclical nature of activity in these countries. The financial services industry and capital markets have been, and may continue to be, adversely affected by volatility, global economic conditions (including inflation and rising interest rates), external events, geopolitical instability, political developments, cyberattacks or a major systemic shock. Market and economic disruptions (or the possibility of interest rates remaining higher for longer than anticipated) could cause consumer and business spending to decrease, unemployment to rise, demand for our products and services to decline and credit losses to increase, thereby reducing our earnings. These events could undermine confidence in the financial system, reduce liquidity, impair access to funding and adversely affect our customers and counterparties. Given Australia’s export reliance on China, slowdown in China’s economic growth and foreign policies (including the adoption of protectionist trade measures or sanctions) could negatively impact the Australian economy. This could result in reduced demand for our products and services and affect supply chains, the level of economic activity and the ability of our borrowers to repay their loans. The nature and consequences of any such event are difficult to predict but each of these factors could adversely affect our business, prospects, financial performance or financial condition. Declines in asset markets could adversely affect our operations or profitability and an increase in impairments and provisioning could adversely affect our financial performance or financial condition - Market risk - Decline in asset values - Impairments - Credit risk Declines in Australian, New Zealand or other asset markets, including equity, bond, residential and commercial property markets, have adversely affected, and could in the future adversely affect, our operations and profitability. Declining asset prices including as a result of change in taxation policies and potential legislation to restrict rents, could also impact customers and counterparties and the value of security (including residential and commercial property) we hold. This may impact our ability to recover amounts owing to us if customers or counterparties default. It may also affect our impairment charges and provisions, in turn impacting our financial performance, financial condition and capital levels. Declining asset prices could also impact our wealth management business as its earnings partly depend on fees based on the value of securities and/or assets held or managed. We establish provisions for credit impairment based on accounting standards using current information and our expectations. If economic conditions deteriorate beyond our expectations, some customers and/or counterparties |

| FINANCIAL STATEMENTS EXHIBITS INDEX STRATEGIC REVIEW PERFORMANCE REVIEW SHAREHOLDER INFORMATION 327 Risk factors (Continued) could experience higher financial stress, leading to an increase in impairments, defaults and write-offs, and higher provisioning. Changes in regulatory expectations in relation to the treatment of customers in hardship could lead to increased impairments and/or higher provisioning. Such events could adversely affect our liquidity, capital resources, financial performance or financial condition. Credit risk also arises from certain derivative, clearing and settlement contracts we enter into, and from our dealings in, and holdings of, debt securities issued by other institutions and government agencies, the financial conditions of which may be affected to varying degrees by economic conditions in global financial markets. Sovereign risk may destabilise financial markets adversely - Sovereign risk - Defaults Potential sovereign contractual defaults, sovereign debt defaults and the risk that governments will nationalise parts of their economy including assets of financial institutions (such as Westpac) could negatively impact the value of our holdings of assets. Such an event could also destabilise global financial markets, adversely affecting our liquidity, financial performance or financial condition. We could be adversely affected by the failure to maintain our credit ratings - Availability of funding - Cost of funding - Downgrade Credit ratings are independent opinions on our creditworthiness. Our credit ratings can affect the cost and availability of our funding and may be important to investors, certain institutional customers and counterparties when evaluating their investments in the Group, our products and services. A rating downgrade could be driven by a downgrade of Australia’s sovereign credit rating, a material weakening in our financial performance, or one or more of the risks identified in this section or by other events including changes to the methodologies rating agencies use to determine credit ratings. A credit rating or rating outlook could be downgraded or revised where credit rating agencies believe there is a very high level of uncertainty on the impact to key rating factors from a significant event. A downgrade to our credit ratings could have an adverse effect on our cost of funds, collateral requirements, liquidity, competitive position, our access to capital markets and our financial stability. The extent and nature of these impacts would depend on various factors, including the extent of any rating change, differences across agencies (split ratings) and whether competitors or the sector are also impacted. We face intense competition in all aspects of our business - Margins; - Regulatory scrutiny - Strategic risk - New entrants The financial services industry is highly competitive. We compete with a range of firms, including retail and commercial banks, investment banks, other financial service companies, fintech companies and businesses in other industries with financial services aspirations. This includes those competitors who are not subject to the same capital and regulatory requirements as us or who derive substantial revenue from other markets, which may allow those competitors to operate more flexibly and with lower costs of funds. Emerging competitors are increasingly altering the competitive environment by adopting new business models or seeking to use new technologies to disrupt existing business models. The competitive environment may also change as a result of increased scrutiny by regulators in the sector (such as in the payments space, or as a result of the recommendations following the ACCC’s inquiry into the market for the supply of retail deposit products) and other legislative reforms, which will stimulate competition, improve customer choice and likely give rise to increased competition from new and existing firms. Competition in the various markets in which we operate has led, and may continue to lead, to a decline in our margins or market share. |
| 328 WESTPAC GROUP 2024 ANNUAL REPORT RISK FACTORS Risk factors (Continued) Deposits fund a significant portion of our balance sheet and have been a relatively stable source of funding. If we are not able to successfully compete for deposits this could increase our cost of funding, lead us to seek access to other types of funding, or result in us reducing our lending. Our ability to compete depends on our ability to offer products and services that meet evolving customer preferences. Not responding to changes in customer preferences could see us lose customers. This could adversely affect our business, prospects, financial performance or financial condition. For more detail on how we address competitive pressures refer to the Our Operating Environment section in the 2024 Annual Report. We have suffered, and could continue to suffer, losses due to operational risk - Operational risk - Change execution - Records management - Ineffective processes and controls - Fraud and scams - Third parties - AI Operational risk is the risk of loss resulting from inadequate or failed internal processes, people and systems or from external events. It includes, among other things, model risk, data risk, operations risk, change execution risk and third party risk. While we have policies, processes and controls in place to manage these risks, these have not always been, or may not be, effective. Ineffective processes and controls (including those of our contractors, agents, authorised representatives and credit representatives, or inadequate supervision and oversight of their activities) have resulted in, and could continue to result in, adverse outcomes for customers, employees or other third parties. The risk of operational breakdowns occurring is heightened if measures are implemented quickly in response to external events. These types of operational failures may result in financial losses, customer remediation, regulatory scrutiny and intervention, fines, penalties and capital overlays and, depending on the nature of the failure, litigation, including class action proceedings. Examples of operational risks include: • Fraud and scams. We have incurred, and could in the future incur, losses from fraud and scams, including fraudulent applications for loans (including misrepresentations by customers), or from incorrect or fraudulent payments and settlements. Such losses, including the potential for additional customer compensation and financial penalties, could increase significantly due to regulatory change (for example, if the Group does not adhere to obligations set out in the impending mandatory cross industry scams code framework and/or a UK style bank reimbursement scheme is implemented in Australia or New Zealand, making Australian and New Zealand banks liable to compensate scam victims). Fraudulent conduct can also arise from external parties seeking to access our systems or customer accounts, the use of mule accounts and where identification records are compromised due to third party cybersecurity events. These risks are heightened by real-time transaction capability, and we are also exposed to contagion risk from incidents affecting other institutions. If systems, procedures and protocols for preventing and managing fraud, scams or improper access to our systems and customer accounts fail, or are inadequate or ineffective, they could lead to losses which could adversely affect our customers, business, prospects, reputation, financial performance or financial condition. Regulatory and compliance requirements can impede the ability to swiftly identify or respond to a fraud or scam, or to communicate with affected parties. • Records management. We could incur losses from a failure to adequately implement and monitor effective records management policies and processes. This could impact our ability to safeguard or locate relevant records, respond to production and regulatory notices, conduct remediation, and generally meet records lifecycle management and compliance obligations. Where there are inadequacies or complexities in our systems, these risks are further heightened, for example retaining records and data for, or destroying records or de-identifying records after a certain period. • Artificial Intelligence (AI). As we increase the adoption of AI to support our customers and business processes, we may become more exposed to risks associated with the use of technology, such as lack of transparency, inaccurate data input, risk of unintentional bias or inaccurate outputs, breaches of confidentiality and privacy obligations, and inaccurate decisions or unintended consequences that are inconsistent with our policies or values. In addition, failure or delays in adopting AI could lead to competitive disadvantages or otherwise not leveraging capability that could better support risk management or improve customer outcomes. These could have financial, regulatory, conduct, reputational and customer impacts. • Third party. We rely on third parties, both in Australia and overseas, to provide services to us and our customers. Failures by these third parties, including our authorised representatives and credit representatives, to deliver services as required and in accordance with law, regulation and regulatory expectations could disrupt our ability |
| FINANCIAL STATEMENTS EXHIBITS INDEX STRATEGIC REVIEW PERFORMANCE REVIEW SHAREHOLDER INFORMATION 329 Risk factors (Continued) to provide products and services and adversely impact our customers, operations, financial performance or reputation. For example, we rely on third parties to provide cash transport, handling and storage services. With reduced demand for cash placing pressure on the cash-in-transit (CIT) industry, we are exposed to operational risk including loss of (or delays in accessing) cash held by CIT providers on our behalf, reduced availability of cash in the system generally (which could lead to a run on cash), and related consequences where we or our customers suffer loss or damage due to disruptions to CIT services. • Change execution. We are exposed to change execution risk through delivery of technology and other change programs. There are risks that a change program fails to deliver the desired outcomes, or fails to reduce, pre-empt, mitigate and manage the challenges associated with transformation delivery. This could result in business disruption and delays, technology challenges, financial loss or further regulatory scrutiny. If our technology systems or financial infrastructure do not operate correctly, this may also cause loss or damage to us or our customers. This can also arise from complexities in our systems, and the interaction between those systems. This could include, for example, where systems issues result in incorrect fees or charges being applied to customers, or other poor customer outcomes. • Insurance coverage. There is a risk that we will not be able to obtain and/or have not obtained appropriate insurance coverage for the risks that we may be exposed to. This could be due to lack of available or adequate insurance, an increase in the cost of insurance, or failure of the insurance underwriter. If an insurance policy is not available or does not respond to a loss, we will not have the ability to recover its loss from an insurance policy. We could suffer losses due to market volatility - Market risk - Geopolitical risks - Volatility and disruption - Credit risk Market risk is the risk of an adverse impact on the Group’s financial performance, financial position, capital and liquidity, resulting from changes in market factors, such as foreign exchange rates, commodity prices, equity prices, credit spreads and interest rates. Market risk is present in both banking book and trading book. We are exposed to market risk due to our financial markets businesses, asset and liability management, our holdings in liquid asset securities and our defined benefit plan. Changes in market factors could be driven by a variety of developments including economic disruption, geopolitical events, market liquidity or concerns relating to major market participants or sectors. The resulting market volatility could potentially lead to losses and may adversely affect our financial performance. As a financial intermediary, we underwrite listed and unlisted debt securities. We could suffer losses if we fail to syndicate or sell down this risk to others. This risk is more pronounced in times of heightened market volatility. Poor data quality could adversely affect our business and operations - Operational risk - Data quality - Poor customer and risk outcomes Having accurate, complete and reliable data, supported by appropriate data controls, retention and, destruction methods and access to internal frameworks and processes, is critical to the effective operation of Westpac’s businesses. Data plays a key role in determining how we provide products and services to customers, the effectiveness of our systems and risk management frameworks and our ability to make effective decisions and strategic planning. Some of our businesses are affected by poor data quality and/or limited data availability. This has been, and may continue to be, due to a number of factors, including inadequacies across systems, processes and policies, or ineffectively implemented data management frameworks. Poor data quality could lead to poor customer service outcomes, adverse risk management outcomes, deficient system outputs and processes. This is because inadequacies in data quality renders that data unreliable to assist in making informed business decisions. Deficiencies with internal systems and processes could negatively impact Westpac’s decision-making in areas such as the provision of credit to a customer, and the terms on which a credit facility is provided. The production of accurate data is also critical for other functions across the Westpac Group, such as financial and other reporting (internal and external). Poor data quality and availability impacts the ability for Westpac’s business to effectively monitor and manage their operations, comply with production notices, respond to regulatory notices, defend and respond to litigation and conduct remediation activities. Conflicting data retention or destruction obligations may increase that risk. |
| 330 WESTPAC GROUP 2024 ANNUAL REPORT RISK FACTORS Risk factors (Continued) Poor data and/or poor data retention/destruction methods, deficient controls that result in control gaps and weaknesses, negatively impact Westpac’s ability to meet its compliance obligations (including its regulatory reporting obligations). In the past this has led to regulatory investigations or adverse findings and actions against Westpac, and such actions are likely to continue if we do not maintain an acceptable level of quality for the data we hold and use, as well as having effective oversight practices in place. The data related frameworks and processes that we have in place must be continuously reviewed, and improved where required, to ensure our data quality and data management practices remain relevant, fit for purpose and sustainable. This is because outdated or unsustainable practices may lead to inefficient data management practices and/or poor quality data. Potential consequences from holding data that is of a poor quality and/or having poor data oversight and controls include adversely impacting on the ability for the Group to effectively operate its existing businesses, securing prospective business from third parties, its reputation, financial performance and financial condition. Certain strategic decisions may have adverse effects on our business - Strategic risk - Warranties and indemnities - Divestments and acquisitions - Implementation risk We routinely evaluate and implement strategic decisions, priorities and objectives including simplification, diversification, innovation, divestment, investment, acquisition, business expansion initiatives or decisions to shut down some operations. Each of these activities can be complex, costly and may not proceed in a timely manner. For example, we may experience difficulties in completing certain transactions, separating or integrating businesses in the scheduled timeframe or at all, disruptions to operations, diversion of management resources or higher than expected transaction costs, there may be impacts on third parties, and there may be differing market views about a strategic choice, which may cause reputational damage. Any failure to successfully divest businesses means that we may have sustained exposure to higher operating costs and to the higher inherent risks in those businesses. Decisions to retain businesses means we may be exposed to the higher inherent risks in those businesses. For example, our Pacific businesses face a number of risks including heightened operational risk, sovereign risk, financial crime and exchange control risks which could adversely affect our customers, business, prospects, reputation, financial performance or financial condition. In addition, as part of the now-completed Specialist Businesses transactions, we have given a number of warranties and indemnities in favour of counterparties relating to certain pre-completion matters and made certain other contractual commitments, including in relation to transitional services. Warranties, indemnities and commitments may also be given in the future in relation to other divestments we undertake. Claims under these warranties, indemnities and other contractual commitments may result in us being liable to make significant payments to these counterparties while the various contractual liability regimes remain on foot. For potential matters related to conduct and customer redress, additional operational risk capital is held against this risk pursuant to APRA’s published guidance. These contingent liabilities are described in Note 25 to the financial statements in the 2024 Annual Report. We also acquire and invest in businesses. These transactions involve a number of risks and costs. A business we invest in may not perform as anticipated, may result in the assumption of unknown and unaccounted for liabilities, regulatory risks or may ultimately prove to have been overvalued when the transaction was entered into. Operational, cultural, governance, compliance and risk appetite differences between us and an acquired business may lead to longer and more costly integration. There are risks involved in not implementing strategies successfully due to internal factors, for example, inadequate funding, resourcing, business capabilities or operating model, or failing to identify, understand or respond effectively to changes in the external business environment, including economic, geopolitical, regulatory, consumer sentiment, technological, environmental, social and competitive factors. This could have a range of adverse effects on us, such as being unable to increase or maintain market share or resulting pressure on margins and fees. Any of these risks could have a negative impact on our business, growth prospects, reputation, engagement with regulators, financial performance or financial condition. |
| FINANCIAL STATEMENTS EXHIBITS INDEX STRATEGIC REVIEW PERFORMANCE REVIEW SHAREHOLDER INFORMATION 331 Risk factors (Continued) Other risks • Failure to recruit and retain key executives, employees and Directors may have adverse effects on our business, prospects, reputation, financial performance or financial condition. Macro-environmental factors including low unemployment, restricted migration levels, on-shoring of work and the competitive talent market, may also have an adverse impact on attracting specialist skills for the Group. • Changes to the critical accounting assumptions and estimates (outlined in Note 1 to the financial statements in our 2024 Annual Report) could expose the Group to losses greater than those anticipated or recognised, which could adversely affect our financial performance, financial condition and reputation. |

| 332 WESTPAC GROUP 2024 ANNUAL REPORT RISK FACTORS Limitation on Independent Registered Public Accounting Firm’s Liability The liability of PricewaterhouseCoopers (an Australian partnership which we refer to as PwC Australia), with respect to claims arising out of its audit report included in this Annual Report, is subject to the limitations set forth in the Professional Standards Act 1994 of New South Wales, Australia, as amended (the Professional Standards Act) and Chartered Accountants Australia and New Zealand (NSW) scheme adopted by Chartered Accountants Australia and New Zealand and approved by the New South Wales Professional Standards Council pursuant to the Professional Standards Act (the NSW Accountants Scheme). For matters occurring on or prior to 8 October 2019, the liability of PwC Australia may be subject to the limitations set forth in predecessor schemes. The current NSW Accountants Scheme expires on 12 July 2025 unless further extended or replaced. The Professional Standards Act and the NSW Accountants Scheme may limit the liability of PwC Australia for damages with respect to certain civil claims arising in, or governed by the laws of, New South Wales directly or vicariously from anything done or omitted to be done in the performance of its professional services for us, including, without limitation, its audits of our financial statements. The extent of the limitation depends on the timing of the relevant matter and in relation to matters occurring on or after 8 October 2013, is a maximum liability for audit work of A$75 million. The limitations do not apply to claims for breach of trust, fraud or dishonesty. In addition, there is equivalent professional standards legislation in place in other states and territories in Australia and amendments have been made to a number of Australian federal statutes to limit liability under those statutes to the same extent as liability is limited under state and territory laws by professional standards legislation. Accordingly, liability for acts or omissions by PwC Australia in Australian states or territories other than New South Wales may be limited in a manner similar to that in New South Wales. These limitations of liability may limit recovery upon the enforcement in Australian courts of any judgment under US or other foreign laws rendered against PwC Australia based on or related to its audit report on our financial statements. Substantially all of PwC Australia’s assets are located in Australia. However, the Professional Standards Act and the NSW Accountants Scheme have not been subject to extensive judicial consideration and therefore how the limitation might be applied by the courts and the effect of the limitation remain untested in a number of respects, including its effect in respect of the enforcement of foreign judgments. |
| FINANCIAL STATEMENTS EXHIBITS INDEX STRATEGIC REVIEW PERFORMANCE REVIEW SHAREHOLDER INFORMATION 333 FINANCIAL STATEMENTS The financial statements section is presented on pages 1- 126. |

| 334 WESTPAC GROUP 2024 ANNUAL REPORT SHAREHOLDER INFORMATION SHAREHOLDING INFORMATION ADDITIONAL INFORMATION GLOSSARY OF ABBREVIATIONS AND DEFINED TERMS EXHIBIT 16.1 |

| FINANCIAL STATEMENTS EXHIBITS INDEX STRATEGIC REVIEW PERFORMANCE REVIEW SHAREHOLDER INFORMATION 335 SHAREHOLDING INFORMATION Westpac ordinary shares Top 20 ordinary shareholders as at 30 September 2024 Number of Fully Paid Ordinary Shares % Held HSBC Custody Nominees (Australia) Limited 866,714,876 25.18 J P Morgan Nominees Australia Pty Limited 512,401,798 14.89 Citicorp Nominees Pty Limited 228,997,948 6.65 BNP Paribas Nominees Pty Ltd <Agency Lending A/C> 61,463,468 1.79 National Nominees Limited 40,456,973 1.18 BNP Paribas NOMS Pty Ltd 26,864,218 0.78 HSBC Custody Nominees (Australia) Limited <NT-Comnwlth Super Corp A/C> 25,113,326 0.73 Citicorp Nominees Pty Limited <Colonial First State Inv A/C> 24,642,154 0.72 Pacific Custodians Pty Limited <WBC Plans Ctrl A/C> 18,679,841 0.54 Netwealth Investments Limited <Wrap Services A/C> 16,586,728 0.48 BNP Paribas Nominees Pty Ltd <HUB24 Custodial Serv Ltd> 15,361,493 0.45 Australian Foundation Investment Company Limited 13,282,500 0.39 Argo Investments Limited 8,807,648 0.26 IOOF Investment Services Limited <IPS Superfund A/C> 7,692,979 0.22 IOOF Investment Services Limited <IOOF IDPS A/C> 6,213,315 0.18 BNP Paribas NOMS (NZ) Ltd 5,652,649 0.16 UBS Nominees Pty Ltd 4,240,536 0.12 Washington H Soul Pattinson and Company Limited 3,953,000 0.11 Netwealth Investments Limited <Super Services A/C> 3,642,054 0.11 Mutual Trust Pty Ltd 3,401,970 0.10 Total of Top 20 registered shareholdersa 1,894,169,474 55.04 a. As recorded on the holder register by holder reference number. As at 30 September 2024, there were 585,176 holders of our ordinary shares compared to 654,993 in 2023 and 672,589 in 2022. Ordinary shareholders with a registered address in Australia held approximately 96% of our fully paid share capital at 30 September 2024 (approximately 98% in 2023 and 2022). Substantial shareholders as at 30 September 2024 As at 30 September 2024, BlackRock Group (comprised of BlackRock Inc. and its subsidiaries), State Street Corporation (comprised of State Street Corporation and its subsidiaries), and The Vanguard Group (comprised of The Vanguard Group, Inc. and its controlled entities) had a ‘substantial holding’ of our shares within the meaning of the Corporations Act. A person has a substantial holding of our shares if the total votes attached to our voting shares in which they or their associates have relevant interests is 5% or more of the total number of votes attached to all our voting shares. The above table of the Top 20 ordinary shareholders includes shareholders that may hold shares for the benefit of third parties. BlackRock Group has been a substantial shareholder since 4 April 2017 (221,964,794 equity securities as at 24 March 2020). State Street Corporation has been a substantial shareholder since 20 July 2022 (226,119,322 equity securities as at 6 August 2024). The Vanguard Group has been a substantial shareholder since 12 May 2022 (175,093,754 equity securities as at 12 May 2022). Control of registrant We are not directly or indirectly owned or controlled by any other corporation(s) or by any foreign government. Refer to the section ‘Exchange controls and other limitations affecting security holders’, which provides information on the Foreign Acquisitions and Takeovers Act 1975, Corporations Act 2001 and Financial Sector (Shareholdings) Act 1998, which impose limits on equity holdings. At 30 September 2024, our Directors and Executive Officers owned beneficially, directly or indirectly, an aggregate of 1,346,433 (0.0391%) of the fully paid ordinary shares outstanding. |
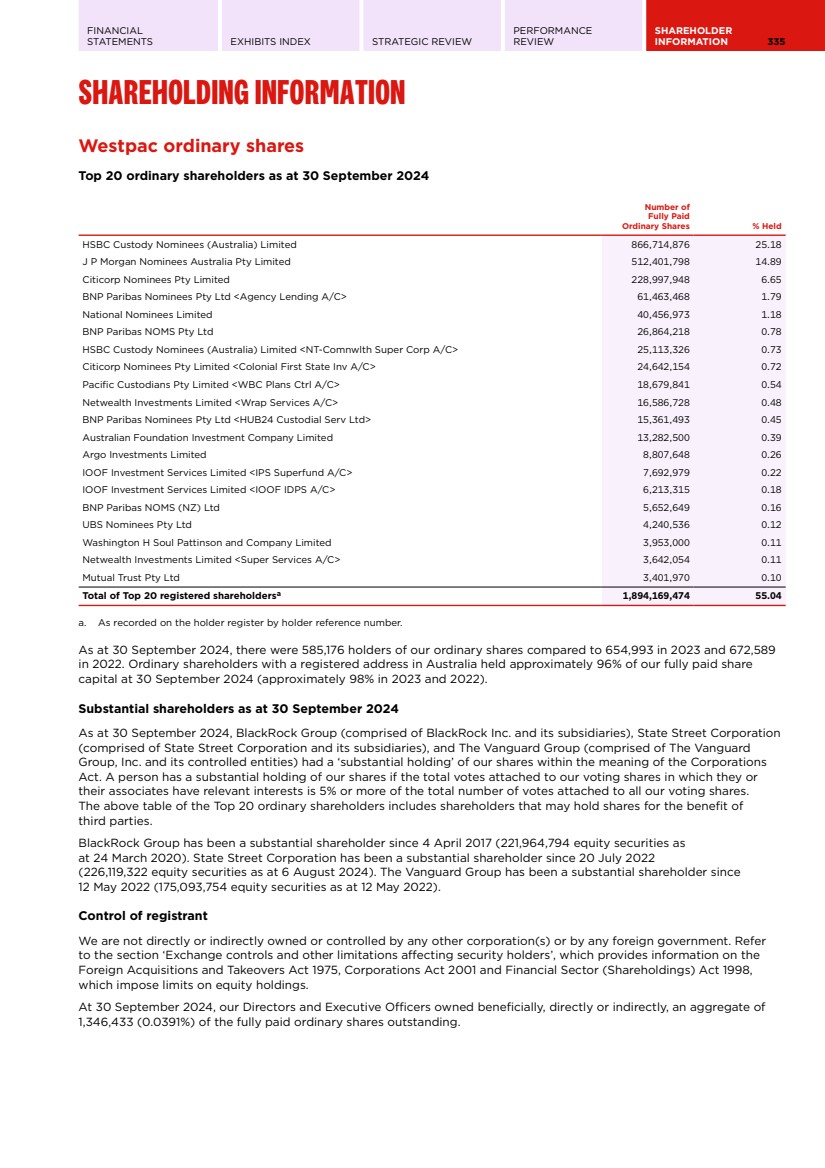
| 336 WESTPAC GROUP 2024 ANNUAL REPORT SHAREHOLDING INFORMATION Westpac ordinary shares (Continued) Analysis by range of holdings of ordinary shares as at 30 September 2024 Number of Shares Number of Holders of Fully Paid Ordinary Shares % Number of Fully Paid Ordinary Shares % Number of Holders of Share Options and Rights 1 – 1,000 324,370 55.43 120,246,358 3.49% 25,245 1,001 – 5,000 196,200 33.53 456,959,625 13.28% 302 5,001 – 10,000 38,295 6.54 270,031,632 7.85% 69 10,001 – 100,000 25,674 4.39 541,512,959 15.73% 126 100,001 and over 637 0.11 2,052,660,787 59.65% 19 Totals 585,176 100.00 3,441,411,361 100.00% 25,761 There were 13,025 shareholders holding less than a marketable parcel ($500) based on a market price of $31.72 per share at the close of trading on 30 September 2024. Voting rights of ordinary shares Holders of our fully paid ordinary shares have, at general meetings (including special general meetings), one vote on a show of hands and, upon a poll, one vote for each fully paid ordinary share held by them. Westpac Capital Notes 5 Top 20 holders of Westpac Capital Notes 5 as at 30 September 2024 Number of Westpac Capital Notes 5 % Held HSBC Custody Nominees (Australia) Limited 1,161,069 6.87 Citicorp Nominees Pty Limited 778,985 4.61 BNP Paribas Nominees Pty Ltd <HUB24 Custodial Serv Ltd> 595,158 3.52 Citicorp Nominees Pty Limited <143212 NMMT Ltd A/C> 451,386 2.67 Netwealth Investments Limited <Wrap Services A/C> 363,648 2.15 IOOF Investment Services Limited <IPS Superfund A/C> 303,810 1.80 Diocese Development Fund - Catholic Diocese of Parramatta 269,486 1.59 BNP Paribas Nominees Pty Ltd <Agency Lending A/C> 266,827 1.58 HSBC Custody Nominees (Australia) Limited - A/C 2 263,906 1.56 IOOF Investment Services Limited <IOOF IDPS A/C> 143,762 0.85 Mutual Trust Pty Ltd 116,141 0.69 BNP Paribas Nominees Pty Ltd <Pitcher Partners> 115,255 0.68 Dimbulu Pty Ltd 100,000 0.59 Netwealth Investments Limited <Super Services A/C> 88,844 0.53 J P Morgan Nominees Australia Pty Limited 87,466 0.52 Marrosan Investments Pty Ltd 85,000 0.50 Royal Freemasons' Benevolent Institution 60,000 0.35 Mrs Linda Anne Van Lieshout 60,000 0.35 Harriette & Co Pty Ltd <Harriette Investment A/C> 50,000 0.30 HSBC Custody Nominees (Australia) Limited-GSI EDA 50,000 0.30 Total of Top 20 registered shareholdersa 5,410,743 32.01 a. As recorded on the holder register by holder reference number. |
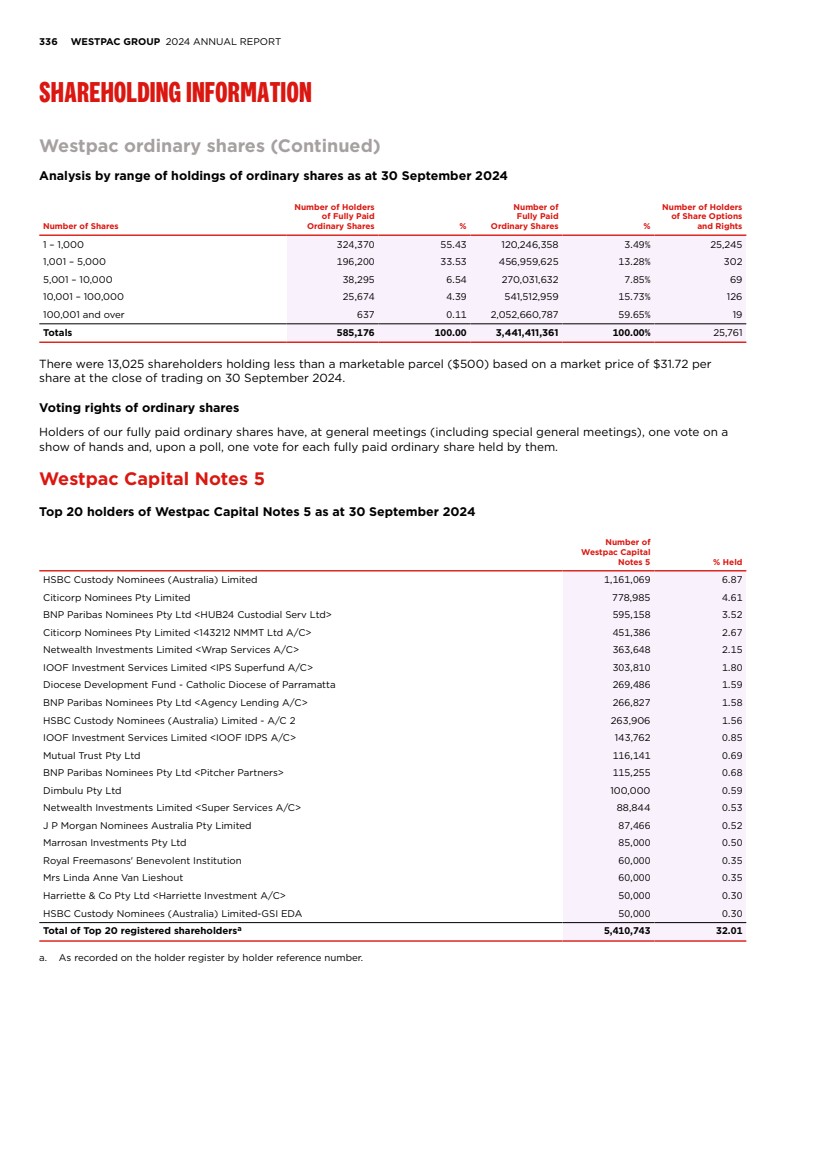
| FINANCIAL STATEMENTS EXHIBITS INDEX STRATEGIC REVIEW PERFORMANCE REVIEW SHAREHOLDER INFORMATION 337 Westpac Capital Notes 5 (Continued) Analysis by range of holdings of Westpac Capital Notes 5 as at 30 September 2024 Number of Shares Number of Holders of Westpac Capital Notes 5 % Number of Westpac Capital Notes 5 % 1 – 1,000 14,918 87.68 5,264,016 31.14 1,001 – 5,000 1,861 10.94 3,866,674 22.88 5,001 – 10,000 147 0.86 1,103,434 6.53 10,001 – 100,000 77 0.45 1,839,826 10.88 100,001 and over 12 0.07 4,829,433 28.57 Totals 17,015 100.00 16,903,383 100.00 There were 9 security holders holding less than a marketable parcel ($500) of Westpac Capital Notes 5 based on a market price of $102.000 at the close of trading on 30 September 2024. Westpac Capital Notes 7 Top 20 holders of Westpac Capital Notes 7 as at 30 September 2024 Number of Westpac Capital Notes 7 % Held Citicorp Nominees Pty Limited 1,216,633 7.06 HSBC Custody Nominees (Australia) Limited 1,023,243 5.94 Citicorp Nominees Pty Limited <143212 NMMT Ltd A/C> 446,552 2.59 BNP Paribas Nominees Pty Ltd <HUB24 Custodial Serv Ltd> 411,294 2.39 BNP Paribas Nominees Pty Ltd <Agency Lending A/C> 379,896 2.20 Netwealth Investments Limited <Wrap Services A/C> 297,364 1.73 Mutual Trust Pty Ltd 267,561 1.55 HSBC Custody Nominees (Australia) Limited-GSI EDA 170,000 0.99 Dimbulu Pty Ltd 150,000 0.87 Netwealth Investments Limited <Super Services A/C> 135,150 0.78 HSBC Custody Nominees (Australia) Limited - A/C 2 130,658 0.76 Marrosan Investments Pty Ltd 110,000 0.64 IOOF Investment Services Limited <IPS Superfund A/C> 105,971 0.61 Bond Street Custodians Limited <BENQLD - D79772 A/C> 100,000 0.58 BNP Paribas Nominees Pty Ltd <Pitcher Partners> 97,800 0.57 BNP Paribas NOMS Pty Ltd 83,460 0.48 IOOF Investment Services Limited <IOOF IDPS A/C> 80,376 0.47 J P Morgan Nominees Australia Pty Limited 65,674 0.38 V S Access Pty Ltd <V S Access A/C> 64,624 0.38 Eastcote Pty Ltd <The Van-Lieshout Family A/C> 61,619 0.36 Total of Top 20 registered shareholdersa 5,397,875 31.33 a. As recorded on the holder register by holder reference number. Analysis by range of holdings of Westpac Capital Notes 7 as at 30 September 2024 Number of Shares Number of Holders of Westpac Capital Notes 7 % Number of Westpac Capital Notes 7 % 1 – 1,000 15,883 88.48 5,551,257 32.22 1,001 – 5,000 1,853 10.32 3,948,083 22.92 5,001 – 10,000 136 0.76 1,029,284 5.97 10,001 – 100,000 67 0.37 1,856,417 10.77 100,001 and over 13 0.07 4,844,322 28.12 Totals 17,952 100.00 17,229,363 100.00 There were 5 security holders holding less than a marketable parcel ($500) of Westpac Capital Notes 7 based on a market price of $104.000 at the close of trading on 30 September 2024. |
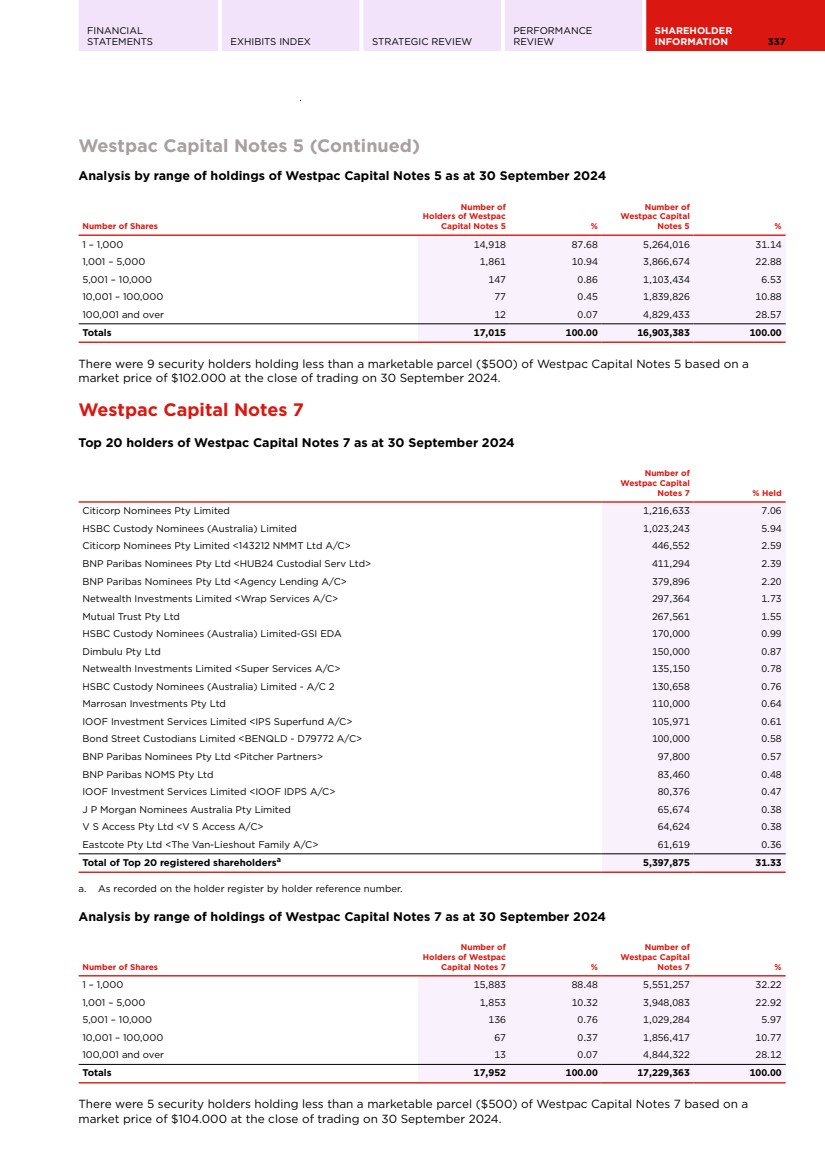
| 338 WESTPAC GROUP 2024 ANNUAL REPORT SHAREHOLDING INFORMATION Westpac Capital Notes 8 Top 20 holders of Westpac Capital Notes 8 as at 30 September 2024 Number of Westpac Capital Notes 8 % Held BNP Paribas Nominees Pty Ltd <Agency Lending A/C> 3,839,682 21.94 HSBC Custody Nominees (Australia) Limited 917,184 5.24 Citicorp Nominees Pty Limited 849,938 4.86 BNP Paribas Nominees Pty Ltd <HUB24 Custodial Serv Ltd> 343,873 1.96 Netwealth Investments Limited <Wrap Services A/C> 260,124 1.49 Dimbulu Pty Ltd 200,000 1.14 HSBC Custody Nominees (Australia) Limited - A/C 2 169,410 0.97 Mutual Trust Pty Ltd 164,908 0.94 IOOF Investment Services Limited <IPS Superfund A/C> 134,630 0.77 Netwealth Investments Limited <Super Services A/C> 103,856 0.59 IOOF Investment Services Limited <IOOF IDPS A/C> 98,535 0.56 BNP Paribas Nominees Pty Ltd <Pitcher Partners> 85,178 0.49 BNP Paribas Nominees Pty Ltd <IB Au Noms Retailclient> 72,993 0.42 J P Morgan Nominees Australia Pty Limited 69,554 0.40 Megt (Australia) Ltd 61,516 0.35 V S Access Pty Ltd <V S Access A/C> 52,220 0.30 National Nominees Limited 44,302 0.25 Invia Custodian Pty Limited <Wehi - Investment Pool A/C> 43,735 0.25 Adirel Holdings Pty Ltd 33,000 0.19 HSBC Custody Nominees (Australia) Limited-GSI EDA 30,000 0.17 Total of Top 20 registered shareholdersa 7,574,638 43.28 a. As recorded on the holder register by holder reference number. Analysis by range of holdings of Westpac Capital Notes 8 as at 30 September 2024 Number of Shares Number of Holders of Westpac Capital Notes 8 % Number of Westpac Capital Notes 8 % 1 – 1,000 14,188 88.32 4,961,867 28.35 1,001 – 5,000 1,690 10.52 3,346,140 19.12 5,001 – 10,000 125 0.78 921,320 5.26 10,001 – 100,000 51 0.32 1,287,068 7.36 100,001 and over 10 0.06 6,983,605 39.91 Totals 16,064 100.00 17,500,000 100.00 There were 4 security holders holding less than a marketable parcel ($500) of Westpac Capital Notes 8 based on a market price of $104.000 at the close of trading on 30 September 2024. |
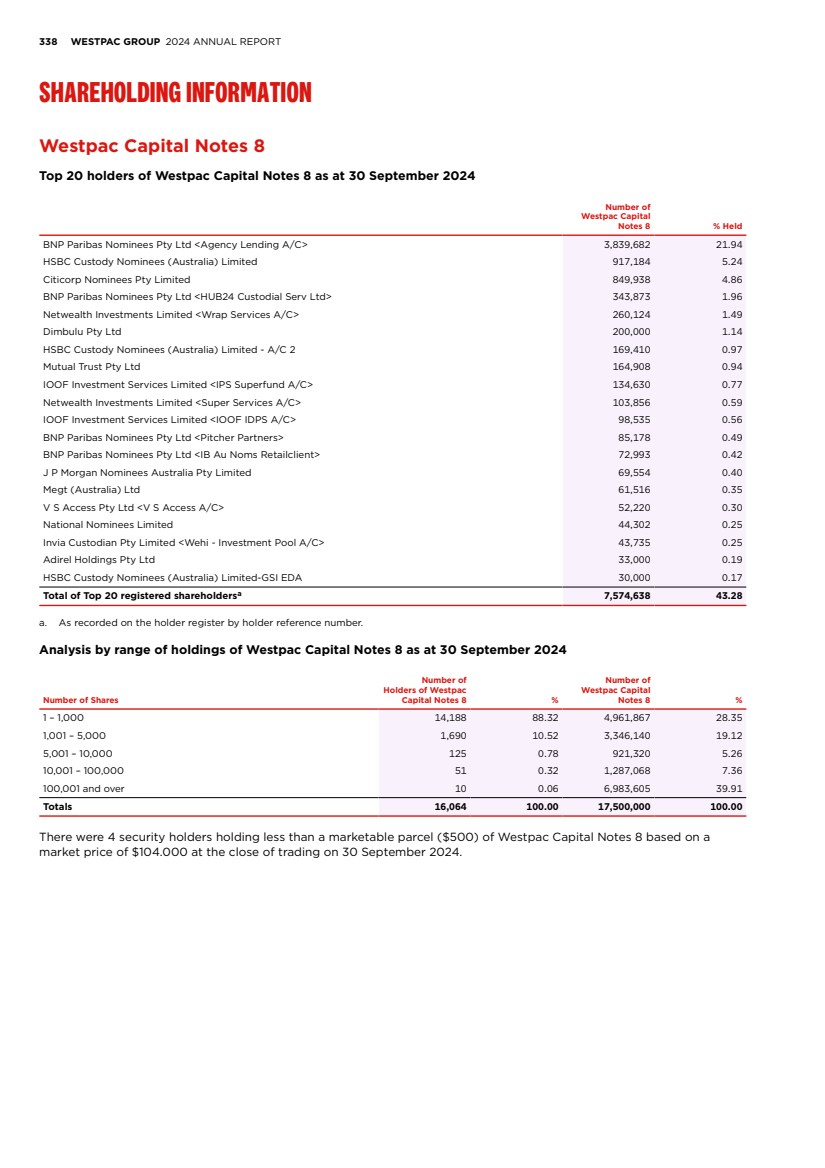
| FINANCIAL STATEMENTS EXHIBITS INDEX STRATEGIC REVIEW PERFORMANCE REVIEW SHAREHOLDER INFORMATION 339 Westpac Capital Notes 9 Top 20 holders of Westpac Capital Notes 9 as at 30 September 2024 Number of Westpac Capital Notes 9 % Held BNP Paribas Nominees Pty Ltd <Agency Lending A/C> 3,761,389 24.92 HSBC Custody Nominees (Australia) Limited 1,010,346 6.70 Citicorp Nominees Pty Limited 506,385 3.36 BNP Paribas Nominees Pty Ltd <HUB24 Custodial Serv Ltd> 486,150 3.22 Bond Street Custodians Limited <BENQLD - D79696 A/C> 275,000 1.82 Netwealth Investments Limited <Wrap Services A/C> 272,810 1.81 HSBC Custody Nominees (Australia) Limited - A/C 2 203,522 1.35 Netwealth Investments Limited <Super Services A/C> 174,063 1.15 BNP Paribas Nominees Pty Ltd <Pitcher Partners> 105,095 0.70 Dimbulu Pty Ltd 100,000 0.66 Royal Freemasons' Benevolent Institution 82,000 0.54 IOOF Investment Services Limited <IPS Superfund A/C> 73,886 0.49 Mutual Trust Pty Ltd 70,101 0.46 IOOF Investment Services Limited <IOOF IDPS A/C> 60,886 0.40 Marrosan Investments Pty Ltd 50,000 0.33 Bond Street Custodians Limited <BENQLD - D80279 A/C> 40,832 0.27 Pesutu Pty Ltd <Karedis Super A/C> 35,868 0.24 Sir Moses Montefiore Jewish Home <Income A/C> 30,000 0.20 HSBC Custody Nominees (Australia) Limited-GSI EDA 30,000 0.20 Morris Commercial P/L 30,000 0.20 Total of Top 20 registered shareholdersa 7,398,333 49.03 a. As recorded on the holder register by holder reference number. Analysis by range of holdings of Westpac Capital Notes 9 as at 30 September 2024 Number of Securities Number of Holders of Westpac Capital Notes 9 % Number of Westpac Capital Notes 9 % 1 – 1,000 9,261 86.62 3,684,371 24.41 1,001 – 5,000 1,276 11.94 2,683,000 17.78 5,001 – 10,000 96 0.90 705,832 4.68 10,001 – 100,000 49 0.46 1,222,917 8.10 100,001 and over 9 0.08 6,794,760 45.03 Totals 10,691 100.00 15,090,880 100.00 There were 4 security holders holding less than a marketable parcel ($500) of Westpac Capital Notes 9 based on a market price of $105.950 at the close of trading on 30 September 2024. |
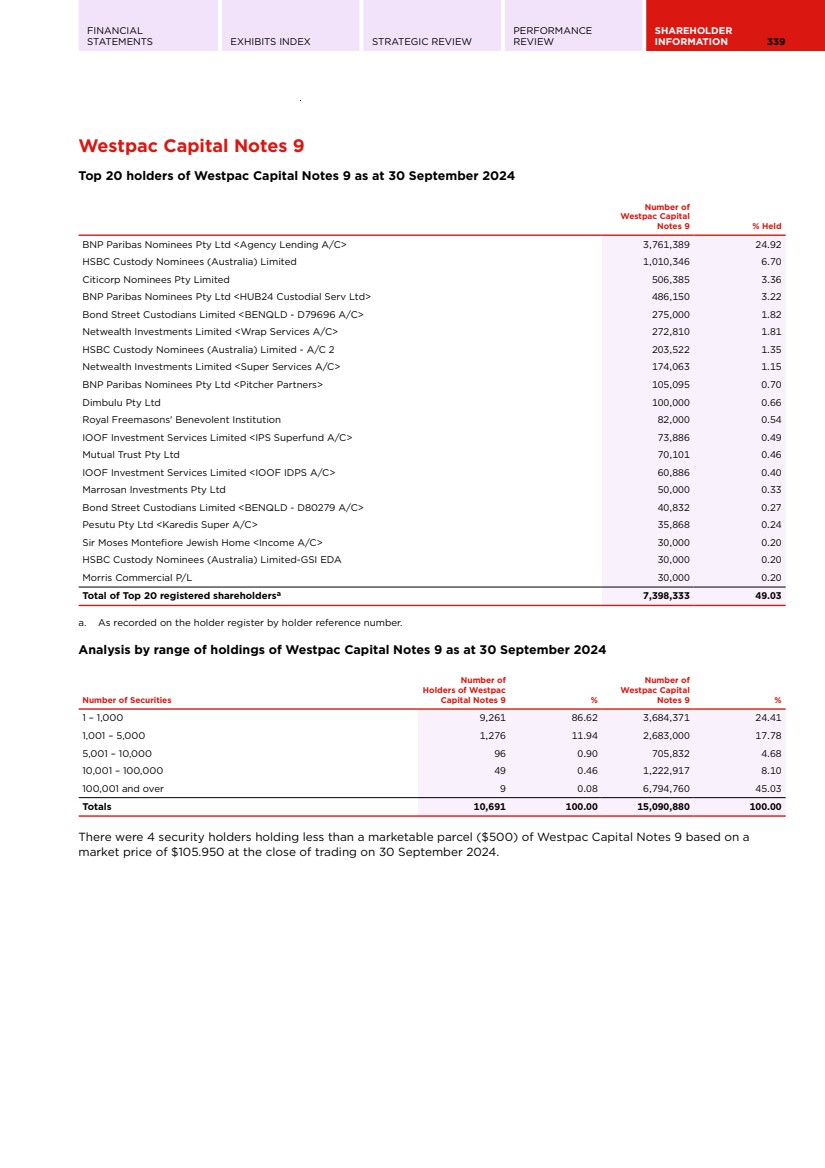
| 340 WESTPAC GROUP 2024 ANNUAL REPORT SHAREHOLDING INFORMATION Westpac Capital Notes 10 Top 20 holders of Westpac Capital Notes 10 as at 30 September 2024 Number of Westpac Capital Notes 10 % Held Citicorp Nominees Pty Limited 1,716,071 9.81 HSBC Custody Nominees (Australia) Limited 1,250,975 7.15 BNP Paribas Nominees Pty Ltd <HUB24 Custodial Serv Ltd> 590,188 3.37 HSBC Custody Nominees (Australia) Limited - A/C 2 485,184 2.77 Netwealth Investments Limited <Wrap Services A/C> 351,788 2.01 Bond Street Custodians Limited <BENQLD - D79696 A/C> 200,000 1.14 BNP Paribas Nominees Pty Ltd <Pitcher Partners> 145,774 0.83 Netwealth Investments Limited <Super Services A/C> 112,558 0.64 Elmore Super Pty Ltd <The Peabody Super Fund A/C> 105,900 0.61 IOOF Investment Services Limited <IPS Superfund A/C> 103,524 0.59 Dimbulu Pty Ltd 100,000 0.57 V S Access Pty Ltd <V S Access A/C> 90,000 0.51 Mutual Trust Pty Ltd 84,633 0.48 Tandom Pty Ltd 82,100 0.47 J P Morgan Nominees Australia Pty Limited 67,620 0.39 J C Family Investments Pty Limited <J Herrington Super Fund A/C> 54,007 0.31 IOOF Investment Services Limited <IOOF IDPS A/C> 53,953 0.31 National Nominees Limited 52,135 0.30 John E Gill Trading Pty Ltd 50,000 0.29 Willimbury Pty Ltd 50,000 0.29 Total of Top 20 registered shareholdersa 5,746,410 32.84 a. As recorded on the holder register by holder reference number. Analysis by range of holdings of Westpac Capital Notes 10 as at 30 September 2024 Number of Securities Number of Holders of Westpac Capital Notes 10 % Number of Westpac Capital Notes 10 % 1 – 1,000 12,017 83.91 4,807,424 27.47 1,001 – 5,000 2,040 14.24 4,327,745 24.73 5,001 – 10,000 175 1.22 1,308,087 7.47 10,001 – 100,000 80 0.56 1,994,782 11.40 100,001 and over 10 0.07 5,061,962 28.93 Totals 14,322 100.00 17,500,000 100.00 There were 2 security holders holding less than a marketable parcel ($500) of Westpac Capital Notes 10 based on a market price of $105.700 at the close of trading on 30 September 2024. Voting rights of Westpac Capital Notes 5, Westpac Capital Notes 7, Westpac Capital Notes 8, Westpac Capital Notes 9 and Westpac Capital Notes 10 In accordance with the terms of issue, holders of Westpac Capital Notes 5, Westpac Capital Notes 7, Westpac Capital Notes 8, Westpac Capital Notes 9 and Westpac Capital Note 10 have no right to vote at any general meeting of Westpac before conversion into Westpac ordinary shares. If conversion occurs (in accordance with the applicable terms of the relevant AT1 instrument), holders of Westpac Capital Notes 5, Westpac Capital Notes 7, Westpac Capital Notes 8, Westpac Capital Notes 9 or Westpac Capital Notes 10 (as applicable) will become holders of Westpac ordinary shares and have the voting rights that attach to Westpac ordinary shares. Unquoted securities Westpac also has the following unquoted securities on issue: USD 1.25 billion AT1 securities (comprised of 3 individual notes) which are all held by Cede & Co. as nominee for the Depository Trust Company. See Note 14 to the financial statements for further information. |
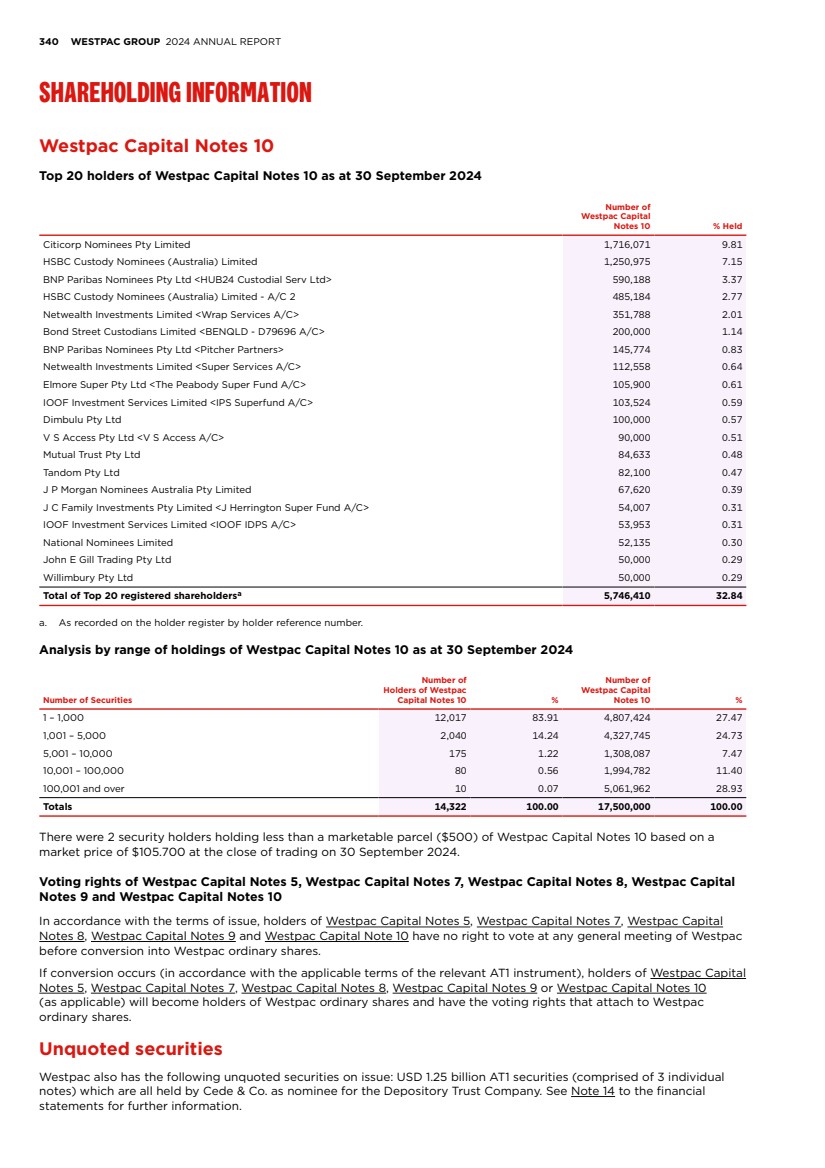
| FINANCIAL STATEMENTS EXHIBITS INDEX STRATEGIC REVIEW PERFORMANCE REVIEW SHAREHOLDER INFORMATION 341 Information on domicile Domicile1 of ordinary shareholders as at 30 September 2024 Number of Holders % of Holdings Number of Issued Shares and Options % of Issued Shares and Options Australia 562,624 96.15 3,394,137,598 98.63 New Zealand 19,050 3.26 35,405,288 1.03 United Kingdom 1,360 0.23 2,545,000 0.07 United States 488 0.08 1,252,391 0.04 Other overseas 1,654 0.28 8,071,084 0.23 Total 585,176 100.00 3,441,411,361 100.00 Domicile1 of holders of Westpac Capital Notes 5 as at 30 September 2024 Number of Holders % of Holdings Number of Issued Westpac Capital Notes 5 % of Issued Westpac Capital Notes 5 Australia 16,994 99.88 16,890,835 99.93 New Zealand 4 0.02 3,340 0.02 United Kingdom 6 0.04 2,473 0.01 United States 1 0.01 200 0.00 Other overseas 10 0.05 6,535 0.04 Total 17,015 100.00 16,903,383 100.00 Domicile1 of holders of Westpac Capital Notes 7 as at 30 September 2024 Number of Holders % of Holdings Number of Issued Westpac Capital Notes 7 % of Issued Westpac Capital Notes 7 Australia 17,933 99.89 17,218,279 99.94 New Zealand 3 0.02 1,460 0.01 United Kingdom 5 0.03 3,452 0.02 United States 3 0.02 1,242 0.01 Other overseas 8 0.04 4,930 0.02 Total 17,952 100.00 17,229,363 100.00 Domicile1 of holders of Westpac Capital Notes 8 as at 30 September 2024 Number of Holders % of Holdings Number of Issued Westpac Capital Notes 8 % of Issued Westpac Capital Notes 8 Australia 16,046 99.89 17,490,661 99.95 New Zealand 2 0.01 400 0.00 United Kingdom 2 0.01 2,040 0.01 United States 5 0.03 2,828 0.02 Other overseas 9 0.06 4,071 0.02 Total 16,064 100.00 17,500,000 100.00 Domicile1 of holders of Westpac Capital Notes 9 as at 30 September 2024 Number of Holders % of Holdings Number of Issued Westpac Capital Notes 9 % of Issued Westpac Capital Notes 9 Australia 10,683 99.93 15,082,056 99.94 New Zealand 0 0.00 0 0.00 United Kingdom 0 0.00 0 0.00 United States 2 0.01 1,100 0.01 Other overseas 6 0.06 7,724 0.05 Total 10,691 100.00 15,090,880 100.00 1. Based on registered address holder. |
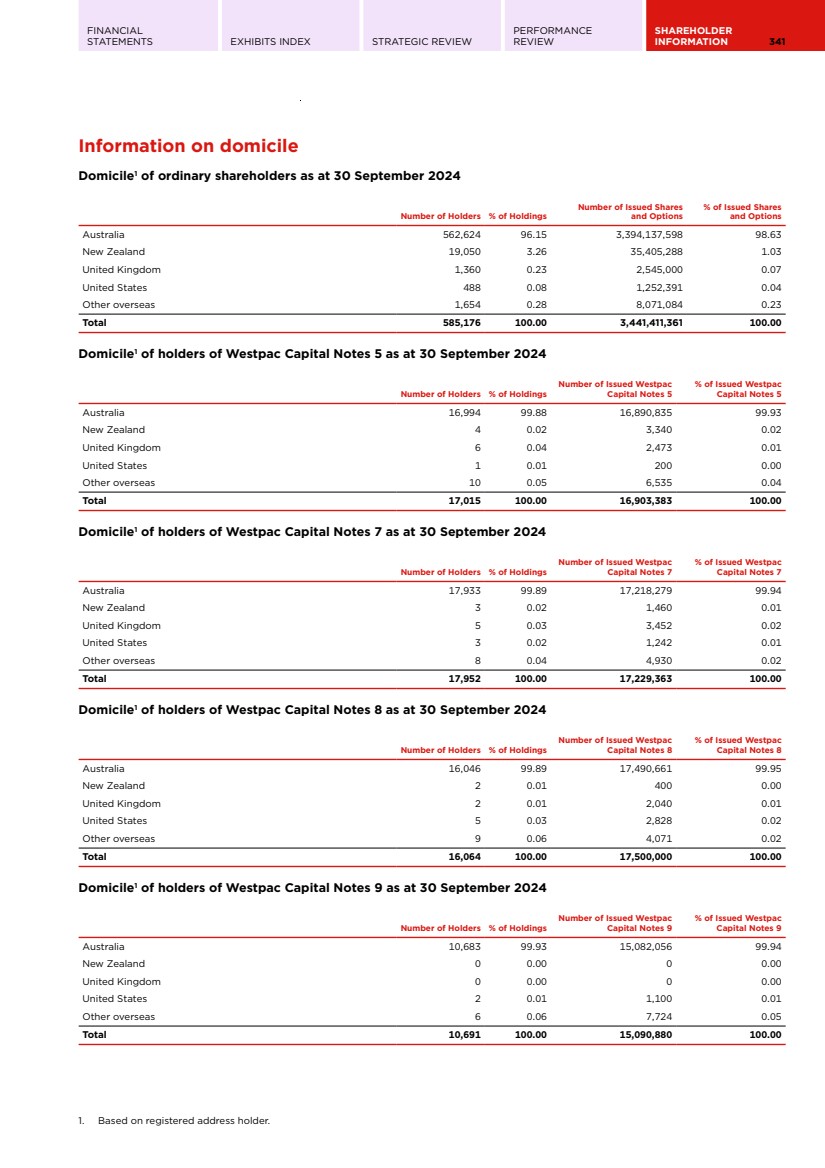
| 342 WESTPAC GROUP 2024 ANNUAL REPORT SHAREHOLDING INFORMATION Information on domicile (Continued) Domicile1 of holders of Westpac Capital Notes 10 as at 30 September 2024 Number of Holders % of Holdings Number of Issued Westpac Capital Notes 10 % of Issued Westpac Capital Notes 10 Australia 14,312 99.93 17,491,791 99.95 New Zealand 1 0.01 100 0.00 United Kingdom 1 0.01 382 0.00 United States 1 0.01 500 0.01 Other overseas 7 0.04 7,227 0.04 Total 14,322 100.00 17,500,000 100.00 Financial calendar Westpac shares are listed on the securities exchanges in Australia (ASX) and New Zealand (NZX). Westpac Capital Notes 5, Westpac Capital Notes 7, Westpac Capital Notes 8, Westpac Capital Notes 9 and Westpac Capital Notes 10 are listed on the ASX. Important dates to note are set out below, subject to change. Payment of any distribution, dividend or interest payment is subject to the relevant payment conditions and the key dates for each payment will be confirmed to the ASX for securities listed on the ASX. Westpac Ordinary Shares (ASX code: WBC, NZX code: WBC) Ex-dividend date for final dividend 7 November 2024 Record date for final dividend 8 November 2024 Annual General Meeting 13 December 2024 Final dividend payable 19 December 2024 First quarter update 17 February 2025 Financial Half Year end 31 March 2025 Interim Results and dividend announcement 5 May 2025 Ex-dividend date for interim dividend 8 May 2025 Record date for interim dividend 9 May 2025 Interim dividend payable 27 June 2025 Third quarter update 18 August 2025 Financial Year end 30 September 2025 Final Results and dividend announcement 3 November 2025 Ex-dividend date for final dividend 6 November 2025 Record date for final dividend 7 November 2025 Annual General Meeting 11 December 2025a Final dividend payable 19 December 2025 a. Details regarding the location of the meeting and the business to be dealt with will be contained in a Notice of Meeting sent to shareholders in November before the meeting. 1. Based on registered address holder. |
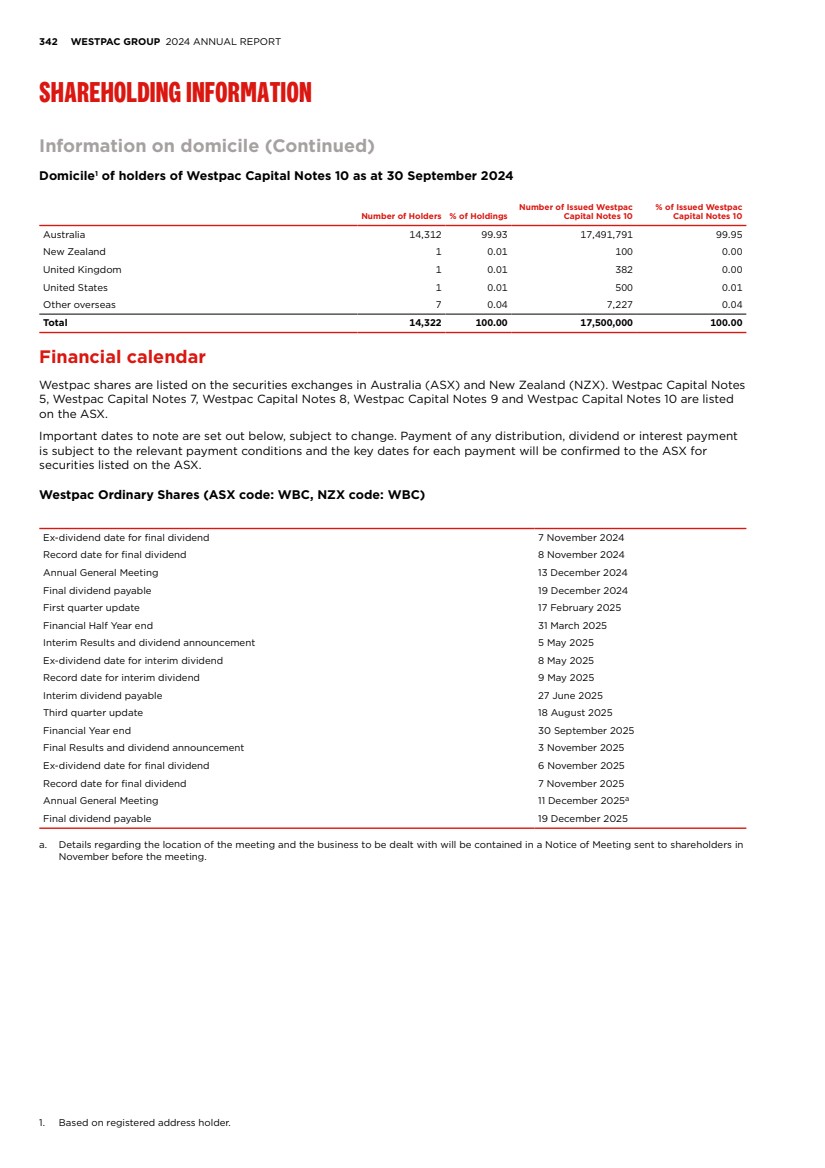
| FINANCIAL STATEMENTS EXHIBITS INDEX STRATEGIC REVIEW PERFORMANCE REVIEW SHAREHOLDER INFORMATION 343 Financial calendar (Continued) Westpac Capital Notes 5 (ASX code: WBCPH) Ex-date for quarterly distribution 12 December 2024 Record date for quarterly distribution 13 December 2024a Payment date for quarterly distribution 23 December 2024b Ex-date for quarterly distribution 13 March 2025 Record date for quarterly distribution 14 March 2025 Payment date for quarterly distribution 24 March 2025b Ex-date for quarterly distribution 12 June 2025 Record date for quarterly distribution 13 June 2025a Payment date for quarterly distribution 23 June 2025b Ex-date for quarterly distribution 11 September 2025 Record date for quarterly distribution 12 September 2025a Payment date for quarterly distribution 22 September 2025 Ex-date for quarterly distribution 11 December 2025 Record date for quarterly distribution 12 December 2025a Payment date for quarterly distribution 22 December 2025 a. Adjusted to immediately preceding business day as record date falls on a non-ASX business day or a date on which banks are not open for general business in Sydney. b. Adjusted to next business day as payment date falls on a non-ASX business day or a date on which banks are not open for general business in Sydney. Westpac Capital Notes 7 (ASX code: WBCPJ) Ex-date for quarterly distribution 12 December 2024 Record date for quarterly distribution 13 December 2024a Payment date for quarterly distribution 23 December 2024b Ex-date for quarterly distribution 13 March 2025 Record date for quarterly distribution 14 March 2025 Payment date for quarterly distribution 24 March 2025b Ex-date for quarterly distribution 12 June 2025 Record date for quarterly distribution 13 June 2025a Payment date for quarterly distribution 23 June 2025b Ex-date for quarterly distribution 11 September 2025 Record date for quarterly distribution 12 September 2025a Payment date for quarterly distribution 22 September 2025 Ex-date for quarterly distribution 11 December 2025 Record date for quarterly distribution 12 December 2025a Payment date for quarterly distribution 22 December 2025 a. Adjusted to immediately preceding business day as record date falls on a non-ASX business day or a date on which banks are not open for general business in Sydney. b. Adjusted to next business day as payment date falls on a non-ASX business day or a date on which banks are not open for general business in Sydney. |
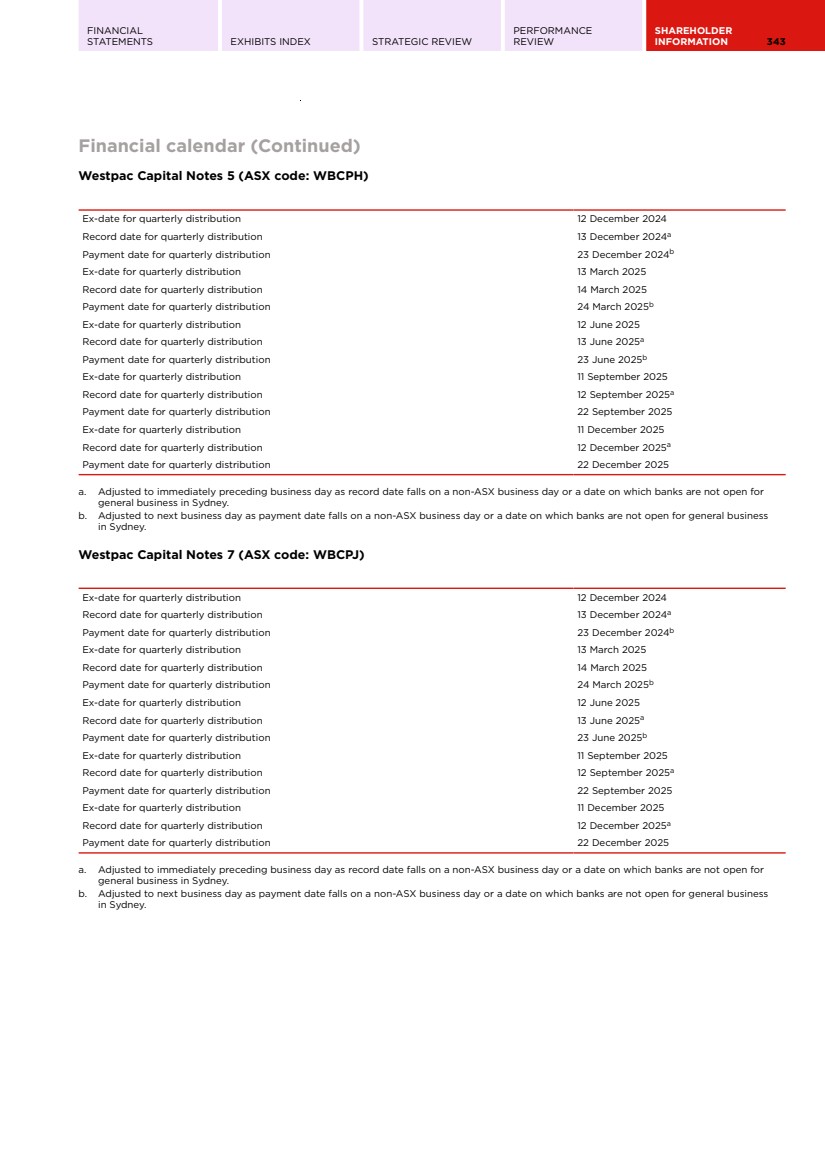
| 344 WESTPAC GROUP 2024 ANNUAL REPORT SHAREHOLDING INFORMATION Financial calendar (Continued) Westpac Capital Notes 8 (ASX code: WBCPK) Ex-date for quarterly distribution 12 December 2024 Record date for quarterly distribution 13 December 2024 Payment date for quarterly distribution 23 December 2024a Ex-date for quarterly distribution 12 March 2025 Record date for quarterly distribution 13 March 2025 Payment date for quarterly distribution 21 March 2025 Ex-date for quarterly distribution 12 June 2025 Record date for quarterly distribution 13 June 2025 Payment date for quarterly distribution 23 June 2025a Ex-date for quarterly distribution 11 September 2025 Record date for quarterly distribution 12 September 2025b Payment date for quarterly distribution 22 September 2025a Ex-date for quarterly distribution 11 December 2025 Record date for quarterly distribution 12 December 2025b Payment for quarterly distribution 22 December 2025a a. Adjusted to next business day as payment date falls on a non-ASX business day or a date on which banks are not open for general business in Sydney. b. Adjusted to immediately preceding business day as record date falls on a non-ASX business day or a date on which banks are not open for general business in Sydney. Westpac Capital Notes 9 (ASX code: WBCPL) Ex-date for quarterly distribution 12 December 2024 Record date for quarterly distribution 13 December 2024a Payment date for quarterly distribution 23 December 2024b Ex-date for quarterly distribution 13 March 2025 Record date for quarterly distribution 14 March 2025 Payment date for quarterly distribution 24 March 2025b Ex-date for quarterly distribution 12 June 2025 Record date for quarterly distribution 13 June 2025a Payment date for quarterly distribution 23 June 2025b Ex-date for quarterly distribution 11 September 2025 Record date for quarterly distribution 12 September 2025a Payment date for quarterly distribution 22 September 2025 Ex-date for quarterly distribution 11 December 2025 Record date for quarterly distribution 12 December 2025a Payment date for quarterly distribution 22 December 2025 a. Adjusted to immediately preceding business day as record date falls on a non-ASX business day or a date on which banks are not open for general business in Sydney. b. Adjusted to next business day as payment date falls on a non-ASX business day or a date on which banks are not open for general business in Sydney. |
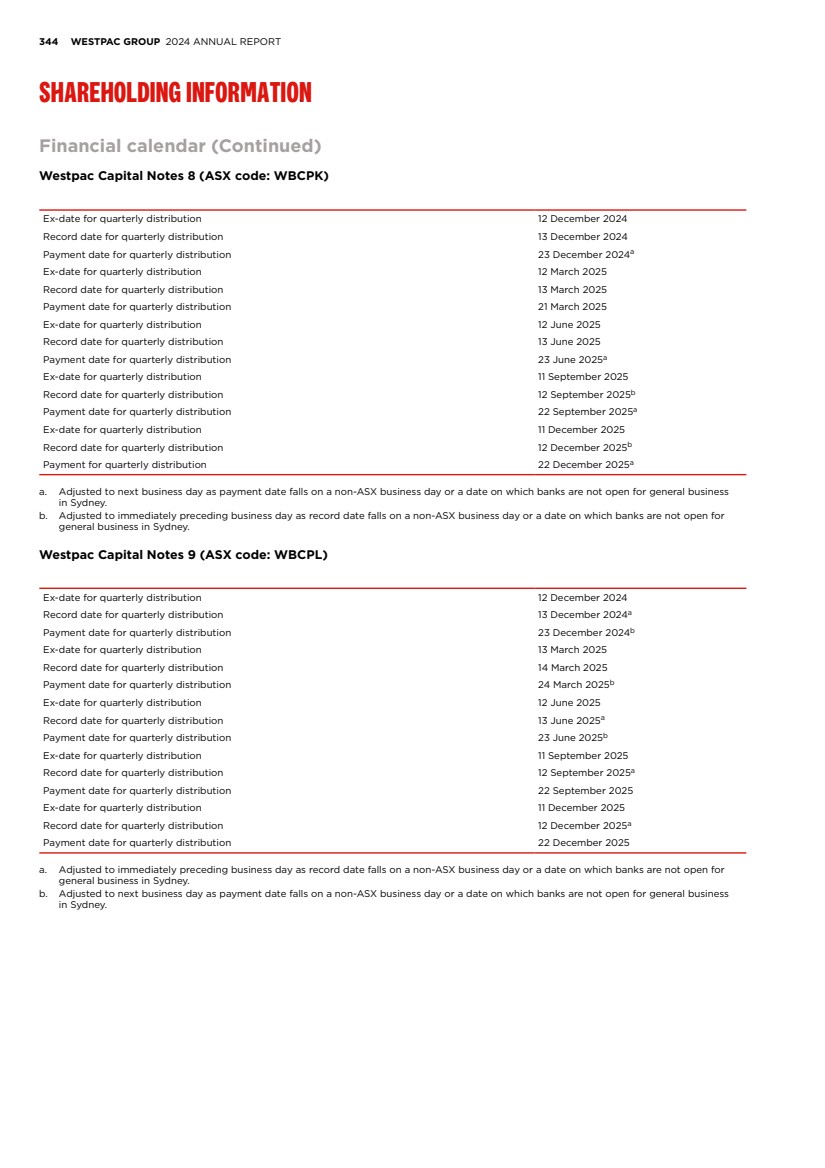
| FINANCIAL STATEMENTS EXHIBITS INDEX STRATEGIC REVIEW PERFORMANCE REVIEW SHAREHOLDER INFORMATION 345 Financial calendar (Continued) Westpac Capital Notes 10 (ASX code: WBCPM) Ex-date for quarterly distribution 12 December 2024 Record date for quarterly distribution 13 December 2024a Payment date for quarterly distribution 23 December 2024b Ex-date for quarterly distribution 13 March 2025 Record date for quarterly distribution 14 March 2025 Payment date for quarterly distribution 24 March 2025b Ex-date for quarterly distribution 12 June 2025 Record date for quarterly distribution 13 June 2025a Payment date for quarterly distribution 23 June 2025b Ex-date for quarterly distribution 11 September 2025 Record date for quarterly distribution 12 September 2025a Payment date for quarterly distribution 22 September 2025 Ex-date for quarterly distribution 11 December 2025 Record date for quarterly distribution 12 December 2025a Payment date for quarterly distribution 22 December 2025 a. Adjusted to immediately preceding business day as record date falls on a non-ASX business day or a date on which banks are not open for general business in Sydney. b. Adjusted to next business day as payment date falls on a non-ASX business day or a date on which banks are not open for general business in Sydney. |
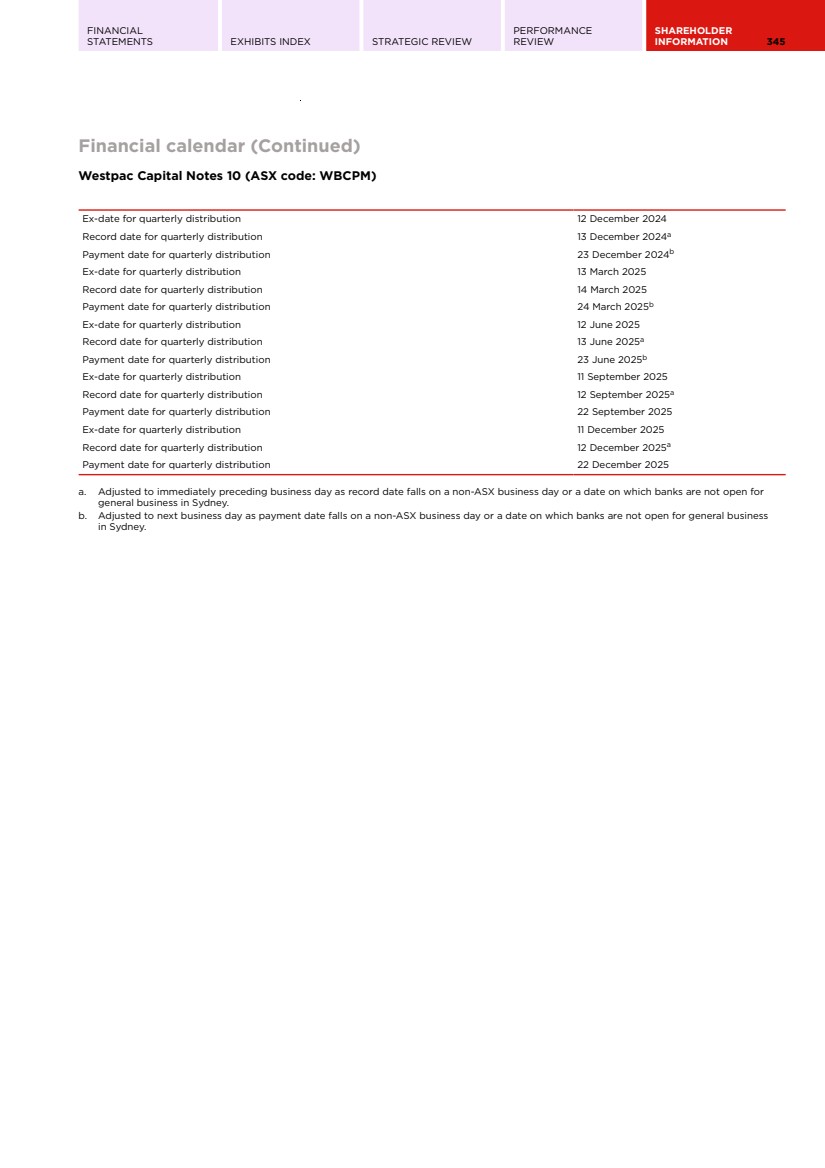
| 346 WESTPAC GROUP 2024 ANNUAL REPORT SHAREHOLDING INFORMATION Exchange controls and other limitations affecting security holders Australian exchange controls Australian laws control and regulate or permit the control and regulation of a broad range of payments and transactions involving non-residents of Australia. Pursuant to a number of exemptions, authorities and approvals, there are no general restrictions from transferring funds from Australia or placing funds to the credit of non-residents of Australia. However, Australian foreign exchange controls are implemented from time to time against prescribed countries, entities and persons. At the present time, these include: (a) withholding taxes in relation to remittances or dividends (to the extent they are unfranked) and interest payments; (b) the financial sanctions administered by the Department of Foreign Affairs and Trade (DFAT) in accordance with the Autonomous Sanctions Act 2011 (Cth) and the Autonomous Sanctions Regulations 2011, specifically, in relation to transactions involving the transfer of funds or payments to, by the order of, or on behalf of individuals or entities designated by the Minister of Foreign Affairs as published on the DFAT Sanctions Webpage (https://www.dfat.gov.au/ international-relations/security/sanctions); (c) the United Nations Security Council (UNSC) financial sanctions administered by DFAT, including: – Terrorist Asset Freezing Regime In accordance with the Charter of the United Nations Act 1945 (Cth) and the Charter of the United Nations (Dealings with Assets) Regulations 2008, a person is prohibited from using or dealing with funds, financial assets or economic resources of persons or entities listed as terrorists by the Minister for Foreign Affairs in the Commonwealth of Australia Gazette. It is also a criminal offence to make assets available to such persons or entities; and – Country-based sanctions Under the Charter of the United Nations Act 1945 and associated regulations, UNSC financial sanctions have been implemented. It is an offence to use or deal with funds, financial assets or economic resources of certain persons or entities associated with countries designated by the UNSC. It is also a criminal offence to make assets available to such persons or entities. Limitations affecting security holders The following Australian laws impose limitations on the right of non-residents or non-citizens of Australia to hold, own or vote Westpac shares. Foreign Acquisitions and Takeovers Act 1975 Acquisitions of interests in shares in Australian companies by foreign persons that meet certain thresholds are required to be notified to the Treasurer of Australia (through the Foreign Investment Review Board) and to obtain a no objections notification under the Foreign Acquisitions and Takeovers Act 1975 (Cth). That legislation applies to any acquisition by a foreign person, including a corporation or group of associated foreign persons, which results in ownership of 20% or more of the issued shares of an Australian company or the ability to control 20% or more of the total voting power. In addition, the legislation applies to any acquisition by a foreign government investor of 10% or more of the total voting power or ownership of an Australian company (or any interest if the foreign government investor acquires any control or influence– for example the right to appoint a director). Further, this lower 10% or control/influence threshold also applies to any acquisition by a foreign person, including a corporation or group of associated foreign persons, insofar as Westpac Banking Corporation owns or operates a critical banking asset as defined in the Security of Critical Infrastructure Act 2018 (Cth). The legislation requires any persons proposing to make any such acquisition to first notify the Treasurer of their intention to do so. Where such an acquisition has already occurred in the absence of a no objections notification, the Treasurer has the power to order divestment if he considers the acquisition to be contrary to Australia’s national interest. Financial Sector (Shareholdings) Act 1998 The Financial Sector (Shareholdings) Act 1998 (Cth) imposes restrictions on shareholdings in Australian financial sector companies (which includes Westpac). Under that legislation a person (including a corporation) may not hold more than a 20% ‘stake’ in a financial sector company without prior approval from the Treasurer of Australia. A person’s stake in a financial sector company is equal to the aggregate of the person’s voting power in the company and the voting power of the person’s associates. The concept of voting power is broadly defined. The Treasurer may approve a higher percentage stake if the Treasurer is satisfied that it is in the national interest to do so. In addition, even if a person’s stake in a financial sector company does not exceed the 20% limit, the Treasurer has the power to declare that a person has ‘practical control’ of a financial sector company and require the person to relinquish that control or reduce their stake in that company. Corporations Act 2001 The Corporations Act 2001 (Cth) prohibits any person (including a corporation) from acquiring a relevant interest in our voting shares if, after the acquisition, that person or any other person would be entitled to exercise more than 20% of the voting power in our shares. The prohibition is subject to certain limited exceptions. In addition, under the Corporations Act, a person is required to give a notice to us and to the ASX providing certain prescribed information, including their name, address and details of their relevant interests in our voting shares if they begin to have, or cease to have, a substantial holding in us, or if they already have a substantial holding and there is a movement of at least 1% in their holding. Such notice must, generally, be provided within two business days after the person becomes aware of that information. A person will have a substantial holding if the total votes attached to our voting shares in which they or their associates have relevant interests is 5% or more of the total number of votes attached to all our voting shares. The concepts of ‘associate’ and ‘relevant interest’ are |
| FINANCIAL STATEMENTS EXHIBITS INDEX STRATEGIC REVIEW PERFORMANCE REVIEW SHAREHOLDER INFORMATION 347 Exchange controls and other limitations affecting security holders (Continued) broadly defined in the Corporations Act and investors are advised to seek their own advice on their scope. In general terms, a person will have a relevant interest in a share if they: (a) are the holder of that share; (b) have power to exercise, or control the exercise of, a right to vote attached to that share; or (c) have power to dispose of, or control the exercise of a power to dispose of, that share. It does not matter how remote the relevant interest is or how it arises. If two or more persons can jointly exercise any one of these powers, each of them is taken to have that power. Nor does it matter that the power or control is express or implied, formal or informal, exercisable either alone or jointly with someone else. Enforceability of foreign judgments in Australia We are an Australian public corporation with limited liability. All of our Directors and Executive Officers reside outside the US. Substantially all or a substantial portion of the assets of all or many of such persons are located outside the US. As a result, it may not be possible for investors to effect service of process within the US upon such persons or to enforce against them judgments obtained in US courts predicated upon the civil liability provisions of the federal securities laws of the US. There may be doubt as to the enforceability in Australia, in original actions or in actions for enforcement of judgments of US courts, of civil liabilities predicated upon the federal securities laws of the US. Taxation Australian taxation The following discussion is a summary of certain Australian taxation implications of the ownership and disposition of ordinary shares for shareholders holding their shares on capital account. This discussion is based on the laws in force at the date of the Annual Report and the Convention between the Government of Australia and the Government of the United States of America for the Avoidance of Double Taxation and The Prevention of Fiscal Evasion with Respect to Taxes on Income (the Tax Treaty), and is subject to any changes in Australian law and any change in the Tax Treaty occurring after that date. This discussion is intended only as a descriptive summary and does not purport to be a complete analysis of all the potential Australian tax implications of owning and disposing of ordinary shares. The specific tax position of each investor will determine the applicable Australian income tax implications for that investor and we recommend that investors consult their own tax advisers concerning the implications of owning and disposing of ordinary shares. Taxation of dividends Under the Australian dividend imputation system, Australian tax paid at the company level is imputed (or allocated) to shareholders by means of imputation credits (also called franking credits) which attach to dividends paid by the company to the shareholder. Such dividends are termed ‘franked dividends’. When an Australian resident individual shareholder receives a franked dividend, the shareholder may be entitled, depending upon their particular circumstances, to a tax offset to the extent of the franking credits, which may be offset against the Australian income tax payable by the shareholder. An Australian resident shareholder may, in certain circumstances, be entitled to a refund of excess tax offsets. The extent to which a dividend is franked typically depends upon a company’s available franking credits at the time of payment of the dividend. Accordingly, a dividend paid to a shareholder may be wholly or partly franked or wholly unfranked. Fully franked dividends paid to non-resident shareholders are exempt from Australian dividend withholding tax. Dividends paid to a non-resident shareholder which are not fully franked are subject to dividend withholding tax at the rate of 30% (unless reduced by a double tax treaty) to the extent they are unfranked. In the case of residents of the US who are entitled to the benefits of the Tax Treaty and are beneficially entitled to the dividends, the rate is reduced to 15% under the Tax Treaty, provided the shares are not effectively connected with a permanent establishment or a fixed base of the non-resident in Australia through which the non-resident carries on business in Australia or provides independent personal services. In the case of residents of the US that have a permanent establishment or fixed base in Australia where the shares in respect of which the dividends are paid are attributable to that permanent establishment or fixed base, there is no dividend withholding tax. Rather, such dividends will be taxed on a net assessment basis and, where the dividends are franked, entitlement to a tax offset may arise. Fully franked dividends paid to non-resident shareholders and dividends that have been subject to dividend withholding tax should not be subject to any further Australian income tax. There are circumstances where a shareholder may not be entitled to the benefit of franking credits. The application of these rules depends upon the shareholder’s own circumstances, including the period during which the shares are held and the extent to which the shareholder is ‘at risk’ in relation to their shareholding. Gain or loss on disposition of shares Generally, any profit made by a resident shareholder on disposal of shares will be subject to capital gains tax. However, if the shareholder is regarded as a trader or speculator, or carries on a business of investing for profit, any profits may be taxed as ordinary income. A discount may be available on capital gains on shares held for 12 months or more by Australian resident individuals, trusts or complying superannuation entities. The discount is one half for individuals and trusts, and one third for complying superannuation entities. Companies are not eligible for the capital gains tax discount. For shares acquired prior to 21 September 1999, an alternative |
| 348 WESTPAC GROUP 2024 ANNUAL REPORT SHAREHOLDING INFORMATION Taxation (Continued) basis of calculation of the capital gain may be available which allows the use of an indexation formula. Normal rates of income tax would apply to capital gains so calculated. Any capital loss can only be offset against capital gains. Excess capital losses may be able to be carried forward for offset against future capital gains. Generally, subject to two exceptions, a non-resident disposing of shares in an Australian public company who holds those shares on capital account will be free from income tax in Australia. The main exceptions are: • shares held as part of a trade or business conducted through a permanent establishment in Australia. In such a case, any profit on disposal would be assessable to tax. Losses may give rise to capital losses or be otherwise deductible; and • shares held in companies where the shareholder and its associates have held at the time of disposal (or at least 12 months in the 24 months prior to disposal) a holding of 10% or more in the company and more than 50% of the company’s assets are represented by interests in Australian real property (which is unlikely to be the case for Westpac). In such a case, capital gains tax would apply. United States taxation The following discussion is a summary of certain US federal income tax implications of the ownership and disposition of ordinary shares by US holders (as defined below) that hold the ordinary shares as capital assets. This discussion is based on the US Internal Revenue Code of 1986, as amended, its legislative history, existing and proposed regulations, published rulings and court decisions, and the Tax Treaty, all as currently in effect and all of which are subject to change, possibly on a retroactive basis. This discussion is intended only as a descriptive summary. It does not purport to be a complete analysis of all the potential US federal income tax consequences of owning and disposing of ordinary shares and does not address US federal income tax considerations that may be relevant to US holders subject to special treatment under US federal income tax law (such as banks, insurance companies, real estate investment trusts, regulated investment companies, dealers in securities, brokers, tax-exempt entities, retirement plans, certain former citizens or residents of the US, persons holding ordinary shares as part of a straddle, hedge, conversion or other integrated transaction, persons that have a ‘functional currency’ other than the US dollar, persons that own 10% or more (by vote or value) of our stock, persons that generally mark their securities to market for US federal income tax purposes or persons that receive ordinary shares as compensation). As this is a complex area, we recommend investors consult their own tax advisers concerning the US federal, state and/or local implications of owning and disposing of ordinary shares. For the purposes of this discussion you are a US holder if you are a beneficial owner of ordinary shares and you are for US federal income tax purposes: • an individual who is a citizen or resident of the US; • a corporation created or organised in or under the laws of the US or any state thereof or the District of Columbia; • an estate, the income of which is subject to US federal income taxation regardless of its source; or • a trust, if a US court can exercise primary supervision over the trust’s administration and one or more US persons are authorised to control all substantial decisions of the trust, or certain electing trusts that were in existence on 19 August 1996 and were treated as domestic trusts on that date. If an entity treated as a partnership for US federal income tax purposes owns the ordinary shares, the US federal income tax implications of the ownership and disposition of ordinary shares will generally depend upon the status and activities of such partnership and its partners. Such an entity should consult its own tax adviser concerning the US federal income tax implications to it and its partners of owning and disposing of ordinary shares. Taxation of dividends If you are a US holder, you must include in your income as a dividend, the gross amount of any distributions paid by us out of our current or accumulated earnings and profits (as determined for US federal income tax purposes) without reduction for any Australian tax withheld from such distribution. We have not maintained and do not plan to maintain calculations of earnings and profits for US federal income tax purposes, and as a result, you may need to include the entire amount of any distribution in income as a dividend. If you are a non-corporate US holder, dividends paid to you that constitute qualified dividend income may be taxable to you at a preferential tax rate so long as certain holding period and other requirements are met. Dividends we pay with respect to the ordinary shares generally will be qualified dividend income so long as we are not a passive foreign investment company (PFIC) during the taxable year in which the dividend is paid or the preceding taxable year. Each non-corporate US holder should consult their own tax advisor regarding the possible applicability of the reduced tax rate and the related restrictions and special rules. Dividends paid by us constitute ordinary income that must generally be included in income when actually or constructively received. Such dividends will not be eligible for the dividends-received deduction generally allowed to corporate shareholders with respect to dividends received from US corporations. The amount of the dividend that you must include in your income as a US holder will be the US dollar value of the Australian dollar payments made, determined at the spot Australian dollar/US dollar rate on the date the dividend distribution is included in your income, regardless of whether the payment is in fact converted into US dollars. Generally, any gain or loss resulting from currency exchange fluctuations during the period from the date you include the dividend payment in income to the date you convert the payment into US dollars will be treated as ordinary income or loss and will not be eligible for the special tax rate applicable to qualified dividend income. This gain or loss generally will be income from sources within the US for foreign tax credit limitation purposes. Distributions on an ordinary share in excess of current and accumulated earnings and |
| FINANCIAL STATEMENTS EXHIBITS INDEX STRATEGIC REVIEW PERFORMANCE REVIEW SHAREHOLDER INFORMATION 349 Taxation (Continued) profits, as determined for US federal income tax purposes, will be treated as a non-taxable return of capital to the extent of your basis in such ordinary share and thereafter as capital gain. Subject to certain limitations, Australian tax withheld in accordance with the Tax Treaty and paid over to Australia may be claimed as a foreign tax credit against your US federal income tax liability. Special rules apply in determining the foreign tax credit limitation with respect to dividends that are subject to a preferential tax rate. A US holder that does not elect to claim a US foreign tax credit for Australian income tax withheld may instead claim a deduction for such withheld tax, but only for a taxable year in which the US holder elects to do so with respect to all non-US income taxes paid or accrued in such taxable year. Dividends paid by us generally will be income from sources outside the US for foreign tax credit limitation purposes. Under the foreign tax credit rules, dividends may, depending on your circumstances, generally be ‘passive category’ or ‘general category’ income for purposes of computing the foreign tax credit. The rules relating to US foreign tax credits are very complex, and each US holder should consult its own tax adviser regarding the application of such rules. Taxation of capital gains If you sell, exchange or otherwise dispose of your ordinary shares, you will generally recognise a capital gain or loss for US federal income tax purposes equal to the difference between the US dollar value of the amount that you realise and your tax basis, determined in US dollars, in your ordinary shares. A capital gain of a non-corporate US holder is generally taxed at a reduced rate if the holder has a holding period greater than one year. The deductibility of capital losses is subject to limitations. Such capital gain or loss generally will be income from sources within the US, for foreign tax credit limitation purposes. Medicare tax In addition to regular US federal income tax, certain US holders that are individuals, estates or trusts are subject to a 3.8% tax on all or a portion of their ‘net investment income’, which may include all or a portion of their dividend income and net gain from the sale, exchange or other disposition of their ordinary shares. Passive foreign investment company considerations We believe that we will not be treated as a passive foreign investment company (PFIC) for US federal income tax purposes, and this discussion assumes we are not a PFIC. However, the determination as to whether we are a PFIC is made annually at the end of each taxable year and therefore could change. If we were to be treated as a PFIC, a US holder of ordinary shares could be subject to certain adverse tax consequences. Disclosure requirements for specified foreign financial assets Individual US holders (and certain US entities specified in US Internal Revenue Service (IRS) guidance) who, during any taxable year, hold any interest in any specified foreign financial asset, generally will be required to file with their US federal income tax returns certain information on IRS Form 8938 if the aggregate value of all such assets exceeds certain specified amounts. ‘Specified foreign financial asset’ generally includes any financial account maintained with a non-US financial institution and may also include the ordinary shares if they are not held in an account maintained with a financial institution. Substantial penalties may be imposed, and the period of limitations on assessment and collection of US federal income taxes may be extended, in the event of a failure to comply. US holders should consult their own tax advisers as to the possible application to them of this filing requirement. Information reporting and backup withholding Under certain circumstances, information reporting and/or backup withholding may apply to US holders with respect to payments on or the proceeds from the sale, exchange or other disposition of the ordinary shares, unless an applicable exemption is satisfied. Backup withholding is not an additional tax. Any amounts withheld under the backup withholding rules generally will be allowed as a refund or credit against a US holder’s US federal income tax liability if the required information is furnished by the US holder on a timely basis to the IRS. |
| 350 WESTPAC GROUP 2024 ANNUAL REPORT ADDITIONAL INFORMATION Overview We were incorporated in 1850 under the Bank of New South Wales Act 1850 (NSW), a special piece of legislation passed by the New South Wales Parliament at a time when there was no general companies’ legislation in Australia. On 23 August 2002, Westpac became registered under the Corporations Act 2001 (Cth) (Corporations Act) as a public company limited by shares. As part of the process of becoming a company regulated under the Corporations Act, shareholders adopted a new constitution at the AGM on 15 December 2000, which came into operation on 23 August 2002. Our constitution has been subsequently amended by shareholders on 15 December 2005, 13 December 2007, 13 December 2012 and 15 December 2021. Our objects and purposes Our constitution does not contain a statement of our objects and purposes. As a company regulated by the Corporations Act, we have the legal capacity and powers of an individual both within and outside Australia, and all the powers of a body corporate, including the power to issue and cancel shares, to issue debentures, to distribute our property among our equity holders (either in kind or otherwise), to give security by charging our uncalled capital, to grant a floating charge over our property and to do any other act permitted by any law. Directors’ voting powers Under clause 9.11(a) of our constitution, subject to complying with the Corporations Act regarding disclosure of and voting on matters involving material personal interests, our Directors may: (a) hold any office or place of profit in our company, except that of auditor; (b) hold any office or place of profit in any other company, body corporate, trust or entity promoted by our company or in which it has an interest of any kind; (c) enter into any contract or arrangement with our company; (d)participate in any association, institution, fund, trust or scheme for past or present employees or Directors of our company or persons dependent on or connected with them; (e) act in a professional capacity (or be a member of a firm that acts in a professional capacity) for our company, except as auditor; and (f) participate in, vote on and be counted in a quorum for any meeting, resolution or decision of the Directors and be present at any meeting where any matter is being considered by the Directors. Under clause 9.11(b) of our constitution, a Director may do any of the above despite the fiduciary relationship of the Director’s office: (a) without any liability to account to our company for any direct or indirect benefit accruing to the Director; and (b) without affecting the validity of any contract or arrangement. Under the Corporations Act, however, a Director who has a material personal interest in any matter to be considered at any Board meeting must not be present while the matter is being considered or vote on the matter, unless the other Directors resolve to allow that Director to be present and vote or a declaration is made by ASIC permitting that Director to participate and vote. These restrictions do not apply to a limited range of matters set out in section 191(2) of the Corporations Act, where the Director’s interest: (a) arises because the Director is a shareholder of the company and is held in common with other shareholders; (b) arises in relation to the Director’s remuneration as a Director of the company; (c) relates to a contract the company is proposing to enter into that is subject to shareholder approval and will not impose obligations on the company if not approved by shareholders; (d) arises merely because the Director is a guarantor or has given an indemnity or security for all or part of a loan (or proposed loan) to the company; (e) arises merely because the Director has a right of subrogation in relation to a guarantee or indemnity referred to in (d); (f) relates to a contract that insures, or would insure, the Director against liabilities the Director incurs as an officer of the company (but only if the contract does not make the company or related body corporate the insurer); (g) relates to any payment by the company or a related body corporate in respect of certain indemnities permitted by the Corporations Act or any contract relating to such an indemnity; or (h) is in a contract or proposed contract with, or for the benefit of, or on behalf of, a related body corporate and arises merely because the Director is a Director of that related body corporate. If there are not enough Directors to form a quorum for the Board meeting because of Directors’ interests in a particular matter, a general meeting for shareholders may be called to consider the matter and interested Directors are entitled to vote on any proposal to requisition such a meeting. Under clause 9.7 of our constitution, the maximum aggregate amount of annual remuneration to be paid to our Non-Executive Directors must be approved by our shareholders. This aggregate amount is paid to the Non-Executive Directors in such manner as the Board from time to time determines. Directors’ remuneration is one of the exceptions under section 191 of the Corporations Act to the prohibitions against being present and voting on any matter in which a Director has a material personal interest. Directors’ borrowing powers Clause 10.2 of our constitution empowers our Directors, as a Board, to exercise all the powers of Westpac to borrow or raise money, to charge any property or business of Westpac or all or any of its uncalled capital and to issue debentures or give any other security for a debt, |
| FINANCIAL STATEMENTS EXHIBITS INDEX STRATEGIC REVIEW PERFORMANCE REVIEW SHAREHOLDER INFORMATION 351 Our constitution (Continued) liability or obligation of Westpac or of any other person. Such powers may only be changed by amending the constitution, which requires a special resolution (that is, a resolution passed by at least 75% of the votes cast by members entitled to vote on the resolution and for which notice has been given in accordance with the Corporations Act). Minimum number of Directors Our constitution requires that the minimum number of Directors is determined in accordance with the Corporations Act or other regulations. Currently the Corporations Act prescribes three as a minimum number of Directors for a public company and APRA governance standards specify five as the minimum number of Directors for APRA regulated entities. Westpac’s current number of Directors is above these prescribed minimums. Share rights The rights attaching to our ordinary shares are set out in the Corporations Act and in our constitution, and may be summarised as follows: a. Profits and dividends Holders of ordinary shares are entitled to receive such dividends on those shares as may be determined by our Directors from time to time. Dividends that are paid but not claimed may be invested by our Directors for the benefit of Westpac until claimed or required to be dealt with in accordance with any law relating to unclaimed monies. Under the Corporations Act, Westpac must not pay a dividend unless our assets exceed our liabilities immediately before the dividend is declared and the excess is sufficient for payment of the dividend. In addition, the payment must be fair and reasonable to the company’s shareholders as a whole and must not materially prejudice our ability to pay our creditors. Subject to the Corporations Act, the constitution, the rights of persons (if any) entitled to shares with special rights to a dividend and any contrary terms of issue of or applying to any shares, our Directors may determine that a dividend is payable, fix the amount and the time for payment and authorise the payment or crediting by Westpac to, or at the direction of, each shareholder entitled to that dividend. If any dividends are returned unclaimed, we are generally obliged, under the Banking Act 1959 (Cth) (Banking Act), to hold those amounts as unclaimed monies for a period of seven years. If at the end of that period the monies remain unclaimed by the shareholder concerned, we must submit an annual unclaimed money return to ASIC by 31 March each year containing the unclaimed money as at 31 December of the previous year. Upon such payment being made, we are discharged from further liability in respect of that amount. Our Directors may, before paying any dividend, set aside out of our profits such sums as they think proper as reserves, to be applied, at the discretion of our Directors, for any purpose for which the profits may be properly applied. Our Directors may carry forward so much of the profits remaining as they consider ought not to be distributed as dividends without transferring those profits to a reserve. The following additional restrictions apply to our ability to declare and/or pay dividends: (i) if the payment of the dividend would breach or cause a breach by us of applicable capital adequacy or other supervisory requirements of APRA, including where Westpac’s Common Equity Tier 1 Capital Ratio falls within APRA’s capital conservation buffer range (consisting of the capital conservation buffer plus any countercyclical capital buffer, currently 5.75% of risk-weighted assets). Currently, one such requirement is that a dividend should not be paid without APRA’s prior consent if payment of that dividend, after taking into account all other dividends (if any) paid on our shares and payments on more senior capital instruments, in the preceding 12 consecutive months to which they relate, would cause the aggregate of such dividend payments to exceed our after tax earnings for the preceding 12 consecutive months, as reflected in our relevant audited consolidated financial statements; and (ii) if, under the Banking Act, we are directed by APRA not to pay a dividend; (iii)if the declaration or payment of the dividend would result in us becoming insolvent; or (iv)if any interest payment, dividend or distribution on certain Additional Tier 1 securities issued by us is not paid in accordance with the terms of those securities, we may be restricted from declaring and/or paying dividends on ordinary shares. This restriction is subject to a number of exceptions. b. Voting rights Holders of our fully paid ordinary shares have, at general meetings, one vote on a show of hands and, upon a poll, one vote for each fully paid share held by them. c. Voting and re-election of Directors Under our constitution, each Director, apart from the Managing Director, must not hold office without re-election past the third AGM following the Director’s appointment or last election, whichever is longer. A retiring Director holds office until the conclusion of the meeting at which that Director retires but is eligible for re-election at that meeting. In addition, there must be an election of Directors at each AGM. This is consistent with the requirements of the ASX Listing Rules. Under the Corporations Act, the election or re-election of each Director by shareholders at a general meeting of a public company must proceed as a separate item, unless the shareholders first resolve that the elections or re-elections may be voted on collectively. A resolution to allow collective voting in relation to elections or re-elections is effective only if no votes are cast against that resolution. Any resolution electing or re-electing two or more Directors in contravention of this requirement is void. d. Winding up Subject to any preferential entitlement of holders of preference shares on issue at the relevant time, holders |
| 352 WESTPAC GROUP 2024 ANNUAL REPORT ADDITIONAL INFORMATION Our constitution (Continued) of our ordinary shares are entitled to share equally in any surplus assets if we are wound up. e. Sinking fund provisions We do not have any class of shares on issue that is subject to any sinking fund provisions. Variation of rights attaching to our shares Under the Corporations Act, unless otherwise provided by the terms of issue of a class of shares, the terms of issue of a class of shares in Westpac can only be varied or cancelled in any way by a special resolution of Westpac and with either the written consent of our shareholders holding at least 75% of the votes in that class of shares or with the sanction of a special resolution passed at a separate meeting of the holders of that class of shares. Convening general meetings Under our constitution, our Directors may convene and arrange to hold a general meeting of Westpac whenever they think fit and must do so if required to do so under the Corporations Act and ASX Listing Rules. Under the Corporations Act, our Directors must call and arrange to hold a general meeting of Westpac if requested to do so by our shareholders who hold at least 5% of the votes that may be cast at the general meeting. Shareholders who hold at least 5% of the votes that may be cast at a general meeting may also call and arrange to hold a general meeting of Westpac at their own expense. At least 28 days notice must be given of a meeting of our shareholders. Written notice must be given to all shareholders entitled to attend and vote at the meeting. All ordinary shareholders are entitled to attend and, subject to the constitution and the Corporations Act, to vote at general meetings of Westpac. Limitations on securities ownership A number of limitations apply in relation to the ownership of our shares, and these are described in more detail in the section ‘Limitations affecting security holders’. Change in control restrictions Restrictions apply under the Corporations Act, the Financial Sector (Shareholdings) Act 1998 (Cth) and the Foreign Acquisitions and Takeovers Act 1975 (Cth). For more detailed descriptions of these restrictions, refer to the sections ‘Limitations affecting security holders’, ‘Foreign Acquisitions and Takeovers Act 1975’, ‘Financial Sector (Shareholdings) Act 1998’, and ‘Corporations Act 2001’. Substantial shareholder disclosure There is no provision in our constitution that requires a shareholder to disclose the extent of their ownership of our shares. Under the Corporations Act, however, any person who begins or ceases to have a substantial holding of our shares must notify us within two business days after they become aware of that information. A further notice must be given to us if there is an increase or decrease of 1% in a person’s substantial holding. Copies of these notices must also be given to the ASX. A person has a substantial holding of our shares if the total votes attached to our voting shares in which they or their associates have relevant interests is 5% or more of the total number of votes attached to all our voting shares. For more details, refer to the section ‘Corporations Act 2001’. We also have a statutory right under the Corporations Act to trace the beneficial ownership of our shares by giving a direction to a shareholder, or certain other persons, requiring disclosure to us of, among other things, their own relevant interest in our shares and the name and address of each other person who has a relevant interest in those shares, the nature and extent of that interest and the circumstances that gave rise to that other person’s interest. Such disclosure must, except in certain limited circumstances, be provided within two business days after the direction is received. |
| FINANCIAL STATEMENTS EXHIBITS INDEX STRATEGIC REVIEW PERFORMANCE REVIEW SHAREHOLDER INFORMATION 353 Our constitution (Continued) Australian Company and Business Numbers All Australian companies have a unique nine-digit identifier, referred to as an Australian Company Number (ACN), which must be included on public documents, eligible negotiable instruments and the company’s common seal. In addition, entities can apply for registration on the Australian Business Register and be allocated a unique eleven-digit identifier known as an Australian Business Number (ABN). For Australian companies, the last nine digits of their ABN are identical to their ACN. The ABN may be quoted on documents in lieu of the ACN. Our ACN is 007 457 141 and our ABN is 33 007 457 141. Documents on display We are subject to the disclosure requirements of the US Securities Exchange Act of 1934, as amended. In accordance with these requirements, we file Annual Reports with, and furnish other information to, the US Securities & Exchange Commission (SEC). The SEC also maintains a website at www.sec.gov that contains reports, proxy statements and other information regarding registrants that file electronically with the SEC. Since April 2002, we have filed our reports on Form 20-F and have furnished other information to the SEC in electronic format which may be accessed through this website. Exchange rates For each of the years indicated, the high, low, average and year-end noon buying rates1 for Australian dollars were: Year Ended 30 September (US$ per A$1.00) 2025a 2024 2023 2022 2021 2020 High 0.6895 0.6934 0.7102 0.7598 0.7953 0.7388 Low 0.6797 0.6290 0.6219 0.6437 0.7006 0.5755 Averageb n/a 0.6620 0.6651 0.7097 0.7490 0.6815 Close (on 30 September) c n/a 0.6934 0.6451 0.6437 0.7228 0.7160 a. Through to 4 October 2024. On 4 October 2024, the noon buying rate was A$1.00 = 0.6797. b. The average is calculated by using the average of the exchange rates on the last day of each month during the period. c. The noon buying rate as such date may differ from the rate used in the preparation of our consolidated financial statements at such date. Refer to Note 1(a) to the financial statements. For each of the months indicated, the high and low noon buying rates for Australian dollars were: Month (US$ per A$1.00) October 2024a September 2024 August 2024 July 2024 June 2024 May 2024 High 0.6895 0.6934 0.6807 0.6788 0.6701 0.6686 Low 0.6797 0.6650 0.6488 0.6535 0.6589 0.6496 a. Through to 4 October 2024. On 4 October 2024, the noon buying rate was A$1.00 = 0.6797. Exchange rates against A$ Twelve months to/as at 30 Sept 2024 2023 2022 Currency Average Spot Average Spot Average Spot US$ 0.6594 0.6929 0.6662 0.6467 0.7125 0.6490 GBP 0.5201 0.5176 0.5435 0.5284 0.5575 0.5841 NZ$ 1.0846 1.0885 1.0846 1.0738 1.0831 1.1355 1. The noon buying rate in New York City for cable transfers in Australian dollars as certified for customs purposes by the Federal Reserve Bank of New York. |
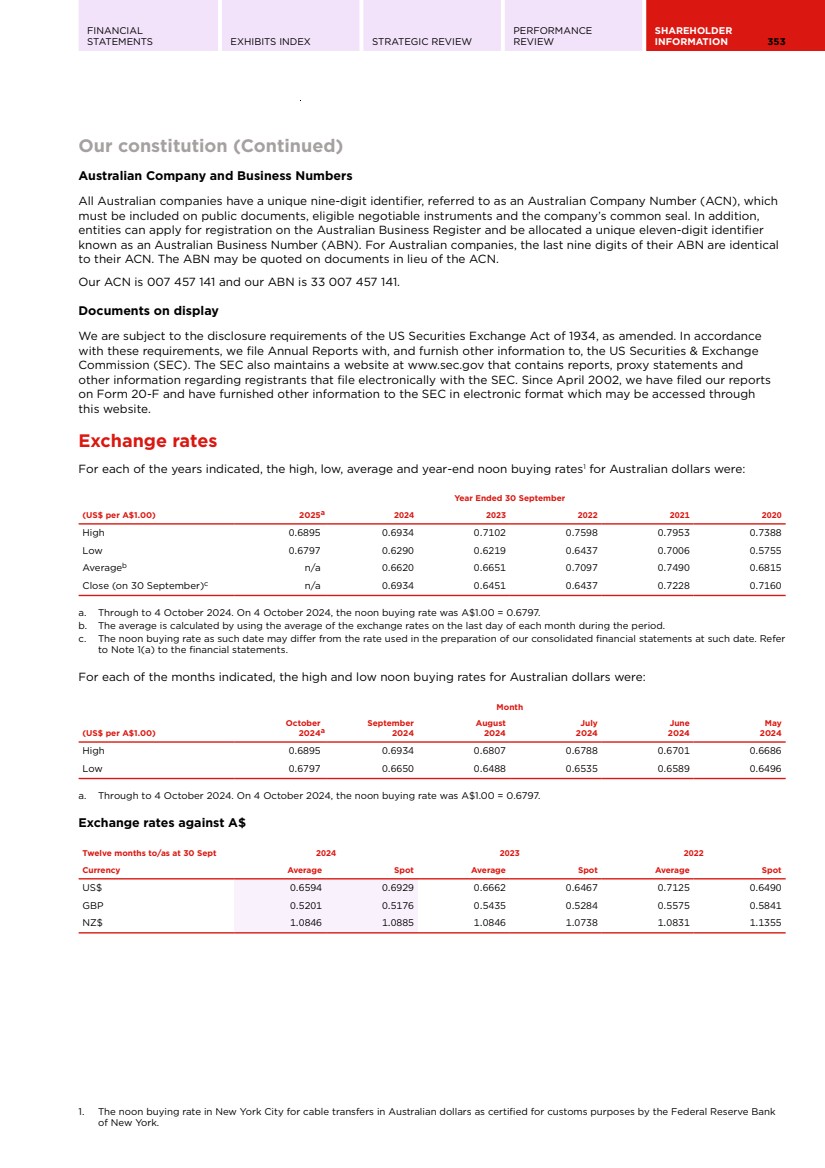
| 354 WESTPAC GROUP 2024 ANNUAL REPORT ADDITIONAL INFORMATION Exchange rates (Continued) Impact of exchange rate movements on Westpac's results 2024 vs 2023 2023 vs 2022 Growth FX impact ($m) Growth ex- FX Growth FX impact ($m) Growth ex- FX Net interest income 2% (2) 2% 7% 5 7% Non-interest income (15%) 9 (15%) 36% 5 36% Net operating income - 7 - 10% 10 10% Operating expenses 2% (9) 2% (1%) (11) (1%) Pre-provision profit (3%) (2) (3%) 24% (1) 24% Impairment (charges)/benefits (17%) - (17%) 93% - 93% Profit before income tax expense (2%) (2) (2%) 22% (1) 22% Income tax expense - - - 12% - 12% Profit after income tax expense (3%) (2) (3%) 26% (1) 26% Profit attributable to non-controlling interests (NCI) (100%) - (100%) 20% - 20% Net profit attributable to owners of WBC (3%) (2) (3%) 26% (1) 26% Exchange rate risk on future NZ$ earnings Westpac’s policy in relation to the hedging of the future earnings of Westpac’s New Zealand division is to manage the economic risk for volatility of the NZ$ against A$. Westpac manages these flows over a time horizon under which up to 100% of the expected earnings for the following 12 months and 50% of the expected earnings for the subsequent 12 months can be hedged. NZ Future Earnings hedges are only implemented when AUD/NZD is trading at the low end of the range or is expected to move higher over the next 12 months. As at 30 September 2024, Westpac has hedges in place for forecasts up to November 2024 with an average rate of $1.0852. Dividend reinvestment plan The Board has determined a fully franked final ordinary dividend of 76 cents per share, to be paid on 19 December 2024 to shareholders on the register at the record date of 8 November 2024. The 2024 final and interim ordinary dividend represents a payout ratio of 74.62%. In addition to being fully franked, the final ordinary dividend will also carry NZ$0.06 in New Zealand imputation credits that may be used by New Zealand tax residents. Westpac operates a DRP that is available to holders of fully paid ordinary shares who are resident in, or whose address on the register of shareholders is in Australia or New Zealand. Shareholders can choose to receive their 2024 final ordinary dividend as cash or reinvest it in additional shares under the DRP. As noted in Note 28 to the financial statements, the Board has made certain determinations in relation to the DRP for the final ordinary dividend only, including that the market price will be set over 15 trading days commencing 13 November 2024 and will not include a discount. Shareholders who wish to commence participation in the DRP, or to vary their current participation election, must do so by 5.00pm (Sydney time) on 11 November 2024. Shareholders can provide these instructions: • Online for shareholders with holdings that have a market value of less than $1,000,000 within their Link Market Services portfolio, by logging into or creating a Portfolio via the Westpac share registry's website at linkmarketservices.com.au and electing the DRP or amending their existing instructions online; or • By completing and returning a DRP application or variation form to Westpac’s share registry. Registry contact details are listed in Useful information (page 359). |
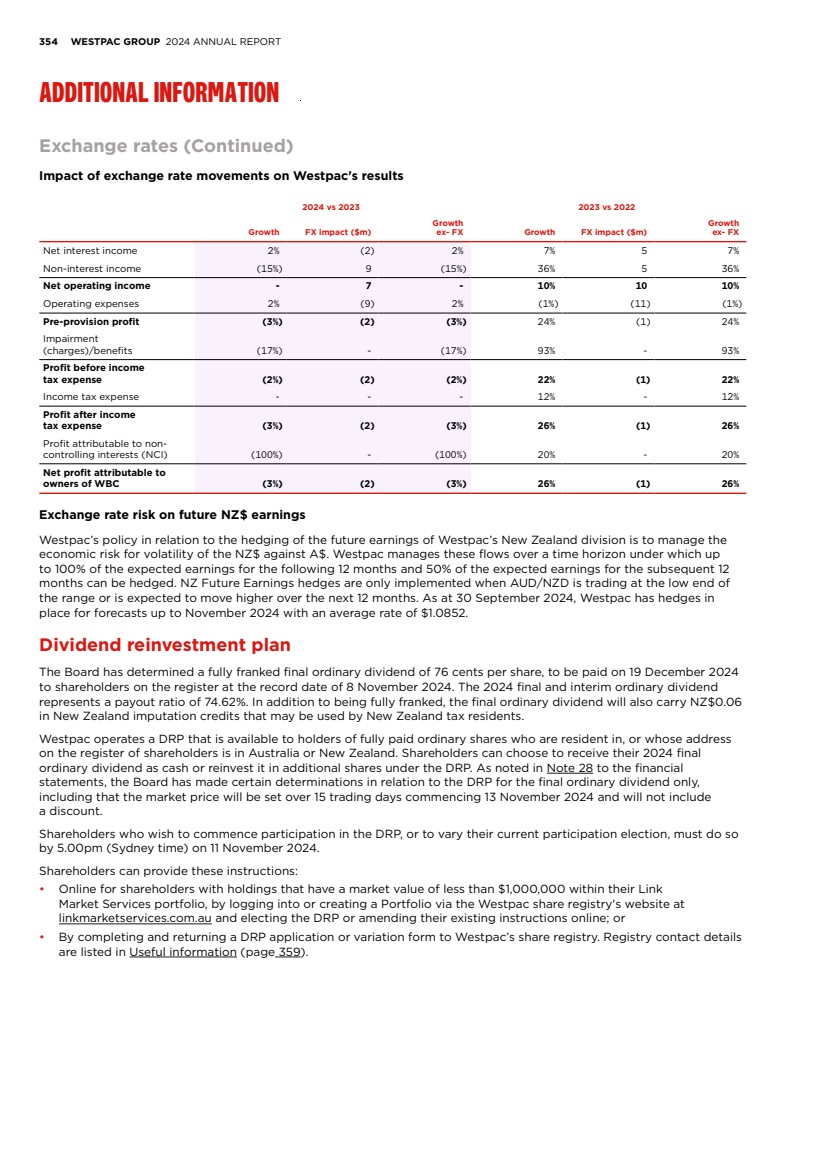
| FINANCIAL STATEMENTS EXHIBITS INDEX STRATEGIC REVIEW PERFORMANCE REVIEW SHAREHOLDER INFORMATION 355 Information on related entities a. Changes in control of Westpac entities During the twelve months ended 30 September 2024 the following controlled entities were acquired, formed, or incorporated: • Series 2024-1 WST Trust (formed 17 October 2023) During the twelve months ended 30 September 2024, the following controlled entities ceased to be controlled: • Westpac Nominees NZ - Limited (deregistered 11 October 2023) • Westpac Superannuation Nominees - NZ - Limited (deregistered 11 October 2023) • Aotearoa Financial Services Limited (deregistered 26 October 2023) • Westpac Investment Vehicle No.2 Pty Limited (deregistered 29 October 2023) • Westpac USA Inc. (dissolved 6 May 2024) • Series 2014-1 WST Trust (terminated 3 June 2024) • Sydney Capital Corporations Inc. (dissolved 23 August 2024) • Partnership Pacific Pty Limited (deregistered 28 August 2024) • BT Financial Group Holdings Pty Ltd (deregistered 5 September 2024) • St. George Security Holdings Pty. Limited (deregistered 12 September 2024) • Westpac Europe Limited (dissolved 17 September 2024) • Westpac Syndications Management Pty Ltd (deregistered 19 September 2024) • Westpac Leasing Nominees - VIC- Pty. Limited (deregistered 19 September 2024) • Waratah Securities Australia Limited (deregistered 19 September 2024) b. Associates As at 30 September 2024 Ownership Interest Held (%) Akahu Technologies Ltd 34.5% OpenAgent Pty Ltd 22.6% mx51 Group Pty Ltd 22.2% Safe Will Pty Ltd 14.2% |
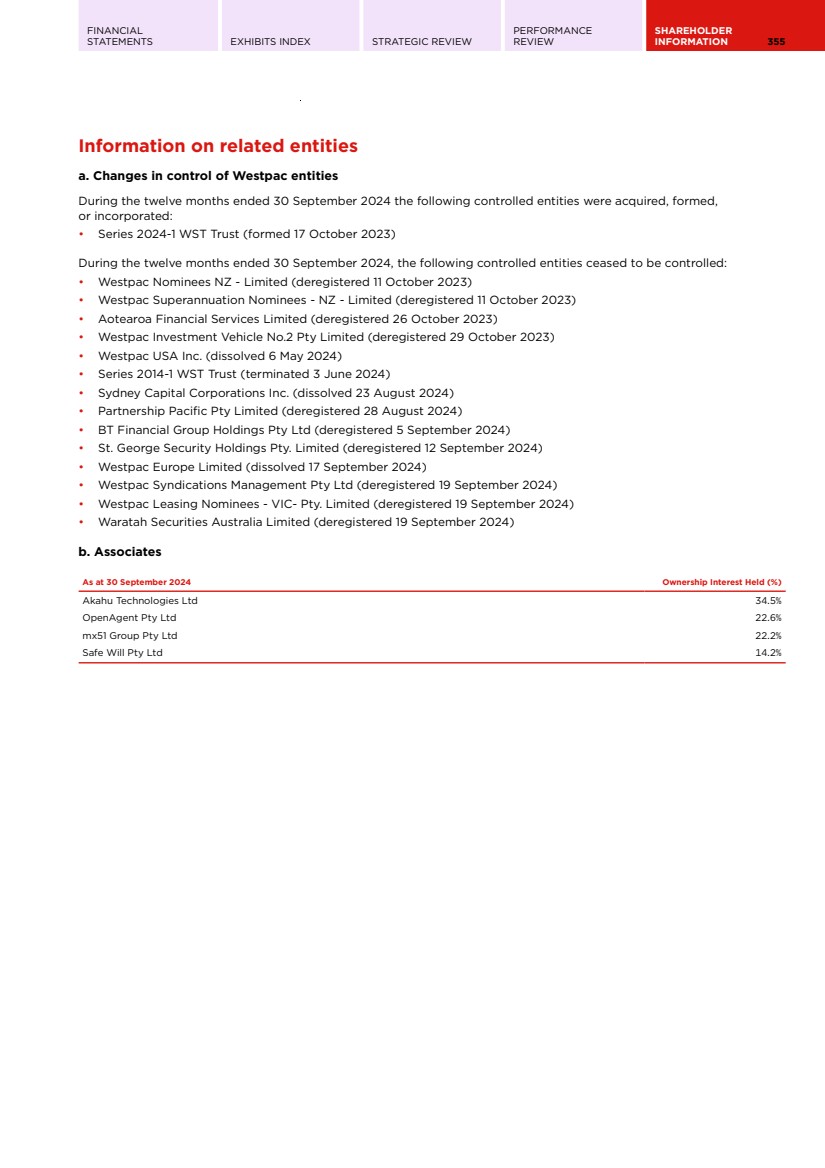
| 356 WESTPAC GROUP 2024 ANNUAL REPORT ADDITIONAL INFORMATION Net profit contribution of businesses sold To assist in understanding the contribution of these businesses, the following tables provide the earnings (excluding Notable Items) attributable to the entities sold. Earnings attributed to each business reflect its contribution up to the sale date, and any other gains/losses on these transactions which were not identified as Notable Items. Balance sheet data is at completion date. Businesses sold in the 2023 financial year had negligible balance sheet contribution. No businesses were sold in 2024. Businesses sold $m Advance Asset Management BT Personal and Corporate Supera Westpac Life Insurance Ltd. Motor Vehicle Finance and Novated Leasing Westpac Life-NZ-Limited (A$) Contribution of businesses sold Westpac Life-NZ-Limited (NZ$) 2023 Non-interest income 38 77 25 - - 140 - Operating expenses (8) 26 28 - - 46 - Income tax expense and NCI (9) (31) (15) - - (55) - Net profit 21 72 38 - - 131 - 2022 Net interest income - - - 6 - 6 - Non-interest income 80 177 107 - 28 392 30 Operating expenses (18) (77) (23) (6) (3) (127) (3) Impairment charges - - - 7 - 7 - Income tax expense and NCI (19) (30) (34) (2) (7) (92) (8) Net profit 43 70 50 5 18 186 19 a. Transfer of the members and benefits of BT Funds Management Limited’s personal and corporate (non-platform) superannuation products, via a successor funds transfer to Mercer Super Trust. $bn Advance Asset Management BT Personal and Corporate Super Westpac Life Insurance Ltd. Motor Vehicle Finance and Novated Leasing Westpac Life-NZ-Limited (A$) Contribution of businesses sold Westpac Life-NZ-Limited (NZ$) As at 30 Sept 2022 Total assets - - 2.6 - - 2.6 - |
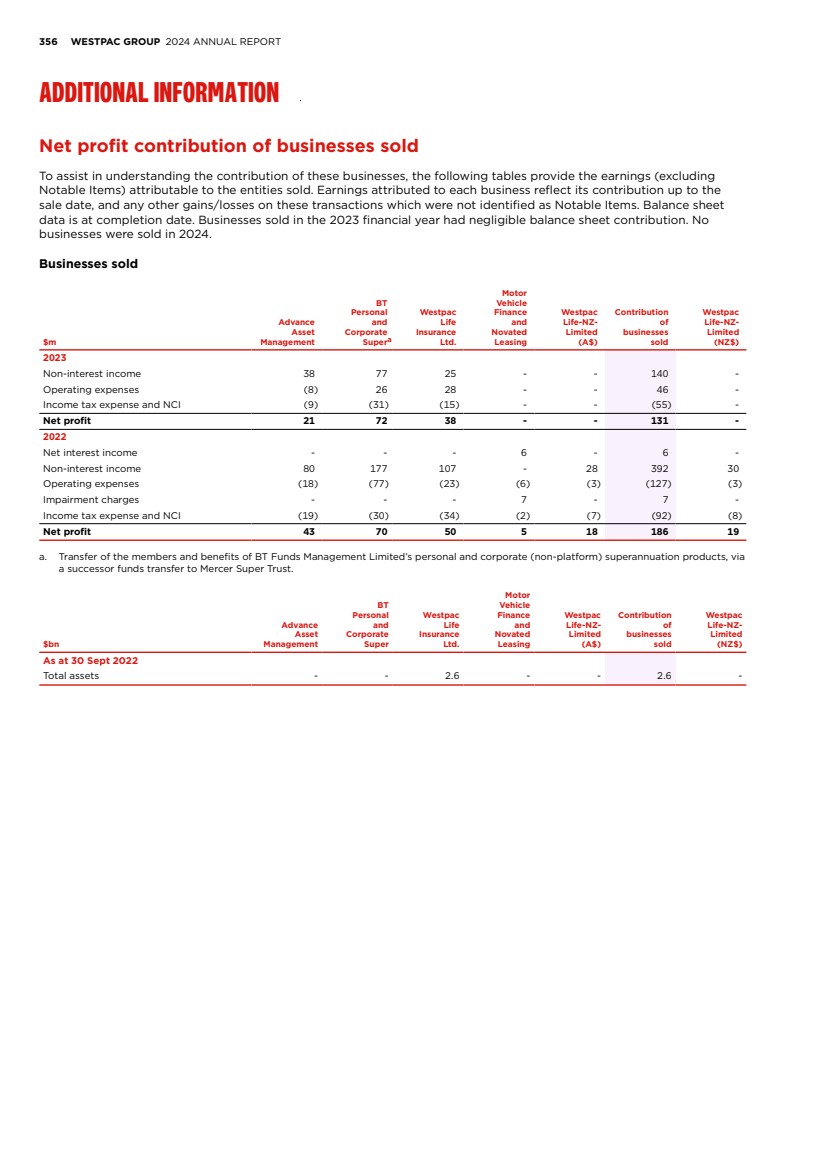
| FINANCIAL STATEMENTS EXHIBITS INDEX STRATEGIC REVIEW PERFORMANCE REVIEW SHAREHOLDER INFORMATION 357 Additional information for Non-AAS financial measures Calculation of Non-AAS financial measures Details of the calculation of non-AAS financial measures not disclosed elsewhere are provided below: Expense to income ratio (excluding Notable Items) $m 2024 2023 2022 Operating expenses 10,944 10,692 10,802 Less: Notable Items (operating expenses) - (460) (621) Operating expenses excluding Notable Items 10,944 10,232 10,181 Net operating income 21,588 21,645 19,606 Add/(less): Notable Items (net interest income) 163 97 (555) Add/(less): Notable Items (non-interest income) 12 (200) 854 Net operating income excluding Notable Items 21,763 21,542 19,905 Expense to income ratio (excluding Notable Items) 50.29% 47.50% 51.15% Average tangible ordinary equity and Return on average tangible ordinary equity (ROTE) $m 2024 2023 2022 2021 2020 Net profit attributable to owners of WBC (adjusted for RSP dividends)a 6,983 7,190 5,691 5,456 2,288 Average ordinary equity 71,493 71,229 70,268 70,849 68,014 Less: Intangible assets (average) (10,758) (10,664) (10,182) (11,310) (11,964) Add: Computer software (average) 2,680 2,552 1,992 2,361 2,371 Average tangible ordinary equity 63,415 63,117 62,078 61,900 58,421 Return on average tangible ordinary equity (ROTE) 11.01% 11.39% 9.17% 8.81% 3.92% a. See Note 8 to the financial statements for calculations of this profit measure. Net profit attributable to owners of WBC (adjusted for RSP shares) excluding Notable Items $m 2024 2023 2022 2021 2020 Net profit attributable to owners of WBC (adjusted for RSP dividends) 6,983 7,190 5,691 5,456 2,288 Add/(less): Notable Items (post tax) 123 173 874 1,495 2,937 Net profit attributable to owners of WBC (adjusted for RSP dividends) excluding Notable Items 7,106 7,363 6,565 6,951 5,225 ROE (excluding Notable Items) and ROTE (excluding Notable Items) $m 2024 2023 2022 2021 2020 Net profit attributable to owners of WBC (adjusted for RSP dividends) excluding Notable Items 7,106 7,363 6,565 6,951 5,225 Average ordinary equity 71,493 71,229 70,268 70,849 68,014 Average tangible ordinary equity 63,415 63,117 62,078 61,900 58,421 Return on average ordinary equity (excluding Notable Items) 9.94% 10.34% 9.34% 9.81% 7.68% Return on average tangible ordinary equity (excluding Notable Items) 11.21% 11.67% 10.58% 11.23% 8.94% |
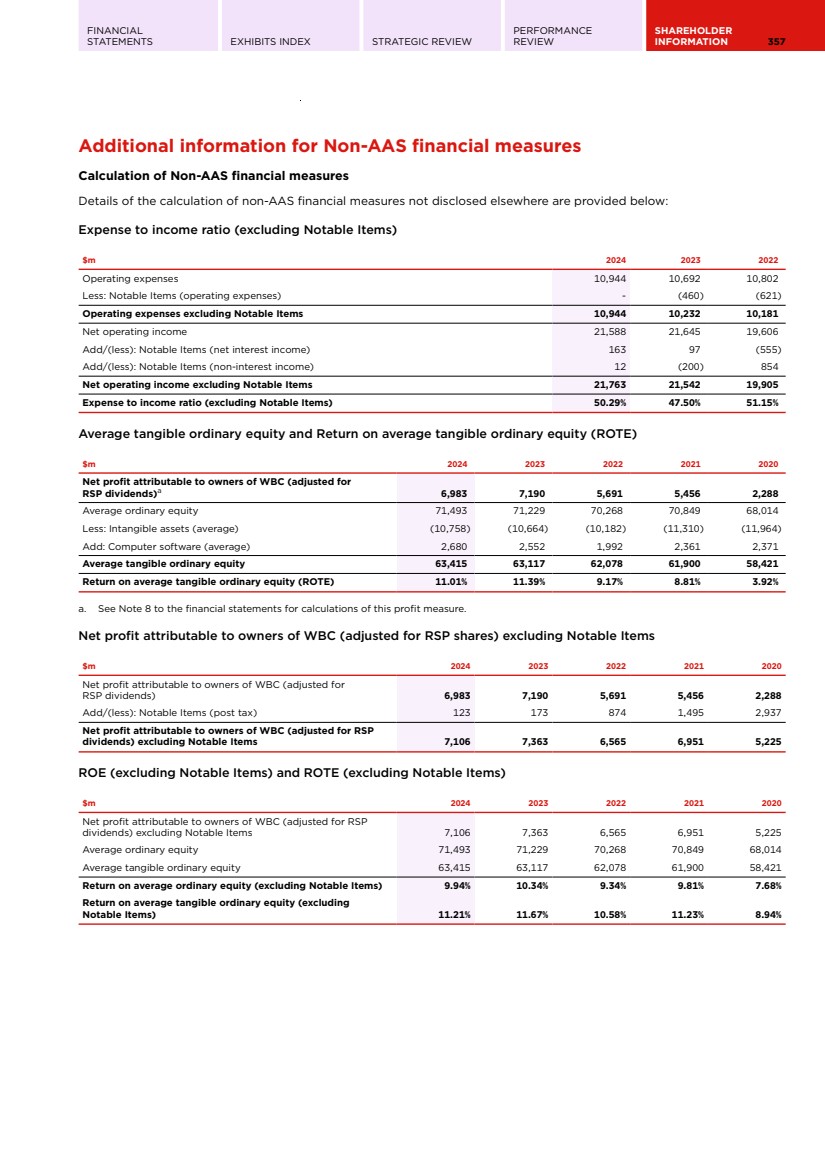
| 358 WESTPAC GROUP 2024 ANNUAL REPORT ADDITIONAL INFORMATION Additional information for Non-AAS financial measures (Continued) Pre-provision profit $m 2024 2023 2022 Net interest income 18,753 18,317 17,161 Non-interest income 2,835 3,328 2,445 Operating expenses (10,944) (10,692) (10,802) Pre-provision profit 10,644 10,953 8,804 Dividend payout ratio (excluding Notable Items) $m 2024 2023 2022 Ordinary dividend paid/declared on issued shares (net of Treasury shares) 5,210 4,975 4,370 divided by: Net profit attributable to owners of WBC (adjusted for RSP dividends) excluding Notable Items 7,106 7,363 6,565 Dividend payout ratio (excluding Notable Items)a 73.32% 67.57% 66.57% a. Dividend used in calculation not subjected to rounding. Segment pre-provision profit excluding Notable Items $m Consumer Business & Wealth Westpac Institutional Bank Westpac New Zealand (A$) Group Businesses Group 2024 Pre-provision profit/(loss) 3,373 3,510 2,040 1,375 346 10,644 Add/(less): Notable Items - - - 8 167 175 Pre-provision profit/(loss) excluding Notable Items 3,373 3,510 2,040 1,383 513 10,819 2023 Pre-provision profit/(loss) 3,966 3,225 1,962 1,362 438 10,953 Add/(less): Notable Items 202 152 15 9 (21) 357 Pre-provision profit/(loss) excluding Notable Items 4,168 3,377 1,977 1,371 417 11,310 2022 Pre-provision profit/(loss) 4,553 1,929 1,323 1,434 (435) 8,804 Add/(less): Notable Items 66 14 - (120) 960 920 Pre-provision profit/(loss) excluding Notable Items 4,619 1,943 1,323 1,314 525 9,724 Earnings per ordinary share (ex Notable Items) 2024 2023 2022 Basic Diluted Basic Diluted Basic Diluted Net profit attributable to owners of WBC (adjusted for RSP dividends) ($m) 6,983 7,466 7,190 7,595 5,691 5,927 Add/(less): Notable Items ($m) 123 123 173 173 874 874 Adjusted net profit attributable to owners of WBC (adjusted for RSP dividends) (excluding Notable Items) ($m) 7,106 7,589 7,363 7,768 6,565 6,801 Adjusted weighted average number of ordinary shares 3,476 3,895 3,502 3,891 3,559 3,889 Earnings per ordinary share (excluding Notable Items) (cents) 204.4 194.8 210.3 199.6 184.5 174.9 |
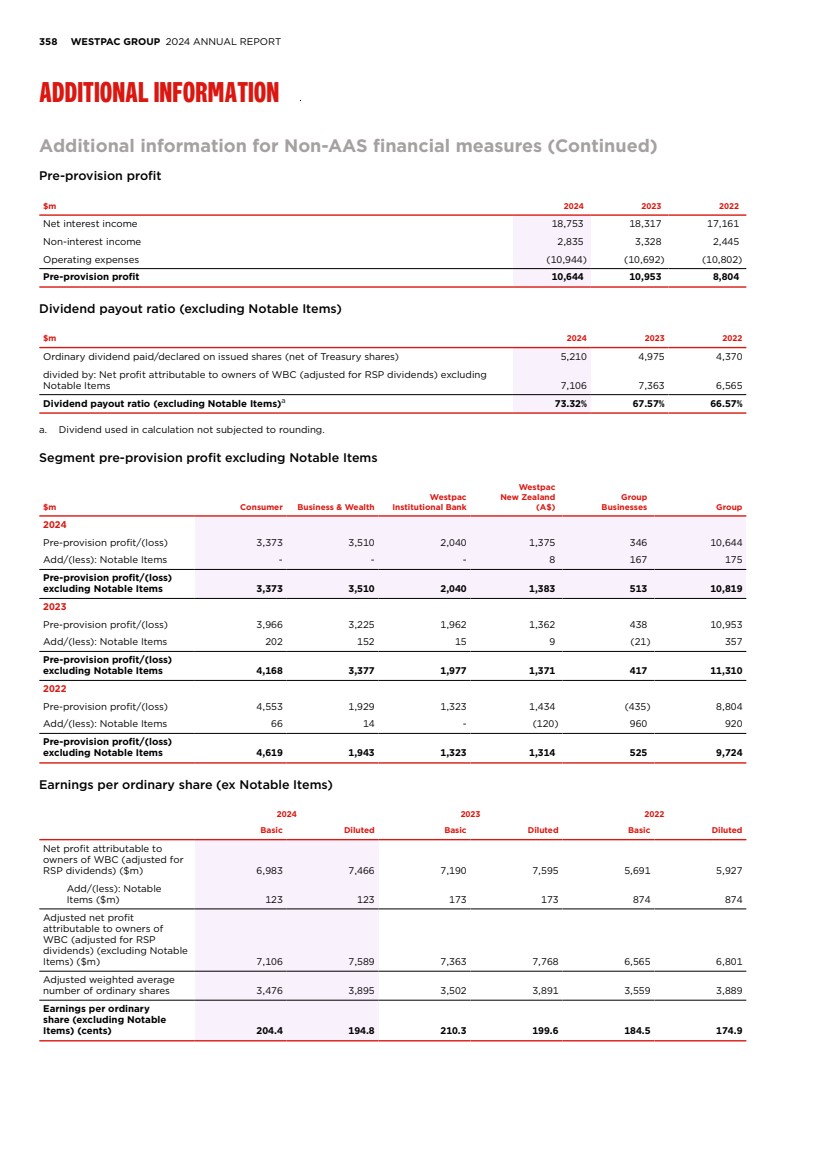
| FINANCIAL STATEMENTS EXHIBITS INDEX STRATEGIC REVIEW PERFORMANCE REVIEW SHAREHOLDER INFORMATION 359 Useful information Key sources of information for shareholders We report our full year performance to shareholders, in late October or early November, in the following forms: an Annual Report; a Climate Report; an Investor Discussion Pack and earnings releases. Electronic communications Shareholders can elect to receive the following communications electronically: • Annual Report; • Dividend statements when paid by direct credit or via Westpac’s Dividend Reinvestment Plan (DRP); • Notices of Meetings and proxy forms; and • Major company announcements. Opt for electronic communications by logging into Westpac’s Share Registrar’s Investor Centre at www.linkmarketservices.com.au. Online information Australia Westpac’s website www.westpac.com.au provides information for shareholders and customers, including: • access to internet banking and online investing services; • details on Westpac’s products and services; • company history, results, market releases and news; and • corporate responsibility and Westpac in the community activities. New Zealand Westpac’s New Zealand website www.westpac.co.nz provides: • access to internet banking services; • details on products and services; • economic updates, news and information, key financial results; and • sponsorships and other community activities. Stock exchange listings Westpac ordinary shares are listed on: • Australian Securities Exchange (code WBC); • New Zealand Exchange Limited (code WBC). We do not sponsor or endorse and are not affiliated in any way with trading in our equity securities in any market or under any facility other than direct trading in our ordinary shares listed on the Australian Securities Exchange and New Zealand Exchange Limited. Westpac Investor Relations Investors can access the Investor Centre at www.westpac.com.au/investorcentre. The Investor Centre includes the current Westpac share price and links to the latest ASX announcements. Information other than that relating to your shareholding can be obtained from: • Westpac Investor Relations 275 Kent Street Sydney NSW 2000 Australia Telephone: +61 2 9178 2977 Email: investorrelations@westpac.com.au Westpac sustainability For further information on Westpac’s sustainability approach, policies and performance please visit westpac.com.au/sustainability Email: sustainability@westpac.com.au Share registrars Shareholders can check and update their information in Westpac’s Share Registrars’ online Investor Centres, see details below. In Australia, broker sponsored holders must contact their broker to amend their address. Australia – Ordinary shares on the main register, Westpac Capital Notes 5, Westpac Capital Notes 7, Westpac Capital Notes 8, Westpac Capital Notes 9 and Westpac Capital Notes 10. Link Market Services Limited1 Level 12, 680 George Street Sydney NSW 2000 Postal address: Locked Bag A6015, Sydney South NSW 1235, Australia www.linkmarketservices.com.au Shareholder enquiries: Telephone: 1800 804 255 (toll free within Australia) International: +61 1800 804 255 Facsimile: +61 2 9287 0303 Email: westpac@linkmarketservices.com.au New Zealand – Ordinary shares Link Market Services Limited Level 30 PwC Tower 15 Customs Street West Auckland 1010, New Zealand Postal address: P.O. Box 91976, Auckland 1142, New Zealand www.linkmarketservices.co.nz Shareholder enquiries: Telephone: 0800 002 727 (toll free within New Zealand) International: +64 9 375 5998 Facsimile: +64 9 375 5990 Email: enquiries@linkmarketservices.co.nz 1. On 16 May 2024, Link Group was acquired by Mitsubishi UFJ Trust & Banking Corporation. Link Group is now known as MUFG Pension & Market Services. Over the coming months, our registry, Link Market Services Limited will progressively change to MUFG Corporate Markets and will rebrand websites, documentation, and emails you receive as a shareholder. While the name may be changing, we do not expect any material changes to how you interact with the registry. |
| 360 WESTPAC GROUP 2024 ANNUAL REPORT ADDITIONAL INFORMATION Other Westpac business information Property Occupied premises are primarily in Australia, New Zealand and Pacific including 762 branches (2023: 786) as at 30 September 2024. This includes 111 (2023: 82) co-located branches in Australia which support multiple brands. With the exception of 2 freehold branches, all retail premises occupied in Australia and New Zealand are held under commercial leases with terms generally ranging between 12 months and 7 years. The carrying value of our directly owned Corporate and Retail premises and sites was $45 million (2023: $61 million). Head office is located at Westpac Place, 275 Kent Street, Sydney with leases over levels 1-23, allowing continued occupation until 2030. There is also a lease over levels 1-28 of International Tower 2, Barangaroo, Sydney until 2030, of which 9 floors are sublet. Together these sites provide a current capacity for approximately 16,500 staff on a hybrid working basis. In the Sydney metropolitan area, the lease commitment for the corporate office at Kogarah expires in 2034 and provides capacity for approximately 2,000 staff on a hybrid working basis. The lease for 8 levels at 8 Parramatta Square, Parramatta provides capacity for approximately 3,000 staff on a hybrid working basis. In Melbourne, there is a lease over the majority of 150 Collins Street until 2033, providing capacity for approximately 2,000 staff. Westpac on Takutai Square is New Zealand’s head office, located at the eastern end of Britomart Precinct near Customs Street in Auckland, contains 26,710 square metres of office space across three buildings. Lease commitment at this site extends to 2031, with two six-year options (for two buildings) and one six-year option to extend on the third building. Significant long-term agreements We have no individual contracts, other than contracts entered into in the ordinary course of business, that would constitute a material contract. Related party disclosures Details of our related party disclosures are set out in Note 34 to the financial statements and details of Directors’ interests in securities are set out in the Remuneration Report (page 236) included in the Directors’ Report. Other than as disclosed in Note 34 to the financial statements and the Remuneration Report (page 236), if applicable, loans made to parties related to Directors and other key management personnel of Westpac are made in the ordinary course of business on normal terms and conditions (including interest rates and collateral). Loans are made on the same terms and conditions (including interest rates and collateral) as they apply to other employees and certain customers in accordance with established policy. These loans do not involve more than the normal risk of collectability or present any other unfavourable features. Auditor’s remuneration Auditor’s remuneration, to the external auditor for the years ended 30 September 2024 and 2023 is provided in Note 33 to the financial statements. Audit related services Westpac’s Group Finance function monitors the application of the pre-approval process in respect of audit, audit-related and non-audit services provided by PricewaterhouseCoopers (PwC) under Westpac’s Pre-Approval of Engagement of PricewaterhouseCoopers for Audit or Non-Audit Services Policy (‘Pre-Approval Policy’). Group Finance promptly brings to the attention of the Board Audit Committee any exceptions that need to be approved pursuant to paragraph (c)(7)(i)(C) of Rule 2-01 of Regulation S-X. The Pre-Approval Policy is communicated to Westpac’s divisions through publication on the Westpac intranet. During the year ended 30 September 2024, there were no fees paid by Westpac to PwC that required approval by the Board Audit Committee pursuant to paragraph (c)(7)(i)(C) of Rule 2-01 of Regulation S-X. |
| FINANCIAL STATEMENTS EXHIBITS INDEX STRATEGIC REVIEW PERFORMANCE REVIEW SHAREHOLDER INFORMATION 361 Other Westpac business information (Continued) Westpac debt programs and issuing shelves Access in a timely and flexible manner to a diverse range of debt markets and investors is provided by the following programs and issuing shelves as at 30 September 2024: Program Limit Issuer(s) Program/Issuing Shelf Type Australia No limit WBC Debt Issuance Program No limit WBC Capital Notes Program New Zealand No limit WNZL Medium Term Note Program Euro Market No limit WBC Euro Commercial Paper and Certificate of Deposit Program USD 20 billion WNZL Euro Commercial Paper and Certificate of Deposit Program USD 70 billion WBC Euro Medium Term Note Program USD 10 billion WSNZLa Euro Medium Term Note Program USD 40 billion WBCb Global Covered Bond Program EUR 5 billion WSNZLc Global Covered Bond Program Japan JPY 750 billion WBC Samurai shelf JPY 750 billion WBC Uridashi shelf United States USD 45 billion WBC US Commercial Paper Program USD 10 billion WSNZLa US Commercial Paper Program USD 35 billion WBC US Medium Term Note Program USD 10 billion WNZL US Medium Term Note Program No limit WBC (NY Branch) Certificate of Deposit Program No limit WBC US Securities and Exchange Commission registered shelves a. Notes issued under this program by Westpac Securities NZ Limited, London branch are guaranteed by Westpac New Zealand Limited, its parent company. b. Notes issued under this program are guaranteed by BNY Trust Company of Australia Limited as trustee of the Westpac Covered Bond Trust. c. Notes issued under this program by Westpac Securities NZ Limited, London branch are guaranteed by Westpac New Zealand Limited, its parent company, and Westpac NZ Covered Bond Limited. |
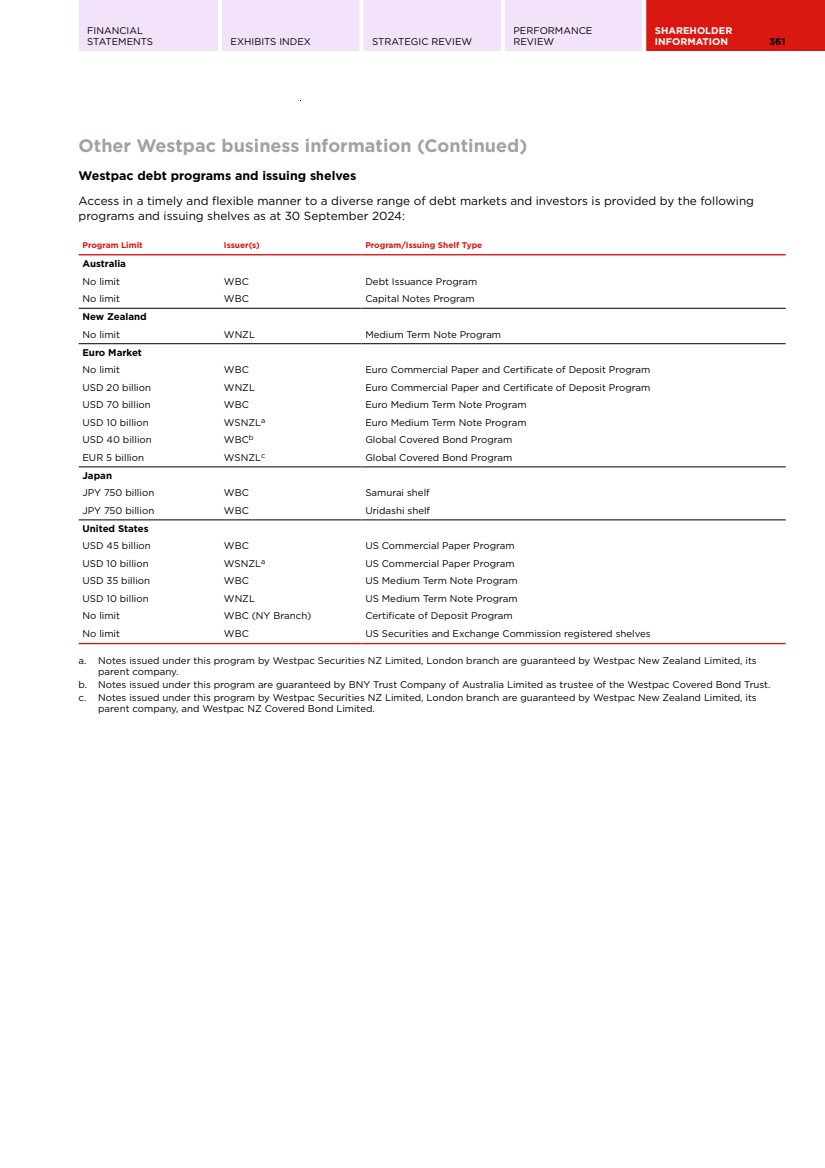
| 362 WESTPAC GROUP 2024 ANNUAL REPORT ADDITIONAL INFORMATION Other Westpac business information Commitments Contractual obligations and commitments In connection with our operating activities we enter into certain contractual obligations and commitments. The following table shows our significant contractual obligations as at 30 September 2024: $m Up to 1 year Over 1 year to 3 years Over 3 years to 5 years Over 5 years Total On balance sheet long-term debta 27,583 51,400 43,800 14,173 136,956 Lease liabilities 430 746 580 460 2,216 Total contractual cash obligations 28,013 52,146 44,380 14,633 139,172 a. Refer to Note 13 to the financial statements for details of on balance sheet long-term debt. The above table excludes deposits and other liabilities taken in the normal course of banking business and short-term and undated liabilities. Commercial commitments1 The following table shows our significant commercial commitments as at 30 September 2024: $m Up to 1 year Over 1 year to 3 years Over 3 years to 5 years Over 5 years Total Letters of credit and financial guarantees 5,306 4,037 618 3,157 13,118 Commitments to extend credit 63,270 39,257 18,956 77,393 198,876 Other - 67 - 50 117 Total undrawn credit commitments 68,576 43,361 19,574 80,600 212,111 Financial reporting Internal control over financial reporting The US Congress passed the Public Company Accounting Reform and Investor Protection Act in July 2002, which is commonly known as the Sarbanes-Oxley Act of 2002 (SOx). SOx is a wide ranging piece of US legislation concerned largely with financial reporting and corporate governance. We are obligated to comply with SOx by virtue of being a foreign registrant with the SEC and we have established procedures designed to comply with all applicable requirements of SOx. Disclosure controls and procedures Our management, with the participation of our CEO and CFO, evaluated the effectiveness of the design and operation of our disclosure controls and procedures (as defined in Rule 13a-15(e) under the US Securities Exchange Act of 1934) as of 30 September 2024. Based upon this evaluation, our CEO and CFO have concluded that the design and operation of our disclosure controls and procedures were effective as of 30 September 2024. Management’s report on internal control over financial reporting Rule 13a-15(a) under the US Securities Exchange Act of 1934 requires us to maintain an effective system of internal control over financial reporting. Refer to the sections headed ‘Management’s report on internal control over financial reporting’ and ‘Report of independent registered public accounting firm’ in Section 3 for those reports. Changes in our internal control over financial reporting There has been no change in our internal control over financial reporting (as defined in Rule 13a-15(f) of the US Securities Exchange Act of 1934) for the year ended 30 September 2024 that has been identified and that has materially affected, or is reasonably likely to materially affect, our internal control over financial reporting. 1. The numbers in this table are notional amounts (refer to Note 25 to the financial statements). |
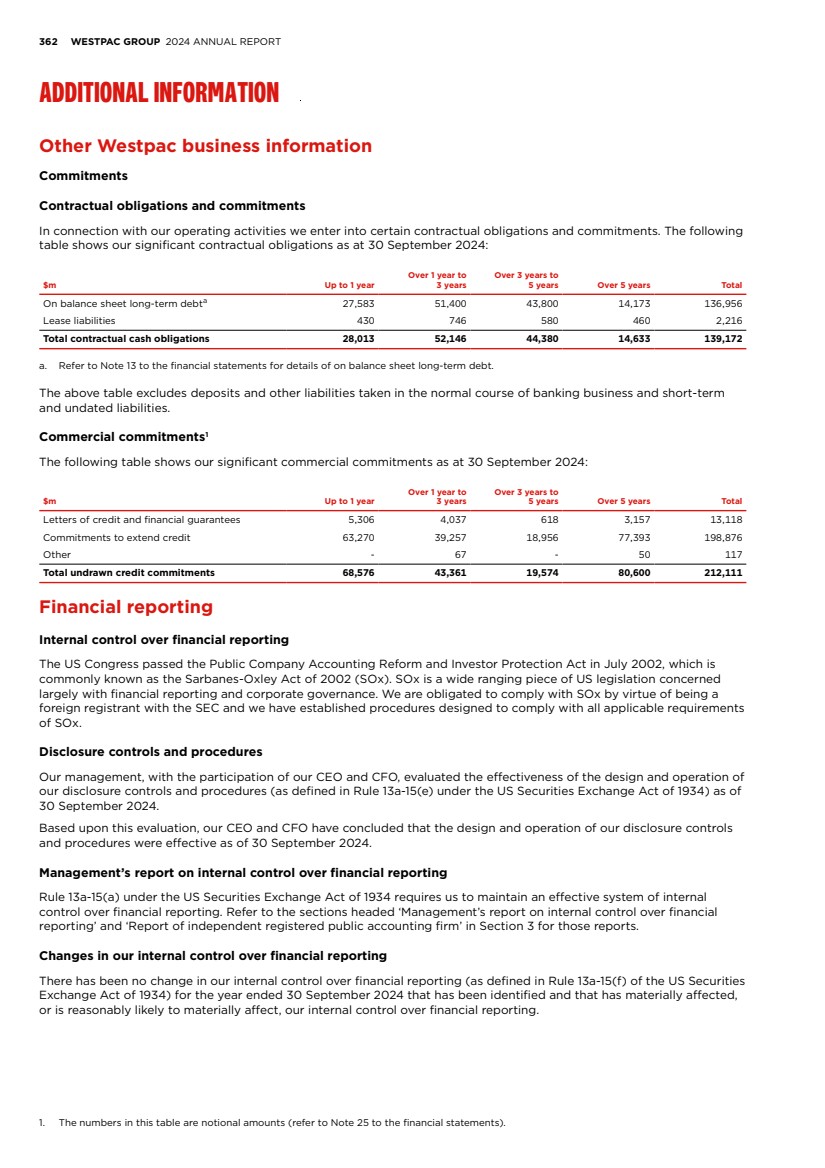
| FINANCIAL STATEMENTS EXHIBITS INDEX STRATEGIC REVIEW PERFORMANCE REVIEW SHAREHOLDER INFORMATION 363 GLOSSARY OF ABBREVIATIONS AND DEFINED TERMS Shareholder value Average ordinary equity Average total equity less average non-controlling interests. Average tangible ordinary equity Average ordinary equity less intangible assets (excluding capitalised software). Average total equity The average balance of shareholders’ equity, including non-controlling interests. Dividend payout ratio Current period ordinary dividend paid/declared on issued shares (net of Treasury shares) divided by the net profit attributable to owners of WBC (adjusted for RSP dividends). Earnings per ordinary share • Basic earnings per ordinary share is calculated by dividing the net profit attributable to owners of WBC by the weighted average number of ordinary shares on issue during the period, adjusted for treasury shares. • Diluted earnings per ordinary share is calculated by adjusting the basic earnings per ordinary share by assuming all dilutive potential ordinary shares are converted. Fully franked dividends per ordinary share (cents) Dividends paid out of retained profits which carry a credit for Australian company income tax paid by Westpac. Net tangible assets per share Net tangible assets (total equity less goodwill and other intangible assets less non-controlling interests) divided by the number of ordinary shares on issue (less Treasury shares held). Pre-provision profit Net interest income plus non-interest income less operating expenses. Return on average ordinary equity (ROE) Net profit attributable to the owners of WBC adjusted for RSP dividends (annualised where applicable) divided by average ordinary equity. Return on average tangible ordinary equity (ROTE) Net profit attributable to the owners of WBC adjusted for RSP dividends (annualised where applicable) divided by average tangible ordinary equity. Weighted average ordinary shares Weighted average number of fully paid ordinary shares listed on the Australian Stock Exchange for the relevant period less Westpac shares held by Westpac (‘Treasury shares’). Productivity and efficiency Expense to income ratio Operating expenses divided by net operating income. Expense to income ratio (ex Notable Items) Operating expenses excluding Notable Items divided by net operating income excluding Notable Items. Full time equivalent employees (FTE) A calculation based on the number of hours worked by full and part-time employees as part of their normal duties. For example, the full time equivalent of one FTE is 76 hours paid work per fortnight. Revenue per FTE Total operating income divided by the average number of FTE for the period. Business Performance Average Where possible, daily balances are used to calculate the average balance for the period. Average interest bearing liabilities The average balance of liabilities owed by Westpac that incur an interest expense. Where possible, daily balances are used to calculate the average balance for the period. Average interest earning assets The average balance of assets held by Westpac that generate interest income. Where possible, daily balances are used to calculate the average balance for the period. Core NIM Calculated by dividing net interest income excluding Notable Items and Treasury & Markets (annualised where applicable) by average interest earning assets. Group NIM/Net interest margin Calculated by dividing net interest income (annualised where applicable) by average interest earning assets. Net profit Net profit attributable to owners of WBC. TSR Total shareholder return. Capital Adequacy Australian Prudential Regulation Authority (APRA) leverage ratio Tier 1 capital divided by ‘exposure measure’ and expressed as a percentage. ‘Exposure measure’ is the sum of on balance sheet exposures, derivative exposures, securities financing transaction (SFT) exposures and non-market related off balance sheet exposures. Common equity tier 1 (CET1) capital ratio Total common equity capital divided by risk weighted assets, as defined by APRA. Internationally comparable capital ratios Internationally comparable methodology references the ABA study on the comparability of APRA’s capital framework released on 10 March 2023. Risk weighted assets (RWA) Assets (both on and off-balance sheet) are risk weighted according to each asset’s inherent potential for default and what the likely losses would be in case of default. In the case of non-asset backed risks (i.e. market, IRRBB and operational risk), RWA is determined by multiplying the capital requirements for those risks by 12.5. Credit risk weighted assets (Credit RWA) Credit risk weighted assets represent risk weighted assets (on-balance sheet and off-balance sheet) that relate to credit exposures and therefore exclude market risk, operational risk, IRRBB and other assets. Business lending Includes credit exposures not captured elsewhere, and where the borrower’s annual turnover is below $75 million. Corporate Exposures to corporate borrowers that do not fall within the definition of Large Corporate, Property Finance, Specialised Lending, Business Lending or Small Business exposures. Financial institution Includes exposure to entities whose primary dealings relates to management of financial assets, lending, factoring, leasing provision of credit enhancements, securitisation, investments, financial custody, central counter party services and proprietary trading. Large corporate Exposures to counter parties with consolidated annual revenue (of the counterparty or group that the counter party consolidates into) exceeding $750 million. |
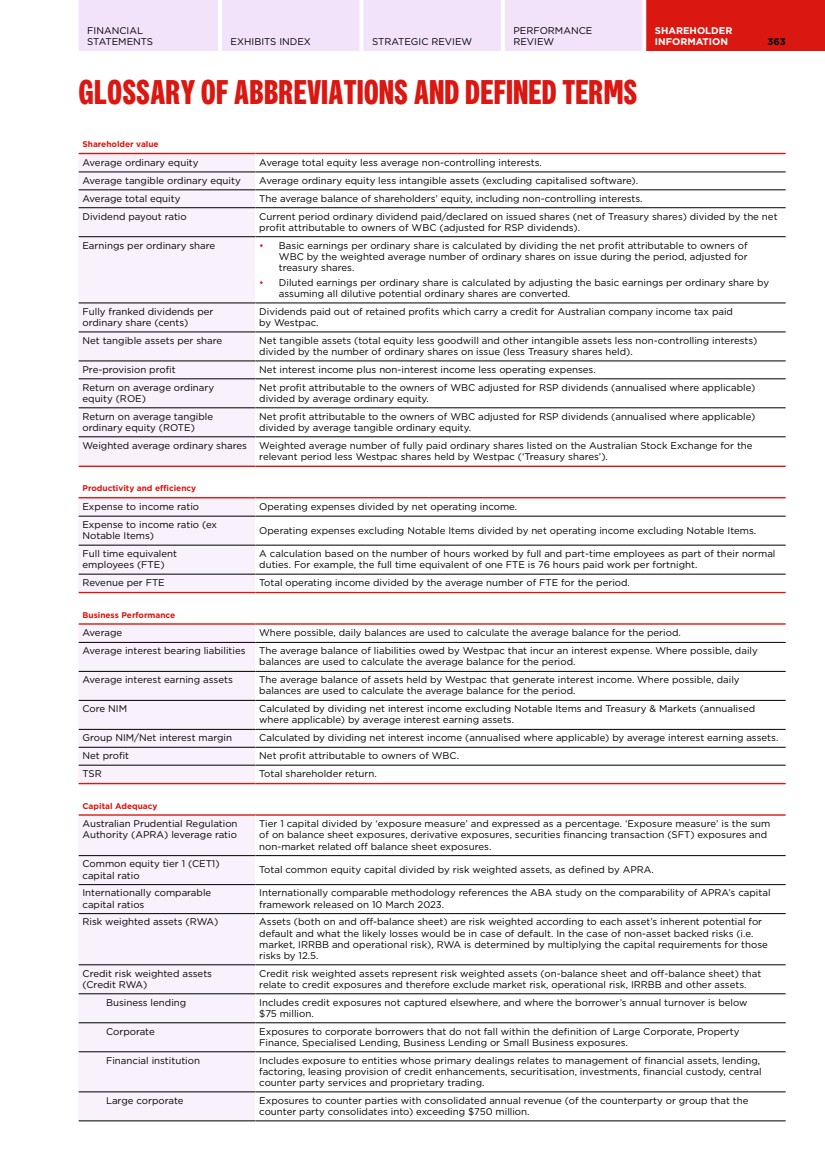
| 364 WESTPAC GROUP 2024 ANNUAL REPORT GLOSSARY OF ABBREVIATIONS AND DEFINED TERMS Capital Adequacy New Zealand Overseas banking subsidiary regulated by the RBNZ. Property finance Exposures to borrowers where repayments depend primarily on the cash flows generated by the property or other real estate assets owned by the borrower. Securitisation Exposures relating to Westpac’s involvement in securitisation activities range from a seller of its own assets to an investor in third party transactions and include the provision of securitisation services for its clients. Small business Program-managed business exposures typically below $1.5 million in value. Program-managed exposures are managed on a statistical basis according to pre-determined objective criteria. Sovereign Exposures to Australian and overseas central and sub-national governments, and central banks. Specialised lending Includes exposures to project and object finance lending. Project finance and object finance rely primarily on the revenues generated by a project, or equipment asset respectively, both as a source of repayment and as security for the loan. Excludes Property Finance exposures. Operational risk The risk of loss resulting from inadequate or failed internal processes, people and systems or from external events, including legal risk but excluding strategic or reputational risk. Tier 1 capital ratio Total Tier 1 capital divided by risk weighted assets, as defined by APRA. Total regulatory capital ratio Total regulatory capital divided by risk weighted assets, as defined by APRA. Funding and liquidity Committed Liquidity Facility (CLF) Facility made available by the RBA to cover the shortfall in Australian dollars between the ADI's holding of HQLA and net cash outflows, subject to qualifying conditions. The facility was phased out by 1 January 2023. The CLF was treated as an ALA for Westpac's LCR calculation. Deposit to loan ratio Customer deposits divided by net loans. Funding for Lending Programme (FLP) A facility that was established by the RBNZ in December 2020 to provide 3 year term funding to eligible New Zealand institutions via repurchase transactions, subject to qualifying conditions, to help support lending to New Zealand customers. The facility closed to new draw downs in December 2022. High Quality Liquid Assets (HQLA) Assets which meet APRA’s criteria for inclusion as HQLA in the numerator of the LCR. Liquid assets HQLA and non LCR qualifying liquid assets, but excludes internally securitised assets that are eligible for a repurchase agreement with the RBA and the RBNZ. Liquidity Coverage Ratio (LCR) An APRA requirement to maintain an adequate level of unencumbered high quality liquid assets, to meet liquidity needs for a 30 calendar day period under an APRA-defined severe stress scenario. Absent a situation of financial stress, the value of the LCR must not be less than 100%. LCR is calculated as the percentage ratio of stock of HQLA, and qualifying RBNZ securities over the total net cash out-flows in a modelled 30 day defined stressed scenario. Net Stable Funding Ratio (NSFR) The NSFR is defined as the ratio of the amount of available stable funding (ASF) to the amount of required stable funding (RSF) defined by APRA. The amount of ASF is the portion of an ADI’s capital and liabilities expected to be a reliable source of funds over a one year time horizon. The amount of RSF is a function of the liquidity characteristics and residual maturities of an ADI’s assets and off-balance sheet activities. ADIs must maintain an NSFR of at least 100%. Term Funding Facility (TFF) A facility that was established by the RBA in March 2020 to provide 3 year term funding to Australian ADIs via repurchase transactions, subject to qualifying conditions, to help support lending to Australian businesses. The facility closed to new draw downs in June 2021. Term funding from central banks Term funding from central banks includes the drawn balances of the RBA TFF and the RBNZ FLP and Term Lending Facility. Wholesale funding Wholesale funding includes debt issues, loan capital, certificates of deposit, term funding from central banks and interbank placements. Credit quality Collectively assessed provisions (CAPs) Collectively assessed provisions for expected credit loss under AASB 9 represent the Expected Credit Loss (ECL) which is collectively assessed in pools of similar assets with similar risk characteristics. This incorporates forward-looking information and does not require an actual loss event to have occurred for an impairment provision to be recognised. Default Credit exposures that are non-performing. Exposure at default (EAD) The estimated outstanding amount of credit exposure at the time of the default. Gross impaired exposures provisions to gross impaired exposures Impairment provisions relating to impaired exposures include individually assessed provisions plus the proportion of the collectively assessed provisions that relate to impaired exposures. |
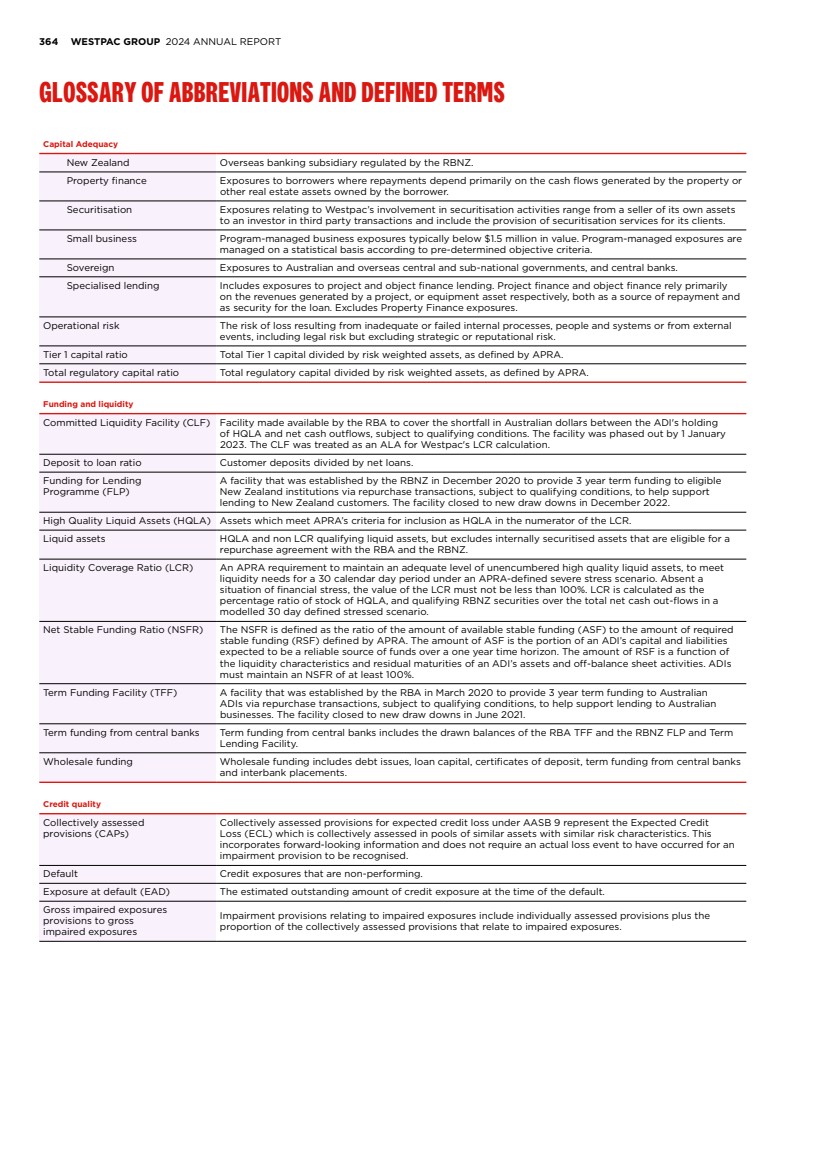
| FINANCIAL STATEMENTS EXHIBITS INDEX STRATEGIC REVIEW PERFORMANCE REVIEW SHAREHOLDER INFORMATION 365 Credit quality Impaired exposures Includes exposures that have deteriorated to the point where full collection of interest and principal is in doubt, based on an assessment of the customer’s outlook, cash flow, and the net realisation of value of assets to which recourse is held: • Facilities 90 days or more past due, and full recovery is in doubt: exposures where contractual payments are 90 or more days in arrears and the net realisable value of assets to which recourse is held may not be sufficient to allow full collection of interest and principal, including overdrafts or other revolving facilities that remain continuously outside approved limits by material amounts for 90 or more calendar days; • Non-accrual facilities: exposures with individually assessed impairment provisions held against them, excluding restructured loans; • Restructured facilities: exposures where the original contractual terms have been formally modified to provide for concessions of interest or principal for reasons related to the financial difficulties of the customer; • Other assets acquired through security enforcement (includes other real estate owned): includes the value of any other assets acquired as full or partial settlement of outstanding obligations through the enforcement of security arrangements; or • Any other facilities where the full collection of interest and principal is in doubt. Impairment charges/(benefit) to average loans Calculated as impairment charges (annualised where applicable) divided by average gross loans. Individually assessed provisions (IAPs) Provisions raised for losses on loans that are known to be impaired and are assessed on an individual basis. The estimated losses on these impaired loans is based on expected future cash flows discounted to their present value and, as this discount unwinds, interest will be recognised in the income statement. Loss given default (LGD) The loss that is expected to arise in the event of a default. Non-performing not impaired exposures Includes those credit exposures that are in default, but where it is expected that the full value of principal and accrued interest can be collected, generally by reference to the value of security held. Performing exposures Credit exposures that are not non-performing. Probability of default (PD) The probability that a counter party will default. Provision for expected credit losses (ECL) Expected credit losses (ECL) are a probability-weighted estimate of the cash shortfalls expected to result from defaults over the relevant time frame. They are determined by evaluating a range of possible outcomes and taking into account the time value of money, past events, current conditions and forecasts of future economic conditions. Stage 1: 12 months ECL - performing For financial assets where there has been no significant increase in credit risk since origination a provision for 12 months expected credit losses is recognised. Interest revenue is calculated on the gross carrying amount of the financial asset. Stage 2: Lifetime ECL - performing For financial assets where there has been a significant increase in credit risk since origination but where the asset is still performing a provision for lifetime expected losses is recognised. Interest revenue is calculated on the gross carrying amount of the financial asset. Stage 3: Lifetime ECL - non-performing For financial assets that are non-performing a provision for lifetime expected losses is recognised. Interest revenue is calculated on the carrying amount net of the provision for ECL rather than the gross carrying amount. Stressed exposures Watchlist and substandard credit exposures plus non-performing exposures. Total committed exposure (TCE) Represents the sum of the committed portion of direct lending (including funds placement overall and deposits placed), contingent and pre-settlement risk plus the committed portion of secondary market trading and underwriting risk. Watchlist and substandard Loan facilities where customers are experiencing operating weakness and financial difficulty but are not expected to incur loss of interest or principal. Sustainability ESG Environment, social and governance FPIC Free, Prior and Informed Consent NZBA Net-Zero Banking Alliance OHI Organisational Health Index RAP Reconciliation Action Plan TNFD Taskforce on Nature-related Financial Disclosures |
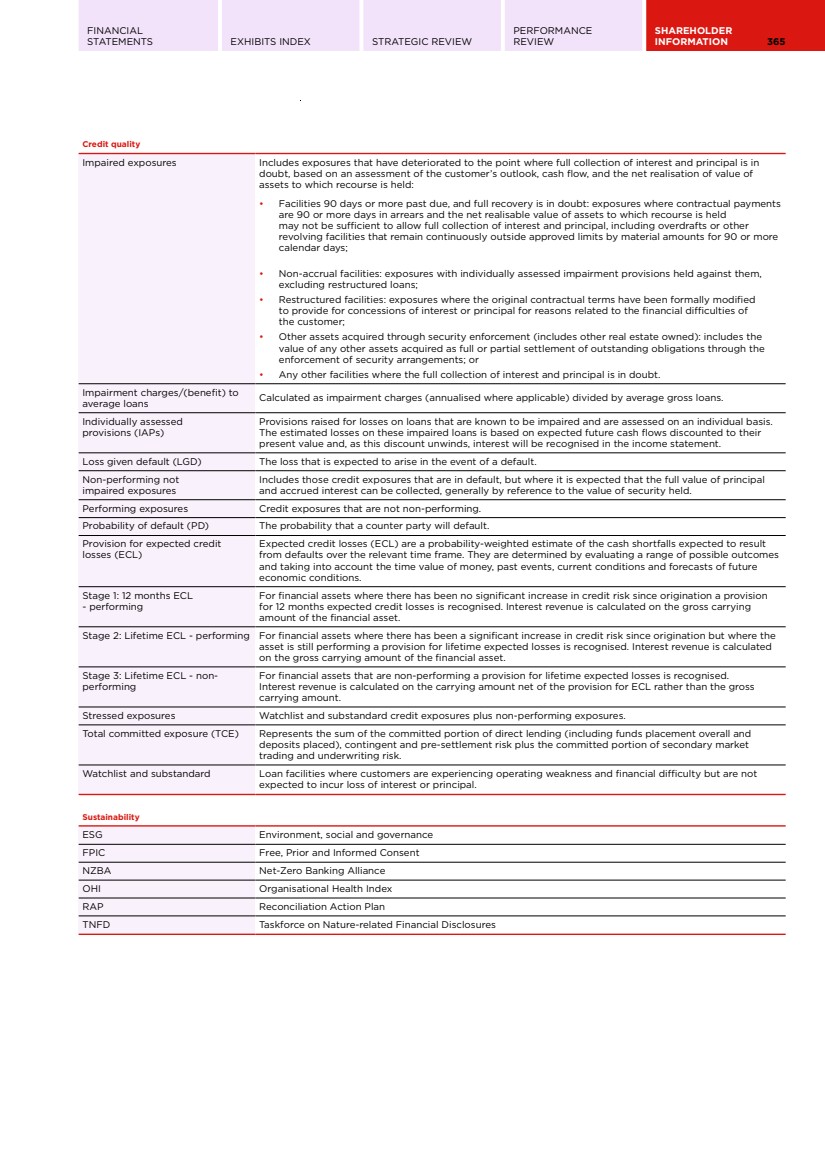
| 366 WESTPAC GROUP 2024 ANNUAL REPORT GLOSSARY OF ABBREVIATIONS AND DEFINED TERMS Other AAS Australian Accounting Standards AASB Australian Accounting Standards Board ABA Australian Banking Association ACCC Australian Competition and Consumer Commission ADI Authorised Deposit-taking Institution AGM Annual General Meeting AI Artificial intelligence ALM Asset and Liability Management APRA Australian Prudential Regulation Authority APS Australian Prudential Standard ASIC Australian Securities and Investments Commission ASX Australian Securities Exchange ATM Automated Teller Machine ATO Australian Taxation Office AUSTRAC Australian Transaction Reports and Analysis Centre BBSW Bank bill swap rate BCCC The Banking Code Compliance Committee bps Basis points CORE program Customer Outcomes and Risk Excellence Credit Value Adjustment (CVA) CVA adjusts the fair value of over-the-counter derivatives for credit risk. CVA is employed on the majority of derivative positions and reflects the market view of the counterparty credit risk. A Debit Valuation Adjustment is employed to adjust for our own credit risk. CTF Counter-terrorism financing Derivative Valuation Adjustment (DVA) DVA includes CVA and FVA. DRP Dividend Reinvestment Plan D-SIB Domestic systemically important bank EIP Executive incentive plan FATCA Foreign Account Tax Compliance Act First Half 2024 (1H24) Six months ended 31 March 2024 Full Year 2023 (FY23) Twelve months ended 30 September 2023 Full Year 2024 (FY24) Twelve months ended 30 September 2024 Funding Value Adjustment (FVA) FVA relates to the funding cost or benefit associated with the uncollateralised portion of the derivative portfolio. FVIS Fair value through income statement FVOCI Fair value through other comprehensive income FX Foreign exchange IASB International Accounting Standards Board IFRS International Financial Reporting Standards IRRBB Interest Rate Risk in the Banking Book LCH London Clearing House LTVR Long term variable reward NCI Non-controlling interests Non-interest earning/bearing Instruments which do not carry an entitlement to interest NPS Net promoter score OAIC The Office of the Australian Information Commissioner OCI Other comprehensive income OHI Organisational Health Index OTC Over the counter Prior period Refers to the twelve months ended 30 September 2023 RBA Reserve Bank of Australia RBNZ Reserve Bank of New Zealand RSP Restricted Share Plan Runoff Scheduled and unscheduled repayments and debt repayments, net of redraws Second Half 2024 (2H24) Six months ended 30 September 2024 Segment reporting Segment reporting is presented on a management reporting basis. Internal charges and transfer pricing adjustments are included in the performance of each segment reflecting the management structure rather than the legal entity (these results cannot be compared to results for individual legal entities). Where management reporting structures or accounting classifications have changed, financial results for comparative periods have been restated and may differ from results previously reported. Overhead costs are allocated to revenue generating segments. Westpac’s internal transfer pricing frameworks facilitate risk transfer, profitability measurement, capital allocation and segment alignment, tailored to the jurisdictions in which Westpac operates. Transfer pricing allows Westpac to measure the relative contribution of products and segments to Westpac’s interest margin and other dimensions of performance. Key components of Westpac’s transfer pricing frameworks are funds transfer pricing for interest rate and liquidity risk and allocation of basis and contingent liquidity costs, including capital allocation. SPPI Solely payments of principal and interest STVR Short term variable reward UNITE program A business-led, technology-enabled simplification program Value at Risk (VaR) A statistical estimate of the potential loss in earnings over a specified period of time and to a given level of confidence based on historical market movements. WIB Westpac Institutional Bank WNZL Westpac New Zealand Limited |
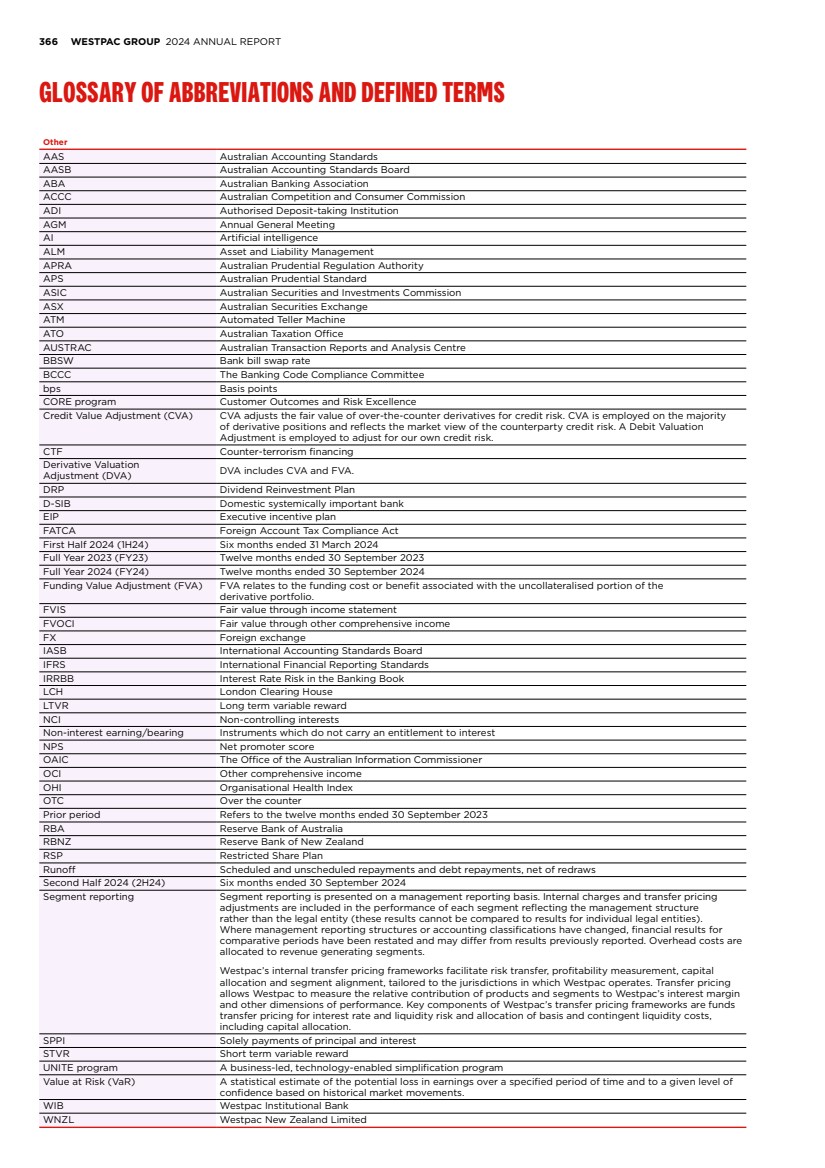
| FINANCIAL STATEMENTS EXHIBITS INDEX STRATEGIC REVIEW PERFORMANCE REVIEW SHAREHOLDER INFORMATION 367 This page has been intentionally left blank. |