Exhibit 1
| ASX RELEASE Westpac Banking Corporation Level 18, 275 Kent Street Sydney, NSW, 2000 3 November 2025 Westpac 2025 Sustainability Report Westpac Banking Corporation (“Westpac”) today provides the attached Westpac 2025 Sustainability Report. For further information: Hayden Cooper Justin McCarthy Group Head of Media Relations General Manager, Investor Relations 0402 393 619 0422 800 321 This document has been authorised for release by Tim Hartin, Company Secretary. |
| 2025 SUSTAINABILITY REPORT WESTPAC BANKING CORPORATION ABN 33 007 457 141 THIS REPORT INCLUDES CLIMATE-RELATED DISCLOSURES FOCUSED ON ALIGNING WITH AUSTRALIAN AND NEW ZEALAND STANDARDS. WESTPAC |
| INTRODUCTION GOVERNANCE STRATEGY RISK MANAGEMENT METRICS AND TARGETS APPENDIX 1 CONTENTS INTRODUCTION 2 GOVERNANCE 7 STRATEGY 12 Climate-related risks and opportunities 14 Our Climate Transition Plan 36 RISK MANAGEMENT 38 METRICS AND TARGETS 50 APPENDIX 70 1.Glossary 71 2. Methodology – Operational Emissions – Scope 1, 2 and Upstream Scope 3 74 3. Methodology – Scope 3 financed emissions 88 4. Methodology – Financed emissions sector targets 96 5. Methodology – Climate-related scenario analysis 107 6. Independent Assurance Statement 113 7.Disclaimer 117 “OUR PURPOSE IS TAKING ACTION NOW TO CREATE A BETTER FUTURE. ONE WAY WE ARE SEEKING TO DELIVER ON THIS IS THROUGH OUR AMBITION TO BECOME A NET-ZERO, CLIMATE RESILIENT BANK. IN THIS SUSTAINABILITY REPORT, WE OUTLINE OUR STRATEGIC APPROACH TO ADDRESSING CLIMATE-RELATED RISKS AND OPPORTUNITIES. WE SHARE OUR PROGRESS, THE CHALLENGES WE'VE ENCOUNTERED, AND THE ACTIONS WE'RE TAKING TO DELIVER ON OUR AMBITION AND DRIVE LONG-TERM VALUE.” WESTPAC CEO, ANTHONY MILLER Cover photo: Close-up photo of drops of water balancing delicately on a blade of grass. Three drops form the shape of the Westpac logo (AI-generated). ACKNOWLEDGEMENT OF INDIGENOUS PEOPLES We acknowledge the First Peoples of Australia and recognise their ongoing role as Traditional Owners of the land and waters of this country. We acknowledge Westpac’s Aboriginal and Torres Strait Islander employees, partners, and stakeholders, and pay our respects to their Elders, both past and present. In Aotearoa New Zealand we also acknowledge tāngata whenua and the unique relationship that Indigenous Peoples share with all New Zealanders under Te Tiriti o Waitangi. WESTPAC 2025 SUSTAINABILITY REPORT |
| INTRODUCTION GOVERNANCE STRATEGY RISK MANAGEMENT METRICS AND TARGETS APPENDIX 2 Important information ABOUT THIS REPORT The Westpac 2025 Sustainability Report (“Report”) outlines Westpac’s strategy, targets, and approach for addressing the risks and opportunities presented by climate change. The Appendix includes a Glossary of definitions along with methodologies for calculating our emissions and additional detail behind our scenario analysis. This Report forms part of Westpac’s 2025 reporting suite including our Annual Report, our Sustainability Index and Datasheet and other annual disclosures. Access the full suite at westpac.com.au. This Report covers the same consolidated reporting entity and reporting period as the Group’s 2025 Annual Report, unless indicated otherwise. It includes climate-related disclosures for Westpac and its subsidiaries across the markets it operates. This includes our operations within Westpac’s BT business in Australia. Certain scope 3 emissions for BT have not been calculated as they are immaterial. References to ‘Westpac’, ‘Group’, ‘Westpac Group’, ‘we’, ‘us’ and ‘our’ are to Westpac Banking Corporation ABN 33 007 457 141 and its subsidiaries unless stated otherwise. Our ambition is to become a net-zero climate resilient bank which means working towards net-zero emissions across our operations and our lending while building resilience to the physical impacts of climate change. This Report includes forward-looking statements – such as commitments, goals, targets, plans, estimates, assumptions and metrics – that inherently carry uncertainty, particularly in the context of climate reporting. These risks and uncertainties need to be considered when interpreting this Report. For an explanation of forward-looking statements and the risks, uncertainties and assumptions to which they are subject, see the Disclaimer in the Appendix. We define some of these forward-looking statements as follows: • Targets: Outcomes where we have identified one or more pathways for achievement by a set date. These are subject to certain assumptions, dependencies and limitations; • Commitments: Actions we are dedicated to taking and are within our direct control; • Aim: Actions we are striving to achieve that are outside our direct control and require a degree of collaboration or influence; and • Goal: A desired result or outcome that we intend to achieve. These may not always have a defined path or be within our direct control. CONSIDERATION OF CLIMATE-RELATED DISCLOSURE STANDARDS This Report was guided by the Australian Accounting Standards Board (AASB) S2 Climate-related Disclosures Standard but does not yet fully align. We are required to comply with AASB S2 for the year ended 30 September 2026. As we work towards compliance against AASB S2 and Aotearoa New Zealand Climate Standards (NZ CS), there are nuances between these Standards in how the impacts from climate-related risks and opportunities should be considered and disclosed. Under the NZ CS, climate-related impacts encompass all impacts arising from climate. In contrast, AASB S2 defines climate-related risks and opportunities as the potential negative and positive effects, respectively, that are associated specifically with climate change. OUR APPROACH TO CLIMATE REPORTING Outlining our approach to managing climate change risks and opportunities is challenging as measuring, reporting and the setting of targets relies on estimates, inexact data and the availability of appropriate methodologies. We strive to apply the best available data and consistent principles in our climate metrics noting estimates have inherent uncertainties. We ask readers to consider these limitations and focus on our intent. Over time, our climate-related data will evolve as new methodologies and technologies emerge and our stakeholders improve the measurement of their climate impacts, risks and opportunities. Our operational greenhouse gas (GHG) emissions metrics are reported using both location-based and market-based methods. Operational targets are absolute emission reduction targets set by applying a market-based accounting approach. Carbon offsets are not considered. Unless indicated otherwise, data in this Report is for the 2025 financial year, being the 12 months ended 30 September 2025 or at 30 September 2025. All amounts are in Australian dollars and emissions data is in a carbon dioxide equivalent (CO2-e). Due to timing of reporting and data availability, some information is reported using different time periods as set out below or as otherwise stated. KPMG has provided independent reasonable assurance over our scope 1, 2 and 3 upstream emissions, and limited assurance over selected metrics and targets within this Report. Their independent assurance statement is on page 113 to 116 of this Report. STATEMENT OF COMPLIANCE TO AOTEAROA NEW ZEALAND CLIMATE STANDARDS This Report complies with the NZ CS issued by the External Reporting Board. Westpac is a Climate Reporting Entity under the New Zealand Financial Markets Conduct Act 2013. Westpac is a listed issuer and registered bank in New Zealand. In preparing this Report, Westpac has elected to use the following adoption provisions from NZ CS 2 published by the External Reporting Board: • Adoption Provision 2: Anticipated financial impacts – exempts Westpac from disclosing anticipated financial impacts of climate risks and opportunities and a description of time horizons over which the anticipated financial impacts could reasonably be expected to occur; • Adoption Provision 4: Scope 3 Greenhouse Gas emissions – exempts Westpac from disclosing some categories of scope 3 gross Greenhouse Gas (GHG) emissions; • Adoption Provision 5: Comparatives for Scope 3 Greenhouse Gas emissions – exempts Westpac from disclosing comparative information for scope 3 GHG emissions; • Adoption Provision 6: Comparatives for metrics – permits Westpac to disclose comparative information for only one prior year for each metric disclosed in this Report; and • Adoption Provision 7: Analysis of trends – exempts Westpac from providing an analysis of main trends evident from a comparison of each metric to the prior two years. The NZ CS are broadly consistent with AASB S2, but where there are differences we have supplemented our disclosure to fully meet the NZ CS. By complying with the NZ CS for the Group we are no longer publishing a separate Climate Report for the Westpac New Zealand Branch. On behalf of Westpac on 2 November 2025: Metrics or Targets Reporting period • Operational emissions targets progress Reported for the 12 months ended 30 June 2025. • Financed emissions • Financed emissions sector target progress Reported one year in arrears. Latest reported period is for the 12 months to 30 September 2024. ___________________________ Anthony Miller Managing Director & CEO ___________________________ Steven Gregg Chairman WESTPAC 2025 SUSTAINABILITY REPORT |
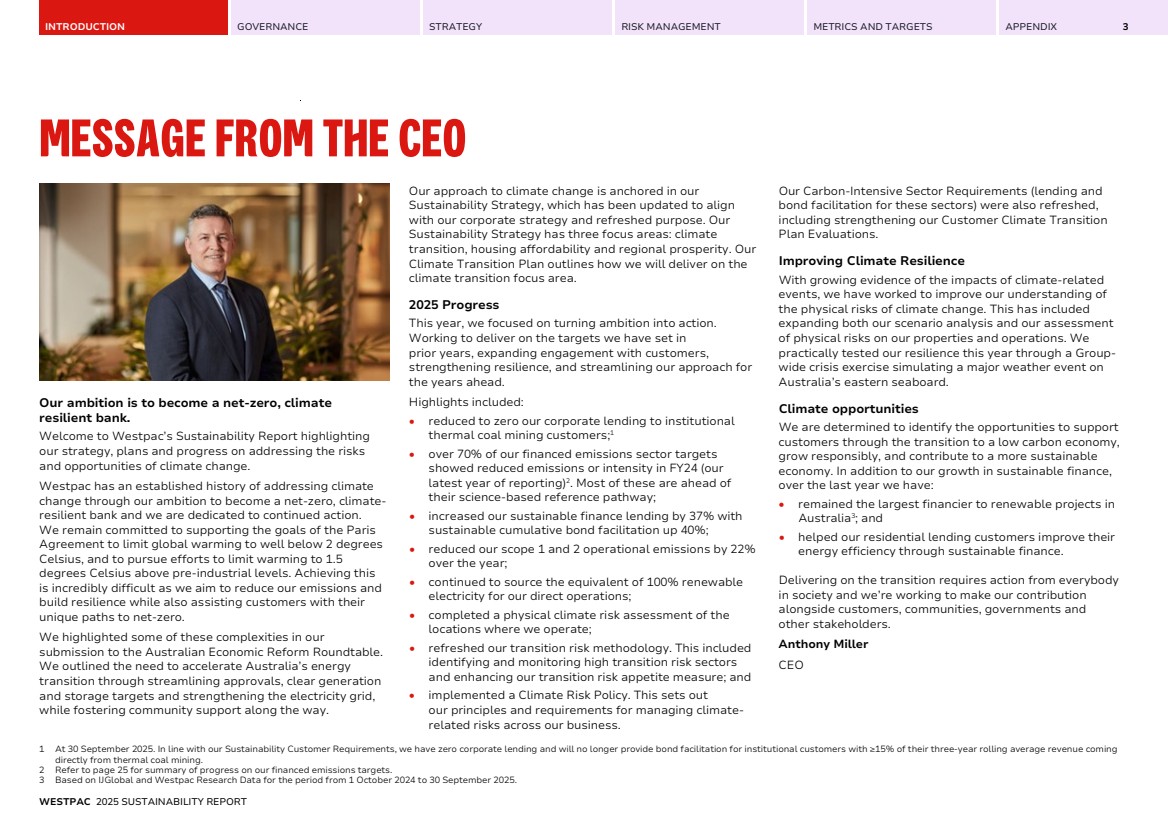
| INTRODUCTION GOVERNANCE STRATEGY RISK MANAGEMENT METRICS AND TARGETS APPENDIX 3 MESSAGE FROM THE CEO Our ambition is to become a net-zero, climate resilient bank. Welcome to Westpac’s Sustainability Report highlighting our strategy, plans and progress on addressing the risks and opportunities of climate change. Westpac has an established history of addressing climate change through our ambition to become a net-zero, climate-resilient bank and we are dedicated to continued action. We remain committed to supporting the goals of the Paris Agreement to limit global warming to well below 2 degrees Celsius, and to pursue efforts to limit warming to 1.5 degrees Celsius above pre-industrial levels. Achieving this is incredibly difficult as we aim to reduce our emissions and build resilience while also assisting customers with their unique paths to net-zero. We highlighted some of these complexities in our submission to the Australian Economic Reform Roundtable. We outlined the need to accelerate Australia’s energy transition through streamlining approvals, clear generation and storage targets and strengthening the electricity grid, while fostering community support along the way. Our approach to climate change is anchored in our Sustainability Strategy, which has been updated to align with our corporate strategy and refreshed purpose. Our Sustainability Strategy has three focus areas: climate transition, housing affordability and regional prosperity. Our Climate Transition Plan outlines how we will deliver on the climate transition focus area. 2025 Progress This year, we focused on turning ambition into action. Working to deliver on the targets we have set in prior years, expanding engagement with customers, strengthening resilience, and streamlining our approach for the years ahead. Highlights included: • reduced to zero our corporate lending to institutional thermal coal mining customers;1 • over 70% of our financed emissions sector targets showed reduced emissions or intensity in FY24 (our latest year of reporting)2 . Most of these are ahead of their science-based reference pathway; • increased our sustainable finance lending by 37% with sustainable cumulative bond facilitation up 40%; • reduced our scope 1 and 2 operational emissions by 22% over the year; • continued to source the equivalent of 100% renewable electricity for our direct operations; • completed a physical climate risk assessment of the locations where we operate; • refreshed our transition risk methodology. This included identifying and monitoring high transition risk sectors and enhancing our transition risk appetite measure; and • implemented a Climate Risk Policy. This sets out our principles and requirements for managing climate-related risks across our business. Our Carbon-Intensive Sector Requirements (lending and bond facilitation for these sectors) were also refreshed, including strengthening our Customer Climate Transition Plan Evaluations. Improving Climate Resilience With growing evidence of the impacts of climate-related events, we have worked to improve our understanding of the physical risks of climate change. This has included expanding both our scenario analysis and our assessment of physical risks on our properties and operations. We practically tested our resilience this year through a Group-wide crisis exercise simulating a major weather event on Australia’s eastern seaboard. Climate opportunities We are determined to identify the opportunities to support customers through the transition to a low carbon economy, grow responsibly, and contribute to a more sustainable economy. In addition to our growth in sustainable finance, over the last year we have: • remained the largest financier to renewable projects in Australia3 ; and • helped our residential lending customers improve their energy efficiency through sustainable finance. Delivering on the transition requires action from everybody in society and we’re working to make our contribution alongside customers, communities, governments and other stakeholders. Anthony Miller CEO 1 At 30 September 2025. In line with our Sustainability Customer Requirements, we have zero corporate lending and will no longer provide bond facilitation for institutional customers with ≥15% of their three-year rolling average revenue coming directly from thermal coal mining. 2 Refer to page 25 for summary of progress on our financed emissions targets. 3 Based on IJGlobal and Westpac Research Data for the period from 1 October 2024 to 30 September 2025. WESTPAC 2025 SUSTAINABILITY REPORT |
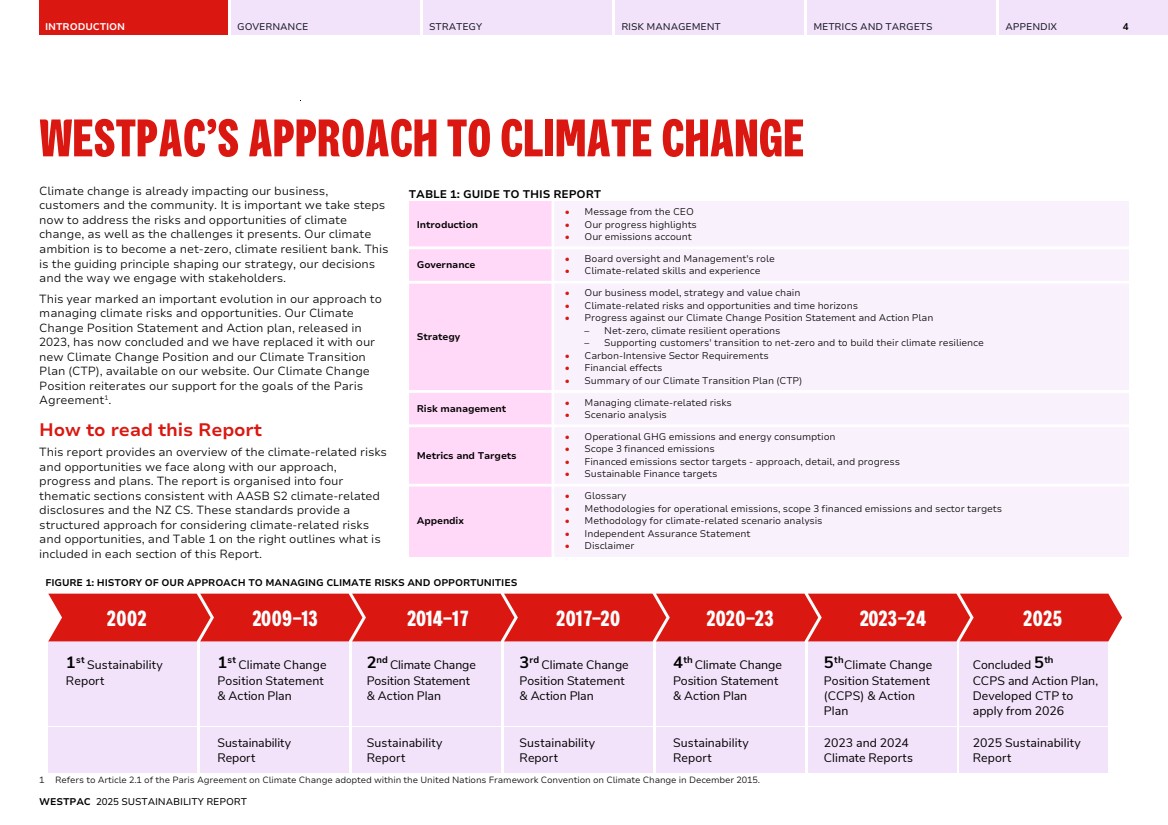
| INTRODUCTION GOVERNANCE STRATEGY RISK MANAGEMENT METRICS AND TARGETS APPENDIX 4 WESTPAC’S APPROACH TO CLIMATE CHANGE Climate change is already impacting our business, customers and the community. It is important we take steps now to address the risks and opportunities of climate change, as well as the challenges it presents. Our climate ambition is to become a net-zero, climate resilient bank. This is the guiding principle shaping our strategy, our decisions and the way we engage with stakeholders. This year marked an important evolution in our approach to managing climate risks and opportunities. Our Climate Change Position Statement and Action plan, released in 2023, has now concluded and we have replaced it with our new Climate Change Position and our Climate Transition Plan (CTP), available on our website. Our Climate Change Position reiterates our support for the goals of the Paris Agreement1 . How to read this Report This report provides an overview of the climate-related risks and opportunities we face along with our approach, progress and plans. The report is organised into four thematic sections consistent with AASB S2 climate-related disclosures and the NZ CS. These standards provide a structured approach for considering climate-related risks and opportunities, and Table 1 on the right outlines what is included in each section of this Report. FIGURE 1: HISTORY OF OUR APPROACH TO MANAGING CLIMATE RISKS AND OPPORTUNITIES 1st Sustainability Report 1st Climate Change Position Statement & Action Plan 2ndClimate Change Position Statement & Action Plan 3rd Climate Change Position Statement & Action Plan 4thClimate Change Position Statement & Action Plan 5thClimate Change Position Statement (CCPS) & Action Plan Concluded 5th CCPS and Action Plan, Developed CTP to apply from 2026 Sustainability Report Sustainability Report Sustainability Report Sustainability Report 2023 and 2024 Climate Reports 2025 Sustainability Report 2002 2009–13 2014–17 2017–20 2020–23 2023–24 2025 1 Refers to Article 2.1 of the Paris Agreement on Climate Change adopted within the United Nations Framework Convention on Climate Change in December 2015. TABLE 1: GUIDE TO THIS REPORT Introduction • Message from the CEO • Our progress highlights • Our emissions account Governance • Board oversight and Management's role • Climate-related skills and experience Strategy • Our business model, strategy and value chain • Climate-related risks and opportunities and time horizons • Progress against our Climate Change Position Statement and Action Plan – Net-zero, climate resilient operations – Supporting customers' transition to net-zero and to build their climate resilience • Carbon-Intensive Sector Requirements • Financial effects • Summary of our Climate Transition Plan (CTP) Risk management • Managing climate-related risks • Scenario analysis Metrics and Targets • Operational GHG emissions and energy consumption • Scope 3 financed emissions • Financed emissions sector targets - approach, detail, and progress • Sustainable Finance targets Appendix • Glossary • Methodologies for operational emissions, scope 3 financed emissions and sector targets • Methodology for climate-related scenario analysis • Independent Assurance Statement • Disclaimer WESTPAC 2025 SUSTAINABILITY REPORT |
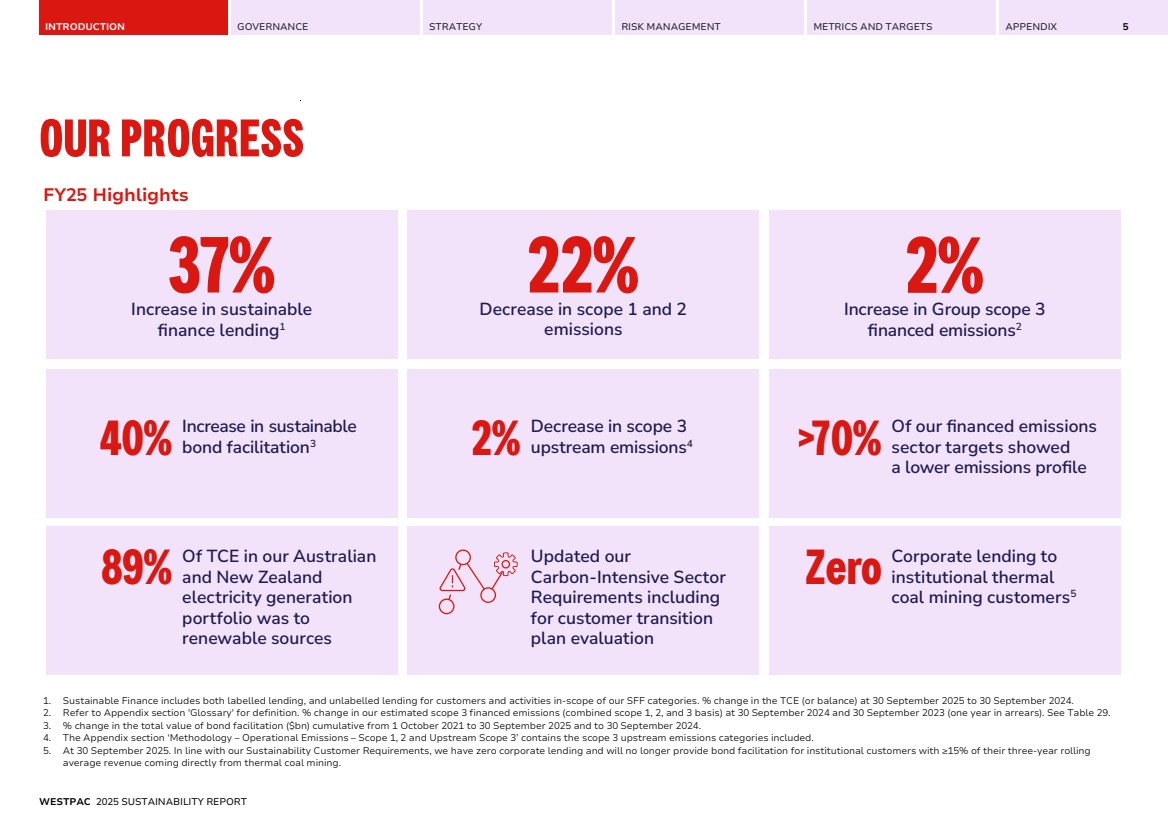
| INTRODUCTION GOVERNANCE STRATEGY RISK MANAGEMENT METRICS AND TARGETS APPENDIX 5 OUR PROGRESS FY25 Highlights Increase in sustainable 37% finance lending1 Decrease in scope 1 and 2 emissions 22% Increase in Group scope 3 2% financed emissions2 2% Decrease in scope 3 upstream emissions 40% 4 Increase in sustainable bond facilitation3 >70% 89% Zero Of our financed emissions sector targets showed a lower emissions profile Of TCE in our Australian and New Zealand electricity generation portfolio was to renewable sources Updated our Carbon-Intensive Sector Requirements including for customer transition plan evaluation Corporate lending to institutional thermal coal mining customers5 1. Sustainable Finance includes both labelled lending, and unlabelled lending for customers and activities in-scope of our SFF categories. % change in the TCE (or balance) at 30 September 2025 to 30 September 2024. 2. Refer to Appendix section 'Glossary' for definition. % change in our estimated scope 3 financed emissions (combined scope 1, 2, and 3 basis) at 30 September 2024 and 30 September 2023 (one year in arrears). See Table 29. 3. % change in the total value of bond facilitation ($bn) cumulative from 1 October 2021 to 30 September 2025 and to 30 September 2024. 4. The Appendix section ‘Methodology – Operational Emissions – Scope 1, 2 and Upstream Scope 3’ contains the scope 3 upstream emissions categories included. 5. At 30 September 2025. In line with our Sustainability Customer Requirements, we have zero corporate lending and will no longer provide bond facilitation for institutional customers with ≥15% of their three-year rolling average revenue coming directly from thermal coal mining. WESTPAC 2025 SUSTAINABILITY REPORT |
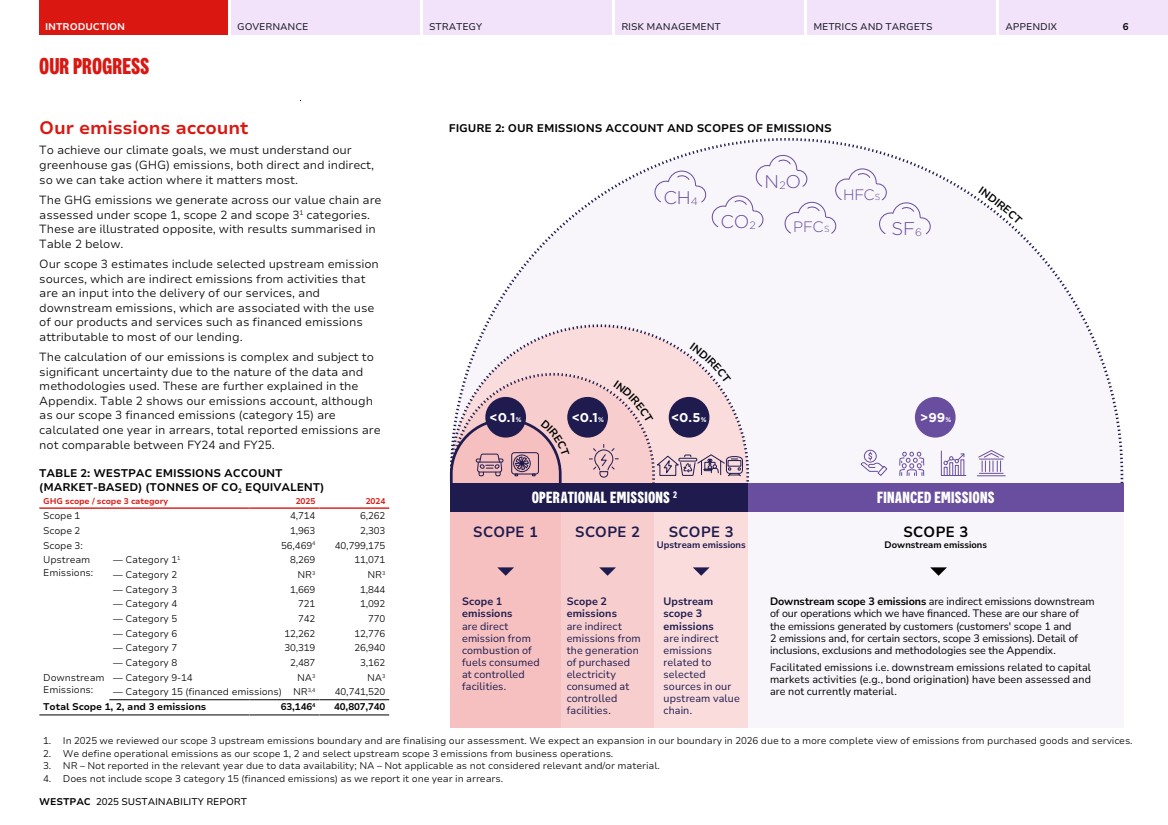
| INTRODUCTION GOVERNANCE STRATEGY RISK MANAGEMENT METRICS AND TARGETS APPENDIX OUR PROGRESS 6 Our emissions account To achieve our climate goals, we must understand our greenhouse gas (GHG) emissions, both direct and indirect, so we can take action where it matters most. The GHG emissions we generate across our value chain are assessed under scope 1, scope 2 and scope 31 categories. These are illustrated opposite, with results summarised in Table 2 below. Our scope 3 estimates include selected upstream emission sources, which are indirect emissions from activities that are an input into the delivery of our services, and downstream emissions, which are associated with the use of our products and services such as financed emissions attributable to most of our lending. The calculation of our emissions is complex and subject to significant uncertainty due to the nature of the data and methodologies used. These are further explained in the Appendix. Table 2 shows our emissions account, although as our scope 3 financed emissions (category 15) are calculated one year in arrears, total reported emissions are not comparable between FY24 and FY25. TABLE 2: WESTPAC EMISSIONS ACCOUNT (MARKET-BASED) (TONNES OF CO2 EQUIVALENT) GHG scope / scope 3 category 2025 2024 Scope 1 4,714 6,262 Scope 2 1,963 2,303 Scope 3: 56,4694 40,799,175 Upstream Emissions: — Category 11 8,269 11,071 — Category 2 NR3 NR3 — Category 3 1,669 1,844 — Category 4 721 1,092 — Category 5 742 770 — Category 6 12,262 12,776 — Category 7 30,319 26,940 — Category 8 2,487 3,162 Downstream Emissions: — Category 9-14 NA3 NA3 — Category 15 (financed emissions) NR3,4 40,741,520 Total Scope 1, 2, and 3 emissions 63,1464 40,807,740 FIGURE 2: OUR EMISSIONS ACCOUNT AND SCOPES OF EMISSIONS >99% INDIRECT Downstream scope 3 emissions are indirect emissions downstream of our operations which we have financed. These are our share of the emissions generated by customers (customers' scope 1 and 2 emissions and, for certain sectors, scope 3 emissions). Detail of inclusions, exclusions and methodologies see the Appendix. Facilitated emissions i.e. downstream emissions related to capital markets activities (e.g., bond origination) have been assessed and are not currently material. CH4 CO2 N2O HFCS PFCS SF6 D <0.1% <0.5% IRECT INDIRECT INDIRECT <0.1% SCOPE 1 SCOPE 2 SCOPE 3 Downstream emissions SCOPE 3 Upstream emissions Upstream scope 3 emissions are indirect emissions related to selected sources in our upstream value chain. Scope 2 emissions are indirect emissions from the generation of purchased electricity consumed at controlled facilities. Scope 1 emissions are direct emission from combustion of fuels consumed at controlled facilities. OPERATIONAL EMISSIONS 2 FINANCED EMISSIONS 1. In 2025 we reviewed our scope 3 upstream emissions boundary and are finalising our assessment. We expect an expansion in our boundary in 2026 due to a more complete view of emissions from purchased goods and services. 2. We define operational emissions as our scope 1, 2 and select upstream scope 3 emissions from business operations. 3. NR – Not reported in the relevant year due to data availability; NA – Not applicable as not considered relevant and/or material. 4. Does not include scope 3 category 15 (financed emissions) as we report it one year in arrears. WESTPAC 2025 SUSTAINABILITY REPORT |
| INTRODUCTION GOVERNANCE STRATEGY RISK MANAGEMENT METRICS AND TARGETS APPENDIX 7 GOVERNANCE |
| INTRODUCTION GOVERNANCE STRATEGY RISK MANAGEMENT METRICS AND TARGETS APPENDIX 8 GOVERNANCE Westpac’s governance reflects the key role that sustainability plays in our performance, prospects and strategy. A summary of our governance structure is provided on the following page, and comprises the Board, its Committees along with a range of executive and management committees. This summary also shows how climate-related information flows through our governance structure. Board oversight Under its Charter, the Board is responsible for considering the social, ethical and environmental impact of our activities, and for setting standards and monitoring compliance with our sustainability policies and practices. The Board approves key sustainability matters such as the sustainability strategy, the Climate Transition Plan and Human Rights Position Statement. It also monitors progress against certain targets and provides oversight of risks and opportunities. Committees in place to support Board oversight The following Board Committees operate under their respective Charters to support oversight responsibilities, including those related to sustainability and climate risk. • Board Risk Committee: Provides oversight of the implementation and operation of Westpac’s risk management framework. It also oversees the monitoring and management of our reputation and sustainability risk profile, performance and controls, including in relation to climate risk; • Board Audit Committee: Has oversight of the integrity of the financial statements and financial reporting and systems, including the sustainability disclosures in the Interim Financial Statements, Annual Report and the Sustainability Report. It also reviews the process by which management assures the integrity of information released in sustainability reporting; and • Board Remuneration Committee: Assists the Board by overseeing the design, operation and monitoring of the remuneration framework. It also assesses the Short-Term Variable Reward Scorecard, including climate-related measures. The Board and Board Committee Charters are on our website and are reviewed regularly. Board and Committee meeting agendas are structured to address each of the responsibilities contained in the relevant Charter, including climate-related topics and decisions. Agendas are approved by the relevant Board or Committee Chair with input from the Company Secretary and subject matter experts. Agenda items are ordinarily supported by a management paper or verbal update that either provides an update on the relevant matter for informational purposes or seeks formal approval from the Board or Committee. Refer to Table 3 for a non-exhaustive summary of matters considered by the Board and its Committees related to sustainability including climate-related risks and opportunities in FY25. Governance of climate strategy and targets The Board has approved Westpac’s strategy and has oversight of its implementation along with its business plan, and significant corporate initiatives. Sustainability risks and opportunities are incorporated in the strategic planning, capital deployment and funding decision-making processes. In FY25, the consideration of climate risks and opportunities as part of the Group’s strategy setting process included: • Outlining climate and sustainability strategic priorities for FY25-30 in Divisional strategies; • Conducting an analysis of potential growth in renewables and energy transition to identify climate-related opportunities and integrate them into our strategic and financial planning; and • Reviewing trade-offs associated with climate-related risks and opportunities. This included considering different strategic options for climate transition and assessing the emerging risks posed by the current global sentiment on Sustainability. We’ve set 2030 targets to support our climate strategy, guided by our Climate Transition Plan and ambition. Progress towards climate-related targets is monitored through internal management reporting of specific metrics. These include regular progress reports to the Board and management-level committees, as well as periodic reviews of performance against targets. WESTPAC 2025 SUSTAINABILITY REPORT |
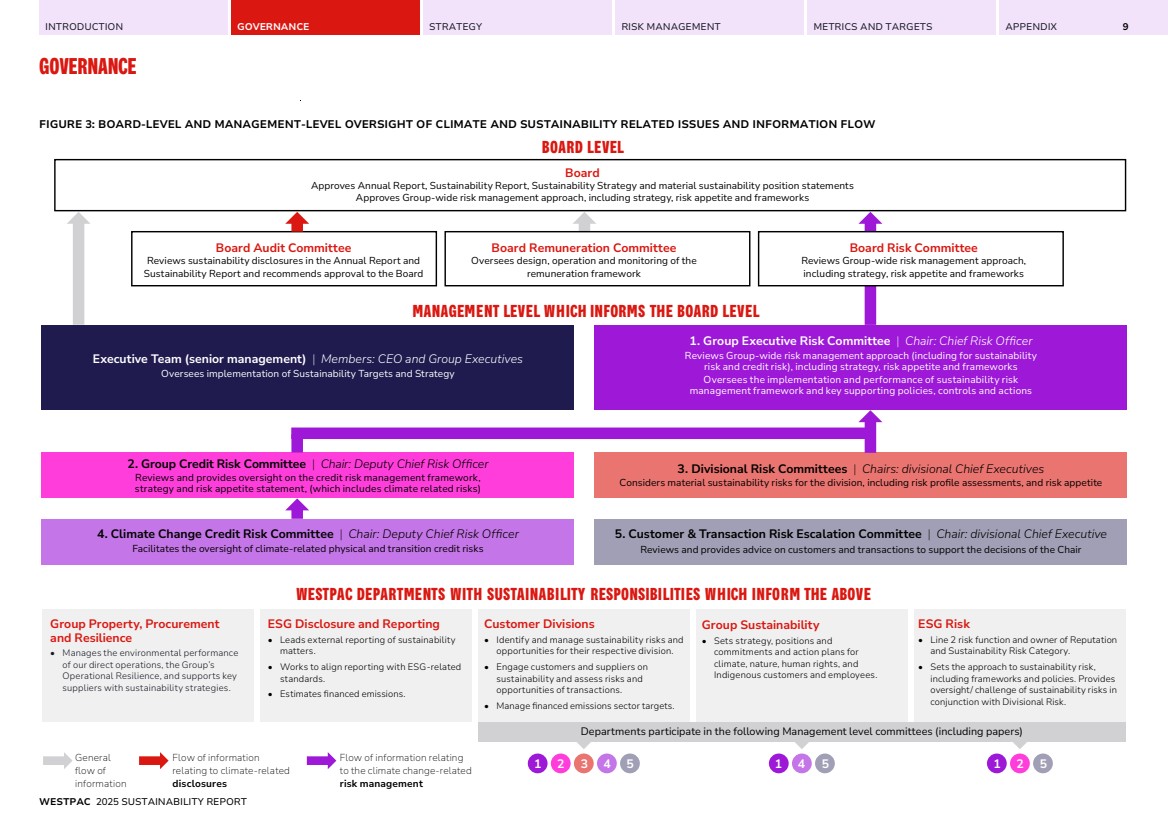
| INTRODUCTION GOVERNANCE STRATEGY RISK MANAGEMENT METRICS AND TARGETS APPENDIX GOVERNANCE 9 FIGURE 3: BOARD-LEVEL AND MANAGEMENT-LEVEL OVERSIGHT OF CLIMATE AND SUSTAINABILITY RELATED ISSUES AND INFORMATION FLOW BOARD LEVEL Board Audit Committee Reviews sustainability disclosures in the Annual Report and Sustainability Report and recommends approval to the Board Board Remuneration Committee Oversees design, operation and monitoring of the remuneration framework Board Risk Committee Reviews Group-wide risk management approach, including strategy, risk appetite and frameworks Group Property, Procurement and Resilience • Manages the environmental performance of our direct operations, the Group’s Operational Resilience, and supports key suppliers with sustainability strategies. General flow of information Flow of information relating to climate-related disclosures Flow of information relating to the climate change-related risk management Departments participate in the following Management level committees (including papers) ESG Disclosure and Reporting • Leads external reporting of sustainability matters. • Works to align reporting with ESG-related standards. • Estimates financed emissions. Customer Divisions • Identify and manage sustainability risks and opportunities for their respective division. • Engage customers and suppliers on sustainability and assess risks and opportunities of transactions. • Manage financed emissions sector targets. Group Sustainability • Sets strategy, positions and commitments and action plans for climate, nature, human rights, and Indigenous customers and employees. ESG Risk • Line 2 risk function and owner of Reputation and Sustainability Risk Category. • Sets the approach to sustainability risk, including frameworks and policies. Provides oversight/ challenge of sustainability risks in conjunction with Divisional Risk. WESTPAC DEPARTMENTS WITH SUSTAINABILITY RESPONSIBILITIES WHICH INFORM THE ABOVE MANAGEMENT LEVEL WHICH INFORMS THE BOARD LEVEL Board Approves Annual Report, Sustainability Report, Sustainability Strategy and material sustainability position statements Approves Group-wide risk management approach, including strategy, risk appetite and frameworks 2. Group Credit Risk Committee | Chair: Deputy Chief Risk Officer Reviews and provides oversight on the credit risk management framework, strategy and risk appetite statement, (which includes climate related risks) 3. Divisional Risk Committees | Chairs: divisional Chief Executives Considers material sustainability risks for the division, including risk profile assessments, and risk appetite 4. Climate Change Credit Risk Committee | Chair: Deputy Chief Risk Officer Facilitates the oversight of climate-related physical and transition credit risks 5. Customer & Transaction Risk Escalation Committee | Chair: divisional Chief Executive Reviews and provides advice on customers and transactions to support the decisions of the Chair Executive Team (senior management) | Members: CEO and Group Executives Oversees implementation of Sustainability Targets and Strategy 1. Group Executive Risk Committee | Chair: Chief Risk Officer Reviews Group-wide risk management approach (including for sustainability risk and credit risk), including strategy, risk appetite and frameworks Oversees the implementation and performance of sustainability risk management framework and key supporting policies, controls and actions 1 2 3 4 5 1 4 5 1 2 5 WESTPAC 2025 SUSTAINABILITY REPORT |
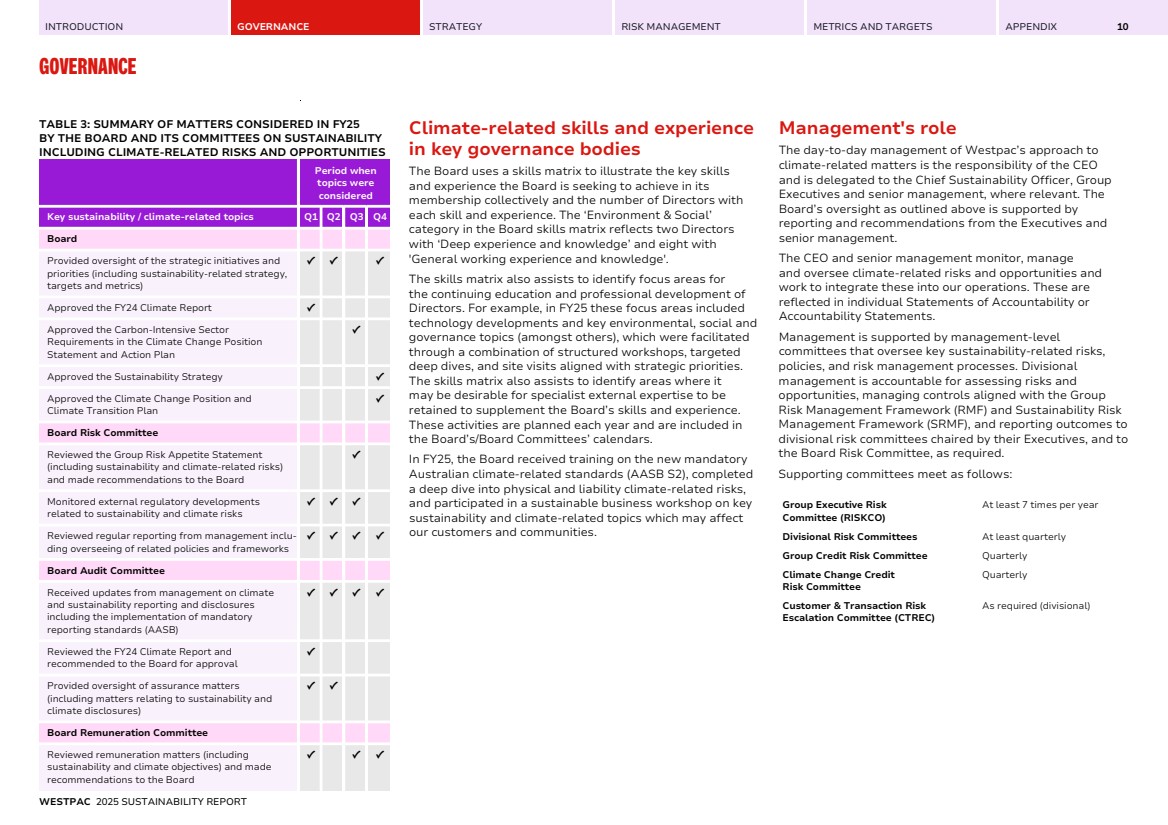
| INTRODUCTION GOVERNANCE STRATEGY RISK MANAGEMENT METRICS AND TARGETS APPENDIX GOVERNANCE 10 TABLE 3: SUMMARY OF MATTERS CONSIDERED IN FY25 BY THE BOARD AND ITS COMMITTEES ON SUSTAINABILITY INCLUDING CLIMATE-RELATED RISKS AND OPPORTUNITIES Period when topics were considered Key sustainability / climate-related topics Q1 Q2 Q3 Q4 Board Provided oversight of the strategic initiatives and priorities (including sustainability-related strategy, targets and metrics) ✔ ✔ ✔ Approved the FY24 Climate Report ✔ Approved the Carbon-Intensive Sector Requirements in the Climate Change Position Statement and Action Plan ✔ Approved the Sustainability Strategy ✔ Approved the Climate Change Position and Climate Transition Plan ✔ Board Risk Committee Reviewed the Group Risk Appetite Statement (including sustainability and climate-related risks) and made recommendations to the Board ✔ Monitored external regulatory developments related to sustainability and climate risks ✔ ✔ ✔ Reviewed regular reporting from management inclu-ding overseeing of related policies and frameworks ✔ ✔ ✔ ✔ Board Audit Committee Received updates from management on climate and sustainability reporting and disclosures including the implementation of mandatory reporting standards (AASB) ✔ ✔ ✔ ✔ Reviewed the FY24 Climate Report and recommended to the Board for approval ✔ Provided oversight of assurance matters (including matters relating to sustainability and climate disclosures) ✔ ✔ Board Remuneration Committee Reviewed remuneration matters (including sustainability and climate objectives) and made recommendations to the Board ✔ ✔ ✔ Climate-related skills and experience in key governance bodies The Board uses a skills matrix to illustrate the key skills and experience the Board is seeking to achieve in its membership collectively and the number of Directors with each skill and experience. The ‘Environment & Social’ category in the Board skills matrix reflects two Directors with ‘Deep experience and knowledge’ and eight with 'General working experience and knowledge'. The skills matrix also assists to identify focus areas for the continuing education and professional development of Directors. For example, in FY25 these focus areas included technology developments and key environmental, social and governance topics (amongst others), which were facilitated through a combination of structured workshops, targeted deep dives, and site visits aligned with strategic priorities. The skills matrix also assists to identify areas where it may be desirable for specialist external expertise to be retained to supplement the Board’s skills and experience. These activities are planned each year and are included in the Board’s/Board Committees’ calendars. In FY25, the Board received training on the new mandatory Australian climate-related standards (AASB S2), completed a deep dive into physical and liability climate-related risks, and participated in a sustainable business workshop on key sustainability and climate-related topics which may affect our customers and communities. Management's role The day-to-day management of Westpac’s approach to climate-related matters is the responsibility of the CEO and is delegated to the Chief Sustainability Officer, Group Executives and senior management, where relevant. The Board’s oversight as outlined above is supported by reporting and recommendations from the Executives and senior management. The CEO and senior management monitor, manage and oversee climate-related risks and opportunities and work to integrate these into our operations. These are reflected in individual Statements of Accountability or Accountability Statements. Management is supported by management-level committees that oversee key sustainability-related risks, policies, and risk management processes. Divisional management is accountable for assessing risks and opportunities, managing controls aligned with the Group Risk Management Framework (RMF) and Sustainability Risk Management Framework (SRMF), and reporting outcomes to divisional risk committees chaired by their Executives, and to the Board Risk Committee, as required. Supporting committees meet as follows: Group Executive Risk Committee (RISKCO) At least 7 times per year Divisional Risk Committees At least quarterly Group Credit Risk Committee Quarterly Climate Change Credit Risk Committee Quarterly Customer & Transaction Risk Escalation Committee (CTREC) As required (divisional) WESTPAC 2025 SUSTAINABILITY REPORT |
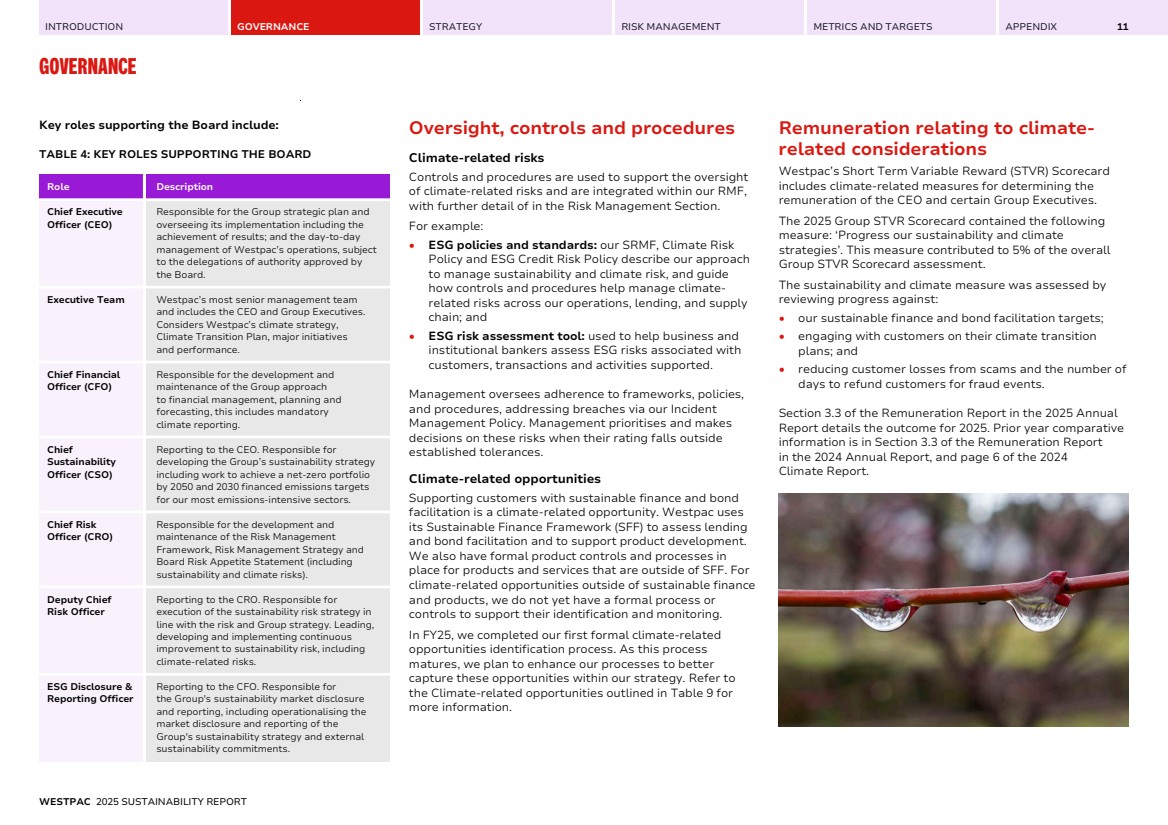
| INTRODUCTION GOVERNANCE STRATEGY RISK MANAGEMENT METRICS AND TARGETS APPENDIX GOVERNANCE 11 Key roles supporting the Board include: TABLE 4: KEY ROLES SUPPORTING THE BOARD Role Description Chief Executive Officer (CEO) Responsible for the Group strategic plan and overseeing its implementation including the achievement of results; and the day-to-day management of Westpac’s operations, subject to the delegations of authority approved by the Board. Executive Team Westpac’s most senior management team and includes the CEO and Group Executives. Considers Westpac’s climate strategy, Climate Transition Plan, major initiatives and performance. Chief Financial Officer (CFO) Responsible for the development and maintenance of the Group approach to financial management, planning and forecasting, this includes mandatory climate reporting. Chief Sustainability Officer (CSO) Reporting to the CEO. Responsible for developing the Group’s sustainability strategy including work to achieve a net-zero portfolio by 2050 and 2030 financed emissions targets for our most emissions-intensive sectors. Chief Risk Officer (CRO) Responsible for the development and maintenance of the Risk Management Framework, Risk Management Strategy and Board Risk Appetite Statement (including sustainability and climate risks). Deputy Chief Risk Officer Reporting to the CRO. Responsible for execution of the sustainability risk strategy in line with the risk and Group strategy. Leading, developing and implementing continuous improvement to sustainability risk, including climate-related risks. ESG Disclosure & Reporting Officer Reporting to the CFO. Responsible for the Group's sustainability market disclosure and reporting, including operationalising the market disclosure and reporting of the Group's sustainability strategy and external sustainability commitments. Oversight, controls and procedures Climate-related risks Controls and procedures are used to support the oversight of climate-related risks and are integrated within our RMF, with further detail of in the Risk Management Section. For example: • ESG policies and standards: our SRMF, Climate Risk Policy and ESG Credit Risk Policy describe our approach to manage sustainability and climate risk, and guide how controls and procedures help manage climate-related risks across our operations, lending, and supply chain; and • ESG risk assessment tool: used to help business and institutional bankers assess ESG risks associated with customers, transactions and activities supported. Management oversees adherence to frameworks, policies, and procedures, addressing breaches via our Incident Management Policy. Management prioritises and makes decisions on these risks when their rating falls outside established tolerances. Climate-related opportunities Supporting customers with sustainable finance and bond facilitation is a climate-related opportunity. Westpac uses its Sustainable Finance Framework (SFF) to assess lending and bond facilitation and to support product development. We also have formal product controls and processes in place for products and services that are outside of SFF. For climate-related opportunities outside of sustainable finance and products, we do not yet have a formal process or controls to support their identification and monitoring. In FY25, we completed our first formal climate-related opportunities identification process. As this process matures, we plan to enhance our processes to better capture these opportunities within our strategy. Refer to the Climate-related opportunities outlined in Table 9 for more information. Remuneration relating to climate-related considerations Westpac’s Short Term Variable Reward (STVR) Scorecard includes climate-related measures for determining the remuneration of the CEO and certain Group Executives. The 2025 Group STVR Scorecard contained the following measure: ‘Progress our sustainability and climate strategies’. This measure contributed to 5% of the overall Group STVR Scorecard assessment. The sustainability and climate measure was assessed by reviewing progress against: • our sustainable finance and bond facilitation targets; • engaging with customers on their climate transition plans; and • reducing customer losses from scams and the number of days to refund customers for fraud events. Section 3.3 of the Remuneration Report in the 2025 Annual Report details the outcome for 2025. Prior year comparative information is in Section 3.3 of the Remuneration Report in the 2024 Annual Report, and page 6 of the 2024 Climate Report. WESTPAC 2025 SUSTAINABILITY REPORT |
| INTRODUCTION GOVERNANCE STRATEGY RISK MANAGEMENT METRICS AND TARGETS APPENDIX 12 STRATEGY CONTENTS OUR STRATEGY 13 CLIMATE-RELATED RISKS AND OPPORTUNITIES 14 NET-ZERO, CLIMATE RESILIENT OPERATIONS 19 SUPPORTING CUSTOMERS' TRANSITION TO NET-ZERO AND TO BUILD THEIR CLIMATE RESILIENCE 23 FINANCIAL EFFECTS 34 OUR CLIMATE TRANSITION PLAN 36 |
| INTRODUCTION GOVERNANCE STRATEGY RISK MANAGEMENT METRICS AND TARGETS APPENDIX 13 OUR STRATEGY Westpac's business model, strategy and value chain Westpac is a retail, commercial and institutional bank providing a full range of banking products and services in our core markets of Australia and New Zealand. Banking services are also provided in Papua New Guinea and Fiji. We also operate a small number of international offices mainly supporting customers with connections to our core markets. We operate select wealth management and related activities although these are not a material part of our business. We generate cash flows through the provision of banking services including net interest income along with fee income on other financial services, trading income and certain financial markets instruments. Costs of the business include operating expenses and impairment charges linked to the risks of providing lending. These activities underpin our business model and value chain, outlined in Table 5. Climate-related risks and opportunities may affect Westpac’s business model, strategy and value chain. This section outlines how climate change is currently impacting Westpac, how it may do so in the future, and how we are responding. Our strategic approach We have long appreciated that climate change is a significant factor affecting our business, customers and the communities in which we operate, and that its effects are likely to become more material over time. Our strategic approach to climate change is guided by our ambition to be a net-zero climate-resilient bank. This in turn is founded on understanding how climate change may impact our operations and customers and determining appropriate responses. Our approach over the year followed the three areas of our 2023-2025 Climate Change Position Statement (CCPS) and Action Plan: 1. Net-zero climate resilient operations; 2. Supporting customers' transition to net-zero and to build their climate resilience; and 3. Collaborate for impact on initiatives towards net-zero and climate resilience. In building our understanding of climate change we engage with a range of stakeholders, and conduct scenario analysis on climate-related risks and opportunities which may affect our prospects. This is assisting us to manage risks, develop and distribute products, better engage with customers and suppliers, and work to improve our climate resilience. Looking ahead, we have built on our progress by releasing a Climate Transition Plan (CTP) and a Climate Change Position. These continue our trajectory towards our 2030 targets, detail our aspirations, and outline the actions and metrics for tracking progress. The Climate Change Position builds on our ambition and principles of the CCPS. It summarises our climate ambition, and our commitment to managing our business to support the goals of the Paris Agreement. It also outlines the principles that guide our decisions and actions. This Report outlines commitments and targets related to our operations, financed emissions, sustainable finance, and focus areas such as decarbonisation and resilience for both our customers and our operations. Our targets and focus areas established in our CCPS will continue under our CTP. The CTP is summarised on page 37 and a full copy is on our website. TABLE 5: OVERVIEW OF WESTPAC'S BUSINESS MODEL, STRATEGY, AND VALUE CHAIN Term Description Business model Our business model as a bank is built around financial intermediation, accepting deposits, raising wholesale funding, and offering lending and financing solutions. Aligned to this is the provision of savings and transaction accounts and facilitating payments. Strategy Westpac's corporate strategy is guided by its purpose – Taking action now to create a better future – and is framed by five priorities: delivering for our customers every day, our people being the best team and trusted experts, embracing change to simplify and deliver what matters most, managing risk to be safe and strong and driving performance through execution excellence. Value chain Our value chain represents the activities that support our business model and strategy. In summary it includes: • Funding – deposits and wholesale • Operations – technology and people • Lending – loans and other finance to customers • Other products/services – transactions, markets • Marketing/Sales – including third parties • Support – Customer service WESTPAC 2025 SUSTAINABILITY REPORT |
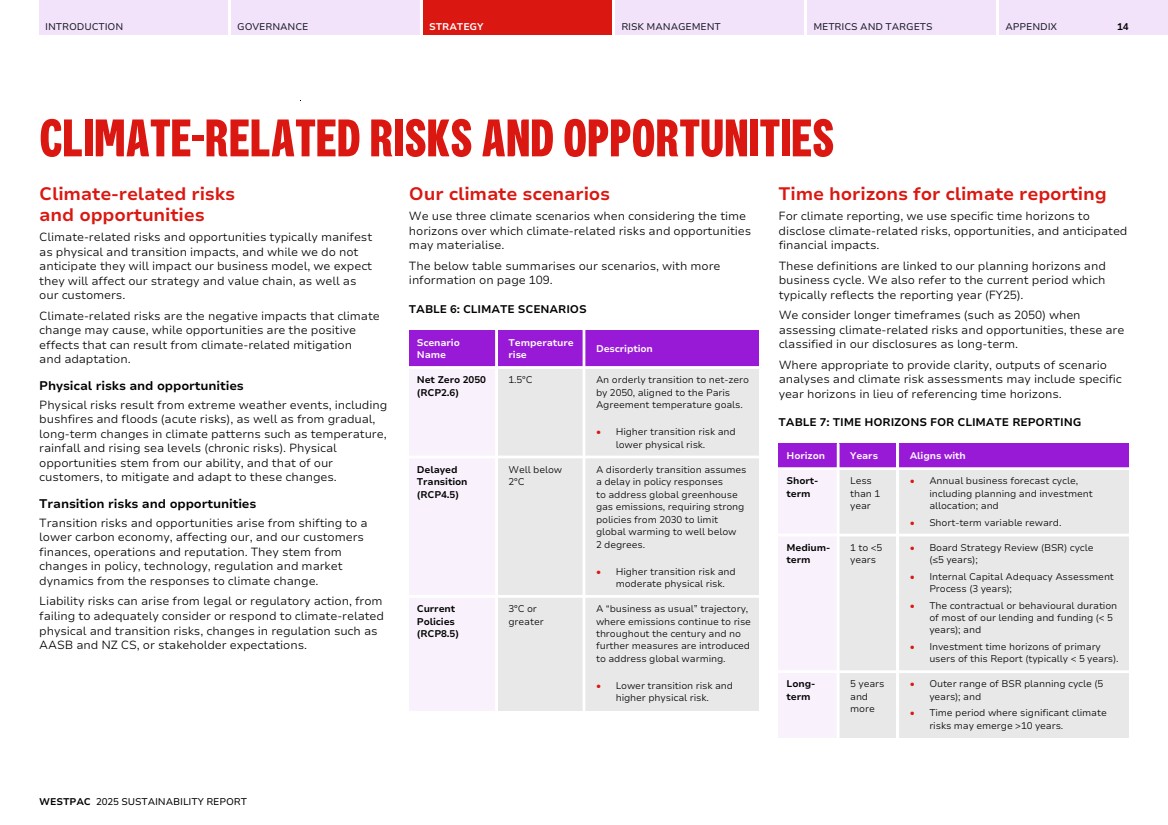
| INTRODUCTION GOVERNANCE STRATEGY RISK MANAGEMENT METRICS AND TARGETS APPENDIX 14 CLIMATE-RELATED RISKS AND OPPORTUNITIES Climate-related risks and opportunities Climate-related risks and opportunities typically manifest as physical and transition impacts, and while we do not anticipate they will impact our business model, we expect they will affect our strategy and value chain, as well as our customers. Climate-related risks are the negative impacts that climate change may cause, while opportunities are the positive effects that can result from climate-related mitigation and adaptation. Physical risks and opportunities Physical risks result from extreme weather events, including bushfires and floods (acute risks), as well as from gradual, long-term changes in climate patterns such as temperature, rainfall and rising sea levels (chronic risks). Physical opportunities stem from our ability, and that of our customers, to mitigate and adapt to these changes. Transition risks and opportunities Transition risks and opportunities arise from shifting to a lower carbon economy, affecting our, and our customers finances, operations and reputation. They stem from changes in policy, technology, regulation and market dynamics from the responses to climate change. Liability risks can arise from legal or regulatory action, from failing to adequately consider or respond to climate-related physical and transition risks, changes in regulation such as AASB and NZ CS, or stakeholder expectations. Our climate scenarios We use three climate scenarios when considering the time horizons over which climate-related risks and opportunities may materialise. The below table summarises our scenarios, with more information on page 109. TABLE 6: CLIMATE SCENARIOS Scenario Name Temperature rise Description Net Zero 2050 (RCP2.6) 1.5°C An orderly transition to net-zero by 2050, aligned to the Paris Agreement temperature goals. • Higher transition risk and lower physical risk. Delayed Transition (RCP4.5) Well below 2°C A disorderly transition assumes a delay in policy responses to address global greenhouse gas emissions, requiring strong policies from 2030 to limit global warming to well below 2 degrees. • Higher transition risk and moderate physical risk. Current Policies (RCP8.5) 3°C or greater A “business as usual” trajectory, where emissions continue to rise throughout the century and no further measures are introduced to address global warming. • Lower transition risk and higher physical risk. Time horizons for climate reporting For climate reporting, we use specific time horizons to disclose climate-related risks, opportunities, and anticipated financial impacts. These definitions are linked to our planning horizons and business cycle. We also refer to the current period which typically reflects the reporting year (FY25). We consider longer timeframes (such as 2050) when assessing climate-related risks and opportunities, these are classified in our disclosures as long-term. Where appropriate to provide clarity, outputs of scenario analyses and climate risk assessments may include specific year horizons in lieu of referencing time horizons. TABLE 7: TIME HORIZONS FOR CLIMATE REPORTING Horizon Years Aligns with Short-term Less than 1 year • Annual business forecast cycle, including planning and investment allocation; and • Short-term variable reward. Medium-term 1 to <5 years • Board Strategy Review (BSR) cycle (≤5 years); • Internal Capital Adequacy Assessment Process (3 years); • The contractual or behavioural duration of most of our lending and funding (< 5 years); and • Investment time horizons of primary users of this Report (typically < 5 years). Long-term 5 years and more • Outer range of BSR planning cycle (5 years); and • Time period where significant climate risks may emerge >10 years. WESTPAC 2025 SUSTAINABILITY REPORT |
| INTRODUCTION GOVERNANCE STRATEGY RISK MANAGEMENT METRICS AND TARGETS APPENDIX CLIMATE-RELATED RISKS AND OPPORTUNITIES 15 Approach to climate-related risk and opportunity analysis Climate-related risk and opportunity identification In FY25, we expanded on our process for identifying climate-related risks that could reasonably be expected to impact Westpac’s prospects, drawing on a combination of internal reviews, stakeholder feedback and peer comparisons. Identification of our climate-related opportunities was informed by a review of international frameworks for assessing and categorising climate-related opportunities, peer analysis, and a series of cross-functional workshops to generate new ideas focused on how to support customers with new products and services. The work that informed the development of both our CCPS and new CTP actions has been considered in identifying the climate-related risks and opportunities highlighted in this section. Next year, as we continue to refine our approach and understanding we expect the list of disclosed climate-related risks and opportunities to evolve. Climate-related scenarios analysis We analysed our exposure to the identified risks using scenarios and time horizons outlined in Table 6 and Table 7 and undertook the approach described on page 42 to 44 in the Risk Management Section. The analysis considered the extent to which elements of our portfolio are exposed to higher physical and transition risks under specific scenarios and time horizons. While this analysis was mainly used to describe the time horizon of occurrence for risk, our findings have also helped inform how risks and opportunities may reasonably be anticipated to impact Westpac. We considered how climate scenarios may impact opportunities as part of a series of cross-functional workshops. Concentration of exposure to climate-related risks and opportunities In FY25 we have considered potential concentrations of exposure to physical and transition risks and opportunities through our application of climate scenarios, with information presented from page 45 to 49 and page 31 to 33. Reasonably anticipated impacts and current mitigation and adaptation efforts We outline the principal climate-related risks and opportunities and their existing and reasonably foreseeable impacts on the following pages. We also outline our current mitigation and adaptation efforts in reference to the three focus areas of our CCPS (refer to page 19 to 33). Where mitigation and adaptation efforts are within our control such as managing our operations or monitoring exposures, we have categorised them as direct. Where efforts apply to working with customers or our supply chain, we have categorised them as indirect. Sector and geography of climate-related risks and opportunities Given the nature and mix of our business, all climate-related risks and opportunities identified are considered within the context of the banking sector. As our activities are centred in Australia and New Zealand, our exposure to climate-related risks and opportunities is concentrated in these geographies. WESTPAC 2025 SUSTAINABILITY REPORT |
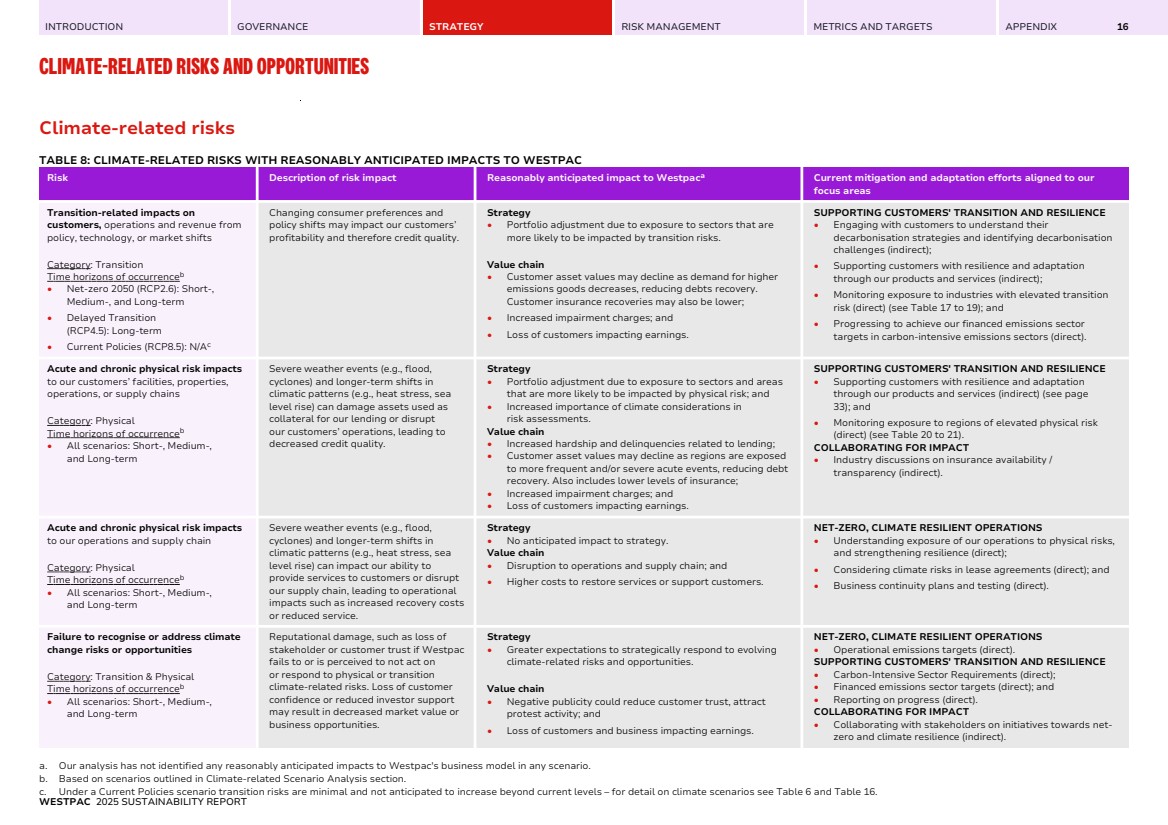
| INTRODUCTION GOVERNANCE STRATEGY RISK MANAGEMENT METRICS AND TARGETS APPENDIX CLIMATE-RELATED RISKS AND OPPORTUNITIES 16 Climate-related risks TABLE 8: CLIMATE-RELATED RISKS WITH REASONABLY ANTICIPATED IMPACTS TO WESTPAC Risk Description of risk impact Reasonably anticipated impact to Westpaca Current mitigation and adaptation efforts aligned to our focus areas Transition-related impacts on customers, operations and revenue from policy, technology, or market shifts Category: Transition Time horizons of occurrence b • Net-zero 2050 (RCP2.6): Short-, Medium-, and Long-term • Delayed Transition (RCP4.5): Long-term • Current Policies (RCP8.5): N/Ac Changing consumer preferences and policy shifts may impact our customers’ profitability and therefore credit quality. Strategy • Portfolio adjustment due to exposure to sectors that are more likely to be impacted by transition risks. Value chain • Customer asset values may decline as demand for higher emissions goods decreases, reducing debts recovery. Customer insurance recoveries may also be lower; • Increased impairment charges; and • Loss of customers impacting earnings. SUPPORTING CUSTOMERS' TRANSITION AND RESILIENCE • Engaging with customers to understand their decarbonisation strategies and identifying decarbonisation challenges (indirect); • Supporting customers with resilience and adaptation through our products and services (indirect); • Monitoring exposure to industries with elevated transition risk (direct) (see Table 17 to 19); and • Progressing to achieve our financed emissions sector targets in carbon-intensive emissions sectors (direct). Acute and chronic physical risk impacts to our customers’ facilities, properties, operations, or supply chains Category: Physical Time horizons of occurrence b • All scenarios: Short-, Medium-, and Long-term Severe weather events (e.g., flood, cyclones) and longer-term shifts in climatic patterns (e.g., heat stress, sea level rise) can damage assets used as collateral for our lending or disrupt our customers’ operations, leading to decreased credit quality. Strategy • Portfolio adjustment due to exposure to sectors and areas that are more likely to be impacted by physical risk; and • Increased importance of climate considerations in risk assessments. Value chain • Increased hardship and delinquencies related to lending; • Customer asset values may decline as regions are exposed to more frequent and/or severe acute events, reducing debt recovery. Also includes lower levels of insurance; • Increased impairment charges; and • Loss of customers impacting earnings. SUPPORTING CUSTOMERS' TRANSITION AND RESILIENCE • Supporting customers with resilience and adaptation through our products and services (indirect) (see page 33); and • Monitoring exposure to regions of elevated physical risk (direct) (see Table 20 to 21). COLLABORATING FOR IMPACT • Industry discussions on insurance availability / transparency (indirect). Acute and chronic physical risk impacts to our operations and supply chain Category: Physical Time horizons of occurrence b • All scenarios: Short-, Medium-, and Long-term Severe weather events (e.g., flood, cyclones) and longer-term shifts in climatic patterns (e.g., heat stress, sea level rise) can impact our ability to provide services to customers or disrupt our supply chain, leading to operational impacts such as increased recovery costs or reduced service. Strategy • No anticipated impact to strategy. Value chain • Disruption to operations and supply chain; and • Higher costs to restore services or support customers. NET-ZERO, CLIMATE RESILIENT OPERATIONS • Understanding exposure of our operations to physical risks, and strengthening resilience (direct); • Considering climate risks in lease agreements (direct); and • Business continuity plans and testing (direct). Failure to recognise or address climate change risks or opportunities Category: Transition & Physical Time horizons of occurrence b • All scenarios: Short-, Medium-, and Long-term Reputational damage, such as loss of stakeholder or customer trust if Westpac fails to or is perceived to not act on or respond to physical or transition climate-related risks. Loss of customer confidence or reduced investor support may result in decreased market value or business opportunities. Strategy • Greater expectations to strategically respond to evolving climate-related risks and opportunities. Value chain • Negative publicity could reduce customer trust, attract protest activity; and • Loss of customers and business impacting earnings. NET-ZERO, CLIMATE RESILIENT OPERATIONS • Operational emissions targets (direct). SUPPORTING CUSTOMERS' TRANSITION AND RESILIENCE • Carbon-Intensive Sector Requirements (direct); • Financed emissions sector targets (direct); and • Reporting on progress (direct). COLLABORATING FOR IMPACT • Collaborating with stakeholders on initiatives towards net-zero and climate resilience (indirect). a. Our analysis has not identified any reasonably anticipated impacts to Westpac's business model in any scenario. b. Based on scenarios outlined in Climate-related Scenario Analysis section. c. Under a Current Policies scenario transition risks are minimal and not anticipated to increase beyond current levels – for detail on climate scenarios see Table 6 and Table 16. WESTPAC 2025 SUSTAINABILITY REPORT |
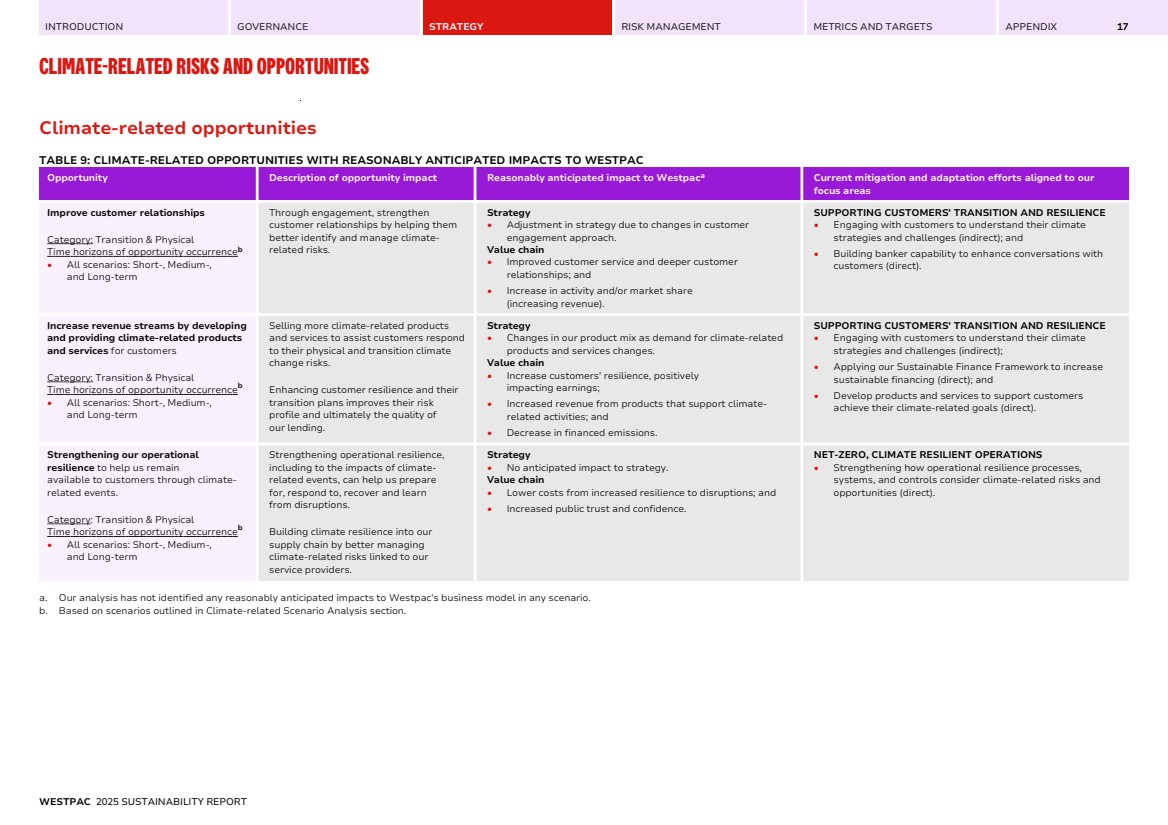
| INTRODUCTION GOVERNANCE STRATEGY RISK MANAGEMENT METRICS AND TARGETS APPENDIX CLIMATE-RELATED RISKS AND OPPORTUNITIES 17 Climate-related opportunities TABLE 9: CLIMATE-RELATED OPPORTUNITIES WITH REASONABLY ANTICIPATED IMPACTS TO WESTPAC Opportunity Description of opportunity impact Reasonably anticipated impact to Westpaca Current mitigation and adaptation efforts aligned to our focus areas Improve customer relationships Category: Transition & Physical Time horizons of opportunity occurrence b • All scenarios: Short-, Medium-, and Long-term Through engagement, strengthen customer relationships by helping them better identify and manage climate-related risks. Strategy • Adjustment in strategy due to changes in customer engagement approach. Value chain • Improved customer service and deeper customer relationships; and • Increase in activity and/or market share (increasing revenue). SUPPORTING CUSTOMERS' TRANSITION AND RESILIENCE • Engaging with customers to understand their climate strategies and challenges (indirect); and • Building banker capability to enhance conversations with customers (direct). Increase revenue streams by developing and providing climate-related products and services for customers Category: Transition & Physical Time horizons of opportunity occurrence b • All scenarios: Short-, Medium-, and Long-term Selling more climate-related products and services to assist customers respond to their physical and transition climate change risks. Enhancing customer resilience and their transition plans improves their risk profile and ultimately the quality of our lending. Strategy • Changes in our product mix as demand for climate-related products and services changes. Value chain • Increase customers' resilience, positively impacting earnings; • Increased revenue from products that support climate-related activities; and • Decrease in financed emissions. SUPPORTING CUSTOMERS' TRANSITION AND RESILIENCE • Engaging with customers to understand their climate strategies and challenges (indirect); • Applying our Sustainable Finance Framework to increase sustainable financing (direct); and • Develop products and services to support customers achieve their climate-related goals (direct). Strengthening our operational resilience to help us remain available to customers through climate-related events. Category: Transition & Physical Time horizons of opportunity occurrence b • All scenarios: Short-, Medium-, and Long-term Strengthening operational resilience, including to the impacts of climate-related events, can help us prepare for, respond to, recover and learn from disruptions. Building climate resilience into our supply chain by better managing climate-related risks linked to our service providers. Strategy • No anticipated impact to strategy. Value chain • Lower costs from increased resilience to disruptions; and • Increased public trust and confidence. NET-ZERO, CLIMATE RESILIENT OPERATIONS • Strengthening how operational resilience processes, systems, and controls consider climate-related risks and opportunities (direct). a. Our analysis has not identified any reasonably anticipated impacts to Westpac's business model in any scenario. b. Based on scenarios outlined in Climate-related Scenario Analysis section. WESTPAC 2025 SUSTAINABILITY REPORT |
| INTRODUCTION GOVERNANCE STRATEGY RISK MANAGEMENT METRICS AND TARGETS APPENDIX CLIMATE-RELATED RISKS AND OPPORTUNITIES 18 Current impacts Climate-related risks and opportunities are already impacting Westpac’s strategy and value chain. It is important to note that, while the effects and potential consequences of climate change are evident, it is difficult to determine its impact on any event. While broader effects are likely to increase, pinpointing its influence on incidents will remain challenging. As such, careful consideration is required when evaluating climate-related impacts on our operations and reporting. We are taking steps now to adapt to the challenges of a changing climate. While we currently assess the overall impact of climate change on our financial statements (see page 34), we have not yet analysed the financial impacts from specific climate-related risks or opportunities or their long-term financial implications. Some impacts from climate-related risks and opportunities experienced over the year have included: • Our response to major weather events, including supporting affected customers (physical risk); • Strengthening climate risk management processes (physical and transition risk); • Broadening climate risk (physical and transition risk) assessments across more customers, especially in carbon-intensive sectors; and • Significant growth in our sustainable finance and bond facilitation (transition risk). The above are not considered material to Westpac's financial statements as described on page 34. How we are responding Our strategic response to climate-related risks and opportunities in FY25 is described in the sections below, in line with three focus areas of our CCPS. WESTPAC 2025 SUSTAINABILITY REPORT |
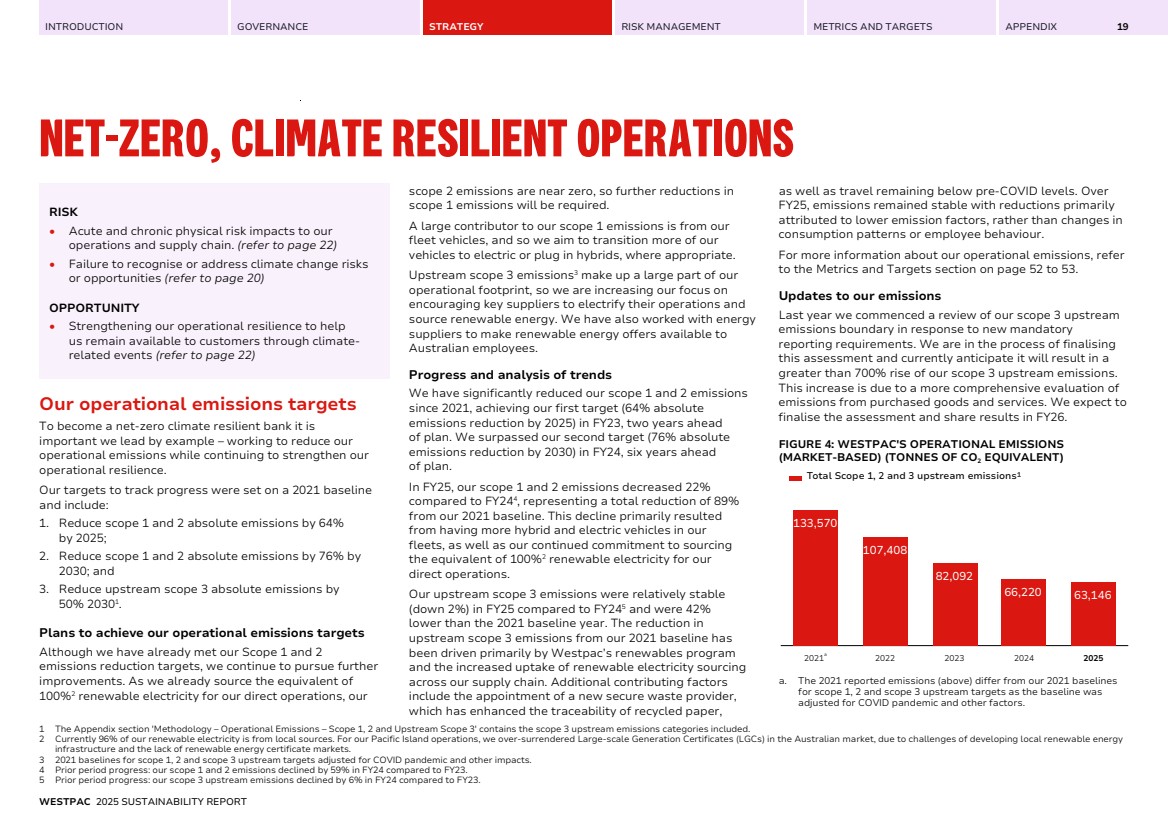
| INTRODUCTION GOVERNANCE STRATEGY RISK MANAGEMENT METRICS AND TARGETS APPENDIX 19 NET-ZERO, CLIMATE RESILIENT OPERATIONS RISK • Acute and chronic physical risk impacts to our operations and supply chain. (refer to page 22) • Failure to recognise or address climate change risks or opportunities (refer to page 20) OPPORTUNITY • Strengthening our operational resilience to help us remain available to customers through climate-related events (refer to page 22) Our operational emissions targets To become a net-zero climate resilient bank it is important we lead by example – working to reduce our operational emissions while continuing to strengthen our operational resilience. Our targets to track progress were set on a 2021 baseline and include: 1. Reduce scope 1 and 2 absolute emissions by 64% by 2025; 2. Reduce scope 1 and 2 absolute emissions by 76% by 2030; and 3. Reduce upstream scope 3 absolute emissions by 50% 20301 . Plans to achieve our operational emissions targets Although we have already met our Scope 1 and 2 emissions reduction targets, we continue to pursue further improvements. As we already source the equivalent of 100%2 renewable electricity for our direct operations, our scope 2 emissions are near zero, so further reductions in scope 1 emissions will be required. A large contributor to our scope 1 emissions is from our fleet vehicles, and so we aim to transition more of our vehicles to electric or plug in hybrids, where appropriate. Upstream scope 3 emissions3 make up a large part of our operational footprint, so we are increasing our focus on encouraging key suppliers to electrify their operations and source renewable energy. We have also worked with energy suppliers to make renewable energy offers available to Australian employees. Progress and analysis of trends We have significantly reduced our scope 1 and 2 emissions since 2021, achieving our first target (64% absolute emissions reduction by 2025) in FY23, two years ahead of plan. We surpassed our second target (76% absolute emissions reduction by 2030) in FY24, six years ahead of plan. In FY25, our scope 1 and 2 emissions decreased 22% compared to FY244 , representing a total reduction of 89% from our 2021 baseline. This decline primarily resulted from having more hybrid and electric vehicles in our fleets, as well as our continued commitment to sourcing the equivalent of 100%2 renewable electricity for our direct operations. Our upstream scope 3 emissions were relatively stable (down 2%) in FY25 compared to FY245 and were 42% lower than the 2021 baseline year. The reduction in upstream scope 3 emissions from our 2021 baseline has been driven primarily by Westpac’s renewables program and the increased uptake of renewable electricity sourcing across our supply chain. Additional contributing factors include the appointment of a new secure waste provider, which has enhanced the traceability of recycled paper, as well as travel remaining below pre-COVID levels. Over FY25, emissions remained stable with reductions primarily attributed to lower emission factors, rather than changes in consumption patterns or employee behaviour. For more information about our operational emissions, refer to the Metrics and Targets section on page 52 to 53. Updates to our emissions Last year we commenced a review of our scope 3 upstream emissions boundary in response to new mandatory reporting requirements. We are in the process of finalising this assessment and currently anticipate it will result in a greater than 700% rise of our scope 3 upstream emissions. This increase is due to a more comprehensive evaluation of emissions from purchased goods and services. We expect to finalise the assessment and share results in FY26. FIGURE 4: WESTPAC'S OPERATIONAL EMISSIONS (MARKET-BASED) (TONNES OF CO2 EQUIVALENT) 133,570 107,408 82,092 66,220 63,146 Total Scope 1, 2 and 3 upstream emissions¹ 2021a 2022 2023 2024 2025 a. The 2021 reported emissions (above) differ from our 2021 baselines for scope 1, 2 and scope 3 upstream targets as the baseline was adjusted for COVID pandemic and other factors. 1 The Appendix section 'Methodology – Operational Emissions – Scope 1, 2 and Upstream Scope 3' contains the scope 3 upstream emissions categories included. 2 Currently 96% of our renewable electricity is from local sources. For our Pacific Island operations, we over-surrendered Large-scale Generation Certificates (LGCs) in the Australian market, due to challenges of developing local renewable energy infrastructure and the lack of renewable energy certificate markets. 3 2021 baselines for scope 1, 2 and scope 3 upstream targets adjusted for COVID pandemic and other impacts. 4 Prior period progress: our scope 1 and 2 emissions declined by 59% in FY24 compared to FY23. 5 Prior period progress: our scope 3 upstream emissions declined by 6% in FY24 compared to FY23. WESTPAC 2025 SUSTAINABILITY REPORT |
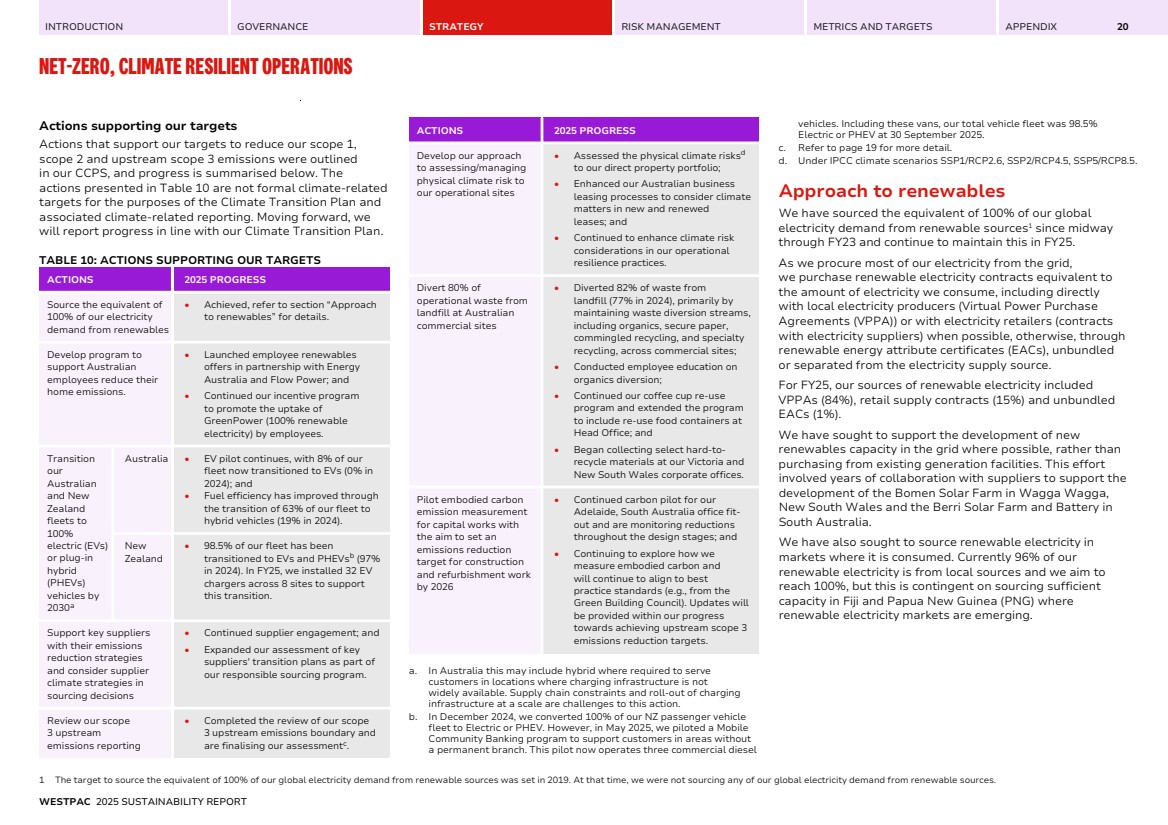
| INTRODUCTION GOVERNANCE STRATEGY RISK MANAGEMENT METRICS AND TARGETS APPENDIX NET-ZERO, CLIMATE RESILIENT OPERATIONS 20 Actions supporting our targets Actions that support our targets to reduce our scope 1, scope 2 and upstream scope 3 emissions were outlined in our CCPS, and progress is summarised below. The actions presented in Table 10 are not formal climate-related targets for the purposes of the Climate Transition Plan and associated climate-related reporting. Moving forward, we will report progress in line with our Climate Transition Plan. TABLE 10: ACTIONS SUPPORTING OUR TARGETS ACTIONS 2025 PROGRESS Source the equivalent of 100% of our electricity demand from renewables • Achieved, refer to section “Approach to renewables” for details. Develop program to support Australian employees reduce their home emissions. • Launched employee renewables offers in partnership with Energy Australia and Flow Power; and • Continued our incentive program to promote the uptake of GreenPower (100% renewable electricity) by employees. Transition our Australian and New Zealand fleets to 100% electric (EVs) or plug-in hybrid (PHEVs) vehicles by 2030a Australia • EV pilot continues, with 8% of our fleet now transitioned to EVs (0% in 2024); and • Fuel efficiency has improved through the transition of 63% of our fleet to hybrid vehicles (19% in 2024). New Zealand • 98.5% of our fleet has been transitioned to EVs and PHEVsb (97% in 2024). In FY25, we installed 32 EV chargers across 8 sites to support this transition. Support key suppliers with their emissions reduction strategies and consider supplier climate strategies in sourcing decisions • Continued supplier engagement; and • Expanded our assessment of key suppliers' transition plans as part of our responsible sourcing program. Review our scope 3 upstream emissions reporting • Completed the review of our scope 3 upstream emissions boundary and are finalising our assessmentc . ACTIONS 2025 PROGRESS Develop our approach to assessing/managing physical climate risk to our operational sites • Assessed the physical climate risksd to our direct property portfolio; • Enhanced our Australian business leasing processes to consider climate matters in new and renewed leases; and • Continued to enhance climate risk considerations in our operational resilience practices. Divert 80% of operational waste from landfill at Australian commercial sites • Diverted 82% of waste from landfill (77% in 2024), primarily by maintaining waste diversion streams, including organics, secure paper, commingled recycling, and specialty recycling, across commercial sites; • Conducted employee education on organics diversion; • Continued our coffee cup re-use program and extended the program to include re-use food containers at Head Office; and • Began collecting select hard-to-recycle materials at our Victoria and New South Wales corporate offices. Pilot embodied carbon emission measurement for capital works with the aim to set an emissions reduction target for construction and refurbishment work by 2026 • Continued carbon pilot for our Adelaide, South Australia office fit-out and are monitoring reductions throughout the design stages; and • Continuing to explore how we measure embodied carbon and will continue to align to best practice standards (e.g., from the Green Building Council). Updates will be provided within our progress towards achieving upstream scope 3 emissions reduction targets. a. In Australia this may include hybrid where required to serve customers in locations where charging infrastructure is not widely available. Supply chain constraints and roll-out of charging infrastructure at a scale are challenges to this action. b. In December 2024, we converted 100% of our NZ passenger vehicle fleet to Electric or PHEV. However, in May 2025, we piloted a Mobile Community Banking program to support customers in areas without a permanent branch. This pilot now operates three commercial diesel vehicles. Including these vans, our total vehicle fleet was 98.5% Electric or PHEV at 30 September 2025. c. Refer to page 19 for more detail. d. Under IPCC climate scenarios SSP1/RCP2.6, SSP2/RCP4.5, SSP5/RCP8.5. Approach to renewables We have sourced the equivalent of 100% of our global electricity demand from renewable sources1 since midway through FY23 and continue to maintain this in FY25. As we procure most of our electricity from the grid, we purchase renewable electricity contracts equivalent to the amount of electricity we consume, including directly with local electricity producers (Virtual Power Purchase Agreements (VPPA)) or with electricity retailers (contracts with electricity suppliers) when possible, otherwise, through renewable energy attribute certificates (EACs), unbundled or separated from the electricity supply source. For FY25, our sources of renewable electricity included VPPAs (84%), retail supply contracts (15%) and unbundled EACs (1%). We have sought to support the development of new renewables capacity in the grid where possible, rather than purchasing from existing generation facilities. This effort involved years of collaboration with suppliers to support the development of the Bomen Solar Farm in Wagga Wagga, New South Wales and the Berri Solar Farm and Battery in South Australia. We have also sought to source renewable electricity in markets where it is consumed. Currently 96% of our renewable electricity is from local sources and we aim to reach 100%, but this is contingent on sourcing sufficient capacity in Fiji and Papua New Guinea (PNG) where renewable electricity markets are emerging. 1 The target to source the equivalent of 100% of our global electricity demand from renewable sources was set in 2019. At that time, we were not sourcing any of our global electricity demand from renewable sources. WESTPAC 2025 SUSTAINABILITY REPORT |
| INTRODUCTION GOVERNANCE STRATEGY RISK MANAGEMENT METRICS AND TARGETS APPENDIX NET-ZERO, CLIMATE RESILIENT OPERATIONS 21 Our renewable strategy goes beyond sourcing renewable electricity, it’s also about giving back to the communities that host the facilities. We have worked with our partners to establish community funds supporting local initiatives. In FY25 this included: • Planted a further 4,600 seedlings in the valley opposite Bomen Solar Farm, marking the completion of the ~50,000 trees and shrubs regreening initiative since 2021; • Supported programs at Wagga Wagga’s Mt Austin High School, specifically, 42 students graduated from the Transition Program, supporting post-school pathways, and 17 students participated in the Girls @ the Centre Program, designed to help girls stay engaged in education; • Installation of two electric vehicles chargers within the Berri local community; and • Revegetation of land adjacent to the Berri Solar Farm, planting 100 trees and 300 shrubs. Our emissions intensity We report two emissions intensity metrics reflecting the nature of our business as a bank. The first metric measures operational emissions per full time equivalent (FTE) employee (for our total scope 1 and 2 emissions). This measure provides a perspective on the organisation's carbon efficiency relative to its footprint and workforce size. Refer to Table 24 in the Metrics and Targets section for more information on this metric. The second metric measures financed emissions per dollar of lending (for the total attributed share of our customers' scope 1, 2, and 3 emissions). Given the scale difference between our financed emissions and operational emissions, this distinction is essential. This measure provides a perspective of the emissions intensity of our loan portfolio. Refer to Table 29 in the Metrics and Targets section for more information on this metric. The combination of metrics also reflects the nature of the direct and indirect levers available to us to manage our emissions intensity: operational emissions can be reduced through direct actions including electrification and energy efficiency upgrades, while financed emissions require more indirect approaches such as portfolio alignment and client engagement. Offsetting emissions We recognise the role that carbon credits will play in achieving net-zero. Operational emissions In FY24, we used carbon credits to offset residual operational emissions, refer to Table 25 on page 52. Where we consider appropriate, we will continue to purchase and retire carbon credits to help offset our residual scope 1, scope 2 and selected upstream scope 3 emissions. In FY25, we decided to withdraw from Climate Active certification under the Australian Government’s Climate Active Carbon Neutral Standard for Organisations. We acknowledge the important role Climate Active plays in enabling Australian businesses to take climate action. The decision was made due to changes in the sustainability reporting landscape and ongoing consultations regarding the Climate Active Standards. We will review our participation after the updated Climate Active Standards are released. Where we purchase credits, we aim to do so from projects in our core markets and review our purchased carbon credits for quality. We aim to support the Australian Carbon Credit Units (ACCUs) market as it continues to make the improvements required in transparency and other areas, as identified in 'The Independent Review of Australian Carbon Credit Units (ACCU Review, 2022)'. The credits we retired for our Australian emission footprint were 100% ACCUs for 2024 and are expected to be 100% ACCUs for the 2025 period. In New Zealand, we are certified under the Toitū Net Carbon Zero programme. Westpac New Zealand has also offset certain residual operational emissions since 2019, in line with Toitū Net Carbon Zero programme requirements. In Australia and New Zealand, the purchased units are not verified independently beyond their certification under the ACCU and Toitū Net Carbon Zero schemes, respectively. Emissions reduction targets Operational targets are absolute emission reduction targets set by applying a market-based accounting approach. Carbon offsets are not considered. Our plans to reduce scope 3 financed emissions do not include the use of carbon credits. WESTPAC 2025 SUSTAINABILITY REPORT |
| INTRODUCTION GOVERNANCE STRATEGY RISK MANAGEMENT METRICS AND TARGETS APPENDIX NET-ZERO, CLIMATE RESILIENT OPERATIONS 22 Physical climate resilience of our operations As a bank, maintaining resilience, and being available for our customers is central to how we are organised and operate. Resilience considers our ability to prepare for, respond to, recover, and learn from disruptions, including those related to climate change. We already have detailed processes, systems and controls to support operational resilience and we are focused on further strengthening how these consider climate-related risks and opportunities. There are also several new and incoming regulatory changes in Australia supporting these efforts. These include the Australian Prudential Regulation Authority’s (APRA) Prudential Standards CPS 230 Operational Risk Management and Prudential Practice Guide CPG 229 Climate Change Financial Risks along with the upcoming AASB S2. These developments will have several implications for Westpac including enhancing Board oversight of climate change risk and resilience and developing more comprehensive scenario analysis across the bank’s operations, lending, and value chain. On 1 July 2025, CPS 230 became effective, with an aim of strengthening the management of operational risks, maintaining critical operations through disruptions, and better management of risks linked to service providers. CPS 230 has already contributed to improving our management of resilience and we will use CPG 229 to further embed specific climate resilience requirements. Testing our operations In July 2025, the Executive Team and Board participated in a crisis exercise to test the Group’s response to a severe weather event that triggered a multi-day power outage in Sydney. This simulation tested the effectiveness of our critical operations in maintaining customer services during a major climate-related disruption. The scenario considered natural hazard and climate risk data for scenarios RCP2.6, RCP4.5, and RCP8.5. Improving the resilience of our physical property footprint In 2025, we implemented a new climate risk assessment tool to enhance our understanding of natural hazard and climate change risk related to our operational footprint. This tool evaluates the effects of climate change on our branches and corporate sites worldwide considering multiple scenarios and climate change stressors over the short, medium and long term. We also incorporated climate risk into our leasing processes so that assessments of natural hazards and climate change risks are reflected in our decision making. WESTPAC 2025 SUSTAINABILITY REPORT |
| INTRODUCTION GOVERNANCE STRATEGY RISK MANAGEMENT METRICS AND TARGETS APPENDIX 23 SUPPORTING CUSTOMERS' TRANSITION TO NET-ZERO AND TO BUILD THEIR CLIMATE RESILIENCE RISK • Transition-related impacts on customers, operations and revenue from policy, technology or market shifts (refer to page 26) • Acute and chronic physical risk impacts to our customers’ facilities, properties, operations, or supply chains (refer to page 33) • Failure to recognise or address climate change risks or opportunities (refer to page 23) OPPORTUNITY • Improving customer relationships (refer to page 28) • Increase revenue streams by developing and providing climate-related products and services for customers (refer to page 31) To achieve our ambition to be a net-zero, climate resilient bank, it is vital we work to reduce our scope 3 financed emissions – our largest emissions category. Accounting for around 99% of our overall emissions account, financed emissions represent our share of the greenhouse gases arising from the projects, companies, households and activities we finance. As financed emissions stem from our customers, we need to partner with them and support their decarbonisation. Our approach includes: • Calculating our financed emissions for the whole Group so we can understand our impact and where we can focus our efforts; • Financed emissions sector targets: we have 13 targets across key industry sectors that seek to reduce emissions or the emissions intensity of our lending; • Engaging with customers to support their transition. This typically includes discussions on climate transition plans, sustainable finance options, and industry benchmarking. In some circumstances, these discussions have also included considerations on natural capital; and • Identifying the main decarbonisation levers across industries to support bankers and customers with their plans. In addition, we have Carbon-Intensive Sector Requirements for customers involved in certain sectors. These restrict the activities we are prepared to support and are accompanied by more detailed evaluations of their transition plans. Further information is provided from page 26. Our scope 3 financed emissions We estimate the financed emissions and emissions intensity of our lending including loans to institutions, corporates and business customers along with residential mortgage customers. Our estimates represent around 73% of our Total Committed Exposure (TCE) at 30 September 2024 (we report one year in arrears to enable the use of customers’ data more closely aligned to the reported period). Our estimates are based on available data and methodologies (refer to Section 'Methodology – Scope 3 financed emissions' in the Appendix for more detail) and limitations exist in both the data and the applicability of existing methodologies to different companies or sectors. We estimate scope 1 and 2 emissions of customers, and incorporate customers' scope 3 emissions in sectors only where they are particularly relevant and reliable data exists. Some customers and facilities are excluded due to data availability, or difficulty in measurement, including (among others) lending to governments, government-owned entities, and certain finance customers, non-mortgage personal lending, and customers in Fiji and PNG. Our estimation process references recognised methodologies and data approaches, including the Partnership for Carbon Accounting Financials (PCAF). It is important to exercise care when comparing financed emissions data over time, as advances in modelling and methodologies, and the use of different data sources, can affect estimates. Refer to Table 29 to 31 and Figure 5 for our FY24 financed emissions estimates and sector exposures. Progress on our scope 3 financed emissions1 This year, we estimated the absolute financed emissions of our portfolio for FY24 at 31.6 MtCO2-e (customers' scope 1 and 2), up 21% on FY23. The rise was primarily due to: • Adoption of higher-quality source for emissions factors used to estimate customer emissions; and • An improvement in the share of Business and Institutional lending for which we estimate financed emissions (excluding Government, administration and defence, Finance and insurance, and Other sectors), rising to 99% of TCE from 93% in FY23, amid overall 3% TCE growth. The scope 1 and 2 emissions intensity of our portfolio financed emissions for FY24 increased by around 12% from FY23. Excluding the change in emissions factors data source, the emissions intensity for FY24 was around 14% lower than FY23. 1 The input of lending into the estimation of financed emissions varies by segment: $ TCE for Commercial Real Estate; $ TCE for Business, commercial and institutional lending; $ outstanding balance for Australian residential mortgages; and, $ TCE for New Zealand residential mortgages. Australian dollars. WESTPAC 2025 SUSTAINABILITY REPORT |
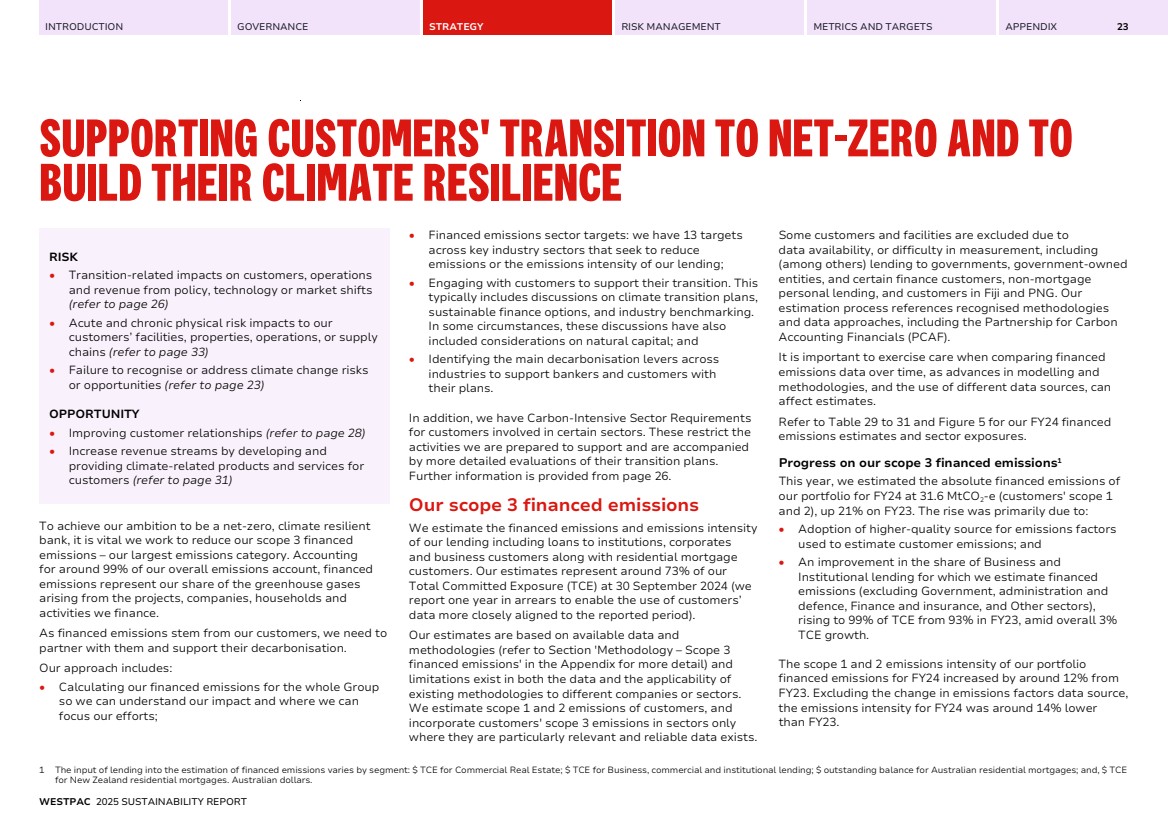
| INTRODUCTION GOVERNANCE STRATEGY RISK MANAGEMENT METRICS AND TARGETS APPENDIX SUPPORTING CUSTOMERS' TRANSITION TO NET-ZERO AND TO BUILD THEIR CLIMATE RESILIENCE 24 FIGURE 5: WESTPAC'S FINANCED EMISSIONS (FE) AND TOTAL COMMITTED EXPOSURE (TCE) BY SECTOR (FY24)1,2 0.9 (3%) 5.7 (18%) 2.1 (7%) 0.2 (1%) 5.2 (17%) 2.0 (6%) 0.6 (2%) 0.1 (0%) 0.5 (2%) 0.9 (3%) 2.1 (7%) 2.9 (9%) 5.0 (16%) 0.1 (0%) 3.3 (10%) Accommodation, cafes & restaurants Agriculture, forestry & fishing Construction Finance & insurance Manufacturing Mining Property – Secured Commercial Real Estate Property – Other Property services & business services Services Trade Transport & storage Utilities Other Retail Lending – Residential Mortgages FY24 ABSOLUTE SCOPE 1 & 2 FINANCED EMISSIONS: 31.6 MtCO2-e FY24 GROUP TOTAL COMMITTED EXPOSURE (TCE): $1,252b * Excluded from estimation of FE Partially excluded from estimation of FE 1% 2% 1% 13% Finance and insurance 2% 1% 7% Property sector incl. CRE and Other 2% 2% 3% 2% 2% 0% 50% 3% Other Retail Lending* 9% Government, administration, and defence* Our financed emissions sector targets We have set 13 interim 2030 emission targets which represent a subset of our overall Group financed emissions, accounting for up to 44%1,3 of total (2024: 54%). For the Group, this is based on our share of customers’ scope 1 and 2 emissions. While our sector targets and their boundaries remain largely unchanged from prior year, the decrease in this ratio reflects our adoption of a higher-quality source of emissions factors, which led to increased estimates of emissions in sectors without financed emissions sector targets. Performance against our sector targets in FY24 In FY24 (our latest year of reporting), we recorded an improved emissions profile in over 70% of the sector targets. It is important to note that while progress on our sector targets has been positive in FY24, over time annual movements may be volatile (either up or down) due to factors out of our control. For many of these targets, we source customer level emissions data and calculate our share accordingly. Customer level emissions are gathered from various sources, including public reports, direct submissions, or data aggregators. Refer to page 25 for a summary of progress and page 59 to 68 for detail on each sector target. Use of offsets We have not purchased, nor do we intend to purchase, carbon credits to meet our financed emissions sector targets. Plans to achieve our financed emissions sector targets Our plans to achieve our 2030 financed emissions sector targets are tailored to the specific characteristics of each sector and consider the size and profile of customers included within each target’s scope. Actions to support the achievement of our financed emissions targets include: • Targeted engagement with customers on their transition plans and to share sector insights; • Conducting ESG risk assessments for new and renewed lending to determine if proposed exposures are aligned with our targets and Sustainability Customer Requirements; • Industry-level engagement by facilitating and participating in industry events to provide decarbonisation insights and capabilities to our customers; and • Financing the transition by providing the products and services that best meet our customers’ needs to decarbonise and contribute to the broader transition. For all sectors we are also focused on improving the quality of data to improve our insights and to feed back to customers to help them with their plans. 1 The input of lending into the estimation of financed emissions varies by segment: $ TCE for Commercial Real Estate; $ TCE for Business, commercial and institutional lending; $ outstanding balance for Australian residential mortgages; and, $ TCE for New Zealand residential mortgages. Australian dollars. 2 For more information refer to Table 29: Group Scope 3 Financed Emissions associated with loans, bonds, and undrawn loan commitments by sector (calculated using TCE) on page 54. 3 Up to 44% of our estimated scope 3 financed emissions from the scope 1 and 2 emissions of our customers at a Group level for FY24 relate to customers captured in our financed emissions sector targets. WESTPAC 2025 SUSTAINABILITY REPORT |
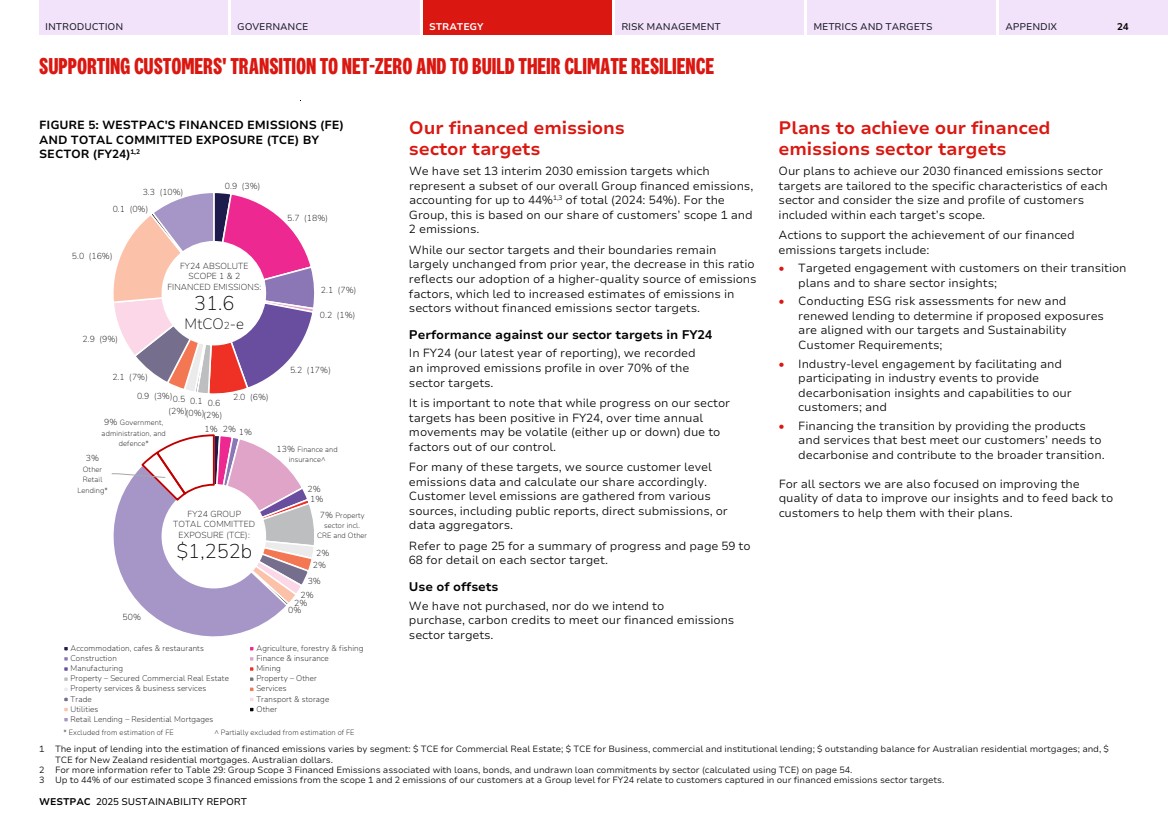
| INTRODUCTION GOVERNANCE STRATEGY RISK MANAGEMENT METRICS AND TARGETS APPENDIX SUPPORTING CUSTOMERS' TRANSITION TO NET-ZERO AND TO BUILD THEIR CLIMATE RESILIENCE 25 TABLE 11: OUR FINANCED EMISSIONS SECTOR TARGETS1 AND PROGRESS4 WESTPAC SECTOR 2030 TARGET AND MEASURE TYPE OF TARGET TEMPERATURE ALIGNMENT BASELINE (YEAR) PROGRESS vs BASELINE % 2024 2023 Power generation Reduce scope 1 and 2 emissions intensity by 62% to 0.10 tCO2-e/MWh Intensity 1.5°C 0.26 tCO2-e/MWh (2021) -38% -23% Upstream oil and gas Reduce absolute scope 1, 2 and 3 financed emissions by 23% to 7.1 MtCO2-e Absolute 1.5°C 9.2 MtCO2-e (2021) -55% -45% Thermal coal mining Reduce absolute scope 1, 2, and 3 financed emissions by 100% to zero2 Absolute 1.5°C 2.46 MtCO2-e (2021) -94% -81% Aviation (passenger aircraft operators) Reduce scope 1 emissions intensity by 60% to 76.4 gCO2-e/ passenger km Intensity 1.5°C 190.6 gCO2-e/ passenger km (2021) -47% -45% Cement production Reduce scope 1 and 2 emissions intensity by 14% to 0.57 tCO2-e/tonne of cement produced from in-house produced clinker Intensity 1.5°C 0.66 tCO2-e/tonne (2021) As at 30 September 2024, we are on track to achieve our 2030 Cement, Steel and Aluminium targets and their progress is below our reference sector pathway. Given the small number of customers associated with each target and to ensure their confidentiality, we are not disclosing some figures. For further information on our sector targets, please see page 63. Steel production Reduce scope 1 and 2 emissions intensity to 1.42 tCO2-e/tonne of crude steel produced Intensity Well below 2°C Not Reported (2021) Aluminium Reduce scope 1 and 2 emissions intensity to 10.35 tCO2-e/tonne of primary aluminium produced Intensity 1.5°C Not Reported (2023) Commercial real estate (offices) Reduce scope 1 and 2 emissions intensity for Australian and New Zealand offices by 59% to 25 kgCO2-e/m2 net lettable area Intensity 1.5°C 60 kgCO2-e/m2 net lettable area (2022) -27% -18% Residential real estate (Australia)3 Reduce scope 1 and 2 emissions intensity by 56% to 15.2 kgCO2-e/m2 attributed floor area Intensity 1.5°C 34.6 kgCO2-e/m2 attri-buted floor area3 (2022) -14% -11% Australia beef and sheep Reduce scope 1 land management emissions intensity by 9% to 20.66 tCO2-e/tonne of Fresh Weight (FW) Intensity 1.5°C 22.62 tCO2-e/ tonne of FW (2021) +2% +2% Australia dairy Reduce scope 1 land management emissions intensity by 10% to 0.85 tCO2-e/tonne of Fat Protein Corrected Milk (FPCM) Intensity 1.5°C 0.95 tCO2-e/ tonne of FPCM (2021) -7% -7% New Zealand beef and sheep Reduce scope 1 land management emissions intensity by 9% to 18.0 tCO2-e/tonne of FW Intensity 1.5°C 19.8 tCO2-e/ tonne of FW (2021) -4% +2% New Zealand dairy Reduce scope 1 land management emissions intensity by 10% to 0.77 tCO2-e/tonne of FPCM Intensity 1.5°C 0.86 tCO2-e/ tonne of FPCM (2021) -6% -2% 1. UNEP FI Guidelines For Climate Target Setting for Banks version 4 recommends sector-level targets be set for all, or a substantial majority of, emissions-intensive sectors (where data and methodologies allow) that include agriculture, aluminium, cement, coal, commercial and residential real estate, iron and steel, oil and gas, power generation and transport. 2. In FY24, we updated the Thermal Coal Mining target boundary to align with Version 2 of the UNEP FI Guidelines For Climate Target Setting, released April 2024. The boundary excludes dominant metallurgical coal mines that produce a thermal coal by-product and diversified miners that produce a thermal coal product where their dominant activity is not thermal coal. 3. For the Residential Real Estate target, baseline and FY23 progress metrics are as at 31 August. FY24 progress metric is as at 30 September. 4. Additional detail on our financed emissions sector targets, including calculation methodologies, scope and boundaries, and other assumptions is outlined in Table 52, Table 53, and Section 4 in the Appendix. Refer to Table 32 for more information about recent limited changes to the methodologies of certain sector targets and associated impacts. WESTPAC 2025 SUSTAINABILITY REPORT |
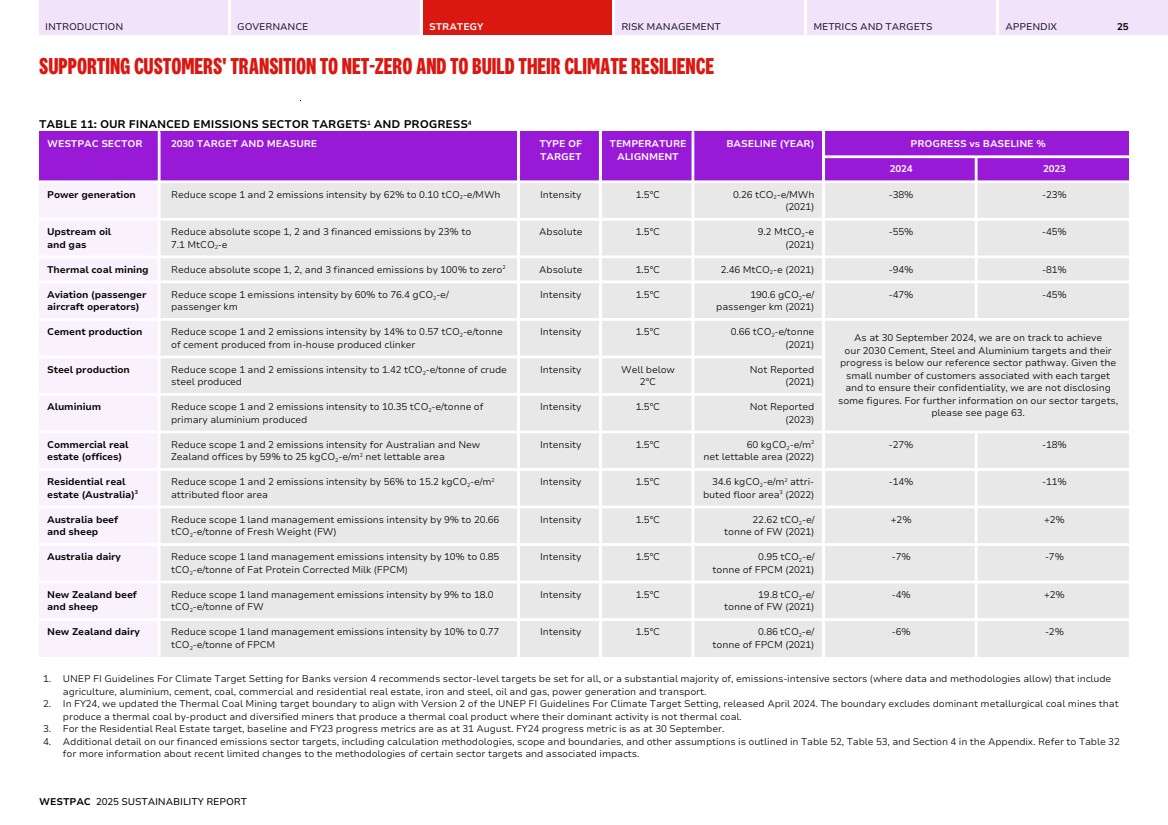
| INTRODUCTION GOVERNANCE STRATEGY RISK MANAGEMENT METRICS AND TARGETS APPENDIX SUPPORTING CUSTOMERS' TRANSITION TO NET-ZERO AND TO BUILD THEIR CLIMATE RESILIENCE 26 Managing climate-related risks in lending Alongside our financed emissions sector targets, we use various methods to mitigate climate-related risks and impacts in our lending and bond facilitation including: • Sustainability Customer Requirements that outline lending restrictions and exclusions for larger business customers; and • ESG Risk Assessments that form part our due diligence for new or renewed lending. Further information on our climate risk management approach is provided from page 39. Carbon-Intensive Sector Requirements In May 2025, we updated our Carbon-intensive Sector Requirements (Requirements) which detail specific requirements for certain larger business customers operating in carbon-intensive sectors, further developing the framework established by our previous Sector Positions and last outlined in our 2024 Climate Report. As part of this update, we introduced a Customer Climate Transition Plan Evaluation (Customer CTP Evaluation) which is detailed below. One component of this evaluation is the requirement for in-scope customers requesting new or renewed corporate lending and bond facilitation to have interim scope 1 and 2 decarbonisation target/s aligned to the well below 2°C goal of the Paris Agreement1 on an absolute or intensity basis. Target alignment is assessed by Westpac utilising a third-party reviewed approach. These Requirements form part of our broader Sustainability Customer Requirements available on our website and apply to all Westpac Group operating locations. Requirements as specified in our Sustainability Customer Requirements Westpac’s Requirements apply to customers whose business involves the production and sale of thermal coal, oil and gas, metallurgical coal, or coal-fired electricity power generation. Adjacent sectors are out of scope (e.g., mining service providers (including logistics), equipment providers, and trading companies). EXCLUDED ENTITY, ACTIVITY OR SECTOR2 Thermal Coal Mining • We will not provide any project finance to new (greenfield), expansions or extensions of thermal coal mines. • We will not provide corporate lending or bond facilitation for institutional customers with ≥15% of their three-year rolling average revenue coming directly from thermal coal mining. Metallurgical Coal • We will not provide project finance for new (greenfield) metallurgical coal mining projects. Oil and Gas • We will not provide project finance for oil and gas exploration in offshore deep water and ultra-deep-water or in high-risk frontier basins, Arctic and Antarctic refuges, or for shale and oil sands development. • Subject to National or Energy Security we will not provide project finance or bond facilitation specifically for the development of new (greenfield) oil and gas extraction projects, including New Associated Dedicated Infrastructure unless in accordance with the IEA Net-Zero by 2050 scenario. Coal-fired Power Generation • We will not provide project finance for new (greenfield) coal-fired power generation facilities. RESTRICTED ENTITY, ACTIVITY OR SECTOR3 Customer CTP Evaluation We actively engage with our customers to support their transition to net-zero. From 30 September 2025, new or renewed corporate lending or bond facilitation for customers whose business involves the production and sale of the following activities is subject to a Customer CTP Evaluation: • Metallurgical coal mining with ≥25% of their revenue coming directly from the extraction of metallurgical coal, calculated on a three-year rolling average. • Extraction of oil and gas with any revenue coming from the extraction of oil and gas. • Coal-fired power generation where customers are responsible for the generation and supply of coal-fired electricity. This includes customers who are diversified and undertake these operations. Customers will scale to the ratings outlined below: RATING ACTION TAKEN A Accept and monitor customer CTP execution. B Accept and proactively engage to encourage further development of customer CTP content. C Escalate to appropriate governance committee and new or renewed finance may be declined. D Decline new or renewed finance. Where a customer achieves a rating of ‘D’, but new or renewed finance supports National or Energy Security, we may escalate to the appropriate governance committee. Westpac will evaluate our customers’ CTP against an internal framework which has consideration for the CTP Evaluation Criteria. 1 Refers to Article 2.1 of the Paris Agreement on Climate Change adopted within the United Nations Framework Convention on Climate Change in December 2015. 2 Excluded: We seek to not provide lending to the entity, activity or sector which is prohibited. 3 Restricted: Where lending to a particular entity, activity or sector may pose a higher risk and so additional due diligence and/or escalation may apply. WESTPAC 2025 SUSTAINABILITY REPORT |
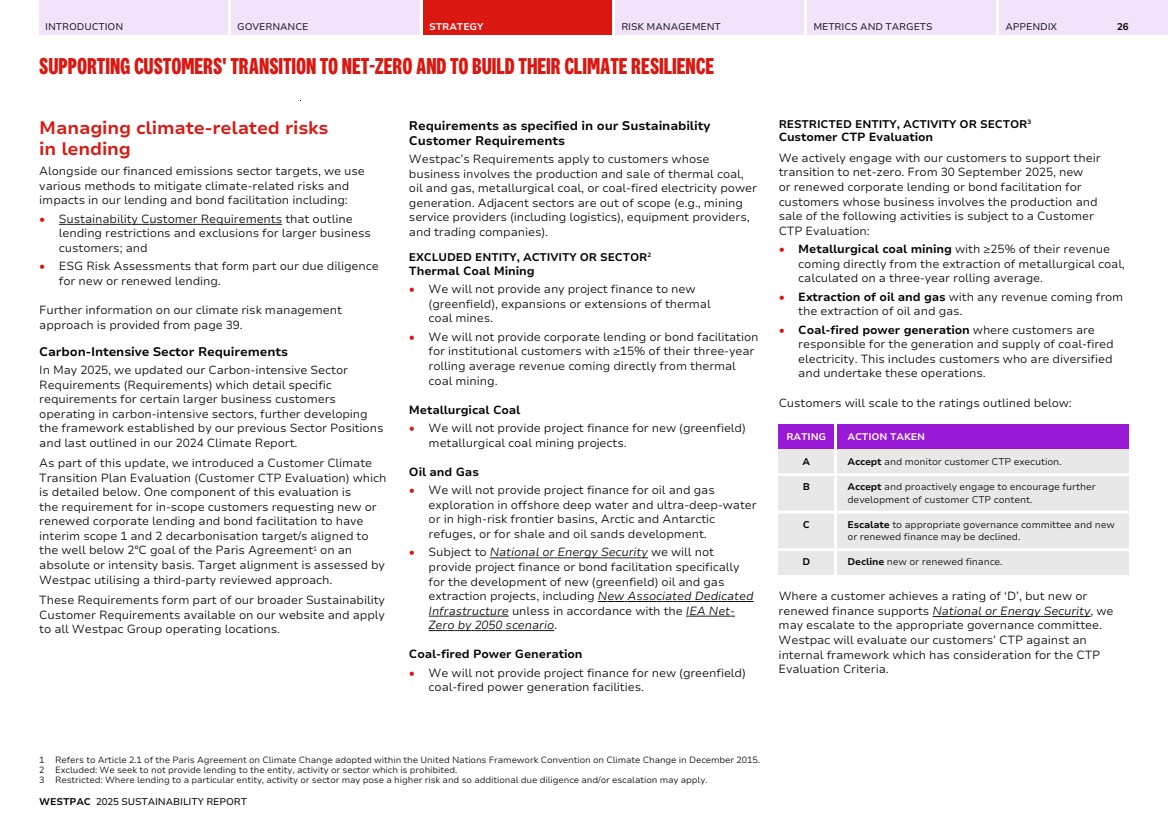
| INTRODUCTION GOVERNANCE STRATEGY RISK MANAGEMENT METRICS AND TARGETS APPENDIX SUPPORTING CUSTOMERS' TRANSITION TO NET-ZERO AND TO BUILD THEIR CLIMATE RESILIENCE 27 CTP Evaluation Criteria Emissions Targets 1. Interim scope 1 & 2 decarbonisation target/s, aligned to the well below 2°C goal of the Paris Agreementa on an absolute or intensity basis as assessed by Westpac. 2. An ambition to reach net-zero for scope 1 & 2 and scope 3 GHG emissions by 2050 (or earlier). Strategy 3. A plan to achieve scope 1 & 2 decarbonisation targets, including intended use of offsets. 4. Disclosure of ‘use of sold product’ scope 3 emissions. 5. A plan to reduce these scope 3 emissions. Capital Allocation 6. Planned capital expenditure to achieve interim scope 1 & 2 target/s. Climate Governance 7. Governance and oversight of the Climate Transition Plan. 8. Public disclosure of a Climate Transition Plan. a. Refers to Article 2.1 of the Paris Agreement on Climate Change adopted within the United Nations Framework Convention on Climate Change in December 2015. We will continue to monitor, assess and be guided by the latest science and government policy, while considering energy security and affordability. DEFINED TERMS National or Energy Security Circumstances where a government or regulator determines that additional supply, or maintaining current supply is necessary for national or energy security and Westpac’s funding is able to support such additional supply. IEA Net-Zero by 2050 The International Energy Agency, Net-Zero by 2050 (2021) scenario specifies that no new (greenfield) oil and gas fields are needed beyond those projects that have already been committed (i.e., approved for development) as of 18 May 2021. New Associated Dedicated Infrastructure New gas collection, storage and processing infrastructure dedicated solely to greenfield oil and gas extraction projects including floating production, storage and offloading (FPSO) vessels, gas processing plant and transmission pipelines. Since 2023, we committed to reduce our lending to thermal coal mining customers to zero by 30 September 2025. At 30 September 2025 we have zero corporate lending or bond facilitation to institutional customers with ≥15% of their three-year rolling average revenue coming directly from thermal coal mining. Additionally, ahead of any future request for new or renewed financing from 30 September 2025, we conducted a preliminary assessment of CTPs for existing in-scope customers. This assessment has informed the actions we would take if these customers request new or renewed corporate lending or bond facilitation. Table 12 presents a summary of the ratings from our preliminary assessments. Customers rated D would currently not be eligible for new or renewed finance, but if the finance supports National or Energy Security, we may escalate to the appropriate governance committee. TABLE 12: CUSTOMER CLIMATE TRANSITION PLAN EVALUATION - PRELIMINARY RATINGS ASSESSMENT RATING % OF CUSTOMERS ASSESSED (PRELIMENARY CUSTOMER ASSESSMENTa) A 55% B 36% C 0% D 9% a. Percentage of customers assessed in advanced of their request for new or renewed corporate lending or bond facilitation. Where appropriate, we engaged with customers within scope of our Carbon-Intensive Sector Requirements to discuss their transition plans and better understand their evolving decarbonisation strategies. These engagements will continue in future years, with a focus on customers seeking new or renewed corporate lending or bond facilitation. ESG Risk Assessments Our ESG Risk Assessment tool is used to assess ESG risks and mitigations (including climate-related risks). These assessments are completed at customer on-boarding and periodic reviews for certain customers and transactions in Institutional and Business Banking. Refer to the Risk Management section for more information. ESG RISK ASSESSMENT FOR COMMERCIAL CUSTOMERS Our ESG Risk Assessment process for commercial customers has seen over 9,000 assessments since its launch in FY24. Of those assessed more than 400 customers and transactions have been reviewed by our specialist ESG team. In FY25, we began implementing the ESG risk assessment process into our Pacific business. The assessment process is further supported by training and resources for our bankers and credit staff across Australia and the Pacific. ESG RISK ASSESSMENTS FOR INSTITUTIONAL CUSTOMERS The ESG Risk Assessments for lending to institutional customers considers the material ESG risks relevant for the sector in which our customers operate to determine if customers or transactions are within appetite. Sector-specific risks and appetite are outlined in our Sustainability Customer Requirements and Sustainability Risk Management Framework. In line with our Group ESG Credit Risk Policy, ESG Risks are considered when originating a new-to-bank customer, when conducting periodic reviews, for any material financing, for material trigger events or if requested by a Credit Officer. If potential high ESG risks are present, transactions or customers may be escalated to relevant governance bodies for consideration in the finance decision. WESTPAC 2025 SUSTAINABILITY REPORT |
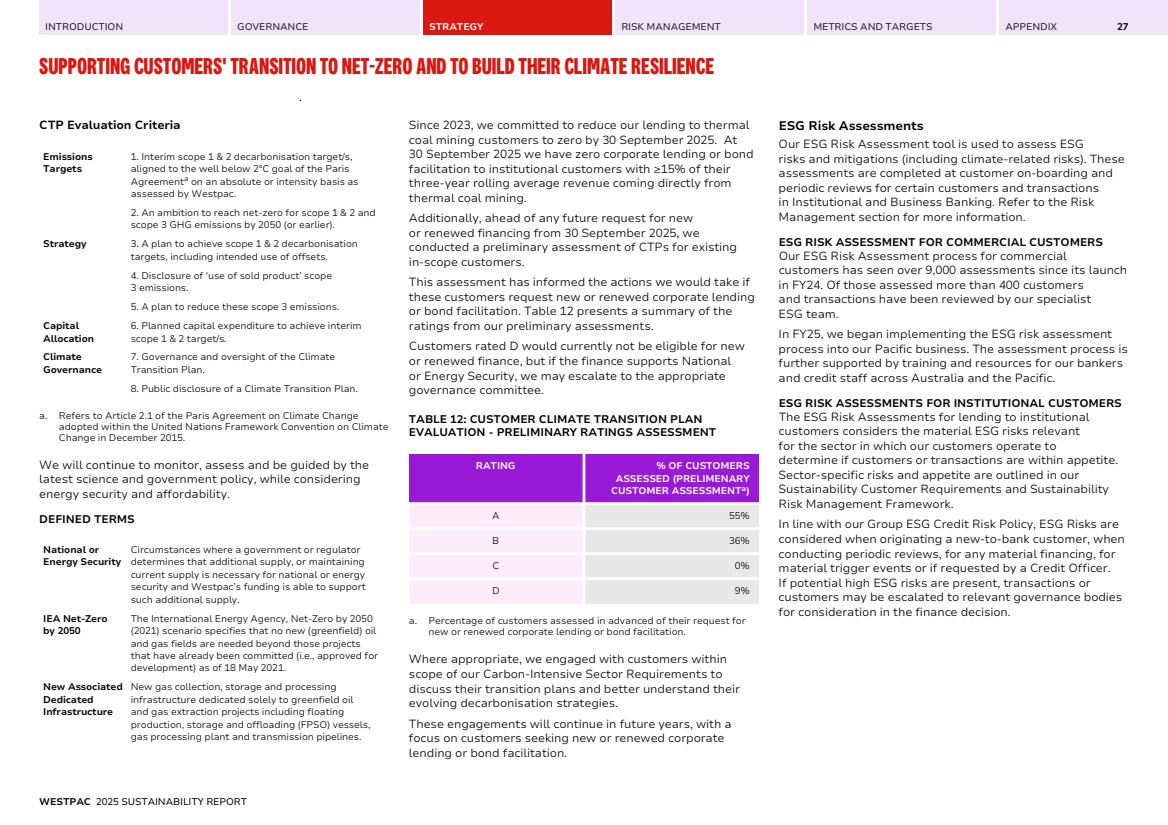
| INTRODUCTION GOVERNANCE STRATEGY RISK MANAGEMENT METRICS AND TARGETS APPENDIX SUPPORTING CUSTOMERS' TRANSITION TO NET-ZERO AND TO BUILD THEIR CLIMATE RESILIENCE 28 Engaging with our customers Approach to customer engagement A key element of supporting customers’ transition and resilience is engagement. Through our engagement we aim to better understand customer needs and plans. Engagement includes targeted engagement with institutional customers and some of our business banking customers in sectors such as agriculture and commercial real estate. We also seek to participate in industry forums to further share our insights. In FY25, we expanded our scope to engage more commercial and agriculture customers, including by: • Discussing transition needs with more commercial customers; and • Discussing our Westpac Sustainable Farm Loan with our New Zealand agricultural customers and helping them with their independent audit as part of the programme. Building banker capability To support engagement in FY25, we worked to further enhance our bankers' ability through targeted training and by providing frameworks for their conversations. This was supplemented by our sustainability specialists, who participated in many discussions and provided additional guidance. Initiatives in FY25 included: • Delivery of a range of sector-specific insights and learning content, designed to support our bankers to engage effectively with customers on sustainability; • Internal newsletters, specialist knowledge sessions and use of e-learning modules on sustainability and climate-related matters in our Institutional business; • An externally developed sustainability learning programme offered to all Westpac New Zealand employees; • Delivered over 140 hours of targeted training to our WNZL employees on other climate related topics; and • Specialist training for a group of business bankers, enabling them to better support their peers and customers on sustainability-related matters. Engagement insights Engaging on customer climate strategies and transition plans In 2025, our engagement continued to evolve, diving deeper into the plans of our institutional customers. Areas of focus this year have been on: • Further discussion with institutional customers on the uplift of their climate transition plans; • Better understanding their value-chain impacts; and • Discussing readiness for mandatory climate reporting with corporate and institutional customers. Our Customer CTP Review Framework has been used to frame discussion with institutional customers, and this is summarised in the adjoining Table 13. We expanded the framework this year to consider: • Implementation strategy – the assumptions and external factors considered in their plans. • Engagement strategy – how customers are engaging with their stakeholders. TABLE 13: CUSTOMER CTP REVIEW FRAMEWORK ELEMENTS AREAS OF ASSESSMENT Foundations 1. Risks and opportunities 2. Business and strategy Implement-ation Strategy 3. Emissions reduction initiatives 4. Capital and financial planning 5. Assumptions and external factors Engagement Strategy 6. Value chain engagement 7. Broader stakeholder engagement Metrics and Targets 8. Long-term GHG targets 9. Interim Scope 1 & 2 targets (~5-10 years) 10. Interim Scope 3 targets (~5-10 years) 11. Carbon credits 12. Progress reporting 13. External assurance Governance 14. Board oversight and capability 15. Incentives and remuneration 16. Skills, competency and training WESTPAC 2025 SUSTAINABILITY REPORT |
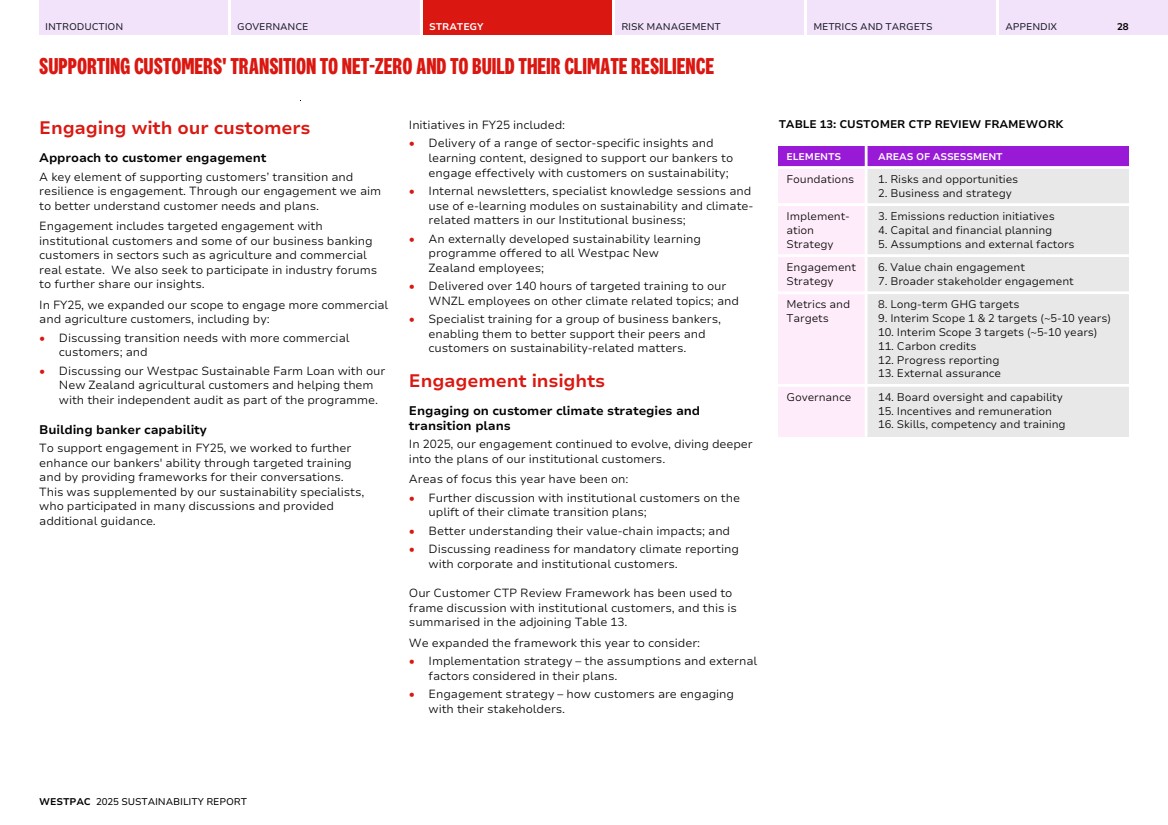
| INTRODUCTION GOVERNANCE STRATEGY RISK MANAGEMENT METRICS AND TARGETS APPENDIX SUPPORTING CUSTOMERS' TRANSITION TO NET-ZERO AND TO BUILD THEIR CLIMATE RESILIENCE 29 In FY25, we had in-depth engagements with over 130 institutional customers in Australia and New Zealand. Approximately 64% of the customers engaged were re-engagements from last year, meaning that data in Figures 6 to 9 are not strictly comparable with previous years. Findings from our engagements in FY25 include: • 83% had a public report outlining their climate transition strategy. In Australia, approximately 20% are in the form of a standalone Climate Transition Plan or equivalent; • 79% had interim (approximately 5-10 year) scope 1 and 2 GHG targets; • 49% had long-term net-zero GHG targets covering at least scope 1 and 2; • 24% had interim (approximately 5-10 year) scope 3 GHG targets; and • Customers commonly cited new infrastructure, technology feasibility, and supportive policies as key dependencies to delivering on their climate plans. Preparation for mandatory climate reporting is a focus for customers. Approximately 80% of those engaged in Australia indicated they are Group 1 entities under the AASB S2 reporting requirements; in New Zealand, 73% were Climate Reporting Entities under the NZ Climate Standards. With the introduction of mandatory climate reporting, the maturity of our customers’ disclosures will vary. FIGURE 6: CUSTOMERS ENGAGED BY SECTOR (%) 18% 17% 15% 15% 12% 11% 8% 4% Energy Manufacturing Property, Construction and Health Transport Mining and Metals Consumer and Retail Utilities and Infrastructure Agriculture FIGURE 7: % OF CUSTOMERS WITH LONG-TERM GHG TARGETS 19% 30% 25% 26% Net-zero scope 1, 2 and 3 GHG target Net-zero scope 1 and 2 GHG target Ambition, aim or support for net-zero No disclosure or commitment FIGURE 8: % OF CUSTOMERS WITH INTERIM SCOPE 1 AND 2 GHG TARGETS 30% 10% 40% 21% Scope 1 and 2, disclosed as being aligned to at least a 1.5°C Scope 1 and 2, disclosed as being aligned to a well below 2°C Scope 1 and 2, no specified temperature alignment No scope 1 and 2 targets FIGURE 9: % OF CUSTOMERS WITH INTERIM SCOPE 3 GHG TARGETS 13% 3% 8% 76% Scope 3, disclosed as being aligned to 1.5°C Scope 3, disclosed as being aligned to well below 2°C Scope 3, no specified temperature alignment No scope 3 target WESTPAC 2025 SUSTAINABILITY REPORT |
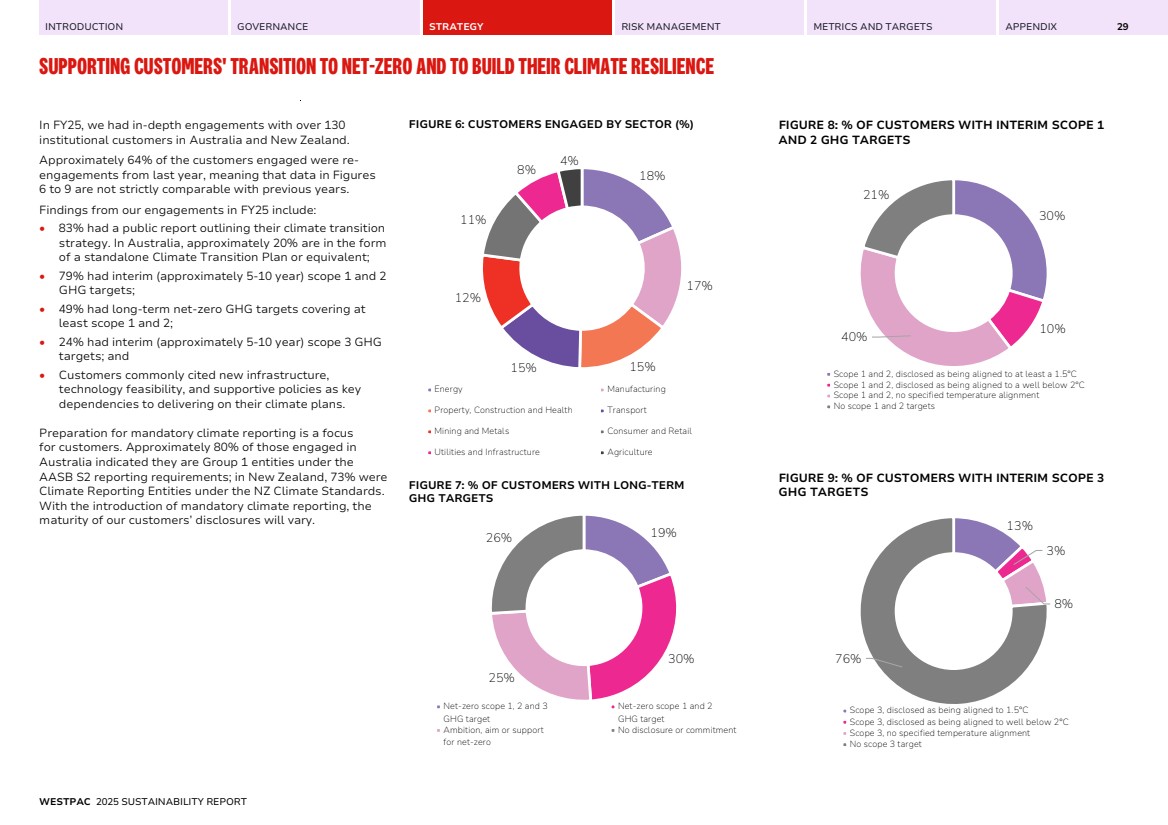
| INTRODUCTION GOVERNANCE STRATEGY RISK MANAGEMENT METRICS AND TARGETS APPENDIX SUPPORTING CUSTOMERS' TRANSITION TO NET-ZERO AND TO BUILD THEIR CLIMATE RESILIENCE 30 Engaging with business customers We continue to engage with business customers (mostly commercial property and agribusiness customers) across our portfolio to understand their approach to decarbonisation and explore areas where we can offer meaningful support. Our engagement approach includes both direct customer interactions and collaboration through industry bodies, enabling us to reach a broader audience and supporting industry-led initiatives. In FY25, supported by our sustainability specialists, we expanded and deepened our engagement with business customers. This included delivering two major industry collaborations: in Agriculture with Meat & Livestock Australia and Commercial Real Estate with the Energy Efficiency Council (EEC), focused on providing tools and resources to customers to support their decarbonisation. Our updated implementation approach on deforestation for our Agriculture targets Westpac is determined to invest in regional Australia and to support the agricultural sector to achieve its climate goals. In 2023, as part of setting 2030 Agriculture financed emissions sector targets for Dairy and for Beef and Sheep, we expressed a commitment to no deforestation1 from 31 December 2025 for customers in scope of our targets, and to engage with customers on this commitment2 . Since that release, we have engaged with rural research and development corporations, members of the agricultural supply chain, peak industry bodies, and with customers to understand how this would affect the sector3 . These discussions showed that customers are increasingly aware of supply chain requirements to manage deforestation risk. However, implementation remains complex, particularly due to varying reporting requirements across companies in the supply chain. The sector expressed a clear need for more support in managing existing demands, rather than facing additional requirements. Accordingly, we have refined our approach – no longer requiring a formal ‘no deforestation’4 commitment – but continuing to develop practical ways we can help customers manage deforestation risk effectively. This includes: • Conducting ESG risk assessments with our larger Agribusiness customers to understand how they are managing their deforestation risks; • Sharing data and insights to manage evolving market requirements; and • Supporting industry efforts that help farmers assess and verify deforestation free status for supply chain reporting. We continue to make progress towards our Agriculture financed emissions sector targets, with details on page 66 to 68. Given their importance to the Australian and New Zealand economies, partnering with our Agribusiness customers and supporting regional communities remains critically important. Case study: Collaborating with Agribusiness customers and industry on decarbonisation As part of our commitment to supporting business customers in their decarbonisation journey, Westpac collaborated with Meat & Livestock Australia this year to sponsor and deliver Carbon EDGE workshops in key growing regions. Tailored specifically for red meat producers, the workshop helped participants understand how to reduce emissions on their farms through best practices in productivity, animal welfare, and environmental management. Participants were guided through the process of establishing an emissions baseline for their property, identifying practical strategies to lower emissions, and developing a customised action plan for their farm. Following the initial success of the Tamworth, NSW session earlier in the year, additional workshops were held in Roma and Rockhampton, Queensland in September, with further sessions planned throughout the remainder of the year. 1 Loss of natural forest as a result of i) conversion to agriculture or other non-forest land use; ii) conversion to a tree plantation; or iii) severe and sustained degradation. Loss of natural forest that meets this definition is considered to be deforestation regardless of whether or not it is legal. Source: Accountability Framework Initiative. The Accountability Framework Core Principles (2023). 2 While this commitment is the same as that contained in the Science Based Targets Initiative (SBTi) Forests, Land and Agriculture (FLAG) guidance, Westpac is not an SBTi signatory and is not required to meet SBTi FLAG requirements. 3 As disclosed in our 2024 Climate Report. 4 In our Australian and New Zealand 2030 Agriculture sector targets and related positions and disclosures, including in our Natural Capital Position Statement. WESTPAC 2025 SUSTAINABILITY REPORT |
| INTRODUCTION GOVERNANCE STRATEGY RISK MANAGEMENT METRICS AND TARGETS APPENDIX SUPPORTING CUSTOMERS' TRANSITION TO NET-ZERO AND TO BUILD THEIR CLIMATE RESILIENCE 31 Climate-related opportunities Sustainable Finance Targets 2030 Sustainable Finance Targets of: • $55 billion in sustainable finance lending. This target is based on TCE (or balance1 ) at 30 September 2030. • $40 billion in bond facilitation. This target is based on our share of the cumulative value of bonds facilitated between 1 October 2021 and 30 September 2030. In supporting customers and to be clear on what constitutes sustainable finance2 , in 2024 we launched our Sustainable Finance Framework (SFF), to provide consistent definitions and processes for identifying and assessing what is in-scope of our green, transition, social and sustainability lending categories. The SFF also defines our 2030 targets for lending and bond facilitation and how we will measure and monitor our progress. In FY25, the Australian Sustainable Finance Institute (ASFI) released their sustainable finance taxonomy and, as a member of ASFI, we are participating in the pilot program to assess the taxonomy’s implementation. The ASFI Taxonomy provides a common standard for green and transition finance in Australia. We will review our SFF, and discuss with key stakeholders if changes are required to align with the ASFI taxonomy. Our Sustainable Finance Framework is available on our website. Plans to achieve our Sustainable Finance Targets We have continued to grow our sustainable finance in FY25, as we have worked to support customers with their transition. This will continue in the period ahead including considering new products that may be included under the Sustainable Finance Framework that will support new and emerging customer needs. Performance against our Sustainable Finance Targets Over FY25, sustainable finance increased $10.7 billion or 37% and cumulative bond facilitation increased $6.3 billion or 40%. This growth keeps us on track to achieve our 2030 targets. The main contributors to the growth in sustainable lending were: • An almost doubling of green finance to power generation sector; • A $4.2 billion increase in residential mortgages, mainly social lending; and • A $1.0 billion increase in TCE to the commercial property sector. New sustainable bond facilitation was spread across green and sustainability bonds with continued growth in the government sector and a doubling in labelled corporate bond issuance over the prior year. FINANCING RENEWABLE ENERGY Achieving economy wide net-zero emissions requires a transformation of the electricity grid. Alongside decarbonising through renewables, the grid must expand to support the growing electrification of homes, businesses and transport. At 30 September 2025, 89% of TCE in our Australian and New Zealand electricity generation portfolio was to renewable generation sources (including wind, solar and hydro). FIGURE 10: PROGRESS OF SUSTAINABLE FINANCE 4.3 19.1 28.7 39.4 4.9c 9.9c 15.9c 22.3 Sustainable finance lendinga (Total TCE $bn) Sustainable bond facilitationb (Total value of bond facilitation ($bn) cumulative from 1 October 2021) 2022 2023 2024 2025 a. Total TCE ($bn). b. Total value of bond facilitation ($bn) cumulative from 1 October 2021. Refer to page 16 of the Sustainable Finance Framework for further information on the scope of products and services and accounting basis of sustainable bond facilitation. c. Prior year numbers restated following data quality reviews which identified additional bonds not previously included. 1 The balance represents the balance outstanding at a point in time and is applicable for residential mortgages. 2 Sustainable Finance includes both labelled lending, and unlabelled lending for customers and activities in-scope of our SFF categories. WESTPAC 2025 SUSTAINABILITY REPORT |
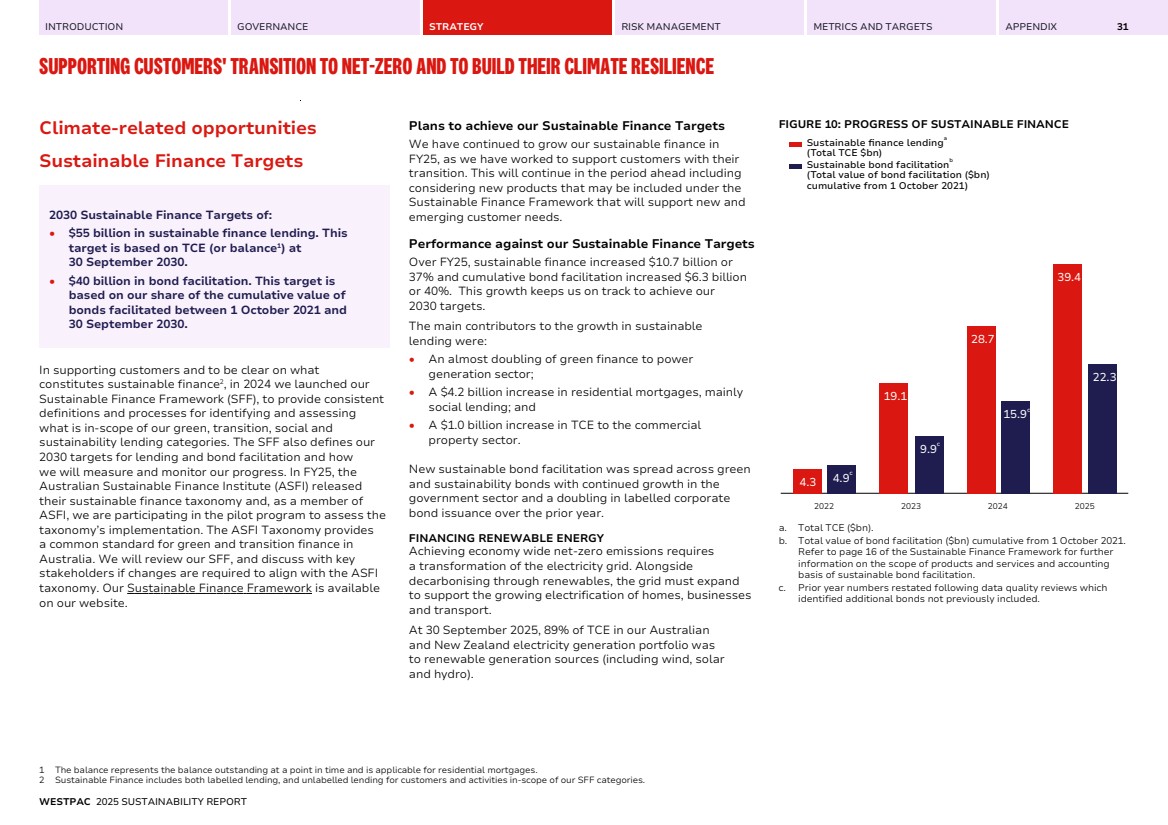
| INTRODUCTION GOVERNANCE STRATEGY RISK MANAGEMENT METRICS AND TARGETS APPENDIX SUPPORTING CUSTOMERS' TRANSITION TO NET-ZERO AND TO BUILD THEIR CLIMATE RESILIENCE 32 TABLE 14: PROGRESS IN SUSTAINABLE FINANCE LENDING1 CATEGORYa 2025 2024 Green 18.5 12.2 Transition 0.2 0.0 Social 11.6 7.6 Sustainability 0.2 0.2 Sustainability-linked 8.9 8.8 Total TCE ($bn) 39.4 28.7 SECTOR 2025 2024 Power Generationb 7.7 3.9 Transportb 1.4 1.2 Commercial Real Estateb 5.6 4.6 Residential Mortgages – Australia 9.4 5.2 Healthcareb 1.6 1.4 Educationb 0.9 0.7 Otherc 6.1 5.3 New Zealand – Agriculture 3.5 3.3 New Zealand – Other sectors excl. agriculture 3.1 3.2 Total TCE ($bn) 39.4 28.7 Amount of assets aligned with climate-related opportunitiesd ($bn TCE) 18.5 12.2 % of Total Group TCE 1.4% 1.0% a. Categories of Green and Social are labelled and unlabelled lending. Transition is unlabelled lending only. Categories of Sustainability and Sustainability-linked are labelled lending only. b. WIB only excludes WNZL. c. Includes labelled lending in other sectors (i.e., not listed already) for WIB. d. Includes Green lending only. May include nature-related opportunities. TABLE 15: PROGRESS IN BOND FACILITATION1,2 CATEGORY 2025 2024 Green 11.1 8.5a Social 0.3 0.3 Sustainability 10.4 6.9a Sustainability-linked 0.5 0.3a Total value of bond facilitation ($bn) cumulative from 1 October 2021 22.3 15.9a a. Prior year numbers restated following data quality reviews which identified additional bonds not previously included. Case study: Battery financing to help South Australia deliver on big energy transition goals To support South Australia’s renewable energy goals, it is essential to strike the right balance between renewable energy generation and storage – underpinned by commercially viable solutions. This year, Westpac played a key role as financier for the Stage 1 development of Revera Energy’s Bungama utility-scale battery project located over 200km north of Adelaide. The 150 MW battery is understood to be the first standalone Battery Energy Storage System (BESS) financed on a fully merchant / uncontracted basis by commercial banks in Australia and will provide 300 MWh of storage capacity once operational in 2026, ensuring grid reliability and energy security. This innovative finance structure not only supports the energy transition but also helps attract new investment into the sector, positioning it as a key contributor to the South Australian Government’s goal of achieving net 100% renewable energy by 2027. Case study: Expanding renewables while supporting regional NSW This year, Westpac acted as Mandated Lead Arranger and Green Loan Coordinator for ACEREZ’s finance of the Central-West Orana Renewable Energy Zone (REZ) transmission project. Located near Mudgee and Dubbo, the REZ spans more than 20,000 square kilometres and will generate enough energy from large-scale solar and wind farms to power more than 2 million homes annually. ACEREZ – a partnership between ACCIONA, COBRA, and Endeavour Energy – has been appointed by EnergyCo, the NSW Government authority leading the delivery of the REZ, to build, operate and maintain the transmission network that connects the REZ to New South Wales’s electricity grid. At its peak, development of the REZ is expected to support around 5,000 construction jobs and bring in up to $20 billion of investment into regional Australia.3 1 When structuring or participating in sustainable finance transactions, Westpac was guided by national sustainable finance taxonomies, and global sustainable finance market standards, principles and guidance that are commonly used to label or categorise loans and bonds as green, social, sustainability or sustainability-linked (such as those standards, principles and guidance issued by the Loan Market Association, International Capital Markets Association and/or the Climate Bonds Initiative). For unlabelled finance, the approach to sustainable finance is set out in our SFF. Progress is reported at 30 September. 2 Refer to page 16 of the Sustainable Finance Framework for further information on the scope of products and services and accounting basis of sustainable bond facilitation. 3 https://www.energyco.nsw.gov.au/cwo-rez WESTPAC 2025 SUSTAINABILITY REPORT |
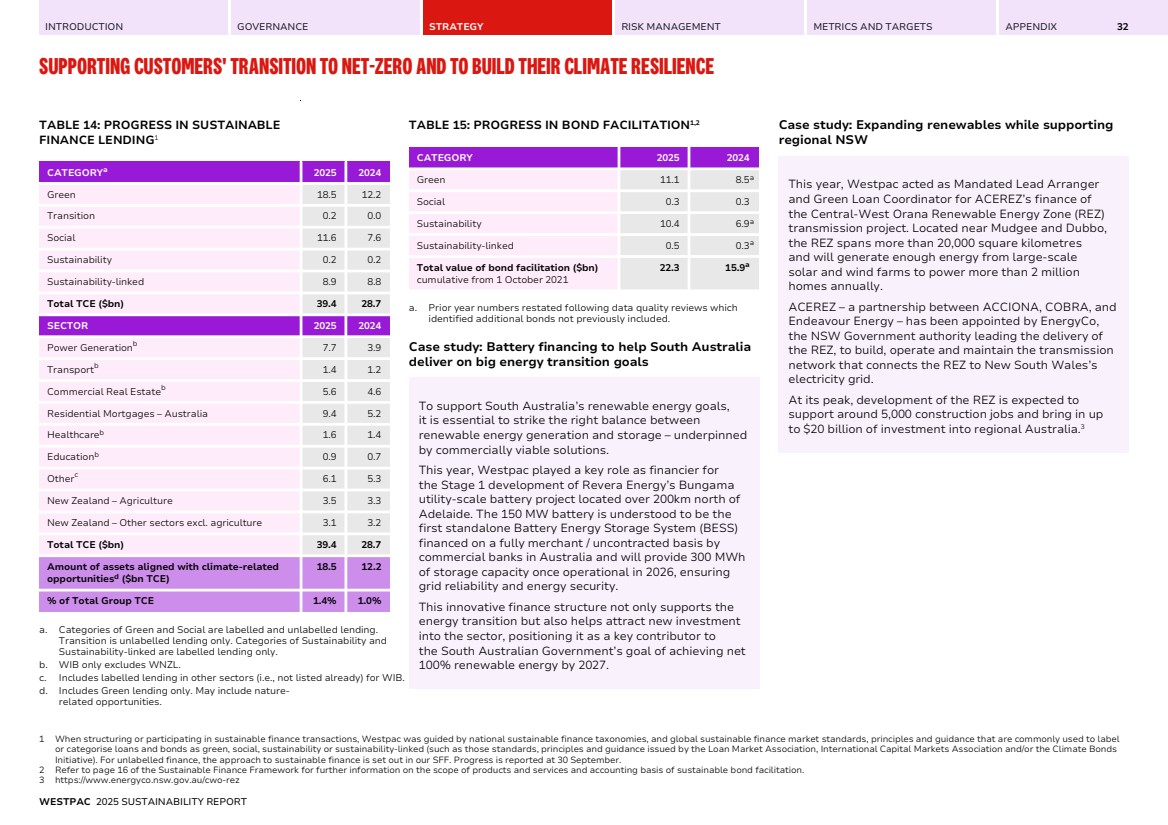
| INTRODUCTION GOVERNANCE STRATEGY RISK MANAGEMENT METRICS AND TARGETS APPENDIX SUPPORTING CUSTOMERS' TRANSITION TO NET-ZERO AND TO BUILD THEIR CLIMATE RESILIENCE 33 Other climate-related opportunities In addition to the lending and bond facilitation captured by our SFF, there are also other climate-related opportunities that the Group is involved in. Some of these included: • EV Vehicle Lending: Westpac launched EV loans in third-party arrangement with Tesla in 2025. At 30 September 2025, loans for EV/hybrid vehicles to Australian customers totaled $63.4 million (2024: $53.7 million); • Green Tailored Deposits: Westpac’s Green Tailored Deposits are term deposits that have been certified to meet the Climate Bonds Standard, which is an internationally recognised scheme utilised to prioritise investments which contribute to addressing climate change. At 30 September 2025, Green Tailored Deposits were $1.7 billion (2024: $2.0 billion); and • Enhanced insights for customers: Launched a Home Energy Efficiency Tool in third-party arrangement with Cogo, providing customers with tailored insights into how they can benefit from sustainable upgrades. Supporting our customers' physical resilience To become a climate resilient bank, it is important to consider the resilience of our customers, as their capacity to withstand challenges directly impacts us. In FY25, we updated our data capabilities for physical risk in the retail portfolio, including improving our understanding of individual asset peril exposure and potential insurance costs. This informed our scenario analysis and contributed to the development of an updated physical risk measure within our Board Risk Appetite Statement, which also considers customers' credit risk. For our non-retail portfolio, we have commenced development of a new physical risk framework to assess a broader range of climate-related factors that may affect our business customers. Supporting customers impacted by disasters This year we supported customers through a range of natural disasters, including ex tropical cyclone Alfred which affected a broad region from Queensland’s Sunshine Coast down to Ballina in Northern New South Wales (NSW). Northern NSW also experienced extreme rain events isolating a number of regional and rural communities. Through the year we supported 639 customers with natural disaster relief packages (2024: 162 natural disaster relief packages). Case study: Supporting commercial property customers to decarbonise A Westpac business customer for over 13 years, Corval – a specialist property investor – continues to demonstrate leadership in sustainable asset management. Through a proactive and collaborative approach, Corval works closely with tenants to improve energy efficiency and reduce emissions across its industrial property portfolio. This includes installing energy meters across its assets, enabling real-time electricity monitoring that helps both Corval and its tenants identify inefficiencies, lower energy consumption, and reduce operational costs. In 2024, at their Wingfield site in South Australia, Corval partnered with tenant Superior Food Services to install a 100kW solar panel system and 130kW battery storage, delivering significant energy savings and emissions reductions. According to CEO Rob Rayner, “actively pursuing energy efficiency is inherent in our approach to developing and owning real estate, as it reduces costs for our tenants, improves returns for our investors, and provides a positive impact for our communities.” Collaborating for impact We recognise the important role we can play by supporting and participating in international, national and industry-based initiatives to progress collective action on climate change. Beyond our discussions with customers, we have engaged with industry groups, regulators, and governments to share our perspectives and insights to support the transition towards a net-zero, climate resilient economy. This year, our initiatives have included: • Actively contributing to industry, regulator and government feedback on new climate-related disclosure standards in both Australia an New Zealand; • Collaborating with agriculture and commercial real estate industry forums and bodies; and • Engaging with ASFI on their sustainable finance taxonomy. Submission to the Economic Reform Roundtable As part of Westpac’s submission to the Australian Treasury’s Economic Reform Roundtable, we provided a range of policy proposals and ideas designed to make Australia more productive. Our submission, "Building a Stronger Australia" outlines proposals that seek to accelerate Australia's energy transition. In developing these recommendations, we sought insights, subject matter expertise and sector knowledge from Westpac customers, peak bodies, industry associations and individuals who are experts in their fields. WESTPAC 2025 SUSTAINABILITY REPORT |
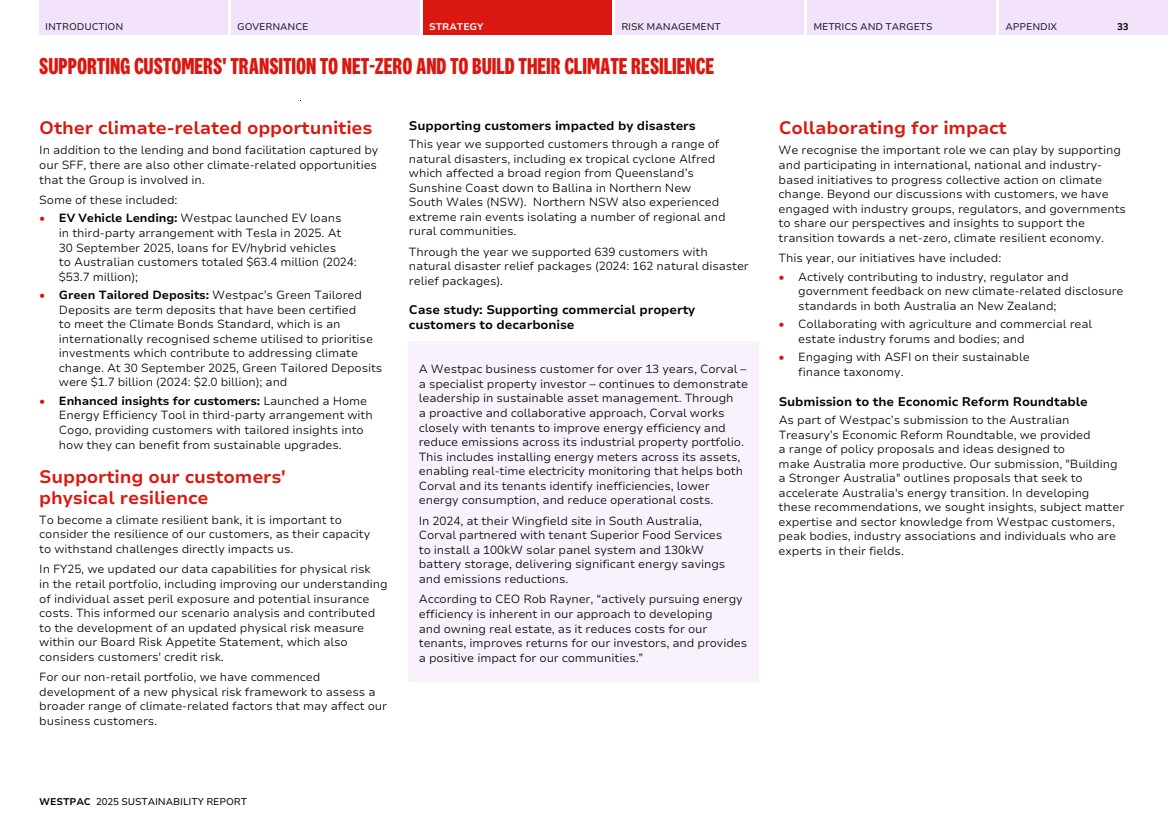
| INTRODUCTION GOVERNANCE STRATEGY RISK MANAGEMENT METRICS AND TARGETS APPENDIX 34 FINANCIAL EFFECTS Financial effects of climate-related risks and opportunities We have conducted an assessment of the impacts of climate change on our financial statements. Our analysis included an assessment of the Group’s exposure to climate risk, including physical and transition risk as a proportion of our overall credit exposure (see Table 17 and Table 20). The analysis showed that there was no material impact on our Group's financial statements for the year ended 30 September 2025. Under current climate scenarios the most significant economic impacts from climate change would be expected to occur beyond the expected lives of the exposures identified. In addition, we did not identify any matters for which there is a significant risk of a material adjustment to the carrying amounts of assets and liabilities, or a material impact to the income statement, within the next annual reporting period (short-term). Climate change is a significant source of uncertainty which may affect our financial statements in the future. While extreme climate-related events may lead to higher costs or credit losses in a given year, the impacts are not anticipated to be material in the medium to long-term, given the Group’s risk management framework, approaches in managing climate-related risks in our lending and targets to reduce our financed emissions. The results of the Climate Risk Materiality Assessment indicate that our risk management strategy (RMS) is well adapted to helping us navigate the potential shocks under a ‘Current Policies’ (RCP8.5) or ‘Delayed Transition’ (RCP4.5) scenario. Climate-related risks We conducted a range of scenario analyses to assess the exposure of certain parts of our lending to climate-related physical and transition risks. Refer to 'Climate-related scenario analysis' in the Risk Management section for more information and figures. At 30 September 2025: • 0.9% of total Group TCE was in sectors with heightened exposure to transition risk1 (based on a Net Zero 2050 (RCP2.6) scenario in a long-term time horizon to 2030-2035); and • 2.8% of total Group TCE was exposed to heightened physical risks2 or vulnerable to severe rainfall flood risk3 (based on IPCC RCP4.5 and IPCC SSP2-4.5 scenarios for certain parts of Australian and New Zealand lending respectively in a medium-term time horizon to 2030). Noting that the scope of our analysis is currently limited and might be expanded in future years, including by integration of new datasets, and refining our methodologies. Over FY25, a number of regions experienced extreme climate-related events. While some customers experienced material hardships such as flooding to homes and businesses, Westpac did not experience a material financial impact because of these events. Refer to 'Supporting our customers' physical resilience' for more information. The Group holds a $71 million expected credit loss provision overlay as at 30 September 2025 (2024: $70 million) for the expected impact of extreme weather events on customers. Climate-related opportunities Sustainable financing provided to customers under the Sustainable Finance Framework generates interest and other income for the Group. At 30 September 2025: • The TCE of sustainable finance lending was $39.4 billion (2024: $28.7 billion). It equals 3% of total Group TCE; and • The Group facilitated bonds of $22.3 billion (2024: $15.9 billion) for its institutional customers (total value of bond facilitation cumulative from 1 October 2021). We also earn income from other climate-related products and services including, lending for electric vehicles, certain home upgrades in New Zealand and from carbon trading. Capital deployment We devote resources in managing climate-related risks and opportunities, which we view through the following three lenses: 1. CUSTOMER SUPPORT Capital is deployed through the provision of sustainable finance products to support our customers to take advantage of climate opportunities and mitigate climate risks. Further details of sustainable finance are in the Strategy section on page 31 to 32. We do not explicitly allocate capital or funding for lending to specific sectors or purposes. Instead, these are applied to lending as it is written, which is driven by customer demand. Based on the Group’s current plans, we have sufficient capital and funding to accommodate our transition plan including the expected increase in sustainable finance and other climate-related lending into the short and medium term. 2. OPERATIONS Expenditure aimed at specifically addressing climate-related risks and opportunities in our business. We deploy capital to climate-related initiatives that drive change, enhance capabilities, develop new products and services, improve infrastructure or reduce risk. In FY25, climate-related expenditure included as part of the Group's investment pool was <$10 million (2024: <$22 million), including: • Improving climate-related data and systems, including for our financed emissions targets; • Enhancing our climate scenario analysis; and • Geospatial mapping to assist with customer risk assessments. 1 In non-retail lending (all geographies). 2 In Australian retail mortgages. 3 In New Zealand retail mortgages, commercial property lending, and agricultural lending. WESTPAC 2025 SUSTAINABILITY REPORT |
| INTRODUCTION GOVERNANCE STRATEGY RISK MANAGEMENT METRICS AND TARGETS APPENDIX FINANCIAL EFFECTS 35 Prior year spend was higher as we completed a number of major initiatives including a new mortgage product, updating our risk assessments and enhancing data. 3. INVESTMENT We deploy capital through investments in specific climate-related initiatives, usually outside the Group’s normal operations. We currently hold a minority equity interest in Virescent Ventures’ second climate technology investment fund (Fund II). This fund is focused on investing in early-stage climate-related technologies aimed at addressing climate-related challenges. Details of the investment committed by Westpac are confidential, noting we committed to the Fund’s initial $100 million raising (which completed in FY25) as a cornerstone investor alongside the Clean Energy Finance Corporation and other public and private institutions. Internal carbon price We do not apply an internal carbon price in our current decision-making processes. This includes operational changes such as office and branch refurbishments or for transfer pricing related to interest rates. We have used some carbon pricing in our scenario analysis, to help understand climate-related impacts on our portfolio. While some customers may be exposed to region-specific legislation that includes carbon pricing mechanisms, for example the Safeguard Mechanism in Australia this is not typically factored into our pricing decisions for customers. Assessing climate resilience In assessing our capacity and flexibility to respond to climate change, we consider our business model, strategy, financial position, and potential operational impacts through our value chain. Implications for our strategy and business model Our business model as a bank is resilient to climate-related changes, developments and uncertainties and is unlikely to change, or need to change, in most foreseeable circumstances. Banks play a key role in the transition to net-zero, to support companies through providing finance to facilitate the change. Given our large market share in Australia and New Zealand we believe we will continue to have an important role to play. Our strategy, centered on supporting customers in our core markets, is expected to require continuous refinement to address evolving climate-related risks and opportunities. We have already adapted our approach through measures such as sector position statements, ESG risk assessments in lending, and the implementation of our Sustainable Finance Framework, and we have the ability and financial resources to continue to respond to potential change. Financial resources supporting resilience Westpac has a strong capital position and funding and liquidity profile, providing flexibility to respond to climate-related impacts. The Group has a common equity tier 1 capital ratio of 12.5% which is above its preferred range and comfortably higher than regulatory minimums. Under our credit risk management approach, we also book provision overlays for risks that are not included in modelled provision outcome but may emerge in the short term. Similarly, possible medium-term impacts to climate change, are considered via our annual Internal Capital Adequacy Assessment Process, which could lead to holding higher levels of capital for assessed risks. This approach assists us to increase our financial resilience to potential climate-related risks as they emerge. Operational assets – the assets required to run a bank The nature and mix of our assets provides us with flexibility in responding to the impacts of climate change. Most of our assets are loans to customers (our lending), liquid assets and derivatives, and these typically have a duration, or behavioural duration, of less than 5 years. This provides us with the capacity to change the mix of our assets within the medium term. Property and equipment assets at 30 September 2025 were $2,266 million (0.2% of total assets). Westpac is not a material owner of commercial property, with branches, corporate, and operational offices occupied under lease agreements. While climate events may affect our operations and service delivery, any asset revaluations would likely have minimal impact given our limited direct property ownership. Lending: accounted for around 75% of our assets at 30 September 2025 with 99% of our gross loans in Australia and New Zealand. We continue to change the mix of our lending consistent with our Climate Transition Plan. This includes reducing the proportion of exposure to high-emitting sectors and increasing lending to clean energy, transition and sustainable projects. Liquid Assets: predominantly include cash (including deposits at central banks), government securities and other debt securities. These securities are held for managing the bank’s balance sheet (liquidity management), and for market inventory as part of the Group’s trading activities. The majority of these assets are held in Australia and New Zealand. Significant areas of uncertainty Climate change involves uncertainties regarding its scale and direction. Scenario analysis indicates that both the extent and nature of possible changes present significant unknowns. Most uncertainties are expected to arise in the long-term, rather than in the short- or medium-term. Key uncertainties that may affect climate resilience include the possibility of more severe weather events, suppliers' ability to maintain operations, how customers will adapt, and unpredictable regulatory demands on the sector. WESTPAC 2025 SUSTAINABILITY REPORT |
| INTRODUCTION GOVERNANCE STRATEGY RISK MANAGEMENT METRICS AND TARGETS APPENDIX 36 OUR CLIMATE TRANSITION PLAN Our Climate Transition Plan Our new Climate Transition Plan (CTP) outlines our response to support our climate ambition of becoming a net-zero, climate resilient bank. It is guided by the principles within our Climate Change Position and supports the delivery of Westpac’s Sustainability Strategy. A summary of our CTP is included on the next page. WESTPAC BANKING CORPORATION ABN 33 007 457 141 WESTPAC'S CLIMATE TRANSITION PLAN Responding to climate-related risks and opportunities The CTP covers our operations and lending and includes the actions we will undertake to manage climate-related risks and capitalise on climate-related opportunities for our business, customers and the communities in which we operate. It outlines our targets, the metrics we do or intend to monitor, and the key enablers and dependencies in achieving our ambition. The next page provides a high level overview of the three focus areas underpinning our CTP. For further details on Westpac's CTP, please refer to our website. This includes our approach to managing our physical and transition risks, and how we are working to improve our resilience. It also highlights our approach to the opportunities that climate change presents, namely how we can support customers to build resilience and help with their decarbonisation. Developing our Climate Transition Plan Our CTP builds on long history of recognising the scientific consensus of climate change and our need to respond. In setting our CTP we have been guided by a set of assumptions, dependencies and principles, outlined below: • Our CTP assumes that global policies, actions, and commitments work in support of Article 2(a) of the Paris Agreement, to hold global warming to well below 2 degrees Celsius, and to pursue efforts to limit warming to 1.5 degrees Celsius above pre-industrial levels; • More than 99% of our greenhouse gas emissions result from our customers through scope 3 financed emissions. As such, achieving our net-zero ambitions is fundamentally linked to the transition pathways of our customers, which we assume are consistent with an orderly transition; • As economies work toward the energy transition, they must keep energy affordable and address the unique needs and challenges of each sector and as well as individuals that may be disproportionately affected; • Achieving our ambitions depends on the economy’s transition which include decarbonising energy systems, enhancing infrastructure along with the advancement and implementation of low carbon and carbon capture technologies; • This progression requires collaborative engagement with governments, regulators, and industry to address emerging challenges and that the right policies and approval processes are in place to support these developments; • The physical risks of climate change will not only directly impact customers but over time will have broader implications for asset values, productivity and resilience; and • Building physical resilience requires sharing essential data and plans on hazard risks, insurance coverage, and infrastructure readiness. WESTPAC 2025 SUSTAINABILITY REPORT |
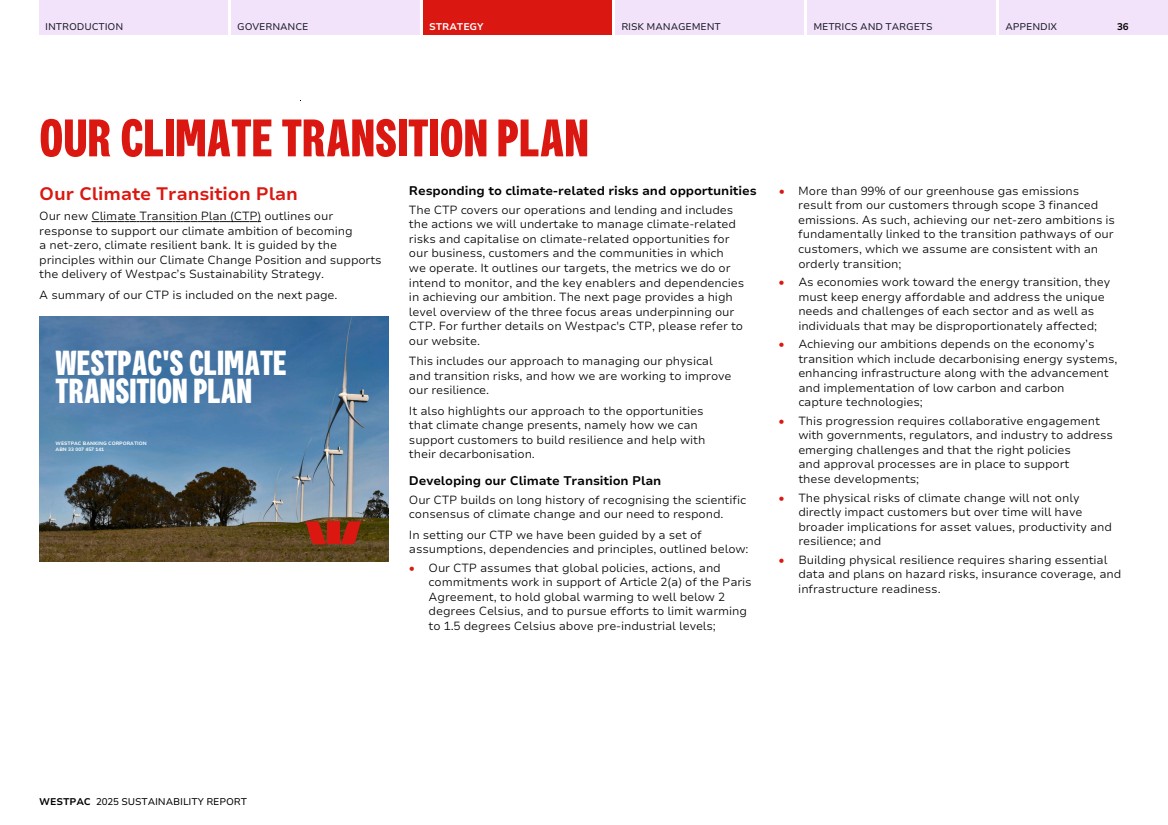
| INTRODUCTION GOVERNANCE STRATEGY RISK MANAGEMENT METRICS AND TARGETS APPENDIX OUR CLIMATE TRANSITION PLAN 37 Summary of our Climate Transition Plan 76% reduction in scope 1, 2 absolute emissions by 2030 (2021 baseline) 50% reduction in upstream scope 3 absolute emissions by 2030 (2021 baseline) 2030 scope 3 financed emissions sector targets $55 billion in sustainable finance lending at 30 September 2030 $40 billion in sustainable bond facilitation between 1 October 2021 and 30 September 2030 Achieving our GHG emissions reductions targets and managing operational climate resilience by: • Maintaining our approach to reducing scope 1 and 2 emissions • Understanding and managing our upstream scope 3 emissions • Understanding and managing the physical climate vulnerability of our operations Taking a whole-of-portfolio view to support an economy-wide, orderly transition by: • Engaging with customers to understand their challenges and exchange insights that help advance their transition • Engaging at an industry-level to promote coordinated change across the value-chain • Offering products and services to our customers to enable their decarbonisation Taking a risk-based view of customer resilience to the physical impacts of climate change by: • Understanding and exploring ways of managing physical risk drivers and impacts within our portfolio • Engaging with customers and communities to identify vulnerability and resilience opportunities • Offering products, services and insights to enable customers and communities adapt, prepare, respond and recover Maintain operational resilience to the physical impacts of climate change. Transition our lending portfolios to support the goals of the Paris Agreement. Adopt a portfolio-wide view of exposure and vulnerability to physical climate risks. WESTPAC 2025 SUSTAINABILITY REPORT |
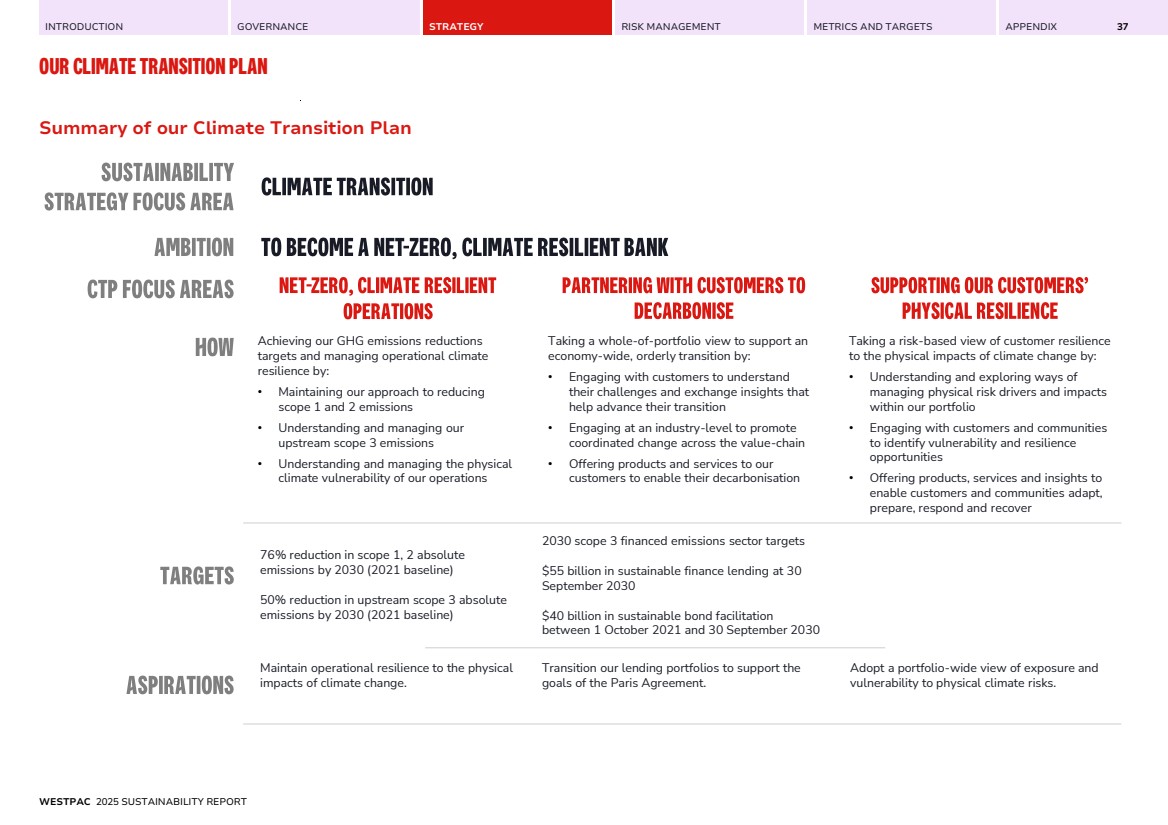
| INTRODUCTION GOVERNANCE STRATEGY RISK MANAGEMENT METRICS AND TARGETS APPENDIX 38 RISK MANAGEMENT CONTENTS RISK MANAGEMENT 39 CLIMATE-RELATED SCENARIO ANALYSIS 42 |
| INTRODUCTION GOVERNANCE STRATEGY RISK MANAGEMENT METRICS AND TARGETS APPENDIX 39 RISK MANAGEMENT Managing climate-related risks The management of climate-related risks is integrated within Westpac’s Board approved Risk Management Strategy (RMS). The RMS, supported by our Risk Management Framework (RMF), sets out a structured approach to identifying, assessing, monitoring, and managing our material risks, including climate-related risks. The RMF is built around customers, a strong risk culture, and a Three Lines of Defence (3LOD) model: • 1st Line: Business units have accountability to own and manage risk; • 2nd Line: Risk function sets frameworks, policies and appetite. Provides insight, oversight and challenge; and • 3rd Line: Internal audit provides independent assurance that Line 1 and 2 are effective in managing risk. The RMF and RMS are supported by risk class frameworks, risk appetite statements, and policies. These are all reviewed regularly to help maintain their effectiveness. The Sustainability Risk Management Framework (SRMF) and the Climate Risk Policy support the RMF and RMS by detailing how sustainability (including climate-related) risks are identified, monitored, and managed. These also define the roles and responsibilities for managing these risks in line with our 3LOD. We identify these risks as part of how we manage the business, considering emerging risks and changes to our strategy and the external environment. For additional details on the broader range of policies and processes which support climate-related risk management, refer to page 41. A Board-approved Group Risk Taxonomy defines 11 material risk categories. The Taxonomy provides a common language and single view of the existing risks faced by Westpac. The RMF integrates climate-related risk into the risk management approach by recognising Sustainability and Climate Change Risk as both a financial risk (under Credit Risk), and as a non-financial risk (under Reputation and Sustainability Risk) in our Taxonomy. Our Board Risk Appetite Statement sets the aggregate amount and types of risk which Westpac is willing to accept for each material risk category. It is reviewed and approved by the Board annually and includes climate-related risk measures. Further details on our material risk categories and risk management approach are available in the Risk Management section of our Annual Report. Climate-related risks do not exist in isolation and, in line with our SRMF, must be managed in coordination with other material financial and non-financial risks across our Taxonomy. Climate Risk Materiality Assessment (CRMA) The purpose of our CRMA is to understand how climate-related risks may impact on our material risk categories. The materiality of the risk is determined by evaluating the impact of climate-related events across our defined financial and non-financial risks. The assessment was completed from a Group perspective, based on Westpac’s existing business model. It was completed through workshops with senior management, including our material risk category owners. This assessment differs to our broader climate scenario analysis activity, but for consistency, we utilised the same climate scenarios. Further work is required to apply this approach to climate-related opportunities. Conducting our assessment In performing this assessment, we considered plausible but severe climate scenarios from the Network for Greening the Financial System (NGFS) across three time horizons. The NGFS scenarios are designed to assist financial institutions to examine how physical and transition risks could impact operations and inform strategies to address future potential risks. These scenarios are designed to serve as analytical tools rather than predictions, so their outcomes should not be interpreted as a prediction of future events. WESTPAC 2025 SUSTAINABILITY REPORT |
| INTRODUCTION GOVERNANCE STRATEGY RISK MANAGEMENT METRICS AND TARGETS APPENDIX RISK MANAGEMENT 40 We selected two scenarios for this analysis: 1. Current Policies (RCP8.5): This scenario serves as a baseline, assuming current climate policies continue in the long term. Under this scenario, emissions are expected to rise, leading to increased global warming and heightened physical risks, such as more frequent or intense droughts, bushfires, and flooding. This is also known as a high physical risk scenario; and 2. Delayed Transition (RCP4.5): This scenario assumes no new climate policies are implemented until 2030, at which time they are suddenly applied to meet the Paris Agreement goals. Under this scenario, the focus on transition risk is a result of a delay in policy implementation. This is also known as a high transition risk scenario. The analysis from the ‘Current Policies’ (RCP8.5) and ‘Delayed Transition’ (RCP4.5) scenarios capture the most significant potential exposures for physical and transition risks, respectively. The 'Net Zero 2050 scenario' (RCP2.6), while relevant, was excluded as its risk impacts are comparatively less pronounced and would not materially change the outcomes of this assessment. For more information on the climate scenarios, refer to Section 'Methodology – Climate-related scenario analysis' in the Appendix. The timeframes used reflect the recommendation from the NGFS, primarily because climate-related impacts are expected to unfold over decades. For example, under the 'Current Policies' (RCP8.5) scenario, the severity and frequency of weather events are expected to increase over time. Similarly, under the 'Delayed Transition' (RCP4.5) scenario, response and progression is generally gradual as change takes time to embed and ultimately causes a shock which impacts the economy at the point where climate policies are suddenly changed. To determine the reasonably anticipated impacts to our material risk categories, we calculated a risk rating under each time horizon using Westpac's Risk Impact Scale and Risk Likelihood Matrix. Risk Impact was assessed across both financial and non-financial (customer, staff, regulatory, reputation, social and environmental) categories. Likelihood was assessed by estimating the probability of the risk occurring. The risk rating was determined on a residual basis, taking into account the mitigating impact of existing key controls. We assume our current control environment is stable through to the long-term to enable comparisons over the time periods assessed. Insights from our assessment The results indicate that our RMS is prepared for potential shocks under a ‘Current Policies’ (RCP8.5) or ‘Delayed Transition’ (RCP4.5) scenario. The climate-related events under each scenario did not indicate a material impact to most of our risk categories. However, it did highlight areas where we can further strengthen controls and processes to manage potential impacts. It was projected that physical risk events under a ‘Current Policies’ (RCP8.5) scenario may result in increased operational disruptions and increased insurance costs for our customers over time, impacting on our operational and credit risk management. Considering the localisation of such events and our existing control environment, the residual risk exposure is managed such that a material change to our business model or strategy is not required. Transition risk anticipated under a ‘Delayed Transition’ (RCP4.5) scenario has been assessed to have the greatest impact on credit risk and therefore a potential impact on capital adequacy, through higher risk weighted assets. To mitigate and prepare for this potential impact, we have targets to reduce our portfolio financed emissions, outlined in our Climate Transition Plan. Given the nature of scenario analysis, several assumptions were relied upon, such as having no changes to our business model or strategy and that our control environment remains constant. As such, the results are designed to be indicative, to inform gaps in our existing risk management. We anticipate this analysis to evolve over time as our understanding of climate-related risks continues to mature and data becomes more available. WESTPAC 2025 SUSTAINABILITY REPORT |
| INTRODUCTION GOVERNANCE STRATEGY RISK MANAGEMENT METRICS AND TARGETS APPENDIX RISK MANAGEMENT 41 Policies and related processes to manage climate-related risks Under our RMF and RMS, we use a range of tools and methods to identify, assess, prioritise and monitor climate-related risks across all parts of our value chain. These policies, processes, and tools support risk identification and management and include: • Climate Risk Policy: supports our SRMF and sets out our principles and requirements for managing climate-related risks. It aligns with APRA’s Prudential Practice Guide CPG 229 – Climate Change Financial Risks (CPG 229) so that climate-related risks are considered in strategic planning, risk assessments, and disclosure; • ESG Credit Risk Policy: applies to transaction managed credit exposures across business and institutional customers, with the consideration of ESG risks in our credit risk assessment process; • ESG Risk Assessment Tools: used to assess ESG risks associated with customers, transactions and the activity supported. These assessments are performed for new-to-bank opportunities and for existing customers as part of periodic risk reviews or where there are major changes to facilities. The assessment reviews the customer or transaction against our Positions, Action Plans and Sustainability Customer Requirements to help ensure our lending activities and bond facilitation are in line with our requirements and expectations. Transactions may also be escalated to a Customer and Transaction Risk Escalation Committee for additional review; • Risk and Control Assessment Policy: sets the approach to identify, assess, manage, monitor and report on risks and controls that could impact the achievement of key business objectives, resilience and the maintenance of critical operations. Material non-financial risks, including climate-related risk, are assessed for inherent and residual risk. The outcome is recorded in a risk profile, which must be refreshed quarterly where there are material changes to the internal or external environment. Risk profile assessments also consider regulatory changes, incidents and emerging risks. Risks, incidents and issues are assessed for potential impact and likelihood over the next 12 months using the Group Risk Impact Scale and Likelihood Matrix. Impact assessment includes both financial and non-financial categories. This process helps identify where the risk rating is out of appetite and supports prioritisation of actions to remediate; • ESG Obligation Library: records key Positions, Action Plans and Sustainability Customer Requirements. The library is accessed through our enterprise risk management system which allows for linking of key controls to obligations; • Stress Testing and Scenario Analysis: Westpac conducts broader Group Stress Tests and Scenario Analysis to assess potential impacts that changes to existing and emerging risks may have, including on our capital. Findings may feed into Business Continuity Planning and the Internal Capital Adequacy Assessment Process; • Responsible Sourcing Code of Conduct: we undertake screening, due diligence and assessment of suppliers to determine levels of sustainability risk (including climate-related risks) and identify actions to align to the Code; • Climate Change Credit Risk Committee: provides portfolio oversight over physical and transition risks, informing accountable individuals in making appropriate climate-related credit risk decisions. This is a sub-committee of the Group Credit Risk Committee (refer also to the Governance section); and • Enterprise Emerging Risk Forum: oversees Westpac’s aggregated view of emerging risks, including climate-related risks. It identifies these risks by scanning internal and external sources and consulting subject matter experts. Emerging risks are assessed and prioritised based on ‘Impact’ (i.e., how serious the risk is) and ‘Velocity’ (i.e., how soon it might affect Westpac – within 1 year, 1–3 years, or more than 3 years). Findings are reported semi-annually to the Group Executive Risk Committee and Board Risk Committee. Our risk management ecosystem is also supported by internal controls, procedures, and oversight mechanisms to monitor and report on these risks across our operations: • Dashboards: Allows monitoring of risk assessments, key risk indicators, and control assessments; and • Risk Reports: In accordance with governance committee Terms of Reference or Charters, this includes regular reports to Board and senior executives on risk management practices, focusing on material matters, including climate-related risks. WESTPAC 2025 SUSTAINABILITY REPORT |
| INTRODUCTION GOVERNANCE STRATEGY RISK MANAGEMENT METRICS AND TARGETS APPENDIX 42 CLIMATE-RELATED SCENARIO ANALYSIS Use of climate-related scenario analysis Climate-related risks are uncertain, so Westpac uses climate scenario analysis to help assess and manage these risks. This analysis helps us evaluate how different climate pathways in the short, medium, and long term could affect our lending and exposure to emissions-intensive sectors (as applicable). Scenario analysis is also used to understand how climate risks might impact our financial position, operations, and business strategy. It also guides risk mitigation by prompting updates to frameworks and policies, adjusting risk appetite, setting portfolio limits, and informing provisioning and capital planning. We carry out various climate-related scenario analyses, adapting each one to suit its specific purpose. Each analysis has a unique scope, approach and assumptions with the insights helping us incorporate climate considerations into our strategic planning and risk management. Our Board Risk Appetite Statement outlines our tolerance for climate risk, covering both physical and transition risks. Climate scenario analysis has helped shape these risk appetite measures for physical risk in our retail portfolio and transition risk in our non-retail portfolio. Our physical risk measure covers the proportion of the current Australian retail residential mortgage portfolio (by TCE) exposed to higher physical risks. Our transition risk measure tracks repayment risk via the percentage of our Non-Retail credit portfolio (by TCE) exposed to higher transition risk. These measures were updated in FY25 and approved by the Board, and both are within Board-approved thresholds. These measures are reviewed regularly so that any adjustments to credit risk policies, limits, and/or provisions can be made to manage these climate risks and ensure they remain within our risk appetite. Our Climate Change Credit Risk Committee reviews and discusses the approach, use and outcomes of climate-related scenarios and implications on our portfolio, credit strategy and risk appetite. Further discussion may also be escalated to the Group Credit Risk Committee, Group Executive Risk Committee, and Board Risk Committee. In FY25, no material findings were escalated to these committees, other than updates that were made to the two risk appetite measures. Overview of climate scenarios used Westpac considers a broad range of publicly available scenarios for our climate-related scenario analysis. These include scenarios aligned with the global climate goal of the Paris Agreement, which aims to hold warming to well below 2°C and ideally to 1.5°C above pre-industrial levels. In FY25, we modelled several scenarios, outlined in Table 6 and detailed in Table 16, to understand potential climate impacts. We consider these scenarios to be relevant and appropriate as they provide plausible, but challenging outcomes for physical and transition risk. These scenarios are grounded in the latest science from (the Intergovernmental Panel on Climate Change (IPCC)) and designed for financial institutions by the NGFS. We consider a diverse range of plausible, distinct scenarios and at a minimum, we use a 1.5°C scenario, 3°C or higher scenario, and a third distinct climate scenario. Our scenario analysis includes a Net Zero 2050 (RCP2.6), Delayed Transition (RCP4.5) and Current Policies (RCP8.5) scenario. Since FY24, we’ve applied a scenario selection framework to help ensure our chosen scenarios are granular, plausible, severe enough to challenge assumptions, and distinct from one another. We review and update these annually, and tailor some scenarios to better reflect our business. For more information on the climate scenarios and analyses, refer to Section 'Methodology – Climate-related scenario analysis' in the Appendix. WESTPAC 2025 SUSTAINABILITY REPORT |
| INTRODUCTION GOVERNANCE STRATEGY RISK MANAGEMENT METRICS AND TARGETS APPENDIX CLIMATE-RELATED SCENARIO ANALYSIS 43 Scenario analyses undertaken in FY25 In FY25, our scenario analyses prioritised portfolios more exposed to climate-related risks where the cohort was sufficiently large and data was available. Our approach reflects the evolving nature of climate scenario methodologies. We anticipate refining our selection criteria and analytical techniques over time. Our primary focus areas were: • Physical risk assessment within the retail lending portfolio; and • Transition risk assessment within the non-retail lending portfolio. Approximately 48% of the total lending portfolio was assessed for physical risk, and approximately 46% was assessed for transition risk. From these analyses, we estimate that 7.2% of Australian residential retail mortgage lending may be exposed to heightened physical risk under a high physical risk scenario (Current Policies) by 2050, and 7.4% of non-retail lending may be exposed to heightened transition risk under a high transition risk scenario (Net Zero 2050) by 2050. Heightened risk refers to lending where the exposure to physical or transition risk is comparatively higher than the risk exposure in the rest of the lending portfolio. These analyses have been implemented in the business through updates to our physical and transition Board Risk Appetite Statement (RAS) settings. These analyses informed our assessment of portfolio resilience to both physical and transition risks and are used as an input into the assessment of the financial effects of climate-related risks and opportunities on page 34. In addition to these core analyses, we are advancing our scenario analysis approach in two additional areas: • Transition Risk in the Australian Retail Portfolio: For example, we are examining the economic dependence of retail lending to the fossil fuel value chain. • Physical Risk in the Non-Retail Portfolio: For example, we are exploring sectoral reliance on physical assets, supply chains, and workforce distribution. While we have made meaningful progress in developing our climate scenario analysis capabilities, we acknowledge that other risk drivers may exist which have not yet been evaluated, such as the impact from sea level rise on our Australian retail residential mortgage portfolio. We expect to enhance our understanding of climate-related risks through ongoing monitoring, integration of new datasets, and refining our scenario analysis methodologies. Physical risk in the retail portfolios (Australia) We continue to deepen our understanding of physical climate risk within the Australian retail mortgage portfolio. In FY24, we disclosed exposure to acute physical risks – specifically flood, bushfire, cyclone, wind, and soil movement – under two climate scenarios (IPCC RCP2.6 and RCP8.5). In FY25, we enhanced our analytical approach and expanded our scenario analysis to include a third pathway (IPCC RCP4.5). This year’s analysis concentrated on flooding, bushfires, and cyclones, identified as the most material natural perils impacting some mortgage customers. Due to the changes in methodology and data, results from prior disclosures are not directly comparable. Our updated analysis used national address-level databases that provide peril-specific insights for individual Australian properties. These databases incorporate vendor hazard models, State government hazard data, and other validated third-party sources. They also include forward-looking projections of peril exposure, developed using local climate science and aligned to multiple Representative Concentration Pathways (RCPs 2.6, 4.5, and 8.5) across various timeframes (2030, 2050, and 2090). This scenario analysis has enabled a more granular understanding of how physical risks may evolve across geographies and timeframes in our Australian residential retail mortgage portfolio. Under a high-risk climate pathway (RCP8.5), approximately $39.4 billion, or 7.2%, of our Australian retail residential mortgage portfolio may be exposed to heightened physical climate risk by 2050. Australian residential retail mortgage portfolio with heightened physical risk exposure by time period and scenario are outlined in (Table 20 Results of Climate-related scenario analyses assessing physical risk). Using this same physical risk analysis, we have provided additional credit quality metrics and outstanding balance exposure in (Table 21 Australian retail mortgages credit quality metrics under different climate scenarios). These insights inform our risk appetite settings (as referenced above) and assist us to determine what products and services to develop to help our customers build resilience and mitigate exposure to physical risks. For further detail, refer to Section 'Methodology – Climate-related scenario analysis' in the Appendix. Physical risk in New Zealand In New Zealand, we use detailed climate-related data from New Zealand-based climate scientists to help us assess a selection of the most material physical risks associated with climate change across a range of climate scenarios. In FY25, we expanded our coverage of physical risks to include rainfall flooding and updated our sea level rise measure to a coastal inundation metric, replacing both the rainfall flooding and the sea level rise metric used last year. In this Report, we focus on the rainfall flooding analysis. We analysed a subset of our lending secured against property, including in the Residential mortgages, Agricultural Business and Commercial Real Estate portfolios and segments. Property (including land or land and buildings) identified by a unique identifier is matched to our climate data. Our assessment is conducted on a portfolio-basis, on the portion of a portfolio that we are able to match with climate data. We have developed damage profiles for each hazard based on data, research and judgement. A damage profile is a classification tool, based on likely severity of the hazard damage to a property. This supports assessment of the levels of risk for properties, including the classification of a property as Vulnerable. Each hazard has its own damage profile and level of risk. This aligns with leading methodologies in natural hazard risk assessment. WESTPAC 2025 SUSTAINABILITY REPORT |
| INTRODUCTION GOVERNANCE STRATEGY RISK MANAGEMENT METRICS AND TARGETS APPENDIX CLIMATE-RELATED SCENARIO ANALYSIS 44 Transition risk in the non-retail portfolios (Australia and New Zealand) In prior years, our disclosures on transition risk exposure were based on a methodology developed in 2019. In FY25, we implemented a revised, internally developed qualitative transition risk framework. This enhanced framework incorporates a broader set of transmission channels, including anticipated changes in policy and regulation, technological disruption, capital reallocation, supply chain impacts, and shifts in consumption patterns. As a result of this change in methodology, current disclosures are not directly comparable to prior years. The identification of sectors with heightened transition risk supports our Lines of Business in more effectively measuring, monitoring, and managing their exposure. Transition risks have been assessed across three climate scenarios and over three time horizons, providing insight into how these risks may evolve over time. Under the Net Zero 2050 scenario (RCP2.6), approximately $44.0 billion (7.4%) of our non-retail lending portfolio is assessed as having heightened exposure to transition risk by 2050. Refer to Table 18 for a breakdown of exposure by sector. This analysis informs our risk appetite settings and portfolio responses. We remain committed to refining our approach as industry practices mature and data availability improves. Inclusion of future enhancements, such as the incorporation of additional transition risk transmission channels, may result in us identifying further sectors with heightened risk exposure. For further detail, refer to Section 'Methodology – Climate-related scenario analysis' in the Appendix. TABLE 16: KEY CLIMATE-RELATED SCENARIOS THAT WE CONSIDERED IN FY25 Characteristic Scenarios Net Zero 2050 (RCP2.6) Delayed Transition (RCP4.5) Current Policies (RCP8.5) Description A net-zero scenario limits global warming to 1.5-degrees through stringent climate policies, reaching net-zero global emissions by 2050. The global response is coordinated, and emissions follow an orderly trajectory to net-zero by 2050, aligned to increasingly stricter carbon policies and increasing deployment of abatement solutions. Only hard-to-abate emissions remain in the economy in the long term, offset by negative emissions technologies and sequestration. A disorderly transition assumes a delay in policy responses to address global greenhouse gas emissions, requiring strong policies from 2030 to limit global warming to well below 2 degrees. The increased frequency and severity of physical risks places pressure on policymakers to take decisive actions to mitigate future physical risk impacts. A current policies scenario describes a business-as-usual trajectory, where emissions continue to rise throughout the century and limited action is taken to address global warming. Acute and chronic physical risk impacts will be similar to the other scenarios in the short-medium term due to the locked-in impacts from existing GHG concentrations. Long term impacts are expected to be much more severe and continuing to worsen to 2100. Temperature rise 1.5°C Well below 2°C. 3°C or greater Physical risk • In the near term, acute physical risks are expected to continue as existing GHG concentrations have already locked in climate change impacts over the coming decades. • Increases in severity and/or frequency are expected to be somewhat limited due to achieving an ambitious temperature goal. • Chronic risks will similarly worsen (heat stress, sea level rise) however these risks are relatively much lower than in other scenarios. • Acute and chronic physical risks, although similar in the short term, are expected to worsen post 2030 with worse outcomes in 2050 relative to "the Net Zero 2050 scenario" (RCP2.6). • Physical damages will also be greater in this scenario relative to a net-zero scenario, due to the delayed policy response. • Acute physical risks will increase in severity and/or frequency. Chronic risks will become much more severe in the long term, including extreme temperatures, changes in precipitation and sea level rise, further exacerbating acute risks (including storm surge, storms, fire weather and flooding). Transition risk • Transition risks are expected to be high as immediate, strict global policy action is required. • Due to the need to take aggressive action to address the impacts of climate change, introduced policies will be restrictive, sudden and severe. • Transition risks in this scenario are minimal as little action is taken to address climate change. • Emissions follow a downward trajectory, aligned to current policy ambition, however a significant volume of emissions continue to enter the atmosphere through to 2050. • No additional policies are enacted beyond the policies that are currently in place to address climate change. WESTPAC 2025 SUSTAINABILITY REPORT |
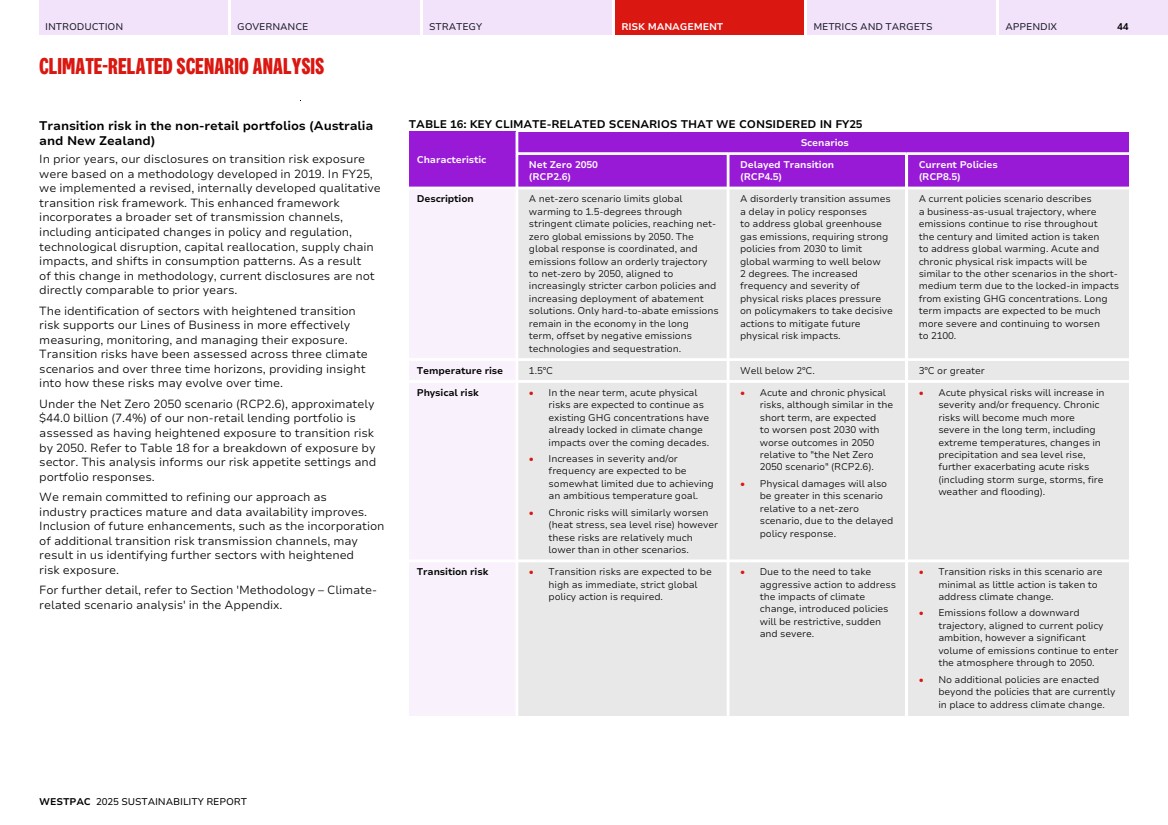
| INTRODUCTION GOVERNANCE STRATEGY RISK MANAGEMENT METRICS AND TARGETS APPENDIX CLIMATE-RELATED SCENARIO ANALYSIS 45 Climate-related scenario analysis results – transition risk Table 17 shows the results of our climate-related scenario analysis to estimate the areas of our lending portfolio exposed to heightened transition risk. Refer to Section 'Methodology – Climate-related scenario analysis' in the Appendix for more detail on the scenarios and analysis conducted. Table 18 provides a breakdown by industry of sectors with heightened exposure to transition risk in 2030-35 under a Net Zero 2050 scenario (RCP2.6). TABLE 17: RESULTS OF CLIMATE-RELATED SCENARIO ANALYSES ASSESSING TRANSITION RISK Reporting year 2025 2024 2023 Portfolio Metrica Westpac Time Horizon Short to Medium-Term (1 to <5 years) Long-Term (5 years+) Medium-Term (1 to <5 years) Long-Term (5 years+) Medium-Term (1 to <5 years) Long-Term (5 years+) Scenario endpoint 2025- 2029 2030- 2035 2036- 2050 2025- 2029 2030- 2035 2036- 2050 2025- 2029 2030- 2035 2036- 2050 Scenario Non-retail lending portfoliob (all geographies) % of non-retail portfolio in sectors with heightened exposure to transition risk Current Policies (RCP8.5) 0.0% 0.0% 0.0% 0.0% 0.0% 0.0% 0.0% 0.0% 0.0% Delayed Transition (RCP4.5) 0.0% 2.0% 7.4% 0.0% 1.8% 7.1% 0.0% 1.8% 6.9% Net Zero 2050 (RCP2.6) 0.0% 2.0% 7.4% 0.0% 1.8% 7.1% 0.0% 1.8% 6.9% Group $bn of total TCE in sectors with heightened exposure to transition riskc Net Zero 2050 (RCP2.6) 0.1 12.2 44.0 0.1 9.9 39.6 0.2 10.4 38.9 % of total TCE in sectors with heightened exposure to transition riskc 0.0% 0.9% 3.4% 0.0% 0.8% 3.2% 0.0% 0.9% 3.2% a. Calculated at 30 September 2025. b. Includes all business and institutional lending (all geographies), including treasury and sovereign lending. Lending that does not have an associated ANZSIC is excluded from the calculation. Analysis is performed at the ANZSIC 4-digit level. c. In non-retail lending (all geographies). WESTPAC 2025 SUSTAINABILITY REPORT |
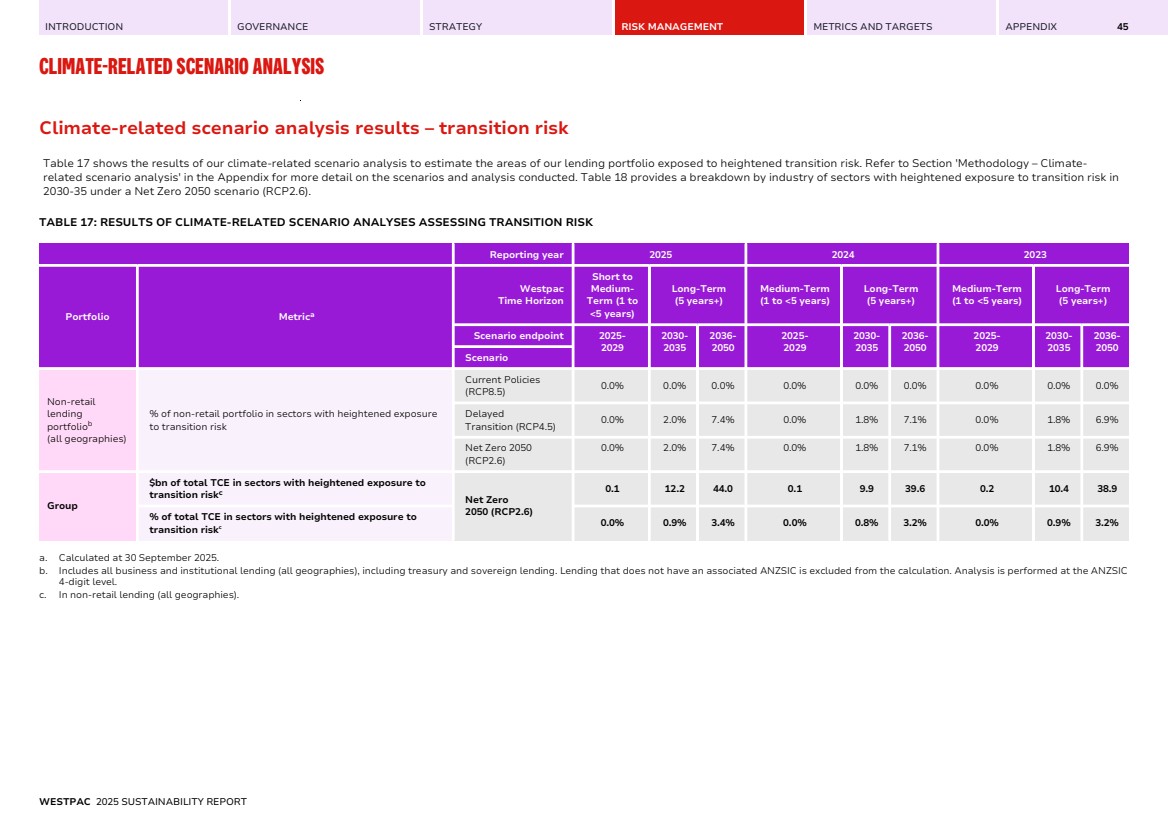
| INTRODUCTION GOVERNANCE STRATEGY RISK MANAGEMENT METRICS AND TARGETS APPENDIX CLIMATE-RELATED SCENARIO ANALYSIS 46 Exposure to industries that may be exposed to higher transition risk Besides our scenario analysis, Table 18 opposite breaks down our total lending and TCE by sector, emphasising sectors that could face higher transition risks (highlighted in dark purple). This table shows our overall exposure (both loans and TCE) and demonstrates that the sectors that may face higher risks make up less than 1% of our total exposure with the overall portion changing little over the year. The total exposure to these sectors combines industries that may be exposed heightened transition risk by 2035 under a 1.5 degree aligned, Net-Zero 2050 scenario. In calculating the total exposure to these industries, we only include the portion of the Electricity supply industry involved in fossil fuel power generation. This breakdown of exposures is high level and indicative only, as transition risks may impact industries, geographies and companies in different ways and to varying degrees. There will also be some sectors, or companies, exposed to transition risks that are not shown separately in the table, including companies operating in multiple sectors. TABLE 18: GROUP TOTAL LOANS AND TOTAL COMMITTED EXPOSURE (TCE) BY INDUSTRY ($M) INDUSTRY Sep 2025 Sep 2024 LOANS TCE LOANS TCE Accommodation, cafes and restaurants 11,898 13,672 10,208 11,748 Agriculture, forestry and fishing 24,480 28,273 22,087 25,414 – Dairy 6,734 7,129 6,840 7,189 – Beef and sheep 9,865 11,397 8,531 9,869 Construction 9,185 14,808 8,319 13,733 Finance and insurance 41,730 154,405 37,897 162,805 Government, administration and defence 926 133,260 1,021 118,877 Manufacturing 13,827 26,688 12,740 25,371 – Aluminium 163 719 306 805 – Cement and Concrete and Iron and Steel 1,253 2,348 1,046 2,311 – Petroleum refining1 173 830 138 331 – Petroleum, Coal, Chemical and Associated Product Manufacturing 2 2 2 2 – Organic Industrial Chemical Manufacturing 3 5 4 7 – Chemical Product Manufacturing 203 312 181 291 Mining 3,785 8,636 3,044 7,885 – Coal mining 64 107 114 161 – Metallurgical coal mining2 36 40 32 38 – Metallurgical coal mining in diversified miners2 29 66 57 97 – Thermal coal mining2 0 0 25 25 INDUSTRY Sep 2025 Sep 2024 LOANS TCE LOANS TCE – Upstream Oil and Gas3 740 1,586 777 1,769 – Iron Ore 6 1,120 59 1,147 Property 75,117 93,582 68,843 85,543 Property services and business services 17,128 27,473 15,786 25,151 Services4 17,231 28,455 15,012 25,922 Trade5 21,183 35,993 18,232 31,827 – Petroleum product wholesaling6 1,834 4,051 983 2,972 – Automotive fuel retailing7 512 699 342 488 Transport and storage 14,134 23,337 11,477 20,672 – Coal ports2 260 324 320 386 – Air Transport8 1,247 2,163 992 1,513 – Marine Transport 81 105 82 105 – Rail Transport (incl. coal transport) 1,259 2,091 1,011 1,904 – Road Transport 2,837 3,502 2,321 3,527 Utilities9 12,999 28,970 10,028 23,569 – Electricity Supply 9,228 18,953 6,031 14,964 – Gas Supply 912 2,231 734 2,094 Other 1,480 3,556 1,725 4,375 Total Retail lending 591,259 684,555 574,916 669,449 – Housing 581,666 646,646 566,081 631,861 Total Group exposure 856,362 1,305,664 811,335 1,252,341 Total exposure to industries that may be exposed to heightened transition risk10 6,205 12,389 4,898 10,143 – % of Total Group 0.7% 0.9% 0.6% 0.8% 1. Previously labelled Oil and Gas Refining in FY24. 2. Includes measures of TCE that are specific to Westpac Institutional Banking division. Refer to Glossary (page 73) for more information. 3. Oil and Gas Exploration and Oil and Gas Extraction and Terminals. 4. Includes education, health and community services, cultural and recreational services, and personal and other services. 5. Wholesale trade and retail trade. 6. Previously labelled Oil and Gas distribution and retail in FY24. 7. Previously labelled Fuel Retailing in FY24. 8. Previously labelled Transport – Aviation in FY24. 9. Includes electricity, gas and water, and communication services. 10. Prior year numbers restated due to methodology change of in-scope industries that may be exposed to higher transition risk. Due to data availability, we include the TCE associated with certain sectors instead of their outstanding loan balance into the calculation of this metric for loans. WESTPAC 2025 SUSTAINABILITY REPORT |
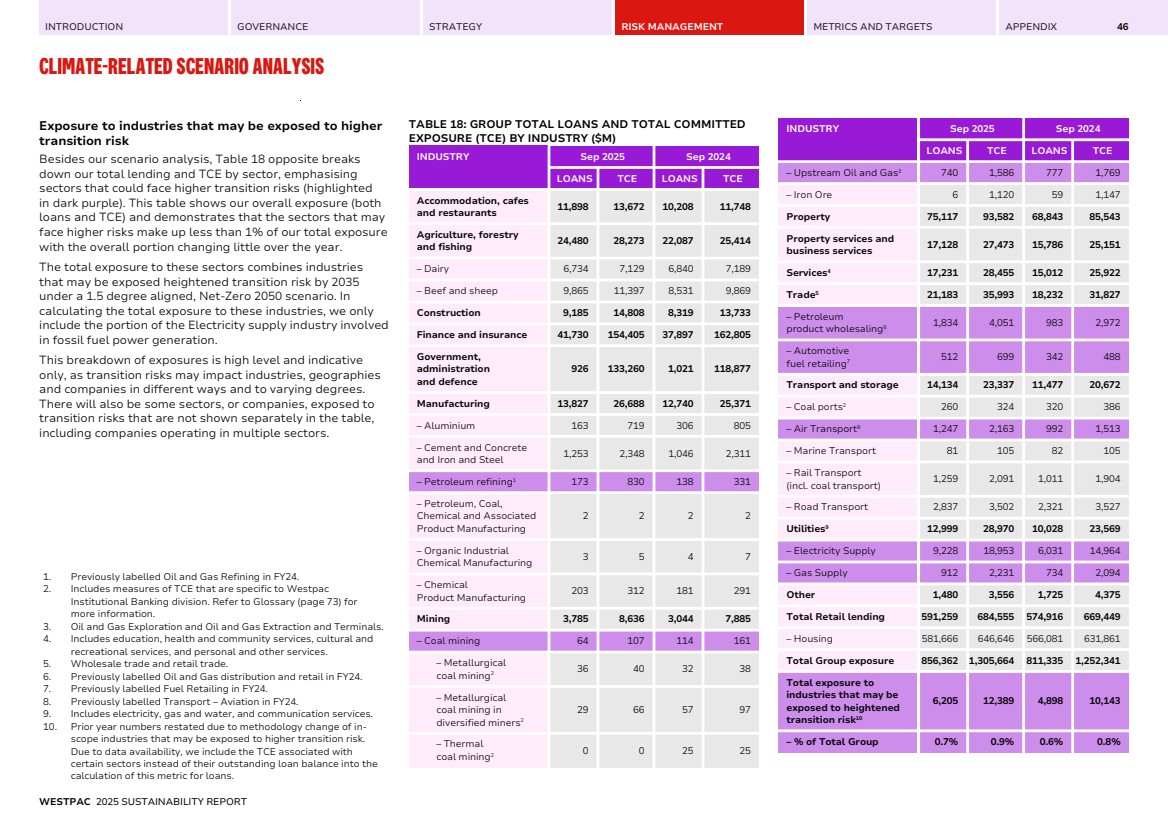
| INTRODUCTION GOVERNANCE STRATEGY RISK MANAGEMENT METRICS AND TARGETS APPENDIX CLIMATE-RELATED SCENARIO ANALYSIS 47 Exposure to the fossil fuel energy value chain This table discloses the TCE to industries in the fossil fuel energy value chain. Table 19 is a subset of Table 18 with further disaggregation of some industries such as upstream oil and gas, and electricity supply and excludes transmission and transport exposures related to fossil fuels. The outputs do not align with the data used in our financed emissions sector targets. TABLE 19: TCE TO INDUSTRIES IN THE FOSSIL FUEL ENERGY VALUE CHAIN ($M)a INDUSTRY SEP 2025 SEP 2024 % CHANGE Upstream Oil and Gas 1,586 1,769 -10% – Oil and Gas Exploration 2 4 -58% – Oil and Gas Extraction and Terminals 1,585 1,764 -10% Petroleum refiningb 830 331 151% Petroleum product wholesalingc 4,051 2,972 36% Automotive fuel retailingd 699 488 43% Thermal coal mininge 0 25 -100% Coal portse 324 386 -16% Electricity supply (fossil fuels only: Gas; Black and Brown Coal; Liquid fuel)e 722 818 -12% Total 8,212 6,788 21% a. Individual sector and portfolio figures may not sum to total due to rounding. b. Previously labelled Oil and Gas Refining in FY24. c. Previously labelled Oil and Gas distribution and retail in FY24. d. Previously labelled Fuel Retailing in FY24. e. Includes measures of TCE that are specific to Westpac Institutional Banking division. Refer to Glossary (page 73) for more information. At 30 September 2025, our exposure was approximately $8.2 billion, which was higher than at 30 September 2024 mainly due to a higher exposure to Petroleum product wholesaling. In aggregate, our sector exposure is around 0.6% of the Group’s total TCE. The data in this table has been refined over the years, including from better identification of companies involved in multiple industries. As a result, care should be taken in comparing results over time. WESTPAC 2025 SUSTAINABILITY REPORT |
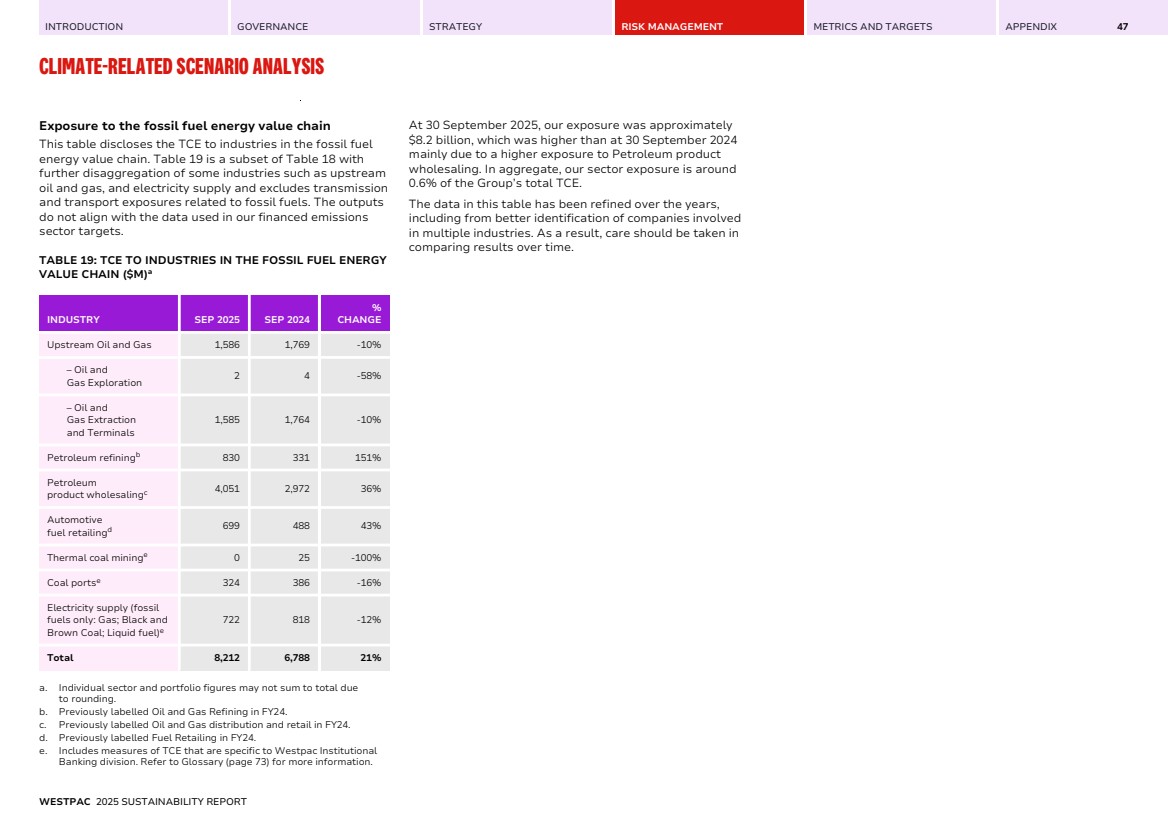
| INTRODUCTION GOVERNANCE STRATEGY RISK MANAGEMENT METRICS AND TARGETS APPENDIX CLIMATE-RELATED SCENARIO ANALYSIS 48 Climate-related scenario analysis results – physical risk Table 20 shows the results of our climate-related scenario analysis to estimate the areas of our lending portfolio exposed to heightened physical risk. Refer to Section 'Methodology – Climate-related scenario analysis' in the Appendix for more detail on the scenarios and analysis conducted. TABLE 20: RESULTS OF CLIMATE-RELATED SCENARIO ANALYSES ASSESSING PHYSICAL RISK Reporting year 2025 2024 2023 Portfolio Metric Westpac Time Horizon Current period Medium-Term (1 to <5 years) Long-Term (5 years+) Short-term (<1 years) Long-Term (5 years+) Medium-Term (1 to <5 years) Long-Term (5 years+) Scenario endpoint 2025 2030 2050 2025 2030 2050 2025 2030 2050 Scenario Australian retail mortgages % of portfolio exposed to heightened physical riska RCP2.6 6.2% 6.4% 6.9% 6.2% 6.4% 6.9% 6.2% 6.5% 6.9% RCP4.5 6.2% 6.4% 7.0% 6.2% 6.4% 7.0% 6.2% 6.5% 7.0% RCP8.5 6.2% 6.5% 7.2% 6.2% 6.5% 7.2% 6.2% 6.5% 7.2% New Zealand retail mortgages % of portfolio vulnerable to severe rainfall flood riskb,c,d SSP1-2.6 NR 2.0% 2.1% NR NR NR NR NR NR SSP2-4.5 NR 2.0% 2.2% NR NR NR NR NR NR SSP5-8.5 NR 2.0% 2.4% NR NR NR NR NR NR New Zealand commercial real estate lending % of portfolio vulnerable to severe rainfall flood riskb,c,d SSP1-2.6 NR 2.1% 2.4% NR NR NR NR NR NR SSP2-4.5 NR 2.1% 2.4% NR NR NR NR NR NR SSP5-8.5 NR 2.1% 2.6% NR NR NR NR NR NR New Zealand agricultural lending % of portfolio vulnerable to severe rainfall flood riskb,c,d SSP1-2.6 NR 2.7% 2.7% NR NR NR NR NR NR SSP2-4.5 NR 2.7% 2.9% NR NR NR NR NR NR SSP5-8.5 NR 2.7% 3.0% NR NR NR NR NR NR Group $bn of total TCE exposed to heightened physical riskse or vulnerable to severe rainfall flood riskf,g IPCC RCP4.5 (AU) / IPCC SSP2-4.5 (NZ) 34.0 37.0 40.4 33.2 34.3 37.3 32.1 33.3 36.1 % of total TCE exposed to heightened physical riskse or vulnerable to severe rainfall flood riskf 2.6% 2.8% 3.1% 2.6% 2.7% 3.0% 2.6% 2.7% 3.0% a. Calculated at 31 August 2025, 31 August 2024, and 31 August 2023 for 2025, 2024, and 2023 reporting years, respectively. b. Analyses covering NZ portfolios that consider other perils outside of the most significant rainfall flood risk are not shown here or included in the totals. c. Replaces the metric measuring the % of portfolio at heightened risk of sea-level rise by 2050 under the IPCC RCP8.5 scenario that was reported in earlier periods. d. 2025 metrics for Current Period (i.e., to 2025) are not reported due to limited availability of climate data for 2025. 2023 and 2024 metrics are not reported as the calculation of these new metrics against historic balance sheet dates does not produce reliable outputs. e. In Australian retail mortgages. f. In New Zealand retail mortgages, commercial property lending, and agricultural lending. g. The exchange rate for NZD: 1.1377 is based on value today (discounted spot rates) at 30 September 2025. WESTPAC 2025 SUSTAINABILITY REPORT |
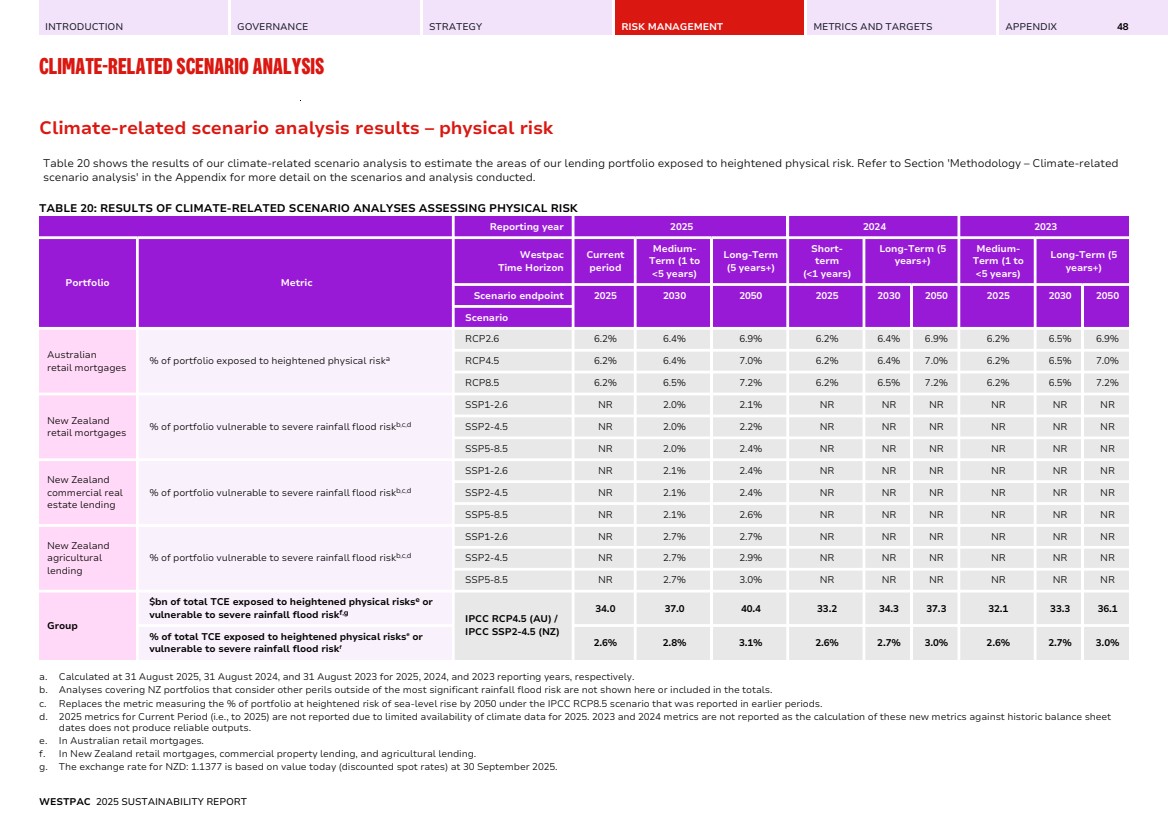
| INTRODUCTION GOVERNANCE STRATEGY RISK MANAGEMENT METRICS AND TARGETS APPENDIX CLIMATE-RELATED SCENARIO ANALYSIS 49 Australian retail mortgages credit quality metrics under different climate scenarios In FY25, we deepened our understanding of physical risk in our Australian retail mortgages portfolio. We have estimated credit quality metrics in our Australian retail mortgage portfolio under several climate scenarios for the long-term time horizon. The estimated metrics in Table 21 are consistent with those for the broader Australia Mortgage Retail Portfolio and are not materially different. The metrics in Table 21 are calculated using data from Westpac’s internal mortgage systems and are based on outstanding balances. This credit quality analysis builds on the climate-related scenario analysis for physical risk described on the previous page and detailed in the methodology section in the Appendix. As this analysis is prepared on an outstanding balance basis, the scenario analysis result should not be compared with other physical risk analysis for the same portfolio in this Report that are prepared on a TCE basis. Refer to the Risk Management section on page 42 to 44 and the and 'Methodology – Climate-related scenario analysis' section in the Appendix on page 107 to 112 for more information on our physical risk climate scenario analysis methodology, including data sources, exclusions, and assumptions. Refer to Glossary on page 72 for more information on RCPs. TABLE 21: AUSTRALIAN RETAIL MORTGAGES CREDIT QUALITY METRICS UNDER DIFFERENT CLIMATE SCENARIOS Credit quality metrics (based on outstanding balance) Reporting year 2025a 2024a Scenario RCP2.6 RCP8.5 RCP2.6 RCP8.5 Westpac Time Horizon Long-Term (5 years+) Long-Term (5 years+) Long-Term (5 years+) Long-Term (5 years+) Scenario endpoint 2050 2050 2050 2050 Dynamic LVR weighted averageb 49.3% 49.2% 48.3% 48.2% % of portfolio >90% DLVRc 1.8% 1.8% 1.7% 1.6% 90+ day delinquencies (%)d 0.7% 0.7% 1.1% 1.1% Scenario analysis result (% of portfolio exposed to heightened physical riske) 6.9%f 7.2%f 4.1% 4.5% a. Calculated at 31 August 2025 and 31 August 2024 for 2025 and 2024 reporting years, respectively. b. Dynamic LVR is the weighted current loan to current value ratio for high-risk properties accounting for the current loan balance, changes in security value, offset account balances and other loan adjustments. The property valuation source is Cotality. Weighted average LVR calculation considers the size of outstanding balances. More information on Westpac's mortgage portfolio is provided in our Investor Discussion Pack. c. DLVR is the dynamic loan-to-value ratio. The percentage of high-risk properties with a current loan to current value ratio above 90%. d. The percentage of high-risk properties that are 90 days or more in arrears. e. Share of Australian mortgage portfolio outstanding balance in locations identified as likely to be exposed to higher physical risks by the scenario endpoint year. f. In FY25, we have changed the source of our physical risk data and have updated our methodology. As such, these FY25 figures are not comparable to FY24. WESTPAC 2025 SUSTAINABILITY REPORT |
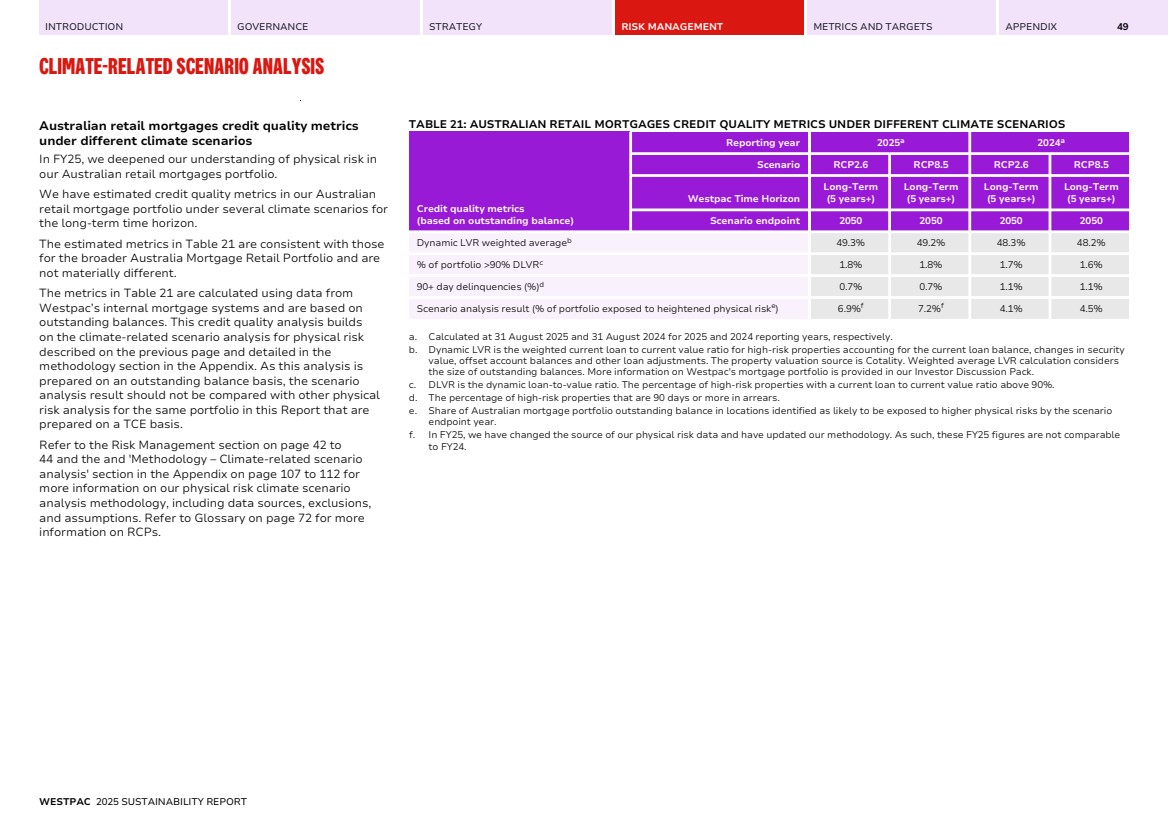
| INTRODUCTION GOVERNANCE STRATEGY RISK MANAGEMENT METRICS AND TARGETS APPENDIX 50 METRICS AND TARGETS CONTENTS INTRODUCTION 51 OPERATIONAL GHG EMISSIONS AND ENERGY CONSUMPTION 52 SCOPE 3 FINANCED EMISSIONS 54 FINANCED EMISSIONS SECTOR TARGETS 56 CLIMATE-RELATED OPPORTUNITIES 69 |
| INTRODUCTION GOVERNANCE STRATEGY RISK MANAGEMENT METRICS AND TARGETS APPENDIX 51 How to read this section This section sets out the cross-industry metrics we use to assess and manage climate-related risks and opportunities, and outlines our climate-related targets and their associated detail. Refer to the Strategy section for information about the performance of certain climate-related metrics and targets and our progress towards meeting them. To assist with referencing and comparability, the adjoining table lists the cross-industry metric categories and the location of related metrics within this Report. FOOTNOTES TO TABLE 22: 1. 2021 baselines for scope 1, 2 and scope 3 upstream targets adjusted for COVID pandemic and other impacts. The Appendix section ‘Methodology – Operational Emissions – Scope 1, 2 and Upstream Scope 3’ contains the scope 3 upstream emissions categories included. 2. The Appendix section ‘Methodology – Operational Emissions – Scope 1, 2 and Upstream Scope 3’ contains the scope 3 upstream emissions categories included. 3. Target is based on Total Committed Exposure (or balance, which is applicable for residential mortgages) at a point in time. 4. Target is based on our share of the cumulative value of bonds facilitated between 1 October 2021 and 30 September 2030. TABLE 22: CROSS-INDUSTRY METRIC CATEGORIES AND OUR CLIMATE-RELATED METRICS AND TARGETS Cross-industry metric category Climate-related metric Climate-related target Reference for more information Scope 1 GHG emissions • Scope 1 and 2 emissions • Upstream scope 3 emissions • Reduce scope 1 and 2 absolute emissions by 64% from our 2021 baseline by 20251 • Reduce scope 1 and 2 absolute emissions by 76% from our 2021 baseline by 20301 Page 19 to 21. Page 52 to 53. Scope 2 (location-based) GHG emissions Page 52 to 53. Scope 2 (market-based) GHG emissions Page 19 to 21. Page 52 to 53. Scope 3 GHG emissions (upstream) • Reduce upstream scope 3 absolute emissions by 50% from our 2021 baseline by 20301,2 Page 19 to 21. Page 52 to 53. Scope 3 greenhouse gas emissions (our financed emissions) • Total estimated financed emissions (scope 1 and 2) • Total estimated financed emissions (scope 1, 2 and 3) • Estimated financed emissions intensity (scope 1, 2 and 3) • Percentage reduction in emissions relative to target baselines • 2030 scope 3 financed emissions sector targets (13 targets) Page 23 to 25. Page 54 to 68. Carbon offsets • Total offsets retired • No target set Page 21. Page 52. Climate-related transition risks • Percentage of TCE to industries that may be exposed to higher transition risk (based on Transition Risk Board RAS) • No target set Page 45 to 47. Climate-related physical risks • Percentage of total TCE likely to be exposed to higher physical risks or vulnerable to severe rainfall flood risk • Percentage of the current Australian Mortgage portfolio exposed to higher physical risks • No target set Page 48 to 49. Climate-related opportunities • Total lending (TCE) or balance under our Sustainable Finance Framework • Cumulative value of bonds facilitated since 1 October 2021 • $55 billion in sustainable finance lending at 30 September 20303 • $40 billion in sustainable bond facilitation4 Page 31 to 32. Page 69. Capital deployment • Climate-related expenditure • No target set Page 34 to 35. Internal carbon price • Not applicable • No target set Page 35. Remuneration • Percentage of executive management remuneration recognised in the current period that is linked to climate-related considerations • No target set Page 11. WESTPAC 2025 SUSTAINABILITY REPORT |
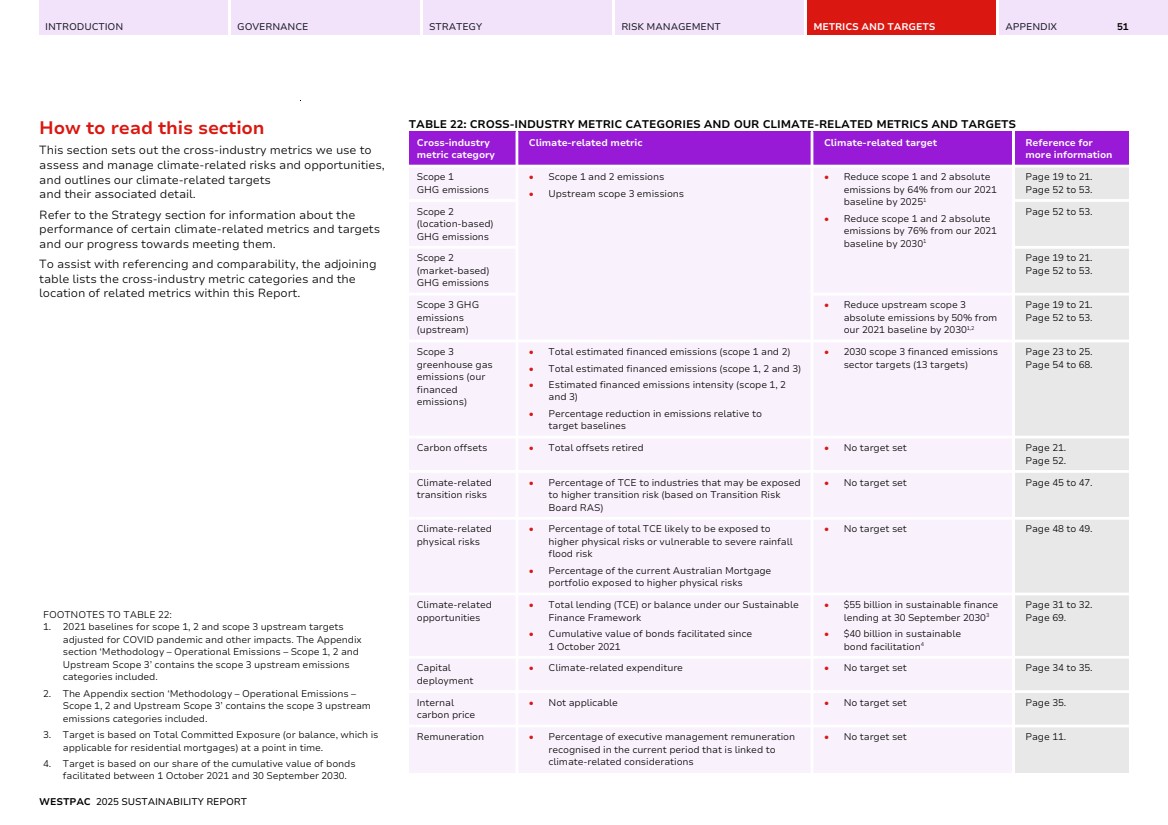
| INTRODUCTION GOVERNANCE STRATEGY RISK MANAGEMENT METRICS AND TARGETS APPENDIX 52 OPERATIONAL GHG EMISSIONS AND ENERGY CONSUMPTION Operational GHG emissions1,2 TABLE 23: OPERATIONAL GHG EMISSIONS (LOCATION-BASED) TONNES OF CARBON DIOXIDE EQUIVALENT (TCO2-E) 2025 2024 Location-based GHG emissions Scope 1 emissions 4,714 6,262 Scope 2 emissions 45,360 51,378 Scope 3 upstream emissions 66,507 70,069 Total scope 1 and 2 emissions 50,074 57,640 Total scope 1, 2 and 3 upstream emissionsa 116,581 127,709 a. Total scope 1 and 2 emissions reflects Westpac’s consolidated Group total. Westpac did not control or operate any other material investees (associates, joint ventures and unconsolidated subsidiaries) for the reporting period. TABLE 24: OPERATIONAL GHG EMISSIONS (MARKET-BASED) TONNES OF CARBON DIOXIDE EQUIVALENT (TCO2-E) 2025 2024 Market-based GHG emissions Scope 1 emissions 4,714 6,262 Scope 2 emissions 1,963 2,303 Scope 3 upstream emissions 56,469 57,655 Total scope 1 and 2 emissions 6,677 8,565 Total scope 1, 2 and 3 upstream emissions 63,146 66,220 Scope 1 and 2 emissions/employee (FTE)a 0.2 0.2 a. Tonnes of scope 1 and 2 greenhouse gas emissions (market-based) per average full-time equivalent employee (FTE) for the year ending 30 June. TABLE 25: CARBON OFFSETTING ACCOUNTS 2024a 2023 GHG emissions (tCO2-e) Total scope 1, 2 and 3 upstream emissionsb (tCO2-e) (Climate Active – Australia)c 63,099 73,069 Total scope 1, 2 and 3 upstream emissions (tCO2-e) (Other International – excluding New Zealand) 8,045 7,686 Total scope 1, 2 and 3 upstream emissionsd (tCO2-e) (Toitū Net Carbon Zero – New Zealand) 3,767 4,705 Total scope 1, 2 and 3 upstream emissions (tCO2-e) 74,911 85,460 Total offsets retired 73,816 86,091 a. The latest reporting period for carbon offsets is presented one year in arrears. This is because offsets are retired only after our emissions have been calculated and verified for the reporting year. b. Emissions streams captured are represented in our Climate Active Public Disclosure Statements. c. Climate Active Standard allows organisations to claim default delivered renewable electricity from the grid, such as LGC surrenders made by a jurisdiction with a renewable electricity target. RE100 Standard allows claims of default delivered renewables only where relevant information from the electricity supplier is available. Westpac has not claimed the default renewables benefit in its market-based emissions figures when LGC were not evidenced. We also retire offsets for additional emissions streams that are estimated and included in our Climate Active disclosure as ‘uplifts’. This results in a difference between Westpac’s market-based emissions in Table 24 and market-based emissions in the carbon offset summary table. d. Emissions streams captured are represented in our Toitū Net Carbon Zero certification. Operational energy consumption TABLE 26: ENERGY CONSUMPTION GIGAJOULES (GJ) 2025 2024 Energy consumption Stationary energy – natural gas, diesel, LPG 15,815 17,297 Transport energy – fleet fuels 44,967 55,705 Electricity 312,351 342,162 Total energy consumption 373,133 415,164 Renewable electricity (supported by EACs) 312,563 342,257 TABLE 27: RENEWABLE ENERGY PERCENTAGE (%)a 2025 2024 Renewable energy Renewable electricity, RE100b 96 96 Renewable electricityc 100 100 Renewable energyd 84 82 a. Renewable energy percentage is calculated as the total renewable electricity (GJ) sourced divided by the total energy consumption (GJ) of stationary energy, transport energy and electricity from facilities and vehicle fleet within Westpac’s operational control for the reporting period. b. Renewable electricity use supported by energy attribute certificates (EACs) which meets RE100’s country-of-origin requirements. c. Renewable electricity use supported by EACs, some of which are sourced outside the country of consumption. Specifically, for our Pacific Island operations, we over-surrendered Large-scale Generation Certificates (LGCs) in the Australian market, due to challenges of developing local renewable energy infrastructure and the lack of renewable energy certificate markets. We will continue to identify opportunities to lift local sourcing. d. Prior year number restated to align with the total renewable electricity purchased (not RE100 methodology). 1 The Appendix section ‘Methodology – Operational Emissions – Scope 1, 2 and Upstream Scope 3’ provides more detail on our calculation methodology and contains the scope 3 upstream emissions categories included. 2 We report using both the location-based and market-based methods. The location-based method reflects the average emissions intensity of the electricity grids where our operations are located. The market-based method reflects emissions from the electricity we have purposefully sourced through contractual instruments, such as Virtual Power Purchase Agreements (VPPA), which support renewable energy. WESTPAC 2025 SUSTAINABILITY REPORT |
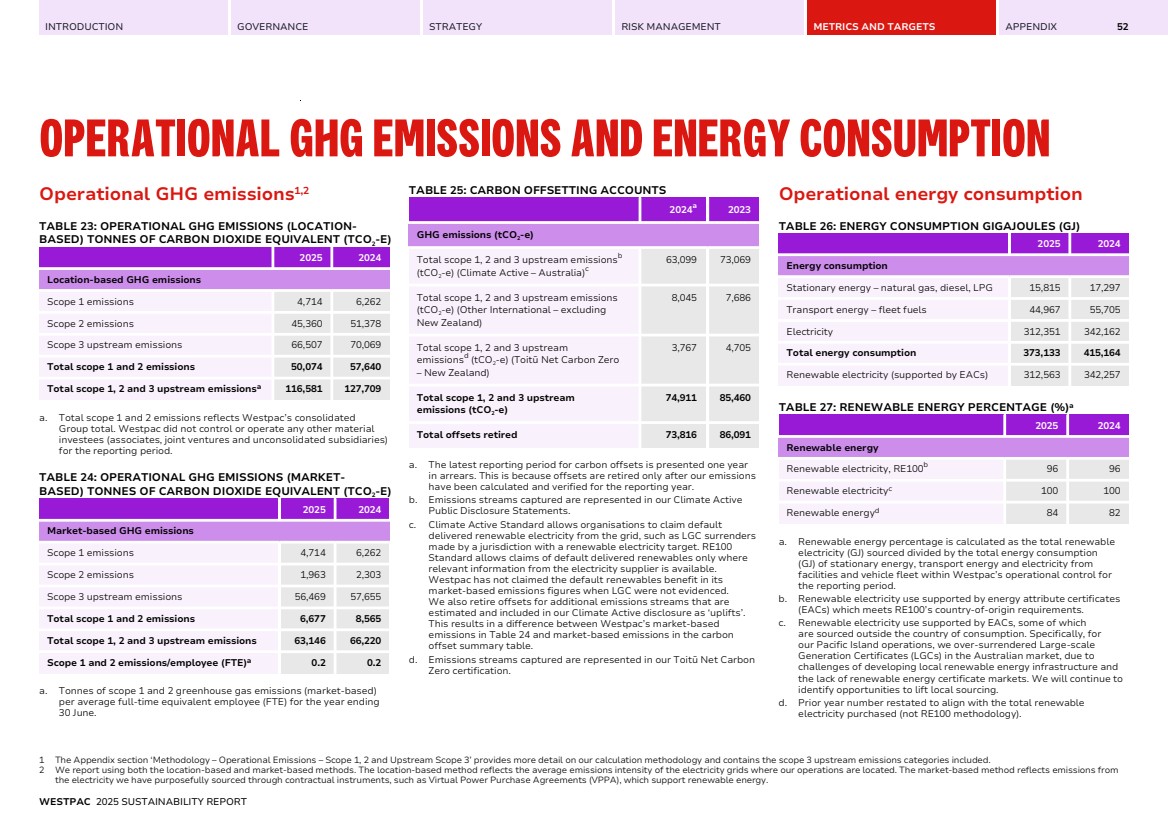
| INTRODUCTION GOVERNANCE STRATEGY RISK MANAGEMENT METRICS AND TARGETS APPENDIX OPERATIONAL GHG EMISSIONS AND ENERGY CONSUMPTION 53 Operational emissions targets Approach to setting and reviewing our operational emissions targets PROCESSES FOR SETTING AND REVIEWING OUR OPERATIONAL EMISSIONS TARGETS Targets are set with consideration of global and national climate commitments, our climate ambition, and the reasonableness of Westpac achieving these targets. Final endorsement is provided by the Executive Team prior to targets being approved by the Board. We reassess and revise, where necessary, our targets at least every five years to seek to ensure they remain aligned with the latest climate science. VALIDATION OF OUR OPERATIONAL EMISSIONS TARGETS AND METHODOLOGIES Our operational emissions targets and methodologies have not been independently assured, however third-party advice was obtained confirming target alignment with a 1.5°C climate scenario for disclosed sources. REVISIONS TO OUR OPERATIONAL EMISSIONS TARGETS There were no revisions to our operational emissions targets in FY25. TABLE 28: ADDITIONAL INFORMATION ABOUT OUR OPERATIONAL EMISSIONS TARGETS Detail TARGET: Reduce our scope 1 and 2 absolute emissions by 76% by 2030 from our 2021 baseline TARGET: Reduce our scope 3 upstream absolute emissions by 50% by 2030 from our 2021 baseline Metric used to set the target This target is a gross scope 1 and 2 GHG emissions reduction target, measured in metric tonnes CO2 equivalent (tCO2-e), applying a market-based accounting approach. Carbon offsets are not considered. This target is a gross scope 3 upstream GHG emissions reduction target, measured in metric tonnes CO2 equivalent (tCO2-e), applying a market-based accounting approach. Carbon offsets are not considered. Objective of the target Mitigation of scope 1 and 2 GHG emissions. Mitigation of upstream scope 3 GHG emissions. Part of Westpac to which the target applies Applies to all Westpac Group. Applies to all Westpac Group. Scope of emissions and greenhouse gases covered by the targeta • Scope 1 and 2 emissions; and • The greenhouse gases covered by the target include carbon dioxide (CO2 ), methane (CH4 ), nitrous oxide (N2O), and hydrofluorocarbons (HFCs). • Selected upstream scope 3 emissions as detailed in the Appendix section 'Methodology – Operational Emissions – Scope 1, 2 and Upstream Scope 3’; and • The greenhouse gases covered by the target include carbon dioxide (CO2 ), methane (CH4 ), nitrous oxide (N2O), and hydrofluorocarbons (HFCs). Sectoral decarbonisation approach Cross-sector absolute reduction approach to reduce emissions at a minimum of 4.2% annually. Cross-sector absolute reduction approach to reduce emissions at a minimum of 4.2% annually. Period over which the target applies 1 July 2021 to 30 June 2030. 1 July 2021 to 30 June 2030. Base period from which progress is measured 1 July 2020 to 30 June 2021. 1 July 2020 to 30 June 2021. Milestones and interim targets Yes, interim target of 64% reduction by 2025. No. Type of target Absolute. Absolute. How the latest international agreement on climate change, including jurisdictional commitments that arise from that agreement, has informed the target Our operational scope 1 and 2 emissions target is aligned with the latest international agreements on climate change to limit warming to well below 2°C above pre-industrial levels and pursuing efforts to limit temperature increase to 1.5°C above pre-industrial levels. Our upstream scope 3 emissions target is aligned with a 1.5-degree reduction trajectory but covers currently disclosed sources only, as detailed in the Appendix section 'Methodology – Operational Emissions – Scope 1, 2 and Upstream Scope 3’. How the target contributes to limiting global warming to 1.5 degrees Celsius (including basis for this view) The target is aligned with the latest international agreements on climate change to limit warming to 1.5 degrees Celsius above pre-industrial levels. To help limiting global warming we source the equivalent of 100% of our electricity from renewables globally. The target is aligned with the latest international agreements on climate change to limit warming to 1.5 degrees Celsius above pre-industrial levels. To help limiting global warming we are working with employees and key suppliers to encourage them to source renewable electricity for their homes and businesses, promote circularity and improve the landfill waste diversion rate for our operations (see page 20). WESTPAC a. The greenhouse gases covered in the target represent those relevant to Westpac. 2025 SUSTAINABILITY REPORT |
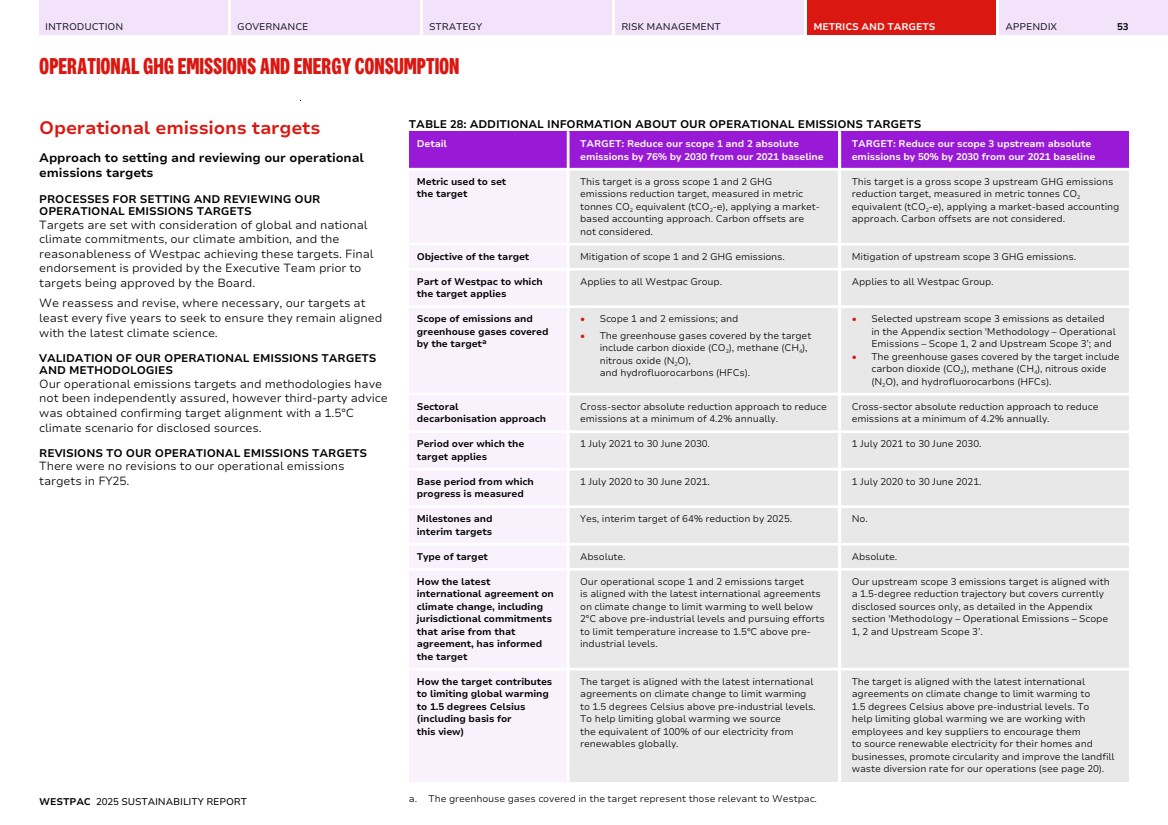
| INTRODUCTION GOVERNANCE STRATEGY RISK MANAGEMENT METRICS AND TARGETS APPENDIX 54 SCOPE 3 FINANCED EMISSIONS Our financed emissions are calculated using Total Committed Exposure (TCE), which we consider to be a more comprehensive measure of lending when estimating financed emissions. TCE better reflects the funds we make available to customers and their potential to contribute to or mitigate emissions. This table is a detailed sector breakdown of our scope 3 financed emissions presented on page 24. TABLE 29: GROUP SCOPE 3 FINANCED EMISSIONS ASSOCIATED WITH LOANS, BONDS, AND UNDRAWN LOAN COMMITMENTS BY SECTOR (CALCULATED USING TCE) FY24 FY23 SECTOR % EXPOSURE OR LOAN BALANCE FOR WHICH WE ESTIMATE FINANCED EMISSIONS SCOPE 1 AND 2 FINANCED EMISSIONS (MtCO2-e)a SCOPE 3 FINANCED EMISSIONS (MtCO2-e)a,b AVERAGE DATA QUALITY SCOREc EMISSIONS INTENSITY (SCOPE 1, 2, AND 3) (kgCO2-e/$)d % EXPOSURE OR LOAN BALANCE FOR WHICH WE ESTIMATE FINANCED EMISSIONS SCOPE 1 AND 2 FINANCED EMISSIONS (MtCO2-e)a SCOPE 3 FINANCED EMISSIONS (MtCO2-e)a,b AVERAGE DATA QUALITY SCOREc EMISSIONS INTENSITY (SCOPE 1, 2, AND 3) (kgCO2-e/$)e Accommodation, cafes & restaurants 100 0.9 NR 4.6 0.074 96 0.2 NR 4.6 0.021 Agriculture, forestry & fishing 100 5.7 NR 4.1 0.224 99 7.3 NR 4.2 0.307 Construction 100 2.1 NR 4.4 0.153 92 0.4 NR 4.2 0.030 Finance & insurance 52 0.2 NR 4.5 0.002 40 0.4 NR 4.6 0.004 Manufacturing 99 5.2 4.0 3.8 0.368 92 3.7 6.0 3.6 0.424 Mining 99 2.0 5.1 3.3 0.910 89 1.2 7.7 2.9 1.228 Property 98 0.7 NR 4.5 0.008 95 0.9 NR 4.7 0.012 — Secured Commercial Real Estate NR 0.6 NR 4.5 0.013 NR 0.8 NR 4.9 0.014 — Other NR 0.1 NR 4.6 0.003 NR 0.1 NR 4.3 0.004 Property services & business services 100 0.5 NR 4.3 0.022 91 0.2 NR 4.2 0.010 Services 99 0.9 NR 4.3 0.035 90 0.9 NR 4.2 0.036 Trade 96 2.1 NR 4.2 0.069 89 1.6 NR 3,9 0.059 Transport & storage 100 2.9 NR 4.0 0.142 89 1.1 NR 4.1 0.071 Utilities 100 5.0 NR 4.0 0.210 91 5.1 NR 3.5 0.297 Otherf 74 0.1 NR 4.9 0.037 36 0.1 NR 4.8 0.070 Total – Business and Institutional Lending 65 28.4 9.1 4.3 0.099 60 23.0 13.7 4.3 0.108 Total – Retail Lending – Residential Mortgagesg 84 3.3 NR 4.1 0.006 81 3.2 NR 4.1 0.006 Total estimated FY24 financed emissionsh 73 31.6 9.1 4.2 0.045 69 26.2 13.7 4.2 0.048 a. Calculated as our estimated share of customers’ scope 1, 2 and scope 3 emissions respectively, which together represent our scope 3 financed emissions. b. NR – not reported. We do not report customers' scope 3 emissions for most sectors. Scope 3 emissions are calculated only for sectors where these emissions are particularly relevant and reliable data exists. c. Data quality score is measured out of 5, with lower scores better. Calculated for scope 1 and 2 only. d. Emissions intensity is kgCO2-e/($ lending). The denominator of lending varies by segment: $ TCE for Commercial Real Estate; $ TCE for Business, commercial and institutional lending; $ outstanding balance for Australian residential mortgages; and, $ TCE for New Zealand residential mortgages. Australian dollars. e. Emissions intensity same as above, except New Zealand residential mortgages and Project Finance where $ outstanding balance was applied for FY23. f. Includes customers and exposures for which the industry classification (ANZSIC) code could not be reliably identified. g. Outstanding loan balance is used for Australian Residential Mortgages in FY24 and used for Australian and New Zealand Residential Mortgages in FY23. h. Individual sector and portfolio figures may not sum due to rounding. WESTPAC 2025 SUSTAINABILITY REPORT |
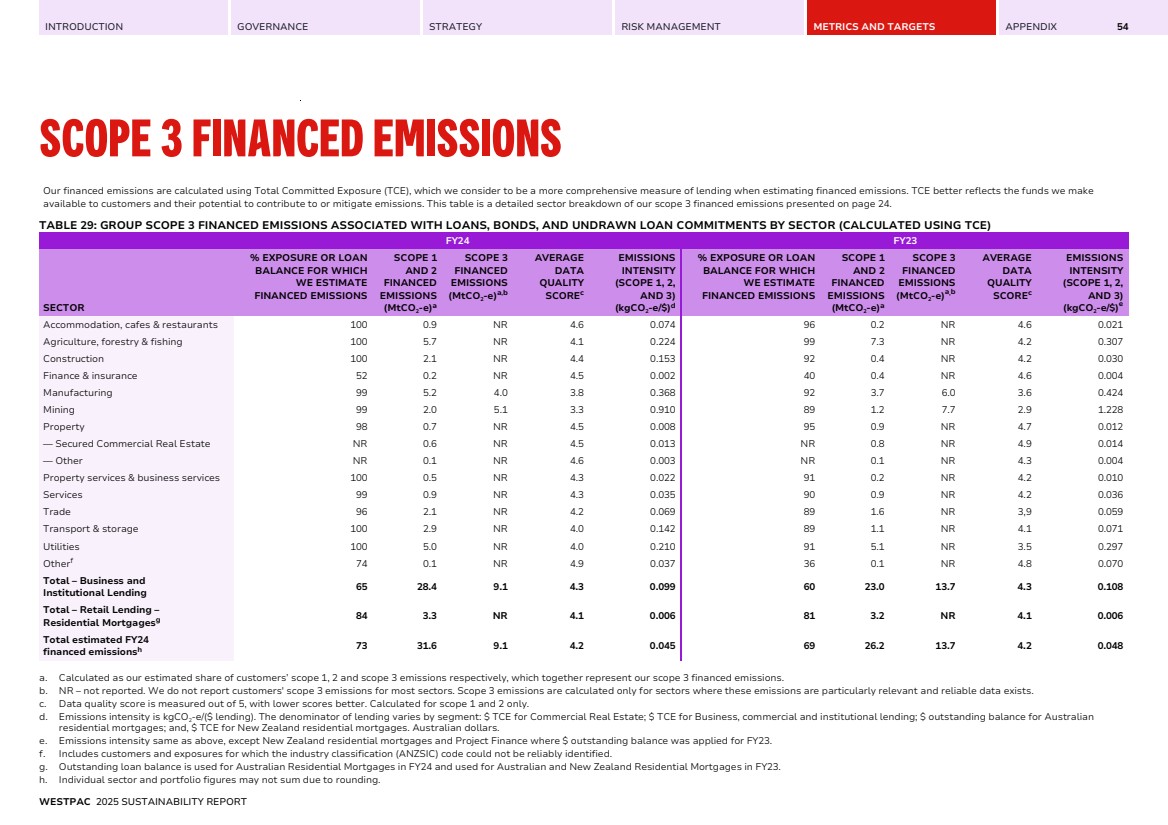
| INTRODUCTION GOVERNANCE STRATEGY RISK MANAGEMENT METRICS AND TARGETS APPENDIX SCOPE 3 FINANCED EMISSIONS 55 For completeness, we also report our financed emissions on an outstanding loan balance basis for all three asset classes (see Table 30) and on the basis of our undrawn commitments for our business, commercial and institutional lending including for commercial real estate (see Table 31). Refer to the Appendix Section 'Methodology – Scope 3 financed emissions' for more information about our financial emissions data and methodologies and the Glossary for more information on TCE. TABLE 30: GROUP SCOPE 3 FINANCED EMISSIONS ASSOCIATED WITH LOANS AND BONDS ONLY (CALCULATED USING OUTSTANDING LOAN BALANCE) BY SECTOR FY24 SECTOR % LOAN BALANCE FOR WHICH WE ESTIMATE FINANCED EMISSIONS SCOPE 1 AND 2 FINANCED EMISSIONS (MtCO2-e)a SCOPE 3 FINANCED EMISSIONS (MtCO2-e)b AVERAGE DATA QUALITY SCOREc EMISSIONS INTENSITY (SCOPE 1, 2, AND 3) (kgCO2-e/$)d Total – Business and Institutional Lending 98 17.8 3.4 4.0 0.091 Total – Retail Lending – Residential Mortgages 91 3.2 NR 4.1 0.006 Total estimated FY24 financed emissionse 92 21.0 3.4 4.1 0.033 a. Calculated as our estimated share of customers’ scope 1, 2 and scope 3 emissions respectively, which together represent our scope 3 financed emissions. b. NR – not reported. We do not report customers' scope 3 emissions for most sectors. Scope 3 emissions are calculated only for sectors where these emissions are particularly relevant and reliable data exists. c. Data quality score is measured out of 5, with lower scores better. Calculated for scope 1 and 2 only. d. Emissions intensity is kgCO2-e/($ lending). The denominator of lending is $ outstanding balance for Commercial Real Estate, $ outstanding balance for Business, commercial and institutional lending, and, $ outstanding balance for Residential mortgages. Australian dollars. e. Individual sector and portfolio figures may not sum due to rounding. TABLE 31: GROUP SCOPE 3 FINANCED EMISSIONS ASSOCIATED WITH UNDRAWN LOAN COMMITMENTS ONLY BY SECTOR FY24 SECTOR % EXPOSURE FOR WHICH WE ESTIMATE FINANCED EMISSIONS SCOPE 1 AND 2 FINANCED EMISSIONS (MtCO2-e)a SCOPE 3 FINANCED EMISSIONS (MtCO2-e)b AVERAGE DATA QUALITY SCOREc EMISSIONS INTENSITY (SCOPE 1, 2, AND 3) (kgCO2-e/$)d Total – Business and Institutional Lending 32 9.8 5.1 4.0 0.135 Total – Retail Lending – Residential Mortgagese NR NR NR NR NR Total estimated FY24 financed emissions 32 9.8 5.1 4.0 0.135 a. Calculated as our estimated share of customers’ scope 1, 2 and scope 3 emissions respectively, which together represent our scope 3 financed emissions. b. NR – not reported. We do not report customers' scope 3 emissions for most sectors. Scope 3 emissions are calculated only for sectors where these emissions are particularly relevant and reliable data exists. c. Data quality score is measured out of 5, with lower scores better. Calculated for scope 1 and 2 only. d. Emissions intensity is kgCO2-e/($ lending). The denominator of lending is $ undrawn loan commitments for Commercial Real Estate and $ undrawn loan commitments for Business, commercial and institutional lending. Australian dollars. e. NR – not reported due to data availability. WESTPAC 2025 SUSTAINABILITY REPORT |
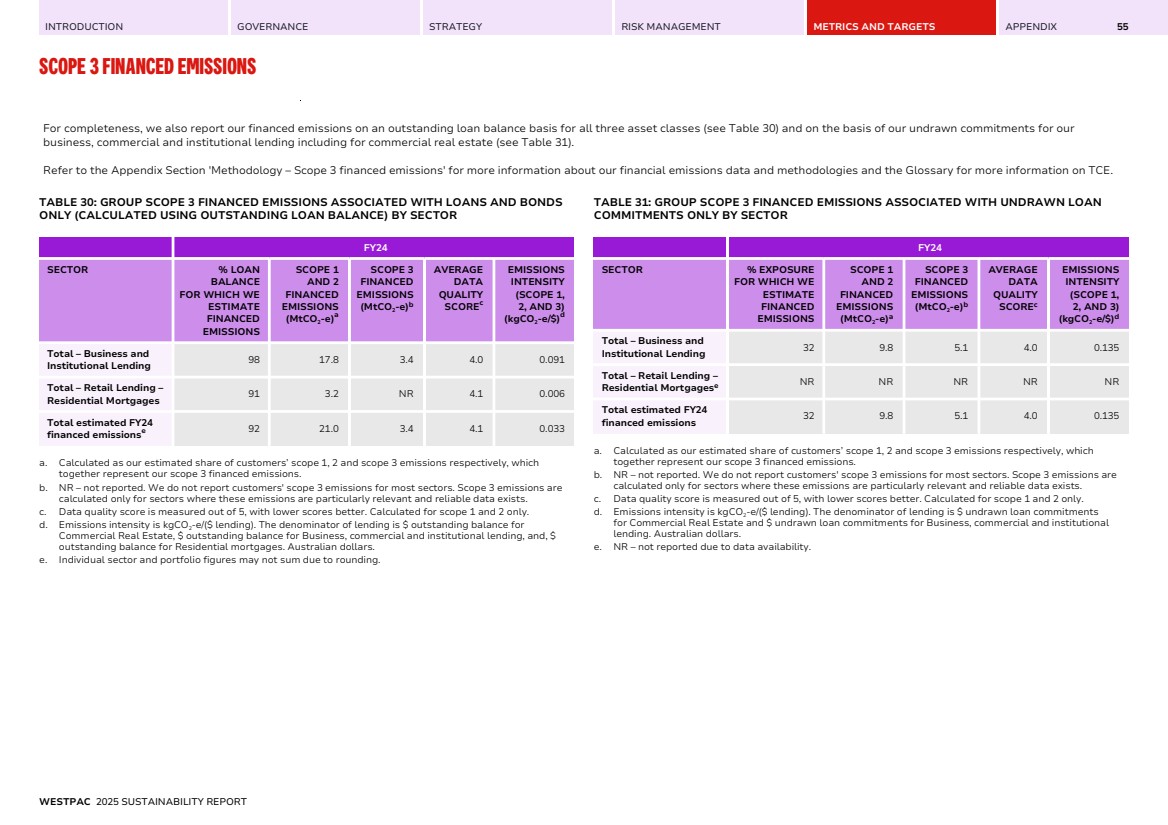
| INTRODUCTION GOVERNANCE STRATEGY RISK MANAGEMENT METRICS AND TARGETS APPENDIX 56 FINANCED EMISSIONS SECTOR TARGETS Overview and approach This section outlines our approach to setting 13 financed emissions sector targets and FY24 progress. Each of the targets are interim 2030 targets. OBJECTIVE OF OUR SECTOR TARGETS The objective of our financed emissions sector targets is to mitigate Westpac's financed emissions, improving the carbon efficiency of our portfolio and contributing towards our climate ambition. HOW THE LATEST INTERNATIONAL AGREEMENTS ON CLIMATE CHANGE HAVE INFORMED OUR SECTOR TARGETS For our targets we have referenced the UNEP FI Guidelines for Climate Change Target Setting1 and credible and well-recognised science-based reference scenarios, tools, methodologies and principles tailored to each sector, as outlined in this Report. Our targets are informed by climate scenarios2 that align to the goals of the Paris Agreement (i.e., "well below 2°C" or 1.5°C by 2100 trajectory scenarios). HOW OUR SECTOR TARGETS CONTRIBUTE TO LIMITING GLOBAL WARMING TO 1.5 DEGREES CELSIUS Except for our steel target, our targets are based on scenarios which are aligned with a 1.5°C by 2100 trajectory and therefore in achieving these targets Westpac is contributing to limiting global warming to 1.5°C. We have not formed a view on how our steel target contributes to limiting global warming to 1.5°C, our steel target is based on a scenario which is aligned with a well-below 2°C by 2100 trajectory. Approach to setting and reviewing our sector targets CALCULATING FINANCED EMISSIONS Westpac estimates the Group’s scope 3 financed emissions by assessing the proportion of emissions of individual customers or industry sectors attributable to financing we provide, using the committed exposure for our lending to customers. The approach for calculating financed emissions for the Group is slightly different to the approach applied to estimating financed emissions for some of our sector-level targets. Group financed emissions are calculated at a portfolio level. For our sector targets we often use more granular data to assess both a company’s emissions and our portion of those emissions. For the Australian residential real estate and agriculture targets the sector-level and portfolio-level Group financed emissions approaches are broadly aligned. There are some small differences in data sources used for the different methodologies due to these approaches, but the sources are not materially different. Over time, as data improves, we expect these approaches to gradually converge. FACILITATED EMISSIONS Our capital markets, underwriting, and syndicated lending activities constitute a small part of our overall business, representing less than 5% of total lending. Within sectors where we have set financed emissions sector targets, facilitated emissions associated with these activities are similarly limited in scale, accounting for no more than 5% of financed emissions on average. We expect to reassess the materiality of facilitated emissions when we next review our targets. SELECTING REFERENCE SCENARIOS In determining our targets, we selected appropriate science-based reference scenarios. We have established a set of principles to assist with scenario selection. No scenario is perfect and it is difficult to fully align with the regional characteristics of the sectors. As a result, our scenarios may differ from other industry participants, and may not align with all the principles. PRINCIPLES DETAIL 1.5°C alignment • Scenario should meet net-zero emissions by 2050 or sooner, consistent with 1.5°C alignment. UNEP FI Guidelines For Climate Target Setting for Banks • Credible, well recognised source with a science-based scenario; • Low/no overshoot (the IPCC defines as – if temperatures exceed 1.5°C by less than 0.1°C; but return to less than 1.5°C in 2100). • Low reliance on offsets; and • Minimise misalignment with other UN Sustainable Development Goals. Regional/ sector granularity • Should have an emissions trajectory and segmentation relevant to Australia and New Zealand; and • Ability to align to components of the value chain consistent with the companies in the sector boundary. Recognised use • Industry accepted/backed scenario; and • Used by other industry participants. 1 UNEP-FI Net-Zero Banking Alliance (NZBA), Guidelines for Climate Target Setting for Banks Version 2 (2024). 2 These reference scenarios are not necessarily utilised within the climate-related scenario analysis discussed in this Report. WESTPAC 2025 SUSTAINABILITY REPORT |
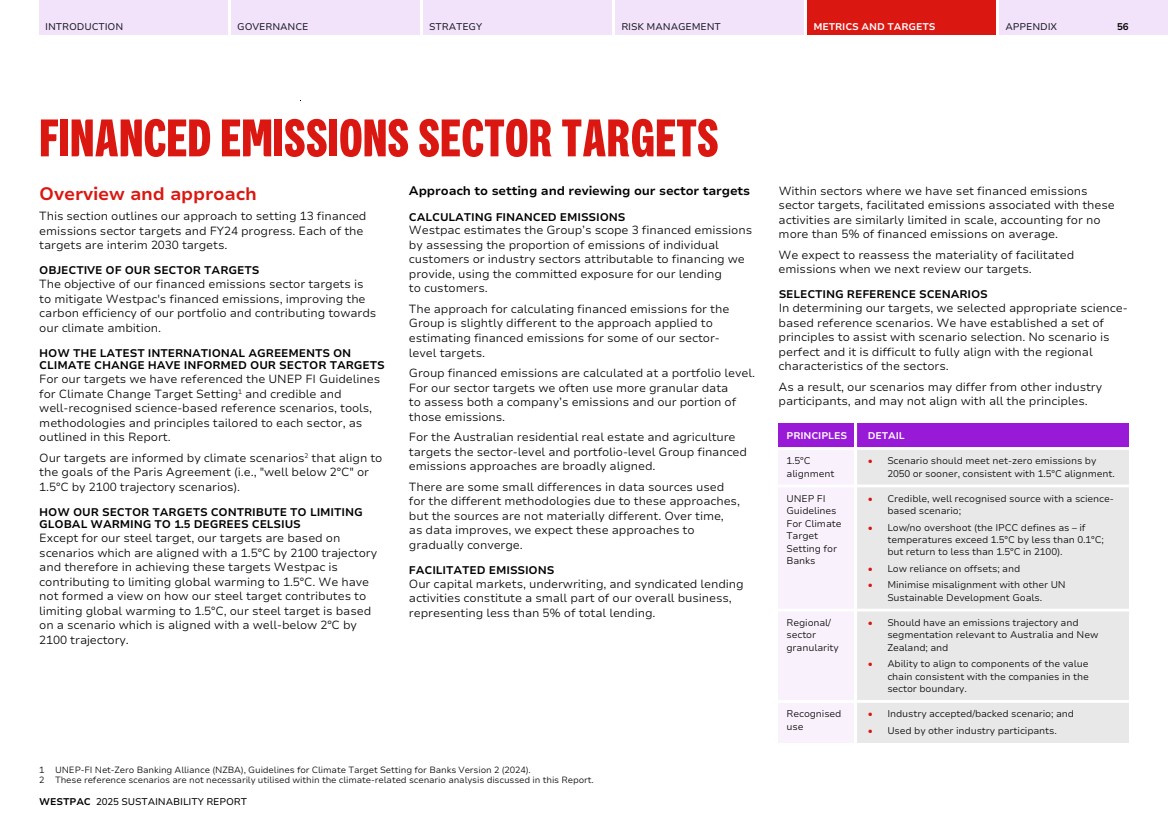
| INTRODUCTION GOVERNANCE STRATEGY RISK MANAGEMENT METRICS AND TARGETS APPENDIX FINANCED EMISSIONS SECTOR TARGETS 57 DETERMINING CUSTOMERS IN THE TARGET BOUNDARY The boundary for each target has been determined by focusing on the value chain addressed by science-based reference scenario used for the target. To identify customers in scope, we use ANZSIC codes for initial screening and, depending on the target, we supplement with more detailed knowledge about the companies so that the nature of the companies' operations aligns with the target. APPROACH TO DIVERSIFIED COMPANIES For our Australian models, where an Institutional customer has operations in multiple segments that are also in-scope of multiple financed emissions sector targets, we apportion our customers Enterprise Value Including Cash (EVIC) and emissions between the applicable sector targets. The method we use to apportion our customers EVIC and emissions is selected based on available customer data preferencing where our customers report segments aligned to the target sectors. We will only use this approach where our customer meets a minimum TCE threshold due to the added complexity of this methodology. ESTABLISHING SECTOR TARGETS Our targets undergo a rigorous sequence of approvals to help ensure our commitments are robust. Our target-setting process is managed by the division that has the main relationship with the sector. Targets are then reviewed by various Group functions before being submitted to the Board for approval (with the exception of our Aluminium target which was approved by the CEO). This approach supports the development of targets that are both ambitious and achievable. GROSS OR NET GREENHOUSE GAS EMISSIONS TARGETS The intent is that our financed emissions sector targets are gross targets. We cannot guarantee, however, that the inputs of our progress against targets (including customer emissions data) does not include net emissions. USE OF CARBON CREDITS TO ACHIEVE OUR TARGETS We believe reducing gross emissions should be a priority action in achieving targets and the transition to net-zero. We recognise carbon offsets are likely to play a role to supplement decarbonisation in line with climate science-based scenarios. We have not purchased, nor do we intend to purchase carbon offsets to meet our financed emissions sector targets. We understand that some customers are using or may use offsets to meet their decarbonisation targets and some of the data we use may also include customer offsets. It is important to note that we use carbon credits to offset our residual emissions (see Table 25), but these are not considered when assessing progress on our targets. REVIEWING OUR SECTOR TARGETS We expect to review each of our sector targets within five years of setting the target. DATA LIMITATIONS Calculating financed emissions is subject to inherent uncertainties due to data limitations/availability and changing methodologies, as well as evolving scientific knowledge. Non-financial data may be subject to more inherent limitations than financial data, given both its nature and the methods for determining, calculating, and estimating such data. As a result, we extensively use proxy data from third parties. Therefore, the quality of our data varies across our targets. Overall, there are significant uncertainties, limitations, risks, and assumptions in the metrics and modelling behind our financed emissions sector targets. OTHER CONSIDERATIONS Our targets are set at the sector level, and may not align with those of our customers. For this and other reasons, the pathway to achieving our targets may not be gradual or linear. The emissions reduction trajectory may occur in step-changes, or increase in some periods. While we have sought to use best available data and scenarios, various assumptions and estimates have been used. As a result, our targets and baselines (along with the pathways to achieve our targets) are likely to change as data quality improves and better methodologies emerge. MORE INFORMATION More detail on the methodologies of our financed emissions sector targets, what is in-scope in the target boundaries (including the ANZSIC codes used for initial screening), and the parts of Westpac to which the targets apply, is outlined in Table 52, Table 53, and Section 'Methodology – Financed emissions sector targets' in the Appendix. WESTPAC 2025 SUSTAINABILITY REPORT |
| INTRODUCTION GOVERNANCE STRATEGY RISK MANAGEMENT METRICS AND TARGETS APPENDIX FINANCED EMISSIONS SECTOR TARGETS 58 VALIDATION OF OUR SECTOR TARGETS AND METHODOLOGIES Our target baselines have been subject to limited assurance in prior years. We have also obtained limited assurance over the progress of our targets this year as per our independent assurance statement (see page 113 to 116). Our sector targets and associated methodologies have not been independently validated by a third party. REVISIONS TO OUR SECTOR TARGETS In FY25, there were limited changes to our sector targets. Changes were generally made for updated data or new methodologies. Changes and their impacts are outlined in Table 32. Refer to the Appendix for more information about the methodologies of our financed emissions sector targets. TABLE 32: SECTOR TARGET REVISIONS AND IMPACTS Target Methodology revisions Impact of revisions Thermal coal mining In FY24, the sector target boundary was updated to align with Version 2 of the NZBA Guidelinesa. The update involved: • Excluding dominant metallurgical coal mines producing a thermal coal by-product; and • Excluding diversified miners that produce a thermal coal product where their dominant activity is not thermal coal. No change to the FY21 baseline. No material impact on progress. Residential real estate (Australia) For FY24, we have adopted a September-end reporting date which is aligned with our reporting year end. Previously August-end was used. Impact is immaterial (<1%) on our baseline or progress so there have been no restatements. Agriculture – Australia beef and sheep In 2025, as part of the Australian Bureau of Statistics’ modernisation of the Agricultural Statistics Program, two methodology updates were introduced, affecting the input data used to calculate our Beef and Sheep emissions. Adopting the new data allowed us to use more appropriate data in our model. Alongside this, we updated the emission factors used in FY23 reporting. Due to National Greenhouse Accounts being published two years in arrears, emission factors are usually used for both current and prior year portfolio emissions calculations. This reflects the most recent available data. Minor increase in FY21 baseline, FY22-23 progress reporting and FY30 target. Target trajectory remains unchanged. Agriculture – Australia dairy Consistent with beef and sheep, the FY23 dairy portfolio emissions intensity was updated to use FY23 emissions factors. This reflects the most recent available data. Negligible impact (<1%) to FY22-23 portfolio emissions intensity. Agriculture – New Zealand beef and sheep In FY25, we commenced using customer level emissions data for all our NZ agriculture targets when previously regional estimates were used. Updated baseline is 19.8 (from 19.4), FY23 progress is 2% above baseline (from 4% below), target is 18.0 (from 17.6). Agriculture – New Zealand dairy Updated baseline is 0.86 (from 0.83), FY23 progress is 2% below baseline (from 7% below), target is 0.77 (from 0.75). a. UNEP-FI Net-Zero Banking Alliance (NZBA), Guidelines for Climate Target Setting for Banks Version 2 (2024). WESTPAC 2025 SUSTAINABILITY REPORT |
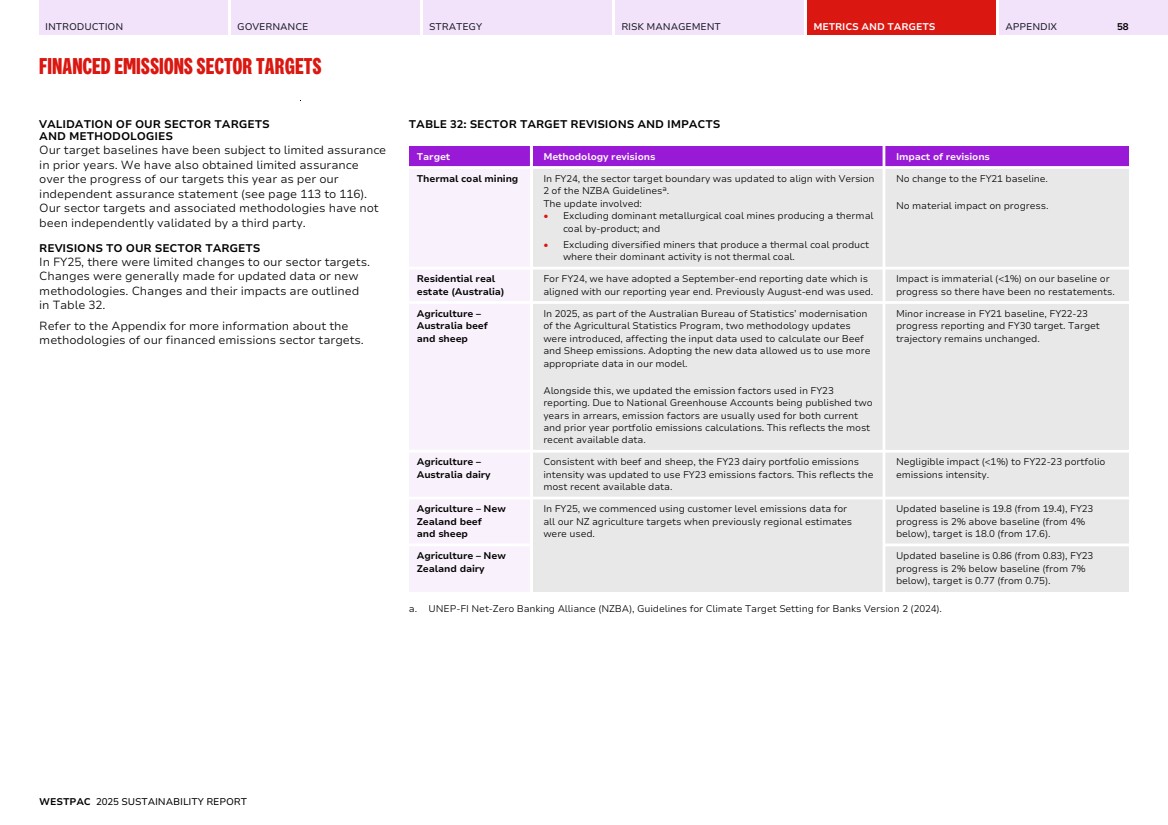
| INTRODUCTION GOVERNANCE STRATEGY RISK MANAGEMENT METRICS AND TARGETS APPENDIX FINANCED EMISSIONS SECTOR TARGETS 59 Sector target progress – Power generation TYPE OF TARGET 2021 BASELINE 2030 TARGET (IMPLIED % REDUCTION TO BASELINE YEAR) PROGRESS vs BASELINE % (AND EMISSIONS INTENSITY) ABSOLUTE EMISSIONS MtCO2-ea TCE IN TARGET BOUNDARY 2024 2023 2024 2023 2024 2023 2024 (% of Group TCE) Intensity 0.26 tCO2-e/MWh -62% -38% (0.16) -23% (0.20) NA NA $7,215m $5,905m 0.6% a. NA means 'Not Available' – data quality scores and/or certain emissions reporting are not available for all financed emissions sector targets. Sector and portfolio developments The power generation sector plays a vital role in the energy transition, and we continue to support its development. In line with the Australian Energy Market Operator (AEMO), we believe that increased renewables coupled with new storage and gas-powered generation is the most efficient way forward. To support the transition, there is a need to streamline approvals for renewable projects, establish clear generation and storage targets and strengthen the grid. Referencing the AEMO’s roadmaps, the transition must be carefully planned to ensure energy security, reliability, and affordability ensuring we bring community along on the journey. At 30 September 2024 our exposure to the sector was $7.2bn, representing 0.6% of Group TCE. Utilities represent approximately 16% of Westpac's scope 1 and 2 financed emissions for FY24. Most of those emissions relate to electricity generation. Progress and plans At FY24 our emissions intensity was 0.16 tCO2-e/MWh, this was 20% lower than FY23 and is 38% lower than the 2021 baseline. The reduction this year was due to further increases in renewable lending. Progress is tracking favourably below our reference pathway. Reflecting our support for the sector, TCE increased 22% for the year to September 2024. Looking ahead we plan to further expand our renewable energy lending to support regional needs. We also intend to continue supporting customers with their Climate Transition Plans. FIGURE 11: POWER GENERATION tCO₂-e/MWh 0.26 0.23 0.20 0.16 0.10 2021 baseline Progress 2030 target CSIRO/ClimateWorks Australia Hydrogen Superpower Scenario FY21 FY22 FY23 FY24 FY25 FY26 FY27 FY28 FY29 FY30 0 0.25 0.5 0.75 The value chain for this sector is represented by the diagram below. We have highlighted in a darker colour the elements of the value chain that are in-scope of our financed emissions sector target. Power Generation Power generation Transmission and distribution Retail Consumption More detail on what is in-scope of the boundary and methodology for this target is outlined in Section 'Methodology – Financed emissions sector targets' of the Appendix. WESTPAC 2025 SUSTAINABILITY REPORT |
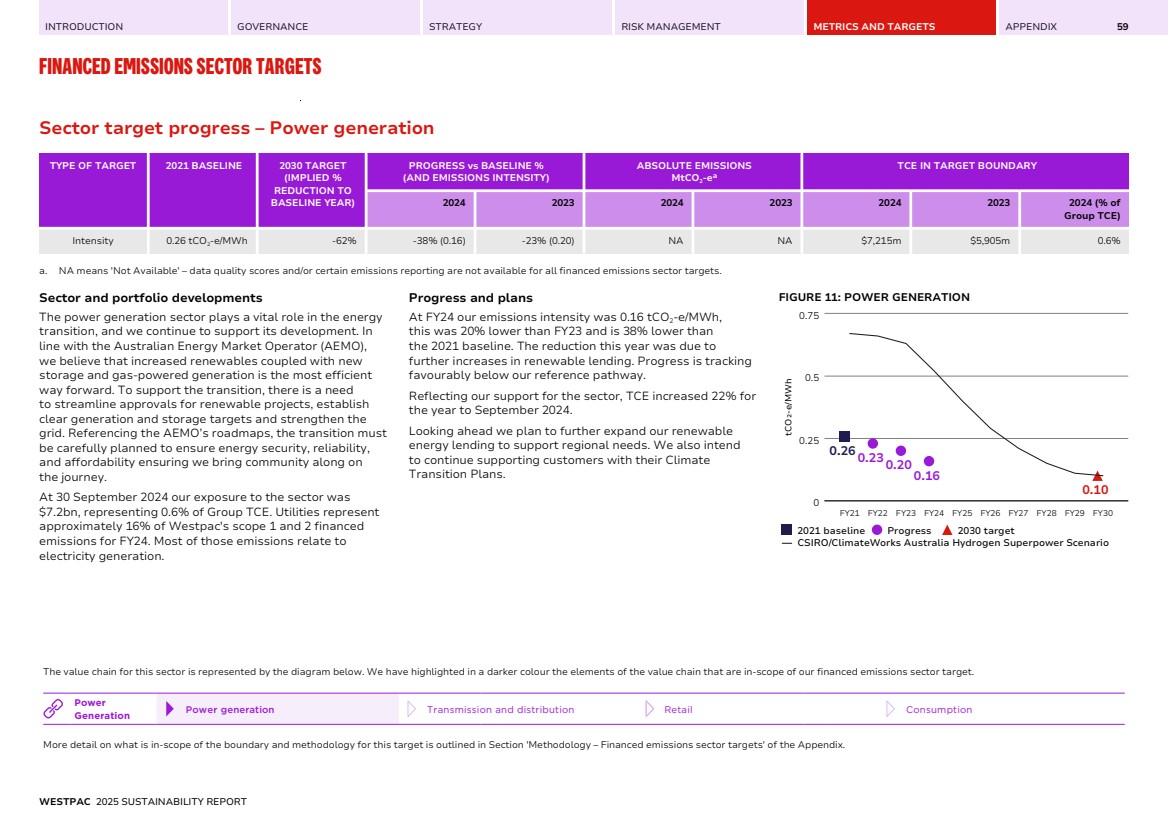
| INTRODUCTION GOVERNANCE STRATEGY RISK MANAGEMENT METRICS AND TARGETS APPENDIX FINANCED EMISSIONS SECTOR TARGETS 60 Sector target progress – Upstream oil and gas TYPE OF TARGET 2021 BASELINE 2030 TARGET (IMPLIED % REDUCTION TO BASELINE YEAR) PROGRESS vs BASELINE % ABSOLUTE EMISSIONS MtCO2-e TCE IN TARGET BOUNDARY 2024 2023 2024 2023 2024 2023 2024 (% of Group TCE) Absolute 9.2 MtCO2-e -23% -55% -45% 4.1 5.1 $2,298m $3,283m 0.2% Sector and portfolio developments The upstream oil and gas sector is central to energy and industry, but it produces about 15% of global energy-related emissions1 . Ways to cut emissions include reducing methane leaks and flaring, electrifying operations, and investing in carbon capture and storage (CCS)1 . While global oil demand is projected to peak around 2030, gas demand is expected to grow until 20402 as we transition to renewables. Recent Australian Government strategies highlight the importance of gas, with an emphasis on affordable and secure energy supply and emissions reduction. The sector is adopting abatement measures through process optimisation and methane leak detection, although the implementation of reservoir large-scale CCS and hydrogen fuel for gas turbines requires further development and investment. Our TCE to oil and gas declined by 30% in the year to September 2024 and represents less than 0.2% of the Group’s total TCE. The oil and gas sector target absolute financed emissions represent approximately 10% of Westpac's scope 1, 2 and 3 financed emissions for FY24 (noting there are different methodologies for calculating sector targets and Group financed emissions). Progress and plans In FY24, absolute financed emissions dropped 19% from FY23, and is 55% lower than our FY21 baseline. The decline in emissions over FY24 was mainly due to reduced exposure, mostly amortisation and active management of our portfolio. The lower financed emissions was also due to considering the impact of potential new transactions on our target. We intend to continue engaging with customers on their transition plans, including as part of our lending decisions and having regard to government policy on energy security and affordability. Financed emissions have shown a consistent decline each year since our 2021 baseline, although future progress may be more variable. Nonetheless, the commitment to our target remains firm. FIGURE 12: UPSTREAM OIL AND GAS MtCO₂-e 9.2 7.5 5.1 4.1 7.1 2021 baseline Progress 2030 target FY21 FY22 FY23 FY24 FY25 FY26 FY27 FY28 FY29 FY30 0 5 10 The value chain for this sector is represented by the diagram below. We have highlighted in a darker colour the elements of the value chain that are in-scope of our financed emissions sector target. Oil and Gas Oil and gas exploration, extraction Mid-stream (integrated companies, tolling and stand-alone refining) Downstream (integrated companies only) Oil and gas trading More detail on what is in-scope of the boundary and methodology for this target is outlined in eSection 'Methodology – Financed emissions sector targets' of the Appendix. 1 International Energy Agency (IEA), Emissions from Oil and Gas Operations in Net Zero Transitions – A World Energy Outlook Special Report on the Oil and Gas Industry and COP28 (2023). 2 International Energy Agency (IEA), World Energy Outlook 2024 (2024). WESTPAC 2025 SUSTAINABILITY REPORT |
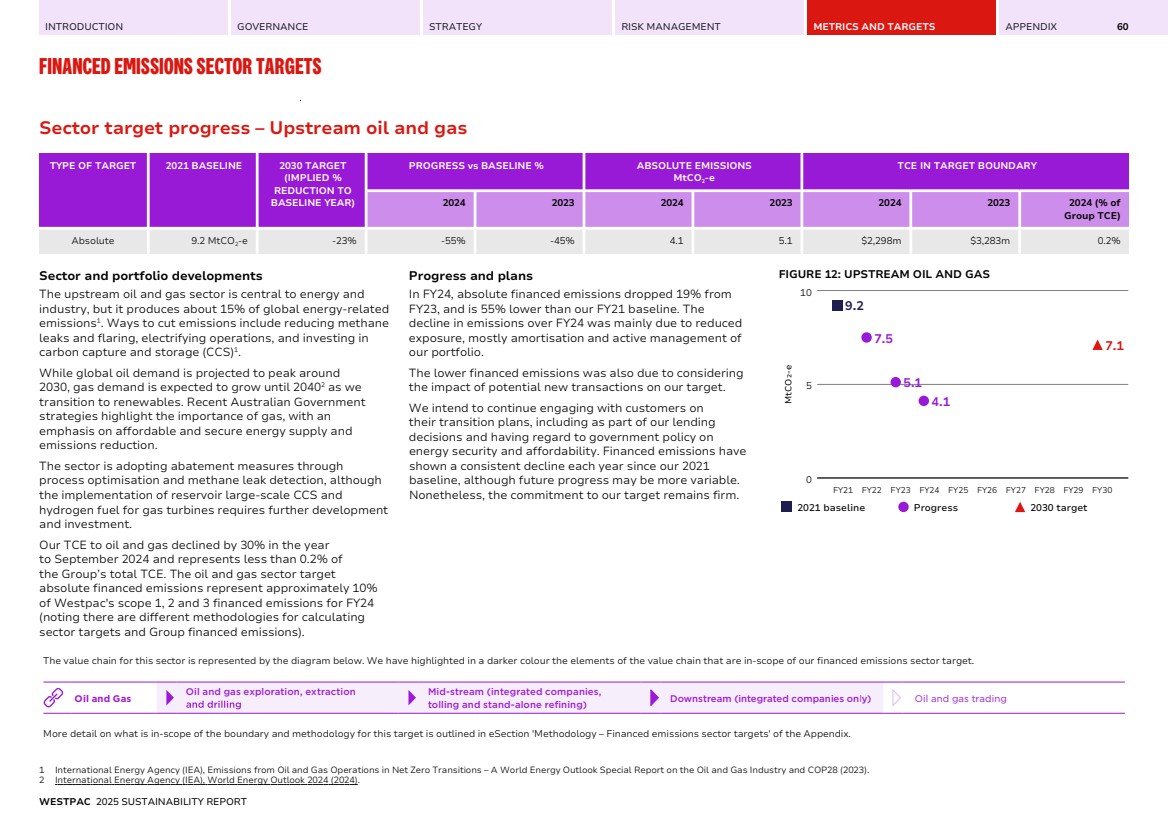
| INTRODUCTION GOVERNANCE STRATEGY RISK MANAGEMENT METRICS AND TARGETS APPENDIX FINANCED EMISSIONS SECTOR TARGETS 61 Sector target progress – Thermal coal mining TYPE OF TARGET 2021 BASELINE 2030 TARGET (IMPLIED % REDUCTION TO BASELINE YEAR) PROGRESS vs BASELINE % ABSOLUTE EMISSIONS MtCO2-e TCE IN TARGET BOUNDARY 2024 2023 2024 2023 2024 2023 2024 (% of Group TCE) Absolute 2.46 MtCO2-e -100% -94% -81% 0.15 0.47 $26m $65m <0.1% Sector and portfolio developments Thermal coal plays a major role in the energy sector and has long been the primary source of energy generation in Australia. Export of thermal coal is a significant contributor to Australia’s economy. However, thermal coal mining is a significant emitter though the release of methane in mining through to combustion for industrial processes and energy generation. Accordingly, we believe it is critical that the world transitions away from thermal coal combustion and does so quickly. Progress and plans Over FY24 our financed emissions related to thermal coal declined 67%, predominantly due to repayments on existing facilities with no new commitments approved. This is consistent with our Carbon-Intensive Sector Requirements for thermal coal mining. Our exposure to thermal coal mining was just $26 million at 30 September 2024. Over FY25, we have reduced to zero our corporate lending to institutional thermal coal mining customers1 . This is consistent with our target. FIGURE 13: THERMAL COAL MINING MtCO₂-e 2.46 1.9 0.47 0.15 0.0 2021 baseline Progress 2030 target FY21 FY22 FY23 FY24 FY25 FY26 FY27 FY28 FY29 FY30 0 1 2 3 1 At 30 September 2025. In line with our Sustainability Customer Requirements, we have zero corporate lending and will no longer provide bond facilitation for institutional customers with ≥15% of their three-year rolling average revenue coming directly from thermal coal mining. The value chain for this sector is represented by the diagram below. We have highlighted in a darker colour the elements of the value chain that are in-scope of our financed emissions sector target. Thermal Coal Mining Transport and distribution Power generation More detail on what is in-scope of the boundary and methodology for this target is outlined in Section 'Methodology – Financed emissions sector targets' of the Appendix. WESTPAC 2025 SUSTAINABILITY REPORT |
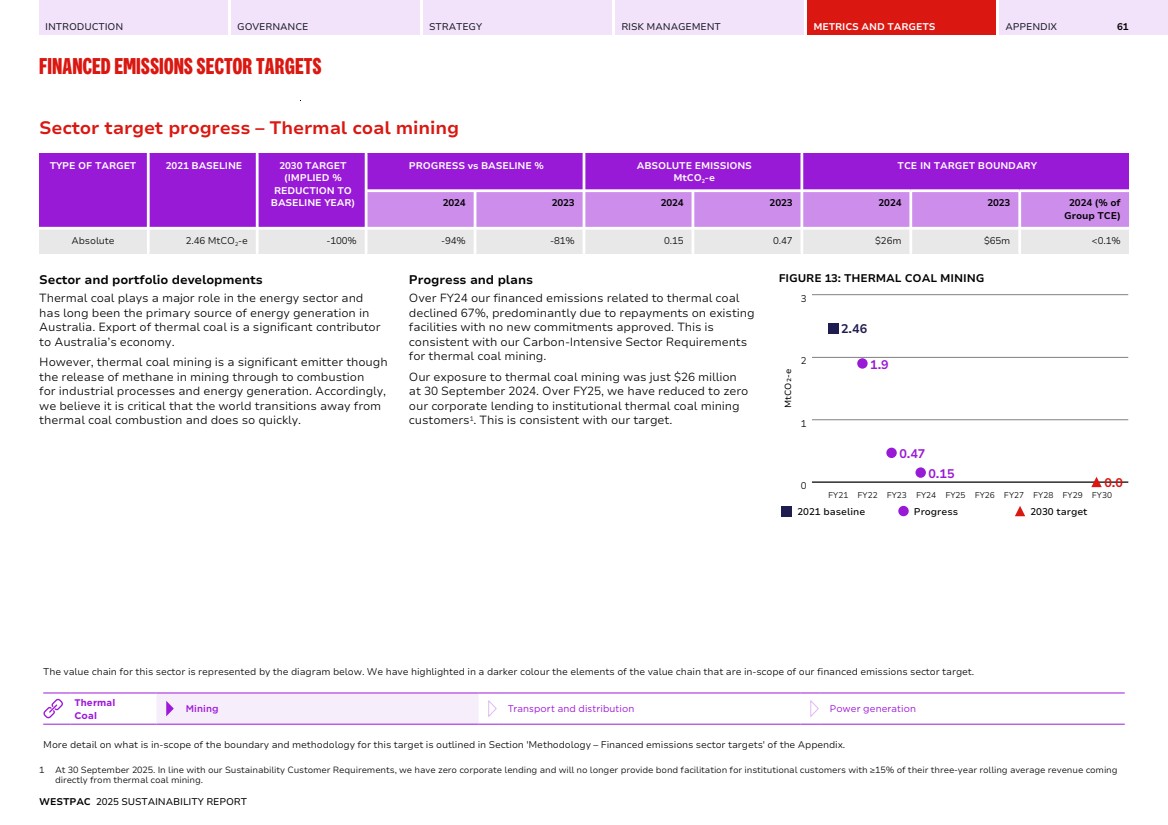
| INTRODUCTION GOVERNANCE STRATEGY RISK MANAGEMENT METRICS AND TARGETS APPENDIX FINANCED EMISSIONS SECTOR TARGETS 62 Sector target progress – Aviation (passenger aircraft operators) TYPE OF TARGET 2021 BASELINE 2030 TARGET (IMPLIED % REDUCTION TO BASELINE YEAR) PROGRESS vs BASELINE % (AND EMISSIONS INTENSITY) ABSOLUTE EMISSIONS MtCO2-e TCE IN TARGET BOUNDARY 2024 2023 2024 2023 2024 2023 2024 (% of Group TCE) Intensity 190.6 gCO2-e/ passenger km -60% -47% (101.5) -45% (105.3) 0.670 0.605 $780m $922m 0.1% Sector and portfolio developments Aviation is a hard-to-abate sector, responsible for around 2.5% of global energy-related CO2 emissions, primarily from burning aviation fuel1 . Decarbonisation of the sector requires reducing consumption of fossil-based jet fuel, through more efficient aircraft and greater use of lower carbon fuels. This transition is challenging given Aviation is a truly global industry and there are high costs associated with expanding the production and distribution of such fuels. The IEA NZE 2050 reference scenario assumes that Sustainable Aviation Fuel (SAF) will make up around 15% of fuel consumption by 20301 . Our passenger aviation target is an emissions intensity metric given the importance of this sector and the need to support customers with their emissions reduction plans. Progress and plans Consistent with sector developments, the emissions intensity of our portfolio has continued to decline. In FY24 this was due mostly to more passenger travel (reduction in emissions per passenger) along with the decarbonisation efforts of our in-scope customers. Our sector exposure declined 15% over the year to 30 September 2024 although this had little impact on our emissions intensity progress. Looking ahead, future decarbonisation will depend on fleet upgrades to use more efficient aircraft and greater access to sustainable aviation fuel. Globally there has been a rise in policy measures to support development of a SAF industry and the Australian Government announced $250 million in grants to domestic low carbon liquid fuels (LCLF) production through the Future Made in Australia Innovation Fund2 . FIGURE 14: AVIATION (PASSENGER AIRCRAFT OPERATORS) gCO₂-e/passenger km 190.6 156.0 105.3101.5 76.4 2021 baseline Progress 2030 target IEA NZE Scenario FY21 FY22 FY23 FY24 FY25 FY26 FY27 FY28 FY29 FY30 0 100 200 300 The value chain for this sector is represented by the diagram below. We have highlighted in a darker colour the elements of the value chain that are in-scope of our financed emissions sector target. Aviation Aircraft manufacturing Aircraft leasing Scheduled passenger air transport Airport operations More detail on what is in-scope of the boundary and methodology for this target is outlined in Section 'Methodology – Financed emissions sector targets' of the Appendix. 1 International Energy Agency (IEA), Aviation Industry Overview (2025). 2 Australian Government, Low-carbon liquid fuels of the Future Made In Australia (2025). WESTPAC 2025 SUSTAINABILITY REPORT |
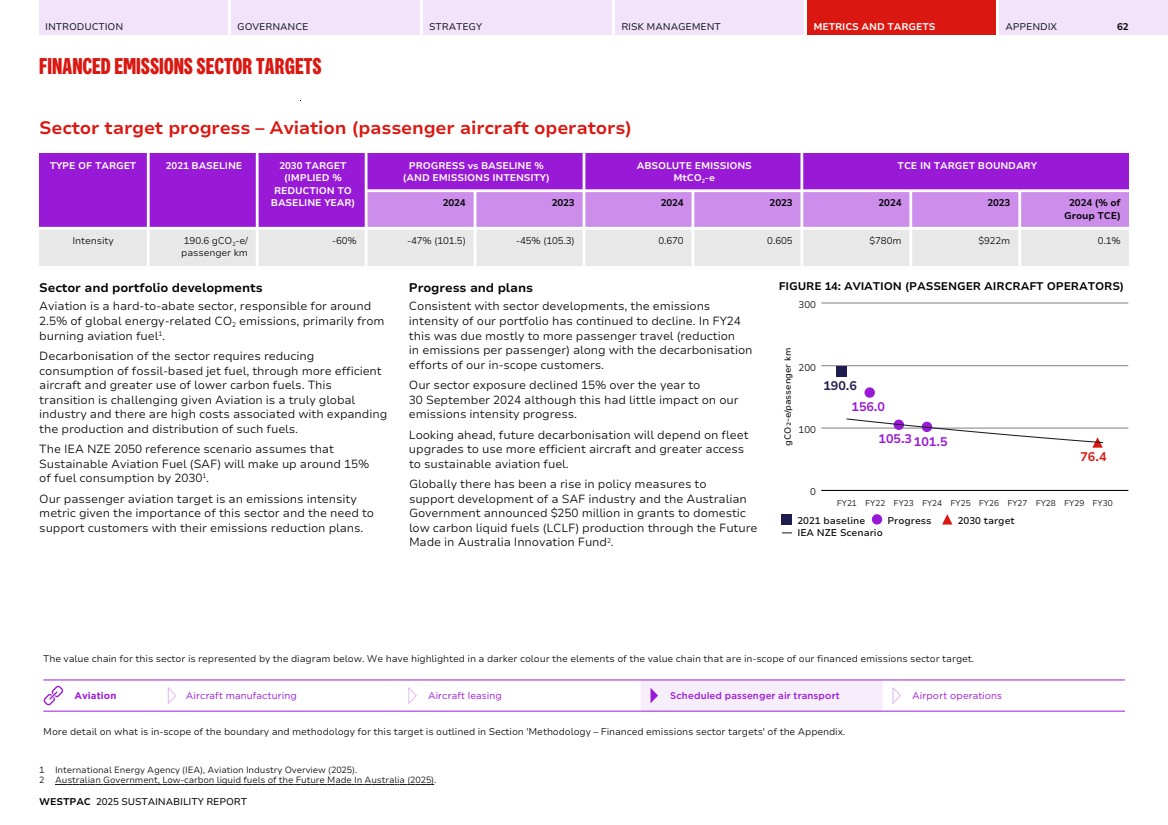
| INTRODUCTION GOVERNANCE STRATEGY RISK MANAGEMENT METRICS AND TARGETS APPENDIX FINANCED EMISSIONS SECTOR TARGETS 63 Sector targets progress – Cement production, Steel production and Aluminium As at 30 September 2024, we are on track to achieve our 2030 Cement, Steel and Aluminium targets and their progress is below our reference sector pathway. Given the small number of customers associated with each target and to ensure their confidentiality, we are not disclosing some figures. Sector and portfolio developments STEEL: Steel is crucial for the net-zero transition and for economic development, with few alternatives available. It is essential for constructing renewable energy assets and supporting electrification and decarbonisation. As such, support for the steel sector, and customers producing metallurgical coal and iron ore (key inputs for large-scale steel production), is vital. Our emissions intensity target considers the expected growth in demand1 while encouraging deployment of low-and zero-emissions technologies. Steel’s decarbonisation plans include greater use of renewable energy, increased scrap recycling and development of new technologies to enhance low carbon-intensive steelmaking, and increasing the use of electric smelting. Decarbonisation is expected to increase after 2030 as further technological development is needed to transition away from coal-based blast furnaces1 . ALUMINIUM: Aluminium is a versatile material utilised in numerous sectors, playing a pivotal role in supporting the transition to a low-carbon economy. This is particularly through its use in solar panels, electrical infrastructure and transmission systems. Globally aluminium production accounts for approximately 3% of direct industrial CO2 emissions2 , with 95% of these from refining and smelting. Decarbonising aluminium production heavily depends on reliable lower-carbon electricity. Reducing emissions also requires new technology in the production process and greater recycling. The pace of decarbonisation across the sector will depend significantly on the timing and availability of these developments and is unlikely to follow a linear path. We have set an emissions intensity target for 2030 that is aligned with the International Aluminium Institute (IAI’s) 1.5°C pathway to 2050. This reflects the importance of aluminium in the transition and the decarbonisation options available to 2030. Aluminium was added to Australia’s Strategic Materials List in 2024 and a new Green Aluminium Production Credit available from 2028-29 has been announced. This will support switching to renewable electricity before 20363 . CEMENT: The cement sector plays a key role in economic development and in the energy transition. Cement is the key component of concrete and is necessary for constructing the infrastructure necessary for the transition and to enhance the resilience of existing buildings and infrastructure. Given cement's importance, we seek to maintain and expand our support for the sector. We have set an emissions intensity target that allows us to support our customers' capital expenditure requirements as they implement new technologies and other emissions reduction initiatives. In FY24 the building materials sector was subject to significant consolidation. This reduced the number of participants in the relevant markets and should accelerate the use of more efficient global technologies. As a consequence of consolidation in the sector there is less publicly available emissions information on local cement production, and therefore a greater risk that disclosure of sector progress figures will inadvertently reveal non-public data about our customers. As a result, in light of our obligation to protect our customers' confidential information, we are no longer disclosing progress figures for this sector. Progress and plans STEEL AND ALUMINIUM: As at 30 September 2024, we are on track to achieve our 2030 Steel and Aluminium targets and their progress is below our reference sector pathway. For aluminium, our FY24 emissions intensity declined compared to our baseline. This was due to changes in the mix of lending within our portfolio and the decarbonisation efforts of our customers. Given the small number of customers associated with each target and to ensure their confidentiality, we are not disclosing our baseline or progress figures for Steel and Aluminium. CEMENT: As at 30 September 2024, we are on track to achieve our 2030 target with a decline in emissions intensity due to further improvements across the portfolio. Our progress remains below our reference sector pathway. Given the small number of customers associated with the target and to ensure their confidentiality, we are not disclosing our progress figures. Cement production is a large energy user and is a considered a hard-to-abate sector. The SBTi reference pathway suggests only modest declines in emissions intensity can be expected by 2030 with most of the sector's decarbonisation expected after 2030 from more advanced technologies. Further improvements in emissions are expected to flow from switching energy sources to lower-emission fuels, using alternative materials and improving the efficiency of high energy use processes. The value chain for these sectors is represented by the diagrams below. We have highlighted in a darker colour the elements of the value chains that are in-scope of our financed emissions sector targets. More detail on what is in-scope of the boundary and methodology for these targets is outlined in Section 'Methodology – Financed emissions sector targets' of the Appendix. Cement Raw material extraction and preparation Clinker and cement production Concrete production and end-use Steel Production Metallurgical coal and iron ore extraction Ironmaking Steelmaking Downstream processing and manufacturing Aluminium Bauxite extraction Alumina refining Aluminium smelting Manufacture of end use products 1 International Energy Agency (IEA), Net Zero Roadmap A Global Pathway to Keep the 1.5°C Goal in Reach (2023). 2 International Energy Agency (IEA), Aluminium Industry Overview (2023). 3 Government of Australia, Department of Industry, Science and Resources (DISR), New Green Aluminium Production Credit will support the transition to green metals (2025). WESTPAC 2025 SUSTAINABILITY REPORT |
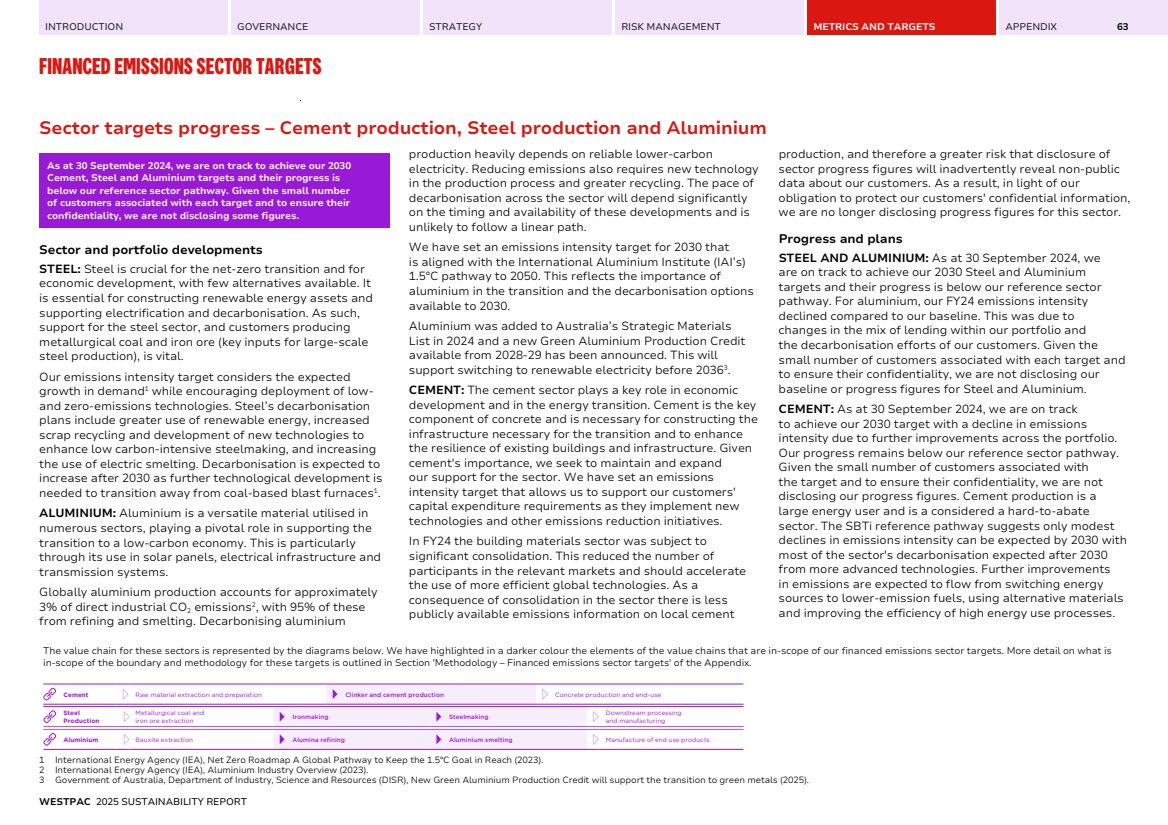
| INTRODUCTION GOVERNANCE STRATEGY RISK MANAGEMENT METRICS AND TARGETS APPENDIX FINANCED EMISSIONS SECTOR TARGETS 64 Sector target progress – Commercial real estate (offices) TYPE OF TARGET 2022 BASELINE 2030 TARGET (IMPLIED % REDUCTION TO BASELINE YEAR) PROGRESS vs BASELINE % (AND EMISSIONS INTENSITY) ABSOLUTE EMISSIONS MtCO2-ea TCE IN TARGET BOUNDARY 2024 2023 2024 2023 2024 2023 2024 (% of Group TCE) Intensity 60 kgCO2-e/m2 net lettable area -59% -27% (44) -18% (49) NA NA $17.3bn $16.7bn 1.4% a. NA means 'Not Available' – data quality scores and/or certain emissions reporting are not available for all financed emissions sector targets. Sector and portfolio developments Commercial buildings in Australia contribute about 25% of electricity use and 10% of carbon emissions1 , and so are important to the nation’s net-zero goals. While electricity is the main emissions source, natural gas remains common for heating and cooking. Our emissions intensity target is for commercial offices (within the broader commercial buildings sector) due to available and reliable emissions data and industry standards. Reducing the sector's emissions relies on upgrading and electrifying existing buildings, increasing renewable electricity use (from both offsite and onsite sources), and aligning with tenant sustainability targets. Achieving long-term goals also depends on broader grid decarbonisation targets, which require coordinated action across governments and the private sector. Progress and plans In FY24, our portfolio’s emissions intensity fell 10%. These improvements largely stemmed from grid decarbonisation, better emissions performance, and newer assets entering the portfolio. Where customer data is available, we have particularly observed rising energy efficiency and greater uptake of renewables. FIGURE 15: COMMERCIAL REAL ESTATE (OFFICES) kgCO₂-e/m² net lettable area 60 49 44 25 2022 baseline Progress 2030 target IEA NZE Scenario (2021) FY21 FY22 FY23 FY24 FY25 FY26 FY27 FY28 FY29 FY30 0 25 50 75 1 Department of Climate Change, Energy, the Environment and Water (DCCEEW), Energy efficiency - Commercial Buildings (2024). The value chain for this sector is represented by the diagram below. We have highlighted in a darker colour the elements of the value chain that are in-scope of our financed emissions sector target. Commercial Real Estate Manufacturing and production Construction Operation (base building) Operation (tenancy) Renovation/maintenance Demolition/recycling More detail on what is in-scope of the boundary and methodology for this target is outlined in Section 'Methodology – Financed emissions sector targets' of the Appendix. WESTPAC 2025 SUSTAINABILITY REPORT |
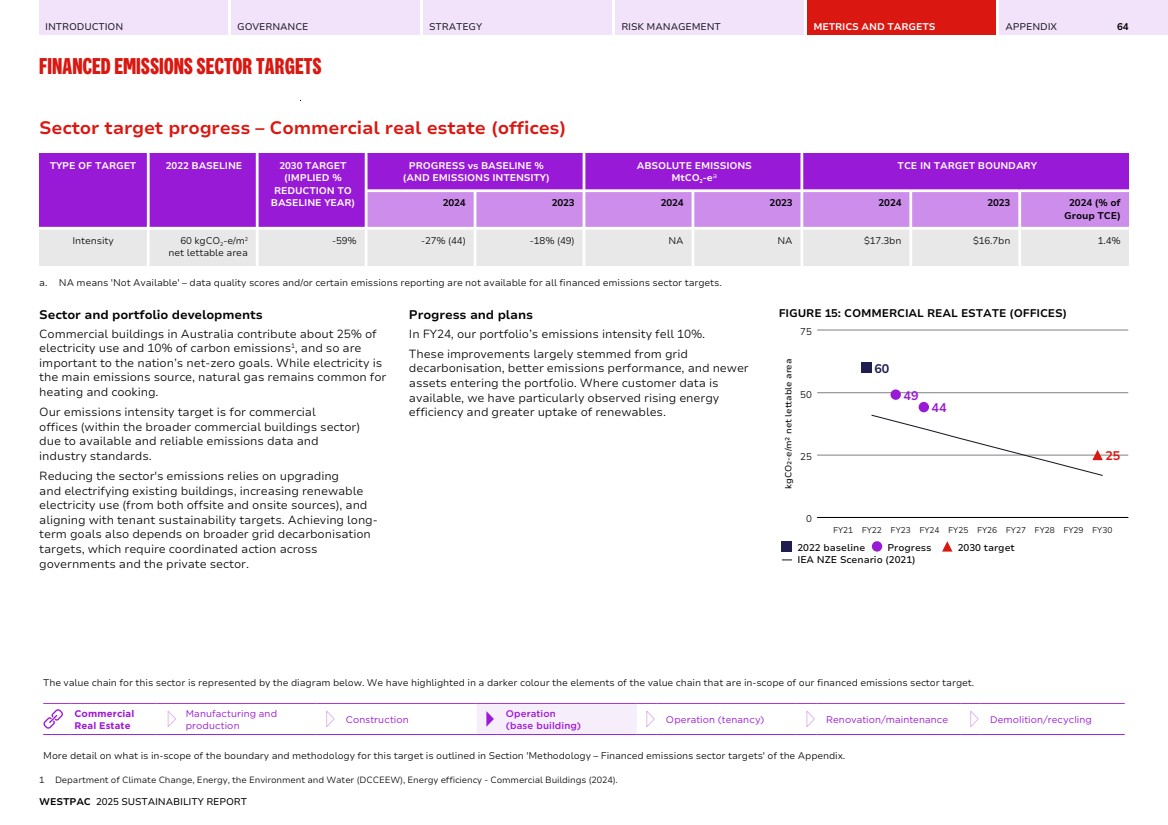
| INTRODUCTION GOVERNANCE STRATEGY RISK MANAGEMENT METRICS AND TARGETS APPENDIX FINANCED EMISSIONS SECTOR TARGETS 65 Sector target progress – Residential real estate (Australia) TYPE OF TARGET 2022 BASELINE 2030 TARGET (IMPLIED % REDUCTION TO BASELINE YEAR) PROGRESS vs BASELINE % (AND EMISSIONS INTENSITY) ABSOLUTE EMISSIONS MtCO2-e LOAN BALANCE IN TARGET BOUNDARY 2024 2023 2024 2023 2024 2023 2024 (% of Group Loans) Intensity 34.6 kgCO2-e/m2 attributed floor areaa -56% -14% (29.8a ) -11% (30.7a ) 2.59 2.69 $456.3bn $438.1bn 56.2% a. For the Residential Real Estate target, baseline and FY23 progress metrics are as at 31 August. FY24 progress metric is as at 30 September. Sector and portfolio developments Australia has around 11 million dwellings1 accounting for approximately 24% of electricity use and more than 10% of the country’s GHG emissions2 . Australian residential mortgages account for approximately half of Westpac’s TCE3 . Residential mortgages (both Australia and New Zealand) represent approximately 10% of Westpac’s scope 1 and 2 financed emissions for FY24. Most of those emissions relate to Australia. Most sector emissions are from natural gas and electricity use and so achieving net-zero financed emissions relies on decarbonisation of the electricity grid. Increasing roof-top solar and household batteries is also contributing. Progress and plans In FY24, the emission intensity of our residential mortgages Australia portfolio decreased 3% from FY23, which is 14% lower than the FY22 base year. The reduction mainly reflects decarbonisation of the electricity grid. Alongside grid decarbonisation, home energy efficiency and electrification are key measures required for achieving net-zero financed emissions in this sector. Some initiatives now underway include: • In FY25, we joined the Australian Government’s trial of the Nationwide House Energy Rating Scheme (NatHERS) for existing homes in collaboration with the Department of Climate Change, Energy, the Environment and Water and CSIRO4 . This initiative offers home energy ratings to help households understand their energy performance and identify cost-effective upgrades5 ; and • In late 2024 we launched our Sustainable Upgrades home and investor loan allowing existing home loan customers to borrow up to $50,000, to improve their energy efficiency or resilience. The loan has a discounted interest rate supported by the Australian Government’s Household Energy Upgrades Fund. FIGURE 16: RESIDENTIAL REAL ESTATE (AUSTRALIA) kgCO₂-e/m² attributed floor area 34.6 30.7 29.8 15.2 2022 baseline Progress 2030 target CRREM Australia Multi-family homes (MFH) Scenario, 2023 FY21 FY22 FY23 FY24 FY25 FY26 FY27 FY28 FY29 FY30 0 20 40 60 The value chain for this sector is represented by the diagram below. We have highlighted in a darker colour the elements of the value chain that are in-scope of our financed emissions sector target. Residential Real Estate Manufacturing and production (owner-occupier or tenancy) Renovation/maintenance Demolition/recycling Operation Construction More detail on what is in-scope of the boundary and methodology for this target is outlined in Section 'Methodology – Financed emissions sector targets' of the Appendix. 1 https://www.abs.gov.au/statistics/industry/building-and-construction/estimated-dwelling-stock/jun-quarter-2022. 2 https://www.dcceew.gov.au/energy/energy-efficiency/buildings/residential-buildings. 3 Westpac 2024 Climate Report, p. 49. 4 Westpac Banking Corporation. Westpac Partners with Government to Help Customers Save on Energy Costs. Media Release, 4 April 2025. 5 NatHERS for existing homes is being rolled out in stages, beginning with the pilot, followed by a scale-up phase, and leading to Stage 2 from mid-2026, which will offer broader access for households to obtain an assessment. WESTPAC 2025 SUSTAINABILITY REPORT |
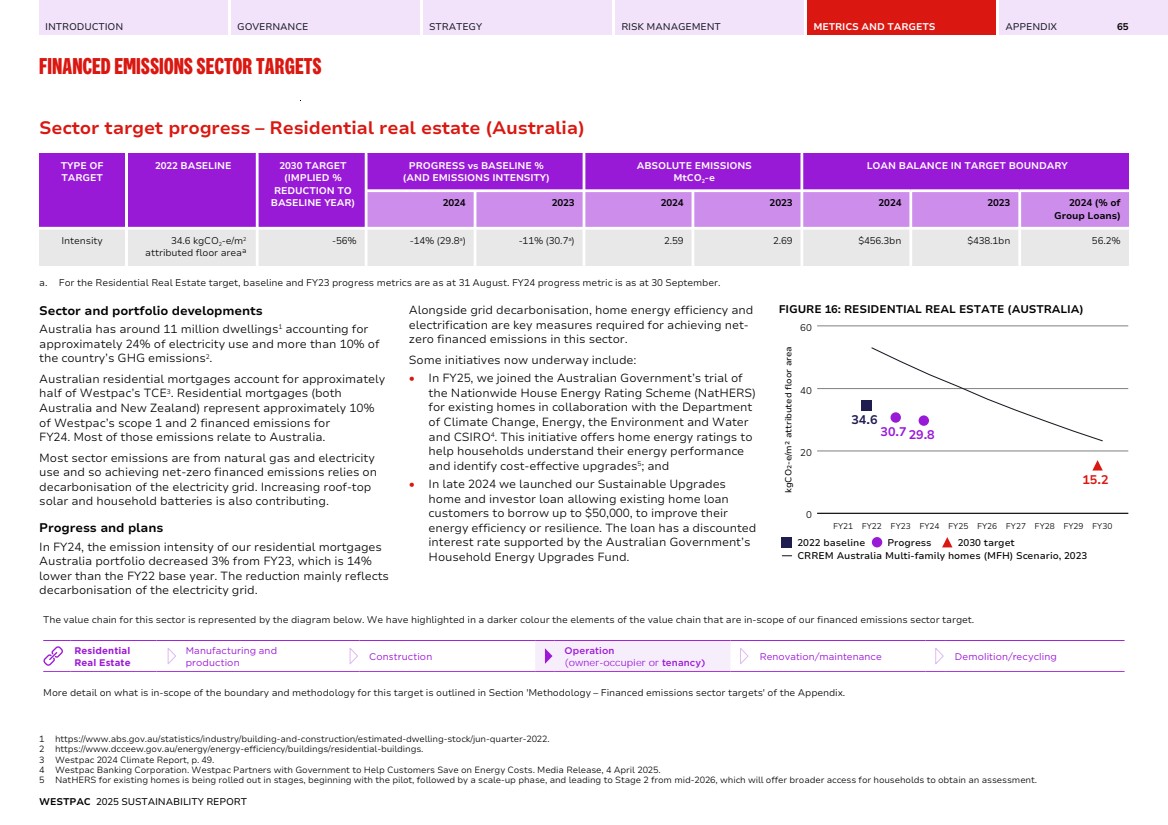
| INTRODUCTION GOVERNANCE STRATEGY RISK MANAGEMENT METRICS AND TARGETS APPENDIX FINANCED EMISSIONS SECTOR TARGETS 66 Sector targets progress – Agriculture TARGET TYPE OF TARGET 2021 BASELINE 2030 TARGET (IMPLIED % REDUCTION TO BASELINE YEAR) PROGRESS vs BASELINE % (AND EMISSIONS INTENSITY) ABSOLUTE EMISSIONS MtCO2-ea TCE IN TARGET BOUNDARY 2024 2023 2024 2023 2024 2023 2024 (% of Group TCE) Australia Beef and Sheep Intensity 22.62 tCO2-e/ tonne of FW -9% +2% (22.96) +2% (23.00) NA NA $6,353m $6,139m 0.5% Australia Dairy Intensity 0.95 tCO2-e/ tonne of FPCM -10% -7% (0.88) -7% (0.88) NA NA $1,482m $1,220m 0.1% New Zealand Beef and Sheep Intensity 19.8 tCO2-e/ tonne of FW -9% -4% (19.0) +2% (20.1) NA NA NZ$1,563m NZ$1,575m 0.1%b New Zealand Dairy Intensity 0.86 tCO2-e/ tonne of FPCM -10% -6% (0.81) -2% (0.84) 2.02 2.04 NZ$5,856m NZ$5,983m 0.4% a. NA means 'Not Available' – data quality scores and/or certain emissions reporting are not available for all financed emissions sector targets. b. New Zealand dollar totals have been translated into Australian dollars at spot rates as at the end of period, 2024: $1.0885. Sector and portfolio developments Agriculture is a broad and diverse sector producing a variety of food and fibre products. Beyond its essential role in sustaining life and providing food security, it is a cornerstone of the Australian and New Zealand economies, being a significant contributor to employment, GDP and export revenues. We are focused on growing in rural and regional Australia including supporting agriculture customers to pursue more efficient farm practices. While agriculture is vital for the economies in which we operate it is also a major source of emissions. In 2024, the sector generated around 19% of Australia’s emissions1 . In New Zealand, due to a more energy-efficient grid and fewer high-emission industries, over 50% of the country’s emissions are from agriculture. In aggregate we estimate that Agriculture, forestry & fishing accounted for around 18% of Westpac’s scope 1 and 2 financed emissions for FY24. The agricultural sector also has a unique opportunity in addressing climate change through carbon sequestration and increased biodiversity, which may provide benefits to animal and soil health and improvements to farm productivity. Whilst the sector’s activities are broad, its emissions are concentrated to key commodities: beef and sheep meat, as well as milk production. These are the sectors that are the focus of our targets. In 2023 beef, sheep and dairy accounted for 85% of Australian agricultural emissions and, in the same year, methane from enteric fermentation accounted for 71% of Australian agricultural emissions2 . In 2022, New Zealand beef and sheep farming made up 22.9% of New Zealand’s total gross greenhouse gas emissions and 43% of New Zealand’s agriculture emissions. New Zealand dairy farming made up 25.7% of New Zealand’s gross greenhouse gas emissions and 48% of New Zealand’s agricultural emissions. The value chain for this sector is represented by the diagram below. We have highlighted in a darker colour the elements of the value chain that are in-scope of our financed emissions sector target. Agriculture Upstream farm inputs and land use changes Farm operations and animal management Processing and transport Retail and distribution Consumption and waste management More detail on what is in-scope of the boundary and methodology for this target is outlined in Section 'Methodology – Financed emissions sector targets' of the Appendix. 1 Australia’s emissions projections 2024. 2 Department of Climate Change, Energy, the Environment and Water (DCCEEW), Australia's National Greenhouse Accounts (n.d.). WESTPAC 2025 SUSTAINABILITY REPORT |
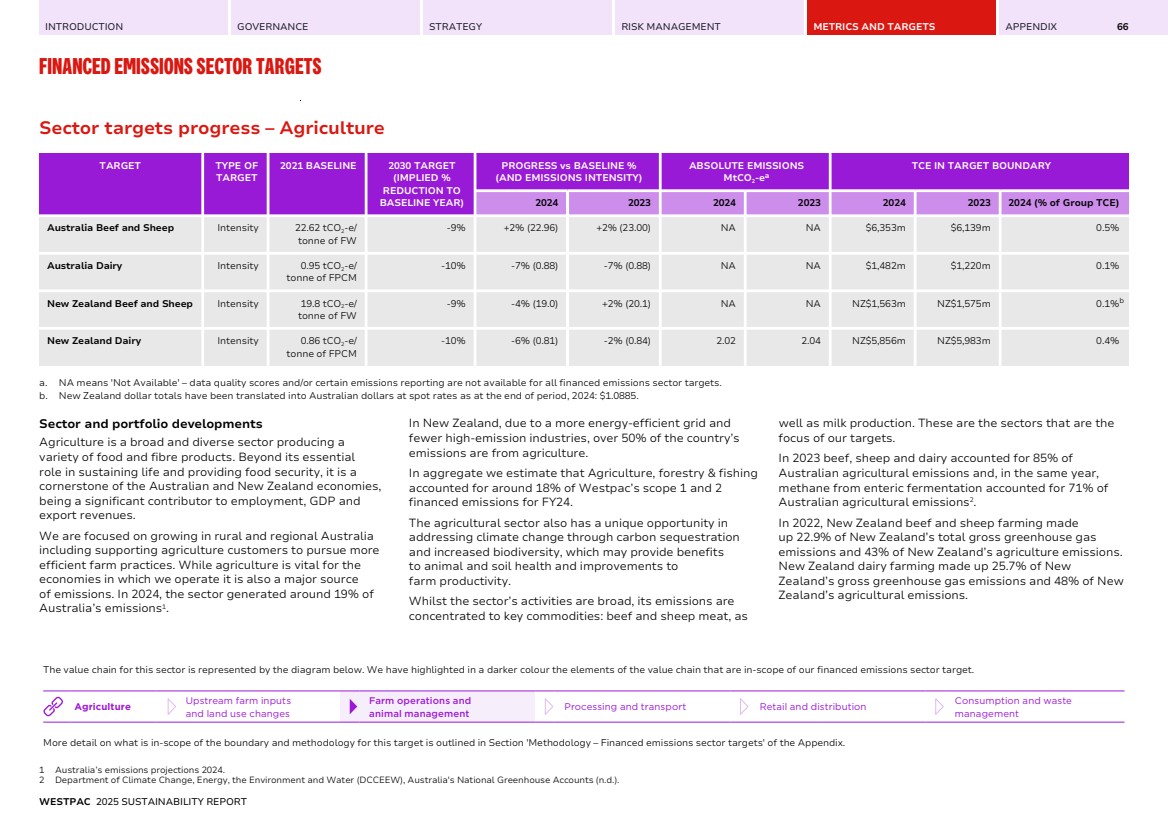
| INTRODUCTION GOVERNANCE STRATEGY RISK MANAGEMENT METRICS AND TARGETS APPENDIX FINANCED EMISSIONS SECTOR TARGETS 67 Emissions related to these sectors are predominantly on-farm, relating to methane and nitrous oxide emissions, with smaller amounts of CO2 . Methane results from enteric fermentation (digestion) and manure management, while nitrous oxide results from excreta and application of nitrogen fertiliser on soils1 . All our targets use emission intensity metrics, reflecting the sector’s substantial economic and community contributions, and our plans to grow the portfolio. Measuring sector emissions is challenging as production systems vary across locations and inputs/output can vary from season to season. This includes climatic variations, commodity prices, and inputs such as fertilisers. Options for reducing emissions in the sector include: • Improve on-farm efficiency and productivity; • Enhance herd genetics for better output and lower emissions; • Apply nitrogen-efficient treated fertilisers; and • Use methane-reducing feed supplements. In late September 2025, the Australian Government released the Agriculture and Land Sector Plan, detailing the sector's contribution to Australia's transition. We are reviewing the report and its implications for our FY26 initiatives. Progress and plans AUSTRALIA BEEF AND SHEEP In FY24 the emissions intensity for the Australian Beef and Sheep portfolio was 22.96 tCO2-e/tonne of Fresh Weight (FW), little changed from FY23 due to the same emissions factors being used (being the latest available data), but remains 1.5% higher than our 2021 baseline and below the sector reference pathway. While our emissions intensity is higher than our 2021 baseline, our analysis of longer-term trends suggests the variances observed appear within the expected ranges of volatility. Livestock activity is highly impacted by climate variations. Higher rainfall in 2021 and 2022 improved pasture conditions and led farmers to rebuild their herds, with a related reduction in animals slaughtered. This resulted in higher stock levels and lower meat production which increased calculated emissions intensity in our portfolio. Beef and sheep meat production rose in FY23, due to maturing animals and strong export demand, which contributed to a lower emissions factor in FY23 (also used for FY24 as the latest available data). In support of our target, we have continued our program of engagement across customers, industry bodies and industry events. This has included our sponsorship of Meat and Livestock Australia (MLA) Carbon EDGE workshops along with participation at various regional field days. We have also lifted our understanding of sector dynamics using data, modelling and geospatial mapping. AUSTRALIA DAIRY In FY24, the emissions intensity for the Australian dairy portfolio was 0.88 tCO2-e/tonne of Fat Protein Corrected Milk (FPCM), changed little from FY23 and remained 7% lower than our FY21 baseline. Our FY24 emissions intensity remains below the sector reference pathway. The flat emissions intensity outcome reflects relatively consistent milk production in 2022 and 2023 which was reflected in emissions factors used in our metrics. At an aggregate level, we have seen lower herd levels across the sector with a rise in milk produced per cow. As part of our commitment to the sector, we are working to improve the quality of our data and evaluating additional ways to share any insights with customers. Engagement is also a priority as we work to understand the opportunities for farmers to reduce emissions and determine how we can best support them. 1 Australian Bureau of Agricultural and Resource Economics and Sciences (ABARES), Snapshot of Australian Agriculture 2025 (2025). https://www.agriculture.gov.au/abares/products/ insights/snapshot-of-australian-agriculture#australian-agricultural-sustainability. FIGURE 17: AGRICULTURE – AUSTRALIA BEEF AND SHEEP tCO₂-e/tonne of Fresh Weight (FW) 22.6223.46 23.0022.96 20.66 2021 baseline Progress 2030 target SBTi FLAG Oceania Beef Commodity Land Management Pathway FY21 FY22 FY23 FY24 FY25 FY26 FY27 FY28 FY29 FY30 0 10 20 30 FIGURE 18: AGRICULTURE – AUSTRALIA DAIRY tCO₂-e/tonne of Fat Protein Corrected Milk (FPCM) 0.95 0.87 0.88 0.88 0.85 2021 baseline Progress 2030 target SBTi FLAG Oceania Dairy Commodity Land Management Pathway FY21 FY22 FY23 FY24 FY25 FY26 FY27 FY28 FY29 FY30 0 1 2 WESTPAC 2025 SUSTAINABILITY REPORT |
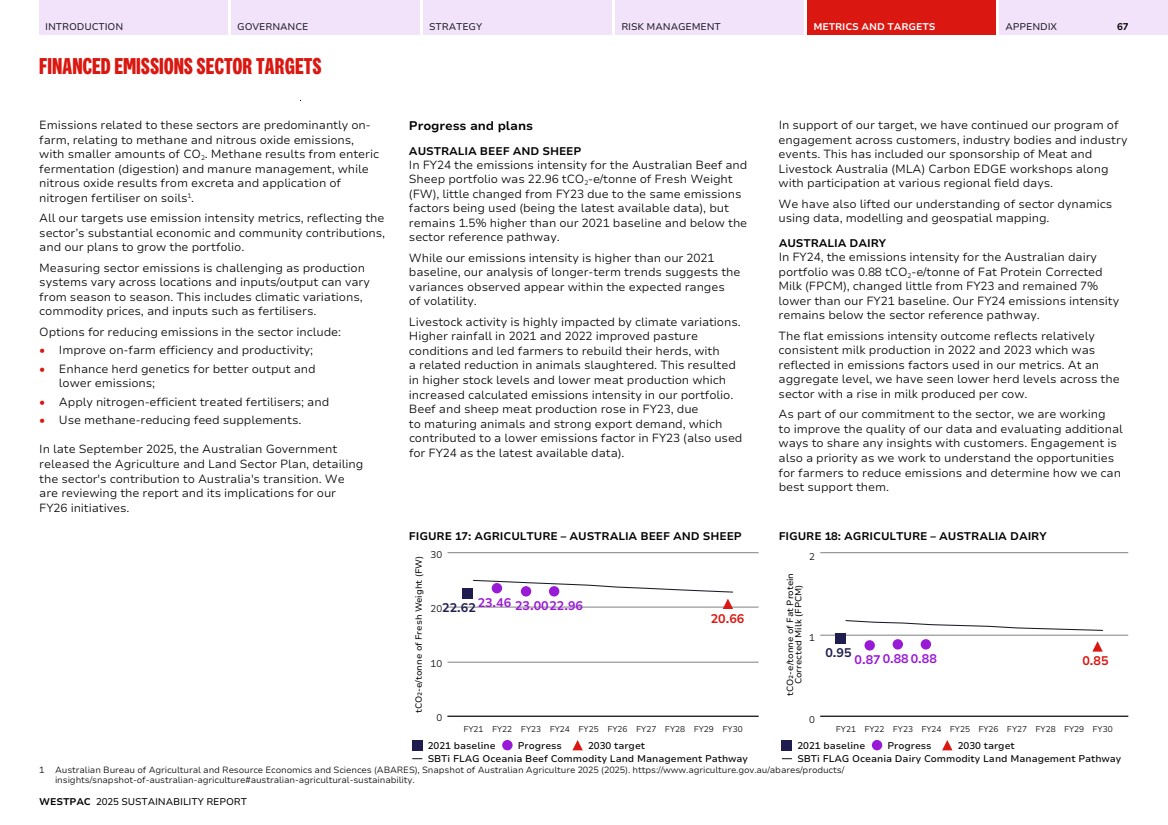
| INTRODUCTION GOVERNANCE STRATEGY RISK MANAGEMENT METRICS AND TARGETS APPENDIX FINANCED EMISSIONS SECTOR TARGETS 68 Progress and plans NEW ZEALAND BEEF AND SHEEP The emissions intensity of our portfolio decreased. The emission intensity initially increased in FY22 and then has decreased for the last two years and now sits 4% below the FY21 baseline. Seasonal variations are likely to have an impact on annual progress. We have steadily improved our data quality by collecting farm level emissions directly from customers. This supports our targets and helps build portfolio and regional insights that we can share back with customers over time. We continue to discuss and promote the Westpac Sustainable Farm Loan which provides an incentive for customers to measure their emissions and set an emission reduction plan. NEW ZEALAND DAIRY The emission intensity initially increased in FY22 and then has decreased for the last two years and now sits 6% below the FY21 baseline which is halfway to the target. Seasonal variations are likely to have an impact on annual progress. As with the beef and sheep sector we continue to collect farm level emissions data and will continue to progress this in a structured way. Similarly the Westpac Sustainable Farm Loan has proven to be a popular product, helping us to have more meaningful discussions with customers on their emission reduction plans. FIGURE 19: AGRICULTURE – NEW ZEALAND BEEF AND SHEEP tCO₂-e/tonne of Fresh Weight (FW) 19.8 20.7 20.1 19.0 18.0 2021 baseline Progress 2030 target SBTi FLAG Oceania Beef Commodity Land Management Pathway FY21 FY22 FY23 FY24 FY25 FY26 FY27 FY28 FY29 FY30 0 10 20 30 FIGURE 20: AGRICULTURE – NEW ZEALAND DAIRY tCO₂-e/tonne of Fat Protein Corrected Milk (FPCM) 0.86 0.88 0.840.81 0.77 2021 baseline Progress 2030 target SBTi FLAG Oceania Dairy Commodity Land Management Pathway FY21 FY22 FY23 FY24 FY25 FY26 FY27 FY28 FY29 FY30 0 1 0.5 1.5 WESTPAC 2025 SUSTAINABILITY REPORT |
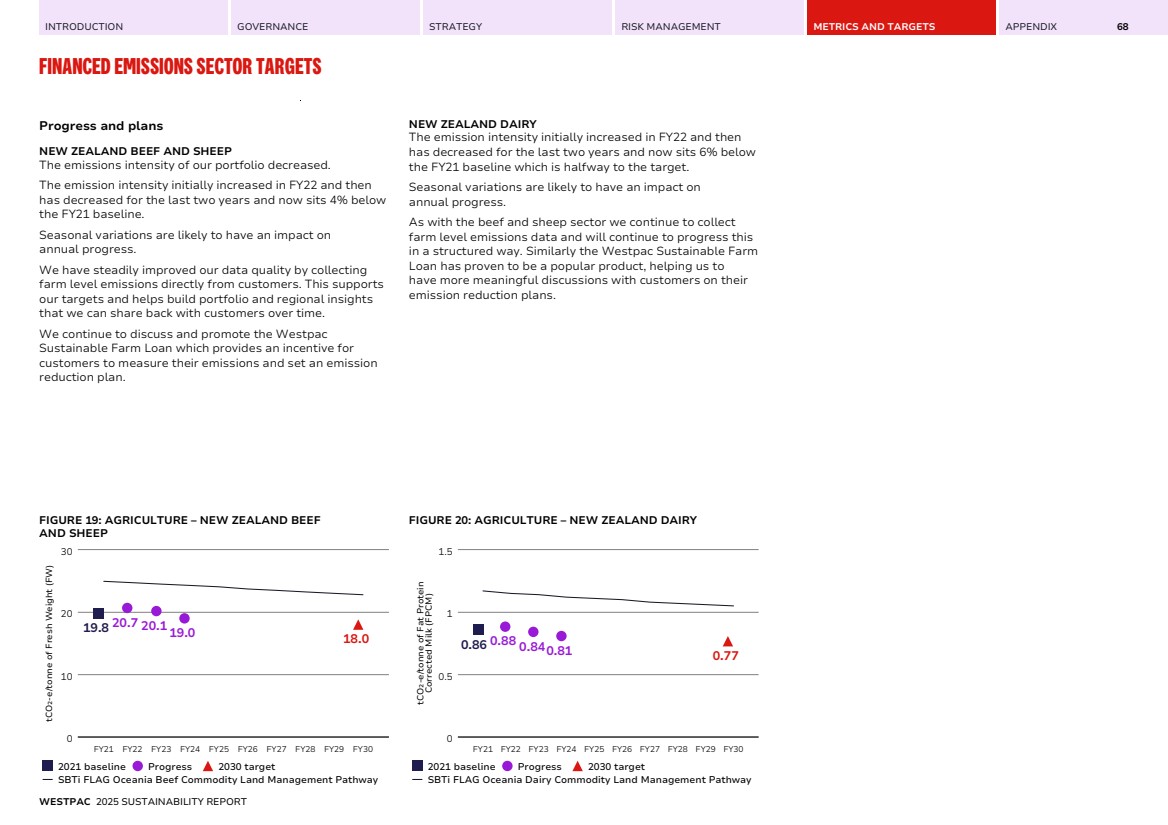
| INTRODUCTION GOVERNANCE STRATEGY RISK MANAGEMENT METRICS AND TARGETS APPENDIX 69 CLIMATE-RELATED OPPORTUNITIES Sustainable Finance Targets Approach to setting and reviewing our Sustainable Finance Targets (SFT) PROCESSES FOR SETTING AND REVIEWING OUR SUSTAINABLE FINANCE TARGETS Our approach in setting our sustainable finance targets was to identify activities which can create and enable positive sustainability outcomes across climate, environmental and social objectives, focusing on material sectors of our lending portfolio. The targets are reviewed by management through periodic monitoring, reporting, and taxonomy updates to reflect regulatory, market, and stakeholder developments. Inputs into our review process include engagement with industry and internal stakeholders. VALIDATION OF OUR SUSTAINABLE FINANCE TARGETS AND METHODOLOGIES Our Sustainable Finance Targets and methodologies have not been validated by a third party. These targets were developed internally leveraging the in-house expertise of our sustainability SMEs and bankers. REVISIONS TO OUR SUSTAINABLE FINANCE TARGETS No revisions were made to the sustainable finance targets in FY25. From 2026, we will commence reviewing our Sustainable Finance Framework (SFF) and target to align with the ASFI national taxonomy where applicable. TABLE 33: ADDITIONAL INFORMATION ABOUT OUR SUSTAINABLE FINANCE TARGETS Detail Target: $55 billion in sustainable finance lending Target: $40 billion in bond facilitation. Metric used to set the target Target is based on TCE (or balancea) at a point in time. Target is based on our share of the cumulative value of bonds facilitated between 1 October 2021 and 30 September 2030. Objective of the targetb Labelled and unlabelled sustainable lending that supports entities and activities contributing to climate change mitigation, adaptation, sustainable land use, natural resources and biodiversity, transition and socialb. Green, Social and Sustainability labelled bond facilitation. Part of Westpac to which the target applies Includes all parts of Westpac Group where products under the Sustainable Finance Framework can be sold. This is mostly includes institutional and commercial customers in Australia and New Zealand and residential mortgage customers in Australia. Westpac Group Institutional Bank Australia and New Zealand labelled bond facilitation globally. Period over which the target applies 30 September 2030. 30 September 2030. Base period from which progress is measured Not applicable – target is measured as a point in time at 30 September 2030. 1 October 2021. Detail Target: $55 billion in sustainable finance lending Target: $40 billion in bond facilitation. Milestones and interim targets No. No. Absolute or intensity target Absolute. Absolute. How the latest international agreement on climate change, including jurisdictional commitments that arise from that agreement, has informed the target Our Sustainable Finance Targets are not informed by the latest international agreement on climate change. a. The balance represents the balance outstanding at a point in time and is applicable for residential mortgages. b. Refer to Westpac Sustainable Finance Framework for definitions. WESTPAC 2025 SUSTAINABILITY REPORT |
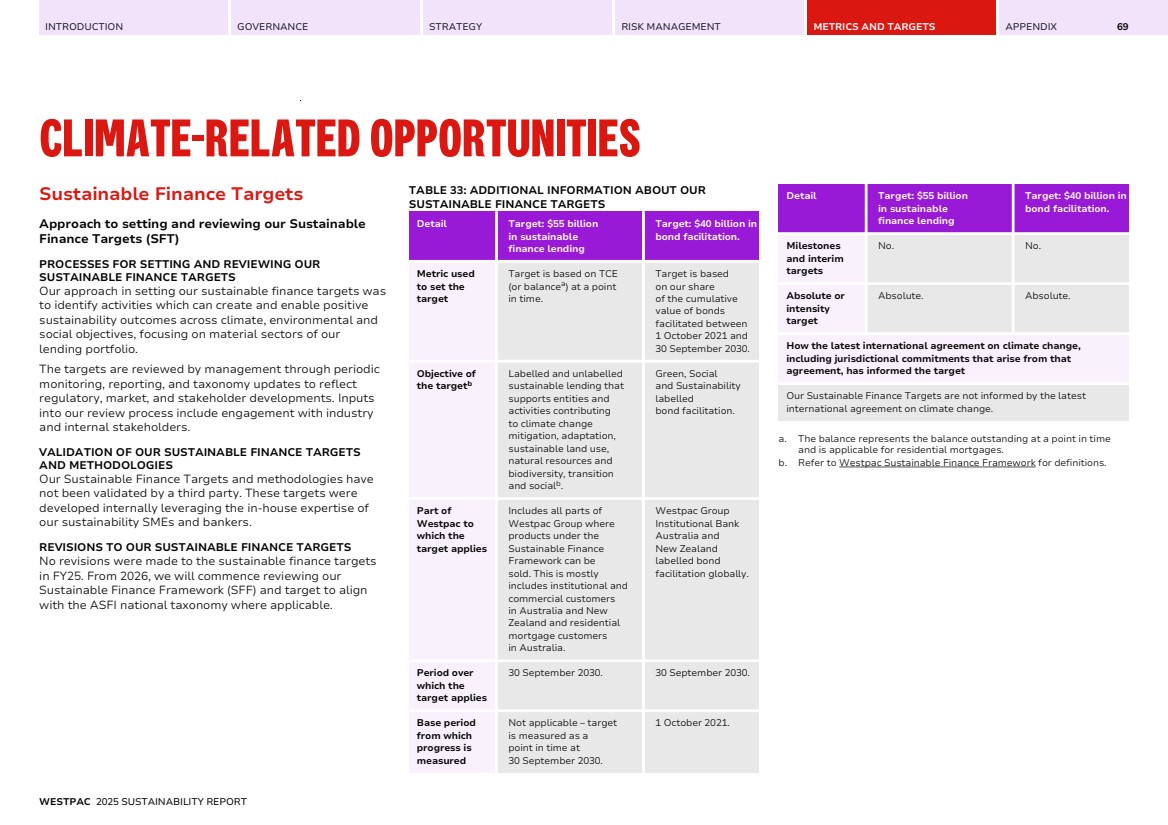
| INTRODUCTION GOVERNANCE STRATEGY RISK MANAGEMENT METRICS AND TARGETS APPENDIX 70 APPENDIX CONTENTS 1.GLOSSARY 71 2.METHODOLOGY – OPERATIONAL EMISSIONS – SCOPE 1, 2 AND UPSTREAM SCOPE 3 74 3.METHODOLOGY – SCOPE 3 FINANCED EMISSIONS 88 4.METHODOLOGY – FINANCED EMISSIONS SECTOR TARGETS 96 5.METHODOLOGY – CLIMATE-RELATED SCENARIO ANALYSIS 107 6.INDEPENDENT ASSURANCE STATEMENT 113 7.DISCLAIMER 117 |
| INTRODUCTION GOVERNANCE STRATEGY RISK MANAGEMENT METRICS AND TARGETS APPENDIX 71 1. GLOSSARY TERM DEFINITION AASB S2 AASB S2 is an Australian Sustainability Reporting Standard issued by the Australian Accounting Standards Board. It requires entities to disclose information about climate-related risks and opportunities that could reasonably affect their cash flows, access to finance, or cost of capital over the short, medium, or long term. AEMO Australian Energy Market Operator. ANZSIC Australia New Zealand Standard Industrial Classification. Australia’s National Greenhouse Accounts (NGA) A series of reports and databases that estimate and account for Australia’s greenhouse gas emissions, published by the Australian Department of Climate Change, Energy, the Environment and Water (DCCEEW). Bond facilitation Labelled syndicated Green, Social, Sustainability and Sustainability-linked bonds, including securitisation, as defined in Westpac's Sustainable Finance Framework. Carbon credit An emissions unit issued by a carbon crediting programme and represents an emission reduction or removal of greenhouse gases. Carbon credits are uniquely serialised, issued, tracked and cancelled by means of an electronic registry. Carbon capture and storage (CCS) A technology that captures carbon dioxide (CO2 ) emissions from industrial processes or power generation, transports it, and stores it to prevent its release into the atmosphere. Climate resilient bank Our ambition is to become a net-zero climate resilient bank which means working towards net-zero emissions across our operations and our lending while building resilience to the physical impacts of climate change. As defined by the AASB S2: A climate resilient entity has the capacity to adjust to climate-related changes, developments or uncertainties. It involves the capacity to manage climate-related risks and benefit from climate-related opportunities, including the ability to respond and adapt to climate-related transition risks and climate-related physical risks. The bank’s climate resilience includes both its strategic resilience and its operational resilience. CO2 Carbon dioxide. CO2-e Carbon dioxide equivalent. The amount of CO2 emission that would cause the same integrated radiative forcing or temperature change, over a given time horizon, as an emitted amount of a GHG or a mixture of GHGs. Source: IPCC, Special Report: Global Warming of 1.5°C, Annex I: Glossary (2018). TERM DEFINITION CSIRO Commonwealth Scientific and Industrial Research Organisation. Dairy Australia The national services body for the Australian dairy industry, funded by a combination of levies paid by dairy farmers and matching payments from the Commonwealth Government for eligible research and development (R&D) activities. Source: Dairy Australia (2023). Data quality score Reflects the level of uncertainty in the data inputs for financed emissions estimation using a scale of 1 to 5, with the lowest scores assigned to more accurate and specific company/property-level inputs while the highest scores are assigned to less specific inputs more reliant on assumptions and proxy data such as industry averages. Decarbonise The act of reducing greenhouse gas emissions compared to current state. It does not necessarily imply achieving zero greenhouse gas emissions. Diversified company Customer with operations across multiple segments which are subject to multiple financed emissions sector targets, where TCE >$100 million and when the segment reporting is available, and in scope segment revenue is >10% of total parent group revenues (except for thermal coal which is 5%). ESG Environmental, Social and Governance. EVIC Enterprise Value Including Cash is a measure of a company’s total value for the purposes of estimating Group financed emissions. Where available, EVIC is the company’s enterprise value based on total market capitalisation without deduction of cash or cash equivalents. Otherwise, and for setting financed emissions sector targets, EVIC is defined as Shareholder Funds + Total Debt. Facilitated emissions Facilitated emissions are emissions that are typically linked to capital markets activities such as syndicated lending or bond facilitation. While Westpac participates in these activities, they are not a material part of the Group or of our individual financed emissions sector targets and so they have not been calculated. Fat and protein corrected milk (FPCM) Standard used for comparing milk with different fat and protein contents, to allow better comparison between farms and regions, reducing the difference between breeds or feeding regimes. Sources: • Christie K. M., Gourley C. J. P., Rawnsley R. P., Eckard R. J., Awty I. M. (2012) Whole-farm systems analysis of Australian dairy farm greenhouse gas emissions. Animal Production Science 52, 998-1011; and, • Mancilla-Leyton, J.M., Morales-Jerrett, E., Delgado-Pertinez, M. & Mena, Y. (2021). “Fat- and protein corrected milk formulation to be used in the life-cycle assessment of Mediterranean dairy goat systems”. Livestock Science. 253, (1.4). WESTPAC 2025 SUSTAINABILITY REPORT |
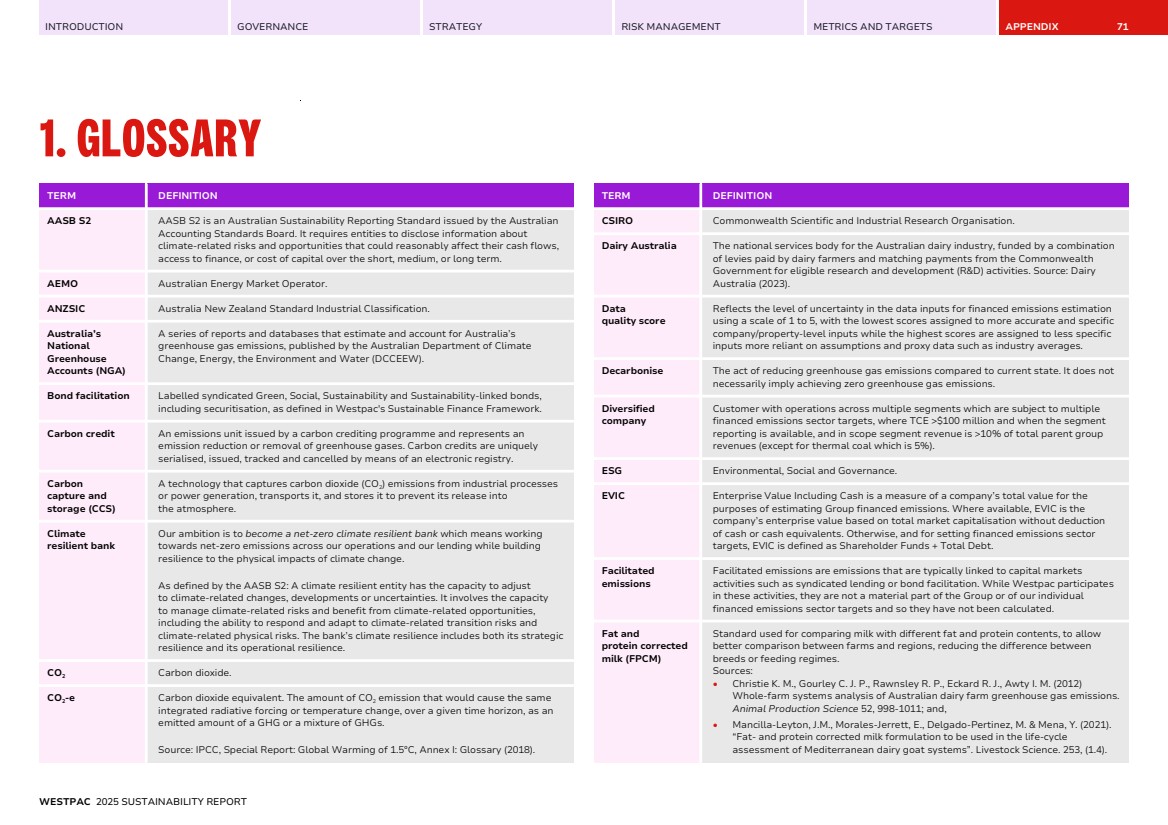
| INTRODUCTION GOVERNANCE STRATEGY RISK MANAGEMENT METRICS AND TARGETS APPENDIX 1. GLOSSARY 72 TERM DEFINITION Greenhouse gas (GHG) emissions For Westpac’s purposes, this includes the seven greenhouse gases listed in the Kyoto Protocol aggregated as CO2-equivalent, unless stated otherwise. IPCC Intergovernmental Panel on Climate Change. Labelled Sustainable Finance, bond facilitation Finance explicitly designated as supporting environmentally and socially sustainable activities through specific sustainability labels or certifications, as defined in industry standards, principles and guidance. Examples include principles issued by the International Capital Markets Association (ICMA) and Loan Market Association (LMA)/Asia Pacific Loan Market Association (APLMA)/Loan Syndication Trading Association (LSTA). Labelled sustainable lending also includes Westpac labelled products, whereby the programs have been assured or verified by an independent, external review provider as aligning with relevant industry standards, principles and guidance, and/or aligns with our Taxonomy Criteria, with any updates assured or verified within a reasonable timeframe. LGC Large-scale generation certificate. An LGC is a singular tradable certificate produced by an eligible large-scale renewable power station (such as a wind or solar farm). The certificate is representative of 1 megawatt-hour (MWh) of renewable electricity generated or displaced by the power station. MWh Megawatt-hour. NABERS National Australian Built Environment Rating System. Net-zero A state in which GHG emissions released into the atmosphere are balanced by an equivalent amount of GHG emissions removed from the atmosphere. NGER The National Greenhouse and Energy Reporting (NGER) scheme, established by the National Greenhouse and Energy Reporting Act 2007, is a single national framework for the reporting and dissemination of company information about location-based greenhouse gas emissions, energy production, and energy consumption in Australia. NGFS Network for Greening the Financial System. NZBA Net-Zero Banking Alliance. NZSIOC New Zealand Standard Industrial Output Categories. Oceania Dairy/Beef Commodity Land Management pathway, 2022 Refers to the regional (Oceania) and commodity specific (Dairy or Beef) Land Management emissions intensity data that underlies the SBTi FLAG tool. The pathways are from the IMAGE model presented by Smith, et al (2016). ‘Science-Based GHG Emissions Targets for Agriculture and Forest Commodities.’ University of Aberdeen, Ecofys, and PBL. PCAF Partnership for Carbon Accounting Financials. TERM DEFINITION PCAF Standard PCAF’s Global GHG Accounting and Reporting Standard: Part A – Financed Emissions 2nd edition. Physical risks As defined by the AASB S2: Climate-related physical risks resulting from climate change that can be event-driven (acute physical risk) or from longer-term shifts in climatic patterns (chronic physical risk). Acute physical risks arise from weather-related events such as storms, floods, drought or heatwaves, which are increasing in severity and frequency. Chronic physical risks arise from longer-term shifts in climatic patterns including changes in precipitation and temperature which could lead to sea level rise, reduced water availability, biodiversity loss and changes in soil productivity. These risks could carry financial implications for an entity, such as costs resulting from direct damage to assets or indirect effects of supply-chain disruption. The entity's financial performance could also be affected by changes in water availability, sourcing and quality; and extreme temperature changes affecting the entity's premises, operations, supply chains, transportation needs and employee health and safety. Representative concentration pathways (RCPs) A set of pathways developed by the Intergovernmental Panel on Climate Change (IPCC) that reflect different levels of emissions and greenhouse gas concentrations in the atmosphere. Higher concentration levels are associated with higher estimated global surface temperatures and therefore increased effects of climate change. They are expressed as RCPy, where ‘y’ refers to the level of radiative forcing (in watts per square metre, or W/m2 ) resulting from the scenario in the year 2100. • RCP2.6 – represents a stringent emissions reduction pathway that is likely to keep temperatures below 2°C by 2100; • RCP4.5 – represents an intermediate scenario where temperatures are likely to exceed 2°C by 2100; and • RCP8.5 – represents a higher emissions scenario where there are no additional efforts to constrain emissions. We use RCPs to assess the impact of physical risk under the various pathways. Our analysis is typically focused on the impact at 2050 under the relevant RCP. Analysis may include other time periods. Removals Activities with mitigation potential in the agriculture and forestry supply chain, including soil sequestration, agroforestry and biochar. Source: Science Based Targets Initiative (SBTi), Forest, Land and Agriculture (FLAG) Science-Based Target-Setting Guidance (2022). Renewable electricity Electricity derived from natural energy sources (for example, hydro, wind, solar) that are replenished at a higher rate than they are consumed. SAF Sustainable Aviation Fuel. WESTPAC 2025 SUSTAINABILITY REPORT |
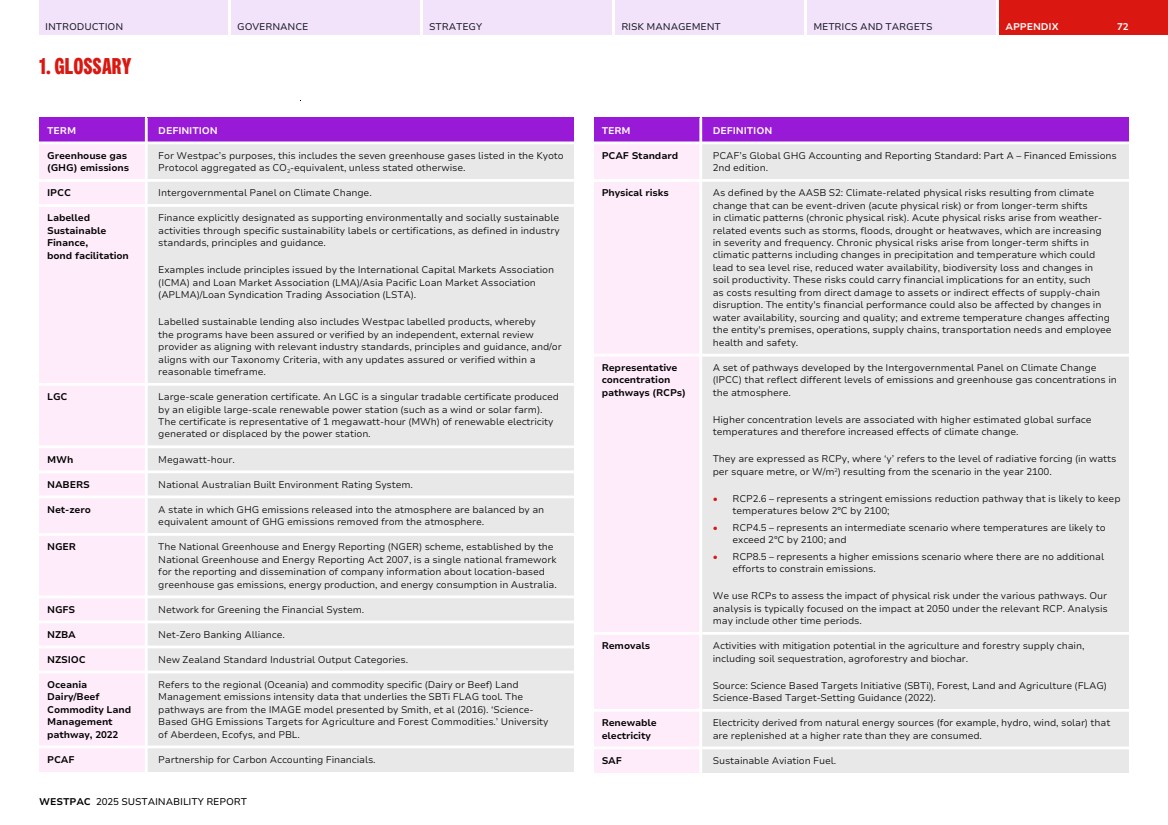
| INTRODUCTION GOVERNANCE STRATEGY RISK MANAGEMENT METRICS AND TARGETS APPENDIX 1. GLOSSARY 73 TERM DEFINITION Science Based Targets Initiative (SBTi) Forest, Land and Agriculture (FLAG) Provides a standard method to set science-based targets for FLAG sectors that include land-based emission reductions and removals. Source: Science Based Targets Initiative (SBTi), Forest, Land and Agriculture (FLAG) Science-Based Target-Setting Guidance (2022). Scope 1 and scope 2 operational emissions Scope 1 emissions are direct emissions that occur from sources that are owned or controlled by Westpac. Scope 2 emissions are our indirect emissions from the generation of purchased electricity consumed by Westpac. Scope 3 upstream emissions Scope 3 upstream emissions are indirect GHG emissions (not included in scope 2) that occur in Westpac’s upstream value chain. The Appendix section 'Methodology – Operational Emissions – Scope 1, 2 and Upstream Scope 3’ provides more detail on our calculation and the scope 3 upstream emissions categories included. Scope 3 financed emissions Scope 3 financed emissions are the indirect GHG emissions (not included in scope 2) associated with our financing activities. For Westpac, these are our share of the GHG emissions of our lending customers. Sustainable finance Transactions assessed pursuant to Westpac’s Sustainable Finance Framework (SFF) as qualifying for inclusion in our Sustainable Finance Targets. Sustainable Finance Framework Sets out how Westpac assesses, monitors, measures and reports on financing and facilitating sustainable activities. Uses our Sustainable Finance Taxonomy or industry standards, principles and guidance to classify Green, Transition, Social and Sustainability activities. Sustainable Finance Taxonomy The Westpac Sustainable Finance Taxonomy includes the Taxonomy Criteria for classifying Green, Transition and Social economic activities (refer to Westpac's Sustainable Finance Framework Appendix B – Summary – Taxonomy Criteria). For the purposes of Sustainable Finance, references to industry standards, principles and guidance refers to those listed in the Westpac 2024 SFF Appendix C – Key referenced national taxonomies, industry standards, principles and guidance. Total committed exposure (TCE) For financial reporting purposes, TCE is the sum of the committed portion of direct lending (including funds placement overall and deposits placed), contingent and pre-settlement risk plus the committed portion of secondary market trading and underwriting risk. For climate scenario analysis purposes, we refer to the same sources of TCE that flow into the financial reporting sources. When calculating Group financed emissions and the financed emissions sector targets we estimate our share of customers’ financed emissions. TERM DEFINITION • For certain institutional customers we use TCE to determine this share; this is detailed in our sector methodologies. For this purpose, TCE excludes secondary market trading and underwriting committed credit exposures; and • For certain WNZL customers, TCE includes all outstanding balances from business, commercial and institutional on-balance sheet lending, as well as undrawn commitments. It excludes merchant prepayment risk and pre-settlement risk exposures. When calculating Sustainable Finance targets, we need to identify the principal amounts of the sustainable lending and bond facilitation that meet our SFF. For certain institutional customers we use TCE or share of bond facilitation to determine this share. For this purpose, TCE excludes pre-settlement risk, secondary market trading and underwriting committed credit exposures. Transition risk As defined by the AASB S2: Climate-related transitions risks that arise from efforts to transition to a lower-carbon economy. Transition risks include policy, legal, technological, market and reputational risks. These risks could carry financial implications for an entity, such as increased operating costs or asset impairment due to new or amended climate-related regulations. The entity's financial performance could also be affected by shifting consumer demands and the development and deployment of new technology. UNEP United Nations Environment Programme. Unlabelled Sustainable Finance Finance that may not have a specific sustainability label or certification. In the context of Westpac 2024 SFF, such finance may still be considered as ‘sustainable’ as defined by our SFF and Taxonomy Criteria. WNZL Westpac New Zealand Limited. WESTPAC 2025 SUSTAINABILITY REPORT |
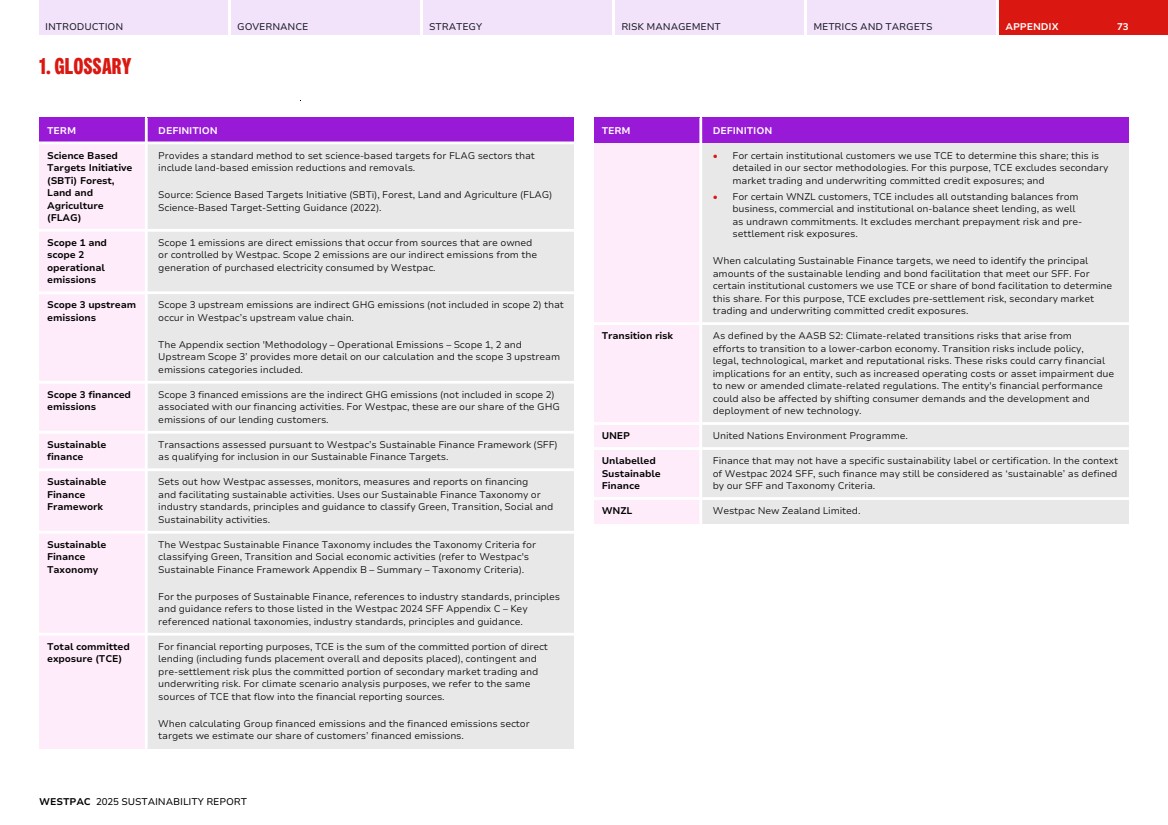
| INTRODUCTION GOVERNANCE STRATEGY RISK MANAGEMENT METRICS AND TARGETS APPENDIX 74 2. METHODOLOGY – OPERATIONAL EMISSIONS – SCOPE 1, 2 AND UPSTREAM SCOPE 3 Overview Organisational boundary We have applied the operational control approach to define our organisational boundary for our greenhouse gas emissions inventory. Emissions sources controlled by Westpac are included in our scope 1 and 2 emissions, and emissions from sources not controlled by Westpac are included in our scope 3 emissions. The operational control approach has been used as it provides consistency with other mandatory emissions reporting obligations outside of AASB S2 and NZ CS, such as the National Greenhouse and Energy Reporting (NGER) Act 2007. We define operational emissions as our scope 1, 2 and select upstream scope 3 emissions resulting from business operations. • Scope 1: direct emissions from combustion of fuels consumed at controlled facilities; • Scope 2: indirect emissions from the generation of purchased electricity consumed at controlled facilities; and • Upstream scope 3: indirect emissions related to selected sources in our upstream value chain, refer to inventory on page 87. Independent assurance We have obtained reasonable assurance over our operational scope 1, 2 and upstream scope 3 emissions estimates. Refer to the Independent Assurance Statement available in the Appendix section of this Report. Methodology Westpac does not directly measure emissions; instead, emissions are estimated using the formula: emissions = activity data x emissions factor. Australian scope 1 and 2 are calculated in accordance with the National Greenhouse and Energy Reporting Act 2007. Westpac’s remaining emissions are estimated with reference to the Greenhouse Gas Protocol (GHG Protocol). Westpac prioritises inputs based on data from specific activities within Westpac’s value chain (primary data), over industry averages or proxy data (secondary data). Changes in the measurement approach • Timing of data: Operational emissions are estimated based on 9 months of data relating to the current financial reporting period, and 3 months of the prior period; • The approach to estimating emissions from Australian hire cars and taxis was revised in FY25. Previously, emissions were derived by estimating kilometres travelled, either extrapolated from a single hire car provider using an average $/km rate, or calculated from taxi spend using State-based fare structures. These methods had limitations due to small sample sizes and pricing variability. To improve consistency, both hire car and taxi emissions are now calculated using a spend-based method; and • The approach to estimating emissions from New Zealand employee commuting was revised in FY25. Previously, emissions were calculated by multiplying the Australian employee commute emissions per FTE by the number of New Zealand FTEs. New Zealand employee commuting emissions are now calculated using HR data to estimate distances between employee home and work locations and assuming all commuting is by car. Limitations • Reliance on default emission factors which may not account for variation, for example, in fuel quality, electricity mix; • Reliance on supplier data; and • Emission calculations are based on latest available data which may not be aligned with the reporting period. Measurement uncertainty Understanding or quantifying the impact of uncertainty on an entity’s emissions inventory is subjective. To assess the level of uncertainty within our operational emissions inventory we have applied the following framework, developed with reference to the GHG Protocol's ‘Guidance for Calculating Measurement and Estimation Uncertainty for GHG Emissions’. TABLE 34: LEVELS OF MEASUREMENT UNCERTAINTY Measurement uncertainty Description Very low High confidence in data; based on direct measurements using calibrated instruments. Low Data from reliable sources; some reliance on assumptions. Moderate Estimated data; moderate reliance on assumptions. High Poor data quality; high reliance on assumptions. WESTPAC 2025 SUSTAINABILITY REPORT |
| INTRODUCTION GOVERNANCE STRATEGY RISK MANAGEMENT METRICS AND TARGETS APPENDIX 2. METHODOLOGY – OPERATIONAL EMISSIONS – SCOPE 1, 2 AND UPSTREAM SCOPE 3 75 Our approach to measuring scope 1 direct operational emissions Scope 1 emissions are direct greenhouse gas emissions from combustion of fuels consumed at controlled facilities. Measurement approach • Australian data is prepared in accordance with the National Greenhouse and Energy Reporting Act 2007 (NGER), using emission factors from the NGER Measurement Determination and Global Warming Potential (GWP) values from the NGER Regulations. • New Zealand data is prepared in accordance with: – the New Zealand Ministry for the Environment guidance for GHG reporting and Toitū net carbonzero programme rules, using emission factors from the Ministry for the Environment Summary of Emissions Factors, which uses the GWPs published in the IPCC Fifth Assessment Report (AR5); – the Aotearoa New Zealand Climate Standards (NZ CS): NZ CS 1 Climate Related Disclosures (NZ CS1), NZ CS 2 Adoption of Aotearoa New Zealand Climate Standards (NZ CS2), and NZ CS 3 General Requirements for Climate-related Disclosures (NZ CS3); and – the Greenhouse Gas Protocol: A Corporate Accounting and Reporting Standard (revised edition). • Other international data is prepared with reference to the GHG Protocol, using emission factors from the NGER Measurement Determination. Westpac’s use of inputs is considered appropriate and accurately represents our operational activities for the following reasons: • Activity data inputs are sourced from primary records, including utility invoices, supplier records and Westpac’s internal documents; and • Emission factor inputs are taken from secondary sources provided by government authorities. Westpac’s use of assumptions is considered appropriate for the following reasons: • To address data gaps, we utilise partial data and extrapolate it using a weighted average method to represent the entire activity; and • The approach of extrapolating data for the final three months of the financial reporting year (July to September) using activity data from the prior period is considered an appropriate proxy for the current reporting period. If significant events impacting greenhouse gas emissions metrics are identified before publication, Westpac will provide qualitative disclosures to ensure transparency for report users. The impact of these significant events will be reflected in the subsequent reporting period. TABLE 35: AUSTRALIAN SCOPE 1 DIRECT OPERATIONAL EMISSIONS BY CATEGORY (TCO2-E) CATEGORY BOUNDARY METHODOLOGY INPUTS (ACTIVITY DATA AND EMISSION FACTORS) ASSUMPTIONS Stationary combustion – Natural gas and diesel Combustion of fuels (natural gas and diesel) for stationary purposes at sites under Westpac operational control. • Emissions are estimated by multiplying the quantity of fuel used by the relevant energy content factor and emission factor; • NGER Method 1; • Average-data method; and • Low measurement uncertainty. • Invoice records – natural gas consumption; • Fuel delivery records – diesel consumption; and • Emission factors sourced from the NGER Measurement Determination. • Where natural gas invoices are not available at the time of reporting data is estimated using a weighted average method. Transport combustion – Fleet fuels Combustion of fuels (diesel, petrol, ethanol) for transport purposes in fleet vehicles under Westpac operational control. • Emissions are estimated by multiplying the quantity of fuel used by the relevant energy content factor and emission factor; • NGER Method 1; • Average-data method; and • Low measurement uncertainty. • Supplier records – fleet fuel transaction report; and • Emission factors sourced from the NGER Measurement Determination • Reliance on supplier data. Refrigerants Refrigerants used in commercial air conditioning units at sites under Westpac operational control. • Emissions are estimated by multiplying the refrigerant mass (kg) with the relevant Global Warming Potential (GWP) value and leakage rate; • NGER Method 1; • Average-data method; and • Moderate measurement uncertainty. • Internal refrigerant register – refrigerant mass (kg) and gas type as per equipment nameplate; and • GWP value sourced from the NGER Regulations. • Leakage rate is determined based on the type of equipment and synthetic gas. However, default leakage rate may not reflect actual losses. WESTPAC 2025 SUSTAINABILITY REPORT |
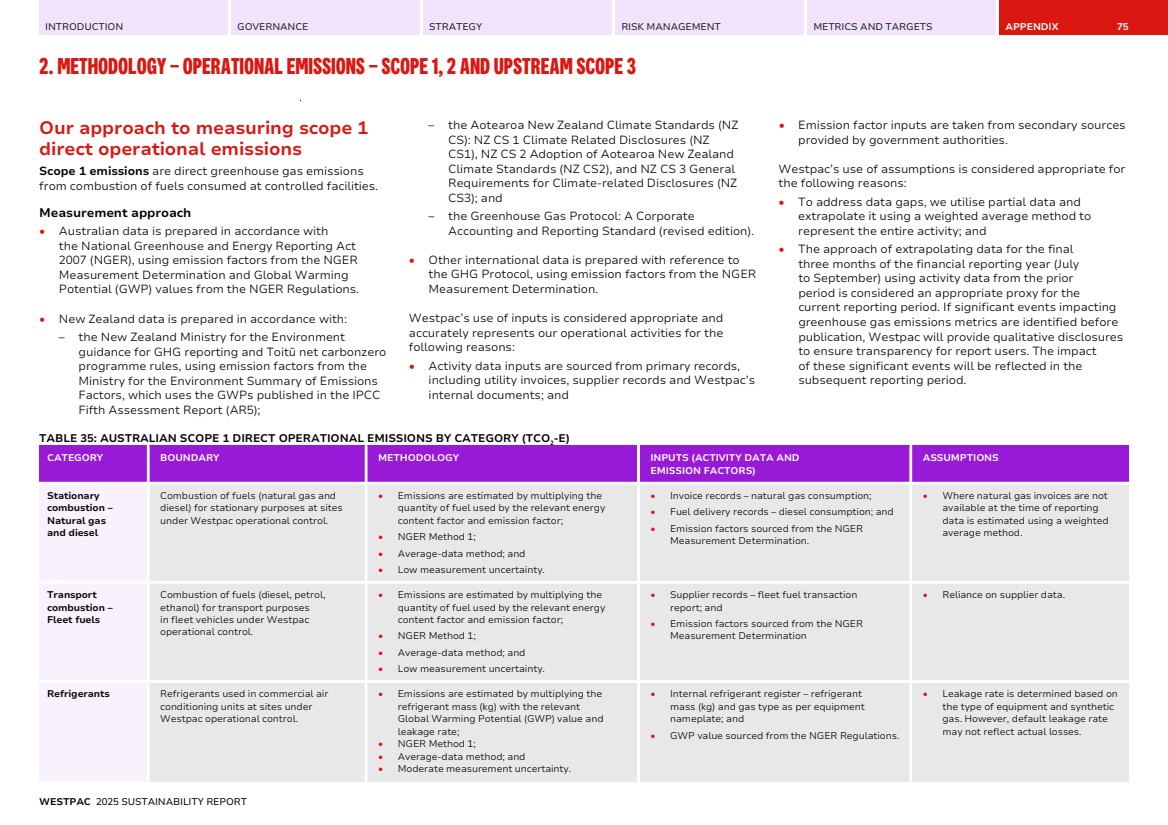
| INTRODUCTION GOVERNANCE STRATEGY RISK MANAGEMENT METRICS AND TARGETS APPENDIX 2. METHODOLOGY – OPERATIONAL EMISSIONS – SCOPE 1, 2 AND UPSTREAM SCOPE 3 76 TABLE 36: NEW ZEALAND SCOPE 1 DIRECT OPERATIONAL EMISSIONS BY CATEGORY (TCO2-E) CATEGORY BOUNDARY METHODOLOGY INPUTS (ACTIVITY DATA AND EMISSION FACTORS) ASSUMPTIONS Stationary combustion – Natural gas, LPG and diesel Combustion of fuels (natural gas, LPG and diesel) for stationary purposes at sites under Westpac operational control. • Emissions are estimated by multiplying the quantity of fuel used by the relevant energy content factor and emission factor; • Average-data method; and • Low measurement uncertainty. • Invoice records – natural gas & LPG consumption; • Fuel delivery records – diesel consumption; and • Emission factors sourced from the Ministry for the Environment Summary of Emission factors. • Where natural gas and LPG invoices are not available at the time of reporting, data is estimated based on historical use. Transport combustion – Fleet fuels Combustion of fuels (diesel and petrol) for transport purposes in fleet vehicles under Westpac operational control. • Emissions are estimated by multiplying the quantity of fuel used by the relevant energy content factor and emission factor; • Average-data method; and • Low measurement uncertainty. • Supplier records – fleet fuel transaction report; and • Emission factors sourced from the Ministry for the Environment Summary of Emission factors. • Reliance on supplier data. Refrigerants Refrigerants used in commercial air conditioning units and refrigeration units at sites under Westpac operational control. • Emissions are estimated by multiplying the refrigerant mass (kg) with the leakage rate and emission factor; • Average-data method; and • Moderate measurement uncertainty. • Supplier refrigerant asset register – refrigerant mass (kg) and gas type as per equipment nameplate; and • Emission factors sourced from the Ministry for the Environment Summary of Emission factors. • Leakage rate is determined based on the size of equipment and type of refrigerant. Default leakage rate may not reflect actual losses. For scope 1 emissions, other international operations include Westpac sites located in Fiji, Papua New Guinea (PNG) and the United Kingdom (UK). TABLE 37: OTHER INTERNATIONAL SCOPE 1 DIRECT OPERATIONAL EMISSIONS BY CATEGORY (TCO2-E) CATEGORY BOUNDARY METHODOLOGY INPUTS (ACTIVITY DATA AND EMISSION FACTORS) ASSUMPTIONS Stationary combustion – Natural gas and diesel Combustion of fuels (natural gas and diesel) for stationary purposes at sites under Westpac operational control. • Emissions are estimated by multiplying the quantity of fuel used by the relevant energy content factor and emission factor; • Average-data method; and • Moderate measurement uncertainty. • Landlord records – natural gas expenditure (UK); • General ledger records – diesel expenditure, quantity of drums (PNG); and • Emission factors sourced from the NGER Measurement Determination. • For UK, quantity of natural gas (MJ) is estimated by multiplying the building gas expenditure, adjusted for Westpac’s tenancy share, by the average gas unit price published by Ofgem (UK energy regulator); and • For PNG, quantity of diesel fuel (L) is estimated by multiplying expenditure by the number and size of delivered fuel drums. Transport combustion – Fleet fuels Combustion of fuels (diesel and petrol) for transport purposes in fleet vehicles under Westpac operational control. • Emissions are estimated by multiplying the quantity of fuel used by the relevant energy content factor and emission factor; • Average-data method; and • Moderate measurement uncertainty. • Supplier records – fleet fuel consumption (PNG and Fiji); and • Emission factors sourced from the NGER Measurement Determination. • Reliance on supplier data. WESTPAC 2025 SUSTAINABILITY REPORT |
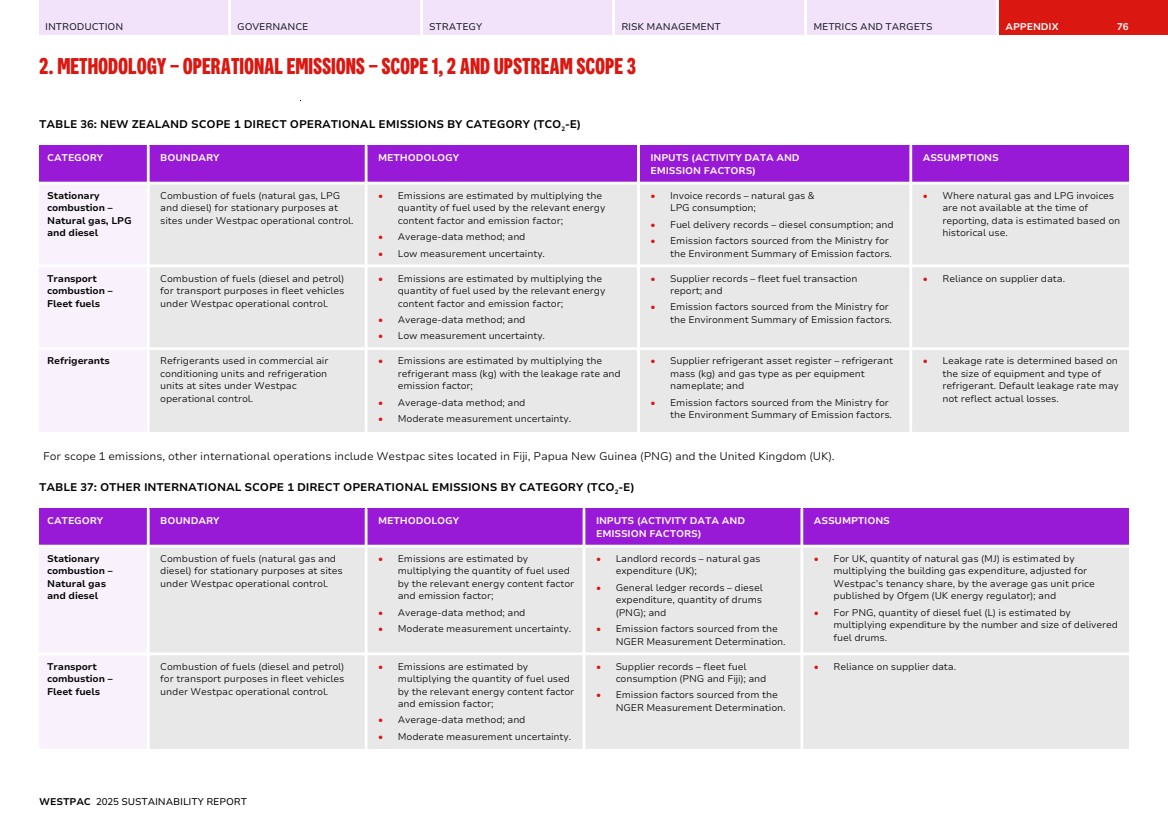
| INTRODUCTION GOVERNANCE STRATEGY RISK MANAGEMENT METRICS AND TARGETS APPENDIX 2. METHODOLOGY – OPERATIONAL EMISSIONS – SCOPE 1, 2 AND UPSTREAM SCOPE 3 77 Our approach to measuring scope 2 indirect operational emissions Scope 2 emissions are indirect greenhouse gas emissions from the generation of purchased electricity consumed at controlled facilities. Scope 2 greenhouse gas emissions physically occur at the facility where electricity is generated. Measurement approach • Australian data is prepared in accordance with the National Greenhouse and Energy Reporting Act 2007 (NGER), using emission factors from the NGER Measurement Determination (location-based) and National Greenhouse Account Factors (NGAF) (market-based). • New Zealand data is prepared in accordance with: – the New Zealand Ministry for the Environment guidance for GHG reporting and Toitū net carbonzero programme rules, using emission factors from the Ministry for the Environment Summary of Emissions Factors (location-based), which uses the GWPs published in the IPCC Fifth Assessment Report (AR5), and BraveTrace (market-based); – the Aotearoa New Zealand Climate Standards (NZ CS): NZ CS 1, NZ CS 2, and NZ CS 3; and – the Greenhouse Gas Protocol: A Corporate Accounting and Reporting Standard (revised edition) and the Greenhouse Gas Protocol: GHG Protocol Scope 2 Guidance: An amendment to the GHG Protocol Corporate Standard. • Other international data is prepared with reference to the GHG Protocol, using emission factors from the International Energy Agency, UK Government GHG Conversion Factors for Company Reporting, and US EPA Emissions & Generation Resource Integrated Database (eGRID). For market-based accounting, in regions where no residual mix factor is available the location-based emission factors are applied. Our use of inputs is considered appropriate and accurately represents our operational activities as: • Activity data inputs are sourced from primary records, including utility invoices; and • Emission factor inputs are taken from secondary sources provided by government authorities. Our use of assumptions is considered appropriate for the following reasons: • To address data gaps, we utilise partial data and extrapolate it using a weighted average method to represent the entire activity; and • The approach of extrapolating data for the final three months of the financial reporting year (July to September) using activity data from the prior period is considered an appropriate proxy for the current reporting period. If significant events impacting greenhouse gas emissions metrics are identified before publication, Westpac will provide qualitative disclosures to ensure transparency for report users. The impact of these significant events will be reflected in the subsequent reporting period. TABLE 38: AUSTRALIAN SCOPE 2 INDIRECT OPERATIONAL EMISSIONS BY CATEGORY (TCO2-E) CATEGORY BOUNDARY METHODOLOGY INPUTS ASSUMPTIONS Purchased electricity – Location-based Electricity consumption at sites under Westpac operational control. • Emissions are estimated by multiplying the quantity of purchased electricity consumed by the applicable grid-average emission factor; • Location-based method; and • Moderate measurement uncertainty. • Invoice records – electricity consumption. • Emission factors sourced from the NGER Measurement Determination. • Where invoices are not available at reporting, data is estimated using the seasonally adjusted weighted average method; • Where invoices are not received for a site, data is estimated using an average intensity (kWh/m2 ) for similar properties; and • Average grid emission factors may not reflect actual energy mix. Purchased electricity – Market-based Electricity consumption at sites under Westpac operational control. • Non-renewable electricity is determined by subtracting the quantity of renewable electricity certificates surrendered from the total electricity consumed; • Emissions are then calculated by multiplying the non-renewable electricity by the residual mix factor; • The residual mix factor is derived from the relevant national location-based scope 2 emission factor, adjusted to exclude the emissions benefit of all claimable renewable generation in the grid; • Market-based method; and • Moderate measurement uncertainty. • Invoice records – electricity consumption; • Energy attribute certificate (EAC) records – number of renewable electricity certificates surrendered; and • Emission factors from NGAF. • Where invoices are not available at reporting, data is estimated using the seasonally adjusted weighted average method; and • Where invoices are not received for a site, data is estimated using an average intensity (kWh/m2 ) for similar properties. WESTPAC 2025 SUSTAINABILITY REPORT |
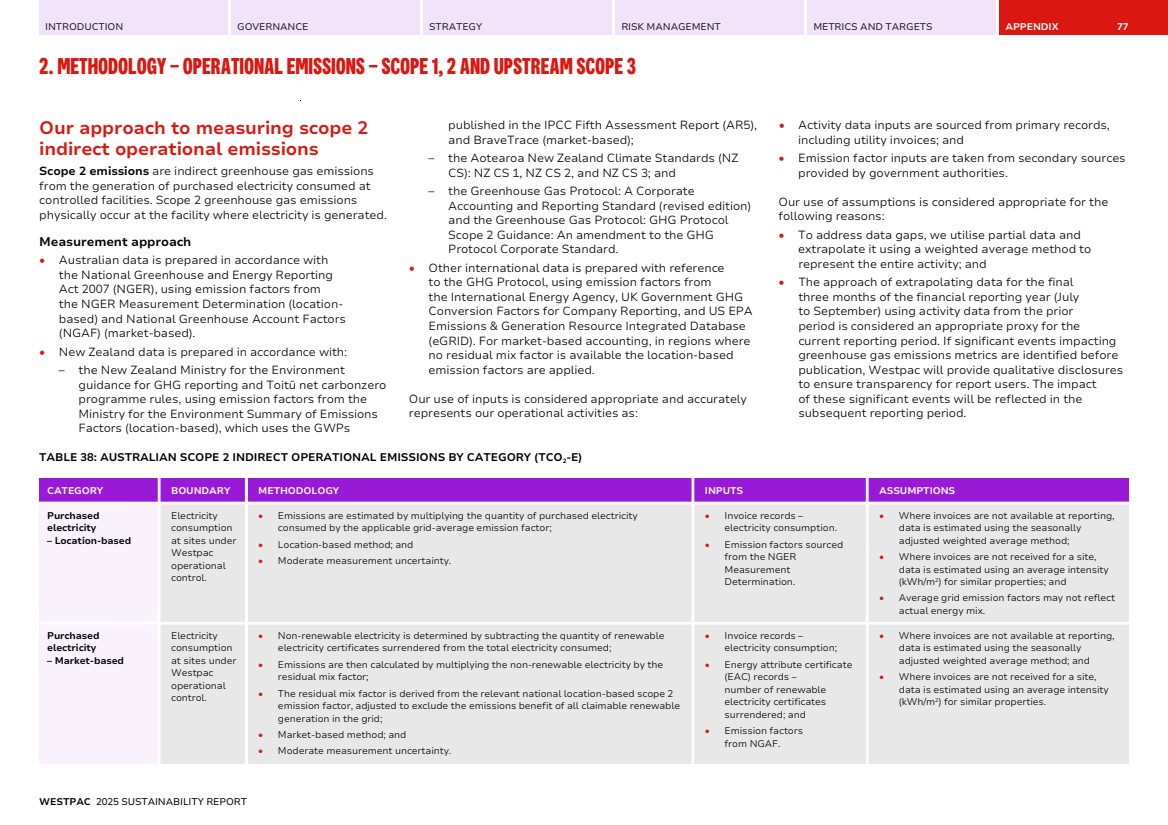
| INTRODUCTION GOVERNANCE STRATEGY RISK MANAGEMENT METRICS AND TARGETS APPENDIX 2. METHODOLOGY – OPERATIONAL EMISSIONS – SCOPE 1, 2 AND UPSTREAM SCOPE 3 78 TABLE 39: NEW ZEALAND SCOPE 2 INDIRECT OPERATIONAL EMISSIONS BY CATEGORY (TCO2-E) CATEGORY BOUNDARY METHODOLOGY INPUTS ASSUMPTIONS Purchased electricity – Location-based Electricity consumption at sites under Westpac operational control. • Emissions are estimated by multiplying the quantity of purchased electricity consumed by the applicable grid-average emission factor; • Location-based method; and • Moderate measurement uncertainty. • Invoice records – electricity consumption; • Review – quarterly for unmetered ATMs and standalone sites; and • Emission factors sourced from the Ministry for the Environment Summary of Emission factors. • Where electricity invoices are not available at the time of reporting, data is estimated based on historical use; • Where electricity from ATM use is not metered, data is estimated based on a metered ATM; • Where a site is not standalone, electricity use is assessed against standalone sites using average intensities (kWh/m2 ). A top up of estimated electricity consumed is based on the difference in actual Energy Use Intensity (EUI) and the average intensity assigned to a site based on several factors such as days and hours of operation; and • Average grid emission factors may not reflect actual energy mix. Purchased electricity – Market-based Electricity consumption at sites under Westpac operational control. • Non-renewable electricity is determined by subtracting the quantity of renewable electricity certificates surrendered from the total electricity consumed; • Emissions are then calculated by multiplying the non-renewable electricity by the residual mix factor; • The residual mix factor is from the relevant national location-based scope 2 emission factor, adjusted to exclude the emissions benefit of all claimable renewable generation in the grid; • Market-based method; and • Moderate measurement uncertainty. • Invoice records – electricity consumption; • Energy attribute certificate (EAC) records – number of renewable electricity certificates surrendered; and • Emission factors BraveTrace. Annual Production Year Report: Including Residual Supply Mix (RSM) for New Zealand. • Where electricity invoices are not available at the time of reporting, data is estimated based on historical use; • Where electricity from ATM use is not metered, data is estimated based on a metered ATM; and • Where a site is not standalone, electricity use is assessed against standalone sites using average intensities (kWh/m2 ). A top up of estimated electricity consumed is based on the difference in actual EUI and the average intensity assigned to a site based on several factors such as days and hours of operation. WESTPAC 2025 SUSTAINABILITY REPORT |
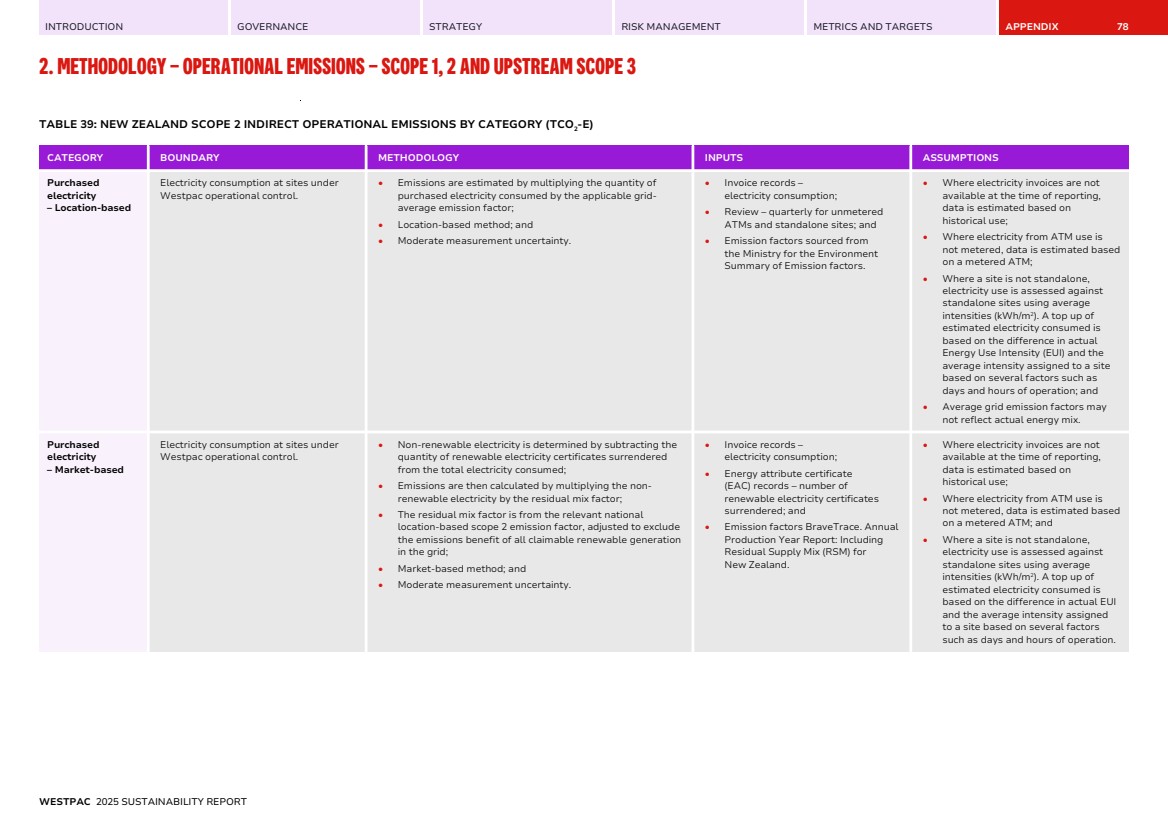
| INTRODUCTION GOVERNANCE STRATEGY RISK MANAGEMENT METRICS AND TARGETS APPENDIX 2. METHODOLOGY – OPERATIONAL EMISSIONS – SCOPE 1, 2 AND UPSTREAM SCOPE 3 79 For scope 2 emissions, other international operations include Westpac sites located in Fiji, PNG, Singapore, UK, United States (US), China and Germany. TABLE 40: OTHER INTERNATIONAL SCOPE 2 INDIRECT OPERATIONAL EMISSIONS BY CATEGORY (TCO2-E) CATEGORY BOUNDARY METHODOLOGY INPUTS ASSUMPTIONS Purchased electricity – Location-based Electricity consumption at sites under Westpac operational control. • Emissions are estimated by multiplying the quantity of purchased electricity consumed by the applicable grid-average emission factor; • Location-based method; and • High measurement uncertainty. • General ledger records – electricity expenditure (PNG); • Invoice records – electricity consumption (Fiji, Singapore, UK, China, Germany, US); and • Emission factors sourced from UK Government GHG Conversion Factors for Company Reporting for the UK, US Environmental Protection Agency (EPA) publishes the eGRID database for the US and International Energy Agency (IEA) for all other locations. • For PNG, quantity of purchased electricity (kWh) is estimated by multiplying expenditure by an electricity unit price provided by the energy retailer; and • Average grid emission factors may not reflect actual energy mix. Purchased electricity – Market-based Electricity consumption at sites under Westpac operational control. • Non-renewable electricity is determined by subtracting the quantity of renewable electricity certificates surrendered from the total electricity consumed; • Emissions are then calculated by multiplying the non-renewable electricity by the residual mix factor; • The residual mix factor is derived from the relevant national location-based scope 2 emission factor, adjusted to exclude the emissions benefit of all claimable renewable generation in the grid; • Market-based method; and • High measurement uncertainty. • General ledger records – electricity expenditure (PNG); • Invoice records – electricity consumption (Fiji, Singapore, UK, China, Germany, US); • Energy attribute certificate (EAC) records – number of renewable electricity certificates surrendered; and • Emission factors sourced from IEA. • For PNG, quantity of purchased electricity (kWh) is estimated by multiplying expenditure by an electricity unit price; and • For PNG and Fiji, residual mix factors are not available so relevant location-based emission factors are applied. WESTPAC 2025 SUSTAINABILITY REPORT |
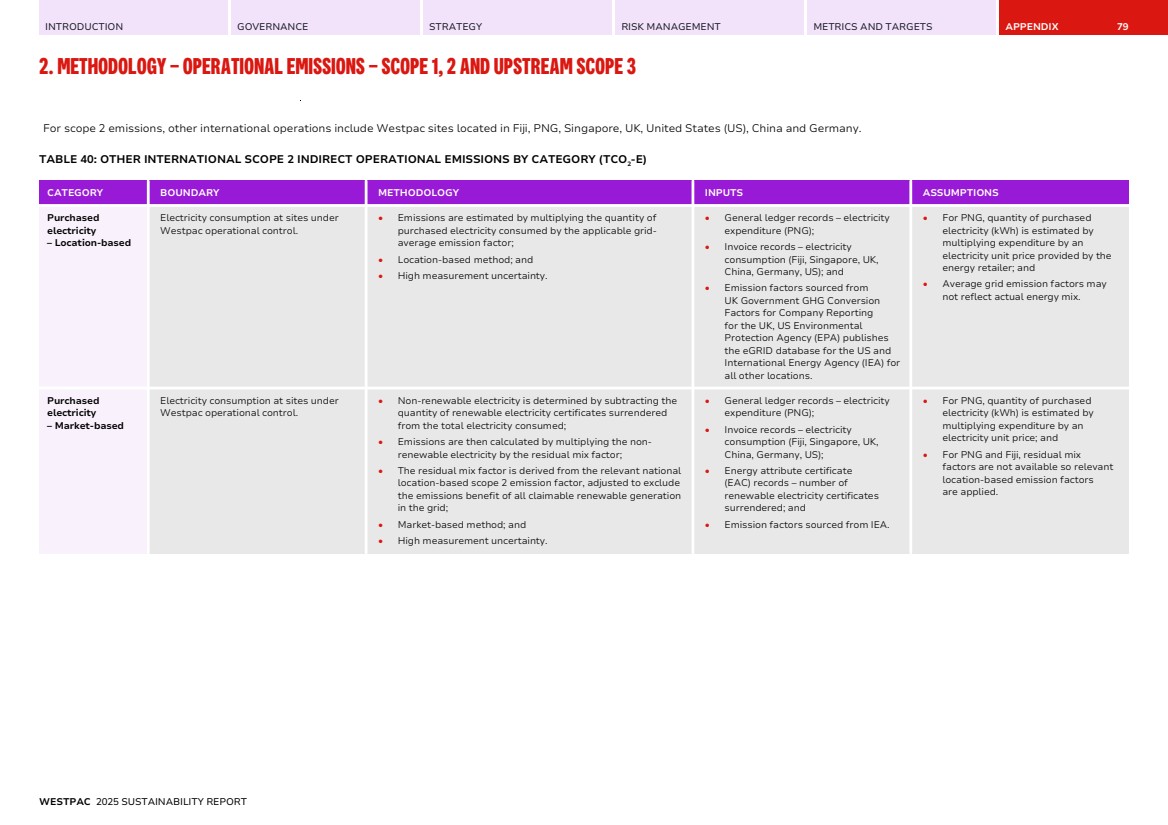
| INTRODUCTION GOVERNANCE STRATEGY RISK MANAGEMENT METRICS AND TARGETS APPENDIX 2. METHODOLOGY – OPERATIONAL EMISSIONS – SCOPE 1, 2 AND UPSTREAM SCOPE 3 80 Our approach to measuring upstream scope 3 indirect emissions Upstream scope 3 emissions are indirect greenhouse gas emissions (not included in scope 2 greenhouse gas emissions) that occur in Westpac’s upstream value chain. Measurement approach • Australian data is prepared with reference to the GHG Protocol: Corporate Value Chain (Scope 3) Accounting and Reporting Standard, using emission factors from a variety of sources including, NGAF, UK Government GHG Conversion Factors for Company Reporting and supplier-specific factors; • New Zealand data is prepared in accordance with the New Zealand Ministry for the Environment guidance for GHG reporting and Toitū net carbonzero programme rules, using emission factors from the Ministry for the Environment Summary of Emissions Factors (which uses the GWPs published in the IPCC Fifth Assessment Report (AR5)) and for paper use, the UK Department for Business, Energy and Industrial Strategy. Government greenhouse gas conversion factors for company reporting (DESNZ 2024 & DESNZ 2025), using the GWPs published in the AR5 and NXP Carbon Reduction Certificate issued by the Carbon Reduction Institute under their NoCO2 Certification Program (23rd May 2025); and • Other international data is estimated by multiplying the Australian emissions per full-time equivalent (FTE) employee by the number of FTEs at the Group’s other International sites. Westpac’s use of inputs is considered appropriate and accurately represents our operational activities for the following reasons: • Activity data inputs are sourced from primary records; and • Emission factor inputs are sourced from: – Primary sources, including supplier-specific emissions data, where available, and – Secondary sources, such as government-published emission factors (e.g., NGAF, UK GHG Conversion Factors), when primary data is unavailable. Westpac’s use of assumptions is considered appropriate for the following reasons: • To address data gaps, we utilise partial data and extrapolate it using a weighted average method to represent the entire activity; and • The approach of extrapolating data for the final three months of the financial reporting year (July to September) using activity data from the prior period is considered an appropriate proxy for the current reporting period. If significant events impacting greenhouse gas emissions metrics are identified before publication, Westpac will provide qualitative disclosures to ensure transparency for report users. The impact of these significant events will be reflected in the subsequent reporting period. TABLE 41: AUSTRALIAN UPSTREAM SCOPE 3 INDIRECT EMISSIONS BY CATEGORY (TCO2-E) CATEGORY BOUNDARY METHODOLOGY INPUTS ASSUMPTIONS Category 1: Purchased goods and services • Production of goods and services purchased by Westpac, specifically electricity (third party), paper and water consumption; and • All other purchased goods and services are excluded. • Location-based and market-based methods (electricity); • Average-data method (paper and water); and • Moderate measurement uncertainty. • Invoice records – data centre electricity and water; and • Supplier records – ATM electricity and paper reports. • Reliance on supplier data. • Electricity consumption from third party data centres and ATMs. • Emissions are estimated by multiplying the quantity of purchased electricity consumed by the applicable grid-average emission factor. • Emission factors sourced from NGAF. • Third party data centre electricity is based on invoices and apportioned by the supplier to Westpac; and • Third party ATM electricity data is estimated based on average ATM usage per day by machine type multiplied by days the ATM was operational and apportioned by the supplier to Westpac. • Paper (copy paper and other paper items (e.g., statements)) purchased through key suppliers. • Emissions are estimated by multiplying the weight of paper consumed by the applicable emission factor. • Emission factors sourced from UK Government GHG Conversion Factors for Company Reporting. • Paper weight is estimated by suppliers based on product dimensions multiplied by product grams per square metre. WESTPAC 2025 SUSTAINABILITY REPORT |
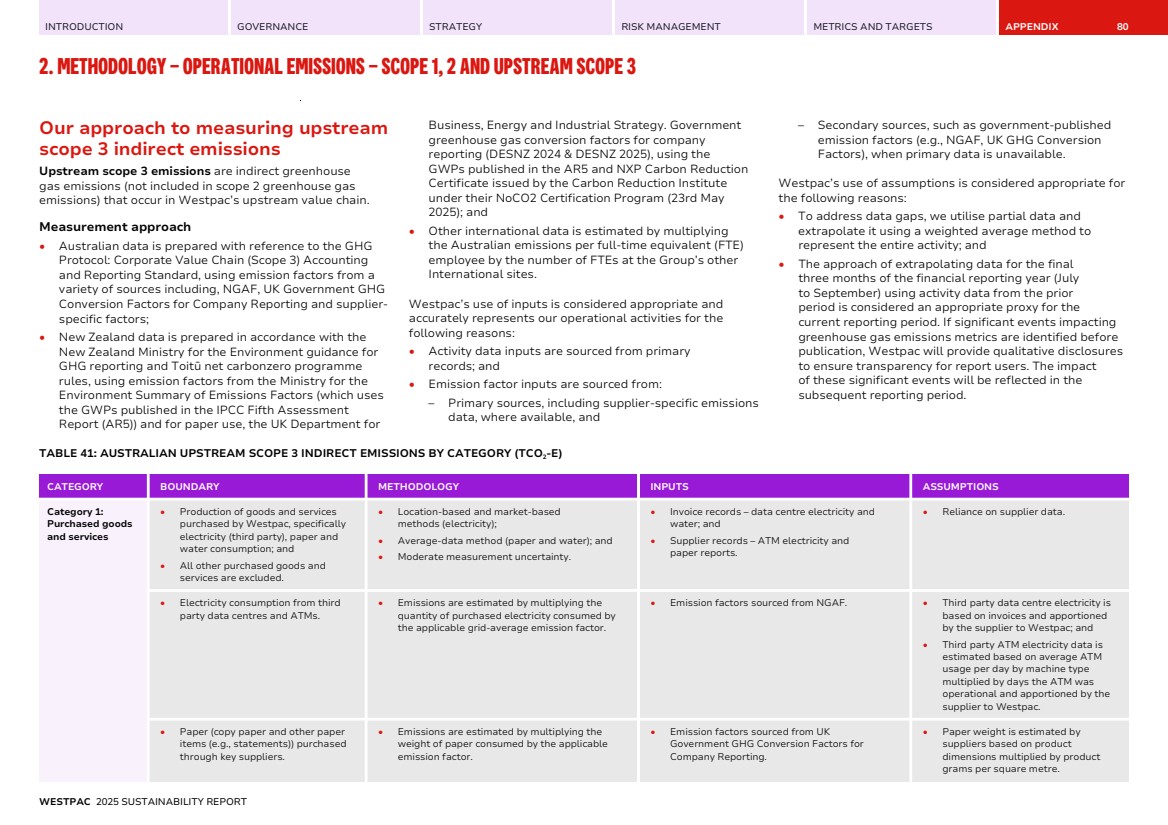
| INTRODUCTION GOVERNANCE STRATEGY RISK MANAGEMENT METRICS AND TARGETS APPENDIX 2. METHODOLOGY – OPERATIONAL EMISSIONS – SCOPE 1, 2 AND UPSTREAM SCOPE 3 81 CATEGORY BOUNDARY METHODOLOGY INPUTS ASSUMPTIONS • Water consumption at sites under Westpac operational control (Australia only). • Emissions are estimated by multiplying the volume of water consumed by the region-specific emission factor. • Emission factors sourced from the Australian National Life Cycle Inventory Database. • Where water invoices are not available at the time of reporting data is estimated using a weighted average method; and • Where water invoices are not received for a site data is estimated using an average intensity (kL/m2 ) for similar properties. Category 3: Fuel and energy related activities • All upstream (cradle-to-gate) emissions related to the production of fuels and electricity purchased and consumed by Westpac (not included in scope 1 or scope 2) and third party data centres and ATMs. • Emissions are estimated by multiplying the quantity of fuel used (converted to GJ) or purchased electricity consumed by the relevant and emission factor; • Average-data method (fuels); • Location-based and market-based methods (electricity); and • Low measurement uncertainty. • Invoice records – natural gas, diesel, electricity; and • Emission factors sourced from NGAF. • Where electricity and natural gas invoices are not available at the time of reporting data is estimated using a weighted average method; and • Where electricity invoices are not received for a site data is estimated using an average intensity (kWh/m2 ) for similar properties. Category 4: Upstream transportation and distribution • Transportation and distribution services between sites under Westpac operational control (e.g., cheque) (in vehicles not owned or controlled by Westpac); and • Excludes transport of cash and customer mailouts. • Emissions are estimated by multiplying the number of deliveries by the supplier emission factor; • Supplier-specific method; and • Moderate measurement uncertainty. • Supplier records – type and number of deliveries; and • Emission factors are specific to type of delivery as provided by Australia Post. • Reliance on supplier data. Category 5: Waste generated in operations • Third-party disposal and treatment of waste generated at sites under Westpac operational control; and • Excludes emissions from transportation to waste facilities, construction waste and wastewater. • Emissions are estimated by multiplying the mass of waste by the relevant emission factor; • Average-data method; • Emissions from recycled waste are not included in Westpac’s inventory. Emissions from recycling are attributed to the user of the recycled materials, not the producer of the waste, in line with GHG Protocol; • Recycled content method; and • High measurement uncertainty. • Supplier records – mass of solid waste disposed in landfill; • Waste audit records – sample of retail site waste audits; and • Emission factors for commercial and industrial landfill waste are sourced from NGAF. • Where records are not available for a corporate site, waste data is estimated based on average waste per employee attendance (tonnes/ FTE) for similar properties; • Waste data is estimated for retail sites based on representative waste audits and extrapolated using employee attendance; and • Westpac has excluded emissions from wastewater treatment as the financial services industry is not identified as a sector with significant wastewater emissions. Category 6: Business travel • Transportation of employees for business related activities. • Distance-based method (air travel); • Average data method (hotels); • Spend-based method (taxi and rental cars); and • Moderate measurement uncertainty. • Supplier and accounts payable records (see below). • Reliance on supplier data. WESTPAC 2025 SUSTAINABILITY REPORT |
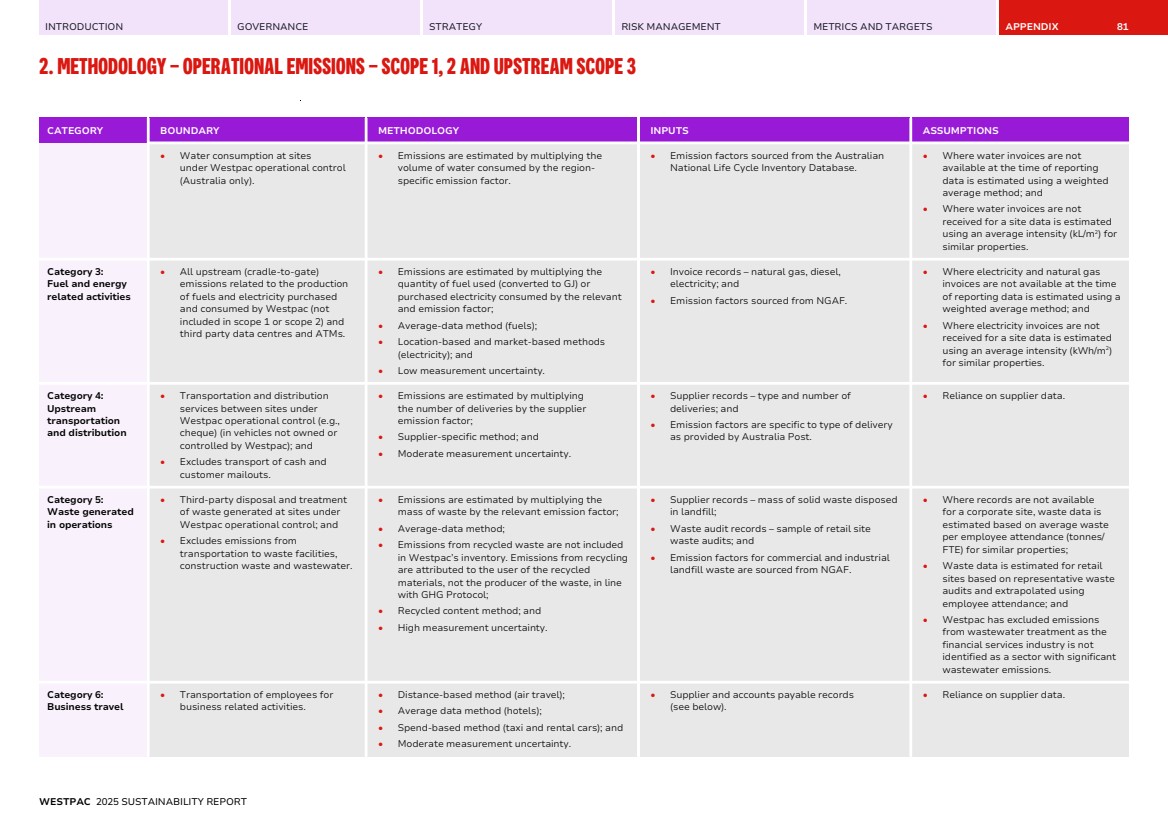
| INTRODUCTION GOVERNANCE STRATEGY RISK MANAGEMENT METRICS AND TARGETS APPENDIX 2. METHODOLOGY – OPERATIONAL EMISSIONS – SCOPE 1, 2 AND UPSTREAM SCOPE 3 82 CATEGORY BOUNDARY METHODOLOGY INPUTS ASSUMPTIONS • Combustion of fuels for air travel. • Air travel emissions are estimated by multiplying distance travelled by the relevant emission factor (including radiative forcing and well-to-tank factors). • Supplier records – passenger kilometres, ticket class; and • Emission factors sourced from the UK Government GHG Conversion Factors for Company Reporting – air travel. • Air travel distance as calculated by our travel management provider. • Business travel accommodation use. • Hotel emissions are estimated by multiplying the number of nights by the relevant emission factor. • Supplier records – number of nights; and • Emission factors sourced from the Cornell Hotel Sustainability Benchmarking Index (CHSBI) – hotel nights. • CHSBI measure 1 selected relates to a median carbon footprint non-resort type accommodation. • Combustion of fuels for land travel. • Taxi and rental car travel emissions are estimated by multiplying spend by industry average emission factor. • Accounts payable/general ledger – spend on taxi and rental cars; and • Emission factors sourced from FootprintLab, in partnership with IELab. • Business travel by public transport modes has been assessed as immaterial and not accounted for in Westpac’s inventory; and • Business travel in employee-owned vehicles is deemed immaterial. Category 7: Employee commuting • Employees commuting and working from home. • Average-data method; and • High measurement uncertainty. • HR records – number of FTE; and • Number of working days at home or office/retail site – turnstile data (corporate sites) or business assumptions (retail sites). • Number of working days per year – assumed FTEs work 5 days per week for 48 weeks per year, this accounts for public holidays and 4 weeks annual leave = 240 days; and • FTE split between commuting and working from home – Assumed that if an employee is not working in a corporate site, they are working from home; and – Assumed all retail employees attend a Westpac retail site. • Employees commuting between their homes and their worksites. • Estimated by multiplying the number of employees by the number of commute days per year by distance travelled by transport mode. • Average distance travelled by mode of transport is sourced from Australian Bureau of Statistics 2016 Census; and • Emission factors are sourced from the UK Government GHG Conversion Factors for Company Reporting. • Transport mode and distances are based on average national commuting pattern data. • Employees working from home. • Estimated from electricity and fuel usage associated with equipment (laptops and monitors), lighting and heating or cooling. • Emission factors are sourced from NGAF. • Assumed majority of staff use heating/cooling, all staff use a laptop, a monitor, and light their home workspace which results in an increase in energy consumption for 8 hours per day; and • Assumed no renewable electricity is used. WESTPAC 2025 SUSTAINABILITY REPORT |
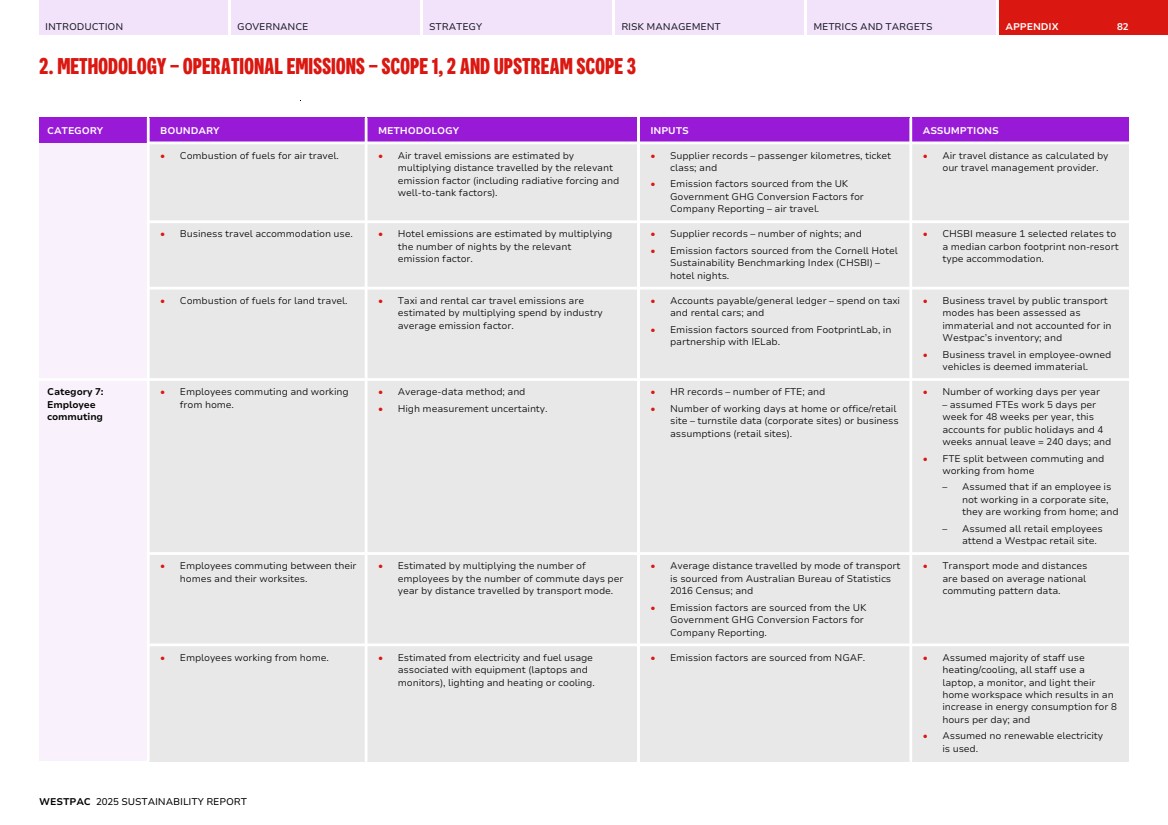
| INTRODUCTION GOVERNANCE STRATEGY RISK MANAGEMENT METRICS AND TARGETS APPENDIX 2. METHODOLOGY – OPERATIONAL EMISSIONS – SCOPE 1, 2 AND UPSTREAM SCOPE 3 83 CATEGORY BOUNDARY METHODOLOGY INPUTS ASSUMPTIONS Category 8: Upstream leased assets • Shared spaces in commercial buildings. • Emissions are estimated by multiplying apportioned energy data (fuel or purchased electricity) by the applicable emission factor (including electricity T&D and fuel extraction and distribution losses); • Asset-specific method; and • Moderate measurement uncertainty. • Landlord reports containing site-specific energy (fuel and electricity) data; • Tenancy and total building area; and • Emission factors are sourced from NGAF. • Where landlord reports are not available at the time of reporting, energy data is estimated using the seasonally adjusted weighted average method; and • Energy data is apportioned based on Westpac tenancy area. TABLE 42: NEW ZEALAND UPSTREAM SCOPE 3 INDIRECT EMISSIONS BY CATEGORY (TCO2-E) CATEGORY BOUNDARY METHODOLOGY INPUTS ASSUMPTIONS Category 1: Purchased goods and services • Production of goods and services purchased by Westpac, specifically electricity (third party) and paper consumption; and • All other purchased goods and services are excluded. • Location-based and market-based methods (electricity); • Average-data method (paper); and • Moderate measurement uncertainty. • Invoice records – data centre electricity; and • Supplier records – fleet fuel transaction report, data centre electricity and paper reports. • Reliance on supplier data. • Electricity consumption from third party data centres and offsite electric vehicle charging. • Emissions are estimated by multiplying the quantity of purchased electricity consumed by the applicable grid-average emission factor (excluding transmission and distribution (T&D) losses). • Emission factors sourced from the Ministry for the Environment Summary of Emission factors. • Third party data centre electricity is based on: – supplier reported average kW usage per day apportioned by the supplier to Westpac, multiplied by the number of hours in a day and number of days over the reporting period; and – supplier reports and invoices based on actual kWh apportioned by the supplier to Westpac. • Paper (copy paper and other paper items (e.g., statements)) purchased through key suppliers. • Emissions are estimated by multiplying the weight of paper consumed by the applicable emission factor. • Emission factors sourced from the Department for Business, Energy and Industrial Strategy UK. Government greenhouse gas conversion factors for company reporting (DESNZ 2024 & DESNZ 2025) and NXP Carbon Reduction Certificate issued by the Carbon Reduction Institute under their NoCO2 Certification Program. • Paper weight is estimated by suppliers based on product dimensions multiplied by product grams per square metre. Category 3: Fuel and energy related activities • Transmission and distribution losses (T&D losses) for electricity and natural gas consumed by Westpac. • Emissions are estimated by multiplying the quantity of purchased electricity consumed by the applicable grid-average emission factor; • Emissions are estimated by multiplying the quantity of fuel used by the relevant energy content factor and emission factor; • Invoice records – electricity, natural gas and data centre electricity; • Supplier records – fleet fuel transaction report and data centre electricity reports; and • Where electricity and natural gas invoices are not available at the time of reporting, data is estimated based on historical use; WESTPAC 2025 SUSTAINABILITY REPORT |
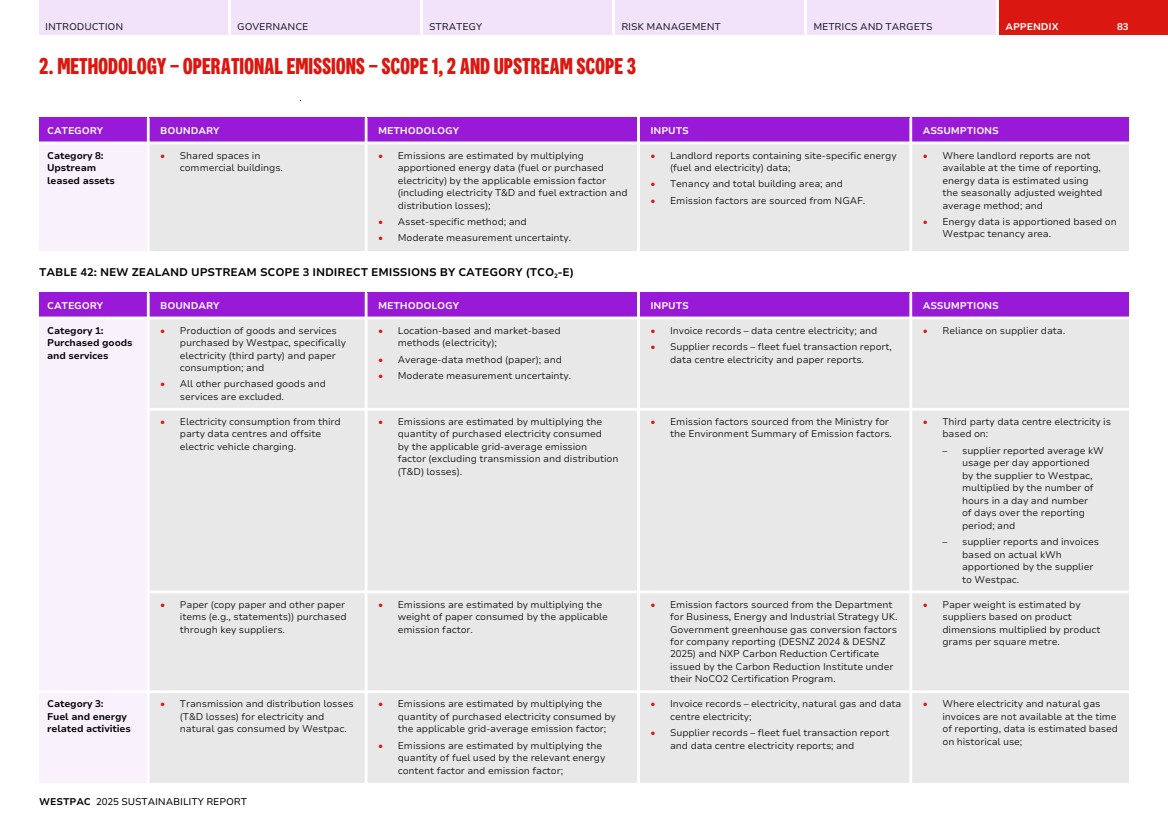
| INTRODUCTION GOVERNANCE STRATEGY RISK MANAGEMENT METRICS AND TARGETS APPENDIX 2. METHODOLOGY – OPERATIONAL EMISSIONS – SCOPE 1, 2 AND UPSTREAM SCOPE 3 84 CATEGORY BOUNDARY METHODOLOGY INPUTS ASSUMPTIONS • Comprises T&D losses from electricity consumed by Westpac sites, third party data centres and offsite electric vehicle charging; • Location-based method (electricity); • Average-data method (natural gas); • Moderate measurement uncertainty (electricity); and • Low measurement uncertainty (natural gas). • Emission factors sourced from the Ministry for the Environment Summary of Emission factors. • Where electricity from ATM use is not metered, data is estimated based on a metered ATM; and • Where a site is not standalone, electricity use is assessed against standalone sites using average intensities (kWh/m2 ). A top up of estimated electricity consumed is based on the difference in actual EUI and the average intensity assigned to a site based on several factors such as days and hours of operation. • Third party data centre electricity: – supplier reported average kW usage per day apportioned by the supplier to Westpac, multiplied by the number of hours in a day and number of days over the reporting period; and – reports and invoices based on actual kWh apportioned by the supplier to Westpac. Category 4: Upstream transportation and distribution • Transportation and distribution of cash between sites under Westpac operational control (in vehicles not owned or controlled by Westpac). • Emissions are estimated by multiplying our share of the fuel used by the relevant energy content factor and emission factor; • Average-data method; and • Moderate measurement uncertainty. • Supplier records – share of supplier cash service business, fuel type and quantity of fuel consumed; and • Emission factors sourced from the Ministry for the Environment Summary of Emission factors. • Reliance on supplier data. Category 5: Waste generated in operations • Third-party disposal and treatment of waste generated at sites under Westpac operational control; and • Excludes emissions from transportation to waste facilities and construction waste. • Emissions are estimated by multiplying the mass of waste by the relevant emission factor; • Average-data method; • Emissions from recycled waste are not included in Westpac’s inventory. Emissions from recycling are attributed to the user of the recycled materials, not the producer of the waste, in line with GHG Protocol; • Recycled content method; and • High measurement uncertainty. • Supplier records – mass of solid waste disposed in landfill; and • Emission factors sourced from the Ministry for the Environment Summary of Emission factors. • Waste data is estimated for retail sites based on rubbish bag capacity. Category 6: Business travel • Transportation of employees for business-related activities. • Distance-based method (air travel, private vehicles used for business purposes and rental cars); • Average data method (accommodation); • Spend-based method (rental cars and taxis); and • Moderate measurement uncertainty. • Supplier, accounts payable and employee expense claim records (see below). • Reliance on supplier data. WESTPAC 2025 SUSTAINABILITY REPORT |
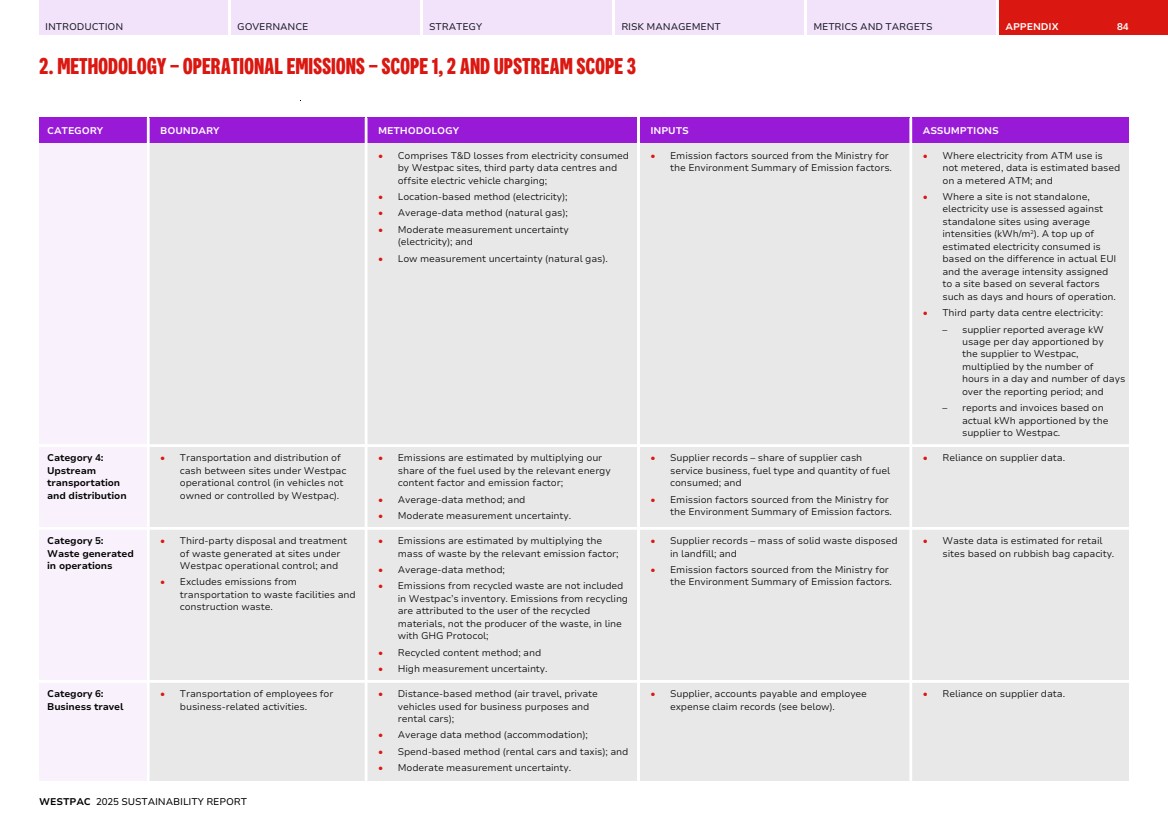
| INTRODUCTION GOVERNANCE STRATEGY RISK MANAGEMENT METRICS AND TARGETS APPENDIX 2. METHODOLOGY – OPERATIONAL EMISSIONS – SCOPE 1, 2 AND UPSTREAM SCOPE 3 85 CATEGORY BOUNDARY METHODOLOGY INPUTS ASSUMPTIONS • Combustion of fuels for air travel. • Air travel emissions are estimated by multiplying distance travelled by the relevant emission factor (including radiative forcing and well-to-tank factors). • Supplier records – passenger kilometres, ticket class; and • Emission factors sourced from the Ministry for the Environment Summary of Emission factors. • Air travel distance as calculated by our travel management provider. • Business travel accommodation use. • Accommodation emissions are estimated by multiplying the number of nights by the relevant emission factor. • Supplier records – number of nights; and • Emission factors sourced from the Ministry for the Environment Summary of Emission factors. • Accommodation nights as reported by our travel management provider. • Combustion of fuels for land travel. • Taxi travel emissions are estimated by multiplying spend by industry average emission factor and the use of precalculated supplier emissions reports. • Accounts payable/general ledger – spend on taxis; • Supplier records – precalculated tCO2-e; and • Emission factors sourced from the Ministry for the Environment Summary of Emission factors. • Reliance on internal data being accurate and complete; • Employees have claimed all their business travel for taxi use; and • Precalculated supplier tCO2-e are estimates of on-trip CO2 tailpipe emissions based on the supplier’s methodology involving average fuel-efficiency ratings for similar vehicles and certain data from third parties. • Rental car travel emissions are estimated by multiplying distance travelled by vehicle type and size by the relevant emission factor. • Supplier records – km travelled (rental car supplier) and spend (travel management provider); and • Emission factors sourced from the Ministry for the Environment Summary of Emission factors. • Spend as reported by our travel management provider is converted to km travelled using an average per km cost based on km travelled reported by our rental car supplier. • Private vehicles used for business purposes emissions are estimated by multiplying distance travelled by the relevant emission factor. • Employee expense claim records – km travelled; and • Emission factors sourced from the Ministry for the Environment Summary of Emission factors. • Employees have claimed all their business travel for private vehicles use. Category 7: Employee commuting • Employees commuting and working from home. • Average-data method. • High measurement uncertainty. • HR records – number of FTE, scheduled workdays and unique work / home address combinations; and • Number of working days at home or corporate/ retail site – swipe data (corporate sites) or business assumptions (retail sites). • FTE split between commuting and working from home – Assumed that if a corporate employee is not working in a corporate site, they are working from home; – Assumed all retail employees attend a Westpac retail site; – Where no work location exists, it is assumed that the employee works from home; and – Where commute is >150km, it is assumed the employee works from home. WESTPAC 2025 SUSTAINABILITY REPORT |
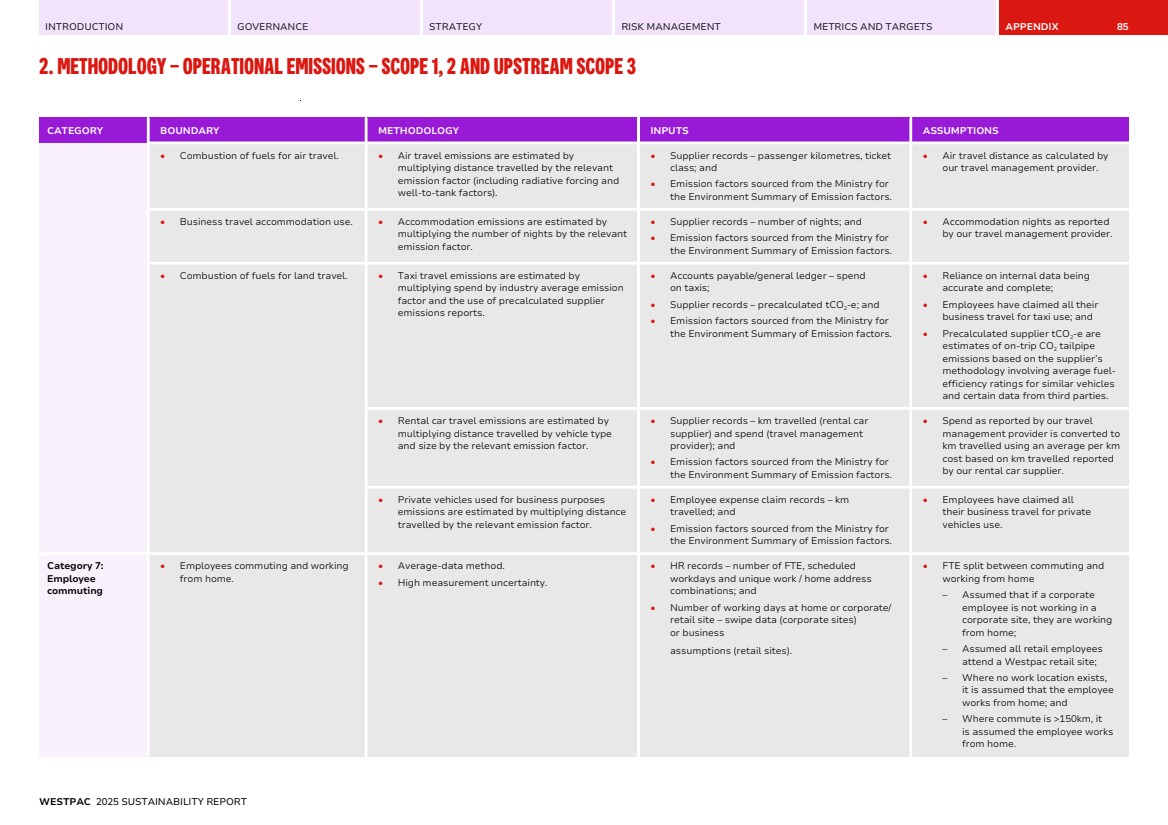
| INTRODUCTION GOVERNANCE STRATEGY RISK MANAGEMENT METRICS AND TARGETS APPENDIX 2. METHODOLOGY – OPERATIONAL EMISSIONS – SCOPE 1, 2 AND UPSTREAM SCOPE 3 86 CATEGORY BOUNDARY METHODOLOGY INPUTS ASSUMPTIONS • Commuting by our employees between their homes and their worksites. • Employee commuting emissions are estimated by multiplying the number of employees by the number of commute days per quarter by distance travelled by transport mode. • Means of travel (mode of transport) from Stats NZ 2023 Census; • Statistical Area 2 from Stats NZ Statistical Area 2 2023; and • Emission factors sourced from the Ministry for the Environment Summary of Emission factors. • Employee work/home locations are based on current HR data and assumed unchanged throughout the year; • Commute distances are estimated using straight-line (as-the-crow-flies) measurements between geocoded home/work areas, adjusted by a commute factor and doubled for round trips; • The commute factor is determined by comparing straight-line distances to a sample of driving routes obtained via Google Maps; • All commute distances are assumed to be by car; and • Where home address is unable to be geocoded an average commute distance is used. • Work undertaken by our employees at their home. • Employee working from home emissions are estimated by multiplying the number of work-from-home days by the relevant emission factor. Refer employee commute inputs. Refer employee commute assumptions. For upstream scope 3 emissions, other international operations include Westpac’s Fiji, PNG, Singapore, UK, US, China and Germany operations. TABLE 43: OTHER INTERNATIONAL UPSTREAM SCOPE 3 INDIRECT EMISSIONS BY CATEGORY (TCO2-E) CATEGORY BOUNDARY METHODOLOGY INPUTS ASSUMPTIONS Category 1 and Categories 3-8 Indirect greenhouse gas emissions that occur in Westpac’s upstream value chain. • Emissions are estimated by multiplying the Australian total upstream scope 3 emissions per FTE by the number of FTEs of the Group’s other international sites; • Methods as per table above ‘Australian upstream scope 3 emissions by category'; and • High measurement uncertainty. • HR records – number of FTE; and • Australian total upstream scope 3 emissions. • Upstream scope 3 emissions from Westpac’s international operations are assumed equivalent to those from Australian operations on a per-FTE basis. WESTPAC 2025 SUSTAINABILITY REPORT |
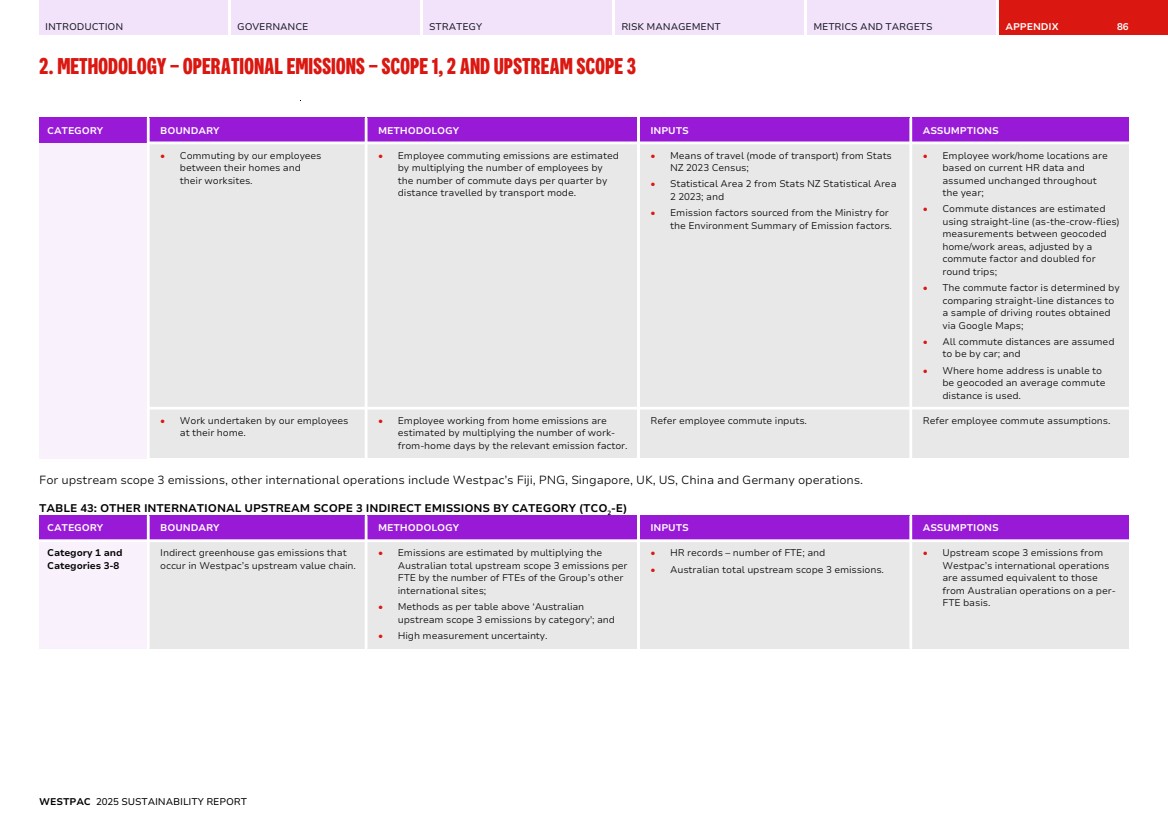
| INTRODUCTION GOVERNANCE STRATEGY RISK MANAGEMENT METRICS AND TARGETS APPENDIX 2. METHODOLOGY – OPERATIONAL EMISSIONS – SCOPE 1, 2 AND UPSTREAM SCOPE 3 87 Reporting of our scope 3 inventory Our scope 3 inventory includes upstream categories 1, 3 to 8, as well as downstream category 15. The table below outlines the inclusion status of upstream scope 3 emission sources in our scope 3 inventory, along with the rationale for any exclusions. TABLE 44: UPSTREAM SCOPE 3 EMISSIONS SOURCES INCLUDED AND EXCLUDED IN OUR INVENTORY Upstream emission sourcesa Justification Category 1: Purchased goods and services Partially included. In response to new mandatory climate reporting standards, we are reviewing our disclosures and expect to expand our reporting boundary in 2026. Category 2: Capital goods Yet to report. In response to new mandatory climate reporting standards, we are reviewing our disclosures and expect to expand our reporting boundary in 2026. Category 3: Fuel and energy-related activities (not included in Scope 1 or Scope 2) Included. Category 4: Upstream transportation and distribution Included. Category 5: Waste generated in operations Included. Category 6: Business travel Included. Category 7: Employee commute Included. Category 8: Upstream leased assets Included. a. Upstream emissions categories reported are taken from the Greenhouse Gas Protocol Corporate Value Chain (Scope 3) Standard. TABLE 45: RELEVANCE OF DOWNSTREAM SCOPE 3 EMISSIONS SOURCES TO OUR INVENTORY Emission sources tested for relevance Justification Category 9: Downstream transportation and distributiona As a bank, we offer financial services, not physical products. Therefore there are no significant emissions from transporting goods to customers. Any related emissions are considered immaterial. Category 10: Processing of sold productsb Our services do not involve physical products, so there are no emissions from processing sold items. Category 11: Use of sold productsc The use of our financial products does not generate emissions. This differs from our lending activities, which are covered under our financed emissions reporting (Category 15: Investments). Category 12: End-of-life treatment of sold productsd We do not produce physical products, so there are no emissions from disposal. Emissions from card issuance have been reviewed and are considered immaterial and not separately calculated. Category 13: Downstream leased assetse Downstream leased assets mainly include owned premises leased to third parties. The level of premises owned is small and the portion that is leased is immaterial. Accordingly the associated emissions are not material and have not been included for this activity. Category 14: Franchisesf We do not operate franchise businesses, this category is not considered relevant. Category 15: Investmentsg The financed emissions associated with our lending activities are reported under Category 15 Investments. Other elements in Category 15 (i.e., equity investments) are not considered relevant. a. Emissions that occur in the reporting year from transportation and distribution of sold products in vehicles and facilities not owned or controlled by the reporting company. b. Emissions from processing of sold intermediate products by third parties (e.g., manufacturers) subsequent to sale by the reporting company. c. Emissions from the use of goods and services sold by the reporting company in the reporting year. d. Emissions from the waste disposal and treatment of products sold by the reporting company (in the reporting year) at the end of their life. e. Emissions from the operation of assets that are owned by the reporting company (acting as lessor) and leased to other entities in the reporting year that are not already included in scope 1 or scope 2. f. Emissions from the operation of franchises not included in scope 1 or scope 2. A franchise is a business operating under a license to sell or distribute another company’s goods or services within a certain location. g. Emissions associated with the reporting company’s investments in the reporting year, not already included in scope 1 or scope 2. WESTPAC 2025 SUSTAINABILITY REPORT |
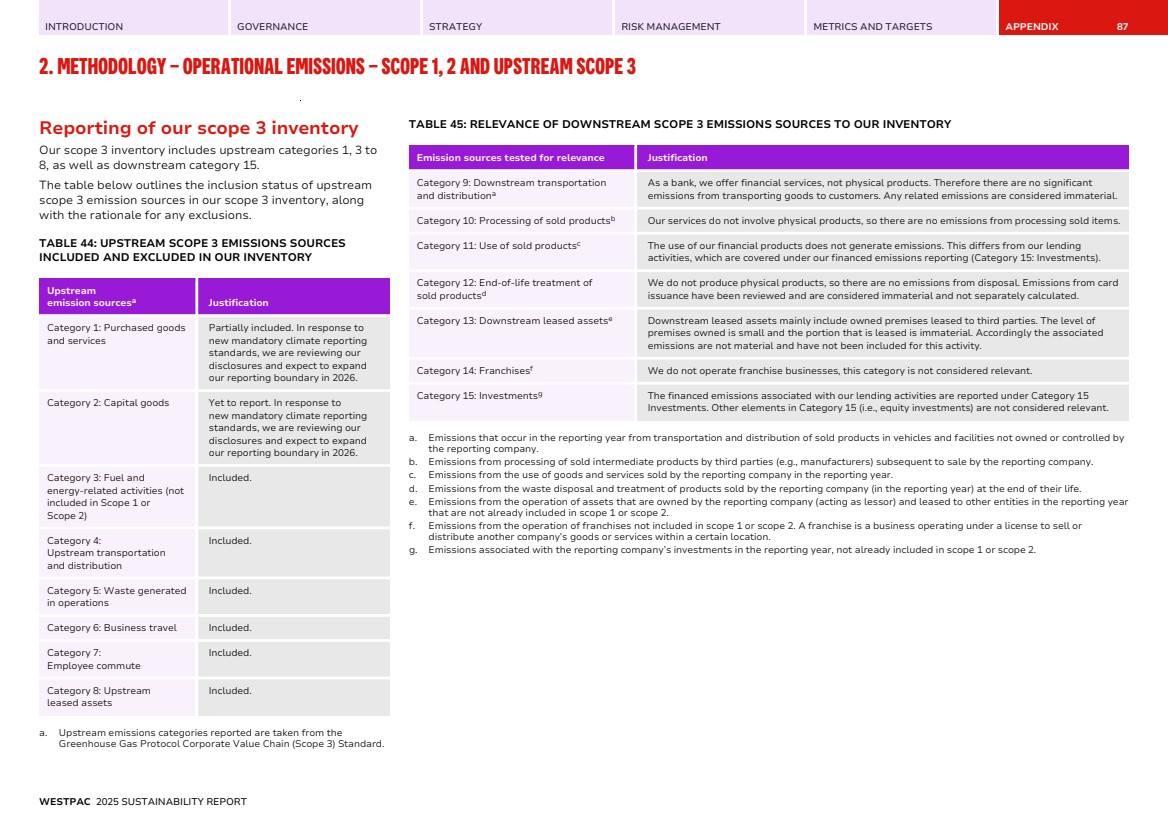
| INTRODUCTION GOVERNANCE STRATEGY RISK MANAGEMENT METRICS AND TARGETS APPENDIX 88 3. METHODOLOGY – SCOPE 3 FINANCED EMISSIONS Introduction Overview For Westpac, financed emissions are the indirect greenhouse gas emissions associated with our financing activities. We estimate our attributable share of customers' scope 1 and 2 (and for certain sectors scope 3) emissions and categorise these as part of our own scope 3 (category 15) emissions in our emissions account. Estimating financed emissions is vital if we are to achieve our ambition to become a net-zero, climate resilient bank. This is because financed emissions are the largest element of our carbon footprint. By estimating our financed emissions, we can also assess where we can make the biggest difference, including via the financed emissions targets for the most emissions intensive sectors we lend to. We have estimated and disclosed our financed emissions since FY21, continually improving our calculations and data each year. In FY25, we continued to refine our estimate of our financed emissions for FY24 by incorporating updated data and calculations. Refer to Tables 29 to 31 in this Report for the updated estimates of our financed emissions for FY24. Approach to estimating our financed emissions Westpac Group financed emissions are consolidated and reported under the operational control approach. They include estimated emissions for Westpac Banking Corporation (in Australia), Westpac Banking Corporation New Zealand Branch (‘NZ Branch’), and Westpac New Zealand Limited (‘WNZL’). Westpac did not control or operate any other material investees (associates, joint ventures and unconsolidated subsidiaries) for the reporting period. In the current reporting period, we report our financed emissions one year in arrears (similar to how we report our financed emissions sector targets). This assists us to use data more closely aligned to that reporting period. Financed emissions are calculated across three broad asset classes: 1. Business, commercial and institutional lending; 2. Commercial real estate; and 3. Residential mortgages. We have excluded the following lending categories from our financed emissions estimation due to materiality, data limitations, and lack of appropriate methodologies: • Non-mortgage personal lending (e.g., personal loans and credit cards); • Member and investor equity investments which are either administered or managed by our wealth management businesses1 ; • Direct equity investments2 ; • Westpac margin lending; • Certain business credit card exposures3 ; • Lending in our Fiji and Papua New Guinea (PNG) operations; and • Lending to governments and government-owned entities4 , as well as financial assets held for short-term liquidity and treasury purposes, which are not considered part of our core financing activities. We estimate financed emissions for project finance, equipment finance, and motor vehicle loans5 with the same methodology as applied to general lending rather than specific methodologies for these facilities. The methodologies used were informed by principles in the Partnership for Carbon Accounting Financials (PCAF)’s Global GHG Accounting and Reporting Standard: Part A – Financed Emissions 2nd edition6 (the PCAF Standard). We have sought to align with the PCAF Standard wherever possible, although we have also considered local applicability, availability of data, and other commercial considerations. Westpac is not currently a signatory to the PCAF Standard. FACILITATED EMISSIONS We do not calculate facilitated emissions from transactions we facilitate including bond issuance, underwriting, or syndicated lending. This applies to both our portfolio emissions and emissions included in our financed emissions sector targets. As an institutional, commercial and retail bank, we participate in capital markets activity but it is not a material part of our business. MATERIALITY AND REASONABLENESS We estimate financed emissions using feasible, reasonable methods informed by the PCAF Standard. While more detailed data or methodologies are sometimes available, we weigh their benefits against potential risks from increased complexity and only pursue them if material to our business. Our approach considers the PCAF Standard, data quality, model complexity, and the materiality of sectors, acknowledging that Westpac’s loan portfolio in Australia and New Zealand is broadly representative across regions and industries. 1 This Report includes Westpac and all its subsidiaries, including the Australian and New Zealand Wealth Management entities. We exclude direct equity investments and the investments related to our funds management activities from our financed emissions calculations as these are not material. Westpac has exited most of its fund management activities, and where activities remain, they are not material or not relevant to the calculation of financed emissions. This includes a small funds management business in New Zealand. The Group has a large funds administration business however it has no beneficial interest in the investments that it administers, nor does it provide financial advice. Therefore, for the purpose of estimating financed emissions, we have excluded the investments related to our funds administration business, as we believe these are not relevant for this purpose. 2 Westpac has a small number of direct equity investments but these are also not material in the context of the Group, nor do we have a controlling interest in them. WESTPAC 2025 SUSTAINABILITY REPORT |
| INTRODUCTION GOVERNANCE STRATEGY RISK MANAGEMENT METRICS AND TARGETS APPENDIX 3. METHODOLOGY – SCOPE 3 FINANCED EMISSIONS 89 APPROACH TO RESTATEMENTS We may consider restating prior period financed emissions estimates, or revising sector target baselines, progress and target figures, in circumstances including, but not limited to, changes in calculation methodologies, updates to data sources and correction of discrepancies or errors. Where such circumstances arise, we assess the materiality of the change to determine whether a restatement is appropriate. In addition to quantitative thresholds, we consider the specific context of each recalculation on a case-by-case basis to guide our assessment. Any proposed restatement is reviewed by the Group ESG Disclosure and Reporting Officer. This year, we did not restate any of our previously reported scope 3 financed emissions figures. Data elements, factors and limitations that may impact our estimates7 MEASURES OF LENDING For estimating financed emissions, we use two different measures of lending: • For residential mortgages, we use outstanding loan balance. • For our business, commercial and institutional lending including for commercial real estate, we use Total Committed Exposure (TCE). Collectively, these are termed our 'lending' to customers. While our use of outstanding loan balances for mortgages aligns with the approach recommended in the PCAF Standard for ‘Mortgages’, our use of TCE is a more conservative approach than recommended in the PCAF Standard, which suggests the use of outstanding loan amount for ‘Business loans’. We consider the use of TCE to be a more comprehensive approach as it better reflects the funds we make available to customers and hence contribute to or mitigate emissions. It also allows for better long-term measurement of our financed emissions as it avoids volatility linked to customers’ use of facilities, and would tend to be associated with higher emissions estimates as TCE is larger than balance sheet lending. For completeness, we also report our financed emissions on an outstanding loan balance basis for all three asset classes (see Table 30) and on the basis of our undrawn commitments for our business, commercial and institutional lending including for commercial real estate (see Table 31). Refer to the Glossary for more information on TCE. FACTORS AND LIMITATIONS • Timing of data: While we seek to use the most recent data relevant to the reporting period for which we estimate emissions, this is not always possible. For example, while we use 30 September 2024 lending data to estimate our share of financed emissions for FY24, we may need to use emissions factors from FY23 as these may be the only data available. Similarly, customer-specific financial data (such as company revenue or value) may only be available for periods preceding (or in some instances following) the reporting period. We prioritise available data from the most recent time periods that are relevant to our estimations, supplemented by estimates and assumptions where applicable. • Industry classification codes: We use ANZSIC codes to identify customers' primary business activities as they are maintained in our lending systems8 . The use of ANZSIC codes has limitations, however, as: – They may not accurately reflect the totality of activities of a diversified business; – A businesses’ activities may change over time and the ANSZIC allocated may be redundant; and – It is not often straightforward to map ANZSIC with related emissions factors and other data inputs. For many sectors, we use a relevant estimation approach and apply sector-level economic intensity emissions factors and sector-level financial ratios at an ANZSIC code level. Where we are unable to do so we look for the next best approach. • Data quality: As data quality varies across portfolios and sectors, in some instances we need to use proxy data to estimate emissions. We evaluate the data quality of various data inputs in each asset class using Data Quality Scores based on the PCAF Standard. These reflect the level of uncertainty in the data inputs using a scale of 1 to 5, with the lowest scores assigned to estimation methodologies that use more accurate and specific company/property-level inputs and the highest scores assigned to estimation methodologies reliant on assumptions and proxy data such as sector-level emissions factors. As part of our financed emissions reporting, we report data quality scores across sectors and asset classes, weighted based on lending, to provide insight into the relative distribution of the estimation methodologies applied. Over time we aim to lift the quality and availability of our data inputs and improve our Data Quality Scores across our asset classes. 3 Certain business credit card exposures outside of our New Zealand portfolio may be inadvertently excluded in instances where they may be categorised as retail lending. 4 Including where these are categorised in the “Government, administration, and defence” sector. As defined by ANZSIC codes under ANZSIC subdivisions 81 (Government Administration) and 82 (Defence). For WNZL portfolio, we exclude specific Crown entities in NZ outside of these ANZSIC codes where they have an ANZSIC associated with the industry they participate in. 5 Except where the loan is a personal loan, on which basis it is excluded. 6 Available at: https://carbonaccountingfinancials.com/files/downloads/PCAF-Global-GHG-Standard.pdf 7 Not an exhaustive list. 8 Applicable to business, commercial and institutional lending (including for commercial real estate) customers WESTPAC 2025 SUSTAINABILITY REPORT |
| INTRODUCTION GOVERNANCE STRATEGY RISK MANAGEMENT METRICS AND TARGETS APPENDIX 3. METHODOLOGY – SCOPE 3 FINANCED EMISSIONS 90 • Property-level information: We generally cannot access property-level energy usage or emissions data for most residential or commercial properties. Likewise, detailed energy efficiency data is unavailable for buildings that secure our loans. Therefore, we estimate emissions using regional averages or proxy data. Since Westpac's portfolio is geographically diverse, this approach should produce representative aggregate results. • Exchange rates: Where financial data is in another currency we convert it to AUD using the spot exchange rate at the end of the reporting period. Financed emissions for WNZL portfolio are estimated on an NZD basis and the in-scope exposure amounts are converted to AUD for consolidation into the Group result. CHANGES TO METHODOLOGIES AND UNDERLYING DATA Caution should be taken when comparing our financed emissions results from year to year. Changes to methodologies and underlying data (refer to the Data Inputs and Sources table in the methodology for each asset class) may impact comparability over time. Changes could include changing data sources, company and property data, sector allocations, exchange rates, emission factors, and financial ratios. Methodology changes are also possible as more analysis is completed on sectors and sub-sectors to better understand emissions. Independent assurance We have obtained limited assurance over our Group financed emissions estimates. Refer to the Independent Assurance Statement available in the Appendix section of this Report. We highlight any material deviations between our Group financed emissions estimation methodologies and both the approaches applied to estimating financed emissions for some of our financed emissions sector targets and the PCAF Standard, where relevant. Methodology Residential Mortgages We estimate the financed emissions of our residential mortgage lending in Australia and New Zealand. This includes loans to owner-occupiers and investors for a broad range of dwellings. We estimate the scope 1 and 2 emissions of properties held as security against these loans and aggregate to determine portfolio emissions. We determine our share of estimated emissions using an attribution factor derived as the ratio of the loan amount to the property value. We adjust the ratio if multiple properties are linked to one loan. The property value is measured at the most recent credit assessment event1 (e.g., the loan was opened, increased, renewed, refinanced, or extended). Financed emissions are estimated for groups of properties with similar building and geographic characteristics2 , and the product of the estimated emissions for each group of properties and the attribution factor for each group is then aggregated into the portfolio total. Emissions are estimated in accordance with methodologies in the following preference order, based on the quality and availability of underlying data: TABLE 46: METHODOLOGIES AND ASSOCIATED SCORES Estimation methodology Data Quality (DQ) score Based on property energy consumption (i.e., metered data) and supplier-specific emissions factors (DQ Score 1) or average emissions factors (DQ Score 2) specific to the respective energy source. This approach was not applied due to limited data availability. 1 and 2 Based on estimated property energy consumption per unit of floor area (using building energy labels) and average emission factors specific to the respective energy source. This approach was not applied due to limited data availability. 3 Based on estimated property energy consumption per unit of floor area (building type and location-specific 4 1 We deviate from the PCAF Standard in that we do not use property value at origination, as we consider the valuation at the most recent credit assessment event to be more representative. 2 Grouping approach applied to Australian residential mortgages portfolio due to data limitations. Financed emissions for the New Zealand residential mortgages portfolio are calculated on a loan-by-loan basis without grouping the loans or properties together (effectively each property is considered as its own group). FIGURE 21: OVERVIEW OF FINANCED EMISSIONS ESTIMATION METHODOLOGY FOR RESIDENTIAL MORTGAGES Estimated financed emissions for each group of similar properties (based on the characteristics and location of properties in the group) Estimated GHG emissions for property (based on the characteristics and location of properties in the group) Number of properties in the group Total loan amounts outstanding for properties in the group Total property value of properties in the group = x x (attribution factor) WESTPAC 2025 SUSTAINABILITY REPORT |
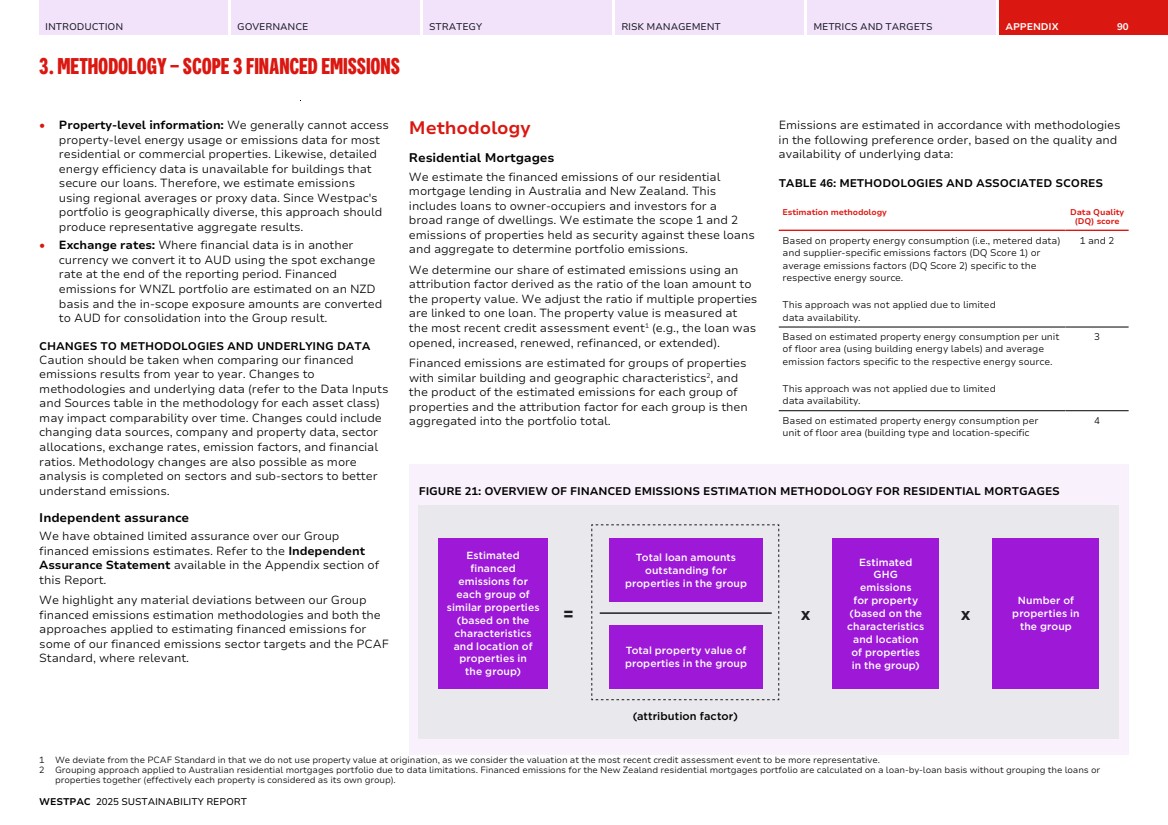
| INTRODUCTION GOVERNANCE STRATEGY RISK MANAGEMENT METRICS AND TARGETS APPENDIX 3. METHODOLOGY – SCOPE 3 FINANCED EMISSIONS 91 Estimation methodology Data Quality (DQ) score statistical data) and average emission factors specific to the respective energy source. This approach was applied to most of our portfolio where property floor area and location information was available. Floor area was either actual floor area recorded or sourced from market data, or the number of bedrooms as a proxy. Based on estimated property energy consumption per energy type per property (using property type and location-specific statistical data) and average emission factors specific to each energy source. This approach was applied where only the loan amount and property value were available. Where location information was unavailable, average energy consumption benchmarks created for State, regional or national levels, where appropriate. 5 DATA INPUTS AND SOURCES TABLE 47: DATA INPUTS AND THEIR CHARACTERISTICS Region Data input Source Publication date Data inputs to estimate property energy consumption AU Per-dwelling electricity and natural gas consumption benchmarks by State and Territory, climate zone, and household size Australian Energy Regulator (AER) 2021 (Jun) AU LPG consumption (as % share of electricity consumption, derived from Australian Energy Statistics, Table F, Australian energy consumption by State and Territory, by industry and fuel type, energy units) Department of Climate Change, Energy, the Environment and Water 2024 (Aug) AU Postcode to climate zone reference link Australian Energy Regulator (AER) 2021 (Jun) Region Data input Source Publication date AU Geographic location to climate zone reference link Australian Building Codes Board (ABCB) Climate Map with National Construction Code (NCC) climate zones 2019 (Sep) NZ Per-dwelling electricity consumption across the islands and regions New Zealand Electricity Authority – Residential Consumption Trends 2023 (Oct) to 2024 (Sep) NZ Heating and cooling emissions by region Stats New Zealand – Residential Emissions by Region – Heating & Cooling 2024 Data inputs to estimate property floor area AU Property characteristics of matched residential dwellings (including number of bedrooms) Property market data provider 2024 NZ Average floor area of residential dwellings by regions Property market data provider 2024 Household and population statistics AU Household statistics, including State-level average occupants per household and average bedrooms per dwelling Australian Bureau of Statistics (ABS) Census 2022 (for 2021 Census) Emissions factors AU Emissions factors for electricity consumption at the State level and the combustion of natural gas and LPG Australian National Greenhouse Accounts Factorsa 2024 (Aug)b NZ Emissions factors for electricity consumption at the national level, and the combustion of natural gas, LPG, wood, and coal New Zealand Government Ministry for the Environment emissions measurement guide for organisationsa 2024 a. Uses the GWPs published in the IPCC Fifth Assessment Report (AR5). b. As described in the Australian National Greenhouse Accounts Factors 2024: data used for the estimation of the factors within this document are the latest available at the time of estimation – which includes NGER reporting data for the 2022-23 cycle. NOTABLE EXCLUSIONS • Home equity loans and home equity lines of credit as these products are like other personal loans, and are a small portion of the mortgage book; • Construction or renovation loans as emissions associated with this activity would generally be attributable to the company undertaking the work; • Loans for the purchase of vacant land; • Mortgages in regions outside of Australia and New Zealand; and • Customers’ scope 3 emissions. WESTPAC 2025 SUSTAINABILITY REPORT |
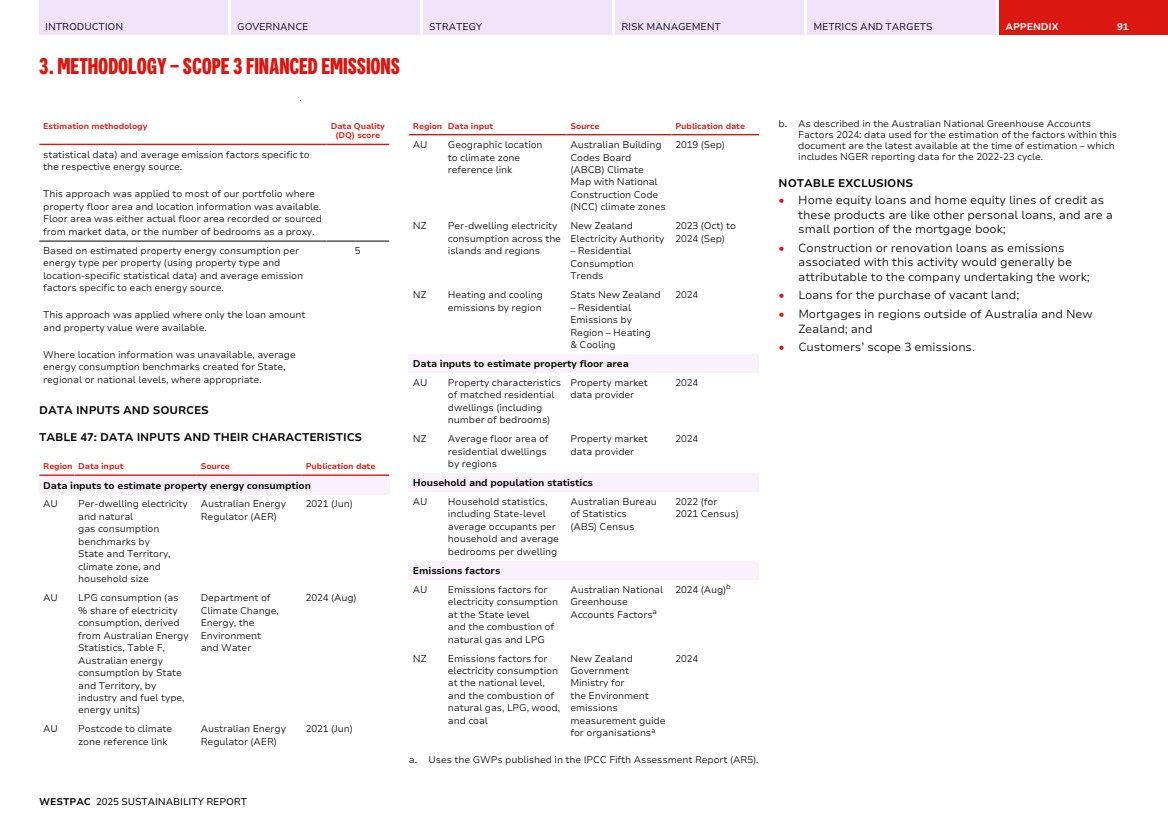
| INTRODUCTION GOVERNANCE STRATEGY RISK MANAGEMENT METRICS AND TARGETS APPENDIX 3. METHODOLOGY – SCOPE 3 FINANCED EMISSIONS 92 Business, commercial, and institutional lending We estimate financed emissions associated with business, commercial and institutional lending. This includes property customers in the sector where the lending does not meet the definition of secured lending in the Commercial Real Estate asset class, where a separate methodology is used. We estimate the scope 1 and 2 emissions and aggregate across customers and portfolios. We have estimated scope 3 emissions in certain sectors where the emissions are a significant portion of the sector’s emissions, including certain mining sectors (such oil and gas extraction) and downstream sectors in manufacturing1 . We use an attribution factor to determine our share of a customer’s emissions. This factor is the ratio of our lending over company value. Depending on data availability, company value is either the enterprise value including cash (EVIC) (which is our first choice) or the sum of the total equity and debt2 . Financed emissions by customer are calculated as the product of the customer attribution factor and their total reported or estimated emissions. Emissions are estimated in accordance with methodologies in the following preference order, based on the quality and availability of underlying data: TABLE 48: METHODOLOGIES AND ASSOCIATED SCORES Estimation methodology Data Quality (DQ) score Based on customer-specific emissions data, which have been verified by a third-party auditor (DQ Score 1) or are unverified (DQ Score 2). This approach was applied to institutional banking customers where customer-specific financial data and reported emissions data were available. It was also applied to certain Agriculture, Forestry, and Fishing customers, where farm emissions were available. We assumed all data was unverified and so had DQ score of 2. 1 and 2 Estimation methodology Data Quality (DQ) score Based on primary activity data for the company’s production and emission factors specific to that primary activity. Where customer-specific data were available, this approach was applied to estimate scope 1 emissions for customers in certain Agriculture, Forestry, and Fishing sectors (with scope 2 estimated on sector-level economic emissions intensity factors). 3 Based on sector-level economic emissions intensity factors. Where customer-specific financial data was available but neither customer-specific emissions nor production data were available, attributed emissions were estimated as the product of our lending, the financial ratio specific to the company or parent group, and a sector-level economic emissions intensity factor (tCO2-e per AUD$ of revenue) (DQ Score of 4). 4 or 5 Estimation methodology Data Quality (DQ) score Where customer-specific financial, emissions or production data was not available, an estimated sector-level financial ratio was applied (DQ Score 5). Where ANZSIC codes are absent or sector classifications cannot be determined or mapped, we assign proxy codes to estimate emissions using a sector average ratio and a sector emissions factor for a representative sector, ensuring that some emissions are still attributed to these customers. For institutional exposures in the Electricity Supply sector, we incorporate additional internal research and green lending data, where available, to distinguish between renewable and non-renewable generation activities and other activities that these customers in this sector may be involved in (which may also include electricity retailing and market operations). We apply a weighted average of fossil-fuel electricity generation factors and lower-intensity factors based on this information, such that the 1 Scope 3 analysis limited to customers allocated to the following ANZSIC (1993) codes within the Mining sector (1101, 1102, 1200, 1311, 1312, 1313, 1314, 1315, 1316, 1317, 1319, 1411, 1419 and 1420) and Manufacturing sector (2510, 2520, 2531, 2532 and 2721). 2 Total tangible assets are used in place of total equity and debt for customers in certain Agriculture, Forestry, and Fishing sectors in instances where financial data on total tangible assets is available and a reliable attribution factor based on total equity and debt cannot be calculated. FIGURE 22: OVERVIEW OF FINANCED EMISSIONS ESTIMATION METHODOLOGY FOR BUSINESS, COMMERCIAL, AND INSTITUTIONAL LENDING Estimated financed emissions for each customer Customer GHG emissions (or estimated emissions) Total customer lending Customer company value = x (attribution factor) WESTPAC 2025 SUSTAINABILITY REPORT |
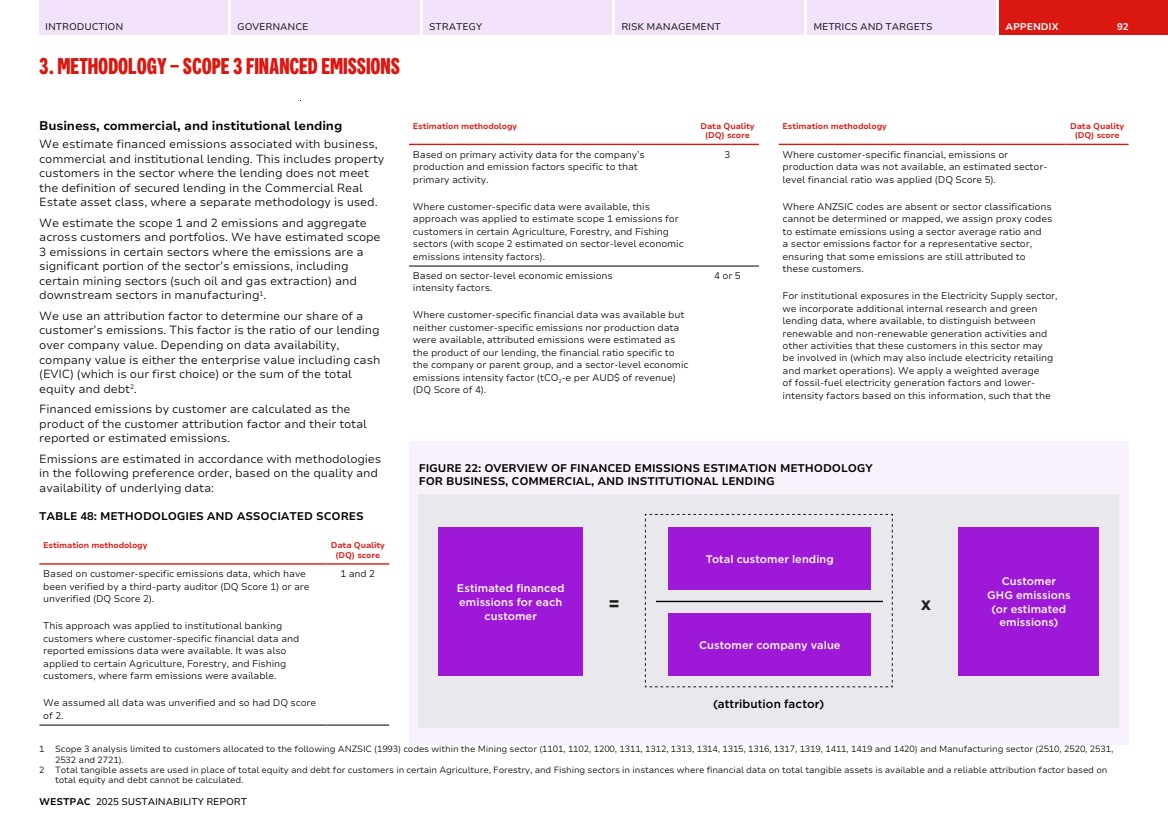
| INTRODUCTION GOVERNANCE STRATEGY RISK MANAGEMENT METRICS AND TARGETS APPENDIX 3. METHODOLOGY – SCOPE 3 FINANCED EMISSIONS 93 Estimation methodology Data Quality (DQ) score estimation reflects the diversity of generation types and more appropriate factors, where possible. DATA INPUTS AND SOURCES TABLE 49: DATA INPUTS AND THEIR CHARACTERISTICS Region Data input Source Publication date Reported emissions and activity data AU Customers’ reported scope 1, 2, and 3 emissions Australian Clean Energy Regulator NGER Corporate emissions and energy data 2025 release based on 2023-24 data Financial market data provider 2025 (up to early June) AU Customers’ activity / production data (e.g., milk production, livestock inventories) Internal systems based on customer filings for certain Agriculture customers 2025 (up to end-June) NZ Customers’ reported scope 1, 2, and 3 emissions Internal systems, public disclosures and financial market data providers 2025 NZ Customers’ activity / production data (e.g., livestock inventories) Internal systems 2025 Customers' financial data AU Customers’ financial data Combination of: internal systems; and, financial market data providers. 2025 (up to end-June) NZ Customers’ financial data Combination of: internal systems; and, financial market data providers. 2025 Emissions factors Region Data input Source Publication date AU Factors for scope 1, 2 and 3 for Australian industry sectors IELabs spend-based emissions factorsc 2025 release based on 2024 data AU Factors for scope 1 emissions related to land management per head of livestock (Beef and Sheep) and per litre of milk produced, in Australian Agriculture sector Based on data prepared for the Australian Agriculture – Beef and Sheep and Agriculture – Dairy financed emissions sector targets. Refer to page 104 to 105. Australia’s National Greenhouse Accounts (NGA) – State/Territory emissions data for Beef and Sheep, and Dairy 2025 release based on 2023 data Australian Bureau of Agriculture and Resource Economics and Sciences (ABARES) –State/ Territory data for Australian meat production for beef and sheep, and count of animals; Milk production 2025 release based on 2023 data NZ National average emissions factors Stats New Zealand, GHG Emissions by Industrya 2022 NZ Factors for scope 1, 2 and 3 for Aotearoa New Zealand industry sectors thinkstep-anz, Emission Factors for New Zealand: Greenhouse Gas Emission Intensities for Commodities and Industries. v2.0b. 2024 NZ Scope 1 & 2 emissions factors per head of livestock in Aotearoa New Zealand New Zealand Government Ministry for the Environment, Measuring emissions: A guide for organisationsc 2024 Sector-level financial ratios AU Ratios of company revenue to company value for Australian industry sectors Financial market data providers’ data for Australian and New Zealand top companies 2024 (up to Dec) Region Data input Source Publication date For certain subsets of customers in Agriculture: ABARES Farm Data Portal data 2023 NZ Ratios of company revenue to company value for Aotearoa New Zealand industries Stats New Zealand, Annual Enterprise Survey 2023 NZ National average ratio of company revenue to company value for Aotearoa New Zealand Stats New Zealand, Business performance benchmarker 2022 a. Uses the GWPs published in the IPCC Fifth Assessment Report (AR5). However, regional inventories may be based on those from other assessment reports. b. Uses the GWPs published in the IPCC Fourth Assessment Report (AR4). c. Uses the GWPs published in the IPCC Fifth Assessment Report (AR5). NOTABLE EXCLUSIONS • Non-mortgage personal lending (e.g., personal loans and credit cards); • Lending to governments and government-owned entities1 ; and • Exposures in-scope of our Commercial Real Estate asset class (to avoid double counting). 1 Including where these are categorised in the “Government, administration, and defence” sector. As defined by ANZSIC codes under ANZSIC subdivisions 81 (Government Administration) and 82 (Defence). For WNZL portfolio, we exclude specific Crown entities in NZ outside of these ANZSIC codes where they have an ANZSIC associated with the industry they participate in. WESTPAC 2025 SUSTAINABILITY REPORT |
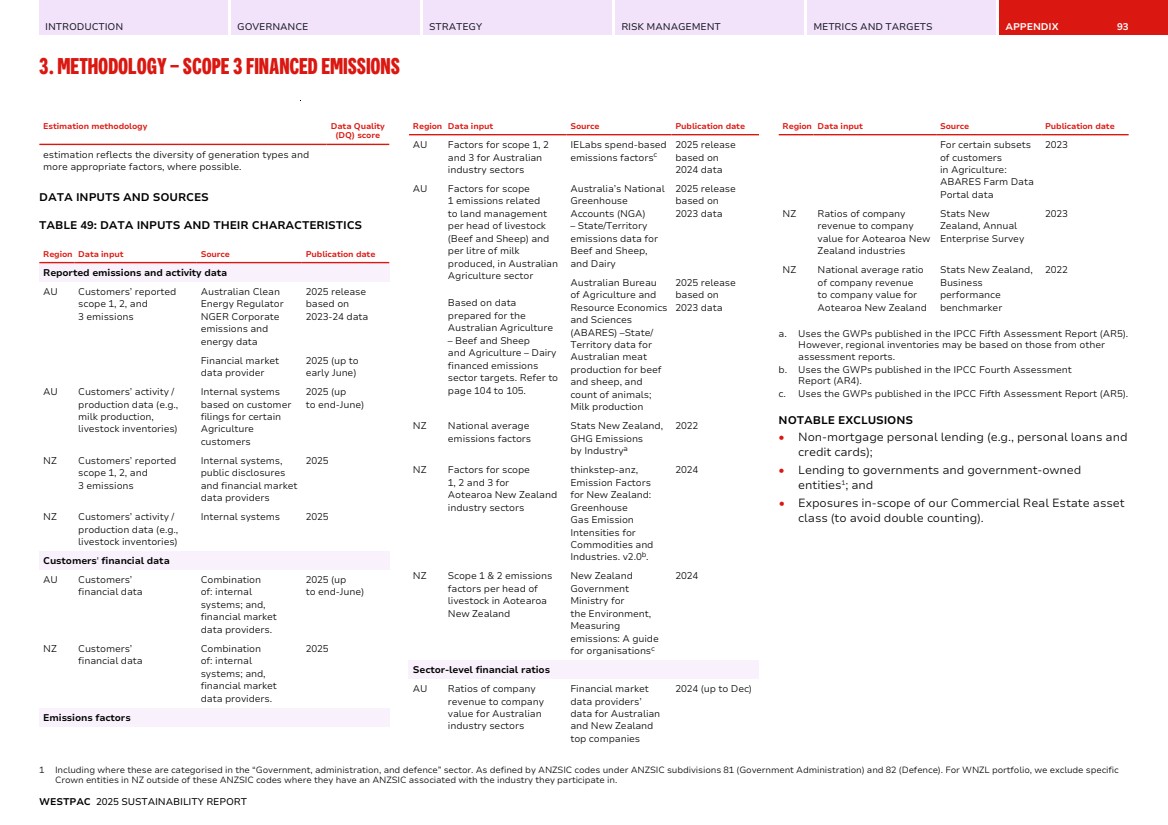
| INTRODUCTION GOVERNANCE STRATEGY RISK MANAGEMENT METRICS AND TARGETS APPENDIX 3. METHODOLOGY – SCOPE 3 FINANCED EMISSIONS 94 Commercial real estate This sector includes lending to business, commercial and institutional customers in the Property sector1 secured by residential and/or commercial real estate. We estimate the scope 1 and 2 emissions associated with the properties held as security and aggregate these for the portfolio2 . Estimation is challenging as property-level emissions and energy data, particularly for smaller properties is not readily available. Where we have data limitations the business lending methodology is applied. We attribute a portion of estimated emissions for each property based on attribution factors. The attribution factor is the ratio(s) of our customers lending secured by the property over the property value. We measure property value using a hierarchy of three options reflecting the best available data: 1. Value recorded at a credit assessment event3 (e.g., when the loan was opened, increased, renewed, refinanced, or extended), noting that this may not necessarily be the latest credit assessment event; 2. The value at a recent sale reported by a property market data provider; or 3. The estimated value based on LVR data. Customer emissions are calculated as the sum of the product of actual or estimated emissions for each property and the relevant attribution factor. Emissions are estimated in accordance with methodologies in the following preference order, based on the quality and availability of underlying data: TABLE 50: METHODOLOGIES AND ASSOCIATED SCORES Estimation methodology Data Quality (DQ) score Based on actual building energy consumption (i.e., metered data) and supplier-specific emissions factors (DQ Score 1) or average emissions factors (DQ Score 2) specific to the energy source. This approach was not applied to any properties due to data. 1 and 2 Based on estimated building energy consumption per unit of floor area (from official energy labels) and average emission factors specific to energy source. This approach was applied to properties where data on property floor area and NABERS rating was available. 3 Estimation methodology Data Quality (DQ) score Emissions were estimated by multiplying the property floor area by the average emissions per unit of floor area derived for the property type, region and rating based on the NABERS rating register (average emissions for Retail properties are applied to Industrial properties due to data limitations). Based on estimated building energy consumption per unit of floor area (based on building type and location-based data) and average emission factors for each energy source. This approach was applied to properties recorded as security where data on property floor area and location information were available. Emissions were estimated by multiplying the property floor area by the relevant energy consumption benchmarks and relevant emissions factors. 4 Based on estimated building energy consumption per building (based on building type and location-5 1 Limited to customers within ANZSIC (1993) codes that start with 771- (i.e., within the Property sector). 2 For WNZL portfolio, we calculate financed emissions by grouping properties with similar building and geographic characteristics and aggregating the product of the estimated emissions for each group of properties and the attribution factor for each group. 3 We deviate from the PCAF Standard in that we do not use property value at origination, as we consider the valuation at the most recent credit assessment event to be more representative. FIGURE 23: OVERVIEW OF FINANCED EMISSIONS ESTIMATION METHODOLOGY FOR COMMERCIAL REAL ESTATE LENDING Estimated financed emissions for each loan secured by property GHG emissions of property (or estimated emissions based on property characteristics and location) Total lending Property value = x (attribution factor) WESTPAC 2025 SUSTAINABILITY REPORT |
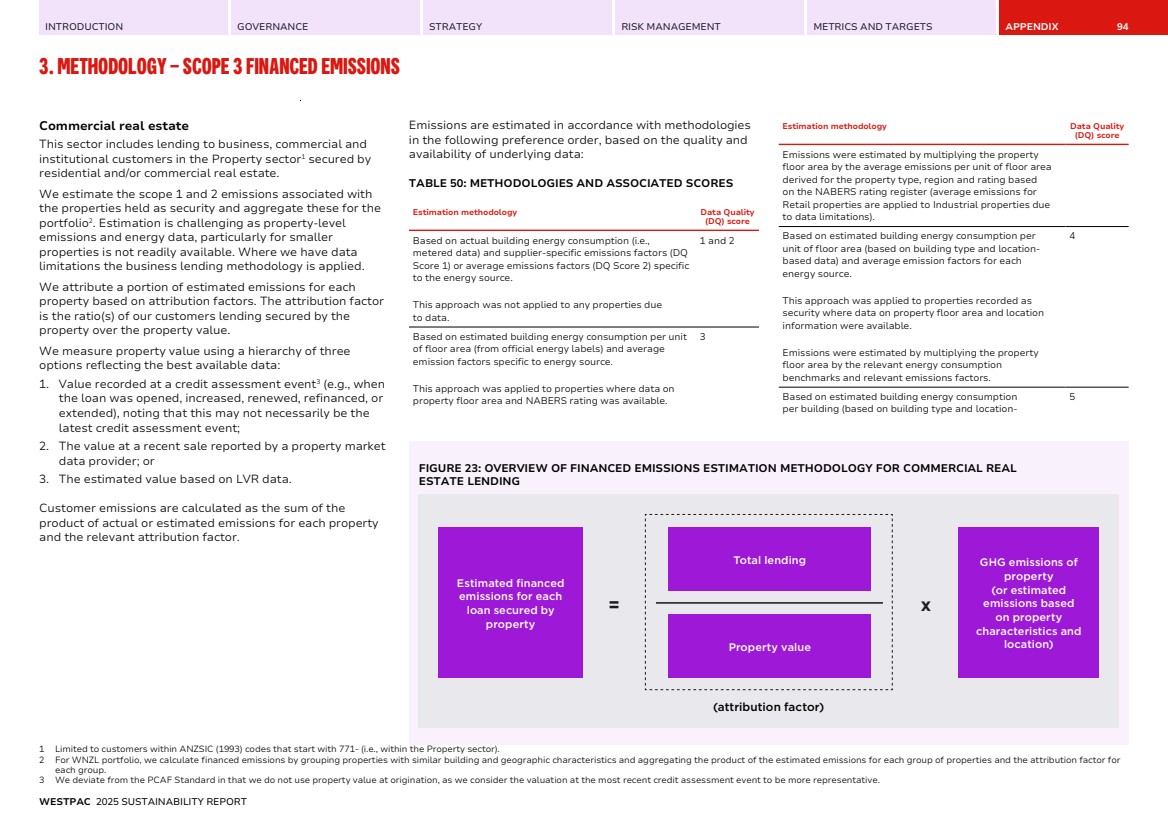
| INTRODUCTION GOVERNANCE STRATEGY RISK MANAGEMENT METRICS AND TARGETS APPENDIX 3. METHODOLOGY – SCOPE 3 FINANCED EMISSIONS 95 Estimation methodology Data Quality (DQ) score specific data) and average emission factors for each energy source. This approach was applied to most properties in our Australian and New Zealand portfolios where only the loan amount and property value were available. Emissions were estimated by multiplying the estimated property floor area (i.e., property value divided by the relevant market value per square metre) by the relevant energy consumption benchmarks and emissions factors for the location. DATA INPUTS AND SOURCES TABLE 51: DATA INPUTS AND THEIR CHARACTERISTICS Region Data input Source Publication date Energy consumption benchmarks – residential AU Per-dwelling electricity and natural gas consumption benchmarks by State and Territory, climate zone, and household size Australian Energy Regulator (AER) 2021 (Jun) NZ Per-dwelling electricity consumption across the islands and regions New Zealand Electricity Authority – Residential Consumption Trends 2023 (Oct) to 2024 (Sep) NZ Heating and cooling emissions by region Stats New Zealand – Residential Emissions by Region – Heating & Cooling 2024 Energy consumption benchmarks – commercial AU Australian buildings’ emissions profiles and net lettable area (NLA) NABERS ratings register 2025 (Apr) NZ Benchmark per-building energy demand figures BEES Part 1: Final Report BRANZ Study Report SR 297/1 2014 Property floor area and value benchmarks – residential Region Data input Source Publication date AU Derived mean price per square metre for Australian properties Combination of: ABS data – Total Value of Dwellings (mean price of residential dwellings) 2023 (Dec) to 2024 (Sep) quarterly average ABS – Building Activity (average floor area of new properties) 2024 (Dec) NZ Derived mean price per square metre measure for New Zealand properties Property market data provider 2025 NZ Average floor area of residential dwellings broken down by regions Property market data provider 2025 Property floor area and value benchmarks – commercial AU Derived mean price per square metre across a range of regions and/or property types and/or specific properties Combination of data points sourced from property market data providers: • average yield and average gross face rents data sourced from national property market research snapshots for retail, industrial, and office sectors • national sales history records for commercial property sector 2024 (Q4) (covering at least prior one year of data) NZ Derived mean price per square metre across a range of regions Property market data provider 2025 Household and population statistics AU Household statistics, including State-level data average occupants per household and Australian Bureau of Statistics (ABS) census reports 2021 Region Data input Source Publication date average bedrooms per dwelling Emissions factors AU Emissions factors for electricity consumption at the State level and the combustion of natural gas and LPG Australian National Greenhouse Accounts Factorsa 2024 (Aug)b NZ Emissions factors for electricity consumption at the national level, and the combustion of natural gas, LPG, wood, and coal New Zealand Government Ministry for the Environment, Measuring emissions: A guide for organisationsa 2024 a. Uses the GWPs published in the IPCC Fifth Assessment Report (AR5). b. As described in the Australian National Greenhouse Accounts Factors 2024: data used for the estimation of the factors within this document are the latest available at the time of estimation – which includes NGER reporting data for the 2022-23 cycle. NOTABLE EXCLUSIONS The following commercial property types were out of scope for the estimation: • freehold hotels and motels; • development lands (residential, industrial, office, and retail); • certain rural farm properties; • land investment subject to ground leases; and, • guarantees. Exposures that are marked as financing for Development or Site Finance, marked as program-managed, as well as unsecured exposures, are also excluded from this approach. We may instead estimate financed emissions using the approach for general business, commercial, and institutional lending. WESTPAC 2025 SUSTAINABILITY REPORT |
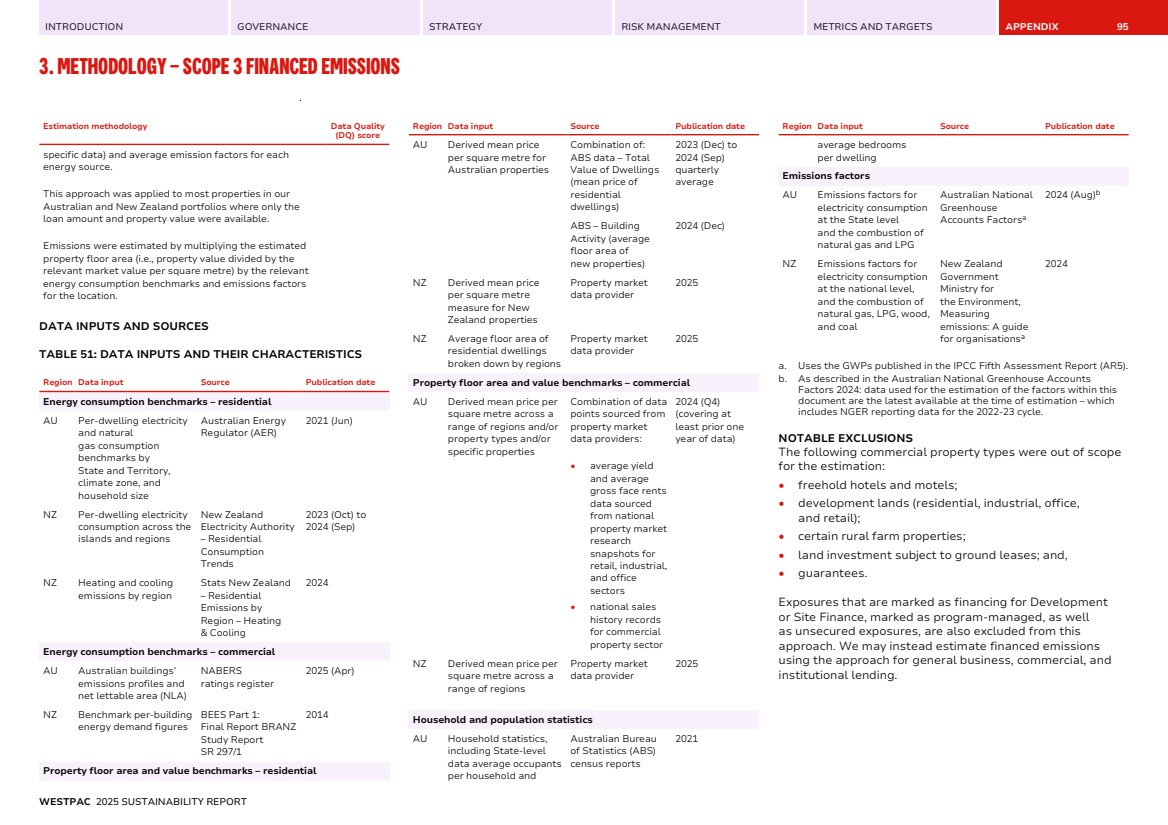
| INTRODUCTION GOVERNANCE STRATEGY RISK MANAGEMENT METRICS AND TARGETS APPENDIX 96 4. METHODOLOGY – FINANCED EMISSIONS SECTOR TARGETS Sector targets – overview of sector target boundaries The below table provides an overview of the boundaries of our sector targets, including the ANZSIC codes (where applicable) for identifying the initial set of customers in scope, and the additional inclusions and exclusions to the boundary. SCOPE OF EMISSIONS AND GREENHOUSE GASES COVERED BY THE SECTOR TARGETS Unless otherwise indicated below, our sector targets and progress metrics are calculated and reported on a CO2-e basis and include scope 1, 2, and 3. Our targets are based on the greenhouse gases that are most relevant to the sector, therefore we include those that are reported by in-scope customers. • The Power Generation, Cement Production, Aluminium, and Steel Production sector targets include scope 1 and 2 only; • For the Thermal Coal sector target, the most relevant greenhouse gases associated with thermal coal combustion are carbon dioxide, methane and nitrous oxide; • The Aviation (passenger aircraft operators) target includes scope 1 only. Given current immateriality we have excluded scope 2 emissions (typically <1% of scope 1 and 2 emissions) in the target coverage. This aligns with the IEA NZE 2050 pathway which covers scope 1 emissions only; • The Commercial Real Estate (Offices) target includes scope 1 and 2, for base building operational emissions. Where customer reported emission data is used, we have given preference to market-based emissions data (i.e., including the use of power purchase agreements or Greenpower) over location-based emissions data. • The Residential Real Estate (Australia) target includes scope 1 (excluding fugitive and LPG emissions) and 2 emissions only; • The Agriculture (Australia Beef and Sheep, and Australia Dairy) targets include scope 1 land management emissions which include biogenic methane from ruminant livestock, emissions from nutrient management, manure management, and fertiliser use; and • The Agriculture (New Zealand Beef and Sheep) target includes scope 1 emissions only for Methane, Nitrous Oxide, Carbon Dioxide. The Agriculture (New Zealand Dairy) target includes scope 1 emissions only which include enteric methane from ruminant livestock and manure management and also nitrous oxide from the application of fertilisers and livestock excreta. TABLE 52: SECTOR TARGET BOUNDARIES AND ADDITIONAL INCLUSIONS AND EXCLUSIONS Sector target ANZSIC codes to identify initial customer set Geography of exposures Part of Westpac to which the target applies Additional inclusions Additional exclusions Glo-bal AU only NZ only Retail Busi-ness Insti-tutional Pacific Banking Power generation 3610 Y – – N Y Y N Customers that generate electricity from various sources, including coal, natural gas, hydropower, wind and solar. These customers may operate globally, and electricity generation must contribute to at least 10% of their revenue (a lower threshold of 5% applies to coal-fired electricity generation). Customers involved with electricity transmission, distribution and batteries. Cement production N/A Y – – N Y Y N Customers in scope are determined by identifying cement manufacturing customers with an overlay to only include customers that produce both clinker and cement in-house. Upstream emissions from the production of purchased clinker, transportation, and delivery of materials to the production facility. Downstream emissions from the distribution and use of cement in other building materials (e.g., concrete). Upstream Oil and Gas 1200; 1511; 1512; 2510 Y – – N Y Y N Companies involved with exploration, extraction and drilling, all activities of integrated oil and gas companies (IOCs), tolling (contract manufacturing) and stand-alone refineries and LNG Companies involved with downstream retail and distribution; pipeline infrastructure; storage and transport; and trading entities. WESTPAC 2025 SUSTAINABILITY REPORT |
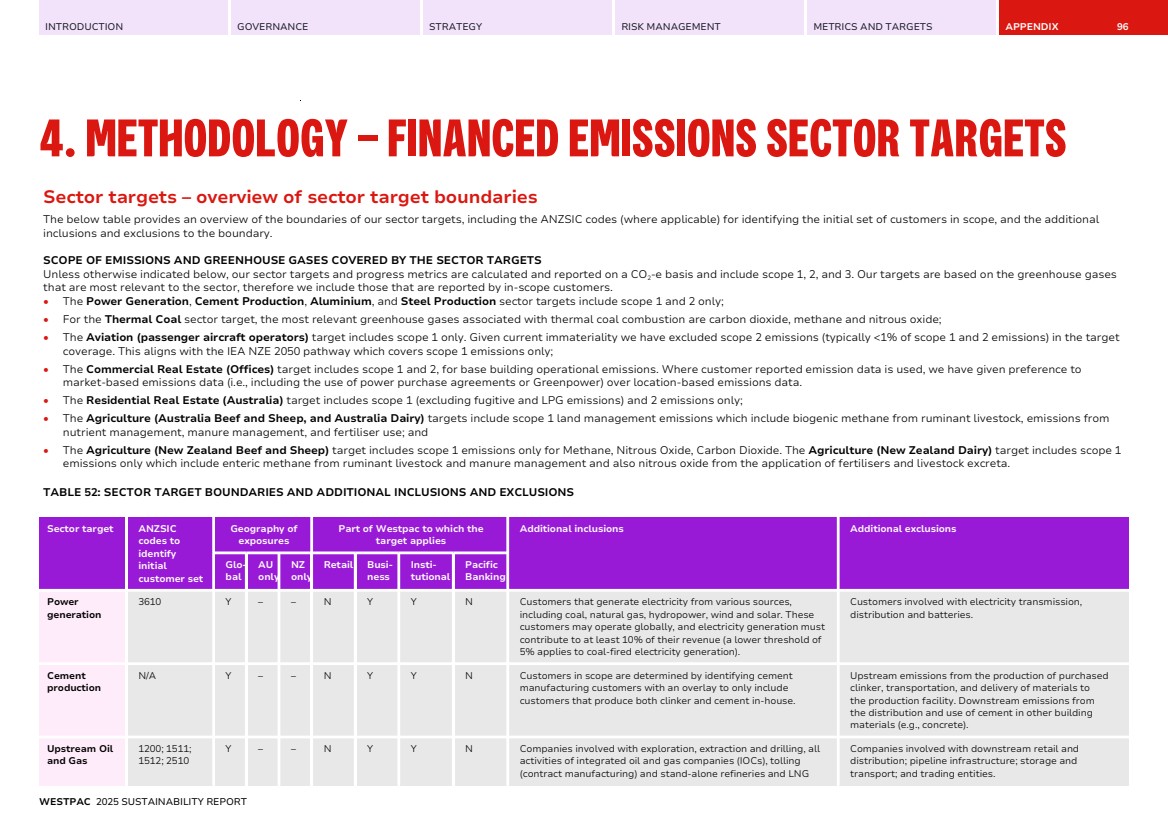
| INTRODUCTION GOVERNANCE STRATEGY RISK MANAGEMENT METRICS AND TARGETS APPENDIX 4. METHODOLOGY – FINANCED EMISSIONS SECTOR TARGETS 97 Sector target ANZSIC codes to identify initial customer set Geography of exposures Part of Westpac to which the target applies Additional inclusions Additional exclusions Glo-bal AU only NZ only Retail Busi-ness Insti-tutional Pacific Banking producers. This includes customers who are diversified, and their operations include the above. Thermal coal mining 1101; 1102; 1103 Y – – N Y Y N Thermal coal mining. Metallurgical coal mine/ers that produce a thermal coal byproduct and diversified mine/ers that produce a thermal coal product where their dominant activity is not thermal coal. Aviation (passenger aircraft operators) 6401; 6402; 6403; 7742 Y – – N Y Y N Customers that operate scheduled passenger air transport. We include emissions from freight operations undertaken by passenger airline operators as the movement of freight and the movement of passengers are often undertaken at the same time. Aircraft lessors and freight only operators; the latter due to their immateriality to the sector globally. We have excluded aircraft lessors given Westpac’s capacity to influence the sector’s transition is more limited. Steel Production 2741 Y – – N Y Y N Customers involved in the production of crude steel. Customers involved in downstream manufacturing, processing of end products and fabrication of products from steel. Aluminium 2721; 2722 Y – – N Y Y N This target covers only: alumina refining; aluminium smelting. 95% of primary aluminium production emissions lie within scope 1 and scope 2 of the refining and smelting processes. We include these processes in our boundary definition. The extraction of bauxite ore in open-cut mining except where reported as part of vertically integrated operations. We exclude end-product manufacture. We exclude secondary production, as it does not reflect our customers’ activities, and due to data limitations. Rehabilitation bonds are excluded. Commercial Real Estate (Offices) 771- (ANZSIC 1993) or 671- (ANZSIC 2006) N Y Y N Y Y N Our target applies to in-scope office facilities for commercial real estate customers in Australia and New Zealand, where the TCE is greater than or equal to $5 million for Australian facilities, or NZ$5 million for New Zealand facilities. Exposures associated with site finance and construction of offices. Residential Real Estate (Australia) N/A N Y N Y Y N N Australian Mortgages, including owner occupier and investment loans. Mortgages on vacant land; Equity access loans (a line of credit using a mortgage as security); Construction loans. Scope 3 emissions are excluded. Agriculture (Australia Beef and Sheep) 0122; 0123; 0124; 0125; 0126 N Y N N Y Y N Commercial relationship-managed and institutional agriculture customers with TCE ≥$1.5 million. Includes those whose banking needs are looked after by designated Relationship Managers. Inclusion of sheep: It was deemed appropriate to include sheep farming in our target despite SBTi FLAG not having a sheep-specific pathway. Sheep farming contributes materially to Australia’s agricultural emissions at approximately 19%. Our assessment indicates the emissions profiles between cattle and sheep are similar. Livestock enteric (methane) emissions reduction opportunities do not distinguish between sheep and beef. Scope 1 emissions relating to fuel use, land-use change and removals due to data limitations. Scope 2 and 3 emissions are not included in the reference scenario selected for target setting and are therefore excluded from our targets. WESTPAC 2025 SUSTAINABILITY REPORT |
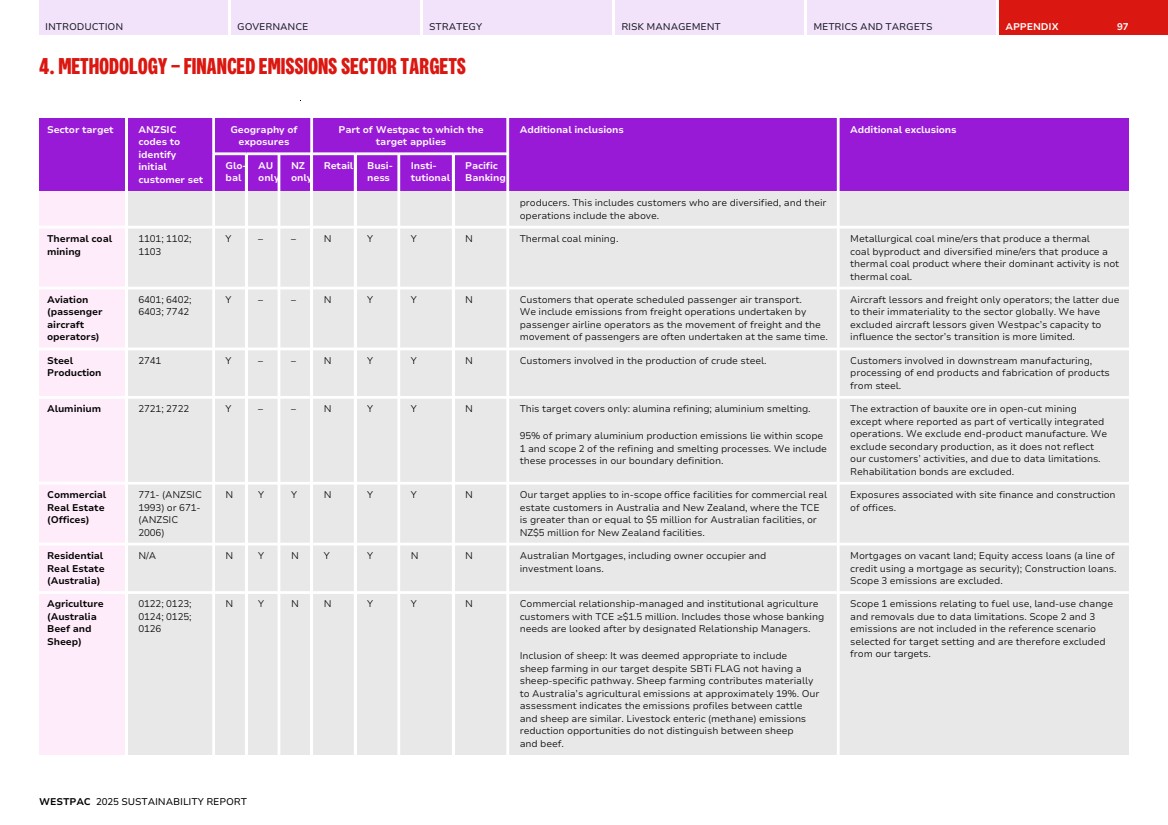
| INTRODUCTION GOVERNANCE STRATEGY RISK MANAGEMENT METRICS AND TARGETS APPENDIX 4. METHODOLOGY – FINANCED EMISSIONS SECTOR TARGETS 98 Sector target ANZSIC codes to identify initial customer set Geography of exposures Part of Westpac to which the target applies Additional inclusions Additional exclusions Glo-bal AU only NZ only Retail Busi-ness Insti-tutional Pacific Banking Agriculture (Australia Dairy) 0130 N Y N N Y Y N Commercial relationship-managed and institutional agriculture customers with TCE ≥$1.5 million. Includes those whose banking needs are looked after by designated Relationship Managers. Scope 1 emissions relating to fuel use, land-use change and removals due to data limitations. Scope 2 and 3 emissions are not included in the reference scenario for target setting and are excluded from our targets. Agriculture (New Zealand Beef and Sheep) 0141; 0142; 0143; 0144 (ANZSIC 2006) N N Y N Y N N This target applies to Westpac New Zealand – Agribusiness. Customers with < NZ$1 million TCE are excluded. Agriculture (New Zealand Dairy) 0160 (ANZSIC 2006) N N Y N Y N N This target applies to Westpac New Zealand – Agribusiness. Customers with < NZ$1 million TCE are excluded. Sector targets – overview of dependencies and risks TABLE 53: DEPENDENCIES AND RISKS ASSOCIATED WITH OUR SECTOR TARGETS Sector target Dependencies/risks Power generation • Delays in approvals for construction of greenfield renewable energy projects may impact the ability to support the decarbonisation of Australia’s electricity grid; • Continued government support will be required to ensure the infrastructure and policy levers are in place to de-risk renewable energy, transmission and distribution projects; and • We will consider the intersecting requirements of emissions reduction, the feasibility of emerging technologies, as well as energy affordability, security and reliability. Cement production • The cement industry is reliant on a reduction in the emissions intensity of electricity purchased and the roll-out of renewable energy; • Reduction in the ratio of clinker used relies on the availability and cost of substitute cementitious materials. Further reduction in clinker use will rely on changes to building standards and/or new technologies; and • Some reliance is expected to come from carbon capture and storage technologies which are yet to be proven at scale. Upstream Oil and Gas • The rate of decarbonisation of the sector could be affected by government policy, availability of new technologies, economic feasibility, or other factors such as energy security, energy affordability and the energy transition. Thermal coal mining • We will not provide any project finance to new (greenfield), expansions or extensions of thermal coal mines; and • From 30 September 2025 we have zero corporate lending and will no longer provide bond facilitation for institutional customers with ≥15% of their three-year rolling average revenue coming directly from thermal coal mining. Aviation (passenger aircraft operators) • The IEA notes that rapid development and deployment of SAF using policy mechanisms such as low carbon fuel standards, biofuel mandates, and CO2 removal credits (offsets) will be required to achieve SAF usage at 15% of total fuel consumption by 2030. The ability of the global aviation sector to achieve the emission reductions required under the IEA NZE 2050 scenario and the ability of our customers to meet their published decarbonisation commitments is highly dependent on the availability and cost of SAF; and • We currently do not have specific data on customer use of offsets, but use of offsets is common in this sector and some customers have indicated that offsets will be used to meet interim targets. Under the IEA NZE 2050 scenario carbon dioxide removal technologies to offset residual emissions are likely to be required to achieve net-zero by 2050. Steel Production • A MPP Technology Moratorium scenario assumption is that investments of near-zero technologies occur after 2030; WESTPAC 2025 SUSTAINABILITY REPORT |
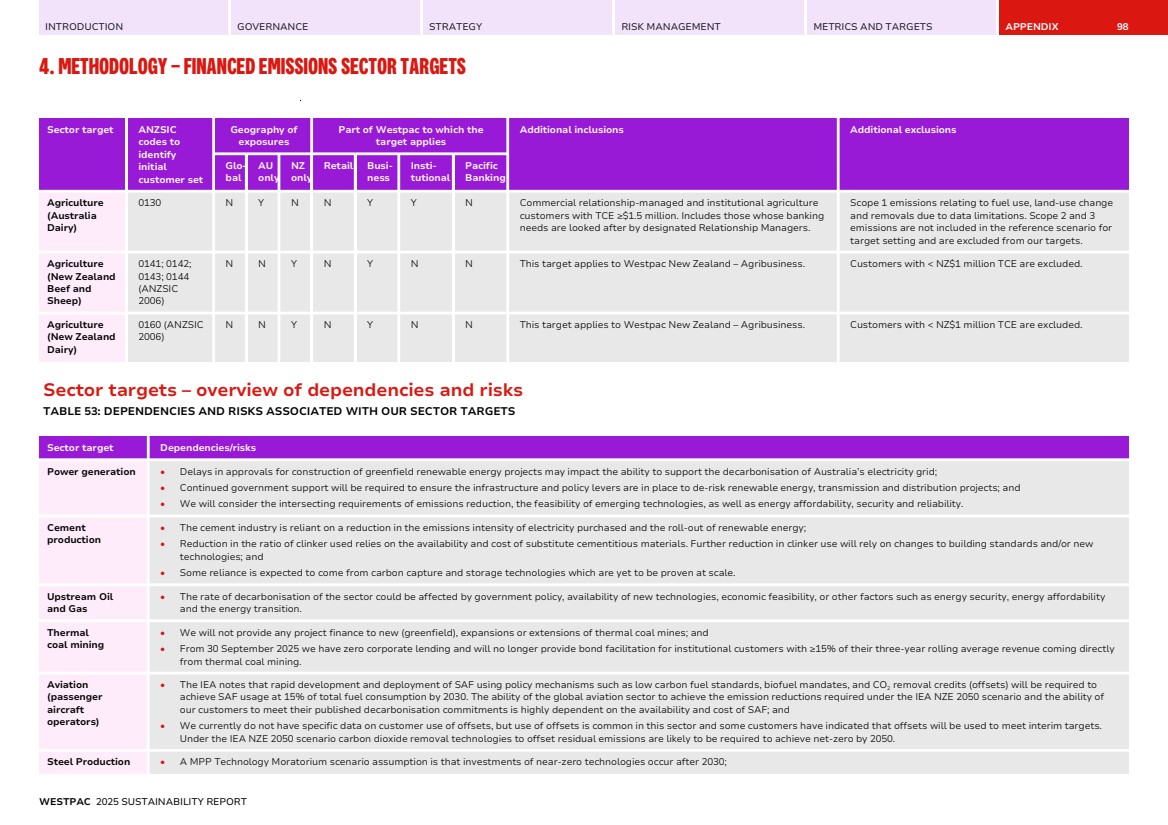
| INTRODUCTION GOVERNANCE STRATEGY RISK MANAGEMENT METRICS AND TARGETS APPENDIX 4. METHODOLOGY – FINANCED EMISSIONS SECTOR TARGETS 99 Sector target Dependencies/risks • Electrical grid not decarbonising at pace; • Particularly in the steel sector, there are inconsistencies between producers related to emissions boundaries. Progress is being made to establish a more consistent boundary between producers; and It is possible this boundary re-scoping may impact how pathways are calculated and/or the emissions of customers. Aluminium • Decarbonisation before 2030 may be constrained by: – Availability of technology to decarbonise emissions from alumina refining and aluminium smelting emissions (Scope 1); – Electrical grid capacity to electrify alumina refining processes; – Electrical grid not decarbonising at pace; – A sufficient supply of firmed lower carbon energy source; and – Contracted electricity supply from higher emissions sources. Commercial Real Estate (Offices) • A significant part of the reduction is expected through grid decarbonisation, with additional contributions from on-site renewable energy and energy efficiency. We expect additional reductions from providing finance for customers as they develop and implement their transition plans. Residential Real Estate (Australia) • The target is heavily dependent on decarbonisation of the electricity grid. Achievement of the target is unlikely if the grid does not decarbonise as quickly as expected. Agriculture – Australia Beef and Sheep The following government-led initiatives relating to the agriculture and land sector may impact our modelling and target-setting in the future: • ABS Agricultural Statistics Program modernisation: Following a joint ABS-ABARES review, a number of initiatives are underway which may change the source statistics used in modelling, with a knock-on impact on methodology; • Climate Change Authority Sector Pathways Review: This review is looking at technology transition and emissions pathways to support Australia’s transition to net-zero by 2050. This review may result in the publication of emission factors for the agriculture sector which may be more appropriate for our modelling than our current data; • Agriculture and Land Sectoral Plan: Net-zero plan released by the Australian Government, which outlines how transitioning to a net-zero economy can be achieved. The plan details how agriculture will contribute to reaching the national goal, and looks to identify risks associated with climate change and opportunities for the industry; • Ag2050 Scenarios Report: Modelling by CSIRO to explore plausible alternative futures for Australian agriculture, to motivate discussions and encourage collaboration across the industry with a view to driving long-term transformative system change; • Emissions and reporting standards: Development of emissions and reporting standards by the Australian Government, influencing future development of GHG calculators and tools, as we continue to assess how to incorporate customer dataa; and • Improving Consistency of On-farm Emissions Estimates Program: Funded by 2024-25 Budget to assist the agriculture sector to reduce emissions and further contribute to the whole-of-economy transition to net-zero.b We will continue to monitor these initiatives and update our assumptions and methodologies as required. Agriculture – Australia Dairy Agriculture – New Zealand Beef and Sheep • Our customers' ability to adopt efficiency and productivity improvements in farming systems; and • Seasonal variations which may affect farm practices, meaning the path to our target is unlikely to be linear. Agriculture – New Zealand Dairy a. Voluntary emissions estimation and reporting standards – Agriculture and Land - DCCEEW b. Improving Consistency of On-farm Emissions Estimates Program - DAFF WESTPAC 2025 SUSTAINABILITY REPORT |
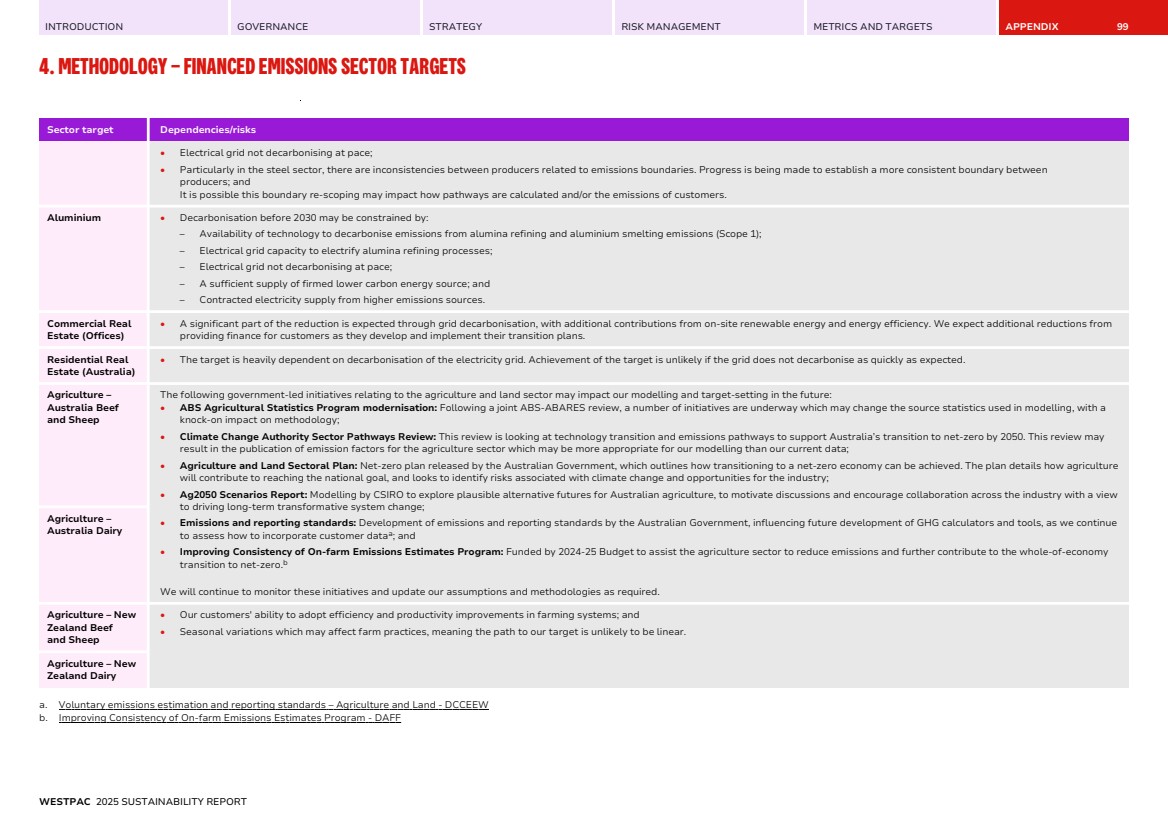
| INTRODUCTION GOVERNANCE STRATEGY RISK MANAGEMENT METRICS AND TARGETS APPENDIX 4. METHODOLOGY – FINANCED EMISSIONS SECTOR TARGETS 100 Sector targets – methodologies and additional information Power generation 2030 Target: 0.10 tCO2-e/MWh for Scope 1 and 2 by 2030 a 62% reduction from a 2021 baseline. Metric: Sector-specific emissions intensity for client’s scope 1 and 2 emissions – tCO2-e (tonnes of carbon dioxide equivalent) per Megawatt hour (MWh). SECTORAL DECARBONISATION APPROACH: This target was set using the CSIRO/ClimateWorks Australia Hydrogen Superpower Scenario (2021) from the multi- sector energy modelling report published in July 2021. NET-ZERO REFERENCE SECTOR PATHWAY(S) AND APPROACH TO PATHWAY DEVELOPMENT: CSIRO/ClimateWorks Australia Hydrogen Superpower Scenario (2021) derived from the multi-sector energy modelling report published in July 2021. The CSIRO/ClimateWorks Australia Hydrogen Superpower scenario was chosen as the emissions attributable to our power generation portfolio are heavily weighted to Australian customers. The scenario determines the most efficient manner to achieve the economy-wide decarbonisation required to meet a 1.5°C carbon budget. This means the scenario must focus on both power generation and the sector’s role in supporting decarbonisation of the wider economy. Key assumptions of the CSIRO/ClimateWorks Australia Hydrogen Superpower reference scenario include: • There will be a high uptake of electrification and energy efficiency improvements to 2030, with a rapid increase in the capacity of renewable energy technologies; • Coal power capacity is expected to be reduced significantly by 2030 and phased out from the energy system by 2035; • Low-cost and abundant renewable energy strengthens Australia’s green hydrogen production from 2030, enabling export opportunities; and • Accelerated growth in renewable energy capacity will be required to enable transition of energy sources away from fossil fuels. METHODOLOGY: To estimate the emissions intensity associated with this sector, we use customer level data at 30 September 2024. TCE data is at 30 September 2024. Emissions intensity data is cumulative, reflecting a 12-month period. To estimate customer Power generation intensity, we use a weighted average emissions intensity for power generation customers, weighted using the TCE for each customer. The emissions intensity for each customer is the scope 1 and 2 emissions (tCO2-e) of its electricity generation, divided by electricity generated (MWh). For Australian customers, we use data reported under the NGER scheme, excluding batteries (sourced from Clean Energy Regulator website using the Greenhouse and energy information by designated generation facility 2022-23 dataset). An average emissions intensity is applied to wind and solar generation projects where data is not yet available under NGER or the NGER- calculated intensity for the project is more than twice the industry average. The average emissions intensity applied is the average of all generation facilities for which ‘Primary fuel’ under NGER is wind or solar respectively. This typically occurs for projects in construction for all or part of the reporting period. For international and Westpac New Zealand customers, data is sourced from customer reporting, where available. If this information is not available, the relevant Australian average emissions intensity is applied to wind and solar generation projects as above. Cement production 2030 Target: 0.57 tCO2-e/tonne of cement by 2030. Metric: Sector-specific emissions intensity for companies’ scope 1 and 2 emissions – tCO2-e per tonne of cement produced from in-house produced clinker. SECTORAL DECARBONISATION APPROACH: This target was set using the Science-based Targets Initiatives (SBTi) Cement Target Setting Guidance – Sectoral Decarbonisation Approach (SDA), 2022. NET-ZERO REFERENCE SECTOR PATHWAY(S) AND APPROACH TO PATHWAY DEVELOPMENT: The SBTi reference pathway was chosen as it provides regional granularity which is aligned to the geographic location of customers we lend to in this sector. The SBTi recommends a Sectoral Decarbonisation Approach (SDA) for setting targets in this sector. The target is calculated using a 2050 convergence approach; after establishing a base year, the physical intensity pathway converges with the sector average intensity by 2050. Using the SBTi calculator and the most recent industry baseline intensity, 0.77 tCO2-e/tonne cement (Cement Industry Federation, Australian Cement Report, August 2020, emissions intensity from on-site clinker in 2018-19.) the pathway reaches a 2030 emissions intensity of 0.57 tCO2-e/tonne cement. Key assumptions of the SBTi reference scenario include: • To 2030, emissions reductions are within conventional technologies. The key decarbonisation levers are substitution of clinker for alternative lower emissions materials, energy efficiency gains and fuel switching; • Emissions reduction in the built environment will be achieved through building material efficiency improvements, e.g., through recycling concrete or designing buildings to require less concrete. This in turn restricts growth in cement demand; • The IEA NZE assumes that by 2030, 9% of global cement production is equipped with innovative technologies, such as carbon capture usage and storage; and • It is assumed that the general trend in electricity consumption for cement manufacturing is in line with electricity consumption for all heavy industries. However, the scope 2 emissions global pathway for cement is adjusted to reflect comparatively slower growth of cement demand. METHODOLOGY: To calculate the emissions intensity of customers, we use customer level data where it is publicly available or able to be estimated from other sources. We used the latest available data for customers at 30 September 2024. TCE WESTPAC 2025 SUSTAINABILITY REPORT |
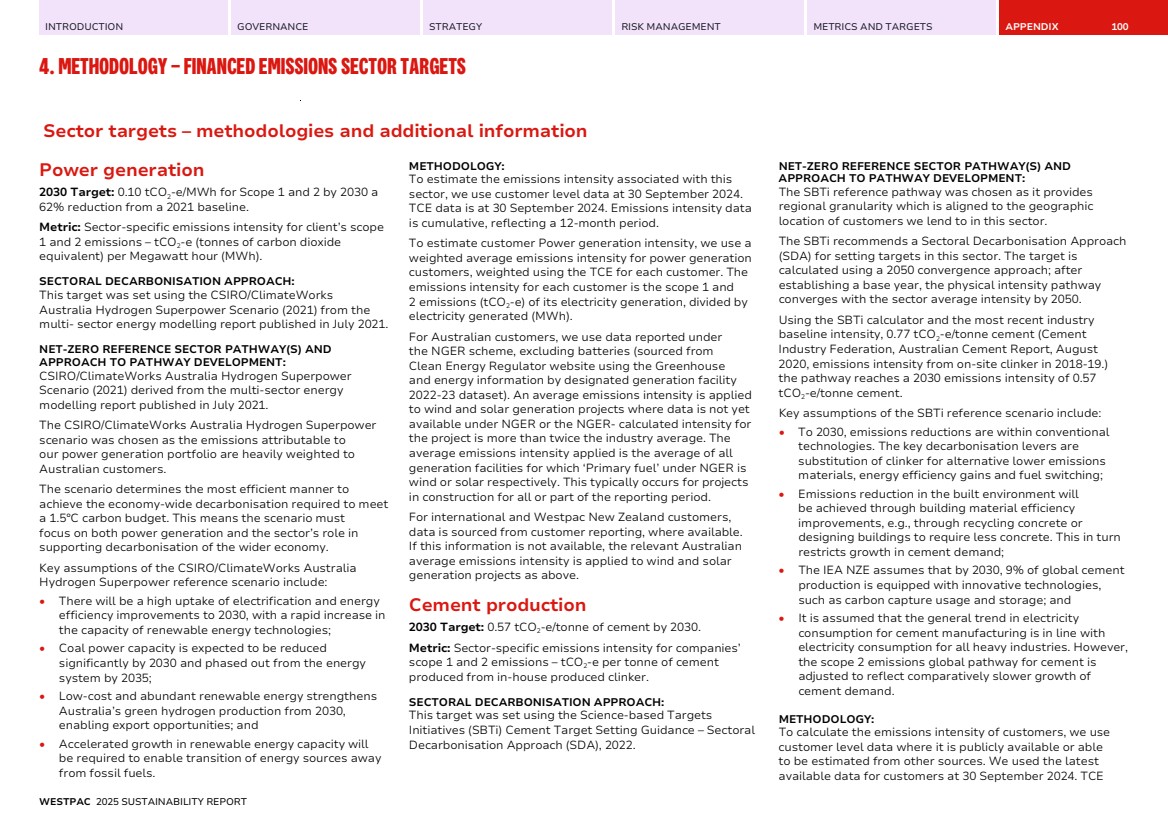
| INTRODUCTION GOVERNANCE STRATEGY RISK MANAGEMENT METRICS AND TARGETS APPENDIX 4. METHODOLOGY – FINANCED EMISSIONS SECTOR TARGETS 101 data is at 30 September. As customers’ reporting cycles often differ from Westpac’s, the bank selects the 12-month period ending prior to 30 September to align this data most closely with Westpac’s reporting periods. Our cement portfolio physical emissions intensity is estimated as the weighted average physical emissions intensity of customers. Customer physical intensity is weighted by the relative contribution of each in-scope customer’s absolute financed emissions to our absolute financed emissions for the sector. Absolute financed emissions for in-scope customers is calculated by using a customer’s absolute emissions from cement production and then attributing Westpac’s share using customer in-scope lending proportionate to customer EVIC. Upstream oil and gas 2030 Target: 23% reduction in scope 1, 2 and 3 absolute financed emissions by 2030 from a 2021 baseline. 9.2 MtCO2- e in 2021 to 7.1 MtCO2-e in 2030. Metric: Absolute financed emissions for client’s scope 1, 2 and 3 emissions – MtCO2-e. SECTORAL DECARBONISATION APPROACH: This target was set using IEA NZE 2050 scenario (2021) complemented with CSIRO/ClimateWorks Australia, Hydrogen Superpower scenario (2021). NET-ZERO REFERENCE SECTOR PATHWAY(S) AND APPROACH TO PATHWAY DEVELOPMENT: The IEA NZE 2050 (2021) scenario and CSIRO/ClimateWorks Australia, Hydrogen Superpower scenario were selected as a combined reference pathway. This combination accurately reflects our customers and lending profile in this sector. Assumptions behind the pathway: • The decarbonisation trajectory of oil demand in the IEA NZE means no exploration for new resources is required, other than fields already committed at 18 May 2021; • No new natural gas fields are needed in the IEA NZE beyond those already committed as at 18 May 2021; • Once fields under development commence production, all upstream investment in the IEA NZE is to support operations in existing fields; and • Innovation is key to developing new clean energy technologies and advancing existing ones. Almost 50% of the emission reductions needed in 2050 in the IEA NZE depend on technologies at the prototype or demonstration stage, i.e., are not yet available on the market. In the CSIRO/ClimateWorks Australia Hydrogen Superpower scenario, a weaker push to electrify heavy industry leads to higher demand for natural gas into the 2030s, at which point a large amount of gas use begins to switch to hydrogen. METHODOLOGY: To estimate the financed emissions associated with the sector target, we use customer level data where it is publicly available. We used data for customers at 30 September 2024. TCE data is at 30 September 2024 and emissions data is cumulative, reflecting a 12-month period ending prior to 30 September 2024. To estimate customer emissions, we source customer scope 1, 2 and 3 emissions directly from customers or via publicly reported information. Where customer-level data is not available, production data is sourced from public disclosures and an emissions intensity factor (based on production) is then used to estimate customer emissions. Where production data is not available, we estimated customer scope 1 and 2 emissions by applying sector-level emissions intensity factors to customer financial information. Sector- level emissions intensity factors were derived from a combination of Australian Government Department of Agriculture, Water and the Environment – National Greenhouse Accounts – National inventory by economic sector for 2021 and ABS – National inventory by economic sector for 2021. Where production data is not available, we estimated the scope 3 emissions by applying sector level scope 3 emissions intensity factors that were derived from known revenue figures and reported emissions totals of customers in these sectors. Sector financial ratios for Australian industry sectors were based on information from financial market data providers’ data for Australian and New Zealand top companies. To attribute our share of customers’ emissions, we use a customer’s emissions and then attributing Westpac’s share using customer TCE proportional to customer EVIC. Thermal coal mining 2030 Target: Zero financed emissions by 2030, a 100% reduction from a 2021 baseline Metric: Absolute financed emissions for client’s scope 1, 2 and 3 emissions – MtCO2-e (million tonnes of carbon dioxide equivalent). SECTORAL DECARBONISATION APPROACH: This target was set using IEA NZA 2050 Scenario (2021). NET-ZERO REFERENCE SECTOR PATHWAY(S) AND APPROACH TO PATHWAY DEVELOPMENT: IEA NZE 2050 scenario (2021) • We selected an absolute financed emissions target. Thermal coal use in power generation is expected to be replaced by other energy sources and so an intensity target is not suitable. • The IEA NZE reference scenario results in a 70% reduction to 2030 on a FY20 baseline. Our target is below this pathway, with a 100% reduction (a reduction to zero). METHODOLOGY: To calculate the financed emissions associated with the sector target, we use customer level data where it is publicly available. We used data for the customers at 30 September 2024. TCE data is at 30 September 2024 and emissions data is cumulative, reflecting a 12-month period ending prior to 30 September 2024. Production data and emissions data for customers will be the most recent public data available as at 30 September 2024. Absolute financed emissions by customer are estimated by using a customer’s Scope 1, 2 and 3 emissions from thermal coal mining and then attributing Westpac’s share using customer TCE proportionate to customer EVIC. Scope 1, 2 and 3 emissions data is sourced from customer reporting, or if not available production data is sourced from public disclosures and an emissions intensity factor (based on production, sourced from the National WESTPAC 2025 SUSTAINABILITY REPORT |
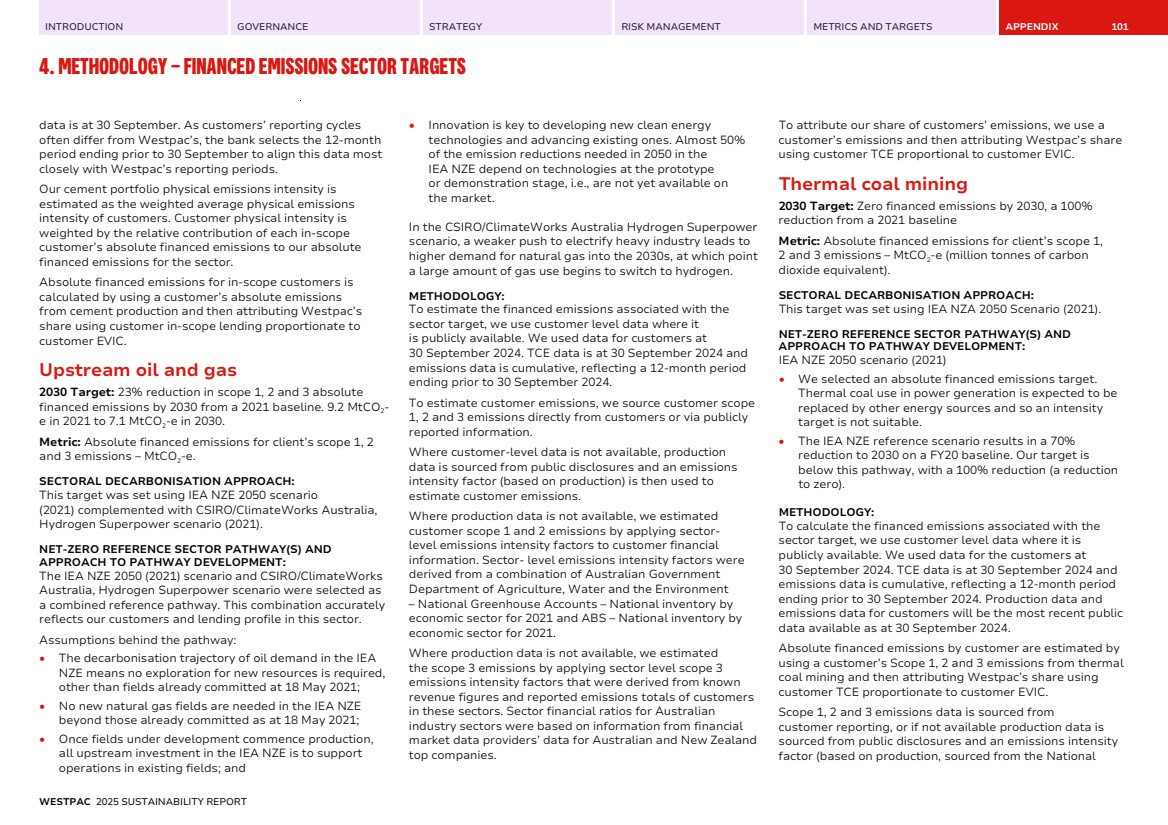
| INTRODUCTION GOVERNANCE STRATEGY RISK MANAGEMENT METRICS AND TARGETS APPENDIX 4. METHODOLOGY – FINANCED EMISSIONS SECTOR TARGETS 102 Greenhouse Account Factors) is then used to estimate customer emissions. Where customer production data is not available, we estimate customer emissions by applying sector-level emissions intensity factors to production estimates which are sourced from a third-party data provider. Aviation (passenger aircraft operators) 2030 Target: 76.4 gCO2-e/passenger kilometre for Scope 1 by 2030. A 60% reduction from a 2021 baseline. Metric: Sector-specific emissions intensity for customer’s scope 1 emissions – gCO2-e (grams of carbon dioxide equivalent) per passenger kilometre. SECTORAL DECARBONISATION APPROACH: The target was set using the IEA NZE 2050 scenario, 2021. NET-ZERO REFERENCE SECTOR PATHWAY(S) AND APPROACH TO PATHWAY DEVELOPMENT: The scenario projects emissions1 and activity2 data for global aviation to model a decarbonisation pathway. We have selected the IEA NZE 2050 modelled emissions intensity as our target, which was calculated as sector emissions divided by sector activity and appropriately represents the customers in our portfolio. Key assumptions of the IEA NZE 2050 reference scenario include: • The use of sustainable aviation fuels (SAF) increases to around 15% of total fuel consumption by 2030. The rapid development and deployment of SAF required in this scenario requires policy changes such as low carbon fuel standards, biofuel mandates, and CO2 removal credits (offsets); • Implementation of operational improvements, coupled with fuel efficiency technologies for both airframes and engines, are expected to limit the growth of aviation fuel demand; • While air travel is assumed to grow at around 3% per annum through to 2050, growth is expected to be constrained by implementation of government policies. Globally, the policies are expected to promote a shift towards high-speed rail from regional flights (may be less common in SE Asia and Oceania), and a reduction in long-haul business travel using, for example, taxes on commercial passenger flights; • Overall, global CO2 emissions from aviation are expected to peak at around 950 Mt by 2025 before beginning to reduce through the above measures; • In 2050, emissions from the aviation sector are expected to account for just over 10% of unabated CO2 emissions from fossil fuels and industrial processes; and • To achieve net-zero in the sector the use of offsets may be required. METHODOLOGY: To calculate the emissions intensity of our customers, we use customer level data. We used the latest available data for the customers at 30 September 2024. TCE data is at 30 September. As customers’ reporting cycles often differ from Westpac’s, the bank selects the 12-month period ending prior to 30 September to align this data most closely with Westpac’s reporting periods. Our aviation physical emissions intensity portfolio metric is estimated by dividing total portfolio attributable emissions by the total portfolio attributable activity (passenger kilometres). Attributable emissions and attributable activity (passenger kilometres) are determined by scaling emissions and activity by an attribution factor which is equal to TCE as a proportion of EVIC. We use absolute scope 1 emissions and passenger-kilometres (activity) as reported by companies. Where customer-specific emissions or activity data from customer reporting is not available, we estimate by applying portfolio average weighted by the proportion of exposure to the specific customer. Steel production 2030 Target: 1.42 tCO2-e/tonne of steel for Scope 1 and 2 by 2030. Metric: Sector-specific emissions intensity for customers’ scope 1 and 2 emissions – tCO2-e (tonnes of carbon dioxide equivalent) per tonne of crude steel produced per annum. SECTORAL DECARBONISATION APPROACH: This target was set using Mission Possible Partnership (MPP), Technology Moratorium scenario, 2021. NET-ZERO REFERENCE SECTOR PATHWAY(S) AND APPROACH TO PATHWAY DEVELOPMENT: This scenario was selected as it has sufficient granularity around primary (includes integrated steelmaking) and secondary (includes electric steelmaking) processes, which we consider to be a critical building block for a credible steel pathway, despite being aligned to a ‘well below 2°C’ temperature ambition. This pathway is recognised within the sector and is used by a number of international banks. GFANZ guidance acknowledges the MPP pathway on steel provides detailed information on assumptions around steel production by different technologies over time. Key assumptions of the scenario include: • Investments confined to (near-) zero-emissions technologies from 2030 onwards; and • Scope 1 and 2 steel emissions and scope 3 metallurgical coal emissions are assumed to decline at the same rate. METHODOLOGY: To calculate the emissions intensity associated with the sector target, we use customer level data, when publicly available. We used data for the customers as at 30 September 2024. TCE data is a point in time as at 30 September 2024 and emissions data is cumulative, reflecting a 12-month period ending prior to 30 September 2024. Production data and emissions data for customers will be the most recent public data available as at 30 September 2024. Our steel emissions intensity is estimated by dividing total attributable portfolio emissions by total attributable portfolio production. Attributable emissions are determined by calculating an attribution factor that is then multiplied by customers’ total emissions and total production. The attribution factor is equal to TCE as a proportion of EVIC. Total attributable portfolio emissions is equal to the sum of all attributable emissions and total attributable portfolio production is equal to the sum of all attributable production. 1 Data from Table A.4: CO2 emissions for aviation, IEA NZE 2050 October 2021 4th revision, page 199. 2 Data from Table A.5: Economic and Activity indicators for aviation, IEA NZE 2050 October 2021 4th revision, page 200. WESTPAC 2025 SUSTAINABILITY REPORT |
| INTRODUCTION GOVERNANCE STRATEGY RISK MANAGEMENT METRICS AND TARGETS APPENDIX 4. METHODOLOGY – FINANCED EMISSIONS SECTOR TARGETS 103 Aluminium 2030 target: 10.35 tCO2-e/tonne of primary aluminium produced. Metric: Sector-specific emissions intensity for customer’s scope 1 and 2 emissions – tCO2-e (tonnes of carbon dioxide equivalent) per tonne of primary aluminium produced per annum. SECTORAL DECARBONISATION APPROACH: This target was set using the International Aluminium Institute (IAI) 1.5°C pathway. NET-ZERO REFERENCE SECTOR PATHWAY(S) AND APPROACH TO PATHWAY DEVELOPMENT: The International Aluminium Institute (IAI) 1.5°C pathway is a global, 1.5-degree aligned reference pathway. The pathway incorporates all production processes including bauxite mining, alumina refining and aluminium smelting. The IAI provides separate pathways for primary aluminium and secondary aluminium. We have applied the primary aluminium pathway as it most accurately represents our customers’ reported activities. We have adjusted this pathway to reflect our target boundary by excluding bauxite mining and scope 3 activities. The availability of a secondary pathway will allow Westpac the flexibility to include secondary production in future target boundary expansion where relevant. A key assumption of this reference pathway is that aluminium demand will grow by 55% by 2050, the increase met predominantly by secondary production. A lack of post-consumer scrap means primary production will still be required into the second half of the century. The carbon intensity of primary metal under the 1.5-degree pathway reduces from 16.1 tCO2-e/t Primary aluminium in 2018 to 0.5 tCO2-e/t Primary aluminium by 2050, and total greenhouse gas emissions from the aluminium sector are expected to be 53 million tonnes, down from 1.1 billion tonnes in 2018. Decarbonisation levers for aluminium production include: • Electricity decarbonisation; • Direct emissions reduction from anode consumption in smelting, and fuel combustion across all production processes; and • Recycling and resource efficiency. No aluminium is lost to landfills or incinerators due to better collection systems by 2050. METHODOLOGY: To calculate the emissions intensity associated with the sector target, we use customer and asset level data, when publicly available. We used data for the customers available as at 30 September 2024. TCE data is a point in time as at 30 September 2024 and emissions data is cumulative, reflecting a 12-month period ending prior to 30 September 2024. Production data, emissions data, and financial data for customers is the most recent public data available as at 30 September 2024. To estimate our aluminium portfolio intensity we use a weighted average emissions intensity, weighted using the TCE for each customer in the portfolio. The total emissions intensity for each customer is the scope 1 and 2 emissions from alumina refining, divided by tonnes of alumina production, and the scope 1 and 2 emissions from aluminium smelting, divided by tonnes of aluminium produced. The emissions intensity for alumina is expressed in terms of aluminium equivalent, using the industry recognised factor of 1.9 tonnes alumina production per 1.0 tonne of aluminium production. Commercial real estate (offices) Target: Reduce scope 1 and 2 emissions intensity for Australian and New Zealand Commercial real estate Offices by 59% to 25 kgCO2-e/m2 net lettable area SECTORAL DECARBONISATION APPROACH: This target was set using the IEA NZE 2050 scenario, 2021. NET-ZERO REFERENCE SECTOR PATHWAY(S) AND APPROACH TO PATHWAY DEVELOPMENT: IEA NZE 2050 scenario, 2021. IEA NZE is a 1.5°C aligned decarbonisation reference scenario for the building sector at a global level and is based on a global dataset for building energy demand, energy sector emissions and building area. Key assumptions of the IEA NZE reference scenario include: • Electrification and energy efficiency are the two drivers of decarbonisation of the sector. That transformation relies primarily on technologies already available, including improved envelopes for new and existing buildings, heat pumps and energy-efficient equipment and appliances; • Increasing electrification of space heating and water heating; • Rapid shifts to zero-carbon-ready technologies enable the share of fossil fuels in energy demand to fall significantly; and • By 2030, around 20% of the existing building stock worldwide will be retrofitted and all new buildings will comply with zero-carbon-ready building standards. Carbon pricing is introduced across all regions. Operational emissions in offices mainly arise from electricity consumption. The IEA NZE scenario identifies a number of variables that are expected to contribute to a decarbonisation pathway in the commercial real estate sector, such as the pace of electrification of building equipment and central services, decarbonisation of the grid through increased renewable generation, and expected energy demand. We calculated the target as a 59% reduction in emissions intensity (kgCO2-e/m2 net lettable area) by 2030 from a 2022 baseline, based on the decarbonisation pathway laid out in the IEA NZE scenario. METHODOLOGY: To estimate the emissions intensity of our customers, where possible, we use customer level data. We used the most recently available data for our customers as at 30 September 2024. TCE data is at a point in time as at 30 September. As customers’ reporting cycles often differ from Westpac’s, the bank selects the 12-month period ending either on 30 June or 31 December to align this data most closely with Westpac’s reporting periods. Our Commercial Real Estate (offices) physical emissions intensity is estimated by taking the TCE weighted average emissions intensity for in-scope facilities. Each in-scope facility’s emissions intensity is multiplied by its weight in Westpac’s in-scope lending portfolio for the sector to determine the weighted average emissions intensity. • Scope 1 and 2 emissions for our customers' facilities is based on information collected on, or disclosed by, customers, where available; and WESTPAC 2025 SUSTAINABILITY REPORT |
| INTRODUCTION GOVERNANCE STRATEGY RISK MANAGEMENT METRICS AND TARGETS APPENDIX 4. METHODOLOGY – FINANCED EMISSIONS SECTOR TARGETS 104 • Where customer data was not available we have applied a proxy value determined from the Australian Built Environment Rating System (NABERS) rating register (extracted on 1 April 2025 from the NABERS website) for Australian customer facilities, or the New Zealand Green Building Council for New Zealand customer facilities. The Australian proxy value estimates the emissions intensity of the 'below average' assets (with a rating between 0 and 4.5 Stars) from the NABERS rating register, and calculates the area-weighted average emission intensity. For the New Zealand proxy, we have used a value obtained from the NZ Green Building Council, based on the NABERSNZ benchmarking report from 2013. Residential real estate (Australia) Target: 15.2 kgCO2-e/m2 attributed floor area. SECTORAL DECARBONISATION APPROACH: 2050 convergence approach, using Carbon Risk Real Estate Monitor (CRREM) Australia Multi-family homes (MFH) scenario, 2023. NET-ZERO REFERENCE SECTOR PATHWAY(S) AND APPROACH TO PATHWAY DEVELOPMENT: • The CRREM pathways have been developed in partnership with the Science Based Targets Initiative (SBTi) as part of a technical collaboration to provide 1.5°C in-use emissions decarbonisation pathways for the buildings sector; • CRREM has derived country-specific carbon reduction pathways by downscaling the IEA NZE 2050 scenario; • The assumed rate of grid decarbonisation appears to be conservative compared to the rate of expected grid decarbonisation in Australia; and • Westpac’s baseline emissions intensity may not be directly comparable with CRREM due to differences in methodologies and assumptions. METHODOLOGY: Westpac does not currently capture customer-level emissions data, as a result proxies have been used to estimate emissions for residential buildings. Data sources: • Energy consumption data was sourced from the Australian Energy Regulator’s residential customers electricity and gas benchmark report 2020; • To apportion energy consumption between dwelling types, used the ABS Household Energy Consumption Survey, Australia 2013; • Electricity and gas emission factors were sourced from FY24 National Greenhouse Accounts Factors; and • Floor area for the majority of our portfolio is from external providers. Calculation methodology: The approach to estimating emissions depends on availability of data: • Where floor area is known, building emissions were estimated as a function of energy consumption per floor area for each dwelling type and State, floor area, and energy emission factors by State; and • Where floor area was unknown, building emissions were estimated as a function of energy consumption per dwelling type and State, number of buildings, and energy emission factors by State. These approaches are in line with PCAF data quality scores 4 and 5, respectively. • To calculate the emission intensity, where floor area was unknown, floor area was estimated using the average of known floor area by State and dwelling type; and • The portfolio emission intensity was calculated by dividing sum of attributed scope 1 and 2 emissions by attributed floor area. The attribution factor is calculated using the loan-to-value ratio (outstanding balance divided by value at origination). Agriculture (Australia Beef and Sheep) Target: 20.66 tCO2-e/tonne of FW. Sector-specific emissions intensity for customers' scope 1 emissions related to land management tCO2-e (tonnes of carbon dioxide equivalent) per tonne of Fresh Weight (FW) of carcase, where carcase is defined as animal meat, fresh, chilled or frozen, with bone in. SECTORAL DECARBONISATION APPROACH: Relative reduction approach, using Science Based Targets Initiative (SBTi) Forest, Land and Agriculture (FLAG) Oceania Beef Commodity Land Management pathway, 2022. NET-ZERO REFERENCE SECTOR PATHWAY(S) AND APPROACH TO PATHWAY DEVELOPMENT: Selection considerations: • Alignment to the 1.5°C ambition; a specific UNEP FI Guidelines For Climate Target Setting for Banks (April 2021) requirement; • Commodity granularity and informed as much as possible by Australian data; • Data and modelling methodology limitations inherent to the sector; • Complexity of the Scope 1 emissions profile in agriculture, containing three categories (Land Management, Land Use Change and Removals) with distinctly different abatement opportunities and data challenges; • Variability of agricultural production systems, emissions sources and abatement opportunities across the globe; and • Variability of production outputs dependent on climatic and market conditions. Pathway key assumptions: • Emissions reductions will follow different pathways for major agricultural commodities and regions. This enables target-setting to focus on the majority of the sector’s emissions (beef/sheep meat and dairy) as well as providing a level of specificity to the emissions profile of Australian agriculture; • Emissions reduction pathways are distinct for three emissions categories (Land Management, Land Use Change and Removals). This enables target-setting to focus on the majority of the sector’s emissions (Land Management category) and reduce the immediate data challenges (by keeping Land Use Change and Removals separate); • The SBTi FLAG pathway supports target setting on an emissions-intensity basis; WESTPAC 2025 SUSTAINABILITY REPORT |
| INTRODUCTION GOVERNANCE STRATEGY RISK MANAGEMENT METRICS AND TARGETS APPENDIX 4. METHODOLOGY – FINANCED EMISSIONS SECTOR TARGETS 105 • Agricultural production increases to 2050 (per SBTi FLAG Guidance); and • The SBTi FLAG pathway is within the IPCC greenhouse gas budgets for CO2 , methane and nitrous oxide. METHODOLOGY: We have used the following data and steps to generate an emissions intensity: 1. Obtain 2023 State/Territory emissions data for beef and sheep from Australia’s National Greenhouse Accounts (NGA); 2. The emissions data is converted to an emissions intensity by using 2023 Australian meat production for beef and sheep from the Australian Bureau of Agriculture and Resource Economics and Sciences (ABARES), apportioned to state production by the count of animals for each State and Territory in the 2023 Activity Tables used by the NGA; 3. These State-based emissions intensities are applied to each customer based on their State location and weighted by their contributions to total portfolio TCE; and 4. Emissions baseline is the sum of weighted emissions intensities from customers. The methodology and data used are the best available, though we acknowledge the limitations and assumptions which have been applied in our calculations. The methodology and data used have been developed to produce an emission intensity metric with the same unit as the SBTi FLAG pathway. The use of a TCE weighting provides a mechanism for reflecting the composition of our portfolio. ABARES and NGA are reputable sources of data informed by industry research. We will seek to address data limitations and improve our emissions intensity calculation through our ongoing engagement with customers, government and industry, although progress will depend on data availability and stakeholder collaboration. Agriculture (Australia Dairy) Target: 0.85 tCO2-e/tonne of FPCM. Metric: Sector-specific emissions intensity for clients' scope 1 emissions related to land management tCO2-e (tonnes of carbon dioxide equivalent) per tonne of Fat Protein Corrected Milk (FPCM). FPCM is milk corrected for its fat and protein content to a regional standard. SECTORAL DECARBONISATION APPROACH: Relative reduction approach, using Science Based Targets Initiative (SBTi) Forest, Land and Agriculture (FLAG) Oceania Dairy Commodity Land Management pathway, 2022. NET-ZERO REFERENCE SECTOR PATHWAY(S) AND APPROACH TO PATHWAY DEVELOPMENT: Selection considerations: • Alignment to the 1.5°C ambition; a specific UNEP FI Guidelines For Climate Target Setting for Banks (April 2021) requirement; • Commodity granularity and informed as much as possible by Australian data; • Data and modelling methodology limitations inherent to the sector; • Complexity of the scope 1 emissions profile in agriculture, containing three categories (Land Management, Land Use Change and Removals) with distinctly different abatement opportunities and data challenges; • Variability of agricultural production systems, emissions sources and abatement opportunities across the globe; and • Variability of production outputs dependent on climatic and market conditions. Pathway key assumptions: • Emissions reductions will follow different pathways for major agricultural commodities and regions. This enables target-setting to focus on the majority of the sector’s emissions (beef/sheep meat and dairy) as well as providing adequate specificity to the emissions profile of Australian agriculture; • Emissions reduction pathways are distinct for three emissions categories (Land Management, Land Use Change and Removals). This enables target-setting to focus on the majority of the sector’s emissions (Land Management category) and reduce the immediate data challenges (by keeping Land Use Change and Removals separate; GHG Protocol Land Sector Guidance in draft currently); • The SBTi FLAG pathway supports target setting on an emissions intensity basis; • Agricultural production increases to 2050 (per SBTi FLAG Guidance); and • The SBTi FLAG pathway is within the IPCC greenhouse gas budgets for CO2 , methane and nitrous oxide. METHODOLOGY: We have used the following data and steps to generate an emissions intensity: 1. Obtain 2023 State/Territory emissions data for dairy from Australia’s National Greenhouse Accounts (NGA); 2. The emissions data is converted into an emissions intensity by using 2023 State milk production from the Australian Bureau of Agriculture and Resource Economics and Sciences (ABARES), converted to fat and protein corrected milk (FPCM); and 3. These State-based emissions intensities are applied to each customer based on their State location and weighted by their contributions to total portfolio TCE. 4. Emissions baseline is the sum of weighted emissions intensities from customers. The methodology and data used are the best available, though we acknowledge the limitations and assumptions which have been applied in our calculations. The methodology and data used have been developed to produce an emission intensity metric with the same unit as the SBTi FLAG pathway. The use of a TCE weighting provides a mechanism for reflecting the composition of our portfolio. ABARES and NGA are reputable sources of data informed by industry research. We will seek to address data limitations and improve our emissions intensity calculation through our ongoing engagement with customers, government and industry, although progress will depend on data availability and stakeholder collaboration. WESTPAC 2025 SUSTAINABILITY REPORT |
| INTRODUCTION GOVERNANCE STRATEGY RISK MANAGEMENT METRICS AND TARGETS APPENDIX 4. METHODOLOGY – FINANCED EMISSIONS SECTOR TARGETS 106 Agriculture (New Zealand Beef and Sheep) Target: Reduce land management emissions intensity by 9% to 18.0 tCO2-e/t Fresh Weight. SECTORAL DECARBONISATION APPROACH: Yes NET-ZERO REFERENCE SECTOR PATHWAY(S) AND APPROACH TO PATHWAY DEVELOPMENT: Science Based Targets Initiative (SBTi) Forest, Land and Agriculture (FLAG) Oceania Beef Commodity Land Management pathway 2022. Required sector rate of reduction was used to determine pathway to 2030 target. The reference pathway has three independent categories. The land management (on farm emissions) category was used. Due to data limitations land use change and carbon removal (on farm sequestration) categories were excluded from the reference pathway calculations. The beef commodity pathway was used, SBTi FLAG does not have a sheep-specific pathway but we have included sheep farming in our target because it was deemed appropriate as sheep have very similar emission profiles as beef cattle and are farmed on similar and in a lot of cases the same farming systems in New Zealand. METHODOLOGY: To calculate the emissions intensity, customer emissions and farm area data was collected, and production data sourced. TCE data for customers was used as at 30 September 2024, TCE data is a point in time while emissions and production data is cumulative over a 12-month period. Emissions, production and financial data used for customers was the most recently available as at 30 September 2024. Farm level emissions data was collected directly from customers, when this wasn’t available or hadn’t been collected, emissions were estimated using customer livestock numbers and emission factors. Production was estimated by multiplying a customer’s farm area in hectares1 by a fresh weight per hectare factor calculated from Stats NZ data2 , this was used to calculate each customer's emission intensity. When a customer’s emissions intensity couldn’t be calculated because the necessary data wasn’t available, the average portfolio emissions intensity was applied to these customers. The overall emission intensity was calculated as a weighted average of individual customers’ emission intensities, with weights determined by each customer’s proportion of the portfolio’s TCE. Agriculture (New Zealand Dairy) Target: Reduce land management emissions intensity by 10% to 0.77 tCO2-e/t FPCM (Fat and Protein Corrected Milk). SECTORAL DECARBONISATION APPROACH: Yes NET-ZERO REFERENCE SECTOR PATHWAY(S) AND APPROACH TO PATHWAY DEVELOPMENT: Science Based Targets Initiative (SBTi) Forest, Land and Agriculture (FLAG) Oceania Dairy Commodity Land Management pathway 2022. Required sector rate of reduction was used to determine pathway to 2030 target. The reference pathway has three independent categories. The land management (on farm emissions) category was used. Due to data limitations land use change and carbon removal (on farm sequestration) categories were excluded from the reference pathway calculations. METHODOLOGY: To calculate the emissions intensity, customer emissions and production data was collected. TCE data for customers was used as at 30 September 2024, TCE data is a point in time while emissions and production data is cumulative over a 12-month period. Emissions, production and financial data used for customers was the most recently available as at 30 September 2024. Farm level emissions data was collected directly from customers, when this wasn’t available or hadn’t been collected, emissions were estimated using customer livestock numbers and emission factors. Production data measured in milk solids produced was collected directly from customers, this was used to calculate each customer's emission intensity. The emissions intensity was converted from Milk Solids to Fat and Protein Corrected Milk using a conversion factor calculated using the International Dairy Federation formula3 and national production data sourced from Dairy NZ4 . When a customer’s emissions intensity couldn’t be calculated because the necessary data wasn’t available, the average portfolio emissions intensity was applied to these customers. The overall emission intensity was calculated as a weighted average of individual customers’ emission intensities, with weights determined by each customer’s proportion of the portfolio’s TCE. 1 Farm area sourced as a one off from Stats NZ from 'Agricultural and horticultural land use 2021'. 2 Fresh Weight and livestock count sourced yearly from Stats NZ, FY24 Numbers from 'Livestock slaughtering statistics: March 2024'. 3 International Dairy Federation formula FPCM Fat & Protein ratio sourced as a one off from a 2015 paper 'Bulletin of the international dairy foundation 409/2015'. 4 National Production data sourced yearly from Dairy NZ, FY24 data from the report 'New Zealand Dairy Statistics 2023-24'. WESTPAC 2025 SUSTAINABILITY REPORT |
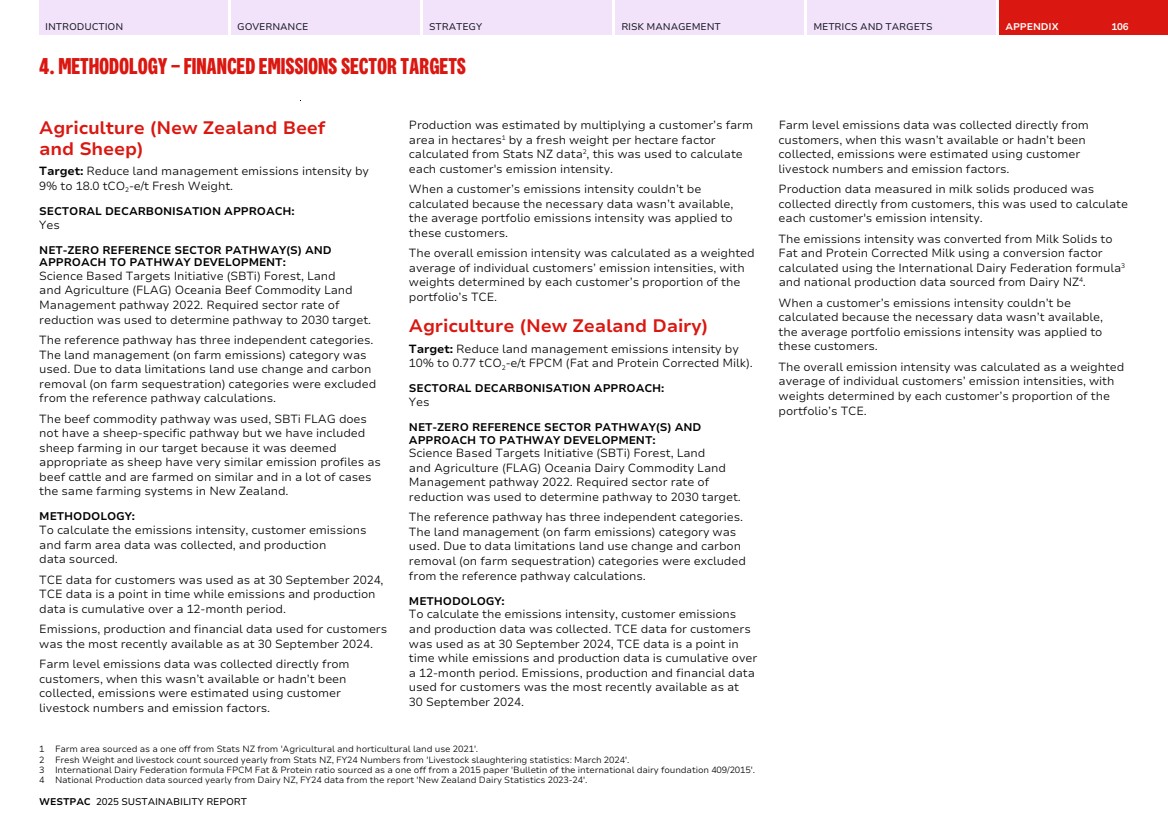
| INTRODUCTION GOVERNANCE STRATEGY RISK MANAGEMENT METRICS AND TARGETS APPENDIX 107 5. METHODOLOGY – CLIMATE-RELATED SCENARIO ANALYSIS Climate-related scenario analysis methodology Physical Risk – Retail To assess the possible implications of climate-related acute physical risks, we conducted an analysis of the exposure of our Australian mortgage portfolio to natural perils. This assessment focused on the three natural perils to some of our mortgage customers: floods, bushfires, and cyclones. The analysis leveraged a national address-level database that provides peril-specific risk insights for individual buildings and addresses across Australia. Westpac matched its mortgage portfolio to this database using unique asset location identifiers. Properties that could not be matched were excluded from the analysis. As at 31 August 2025, 5% of retail lending exposure could not be included due to system and data constraints. Properties were classified as higher risk based on their relative peril rates to the three identified perils. The database also includes forward-looking projections of weather-related perils under three IPCC Representative Concentration Pathways (RCP2.6, RCP4.5, and RCP8.5), extending to 2050. For the purposes of this analysis, the mortgage portfolio was held static – assuming no growth or change in composition – and no adaptation measures by Westpac or its customers were considered. To validate the reliability of the underlying climate data, the following methodologies were applied: • Modelled hazard data is calibrated using Synthetic Aperture Radar imagery and observed floodplain data from historical global flood events; • Assessed using proximity to bushfire-prone vegetation and validated against observed burn areas following each fire season; and • Derived from modelled wind speed data and cross-referenced with observations from the Bureau of Meteorology and other third-party sources. While floods, bushfires, and cyclones were prioritised due to their severity and relevance to household impacts, other hazards such as soil movement and storms were considered less material for this analysis. However, we recognise that this analysis provides one relative view of physical risk, and our Australian mortgage customers may be exposed to severe events or other natural perils not captured in this analysis. These exposures may translate into credit risk impacts through mechanisms such as reduced insurance availability or affordability, or asset devaluation. Transition Risk – Non-Retail Westpac’s transition risk framework assesses sector-level lending exposure to climate-related transition risks across three key categories: policy, technology, and market changes. Each category includes two risk factors, resulting in six climate transition risk factors in total. Each sector with lending exposure is assigned a 1–5 rating for each of the six risk factors, based on internal subject matter expertise. A rating of 1 indicates lower relative transition risk, while a rating of 5 indicates higher relative transition risk compared to other sectors in the economy. A sector’s overall transition risk rating is determined by taking the highest rating across the three categories (policy, technology, and market). For aggregated sectors, the average of the underlying sub-sector ratings is used for each risk factor, and the same approach is applied to determine the overall rating. Several methods were considered to convert the rating for each risk factor to a determination of heightened transition risk, both for individual sectors and at the aggregated sector level used for reporting purposes. The selected approach represents a midpoint among the options considered, balancing the need to highlight material risks while maintaining comparability across sectors. The analysis is conducted at the ANZSIC 4-digit level, using the Customer ANZSIC code to identify the primary industry of each borrower. Where unavailable, the Facility ANZSIC is used. Lending exposures without an ANZSIC code are excluded from the analysis. As at 30 September 2025, 0.44% of non-retail lending exposure lacked an associated ANZSIC code. While ANZSIC codes provide a consistent classification framework, they have limitations: • They may not fully reflect the activities of diversified businesses; • Business activities may evolve over time, making codes outdated; and • Mapping ANZSIC codes to other data sources can be complex. Scenario analysis was conducted across all sectors using three climate transition scenarios and three time horizons. This enabled extrapolation of the six risk factors over time and under different climate policy pathways. Refer to the scenarios detailed in Table 16 and metrics in Table 17 for further detail. The framework and sector ratings have undergone internal review and were benchmarked against peer disclosures and leading publications (e.g., UNEP FI’s Beyond the Horizon) to ensure alignment with emerging industry practice. Our breakdown of potential transition risks are at a high level and indicative only. We acknowledge that transition risks may affect sectors, geographies, and individual companies differently and to varying degrees, beyond what we have identified through this framework. Ultimately, these risks may lead to adverse financial outcomes such as reduced demand, lower profitability, or asset devaluation, which could impair a customer’s ability to service debt and increase credit risk. WESTPAC 2025 SUSTAINABILITY REPORT |
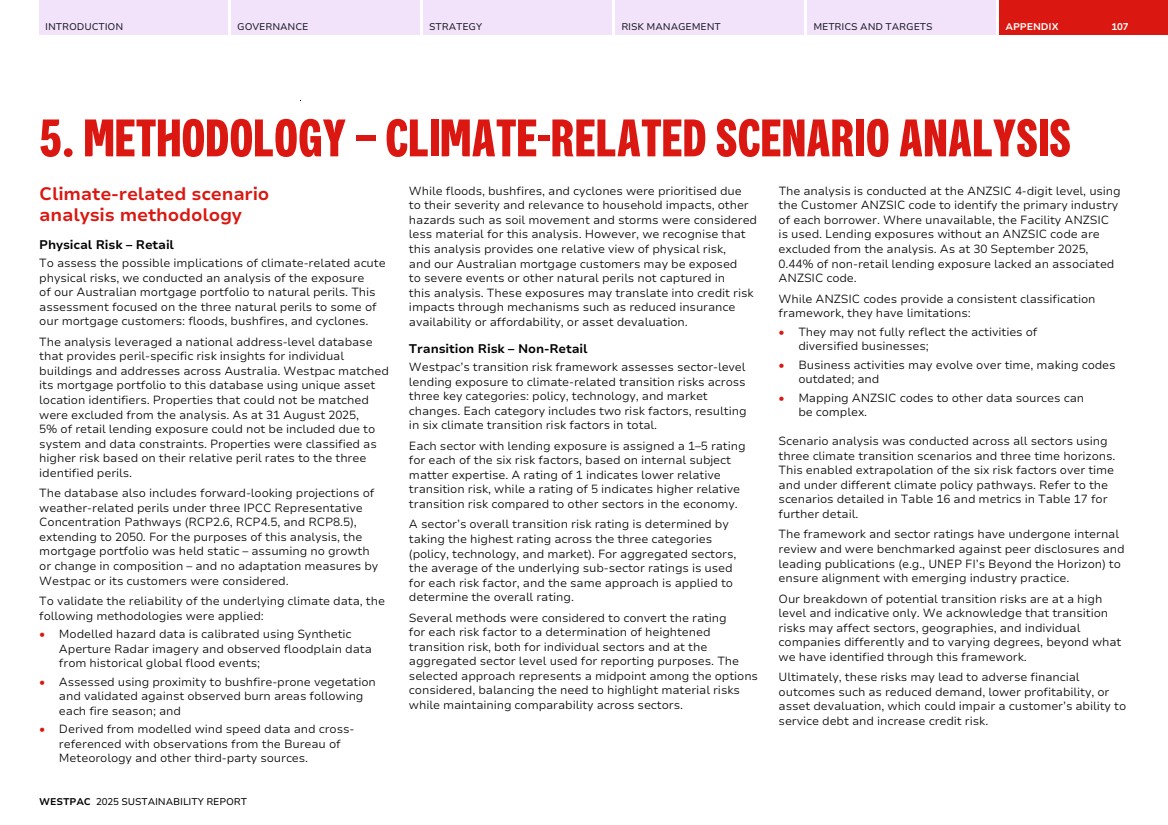
| INTRODUCTION GOVERNANCE STRATEGY RISK MANAGEMENT METRICS AND TARGETS APPENDIX 5. METHODOLOGY – CLIMATE-RELATED SCENARIO ANALYSIS 108 Physical Risk in New Zealand – Retail and Non-Retail This rainfall flooding assessment was conducted using TCE as at 30 September 2025 for each of the following three lending types: Residential Mortgages, Agricultural business and Commercial Real Estate lending. We match secured TCE with the location of properties where it is possible to do so accurately and reliably. Where we cannot match secured TCE with the location of properties, we cannot match the TCE to climate data and therefore, this has been classified as unmatched to assessed lending portfolio(s). We have carried out our FY25 analysis using new modelled rainfall flooding data sourced from our climate data partners. The metrics presented are not comparable to those presented in prior years. Rainfall flooding affects Agricultural properties used for livestock and Agricultural properties used for crops differently. Similarly, rainfall flooding affects non-industrial commercial properties (e.g., office buildings or retail premises) differently to industrial property. The sub-segments of these Agricultural and Commercial Real Estate lending portfolios were considered separately, as described below. Residential Mortgages lending: We assess a residential property’s vulnerability to rainfall flooding based on: • the potential depth of water that may inundate a property and the velocity of the modelled flood; and • the percentage of the title area that may be covered in the modelled flood. The combination of flood depth and velocity recognises that a fast moving but relatively shallow flood can be as damaging as a deep flood – over a certain depth or velocity of flood, there is limited likelihood of recovery during the flood and thus damage will likely ensue. The assessment of damage resulting from depth and velocity identify risk in different flood conditions and provide a helpful reference point for estimating the vulnerability of properties. Agricultural lending: We assess an agricultural property’s vulnerability to rainfall flooding based on: • the potential depth of the flood on the farm the percentage of the farm area that may be flooded, and the current type of farming (cropped or livestock). We assume a shallower flood will damage crops before it damages livestock farming. Note, while we use a different definition of Vulnerable depending on whether the agricultural property is used for livestock or cropped land, for the purposes of the metric in Table 20, we present a % Vulnerable across Agricultural lending as a whole. Commercial Real Estate lending: We assess a commercial real estate property’s vulnerability to rainfall flooding based on: • the potential depth of the flood on the property; • the percentage of the site area that may be flooded; and • the type of commercial real estate (non-industrial commercial property or industrial property). Industrial and warehouse buildings typically have higher wall heights and steel portal frames, which is the primary driver for the different approaches. Note, while we use a different definition of Vulnerable depending on whether the commercial property is used for non-industrial commercial property or industrial property, for the purposes of the metric in Table 20, we present a % Vulnerable to severe rainfall flooding across Commercial Real Estate lending as a whole. We recognise that Westpac NZ is exposed to physical climate-related risks more broadly, both directly and indirectly through our customers and other business activities that are not secured against property. This is outside the scope of this specific analysis. In addition, we do not currently match unsecured TCE to a physical location and therefore exclude this TCE from our analysis. WESTPAC 2025 SUSTAINABILITY REPORT |
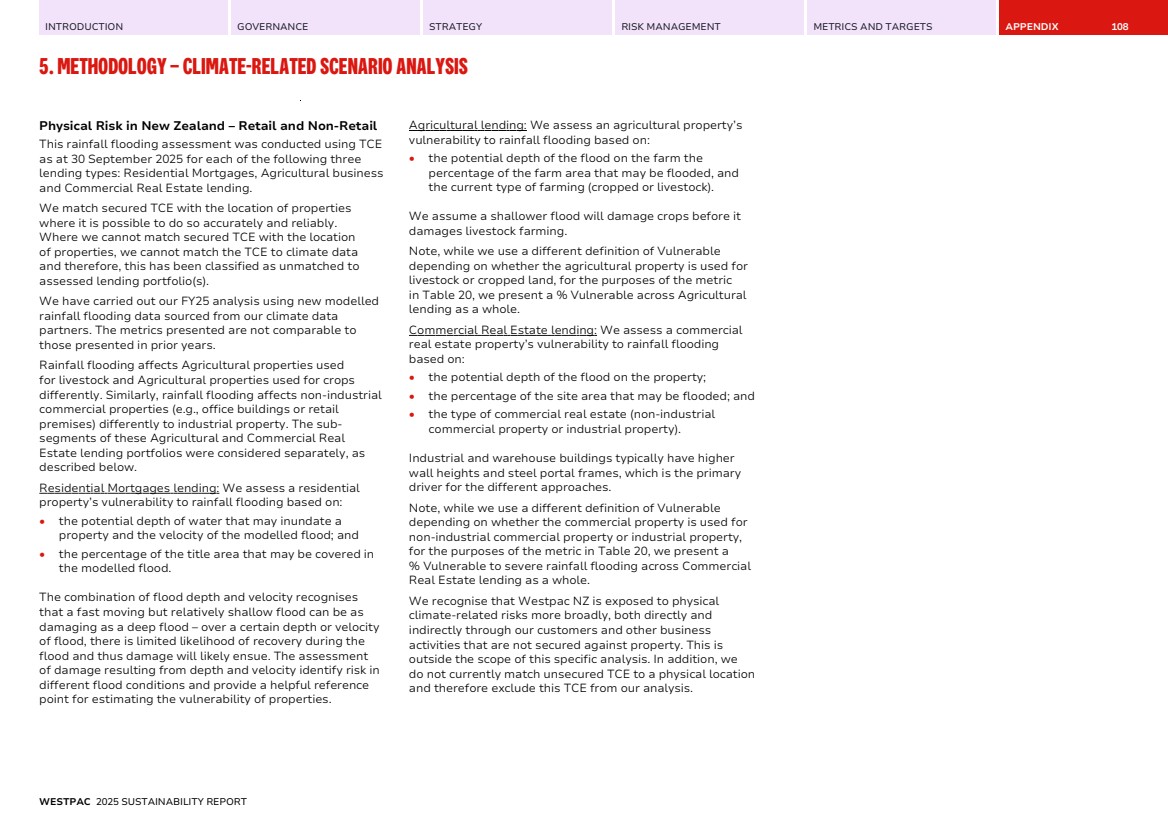
| INTRODUCTION GOVERNANCE STRATEGY RISK MANAGEMENT METRICS AND TARGETS APPENDIX 5. METHODOLOGY – CLIMATE-RELATED SCENARIO ANALYSIS 109 Scenarios we used in our scenario analyses carried out in FY25 (Australia & New Zealand) Net Zero 2050 Delayed Transition Current Policies Source of scenario • Source of transition risk: NGFS (phase 5) Net Zero 2050; • Source of physical risk: IPCC RCP2.6 (AU) and CMIP6a SSP1-2.6 (NZ); and • Source of demographic changes: SSP2 Middle of the Road (as used by the NGFS). • Source of transition risk: NGFS (phase 5) Delayed Transition; • Source of physical risk: IPCC RCP4.5 (AU) and CMIP61 SSP2-4.5 (NZ); and • Source of demographic changes: SSP2 Middle of the Road (as used by the NGFS). • Source of transition risk: NGFS (phase 5) Current Policies; • Source of physical risk: IPCC RCP8.5 and CMIP6a SSP5-8.5; and • Source of demographic changes: SSP2 Middle of the Road (as used by the NGFS). Brief description A net-zero scenario that limits global warming to 1.5°C through stringent climate policies, reaching net-zero global emissions by 2050. The global response is coordinated and orderly. A delayed transition assumes a delay in policy response to address global greenhouse gas emissions, requiring strong policies from 2030 to limit global warming to well below 2°C. A current policies scenario describes a business-as-usual (BAU) trajectory where limited action is taken to address global warming. Time horizons considered (incl. end- points and determination by year or temperature target) Scenario analysis is performed for each year from the present to an endpoint of 2050 in each scenario. Scenario analysis is performed for each year from the present to an endpoint of 2050 in each scenario. Scenario analysis is performed for each year from the present to an endpoint of 2050 in each scenario. Description of emissions reduction pathways Emissions follow an orderly trajectory, reaching net-zero global emissions by 2050. Emissions follow a disorderly trajectory, with only a moderate decline to 2030 before a steep decline approaching net-zero by 2050. Emissions follow a downward trajectory, aligned to current policy ambition; however, a significant volume of emissions continue to enter the atmosphere through to 2050. Key assumptions in pathway development over time Climate-related policies and socioeconomic assumptions • Transition risks are expected to be high as immediate, strict global policy action is required. • Due to the restrictive nature of carbon policies, renewables are deployed rapidly and at-scale, reaching full grid decarbonisation by 2050, supported by large-scale batteries and residential solar and batteries. • Shadow carbon prices are higher in scenarios where greater climate policy is enacted to reduce further global warming. • Demographic assumptions are consistent across all scenarios, aligned to the SSP2 Middle of the Road scenario as employed in the NGFS scenario suite. • Due to the need to take aggressive action to address the impacts of climate change, introduced policies will be restrictive, sudden and severe. • As a result, transition risk will be highest in this scenario. • This is further exacerbated by the need for countries mitigating climate change to take greater action to make up for countries not taking action or taking insufficient action to address emissions. • Shadow carbon prices (a hypothetical carbon price which represents policy action) are higher in scenarios where greater climate policy is enacted to reduce further global warming. • Demographic assumptions are consistent across all scenarios, aligned to the SSP2 Middle of the Road scenario as employed in the NGFS scenario suite. • Transition risks in this scenario are minimal as little action is taken to address climate change. • No additional policies are enacted beyond the policies that are currently in place to address climate change. • Demographic assumptions are consistent across all scenarios, aligned to the SSP2 Middle of the Road scenario as employed in the NGFS scenario suite. Macroeconomic trends • Restrictive policies and high carbon prices will have flow-on impacts to energy prices and emissions-intensive production, causing inflation to increase generally. • Gross Domestic Product (GDP) experiences a slight decline in growth rates due to the restrictive policies implemented. • GDP resumes baseline level growth from 2040 with impacts from physical damages relatively low. • Macroeconomic impacts will be severe from 2030 due to the disruptive and restrictive nature of the policies deployed, acutely felt in emissions-intensive and energy-intensive industries. • Policies will be sudden and severe from 2030, with significant flow-on disruptions to economic activity. GDP will be unaffected in the short term, before a notable decline in economic growth from restrictive policy. • Macroeconomic impacts are negligible initially, with notable declines in economic growth in later decades due to increased physical risks, natural disasters and economic damages. • GDP continues to worsen relative to the baseline with increasingly significant damages and lower economic growth rates expected over time, driven by climate inaction and exacerbated physical risks. WESTPAC 2025 SUSTAINABILITY REPORT |
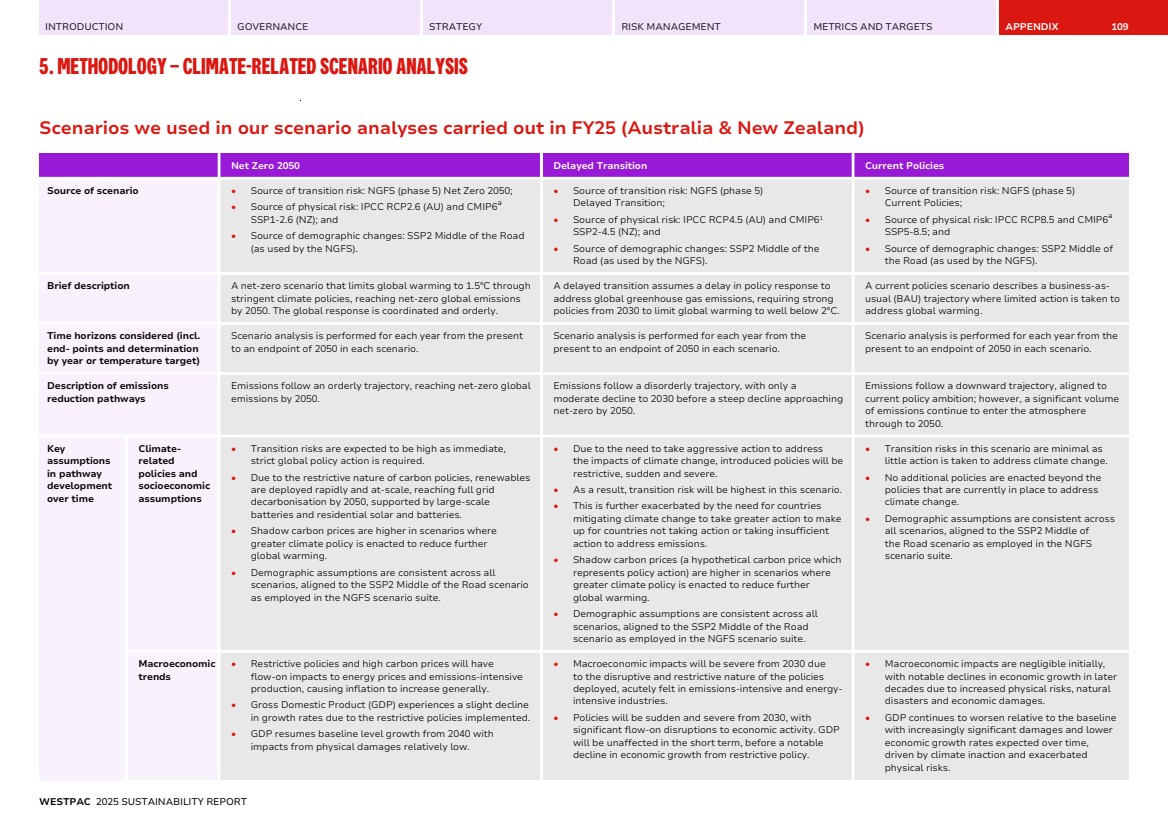
| INTRODUCTION GOVERNANCE STRATEGY RISK MANAGEMENT METRICS AND TARGETS APPENDIX 5. METHODOLOGY – CLIMATE-RELATED SCENARIO ANALYSIS 110 Net Zero 2050 Delayed Transition Current Policies • Physical damages will also be greater in this scenario relative to a net-zero scenario, due to the initially delayed policy response, limiting economic growth as funding is redirected to recovery. National- or regional-level variables • In the short to medium term, acute physical risks are expected to continue as existing GHG concentrations have already locked in climate change impacts over the coming decades. Increases in severity and/or frequency are expected to be relatively limited due to achieving an ambitious temperature goal. • Chronic risks will similarly worsen (heat stress, sea level rise) however these risks are relatively much lower than in other scenarios. • Land use change (from vegetation to pastureland) is limited due to the need for carbon sinks and the emissions-intensive nature of deforestation and livestock agriculture. • Increased capital expenditure will be deployed in the electricity sector to cater to growing demand, increased electrification, distributed resources and the need for significant upgrades to transmission and distribution networks. • The increased frequency and severity of physical risks places pressure on policymakers to take decisive actions to mitigate future physical risk impacts. • Acute and chronic physical risks, although similar initially to a net-zero scenario, are expected to worsen post 2030 with worse outcomes in 2050. • Due to the need for a rapid transition post 2030, restrictive policy will be implemented on unsustainable deforestation and limitations placed on any further land-use change. • Acute and chronic physical risk impacts will be similar to the other scenarios in the short/ medium term due to the locked-in impacts from existing GHG concentrations. • Impacts are expected to be more severe and continuing to worsen to 2100. • Acute physical risks will increase in severity and/or frequency. • Chronic risks will become more severe post 2050, including extreme temperatures, changes in precipitation and sea level rise, further exacerbating acute risks (including storm surge, storms, fires, and flooding). • Land-use change will follow current trajectories, catering to the food production requirements of an increasing population. Energy usage and mix • Primary energy is increasingly converted to renewables with a significant scaling of electrification. • Remaining fossil fuel generation is converted to renewables. • Although buildings, vehicles and devices become more energy-efficient, the decline in energy usage driven by efficiencies is offset by the significant scale of electrification across industrial production. • Primary energy and grid decarbonisation follows a business-as-usual trend to 2030. • Restrictive policy forces fuel switching, electrification and a rapid increase in renewable energy projects. • Renewable energy continues to make up a greater share of total energy composition; however, a significant volume of fossil fuel energy remains in the system over all time horizons. • Energy demand continues to increase, with little offsetting impact from increased energy efficiency. Developments in technology and carbon sequestration/ negative emissions solutions • Only hard-to-abate emissions remain in the economy post 2050, offset by negative emissions technologies and sequestration. • Negative emissions technologies and natured-based sequestration are increasingly deployed to reach the aspirational goal of the Paris Agreement. • Technological advances in energy efficiency (industry, buildings, vehicles and devices) help to offset growing energy demand. • Hydrogen and sustainable fuels production take a greater share of oil and gas combustion in hard-to-abate sectors, such as marine and air transport. • Limited use of carbon removal technology or nature-based sequestration due to the delayed nature of the transition and slow roll-out of negative emission technology. • Limited development of sustainable fuels as the majority of renewable electricity is dedicated towards decarbonisation of the electricity grid. • No carbon removal technologies or additional carbon sequestration projects are employed. • No major technological developments. a. CMIP – Coupled Model Intercomparison Project – is a project of the World Climate Research Group (WCRP) providing climate projections to understand past, present and future climate changes. CMIP and its associated data infrastructure have become essential to the Intergovernmental Panel on Climate Change (IPCC) and other international and national climate assessments. CMIP5 used Representative Concentration Pathways (RCPs) to describe future scenarios such as RCP2.6, RCP4.5 and RCP8.5. CMIP6 uses Shared Socioeconomic Pathways (SSPs), including SSP1-2.6, SSP2-4.5 and SSP5-8.5. WESTPAC 2025 SUSTAINABILITY REPORT |
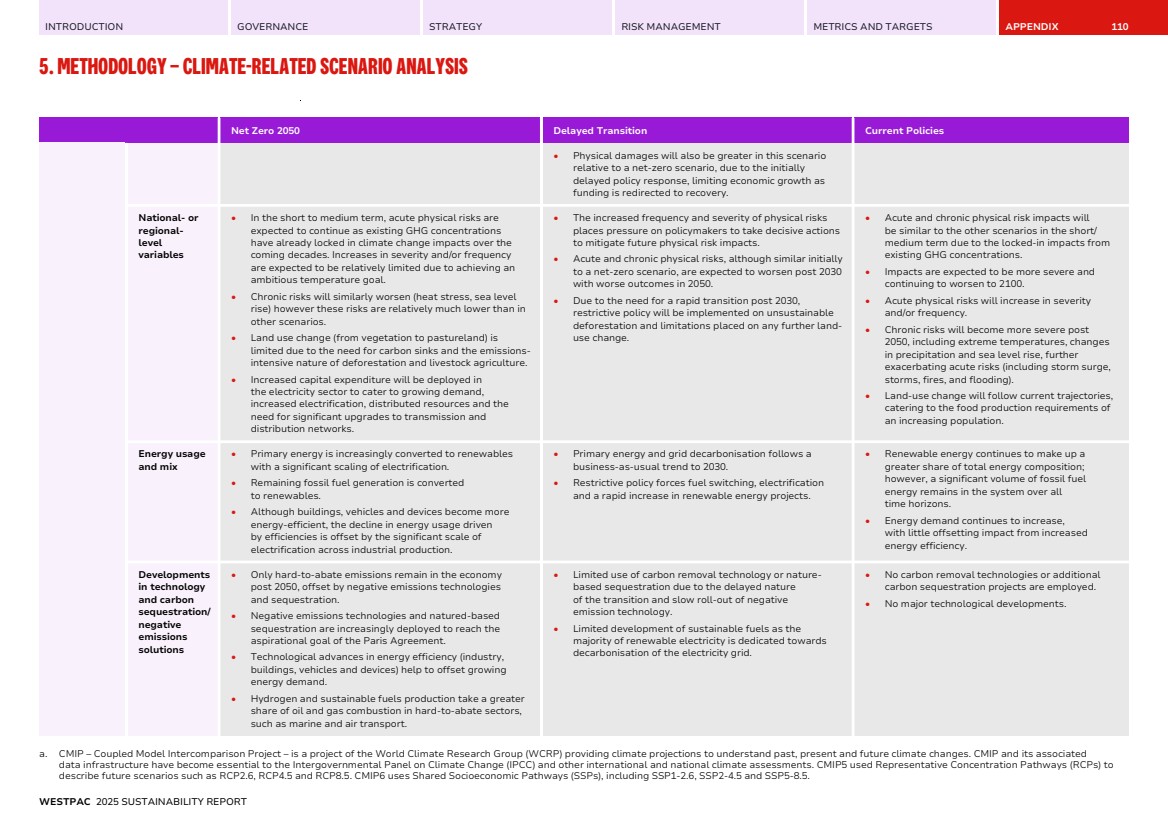
| INTRODUCTION GOVERNANCE STRATEGY RISK MANAGEMENT METRICS AND TARGETS APPENDIX 5. METHODOLOGY – CLIMATE-RELATED SCENARIO ANALYSIS 111 Inputs we used into our scenario analyses carried out in FY25 Climate-related risk type Scenario analysis carried out in FY25 Scenarios used and their source Diverse range of scenarios Scenario(s) aligned with latest international agreement on climate change Rationale of relevance of the scenarios to assessment of our resilience to climate-related changes, development or uncertainties Time horizons Scope of operations used in scenario analysis Physical risk 1. Climate-related physical risk in the Retail portfolios • RCP2.6, RCP4.5 and RCP8.5 (IPCC) – Third party data provider (AU). • SSP1-2.6, SSP2-4.5 and SSP5-8.5 (CMIP6) – Third party data provider (NZ). Yes No RCP2.6 (and SSP1-2.6) through to RCP8.5 (and SSP5-8.5) includes a diverse, yet plausible range of physical risk outcomes. Current to 2050 • Assessed Australian retail mortgage portfolio, ~$547b TCEa, ~42% of total Group TCEb. • Assessed New Zealand residential mortgage portfolio, NZ$84.5bn TCE. 2. Climate-related physical risk in the Non-Retail portfolios • SSP1-2.6, SSP2-4.5 and SSP5-8.5 (CMIP6) – Third party data provider (NZ). Yes No This analysis is focused on assessing resilience and exposure to a plausible range of physical risk outcomes. Current to 2050 • Assessed Commercial Real Estate lending in New Zealand, NZ$9.3bn TCE. • Assessed Agricultural business lending in New Zealand, NZ$9.3bn TCE. Transition risk 3. Climate-related transition risk in the Non-Retail portfolios • Current Policies, Delayed Transition and Net Zero 2050 (NGFS). Yes Yes Current Policies through to Net Zero 2050 includes a diverse, yet plausible range of transition risk outcomes. Current to 2050 • Assessed Business and institutional lending portfolios, all sectors and geographies, ~$599b TCEc , ~46% of total Group TCEb. Physical and transition risk Qualitative scenario analysis workshops to identify risks and opportunities • New Zealand Banking Association “Orderly”. • “Too Little Too Late” – Network for Greening the Financial System Delayed Transition for transition risk; – Network for Greening the Financial System Current Policies for physical risk. • New Zealand Banking Association “Hothouse World”. Yes Yes We have used scenarios relevant to the New Zealand Banking sector – two that were developed as sector scenarios by the New Zealand Banking Association and one that aligns to recent stress testing. Present to 2050 and beyond. Scenario narratives describe short term (present to 2030) medium term (2030 to 2040) and long term (2040 to 2050 and beyond) time horizons. Westpac New Zealand, with focus on Agribusiness, Commercial Real Estate and Residential Property. Participants asked to consider impacts to WNZL and stakeholders including customers, communities, government, Māori /Iwi and shareholders. a. At 31 August 2025. b. Total Group TCE at 30 September 2025. c. At 30 September 2025. WESTPAC 2025 SUSTAINABILITY REPORT |
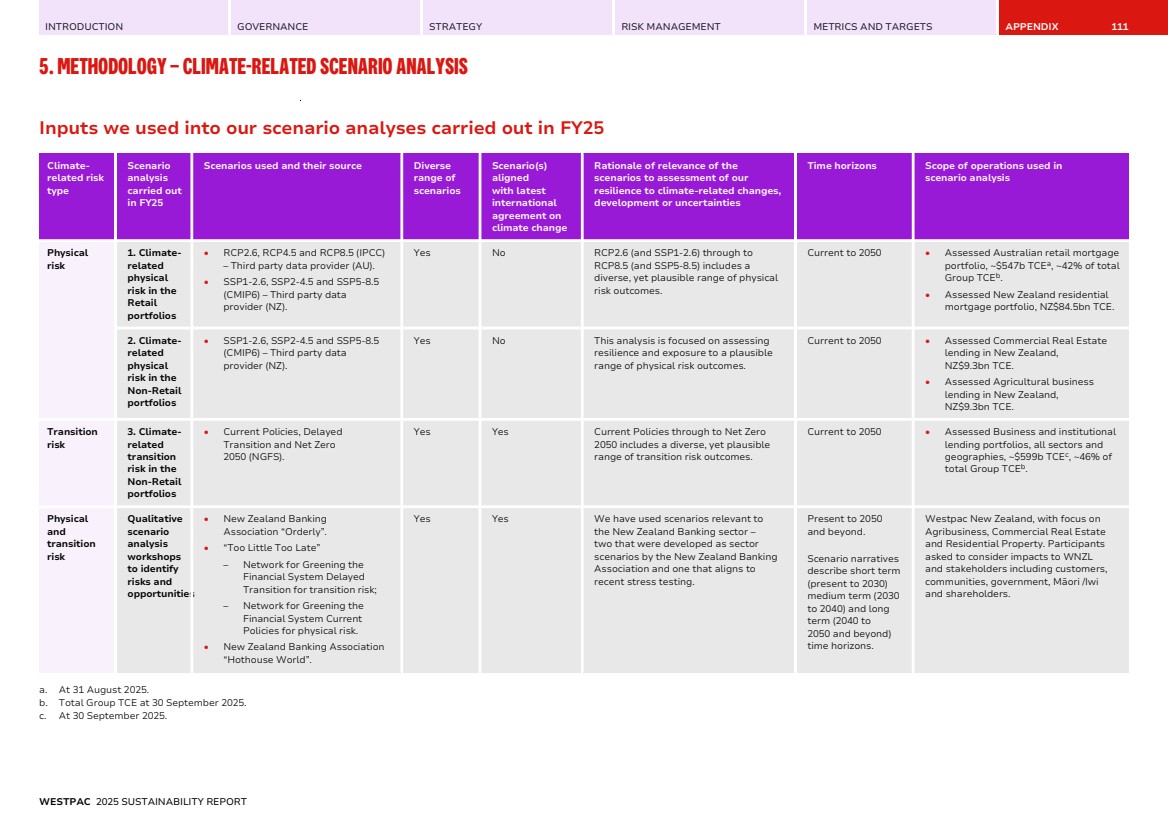
| INTRODUCTION GOVERNANCE STRATEGY RISK MANAGEMENT METRICS AND TARGETS APPENDIX 5. METHODOLOGY – CLIMATE-RELATED SCENARIO ANALYSIS 112 Key assumptions made within our scenario analysis process in FY25 Climate-related risk type Scenario analysis carried Assumptions about climate-related policies in the jurisdictions in which Westpac operates Assumptions about macroeconomic trends; Assumptions about national- or regional-level variables Assumptions about energy usage and mix Assumptions about developments in technology Physical risk 1. Climate-related physical risk in the Retail portfolios Although assumptions about climate-related policies are present within the scenarios analysed, climate-related policies are not relevant to this analysis as the focus is on understanding our retail lending exposure to perils (bushfire & cyclone – AU only, rainfall flooding and coastal inundation – NZ only) and how this exposure changes over time. Although assumptions about macroeconomic trends are present within the scenarios analysed, macroeconomic trends are not relevant to this analysis as the focus is on understanding our retail lending exposure to physical perils (bushfire & cyclone – AU only, rainfall flooding and coastal inundation – NZ only) and how this exposure changes over time. Third party data provider provides downscaled outputs from global and regional climate models to ensure outputs are relevant to Australia’s and New Zealand’s circumstances. Outputs are provided at an asset level and consider local weather patterns, land use and infrastructure. Although assumptions about energy usage and mix are present within the scenarios analysed, assumptions on energy usage and mix are not relevant to this analysis as the focus is on understanding our retail lending exposure to physical perils (bushfire & cyclone – AU only, rainfall flooding and coastal inundation – NZ only) and how this exposure changes over time. Although assumptions about developments in technology are present within the scenarios analysed, developments in technology are not relevant to this analysis as the focus is on understanding our retail lending exposure to physical perils (bushfire & cyclone – AU only, rainfall flooding and coastal inundation – NZ only) and how this exposure changes over time. 2. Climate-related physical risk in the Non-Retail portfolios Although assumptions about climate-related policies are present within the scenarios analysed, climate-related policies are not relevant to this analysis as the focus is on understanding our agricultural and commercial real estate lending exposure to rainfall flooding and coastal inundation and how this exposure changes over time. Although assumptions about macroeconomic trends are present within the scenarios analysed, macroeconomic trends are not relevant to this analysis as the focus is on understanding our agricultural and commercial real estate lending exposure to rainfall flooding and coastal inundation, and how this exposure changes over time. Increasing severity and/or frequency of natural disasters, consistent with increasing emissions in each scenario. Although assumptions about energy usage and mix are present within the scenarios analysed, assumptions on energy usage and mix are not relevant to this analysis as the focus is on understanding our agricultural and commercial real estate lending exposure to rainfall flooding and coastal inundation, and how this exposure changes over time. Although assumptions about developments in technology are present within the scenarios analysed, developments in technology are not relevant to this analysis as the focus is on understanding our agricultural and commercial real estate lending exposure to rainfall flooding and coastal inundation, and how this exposure changes over time. Transition risk 3. Climate-related transition risk in the Non-Retail portfolios Depending on the scenario, climate-related policies may be minimal (Current Policies) or restrictive (Net Zero 2050). These policies are anticipated to impact the trajectory and economic viability of emissions intensive sectors, with indirect flow-on impacts across value chains and supply chains. Depending on the scenario, macroeconomic trends may be neutral (Current Policies) or unfavourable (Net Zero 2050) to fossil fuel industries and high emitting sectors. These trends may include impacts to demand and/or price for fossil fuels and high emissions products, impacting the trajectory and economic viability of emissions intensive industries. This analysis is performed at a global level without making specific reference to national or regional variables. Global trends are adopted to understand Group non-retail lending exposure to transition risk. Depending on the scenario, energy usage and mix may favour fossil fuels (Current Policies) or renewables (Net Zero 2050). The impacts of these assumptions on this analysis are captured under “assumptions about economic trends”. Developments in technology is specifically considered within the non-retail transition risk analysis. Depending on the scenario, developments in technology may be limited (Current Policies) or result in significant developments (Net Zero 2050). Assumptions include technological developments emissions reductions, carbon capture, alternative fuels and energy efficiency, among others. WESTPAC 2025 SUSTAINABILITY REPORT |
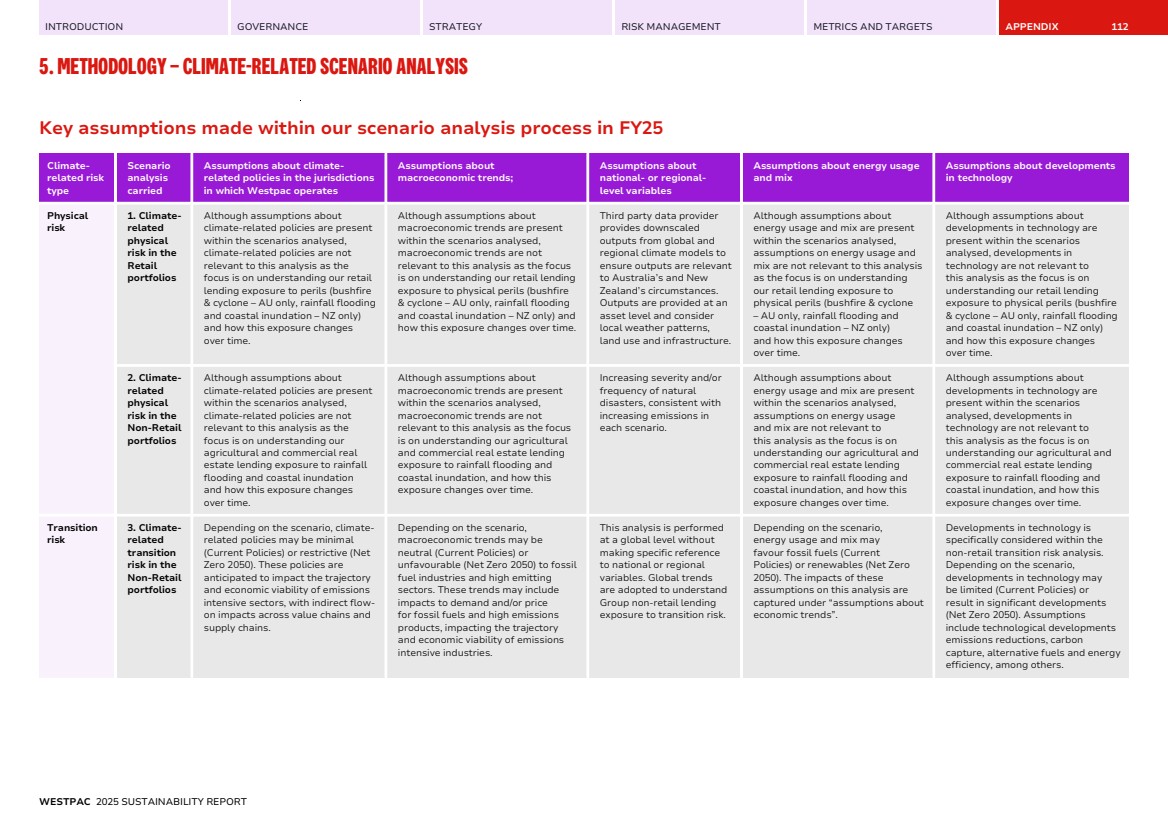
| INTRODUCTION GOVERNANCE STRATEGY RISK MANAGEMENT METRICS AND TARGETS APPENDIX 113 6. INDEPENDENT ASSURANCE STATEMENT WESTPAC 2025 SUSTAINABILITY REPORT |
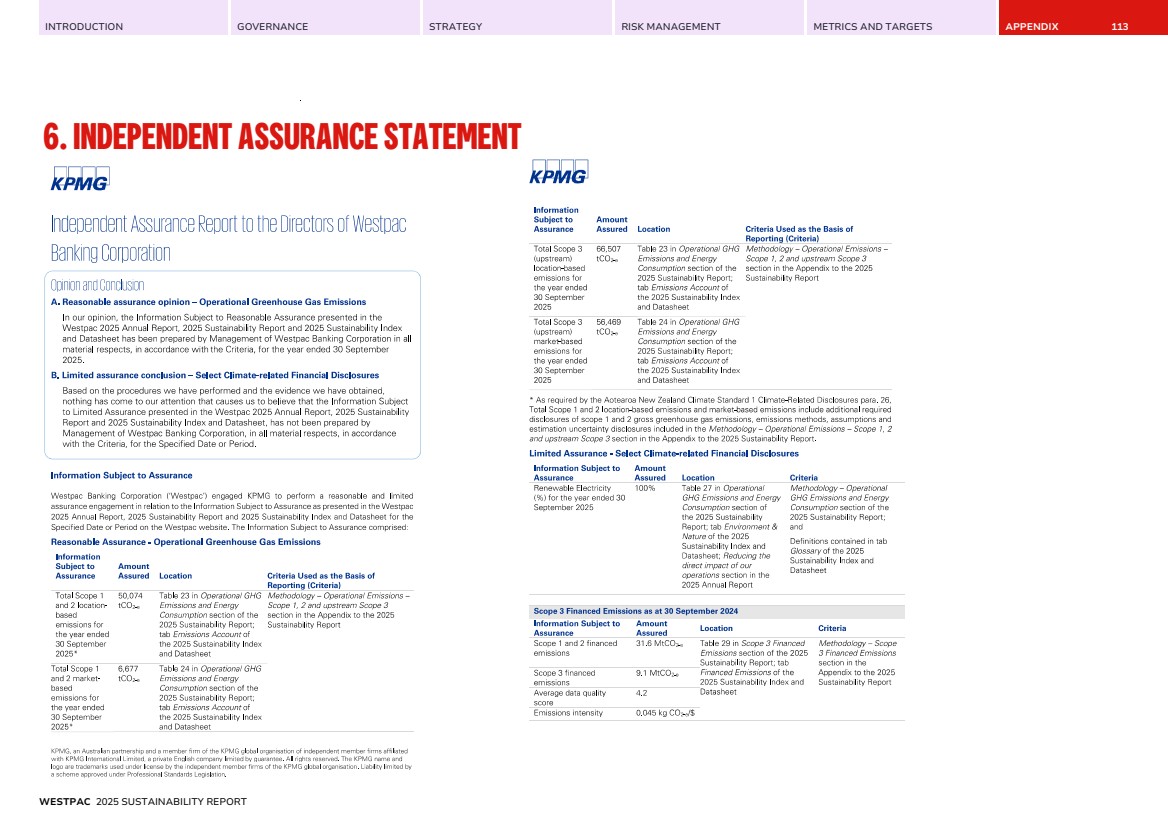
| INTRODUCTION GOVERNANCE STRATEGY RISK MANAGEMENT METRICS AND TARGETS APPENDIX 6. INDEPENDENT ASSURANCE STATEMENT 114 WESTPAC 2025 SUSTAINABILITY REPORT |
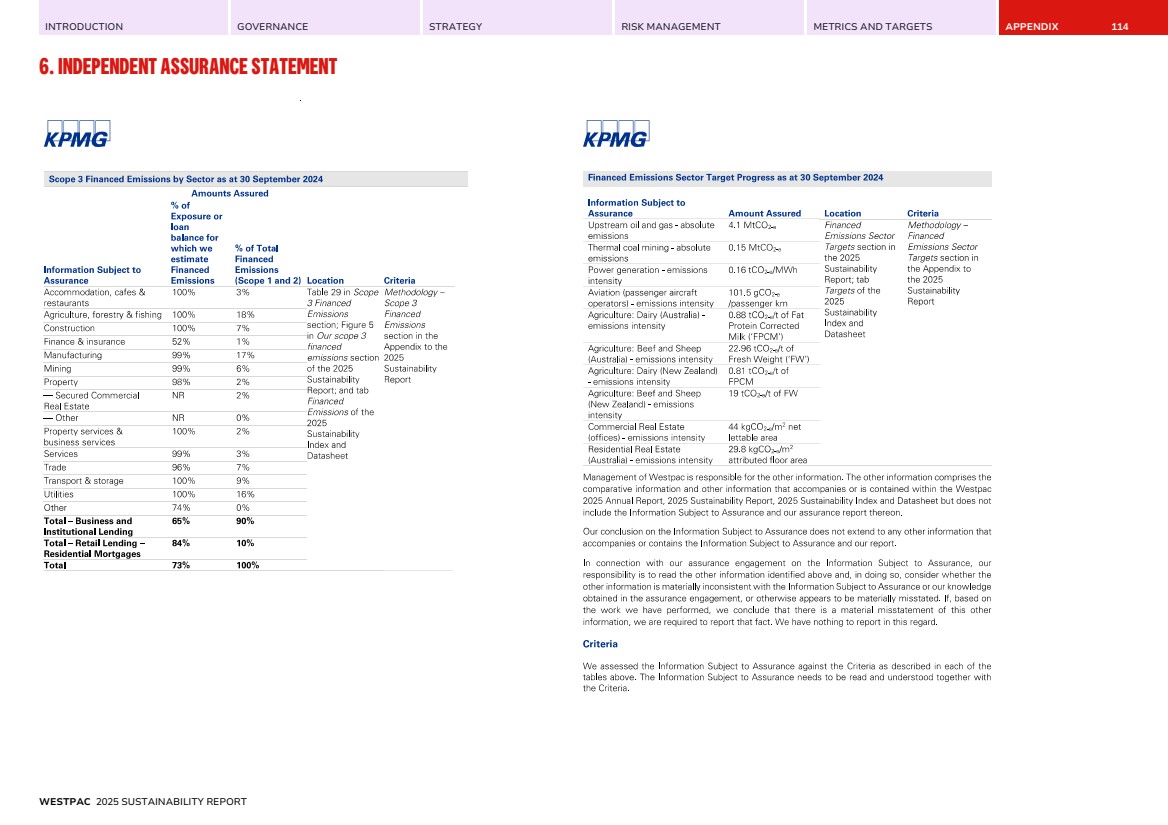
| INTRODUCTION GOVERNANCE STRATEGY RISK MANAGEMENT METRICS AND TARGETS APPENDIX 6. INDEPENDENT ASSURANCE STATEMENT 115 WESTPAC 2025 SUSTAINABILITY REPORT |
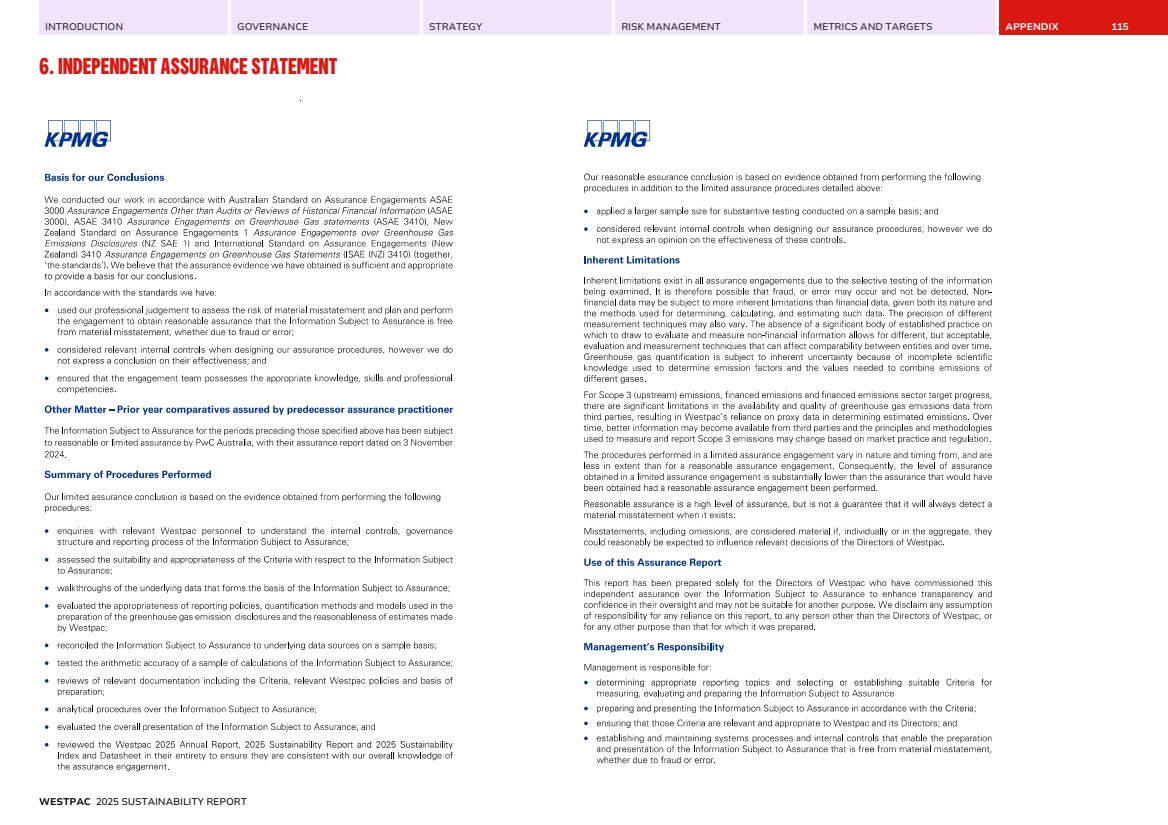
| INTRODUCTION GOVERNANCE STRATEGY RISK MANAGEMENT METRICS AND TARGETS APPENDIX 6. INDEPENDENT ASSURANCE STATEMENT 116 WESTPAC 2025 SUSTAINABILITY REPORT |
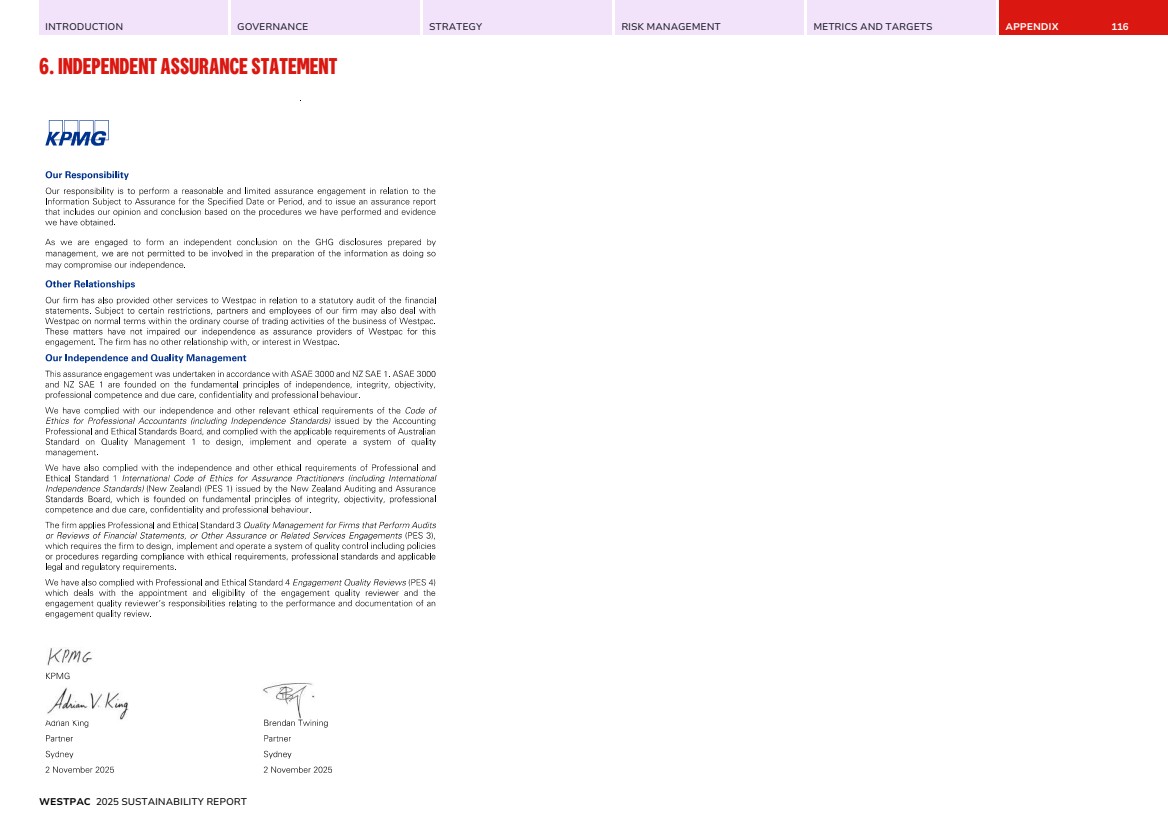
| INTRODUCTION GOVERNANCE STRATEGY RISK MANAGEMENT METRICS AND TARGETS APPENDIX 117 7. DISCLAIMER The information in this document is general information about the Group and its activities as at the date of this Sustainability Report unless otherwise stated herein. It is given in summary form and is therefore not necessarily complete. It is not intended that it be relied upon as advice to investors or potential investors, who should be seeking independent professional advice depending on their specific investment objectives, financial situation or particular needs. The material contained in this document may include information, including, without limitation, methodologies, modelling, scenarios, reports, benchmarks, standards, tools, metrics and data, derived from publicly available or government or industry sources that have not been independently verified. No representation or warranty is made as to the accuracy, completeness or reliability of the information. This document contains statements that constitute “forward-looking statements” within the meaning of Section 21E of the US Securities Exchange Act of 1934. Forward-looking statements are statements about matters that are not historical facts. Forward-looking statements and metrics appear in a number of places in this document and include statements regarding our current intent, belief or expectations with respect to our business and operations, macro and micro economic and market conditions, results of operations and financial condition, capital adequacy and risk management, including without limitation, climate change, net-zero, emissions intensity and other sustainability related statements, commitments and targets, projections, scenarios, risk and opportunity assessments, pathways, forecasts and metrics, forecasted economic indicators and performance metric outcomes, financial support to certain borrowers, indicative drivers, estimated emissions and other proxy data. These are subject to known and unknown risks, and there are significant uncertainties, limitations, risks and assumptions in the metrics and modelling on which these statements rely. In particular, the metrics, methodologies and data relating to climate and sustainability are rapidly evolving and maturing, including variations in approaches and common standards in estimating and calculating emissions, and uncertainty around future climate- and sustainability- related policy and legislation. There are inherent limits in the current scientific understanding of climate change and its impacts. Forward-looking statements may also be made by members of Westpac’s management, directors, officers or employees (verbally or in writing) in connection with this document. Such statements are subject to the same limitations, uncertainties, assumptions and disclaimers in this document. We use words such as ‘will’, ‘may’, ‘expect’, ‘indicative’, ‘intend’, ‘seek’, ‘would’, ‘should’, ‘could’, ‘continue’, ‘anticipate‘, ‘believe‘, ‘probability‘, ‘risk‘, ‘aim‘, ‘target’, ‘plan’, ‘estimate‘, ‘outlook‘, ‘forecast‘, ‘goal’, ‘guidance’, ‘ambition’, ‘assumption’, ‘projection’, or other similar words that convey the prospective nature of events or outcomes and generally indicate forward-looking statements. These forward-looking statements reflect our current best estimates, judgements, assumptions and views as at the date of this document with respect to future events and are subject to change, certain known and unknown risks and uncertainties and assumptions and other factors which are, in many instances, beyond the control of Westpac, its officers, employees, agents and advisors, and have been made based upon management’s and/or the Board’s current expectations, understandings or beliefs concerning future developments and their potential effect upon us. Although management and/or the Board currently believes these forward-looking statements have a reasonable basis, there can be no assurance that future developments or performance will be in accordance with our expectations or that the effect of future developments on us will be those anticipated. There is a risk that the best estimates, judgements, assumptions, views, models, scenarios, projections used may subsequently turn out to be incorrect. Actual results, performance, conditions, circumstances or the ability to meet commitments and targets could differ materially from those we expect or are expressed or implied in such statements, depending on various factors, including without limitation significant uncertainties in climate change and sustainability related metrics and modelling as well as further development of methodologies, reporting or other standards which could impact metrics, data and targets (noting that climate and sustainability science, standards, methodologies and reporting are subject to rapid change and development). There are usually differences between forecast and actual results because events and actual circumstances frequently do not occur as forecast and their differences may be material. Factors that may impact on the forward- looking statements made include, but are not limited to, those described in this document and in the section titled 'Risk Management' in our 2025 Annual Report, as well as the 2025 Risk Factors document available at www.westpac.com.au. Investors should not place undue reliance on forward-looking statements and statements of expectation, including targets, particularly in light of the current economic climate and the significant global volatility. These statements are not guarantees or predictions of future performance and Westpac gives no representation, warranty or assurance (including as to the quality, accuracy or completeness of this document), nor guarantee that the occurrence of the events expressed or implied in any forward-looking statement will occur. When relying on forward-looking statements to make decisions with respect to us, investors and others should carefully consider such factors and other uncertainties and events, and the judgements and data presented in this document are not a substitute for investors and other readers’ own independent judgements and analysis. Investors and others should also exercise independent judgement, with the advice of professional advisers as necessary, regarding the risks and consequences of any matter contained in this document. To the maximum extent permitted by law, responsibility for the accuracy or completeness of any forward-looking statements, whether as a result of new information, future events or results or otherwise, is disclaimed. Except as required by law, we assume no obligation to update any forward-looking statements contained in this document, whether as a result of new information, future events or otherwise, after the date of this document. WESTPAC 2025 SUSTAINABILITY REPORT |
| CONTACT For questions and comments, please contact Westpac Group Sustainability: sustainability@westpac.com.au westpac.com.au/sustainability westpac.com.au |