| ASXRELEASE Westpac Banking Corporation Level 18, 275 Kent Street Sydney, NSW, 2000 3 November 2025 Pillar 3 Report as at 30 September 2025 Westpac Banking Corporation (“Westpac”) today provides the attached Pillar 3 Report (September 2025). For further information: Hayden Cooper Justin McCarthy Group Head of Media Relations General Manager, Investor Relations 0402 393 619 0422 800 321 This document has been authorised for release by Tim Hartin, Company Secretary. |
| PILLAR 3 REPORT WESTPAC SEPTEMBER 2025 INCORPORATING THE REQUIREMENTS OF APS 330 WESTPAC BANKING CORPORATION ABN 33 007 457 141 |
| Acknowledgement of Indigenous Peoples Westpac acknowledges the First Peoples of Australia. We recognise their ongoing role as Traditional Owners of the land and waters of this country and pay our respects to Elders, past and present. We extend our respect to Westpac’s Aboriginal and Torres Strait Islander employees, partners and stakeholders and to the Indigenous Peoples in the other locations where we operate. In Aotearoa (New Zealand) we also acknowledge tāngata whenua and the unique relationship that Indigenous Peoples share with all New Zealanders under Te Tiriti o Waitangi. 2 WESTPAC GROUP SEPTEMBER 2025 PILLAR 3 REPORT Contents OVERVIEW 3 Introduction 4 Key Metrics 5 Group Structure 8 Capital Overview 10 Risk Management Approach 20 Linkages to Financial Statements 27 Asset Encumbrance 29 CREDIT RISK 30 Credit Risk Management 31 Counterparty Credit Risk 59 Credit Valuation Adjustment Risk 65 Securitisation 66 OTHER RISKS 72 Market Risk 73 Interest Rate Risk in the Banking Book (IRRBB) 78 Operational Risk 80 Leverage Ratio 84 Macro-prudential Supervisory Measures 86 Funding and Liquidity Risk Management 87 OTHER INFORMATION 91 Prudential Disclosure Policy 92 Management's Declaration 93 Appendices 94 Glossary 98 Disclosure regarding forward-looking statements 101 In this report references to ‘Westpac’, 'WBC', ‘Westpac Group’, ‘the Group’, ‘we’, ‘us’ and ‘our’ are to Westpac Banking Corporation ABN 33 007 457 141 and its subsidiaries unless it clearly means just Westpac Banking Corporation. In this report, unless otherwise stated or the context otherwise requires, references to 'dollars', 'dollar amounts', ‘$’, ‘AUD’ or ‘A$’ are to Australian dollars. References to ‘US$’, ‘USD’ or ‘US dollars’ are to United States dollars, references to ‘NZ$’, ‘NZD’ or ‘NZ dollars’ are to New Zealand dollars, references to 'GBP' are to British Pound Sterling and references to 'EUR' are to European Euro. Any discrepancies between totals and sums of components in tables contained in this report are due to rounding. In this report, unless otherwise stated, disclosures reflect the Australian Prudential Regulation Authority’s (APRA) implementation of Basel III. Information contained in or accessible through the websites mentioned in this report does not form part of this report unless we specifically state that it is incorporated by reference and forms part of this report. Information on those websites owned by Westpac is current as at the date of this report. Except as required by law, we assume no obligation to revise or update those websites after the date of this report. We are not in a position to verify information on websites owned and/or operated by third parties. Westpac Banking Corporation ABN 33 007 457 141 |

| OVERVIEW CREDIT RISK OTHER RISKS OTHER INFORMATION 3 OVERVIEW INTRODUCTION KEY METRICS KM1: Key metrics GROUP STRUCTURE CAPITAL OVERVIEW CC1: Composition of regulatory capital OV1: Overview of Risk Weighted Assets (RWA) Summary of Credit Risk CC2: Reconciliation of regulatory capital to balance sheet CMS1: Comparison of modelled and standardised RWA at risk level CMS2: Comparison of modelled and standardised RWA for credit risk at asset class level RISK MANAGEMENT APPROACH LINKAGES TO FINANCIAL STATEMENTS LIA: Explanations of differences between accounting and regulatory exposure amounts LI1: Differences between accounting and regulatory scopes of consolidation and mapping of financial statement categories with regulatory risk categories LI2: Main sources of differences between regulatory exposure amounts and carrying values in financial statements ASSET ENCUMBRANCE ENC: Asset encumbrance |

| 4 WESTPAC GROUP SEPTEMBER 2025 PILLAR 3 REPORT INTRODUCTION Introduction Westpac Banking Corporation is an Authorised Deposit-taking Institution (ADI) subject to regulation by the Australian Prudential Regulation Authority (APRA). Westpac is primarily accredited to use the Advanced Internal Ratings-Based Approach (A-IRB) for credit risk, the Standardised Measurement Approach (SMA) for operational risk and is required to apply the Pillar 1 Basel capital framework in our assessment of traded market risk and interest rate risk in the banking book (IRRBB). This report has been prepared in accordance with APS 330 Public Disclosure (APS 330) and Westpac's Board approved Prudential Disclosure Policy. This report provides prudential information about our risk management practices and measures. Under the revised APS 330 standard (effective on 1 January 2025), Westpac is required to comply with the disclosure requirements issued by the BCBS, subject to certain amendments by APRA. These disclosure requirements include new and amended disclosures, where the presentation format is usually prescribed. Disclosures requirements vary, for quarterly, semi-annual and annual Pillar 3 reports. On transition to the revised standard, APRA permits ADIs to omit comparatives where new disclosures are reported for the first time. However, where comparatives are available, this information has been included. In addition to this report, the regulatory disclosures section of Westpac's website1 contains the reporting requirements for capital instruments under paragraph 37 of APS 330 and CCA: Main features of regulatory capital instruments. Capital instruments disclosures are updated when: • A new capital instrument is issued that will form part of regulatory capital; or • A capital instrument is redeemed, converted into Common equity tier 1 (CET1) capital, written off, or its terms and conditions are changed. 1. http://www.westpac.com.au/about-westpac/investor-centre/financial-information/regulatory-disclosures/ |
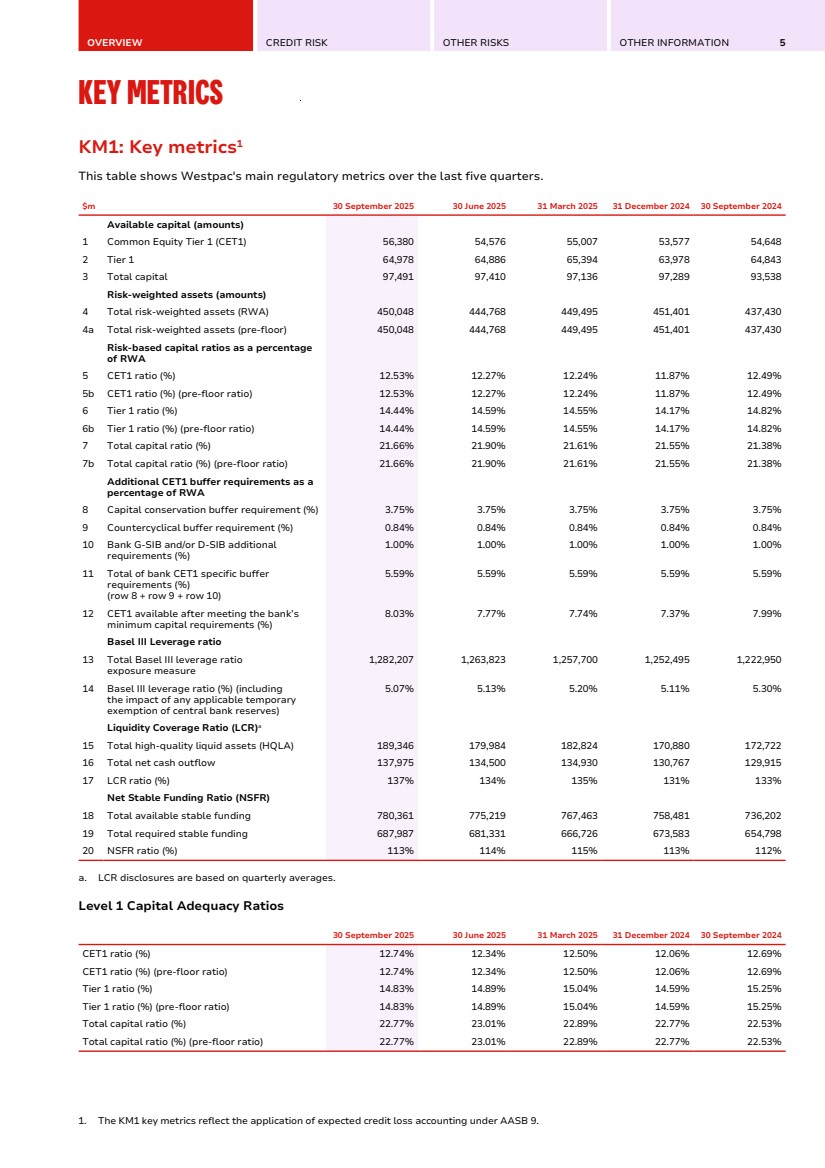
| OVERVIEW CREDIT RISK OTHER RISKS OTHER INFORMATION 5 KEY METRICS KM1: Key metrics1 Key Metrics KM1: Key metrics1 This table shows Westpac's main regulatory metrics over the last five quarters. $m 30 September 2025 30 June 2025 31 March 2025 31 December 2024 30 September 2024 Available capital (amounts) 1 Common Equity Tier 1 (CET1) 56,380 54,576 55,007 53,577 54,648 2 Tier 1 64,978 64,886 65,394 63,978 64,843 3 Total capital 97,491 97,410 97,136 97,289 93,538 Risk-weighted assets (amounts) 4 Total risk-weighted assets (RWA) 450,048 444,768 449,495 451,401 437,430 4a Total risk-weighted assets (pre-floor) 450,048 444,768 449,495 451,401 437,430 Risk-based capital ratios as a percentage of RWA 5 CET1 ratio (%) 12.53% 12.27% 12.24% 11.87% 12.49% 5b CET1 ratio (%) (pre-floor ratio) 12.53% 12.27% 12.24% 11.87% 12.49% 6 Tier 1 ratio (%) 14.44% 14.59% 14.55% 14.17% 14.82% 6b Tier 1 ratio (%) (pre-floor ratio) 14.44% 14.59% 14.55% 14.17% 14.82% 7 Total capital ratio (%) 21.66% 21.90% 21.61% 21.55% 21.38% 7b Total capital ratio (%) (pre-floor ratio) 21.66% 21.90% 21.61% 21.55% 21.38% Additional CET1 buffer requirements as a percentage of RWA 8 Capital conservation buffer requirement (%) 3.75% 3.75% 3.75% 3.75% 3.75% 9 Countercyclical buffer requirement (%) 0.84% 0.84% 0.84% 0.84% 0.84% 10 Bank G-SIB and/or D-SIB additional requirements (%) 1.00% 1.00% 1.00% 1.00% 1.00% 11 Total of bank CET1 specific buffer requirements (%) (row 8 + row 9 + row 10) 5.59% 5.59% 5.59% 5.59% 5.59% 12 CET1 available after meeting the bank’s minimum capital requirements (%) 8.03% 7.77% 7.74% 7.37% 7.99% Basel III Leverage ratio 13 Total Basel III leverage ratio exposure measure 1,282,207 1,263,823 1,257,700 1,252,495 1,222,950 14 Basel III leverage ratio (%) (including the impact of any applicable temporary exemption of central bank reserves) 5.07% 5.13% 5.20% 5.11% 5.30% Liquidity Coverage Ratio (LCR)a 15 Total high-quality liquid assets (HQLA) 189,346 179,984 182,824 170,880 172,722 16 Total net cash outflow 137,975 134,500 134,930 130,767 129,915 17 LCR ratio (%) 137% 134% 135% 131% 133% Net Stable Funding Ratio (NSFR) 18 Total available stable funding 780,361 775,219 767,463 758,481 736,202 19 Total required stable funding 687,987 681,331 666,726 673,583 654,798 20 NSFR ratio (%) 113% 114% 115% 113% 112% a. LCR disclosures are based on quarterly averages. Level 1 Capital Adequacy Ratios 30 September 2025 30 June 2025 31 March 2025 31 December 2024 30 September 2024 CET1 ratio (%) 12.74% 12.34% 12.50% 12.06% 12.69% CET1 ratio (%) (pre-floor ratio) 12.74% 12.34% 12.50% 12.06% 12.69% Tier 1 ratio (%) 14.83% 14.89% 15.04% 14.59% 15.25% Tier 1 ratio (%) (pre-floor ratio) 14.83% 14.89% 15.04% 14.59% 15.25% Total capital ratio (%) 22.77% 23.01% 22.89% 22.77% 22.53% Total capital ratio (%) (pre-floor ratio) 22.77% 23.01% 22.89% 22.77% 22.53% 1. The KM1 key metrics reflect the application of expected credit loss accounting under AASB 9. |
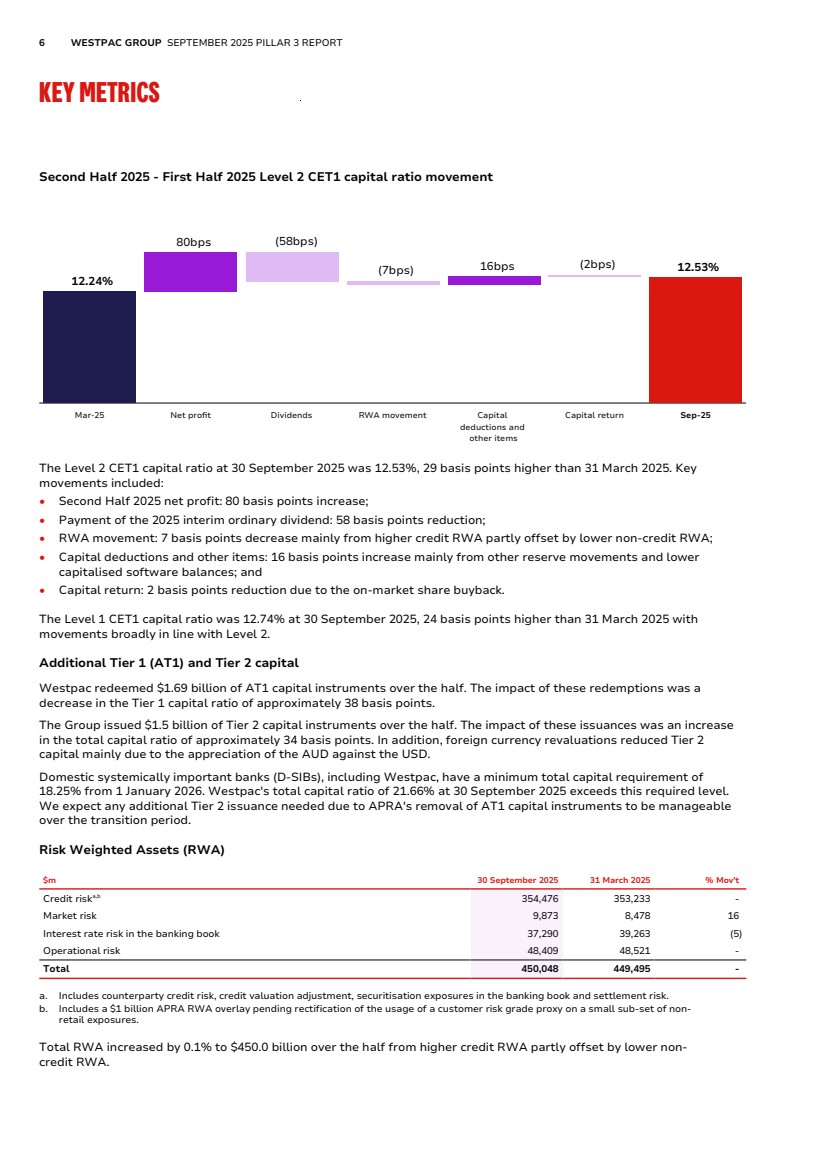
| 6 WESTPAC GROUP SEPTEMBER 2025 PILLAR 3 REPORT KEY METRICS Second Half 2025 - First Half 2025 Level 2 CET1 capital ratio movement 12.24% 80bps (58bps) (7bps) 16bps (2bps) 12.53% Mar-25 Net profit Dividends RWA movement Capital deductions and other items Capital return Sep-25 The Level 2 CET1 capital ratio at 30 September 2025 was 12.53%, 29 basis points higher than 31 March 2025. Key movements included: • Second Half 2025 net profit: 80 basis points increase; • Payment of the 2025 interim ordinary dividend: 58 basis points reduction; • RWA movement: 7 basis points decrease mainly from higher credit RWA partly offset by lower non-credit RWA; • Capital deductions and other items: 16 basis points increase mainly from other reserve movements and lower capitalised software balances; and • Capital return: 2 basis points reduction due to the on-market share buyback. The Level 1 CET1 capital ratio was 12.74% at 30 September 2025, 24 basis points higher than 31 March 2025 with movements broadly in line with Level 2. Additional Tier 1 (AT1) and Tier 2 capital Westpac redeemed $1.69 billion of AT1 capital instruments over the half. The impact of these redemptions was a decrease in the Tier 1 capital ratio of approximately 38 basis points. The Group issued $1.5 billion of Tier 2 capital instruments over the half. The impact of these issuances was an increase in the total capital ratio of approximately 34 basis points. In addition, foreign currency revaluations reduced Tier 2 capital mainly due to the appreciation of the AUD against the USD. Domestic systemically important banks (D-SIBs), including Westpac, have a minimum total capital requirement of 18.25% from 1 January 2026. Westpac's total capital ratio of 21.66% at 30 September 2025 exceeds this required level. We expect any additional Tier 2 issuance needed due to APRA's removal of AT1 capital instruments to be manageable over the transition period. Risk Weighted Assets (RWA) $m 30 September 2025 31 March 2025 % Mov't Credit riska,b 354,476 353,233 - Market risk 9,873 8,478 16 Interest rate risk in the banking book 37,290 39,263 (5) Operational risk 48,409 48,521 - Total 450,048 449,495 - a. Includes counterparty credit risk, credit valuation adjustment, securitisation exposures in the banking book and settlement risk. b. Includes a $1 billion APRA RWA overlay pending rectification of the usage of a customer risk grade proxy on a small sub-set of non-retail exposures. Total RWA increased by 0.1% to $450.0 billion over the half from higher credit RWA partly offset by lower non-credit RWA. |
| OVERVIEW CREDIT RISK OTHER RISKS OTHER INFORMATION 7 Credit RWA increased by $1.2 billion. Key movements included: • A $12.6 billion increase from higher lending primarily in Corporate and Large Corporate; • A $5.9 billion decrease from model updates, methodology and policy changes and other data refinements mainly in RBNZ Regulated Entities and Corporate; • A $3.0 billion decrease mainly due to improvements in residential mortgages delinquency rates; • A $1.8 billion decrease from foreign currency translation impacts, predominantly the appreciation of the AUD against the NZD; and • A $0.8 billion decrease from credit valuation adjustments. Non-credit RWA decreased by $0.7 billion. Key movements included: • IRRBB RWA: $2.0 billion decrease from: – A $1.2 billion net decrease across repricing and yield curve, basis and optionality risk in line with underlying banking book positions; and – A $0.8 billion decrease from lower interest rates resulting in the regulatory embedded gain increasing to $3.9 billion • Market RWA: $1.4 billion increase mainly from higher market risk exposures. Leverage ratio The leverage ratio represents the percentage of Tier 1 capital relative to the Exposure Measure1 . At 30 September 2025, Westpac's leverage ratio was 5.07%, down 13 basis points from 31 March 2025. The ratio remains well above APRA's regulatory minimum requirement of 3.5%. The decrease in the leverage ratio was mainly due to higher total exposures from higher lending. APRA has announced changes to banks' capital requirements with effect from 1 January 2027, as outlined in the Capital Overview section. This includes changes to CET1, Tier 1, Total capital and the Leverage ratio. Liquidity Coverage Ratio (LCR) Westpac’s average LCR for the quarter ended 30 September 2025 was 137% (30 June 2025: 134%), well above the regulatory minimum of 100%. The increase in the ratio was due to higher average liquid assets. Net Stable Funding Ratio (NSFR) Westpac had an NSFR of 113% as of 30 September 2025 (30 June 2025: 114%) and continues to be above the regulatory minimum of 100%. The decrease in the ratio was due to a net increase in required stable funding. Fourth Quarter 2025 - Third Quarter 2025 CET1 capital ratio movement The Level 2 CET1 capital ratio increased by 26 basis points over the quarter from net profit and other reserve movements partly offset by higher IRRBB RWA. 1. As defined under Attachment D of APS110: Capital Adequacy. |
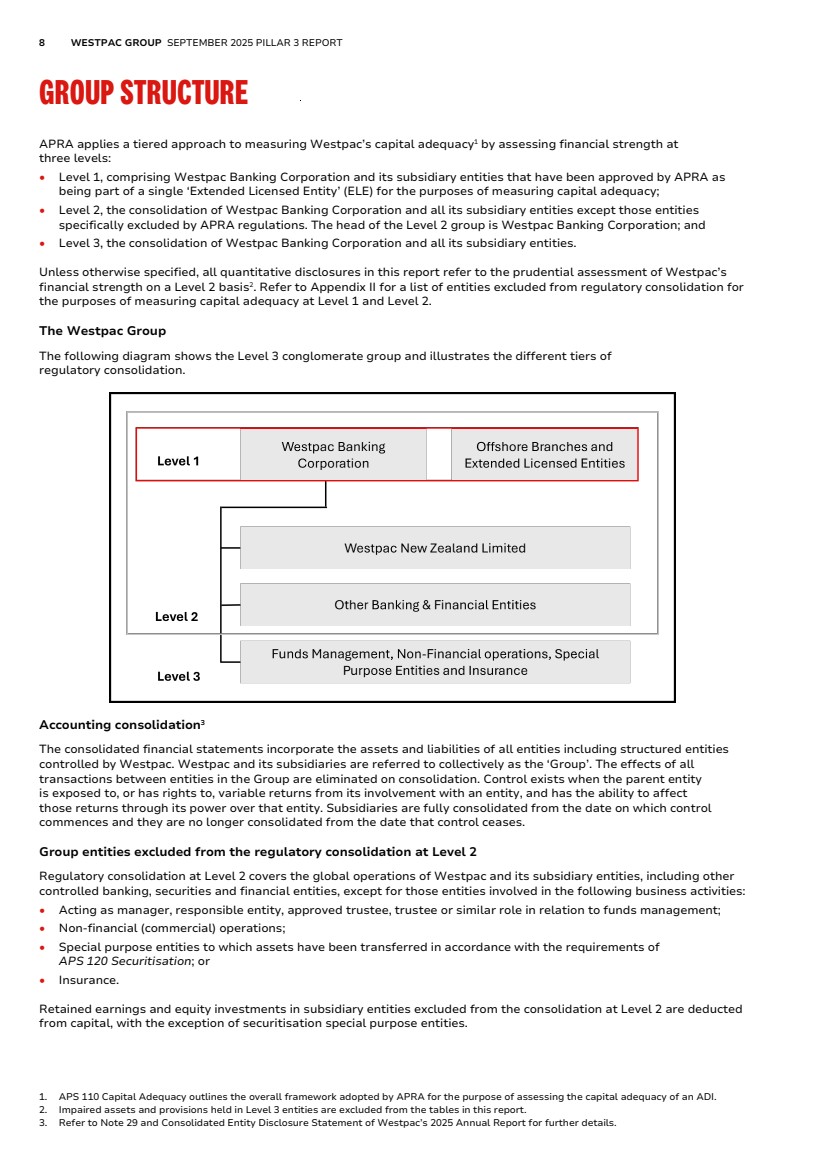
| 8 WESTPAC GROUP SEPTEMBER 2025 PILLAR 3 REPORT GROUP STRUCTURE Group Structure APRA applies a tiered approach to measuring Westpac’s capital adequacy1 by assessing financial strength at three levels: • Level 1, comprising Westpac Banking Corporation and its subsidiary entities that have been approved by APRA as being part of a single ‘Extended Licensed Entity’ (ELE) for the purposes of measuring capital adequacy; • Level 2, the consolidation of Westpac Banking Corporation and all its subsidiary entities except those entities specifically excluded by APRA regulations. The head of the Level 2 group is Westpac Banking Corporation; and • Level 3, the consolidation of Westpac Banking Corporation and all its subsidiary entities. Unless otherwise specified, all quantitative disclosures in this report refer to the prudential assessment of Westpac’s financial strength on a Level 2 basis2 . Refer to Appendix II for a list of entities excluded from regulatory consolidation for the purposes of measuring capital adequacy at Level 1 and Level 2. The Westpac Group The following diagram shows the Level 3 conglomerate group and illustrates the different tiers of regulatory consolidation. Accounting consolidation3 The consolidated financial statements incorporate the assets and liabilities of all entities including structured entities controlled by Westpac. Westpac and its subsidiaries are referred to collectively as the ‘Group’. The effects of all transactions between entities in the Group are eliminated on consolidation. Control exists when the parent entity is exposed to, or has rights to, variable returns from its involvement with an entity, and has the ability to affect those returns through its power over that entity. Subsidiaries are fully consolidated from the date on which control commences and they are no longer consolidated from the date that control ceases. Group entities excluded from the regulatory consolidation at Level 2 Regulatory consolidation at Level 2 covers the global operations of Westpac and its subsidiary entities, including other controlled banking, securities and financial entities, except for those entities involved in the following business activities: • Acting as manager, responsible entity, approved trustee, trustee or similar role in relation to funds management; • Non-financial (commercial) operations; • Special purpose entities to which assets have been transferred in accordance with the requirements of APS 120 Securitisation; or • Insurance. Retained earnings and equity investments in subsidiary entities excluded from the consolidation at Level 2 are deducted from capital, with the exception of securitisation special purpose entities. 1. APS 110 Capital Adequacy outlines the overall framework adopted by APRA for the purpose of assessing the capital adequacy of an ADI. 2. Impaired assets and provisions held in Level 3 entities are excluded from the tables in this report. 3. Refer to Note 29 and Consolidated Entity Disclosure Statement of Westpac’s 2025 Annual Report for further details. |
| OVERVIEW CREDIT RISK OTHER RISKS OTHER INFORMATION 9 Subsidiary banking entities Westpac New Zealand Limited (WNZL), a wholly owned subsidiary entity, is a registered bank incorporated in New Zealand and regulated by, among others, the Reserve Bank of New Zealand (RBNZ) for prudential purposes. WNZL uses both A-IRB and Standardised methodologies for credit risk and the SMA for operational risk. Other subsidiary banking entities in the Group include Westpac Bank PNG Limited and Westpac Europe GMBH. For the purposes of determining Westpac’s capital adequacy, subsidiary banking entities are consolidated at Level 2. Customer operations Westpac is one of Australia's leading providers of banking and certain financial services, operating under multiple brands in Australia and in New Zealand, with a small presence in Europe, North America, Asia and the Pacific. Westpac provides banking products and services through its digital and online channels, supported by a branch and ATM network, contact centres and relationship and product managers. Restrictions and major impediments on the transfer of funds or regulatory capital within the Group Certain subsidiary banking and trustee entities are subject to specific and local prudential regulation in their own right, including capital adequacy requirements and investment or intra-group exposure limits. Westpac seeks to ensure that its subsidiary entities are adequately capitalised and adhere to regulatory requirements at all times. Dividends and capital are repatriated in line with the Group’s policy subject to subsidiary Board approval and local regulations. Intra-group exposure limits Exposures to related entities are managed within the prudential limits prescribed by APRA in APS 222 Associations with Related Entities1 . Westpac has an internal limit structure and approval process governing credit exposures to related entities. This limit structure and approval process, combined with APRA’s prudential limits, is designed to reduce the potential for unacceptable contagion risk. 1. For the purposes of APS 222, subsidiaries controlled by Westpac, other than subsidiaries that form part of the ELE, represent ‘related entities’. Prudential and internal limits apply to intra-group exposures between the ELE and related entities, both on an individual and aggregate basis. |

| 10 WESTPAC GROUP SEPTEMBER 2025 PILLAR 3 REPORT CAPITAL OVERVIEW Capital Overview Capital management strategy Westpac's capital management strategy is reviewed on an ongoing basis, including through an annual Internal Capital Adequacy Assessment Process (ICAAP). Key considerations include: • Regulatory capital minimums together with the capital conservation buffer and countercyclical capital buffer comprise the Total CET1 Requirement. The total CET1 requirement is currently at least 10.25% and 10.50% effective 1 January 20271 ; • Strategy, business mix and operations and contingency plans; • Perspectives of external stakeholders including rating agencies as well as equity and debt investors; and • A stress testing framework that tests our resilience under a range of adverse economic scenarios. The Board has determined a target post dividend CET1 capital ratio of above 11.25% in normal operating conditions. This target includes consideration of APRA's increase in the minimum CET1 ratio of 0.25% to 10.50% effective 1 January 2027 and replaces the previous CET1 capital operating range of between 11.00% and 11.50%. Regulatory developments Interest Rate Risk in the Banking Book APRA’s revised APS 117 Capital Adequacy: Interest Rate Risk in the Banking Book came into effect on 1 October 2025. The revised requirements include implementation of APRA’s reaccreditation outcomes for Westpac’s IRRBB models. Reporting under the revised standard will be reflected in the 31 December 2025 Pillar 3 report. Operational risk capital overlays In 2019, APRA applied $1 billion of additional capital overlays to our operational risk capital requirement. These overlays were applied through an increase in risk weighted assets (RWA). On 19 July 2024, APRA announced its decision to reduce Westpac’s total operational risk capital overlay from $1 billion to $500 million. On 15 October 2025, APRA announced its decision to lift the Court Enforceable Undertaking and remove Westpac's remaining $500 million operational risk capital overlay. The removal of the $500 million capital overlay will mean Westpac’s CET1 capital ratio will increase by approximately 17 basis points, reflecting a reduction in risk weighted assets of $6,250 million. This change applied with immediate effect. Refer to Operational Risk section for further details. APRA announcement to phase out Additional Tier 1 (AT1) capital as eligible bank capital On 8 July 2025 APRA released a consultation paper on implementing the phase out of AT1 capital instruments. This included changes to APRA's prudential and reporting frameworks resulting from the removal of AT1 capital instruments. Under the revisions, large internationally active banks such as Westpac will replace 1.5% of AT1 capital with 1.25% of Tier 2 capital and 0.25% of CET1 capital. The total CET1 requirement, including regulatory buffers, will increase from 10.25% to 10.50%. There is no overall increase in total capital requirements for banks. APRA has also proposed changes to the leverage ratio, which will see the leverage ratio calculation based on CET1 capital rather than Tier 1 capital. Should the changes be implemented as proposed, this will result in a reduction in the reported leverage ratio. The minimum leverage ratio of 3.5% is proposed to remain unchanged. APRA intends to finalise changes to the relevant prudential standards in 2025, with the updated framework coming into effect from 1 January 2027. In addition, from this date, existing AT1 capital instruments would be eligible to be included as Tier 2 capital, until their first scheduled call date. Existing Westpac AT1 capital instruments would reach their first scheduled optional redemption dates by 2031 at the latest. 1. Noting that APRA may apply higher CET1 requirements for an individual ADI. |
| OVERVIEW CREDIT RISK OTHER RISKS OTHER INFORMATION 11 RBNZ capital review1 On 31 March 2025, the RBNZ announced a review of the key capital settings for deposit takers. On 25 August 2025, it released a consultation paper. For Group 1 deposit takers (including WNZL) the key proposals include: • Removal of AT1 instruments from the capital stack. • Two options for capital ratio requirements: – Option 1: A total CET1 capital ratio requirement of 14%, with a total capital ratio requirement of 17% (including a prudential capital buffer (‘PCB’) ratio of 8%). – Option 2: A total CET1 capital ratio requirement of 12%, with a total capital ratio requirement of 15% (including a PCB ratio of 6%) and an additional Loss Absorbing Capacity (LAC) requirement of 6%. Tier 2 capital and LAC instruments would be required to be issued internally (for example to WBC) and LAC would take a form similar to Tier 2 capital. • More granular standardised risk weights, including lower risk weights in some areas. • Setting the long-run level for the counter-cyclical capital buffer component of the PCB at 1%. The RBNZ is expected to make its final decision in December 2025 with the implementation timeline to be announced in the first quarter of the 2026 calendar year. The outcome of the review remains uncertain. 1. WNZL’s references to CET1, AT1 and other capital measures are subject to RBNZ's specific requirements and may not align with Australian requirements or definitions in the Glossary. |
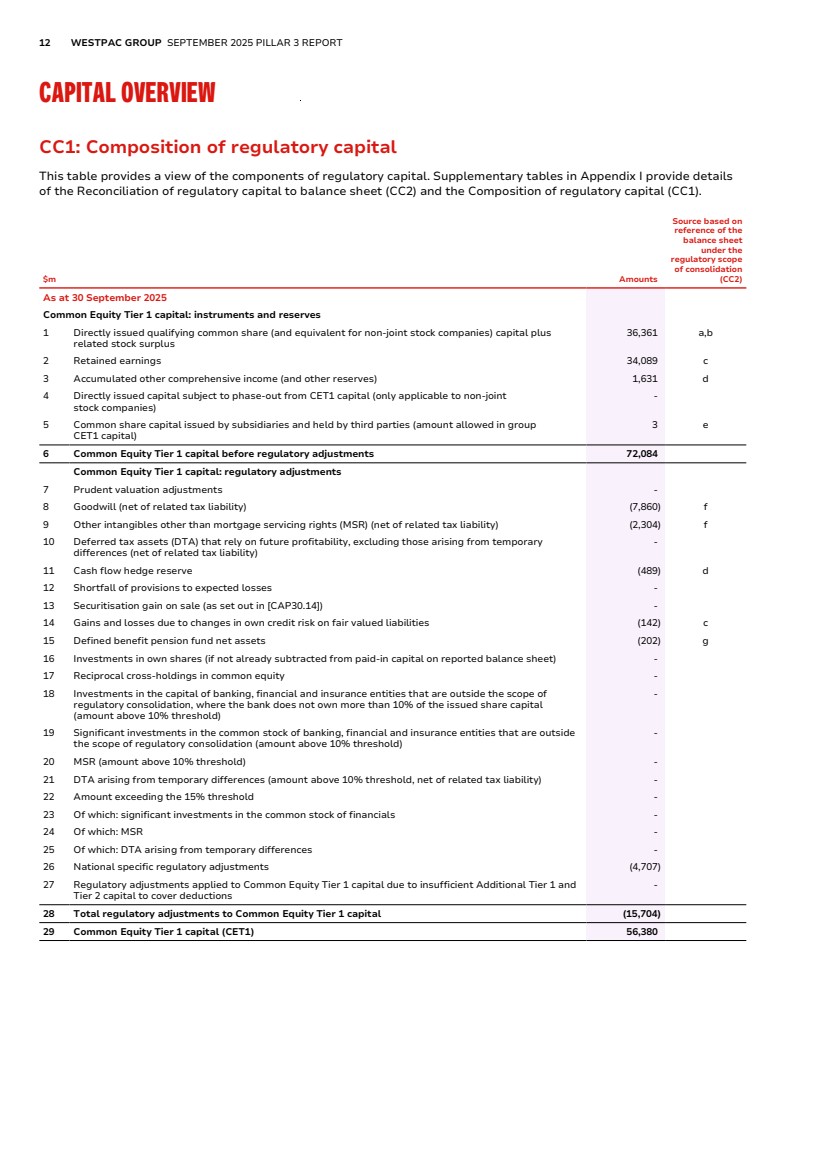
| 12 WESTPAC GROUP SEPTEMBER 2025 PILLAR 3 REPORT CAPITAL OVERVIEW CC1: Composition of regulatory capital CC1: Composition of regulatory capital This table provides a view of the components of regulatory capital. Supplementary tables in Appendix I provide details of the Reconciliation of regulatory capital to balance sheet (CC2) and the Composition of regulatory capital (CC1). $m Amounts Source based on reference of the balance sheet under the regulatory scope of consolidation (CC2) As at 30 September 2025 Common Equity Tier 1 capital: instruments and reserves 1 Directly issued qualifying common share (and equivalent for non-joint stock companies) capital plus related stock surplus 36,361 a,b 2 Retained earnings 34,089 c 3 Accumulated other comprehensive income (and other reserves) 1,631 d 4 Directly issued capital subject to phase-out from CET1 capital (only applicable to non-joint stock companies) - 5 Common share capital issued by subsidiaries and held by third parties (amount allowed in group CET1 capital) 3 e 6 Common Equity Tier 1 capital before regulatory adjustments 72,084 Common Equity Tier 1 capital: regulatory adjustments 7 Prudent valuation adjustments - 8 Goodwill (net of related tax liability) (7,860) f 9 Other intangibles other than mortgage servicing rights (MSR) (net of related tax liability) (2,304) f 10 Deferred tax assets (DTA) that rely on future profitability, excluding those arising from temporary differences (net of related tax liability) - 11 Cash flow hedge reserve (489) d 12 Shortfall of provisions to expected losses - 13 Securitisation gain on sale (as set out in [CAP30.14]) - 14 Gains and losses due to changes in own credit risk on fair valued liabilities (142) c 15 Defined benefit pension fund net assets (202) g 16 Investments in own shares (if not already subtracted from paid-in capital on reported balance sheet) - 17 Reciprocal cross-holdings in common equity - 18 Investments in the capital of banking, financial and insurance entities that are outside the scope of regulatory consolidation, where the bank does not own more than 10% of the issued share capital (amount above 10% threshold) - 19 Significant investments in the common stock of banking, financial and insurance entities that are outside the scope of regulatory consolidation (amount above 10% threshold) - 20 MSR (amount above 10% threshold) - 21 DTA arising from temporary differences (amount above 10% threshold, net of related tax liability) - 22 Amount exceeding the 15% threshold - 23 Of which: significant investments in the common stock of financials - 24 Of which: MSR - 25 Of which: DTA arising from temporary differences - 26 National specific regulatory adjustments (4,707) 27 Regulatory adjustments applied to Common Equity Tier 1 capital due to insufficient Additional Tier 1 and Tier 2 capital to cover deductions - 28 Total regulatory adjustments to Common Equity Tier 1 capital (15,704) 29 Common Equity Tier 1 capital (CET1) 56,380 |
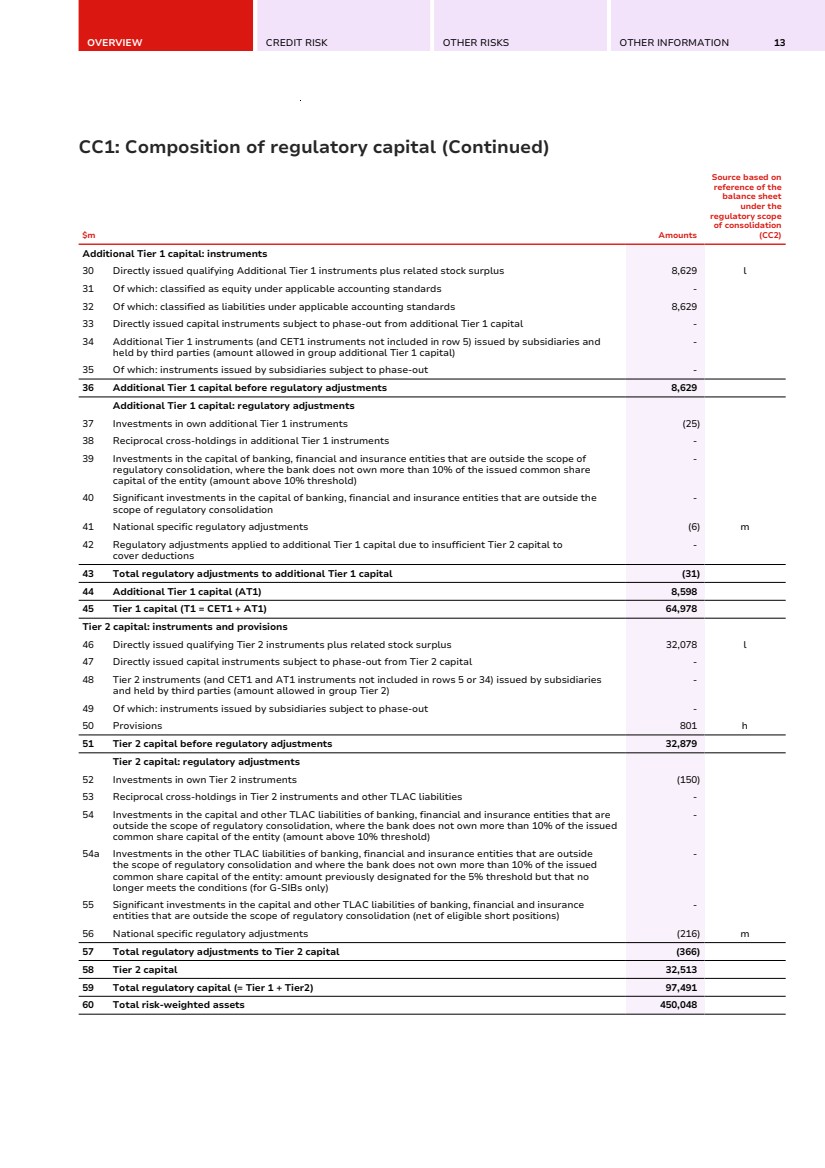
| OVERVIEW CREDIT RISK OTHER RISKS OTHER INFORMATION 13 CC1: Composition of regulatory capital (Continued) $m Amounts Source based on reference of the balance sheet under the regulatory scope of consolidation (CC2) Additional Tier 1 capital: instruments 30 Directly issued qualifying Additional Tier 1 instruments plus related stock surplus 8,629 l 31 Of which: classified as equity under applicable accounting standards - 32 Of which: classified as liabilities under applicable accounting standards 8,629 33 Directly issued capital instruments subject to phase-out from additional Tier 1 capital - 34 Additional Tier 1 instruments (and CET1 instruments not included in row 5) issued by subsidiaries and held by third parties (amount allowed in group additional Tier 1 capital) - 35 Of which: instruments issued by subsidiaries subject to phase-out - 36 Additional Tier 1 capital before regulatory adjustments 8,629 Additional Tier 1 capital: regulatory adjustments 37 Investments in own additional Tier 1 instruments (25) 38 Reciprocal cross-holdings in additional Tier 1 instruments - 39 Investments in the capital of banking, financial and insurance entities that are outside the scope of regulatory consolidation, where the bank does not own more than 10% of the issued common share capital of the entity (amount above 10% threshold) - 40 Significant investments in the capital of banking, financial and insurance entities that are outside the scope of regulatory consolidation - 41 National specific regulatory adjustments (6) m 42 Regulatory adjustments applied to additional Tier 1 capital due to insufficient Tier 2 capital to cover deductions - 43 Total regulatory adjustments to additional Tier 1 capital (31) 44 Additional Tier 1 capital (AT1) 8,598 45 Tier 1 capital (T1 = CET1 + AT1) 64,978 Tier 2 capital: instruments and provisions 46 Directly issued qualifying Tier 2 instruments plus related stock surplus 32,078 l 47 Directly issued capital instruments subject to phase-out from Tier 2 capital - 48 Tier 2 instruments (and CET1 and AT1 instruments not included in rows 5 or 34) issued by subsidiaries and held by third parties (amount allowed in group Tier 2) - 49 Of which: instruments issued by subsidiaries subject to phase-out - 50 Provisions 801 h 51 Tier 2 capital before regulatory adjustments 32,879 Tier 2 capital: regulatory adjustments 52 Investments in own Tier 2 instruments (150) 53 Reciprocal cross-holdings in Tier 2 instruments and other TLAC liabilities - 54 Investments in the capital and other TLAC liabilities of banking, financial and insurance entities that are outside the scope of regulatory consolidation, where the bank does not own more than 10% of the issued common share capital of the entity (amount above 10% threshold) - 54a Investments in the other TLAC liabilities of banking, financial and insurance entities that are outside the scope of regulatory consolidation and where the bank does not own more than 10% of the issued common share capital of the entity: amount previously designated for the 5% threshold but that no longer meets the conditions (for G-SIBs only) - 55 Significant investments in the capital and other TLAC liabilities of banking, financial and insurance entities that are outside the scope of regulatory consolidation (net of eligible short positions) - 56 National specific regulatory adjustments (216) m 57 Total regulatory adjustments to Tier 2 capital (366) 58 Tier 2 capital 32,513 59 Total regulatory capital (= Tier 1 + Tier2) 97,491 60 Total risk-weighted assets 450,048 |
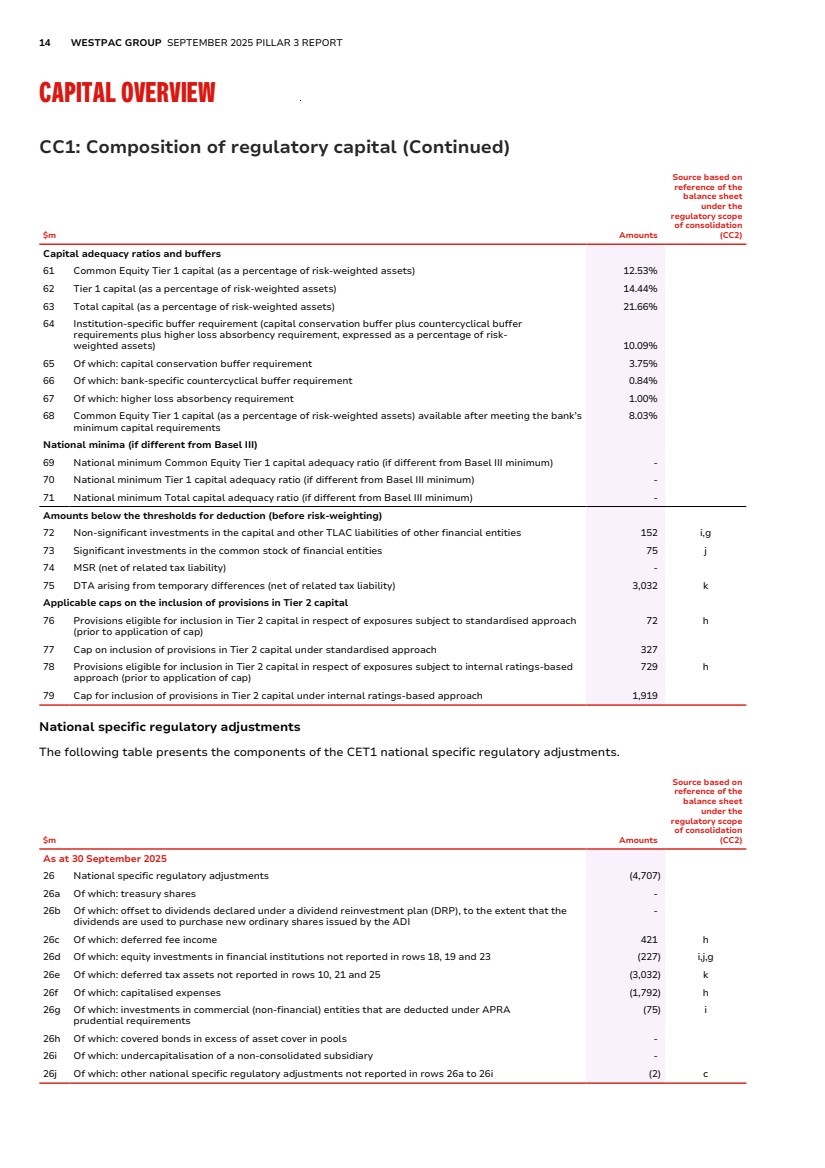
| 14 WESTPAC GROUP SEPTEMBER 2025 PILLAR 3 REPORT CAPITAL OVERVIEW CC1: Composition of regulatory capital (Continued) $m Amounts Source based on reference of the balance sheet under the regulatory scope of consolidation (CC2) Capital adequacy ratios and buffers 61 Common Equity Tier 1 capital (as a percentage of risk-weighted assets) 12.53% 62 Tier 1 capital (as a percentage of risk-weighted assets) 14.44% 63 Total capital (as a percentage of risk-weighted assets) 21.66% 64 Institution-specific buffer requirement (capital conservation buffer plus countercyclical buffer requirements plus higher loss absorbency requirement, expressed as a percentage of risk-weighted assets) 10.09% 65 Of which: capital conservation buffer requirement 3.75% 66 Of which: bank-specific countercyclical buffer requirement 0.84% 67 Of which: higher loss absorbency requirement 1.00% 68 Common Equity Tier 1 capital (as a percentage of risk-weighted assets) available after meeting the bank’s minimum capital requirements 8.03% National minima (if different from Basel III) 69 National minimum Common Equity Tier 1 capital adequacy ratio (if different from Basel III minimum) - 70 National minimum Tier 1 capital adequacy ratio (if different from Basel III minimum) - 71 National minimum Total capital adequacy ratio (if different from Basel III minimum) - Amounts below the thresholds for deduction (before risk-weighting) 72 Non-significant investments in the capital and other TLAC liabilities of other financial entities 152 i,g 73 Significant investments in the common stock of financial entities 75 j 74 MSR (net of related tax liability) - 75 DTA arising from temporary differences (net of related tax liability) 3,032 k Applicable caps on the inclusion of provisions in Tier 2 capital 76 Provisions eligible for inclusion in Tier 2 capital in respect of exposures subject to standardised approach (prior to application of cap) 72 h 77 Cap on inclusion of provisions in Tier 2 capital under standardised approach 327 78 Provisions eligible for inclusion in Tier 2 capital in respect of exposures subject to internal ratings-based approach (prior to application of cap) 729 h 79 Cap for inclusion of provisions in Tier 2 capital under internal ratings-based approach 1,919 National specific regulatory adjustments The following table presents the components of the CET1 national specific regulatory adjustments. $m Amounts Source based on reference of the balance sheet under the regulatory scope of consolidation (CC2) As at 30 September 2025 26 National specific regulatory adjustments (4,707) 26a Of which: treasury shares - 26b Of which: offset to dividends declared under a dividend reinvestment plan (DRP), to the extent that the dividends are used to purchase new ordinary shares issued by the ADI - 26c Of which: deferred fee income 421 h 26d Of which: equity investments in financial institutions not reported in rows 18, 19 and 23 (227) i,j,g 26e Of which: deferred tax assets not reported in rows 10, 21 and 25 (3,032) k 26f Of which: capitalised expenses (1,792) h 26g Of which: investments in commercial (non-financial) entities that are deducted under APRA prudential requirements (75) i 26h Of which: covered bonds in excess of asset cover in pools - 26i Of which: undercapitalisation of a non-consolidated subsidiary - 26j Of which: other national specific regulatory adjustments not reported in rows 26a to 26i (2) c |
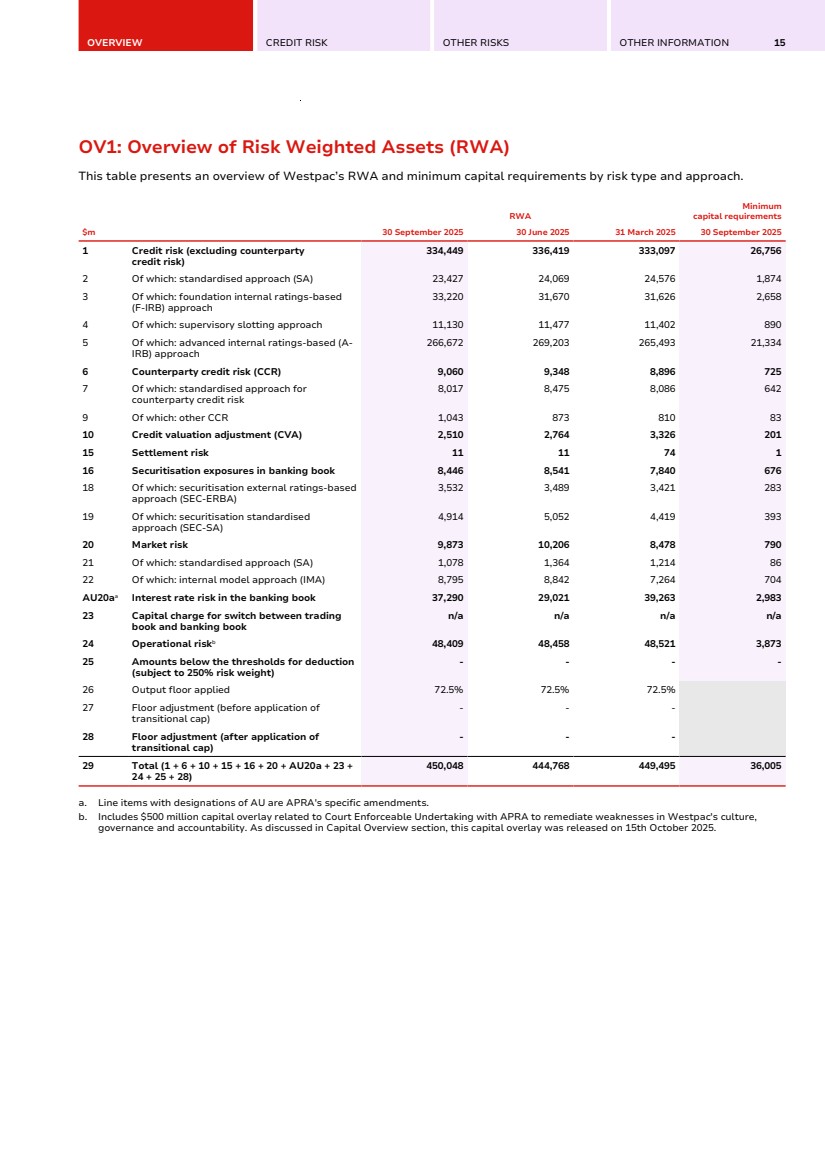
| OVERVIEW CREDIT RISK OTHER RISKS OTHER INFORMATION 15 OV1: Overview of Risk Weighted Assets (RWA) OV1: Overview of Risk Weighted Assets (RWA) This table presents an overview of Westpac’s RWA and minimum capital requirements by risk type and approach. $m RWA Minimum capital requirements 30 September 2025 30 June 2025 31 March 2025 30 September 2025 1 Credit risk (excluding counterparty credit risk) 334,449 336,419 333,097 26,756 2 Of which: standardised approach (SA) 23,427 24,069 24,576 1,874 3 Of which: foundation internal ratings-based (F-IRB) approach 33,220 31,670 31,626 2,658 4 Of which: supervisory slotting approach 11,130 11,477 11,402 890 5 Of which: advanced internal ratings-based (A-IRB) approach 266,672 269,203 265,493 21,334 6 Counterparty credit risk (CCR) 9,060 9,348 8,896 725 7 Of which: standardised approach for counterparty credit risk 8,017 8,475 8,086 642 9 Of which: other CCR 1,043 873 810 83 10 Credit valuation adjustment (CVA) 2,510 2,764 3,326 201 15 Settlement risk 11 11 74 1 16 Securitisation exposures in banking book 8,446 8,541 7,840 676 18 Of which: securitisation external ratings-based approach (SEC-ERBA) 3,532 3,489 3,421 283 19 Of which: securitisation standardised approach (SEC-SA) 4,914 5,052 4,419 393 20 Market risk 9,873 10,206 8,478 790 21 Of which: standardised approach (SA) 1,078 1,364 1,214 86 22 Of which: internal model approach (IMA) 8,795 8,842 7,264 704 AU20aa Interest rate risk in the banking book 37,290 29,021 39,263 2,983 23 Capital charge for switch between trading book and banking book n/a n/a n/a n/a 24 Operational riskb 48,409 48,458 48,521 3,873 25 Amounts below the thresholds for deduction (subject to 250% risk weight) - - - - 26 Output floor applied 72.5% 72.5% 72.5% 27 Floor adjustment (before application of transitional cap) - - - 28 Floor adjustment (after application of transitional cap) - - - 29 Total (1 + 6 + 10 + 15 + 16 + 20 + AU20a + 23 + 24 + 25 + 28) 450,048 444,768 449,495 36,005 a. Line items with designations of AU are APRA's specific amendments. b. Includes $500 million capital overlay related to Court Enforceable Undertaking with APRA to remediate weaknesses in Westpac's culture, governance and accountability. As discussed in Capital Overview section, this capital overlay was released on 15th October 2025. |
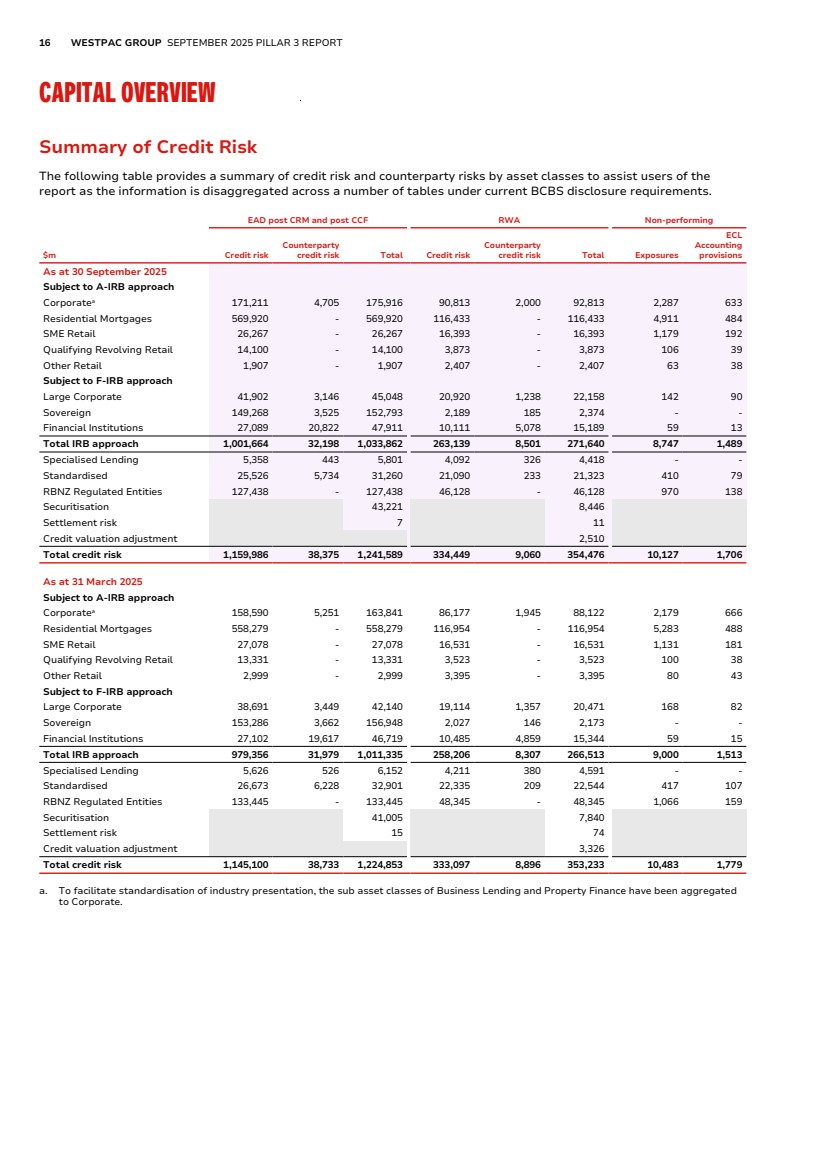
| 16 WESTPAC GROUP SEPTEMBER 2025 PILLAR 3 REPORT CAPITAL OVERVIEW Summary of Credit Risk Summary of Credit Risk The following table provides a summary of credit risk and counterparty risks by asset classes to assist users of the report as the information is disaggregated across a number of tables under current BCBS disclosure requirements. EAD post CRM and post CCF RWA Non-performing $m Credit risk Counterparty credit risk Total Credit risk Counterparty credit risk Total Exposures ECL Accounting provisions As at 30 September 2025 Subject to A-IRB approach Corporatea 171,211 4,705 175,916 90,813 2,000 92,813 2,287 633 Residential Mortgages 569,920 - 569,920 116,433 - 116,433 4,911 484 SME Retail 26,267 - 26,267 16,393 - 16,393 1,179 192 Qualifying Revolving Retail 14,100 - 14,100 3,873 - 3,873 106 39 Other Retail 1,907 - 1,907 2,407 - 2,407 63 38 Subject to F-IRB approach Large Corporate 41,902 3,146 45,048 20,920 1,238 22,158 142 90 Sovereign 149,268 3,525 152,793 2,189 185 2,374 - - Financial Institutions 27,089 20,822 47,911 10,111 5,078 15,189 59 13 Total IRB approach 1,001,664 32,198 1,033,862 263,139 8,501 271,640 8,747 1,489 Specialised Lending 5,358 443 5,801 4,092 326 4,418 - - Standardised 25,526 5,734 31,260 21,090 233 21,323 410 79 RBNZ Regulated Entities 127,438 - 127,438 46,128 - 46,128 970 138 Securitisation 43,221 8,446 Settlement risk 7 11 Credit valuation adjustment 2,510 Total credit risk 1,159,986 38,375 1,241,589 334,449 9,060 354,476 10,127 1,706 As at 31 March 2025 Subject to A-IRB approach Corporatea 158,590 5,251 163,841 86,177 1,945 88,122 2,179 666 Residential Mortgages 558,279 - 558,279 116,954 - 116,954 5,283 488 SME Retail 27,078 - 27,078 16,531 - 16,531 1,131 181 Qualifying Revolving Retail 13,331 - 13,331 3,523 - 3,523 100 38 Other Retail 2,999 - 2,999 3,395 - 3,395 80 43 Subject to F-IRB approach Large Corporate 38,691 3,449 42,140 19,114 1,357 20,471 168 82 Sovereign 153,286 3,662 156,948 2,027 146 2,173 - - Financial Institutions 27,102 19,617 46,719 10,485 4,859 15,344 59 15 Total IRB approach 979,356 31,979 1,011,335 258,206 8,307 266,513 9,000 1,513 Specialised Lending 5,626 526 6,152 4,211 380 4,591 - - Standardised 26,673 6,228 32,901 22,335 209 22,544 417 107 RBNZ Regulated Entities 133,445 - 133,445 48,345 - 48,345 1,066 159 Securitisation 41,005 7,840 Settlement risk 15 74 Credit valuation adjustment 3,326 Total credit risk 1,145,100 38,733 1,224,853 333,097 8,896 353,233 10,483 1,779 a. To facilitate standardisation of industry presentation, the sub asset classes of Business Lending and Property Finance have been aggregated to Corporate. |
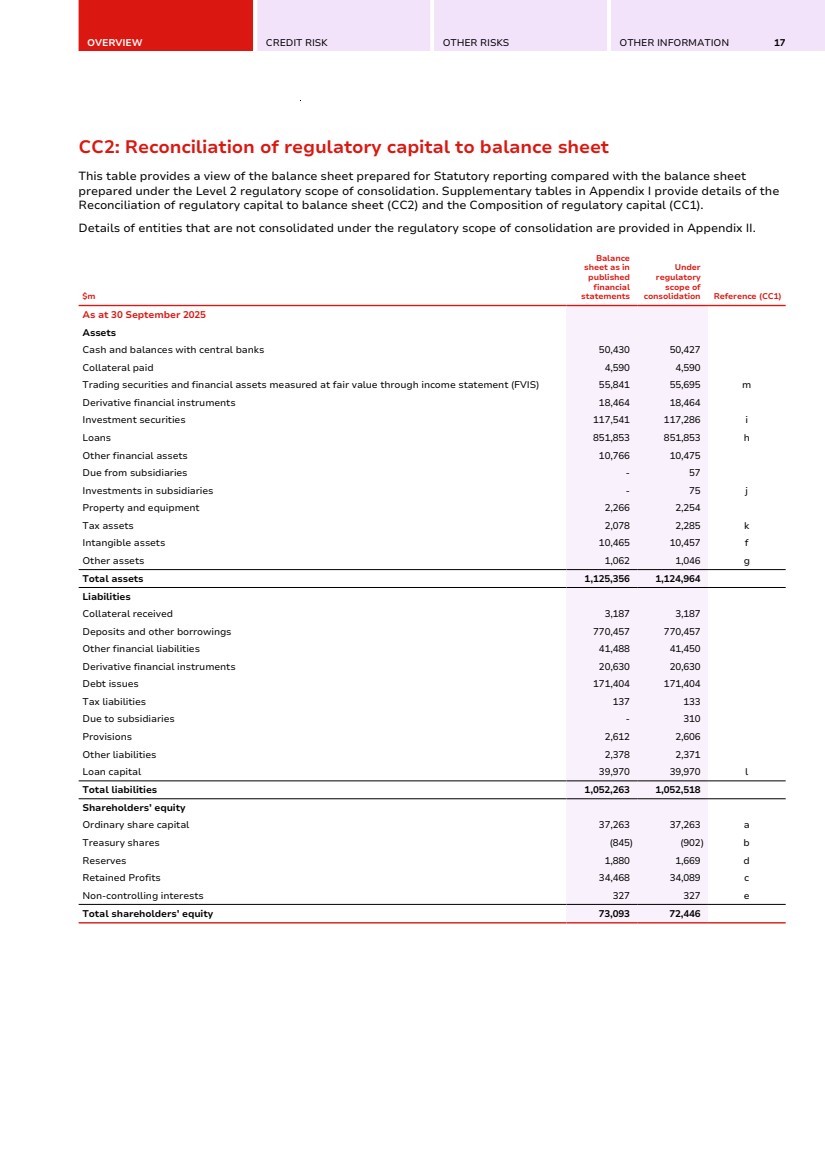
| OVERVIEW CREDIT RISK OTHER RISKS OTHER INFORMATION 17 CC2: Reconciliation of regulatory capital to balance sheet CC2: Reconciliation of regulatory capital to balance sheet This table provides a view of the balance sheet prepared for Statutory reporting compared with the balance sheet prepared under the Level 2 regulatory scope of consolidation. Supplementary tables in Appendix I provide details of the Reconciliation of regulatory capital to balance sheet (CC2) and the Composition of regulatory capital (CC1). Details of entities that are not consolidated under the regulatory scope of consolidation are provided in Appendix II. $m Balance sheet as in published financial statements Under regulatory scope of consolidation Reference (CC1) As at 30 September 2025 Assets Cash and balances with central banks 50,430 50,427 Collateral paid 4,590 4,590 Trading securities and financial assets measured at fair value through income statement (FVIS) 55,841 55,695 m Derivative financial instruments 18,464 18,464 Investment securities 117,541 117,286 i Loans 851,853 851,853 h Other financial assets 10,766 10,475 Due from subsidiaries - 57 Investments in subsidiaries - 75 j Property and equipment 2,266 2,254 Tax assets 2,078 2,285 k Intangible assets 10,465 10,457 f Other assets 1,062 1,046 g Total assets 1,125,356 1,124,964 Liabilities Collateral received 3,187 3,187 Deposits and other borrowings 770,457 770,457 Other financial liabilities 41,488 41,450 Derivative financial instruments 20,630 20,630 Debt issues 171,404 171,404 Tax liabilities 137 133 Due to subsidiaries - 310 Provisions 2,612 2,606 Other liabilities 2,378 2,371 Loan capital 39,970 39,970 l Total liabilities 1,052,263 1,052,518 Shareholders’ equity Ordinary share capital 37,263 37,263 a Treasury shares (845) (902) b Reserves 1,880 1,669 d Retained Profits 34,468 34,089 c Non-controlling interests 327 327 e Total shareholders’ equity 73,093 72,446 |
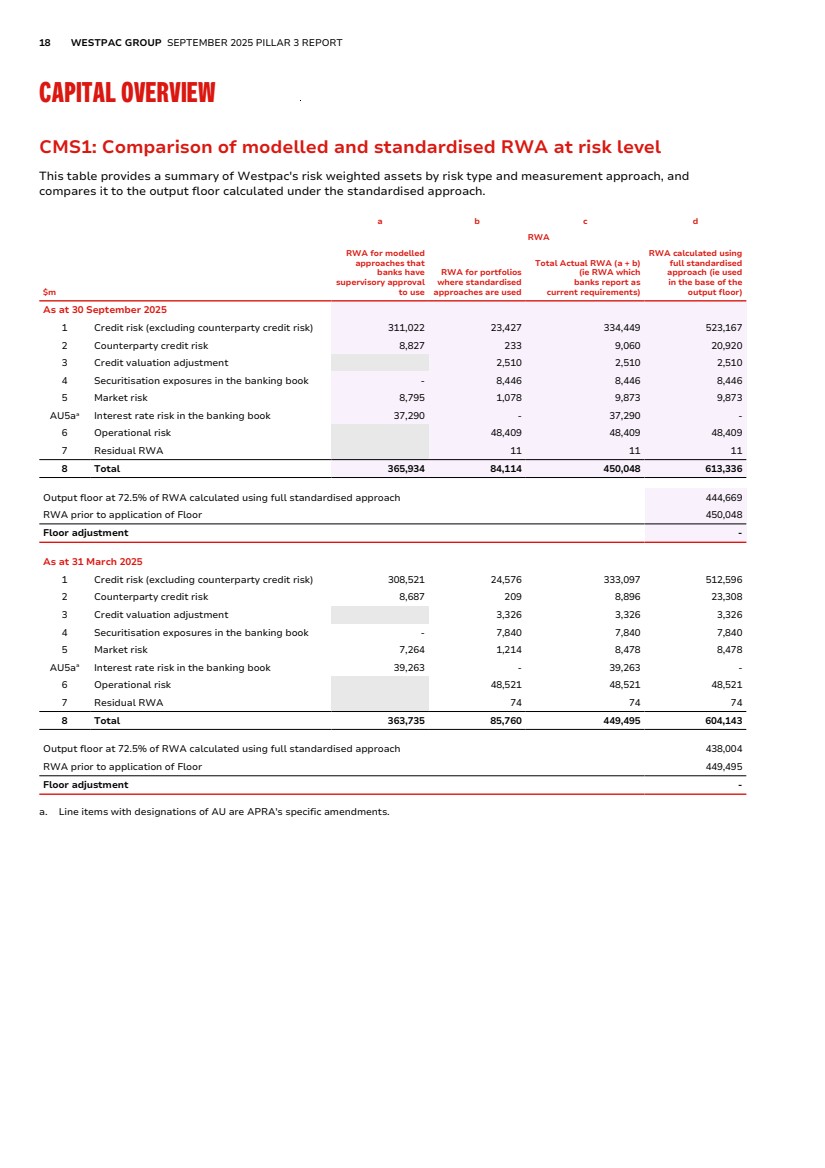
| 18 WESTPAC GROUP SEPTEMBER 2025 PILLAR 3 REPORT CAPITAL OVERVIEW CMS1: Comparison of modelled and standardised RWA at risk level CMS1: Comparison of modelled and standardised RWA at risk level This table provides a summary of Westpac's risk weighted assets by risk type and measurement approach, and compares it to the output floor calculated under the standardised approach. $m a b c d RWA RWA for modelled approaches that banks have supervisory approval to use RWA for portfolios where standardised approaches are used Total Actual RWA (a + b) (ie RWA which banks report as current requirements) RWA calculated using full standardised approach (ie used in the base of the output floor) As at 30 September 2025 1 Credit risk (excluding counterparty credit risk) 311,022 23,427 334,449 523,167 2 Counterparty credit risk 8,827 233 9,060 20,920 3 Credit valuation adjustment 2,510 2,510 2,510 4 Securitisation exposures in the banking book - 8,446 8,446 8,446 5 Market risk 8,795 1,078 9,873 9,873 AU5aa Interest rate risk in the banking book 37,290 - 37,290 - 6 Operational risk 48,409 48,409 48,409 7 Residual RWA 11 11 11 8 Total 365,934 84,114 450,048 613,336 Output floor at 72.5% of RWA calculated using full standardised approach 444,669 RWA prior to application of Floor 450,048 Floor adjustment - As at 31 March 2025 1 Credit risk (excluding counterparty credit risk) 308,521 24,576 333,097 512,596 2 Counterparty credit risk 8,687 209 8,896 23,308 3 Credit valuation adjustment 3,326 3,326 3,326 4 Securitisation exposures in the banking book - 7,840 7,840 7,840 5 Market risk 7,264 1,214 8,478 8,478 AU5aa Interest rate risk in the banking book 39,263 - 39,263 - 6 Operational risk 48,521 48,521 48,521 7 Residual RWA 74 74 74 8 Total 363,735 85,760 449,495 604,143 Output floor at 72.5% of RWA calculated using full standardised approach 438,004 RWA prior to application of Floor 449,495 Floor adjustment - a. Line items with designations of AU are APRA's specific amendments. |
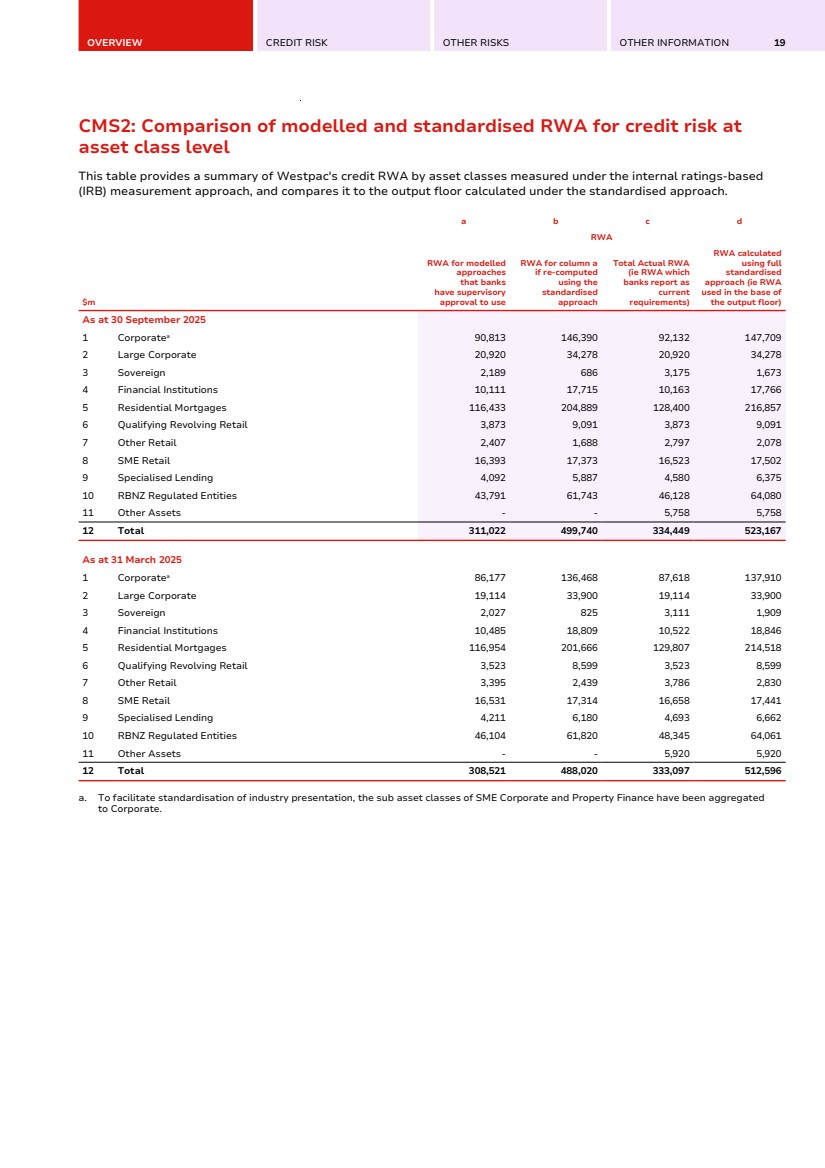
| OVERVIEW CREDIT RISK OTHER RISKS OTHER INFORMATION 19 CMS2: Comparison of modelled and standardised RWA for credit risk at asset class level CMS2: Comparison of modelled and standardised RWA for credit risk at asset class level This table provides a summary of Westpac's credit RWA by asset classes measured under the internal ratings-based (IRB) measurement approach, and compares it to the output floor calculated under the standardised approach. $m a b c d RWA RWA for modelled approaches that banks have supervisory approval to use RWA for column a if re-computed using the standardised approach Total Actual RWA (ie RWA which banks report as current requirements) RWA calculated using full standardised approach (ie RWA used in the base of the output floor) As at 30 September 2025 1 Corporatea 90,813 146,390 92,132 147,709 2 Large Corporate 20,920 34,278 20,920 34,278 3 Sovereign 2,189 686 3,175 1,673 4 Financial Institutions 10,111 17,715 10,163 17,766 5 Residential Mortgages 116,433 204,889 128,400 216,857 6 Qualifying Revolving Retail 3,873 9,091 3,873 9,091 7 Other Retail 2,407 1,688 2,797 2,078 8 SME Retail 16,393 17,373 16,523 17,502 9 Specialised Lending 4,092 5,887 4,580 6,375 10 RBNZ Regulated Entities 43,791 61,743 46,128 64,080 11 Other Assets - - 5,758 5,758 12 Total 311,022 499,740 334,449 523,167 As at 31 March 2025 1 Corporatea 86,177 136,468 87,618 137,910 2 Large Corporate 19,114 33,900 19,114 33,900 3 Sovereign 2,027 825 3,111 1,909 4 Financial Institutions 10,485 18,809 10,522 18,846 5 Residential Mortgages 116,954 201,666 129,807 214,518 6 Qualifying Revolving Retail 3,523 8,599 3,523 8,599 7 Other Retail 3,395 2,439 3,786 2,830 8 SME Retail 16,531 17,314 16,658 17,441 9 Specialised Lending 4,211 6,180 4,693 6,662 10 RBNZ Regulated Entities 46,104 61,820 48,345 64,061 11 Other Assets - - 5,920 5,920 12 Total 308,521 488,020 333,097 512,596 a. To facilitate standardisation of industry presentation, the sub asset classes of SME Corporate and Property Finance have been aggregated to Corporate. |
| 20 WESTPAC GROUP SEPTEMBER 2025 PILLAR 3 REPORT RISK MANAGEMENT APPROACH Risk Management Approach Risk Appetite and Risk Types Westpac's operations expose us to risks. Westpac’s appetite for risk is informed by its strategic objectives and business plans, regulatory rules and ratios, and the potential for adverse outcomes that may result in material impacts on Westpac's customers, people, reputation, regulatory relationships and/or financial position including the potential for capital and liquidity ratios to fall below target levels in stressed scenarios. Westpac distinguishes between different types of risk and takes an integrated approach toward identifying, assessing, and managing risks. The Risk Management Strategy, which incorporates the risk management framework model, and the Board Risk Appetite Statement, together with monitoring and controls are key to identifying and managing risk. Westpac's key risks are: • capital adequacy risk – the risk that Westpac has an inadequate level or composition of capital to support its normal business activities and to meet its regulatory capital requirements under both normal and stressed operating environments; • compliance and conduct risk – the risk of failing to abide by compliance obligations required of Westpac or otherwise failing to have behaviours and practices that deliver suitable, fair, and clear outcomes for our customers and that support market integrity; • credit risk – the risk of financial loss where a customer or counterparty fails to meet their financial obligations to Westpac; • cyber risk – the risk that Westpac or its third parties’ data or technology are inappropriately accessed, manipulated, or damaged from cyber threats or vulnerabilities; • financial crime risk – the risk that Westpac fails to prevent products and services being used to facilitate financial crime, fails to protect our customers and Westpac from fraud and scam events or fails to comply with applicable global financial crime regulatory obligations; • funding and liquidity risk – the risk that Westpac cannot meet its payment obligations or that it does not have the appropriate amount, tenor and composition of funding and liquidity to support its assets; • market risk – the risk of an adverse impact on Westpac’s earnings and economic value resulting from changes in the value of Westpac's positions as a result of a change in financial market factors, such as foreign exchange rates, commodity prices, equity prices, credit spreads and interest rates. This includes earnings at risk - the risk to net interest income from interest rate changes and economic value sensitivity - the risk of variability in the Group's banking book capital requirements; • operational risk – the risk of loss resulting from inadequate or failed internal processes, people and systems or from external events; • reputational and sustainability risk − the risk of failing to recognise or address environmental, social or governance (ESG) issues and the risk that an action, inaction, transaction, investment, or event will reduce trust in Westpac’s integrity and competence by clients, counterparties, investors, regulators, employees, or the public; • risk culture – the risk that Westpac's culture does not promote and reinforce behavioural expectations or structures to identify, understand, discuss and act on risks; and • strategic risk – the risk that Westpac makes inappropriate strategic choices, does not implement its strategies successfully, or does not respond effectively to changes in the environment. Risk Management Strategy Westpac has put in place a Risk Management Strategy (incorporating the risk management framework model) that: • is proactive in the management of risk and risk culture to achieve Westpac’s purpose of creating better futures together; • embeds a consistent and integrated risk management approach in its processes and culture; • continues to improve the management of risk; • is resilient to operational risks and disruptions and manages the risks that arise arising from service providers; • understands the reward-to-risk balance and where required, reduces risks to acceptable levels. The Risk Management Strategy and Board Risk Appetite Statement were approved by the Board during the 12 months to 30 September 2025. |
| OVERVIEW CREDIT RISK OTHER RISKS OTHER INFORMATION 21 Roles and responsibilities We have adopted and continue to embed a Three Lines of Defence model which enables all our people to understand their roles and responsibilities in the active management of risk. First Line of Defence (1LOD) The 1LOD under the Three Lines of Defence Model refers to all Divisions and Functions excluding the Risk and Audit functions. The 1LOD proactively identifies, evaluates, owns, monitors, manages and controls the existing and emerging risks in their business. It manages business activities within approved risk appetite and policies. In managing its risk, the 1LOD establishes and maintains appropriate governance structures, controls, resources and self-assessment processes, including issue identification, recording and escalation procedures. Second Line of Defence (2LOD) The 2LOD under the Three Lines of Defence Model refers to the Risk Function. It is an independent function that develops risk management frameworks, defines guardrails, provides objective review and challenge regarding the effectiveness of risk management within the 1LOD business, and executes specific risk management activities where functional independence and/or specific risk capability is required. Its approach is risk-based and proportionate to 1LOD activities. Third Line of Defence (3LOD) Group Audit is the 3LOD assurance function that provides the Board and Senior Executive with independent and objective evaluation of the adequacy and effectiveness of the Group’s governance, risk management and internal controls. Risk management governance structure Governance Structure Functions and responsibilities Board • approves the overall risk management framework for managing financial and non-financial risks, as well as Westpac’s Risk Management Strategy and Board Risk Appetite Statement, and monitors the effectiveness of risk management by Westpac; • forms a view of Westpac’s risk culture and oversees the identification of, and steps taken to address, any changes to risk culture; • approves the Internal Capital Adequacy Assessment Process (ICAAP), including reviewing Group stress testing scenarios/outcomes, and approves Westpac's recovery and exit plans and material relevant to resolution planning; • approves the strategic direction of the Westpac Group; and • makes its annual declaration to APRA on risk management in accordance with APRA prudential standard CPS 220 Risk Management. |
| 22 WESTPAC GROUP SEPTEMBER 2025 PILLAR 3 REPORT RISK MANAGEMENT APPROACH Governance Structure Functions and responsibilities Board Risk Committee (BRiskC) From the perspective of specific types of risk, the BRiskC’s role includes reviewing and approving risk management frameworks and material supporting policies and limits as required, and in addition: • credit risk – reviewing and approving Westpac’s Credit Risk Management Strategy and Credit Risk Appetite Statement and material policies and limits supporting Westpac’s Credit Risk Management Framework, noting credit provisioning levels, and monitoring the risk profile, performance, and management of our credit portfolio; • funding and liquidity risk – reviewing and approving Westpac’s annual funding strategy, and liquidity targets and limits, reviewing and recommending recovery and exit plans and resolution plans to the Board for approval, and monitoring the liquidity position and requirements; • capital adequacy risk – reviewing and recommending the ICAAP to the Board for approval including target capital ranges (where appropriate) and reviewing and monitoring capital levels for consistency with the Board Risk Appetite Statement; • market risk – reviewing Westpac’s trading and non-trading market risk profiles and their respective exposure against limits; • non-financial risks, including operational risk, compliance and conduct risk, cyber risk, financial crime risk, and reputational and sustainability risk and monitoring the performance of risk class management and controls; and • risk culture – forming a view on Westpac’s risk culture and the extent to which it supports our ability to operate consistently within Westpac’s Risk Management Strategy and Board Risk Appetite Statement, and overseeing the identification of, and steps taken to address, any desirable changes to risk culture. The Board Risk Committee also: • reviews the Westpac Group stress testing results, monitors management response and, together with the Board provides recommendations for future scenarios; • provides relevant periodic assurances and reports (as appropriate) to the Board Audit Committee; • refers or recommends to the Board and any other Board Committees (as appropriate) any matters that have come to the attention of the Board Risk Committee that are relevant for the Board or the respective Board Committee; and • in its capacity as the Westpac Group’s US Risk Committee, oversees the key risks, risk management framework and policies of Westpac’s US operations. Assists the Board to: • consider and approve Westpac’s overall risk management framework for managing financial and non-financial risks; • oversee risk culture across Westpac; • oversee Westpac’s risk profile and set risk appetite for material risks; • review and approve the Risk Management Strategy and Board Risk Appetite Statement; • make its annual declaration to APRA on risk management under APRA prudential standard CPS 220 Risk Management; and • oversee compliance risk management within Westpac. The Committee is also responsible for: • reviewing and monitoring Westpac’s risk profile and controls for consistency with the Board Risk Appetite Statement; • reviewing and recommending Westpac's recovery and exit plan and material relevant to resolution planning to the Board for approval; • reviewing and approving the limits and conditions that apply to the delegated credit risk approval authorities; • monitoring changes anticipated for the economic and business environment including consideration of emerging risks and other factors considered relevant to risk profile and risk appetite; • reviewing and where appropriate approving risks beyond the approval discretion provided to management; and • overseeing material legal and regulatory change relevant to Westpac and the management of material litigation and regulatory investigations and associated remediation activities. |
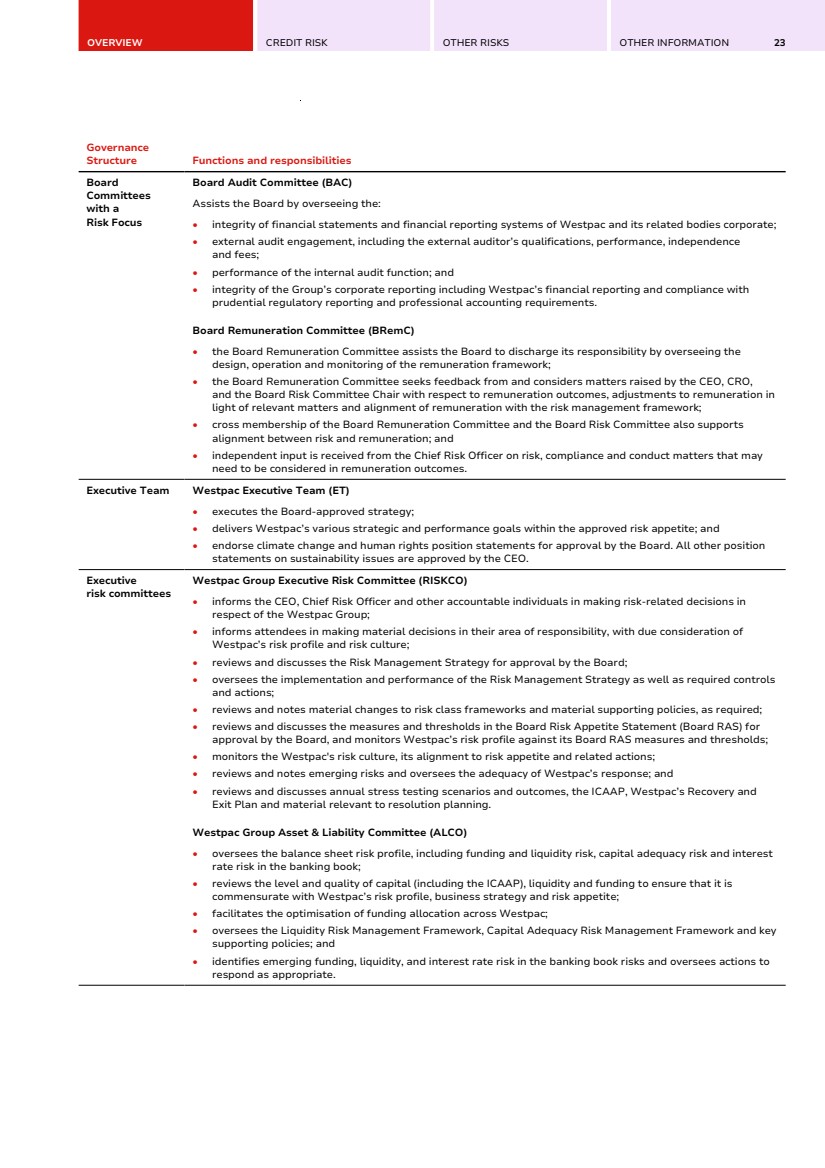
| OVERVIEW CREDIT RISK OTHER RISKS OTHER INFORMATION 23 Governance Structure Functions and responsibilities Board Committees with a Risk Focus Board Audit Committee (BAC) Assists the Board by overseeing the: • integrity of financial statements and financial reporting systems of Westpac and its related bodies corporate; • external audit engagement, including the external auditor’s qualifications, performance, independence and fees; • performance of the internal audit function; and • integrity of the Group’s corporate reporting including Westpac’s financial reporting and compliance with prudential regulatory reporting and professional accounting requirements. Board Remuneration Committee (BRemC) • the Board Remuneration Committee assists the Board to discharge its responsibility by overseeing the design, operation and monitoring of the remuneration framework; • the Board Remuneration Committee seeks feedback from and considers matters raised by the CEO, CRO, and the Board Risk Committee Chair with respect to remuneration outcomes, adjustments to remuneration in light of relevant matters and alignment of remuneration with the risk management framework; • cross membership of the Board Remuneration Committee and the Board Risk Committee also supports alignment between risk and remuneration; and • independent input is received from the Chief Risk Officer on risk, compliance and conduct matters that may need to be considered in remuneration outcomes. Executive Team Westpac Executive Team (ET) • executes the Board-approved strategy; • delivers Westpac’s various strategic and performance goals within the approved risk appetite; and • endorse climate change and human rights position statements for approval by the Board. All other position statements on sustainability issues are approved by the CEO. Executive risk committees Westpac Group Executive Risk Committee (RISKCO) • informs the CEO, Chief Risk Officer and other accountable individuals in making risk-related decisions in respect of the Westpac Group; • informs attendees in making material decisions in their area of responsibility, with due consideration of Westpac’s risk profile and risk culture; • reviews and discusses the Risk Management Strategy for approval by the Board; • oversees the implementation and performance of the Risk Management Strategy as well as required controls and actions; • reviews and notes material changes to risk class frameworks and material supporting policies, as required; • reviews and discusses the measures and thresholds in the Board Risk Appetite Statement (Board RAS) for approval by the Board, and monitors Westpac’s risk profile against its Board RAS measures and thresholds; • monitors the Westpac's risk culture, its alignment to risk appetite and related actions; • reviews and notes emerging risks and oversees the adequacy of Westpac’s response; and • reviews and discusses annual stress testing scenarios and outcomes, the ICAAP, Westpac’s Recovery and Exit Plan and material relevant to resolution planning. Westpac Group Asset & Liability Committee (ALCO) • oversees the balance sheet risk profile, including funding and liquidity risk, capital adequacy risk and interest rate risk in the banking book; • reviews the level and quality of capital (including the ICAAP), liquidity and funding to ensure that it is commensurate with Westpac’s risk profile, business strategy and risk appetite; • facilitates the optimisation of funding allocation across Westpac; • oversees the Liquidity Risk Management Framework, Capital Adequacy Risk Management Framework and key supporting policies; and • identifies emerging funding, liquidity, and interest rate risk in the banking book risks and oversees actions to respond as appropriate. |
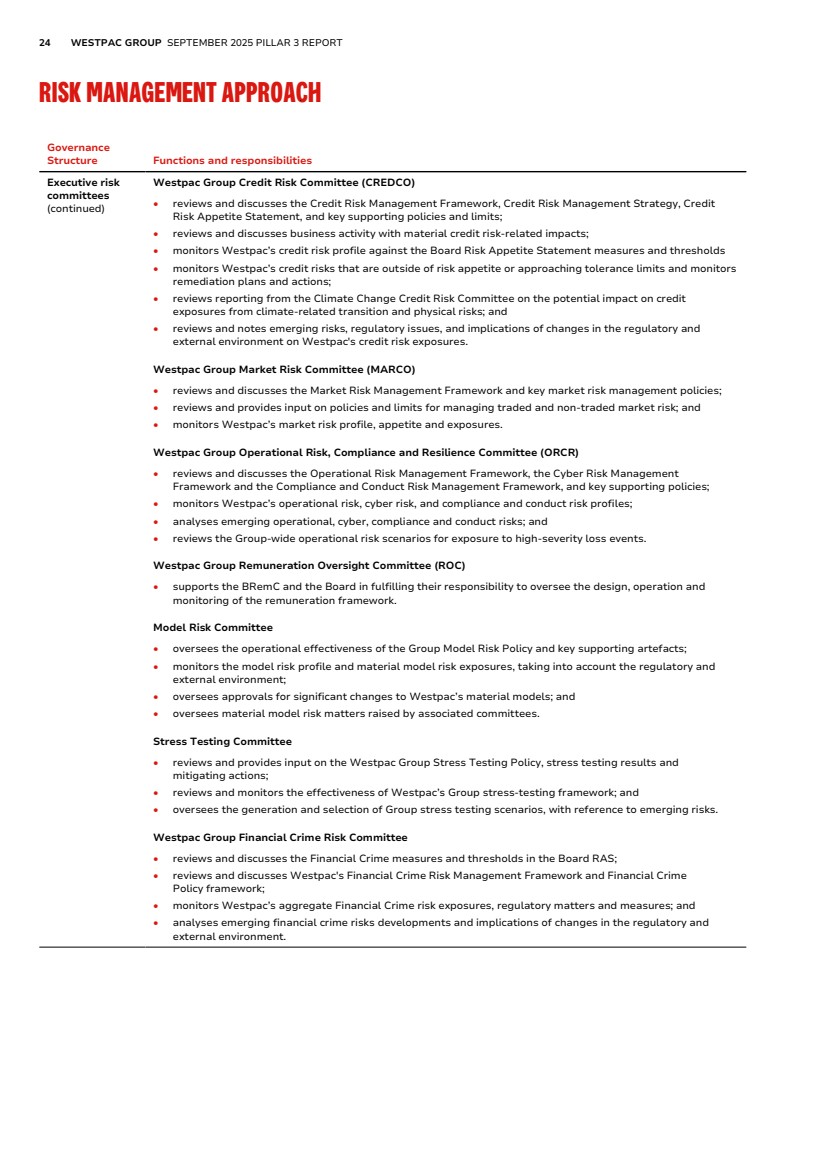
| 24 WESTPAC GROUP SEPTEMBER 2025 PILLAR 3 REPORT RISK MANAGEMENT APPROACH Governance Structure Functions and responsibilities Executive risk committees (continued) Westpac Group Credit Risk Committee (CREDCO) • reviews and discusses the Credit Risk Management Framework, Credit Risk Management Strategy, Credit Risk Appetite Statement, and key supporting policies and limits; • reviews and discusses business activity with material credit risk-related impacts; • monitors Westpac’s credit risk profile against the Board Risk Appetite Statement measures and thresholds • monitors Westpac’s credit risks that are outside of risk appetite or approaching tolerance limits and monitors remediation plans and actions; • reviews reporting from the Climate Change Credit Risk Committee on the potential impact on credit exposures from climate-related transition and physical risks; and • reviews and notes emerging risks, regulatory issues, and implications of changes in the regulatory and external environment on Westpac's credit risk exposures. Westpac Group Market Risk Committee (MARCO) • reviews and discusses the Market Risk Management Framework and key market risk management policies; • reviews and provides input on policies and limits for managing traded and non-traded market risk; and • monitors Westpac’s market risk profile, appetite and exposures. Westpac Group Operational Risk, Compliance and Resilience Committee (ORCR) • reviews and discusses the Operational Risk Management Framework, the Cyber Risk Management Framework and the Compliance and Conduct Risk Management Framework, and key supporting policies; • monitors Westpac’s operational risk, cyber risk, and compliance and conduct risk profiles; • analyses emerging operational, cyber, compliance and conduct risks; and • reviews the Group-wide operational risk scenarios for exposure to high-severity loss events. Westpac Group Remuneration Oversight Committee (ROC) • supports the BRemC and the Board in fulfilling their responsibility to oversee the design, operation and monitoring of the remuneration framework. Model Risk Committee • oversees the operational effectiveness of the Group Model Risk Policy and key supporting artefacts; • monitors the model risk profile and material model risk exposures, taking into account the regulatory and external environment; • oversees approvals for significant changes to Westpac’s material models; and • oversees material model risk matters raised by associated committees. Stress Testing Committee • reviews and provides input on the Westpac Group Stress Testing Policy, stress testing results and mitigating actions; • reviews and monitors the effectiveness of Westpac’s Group stress-testing framework; and • oversees the generation and selection of Group stress testing scenarios, with reference to emerging risks. Westpac Group Financial Crime Risk Committee • reviews and discusses the Financial Crime measures and thresholds in the Board RAS; • reviews and discusses Westpac's Financial Crime Risk Management Framework and Financial Crime Policy framework; • monitors Westpac’s aggregate Financial Crime risk exposures, regulatory matters and measures; and • analyses emerging financial crime risks developments and implications of changes in the regulatory and external environment. |
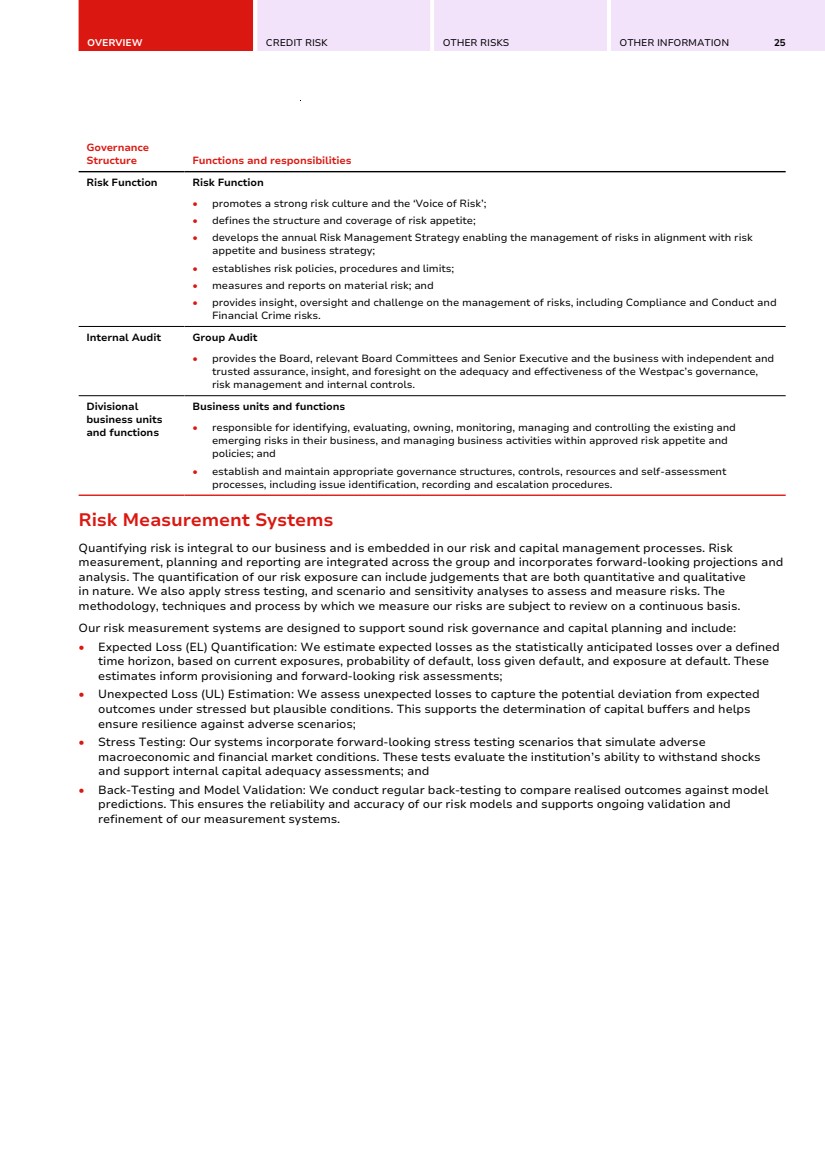
| OVERVIEW CREDIT RISK OTHER RISKS OTHER INFORMATION 25 Governance Structure Functions and responsibilities Risk Function Risk Function • promotes a strong risk culture and the ‘Voice of Risk’; • defines the structure and coverage of risk appetite; • develops the annual Risk Management Strategy enabling the management of risks in alignment with risk appetite and business strategy; • establishes risk policies, procedures and limits; • measures and reports on material risk; and • provides insight, oversight and challenge on the management of risks, including Compliance and Conduct and Financial Crime risks. Internal Audit Group Audit • provides the Board, relevant Board Committees and Senior Executive and the business with independent and trusted assurance, insight, and foresight on the adequacy and effectiveness of the Westpac’s governance, risk management and internal controls. Divisional business units and functions Business units and functions • responsible for identifying, evaluating, owning, monitoring, managing and controlling the existing and emerging risks in their business, and managing business activities within approved risk appetite and policies; and • establish and maintain appropriate governance structures, controls, resources and self-assessment processes, including issue identification, recording and escalation procedures. Risk Measurement Systems Quantifying risk is integral to our business and is embedded in our risk and capital management processes. Risk measurement, planning and reporting are integrated across the group and incorporates forward-looking projections and analysis. The quantification of our risk exposure can include judgements that are both quantitative and qualitative in nature. We also apply stress testing, and scenario and sensitivity analyses to assess and measure risks. The methodology, techniques and process by which we measure our risks are subject to review on a continuous basis. Our risk measurement systems are designed to support sound risk governance and capital planning and include: • Expected Loss (EL) Quantification: We estimate expected losses as the statistically anticipated losses over a defined time horizon, based on current exposures, probability of default, loss given default, and exposure at default. These estimates inform provisioning and forward-looking risk assessments; • Unexpected Loss (UL) Estimation: We assess unexpected losses to capture the potential deviation from expected outcomes under stressed but plausible conditions. This supports the determination of capital buffers and helps ensure resilience against adverse scenarios; • Stress Testing: Our systems incorporate forward-looking stress testing scenarios that simulate adverse macroeconomic and financial market conditions. These tests evaluate the institution’s ability to withstand shocks and support internal capital adequacy assessments; and • Back-Testing and Model Validation: We conduct regular back-testing to compare realised outcomes against model predictions. This ensures the reliability and accuracy of our risk models and supports ongoing validation and refinement of our measurement systems. |
| 26 WESTPAC GROUP SEPTEMBER 2025 PILLAR 3 REPORT RISK MANAGEMENT APPROACH Risk Reporting to the Board and Senior Management We have in place risk monitoring and reporting processes on a Groupwide and business segment level to support senior management and the Board to effectively assess, manage and oversee risks. The ongoing monitoring of our risk profile seeks to: • Ensure that our businesses operate within the approved risk appetite; • Assess business activity and growth potential relative to our risk profile; • Assess the impact of stress and unanticipated events; and • Identify matters requiring actions. The Board Risk Committee and the Board meet regularly to consider the information provided by senior management, which includes, among others matters, emerging risks, industry trends, our current risk profiles, and/or other notable items. Senior management are provided with monthly analysis of our operations, and information related to our risk profile, including our credit risk profiles. In addition to our regular risk monitoring, other risk-specific presentations are provided to, and discussed with, senior management and the Board as required. We also publish external reports on risk matters to comply with regulatory requirements on a quarterly, semi-annual and annual basis. Further information on our risk reporting for each of our primary risks are also discussed within this report in the sections for these respective risks. Stress Testing We conduct regular stress testing throughout the year to: • Identify and manage key economic risks that we are exposed to; • Assess the potential impact on our financial position and performance from extreme hypothetical economic shocks; and • Assess the adequacy of our liquidity and capital position to withstand extreme shock events. Further information on our stress testing for our primary risks is also discussed in their respective sections. Risk Mitigation We mitigate our primary risks using various approaches. Further details are provided for each of the primary risks in their respective section. |
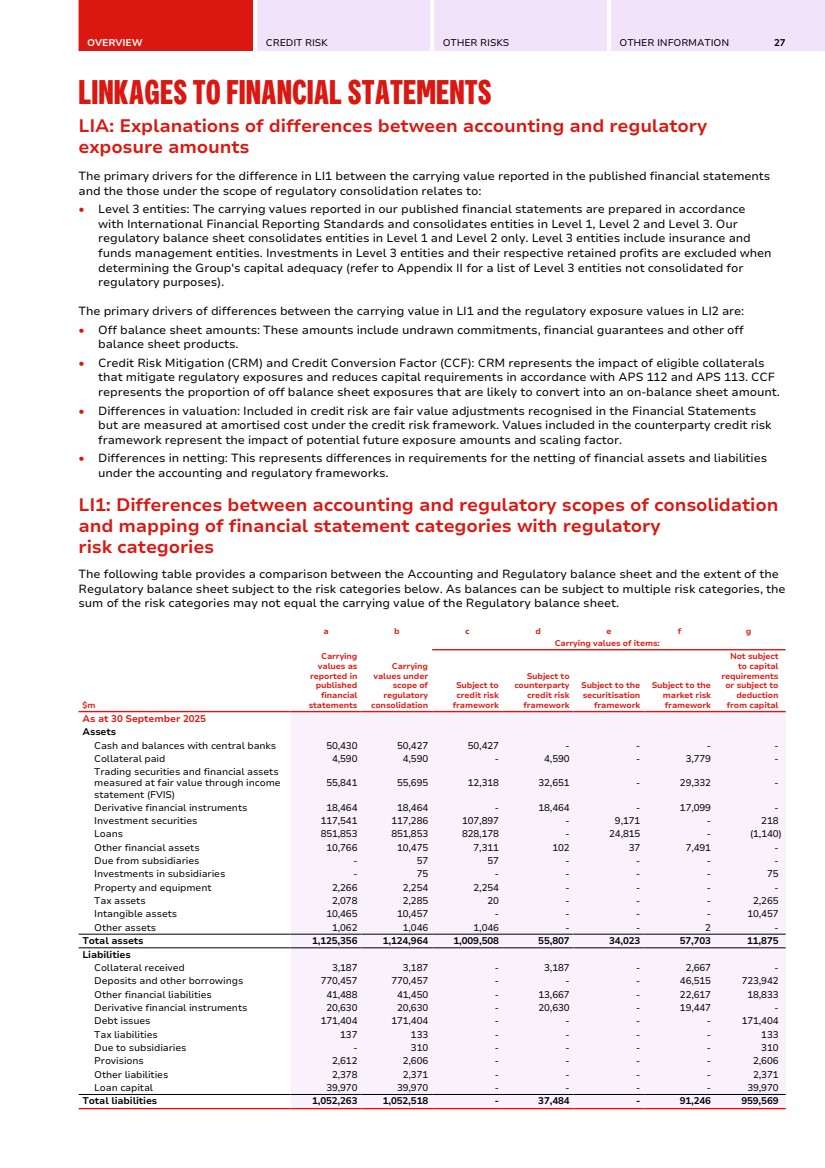
| OVERVIEW CREDIT RISK OTHER RISKS OTHER INFORMATION 27 LINKAGES TO FINANCIAL STATEMENTS LIA: Explanations of differences between accounting and regulatory exposure amounts Linkages to Financial Statements LIA: Explanations of differences between accounting and regulatory exposure amounts The primary drivers for the difference in LI1 between the carrying value reported in the published financial statements and the those under the scope of regulatory consolidation relates to: • Level 3 entities: The carrying values reported in our published financial statements are prepared in accordance with International Financial Reporting Standards and consolidates entities in Level 1, Level 2 and Level 3. Our regulatory balance sheet consolidates entities in Level 1 and Level 2 only. Level 3 entities include insurance and funds management entities. Investments in Level 3 entities and their respective retained profits are excluded when determining the Group's capital adequacy (refer to Appendix II for a list of Level 3 entities not consolidated for regulatory purposes). The primary drivers of differences between the carrying value in LI1 and the regulatory exposure values in LI2 are: • Off balance sheet amounts: These amounts include undrawn commitments, financial guarantees and other off balance sheet products. • Credit Risk Mitigation (CRM) and Credit Conversion Factor (CCF): CRM represents the impact of eligible collaterals that mitigate regulatory exposures and reduces capital requirements in accordance with APS 112 and APS 113. CCF represents the proportion of off balance sheet exposures that are likely to convert into an on-balance sheet amount. • Differences in valuation: Included in credit risk are fair value adjustments recognised in the Financial Statements but are measured at amortised cost under the credit risk framework. Values included in the counterparty credit risk framework represent the impact of potential future exposure amounts and scaling factor. • Differences in netting: This represents differences in requirements for the netting of financial assets and liabilities under the accounting and regulatory frameworks. LI1: Differences between accounting and regulatory scopes of consolidation and mapping of financial statement categories with regulatory risk categories LI1: Differences between accounting and regulatory scopes of consolidation and mapping of financial statement categories with regulatory risk categories The following table provides a comparison between the Accounting and Regulatory balance sheet and the extent of the Regulatory balance sheet subject to the risk categories below. As balances can be subject to multiple risk categories, the sum of the risk categories may not equal the carrying value of the Regulatory balance sheet. $m a b c d e f g Carrying values as reported in published financial statements Carrying values under scope of regulatory consolidation Carrying values of items: Subject to credit risk framework Subject to counterparty credit risk framework Subject to the securitisation framework Subject to the market risk framework Not subject to capital requirements or subject to deduction from capital As at 30 September 2025 Assets Cash and balances with central banks 50,430 50,427 50,427 - - - - Collateral paid 4,590 4,590 - 4,590 - 3,779 - Trading securities and financial assets measured at fair value through income statement (FVIS) 55,841 55,695 12,318 32,651 - 29,332 - Derivative financial instruments 18,464 18,464 - 18,464 - 17,099 - Investment securities 117,541 117,286 107,897 - 9,171 - 218 Loans 851,853 851,853 828,178 - 24,815 - (1,140) Other financial assets 10,766 10,475 7,311 102 37 7,491 - Due from subsidiaries - 57 57 - - - - Investments in subsidiaries - 75 - - - - 75 Property and equipment 2,266 2,254 2,254 - - - - Tax assets 2,078 2,285 20 - - - 2,265 Intangible assets 10,465 10,457 - - - - 10,457 Other assets 1,062 1,046 1,046 - - 2 - Total assets 1,125,356 1,124,964 1,009,508 55,807 34,023 57,703 11,875 Liabilities Collateral received 3,187 3,187 - 3,187 - 2,667 - Deposits and other borrowings 770,457 770,457 - - - 46,515 723,942 Other financial liabilities 41,488 41,450 - 13,667 - 22,617 18,833 Derivative financial instruments 20,630 20,630 - 20,630 - 19,447 - Debt issues 171,404 171,404 - - - - 171,404 Tax liabilities 137 133 - - - - 133 Due to subsidiaries - 310 - - - - 310 Provisions 2,612 2,606 - - - - 2,606 Other liabilities 2,378 2,371 - - - - 2,371 Loan capital 39,970 39,970 - - - - 39,970 Total liabilities 1,052,263 1,052,518 - 37,484 - 91,246 959,569 |
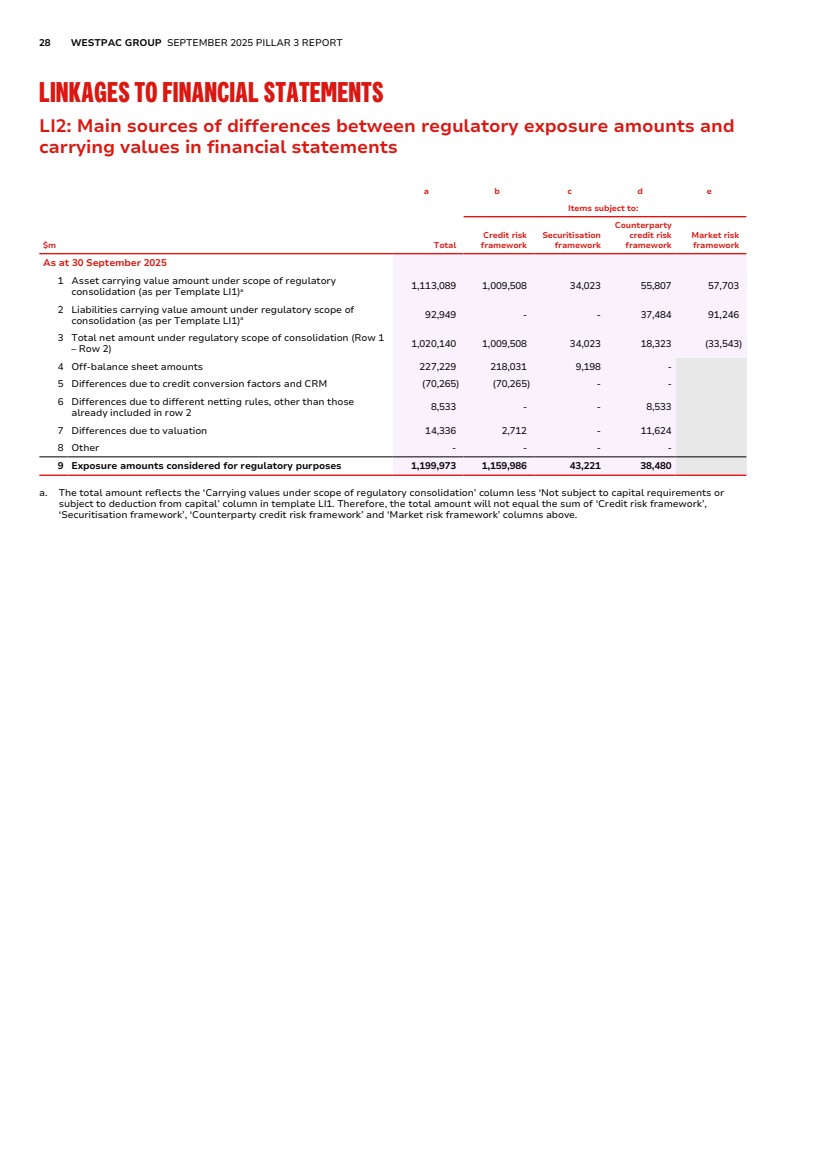
| 28 WESTPAC GROUP SEPTEMBER 2025 PILLAR 3 REPORT LINKAGES TO FINANCIAL STATEMENTS LI2: Main sources of differences between regulatory exposure amounts and carrying values in financial statements LI2: Main sources of differences between regulatory exposure amounts and carrying values in financial statements $m a b c d e Total Items subject to: Credit risk framework Securitisation framework Counterparty credit risk framework Market risk framework As at 30 September 2025 1 Asset carrying value amount under scope of regulatory consolidation (as per Template LI1)a 1,113,089 1,009,508 34,023 55,807 57,703 2 Liabilities carrying value amount under regulatory scope of consolidation (as per Template LI1)a 92,949 - - 37,484 91,246 3 Total net amount under regulatory scope of consolidation (Row 1 – Row 2) 1,020,140 1,009,508 34,023 18,323 (33,543) 4 Off-balance sheet amounts 227,229 218,031 9,198 - 5 Differences due to credit conversion factors and CRM (70,265) (70,265) - - 6 Differences due to different netting rules, other than those already included in row 2 8,533 - - 8,533 7 Differences due to valuation 14,336 2,712 - 11,624 8 Other - - - - 9 Exposure amounts considered for regulatory purposes 1,199,973 1,159,986 43,221 38,480 a. The total amount reflects the ‘Carrying values under scope of regulatory consolidation’ column less ‘Not subject to capital requirements or subject to deduction from capital’ column in template LI1. Therefore, the total amount will not equal the sum of ‘Credit risk framework’, ‘Securitisation framework’, ‘Counterparty credit risk framework’ and ‘Market risk framework’ columns above. |
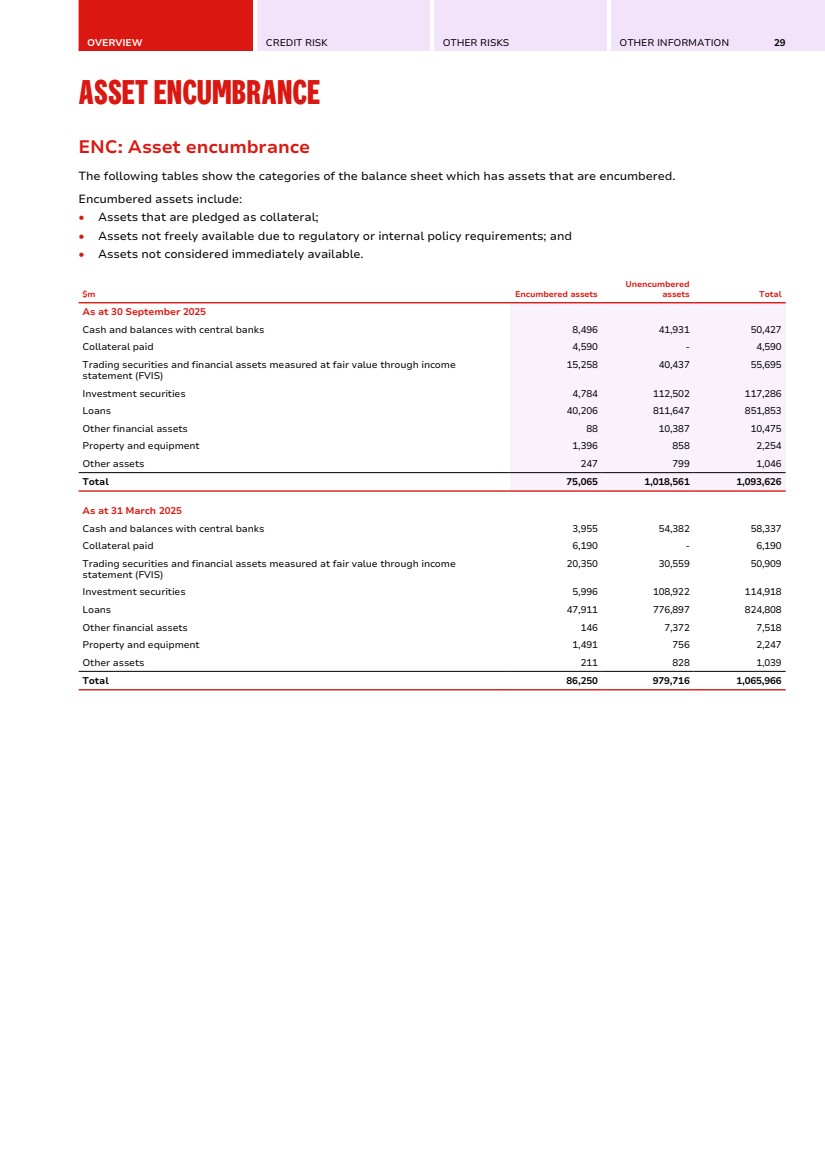
| OVERVIEW CREDIT RISK OTHER RISKS OTHER INFORMATION 29 ASSET ENCUMBRANCE ENC: Asset encumbrance Asset Encumbrance ENC: Asset encumbrance The following tables show the categories of the balance sheet which has assets that are encumbered. Encumbered assets include: • Assets that are pledged as collateral; • Assets not freely available due to regulatory or internal policy requirements; and • Assets not considered immediately available. $m Encumbered assets Unencumbered assets Total As at 30 September 2025 Cash and balances with central banks 8,496 41,931 50,427 Collateral paid 4,590 - 4,590 Trading securities and financial assets measured at fair value through income statement (FVIS) 15,258 40,437 55,695 Investment securities 4,784 112,502 117,286 Loans 40,206 811,647 851,853 Other financial assets 88 10,387 10,475 Property and equipment 1,396 858 2,254 Other assets 247 799 1,046 Total 75,065 1,018,561 1,093,626 As at 31 March 2025 Cash and balances with central banks 3,955 54,382 58,337 Collateral paid 6,190 - 6,190 Trading securities and financial assets measured at fair value through income statement (FVIS) 20,350 30,559 50,909 Investment securities 5,996 108,922 114,918 Loans 47,911 776,897 824,808 Other financial assets 146 7,372 7,518 Property and equipment 1,491 756 2,247 Other assets 211 828 1,039 Total 86,250 979,716 1,065,966 |
| 30 WESTPAC GROUP SEPTEMBER 2025 PILLAR 3 REPORT CREDIT RISK CREDIT RISK MANAGEMENT CRA: General qualitative information about credit risk CRB: Additional disclosure related to the credit quality of assets CR1: Credit quality of assets CR2: Changes in stock of non-performing loans, debt securities and off balance sheet exposures CRB(e): Exposures by geographical areas, industry and residual maturity CRB(f): Non-performing exposures by geographical areas and industry CRB(g): Ageing Analysis of credit exposures CRB(h): Restructured exposures CRC: Qualitative disclosure related to credit risk mitigation techniques CR3: Credit Risk Mitigation Techniques CR7: IRB - Effect on RWA of credit derivatives used as CRM techniques CRD: Qualitative disclosure on banks’ use of external credit ratings under the standardised approach for credit risk CR4: Standardised approach – credit risk exposure and credit risk mitigation effects CR5: Standardised approach - Exposures by asset classes and risk weights CRE: Qualitative disclosures related to IRB models CR6: IRB - Credit risk exposures by portfolio and PD ranges CR8: RWA flow statements of credit risk exposures under IRB CR9: IRB - Backtesting of probability of default (PD) per portfolio CR10: IRB - Specialised lending under the slotting approach COUNTERPARTY CREDIT RISK CCRA: Qualitative disclosure related to CCR CCR1: Analysis of CCR exposures by approach CCR4: IRB - CCR exposures by portfolio and PD scale CCR5: Composition of collateral for CCR exposures CCR6: Credit derivatives exposures CCR8: Exposure to central counterparties CREDIT VALUATION ADJUSTMENT RISK CVAA: General qualitative disclosure requirements related to CVA SECURITISATION SECA: Qualitative disclosure requirements related to securitisation exposures SEC1: Securitisation exposures in the banking book SEC2: Securitisation exposures in the trading book SEC3: Securitisation exposures in the banking book and associated regulatory capital requirements – bank acting as originator or as sponsor SEC4: Securitisation exposures in the banking book and associated capital requirements – bank acting as investor |

| OVERVIEW CREDIT RISK OTHER RISKS OTHER INFORMATION 31 CREDIT RISK MANAGEMENT CRA: General qualitative information about credit risk Credit Risk Management CRA: General qualitative information about credit risk Credit risk is the risk of financial loss where a customer or counterparty fails to meet their financial obligations to Westpac. Credit Risk Management Framework and policies The Westpac Board through its Board Risk Committee reviews and approves the credit risk management framework and material supporting policies that clearly define roles and responsibilities, acceptable practices, limits and key controls. The Credit Risk Management Framework describes the principles, methodologies, systems, roles and responsibilities, reports and controls that exist for managing credit risk in Westpac. The Credit Risk Rating System policy describes the credit risk rating system philosophy, design, key features, roles and responsibilities and uses of rating outcomes. Concentration risk policies cover individual counterparties, industries (e.g. property) and individual countries. In addition, we have policies covering risk appetite statements, environmental, social and governance credit risk, the delegation of credit approval authorities, and all other credit policies that span the end-to-end credit lifecycle. Credit policies and standards embed the Group’s framework requirements throughout Westpac's operating segments. Policies and standards cover the origination, evaluation, approval, documentation, settlement and on-going management of counterparty credit risks, and sector policies guide the extension of credit where industry-specific guidelines are considered necessary. Credit approval limits represent the formal delegation of credit approval authority to responsible individuals throughout the organisation. Structure and organisation Westpac Credit Risk Committee (CREDCO) oversees Westpac’s credit risk profile against the Board Risk appetite statement and thresholds. CREDCO reviews and monitors Westpac’s credit risk that is outside of risk appetite or approaching tolerance limits and monitors remediation plans and actions. The Chief Risk Officer is responsible for the effectiveness of overall risk management throughout Westpac, including credit risk. The Group Chief Credit Officer is responsible for the effectiveness of credit risk management, including credit approval decisioning beyond business authority level and appointing our most senior authorised credit officers. Authorised credit officers have delegated authority to approve credit risk exposures, including customer risk grades, other credit parameters and their ongoing review. Our largest exposures are approved by our most experienced authorised credit officers. Management is responsible for managing credit risks originated in their business and for managing risk adjusted returns from their business credit portfolios, within the approved risk appetite, risk management framework and policies. Approach Westpac adopts two approaches to managing credit risk depending upon the nature of the customer and the product. Transaction-managed approach For larger customers, Westpac evaluates credit requests by undertaking detailed individual customer and transaction risk analysis (the ‘transaction-managed’ approach). Such customers are assigned a customer risk grade (CRG) representing Westpac’s estimate of their probability of default (PD). Each facility is assigned a loss given default (LGD). The Westpac credit risk rating system has 20 risk grades for non-defaulted customers and 8 risk grades for defaulted customers. Non-defaulted CRGs down to the level of normally acceptable risk (i.e. D grade – see table below) are mapped to Moody’s external senior unsecured ratings. This mapping allows Westpac to integrate the rating agency's default history with internal historical data when calculating PDs. The final assignment of CRGs and LGDs is approved by authorised credit officers with appropriate delegated approval authority. All material credit exposures are also approved by authorised credit officers who are part of the risk management stream and operate independently of the areas originating the credit risk proposals. Authorised credit officer decisions are subject to hindsighting reviews to ensure consistent quality and confirm compliance with approval authority. Separate teams are responsible for maintaining accurate and timely recording of all credit risk approvals and changes to customer and facility data. These teams also operate independently of both the areas originating the credit risk proposals and the credit risk approvers. Appropriate segregation of functions is one of the key requirements of our Credit Risk Management Framework. |
| 32 WESTPAC GROUP SEPTEMBER 2025 PILLAR 3 REPORT CREDIT RISK MANAGEMENT CRA: General qualitative information about credit risk (Continued) Alignment of Westpac risk grades The table below shows the current alignment between Westpac’s internal CRGs and the corresponding external rating. Note that only high-level CRG groupings are shown. Westpac customer risk grade Moody’s Rating S&P Rating A Aaa - Aa3 AAA - AA– B A1 - A3 A+ - A– C Baa1 - Baa3 BBB+ - BBB– D Ba1 - B1 BB+ - B+ Westpac Rating E Watchlist F Special mention G Substandard/default H Doubtful/default For Specialised Lending, Westpac aligns exposures to the appropriate supervisory slot based on an assessment that takes into account borrower strength and security quality, as required by APS 113 Capital Adequacy: Internal Ratings-based Approach to Credit Risk (APS 113). Program-managed approach High-volume retail customer credit portfolios with homogenous credit risk characteristics are managed on a statistical basis according to pre-determined objective criteria (the ‘program-managed’ approach). Program-managed exposures include all consumer and some small business customers. Quantitative scorecards are used to assign application and behavioural scores to enable risk-based decision making within these portfolios. For capital estimation and other purposes, risk-based customer segments are created based upon modelled PD, LGD and, where applicable, exposure at default (EAD)1 . Accounts are then assigned to respective segments based on customer and account characteristics. Each segment is assigned a quantified measure of its PD, LGD and EAD. For both transaction-managed and program-managed approaches, PD and LGD assignment is regularly monitored and validated against subsequent customer performance and models and credit processes are recalibrated when required. CRGs, Security Quality Indicators (SQIs) and LGDs are reviewed at least annually. Alignment of Basel categories to Westpac portfolios APRA’s capital framework includes prudential standards for credit risk capital (APS 113 Capital Adequacy: Internal Ratings-based Approach to Credit Risk). In line with the standard, an ADI must categorise banking book exposures into four broad IRB APS 113 asset classes (Corporate, Sovereign, Financial Institutions and Retail) and apply the prescribed treatment for those classes to each credit exposure within them for the purposes of deriving its regulatory capital requirement. APS 113 cascades these asset classes into further sub-asset classes as per below. 1. Under APS 113 the credit conversion factors used to calculate EAD are prescribed for all portfolios other than revolving retail. |
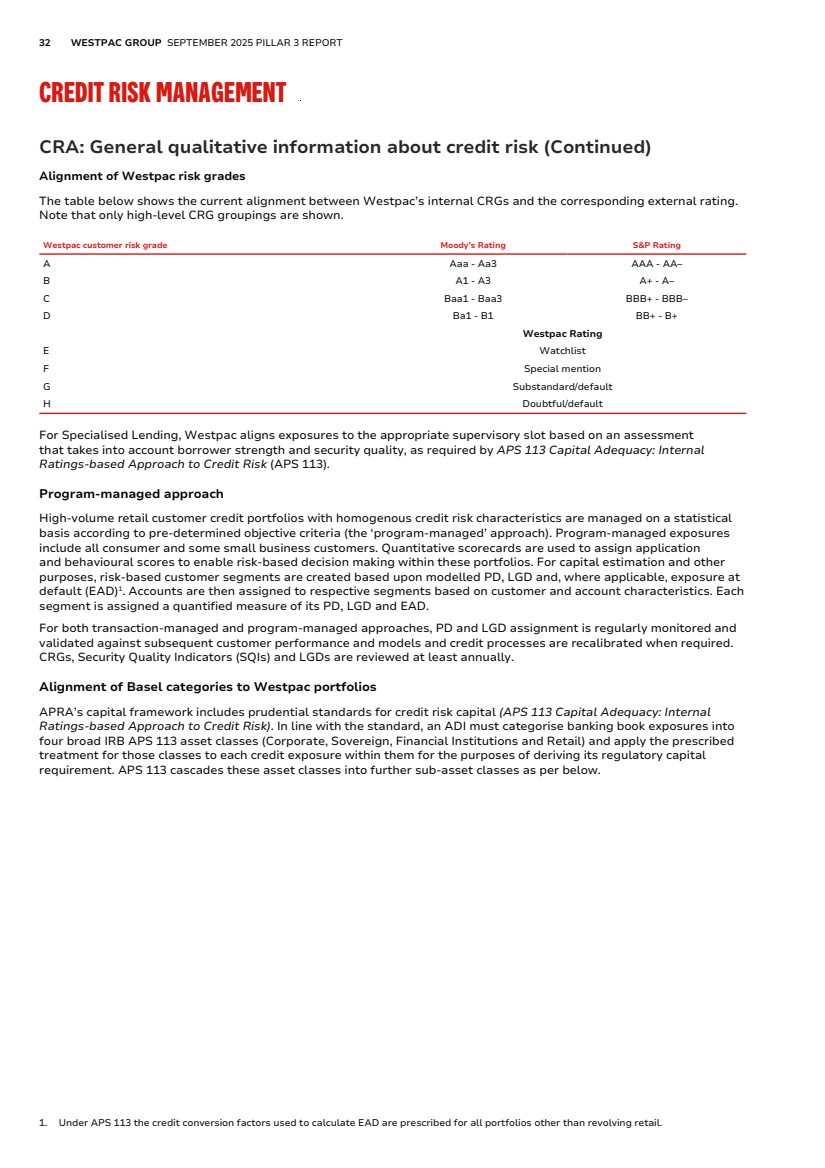
| OVERVIEW CREDIT RISK OTHER RISKS OTHER INFORMATION 33 CRA: General qualitative information about credit risk (Continued) The below table sets out Westpac's disclosed credit risk asset sub-classes. Credit Asset Subclasses Asset Subclass Definition Corporatea Corporate asset class includes all credit exposures to corporate counterparties and public sector entities, including Income Producing Real Estate (IPRE) with total consolidated annual revenue less than $750 million. Large Corporate Large Corporate asset class covers exposures to corporate counterparties with consolidated annual revenue greater than $750 million. Credit RWA is measured under FIRB. Sovereign Sovereign asset class covers exposures to central and sub-national governments, central banks, and development banks or institutions eligible for zero risk weights. Credit RWA is measured under FIRB. Financial Institutions Financial Institutions asset class covers exposures to financial institution counterparties. Financial institutions include, but are not limited to, banks, securities firms, insurance companies and leveraged funds. Credit RWA is measured under FIRB. Residential Mortgages Residential Mortgages asset class covers exposures, to individuals and not for business purposes, fully or partially secured by residential property. Non-standard mortgages receive 100% standardised risk weight (rather than the internally-modelled Retail IRB approach). Qualifying Revolving Retail Australian Credit Cards, otherwise known as Qualifying Revolving Retail, covers exposure to individuals and not for business purposes which are revolving, unsecured and unconditionally cancellable. Other Retail Other Retail asset class covers retail exposures which do not meet the criteria of any other retail asset class. SME Retail SME Retail asset class covers exposures where the total exposures are <$1.5m, the customer does not hold a complex product and consolidated annual revenues are <$75m. Exposures are managed as part of a portfolio. Specialised Lending Specialised Lending asset class covers exposures subject to the supervisory slotting approach and includes Project, Object and Commodities Finance. Project Finance is defined as exposures where revenues generated by a single project, are both the primary source of repayment and security for the loan. Object Finance is defined as lending for the acquisition of equipment where the repayment of the loan is dependent on the cash flows generated by the specific assets that have been financed and pledged or assigned to the lender. RBNZ Regulated Entities RBNZ regulated exposures are calculated using RBNZ rules and disclosed separately under a New Zealand class. a. To facilitate standardisation of industry presentation, the sub asset classes of SME Corporate and Property Finance have been aggregated to Corporate. |
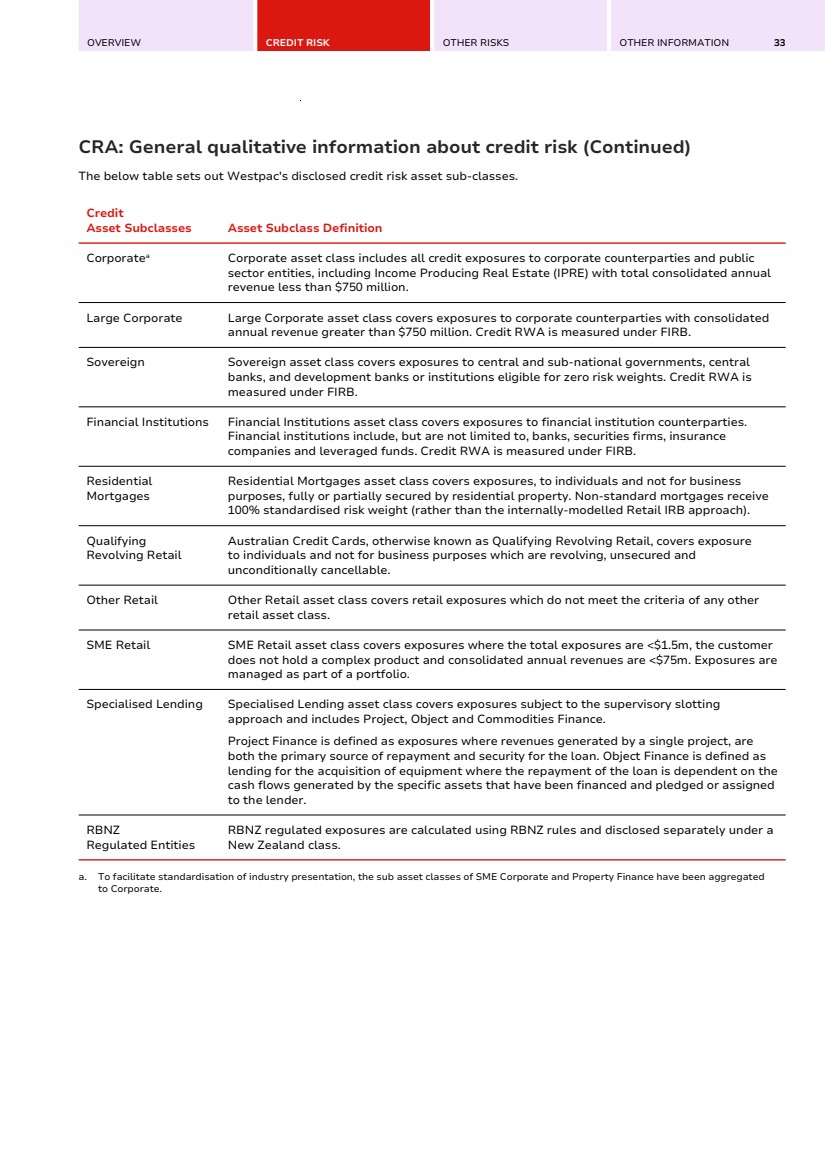
| 34 WESTPAC GROUP SEPTEMBER 2025 PILLAR 3 REPORT CREDIT RISK MANAGEMENT CRA: General qualitative information about credit risk (Continued) Alignment of Credit risk approach to Basel categories and exposure types Approach APS asset class Types of exposures Transaction-Managed Portfolios Corporate Sovereign Financial Institutions Direct lending Contingent lending Derivative counterparty Asset warehousing Underwriting Secondary market trading Foreign exchange settlement Other intra-day settlement obligations Program-Managed Portfolios Residential Mortgages Qualifying revolving retail Other retail Small-and medium-sized enterprise retail Mortgages Equity access loans Australian credit cards Personal loans Overdrafts Business development loans Business overdrafts Other term products CRB: Additional disclosure related to the credit quality of assets CRB: Additional disclosure related to the credit quality of assets Non-performing exposures Non-performing exposures are those captured by the regulatory definition of default, contained in APS 220 Credit Risk Management and the RBNZ's Banking Prudential Requirements for New Zealand regulated exposures. Default occurs when either one, or both, of the following has happened: • Westpac considers that the borrower is unlikely to pay its credit obligations to Westpac in full, without recourse to actions such as realising available security; • the borrower is 90 days or more past-due on a credit obligation to Westpac. Westpac applies the impairment requirements contained in AASB 9 Financial Instruments. Where a credit exposure is captured by those impairment requirements, Westpac’s definition of ‘credit impaired’ is aligned to the regulatory definition of default. Provisions for expected credit losses Expected credit losses (ECL) are estimates of the cashflow shortfalls expected to result from defaulted exposures over the relevant timeframe. ECL is determined by evaluating a range of possible outcomes and taking into account the time value of money, past events, current conditions and forecasts of future economic conditions. Westpac calculates provisions for ECL based on a three-stage approach: • Stage 1: 12 months ECL (performing) - For financial assets where there has been no significant increase in credit risk since origination, a provision for 12-month ECL is recognised. • Stage 2: Lifetime ECL (performing) - For financial assets where there has been a significant increase in credit risk since origination and where the asset is still performing, a provision for lifetime ECL is recognised. Determining when a financial asset has experienced a significant increase in credit risk since origination is a critical accounting judgement. The determination of a significant increase in risk is driven by the change in the probability of default (PD) since origination. In determining whether a change in PD represents a significant increase in risk, relative changes in PD and absolute PD thresholds are both considered based on the portfolio of the exposure. • Stage 3: Lifetime ECL (non-performing) - For financial assets that are non-performing a provision for lifetime ECL is recognised. Indicators include a breach of contract with Westpac such as a default on interest or principal payments or a borrower experiencing significant financial difficulties. |
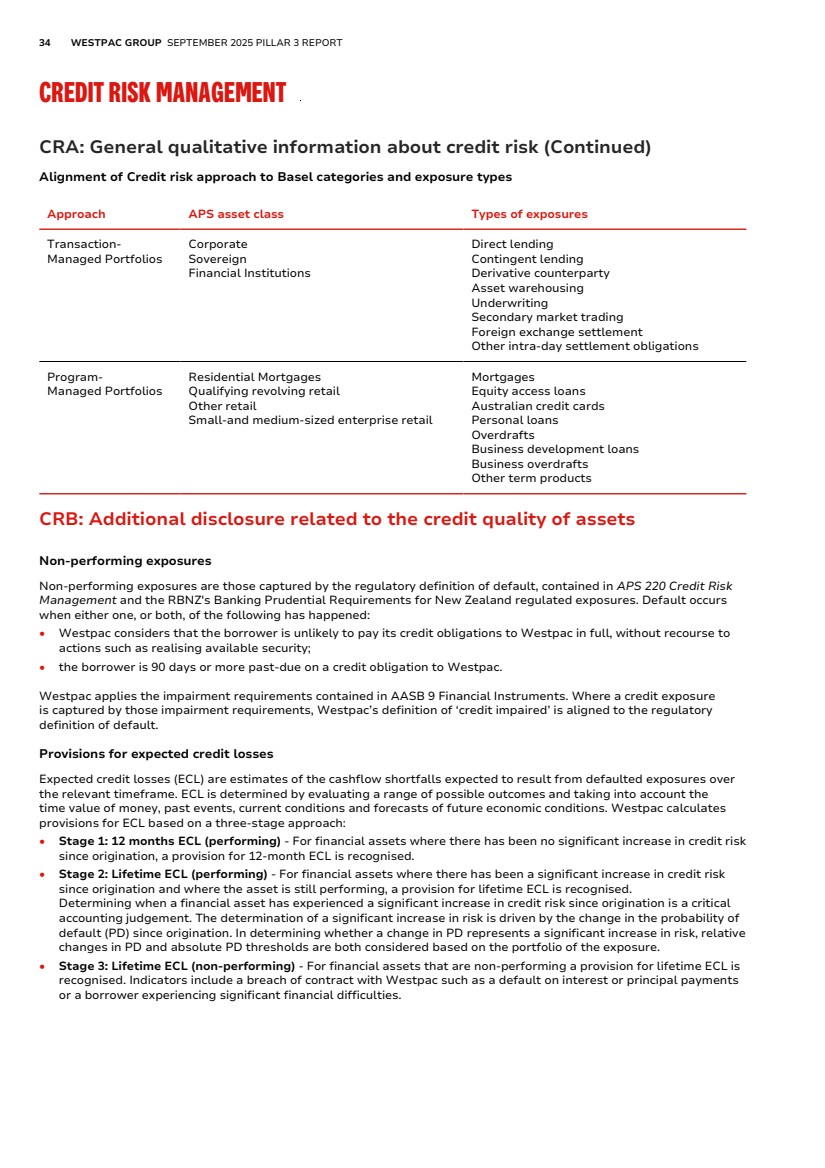
| OVERVIEW CREDIT RISK OTHER RISKS OTHER INFORMATION 35 CRB: Additional disclosure related to the credit quality of assets (Continued) Collective and individual assessment – Financial assets that are in Stages 1 and 2 are assessed on a collective basis, as are financial assets in Stage 3 below specified exposure thresholds. Those financial assets in Stage 3 above the specified exposure thresholds are assessed on an individual basis. Overlays – Where appropriate, adjustments are made to modelled outcomes to reflect reasonable and supportable information about estimated cashflow shortfalls on defaulted exposures not already incorporated in the models. Judgements can change with time as new information becomes available which could result in changes to the provision for ECL. Expected life – Lifetime ECL represents the expected credit losses that result from default events over the expected life of a financial instrument. In considering lifetime ECL, the remaining contractual life is used for non-retail portfolios. For retail portfolios lifetime ECL is calibrated to historically observed portfolio behaviour. Forward-looking information - The measurement of ECL for each stage and the assessment of significant increase in credit risk considers information about past events and current conditions as well as reasonable and supportable projections of future events and economic conditions. In order to capture the asymmetry of the losses expected over the range of plausible future events and economic conditions, Westpac considers three future macroeconomic scenarios: base, upside and downside scenarios. The macroeconomic variables used in these scenarios include (but are not limited to) employment to population ratio, real gross domestic product growth rates and residential and commercial property price indices. The ECL is a weighted average of the credit losses expected under these three scenarios. The scenario weights are based on Westpac’s assessment of upside and downside risks taking into account current trends, forward looking conditions and the degree of uncertainty attached to these projections. Regulatory classification of provisions for expected credit losses Stage 1 and Stage 2 expected credit losses are classified as provisions held against performing exposures. Stage 3 expected credit losses are classified as specific provisions. Restructured exposures The below table contains the portion of credit exposures classified as restructured per the definition contained in APS 220 Credit Risk Management. A credit exposure is considered restructured where: • counterparty is experiencing financial difficulty in meeting its financial commitments; and • Westpac has granted a concession that it would not otherwise consider, whether or not the concession is at the discretion of the bank and/or the counterparty. A concession is at the discretion of the counterparty (debtor) when the initial contract allows the counterparty (debtor) to change the terms of the contract in its own favour (embedded forbearance clauses) due to financial difficulty. • A credit exposure that is restructured is classified as non-performing, and will not be reclassified to performing until the borrower has made repayments in a timely manner under the revised contractual terms for a period of at least six months. |
| 36 WESTPAC GROUP SEPTEMBER 2025 PILLAR 3 REPORT CREDIT RISK MANAGEMENT CR1: Credit quality of assets CR1: Credit quality of assets This table provides an overview of both on and off-balance sheet exposures and their related provision disaggregated across standardised and IRB measurement approaches. $m Gross carrying values of Allowances / impairments Of which ECL accounting provisions for credit losses on SA exposures Of which ECL accounting provisions for credit losses on IRB exposures Net Values Non-performing exposures Performing exposures Allocated in regulatory category of non-performing Allocated in regulatory category of performing As at 30 September 2025 1 Loans 9,657 821,900 (4,504) (79) (57) (4,368) 827,053 2 Debt Securities - 107,897 (9) - (3) (6) 107,888 3 Off-balance sheet exposures 470 211,501 (468) - (13) (455) 211,503 4 Total 10,127 1,141,298 (4,981) (79) (73) (4,829) 1,146,444 As at 31 March 2025 1 Loans 9,999 795,611 (4,572) (107) (66) (4,399) 801,038 2 Debt Securities - 105,600 (10) - (4) (6) 105,590 3 Off-balance sheet exposures 484 209,279 (483) - (13) (470) 209,280 4 Total 10,483 1,110,490 (5,065) (107) (83) (4,875) 1,115,908 At 30 September 2025, Westpac remains appropriately provisioned with credit impairment provisions of $5.0 billion. Over the year, credit metrics improved reflecting a decrease in 90+ day mortgage delinquencies. Stressed exposures to total committed exposures were 1.28%. The ratio of collectively assessed provisions to credit RWA was 1.25%. CR2: Changes in stock of non-performing loans, debt securities and off balance sheet exposures CR2: Changes in stock of non-performing loans, debt securities and off balance sheet exposures The following table discloses the movements in non-performing exposures on loans, debt securities and off-balance sheet credit exposures. $m For the half year ended 30 September 2025 For the half year ended 31 March 2025 1 Non-performing loans and debt securities at end of the previous reporting period 10,483 10,755 2 Loans and debt securities that became non-performing since the last reporting period 4,862 4,922 3 Returned to performing status (3,130) (3,312) 4 Amounts written off (399) (364) 5 Other changesa (1,689) (1,518) 6 Non-performing loans and debt securities at end of the reporting period 10,127 10,483 a. Other changes represent collections, and the impact of foreign exchange movements. |
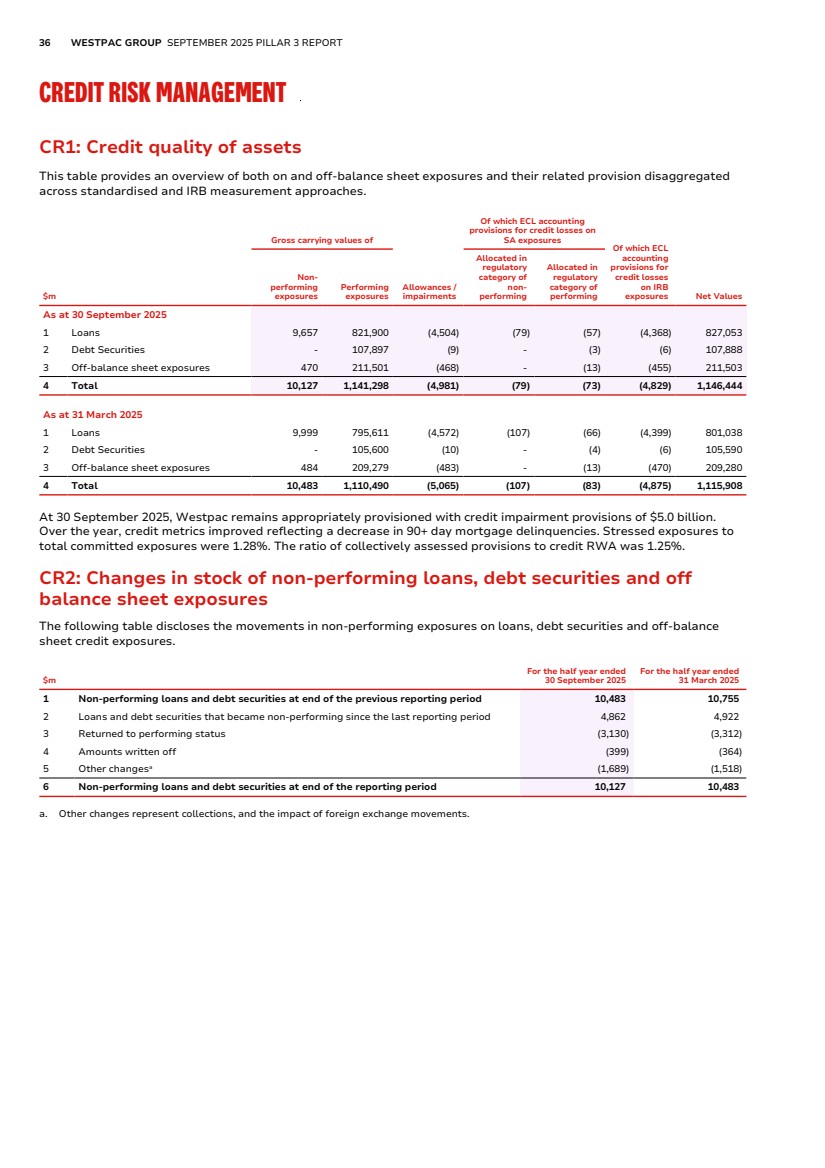
| OVERVIEW CREDIT RISK OTHER RISKS OTHER INFORMATION 37 CRB(e): Exposures by geographical areas, industry and residual maturity CRB(e): Exposures by geographical areas, industry and residual maturity The following table presents the total exposure disaggregated by geographical areas, industry and residual maturity. $m < 12 months 1 to 5 years > 5 years No Specified Maturitya Total Exposure As at 30 September 2025 Australia Accommodation, cafes and restaurants 2,656 9,265 410 229 12,560 Agriculture, forestry and fishing 4,304 11,182 527 2,344 18,357 Construction 1,617 7,428 1,698 1,023 11,766 Finance and insurance 40,350 9,235 800 3,064 53,449 Government, administration and defence 11,986 30,240 48,706 519 91,451 Manufacturing 2,603 9,264 822 2,074 14,763 Mining 809 3,508 298 731 5,346 Property 18,892 55,588 1,662 282 76,424 Property services and business services 2,688 12,791 2,283 1,817 19,579 Services 3,123 13,411 1,795 1,717 20,046 Trade 4,359 12,949 1,753 2,981 22,042 Transport and storage 1,670 11,624 1,958 561 15,813 Utilities 2,100 11,149 1,828 332 15,409 Retail lending 1,503 9,961 552,706 35,117 599,287 Other 309 987 386 9,602 11,284 Total Australia 98,969 208,582 617,632 62,393 987,576 New Zealand Accommodation, cafes and restaurants 173 133 19 9 334 Agriculture, forestry and fishing 3,401 4,618 75 189 8,283 Construction 149 486 134 113 882 Finance and insurance 6,233 5,178 314 708 12,433 Government, administration and defence 1,826 4,144 1,761 79 7,810 Manufacturing 697 1,554 36 431 2,718 Mining 63 59 5 33 160 Property 2,643 6,528 140 27 9,338 Property services and business services 296 862 37 145 1,340 Services 454 1,956 68 176 2,654 Trade 1,220 1,581 156 1,446 4,403 Transport and storage 102 686 25 87 900 Utilities 451 2,092 290 247 3,080 Retail lending 187 1,296 69,742 2,239 73,464 Other 24 34 15 6 79 Total New Zealand 17,919 31,207 72,817 5,935 127,878 Other overseas Accommodation, cafes and restaurants 21 32 30 - 83 Agriculture, forestry and fishing 1 - 1 - 2 Construction 24 36 10 - 70 Finance and insurance 10,306 4,714 1 129 15,150 Government, administration and defence 1,104 16,785 - - 17,889 Manufacturing 228 2,238 43 12 2,521 Mining 23 400 - - 423 Property 131 267 293 - 691 Property services and business services 117 1,164 200 - 1,481 Services 12 247 30 - 289 Trade 1,340 1,036 141 176 2,693 Transport and storage 44 322 852 - 1,218 Utilities 91 435 999 - 1,525 Retail lending 31 45 328 - 404 Other 36 29 28 - 93 Total other overseas 13,509 27,750 2,956 317 44,532 Total exposureb 130,397 267,539 693,405 68,645 1,159,986 a. Includes exposures related to credit cards, on demand facilities and exposures with no fixed maturity date. b. Geographic segmentation of exposures are based on the location of the office in which these items were booked. |
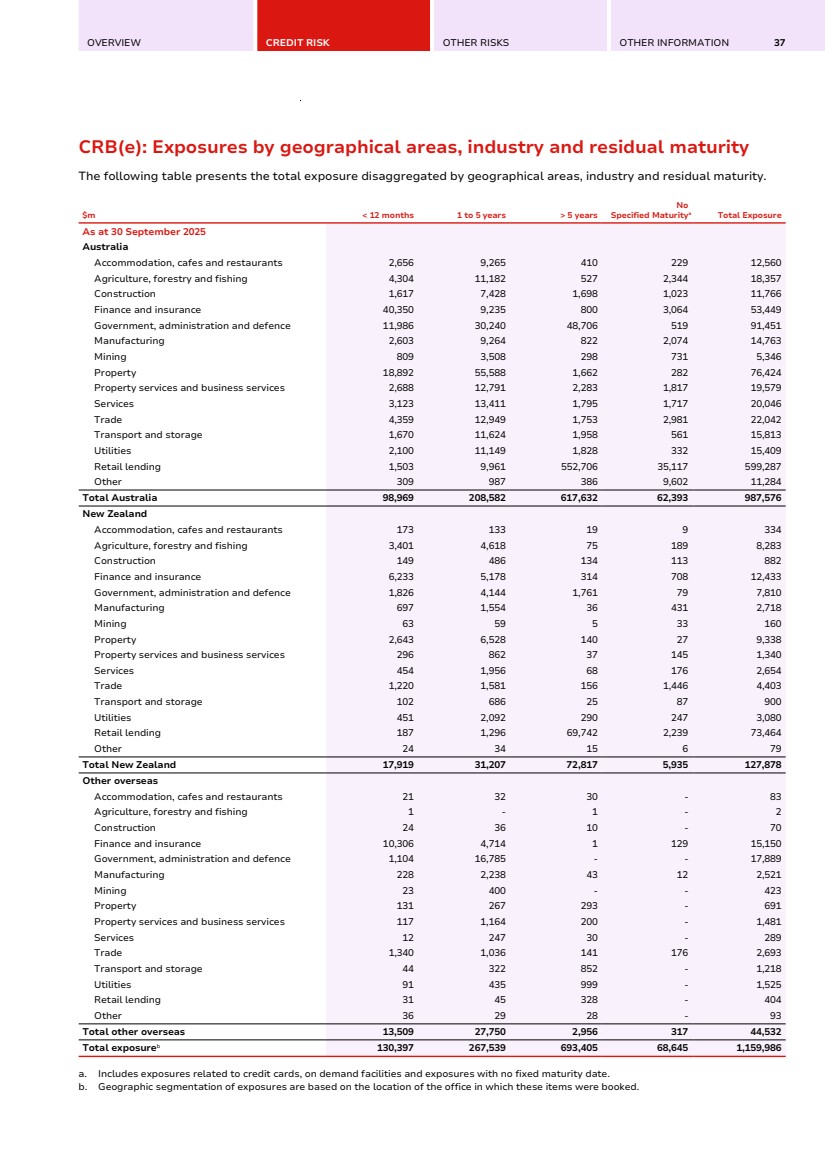
| 38 WESTPAC GROUP SEPTEMBER 2025 PILLAR 3 REPORT CREDIT RISK MANAGEMENT CRB(f): Non-performing exposures by geographical areas and industry CRB(f): Non-performing exposures by geographical areas and industry The following table presents information on non-performing exposures across geographical and industry segments. $m Non-performing exposures Provision for ECL Actual losses for the 12 Australia months endeda New Zealand Other Overseas Total Australia New Zealand Other Overseas Total As at 30 September 2025 Accommodation, cafes and restaurants 203 4 3 210 (43) - (1) (44) 8 Agriculture, forestry and fishing 378 81 - 459 (68) (15) - (83) (4) Construction 296 6 1 303 (67) (1) - (68) 24 Finance and insurance 78 - - 78 (14) - - (14) 4 Government, administration and defence - - - - - - - - - Manufacturing 274 89 2 365 (107) (24) (1) (132) 10 Mining 32 - 1 33 (9) - - (9) 1 Property 924 6 35 965 (152) - (19) (171) 4 Property services and business services 408 19 5 432 (104) (3) (2) (109) 15 Services 346 15 1 362 (147) (7) - (154) 14 Trade 551 26 5 582 (152) (7) (2) (161) 101 Transport and storage 136 1 1 138 (53) - - (53) 9 Utilities 13 1 - 14 (3) - - (3) 1 Retail lending 5,412 719 15 6,146 (609) (81) (3) (693) 324 Other 37 3 - 40 (12) - - (12) 5 Total 9,088 970 69 10,127 (1,540) (138) (28) (1,706) 516 a. Losses stemming from lower risk IPRE lending (defined as exposures up to the lower of 50 per cent of the market value or 60 per cent of the lending value) and overall losses from IPRE lending are less than 0.3% and 0.5% of the outstanding IPRE exposures respectively, in each of the past three years to 30 September 2025. CRB(g): Ageing Analysis of credit exposures CRB(g): Ageing Analysis of credit exposures The following table provides an ageing analysis of past due exposures. $m As at 30 September 2025 30 to 89 days > 90 days Total >= 30 days past due Loans 4,286 5,325 9,611 Off-balance sheet exposures 101 42 143 Total 4,387 5,367 9,754 CRB(h): Restructured exposures CRB(h): Restructured exposures This following table presents Westpac's restructured exposures. $m As at 30 September 2025 Non-performing Loans 544 Off-balance sheet exposures 19 Total 563 |
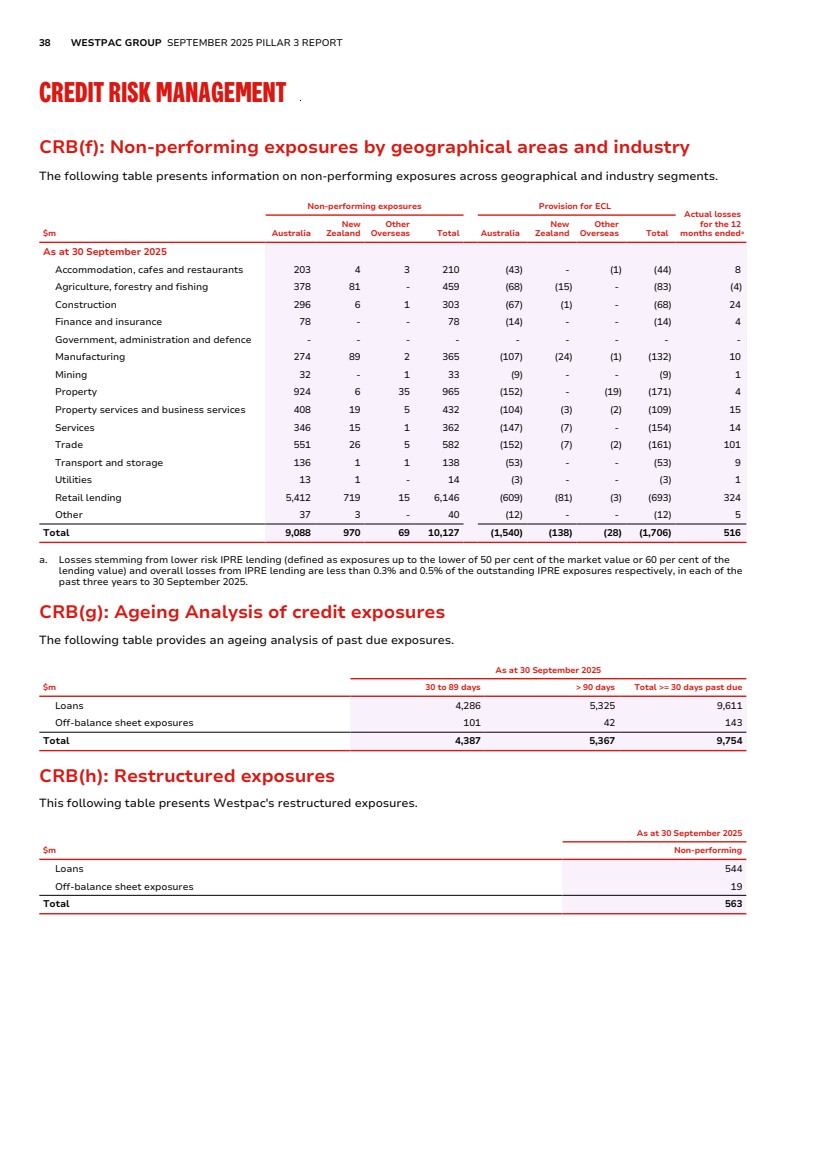
| OVERVIEW CREDIT RISK OTHER RISKS OTHER INFORMATION 39 CRC: Qualitative disclosure related to credit risk mitigation techniques CRC: Qualitative disclosure related to credit risk mitigation techniques This section describes the way in which Westpac reduces its credit risk by using financial collateral, guarantees or credit derivatives for the Corporate, Sovereign and Financial Institution asset classes. Approach Westpac recognises credit risk mitigation only when formal legal documentation is held that establishes Westpac’s direct, irrevocable and unconditional recourse to the collateral or to an unrelated credit risk mitigation provider. Minimum standards for recognising credit risk mitigation are set out in Westpac’s credit rules and policies. All proposals for recognising risk mitigation require approval by an authorised credit officer. Authorised credit officer approval is also required for existing risk mitigation to be discontinued or withdrawn. The amount of credit risk mitigation recognised is the face value of the mitigation instrument, adjusted by the application of discounts for any maturity and/or currency mismatch with the underlying obligation, so that a discounted amount is recognised when calculating the residual exposure after mitigation. For regulatory capital purposes: • exposures secured by eligible financial collateral, either cash or certain government or semi-government securities, or where protection is bought via credit linked notes, provided proceeds are invested in eligible financial collateral, are included at the gross value, with risk weighted assets for the portion thus secured calculated by applying a 5% LGD1 ; • exposures mitigated by eligible guarantees, standby letters of credit or similar instruments, where Westpac has direct recourse to an unrelated third party, or credit protection bought via credit default swaps where Westpac is entitled to recover either full principal or credit losses on occurrence of defined credit events, are treated under double default rules where the protection provider is rated A-/A3 or better. The Group Chief Credit Officer has the authority to approve exceptions to the A-/A3 minimum; and • exposures mitigated by guarantees, letters of credit, credit default swaps or similar instruments, which are not eligible for double default treatment are treated under the substitution approach. When Westpac uses credit risk mitigation techniques to reduce counterparty exposure, limits are applied to both gross (i.e. pre-mitigation) and net exposure. Furthermore, exposure is recorded against the provider of any credit risk mitigation and a limit framework prevents excessive concentration to such counterparties. For the years ended 30 September 2025 and 30 September 2024 we have not utilised derivative instruments to manage credit risk. Netting Risk reduction by way of current account set-offs is recognised for exposures to creditworthy customers domiciled in Australia and New Zealand only. Customers are required to enter into formal agreements giving Westpac the unfettered right to set-off gross credit and debit balances in their nominated accounts to determine Westpac’s net exposure within each of these two jurisdictions. Cross-border set-offs are not permitted. Close-out netting is undertaken for off-balance sheet financial market transactions with counterparties with whom Westpac has entered into master netting agreements which allow such netting in specified jurisdictions. Close-out netting effectively aggregates pre-settlement risk exposure at time of default, thus reducing overall exposure. Collateral valuation and management Westpac revalues financial markets and associated collateral positions on a daily basis to monitor the net risk position, and has formal processes in place so that calls for collateral top-up or exposure reduction are made promptly. An independent operational unit has responsibility for monitoring these positions. The collateralisation arrangements are documented via the Credit Support Annex of the International Swaps and Derivatives Association (ISDA) master agreement for derivatives transactions and Global Master Repurchase Agreement (GMRA) for repurchase transactions and Clearing Agreements for cleared trades. 1. Excludes collateralised derivative transactions. |
| 40 WESTPAC GROUP SEPTEMBER 2025 PILLAR 3 REPORT CREDIT RISK MANAGEMENT CR3: Credit Risk Mitigation Techniques CR3: Credit Risk Mitigation Techniques The table below shows a breakdown of Westpac's on-balance sheet exposures that are secured or unsecured. The secured exposures are then disaggregated by the type of security held. $m Exposures unsecured: carrying amount Exposures to be secureda Exposures secured by collateral Exposures secured by financial guarantees Exposures secured by credit derivatives As at 30 September 2025 1 Loans 72,485 754,568 753,101 1,467 - 2 Debt securities 106,512 1,376 1,376 - - 3 Total 178,997 755,944 754,477 1,467 - 4 Of which non-performing 316 7,665 7,665 - - As at 31 March 2025 1 Loans 66,331 734,707 733,592 1,115 - 2 Debt securities 103,120 2,470 2,470 - - 3 Total 169,451 737,177 736,062 1,115 - 4 Of which non-performing 371 7,884 7,884 - - a. Represents exposures that are secured with at least one form of credit risk mitigation. CR7: IRB - Effect on RWA of credit derivatives used as CRM techniques CR7: IRB - Effect on RWA of credit derivatives used as CRM techniques At present Westpac does not employ credit derivatives as a credit risk management technique1 . $m As at 30 September 2025 As at 31 March 2025 Pre-credit derivatives RWA Actual RWA Pre-credit derivatives RWA Actual RWA 1 Exposures under A-IRB 2 Corporatea 90,813 90,813 86,177 86,177 3 Residential Mortgages 116,433 116,433 116,954 116,954 4 Qualifying Revolving Retail 3,873 3,873 3,523 3,523 5 Other Retail 2,407 2,407 3,395 3,395 6 SME Retail 16,393 16,393 16,531 16,531 7 Specialised Lending 4,092 4,092 4,211 4,211 8 RBNZ Regulated Entities 43,791 43,791 46,104 46,104 9 Total Exposures under A-IRB 277,802 277,802 276,895 276,895 10 Exposures under F-IRB 11 Large Corporate - F-IRB 20,920 20,920 19,114 19,114 12 Sovereign - F-IRB 2,189 2,189 2,027 2,027 13 Financial Institutions - F-IRB 10,111 10,111 10,485 10,485 14 Total Exposures under F-IRB 33,220 33,220 31,626 31,626 15 Total Exposures including A-IRB exposures and F-IRB exposures 311,022 311,022 308,521 308,521 a. To facilitate standardisation of industry presentation, the sub asset classes of SME Corporate and Property Finance have been aggregated to Corporate. 1. As defined in APS 112 Attachment J. |
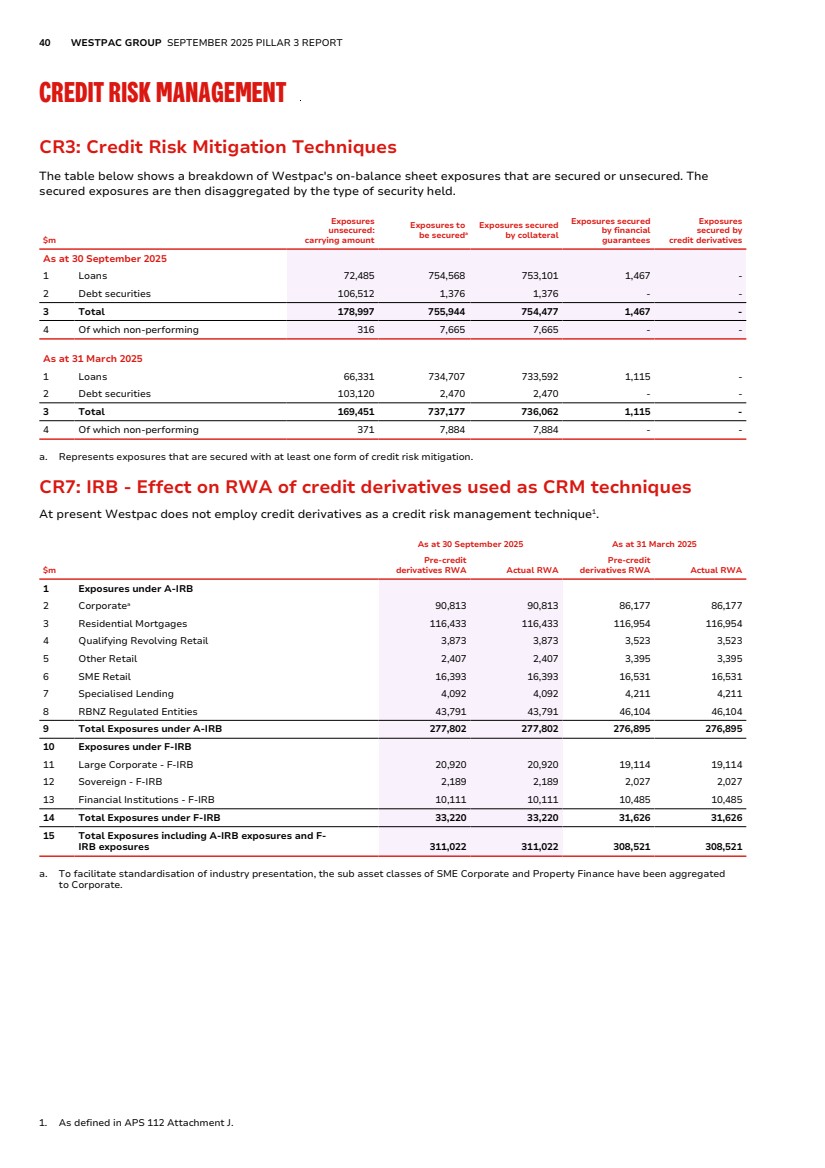
| OVERVIEW CREDIT RISK OTHER RISKS OTHER INFORMATION 41 CRD: Qualitative disclosure on banks’ use of external credit ratings under the standardised approach for credit risk CRD: Qualitative disclosure on banks’ use of external credit ratings under the standardised approach for credit risk A small portion of Westpac's transaction-managed portfolios are under the standardised approach for credit risk. For these portfolios Westpac utlises external credit ratings where available. Each external credit rating aligns to one or more internally assigned credit risk grades, as outlined in the ‘CRA: General qualitative information about credit risk’ section of this report. CR4: Standardised approach – credit risk exposure and credit risk mitigation effects CR4: Standardised approach – credit risk exposure and credit risk mitigation effects This table presents exposures subject to the standardised approach for the calculation of RWA. This includes certain mortgages that are prescribed a standardised risk weight including interest-only mortgages greater than five years and mortgages held by self-managed superannuation funds. Other exposures subject to the standardised approach include Westpac Pacific, margin lending and some other small portfolios. $m Exposures before CCF and CRM Exposures post-CCF and post-CRM RWA and RWA density On-balance sheet amount Off-balance sheet amount On-balance sheet amount Off-balance sheet amount RWA RWA density (%)a As at 30 September 2025 Asset classes 1 Residential Property 10,277 3,562 10,277 1,471 11,513 98% 2 Corporate 1,025 550 1,025 401 1,416 99% 3 Otherb 2,568 1,787 2,568 718 1,920 58% 4 Other assetsc 8,736 - 8,736 - 5,758 66% 5 RBNZ Regulated Entitiesd 16,005 787 15,959 370 2,337 14% 6 Non-performing exposures 409 16 331 - 483 146% 7 Total 39,020 6,702 38,896 2,960 23,427 56% As at 31 March 2025 Asset classes 1 Residential Property 11,130 3,708 11,130 1,528 12,421 98% 2 Corporate 1,218 537 1,218 405 1,538 95% 3 Otherb 2,716 1,686 2,716 676 1,997 59% 4 Other assetsc 8,683 - 8,683 - 5,919 68% 5 RBNZ Regulated Entitiesd 17,244 805 17,236 357 2,241 13% 6 Non-performing exposures 422 12 317 - 460 145% 7 Total 41,413 6,748 41,300 2,966 24,576 56% a. RWA density is calculated based on unrounded numbers. b. To facilitate standardisation of industry presentation, the immaterial asset classes have been aggregated to Other. These asset classes are: Commercial property, Land acquisition, development and construction, Margin Lending, Sovereign and Banks. c. Other assets include cash items, unsettled transactions, fixed assets and other non-interest earning assets. d. New Zealand also includes NZ CVA and Counterparty credit risk. |
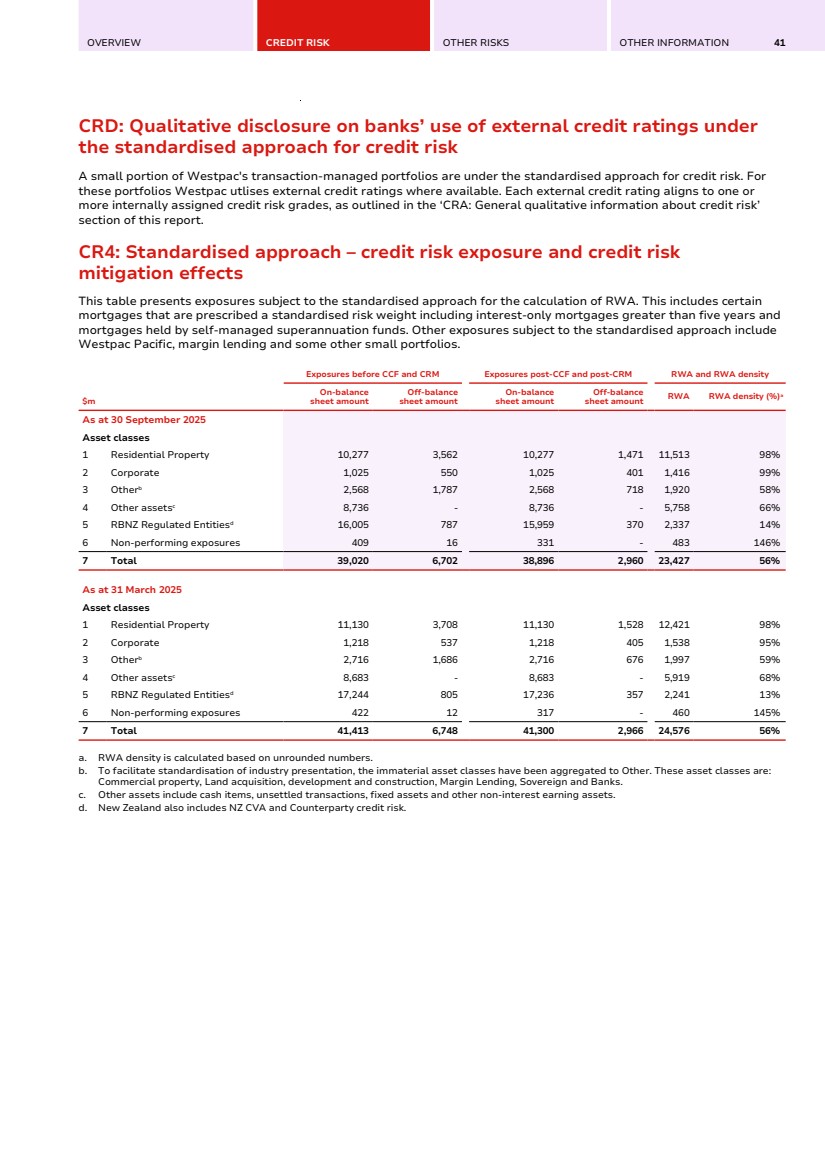
| 42 WESTPAC GROUP SEPTEMBER 2025 PILLAR 3 REPORT CREDIT RISK MANAGEMENT CR5: Standardised approach - Exposures by asset classes and risk weights CR5: Standardised approach - Exposures by asset classes and risk weights This table provides a view of the exposure value of each asset class measured under the standardised approach disaggregated across risk weights. $m Asset classes 0% 20% 50% 65% 75% 85% 90% 100% 110% 120% 150% Other Total credit exposure amount (post-CCF and post-CRM) As at 30 September 2025 1 Residential Property - - 321 217 - - - 11,201 - - 9 - 11,748 2 Corporate - - - - 164 363 - 42 857 - - - 1,426 3 Othera - 1,654 10 - 7 9 476 1,098 9 - 23 - 3,286 4 Other assetsb 2,827 262 - - - - - 5,608 - - - 39 8,736 5 RBNZ Regulated Entities 12,194 2,772 1,344 - - - - 16 - - - 3 16,329 6 Non-performing exposures - - - - - - - 24 - 7 300 - 331 As at 31 March 2025 1 Residential Property - - 335 210 - - - 12,107 - - 7 - 12,659 2 Corporate - - - - 161 299 - 1,163 - - - - 1,623 3 Othera - 1,694 - - 8 12 476 1,182 - - 20 - 3,392 4 Other assetsb 2,443 475 - - - - - 5,723 - - - 41 8,682 5 RBNZ Regulated Entities 13,926 2,825 812 - - - - 27 - - - 3 17,593 6 Non-performing exposures - - - - - - - 25 - 8 284 - 317 a. To facilitate standardisation of industry presentation, the immaterial asset classes have been aggregated to Other. These asset classes are: Commercial property, Land acquisition, development and construction, Margin Lending, Sovereign and Banks. b. Other assets include cash items, unsettled transactions, fixed assets and other non-interest earning assets. |
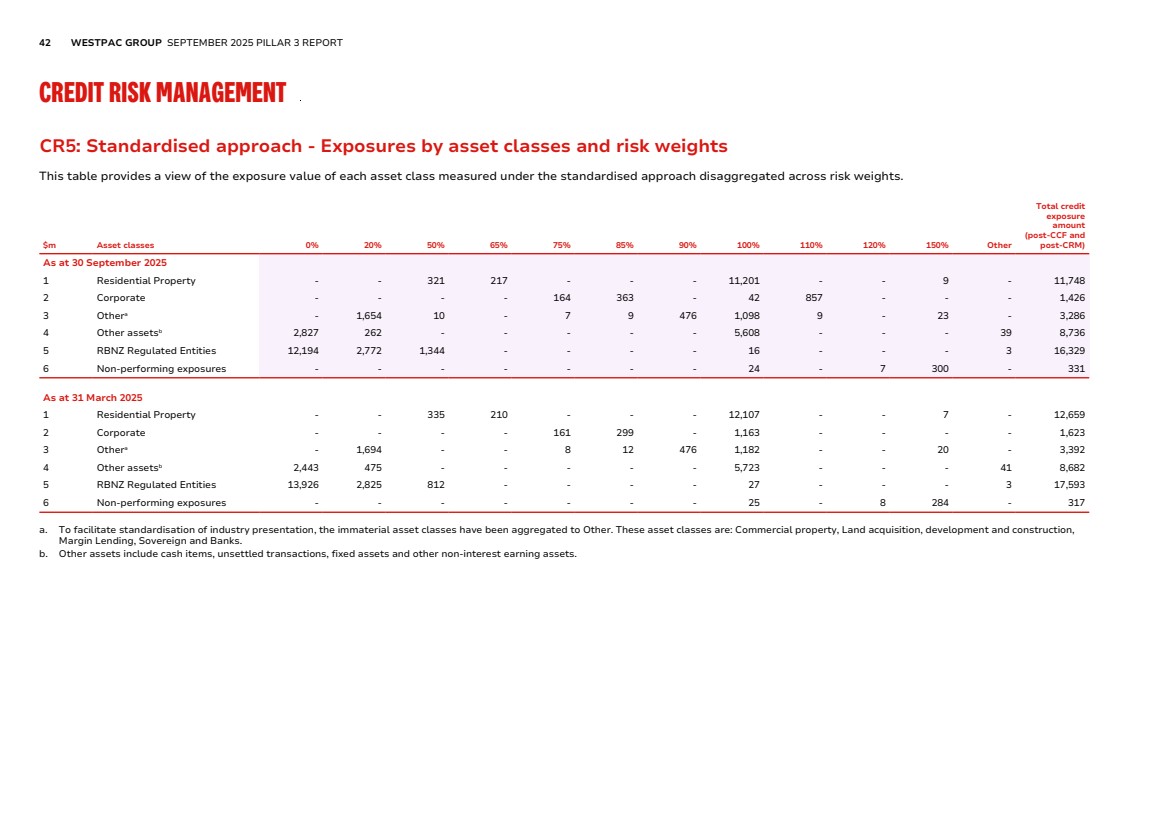
| OVERVIEW CREDIT RISK OTHER RISKS OTHER INFORMATION 43 CR5: Standardised approach - Exposures by asset classes and risk weights (Continued) Exposure amounts and CCFs applied to off-balance sheet exposures, categorised based on risk bucket of converted exposures. The following table shows a breakdown of on and off-balance sheet standardised exposures by risk weights and the weighted average credit conversion factors (CCF) applied against off-balance sheet exposures compared to the exposure amount post CCF and the application of credit risk mitigation techniques. $m Risk weighta On-balance sheet exposure Off-balance sheet exposure (pre-CCF) Weighted average CCFb Exposure (post-CCF and post-CRM) As at 30 September 2025 1 Less than 40% 18,755 2,284 42% 19,709 2 40–70% 1,824 191 27% 1,892 3 75% 143 65 45% 171 4 85% 308 142 46% 372 5 90–100% 16,969 3,633 41% 18,465 6 105–130% 597 373 74% 873 7 150% 382 14 8% 332 8 250% 39 - - 39 9 400% 3 - - 3 10 1250% - - - - 11 Total exposures 39,020 6,702 43% 41,856 As at 31 March 2025 1 Less than 40% 20,441 2,179 42% 21,363 2 40–70% 1,277 210 29% 1,357 3 75% 142 62 44% 169 4 85% 257 123 43% 311 5 90–100% 18,877 4,167 44% 20,703 6 105–130% 10 - - 8 7 150% 365 7 5% 311 8 250% 41 - - 41 9 400% 3 - - 3 10 1250% - - - - 11 Total exposures 41,413 6,748 43% 44,266 a. To facilitate standardisation of industry presentation, table rows have been updated to include RBNZ regulated entities in risk weight bands instead of a separate row. b. Weighting is based on off-balance sheet exposure (pre-CCF). |
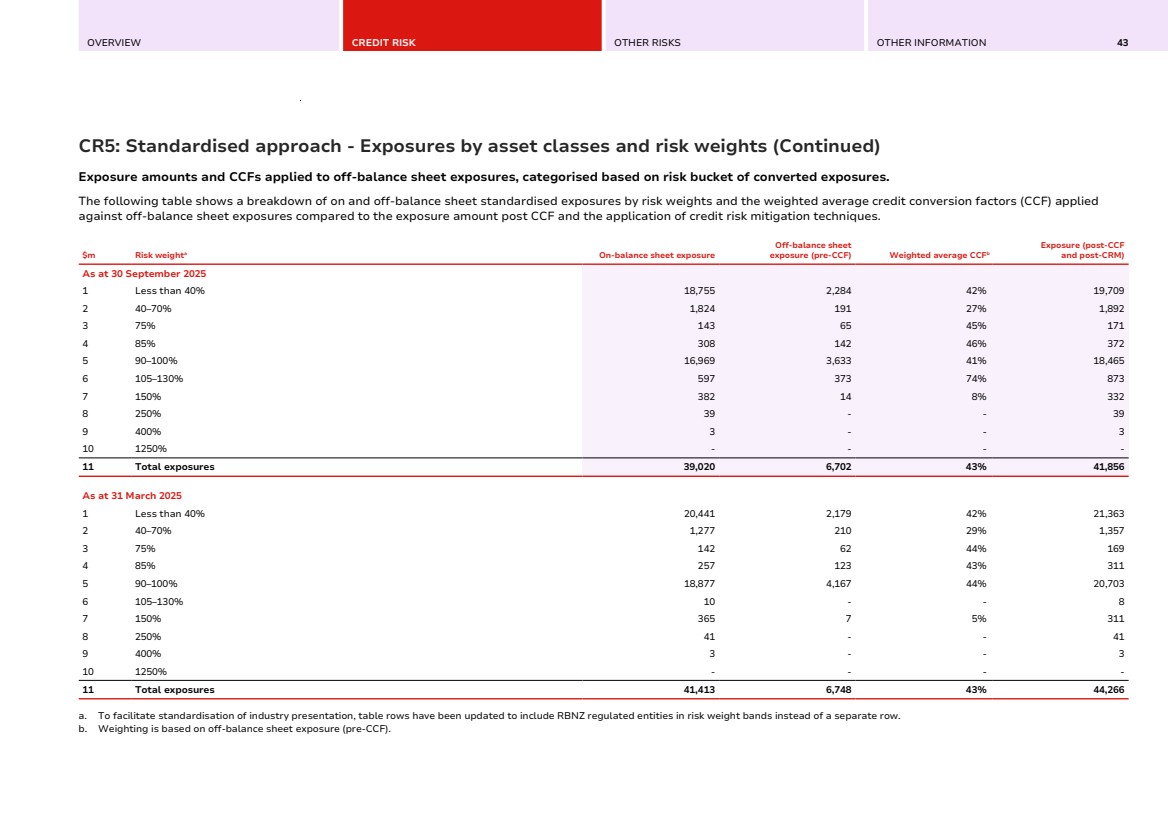
| 44 WESTPAC GROUP SEPTEMBER 2025 PILLAR 3 REPORT CREDIT RISK MANAGEMENT CRE: Qualitative disclosures related to IRB models CRE: Qualitative disclosures related to IRB models Scope of IRB models Under the Advanced Internal Ratings-Based (AIRB) approach, Westpac has regulatory approval to use its own models to determine risk estimates for Probability of Default (PD), Loss Given Default (LGD) and Exposure at Default (EAD). Under the Foundation IRB (FIRB) approach the bank provides its own estimates for PD, however relies on supervisory estimates of LGD and EAD. The bank also uses the Standardised approach for certain credit risk exposures, in line with the APS 1121 standard. This approach uses risk weights that are prescribed by the supervisor to calculate RWA for those exposures. Exposures subject to supervisory risk-weights in the IRB approach include assets categorised as specialised lending, where a regulatory capital ‘slotting’ approach applies. Specialised lending relates to Project Finance, Commodity Finance and Object Finance. AIRB FIRB Standardised Includes: • Corporate • Residential Mortgages • Qualifying Revolving Retail • Other Retail • SME Retail • Specialised Lending (‘slotting’ approach) Includes: • Large Corporate • Financial Institutions • Sovereign Includes: • Interest-only mortgages greater than 5 years • Mortgages held by self-managed super funds • Pacific and Asian retail exposures • Margin lending • Credit valuation adjustments • Pacific Sovereign exposures Securitised portfolios are treated separately under APS 120 Securitisation, and are hence excluded from this disclosure section. Internal ratings process for program-managed portfolios The process for assigning PDs, LGDs and, where applicable, EADs to the program-managed portfolio involves segmenting or categorising the portfolio into a number of pools per product. These pools are created by analysing risk characteristics that have historically predicted that an account is likely to go into default or loss. No deviations from the reference definition of default are permitted. Definition of default is aligned to the regulatory definition of non-performing exposure under APS 220 Credit Risk Management. Internal credit risk ratings system In addition to use for regulatory capital purposes, credit risk estimates are also used for the purposes described below: Provisioning Credit provisions are held by Westpac to cover expected credit losses (ECL) for loans, debt securities and credit commitments. Provisioning includes both individual and collective components, including overlays. Individual provisions are calculated on impaired loans taking into account management’s best estimate of the present value of future cashflows. Collective provisions are established on a portfolio basis using a framework that considers PD, LGD, EAD and forward looking macro-economic scenarios. This also includes a consideration of overlays, to address any residual risks which are not covered through the ECL provisioning models. Risk-adjusted performance measurement Business performance measures include allocated Level 2 CET1 capital. Pricing Westpac prices loans with consideration of the return on the capital allocated to the loan. Returns include interest income and fees after expected credit losses and other costs. 1. APS 112 Capital Adequacy: Standardised Approach to Credit Risk |
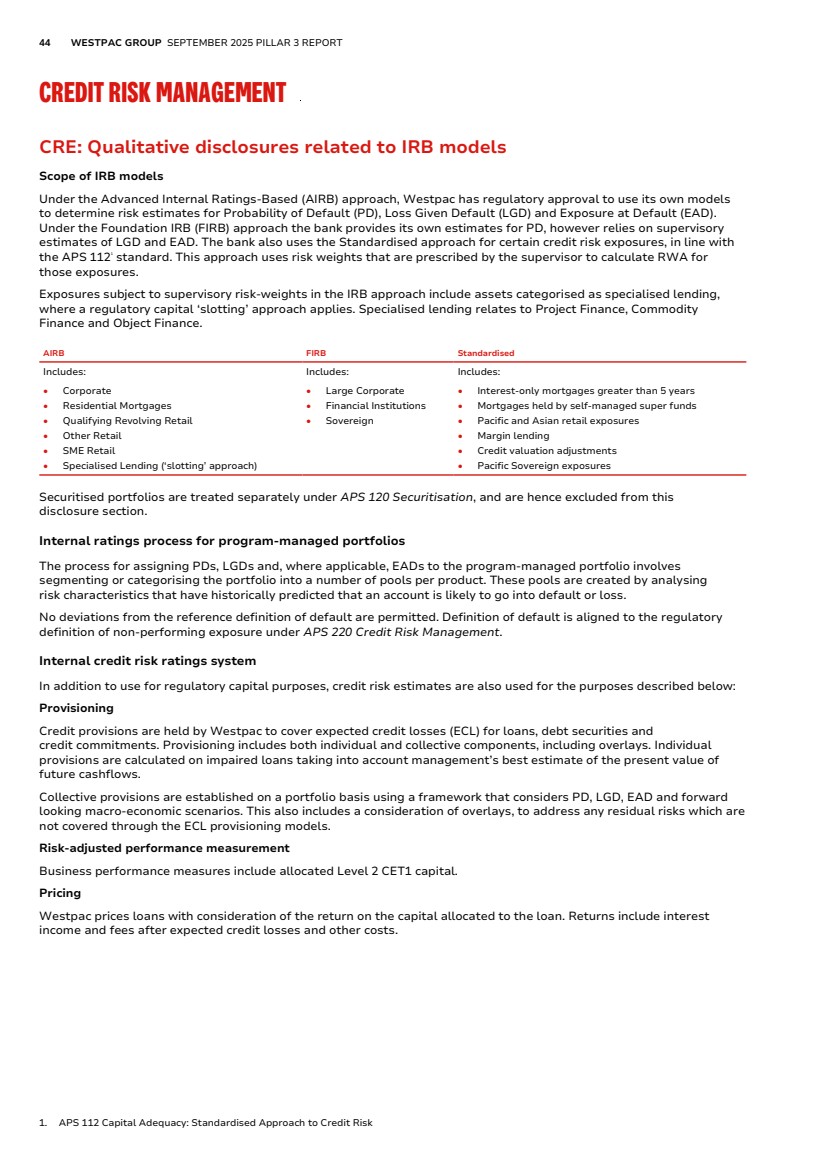
| OVERVIEW CREDIT RISK OTHER RISKS OTHER INFORMATION 45 CRE: Qualitative disclosures related to IRB models (Continued) Control mechanisms for the credit risk rating system include: Westpac’s credit risk rating system is reviewed by Risk and presented to BRiskC confirming that the rating criteria and policy are appropriate given the current portfolio, control framework and external conditions; • All models impacting the risk rating process are periodically reviewed by model owner in accordance with Westpac’s model risk policies; • Credit risk estimate models (including PD, LGD and EAD levels) are independently assessed annually by Model Risk and outcomes are noted at the Credit Risk Estimates Committee (a sub-committee of CREDCO) and the Model Risk Committee (a sub-committee of the Group Executive Risk Committee). All credit risk estimate models used for IRB purposes are approved by Head of Model Risk; • Group Audit undertakes an independent annual review of the credit risk rating system in accordance with APS 113; and • CREDCO, RISKCO and BRiskC monitor the risk profile, performance and management of Westpac’s credit portfolio and the development and review of key credit risk policies. Risk reporting A report on Westpac’s credit risk portfolio is provided to CREDCO, RISKCO and BRiskC quarterly. It includes monitoring of performance against risk appetite. Credit risk and asset quality are also reported to the BRiskC, including details of provisioning , stressed exposures, delinquency trends and key performance metrics. Exposures subject to supervisory risk-weights in the IRB approach include assets categorised as specialised lending, where a regulatory capital ‘slotting’ approach applies. Specialised lending relates to Project, Object and Commodities Finance. The ‘Credit Risk Management’ section of this report describes the alignment of Westpac risk grades to both external rating equivalents and regulatory capital ‘slots’. Breakdown by asset class and approach The tables below illustrate the degree to which IRB models are used within Westpac, showing the proportional split of EAD and RWA by the AIRB, FIRB and Standardised approaches. The Westpac New Zealand portfolio is split into Non-Retail (including SME Retail) and Retail asset classes, as per the CR6 and CR9 disclosures. Breakdown of EAD and RWA by Asset Class and Approach As at 30 September 2025 EAD (in %) IRB F-IRB Standardised Corporate 98% - 2% Specialised Lending 100% - - Large Corporate - 100% - Sovereign - 71% 29% Financial Institutions - 100% - Residential Mortgages 91% - 9% Qualifying Revolving Retail 100% - - Other Retail 99% - 1% SME Retail 99% - 1% RBNZ Regulated Entities - Retail 100% - - RBNZ Regulated Entities - Non retail 91% - 9% |
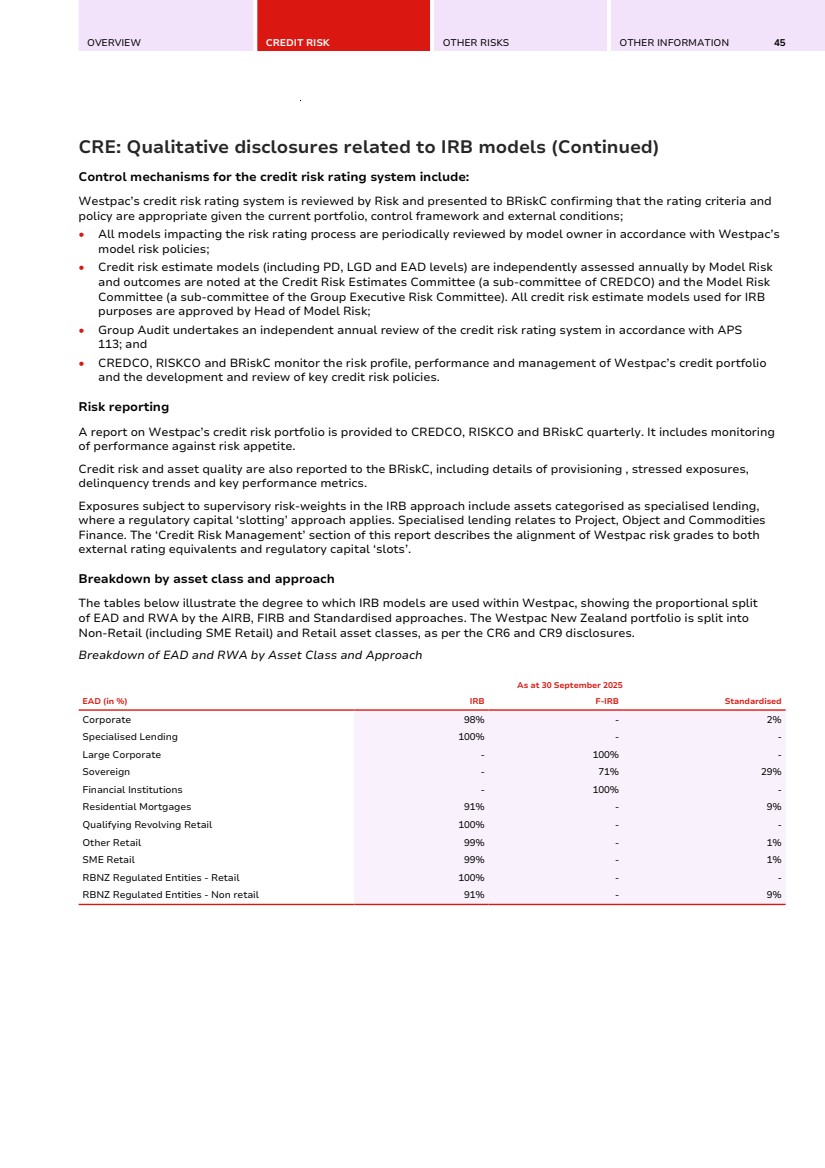
| 46 WESTPAC GROUP SEPTEMBER 2025 PILLAR 3 REPORT CREDIT RISK MANAGEMENT CRE: Qualitative disclosures related to IRB models (Continued) Relationships between model development and risk management functions, and reporting IRB credit risk models, and any subsequent changes to those models, are developed internally by credit risk modelling functions within Westpac’s Risk division or, for New Zealand models, Westpac New Zealand’s credit risk modelling function. IRB credit risk models are periodically reviewed by the model owner in accordance with Westpac’s model risk policies. Regular model performance monitoring is in place to ensure that deterioration in the performance of a model is identified and remediated proactively and in a timely manner. Stakeholder forums are held with Risk and Business representatives to discuss model monitoring outcomes and other process or policy changes that may impact on model performance. Newly developed, changes to existing, and periodic reviews of IRB models must be independently assessed by the Group’s Model Risk function prior to approval, in line with model risk policy and governance. Independent assessment outcomes are noted at relevant committees as specified in Model Risk Policy. All IRB models are approved by Model Risk function. New or changed IRB models require APRA approval prior to implementation. Model monitoring and performance outcomes are one input into the annual review of Westpac’s Credit Risk Rating System, which is independently reviewed by Group Audit in accordance with APS 113. Group Audit also provides re-assurance over the performance of the Model Risk function. Description of the main characteristics of the approved models Westpac adopts two approaches for assigning internal credit risk ratings, depending upon the nature of the customer and the product. Transaction-managed (TM) approach For larger customers (those in the broader Corporate, Sovereign and Financial Institution asset classes), Westpac evaluates credit requests by undertaking detailed individual customer and transaction risk analysis – the ‘transaction-managed’ approach. Customers are assigned a customer risk grade (CRG) representing Westpac’s estimate of their probability of default (PD). CRGs are defined by qualitative and quantitative criteria and other characteristics. Some portfolios (e.g. Business Lending, Property Finance, New Zealand Agriculture) utilise risk grading models1 to generate a proposed CRG, however for all TM customers, an expert judgment decision-making process is employed to evaluate the final CRG. They are defined using distinct rating criteria that are applied consistently across the Group. CRGs are reviewed annually at a minimum, or more frequently as material information comes to hand. A PD masterscale maps CRGs to PDs that are used in the APS 113 RWA calculations. This mapping is classified as a model and subject to the same model governance as other IRB models, including back-testing against realised default data, annual review, independent assessment and approval. For secured exposures LGD values are assigned at facility level taking into account the realistic value of assets over which security is held, and the seniority of exposure in the capital and debt structure of TM customers. LGD estimates are based on an economic loss calculation, and include workout costs and discounting of future cash flows to the date of default. LGD estimates are calibrated with reference to analysis of available internal and external loss data. Under APS 113, prescribed LGD estimates are applied to unsecured and subordinated exposures, while internal models for EAD are not permitted for the non-retail portfolios that fall under Westpac’s Transaction Managed approach. The calculation of EAD is prescribed by the Standard. 1. Risk grading models utilise a combination of quantitative and qualitative attributes of a customer to generate a proposed Customer Risk Grade (CRG). |
| OVERVIEW CREDIT RISK OTHER RISKS OTHER INFORMATION 47 CRE: Qualitative disclosures related to IRB models (Continued) Program-managed approach High-volume retail credit portfolios (all consumer and small business customers) with homogenous credit risk characteristics are managed on a statistical basis according to pre-determined objective criteria (the ‘program-managed’ approach). The process for assigning PDs, LGDs and, where applicable, EADs to the program-managed portfolio involves categorising the portfolio into a number of pools or segments for each product. These pools are created by analysing risk characteristics (using internal data) that have historically predicted that an account is likely to go into default or loss. PD models are calibrated to reflect variations of default rates through an economic cycle and ensure that the PD estimates attached to each segment represent an estimate of long-run average default risk. LGD estimates are calibrated to reflect expected losses during a downturn period. Internal models for EAD are applied to revolving retail products. These models estimate the expected exposure on a revolving product at the point of a future default, allowing for the possibility of further drawdowns against currently unutilised limits. Key models used with respect to each portfolio Approach Asset Class Risk Grading Models PD LGD EAD AIRB Transaction Managed Corporate • • • New Zealand – Non-Retail • • • • FIRB Transaction Managed Large Corporate • Sovereign • Financial Institutions • AIRB Program-Managed Residential Mortgages • • • Qualifying Revolving Retail • • • Other Retail • • • SME Retail • • • New Zealand – Retail • • • • Risk grading models are used for Business Lending and Property Finance (also used in New Zealand). New Zealand also uses a risk grading model for its Agriculture portfolio. • The Transaction-managed PD model applies to all TM exposures (including New Zealand) except Specialised Lending, while the LGD model is not applied to FIRB asset classes. Prescribed EAD estimates also apply across both Australia and New Zealand TM portfolios. • Specialised Lending asset classes use prescribed risk weights in the calculation of regulatory capital, using the supervisory slotting approach. • Program-managed asset classes (including those in New Zealand) have separate PD, LGD and EAD risk estimate models. |
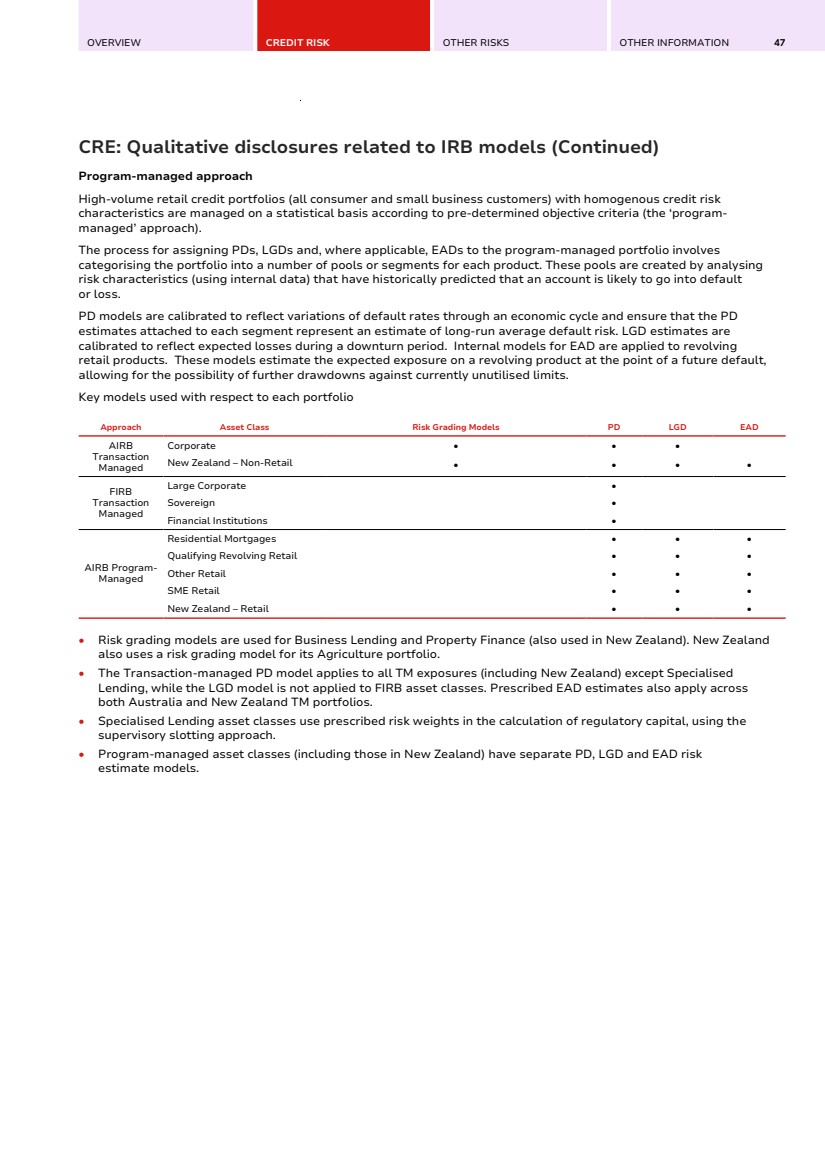
| 48 WESTPAC GROUP SEPTEMBER 2025 PILLAR 3 REPORT CREDIT RISK MANAGEMENT CR6: IRB - Credit risk exposures by portfolio and PD ranges CR6: IRB - Credit risk exposures by portfolio and PD ranges The following tables provide the main parameters used for the calculation of capital requirements for IRB modelled RWA outcomes (which includes A-IRB and F-IRB). A-IRB The following table provides the key parameters used for the calculation of capital requirements for credit risk exposures under the A-IRB approach, broken down by asset class and PD range. Under A-IRB, an ADI can use its own estimates of PD, maturity, LGD & EAD (non-retail portfolios use APRA supervisory estimates for EAD). A-IRB As at 30 September 2025 $m PD scale Original on-balance sheet gross exposure Off-balance sheet exposure pre CCF Average CCF (%) EAD post CRM and post-CCF Average PD (%) Number of borrowers Average LGD (%) Average maturity (years) RWA RWA density (%)a EL Provisions Corporateb 0.00 to <0.15 5,683 4,865 44% 7,834 0.07% 1,717 37% 2.8 1,858 24% 2 0.15 to <0.25 17,248 7,805 46% 20,853 0.18% 1,654 29% 2.8 7,427 36% 11 0.25 to <0.50 48,358 18,706 52% 58,153 0.39% 12,256 26% 2.3 24,109 41% 59 0.50 to <0.75 - - - - - - - - - - - 0.75 to <2.50 65,656 16,153 59% 75,147 1.39% 25,217 26% 1.8 45,911 61% 269 2.50 to <10.00 2,074 421 66% 2,352 4.78% 1,788 30% 1.7 2,347 100% 34 10.00 to <100.00 3,922 719 62% 4,368 20.80% 1,544 31% 2.0 7,595 174% 284 100.00 (Default) 2,192 275 25% 2,504 100.00% 1,184 29% 1.5 1,566 63% 869 Total Corporate 145,133 48,944 53% 171,211 2.83% 45,360 27% 2.1 90,813 53% 1,528 1,697 RBNZ Regulated Entities - Non retail 0.00 to <0.15 5,760 3,917 52% 7,847 0.04% 3,249 44% 2.4 1,528 19% 53 0.15 to <0.25 2,206 2,196 55% 3,377 0.18% 217 34% 2.6 1,132 34% 2 0.25 to <0.50 5,429 2,399 57% 6,768 0.38% 12,201 33% 2.3 3,070 45% 9 0.50 to <0.75 - - - - - - - - - - - 0.75 to <2.50 8,831 1,932 55% 9,874 1.41% 45,469 32% 2.3 6,932 70% 44 2.50 to <10.00 592 70 54% 625 4.75% 2,612 30% 2.1 570 91% 9 10.00 to <100.00 842 129 45% 899 25.53% 8,412 34% 1.8 1,637 182% 77 100.00 (Default) 228 24 58% 242 100.00% 495 40% 1.9 712 294% 51 Total RBNZ Regulated Entities - Non retail 23,888 10,667 55% 29,632 2.28% 72,655 36% 2.3 15,581 53% 245 180 Residential Mortgages 0.00 to <0.15 151,123 51,624 98% 201,511 0.08% 578,226 13% 12,241 6% 20 0.15 to <0.25 64,857 5,773 76% 69,263 0.19% 166,412 14% 6,481 9% 19 0.25 to <0.50 134,387 8,068 91% 141,757 0.33% 340,019 15% 21,065 15% 71 0.50 to <0.75 92,094 587 101% 92,685 0.64% 223,216 16% 23,050 25% 95 0.75 to <2.50 28,233 788 82% 28,883 1.17% 70,626 16% 10,825 37% 56 2.50 to <10.00 23,154 1,136 50% 23,717 7.85% 65,425 15% 25,249 106% 287 10.00 to <100.00 7,166 17 104% 7,183 20.47% 18,683 16% 10,099 141% 238 100.00 (Default) 4,921 38 - 4,921 100.00% 11,632 20% 7,423 151% 481 Total Residential Mortgages 505,935 68,031 94% 569,920 1.74% 1,474,239 15% 116,433 20% 1,267 1,347 |
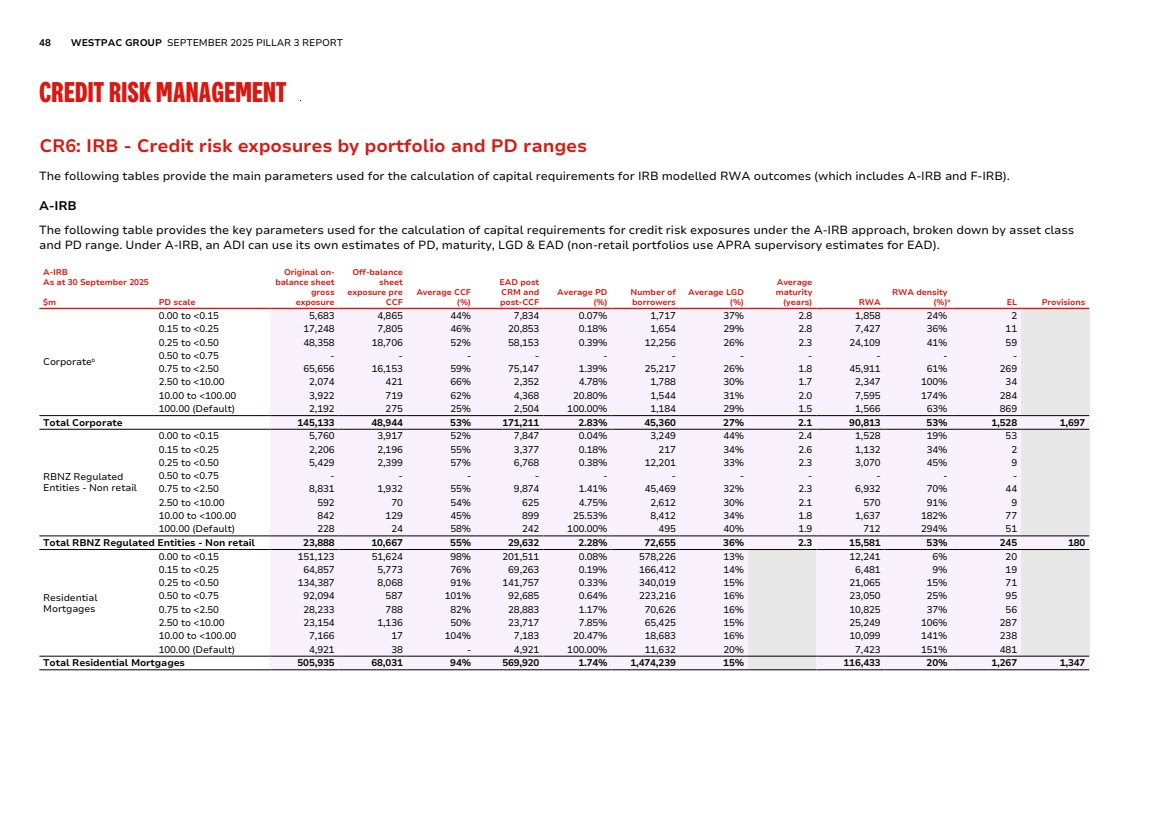
| OVERVIEW CREDIT RISK OTHER RISKS OTHER INFORMATION 49 CR6: IRB - Credit risk exposures by portfolio and PD ranges (Continued) A-IRB As at 30 September 2025 $m PD scale Original on-balance sheet gross exposure Off-balance sheet exposure pre CCF Average CCF (%) EAD post CRM and post-CCF Average PD (%) Number of borrowers Average LGD (%) Average maturity (years) RWA RWA density (%)a EL Provisions Qualifying Revolving Retail 0.00 to <0.15 2,071 8,354 52% 6,442 0.09% 1,010,554 82% 328 5% 5 0.15 to <0.25 844 2,119 58% 2,068 0.21% 253,035 84% 210 10% 4 0.25 to <0.50 728 1,379 60% 1,552 0.40% 163,541 84% 269 17% 5 0.50 to <0.75 518 631 64% 919 0.73% 98,382 83% 253 28% 6 0.75 to <2.50 1,133 813 72% 1,716 1.50% 178,034 83% 804 47% 21 2.50 to <10.00 718 374 57% 931 3.87% 98,420 83% 850 91% 30 10.00 to <100.00 315 156 48% 390 18.43% 46,135 80% 850 218% 57 100.00 (Default) 82 24 - 82 100.00% 9,767 75% 309 375% 39 Total Qualifying Revolving Retail 6,409 13,850 56% 14,100 1.70% 1,857,868 83% 3,873 27% 167 198 Other Retail 0.00 to <0.15 2 7 46% 5 0.11% 55 82% 1 24% - 0.15 to <0.25 1 11 82% 11 0.23% 410 80% 4 39% - 0.25 to <0.50 3 17 90% 19 0.40% 766 79% 10 55% - 0.50 to <0.75 187 107 108% 302 0.57% 30,769 70% 179 59% 1 0.75 to <2.50 531 95 102% 629 1.48% 44,204 80% 640 102% 7 2.50 to <10.00 668 29 100% 707 4.87% 91,895 83% 946 134% 29 10.00 to <100.00 161 5 114% 172 32.69% 69,550 83% 372 216% 47 100.00 (Default) 62 1 - 62 100.00% 42,531 82% 255 409% 33 Total Other Retail 1,615 272 101% 1,907 8.63% 280,180 80% 2,407 126% 117 118 SME Retail 0.00 to <0.15 - - - - - - - - - - 0.15 to <0.25 - - - - - - - - - - 0.25 to <0.50 203 624 104% 852 0.32% 7,876 40% 208 24% 1 0.50 to <0.75 1,090 1,584 104% 2,731 0.67% 38,196 37% 956 35% 7 0.75 to <2.50 12,622 3,457 104% 16,201 1.49% 183,323 35% 7,685 47% 84 2.50 to <10.00 3,450 530 103% 3,994 4.65% 48,621 36% 2,679 67% 65 10.00 to <100.00 1,283 220 103% 1,509 26.03% 43,005 36% 1,608 107% 148 100.00 (Default) 961 84 22% 980 100.00% 8,802 41% 3,257 333% 179 Total SME Retail 19,609 6,499 102% 26,267 6.93% 329,823 35% 16,393 62% 484 733 RBNZ Regulated Entities - Retail 0.00 to <0.15 296 1,170 60% 1,001 0.08% 137,831 48% 106 11% 3 0.15 to <0.25 - - - - - - - - - - 0.25 to <0.50 7,170 3,825 68% 9,792 0.39% 202,930 13% 958 10% 8 0.50 to <0.75 42,134 7,263 71% 47,272 0.61% 293,855 19% 9,929 21% 60 0.75 to <2.50 11,900 2,084 76% 13,495 1.53% 142,909 27% 7,673 57% 60 2.50 to <10.00 1,050 161 61% 1,150 4.15% 58,862 39% 1,216 106% 22 10.00 to <100.00 37 5 80% 42 20.33% 10,388 77% 73 174% 8 100.00 (Default) 710 10 - 713 100.00% 4,854 23% 1,217 171% 85 Total RBNZ Regulated Entities - Retail 63,297 14,518 70% 73,465 1.77% 851,629 21% 21,172 29% 246 241 Total A-IRB Credit risk exposure 765,886 162,781 74% 886,502 2.14% 4,911,754 20% 2.2 266,672 30% 4,054 4,514 a. RWA density is calculated based on unrounded numbers. b. To facilitate standardisation of industry presentation, the sub asset classes of SME Corporate and Property Finance have been aggregated to Corporate. |
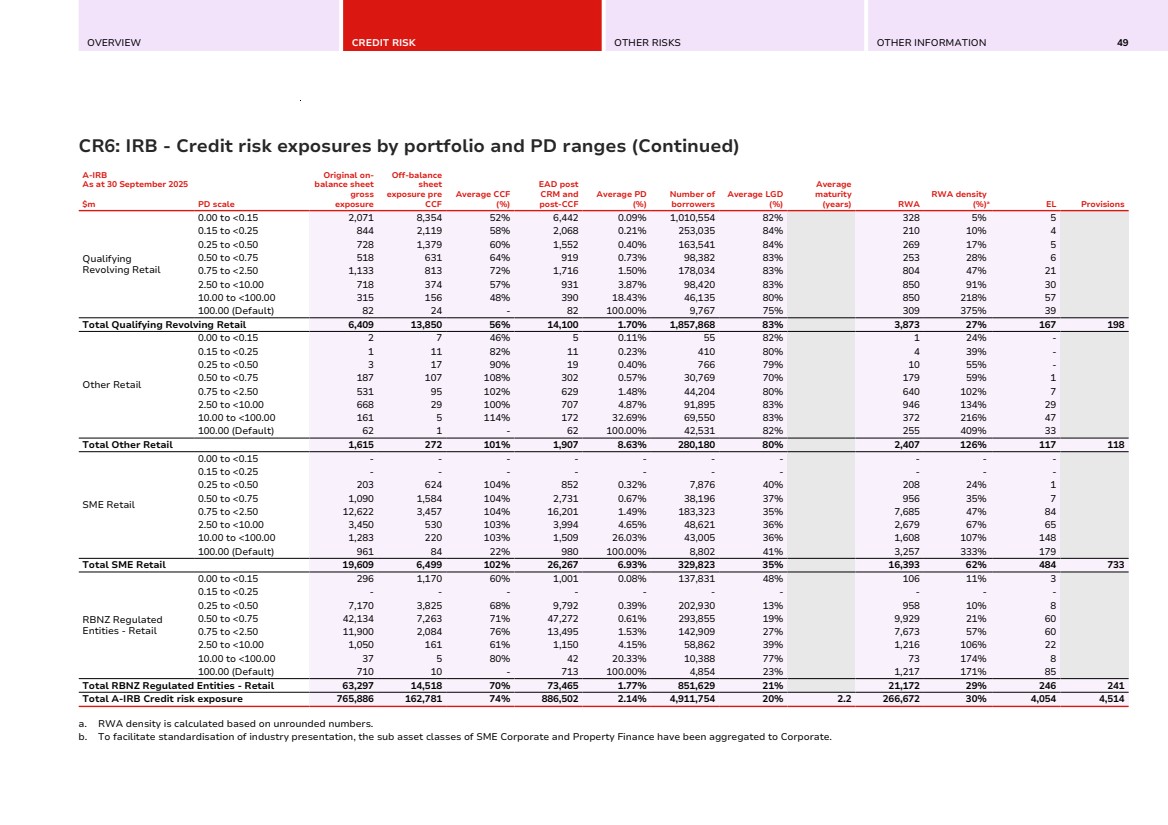
| 50 WESTPAC GROUP SEPTEMBER 2025 PILLAR 3 REPORT CREDIT RISK MANAGEMENT CR6: IRB - Credit risk exposures by portfolio and PD ranges (Continued) A-IRB As at 31 March 2025 $m PD scale Original on-balance sheet gross exposure Off-balance sheet exposure pre CCF Average CCF (%) EAD post CRM and post-CCF Average PD (%) Number of borrowers Average LGD (%) Average maturity (years) RWA RWA density (%)a EL Provisions Corporateb 0.00 to <0.15 5,265 3,862 44% 6,974 0.07% 1,706 37% 2.6 1,567 22% 1 0.15 to <0.25 15,157 6,322 46% 18,087 0.18% 1,313 30% 2.7 6,463 36% 10 0.25 to <0.50 41,131 17,312 52% 50,202 0.39% 9,924 26% 2.3 20,202 40% 49 0.50 to <0.75 - - - - - - - - - - - 0.75 to <2.50 63,246 17,063 59% 73,347 1.45% 28,486 25% 1.9 45,587 62% 271 2.50 to <10.00 3,023 918 67% 3,486 4.78% 1,323 31% 1.8 3,569 102% 52 10.00 to <100.00 3,599 785 60% 4,072 21.20% 1,403 30% 2.0 7,190 177% 267 100.00 (Default) 2,103 280 26% 2,422 100.00% 988 30% 1.5 1,599 66% 912 Total Corporate 133,524 46,542 54% 158,590 2.99% 45,143 27% 2.1 86,177 54% 1,562 1,652 RBNZ Regulated Entities - Non retail 0.00 to <0.15 6,127 3,060 100% 9,191 0.04% 3,299 47% 2.3 1,752 19% 64 0.15 to <0.25 2,290 1,760 102% 3,897 0.18% 202 37% 2.2 1,366 35% 3 0.25 to <0.50 5,377 2,168 97% 7,246 0.38% 12,325 35% 2.3 3,359 46% 9 0.50 to <0.75 - - - - - - - - - - - 0.75 to <2.50 9,254 1,972 98% 11,030 1.43% 44,139 32% 2.2 8,021 73% 52 2.50 to <10.00 685 65 101% 743 4.74% 2,826 30% 2.2 686 92% 11 10.00 to <100.00 1,034 134 102% 1,160 24.23% 8,385 36% 1.9 2,201 190% 102 100.00 (Default) 286 20 100% 301 100.00% 502 34% 1.7 666 221% 57 Total RBNZ Regulated Entities - Non retail 25,053 9,179 99% 33,568 2.42% 71,678 37% 2.2 18,051 54% 298 216 Residential Mortgages 0.00 to <0.15 141,001 51,610 98% 191,366 0.08% 572,736 13% 11,596 6% 19 0.15 to <0.25 62,495 5,895 76% 66,999 0.19% 169,294 14% 6,221 9% 18 0.25 to <0.50 134,006 7,727 91% 141,026 0.33% 351,555 15% 20,806 15% 70 0.50 to <0.75 92,023 576 101% 92,603 0.64% 228,667 16% 22,859 25% 94 0.75 to <2.50 28,880 810 83% 29,551 1.18% 73,926 16% 11,091 38% 57 2.50 to <10.00 22,961 1,138 49% 23,523 7.84% 67,365 15% 24,983 106% 284 10.00 to <100.00 7,898 18 106% 7,917 22.12% 20,731 16% 10,929 138% 282 100.00 (Default) 5,294 32 - 5,294 100.00% 12,739 20% 8,469 160% 472 Total Residential Mortgages 494,558 67,806 94% 558,279 1.89% 1,497,013 15% 116,954 21% 1,296 1,352 |
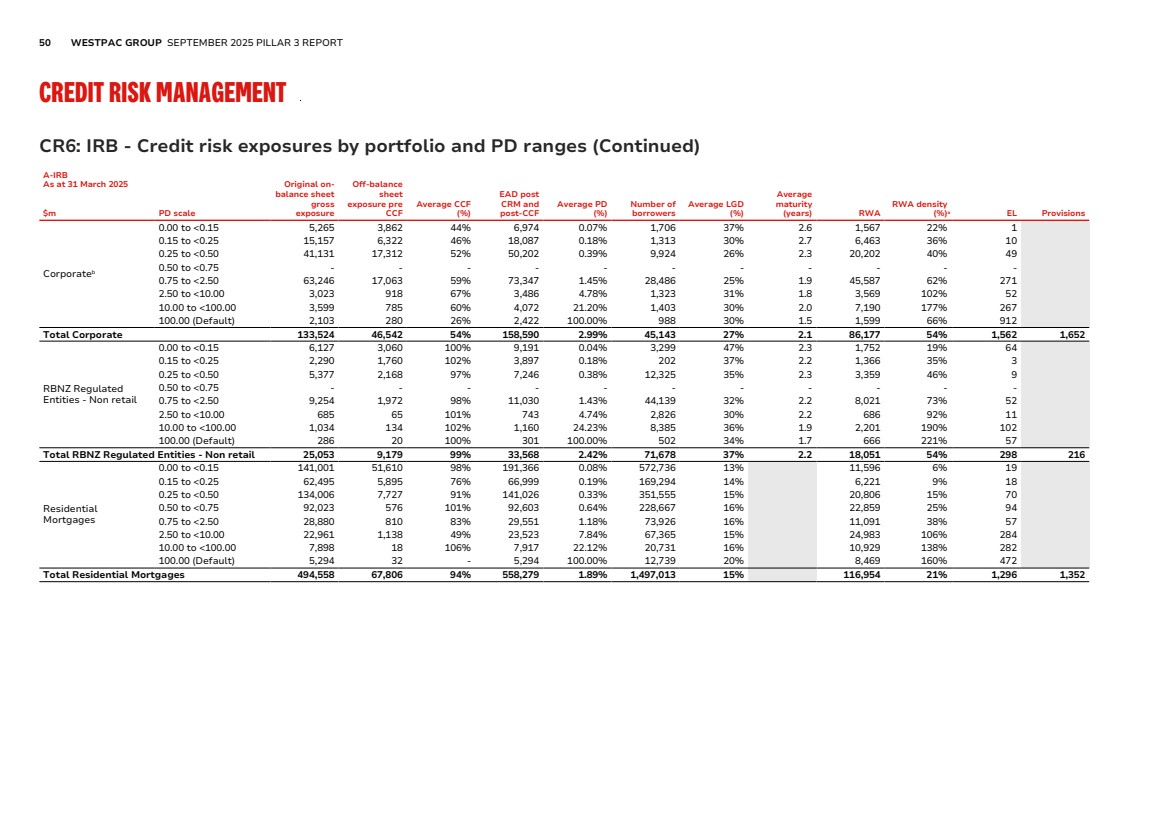
| OVERVIEW CREDIT RISK OTHER RISKS OTHER INFORMATION 51 CR6: IRB - Credit risk exposures by portfolio and PD ranges (Continued) A-IRB As at 31 March 2025 $m PD scale Original on-balance sheet gross exposure Off-balance sheet exposure pre CCF Average CCF (%) EAD post CRM and post-CCF Average PD (%) Number of borrowers Average LGD (%) Average maturity (years) RWA RWA density (%)a EL Provisions Qualifying Revolving Retail 0.00 to <0.15 2,051 8,440 52% 6,455 0.09% 1,015,664 82% 328 5% 5 0.15 to <0.25 804 2,006 55% 1,917 0.21% 242,795 85% 196 10% 3 0.25 to <0.50 704 1,295 56% 1,425 0.40% 158,000 85% 250 18% 5 0.50 to <0.75 481 517 53% 756 0.74% 90,807 86% 216 29% 5 0.75 to <2.50 998 668 65% 1,433 1.46% 164,299 85% 673 47% 18 2.50 to <10.00 696 366 54% 895 3.59% 98,663 84% 793 89% 27 10.00 to <100.00 307 141 46% 373 17.21% 45,563 81% 809 217% 51 100.00 (Default) 77 23 - 77 100.00% 9,599 75% 258 335% 39 Total Qualifying Revolving Retail 6,118 13,456 54% 13,331 1.62% 1,825,390 83% 3,523 26% 153 192 Other Retail 0.00 to <0.15 2 7 45% 5 0.12% 53 82% 1 25% - 0.15 to <0.25 21 103 99% 123 0.23% 5,940 75% 45 37% - 0.25 to <0.50 34 137 98% 169 0.40% 8,663 76% 89 52% 1 0.50 to <0.75 250 244 104% 504 0.61% 42,312 72% 320 64% 2 0.75 to <2.50 750 263 101% 1,014 1.58% 68,784 78% 1,025 101% 13 2.50 to <10.00 809 53 101% 874 5.03% 104,545 82% 1,160 133% 36 10.00 to <100.00 215 11 106% 233 32.45% 78,682 82% 491 211% 61 100.00 (Default) 77 4 - 77 100.00% 42,435 81% 264 342% 44 Total Other Retail 2,158 822 100% 2,999 7.23% 351,414 78% 3,395 113% 157 161 SME Retail 0.00 to <0.15 - - - - - - - - - - 0.15 to <0.25 - - - - - - - - - - 0.25 to <0.50 210 761 102% 987 0.32% 9,578 40% 243 25% 1 0.50 to <0.75 1,157 1,889 102% 3,077 0.67% 44,340 37% 1,094 36% 8 0.75 to <2.50 12,434 4,016 100% 16,469 1.47% 192,695 34% 7,739 47% 84 2.50 to <10.00 3,499 539 101% 4,042 4.66% 35,717 35% 2,747 68% 65 10.00 to <100.00 1,333 250 102% 1,588 26.95% 43,201 36% 1,726 109% 159 100.00 (Default) 896 95 21% 915 100.00% 8,521 40% 2,982 326% 166 Total SME Retail 19,529 7,550 100% 27,078 6.64% 334,052 35% 16,531 61% 483 694 RBNZ Regulated Entities - Retail 0.00 to <0.15 297 1,207 59% 1,012 0.08% 135,979 48% 107 11% - 0.15 to <0.25 - - - - - - - - - - 0.25 to <0.50 7,317 3,887 68% 9,964 0.39% 199,106 13% 970 10% 6 0.50 to <0.75 42,314 7,388 70% 47,498 0.61% 289,349 19% 9,703 20% 57 0.75 to <2.50 12,121 2,115 75% 13,715 1.54% 145,368 26% 7,484 55% 57 2.50 to <10.00 1,054 165 61% 1,156 4.17% 61,692 39% 1,203 104% 22 10.00 to <100.00 40 5 90% 45 19.57% 16,486 77% 78 172% 8 100.00 (Default) 752 12 - 755 100.00% 5,522 23% 1,317 174% 88 Total RBNZ Regulated Entities - Retail 63,895 14,779 69% 74,145 1.82% 853,502 20% 20,862 28% 238 302 Total A-IRB Credit risk exposure 744,835 160,134 77% 867,990 2.27% 4,978,192 20% 2.1 265,493 31% 4,187 4,569 a. RWA density is calculated based on unrounded numbers. b. To facilitate standardisation of industry presentation, the sub asset classes of SME Corporate and Property Finance have been aggregated to Corporate. |
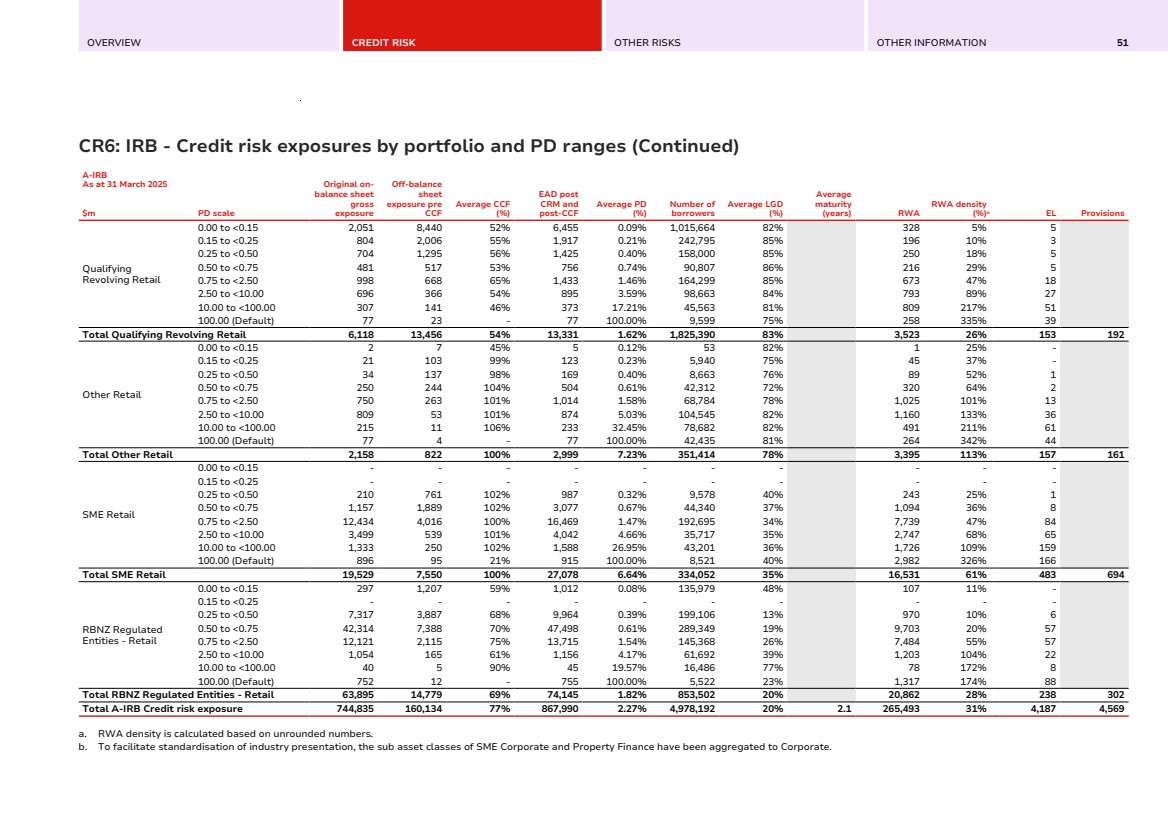
| 52 WESTPAC GROUP SEPTEMBER 2025 PILLAR 3 REPORT CREDIT RISK MANAGEMENT CR6: IRB - Credit risk exposures by portfolio and PD ranges (Continued) F-IRB This table sets out portfolios subject to F-IRB. Under F-IRB, an ADI must provide its own estimates of PD and maturity and rely on supervisory estimates of LGD and EAD. This includes all Sovereign, Financial Institutions and Large Corporate exposures. F-IRB As at 30 September 2025 $m PD scale Original on-balance sheet gross exposure Off-balance sheet exposure pre CCF Average CCF (%) EAD post CRM and post-CCF Average PD (%) Number of borrowers Average LGD (%) Average maturity (years) RWA RWA density (%)a EL Provisions Large Corporate 0.00 to <0.15 7,894 10,191 45% 12,431 0.07% 175 44% 3,300 27% 4 0.15 to <0.25 9,721 13,487 45% 15,856 0.18% 464 47% 7,472 47% 13 0.25 to <0.50 7,446 7,336 50% 11,112 0.32% 496 46% 7,071 64% 16 0.50 to <0.75 - - - - - - - - - - 0.75 to <2.50 1,343 1,345 56% 2,096 1.38% 341 46% 2,454 117% 13 2.50 to <10.00 10 52 90% 57 4.78% 55 54% 101 177% 1 10.00 to <100.00 34 240 63% 185 26.61% 41 50% 522 282% 25 100.00 (Default) 134 35 89% 165 100.00% 7 42% - - 70 Total Large Corporate 26,582 32,686 47% 41,902 0.76% 1,579 46% 20,920 50% 142 221 Sovereign 0.00 to <0.15 148,922 566 47% 149,190 0.01% 197 5% 2,077 1% 2 0.15 to <0.25 11 2 40% 11 0.17% 2 25% 4 36% - 0.25 to <0.50 - - - - 0.26% 1 50% - 86% - 0.50 to <0.75 - - - - - - - - - - 0.75 to <2.50 - 1 41% - 1.83% 2 25% - 57% - 2.50 to <10.00 52 15 100% 67 4.78% 31 45% 108 162% 1 10.00 to <100.00 - - - - - - - - - - 100.00 (Default) - - - - - - - - - - Total Sovereign 148,985 584 49% 149,268 0.02% 233 5% 2,189 1% 3 5 Financial Institutions 0.00 to <0.15 15,492 9,035 50% 20,019 0.06% 476 51% 5,358 27% 6 0.15 to <0.25 2,958 1,887 45% 3,798 0.17% 104 50% 1,990 52% 3 0.25 to <0.50 1,572 543 53% 1,859 0.36% 445 41% 1,258 68% 3 0.50 to <0.75 - - - - - - - - - - 0.75 to <2.50 995 420 54% 1,221 1.37% 777 36% 1,240 102% 6 2.50 to <10.00 16 35 90% 48 4.78% 86 38% 86 180% 1 10.00 to <100.00 80 12 51% 86 20.45% 50 33% 179 208% 6 100.00 (Default) 58 1 - 58 100.00% 31 35% - - 20 Total Financial Institutions 21,171 11,933 50% 27,089 0.44% 1,969 50% 10,111 37% 45 65 Total F-IRB Credit risk exposure 196,738 45,203 48% 218,259 0.21% 3,781 18% 33,220 15% 190 291 a. RWA density is calculated based on unrounded numbers. |
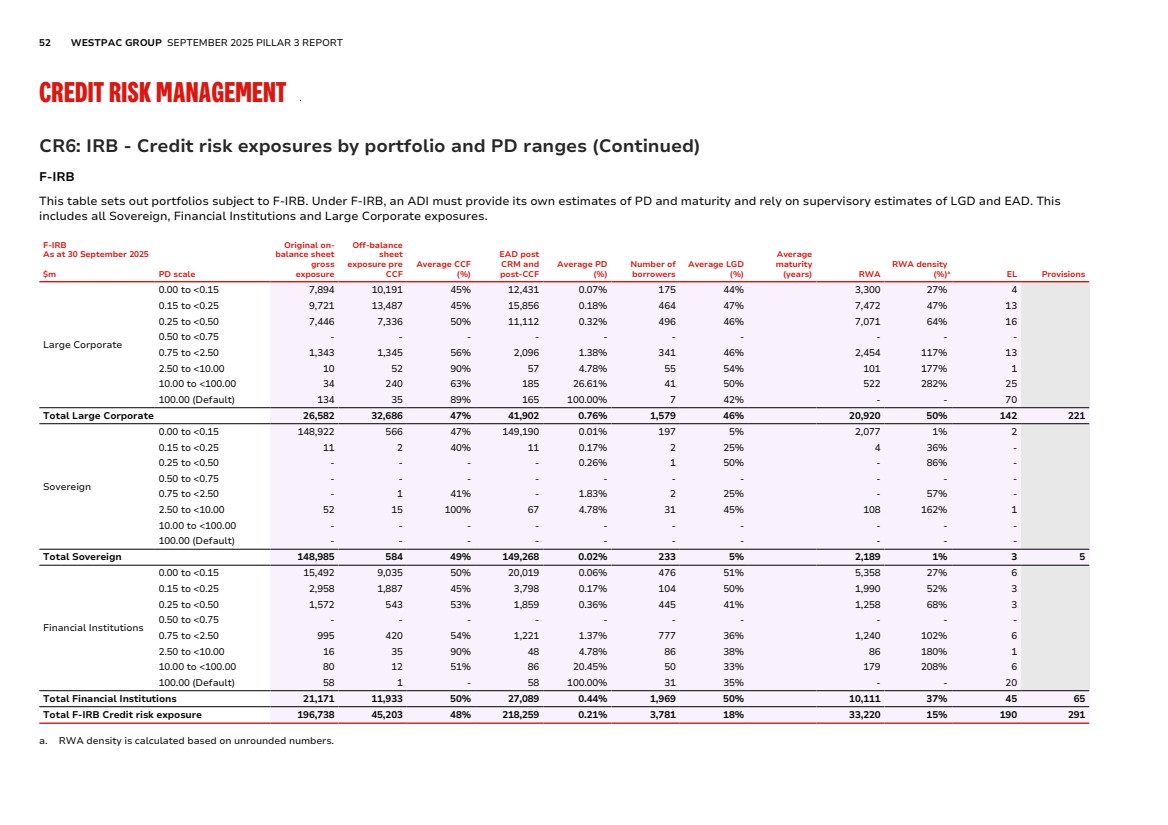
| OVERVIEW CREDIT RISK OTHER RISKS OTHER INFORMATION 53 CR6: IRB - Credit risk exposures by portfolio and PD ranges (Continued) F-IRB As at 31 March 2025 $m PD scale Original on-balance sheet gross exposure Off-balance sheet exposure pre CCF Average CCF (%) EAD post CRM and post-CCF Average PD (%) Number of borrowers Average LGD (%) Average maturity (years) RWA RWA density (%)a EL Provisions Large Corporate 0.00 to <0.15 7,000 9,364 42% 10,970 0.07% 156 44% 2.3 2,784 25% 4 0.15 to <0.25 9,612 12,874 46% 15,523 0.18% 435 48% 2.5 7,469 48% 13 0.25 to <0.50 6,183 6,902 47% 9,413 0.30% 526 45% 2.4 5,703 61% 13 0.50 to <0.75 - - - - - - - - - - - 0.75 to <2.50 1,632 1,259 55% 2,320 1.39% 365 46% 2.1 2,523 109% 15 2.50 to <10.00 37 37 69% 63 4.78% 50 40% 1.4 83 131% 1 10.00 to <100.00 23 369 52% 216 25.87% 52 46% 1.4 552 255% 26 100.00 (Default) 155 38 83% 186 100.00% 8 43% 1.4 - - 80 Total Large Corporate 24,642 30,843 46% 38,691 0.88% 1,592 46% 2.4 19,114 49% 152 214 Sovereign 0.00 to <0.15 153,032 424 53% 153,239 0.01% 199 5% 2.7 1,992 1% 1 0.15 to <0.25 11 2 45% 12 0.17% 2 25% 4.7 4 36% - 0.25 to <0.50 23 - - 23 0.35% 17 50% 2.5 17 72% - 0.50 to <0.75 - - - - - - - - - - - 0.75 to <2.50 - 7 88% 6 2.38% 27 25% 4.6 5 89% - 2.50 to <10.00 4 - 100% 4 4.78% 4 49% 2.5 7 176% - 10.00 to <100.00 - 3 50% 2 23.74% 1 25% 2.3 2 149% - 100.00 (Default) - - - - - - - - - - - Total Sovereign 153,070 436 59% 153,286 0.01% 250 5% 2.7 2,027 1% 1 3 Financial Institutions 0.00 to <0.15 14,829 9,642 51% 19,793 0.06% 446 51% 1.5 5,266 27% 6 0.15 to <0.25 2,752 2,422 45% 3,844 0.17% 129 50% 1.4 1,895 49% 3 0.25 to <0.50 1,480 604 52% 1,796 0.36% 405 47% 2.6 1,474 82% 3 0.50 to <0.75 - - - - - - - - - - - 0.75 to <2.50 1,185 568 53% 1,486 1.65% 1,002 34% 2.7 1,630 110% 8 2.50 to <10.00 36 18 54% 46 4.78% 29 36% 1.7 68 149% 1 10.00 to <100.00 61 7 45% 64 24.74% 44 36% 2.5 152 238% 6 100.00 (Default) 73 2 - 73 100.00% 35 38% 1.9 - - 28 Total Financial Institutions 20,416 13,263 50% 27,102 0.52% 2,090 50% 1.6 10,485 39% 55 68 Total F-IRB Credit risk exposure 198,128 44,542 47% 219,079 0.23% 3,932 18% 2.5 31,626 14% 208 285 a. RWA density is calculated based on unrounded numbers. |
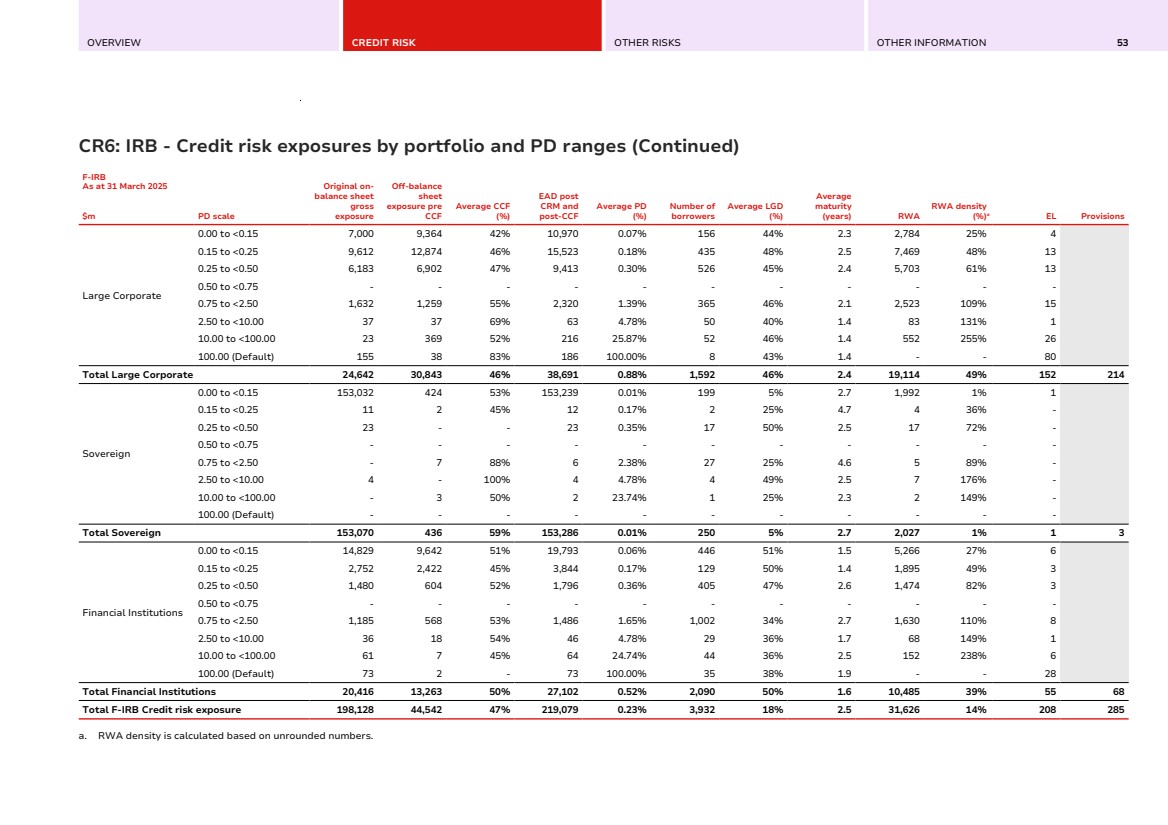
| 54 WESTPAC GROUP SEPTEMBER 2025 PILLAR 3 REPORT CREDIT RISK MANAGEMENT CR8: RWA flow statements of credit risk exposures under IRB CR8: RWA flow statements of credit risk exposures under IRB The following table provides details on the drivers of changes in credit RWA measured under the IRB approach. $m Quarter ended 30 September 2025 30 June 2025 1 RWA as at end of previous reporting period 312,350 308,521 2 Asset size 6,730 6,371 3 Asset quality (3,490) 100 4 Model updates - (1,787) 5 Methodology and policy (1,690) (382) 6 Acquisitions and disposals - - 7 Foreign exchange movements (2,407) 615 8 Other (471) (1,088) 9 RWA as at end of reporting period 311,022 312,350 |
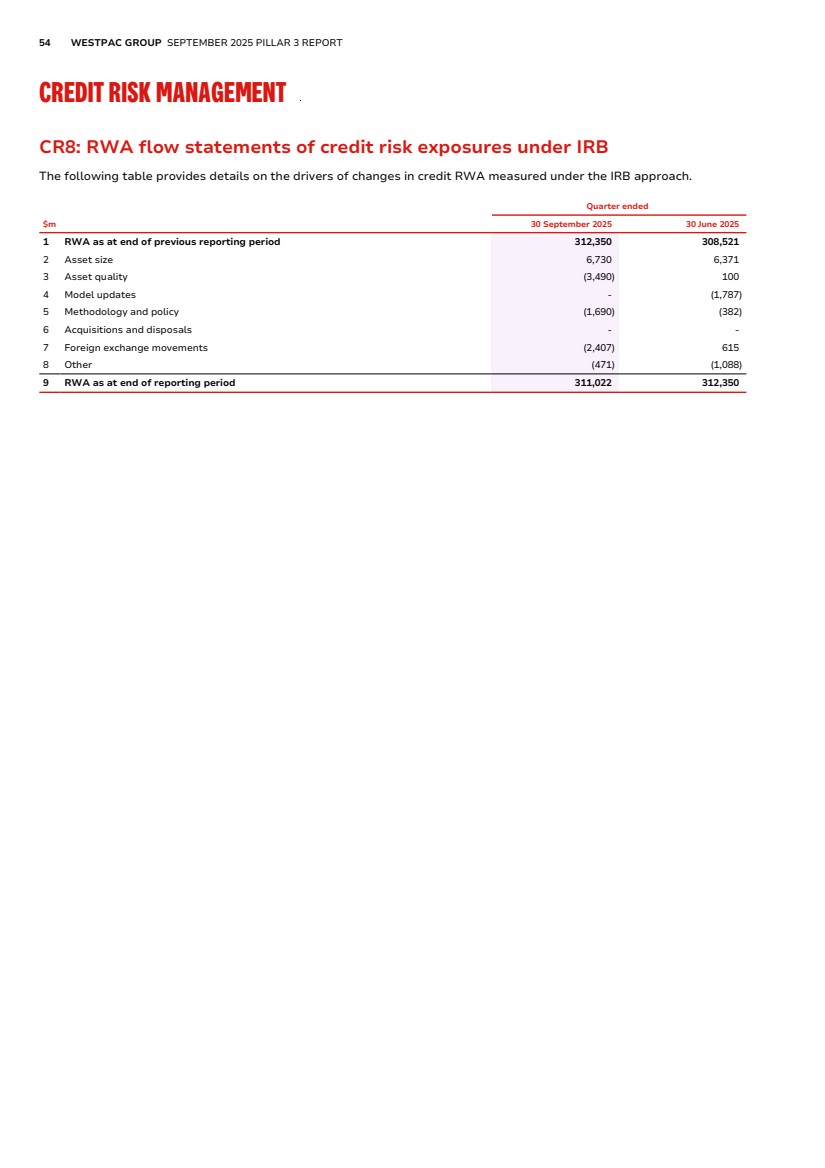
| OVERVIEW CREDIT RISK OTHER RISKS OTHER INFORMATION 55 CR9: IRB - Backtesting of probability of default (PD) per portfolio CR9: IRB - Backtesting of probability of default (PD) per portfolio The following table provides a comparison of the PD used in our IRB models with the effective default rates of the Group’s borrowers in order to validate the reliability of PD calculations for exposures. The data is computed for the 12-month period from 1 July 2024 to 30 June 2025 for all portfolio types. A-IRB Asset classesa PD Range External rating equivalent Weighted average PDb Arithmetic average PD by borrowers Number of borrowers Non-performing borrowers in the yearc of which: new Non-performing borrowers in the year Average historical annual default rated Moody's S&P End of previous year End of the year Corporate 0.00 to <0.15 Aaa to A3 AAA to A- 0.06% 0.04% 2,593 2,299 2 - 0.01% 0.15 to <0.25 Baa1 to Baa2 BBB+ to BBB 0.18% 0.18% 1,341 1,720 3 - 0.05% 0.25 to <0.50 Baa3 to Ba1 BBB- to BB+ 0.39% 0.41% 9,266 11,672 68 2 0.42% 0.50 to <0.75 Ba2 BB - - - - - - - 0.75 to <2.50 Ba2 to Ba3 BB to BB- 1.48% 1.72% 27,707 24,790 631 6 1.06% 2.50 to <10.00 B1 B+ 4.78% 4.78% 1,507 2,598 69 - 2.48% 10.00 to <100.00 B2 to Caa2 B- to CCC 21.03% 21.34% 1,507 1,539 279 - 15.00% 100.00 (Default) 100.00% 100.00% 882 1,125 Residential Mortgages 0.00 to <0.15 N/A N/A 0.07% 0.07% 564,613 571,083 385 7 0.06% 0.15 to <0.25 N/A N/A 0.19% 0.19% 168,294 160,875 272 10 0.15% 0.25 to <0.50 N/A N/A 0.33% 0.33% 364,325 339,661 991 63 0.27% 0.50 to <0.75 N/A N/A 0.64% 0.63% 237,828 225,942 1,166 58 0.52% 0.75 to <2.50 N/A N/A 1.19% 1.18% 76,669 71,425 717 29 0.98% 2.50 to <10.00 N/A N/A 7.93% 7.66% 65,511 63,534 3,345 1 5.80% 10.00 to <100.00 N/A N/A 24.25% 23.97% 21,704 19,366 4,189 - 17.92% 100.00 (Default) 100.00% 100.00% 14,341 11,650 Australian credit cards 0.00 to <0.15 N/A N/A 0.08% 0.08% 991,864 996,596 939 2 0.08% 0.15 to <0.25 N/A N/A 0.21% 0.21% 257,288 254,900 532 2 0.17% 0.25 to <0.50 N/A N/A 0.40% 0.40% 172,231 164,335 720 3 0.32% 0.50 to <0.75 N/A N/A 0.73% 0.73% 108,217 102,849 938 8 0.57% 0.75 to <2.50 N/A N/A 1.52% 1.49% 199,574 185,959 2,972 152 1.26% 2.50 to <10.00 N/A N/A 3.91% 3.82% 117,260 106,401 5,320 281 3.99% 10.00 to <100.00 N/A N/A 19.36% 18.56% 55,299 51,064 11,710 621 18.96% 100.00 (Default) 100.00% 100.00% 8,401 8,690 Other Retail 0.00 to <0.15 N/A N/A - - - - - - - 0.15 to <0.25 N/A N/A 0.23% 0.23% 533 379 2 - 0.18% 0.25 to <0.50 N/A N/A 0.40% 0.40% 729 709 2 - 0.32% 0.50 to <0.75 N/A N/A 0.57% 0.59% 33,530 31,056 43 - 0.36% 0.75 to <2.50 N/A N/A 1.49% 1.44% 48,705 45,012 410 39 1.04% 2.50 to <10.00 N/A N/A 4.90% 6.25% 96,420 95,715 5,226 1,248 3.60% 10.00 to <100.00 N/A N/A 32.74% 24.02% 70,242 78,615 15,976 2,035 20.81% 100.00 (Default) 100.00% 100.00% 43,628 42,865 |
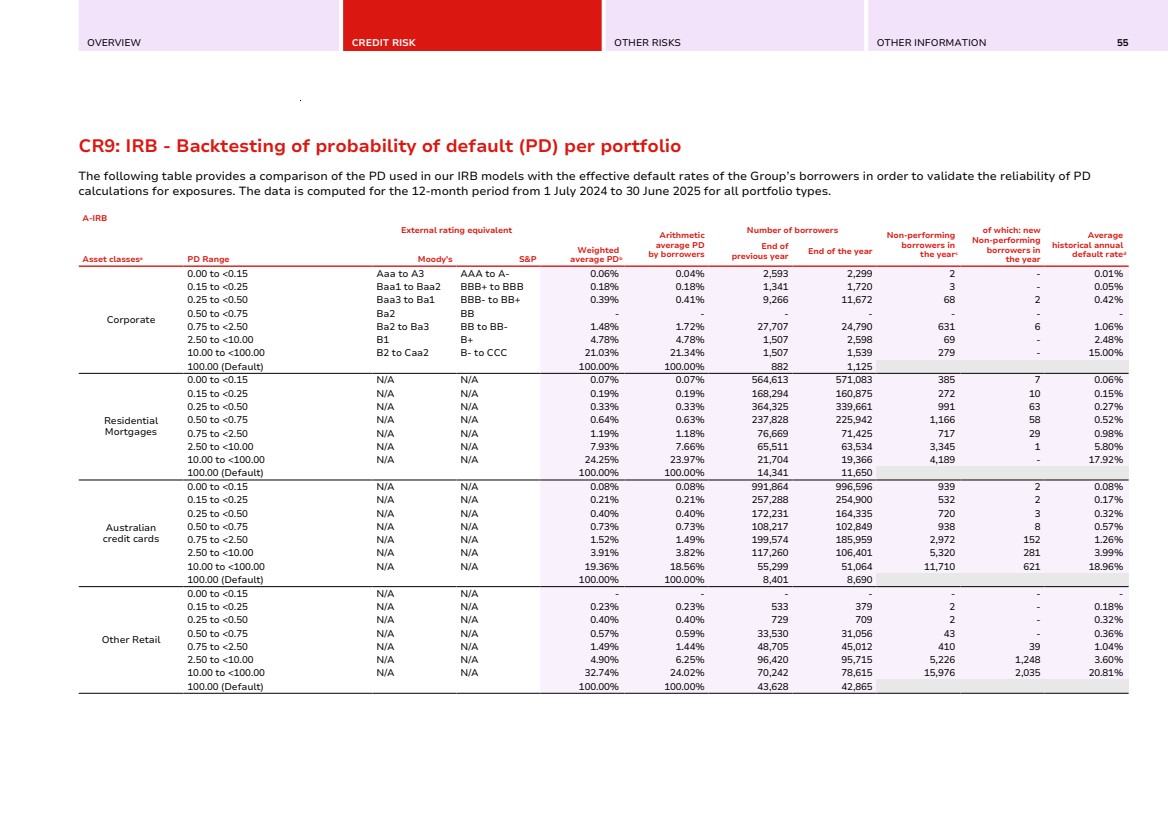
| 56 WESTPAC GROUP SEPTEMBER 2025 PILLAR 3 REPORT CREDIT RISK MANAGEMENT CR9: IRB - Backtesting of probability of default (PD) per portfolio (Continued) A-IRB Asset classesa PD Range External rating equivalent Weighted average PDb Arithmetic average PD by borrowers Number of borrowers Non-performing borrowers in the yearc of which: new Non-performing borrowers in the year Average historical annual default rated Moody's S&P End of previous year End of the year Small Business 0.00 to <0.15 N/A N/A - - - - - - - 0.15 to <0.25 N/A N/A - - - - - - - 0.25 to <0.50 N/A N/A 0.32% 0.32% 9,388 8,004 12 - 0.15% 0.50 to <0.75 N/A N/A 0.67% 0.67% 44,416 36,993 187 49 0.24% 0.75 to <2.50 N/A N/A 1.48% 1.47% 235,115 176,768 1,618 55 0.89% 2.50 to <10.00 N/A N/A 4.74% 4.67% 56,217 35,228 1,139 26 3.39% 10.00 to <100.00 N/A N/A 26.88% 31.22% 45,298 43,327 3,952 364 17.52% 100.00 (Default) 100.00% 100.00% 10,082 8,596 Specialised Lending 0.00 to <0.15 N/A N/A 0.09% 0.07% 4 6 - - - 0.15 to <0.25 N/A N/A 0.18% 0.18% 12 12 - - - 0.25 to <0.50 N/A N/A 0.36% 0.36% 24 27 - - - 0.50 to <0.75 N/A N/A - - - - - - - 0.75 to <2.50 N/A N/A 1.91% 1.87% 6 12 - - 1.05% 2.50 to <10.00 N/A N/A 4.78% 4.78% 3 3 - - - 10.00 to <100.00 N/A N/A 23.74% 23.74% 1 - - - 13.33% 100.00 (Default) 100.00% 100.00% 1 - New Zealand - Retail 0.00 to <0.15 N/A N/A 0.08% 0.08% 135,483 136,050 196 1 0.17% 0.15 to <0.25 N/A N/A - - - - - - - 0.25 to <0.50 N/A N/A 0.39% 0.32% 201,989 203,212 593 10 0.27% 0.50 to <0.75 N/A N/A 0.60% 0.58% 286,062 287,997 1,597 32 0.46% 0.75 to <2.50 N/A N/A 1.54% 1.61% 125,289 126,029 1,550 42 1.29% 2.50 to <10.00 N/A N/A 4.20% 5.28% 59,112 58,804 2,020 99 3.79% 10.00 to <100.00 N/A N/A 18.29% 17.82% 13,895 10,718 1,307 18 12.98% 100.00 (Default) 100.00% 100.00% 4,912 5,274 New Zealand - Non-Retail 0.00 to <0.15 Aaa to A3 AAA to A- 0.04% 0.11% 3,375 3,247 11 - 0.19% 0.15 to <0.25 Baa1 to Baa2 BBB+ to BBB 0.18% 0.18% 231 288 - - 0.10% 0.25 to <0.50 Baa3 to Ba1 BBB- to BB+ 0.37% 0.35% 12,657 12,317 64 - 0.33% 0.50 to <0.75 Ba2 BB - - - - - - - 0.75 to <2.50 Ba2 to Ba3 BB to BB- 1.43% 1.16% 45,607 43,606 389 7 0.61% 2.50 to <10.00 B1 B+ 4.75% 4.63% 2,959 2,720 116 2 3.20% 10.00 to <100.00 B2 to Caa2 B- to CCC 20.79% 11.04% 7,370 7,750 239 - 5.94% 100.00 (Default) 100.00% 100.00% 499 480 a. Proxies for Basel III non-retail asset classes have been developed for historical cohorts, to enable calculation of average historical annual default rate. b. Observation point is June 2024, tracking default performance from July 2024 to June 2025. PD estimate and EAD used for weighted average PD is as at June 2024. c. Defaulted borrowers in the year include: - performing borrowers as at June 2024 who default from July 2024 to June 2025; and - new borrowers not funded in June 2024 who default from July 2024 to June 2025 (new defaulted borrowers). d. Average historical default rate is calculated over 10 years. |
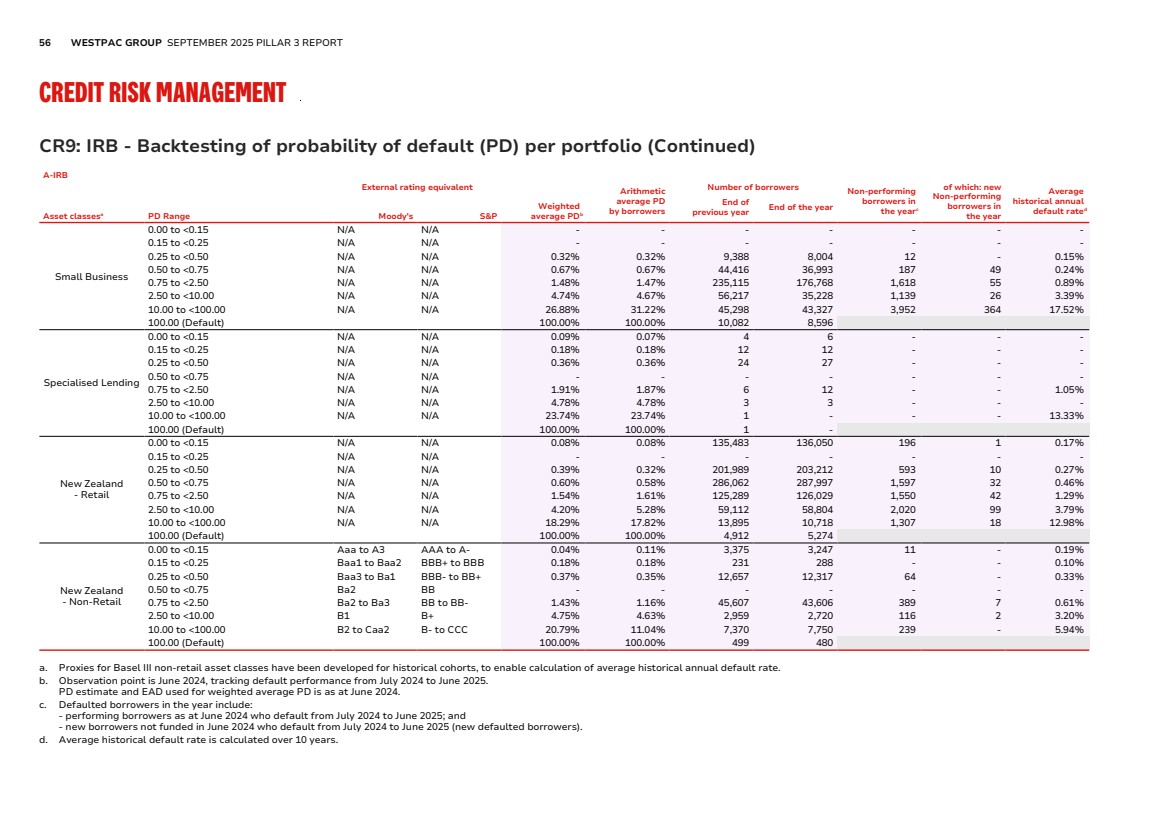
| OVERVIEW CREDIT RISK OTHER RISKS OTHER INFORMATION 57 CR9: IRB - Backtesting of probability of default (PD) per portfolio (Continued) F-IRB Asset classesa PD Range External rating equivalent Weighted average PDb Arithmetic average PD by borrowers Number of borrowers Non-performing borrowers in the yearc of which: new Non-performing borrowers in the year Average historical annual default rated Moody's S&P End of previous year End of the year Large Corporate 0.00 to <0.15 Aaa to A3 AAA to A- 0.07% 0.07% 285 284 - - - 0.15 to <0.25 Baa1 to Baa2 BBB+ to BBB 0.18% 0.18% 596 638 - - - 0.25 to <0.50 Baa3 to Ba1 BBB- to BB+ 0.30% 0.33% 801 720 - - 0.02% 0.50 to <0.75 Ba2 BB - - - - - - - 0.75 to <2.50 Ba2 to Ba3 BB to BB- 1.36% 1.46% 443 399 6 - 0.20% 2.50 to <10.00 B1 B+ 4.78% 4.78% 26 54 - - 0.51% 10.00 to <100.00 B2 to Caa2 B- to CCC 18.57% 17.93% 76 61 1 - 0.50% 100.00 (Default) 100.00% 100.00% 7 9 Sovereign 0.00 to <0.15 Aaa to A3 AAA to A- 0.01% 0.03% 460 421 - - - 0.15 to <0.25 Baa1 to Baa2 BBB+ to BBB 0.17% 0.18% 10 11 - - - 0.25 to <0.50 Baa3 to Ba1 BBB- to BB+ 0.29% 0.35% 29 7 - - - 0.50 to <0.75 Ba2 BB - - - - - - - 0.75 to <2.50 Ba2 to Ba3 BB to BB- 1.90% 2.30% 24 2 - - - 2.50 to <10.00 B1 B+ 4.78% 4.78% 5 52 - - - 10.00 to <100.00 B2 to Caa2 B- to CCC 23.74% 17.93% 2 2 - - 3.33% 100.00 (Default) 100.00% 100.00% - - Financial Institutions 0.00 to <0.15 Aaa to A3 AAA to A- 0.05% 0.05% 4,901 5,079 - - 0.01% 0.15 to <0.25 Baa1 to Baa2 BBB+ to BBB 0.17% 0.18% 461 505 - - - 0.25 to <0.50 Baa3 to Ba1 BBB- to BB+ 0.36% 0.37% 688 712 1 - 0.10% 0.50 to <0.75 Ba2 BB - - - - - - - 0.75 to <2.50 Ba2 to Ba3 BB to BB- 1.55% 1.81% 983 736 31 - 1.13% 2.50 to <10.00 B1 B+ 4.78% 4.78% 35 380 - - 1.15% 10.00 to <100.00 B2 to Caa2 B- to CCC 34.38% 23.97% 52 59 5 - 13.14% 100.00 (Default) 100.00% 100.00% 35 36 a. Proxies for Basel III non-retail asset classes have been developed for historical cohorts, to enable calculation of average historical annual default rate. b. Observation point is June 2024, tracking default performance from July 2024 to June 2025. PD estimate and EAD used for weighted average PD is as at June 2024. c. Defaulted borrowers in the year include: - performing borrowers as at June 2024 who default from July 2024 to June 2025; and - new borrowers not funded in June 2024 who default from July 2024 to June 2025 (new defaulted borrowers). d. Average historical default rate is calculated over 10 years. |
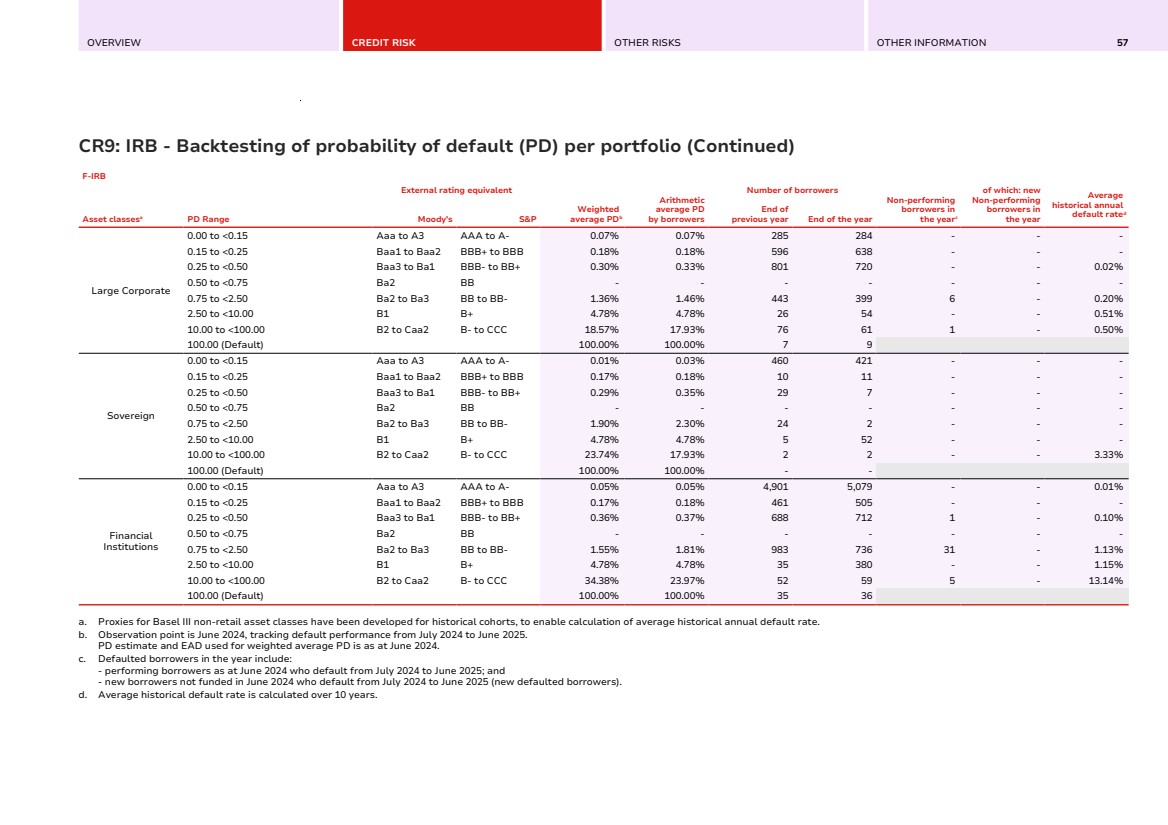
| 58 WESTPAC GROUP SEPTEMBER 2025 PILLAR 3 REPORT CREDIT RISK MANAGEMENT CR10: IRB - Specialised lending under the slotting approach CR10: IRB - Specialised lending under the slotting approach Slotting is an approach that is applied to financing for projects where the repayment is highly dependent on the performance of the underlying asset or collateral, and includes assets categorised as specialised lending. It uses specific rules for the calculation of RWAs, based upon an assessment of factors such as the financial strength of the counterparty. The table below provides an overview of exposure under this approach and associated credit metrics. $m Residual maturity Exposure amount Regulatory categories On-balance sheet amount Off-balance sheet amount Risk weight % PF OF Total RWA Expected losses Westpac (ex-RBNZ Regulated Entities) As at 30 September 2025 Strong Less than 2.5 years 1,328 732 70% 1,961 35 1,996 1,398 8 Equal to or more than 2.5 years 1,130 745 70% 1,745 27 1,772 1,240 7 Good Less than 2.5 years 538 292 90% 781 - 781 703 6 Equal to or more than 2.5 years 424 322 90% 716 - 716 644 6 Satisfactory 82 24 115% 93 - 93 107 3 Weak - - 250% - - - - - Default - - - - - - - - Total 3,502 2,115 - 5,296 62 5,358 4,092 30 As at 31 March 2025 Strong Less than 2.5 years 927 564 70% 1,389 85 1,474 1,032 6 Equal to or more than 2.5 years 1,486 1,582 70% 2,925 - 2,925 2,048 11 Good Less than 2.5 years 388 264 90% 600 - 600 540 5 Equal to or more than 2.5 years 307 232 90% 524 - 524 472 4 Satisfactory 90 25 115% 103 - 103 119 3 Weak - - 250% - - - - - Default - - - - - - - - Total 3,198 2,667 - 5,541 85 5,626 4,211 29 $m Residual maturity Exposure amount Regulatory categories On-balance sheet amount Off-balance sheet amount Risk weight % PF IPRE Total RWA Expected losses RBNZ Regulated Entities As at 30 September 2025 Strong Less than 2.5 years 4,268 544 70% 77 4,591 4,668 3,593 19 Equal to or more than 2.5 years 227 181 70% 108 212 320 246 1 Good Less than 2.5 years 2,169 371 90% 108 2,388 2,496 2,471 21 Equal to or more than 2.5 years 110 52 90% 49 102 151 150 1 Satisfactory 232 82 115% - 307 307 389 9 Weak 68 - 250% - 69 69 189 5 Default - - - - - - - - Total 7,074 1,230 - 342 7,669 8,011 7,038 56 As at 31 March 2025 Strong Less than 2.5 years 3,928 624 70% 1 4,551 4,552 3,504 18 Equal to or more than 2.5 years 181 122 70% 96 205 301 231 1 Good Less than 2.5 years 2,270 428 90% 140 2,556 2,696 2,670 23 Equal to or more than 2.5 years 96 162 90% 50 202 252 250 2 Satisfactory 241 19 115% - 260 260 328 7 Weak 75 - 250% - 75 75 208 6 Default 3 - - - 3 3 - 1 Total 6,794 1,355 - 287 7,852 8,139 7,191 58 |
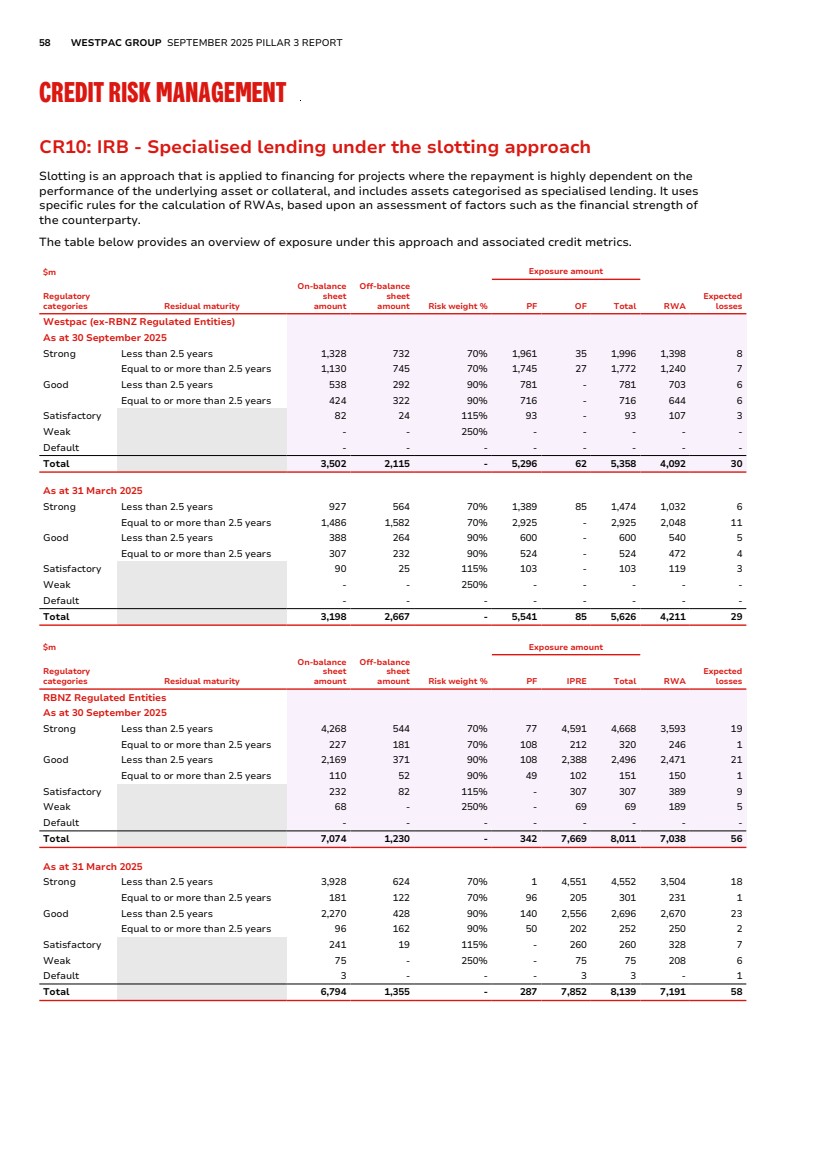
| OVERVIEW CREDIT RISK OTHER RISKS OTHER INFORMATION 59 COUNTERPARTY CREDIT RISK CCRA: Qualitative disclosure related to CCR Counterparty Credit Risk CCRA: Qualitative disclosure related to CCR Approach Westpac’s process for managing counterparty credit risk is based on its assessment of the potential future credit risk it is exposed to when dealing in derivatives products and securities financial transactions. Westpac quantified this risk through a daily simulation of future market price and rate shocks and converts the effect of these shocks on the mark-to-market value of Westpac’s positions to a credit exposure using Westpac’s Derivative Risk Equivalent (DRE) methodology. Exposures are assessed against pre-settlement risk limits that are set at the counterparty level. Limit excesses are reported to credit management and actioned within specified timeframes. Structure and organisation Financial Markets (First Line of Defence) and Westpac Institutional Bank Credit (WIB Credit, Second Line of Defence) work collaboratively, providing insight, oversight and challenge of Financial Market’s credit exposure. WIB Credit sets counterparty credit risk appetite, internal ratings, and credit limits for the counterparties with which Financial Markets transacts. Transactions generating credit exposure outside of pre-defined credit appetite and limits require approval by WIB Credit. Risk framework Description Market related credit risk There are two components to the regulatory capital requirements for credit risk arising from derivative products: • Capital to absorb losses arising from the default of derivative counterparties; and • Capital to absorb losses arising from mark-to-market valuation movements resulting from changes in the credit quality of derivative counterparties. These valuation movements are referred to as credit valuation adjustments (CVA) and this risk is sometimes labelled as CVA risk. Risk mitigation Mitigation is achieved in a number of ways: • The limit system monitors for excesses of the pre-defined limits, with any excesses being notified to authorised credit officers; • Westpac has netting agreements with counterparties to allow the exposure across a portfolio of trades with the same counterparty to be netted; • Westpac has collateral agreements with its largest counterparties. The market value of the counterparty’s portfolio is used to recalculate the credit position at each end of day, with collateral being called for when certain pre-set limits are met or exceeded. Westpac exchanges Initial Margin with eligible counterparties for eligible products as protection against potential future exposure to changes in market value; • Westpac has initial margin agreements with qualifying counterparties subject to relevant international regulations. The exchange of initial margin for eligible products covers the potential future exposure that could arise from changes in the market value of derivative transactions over the close-out period in the event of a counterparty default; • Credit derivatives are used to mitigate credit exposure against certain counterparties; and • Regular marking to market and settling of the foreign exchange components of foreign exchange reset contracts. Counterparty derivative exposures and limits The risk management methodology for counterparty derivatives exposures is similar to the credit methodology for transaction-managed loans. The main difference is in the estimation of the exposure for derivatives which is based on the DRE methodology. DRE is a credit exposure measure for derivative trades which is calibrated to a ‘loan-equivalent’ exposure. Counterparty credit limits are approved on an uncommitted and unadvised basis by authorised credit officers. This follows an evaluation of each counterparty’s credit worthiness and establishing an agreed credit risk appetite for the nature and extent of prospective business. Wrong-way risk exposures Westpac defines wrong-way risk as exposure to a counterparty which is adversely correlated with the credit quality of that counterparty. With respect to credit derivatives, wrong-way risk refers to credit protection purchased from a counterparty highly correlated to the reference obligation. Wrong-way risk exposures using credit derivatives are controlled by only buying protection from highly rated counterparties. These transactions are assessed by an authorised credit officer who has the right to decline any transaction where they feel there is an unacceptably high correlation between the ability to perform under the trade and the performance of the underlying counterparty. Consequences of a downgrade in Westpac’s credit rating A downgrade in Westpac’s credit rating can have an impact on Westpac’s collateral agreements. Where an outright threshold and minimum transfer amount are agreed, there will not be any impact on the amount of collateral posted by Westpac in the event of a credit rating downgrade. Where the threshold and minimum transfer amount are tiered according to credit rating, the impact of Westpac being downgraded below its current credit rating would be: for a one notch downgrade, postings of $4 million, while for a two notch downgrade, postings would be $6 milliona . a. Credit rating downgrade postings are cumulative. |
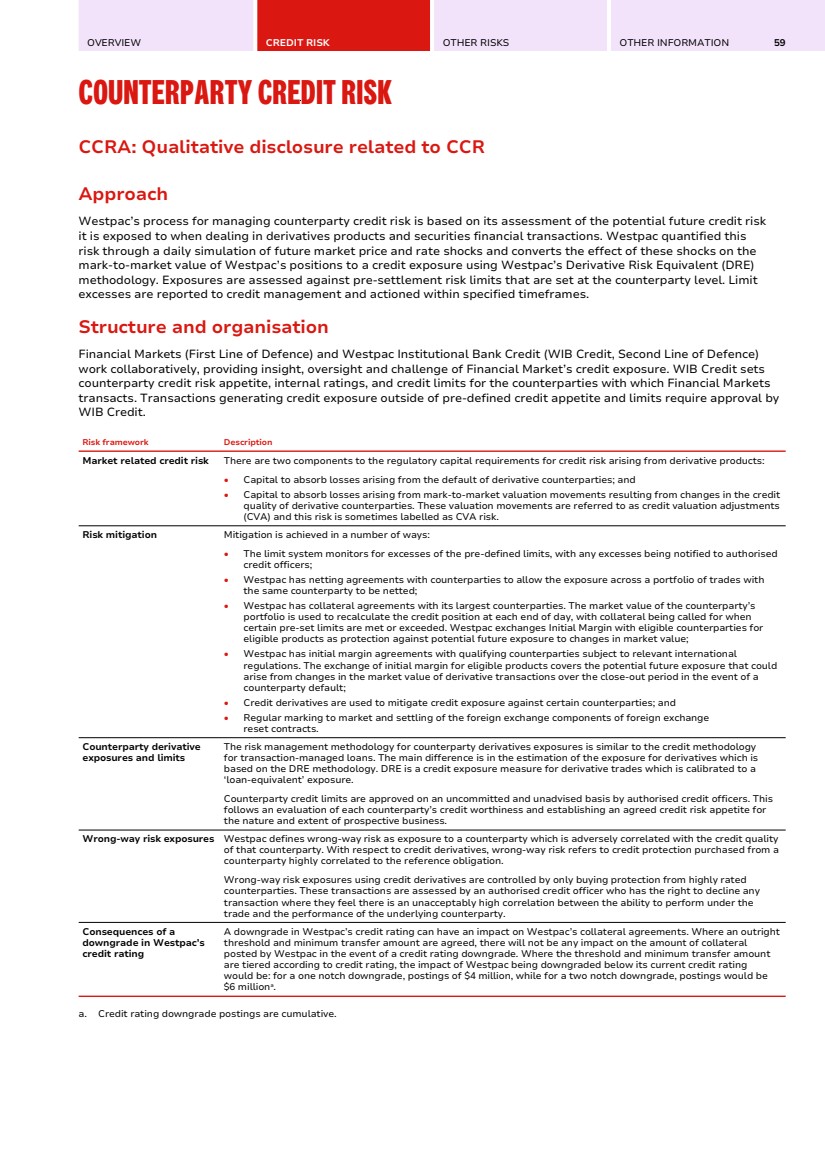
| 60 WESTPAC GROUP SEPTEMBER 2025 PILLAR 3 REPORT COUNTERPARTY CREDIT RISK The following CCR tables present the counterparty credit risk for Australian exposures only as all other jurisdictions are immaterial and aggregates to $713 million of RWA as at 30 September 2025. Counterparty credit risk attached to New Zealand regulated exposures are included and reported in the RBNZ regulated entities asset class in credit risk disclosures. CCR1: Analysis of CCR exposures by approach The table below presents the counterparty credit risk exposures by approach. This table excludes exposures to central counterparties. Exposures to central counterparties are disclosed in table CCR8. $m Replacement cost Potential future exposure Effective EPE Alpha used for computing regulatory EAD EAD post-CRM RWA As at 30 September 2025 1 SA-CCR (for derivatives) 5,035 15,446 1.4 28,591 7,904 2 Internal Model Method (for derivatives and SFTs) - - - - 3 Simple Approach for credit risk mitigation (for SFTs) - - 4 Comprehensive Approach for credit risk mitigation (for SFTs) 4,052 923 5 Value-at-risk (VaR) for SFTs - - 6 Total 8,827 As at 31 March 2025a 1 SA-CCR (for derivatives) 6,042 14,775 1.4 29,550 7,963 2 Internal Model Method (for derivatives and SFTs) - - - - 3 Simple Approach for credit risk mitigation (for SFTs) - - 4 Comprehensive Approach for credit risk mitigation (for SFTs) 2,955 724 5 Value-at-risk (VaR) for SFTs - - 6 Total 8,687 a. Comparatives have been revised following an uplift in data quality in the current period. |
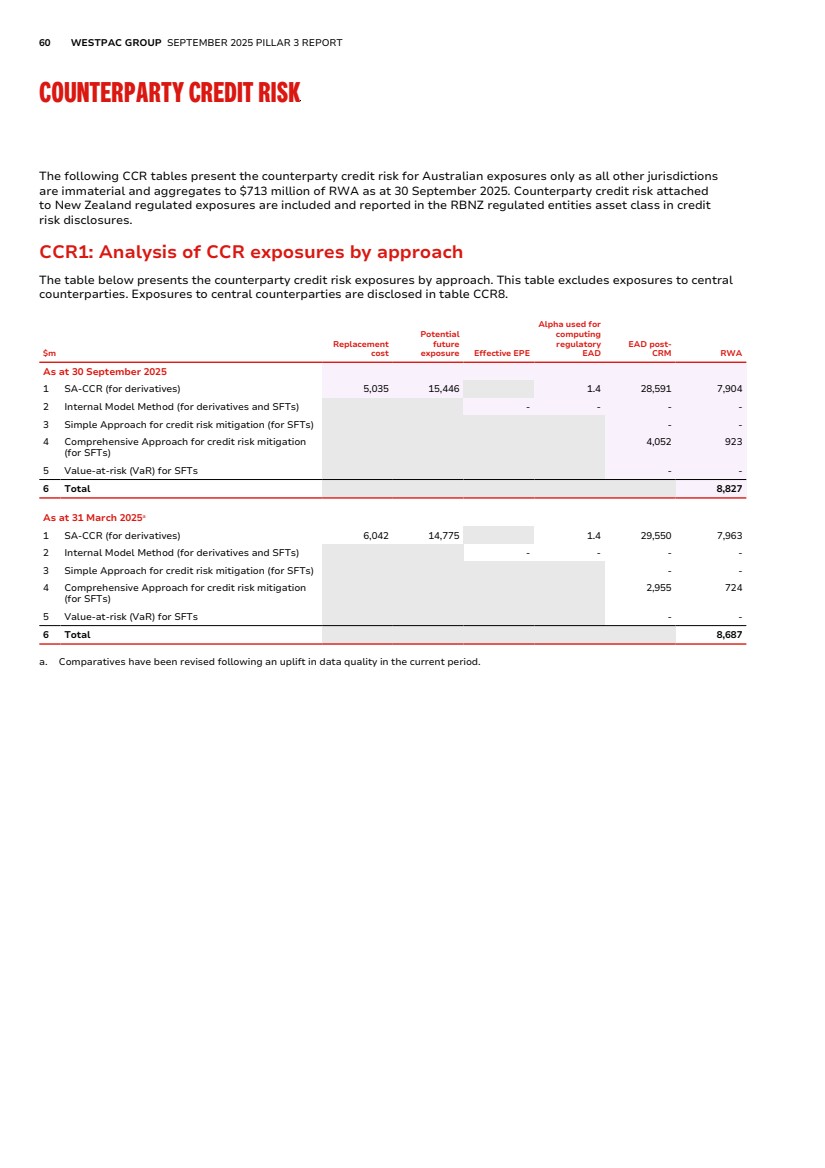
| OVERVIEW CREDIT RISK OTHER RISKS OTHER INFORMATION 61 CCR4: IRB - CCR exposures by portfolio and PD scale CCR4: IRB - CCR exposures by portfolio and PD scale The following table provides information on counterparty credit risk subject to the IRB approach by asset classes and PD scale. A-IRB Asset classes PD scale EAD post-CRM ($m) Average PD (%) Number of borrowers Average LGD (%) Average maturity (years) RWA ($m) RWA density (%)a As at 30 September 2025 Corporateb 0.00 to <0.15 2,274 0.06% 375 48% 1.8 469 21% 0.15 to <0.25 1,126 0.18% 195 44% 2.8 542 48% 0.25 to <0.50 970 0.35% 389 50% 2.0 619 64% 0.50 to <0.75 - - - - - - - 0.75 to <2.50 247 1.36% 226 43% 1.2 221 90% 2.50 to <10.00 79 4.78% 247 50% 1.1 123 155% 10.00 to <100.00 9 23.47% 30 53% 1.0 25 288% 100.00 (Default) - 100.00% 6 50% 1.3 1 688% Total Corporate 4,705 0.34% 1,468 47% 2.0 2,000 43% Total subject to A-IRB approach 4,705 0.34% 1,468 47% 2.0 2,000 43% As at 31 March 2025 Corporateb 0.00 to <0.15 3,302 0.06% 320 49% 1.5 595 18% 0.15 to <0.25 950 0.18% 152 46% 2.7 468 49% 0.25 to <0.50 708 0.39% 252 54% 2.2 538 76% 0.50 to <0.75 - - - - - - - 0.75 to <2.50 216 1.49% 96 45% 1.2 206 95% 2.50 to <10.00 66 4.78% 379 50% 1.4 103 156% 10.00 to <100.00 9 32.36% 25 66% 1.0 34 379% 100.00 (Default) - - 3 - - 1 - Total Corporate 5,251 0.30% 1,227 49% 1.8 1,945 37% Total subject to A-IRB approach 5,251 0.30% 1,227 49% 1.8 1,945 37% a. RWA density is calculated based on unrounded numbers. b. To facilitate standardisation of industry presentation, the sub asset classes of SME Corporate and Property Finance have been aggregated to Corporate. |
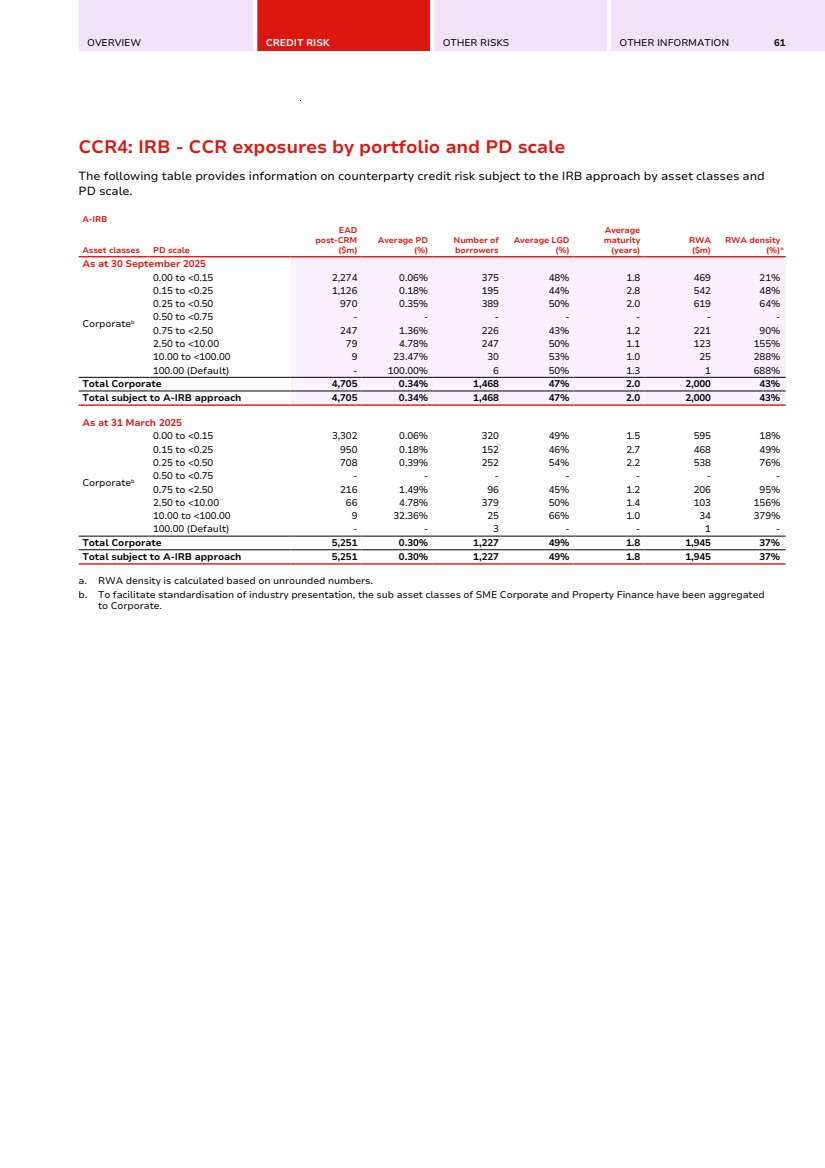
| 62 WESTPAC GROUP SEPTEMBER 2025 PILLAR 3 REPORT COUNTERPARTY CREDIT RISK CCR4: IRB - CCR exposures by portfolio and PD scale (Continued) F-IRB Asset classes PD scale EAD post-CRM ($m) Average PD (%) Number of borrowers Average LGD (%) Average maturity (years) RWA ($m) RWA density (%)a As at 30 September 2025 Large Corporate 0.00 to <0.15 1,492 0.07% 71 45% 2.5 360 24% 0.15 to <0.25 1,228 0.18% 127 44% 2.9 545 44% 0.25 to <0.50 330 0.29% 75 50% 2.5 208 63% 0.50 to <0.75 - - - - - - - 0.75 to <2.50 91 1.25% 30 64% 1.0 112 122% 2.50 to <10.00 - 4.78% 2 50% 1.0 - 158% 10.00 to <100.00 5 16.68% 6 50% 1.0 13 247% 100.00 (Default) - - - - - - - Total Large Corporate 3,146 0.20% 311 46% 2.6 1,238 39% Sovereign 0.00 to <0.15 3,465 0.02% 76 31% 2.0 170 5% 0.15 to <0.25 59 0.17% 4 50% 0.2 14 24% 0.25 to <0.50 - 0.47% 2 50% 1.0 - 62% 0.50 to <0.75 - - - - - - - 0.75 to <2.50 - 0.96% 1 50% 1.0 - 88% 2.50 to <10.00 1 4.78% 2 50% 1.2 1 162% 10.00 to <100.00 - - - - - - - 100.00 (Default) - - - - - - - Total Sovereign 3,525 0.02% 85 32% 2.0 185 5% Financial Institutions 0.00 to <0.15 19,331 0.05% 1,769 50% 1.2 4,104 21% 0.15 to <0.25 750 0.17% 191 50% 1.2 334 45% 0.25 to <0.50 666 0.32% 143 63% 0.8 504 76% 0.50 to <0.75 - - - - - - - 0.75 to <2.50 26 1.26% 6 64% 1.0 40 150% 2.50 to <10.00 47 4.78% 107 50% 1.1 90 191% 10.00 to <100.00 2 23.74% 5 50% 1.0 6 318% 100.00 (Default) - - - - - - - Total Financial Institutions 20,822 0.08% 2,221 51% 1.2 5,078 24% Total subject to F-IRB approach 27,493 0.09% 2,617 48% 1.4 6,501 24% As at 31 March 2025 Large Corporate 0.00 to <0.15 1,462 0.06% 67 47% 2.3 349 24% 0.15 to <0.25 1,320 0.18% 123 45% 2.7 591 45% 0.25 to <0.50 586 0.28% 82 50% 1.9 324 55% 0.50 to <0.75 - - - - - - - 0.75 to <2.50 73 1.53% 29 50% 1.0 76 104% 2.50 to <10.00 1 4.78% 5 50% 1.0 1 158% 10.00 to <100.00 7 12.63% 4 50% 1.1 16 234% 100.00 (Default) - - - - - - - Total Large Corporate 3,449 0.20% 310 47% 2.4 1,357 39% Sovereign 0.00 to <0.15 3,625 0.02% 76 31% 1.8 136 4% 0.15 to <0.25 36 0.17% 4 50% 0.3 9 25% 0.25 to <0.50 1 0.41% 2 50% 1.2 1 59% 0.50 to <0.75 - - - - - - - 0.75 to <2.50 - - - - - - - 2.50 to <10.00 - - - - - - - 10.00 to <100.00 - - - - - - - 100.00 (Default) - - - - - - - Total Sovereign 3,662 0.02% 82 31% 1.8 146 4% Financial Institutionsb 0.00 to <0.15 18,090 0.05% 1,803 50% 1.2 4,024 22% 0.15 to <0.25 1,044 0.17% 172 50% 1.0 450 43% 0.25 to <0.50 454 0.31% 123 66% 0.8 350 77% 0.50 to <0.75 - - - - - - - 0.75 to <2.50 29 1.12% 4 57% 1.0 35 120% 2.50 to <10.00 - 4.78% 2 50% 1.0 - 190% 10.00 to <100.00 - - - - - - - 100.00 (Default) - - - - - - - Total Financial Institutions 19,617 0.07% 2,104 51% 1.2 4,859 24% Total subject to F-IRB approach 26,728 0.08% 2,496 47% 1.4 6,362 23% a. RWA density is calculated based on unrounded numbers. b. Comparatives have been revised following an uplift in data quality in the current period. |
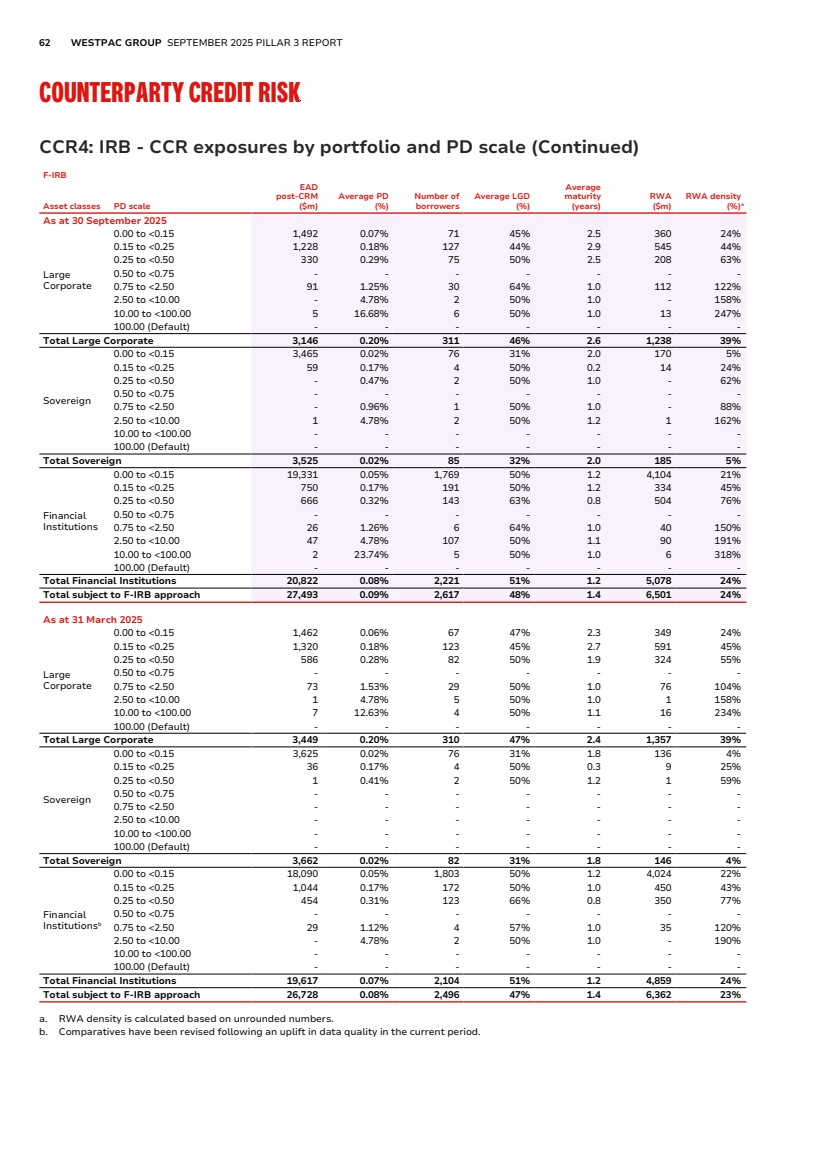
| OVERVIEW CREDIT RISK OTHER RISKS OTHER INFORMATION 63 CCR5: Composition of collateral for CCR exposures CCR5: Composition of collateral for CCR exposures The following table provides an overview of the type of collateral used in derivatives and securities financing transactions (SFTs). $m Collateral used in derivative transactions Collateral used in SFTs Fair value of collateral received Fair value of posted collateral Fair value of collateral received Fair value of Segregated Unsegregated Segregated Unsegregated posted collateral As at 30 September 2025 Cash - 2,676 - 7,577 27,698 49,626 Debt - 4 1,944 2,271 46,706 26,225 Total - 2,680 1,944 9,848 74,404 75,851 As at 31 March 2025 Cash - 3,118 - 9,050 31,307 25,387 Debt - 345 1,830 29 23,655 30,195 Total - 3,463 1,830 9,079 54,962 55,582 CCR6: Credit derivatives exposures CCR6: Credit derivatives exposures The table below provides information on the extent of Westpac's exposure to credit derivative transactions. $m 30 September 2025 31 March 2025 Protection bought Protection sold Protection bought Protection sold Notionals Single-name credit default swaps - - - - Index credit default swaps 18,074 15,627 8,956 6,491 Total return swaps - - - - Credit options - - - - Other credit derivatives - - - - Total notionals 18,074 15,627 8,956 6,491 Positive fair value (asset) - 353 - 123 Negative fair value (liability) (407) - (169) - |
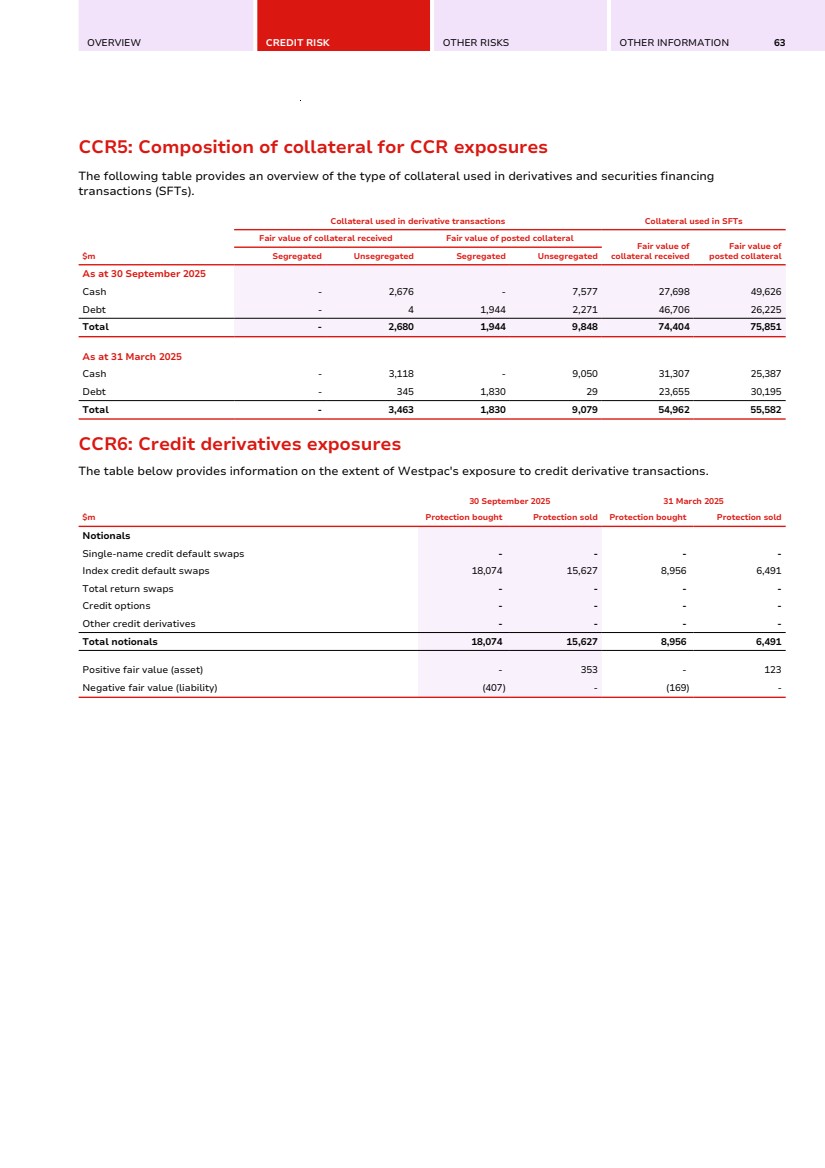
| 64 WESTPAC GROUP SEPTEMBER 2025 PILLAR 3 REPORT COUNTERPARTY CREDIT RISK CCR8: Exposure to central counterparties CCR8: Exposure to central counterparties This table provides an overview of Westpac's exposure to central counterparties. $m 30 September 2025 31 March 2025a EAD (post-CRM) RWA EAD (post-CRM) RWA 1 Exposures to qualifying central counterparties (‘QCCPs’) (total) 5,837 233 6,228 209 2 Exposures for trades at QCCPs (excluding initial margin and default fund contributions); of which 3,657 73 3,842 76 3 (i) OTC derivatives 3,657 73 3,842 76 4 (ii) Exchange-traded derivatives - - - - 5 (iii) Securities financing transactions - - - - 6 (iv) Netting sets where cross-product netting has been approved - - - - 7 Segregated initial margin 1,944 1,830 8 Non-segregated initial margin 126 39 465 46 9 Pre-funded default fund contributions 110 121 91 87 10 Unfunded default fund contributions - - - - 11 Exposures to non-QCCPs (total) - - - - 12 Exposures for trades at non-QCCPs (excluding initial margin and default fund contributions); of which - - - - 13 (i) OTC derivatives - - - - 14 (ii) Exchange-traded derivatives - - - - 15 (iii) Securities financing transactions - - - - 16 (iv) Netting sets where cross-product netting has been approved - - - - 17 Segregated initial margin - - 18 Non-segregated initial margin - - - - 19 Pre-funded default fund contributions - - - - 20 Unfunded default fund contributions - - - - a. Comparatives have been revised following an uplift in data quality in the current period. |
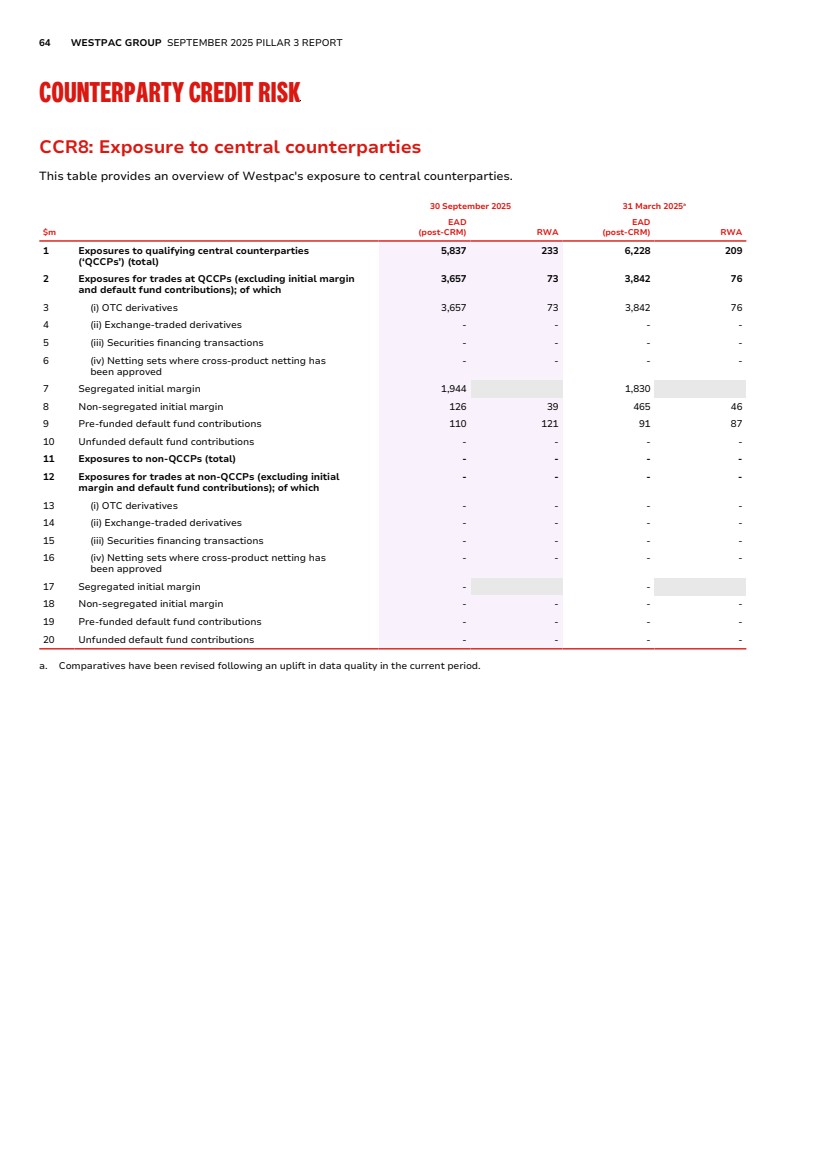
| OVERVIEW CREDIT RISK OTHER RISKS OTHER INFORMATION 65 CREDIT VALUATION ADJUSTMENT RISK CVAA: General qualitative disclosure requirements related to CVA Credit Valuation Adjustment Risk CVAA: General qualitative disclosure requirements related to CVA Risk framework Description Various Frameworks CVA risk is centrally managed within Financial Markets and governed by various policies, standards, and frameworks such as: • The Market Risk Policy and Statement sets requirements to identify and measure the risk associated with CVA and any hedges (both credit and market risk hedges) including daily independent monitoring of risk and reporting requirements to market risk committees comprising of senior 1st and 2nd line management. • The XVA Framework establishes how CVA is risk managed and reported including independent processes that monitor the P&L effectiveness of hedges and correlation analysis. • The Credit Risk Management Framework sets the requirements to manage our credit risk appetite towards counterparty credit risk. Capital Requirements The bank currently uses the Standardised Approach for Counterparty Credit Risk (SA-CCR) methodology per APS 180 to calculate the CVA RWA currently at $2,510 million. |
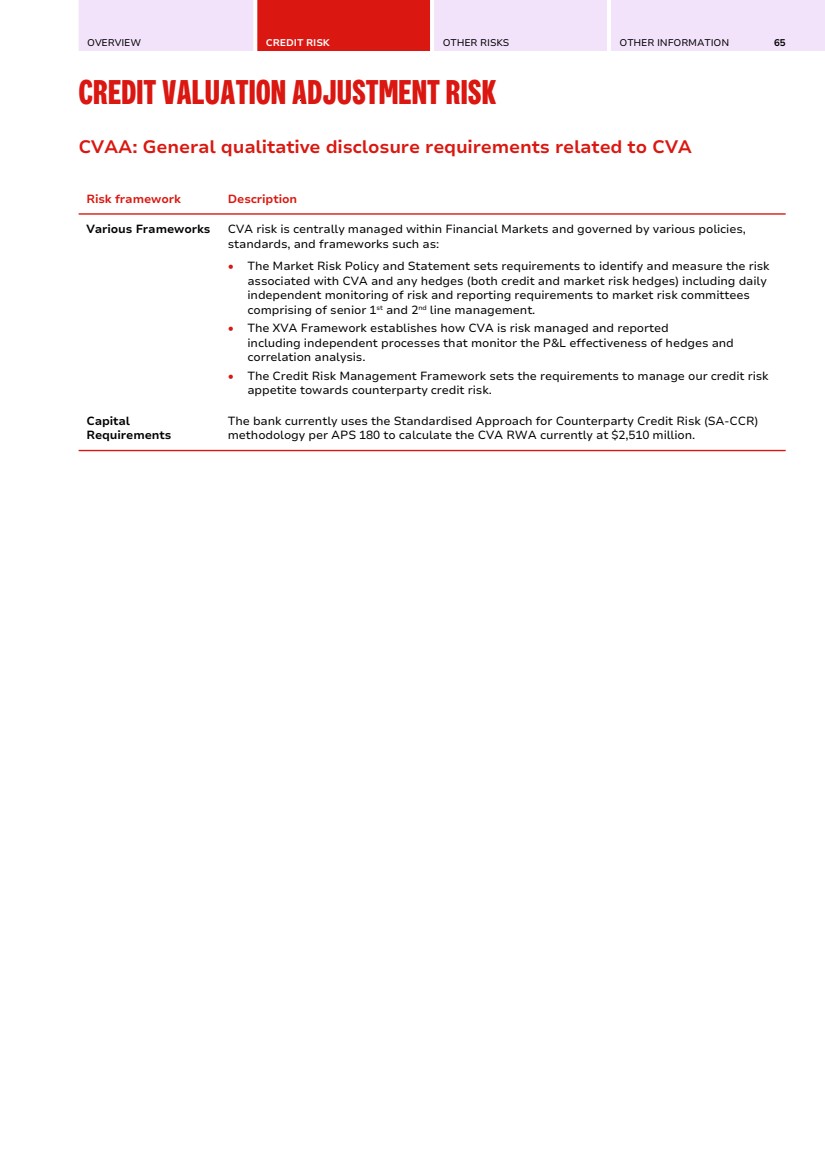
| 66 WESTPAC GROUP SEPTEMBER 2025 PILLAR 3 REPORT SECURITISATION SECA: Qualitative disclosure requirements related to securitisation exposures Securitisation SECA: Qualitative disclosure requirements related to securitisation exposures A securitisation is a financial structure where the cash flow from a pool of assets is used to service obligations to at least two different tranches or classes of creditors (typically holders of debt securities), with each class or tranche reflecting a different degree of credit risk (i.e. one class of creditors is entitled to receive payments from the pool before another class of creditors). Securitisation transactions are generally grouped into two broad categories: • Traditional or true sale securitisations, which involve the transfer of ownership of the underlying asset pool to a third party; and • Synthetic transactions, where the ownership of the underlying asset pool remains with the originator and only the credit risk of the pool is transferred to a third party, using credit derivatives or guarantees. In line with current APRA requirements, Westpac does not currently undertake any synthetic securitisations. Approach Westpac’s securitisation activities range from a seller of its own assets, to an investor in third-party transactions and includes the arranging of transactions, the provision of securitisation services and the provision of funding for clients, including clients requiring access to capital markets. Securitisation activity follows Westpac’s credit policies and approval processes. The regulatory capital treatment of securitisation exposures is measured in accordance with APS 120 other than the securitisation exposures of an overseas banking subsidiary that is prudentially regulated by a prescribed authority. Outside of Australia, Westpac has securitisation exposures in Westpac New Zealand Limited. For these exposures, Westpac calculates risk-weighted assets using the Reserve Bank of New Zealand’s prudential rules. These exposures are separately included in the RBNZ Regulated Entities line item. Westpac makes deductions from CET1 capital that are required under APS 120. APS 120 also specifies that securitisation exposures held in the trading book1 are subject to the requirements of Prudential Standard APS 116 Capital Adequacy: Market Risk. Under APS 120 the approaches employed include the External Ratings Based Approach (ERBA) which is largely based on external credit ratings and the Supervisory Formula Approach (SFA) for unrated exposures. Westpac’s role in the securitisation process • Securitisation of Westpac originated assets Securitisation is used by Westpac to manage funding and liquidity and may also be used for capital management. It allows Westpac the ability to use a pool of assets to increase Westpac's wholesale funding capacity. Westpac may provide arm's length facilities and services to the securitisation vehicles. These typically include the provision of financing, redraw facilities and derivative contracts. Westpac has entered into self securitisation transactions for funding and liquidity purposes. These are the same as traditional securitisations, except that Westpac is the holder of all classes of notes issued (other than where senior notes have been pledged as eligible collateral with the RBA). These self securitisations do not change risk weighted assets. No securitisation transactions for Westpac originated assets are classified as re-securitisation exposure which are deemed to mean a securitisation exposure in which at least one of the underlying exposure in the pool is a securitisation exposure. • Provision of securitisation services, including funding and arranging assets backed bond issues Securitisation facilities provided by Westpac may include re-securitisation exposures. Westpac also buys and sells securitisation exposure in the secondary market to facilitate portfolio management activity by its institutional customers who hold asset backed bonds. 1. Trading book activity represents positions in financial instruments, including derivative products and other off-balance sheet instruments, that are held either with trading intent or to hedge other elements of the trading book. |
| OVERVIEW CREDIT RISK OTHER RISKS OTHER INFORMATION 67 SECA: Qualitative disclosure requirements related to securitisation exposures (Continued) Risk Management Securitisation activities expose Westpac to credit risk, market risk, liquidity risk, operational risk. These risks are managed in accordance with Westpac's risk management frameworks and policies. • Credit risk - Credit risk assessments are undertaken on all securitisation transactions in accordance with Westpac's credit policies. Exposures and limits are captured and monitored in key source systems. • Operational risk - the review process includes the identification of risks, controls and key performance indicators in relation to the activities and services provided by Westpac. • Market risk - is captured as part of Westpac's traded and non-traded market risk reporting and limit management framework. • Liquidity risk - is managed under the Liquidity Risk Management Framework and is integrated into routine reporting for capital and liquidity positions, net interest margin analysis, balance sheet forecasting and funding scenario testing. The annual funding plan incorporates consideration of overall liquidity risk limits and the securitisation of Westpac originated assets. • Westpac does not have any exposures which are classified as resecuritisation exposures. Accounting policies for securitisation activities • Securitisation of Westpac originated assets - The assets sold by Westpac to a securitisation trust remain on Westpac’s balance sheet for accounting purposes. • Third party securitisations - Assets sold under securitisations are treated as loans. Liquidity and redraw facilities are treated as commitments to provide finance. Fee and margin income from these services are recognised on an accrual basis. • Portfolio investment and liquidity management - If a security has been designated on initial recognition at fair value, the exposure will be measured at fair value through the Income Statement. All other investments in securitisation exposures will be classified and measured at fair value through Other Comprehensive Income (FVOCI) (within the debt securities at FVOCI reserve). • For trading - Trading securities are measured at fair value through the Income Statement. Interest is recognised on an accrual basis with amortisation of any premium/discount. Westpac does not have any entities that meets the following criteria: • Special purpose entities (SPEs) where the bank acts as sponsor; • Affiliated entities that Westpac manages or advises and invests either in the securitisation exposures that the bank has securitised or in SPEs that the bank sponsors; or • Entities to which the Westpac provide implicit support. |
| 68 WESTPAC GROUP SEPTEMBER 2025 PILLAR 3 REPORT SECURITISATION SEC1: Securitisation exposures in the banking book SEC1: Securitisation exposures in the banking book The table below summarises Westpac's securitisation exposure by activity type. Bank acts as originator Bank acts as sponsor Banks acts as investor $m Traditional Synthetic Sub-total Traditional Synthetic Sub-total Traditional Synthetic Sub-total As at 30 September 2025 1 Retail (total) 130,916 - 130,916 - - - 30,642 - 30,642 2 of which: residential mortgage 130,916 - 130,916 - - - 28,966 - 28,966 3 of which: credit card - - - - - - 263 - 263 4 of which: other retail exposures - - - - - - 1,413 - 1,413 5 of which: re-securitisation - - - - - - - - - 6 Wholesale (total) - - - - - - 12,579 - 12,579 7 of which: loans to corporates - - - - - - 310 - 310 8 of which: commercial mortgage - - - - - - 1,251 - 1,251 9 of which: lease and receivables - - - - - - 1,524 - 1,524 10 of which: other wholesale - - - - - - 9,494 - 9,494 11 of which: re-securitisation - - - - - - - - - As at 31 March 2025 1 Retail (total) 110,181 - 110,181 - - - 27,986 - 27,986 2 of which: residential mortgage 110,181 - 110,181 - - - 26,383 - 26,383 3 of which: credit card - - - - - - 222 - 222 4 of which: other retail exposures - - - - - - 1,381 - 1,381 5 of which: re-securitisation - - - - - - - - - 6 Wholesale (total) - - - - - - 13,019 - 13,019 7 of which: loans to corporates - - - - - - 325 - 325 8 of which: commercial mortgage - - - - - - 1,372 - 1,372 9 of which: lease and receivables - - - - - - 1,566 - 1,566 10 of which: other wholesale - - - - - - 9,756 - 9,756 11 of which: re-securitisation - - - - - - - - - |
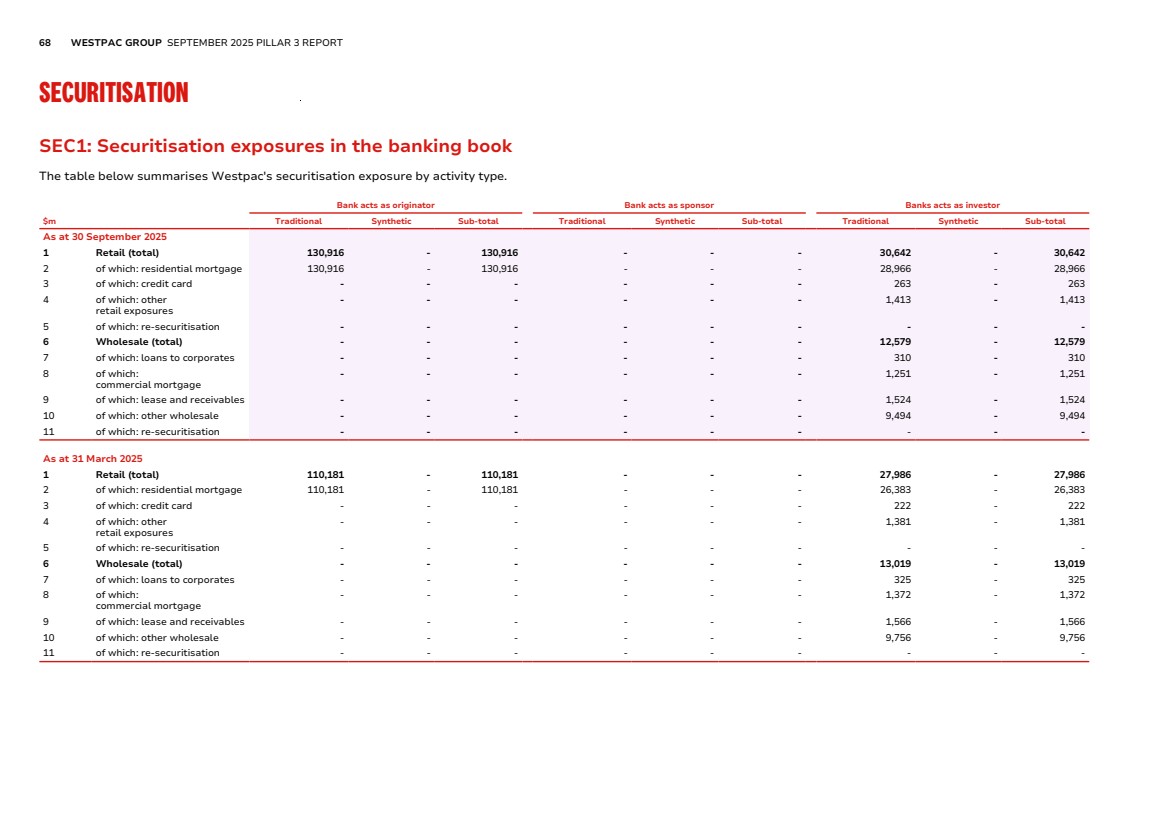
| OVERVIEW CREDIT RISK OTHER RISKS OTHER INFORMATION 69 SEC2: Securitisation exposures in the trading book SEC2: Securitisation exposures in the trading book The table below disclose our Australian securitisation exposure only as required by APRA. Bank acts as originator Bank acts as sponsor Banks acts as investor $m Traditional Synthetic Sub-total Traditional Synthetic Sub-total Traditional Synthetic Sub-total As at 30 September 2025 1 Retail (total) - - - - - - 696 - 696 2 of which: residential mortgage - - - - - - 683 - 683 3 of which: credit card - - - - - - - - - 4 of which: other retail exposures - - - - - - 13 - 13 5 of which: re-securitisation - - - - - - - - - 6 Wholesale (total) - - - - - - 68 - 68 7 of which: to corporates - - - - - - - - - 8 of which: commercial mortgage - - - - - - 51 - 51 9 of which: lease and receivables - - - - - - 1 - 1 10 of which: other wholesale - - - - - - 16 - 16 11 of which: re-securitisation - - - - - - - - - As at 31 March 2025 1 Retail (total) - - - - - - 400 - 400 2 of which: residential mortgage - - - - - - 400 - 400 3 of which: credit card - - - - - - - - - 4 of which: other retail exposures - - - - - - - - - 5 of which: re-securitisation - - - - - - - - - 6 Wholesale (total) - - - - - - 33 - 33 7 of which: to corporates - - - - - - - - - 8 of which: commercial mortgage - - - - - - 33 - 33 9 of which: lease and receivables - - - - - - - - - 10 of which: other wholesale - - - - - - - - - 11 of which: re-securitisation - - - - - - - - - |
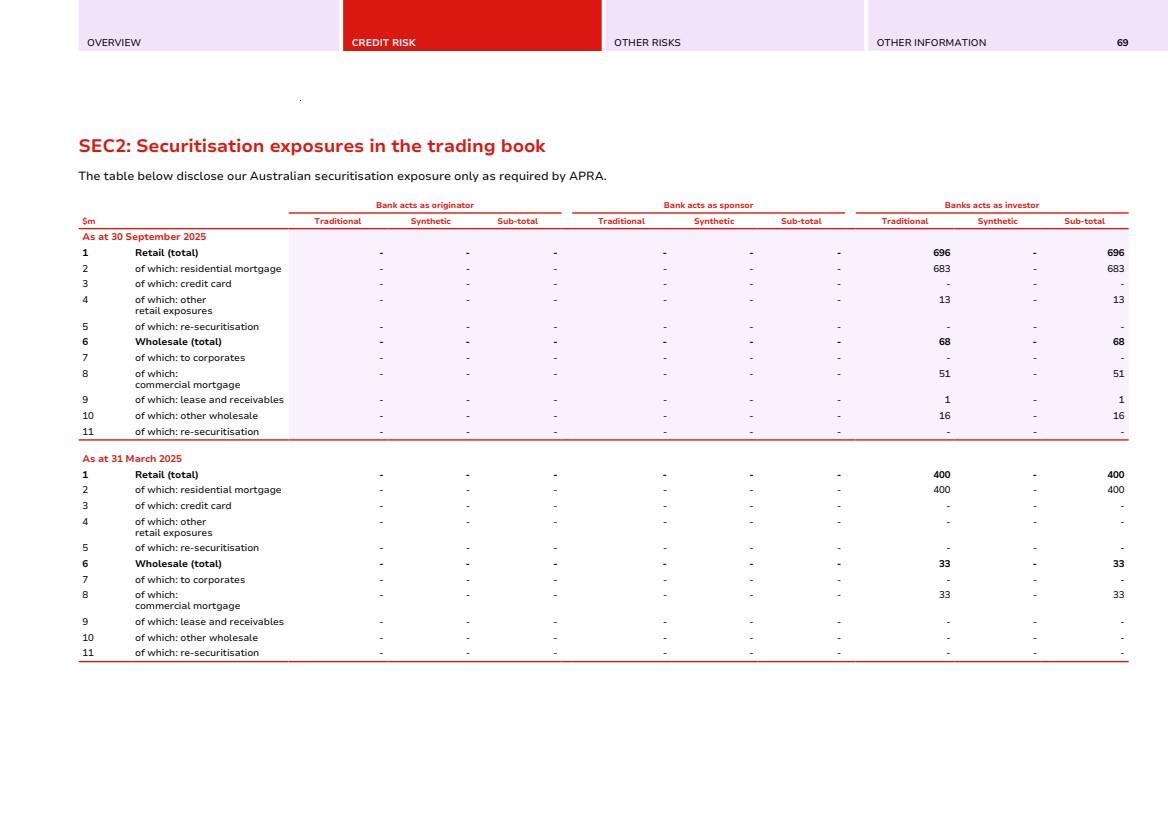
| 70 WESTPAC GROUP SEPTEMBER 2025 PILLAR 3 REPORT SECURITISATION SEC3: Securitisation exposures in the banking book and associated regulatory capital requirements – bank acting as originator or as sponsor SEC3: Securitisation exposures in the banking book and associated regulatory capital requirements – bank acting as originator or as sponsor Exposure values (by risk weight bands) Exposure values (by regulatory approach) RWA (by regulatory approach) Capital charge after cap $m ≤20% >20% to 50% >50% to 100% >100% to <1250% 1250%a SEC-ERBA SEC-SAb 1250%a SEC-ERBA SEC-SAb 1250%a SEC-ERBA SEC-SAb 1250%a As at 30 September 2025 1 Total exposures - - - - 1 - - 1 - - - - - 1 2 Traditional securitisation - - - - 1 - - 1 - - - - - 1 3 of which: securitisation - - - - 1 - - 1 - - - - - 1 4 of which: retail underlying - - - - 1 - - 1 - - - - - 1 6 of which: wholesale - - - - - - - - - - - - - - 8 of which: re-securitisation - - - - - - - - - 9 Synthetic securitisation - - - - - - - - - - - - - - 10 of which: securitisation - - - - - - - - - - - - - - 11 of which: retail underlying - - - - - - - - - - - - - - 12 of which: wholesale - - - - - - - - - - - - - - 13 of which: re-securitisation - - - - - - - - - As at 31 March 2025 1 Total exposures - - - - 2 - - 2 - - - - - 2 2 Traditional securitisation - - - - 2 - - 2 - - - - - 2 3 of which: securitisation - - - - 2 - - 2 - - - - - 2 4 of which: retail underlying - - - - 2 - - 2 - - - - - 2 6 of which: wholesale - - - - - - - - - - - - - - 8 of which: re-securitisation - - - - - - - - - 9 Synthetic securitisation - - - - - - - - - - - - - - 10 of which: securitisation - - - - - - - - - - - - - - 11 of which: retail underlying - - - - - - - - - - - - - - 12 of which: wholesale - - - - - - - - - - - - - - 13 of which: re-securitisation - - - - - - - - - a. 1250% risk weight is treated as deductions from CET1. b. Standardised Approach (SEC-SA) is treated as the Supervisory Formula Approach as set out in APS 120. |
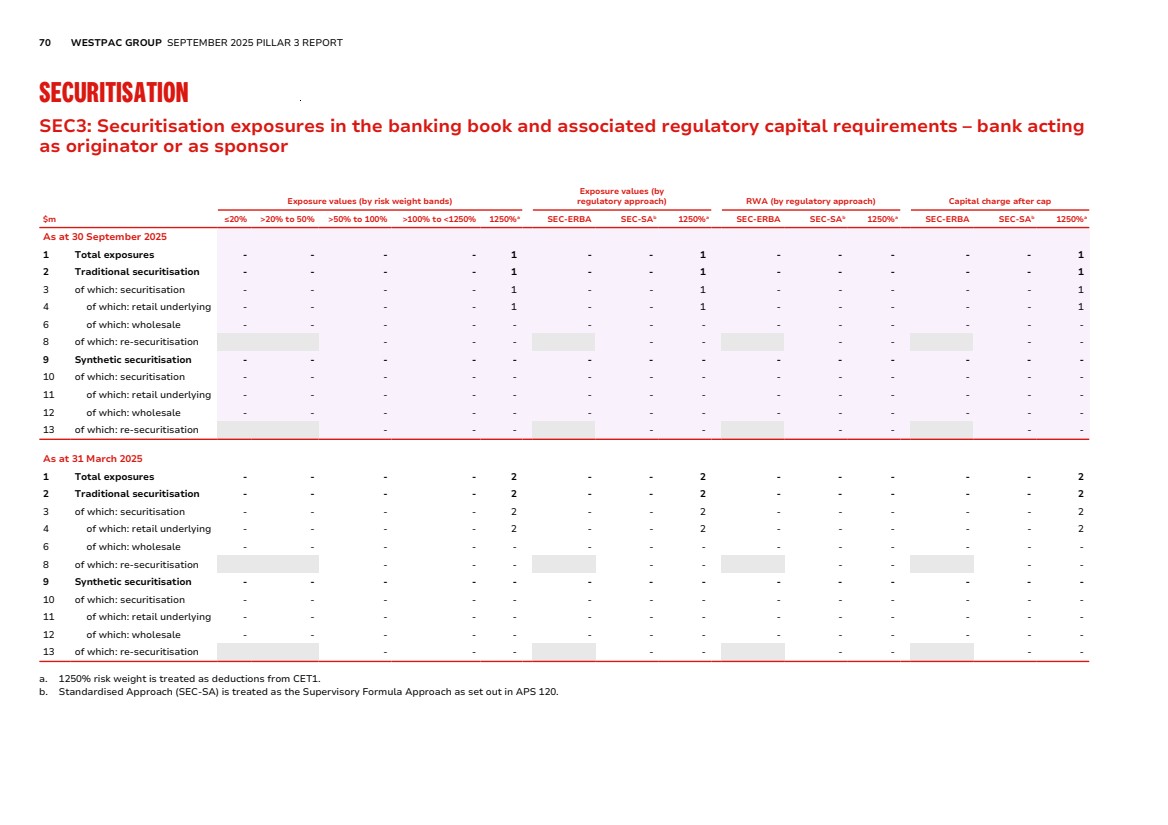
| OVERVIEW CREDIT RISK OTHER RISKS OTHER INFORMATION 71 SEC4: Securitisation exposures in the banking book and associated capital requirements – bank acting as investor SEC4: Securitisation exposures in the banking book and associated capital requirements – bank acting as investor Exposure values (by risk weight bands) Exposure values (by regulatory approach) RWA (by regulatory approach) Capital charge after cap $m ≤20% >20% to 50% >50% to 100% >100% to <1250% 1250%a SEC-ERBA SEC-SAb 1250%a SEC-ERBA SEC-SAb 1250%a SEC-ERBA SEC-SAb 1250%a As at 30 September 2025 1 Total exposures 34,844 8,028 342 7 - 16,750 26,471 - 3,532 4,914 - 282 393 - 2 Traditional securitisation 34,844 8,028 342 7 - 16,750 26,471 - 3,532 4,914 - 282 393 - 3 of which: securitisation 34,844 8,028 342 7 - 16,750 26,471 - 3,532 4,914 - 282 393 - 4 of which: retail underlying 27,120 3,392 123 7 - 12,957 17,685 - 2,656 3,014 - 212 241 - 6 of which: wholesale 7,724 4,636 219 - - 3,793 8,786 - 876 1,900 - 70 152 - 8 of which: re-securitisation - - - - - - - - - 9 Synthetic securitisation - - - - - - - - - - - - - - 10 of which: securitisation - - - - - - - - - - - - - - 11 of which: retail underlying - - - - - - - - - - - - - - 12 of which: wholesale - - - - - - - - - - - - - - 13 of which: re-securitisation - - - - - - - - - As at 31 March 2025 1 Total exposures 34,873 5,794 330 7 - 16,189 24,816 - 3,421 4,419 - 274 353 - 2 Traditional securitisation 34,873 5,794 330 7 - 16,189 24,816 - 3,421 4,419 - 274 353 - 3 of which: securitisation 34,873 5,794 330 7 - 16,189 24,816 - 3,421 4,419 - 274 353 - 4 of which: retail underlying 27,060 780 143 2 - 12,245 15,741 - 2,516 2,575 - 202 206 - 6 of which: wholesale 7,813 5,014 187 5 - 3,944 9,075 - 905 1,844 - 72 147 - 8 of which: re-securitisation - - - - - - - - - 9 Synthetic securitisation - - - - - - - - - - - - - - 10 of which: securitisation - - - - - - - - - - - - - - 11 of which: retail underlying - - - - - - - - - - - - - - 12 of which: wholesale - - - - - - - - - - - - - - 13 of which: re-securitisation - - - - - - - - - a. 1250% risk weight is treated as deductions from CET1. b. Standardised Approach (SEC-SA) is treated as the Supervisory Formula Approach as set out in APS 120. |
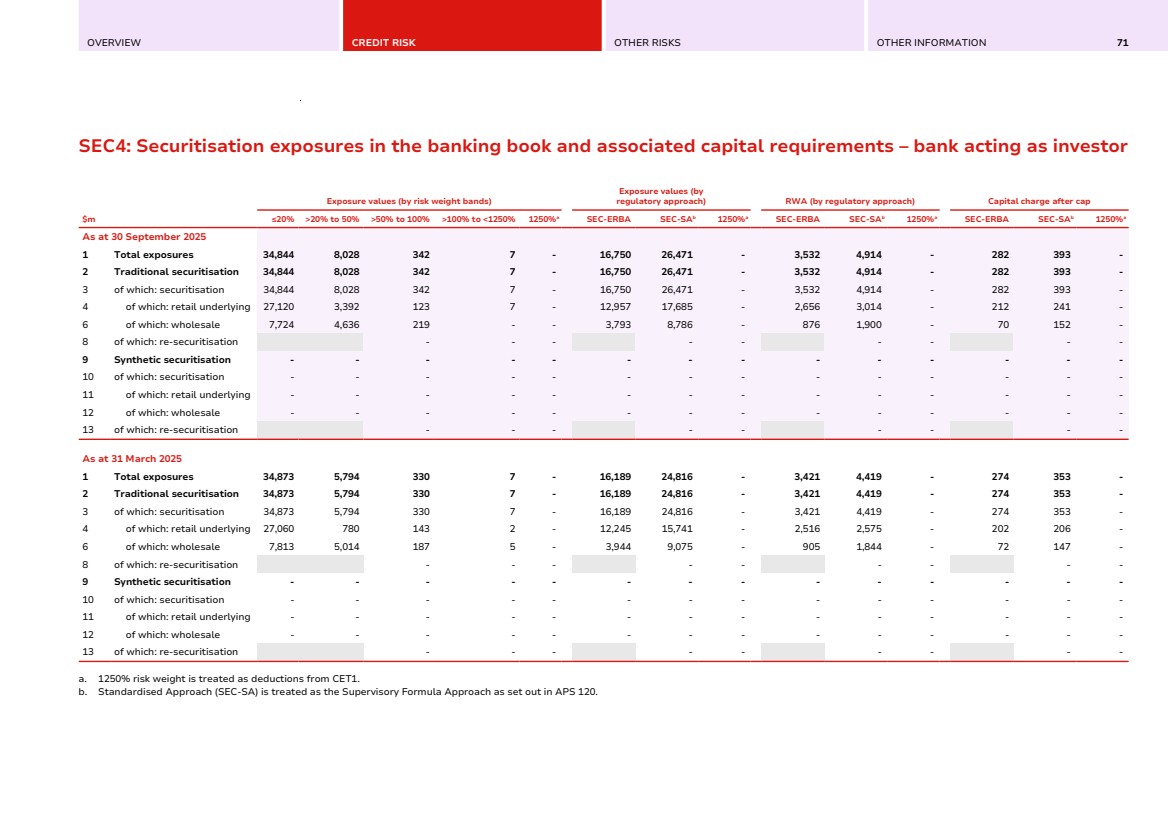
| 72 WESTPAC GROUP SEPTEMBER 2025 PILLAR 3 REPORT OTHER RISKS MARKET RISK INTEREST RATE RISK IN THE BANKING BOOK (IRRBB) OPERATIONAL RISK ORA: General qualitative information on a bank’s operational risk framework OR1: Historical losses OR2: Business indicator and subcomponents OR3: Minimum required operational risk capital LEVERAGE RATIO LR1: Summary comparison of accounting assets vs leverage ratio exposure measure LR2: Leverage ratio common disclosure template MACRO-PRUDENTIAL SUPERVISORY MEASURES Disclosure of global systemically important bank (G-SIB) indicators CCYB1: Geographical distribution of credit exposures used in the calculation of the bank-specific countercyclical capital buffer requirement FUNDING AND LIQUIDITY RISK MANAGEMENT LIQA: Liquidity risk management LIQ1: Liquidity Coverage Ratio LIQ2: Net Stable Funding Ratio |

| OVERVIEW CREDIT RISK OTHER RISKS OTHER INFORMATION 73 MARKET RISK Market Risk Traded Market Risk Westpac’s exposure to traded market risk arises out of Financial Markets and Treasury trading activities. This is quantified for regulatory capital purposes using both the internal model approach and the standardised method, details of which are provided below. Approach Financial Markets in WIB provides products and services to customers including market making and distribution of capital markets products. The types of market risk arising from these activities include interest rate, foreign exchange, commodity, credit spread, volatility risk and derivative valuation adjustments due to credit and funding risk. Treasury’s activities include the management of interest rate, foreign exchange and credit spread risks associated with the wholesale funding book, liquid asset holdings and foreign exchange repatriations. Treasury also manages interest rate risk in the banking book which is discussed in the IRRBB section. Trading activities are managed within the Westpac Board Risk Committee (BRiskC) approved Market Risk Management Framework. The supporting Traded Market Risk Policy contains the Board-approved Value at Risk (VaR) and Stressed Value at Risk (SVaR) limits. Market risk is managed using VaR, SVaR and structural risk limits (including volume limits and basis point value limits) in conjunction with scenario analysis and stress testing. Market risk limits used by management are based upon Westpac’s risk appetite and business strategies, in addition to the consideration of market liquidity and concentration risk. Trades are fair valued daily using rates that have been captured from an independent market data source that has been approved by the Revaluation Committee (RC). Where there is no source of independent rates, data will either be derived using a methodology approved by the RC or sourced from external market dealers. Rates that are dealer-sourced or have limited independent sources are reviewed at least monthly for appropriateness. The RC meets monthly to review the results of independent price verification performed. In addition, valuation adjustments may be made as deductions from CET1 Capital for exposures which are not captured through the fair valuation framework. Guidance for prudential valuation practices are documented in the Westpac Model Risk policy, and model owners are required to assess the extent of valuation uncertainty and limitations in product valuations systems. This is reviewed by Model Risk as part of independent model validation. Where applicable, prudential valuation adjustments are taken by Finance beyond any fair value adjustments that may apply. Risk framework Description Risk reporting Daily monitoring of current exposure and limit utilisation is conducted independently by the Market Risk team, that monitors market risk exposures against VaR, SVaR and structural limits. This team reports directly to the Westpac Institutional Bank and Treasury Chief Risk Officer (CRO) who in turn reports to the Group CRO. Daily VaR and SVaR position reports are produced by risk type, by product lines and by geographic region. These are supplemented by structural risk reporting, advice of profit and loss trigger levels and stress test escalation trigger points. Model accreditation has been granted by APRA for the use of an internal model for the determination of regulatory capital for the key classes of interest rate (general market), foreign exchange and commodity risks. Under the model, regulatory capital is derived from both the current VaR window and a SVaR window, where these VaR measures are calculated over a 10-day time horizon to a 99th percentile, one-tailed confidence interval. Specific risk refers to the variations in individual security prices that cannot be explained by general market movements, and event and default risk. Interest rate specific risk capital (specific issuer risk) is calculated using the Standard method and is added to the VaR regulatory capital measure. Westpac currently holds an industry-wide capital overlay which was introduced from 31 December 2021 and relates to APRA’s revised risks-not-in-VaR framework. This overlay will be applied until the Group’s revised framework is approved by APRA. |
| 74 WESTPAC GROUP SEPTEMBER 2025 PILLAR 3 REPORT MARKET RISK Risk framework Description VaR and SVaR limits for Traded Market Risk Market risk arising from trading book activities is primarily measured using VaR based on a historical simulation methodology. Westpac estimates VaR as the potential loss in earnings from adverse market movements and is calculated to a 99% confidence level using the most recent 12 months of historical market data. SVaR is an additional VaR measure which uses 12 months of historical market data that includes a period of significant financial stress. VaR and SVaR take account of all known material market variables that may cause a change in the value of the trading portfolio, including interest rates, foreign exchange rates, price changes, volatility, and the correlation between these variables. The Board-approved market risk VaR and SVaR limits for trading activities are supported by separate VaR and SVaR sub-limits for the trading activities of Financial Markets and Treasury. Westpac uses a full revaluation historical simulation approach for calculating VaR for general market risk for all portfolios. A small number of linear products are modelled using a sensitivity-based approach which is demonstrated to adequately replicate the risk. Products use valuation models which are marked to market or marked to model and aligned to the approaches used for valuations for official profit and loss. This is monitored by back-testing and profit and loss attribution analysis between the risk and valuation systems to ensure alignment and investigation of any material differences. Stress testing through scenarios is performed daily at the Group, trading book and portfolio level to ensure limits are adequately calibrated to risk appetite and strategy. Stress testing Stress scenarios represent a combination of historical and hypothetical events and are reviewed regularly with a view to incorporating emerging risks. Responsibilities for the approval and oversight of stress test policies, parameters and results are allocated to accountable members of the various committees across the market risk governance framework. The Market Risk Stress Test Policy, containing the stress test escalation framework, is approved by the Head of Market, Capital and Liquidity Risk. Back-testing Market Risk performs daily back-testing analysis to assess the validity of the VaR numbers when compared to the actual clean and hypothetical trading outcomes to ensure that model integrity is maintained. A review of both the actual and potential profit and loss outcomes is also undertaken to monitor any skew created by the historical data. Risk mitigation Market risk positions are managed by the trading desks consistent with delegated trading and product authorities. Risk management is carried out by qualified personnel with varying levels of seniority commensurate with the nature and scale of market risks under management. There is extensive hedging capability across cash and derivative products which is used to support the management of market risk within risk appetite at the Desk, Management and Board Level. The following controls allow monitoring by management: • trading authorities and responsibilities are clearly delineated at all levels; • a structured system of limits and reporting of risk exposures, including stress testing; • surveillance of dealing room conduct; • all new products and significant product variations undergo a rigorous approval process to identify business risks prior to launch; • models that are used to determine risk or profit and loss for Westpac’s accounts are independently reviewed; • duties are segregated so that employees involved in the origination, processing and valuation of transactions operate under separate reporting lines, minimising the opportunity for collusion; and • legal personnel review documentation for compliance with relevant laws and regulations. In addition, Group Audit provides independent assurance of the governance, risk management and internal controls. Capital and profit and loss notification framework The BRiskC has approved a profit and loss notification framework. Included in this framework are levels of escalation in accordance with the size of the profit or loss. Triggers are applied to both a 1-day and a rolling 20-day cumulative total. Banking book capital and profit and loss triggers consider changes in economic value as well as financial profit and loss. Structural foreign exchange rate risk Structural foreign exchange rate risk results from the generation of foreign currency denominated earnings and from Westpac’s capital deployed in offshore branches and subsidiaries, where it is denominated in currencies other than Australian dollars. The Australian dollar equivalent of offshore earnings and capital is subject to change as exchange rates fluctuate, which could introduce significant variability to Westpac’s reported financial results. The Chief Financial Officer, with advice from the Group Asset and Liability committee provides oversight of the appropriateness of foreign exchange hedges on earnings and capital. |
| OVERVIEW CREDIT RISK OTHER RISKS OTHER INFORMATION 75 Market risk regulatory capital and risk weighted assets The table below details the capital and associated RWA by approach. The Internal model approach uses VaR and SVaR, while the Standard approach is used for interest rate specific risk. Capital required Risk weighted assets $m 30 September 2025 31 March 2025 30 September 2024 30 September 2025 31 March 2025 30 September 2024 Internal model approach 704 581 637 8,795 7,264 7,969 Standard approach 86 97 127 1,078 1,214 1,586 Total 790 678 764 9,873 8,478 9,555 VaR by risk type For the 6 months ended $m High Low Average Period end 30 September 2025 Interest rate risk 16.2 6.5 9.6 9.3 Foreign exchange risk 4.4 1.2 2.2 2.1 Equity risk - - - - Commodity risk 0.8 0.3 0.4 0.4 Other market risks 7.4 4.3 5.5 4.4 Diversification benefit n/a n/a (7.2) (5.9) Net market riska 16.1 7.2 10.5 10.3 31 March 2025 Interest rate risk 16.7 4.3 7.7 9.9 Foreign exchange risk 4.0 1.1 2.1 2.4 Equity risk - - - - Commodity risk 1.2 0.4 0.7 1.0 Other market risks 4.8 2.3 3.2 4.7 Diversification benefit n/a n/a (4.9) (7.8) Net market riska 17.9 6.6 8.8 10.2 30 September 2024 Interest rate risk 12.8 5.4 7.7 6.2 Foreign exchange risk 5.9 1.1 2.1 3.0 Equity risk - - - - Commodity risk 1.4 0.6 0.9 0.9 Other market risks 3.7 1.9 2.8 3.0 Diversification benefit n/a n/a (4.5) (4.7) Net market riska 14.5 6.8 9.1 8.3 a. VaR and SVaR measures shown here use a 1 day time horizon. The net market risk measure reflects the aggregate diversified risk position for the period. Therefore, individual risk factors will not sum to this total. |
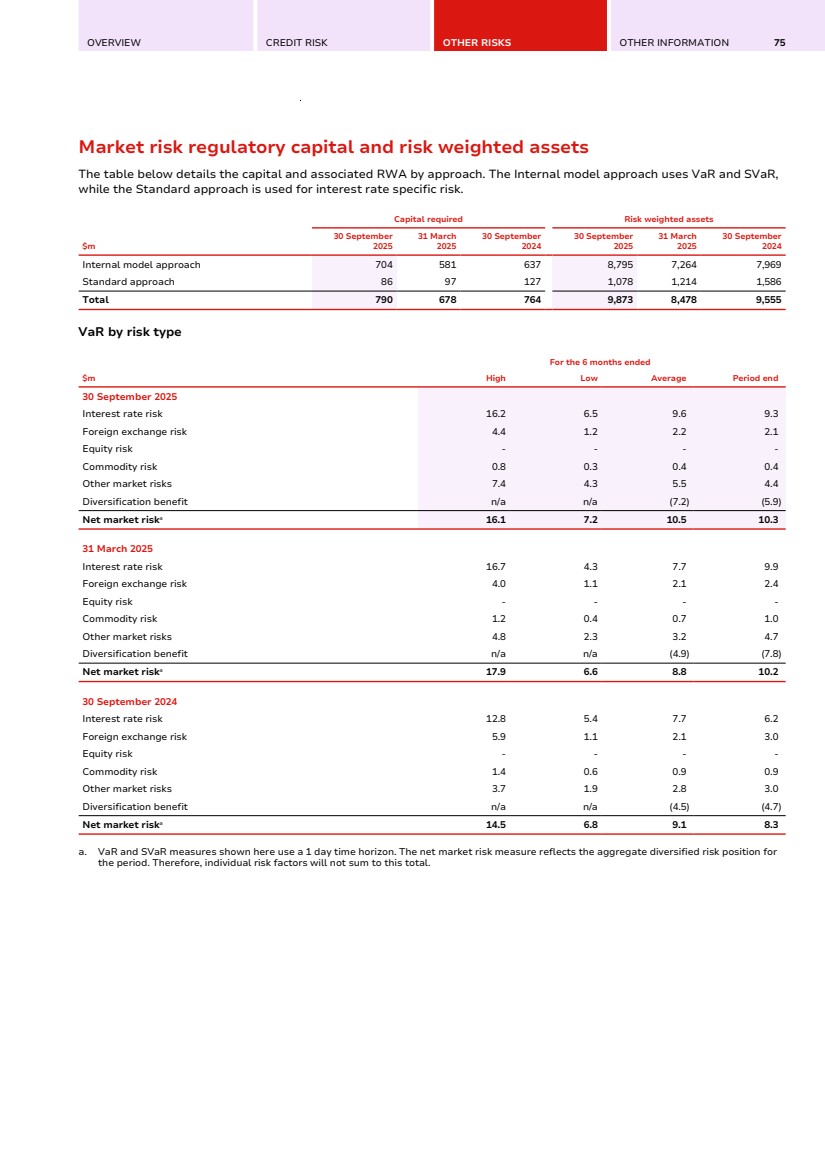
| 76 WESTPAC GROUP SEPTEMBER 2025 PILLAR 3 REPORT MARKET RISK SVaR by risk type For the 6 months ended $m High Low Average Period end 30 September 2025 Interest rate risk 95.1 42.4 70.3 63.0 Foreign exchange risk 11.4 1.2 3.7 3.3 Equity risk - - - - Commodity risk 3.4 0.4 0.8 0.6 Other market risks 13.8 8.1 11.0 9.0 Diversification benefit n/a n/a (20.5) (7.0) Net market riska 92.0 40.9 65.3 68.9 31 March 2025 Interest rate risk 72.9 35.1 54.0 52.8 Foreign exchange risk 8.3 1.9 4.3 3.2 Equity risk - - - - Commodity risk 4.2 0.6 1.3 2.7 Other market risks 21.6 10.7 13.5 11.6 Diversification benefit n/a n/a (20.0) (13.2) Net market riska 73.7 38.0 53.1 57.1 30 September 2024 Interest rate risk 95.4 32.5 62.4 38.2 Foreign exchange risk 10.8 1.5 3.5 6.0 Equity risk - - - - Commodity risk 2.1 0.8 1.2 1.2 Other market risks 18.6 13.9 16.0 16.5 Diversification benefit n/a n/a (20.7) (19.8) Net market riska 93.3 32.7 62.4 42.1 a. The net market risk measure reflects the aggregate diversified risk position for the period. Therefore, individual risk factors will not sum to this total. |
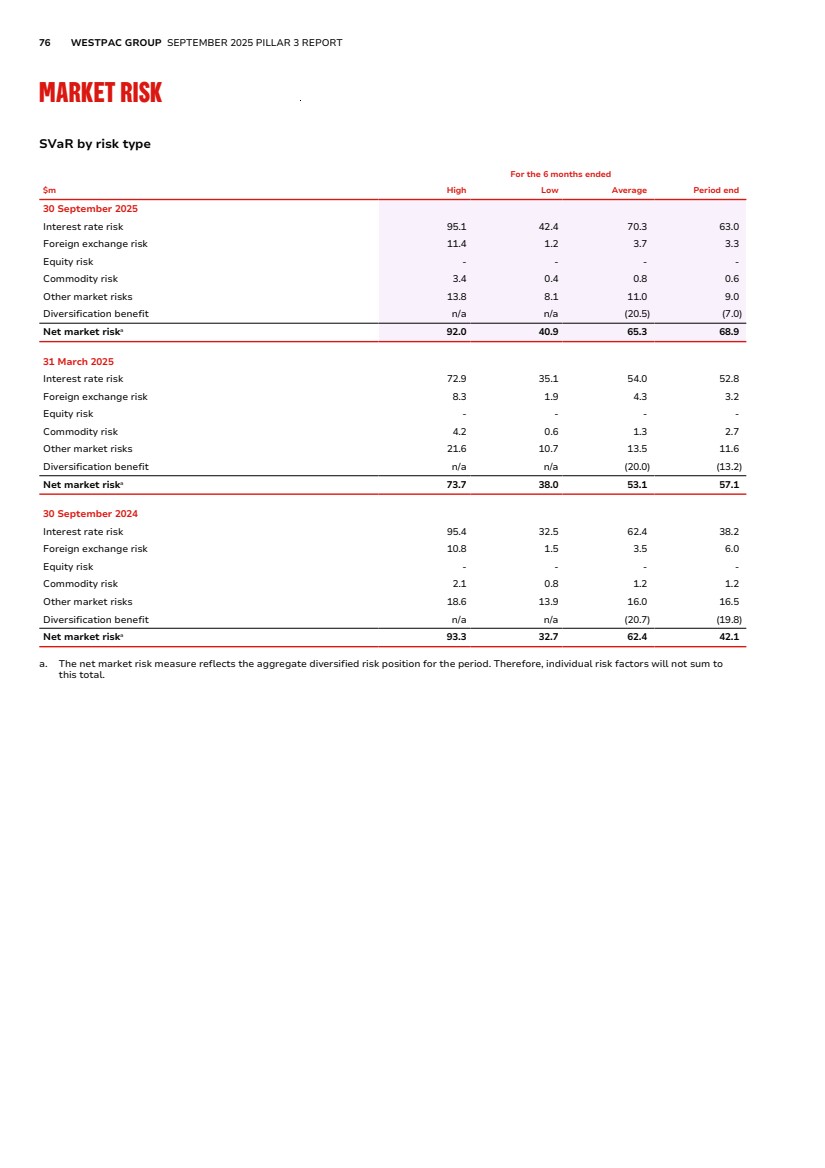
| OVERVIEW CREDIT RISK OTHER RISKS OTHER INFORMATION 77 Back-testing results The following graph gives a comparison of actual profit and loss to VaR over the 6 months ended 30 September 2025. (20) (15) (10) (5) - 5 10 15 20 - 10 20 Actual Profit and Loss ($m) Daily Value at Risk ($m) Traded Risk: Actual Profit and Loss vs. Var 01-Apr-2025 to 30-Sep-2025 Each point on the graph represents 1 day’s trading profit or loss. This result is placed on the graph relative to the associated VaR utilisation. The downward sloping line represents the point where a loss is equal to VaR utilisation. |
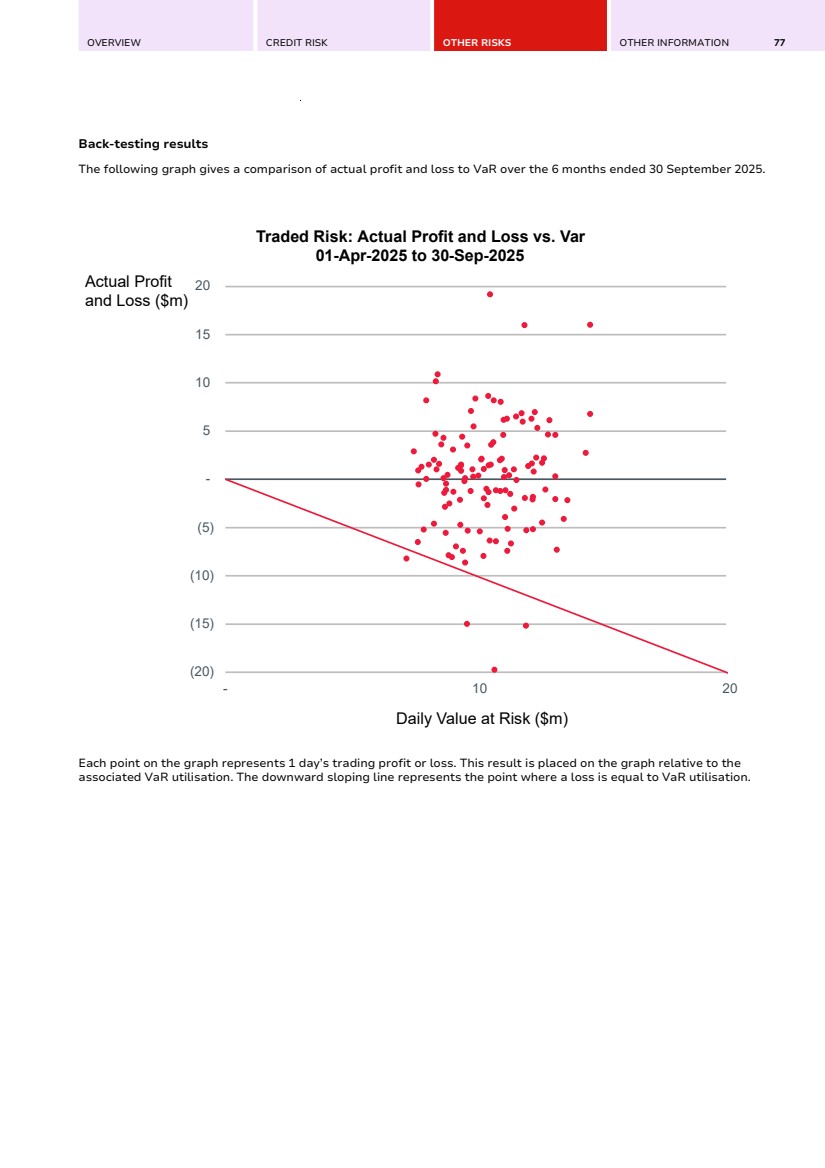
| 78 WESTPAC GROUP SEPTEMBER 2025 PILLAR 3 REPORT INTEREST RATE RISK IN THE BANKING BOOK (IRRBB) Interest Rate Risk in the Banking Book (IRRBB) Interest rate risk is the Group’s exposure to movements in interest rates. IRRBB arises from changes in market interest rates that impact the Group’s earnings (net interest income (NII)) or the economic value of balance sheet categories. The Group manages interest rate risk to achieve appropriate earnings stability over time. The activities that give rise to this risk include customer lending and deposit taking, balance sheet funding and liquidity management, and capital management. Approach IRRBB is managed and governed under the Group’s Market Risk Management Framework which is approved by the BRiskC. This framework is supported by a comprehensive IRRBB measurement system for the quantification of these risks and the potential impact from changes in market interest rates. It includes independent Risk oversight in line with the Group’s Three Lines of Defence framework. Risk framework Description Management Key aspects of the Market Risk Management Framework include: • risk appetite metrics set by the Board which incorporate limits for changes in NII, embedded losses and economic value at risk; • centralisation of the management of the Group’s interest rate risk profile by Treasury under the Funds Transfer Pricing policy and systems; • day to day management of these risks by Treasury in line with approved limits. This includes the development and execution of the interest rate risk strategy for the Group’s choice of its investment term of capital and the repricing profile for non-rate sensitive deposits; • policies and procedures that support the proactive risk management of IRRBB exposures and the management and performance of models used to capture and measure IRRBB risk; • regular reporting of IRRBB metrics to senior management and the Board; and • independent oversight from the Market Risk and Model Risk functions in line with the Group’s Three Lines of Defense framework. Measurement Westpac has received approval from APRA to use its internal model for the calculation of regulatory capital for IRRBB, under APS 117 Capital Adequacy: Interest Rate Risk in the Banking Book. Westpac measures and monitors IRRBB outcomes using the following principal metrics: • Value at Risk (VaR) – potential loss in economic value from adverse market rate movements while maintaining the portfolio for a defined period. Westpac calculates VaR for both internal monitoring and regulatory capital purposes. The regulatory capital VaR measure uses 6 years of historical data with a scaled 1 year holding period and 99% confidence interval and internal VaR, 1 year of historical data is used with a 1 day holding period and 99% confidence interval. Limits are in place to manage potential losses in the economic value of the banking book; • Single currency basis and credit spread sensitivities – the estimate of a change in economic value of the banking book due to a 1 basis point move in single currency basis and credit spreads. Structural risk limits are in place to manage these sensitivities; • Embedded Gains or Losses (EGL) – EGL is included in the IRRBB capital requirement and is the economic gain or loss implied by a static balance sheet, being the difference between the book value and current economic value of banking book items accounted for on an accrual basis. Sensitivity metrics are in place to monitor the potential risk of loss in economic value from embedded losses; • NII-at-risk (NaR) – NaR is measured using a net interest income sensitivity model. The NaR model combines the underlying statement of financial position data with assumptions about runoff and new business and expected repricing behaviour. This simulates a series of potential NII outcomes over a one year horizon subject to 100 basis point shifts up and down from the current market interest rates in Australia and New Zealand. A NaR limit is in place to monitor this exposure; and • Scenario analysis and Stress Testing – the potential loss in earnings and economic value from large parallel and non-parallel yield curve shocks. Behavioural models are incorporated in the measurement of IRRBB to derive behavioural assumptions where appropriate, such as for products that do not have a contractually defined repricing date (e.g. non-maturity deposits) or where there is potential for variation between contractual and actual repricing dates (e.g. prepayments). |
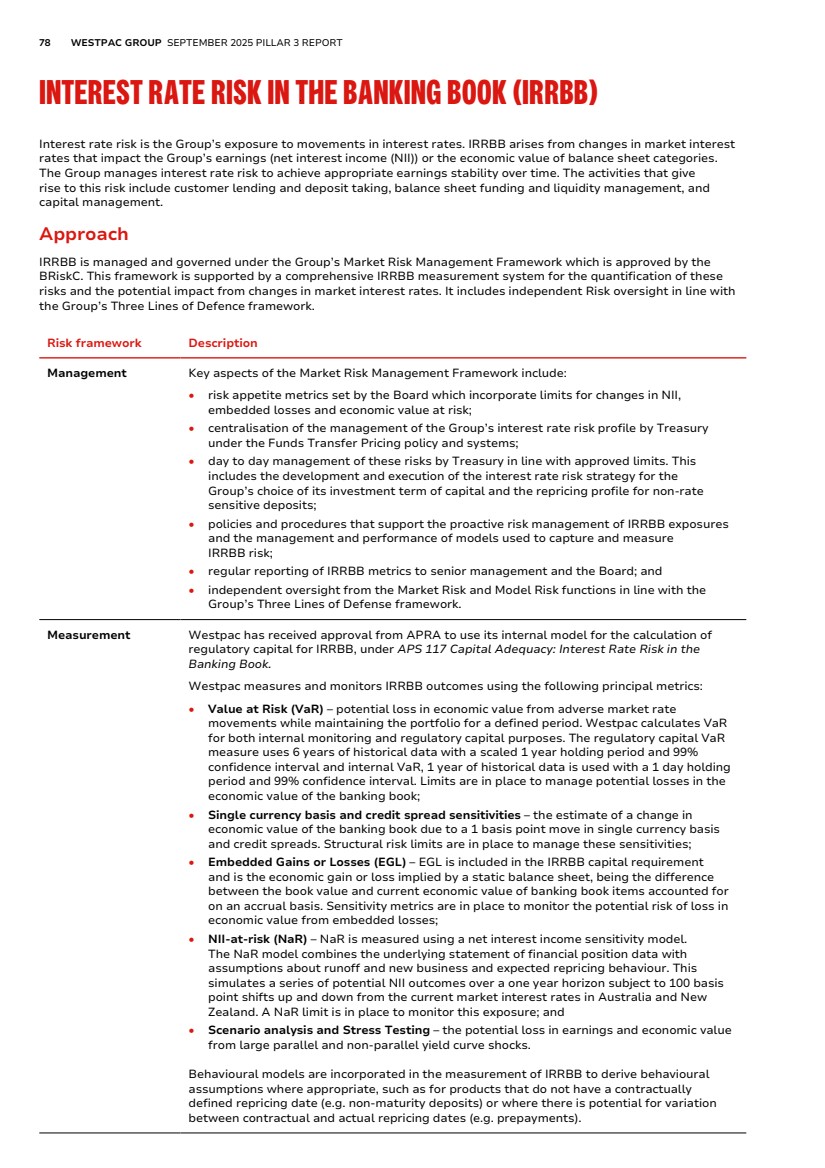
| OVERVIEW CREDIT RISK OTHER RISKS OTHER INFORMATION 79 Risk framework Description Risk reporting The IRRBB measurement comprises the systems, data and models used to measure IRRBB and forms part of the Group’s IRRBB management framework. It includes the capture of retail and other business transactions through the transfer pricing system and the relevant balance sheet management activities of Treasury. The IRRBB measurement system provides regular reporting of the key IRRBB metrics described above, with Market Risk Oversight performing independent monitoring daily of market risk exposures against VaR, structural risk limits and stress testing. Regulatory capital, NaR and EGL sensitivity are monitored on a monthly basis with IRRBB management reports produced for the senior management forums of ALCO, MARCO, RISKCO and BRiskC to provide transparency of compliance with risk appetite, limits and interest rate risk strategy outcomes. Risk mitigation Market risk arising in the banking book stems from the ordinary course of banking activities, including structural interest rate risk (the mismatch between the duration of assets and liabilities) and capital management. Hedging Westpac’s exposure to interest rate risk is undertaken using derivatives. The hedge strategy adopted utilises a combination of the cash flow and fair value hedge approaches. Some derivatives held for economic hedging purposes do not meet the criteria for hedge accounting as defined under AASB 139 Financial Instruments: Recognition and Measurement are therefore accounted for in the same way as derivatives held for trading. IRRBB regulatory capital and RWA1 This table presents IRRRB regulatory capital and RWA. Refer to Key metrics for movement drivers. 30 September 31 March 30 September $m 2025 2025 2024 Total capital required 2,983 3,141 2,236 Risk weighted assets 37,290 39,263 27,955 Change in economic value of a sudden upward and downward movement in interest rates The table below represents the change in economic value of a sudden upward or downward movement in interest rates based on a 200 basis point parallel shift. The results include the regulatory earnings offset. The sensitivity to upward or downward movements in interest rates has increased due to the Group's decision to extend the duration of its core non-rate sensitive hedge from 4 to 5 years and underlying banking activities. 30 September 2025 31 March 2025 30 September 2024 200bp Parallel 200bp Parallel 200bp Parallel 200bp Parallel 200bp Parallel 200bp Parallel $m Increase Decrease Increase Decrease Increase Decrease AUD (1,823) 1,959 (1,935) 2,072 (899) 934 NZD 78 (82) 85 (89) 95 (99) USD (10) 10 (18) 19 6 (7) Other 5 (5) 8 (8) 11 (11) Total (1,750) 1,882 (1,860) 1,994 (787) 817 1. Regulatory capital and interest rate shock calculations for IRRBB are based on the requirements of APS 117 dated January 2013. The revised APS 117 came into effect on 1 October 2025 and is applicable to Westpac’s 2026 Pillar 3 reports. |
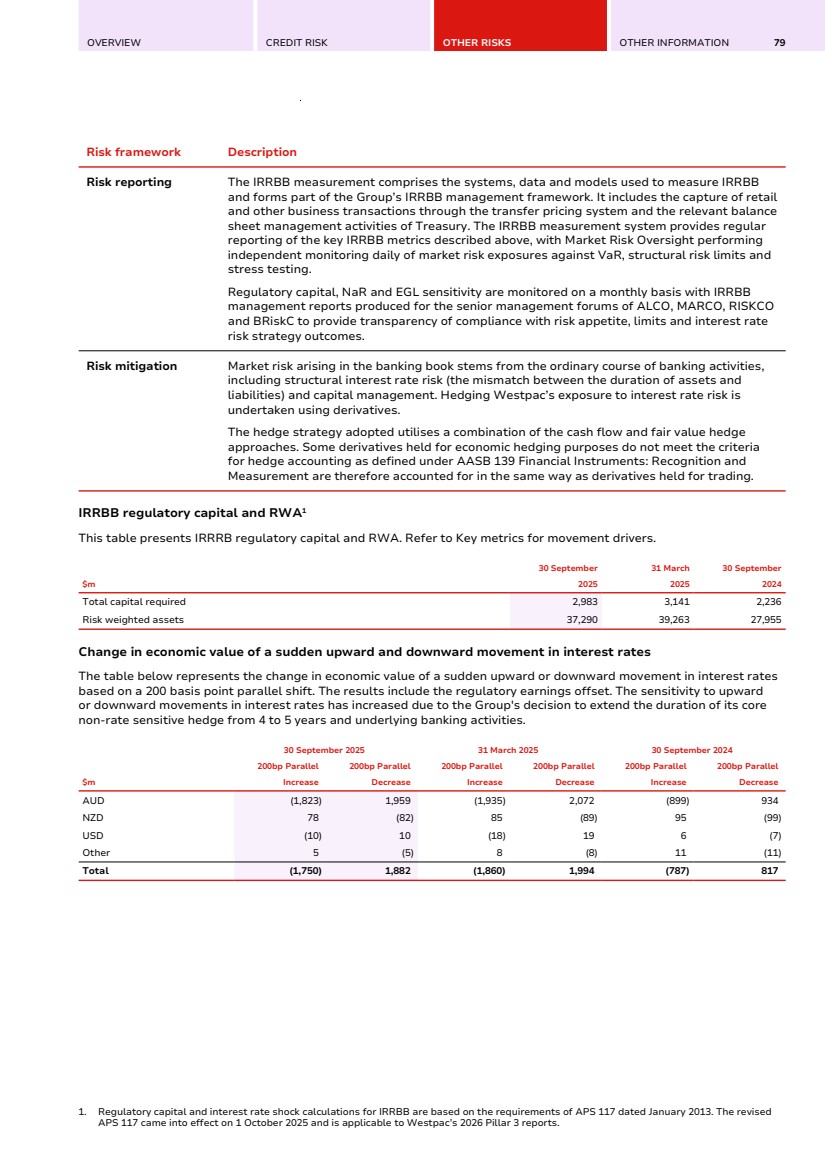
| 80 WESTPAC GROUP SEPTEMBER 2025 PILLAR 3 REPORT OPERATIONAL RISK ORA: General qualitative information on a bank’s operational risk framework Operational Risk ORA: General qualitative information on a bank’s operational risk framework Operational risk is defined as the risk of loss resulting from inadequate or failed internal processes, people and systems or from external events. Approach The Operational Risk Management Framework describes the principles, methodologies, systems, roles and responsibilities, key policies, standards, processes, controls and reporting that enables the effective management and mitigation of operational risk at Westpac including how it remains resilient to operational risks and disruptions, and managing risks arising from service providers, to achieve its purpose. Westpac is subject to APS 115 Capital Adequacy: Standardised Measurement Approach to Operational Risk. Westpac’s Operational Risk Management Framework This Framework implements the nine components in Westpac’s Risk Management Framework. These components are listed below: Risk framework Description Business Strategy Operational Risk Management is an integral part of the Group’s business strategy, planning and management. Both internal and external factors are considered as part of this. Risk Identification Operational risk is identified as part of managing business, considering emerging risks, and in response to changes in the business, business strategy and in the external environment. The Group uses and monitors various internal and external data sources for complete, accurate and timely identification of operational risks. Once identified, the Risk and Control Assessment process provides a structured and consistent approach for the assessment of non-financial risks and management of controls for risk profiles across the Group. Risk Appetite Our operational risk qualitative statements of risk appetite, risk appetite measures and thresholds are contained in our Board Risk Appetite Statement. Operational risk appetite measures and thresholds are contained in Divisional and Lines of Business risk appetite statements to support risk-informed decision making within the bounds of the Board Risk Appetite Statement. We use risk appetite dashboards to report performance against risk appetite to support the management of operational risk. Operational risks outside of approved risk appetite thresholds are subject to heightened monitoring, remediation and reporting to the relevant Board and management committees. Stress and Scenario Analysis We use stress testing and scenario analysis to assess the potential impacts that changes to existing and emerging operational risks may have on our business. Understanding these impacts enables better decision making to deliver fair customer outcomes. They also help us to assess if the group holds capital commensurate with its risk profile and can remain solvent under the stress test. People and Infrastructure The Group aims to have sufficient people in defined roles and responsibilities with appropriate expertise to exercise those responsibilities for the management of operational risk. Control Definition and Effectiveness The Group defines, manages, and continually enhances its control environment to mitigate operational risks. Frameworks and policies are used to mitigate risks and manage within acceptable levels. Monitoring and Reporting Operational risk monitoring and reporting provides comprehensive and timely information to Board, Risk Committees and Senior Management to support the effective management of operational risk. There is a consistent and periodic reporting process in place. Operational Risk Measurement plays a key role in active risk management. This includes measurement of loss data, forward looking scenarios, and Group’s operational risk capital adequacy. |
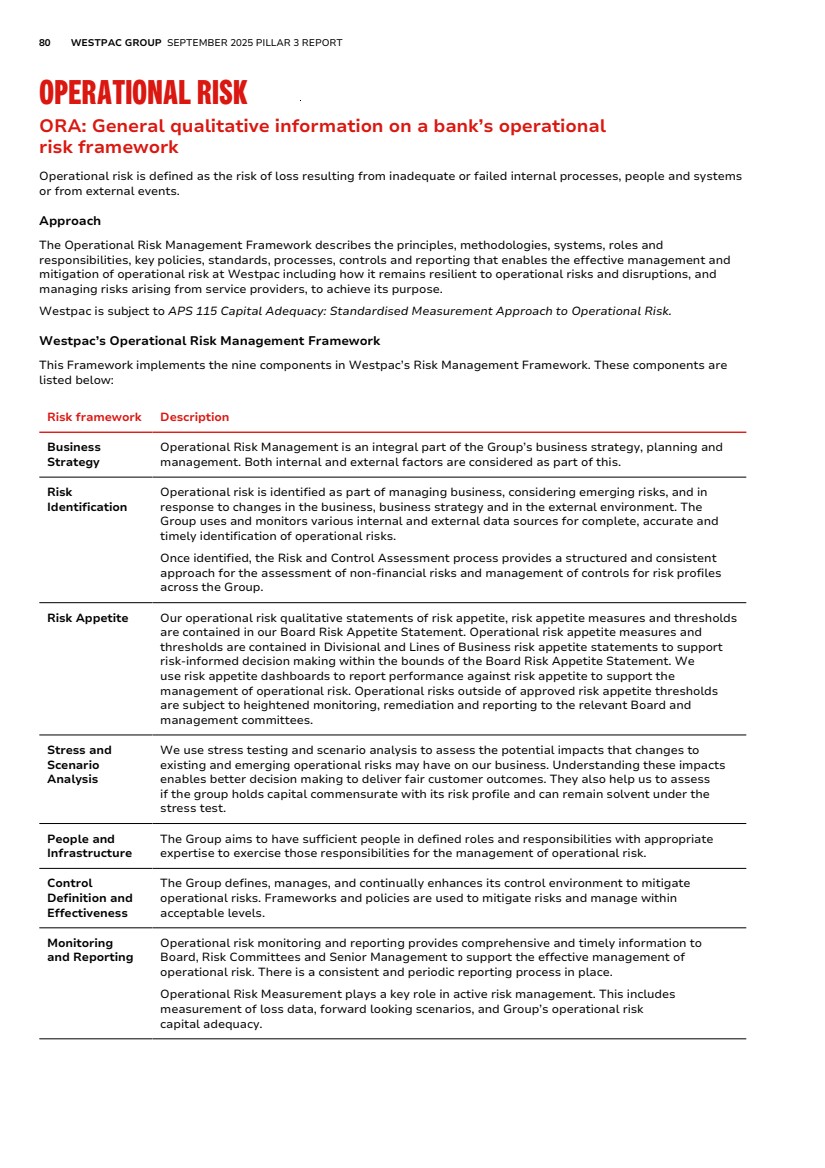
| OVERVIEW CREDIT RISK OTHER RISKS OTHER INFORMATION 81 ORA: General qualitative information on a bank’s operational risk framework (Continued) Risk framework Description Actions and Response Action plans are designed and implemented to manage operational risk to ensure we remain within our approved risk appetite and/ or to improve our risk profile. Where action plans are established, they are well defined with clear milestones and delivery dates and accountabilities. Governance and Management Control The Board Risk Committee, Group Executive Risk Committee, Operational Risk, Compliance and Resilience Committee, Divisional Risk and Compliance Committees support the management and oversight of operational risk for the Group. SMA capital overview Westpac applies the SMA to operational risk capital as required by Prudential Standard APS 115 Capital Adequacy: Standardised Measurement Approach to Operational Risk. Westpac is required to calculate operational risk capital annually based on annual audited financial statements. The SMA based operational risk calculation was updated as part of the 31 December 2024 Pillar 3 report. OR1: Historical losses OR1: Historical losses The table below presents the aggregate operational losses incurred over the 10 financial years of 2015-2024, based on the accounting date of the loss event. Loss event impacts may be subject to ongoing updates due to factors such as remediation and recoveries. This in turn may result in the future movement of loss impacts for prior periods as these value updates may affect whether an incident meets minimum reporting thresholds. a b c d e f g h i j k For the year ended 30 September 2024 2023 2022 2021 2020 2019 2018 2017 2016 2015 Ten-year average Using $30,000 AUD threshold 1 Total amount of operational losses net of recoveries (no exclusions) ($m) 151 196 298 1,022 2,221 1,476 421 242 100 86 621 2 Total number of operational risk losses 415 391 437 499 587 582 544 498 422 412 479 3 Total amount of excluded operational risk losses ($m) - - - - - - - - - - - 4 Total number of exclusions - - - - - - - - - - - 5 Total amount of operational losses net of recoveries and net of excluded losses ($m) 151 196 298 1,022 2,221 1,476 421 242 100 86 621 Using $150,000 AUD threshold 6 Total amount of operational losses net of recoveries (no exclusions) ($m) 136 184 287 1,009 2,203 1,462 405 226 87 67 606 7 Total number of operational risk losses 155 168 197 232 228 209 207 168 126 117 181 8 Total amount of excluded operational risk losses ($m) - - - - - - - - - - - 9 Total number of exclusions - - - - - - - - - - - 10 Total amount of operational losses net of recoveries and net of excluded losses ($m) 136 184 287 1,009 2,203 1,462 405 226 87 67 606 Details of operational risk capital calculation 11 Are losses used to calculate the ILM (yes/no)? No 12 If “no” in row 11, is the exclusion of internal loss data due to non-compliance with the minimum loss data standards (yes/no)? No 13 Loss event threshold: $30,000AUD or $150,000 AUD for the operational risk capital calculation if applicable N/A |
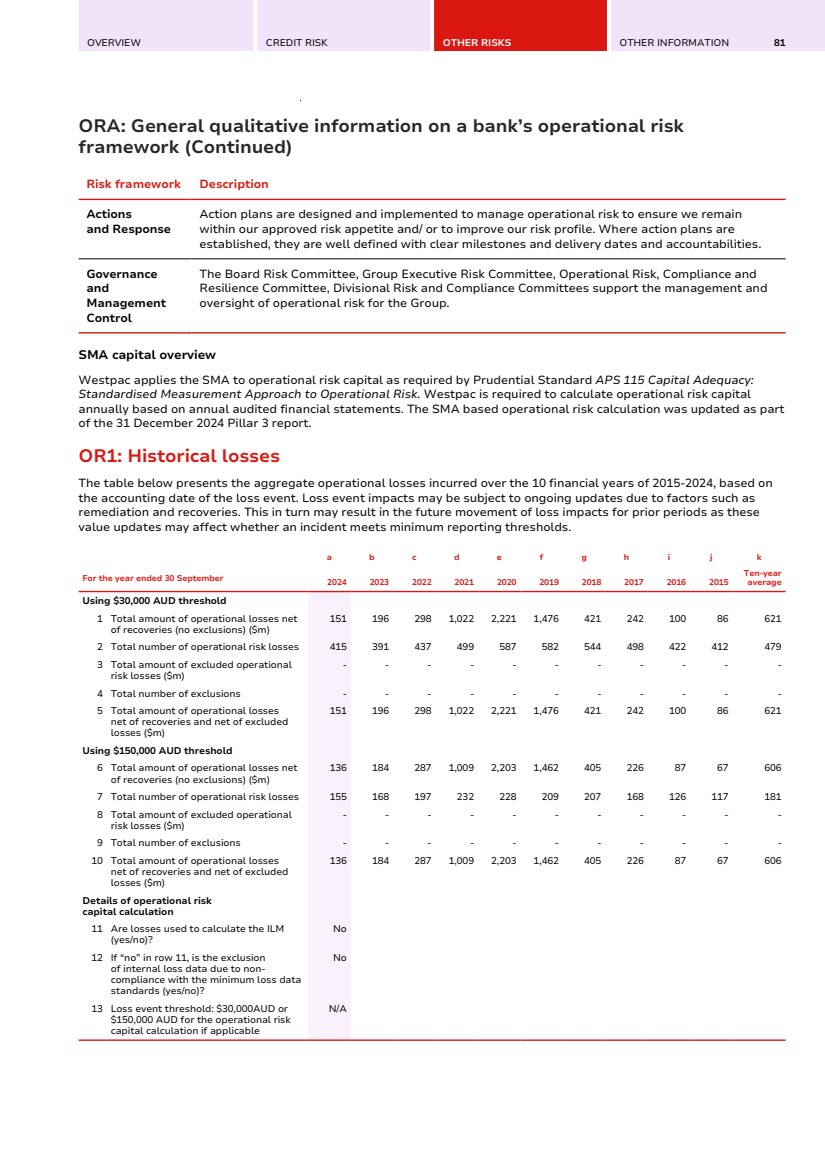
| 82 WESTPAC GROUP SEPTEMBER 2025 PILLAR 3 REPORT OPERATIONAL RISK OR2: Business indicator and subcomponents OR2: Business indicator and subcomponents The following table presents the business indicator (BI) and its subcomponents used in the calculation of the operational risk capital and RWA for the period from 30 September 2023 to 30 September 2024. The information presented in this table is calculated as per the ARS 115 Capital Adequacy: Standardized Measurement Approach to Operational Risk and is submitted to APRA annually in February each year to meet the reporting format ARF 115 timelines. $m a b c BI and its subcomponents 30 September 2024 30 September 2023 30 September 2022 1 Interest, lease and dividend componenta,b 17,789 1a Interest and lease income 54,340 43,844 23,312 1b Interest and lease expense 35,993 25,846 6,665 1c Interest earning assetsc 882,757 819,609 790,122 1d Dividend income 97 140 137 2 Services componenta,d 4,066 2a Fee and commission income 3,704 3,665 3,469 2b Fee and commission expense 2,070 2,056 1,791 2c Other operating income 21 296 408 2d Other operating expense 420 498 443 3 Financial componenta,e 823 3a Net P&L on the trading book 388 236 840 3b Net P&L on the banking book 291 552 161 4 BI (1 + 2 + 3)f 22,678 5 Business indicator component (BIC)g 3,357 Disclosure on the BI: 6a BI gross of excluded divested activities 22,678 6b Reduction in BI due to excluded divested activities (6a - 4) - a. Calculated as average of the three recent financial years available at the time of preparing the ARF 115 return. b. Calculated as the lesser of the average net interest and lease income and 2.25% of interest earning assets, plus the average of dividend income. c. Interest earning assets as at the end of each financial year. d. Calculated as the higher of the average fee and commission income and expense, plus the higher of the average other operating income and expense. e. Calculated as the sum of the average net profit or loss on the trading and banking book. f. Business indicator is a sum of the interest, lease and dividend component, services component and financial component. g. Calculated as the business indicator multiplied by 12%, plus 3% of the amount by which the business indicator exceeds $1.5 billion. OR3: Minimum required operational risk capital OR3: Minimum required operational risk capital The following table presents the operational risk regulatory capital requirements as of 30 September 2025. Following an APRA investigation in 2020, Westpac entered a Court Enforceable Undertaking with APRA in December 2020 where it committed to remediating specific prudential weaknesses identified by APRA in its culture, governance and accountability, and address the root causes of these issues. In response, Westpac established the Customer Outcomes and Risk Excellence Program and appointed an independent reviewer. Prior to this, APRA had pre-emptively imposed a $500 million capital add-on on Westpac in July 2019 and an additional $500 million capital add-on in December 2019. As APRA progressed its supervision program, a first tranche of $500 million capital add-on was removed in July 2024 in recognition of Westpac’s progress in addressing these issues. APRA indicated at the time that the remainder would stay in place until Westpac completed its transition work and APRA undertook further validation work to assess the sustainability of improvements made in prudent risk management practices and outcomes. On 15th October 2025, APRA confirmed that Westpac has completed a multi-year risk transformation program required by APRA and, consequently, APRA has removed the remaining tranche of $500 million capital add-on, with immediate effect. |
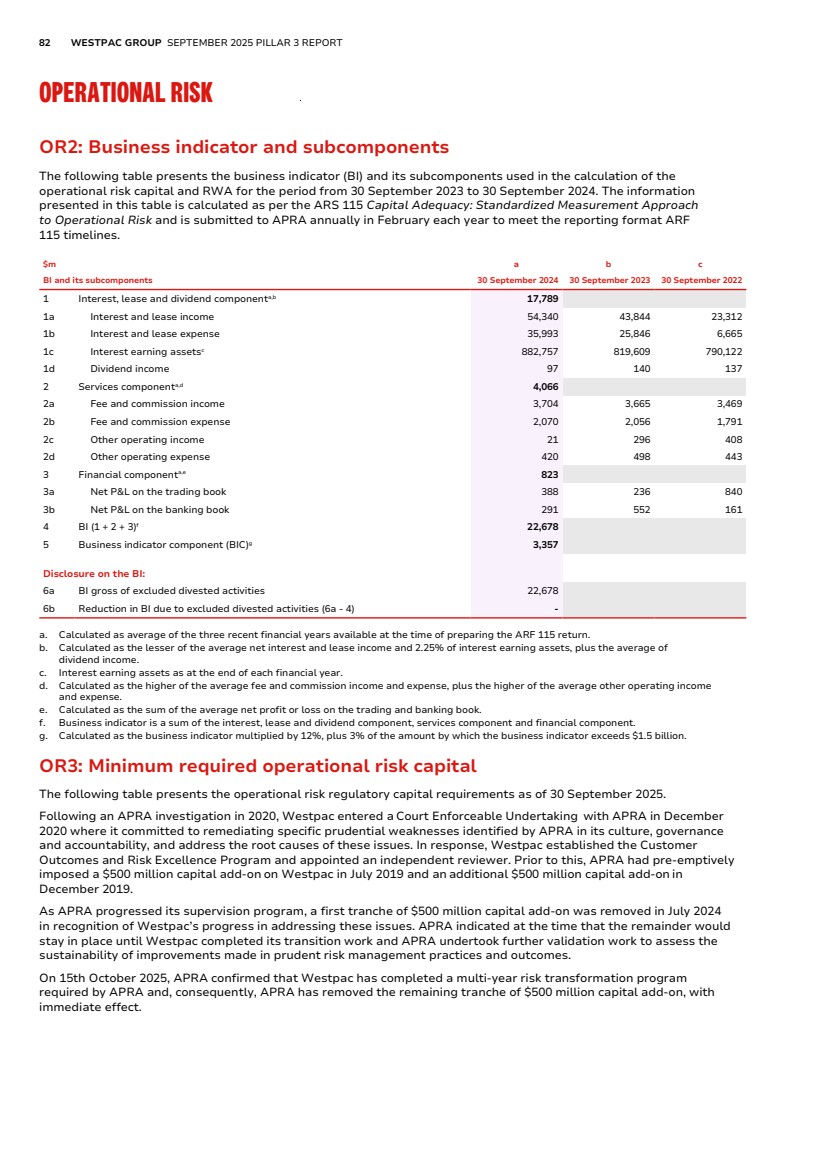
| OVERVIEW CREDIT RISK OTHER RISKS OTHER INFORMATION 83 OR3: Minimum required operational risk capital (Continued) $m 30 September 2025 30 September 2024 1 Business indicator component (BIC)a 3,357 3,297 2 Internal loss multiplier (ILM)b 1 1 AU2a Other regulatory capital chargesc 516 559 3 Minimum required operational risk capital 3,873 3,856 4 Operational risk RWAd 48,409 48,196 a. BIC is based on the annually submitted ARF 115 return submitted to APRA in February each year and thus not calculated based on the latest available financial year. b. APS 115 does not prescribe an internal loss multiplier. c. APRA has removed the $500 million capital add-on, with immediate effect, this will be reflected in December 2025 Pillar 3 disclosure. d. Operational risk RWA is operational risk capital multiplied by 12.5, as prescribed in APS 110 paragraph 4. |
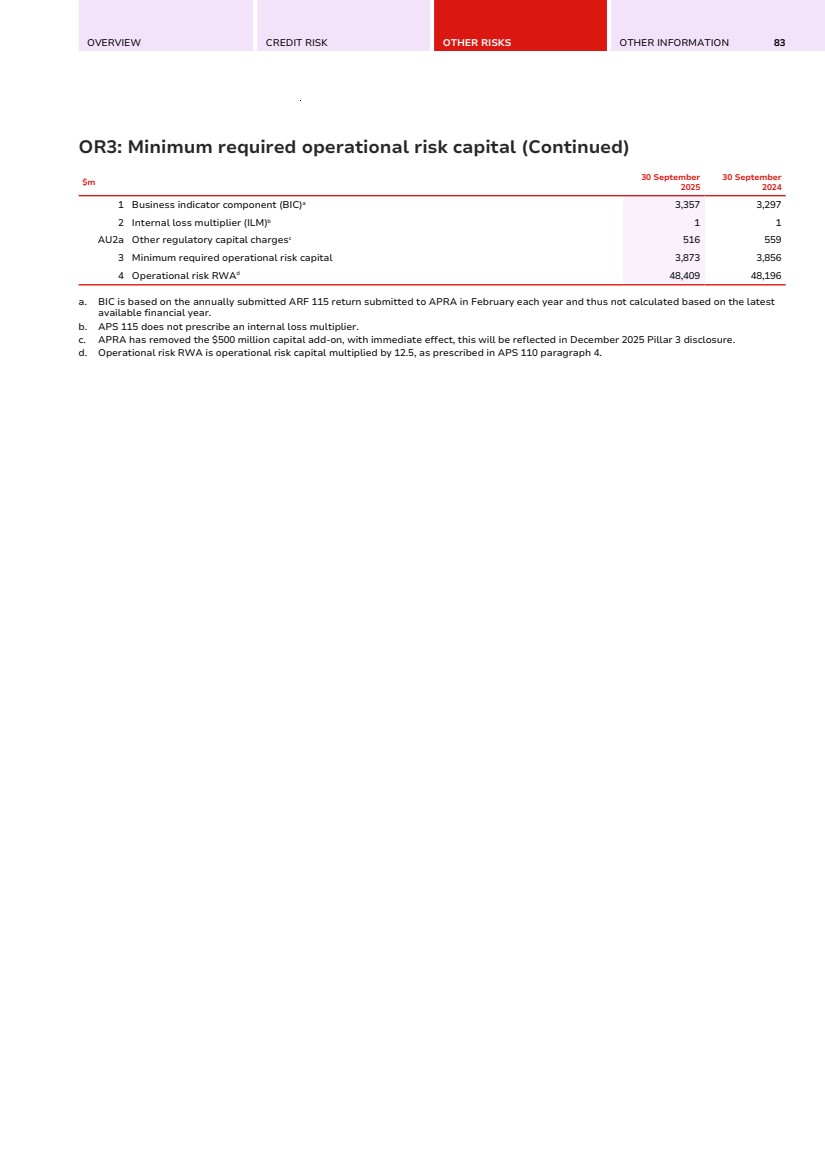
| 84 WESTPAC GROUP SEPTEMBER 2025 PILLAR 3 REPORT LEVERAGE RATIO LR1: Summary comparison of accounting assets vs leverage ratio exposure measure Leverage Ratio LR1: Summary comparison of accounting assets vs leverage ratio exposure measure This table presents an overview of adjustments against Westpac’s published total assets for leverage ratio calculation purposes. $m 30 September 2025 1 Total consolidated assets as per published financial statements 1,125,356 2 Adjustment for investments in banking, financial, insurance or commercial entities that are consolidated for accounting purposes but outside the scope of regulatory consolidation (392) 3 Adjustment for securitised exposures that meet the operational requirements for the recognition of risk transference - 4 Adjustments for temporary exemption of central bank reserves (if applicable) - 5 Adjustment for fiduciary assets recognised on the balance sheet pursuant to the operative accounting framework but excluded from the leverage ratio exposure measure - 6 Adjustments for regular-way purchases and sales of financial assets subject to trade date accounting - 7 Adjustments for eligible cash pooling transactions 26,784 8 Adjustments for derivative financial instruments 16,316 9 Adjustment for securities financing transactions (ie repurchase agreements and similar secured lending) 16,763 10 Adjustment for off-balance sheet items (ie conversion to credit equivalent amounts of off-balance sheet exposures) 113,016 11 Adjustments for prudent valuation adjustments and specific and general provisions which have reduced Tier 1 capital - 12 Other adjustments (15,636) 13 Leverage ratio exposure measure 1,282,207 |
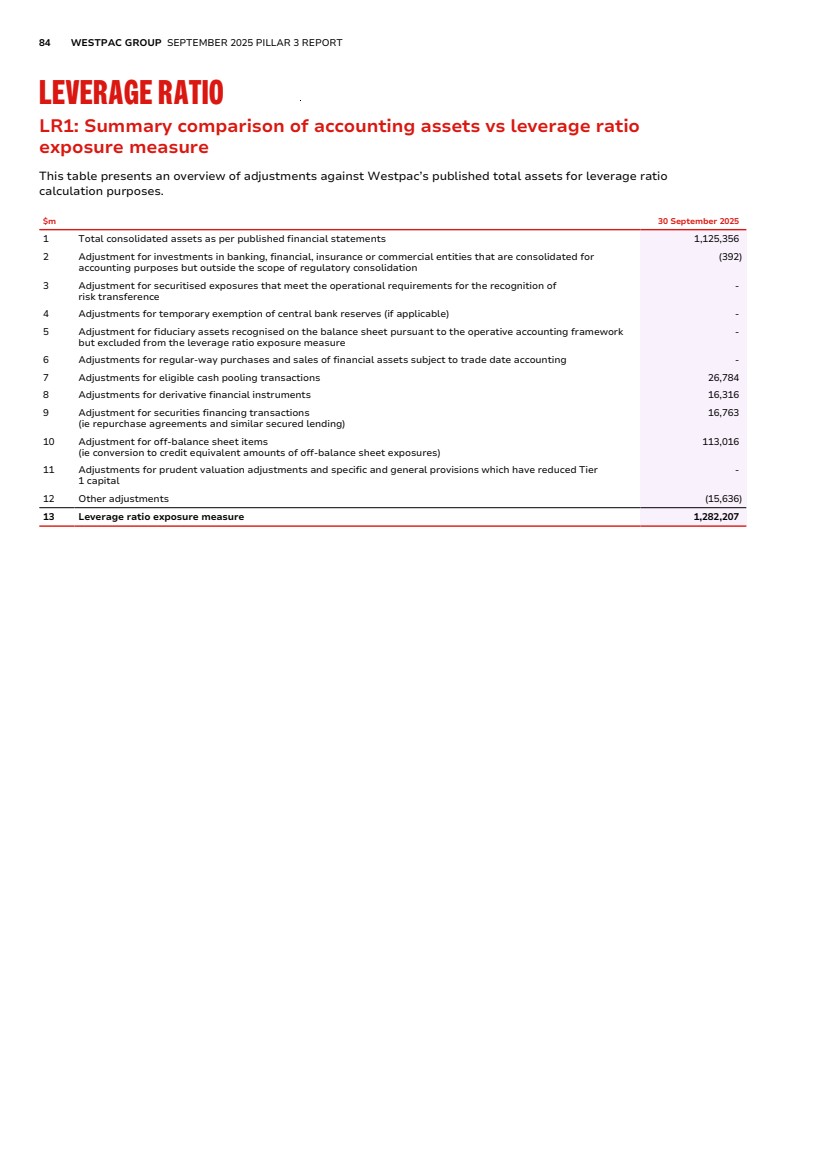
| OVERVIEW CREDIT RISK OTHER RISKS OTHER INFORMATION 85 LR2: Leverage ratio common disclosure template LR2: Leverage ratio common disclosure template The table below provides a detailed breakdown of the components of the leverage ratio denominator, as well as information on the leverage ratio, minimum requirements and buffers. $m 30 September 2025 30 June 2025 On-balance sheet exposures 1 On-balance sheet exposures (excluding derivatives and securities financing transactions (SFTs), but including collateral) 1,104,980 1,095,846 2 Gross-up for derivatives collateral provided where deducted from balance sheet assets pursuant to the operative accounting framework 3,715 4,324 3 (Deductions of receivable assets for cash variation margin provided in derivatives transactions) (3,776) (5,236) 4 (Adjustment for securities received under securities financing transactions that are recognised as an asset) - - 5 (Specific and general provisions associated with on-balance sheet exposures that are deducted from Tier 1 capital) - - 6 (Asset amounts deducted in determining Tier 1 capital and regulatory adjustments) (15,636) (15,916) 7 Total on-balance sheet exposures (excluding derivatives and SFTs) (sum of rows 1 to 6) 1,089,283 1,079,018 Derivative exposures 8 Replacement cost associated with all derivatives transactions (where applicable net of eligible cash variation margin, with bilateral netting and/or the specific treatment for client cleared derivatives) 7,131 8,843 9 Add-on amounts for potential future exposure associated with all derivatives transactions 27,710 27,275 10 (Exempted central counterparty (CCP) leg of client-cleared trade exposures) - - 11 Adjusted effective notional amount of written credit derivatives 5,726 7,704 12 (Adjusted effective notional offsets and add-on deductions for written credit derivatives) (5,726) (7,704) 13 Total derivative exposures (sum of rows 8 to 12) 34,841 36,118 Securities financing transaction exposures 14 Gross SFT assets (with no recognition of netting), after adjustment for sale accounting transactions 42,073 32,393 15 (Netted amounts of cash payables and cash receivables of gross SFT assets) - - 16 Counterparty credit risk exposure for SFT assets 2,994 2,301 17 Agent transaction exposures - - 18 Total securities financing transaction exposures (sum of rows 14 to 17) 45,067 34,694 Other off-balance sheet exposures 19 Off-balance sheet exposure at gross notional amount 227,441 227,751 20 (Adjustments for conversion to credit equivalent amounts) (114,425) (113,758) 21 (Specific and general provisions associated with off-balance sheet exposures deducted in determining Tier 1 capital) - - 22 Off-balance sheet items (sum of rows 19 to 21) 113,016 113,993 Capital and total exposures 23 Tier 1 capital 64,978 64,886 24 Total exposures (sum of rows 7, 13, 18 and 22) 1,282,207 1,263,823 Leverage ratio 25 Leverage ratio (including the impact of any applicable temporary exemption of central bank reserves) 5.07% 5.13% 25a Leverage ratio (excluding the impact of any applicable temporary exemption of central bank reserves) 5.07% 5.13% 26 National minimum leverage ratio requirement 3.50% 3.50% 27 Applicable leverage buffers - - Disclosure of mean values 28 Mean value of gross SFT assets, after adjustment for sale accounting transactions and netted of amounts of associated cash payables and cash receivables 42,073 32,393 29 Quarter-end value of gross SFT assets, after adjustment for sale accounting transactions and netted of amounts of associated cash payables and cash receivables 47,266 35,281 30 Total exposures (including the impact of any applicable temporary exemption of central bank reserves) incorporating mean values from row 28 of gross SFT assets (after adjustment for sale accounting transactions and netted of amounts of associated cash payables and cash receivables) 1,282,207 1,263,823 30a Total exposures (excluding the impact of any applicable temporary exemption of central bank reserves) incorporating mean values from row 28 of gross SFT assets (after adjustment for sale accounting transactions and netted of amounts of associated cash payables and cash receivables) 1,282,207 1,263,823 31 Basel III leverage ratio (including the impact of any applicable temporary exemption of central bank reserves) incorporating mean values from row 28 of gross SFT assets (after adjustment for sale accounting transactions and netted of amounts of associated cash payables and cash receivables) 5.07% 5.13% 31a Basel III leverage ratio (excluding the impact of any applicable temporary exemption of central bank reserves) incorporating mean values from row 28 of gross SFT assets (after adjustment for sale accounting transactions and netted of amounts of associated cash payables and cash receivables) 5.07% 5.13% Fourth Quarter 2025 - Third Quarter 2025 Leverage ratio movement The leverage ratio decreased by 6 basis points over the quarter mainly due to higher total exposures from higher lending. |
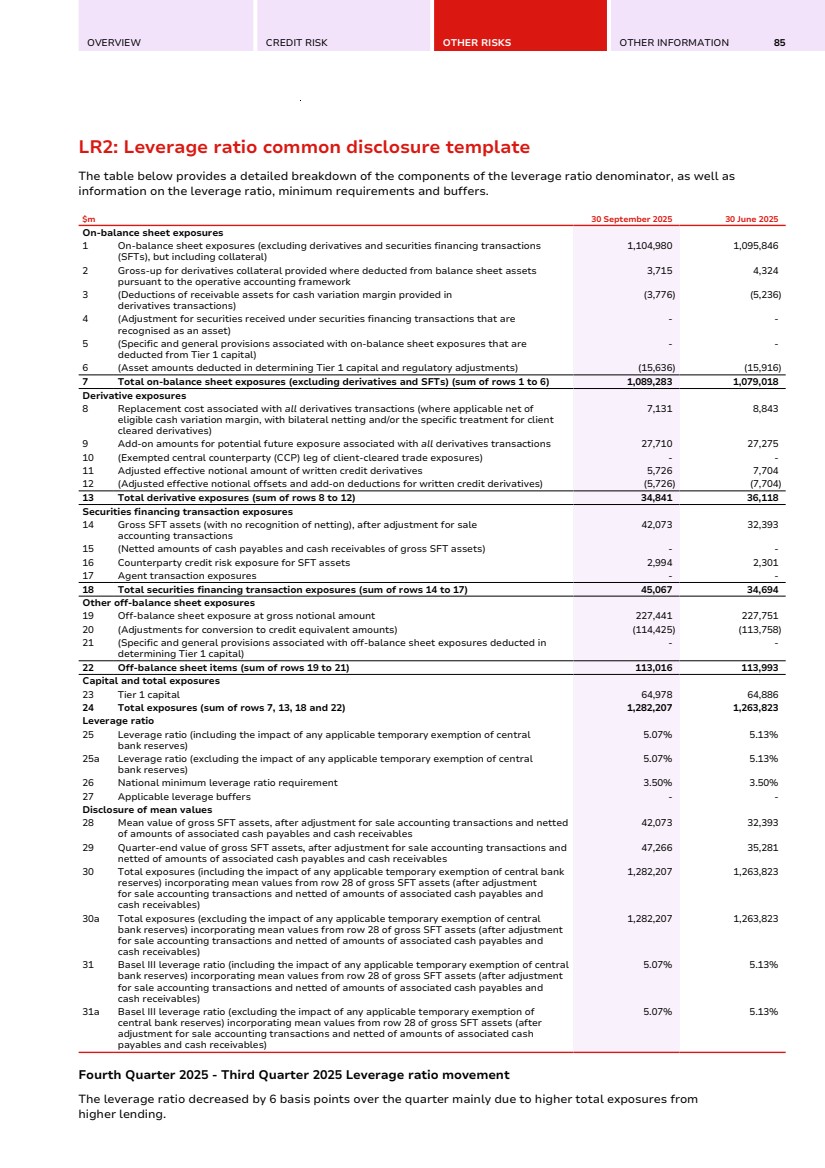
| 86 WESTPAC GROUP SEPTEMBER 2025 PILLAR 3 REPORT MACRO-PRUDENTIAL SUPERVISORY MEASURES Disclosure of global systemically important bank (G-SIB) indicators Macro-prudential Supervisory Measures Disclosure of global systemically important bank (G-SIB) indicators The identification of potential G-SIB is provided under Attachment A, paragraph 36 of APS 330 available at www.westpac.com.au/about-westpac/investor-centre/financial-information/regulatory-disclosures/. CCYB1: Geographical distribution of credit exposures used in the calculation of the bank-specific countercyclical capital buffer requirement CCYB1: Geographical distribution of credit exposures used in the calculation of the bank-specific countercyclical capital buffer requirement This table sets out the ADI specific countercyclical capital buffer. The countercyclical capital buffer is an additional amount of capital that APRA can require banks to hold or release at certain points in the economic and financial cycle. As part of the capital framework, APRA has set a 1.0% default countercyclical capital buffer for Australian exposures. The following table provides a geographic breakdown of RWA associated with private sector credit exposures that are used to calculate the countercyclical capital buffer requirement. Geographical breakdown Countercyclical capital buffer rate RWA used in the computation of the countercyclical capital buffer ($m) Bank-specific countercyclical capital buffer rate Countercyclical capital buffer amount ($m) As at 30 September 2025 Australia 1.00% 286,652 0.83% United Kingdom 2.00% 1,625 0.01% France 1.00% 514 0.00% Netherlands 2.00% 349 0.00% South Korea 1.00% 317 0.00% Hong Kong SAR 0.50% 144 0.00% Ireland 1.50% 139 0.00% Germany 0.75% 115 0.00% Luxembourg 0.50% 98 0.00% Belgium 1.00% 61 0.00% Denmark 2.50% 45 0.00% Sweden 2.00% 27 0.00% Norway 2.50% 4 0.00% Other n/a 56,613 0.00% Total, where countercyclical capital buffer rate applies 290,090 0.84% Total of geographical breakdowns 346,703 0.84% 3,792 Geographical breakdown Countercyclical capital buffer rate RWA used in the computation of the countercyclical capital buffer ($m) Bank-specific countercyclical capital buffer rate Countercyclical capital buffer amount ($m) As at 31 March 2025 Australia 1.00% 284,746 0.82% United Kingdom 2.00% 1,268 0.01% France 1.00% 516 0.00% Netherlands 2.00% 457 0.00% Ireland 1.50% 175 0.00% Luxembourg 0.50% 148 0.00% South Korea 1.00% 133 0.00% Hong Kong SAR 0.50% 83 0.00% Germany 0.75% 64 0.00% Denmark 2.50% 54 0.00% Belgium 1.00% 48 0.00% Sweden 2.00% 10 0.00% Norway 2.50% 1 0.00% Other n/a 57,481 0.00% Total, where countercyclical capital buffer rate applies 287,703 0.84% Total of geographical breakdowns 345,184 0.84% 3,770 |
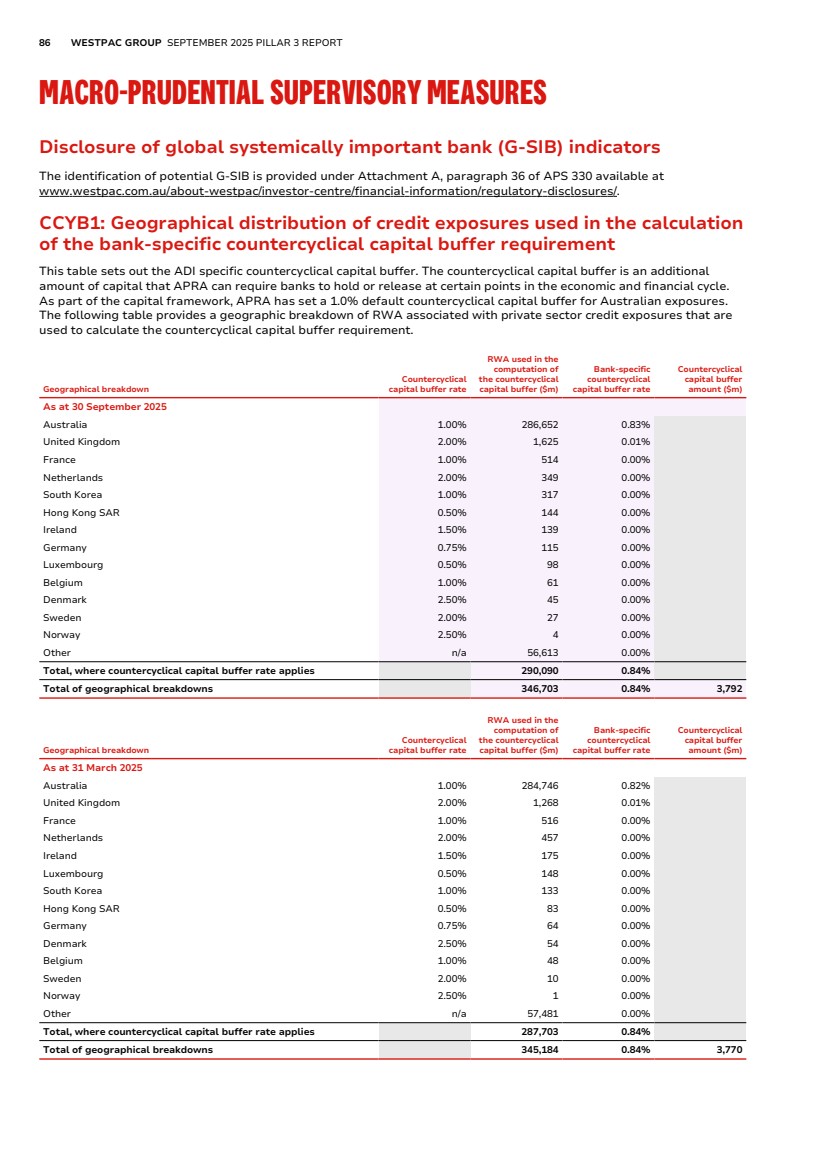
| OVERVIEW CREDIT RISK OTHER RISKS OTHER INFORMATION 87 FUNDING AND LIQUIDITY RISK MANAGEMENT LIQA: Liquidity risk management Funding and Liquidity Risk Management LIQA: Liquidity risk management Funding and liquidity risk is the risk that Westpac cannot meet its payment obligations or that it does not have the appropriate amount, tenor and composition of funding and liquidity to support its assets. Approach Funding and liquidity risk is measured and managed in accordance with the policies and processes defined in the Board-approved Liquidity Risk Management Framework which is part of the Westpac Board-approved Risk Management Strategy. Responsibility for managing Westpac’s liquidity and funding positions in accordance with the Liquidity Risk Management Framework is delegated to Treasury, under the oversight of the ALCO and Risk. Liquidity Risk Management Framework The Liquidity Risk Management Framework sets out Westpac’s funding and liquidity risk appetite, roles and responsibilities of key people managing funding and liquidity risk within Westpac, risk reporting and control processes and limits and targets used to manage Westpac’s balance sheet. Key components of Westpac’s approach to liquidity risk management are listed below. Framework Description Sources of funding Sources of funding include, but are not limited to, customer deposits, short-term and long-term wholesale funding, securitisation, and capital instruments. The Group monitors the composition and stability of its funding so that it remains within the Group's funding risk appetite including compliance with LCR and NSFR. Refer to Note 21.2.2 Funding and Liquidity Risk in Annual Report for further details. Funding Strategy Treasury undertakes an annual funding review that outlines Westpac’s funding strategy over a five-year period which is approved by the BRiskC. This review encompasses trends in global markets, peer analysis, wholesale funding capacity, expected funding requirements and a funding risk analysis. This strategy is continuously reviewed to take account of changing market conditions, investor sentiment, estimations of asset and liability growth rates, capacity analysis and results from stress testing. Westpac monitors the composition and stability of its funding so that it remains within its funding risk appetite. This includes compliance with LCR and NSFR. Monitoring and Reporting Westpac has monitoring and reporting processes in place to support the management of liquidity, ensuring it remains within its Board risk appetite tolerance and in compliance with regulatory requirements. Westpac conducts liquidity modelling, which incorporates balance sheet forecasts and the maturity profile of its wholesale funding portfolio, to forecast the group's liquidity outcomes and metrics. In addition, Westpac conducts liquidity stress testing to assess its ability to meet cash flow obligations under a range of market conditions and scenarios. The Liquidity stress test is also used to inform the Group’s liquidity risk tolerance, determine the appropriate level of Group’s liquid asset buffer and evaluate the adequacy of contingent funding and recovery options to respond to stress Contingency Planning Westpac’s Liquidity Crisis Management Policy provides guidance on the courses of action to be taken in the event of an emerging liquidity crisis. A liquidity crisis may result from any event that may impact Westpac’s ability to fund assets and meet refinancing obligations as they become due. Supporting action plans in the Liquidity Crisis Management Policy include the Treasury Contingent Funding Plan and the Retail Run Plan. Both plans are approved by the Board annually. Liquidity transfer pricing Westpac’s Liquidity Transfer Pricing framework allocates the costs and benefits of liquidity to business segment in accordance with the underlying liquidity characteristics of its balance sheet assets and liabilities. |
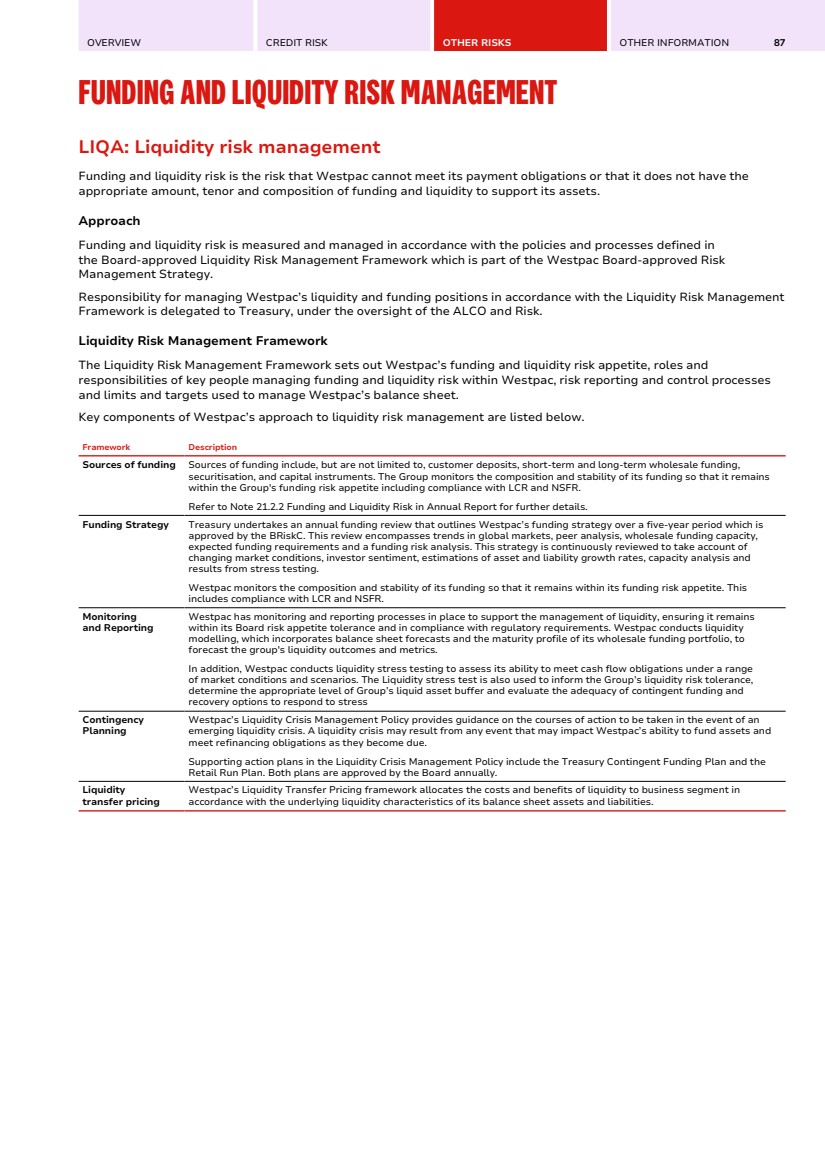
| 88 WESTPAC GROUP SEPTEMBER 2025 PILLAR 3 REPORT FUNDING AND LIQUIDITY RISK MANAGEMENT LIQ1: Liquidity Coverage Ratio LIQ1: Liquidity Coverage Ratio The Liquidity Coverage Ratio (LCR) measures a bank’s ability to meet its liquidity needs under an acute liquidity stress scenario (prescribed by APRA), measured over a 30-day time frame. LCR is calculated as high-quality liquid assets (HQLA) as a percentage of net cash outflows (NCO). Average LCR is calculated as a simple average of the daily observations over the quarter. The number of data points used is reported in the table. Westpac’s average LCR for the quarter was 137% (30 June 2025: 134%) and continues to be above the regulatory minimum of 100% in line with the Group’s liquidity risk tolerance. The increase in average LCR for the quarter ended 30 September 2025 reflects an increase in average liquid assets, mainly driven by higher average net wholesale funding issuance and a lower average customer funding gap. Average NCOs were also higher during the quarter, mostly driven by an increase in customer deposits and higher wholesale funding maturities. HQLA averaged $182.6 billion over the quarter (30 June 2025: $172.5 billion), comprising of cash and balances with central banks, Australian government and semi-government bonds. Westpac also holds other HQLA, mainly qualifying RBNZ securities. Funding is sourced from retail, small business, corporate and institutional customer deposits and wholesale funding. Westpac seeks to minimise the outflows associated with this funding by targeting customer deposits with lower LCR outflow rates and actively manages the maturity profile of its wholesale funding portfolio. 30 September 2025 30 June 2025 $m Total unweighted value (average) Total weighted value (average) Total unweighted value (average) Total weighted value (average) Liquid assets, of which: 1 High-quality liquid assets (HQLA) 182,637 172,460 Alternative Liquid Assets (ALA) - - Reserve Bank of New Zealand (RBNZ) securities 6,709 7,524 Cash outflows 2 Retail deposits and deposits from small business customers, of which: 388,731 32,800 377,484 32,979 3 Stable deposits 192,163 9,608 182,429 9,121 4 Less stable deposits 196,568 23,192 195,055 23,858 5 Unsecured wholesale funding, of which: 175,580 77,356 167,751 74,418 6 Operational deposits (all counterparties) and deposits in networks of cooperative banks 79,473 19,791 74,589 18,573 7 Non-operational deposits (all counterparties) 86,421 47,879 84,535 47,218 8 Unsecured debt 9,686 9,686 8,627 8,627 9 Secured wholesale funding 329 1,087 10 Additional requirements, of which: 209,083 33,707 207,527 35,908 11 Outflows related to derivative exposures and other collateral requirements 15,752 14,652 17,599 16,794 12 Outflows related to loss of funding on debt products 169 169 915 915 13 Credit and liquidity facilities 193,162 18,886 189,013 18,199 14 Other contractual funding obligations 10,227 6,989 9,987 6,793 15 Other contingent funding obligations 69,483 5,371 66,243 5,030 16 Total Cash Outflows 156,552 156,215 Cash inflows 17 Secured lending (e.g. reverse repos) 18,721 - 10,397 - 18 Inflows from fully performing exposures 9,015 4,839 10,647 5,852 19 Other cash inflows 13,738 13,738 15,863 15,863 20 Total Cash Inflows 41,474 18,577 36,907 21,715 Total adjusted value Total adjusted value 21 Total HQLA 189,346 179,984 22 Total net cash outflows 137,975 134,500 23 Liquidity Coverage Ratio (%) 137% 134% Number of data points used 66 62 |
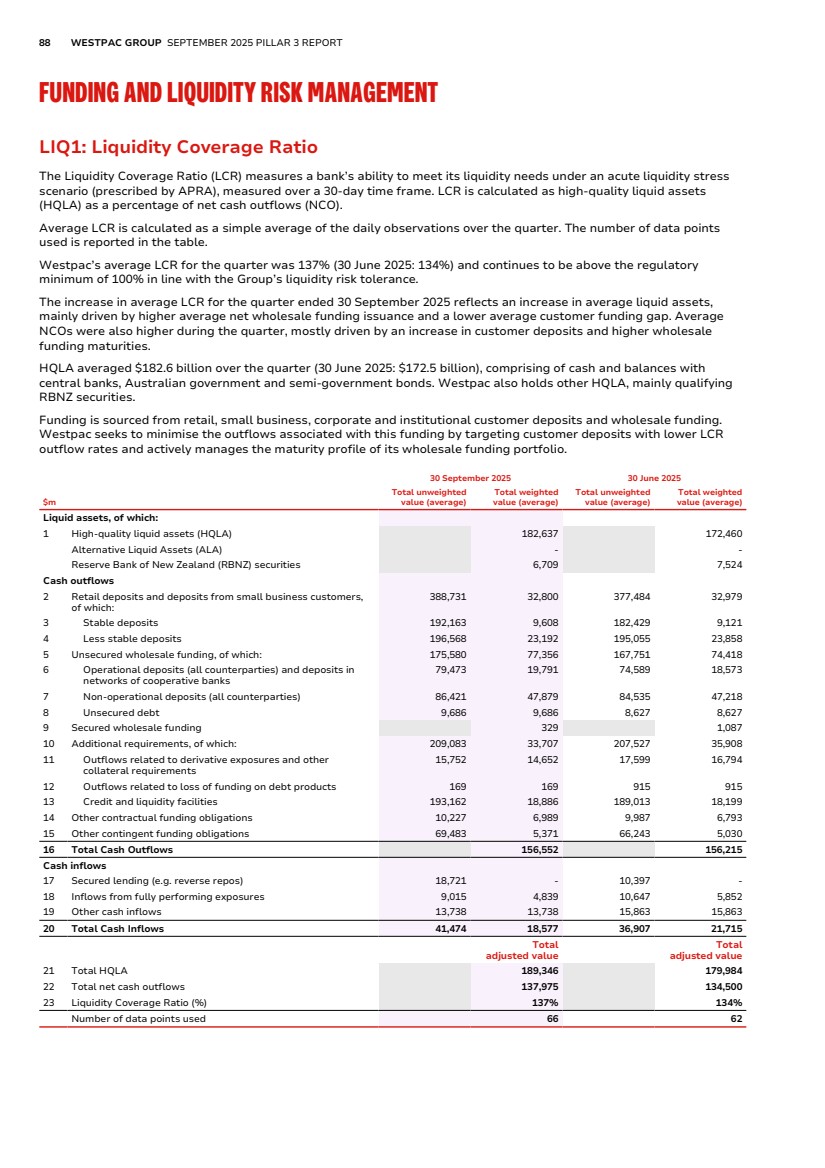
| OVERVIEW CREDIT RISK OTHER RISKS OTHER INFORMATION 89 LIQ2: Net Stable Funding Ratio LIQ2: Net Stable Funding Ratio The objective of the NSFR is to reduce the funding risk of an ADI over a one-year time horizon by requiring an ADI to fund its activities with sufficiently stable source of funding in order to mitigate the risk of future funding stress. Westpac’s NSFR for the quarter was 113%1 (30 June 2025: 114%) and continues to be above the regulatory minimum of 100%. The decrease in the NSFR for the quarter reflects an increase in RSF of $6.7 billion driven by an increase in loans, alongside an increase in ASF of $5.1 billion driven by growth in customer deposits partially offset by a reduction in wholesale funding. Unweighted value by residual maturity $m No maturity < 6 months 6 months to < 1 year ≥ 1 year Weighted value As at 30 September 2025 Available stable funding (ASF) item 1 Capital: 72,049 - - 39,230 111,280 2 Regulatory capital 72,049 - - 38,176 110,226 3 Other capital instruments - - - 1,054 1,054 4 Retail deposits and deposits from small business customers: 377,842 93,877 579 343 436,038 5 Stable deposits 189,542 30,904 2 4 209,430 6 Less stable deposits 188,300 62,973 577 339 226,608 7 Wholesale funding: 146,312 187,110 48,369 112,410 232,713 8 Operational deposits 77,027 - - - 38,514 9 Other wholesale funding 69,285 187,110 48,369 112,410 194,199 10 Liabilities with matching interdependent assets - - - - - 11 Other liabilities: - 28,454 - 331 330 12 NSFR derivative liabilities 6,642 - - 13 All other liabilities and equity not included in the above categories - 21,812 - 331 330 14 Total ASF 780,361 Required stable funding (RSF) item 15 Total NSFR high-quality liquid assets (HQLA) 5,825 15b Alternative Liquid Assets (ALA) - 15c Reserve Bank of New Zealand (RBNZ) securities 487 16 Deposits held at other financial institutions for operational purposes - - - - - 17 Performing loans and securities: 2,293 65,645 52,235 768,544 634,553 18 Performing loans to financial institutions secured by Level 1 HQLA 2,236 24,547 907 - 5,144 19 Performing loans to financial institutions secured by non-Level 1 HQLA and unsecured performing loans to financial institutions 57 2,444 7,628 30,311 34,549 20 Performing loans to non-financial corporate clients, loans to retail and small business customers, and loans to sovereigns, central banks and public sectors entities (PSEs) - 29,589 34,531 184,509 187,973 21 of which: with a risk weight of less than or equal to 35% under APS 112 - 700 1,106 4,102 3,570 22 Performing residential mortgages - 6,115 6,049 539,214 391,454 23 of which: are standard loans to individuals with a LVR of 80% or below - - - 379,725 246,821 24 Securities that are not in default and do not qualify as HQLA, including exchange-traded equities - 2,950 3,120 14,510 15,433 25 Assets with matching interdependent liabilities - - - - - 26 Other assets: 8,051 7,460 296 42,090 36,422 27 Physical traded commodities, including gold - - 28 Assets posted as initial margin for derivative contracts and contributions to default funds of central counterparties - - 3,186 2,708 29 NSFR derivative assets - - 5,424 - 30 NSFR derivative liabilities before deduction of variation margin posted - - 10,656 2,131 31 All other assets not included in the above categories 8,051 7,460 296 22,824 31,583 32 Off-balance sheet items 219,930 - - 10,700 33 Total RSF 687,987 34 Net Stable Funding Ratio (%) 113% 1. Calculated as total ASF divided by total RSF as at end of the quarter. |
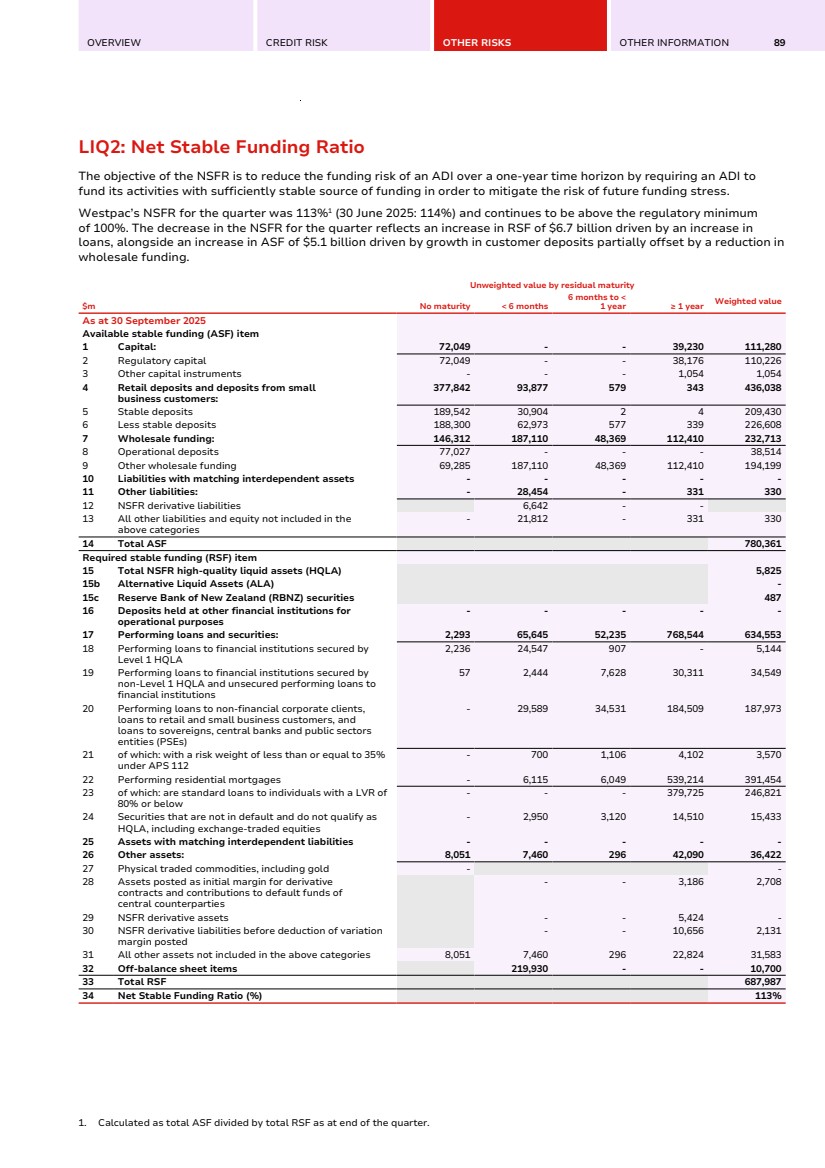
| 90 WESTPAC GROUP SEPTEMBER 2025 PILLAR 3 REPORT FUNDING AND LIQUIDITY RISK MANAGEMENT LIQ2: Net Stable Funding Ratio (Continued) Unweighted value by residual maturity $m No maturity < 6 months 6 months to < 1 year ≥ 1 year Weighted value As at 30 June 2025 Available stable funding (ASF) item 1 Capital: 70,553 - - 41,049 111,602 2 Regulatory capital 70,553 - - 39,936 110,489 3 Other capital instruments - - - 1,113 1,113 4 Retail deposits and deposits from small business customers: 366,503 96,854 678 297 428,282 5 Stable deposits 183,242 32,109 3 4 204,589 6 Less stable deposits 183,261 64,745 675 293 223,693 7 Wholesale funding: 142,987 177,858 55,050 113,589 234,991 8 Operational deposits 79,746 - - - 39,873 9 Other wholesale funding 63,241 177,858 55,050 113,589 195,118 10 Liabilities with matching interdependent assets - - - - - 11 Other liabilities: - 24,113 - 344 344 12 NSFR derivative liabilities 7,208 - - 13 All other liabilities and equity not included in the above categories - 16,905 - 344 344 14 Total ASF 775,219 Required stable funding (RSF) item 15 Total NSFR high-quality liquid assets (HQLA) 5,834 15b Alternative Liquid Assets (ALA) - 15c Reserve Bank of New Zealand (RBNZ) securities 558 16 Deposits held at other financial institutions for operational purposes - - - - - 17 Performing loans and securities: 2,628 63,920 44,056 761,137 627,275 18 Performing loans to financial institutions secured by Level 1 HQLA 2,582 18,196 - - 4,402 19 Performing loans to financial institutions secured by non-Level 1 HQLA and unsecured performing loans to financial institutions 46 3,684 5,731 28,541 32,005 20 Performing loans to non-financial corporate clients, loans to retail and small business customers, and loans to sovereigns, central banks and public sectors entities (PSEs) - 32,906 28,626 181,192 183,820 21 of which: with a risk weight of less than or equal to 35% under APS 112 - 894 1,006 4,293 3,742 22 Performing residential mortgages - 6,007 6,128 535,862 390,430 23 of which: are standard loans to individuals with a LVR of 80% or below - - - 374,133 243,187 24 Securities that are not in default and do not qualify as HQLA, including exchange-traded equities - 3,127 3,571 15,542 16,618 25 Assets with matching interdependent liabilities - - - - - 26 Other assets: 8,077 4,731 269 44,309 37,237 27 Physical traded commodities, including gold - - 28 Assets posted as initial margin for derivative contracts and contributions to default funds of central counterparties - - 3,193 2,714 29 NSFR derivative assets - - 5,024 - 30 NSFR derivative liabilities before deduction of variation margin posted - - 12,897 2,579 31 All other assets not included in the above categories 8,077 4,731 269 23,195 31,944 32 Off-balance sheet items 216,824 - - 10,427 33 Total RSF 681,331 34 Net Stable Funding Ratio (%) 114% |
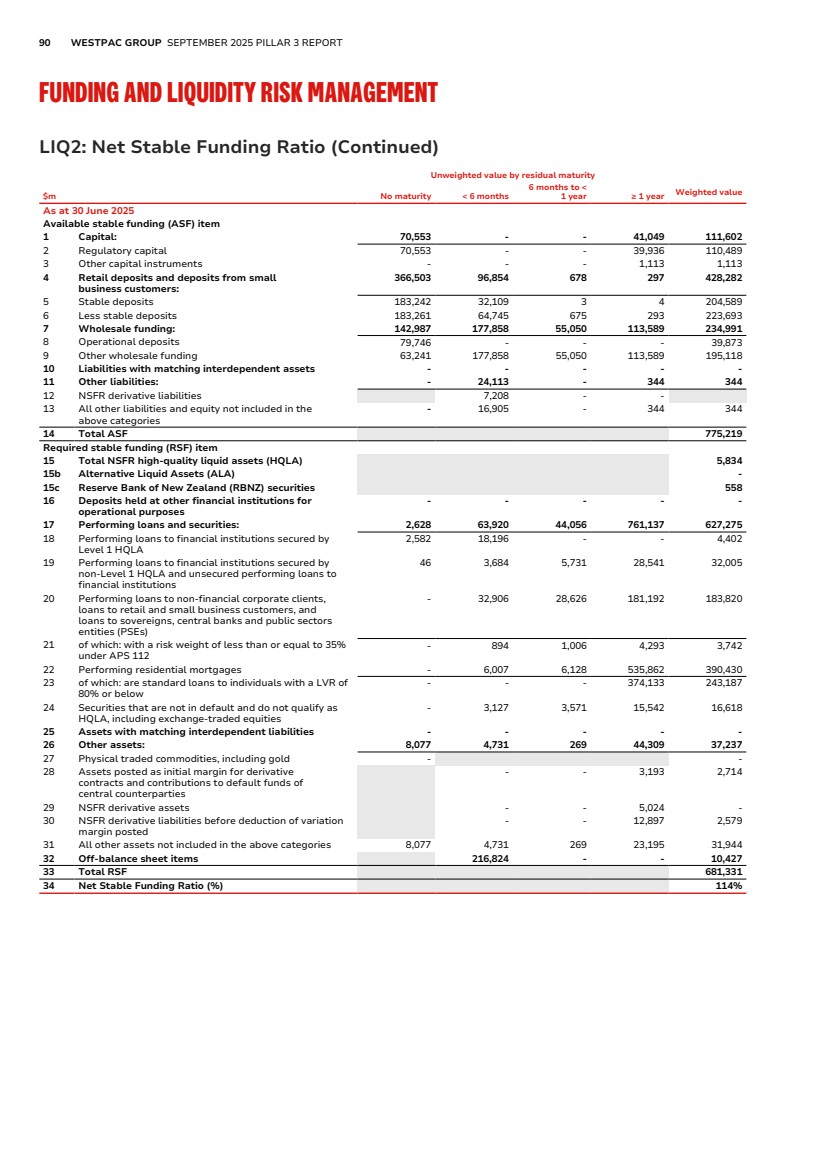
| OVERVIEW CREDIT RISK OTHER RISKS OTHER INFORMATION 91 OTHER INFORMATION PRUDENTIAL DISCLOSURE POLICY MANAGEMENT'S DECLARATION APPENDICES Appendix I – Regulatory capital reconciliation Appendix II – Level 3 entities’ assets and equity Appendix III – Regulatory expected loss GLOSSARY DISCLOSURE REGARDING FORWARD-LOOKING STATEMENTS |

| 92 WESTPAC GROUP SEPTEMBER 2025 PILLAR 3 REPORT PRUDENTIAL DISCLOSURE POLICY Prudential Disclosure Policy This report has been prepared in accordance with Westpac's Prudential Disclosure Policy. This policy defines the framework for the preparation of Pillar 3 disclosures in compliance with APRA’s APS 330 requirements. The policy sets out the processes that ensure the appropriateness, accuracy, completeness, consistency and comparability of Westpac's disclosures. It is supported by the Group’s broader risk frameworks, policies, and procedures and has been approved by Westpac's Board. Key features of the policy include frameworks over: • Accountability and process controls; • The appropriateness of the content contained in the disclosure; • The accuracy and comparability of the disclosure; and • The completeness of the disclosure. Accountability and process controls A standard owner is appointed for each Prudential Standard, and attestation of compliance against their respective standards are provided annually as part of the CPS 220 Risk Management due diligence process. The APS 330 standard owner is responsible for ensuring compliance with APS 330. Standard owners that contribute qualitative and quantitative information required for the Pillar 3 disclosures provide attestations over the accuracy and completeness of the information provided, and the effectiveness of the controls related to their information. The Chief Financial Officer (CFO) is the accountable officer of the Pillar 3 report and authorises its release, under delegation from the Board. The CFO authorisation is based on the processes that underpin the production of the disclosures. In addition to analytical reviews performed by the APS 330 standard owner, each contributing standard owner reviews their respective contribution. Reviews are also performed by senior management, including the CFO, the Chief Risk Officer (CRO), and the Chief Executive Officer (CEO). Prior to any release, the APS 330 standard owner reviews the verification report for completeness, and confirms to the Market Disclosure Officer that the disclosure is suitable for release. External assurance Although Pillar 3 report is not required to be audited, Westpac engages the external auditor to perform limited assurance over the Pillar 3 report in accordance with the Australian Standard on Assurance Engagements ASAE 3000 Assurance Engagements Other than Audits or Reviews of Historical Financial Information and Australian Standard on Review Engagements ASRE 2405 Review of Historical Financial Information Other than a Financial Report issued by the Auditing and Assurance Standards Board. Appropriateness of the content The content of the disclosure is subject to review at each reporting period by Senior Management to determine relevance and alignment with the material risks applicable to the business. For risks that are considered material, management ensures that there are clear and comprehensive disclosures on Westpac's risk management appetite, strategy, processes and measurement, which are reported in the annual Pillar 3 report. Accuracy and comparability of disclosure Prior to the submission of information to APRA, the team generating the information conducts a meeting with the respective standard owners and the business to assess accuracy and alignment with their understanding of drivers. In addition to controls over verifications, the APS 330 standard owner (or their delegate) overviews and assesses: • Comparability across other disclosures such as those contain in Westpac's Financial Reports and submissions to APRA; and • The materiality of any matters impacting disclosure brought to their attention and whether adjustments are required. Completeness of disclosure Prior to each reporting period, Westpac completes an assessment of the reporting requirements and updates the report as required, which is approved by the APS 330 standard owner. |
| OVERVIEW CREDIT RISK OTHER RISKS OTHER INFORMATION 93 MANAGEMENT'S DECLARATION Management's Declaration I hereby certify that the information set out in the September 2025 Pillar 3 report has been prepared in accordance with Westpac's disclosure policy and complying with the requirements of the Australian Prudential Standards, APS 330 Public Disclosure. Nathan Goonan Chief Financial Officer Sydney 2 November 2025 |

| 94 WESTPAC GROUP SEPTEMBER 2025 PILLAR 3 REPORT APPENDICES Appendix I – Regulatory capital reconciliation Appendices Appendix I – Regulatory capital reconciliation Below are details of the Reconciliation of regulatory capital to balance sheet (CC2) and the Composition of regulatory capital (CC1). $m 30 September 2025 Capital disclosure template reference (CC1) Table a Deferred Tax Assets Total Tax Assets per Group Balance Sheet 2,078 Less: Current tax assets (20) Total Deferred Tax Assets per Group Balance Sheet 2,058 Add: Adjustments required in accordance with APRA prudential standardsa 974 Total Deferred Tax Assets after regulatory adjustments 3,032 Row 26e Less: Amounts below prescribed threshold - risk weighted (3,032) Row 75 Total per Capital Disclosure Template - Deferred Tax Asset - Row 21 / 25 Table b Goodwill and other intangible assets Total Goodwill and Intangibles Assets per Level 2 Regulatory Balance Sheet 10,457 Less: Deferred Tax Liability associated with goodwill and other intangible assetsb (293) Less: Capitalised Software Disclosed Under Intangibles (2,304) Row 9 Total per Capital Disclosure Template - Goodwill 7,860 Row 8 Table c Equity Investments Equity Investments in non-consolidated subsidiaries 75 Total Significant Investment in financial entities 75 Row 73 Non-significant Investment in financial entities 152 Row 72 Total Investments in financial institutions 227 Row 26d Investment in commercial entities 75 Row 26g Total Equity Investments before applying prescribed threshold 302 Less: Amounts below prescribed threshold (302) Total per Capital Disclosure Template - Equity Investments - Row 18 / 19 / 23 Table d Additional Tier 1 Capital Total Loan Capital per Level 2 Regulatory Balance Sheet 39,970 Less: Tier 2 Capital Instruments Reported Below (31,435) Add: Capitalised Issue Costs for Additional Tier 1 Capital Instrumentsc 39 Add: Fair Value Adjustmentd 55 Total per Capital Disclosure Template - Additional Tier 1 Capital 8,629 Row 36 Additional Tier 1 Capital included in Regulatory Capital USD AT1 securities 1,897 Westpac Capital Notes 7 1,723 Westpac Capital Notes 8 1,750 Westpac Capital Notes 9 1,509 Westpac Capital Notes 10 1,750 Total per Capital Disclosure Template - Additional Tier 1 Capital Instruments 8,629 Row 30 a. Represents deferred tax balances associated with reserves ineligible for inclusion in regulatory capital, goodwill and intangibles. b. For the purposes of CC1, Goodwill and other intangibles are presented net of tax. c. Unamortised issue costs relating to capital instruments are netted off against each instrument in the Balance Sheet. For regulatory capital purposes, these capital instruments are shown gross of unamortised issue costs. The unamortised issue costs are deducted from CET1 as part of capitalised expenses in Row 26f in CC1. d. For regulatory capital purposes, APRA requires these instruments to be included as if they were unhedged. |
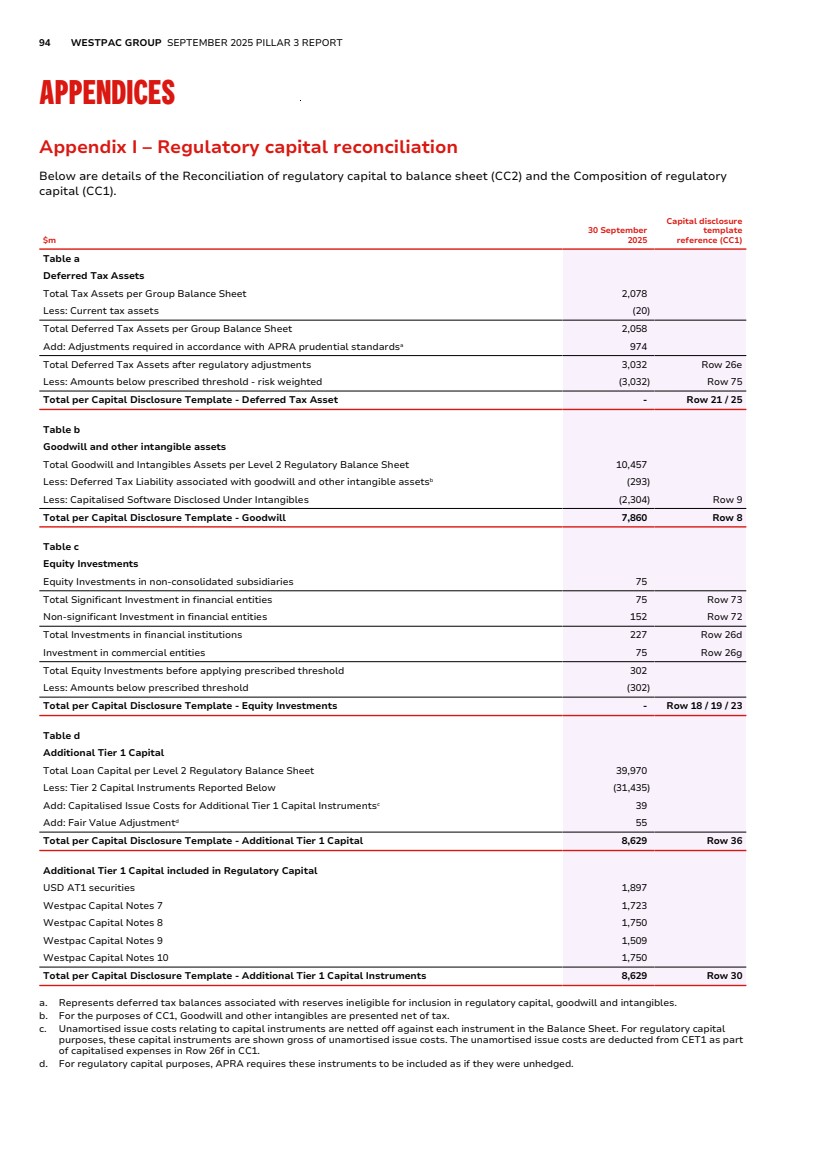
| OVERVIEW CREDIT RISK OTHER RISKS OTHER INFORMATION 95 Appendix I – Regulatory capital reconciliation (Continued) $m 30 September 2025 Capital disclosure template reference (CC1) Table e Tier 2 Capital Total Tier 2 Capital per Level 2 Regulatory Balance Sheet 31,435 Add: Capitalised Issue Costs for Tier 2 Capital Instrumentsa 51 Add: Fair Value Adjustmentb 1,970 Less: Cumulative amortisation of Tier 2 Capital Instrumentsc (329) Less: Loan capital not recognised for APRA purposes (1,049) Provisions 801 Row 50 / 76 & 78 Total per Capital Disclosure Template - Tier 2 Capital 32,879 Row 51 Tier 2 Capital included in Regulatory Capital USD 100 million Westpac Subordinated Notes 152 JPY 20,000 million Westpac Subordinated Notes 41 JPY 10,200 million Westpac Subordinated Notes 22 JPY 10,000 million Westpac Subordinated Notes 21 USD 1,500 million Westpac Subordinated Notes 2,273 AUD 185 million Westpac Subordinated Notes 185 AUD 130 million Westpac Subordinated Notes 130 USD 1,000 million Westpac Subordinated Notes 1,515 USD 1,250 million Westpac Subordinated Notes 1,894 USD 1,000 million Westpac Subordinated Notes 1,515 USD 1,500 million Westpac Subordinated Notes 2,273 AUD 1,250 million Westpac Subordinated Notes 1,250 EUR 1,000 million Westpac Subordinated Notes 1,779 USD 1,000 million Westpac Subordinated Notes 1,515 USD 1,250 million Westpac Subordinated Notes 1,894 JPY 26,000 million Westpac Subordinated Notes 266 USD 1,000 million Westpac Subordinated Notes 1,515 SGD 450 million Westpac Subordinated Notes 528 AUD 1,500 million Westpac Subordinated Notes 1,500 AUD 300 million Westpac Subordinated Notes 300 AUD 1,100 million Westpac Subordinated Notes 1,100 AUD 1,500 million Westpac Subordinated Notes 1,500 USD 750 million Westpac Subordinated Notes 1,137 AUD 650 million Westpac Subordinated Notes 650 AUD 600 million Westpac Subordinated Notes 600 AUD 500 million Westpac Subordinated Notes 500 AUD 1,000 million Westpac Subordinated Notes 1,000 USD 1,500 million Westpac Subordinated Notes 2,273 AUD 850 million Westpac Subordinated Notes 850 AUD 400 million Westpac Subordinated Notes 400 AUD 1,500 million Westpac Subordinated Notes 1,500 Total Tier 2 Capital Instruments 32,078 Row 46 Provisions 801 Row 50 / 76 & 78 Total per Capital Disclosure Template - Tier 2 Capital 32,879 Row 51 Table f Accumulated Other Comprehensive Income (and other reserves) Total reserves per Level 2 Regulatory Balance Sheet 1,669 Less: Share Based Payment Reserve not included within capital (38) Total per Capital Disclosure Template - Accumulated Other Comprehensive Income (and other reserves) 1,631 Row 3 Table g Non-controlling interests Non-controlling interests per Level 2 Regulatory Balance Sheet 327 Less: Ineligible Non-controlling interests (324) Total per Capital Disclosure Template - Ordinary share capital issued by subsidiaries and held by third parties (amount allowed in group CET1) 3 Row 5 a. Unamortised issue costs relating to capital instruments are netted off against each instrument in the Balance Sheet. For regulatory capital purposes, these capital instruments are shown gross of unamortised issue costs. The unamortised issue costs are deducted from CET1 as part of capitalised expenses in Row 26f in CC1. b. For regulatory capital purposes, APRA requires these instruments to be included as if they were unhedged. c. APRA requires these instruments to be amortised by 20% of the original amount during each of the last five years to maturity. |
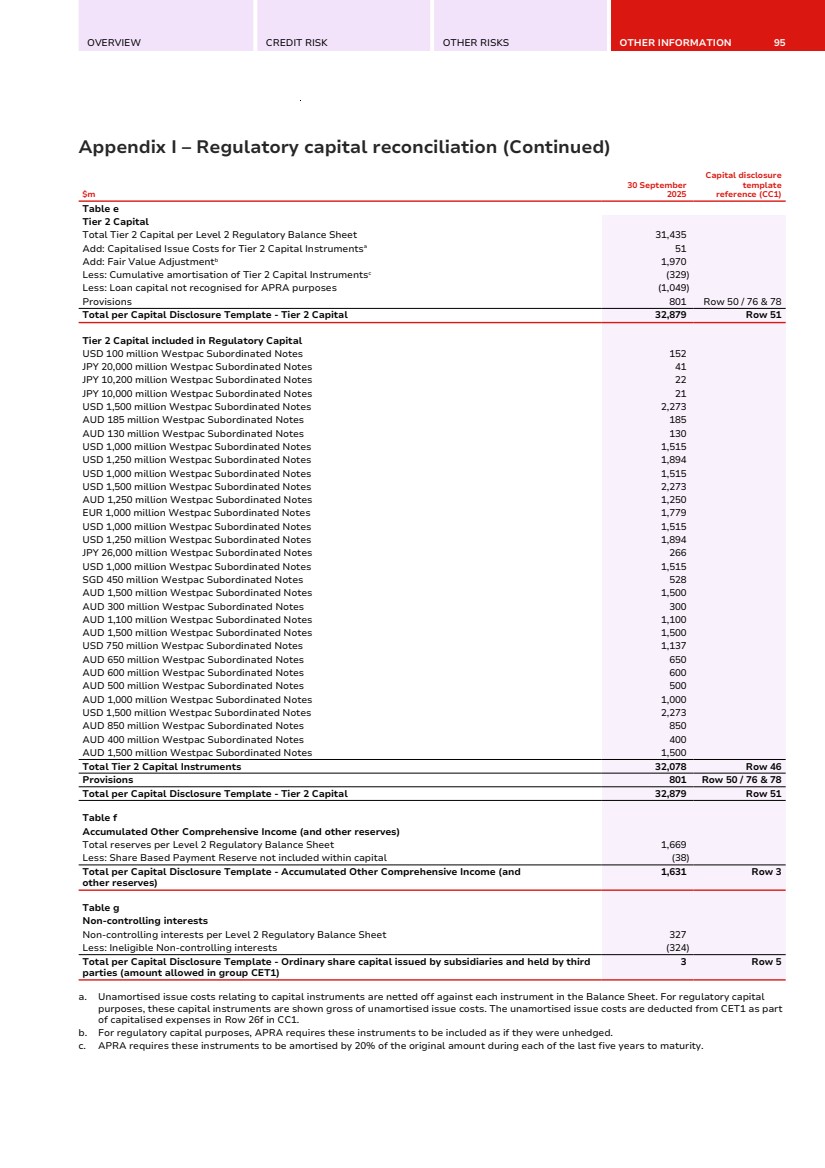
| 96 WESTPAC GROUP SEPTEMBER 2025 PILLAR 3 REPORT APPENDICES Appendix II – Level 3 entities’ assets and equity Appendix II – Level 3 entities’ assets and equity The following legal entities are excluded from the regulatory scope of consolidation. The total assets and equities should not be aggregated, as they are inclusive of inter-company balances between some of the entities in the table shown below. 30 September 2025 Principal activity Total assets ($m) Total equity ($m) Asgard Capital Management Ltd Funds administrator 55 46 BT Funds Management (NZ) Limited Funds management 58 46 BT Funds Management Limited Registrable Superannuation Entity Licensee and Trustee 172 18 BT Funds Management No. 2 Limited Responsible Entity 10 8 BT Portfolio Services Ltd Funds administrator 128 68 GIS Private Nominees Pty Limited Investment services 17 13 Healthpoint Claims Pty. Limited Electronic health claims processing 40 38 Hyde Potts Insurance Services Pte. Limited Insurance 89 79 Pendal Short Term Income Fund Trust 149 - Red Bird Ventures Limited Venture capital investments 10 11 Reinventure Fund, I.L.P. Venture capital investments 92 78 Reinventure Fund II I.L.P. Venture capital investments 92 91 Reinventure Fund III I.L.P Venture capital investments 42 42 Reinventure Special Purpose Investment Unit Trust Venture capital investments 43 42 Securitor Financial Group Pty Limited Dormant 4 4 Westpac Financial Services Limited Responsible Entity 23 15 Westpac New Zealand Staff Superannuation Scheme Trustee Limited Trustee - - |
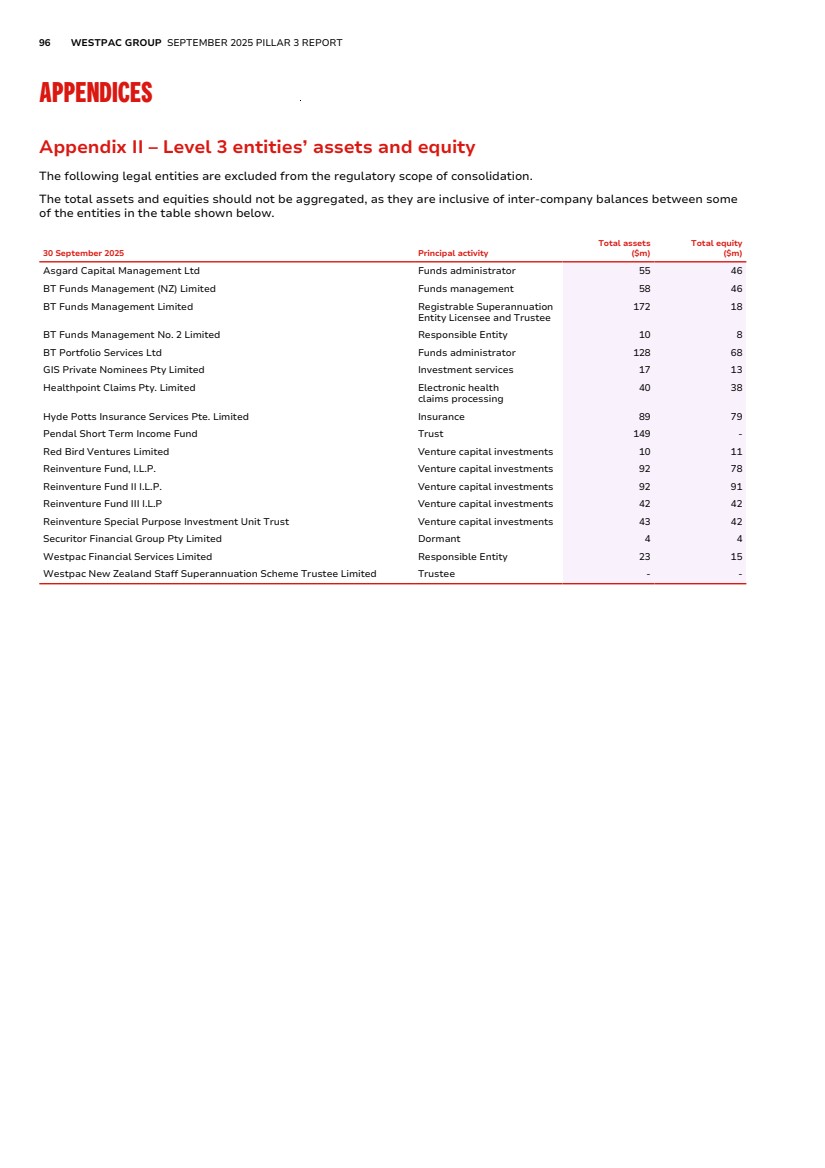
| OVERVIEW CREDIT RISK OTHER RISKS OTHER INFORMATION 97 Appendix III – Regulatory expected loss Appendix III – Regulatory expected loss Capital deduction for regulatory expected loss For capital adequacy purposes APRA requires the amount of regulatory expected credit losses in excess of eligible provisions to be deducted from capital. The following table shows how the deduction is calculated. 30 September 31 March 30 September $m 2025 2025 2024 Provisions associated with eligible portfolios Total provisions for impairment charges 4,987 5,072 5,096 plus provisions associated with partial write-offs 306 297 290 less ineligible provisionsa (158) (197) (201) Total eligible provisions 5,135 5,172 5,185 Regulatory expected downturn loss 4,350 4,504 4,486 Excess/(shortfall) in eligible provisions compared to regulatory expected downturn loss 785 668 699 Common equity Tier 1 capital deduction for regulatory expected downturn loss in excess of eligible provisionsb - - - a. Provisions associated with portfolios subject to the Basel standardised approach to credit risk are not eligible. b. Regulatory expected loss is calculated for portfolios subject to the IRB approach to credit risk. The comparison between regulatory expected loss and eligible provisions is performed separately for defaulted and non-defaulted exposures. |
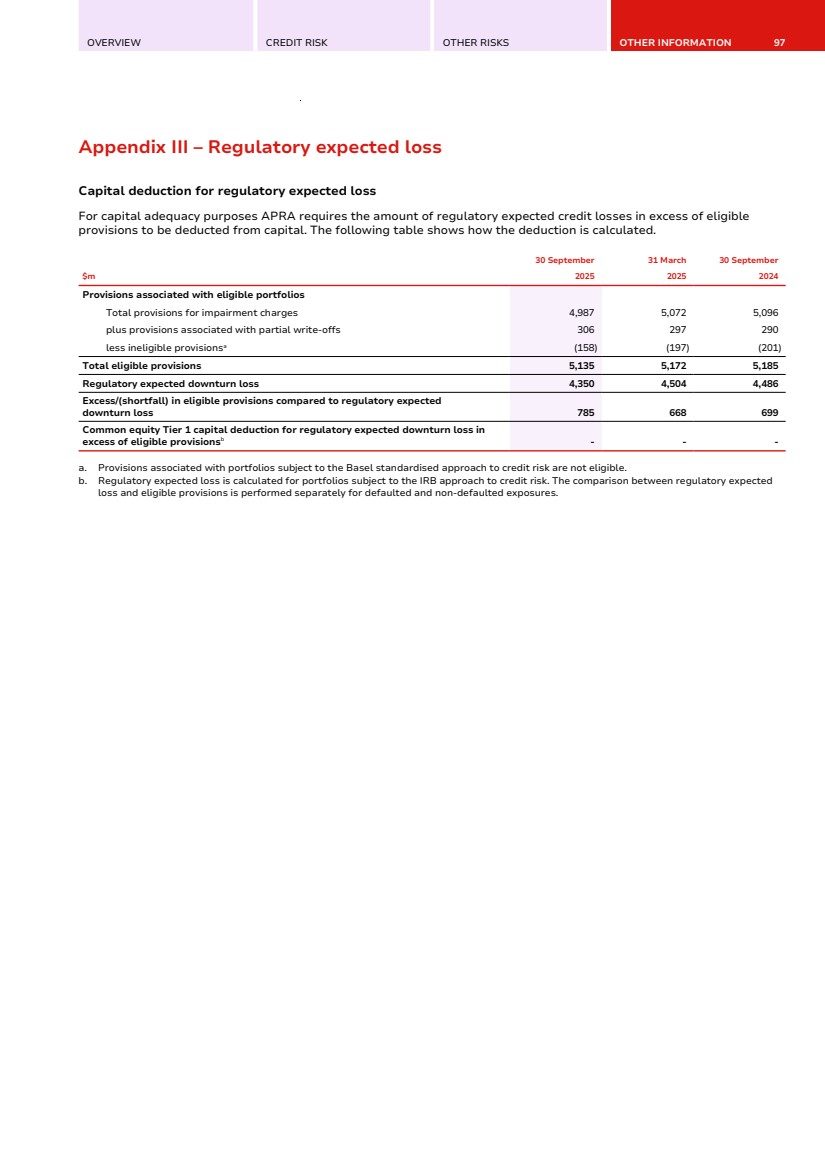
| 98 WESTPAC GROUP SEPTEMBER 2025 PILLAR 3 REPORT GLOSSARY Glossary Capital Adequacy Description Common Equity Tier 1 (CET1) Capital Comprises the highest quality components of capital that consists of paid-up share capital, retained profits and certain reserves, less certain intangible assets, capitalised expenses and software, and investments and retained profits in insurance and funds management subsidiaries that are not consolidated for capital adequacy purposes. Internal Ratings-Based approach (IRB & A-IRB) These approaches allow banks to use internal estimates of the risks of their loans as inputs into the determination of the amount of credit risk capital needed to support the organisation. In the Advanced IRB (A-IRB) approach, banks must supply their own estimates for all three credit parameters – probability of default, loss given default and exposure at default. Leverage ratio The leverage ratio is defined by APRA as Tier 1 capital divided by the “Exposure measure” and is expressed as a percentage. “Exposure measure” includes on-balance sheet exposures, derivatives exposures, securities financing transaction (SFT) exposures, and other off-balance sheet exposures. Risk weighted assets (RWA) Assets (both on and off-balance sheet) are risk weighted according to each asset’s inherent potential for default and what the likely losses would be in case of default. In the case of non-asset backed risks (i.e. market, IRRBB and operational risk), RWA is determined by multiplying the capital requirements for those risks by 12.5. Securities financing transactions (SFT) APRA defines SFTs as “transactions such as repurchase agreements, reverse repurchase agreements, and security lending and borrowing, and margin lending transactions, where the value of the transactions depends on the market valuation of securities and the transactions are typically subject to margin agreements.” Tier 1 Capital The sum of CET1 and Additional Tier 1 (AT1) Capital. AT1 Capital comprises high quality components of capital that consists of certain securities not included in CET1, but which include loss absorbing characteristics. AT1 instruments convert into equity and absorb losses when certain triggers are met. Total Capital The sum of Tier 1 Capital and Tier 2 Capital. Tier 2 Capital includes subordinated instruments and other components of capital that, to varying degrees, do not meet the criteria for Tier 1 Capital, but nonetheless contribute to the overall strength of an ADI and its capacity to absorb losses when certain triggers are met. Funding and liquidity Alternative Liquid Assets (ALA) Assets that qualify for inclusion in the numerator of the LCR in jurisdictions where there is insufficient supply of HQLA. High-quality liquid assets (HQLA) Assets which meet APRA’s criteria for inclusion as HQLA in the numerator of the LCR. Liquidity coverage ratio (LCR) An APRA requirement to maintain an adequate level of unencumbered high-quality liquid assets, to meet liquidity needs for a 30 calendar day period under an APRA-defined severe stress scenario. Absent a situation of financial stress, the value of the LCR must not be less than 100%. LCR is calculated as the percentage ratio of stock of HQLA, and qualifying RBNZ securities over the total net cash out-flows in a modelled 30 day defined stressed scenario. Maturity The maturity date used is drawn from the contractual maturity date of the customer loans. Net cash outflows (NCO) Total expected cash outflows minus total expected cash inflows in the specified LCR stress scenario calculated in accordance with APRA’s liquidity standard. Net Stable Funding Ratio (NSFR) The NSFR is defined as the ratio of the amount of available stable funding (ASF) to the amount of required stable funding (RSF) defined by APRA. The amount of ASF is the portion of an ADI’s capital and liabilities expected to be a reliable source of funds over a one year time horizon. The amount of RSF is a function of the liquidity characteristics and residual maturities of an ADI’s assets and off-balance sheet activities. ADI’s must maintain an NSFR of at least 100%. Credit Risk Description Credit conversion factor (CCF) Represents the proportion of undrawn limit expected to be drawn down when a facility enters default. Credit valuation adjustment (CVA) risk The risk of mark-to-market losses related to deterioration in the credit quality of a derivative counterparty also referred to as credit valuation adjustment (CVA) risk. Default Refer to non-performing exposures definition. Expected credit losses (ECL) Expected credit losses are a probability-weighted estimate of the cash shortfalls expected to result from defaults over the relevant time frame. They are determined by evaluating a range of possible outcomes and taking into account the time value of money, past events, current conditions and forecasts of future economic conditions. Exposure at default (EAD) EAD is calculated at facility level and includes outstandings as well as the proportion of committed undrawn that is expected to be drawn in the event of a future default. Industry Credit exposures in non-retail asset subclasses are assigned an ANZSIC code based on their primary industry. ANZSIC codes are then allocated to disclosed industry groups. Credit exposures in retail asset subclasses are classified as “retail lending”. Non-performing exposures Credit exposures that are captured by the regulatory definition of default as outlined in section CR1. Off-balance sheet exposure Credit exposures arising from facilities that are not recorded on Westpac's balance sheet (under accounting methodology). Undrawn commitments and the expected future exposure calculated for Westpac's derivative products are included in off-balance sheet exposure. On-balance sheet exposure Credit exposures arising from facilities that are recorded on Westpac's balance sheet (under accounting methodology). Probability of default (PD) Probability of default is a through-the-cycle assessment of the likelihood of a customer defaulting on its financial obligations within one year. |
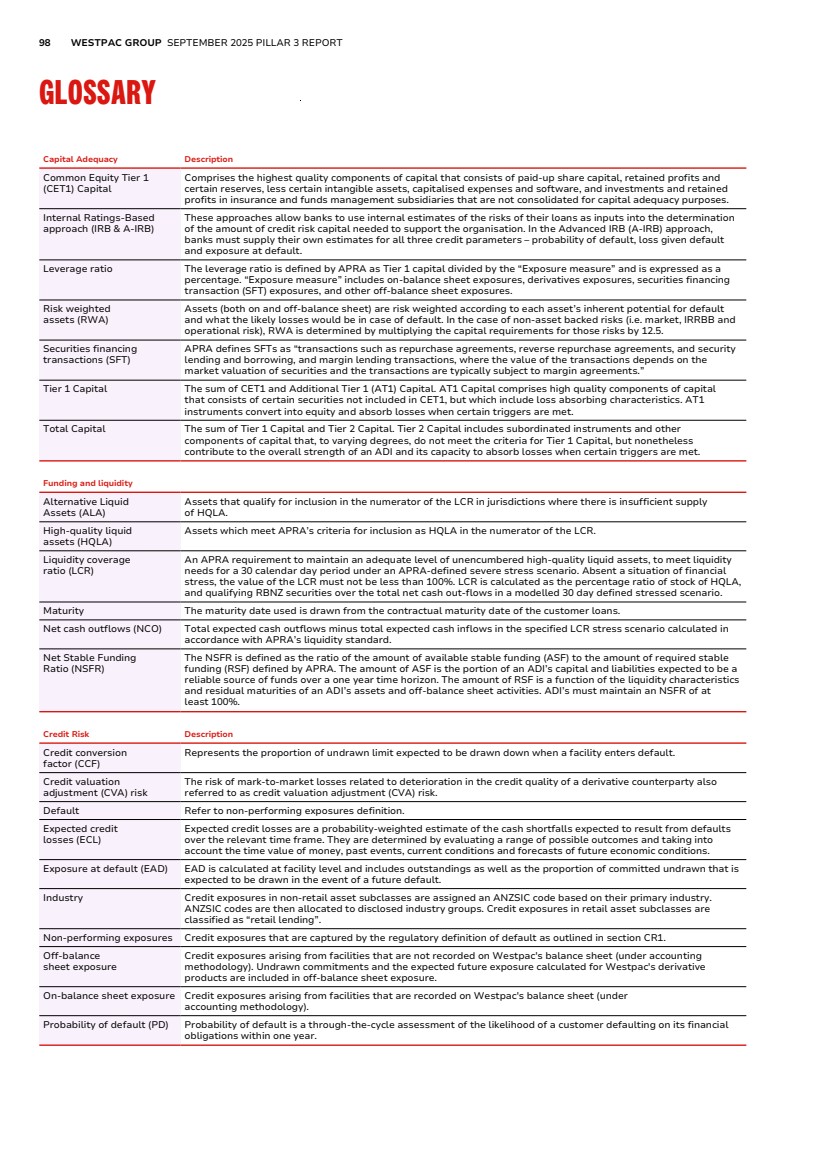
| OVERVIEW CREDIT RISK OTHER RISKS OTHER INFORMATION 99 Securitisation Description Banking book The banking book includes all securities that are not actively traded by Westpac. Sponsor An ADI would generally be considered a sponsor if it, in fact or substance, manages or advises the securitisation program, places securities into the market, or provides liquidity and/or credit enhancements. Synthetic securitisation A securitisation whereby the credit risk, or part of the credit risk, of a pool is transferred to a third party which need not be an SPV. The transfer of credit risk can be undertaken through the use of funded (e.g. credit linked notes) or unfunded (e.g. credit default swaps) credit derivatives or guarantees. Trading book Trading book activity represents positions in financial instruments, including derivative products and other off-balance sheet instruments, that are held either with trading intent or to hedge other elements of the trading book. Market Risk Risks-not-in-VaR (RNIV) The RNIV framework is a component of APRA’s APS 116 internal model approach for market risk regulatory capital. Value at risk (VaR) VaR is a measure of the potential loss in economic value arising from adverse market movements and is calculated over a defined time horizon (typically 1-day or 1-year) at a 99% confidence interval using a minimum of one year of historical data. VaR takes account of all material market variables that may cause a change in the value of the trading portfolio or the banking book including interest rates, foreign exchange rates, price changes, volatility, and the correlation among these variables. Interest rate risk in the banking book Interest rate risk in the banking book (IRRBB) The risk of loss in earnings or economic value in the banking book as a consequence of movements in interest rates. |

| 100 WESTPAC GROUP SEPTEMBER 2025 PILLAR 3 REPORT GLOSSARY Other Description AASB Australian Accounting Standards Board ADI Authorised deposit-taking institutions are corporations that are authorised under the Banking Act 1959 to carry on banking business in Australia. A-IRB Advanced Internal Ratings-Based Approach ALCO Westpac Group Asset and Liability Committee APRA Australian Prudential Regulation Authority APS Australian Prudential Standard ASF Available Stable Funding BCBS Basel Committee on Banking Supervision BI Business indicator BIC Business indicator component BRiskC Board Risk Committee CCF Credit Conversion Factor CCP Central counterparty CCR Counterparty Credit Risk CREDCO Westpac Credit Risk Committee CRG Customer risk grade CRM Credit Risk Mitigation DRE Derivative Risk Equivalent methodology D-SIB Domestic Systemically Important Bank DTA Deferred tax assets EL Expected losses ELE An extended licensed entity (ELE) comprises an ADI and any subsidiaries of the ADI that have been approved by APRA as being part of a single ‘stand-alone’ entity. EPE Expected Positive Exposure ERBA External Rating Based Approach F-IRB Foundation Internal Ratings-Based Approach G-SIB Global Systemically Important Bank ILM Internal loss multiplier IPRE Income-producing residential real estate LGD Loss given default LVR Loan-to-valuation ratio MARCO Westpac Group Market Risk Committee MSR Mortgage servicing rights OF Object finance OTC Over-the-counter PF Project finance QCCPs Qualifying central counterparties RBA Reserve Bank of Australia RBNZ Reserve Bank of New Zealand RC Revaluation Committee RISKCO Westpac Group Executive Risk Committee RSF Required Stable Funding SA Standardised Approach SA-CCR Standardised Approach for counterparty credit risk SFA Supervisory Formula Approach SMA Standardised Measurement Approach SME Small and medium sized enterprise SVaR Stressed Value at Risk TLAC Total loss-absorbing capacity WNZL Westpac New Zealand Limited XVA X-Value Adjustment |
| OVERVIEW CREDIT RISK OTHER RISKS OTHER INFORMATION 101 DISCLOSURE REGARDING FORWARD-LOOKING STATEMENTS Disclosure regarding forward-looking statements The information contained in this report contains statements that constitute “forward-looking statements” within the meaning of section 21E of the U.S. Securities Exchange Act of 1934. Forward-looking statements are statements that are not historical facts. Forward-looking statements appear in a number of places in this report and include statements regarding Westpac’s current intent, belief or expectations with respect to its business and operations, macro and micro economic and market conditions, results of operations and financial condition and performance, capital adequacy and liquidity and risk management, including, without limitation, future loan loss provisions and financial support to certain borrowers, forecasted economic indicators and performance metric outcomes, indicative drivers, climate- and other sustainability-related statements, commitments, targets, projections and metrics, and other estimated and proxy data. Words such as ‘will’, ‘may’, ‘expect’, ‘intend’, ‘seek’, ‘would’, ‘should’, ‘could’, ‘continue’, ‘plan’, ‘estimate’, ‘anticipate’, ‘believe’, ‘probability’, ‘indicative’, ‘risk’, ‘aim’, ‘outlook’, ‘forecast’, ‘f’cast’, ‘f’, ‘assumption’, ‘projection’, ‘target,’ goal’, ‘guidance’, 'objective', ‘ambition’ or other similar words, are used to identify forward-looking statements. These statements reflect Westpac’s current views on future events and are subject to change, certain known and unknown risks, uncertainties and assumptions and other factors which are, in many instances, beyond Westpac’s control (and the control of Westpac’s officers, employees, agents, and advisors), and have been made based on management’s and/or the Board's current expectations or beliefs concerning future developments and their potential effect upon Westpac. Forward-looking statements may also be made, verbally or in writing, by members of Westpac’s management or Board in connection with this report. Such statements are subject to the same limitations, uncertainties, assumptions and disclaimers set out in this report. There can be no assurance that future developments or performance will align with Westpac’s expectations or that the effect of future developments on Westpac will be those anticipated. Actual results could differ materially from those Westpac expects or which are expressed or implied in forward-looking statements, depending on various factors including, but not limited to, those described in the risk factors in Westpac’s 2025 Risk Factors. When relying on forward-looking statements to make decisions with respect to Westpac, investors and others relying on information in this report should carefully consider such factors and other uncertainties and events. Except as required by law, Westpac assumes no obligation to revise or update any forward-looking statements in this report, whether from new information, future events, conditions or otherwise, after the date of this report. |

| WESTPAC.COM.AU |