| FINANCIAL REPORT EXHIBITS INDEX STRATEGIC REVIEW PERFORMANCE REVIEW EXHIBIT 15.4 ADDITIONAL INFORMATION 143 EXHIBIT 15.3 Exhibit 15.3 Westpac Group 2025 Annual Report on Form 20-F Section 1 144 Strategic review 144 Corporate governance 188 Directors’ report 208 Remuneration report 222 Risk factors 254 Information on Westpac 268 Section 2 Financial statements 287 Section 3 289 Reading this report 290 Shareholder information 302 Other Westpac business information 321 Glossary of abbreviations and defined terms 324 |
| 144 WESTPAC GROUP 2025 ANNUAL REPORT ABOUT WESTPAC As Australia's first bank, we've been taking action to support people, businesses and communities for more than 200 years. Established in New South Wales in 1817, Westpac has grown to be one of Australia’s largest companies and employers. We’re proud to contribute to the prosperity of Australia and New Zealand. We support 13 million customers with a range of banking products and services, including helping them into homes, starting and growing businesses and supporting large corporates with their banking needs. We help foster stronger, more inclusive communities by promoting financial inclusion and literacy, investing in regional banking services and respecting human rights. Since founding our first charity in 1879, we've broadened our social impact through the independent Foundations and Trusts1 . These have contributed more than $100 million in the past decade to create meaningful change in people’s lives. For our 35,000 employees, we strive to create a workplace where they feel valued, inspired and motivated to reach their potential. As part of our environmental commitment, we support businesses in transitioning to a low-carbon future and adapting to climate change, while continuing to reduce our operational emissions and build climate resilience. This year, we paid $6.6 billion in salaries, $5.2 billion in shareholder dividends, $3.5 billion in taxes and levies and spent $4.74 billion with suppliers inside Australia2 . As we evolve, we're inspired by customers, their needs and our purpose of taking action now to create a better future. Market share AUSTRALIA NEW ZEALAND Household depositsaa 21% Consumer lendingb 18% Mortgagesa 21% Depositsb 17% Business lendinga 16% Business lendingb 16% a. APRA Banking Statistics, September 2025. b. RBNZ, September 2025. 1. In FY25, Westpac Group provided support to the Westpac Community Trust and the Westpac Buckland Fund (known as the Westpac Foundation), Westpac Scholars Trust and the St George Foundation Trust (known as St George Foundation, BankSA Foundation and the Bank of Melbourne Foundation). While Westpac was involved in establishing these foundations, they are non-profit organisations that are separate to the Westpac Group. The trustee of St George Foundation Trust (St George Foundation Limited) is a related body corporate of Westpac. 2. Refer to the 2025 Sustainability Index and Datasheet for details. |
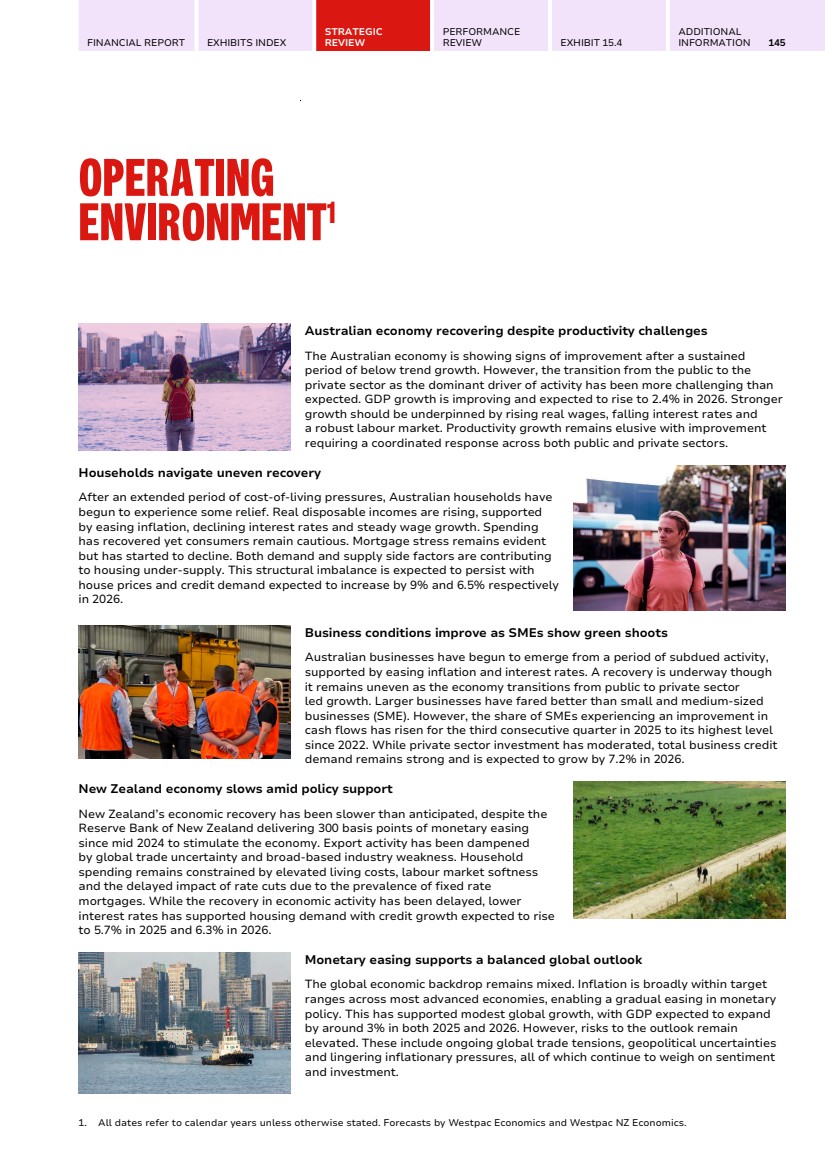
| FINANCIAL REPORT EXHIBITS INDEX STRATEGIC REVIEW PERFORMANCE REVIEW EXHIBIT 15.4 ADDITIONAL INFORMATION 145 OPERATING ENVIRONMENT1 Australian economy recovering despite productivity challenges The Australian economy is showing signs of improvement after a sustained period of below trend growth. However, the transition from the public to the private sector as the dominant driver of activity has been more challenging than expected. GDP growth is improving and expected to rise to 2.4% in 2026. Stronger growth should be underpinned by rising real wages, falling interest rates and a robust labour market. Productivity growth remains elusive with improvement requiring a coordinated response across both public and private sectors. Households navigate uneven recovery After an extended period of cost-of-living pressures, Australian households have begun to experience some relief. Real disposable incomes are rising, supported by easing inflation, declining interest rates and steady wage growth. Spending has recovered yet consumers remain cautious. Mortgage stress remains evident but has started to decline. Both demand and supply side factors are contributing to housing under-supply. This structural imbalance is expected to persist with house prices and credit demand expected to increase by 9% and 6.5% respectively in 2026. Business conditions improve as SMEs show green shoots Australian businesses have begun to emerge from a period of subdued activity, supported by easing inflation and interest rates. A recovery is underway though it remains uneven as the economy transitions from public to private sector led growth. Larger businesses have fared better than small and medium-sized businesses (SME). However, the share of SMEs experiencing an improvement in cash flows has risen for the third consecutive quarter in 2025 to its highest level since 2022. While private sector investment has moderated, total business credit demand remains strong and is expected to grow by 7.2% in 2026. New Zealand economy slows amid policy support New Zealand’s economic recovery has been slower than anticipated, despite the Reserve Bank of New Zealand delivering 300 basis points of monetary easing since mid 2024 to stimulate the economy. Export activity has been dampened by global trade uncertainty and broad-based industry weakness. Household spending remains constrained by elevated living costs, labour market softness and the delayed impact of rate cuts due to the prevalence of fixed rate mortgages. While the recovery in economic activity has been delayed, lower interest rates has supported housing demand with credit growth expected to rise to 5.7% in 2025 and 6.3% in 2026. Monetary easing supports a balanced global outlook The global economic backdrop remains mixed. Inflation is broadly within target ranges across most advanced economies, enabling a gradual easing in monetary policy. This has supported modest global growth, with GDP expected to expand by around 3% in both 2025 and 2026. However, risks to the outlook remain elevated. These include ongoing global trade tensions, geopolitical uncertainties and lingering inflationary pressures, all of which continue to weigh on sentiment and investment. 1. All dates refer to calendar years unless otherwise stated. Forecasts by Westpac Economics and Westpac NZ Economics. |
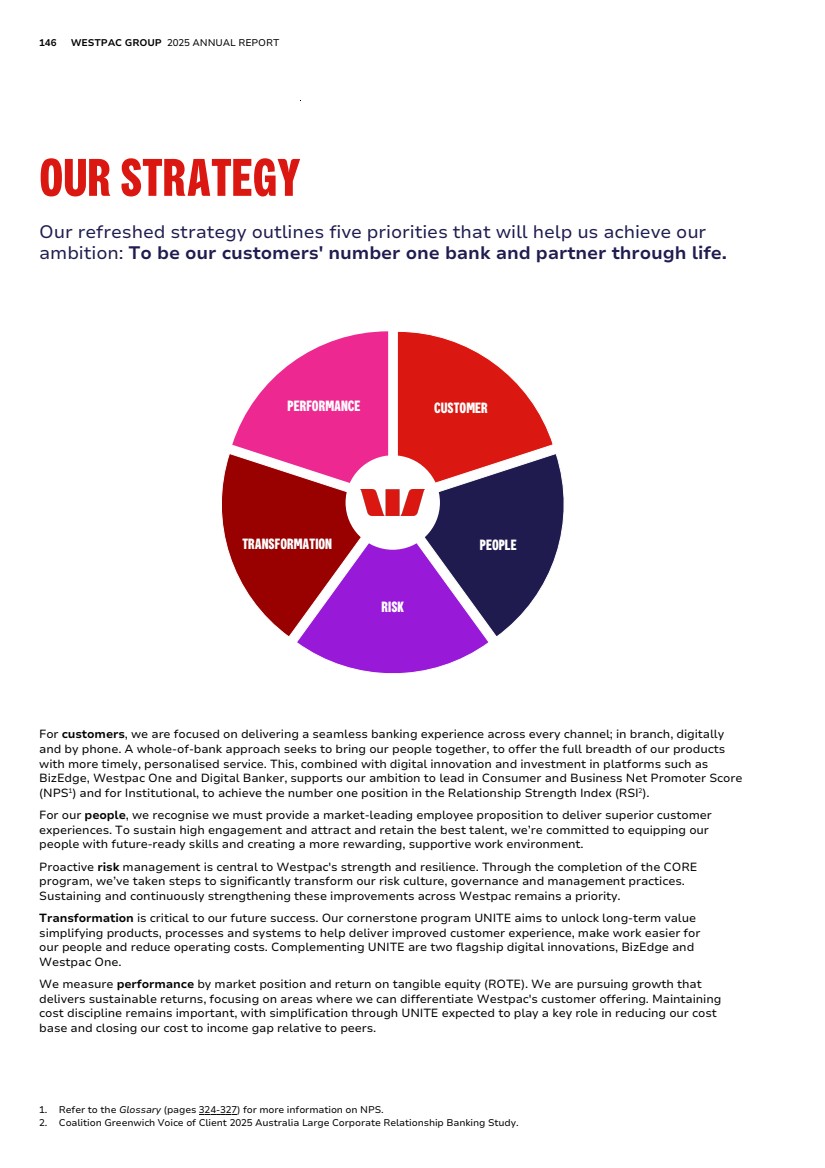
| 146 WESTPAC GROUP 2025 ANNUAL REPORT OUR STRATEGY Our refreshed strategy outlines five priorities that will help us achieve our ambition: To be our customers' number one bank and partner through life. PERFORMANCE CUSTOMER TRANSFORMATION PEOPLE RISK For customers, we are focused on delivering a seamless banking experience across every channel; in branch, digitally and by phone. A whole-of-bank approach seeks to bring our people together, to offer the full breadth of our products with more timely, personalised service. This, combined with digital innovation and investment in platforms such as BizEdge, Westpac One and Digital Banker, supports our ambition to lead in Consumer and Business Net Promoter Score (NPS1 ) and for Institutional, to achieve the number one position in the Relationship Strength Index (RSI2 ). For our people, we recognise we must provide a market-leading employee proposition to deliver superior customer experiences. To sustain high engagement and attract and retain the best talent, we’re committed to equipping our people with future-ready skills and creating a more rewarding, supportive work environment. Proactive risk management is central to Westpac's strength and resilience. Through the completion of the CORE program, we’ve taken steps to significantly transform our risk culture, governance and management practices. Sustaining and continuously strengthening these improvements across Westpac remains a priority. Transformation is critical to our future success. Our cornerstone program UNITE aims to unlock long-term value simplifying products, processes and systems to help deliver improved customer experience, make work easier for our people and reduce operating costs. Complementing UNITE are two flagship digital innovations, BizEdge and Westpac One. We measure performance by market position and return on tangible equity (ROTE). We are pursuing growth that delivers sustainable returns, focusing on areas where we can differentiate Westpac's customer offering. Maintaining cost discipline remains important, with simplification through UNITE expected to play a key role in reducing our cost base and closing our cost to income gap relative to peers. 1. Refer to the Glossary (pages 324-327) for more information on NPS. 2. Coalition Greenwich Voice of Client 2025 Australia Large Corporate Relationship Banking Study. |
| FINANCIAL REPORT EXHIBITS INDEX STRATEGIC REVIEW PERFORMANCE REVIEW EXHIBIT 15.4 ADDITIONAL INFORMATION 147 Foundations for sustainable growth BALANCE SHEET STRENGTH DIVERSIFIED PORTFOLIO EMPLOYEE ENGAGEMENT Capacity to invest and grow for the long term Enviable portfolio mix across four business segments Top quartile of workplaces globally (OHI) Our business segments Segment Who we serve Key execution focus areas Consumer Helping more Australians into their home, save for the future and manage their money through a range of banking products and services offered through the Westpac, St.George, BankSA and Bank of Melbourne brands. • Elevate experiences through personalised, digital first service; • Deepen relationships and expand in priority segments; and • Grow proportion of proprietary lending. Business & Wealth Serving the needs of small to medium businesses, commercial and agribusiness customers across Australia. The segment includes Private Wealth, supporting high-net-worth individuals, as well as BT Financial Group, which provides wealth management platform services. It also includes Westpac Pacific, operating in Fiji and Papua New Guinea. • Continue lending momentum through BizEdge; • Deepen relationships and enhance transaction banking capability; and • Expand banker presence, training and expertise. Institutional Delivering financial services to corporate, institutional and government clients through three areas of specialisation: Corporate & Institutional Banking, Global Transaction Services and Financial Markets. Clients are supported throughout Australia and via branches and subsidiaries located in New Zealand, New York, London, Frankfurt and Singapore. • Rollout Westpac One and payments innovation; • Deepen client relationships and grow share of FX and commodities; and • Invest in expert bankers enabled by data, analytics and AI. New Zealand Providing banking and wealth services for consumer, business and institutional customers in New Zealand, through the Westpac New Zealand, Westpac Life and BT Funds Management (NZ) brands. • Target growth in business lending; • Invest in digital capability; and • Improve market position and returns. |

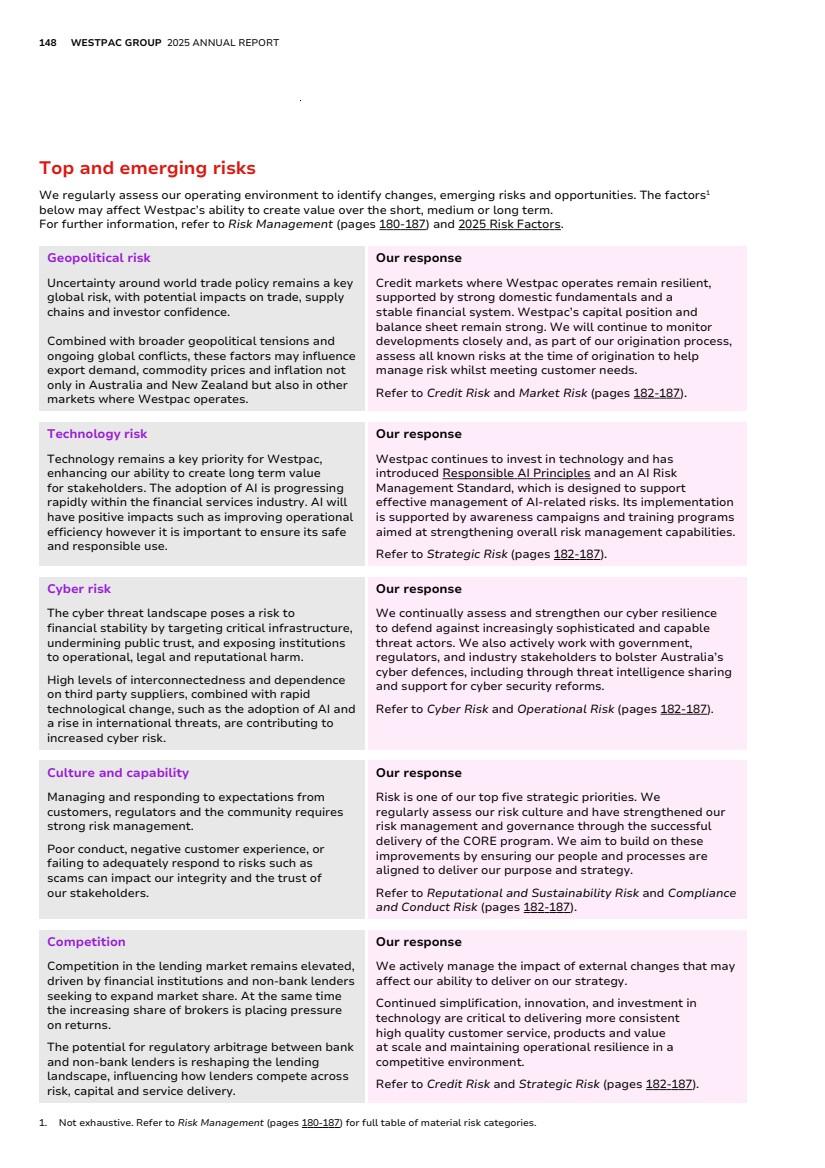
| 148 WESTPAC GROUP 2025 ANNUAL REPORT Top and emerging risks We regularly assess our operating environment to identify changes, emerging risks and opportunities. The factors1 below may affect Westpac’s ability to create value over the short, medium or long term. For further information, refer to Risk Management (pages 180-187) and 2025 Risk Factors. Geopolitical risk Uncertainty around world trade policy remains a key global risk, with potential impacts on trade, supply chains and investor confidence. Combined with broader geopolitical tensions and ongoing global conflicts, these factors may influence export demand, commodity prices and inflation not only in Australia and New Zealand but also in other markets where Westpac operates. Our response Credit markets where Westpac operates remain resilient, supported by strong domestic fundamentals and a stable financial system. Westpac’s capital position and balance sheet remain strong. We will continue to monitor developments closely and, as part of our origination process, assess all known risks at the time of origination to help manage risk whilst meeting customer needs. Refer to Credit Risk and Market Risk (pages 182-187). Technology risk Technology remains a key priority for Westpac, enhancing our ability to create long term value for stakeholders. The adoption of AI is progressing rapidly within the financial services industry. AI will have positive impacts such as improving operational efficiency however it is important to ensure its safe and responsible use. Our response Westpac continues to invest in technology and has introduced Responsible AI Principles and an AI Risk Management Standard, which is designed to support effective management of AI-related risks. Its implementation is supported by awareness campaigns and training programs aimed at strengthening overall risk management capabilities. Refer to Strategic Risk (pages 182-187). Cyber risk The cyber threat landscape poses a risk to financial stability by targeting critical infrastructure, undermining public trust, and exposing institutions to operational, legal and reputational harm. High levels of interconnectedness and dependence on third party suppliers, combined with rapid technological change, such as the adoption of AI and a rise in international threats, are contributing to increased cyber risk. Our response We continually assess and strengthen our cyber resilience to defend against increasingly sophisticated and capable threat actors. We also actively work with government, regulators, and industry stakeholders to bolster Australia’s cyber defences, including through threat intelligence sharing and support for cyber security reforms. Refer to Cyber Risk and Operational Risk (pages 182-187). Culture and capability Managing and responding to expectations from customers, regulators and the community requires strong risk management. Poor conduct, negative customer experience, or failing to adequately respond to risks such as scams can impact our integrity and the trust of our stakeholders. Our response Risk is one of our top five strategic priorities. We regularly assess our risk culture and have strengthened our risk management and governance through the successful delivery of the CORE program. We aim to build on these improvements by ensuring our people and processes are aligned to deliver our purpose and strategy. Refer to Reputational and Sustainability Risk and Compliance and Conduct Risk (pages 182-187). Competition Competition in the lending market remains elevated, driven by financial institutions and non-bank lenders seeking to expand market share. At the same time the increasing share of brokers is placing pressure on returns. The potential for regulatory arbitrage between bank and non-bank lenders is reshaping the lending landscape, influencing how lenders compete across risk, capital and service delivery. Our response We actively manage the impact of external changes that may affect our ability to deliver on our strategy. Continued simplification, innovation, and investment in technology are critical to delivering more consistent high quality customer service, products and value at scale and maintaining operational resilience in a competitive environment. Refer to Credit Risk and Strategic Risk (pages 182-187). 1. Not exhaustive. Refer to Risk Management (pages 180-187) for full table of material risk categories. |
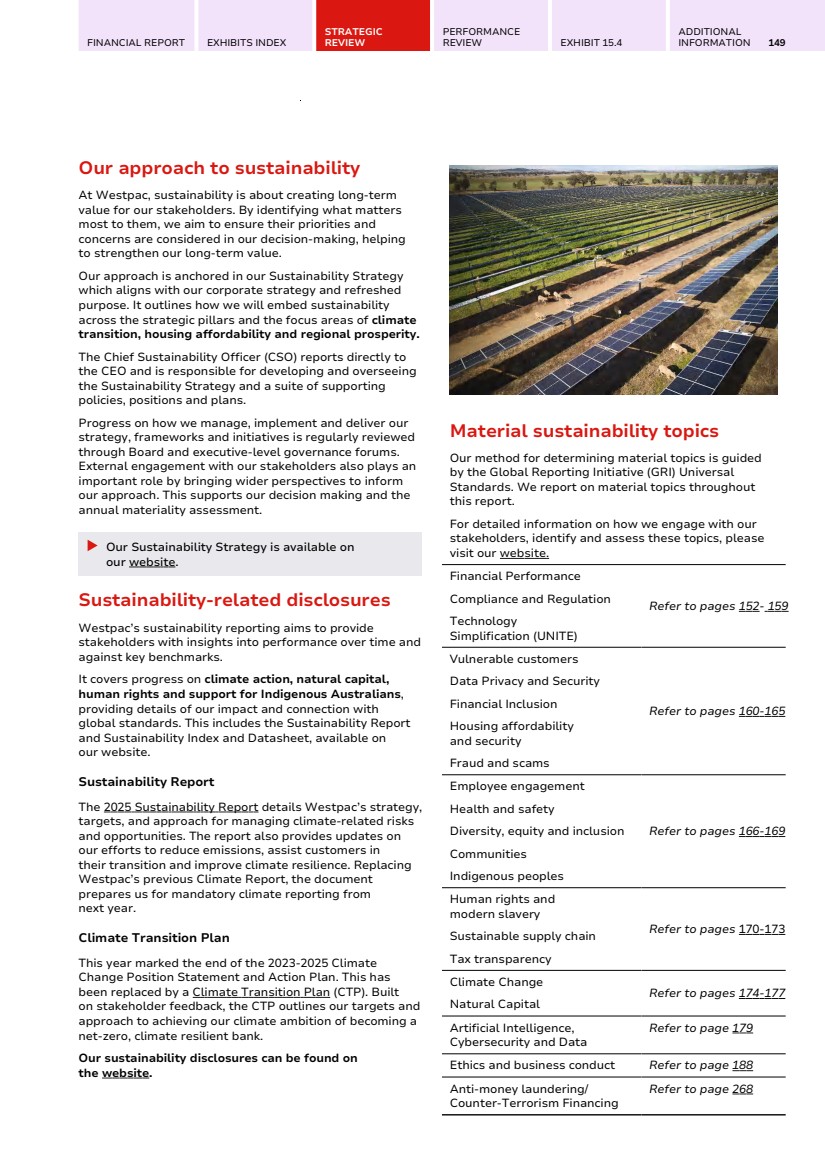
| FINANCIAL REPORT EXHIBITS INDEX STRATEGIC REVIEW PERFORMANCE REVIEW EXHIBIT 15.4 ADDITIONAL INFORMATION 149 Our approach to sustainability At Westpac, sustainability is about creating long-term value for our stakeholders. By identifying what matters most to them, we aim to ensure their priorities and concerns are considered in our decision-making, helping to strengthen our long-term value. Our approach is anchored in our Sustainability Strategy which aligns with our corporate strategy and refreshed purpose. It outlines how we will embed sustainability across the strategic pillars and the focus areas of climate transition, housing affordability and regional prosperity. The Chief Sustainability Officer (CSO) reports directly to the CEO and is responsible for developing and overseeing the Sustainability Strategy and a suite of supporting policies, positions and plans. Progress on how we manage, implement and deliver our strategy, frameworks and initiatives is regularly reviewed through Board and executive-level governance forums. External engagement with our stakeholders also plays an important role by bringing wider perspectives to inform our approach. This supports our decision making and the annual materiality assessment. Our Sustainability Strategy is available on our website. Sustainability-related disclosures Westpac’s sustainability reporting aims to provide stakeholders with insights into performance over time and against key benchmarks. It covers progress on climate action, natural capital, human rights and support for Indigenous Australians, providing details of our impact and connection with global standards. This includes the Sustainability Report and Sustainability Index and Datasheet, available on our website. Sustainability Report The 2025 Sustainability Report details Westpac’s strategy, targets, and approach for managing climate-related risks and opportunities. The report also provides updates on our efforts to reduce emissions, assist customers in their transition and improve climate resilience. Replacing Westpac’s previous Climate Report, the document prepares us for mandatory climate reporting from next year. Climate Transition Plan This year marked the end of the 2023-2025 Climate Change Position Statement and Action Plan. This has been replaced by a Climate Transition Plan (CTP). Built on stakeholder feedback, the CTP outlines our targets and approach to achieving our climate ambition of becoming a net-zero, climate resilient bank. Our sustainability disclosures can be found on the website. Material sustainability topics Our method for determining material topics is guided by the Global Reporting Initiative (GRI) Universal Standards. We report on material topics throughout this report. For detailed information on how we engage with our stakeholders, identify and assess these topics, please visit our website. Financial Performance Compliance and Regulation Technology Simplification (UNITE) Refer to pages 152- 159 Vulnerable customers Data Privacy and Security Financial Inclusion Housing affordability and security Fraud and scams Refer to pages 160-165 Employee engagement Health and safety Diversity, equity and inclusion Communities Indigenous peoples Refer to pages 166-169 Human rights and modern slavery Sustainable supply chain Tax transparency Refer to pages 170-173 Climate Change Natural Capital Refer to pages 174-177 Artificial Intelligence, Cybersecurity and Data Refer to page 179 Ethics and business conduct Refer to page 188 Anti-money laundering/ Counter-Terrorism Financing Refer to page 268 |
| HOW WE CREATE VALUE • 208-year heritage • Customer needs • Competition • Regulatory environment • Technology and artificial intelligence (AI) • Geopolitical and climate risks • Financial strength • Customer relationships • 35,000 motivated people • Proactive risk management • Digital and physical infrastructure • Diverse partnerships Provide financial products and services to 13 million customers in our core markets of Australia and New Zealand, focusing on five priorities: What shapes us What we do What we rely on Customer: Customer obsessed People: Best team, trusted experts Transformation: Brilliant at delivery Risk: Safe and Strong Performance: Execution Excellence Our purpose TAKING ACTION NOW TO CREATE A BETTER FUTURE 150 WESTPAC GROUP 2025 ANNUAL REPORT |

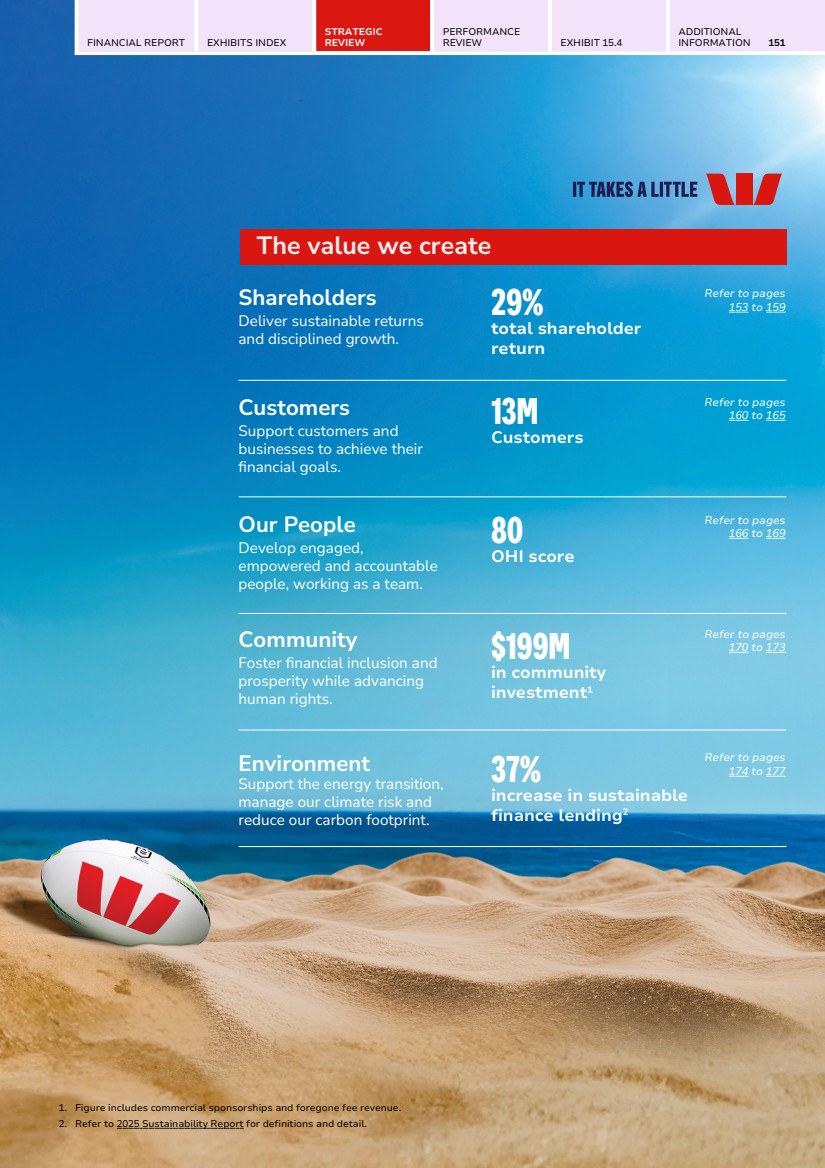
| The value we create Shareholders Deliver sustainable returns and disciplined growth. Customers Support customers and businesses to achieve their financial goals. Our People Develop engaged, empowered and accountable people, working as a team. Community Foster financial inclusion and prosperity while advancing human rights. Environment Support the energy transition, manage our climate risk and reduce our carbon footprint. 29% Refer to pages 153 to 159 total shareholder return 13M Refer to pages 160 to 165 Customers 80 Refer to pages 166 to 169 OHI score $199M Refer to pages 170 to 173 in community investment1 37% Refer to pages 174 to 177 increase in sustainable finance lending2 1. Figure includes commercial sponsorships and foregone fee revenue. 2. Refer to 2025 Sustainability Report for definitions and detail. FINANCIAL REPORT EXHIBITS INDEX STRATEGIC REVIEW PERFORMANCE REVIEW EXHIBIT 15.4 ADDITIONAL INFORMATION 151 |
| Jordan Mobile Lending Manager Broadbeach, QLD 152 WESTPAC GROUP 2025 ANNUAL REPORT CREATING VALUE FOR SHAREHOLDERS By maintaining a strong balance sheet and focusing on service excellence, we aim to strengthen our market position and deliver long-term value for shareholders. Related material topics (refer to page 149) • Financial performance • Compliance and regulation • Technology simplification (UNITE) Key highlights 153c FULL YEAR ORDINARY DIVIDENDS PER SHARE 29% TOTAL SHAREHOLDER RETURN 201.9c BASIC EARNINGS PER SHARE 12.5% CET1 CAPITAL RATIO |

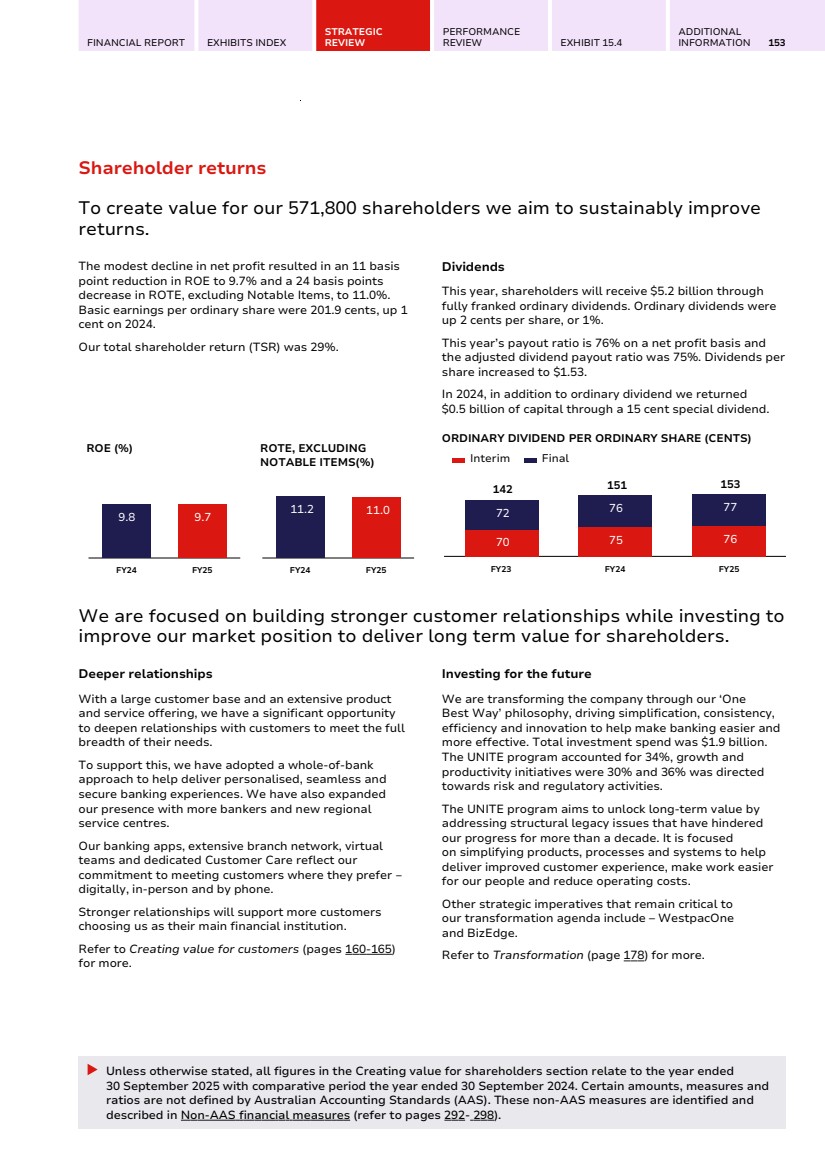
| FINANCIAL REPORT EXHIBITS INDEX STRATEGIC REVIEW PERFORMANCE REVIEW EXHIBIT 15.4 ADDITIONAL INFORMATION 153 Shareholder returns To create value for our 571,800 shareholders we aim to sustainably improve returns. The modest decline in net profit resulted in an 11 basis point reduction in ROE to 9.7% and a 24 basis points decrease in ROTE, excluding Notable Items, to 11.0%. Basic earnings per ordinary share were 201.9 cents, up 1 cent on 2024. Our total shareholder return (TSR) was 29%. ROE (%) 9.8 9.7 FY24 FY25 ROTE, EXCLUDING NOTABLE ITEMS(%) 11.2 11.0 FY24 FY25 Dividends This year, shareholders will receive $5.2 billion through fully franked ordinary dividends. Ordinary dividends were up 2 cents per share, or 1%. This year’s payout ratio is 76% on a net profit basis and the adjusted dividend payout ratio was 75%. Dividends per share increased to $1.53. In 2024, in addition to ordinary dividend we returned $0.5 billion of capital through a 15 cent special dividend. ORDINARY DIVIDEND PER ORDINARY SHARE (CENTS) 142 151 153 70 75 76 72 76 77 Interim Final FY23 FY24 FY25 We are focused on building stronger customer relationships while investing to improve our market position to deliver long term value for shareholders. Deeper relationships With a large customer base and an extensive product and service offering, we have a significant opportunity to deepen relationships with customers to meet the full breadth of their needs. To support this, we have adopted a whole-of-bank approach to help deliver personalised, seamless and secure banking experiences. We have also expanded our presence with more bankers and new regional service centres. Our banking apps, extensive branch network, virtual teams and dedicated Customer Care reflect our commitment to meeting customers where they prefer ‒ digitally, in-person and by phone. Stronger relationships will support more customers choosing us as their main financial institution. Refer to Creating value for customers (pages 160-165) for more. Investing for the future We are transforming the company through our ‘One Best Way’ philosophy, driving simplification, consistency, efficiency and innovation to help make banking easier and more effective. Total investment spend was $1.9 billion. The UNITE program accounted for 34%, growth and productivity initiatives were 30% and 36% was directed towards risk and regulatory activities. The UNITE program aims to unlock long-term value by addressing structural legacy issues that have hindered our progress for more than a decade. It is focused on simplifying products, processes and systems to help deliver improved customer experience, make work easier for our people and reduce operating costs. Other strategic imperatives that remain critical to our transformation agenda include – WestpacOne and BizEdge. Refer to Transformation (page 178) for more. Unless otherwise stated, all figures in the Creating value for shareholders section relate to the year ended 30 September 2025 with comparative period the year ended 30 September 2024. Certain amounts, measures and ratios are not defined by Australian Accounting Standards (AAS). These non-AAS measures are identified and described in Non-AAS financial measures (refer to pages 292- 298). |
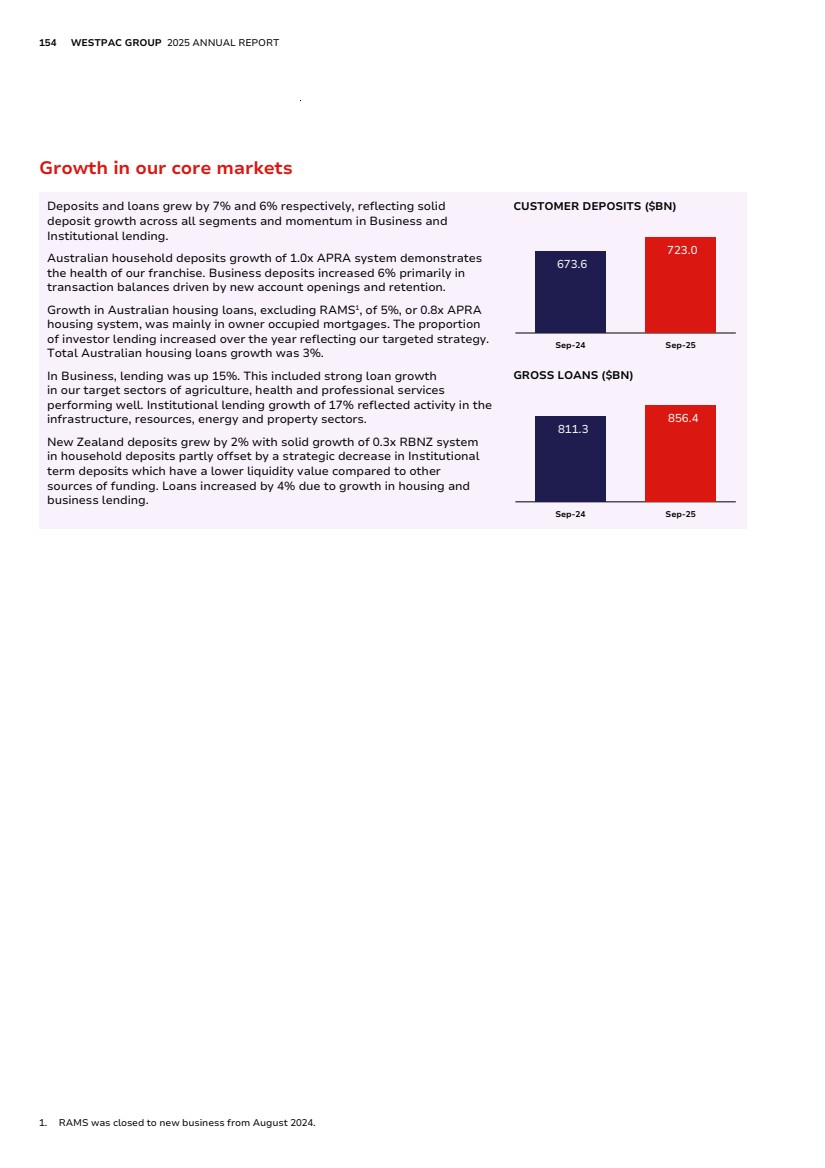
| 154 WESTPAC GROUP 2025 ANNUAL REPORT Growth in our core markets Deposits and loans grew by 7% and 6% respectively, reflecting solid deposit growth across all segments and momentum in Business and Institutional lending. Australian household deposits growth of 1.0x APRA system demonstrates the health of our franchise. Business deposits increased 6% primarily in transaction balances driven by new account openings and retention. Growth in Australian housing loans, excluding RAMS1 , of 5%, or 0.8x APRA housing system, was mainly in owner occupied mortgages. The proportion of investor lending increased over the year reflecting our targeted strategy. Total Australian housing loans growth was 3%. In Business, lending was up 15%. This included strong loan growth in our target sectors of agriculture, health and professional services performing well. Institutional lending growth of 17% reflected activity in the infrastructure, resources, energy and property sectors. New Zealand deposits grew by 2% with solid growth of 0.3x RBNZ system in household deposits partly offset by a strategic decrease in Institutional term deposits which have a lower liquidity value compared to other sources of funding. Loans increased by 4% due to growth in housing and business lending. CUSTOMER DEPOSITS ($BN) 673.6 723.0 Sep-24 Sep-25 GROSS LOANS ($BN) 811.3 856.4 Sep-24 Sep-25 1. RAMS was closed to new business from August 2024. |
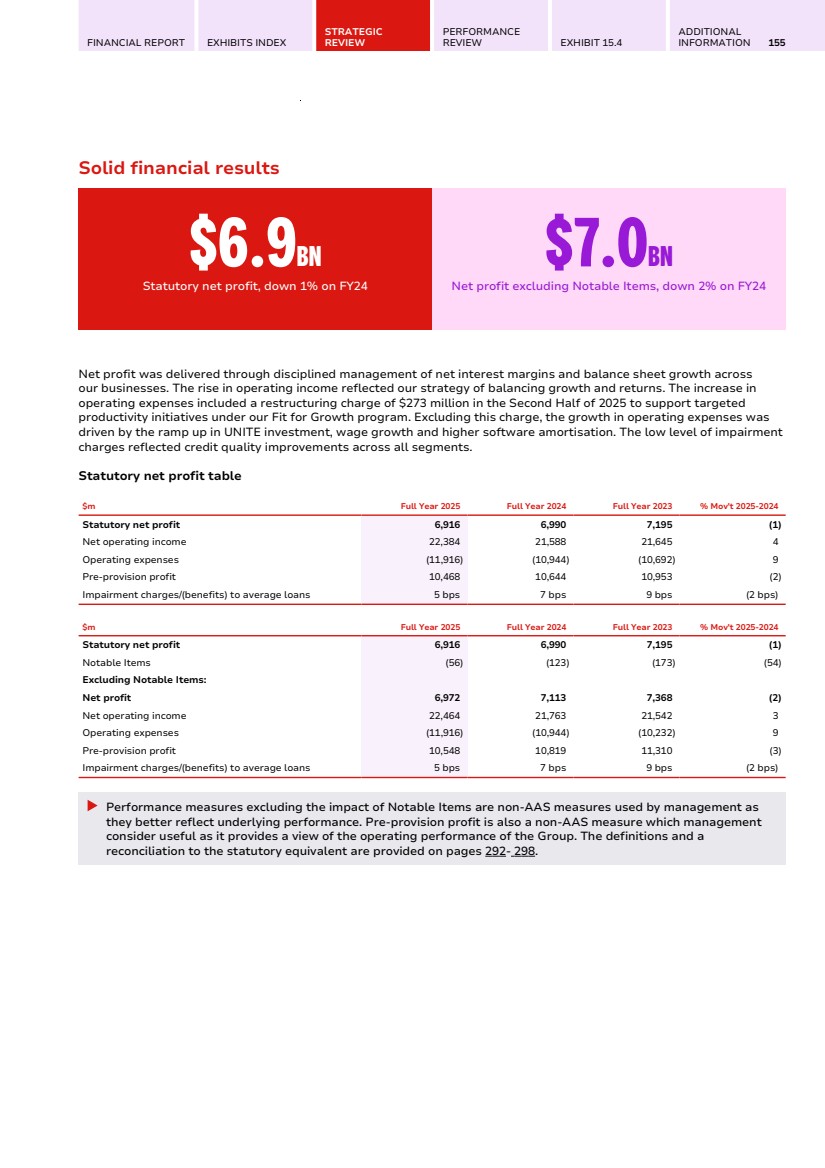
| FINANCIAL REPORT EXHIBITS INDEX STRATEGIC REVIEW PERFORMANCE REVIEW EXHIBIT 15.4 ADDITIONAL INFORMATION 155 Solid financial results $6.9BN Statutory net profit, down 1% on FY24 $7.0BN Net profit excluding Notable Items, down 2% on FY24 Net profit was delivered through disciplined management of net interest margins and balance sheet growth across our businesses. The rise in operating income reflected our strategy of balancing growth and returns. The increase in operating expenses included a restructuring charge of $273 million in the Second Half of 2025 to support targeted productivity initiatives under our Fit for Growth program. Excluding this charge, the growth in operating expenses was driven by the ramp up in UNITE investment, wage growth and higher software amortisation. The low level of impairment charges reflected credit quality improvements across all segments. Statutory net profit table $m Full Year 2025 Full Year 2024 Full Year 2023 % Mov't 2025-2024 Statutory net profit 6,916 6,990 7,195 (1) Net operating income 22,384 21,588 21,645 4 Operating expenses (11,916) (10,944) (10,692) 9 Pre-provision profit 10,468 10,644 10,953 (2) Impairment charges/(benefits) to average loans 5 bps 7 bps 9 bps (2 bps) $m Full Year 2025 Full Year 2024 Full Year 2023 % Mov't 2025-2024 Statutory net profit 6,916 6,990 7,195 (1) Notable Items (56) (123) (173) (54) Excluding Notable Items: Net profit 6,972 7,113 7,368 (2) Net operating income 22,464 21,763 21,542 3 Operating expenses (11,916) (10,944) (10,232) 9 Pre-provision profit 10,548 10,819 11,310 (3) Impairment charges/(benefits) to average loans 5 bps 7 bps 9 bps (2 bps) Performance measures excluding the impact of Notable Items are non-AAS measures used by management as they better reflect underlying performance. Pre-provision profit is also a non-AAS measure which management consider useful as it provides a view of the operating performance of the Group. The definitions and a reconciliation to the statutory equivalent are provided on pages 292- 298. |
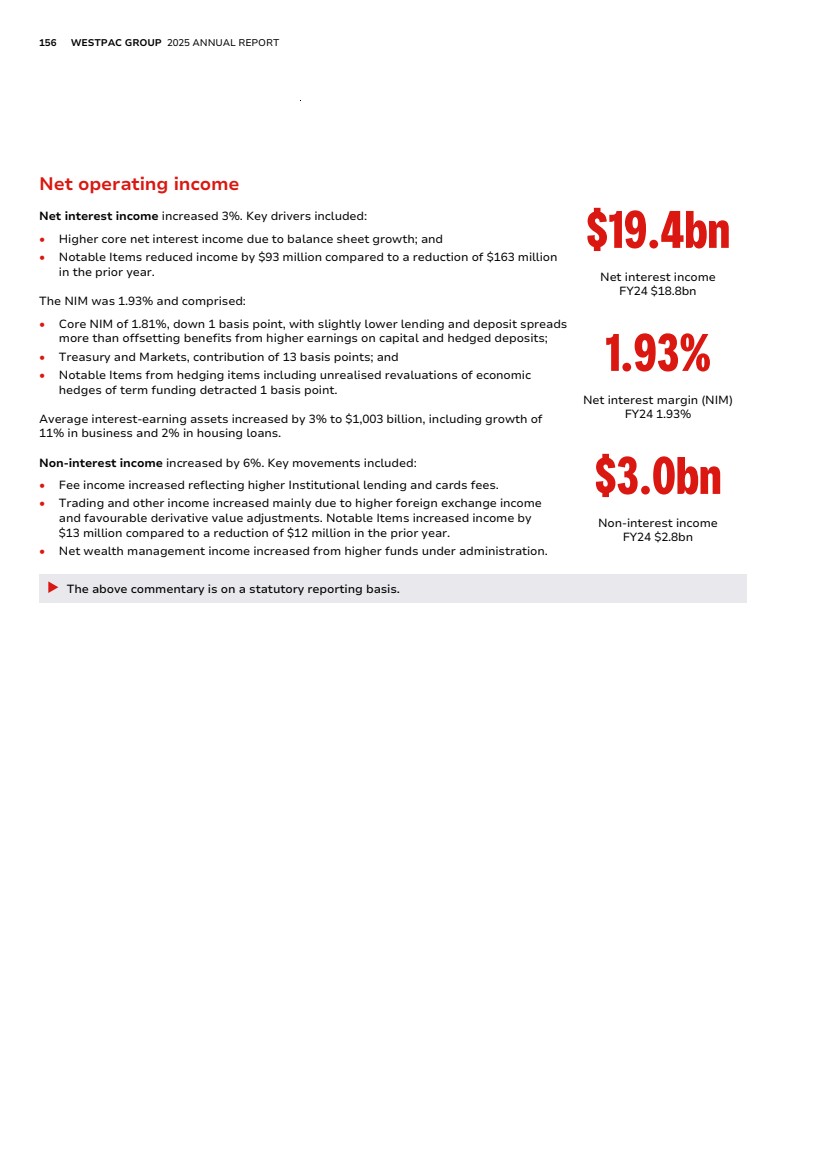
| 156 WESTPAC GROUP 2025 ANNUAL REPORT Net operating income Net interest income increased 3%. Key drivers included: • Higher core net interest income due to balance sheet growth; and • Notable Items reduced income by $93 million compared to a reduction of $163 million in the prior year. The NIM was 1.93% and comprised: • Core NIM of 1.81%, down 1 basis point, with slightly lower lending and deposit spreads more than offsetting benefits from higher earnings on capital and hedged deposits; • Treasury and Markets, contribution of 13 basis points; and • Notable Items from hedging items including unrealised revaluations of economic hedges of term funding detracted 1 basis point. Average interest-earning assets increased by 3% to $1,003 billion, including growth of 11% in business and 2% in housing loans. $19.4bn Net interest income FY24 $18.8bn 1.93% Net interest margin (NIM) FY24 1.93% Non-interest income increased by 6%. Key movements included: • Fee income increased reflecting higher Institutional lending and cards fees. • Trading and other income increased mainly due to higher foreign exchange income and favourable derivative value adjustments. Notable Items increased income by $13 million compared to a reduction of $12 million in the prior year. • Net wealth management income increased from higher funds under administration. $3.0bn Non-interest income FY24 $2.8bn The above commentary is on a statutory reporting basis. |
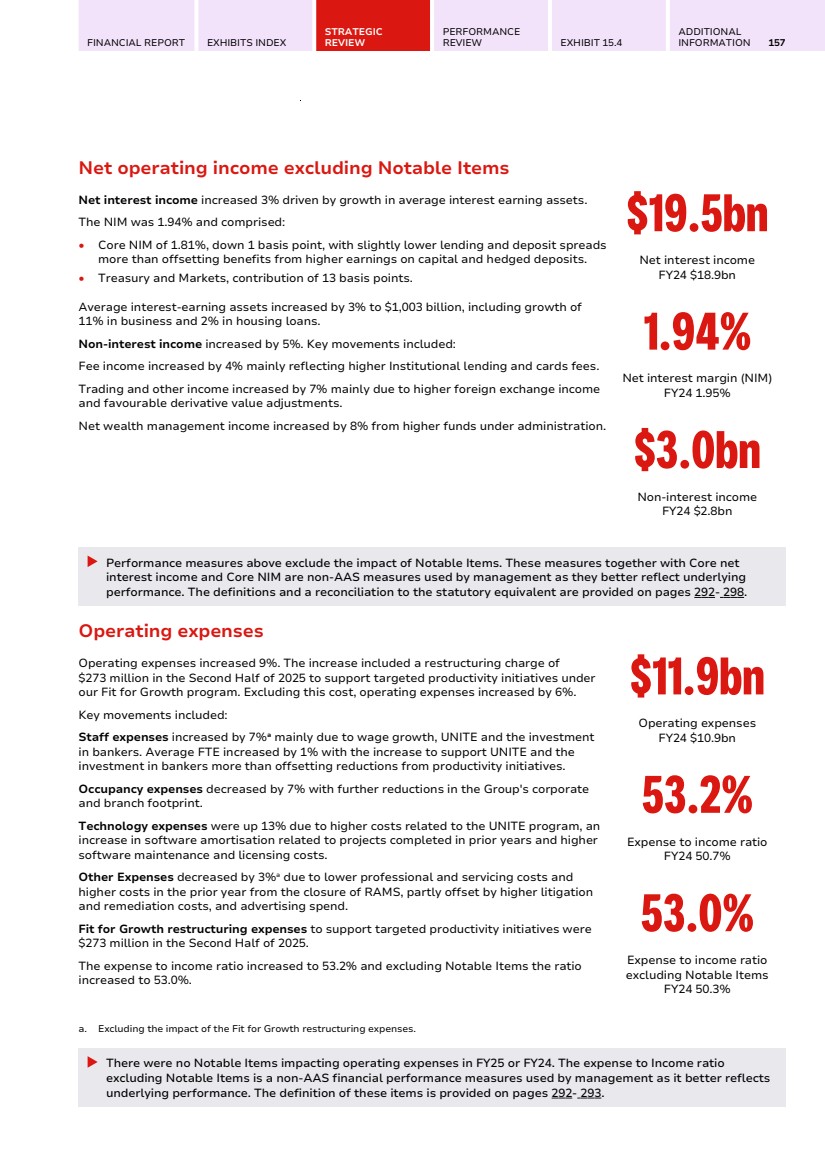
| FINANCIAL REPORT EXHIBITS INDEX STRATEGIC REVIEW PERFORMANCE REVIEW EXHIBIT 15.4 ADDITIONAL INFORMATION 157 Net operating income excluding Notable Items Net interest income increased 3% driven by growth in average interest earning assets. The NIM was 1.94% and comprised: • Core NIM of 1.81%, down 1 basis point, with slightly lower lending and deposit spreads more than offsetting benefits from higher earnings on capital and hedged deposits. • Treasury and Markets, contribution of 13 basis points. Average interest-earning assets increased by 3% to $1,003 billion, including growth of 11% in business and 2% in housing loans. Non-interest income increased by 5%. Key movements included: Fee income increased by 4% mainly reflecting higher Institutional lending and cards fees. Trading and other income increased by 7% mainly due to higher foreign exchange income and favourable derivative value adjustments. Net wealth management income increased by 8% from higher funds under administration. $19.5bn Net interest income FY24 $18.9bn 1.94% Net interest margin (NIM) FY24 1.95% $3.0bn Non-interest income FY24 $2.8bn Performance measures above exclude the impact of Notable Items. These measures together with Core net interest income and Core NIM are non-AAS measures used by management as they better reflect underlying performance. The definitions and a reconciliation to the statutory equivalent are provided on pages 292- 298. Operating expenses Operating expenses increased 9%. The increase included a restructuring charge of $273 million in the Second Half of 2025 to support targeted productivity initiatives under our Fit for Growth program. Excluding this cost, operating expenses increased by 6%. Key movements included: Staff expenses increased by 7%a mainly due to wage growth, UNITE and the investment in bankers. Average FTE increased by 1% with the increase to support UNITE and the investment in bankers more than offsetting reductions from productivity initiatives. Occupancy expenses decreased by 7% with further reductions in the Group's corporate and branch footprint. Technology expenses were up 13% due to higher costs related to the UNITE program, an increase in software amortisation related to projects completed in prior years and higher software maintenance and licensing costs. Other Expenses decreased by 3%a due to lower professional and servicing costs and higher costs in the prior year from the closure of RAMS, partly offset by higher litigation and remediation costs, and advertising spend. Fit for Growth restructuring expenses to support targeted productivity initiatives were $273 million in the Second Half of 2025. The expense to income ratio increased to 53.2% and excluding Notable Items the ratio increased to 53.0%. $11.9bn Operating expenses FY24 $10.9bn 53.2% Expense to income ratio FY24 50.7% 53.0% Expense to income ratio excluding Notable Items FY24 50.3% a. Excluding the impact of the Fit for Growth restructuring expenses. There were no Notable Items impacting operating expenses in FY25 or FY24. The expense to Income ratio excluding Notable Items is a non-AAS financial performance measures used by management as it better reflects underlying performance. The definition of these items is provided on pages 292- 293. |
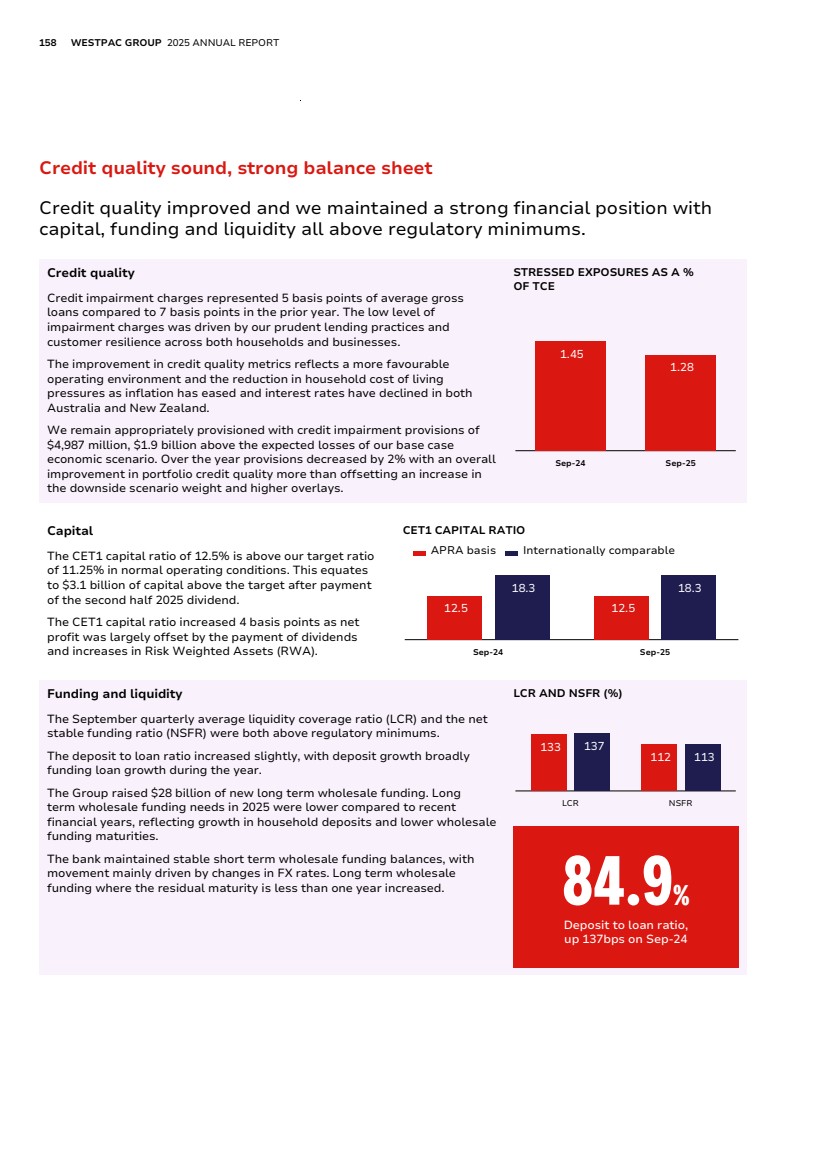
| 158 WESTPAC GROUP 2025 ANNUAL REPORT Credit quality sound, strong balance sheet Credit quality improved and we maintained a strong financial position with capital, funding and liquidity all above regulatory minimums. Credit quality Credit impairment charges represented 5 basis points of average gross loans compared to 7 basis points in the prior year. The low level of impairment charges was driven by our prudent lending practices and customer resilience across both households and businesses. The improvement in credit quality metrics reflects a more favourable operating environment and the reduction in household cost of living pressures as inflation has eased and interest rates have declined in both Australia and New Zealand. We remain appropriately provisioned with credit impairment provisions of $4,987 million, $1.9 billion above the expected losses of our base case economic scenario. Over the year provisions decreased by 2% with an overall improvement in portfolio credit quality more than offsetting an increase in the downside scenario weight and higher overlays. STRESSED EXPOSURES AS A % OF TCE 1.45 1.28 Sep-24 Sep-25 Capital The CET1 capital ratio of 12.5% is above our target ratio of 11.25% in normal operating conditions. This equates to $3.1 billion of capital above the target after payment of the second half 2025 dividend. The CET1 capital ratio increased 4 basis points as net profit was largely offset by the payment of dividends and increases in Risk Weighted Assets (RWA). CET1 CAPITAL RATIO 12.5 12.5 18.3 18.3 APRA basis Internationally comparable Sep-24 Sep-25 Funding and liquidity The September quarterly average liquidity coverage ratio (LCR) and the net stable funding ratio (NSFR) were both above regulatory minimums. The deposit to loan ratio increased slightly, with deposit growth broadly funding loan growth during the year. The Group raised $28 billion of new long term wholesale funding. Long term wholesale funding needs in 2025 were lower compared to recent financial years, reflecting growth in household deposits and lower wholesale funding maturities. The bank maintained stable short term wholesale funding balances, with movement mainly driven by changes in FX rates. Long term wholesale funding where the residual maturity is less than one year increased. LCR AND NSFR (%) 133 112 137 113 LCR NSFR 84.9% Deposit to loan ratio, up 137bps on Sep-24 |
| FINANCIAL REPORT EXHIBITS INDEX STRATEGIC REVIEW PERFORMANCE REVIEW EXHIBIT 15.4 ADDITIONAL INFORMATION 159 Segment performance Our operating segments including Group Businesses contribute to Group performance. For descriptions of Consumer, Business & Wealth, Institutional and New Zealand refer to page 147. Group Businesses includes Treasury, Enterprise services and other costs not directly attributable to segments. In 2025, the composition of our segments was revised to improve operational alignment. Prior year comparatives have not been restated. The key changes included: • The merchants services business was transferred from Business & Wealth to Institutional given strategic alignment with management of payments infrastructure; • The contribution from the auto finance portfolio which was sold in March 2025 was transferred from Business & Wealth to Group Businesses; and • Centralisation of Finance and Human Resources into Group Businesses. The impact of Notable Items on net profit, income and expenses have been excluded from the Segment Performance section. These measures are used by Westpac for management reporting and is consistent with the disclosure in Note 2. Consumer Net profit increased 4% to $2,282 million and pre-provision profit increased 4% to $3,492 million. Segment composition changes had a minimal impact, with pre-provision profit also rising 3%. Operating income rising 4% and operating expenses increasing 4%. The increase in operating income reflected 3 basis points of net interest margin expansion with disciplined growth in mortgages and strong deposit growth. Expense growth was driven by a step up in UNITE spend and inflationary pressures, partly offset by benefits from productivity initiatives. Impairment charges to average loans were 4 basis points, compared to 5 basis points in the prior year. The decrease reflects the improvement in credit quality metrics. 33% Contribution to Group net profit Business & Wealth Net profit decreased 7% to $2,186 million and pre-provision profit fell 4% to $3,383 million. Excluding the impact of segment composition changes, pre-provision profit fell 1% with a 3% increase in operating income more than offset by a 10% increase in operating expenses. Operating income reflected strong growth in lending balances, partly offset by a lower net interest margin, while operating expenses increased due to the step up in UNITE spend and investment in front line bankers. Impairment charges to average loans were 23 basis points, compared to 14 basis points in the prior year. The increase reflects an increase in the downside scenario weight and higher overlays, while credit quality metrics improved. 31% Contribution to Group net profit Institutional Net profit increased 15% to $1,575 million and pre-provision profit increased 6% to $2,161 million. Excluding the impact of segment composition changes, pre-provision profit rose 2%, with a 5% rise in operating income more than offsetting an 11% increase in operating expenses. The growth in operating income reflects lending growth and higher earnings on capital. The 11% increase in operating expenses was driven by increased investment spend, including the step up of UNITE and higher software amortisation, in addition to an increase in bankers to support growth. The impairment benefit of $1 million, compared to a 13 basis point charge of $120 million in the prior year. The decrease reflects the improvement in credit quality metrics. 23% Contribution to Group net profit New Zealand Net profit increased 13% to NZ$1,197 million and pre-provision profit increased 8% to NZ$1,618 million, reflecting an 8% increase in operating income which more than offset a 7% increase in operating expenses. Operating income reflected growth in lending and a higher net interest margin, while operating expenses were driven by higher staff expenses, third party vendor costs, software amortisation and higher investment spend. The impairment benefit was 4 basis points of average loans, compared to a charge of 3 basis points in the prior year. The decrease reflects the improvement in credit quality metrics. 16% Contribution to Group net profit Group Businesses Net loss of $161 million compared to a net profit of $227 million. Excluding the impact of segment composition changes pre-provision profit also decreased 92%, reflecting an 11% decrease in operating income and a 34% increase in operating expenses. The decrease in operating income reflects lower income on surplus capital, while operating expense growth reflects the restructuring charge as part of the targeted productivity initiates through the Fit for Growth program. |
| 160 WESTPAC GROUP 2025 ANNUAL REPORT CREATING VALUE FOR CUSTOMERS By adopting a whole-of-bank approach, we are creating more personalised, seamless and secure banking experiences that build long-term trust and value. Related material topics (refer to page 149) • Vulnerable customers • Data privacy and security • Financial inclusion • Housing affordability and security • Fraud and scams Key highlights 13M CUSTOMERS # 1 MOBILE BANKING APP1 21% AUSTRALIAN MORTGAGE MARKET SHARE2 #2 CONSUMER NPS3 RANKED EQUAL SECOND 1. The Forrester Digital Experience Review: Australian Mobile Banking Apps, Q3 2025. 2. APRA Banking Statistics, September 2025. 3. Refer to the Glossary (pages 324-327) for more information on NPS. |

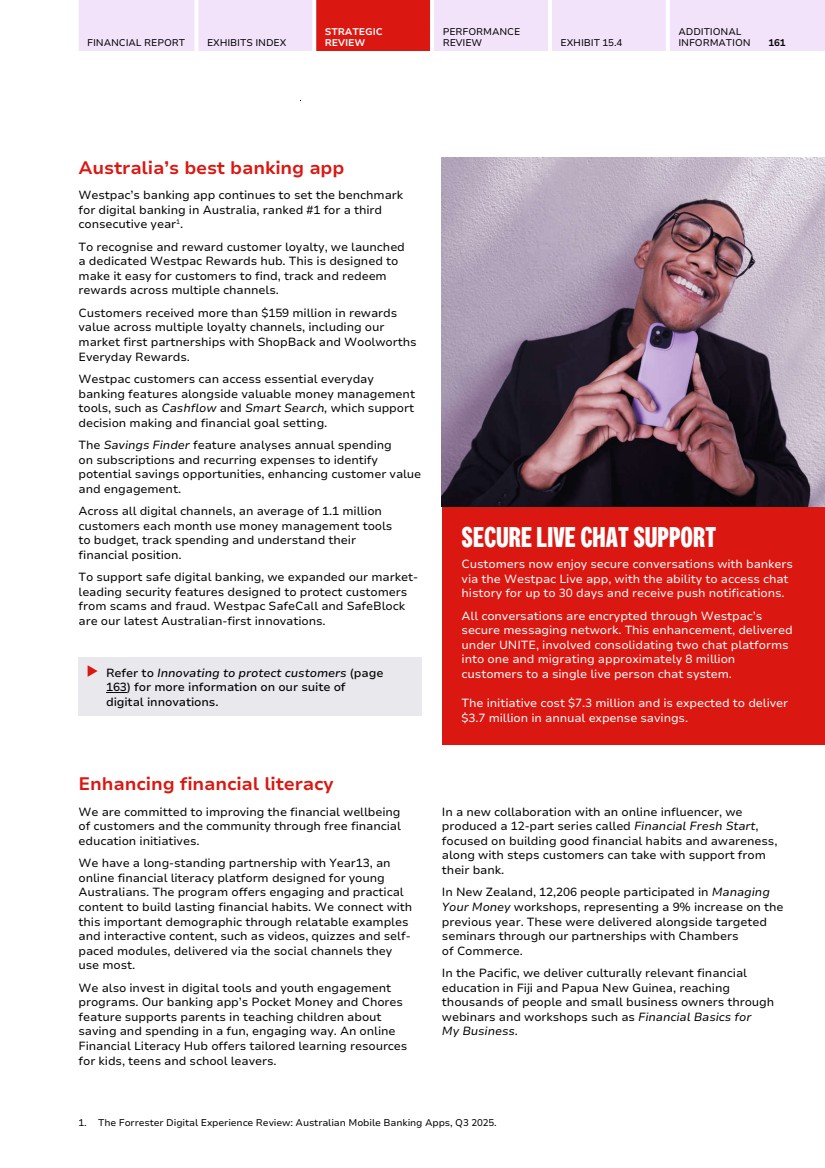
| FINANCIAL REPORT EXHIBITS INDEX STRATEGIC REVIEW PERFORMANCE REVIEW EXHIBIT 15.4 ADDITIONAL INFORMATION 161 Australia’s best banking app Westpac’s banking app continues to set the benchmark for digital banking in Australia, ranked #1 for a third consecutive year1 . To recognise and reward customer loyalty, we launched a dedicated Westpac Rewards hub. This is designed to make it easy for customers to find, track and redeem rewards across multiple channels. Customers received more than $159 million in rewards value across multiple loyalty channels, including our market first partnerships with ShopBack and Woolworths Everyday Rewards. Westpac customers can access essential everyday banking features alongside valuable money management tools, such as Cashflow and Smart Search, which support decision making and financial goal setting. The Savings Finder feature analyses annual spending on subscriptions and recurring expenses to identify potential savings opportunities, enhancing customer value and engagement. Across all digital channels, an average of 1.1 million customers each month use money management tools to budget, track spending and understand their financial position. To support safe digital banking, we expanded our market-leading security features designed to protect customers from scams and fraud. Westpac SafeCall and SafeBlock are our latest Australian-first innovations. Refer to Innovating to protect customers (page 163) for more information on our suite of digital innovations. Enhancing financial literacy We are committed to improving the financial wellbeing of customers and the community through free financial education initiatives. We have a long-standing partnership with Year13, an online financial literacy platform designed for young Australians. The program offers engaging and practical content to build lasting financial habits. We connect with this important demographic through relatable examples and interactive content, such as videos, quizzes and self-paced modules, delivered via the social channels they use most. We also invest in digital tools and youth engagement programs. Our banking app’s Pocket Money and Chores feature supports parents in teaching children about saving and spending in a fun, engaging way. An online Financial Literacy Hub offers tailored learning resources for kids, teens and school leavers. In a new collaboration with an online influencer, we produced a 12-part series called Financial Fresh Start, focused on building good financial habits and awareness, along with steps customers can take with support from their bank. In New Zealand, 12,206 people participated in Managing Your Money workshops, representing a 9% increase on the previous year. These were delivered alongside targeted seminars through our partnerships with Chambers of Commerce. In the Pacific, we deliver culturally relevant financial education in Fiji and Papua New Guinea, reaching thousands of people and small business owners through webinars and workshops such as Financial Basics for My Business. 1. The Forrester Digital Experience Review: Australian Mobile Banking Apps, Q3 2025. SECURE LIVE CHAT SUPPORT Customers now enjoy secure conversations with bankers via the Westpac Live app, with the ability to access chat history for up to 30 days and receive push notifications. All conversations are encrypted through Westpac’s secure messaging network. This enhancement, delivered under UNITE, involved consolidating two chat platforms into one and migrating approximately 8 million customers to a single live person chat system. The initiative cost $7.3 million and is expected to deliver $3.7 million in annual expense savings. |
| 162 WESTPAC GROUP 2025 ANNUAL REPORT CREATING VALUE FOR CUSTOMERS Delivering service excellence Exceptional customer experiences depend on many factors, including ensuring our people, systems and processes work together seamlessly to deliver timely, consistent and personalised service. We are focusing on connecting the full breadth of our capabilities, across every operating segment and customer touchpoint, to bring the whole bank to customers. This integrated approach aims to remove customer pain points, strengthen advocacy and build deeper relationships over time. Through mapping, measuring and improving more than 15 critical customer journeys across our Australian operations, we are helping teams to walk in customers’ shoes and drive cross-functional collaboration. This also provides us with better insights to help customers achieve their financial goals. While the program is a recent initiative, early feedback indicates customers are engaging with a broader range of our products and services. In addition, we are extending the rollout of the single banker platform, Digital Banker, to support approximately 20,000 employees across Consumer and Business. This portal captures customer interactions and needs, providing better insights and experiences for customers and bankers. Prioritising safety in products and services We were proud to develop Australia’s first Safety by Design Toolkit for financial institutions, placing customer safety and rights at the centre of product and service design. In collaboration with the Australian Banking Association, the toolkit includes customer vulnerability personas, lived experience videos and mandatory eLearning for product managers. It has been shared with peer organisations to help support more Australians, regardless of who they bank with. Westpac remains committed to sector-wide reform, advocating for Safety by Design across banking and beyond, so customer safety is built-in from the start. Providing support in tough times We understand that anyone can fall on tough times so our Assist team provide a range of tailored solutions to help customers regain financial stability. This can include short-term options such as payment pauses and reduced repayments, as well as longer-term assistance plans designed to support recovery. We also connect customers with our wider network of external partners, extending support into wellbeing and financial empowerment. By collaborating with respected organisations, we hope to help strengthen families and communities, break cycles of disadvantage and build lasting financial confidence. We supported customers with 46,485 tailored hardship assistance and disaster relief packages, giving customers financial reprieve and the chance to get back on track. At the end of the financial year, 10,870 accounts remained in hardship. Through UNITE's collections migration, we are consolidating multiple legacy systems into a single platform to support customers and reduce complexity. It includes new tools to help teams respond to customers in hardship with greater consistency and care. Resolving complaints Complaints are a second chance for us to make things right for customers. Our monthly average resolution time is stable, with 94% of complaints resolved without need for escalation. Our Customer Advocate also provides advice, while recommending policy changes and supporting vulnerable customers. Listening to feedback helps us to continuously improve our products and services. Importantly, we are using complaints as a key input into the customer journeys initiative, ensuring we have a genuine view of pain points and the end to end customer experience. For example, through UNITE, we introduced the option for eligible Westpac home loan customers to set up multiple offset accounts with no additional fee – providing more choice and control in how they manage their finances. More than 35,000 offset accounts have been set up since February. Listening to customers We proactively and continuously seek customer feedback, using insights from Net Promoter Score (NPS)1 surveys, complaints and direct feedback which helps us to measure progress and identify areas for improvement. To be Australia’s best bank, we recognise there is more work needed to lift customer and brand advocacy. In Consumer, NPS1 improved during the year, despite intense competition. We are currently ranked equal second in Consumer NPS1 . In Business, we hold an NPS1 score of minus one and have established clear leadership in the SME and Commercial sub-segments. We are prioritising improvements in our service offering for small business customers, recognising the importance of this segment to our Business & Wealth strategy. For our Institutional customers, we aim to be their bank of choice, supporting all their banking needs through strong relationships and comprehensive solutions. Our Relationship Strength Index (RSI2 ) rose by 19 points, marking our highest score in a decade. While we are currently in equal third position, our focus on deepening relationships positions us well for continued growth in this segment. 1. Refer to the Glossary (pages 324-327) for more information on NPS. 2. Coalition Greenwich Voice of Client 2025 Australia Large Corporate Relationship Banking Study. |
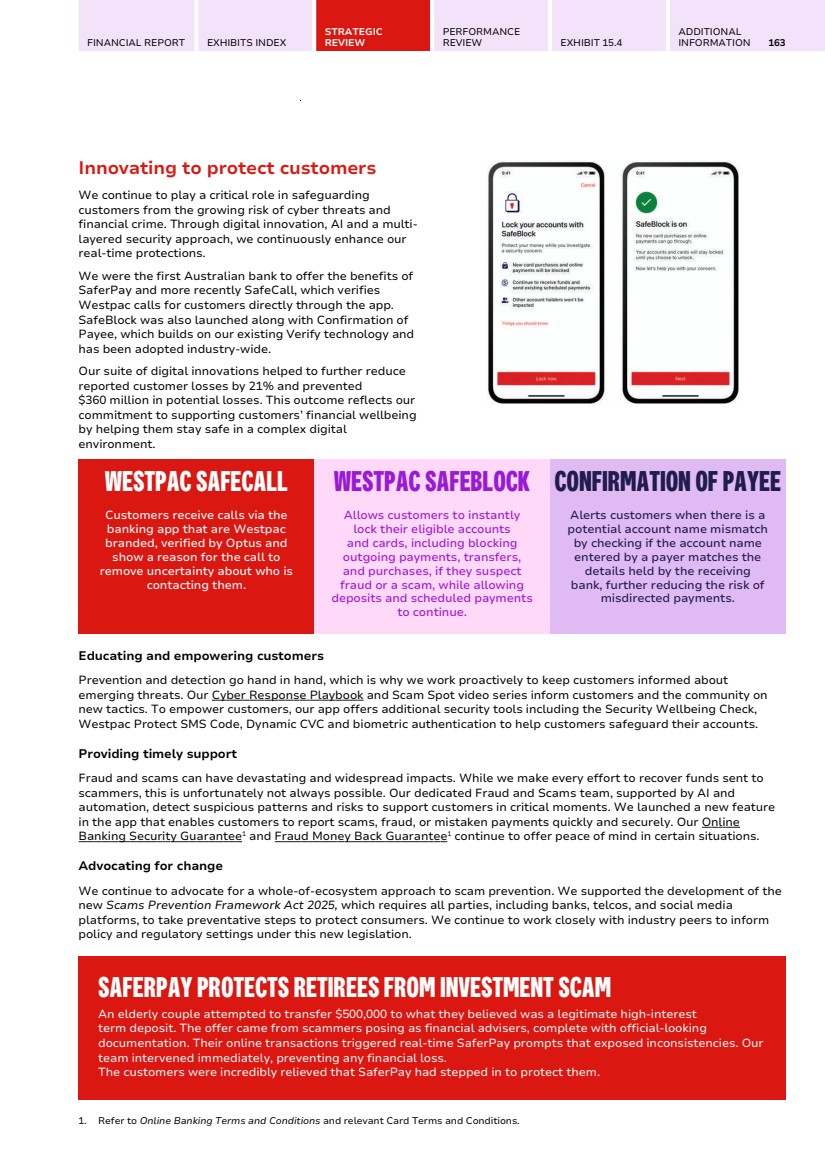
| FINANCIAL REPORT EXHIBITS INDEX STRATEGIC REVIEW PERFORMANCE REVIEW EXHIBIT 15.4 ADDITIONAL INFORMATION 163 Innovating to protect customers We continue to play a critical role in safeguarding customers from the growing risk of cyber threats and financial crime. Through digital innovation, AI and a multi-layered security approach, we continuously enhance our real-time protections. We were the first Australian bank to offer the benefits of SaferPay and more recently SafeCall, which verifies Westpac calls for customers directly through the app. SafeBlock was also launched along with Confirmation of Payee, which builds on our existing Verify technology and has been adopted industry-wide. Our suite of digital innovations helped to further reduce reported customer losses by 21% and prevented $360 million in potential losses. This outcome reflects our commitment to supporting customers’ financial wellbeing by helping them stay safe in a complex digital environment. WESTPAC SAFECALL Customers receive calls via the banking app that are Westpac branded, verified by Optus and show a reason for the call to remove uncertainty about who is contacting them. WESTPAC SAFEBLOCK Allows customers to instantly lock their eligible accounts and cards, including blocking outgoing payments, transfers, and purchases, if they suspect fraud or a scam, while allowing deposits and scheduled payments to continue. CONFIRMATION OF PAYEE Alerts customers when there is a potential account name mismatch by checking if the account name entered by a payer matches the details held by the receiving bank, further reducing the risk of misdirected payments. Educating and empowering customers Prevention and detection go hand in hand, which is why we work proactively to keep customers informed about emerging threats. Our Cyber Response Playbook and Scam Spot video series inform customers and the community on new tactics. To empower customers, our app offers additional security tools including the Security Wellbeing Check, Westpac Protect SMS Code, Dynamic CVC and biometric authentication to help customers safeguard their accounts. Providing timely support Fraud and scams can have devastating and widespread impacts. While we make every effort to recover funds sent to scammers, this is unfortunately not always possible. Our dedicated Fraud and Scams team, supported by AI and automation, detect suspicious patterns and risks to support customers in critical moments. We launched a new feature in the app that enables customers to report scams, fraud, or mistaken payments quickly and securely. Our Online Banking Security Guarantee 1 and Fraud Money Back Guarantee 1 continue to offer peace of mind in certain situations. Advocating for change We continue to advocate for a whole-of-ecosystem approach to scam prevention. We supported the development of the new Scams Prevention Framework Act 2025, which requires all parties, including banks, telcos, and social media platforms, to take preventative steps to protect consumers. We continue to work closely with industry peers to inform policy and regulatory settings under this new legislation. SAFERPAY PROTECTS RETIREES FROM INVESTMENT SCAM An elderly couple attempted to transfer $500,000 to what they believed was a legitimate high-interest term deposit. The offer came from scammers posing as financial advisers, complete with official-looking documentation. Their online transactions triggered real-time SaferPay prompts that exposed inconsistencies. Our team intervened immediately, preventing any financial loss. The customers were incredibly relieved that SaferPay had stepped in to protect them. 1. Refer to Online Banking Terms and Conditions and relevant Card Terms and Conditions. |
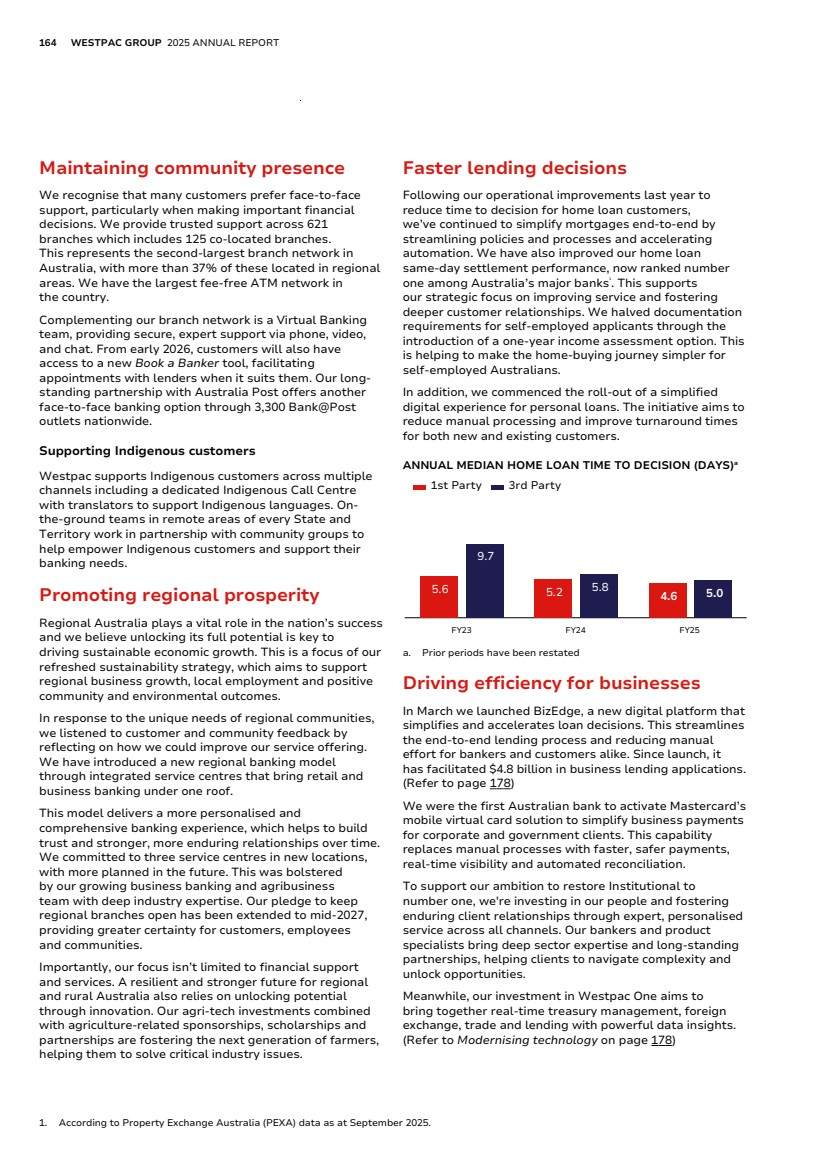
| 164 WESTPAC GROUP 2025 ANNUAL REPORT CREATING VALUE FOR CUSTOMERS Maintaining community presence We recognise that many customers prefer face-to-face support, particularly when making important financial decisions. We provide trusted support across 621 branches which includes 125 co-located branches. This represents the second-largest branch network in Australia, with more than 37% of these located in regional areas. We have the largest fee-free ATM network in the country. Complementing our branch network is a Virtual Banking team, providing secure, expert support via phone, video, and chat. From early 2026, customers will also have access to a new Book a Banker tool, facilitating appointments with lenders when it suits them. Our long-standing partnership with Australia Post offers another face-to-face banking option through 3,300 Bank@Post outlets nationwide. Supporting Indigenous customers Westpac supports Indigenous customers across multiple channels including a dedicated Indigenous Call Centre with translators to support Indigenous languages. On-the-ground teams in remote areas of every State and Territory work in partnership with community groups to help empower Indigenous customers and support their banking needs. Promoting regional prosperity Regional Australia plays a vital role in the nation’s success and we believe unlocking its full potential is key to driving sustainable economic growth. This is a focus of our refreshed sustainability strategy, which aims to support regional business growth, local employment and positive community and environmental outcomes. In response to the unique needs of regional communities, we listened to customer and community feedback by reflecting on how we could improve our service offering. We have introduced a new regional banking model through integrated service centres that bring retail and business banking under one roof. This model delivers a more personalised and comprehensive banking experience, which helps to build trust and stronger, more enduring relationships over time. We committed to three service centres in new locations, with more planned in the future. This was bolstered by our growing business banking and agribusiness team with deep industry expertise. Our pledge to keep regional branches open has been extended to mid-2027, providing greater certainty for customers, employees and communities. Importantly, our focus isn’t limited to financial support and services. A resilient and stronger future for regional and rural Australia also relies on unlocking potential through innovation. Our agri-tech investments combined with agriculture-related sponsorships, scholarships and partnerships are fostering the next generation of farmers, helping them to solve critical industry issues. Faster lending decisions Following our operational improvements last year to reduce time to decision for home loan customers, we’ve continued to simplify mortgages end-to-end by streamlining policies and processes and accelerating automation. We have also improved our home loan same-day settlement performance, now ranked number one among Australia’s major banks1 . This supports our strategic focus on improving service and fostering deeper customer relationships. We halved documentation requirements for self-employed applicants through the introduction of a one-year income assessment option. This is helping to make the home-buying journey simpler for self-employed Australians. In addition, we commenced the roll-out of a simplified digital experience for personal loans. The initiative aims to reduce manual processing and improve turnaround times for both new and existing customers. ANNUAL MEDIAN HOME LOAN TIME TO DECISION (DAYS)a 5.6 5.2 4.6 9.7 5.8 5.0 1st Party 3rd Party FY23 FY24 FY25 a. Prior periods have been restated Driving efficiency for businesses In March we launched BizEdge, a new digital platform that simplifies and accelerates loan decisions. This streamlines the end-to-end lending process and reducing manual effort for bankers and customers alike. Since launch, it has facilitated $4.8 billion in business lending applications. (Refer to page 178) We were the first Australian bank to activate Mastercard’s mobile virtual card solution to simplify business payments for corporate and government clients. This capability replaces manual processes with faster, safer payments, real-time visibility and automated reconciliation. To support our ambition to restore Institutional to number one, we're investing in our people and fostering enduring client relationships through expert, personalised service across all channels. Our bankers and product specialists bring deep sector expertise and long-standing partnerships, helping clients to navigate complexity and unlock opportunities. Meanwhile, our investment in Westpac One aims to bring together real-time treasury management, foreign exchange, trade and lending with powerful data insights. (Refer to Modernising technology on page 178) 1. According to Property Exchange Australia (PEXA) data as at September 2025. |
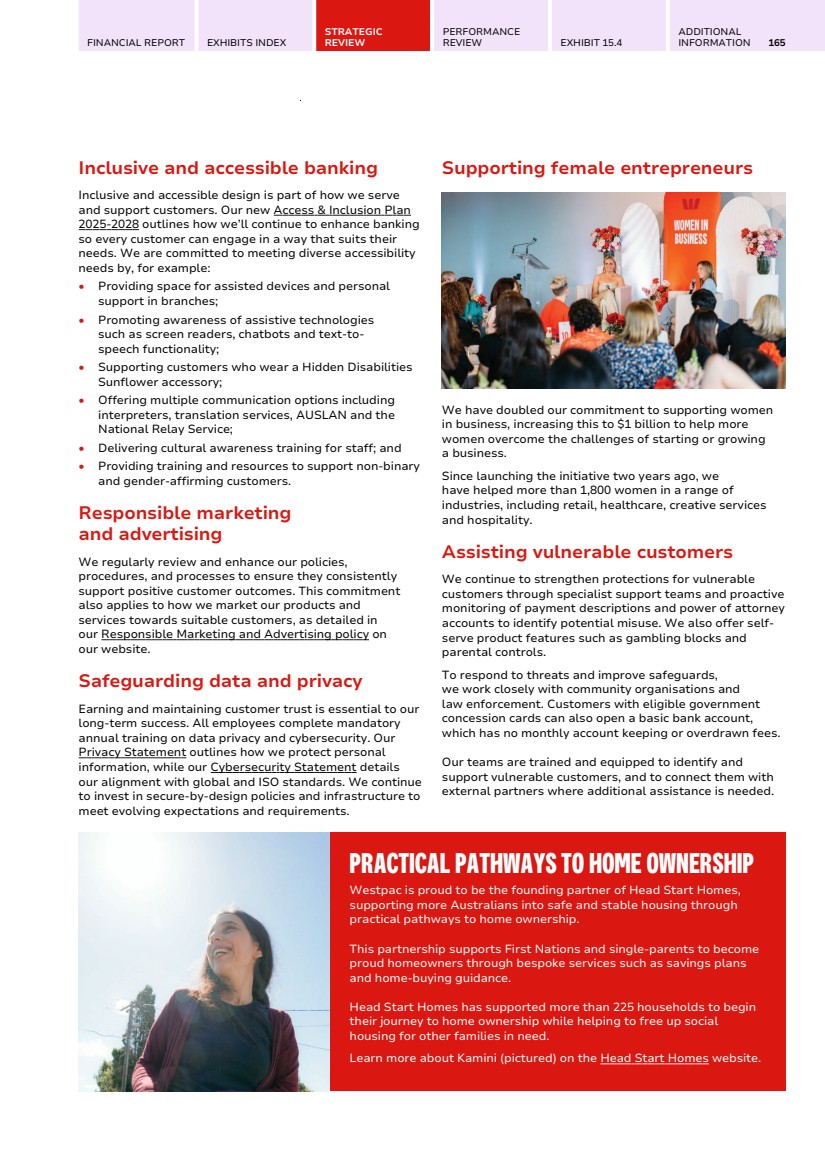
| FINANCIAL REPORT EXHIBITS INDEX STRATEGIC REVIEW PERFORMANCE REVIEW EXHIBIT 15.4 ADDITIONAL INFORMATION 165 Inclusive and accessible banking Inclusive and accessible design is part of how we serve and support customers. Our new Access & Inclusion Plan 2025-2028 outlines how we’ll continue to enhance banking so every customer can engage in a way that suits their needs. We are committed to meeting diverse accessibility needs by, for example: • Providing space for assisted devices and personal support in branches; • Promoting awareness of assistive technologies such as screen readers, chatbots and text-to-speech functionality; • Supporting customers who wear a Hidden Disabilities Sunflower accessory; • Offering multiple communication options including interpreters, translation services, AUSLAN and the National Relay Service; • Delivering cultural awareness training for staff; and • Providing training and resources to support non-binary and gender-affirming customers. Responsible marketing and advertising We regularly review and enhance our policies, procedures, and processes to ensure they consistently support positive customer outcomes. This commitment also applies to how we market our products and services towards suitable customers, as detailed in our Responsible Marketing and Advertising policy on our website. Safeguarding data and privacy Earning and maintaining customer trust is essential to our long-term success. All employees complete mandatory annual training on data privacy and cybersecurity. Our Privacy Statement outlines how we protect personal information, while our Cybersecurity Statement details our alignment with global and ISO standards. We continue to invest in secure-by-design policies and infrastructure to meet evolving expectations and requirements. Supporting female entrepreneurs We have doubled our commitment to supporting women in business, increasing this to $1 billion to help more women overcome the challenges of starting or growing a business. Since launching the initiative two years ago, we have helped more than 1,800 women in a range of industries, including retail, healthcare, creative services and hospitality. Assisting vulnerable customers We continue to strengthen protections for vulnerable customers through specialist support teams and proactive monitoring of payment descriptions and power of attorney accounts to identify potential misuse. We also offer self-serve product features such as gambling blocks and parental controls. To respond to threats and improve safeguards, we work closely with community organisations and law enforcement. Customers with eligible government concession cards can also open a basic bank account, which has no monthly account keeping or overdrawn fees. Our teams are trained and equipped to identify and support vulnerable customers, and to connect them with external partners where additional assistance is needed. PRACTICAL PATHWAYS TO HOME OWNERSHIP Westpac is proud to be the founding partner of Head Start Homes, supporting more Australians into safe and stable housing through practical pathways to home ownership. This partnership supports First Nations and single-parents to become proud homeowners through bespoke services such as savings plans and home-buying guidance. Head Start Homes has supported more than 225 households to begin their journey to home ownership while helping to free up social housing for other families in need. Learn more about Kamini (pictured) on the Head Start Homes website. |
| Brittany Mobile Home Finance Manager Broadbeach, QLD 166 WESTPAC GROUP 2025 ANNUAL REPORT CREATING VALUE FOR OUR PEOPLE We strive to be Australia’s best workplace, where people feel valued, supported and inspired to deliver for customers and reach their potential. Related material topics (refer to page 149) • Employee engagement • Health and safety • Diversity, equity and inclusion Key highlights 80 ORGANISATIONAL HEALTH INDEX 49% WOMEN IN SENIOR LEADERSHIP1 $6.3BN PAID IN SALARIES 35,236 EMPLOYEES2 1. Senior Leadership includes Executive Team, General Managers and their direct reports (excluding administrative or support roles). 2. Refers to Full-Time Equivalent as at 30 September 2025. |

| FINANCIAL REPORT EXHIBITS INDEX STRATEGIC REVIEW PERFORMANCE REVIEW EXHIBIT 15.4 ADDITIONAL INFORMATION 167 190,000 employee recognition moments AMPLIFY new employee listening platform 3,600 employees participated in AI Shark Tank Creating a culture where people thrive To become Australia’s best workplace, we are shaping a high-performance culture where people feel supported, accountability is clear, positive behaviours are recognised and it is safe to speak up. Receiving the ‘Employer of Choice’ award for large organisations at the Australian HR Awards recognises the progress we’ve made in making Westpac a great place to work. We are building on this momentum under the guidance of a new Chief People Officer, while executing UNITE to help make our working environment simpler and more rewarding for our people. With a renewed Purpose, our values were updated in July to three clear, actionable commitments: Always deliver, safely; Make an impact; and Own it. We are embedding these into processes to align expectations and shape a service mindset. We’re actively supporting our leaders to help shape our culture. One way we do this is by embedding skill boost sessions into weekly team rhythms. These activities encourage open conversations around positive risk behaviours such as speaking up, admitting mistakes and taking initiative. In June 2025, our final Voice+ survey including the Organisational Health Index (OHI) was completed. The score remained at 80, reinforcing Westpac's position in the top quartile of organisations globally. This reflects our progress in recent years to reset culture and strengthen risk practices through the CORE program, which is now complete. For more detail, refer to page 181. Listening and acting on feedback Feedback is essential to building a culture of trust and continuous improvement. It ensures people feel heard, empowered to act, and aligned to our purpose. To capture more dynamic employee insights and drive further improvement, we’ve transitioned from Voice+ to a new Amplify platform. Amplify enables leaders at all levels to act on team feedback, strengthening engagement and risk management. Insights help leaders and teams agree on priorities and turn feedback into measurable change, supporting our goal of becoming the best place to work. We also engaged with our people to understand how they want to use AI to work more effectively and provide better service to customers. Our inaugural CEO-sponsored AI Shark Tank program drew significant engagement, with 3,600 employees participating and 1,200 ideas submitted. It highlighted a keen interest in embracing AI across the company. 10 standout opportunities were selected by Executives for implementation. We also responded to employee feedback through our continuous improvement platform Ignite, which uncovered valuable ways to boost productivity, improve customer experience and reduce risk. In addition, leaders have regular conversations with their team members to provide performance and development feedback to engage and motivate our people. RECOGNISING GREAT OUTCOMES The recognition of our people is embedded in our culture. We have formal mechanisms in place to encourage and recognise high performance, including those linked to excellent risk outcomes. The Great Employee Moments (GEM) platform captured 190,000 recognition moments, which informed our award winners. The annual CEO Awards (pictured) at the end of each calendar year are the pinnacle of our recognition framework, celebrating individuals and teams who exemplify excellence, leadership and impact across the business. Each quarter, the Board directly recognise individuals who demonstrate positive risk outcomes, exceptional courage, innovation or leadership beyond the expectations of their role. |
| 168 WESTPAC GROUP 2025 ANNUAL REPORT CREATING VALUE FOR OUR PEOPLE Attracting and retaining talent Attracting and retaining talent sparks innovation and builds a workforce that reflects the diversity and capability needed to deliver great results. We are advancing this through several targeted strategies. Onboarding and Orientation: We introduced a refreshed onboarding and orientation program for new talent, featuring customer immersion sessions, hands-on activities and engagement with our Executive team. Graduate Program: We rank in the top ten of Australian Financial Review 'Top Grad Employers for 2025’ for our award-winning graduate program. We hired 135 graduates, comprising 58% female and 52% from a STEM background. Licensed to recruit: A new Licenced to Recruit training program is strengthening the capability of People Leaders making hiring decisions. To date, more than 1,500 leaders have completed face-to-face training across Australia. Internal talent mobility: We saw a second consecutive year of improvement in internal talent mobility, which is up 5% from FY23. This was driven by the launch of a new Internal Careers site with enhanced employee tools and the introduction of the Westpac Talent Community. We continue to support redeployed employees through job-matching tools and reporting dashboards that help identify opportunities and track outcomes. Diverse hiring: We maintained our commitment to diverse hiring, with 49% overall female representation, even as recruitment efforts pivoted towards male dominated technology-focused roles. Notably, MobTech welcomed 11 new Indigenous cadets. Our dedicated female talent initiative, EmPOWERUp, creates a pathway for women to reignite their careers after an extended leave break. It continues to build a strong candidate pool across all levels and disciplines, with approximately 1,300 women engaged to date. Developing leadership capability People leaders are critical to our success. They shape our culture, drive performance and role model the behaviours that enable teams to thrive. We have three signature leadership programs to develop leaders at all levels. The Horizon program for executive leaders resumed with its fourth cohort. This is part of a broader leadership development strategy aimed at strengthening executive capability and driving cultural transformation. To further align broader leadership behaviours with performance outcomes, we launched the Westpac Leadership Qualities framework, which will be reinforced in a new Executive Leadership Group1 Scorecard from FY26. We introduced two new leadership programs designed to strengthen capability for more than 4,000 employees through to FY27. Elevate supports our senior leadership cohort, while LEAD is tailored for mid-level and emerging leaders. These programs focus on executive coaching and developing adaptive leadership, high-performance and an enterprise mindset. We are committed to supporting the development and progression of women at Westpac. This includes accelerating the impact of programs such as Illuminate, our female sponsorship initiative and Step-Up, a new career development program. Refer to page 169 for more information. Investing in skills for the future Equipping our people with future skills and capabilities is at the heart of our learning and talent strategy. It encompasses both mandatory and optional training, leadership development as well as addressing capability gaps across the organisation. Mandatory training is completed by all employees and covers compliance, privacy and data protection, risk awareness, identifying hazards and conflicts of interest. We expanded optional learning in emerging areas such as AI, sustainability and cybersecurity. More than 10,000 employees completed training in generative AI through our Microsoft 365 Copilot rollout. See Data, Digital and AI on page 179 for more information. In Business & Wealth, we relaunched The Business Performance Academy, offering targeted training to 3,000 employees to build confidence and advance their careers. This is complemented by learning programs designed to build confidence in discussing sustainability matters with customers. A new self-directed leadership program, IMPROVE, was developed by the NeuroLeadership Institute and is designed to enhance feedback skills for leaders using contemporary research. Our people also accessed degree programs and certification training, supported by paid study leave. 1. Includes approximately 190 senior leaders, including Group Executive direct reports (General Managers (GM) and Chief of Staffs) and key GM1 roles. |
| FINANCIAL REPORT EXHIBITS INDEX STRATEGIC REVIEW PERFORMANCE REVIEW EXHIBIT 15.4 ADDITIONAL INFORMATION 169 11,000+ employee advocacy group members 135 new graduates joined Westpac 10,600 Microsoft 365 Copilot licences Strengthening diversity, equity and inclusion We are a proudly inclusive employer, committed to fostering a workplace where our people feel valued, respected and safe. One way we advance inclusion is through 10 employee advocacy groups, connecting more than 11,000 people who champion diversity across areas such as gender, disability, LGBTQ+ communities and cultural backgrounds. We also refreshed the Access and Inclusion Plan, marking a 25 year commitment. We have a zero-tolerance approach to sexual harassment and related unlawful conduct, encouraging respectful behaviour and accountability. We encourage our people to be upstanders and speak up against inappropriate behaviours. Our policy includes training, dedicated reporting channels, a no-bystander rule and investigation and support processes. We also delivered training to the Board and Executive Team on their positive duty obligations under recent legislative reforms. We continue to champion gender diversity, with women holding 49% of senior leadership roles. To build on this, we aim to achieve a 40:40:20 balance at all levels by FY30, with 40% women, 40% men and 20% of any gender. In a submission to the Workplace Gender Equality Agency (WGEA), we reported an overall average gender pay difference of 2% based on similar roles or levels. The median gender pay gap reduced by 1.2% to 28.1% and this figure is heavily influenced by the composition of our workforce, with many women employed in contact centres, operations and branches. Our new gender diversity target is designed to help address this. The Illuminate program supported 82 aspiring female leaders through GM sponsorship, with more than 35% advancing to new or expanded roles. As the first bank to join Diversity Council Australia’s RISE Project, we are supporting 20 women from diverse racial and cultural backgrounds to advance their leadership careers. We are investing in specialised programs to recruit, retain and develop Aboriginal and Torres Strait Islander people, supported by a dedicated First Nations Engagement Manager. Refer to page 173 for more information. Prioritising health, safety and wellbeing We recognise health, safety and wellbeing play a vital role in how our people show up at work. We are committed to fostering a safe, secure and supportive environment, focused on protecting people from physical and psychological harm, supporting mental health and providing a respectful and inclusive workplace. The mental health strategy is shaped by our Chief Mental Health Officer. Reviews of each segment were conducted, which helped develop targeted action plans to address psycho-social risks and better understand the factors influencing wellbeing at work. This was complemented by mental health training in partnership with the Black Dog Institute. For our Retail bankers' safety, we delivered face to face de-escalation training to 157 branches and psychological first aid training to 375 Consumer leaders. Wellbeing remains a core part of our employee value proposition. We launched a new mobile Wellbeing App with personalised content and holistic wellbeing assessments to encourage healthy living. This complements our other health initiatives including fitness incentives, access to 24/7 counselling and free flu vaccinations. Flexible working arrangements support a healthy work-life balance. In addition, our latest EVP introduced new leave benefits including doubling Culture, Lifestyle and Wellbeing Leave to four days, increasing Compassionate Leave from three to five days per occasion, as well as five days leave to support employees to attend appointments related to fertility treatment, surrogacy, adoption and foster care. We also make superannuation payments during unpaid parental leave, rather than waiting until employees return to work. We offer market-leading banking benefits for employees, contractors and their families. Eligible employees receive a Salary Continuance Insurance benefit, also known as Income Protection Insurance, in case of illness and injury. In addition, a MyDiscounts employee portal continues to offer exclusive offers and discounts from leading brands. BUILDING STRONGER CUSTOMER CONNECTIONS We believe it’s essential for our people to understand how their roles contribute to better customer outcomes. We created opportunities for all teams, including business functions like risk, legal and compliance, to connect with customer experiences supported by Customer Obsession Learning and Service Mindset sessions attended by 1,000 people. Additionally, 2,500 people completed Immersion training and 600 participated in Customer Journey Bootcamps. We're building a workplace where everyone feels empowered to deliver great customer outcomes. |
| 170 WESTPAC GROUP 2025 ANNUAL REPORT CREATING VALUE FOR THE COMMUNITY We are determined to make a meaningful difference in the community by empowering our people and the organisations we support. Related material topics (refer to page 149) • Communities • Indigenous peoples • Human rights and modern slavery • Sustainable supply chain • Tax transparency Photo: Ngutu child Thelma with her educator Melissa at Ngutu College, supported by BankSA Foundation. 100 SCHOLARSHIPS AWARDED EVERY YEAR1 65,538 HOURS VOLUNTEERED BY WESTPAC EMPLOYEES $199M IN COMMUNITY INVESTMENT2 $56.1M SPENT WITH DIVERSE SUPPLIERS3 1. By Westpac Scholars Trust which is supported by Westpac Group but operates independently as a non-profit organisation. 2. Figure includes commercial sponsorships and foregone fee revenue. 3. Refer to the 2025 Sustainability Index and Datasheet for definition. |

| FINANCIAL REPORT EXHIBITS INDEX STRATEGIC REVIEW PERFORMANCE REVIEW EXHIBIT 15.4 ADDITIONAL INFORMATION 171 Since establishing our first charity in 1879, we have remained committed to building stronger, more inclusive communities. Our approach continues to evolve and is guided by where we can deliver the greatest impact for customers and their communities. Westpac offers a range of community investment initiatives that encourage employees to contribute their time, skills and experience to causes they are passionate about. These initiatives also help to foster trust and deeper connections with the communities we serve. Australian employees receive one day of paid volunteer leave each year. This offers valuable opportunities for personal and professional development while delivering meaningful benefits to the community. Our people contributed 65,538 hours to initiatives ranging from volunteer firefighting to mentoring social enterprises. In addition, 140 people also participated in Jawun secondments, the Community Ambassador and Westpac Board Observer programs. Through our workplace giving initiative, Westpac matched $1.6 million in employee donations to 200 charities. New chapter, stronger commitment We spent time assessing how to maximise our impact for current and future generations. To align with Australia’s national education and productivity goals, from 2026 the Westpac and Regional Foundations and our community initiatives will unite next year behind a single, critical objective: improving literacy and numeracy outcomes for children facing disadvantage. We believe every child should have the tools to unlock their potential, regardless of background or the challenges they face. Refer to our 2025 Foundations Impact Report for more information. Westpac Foundation1 The Westpac Foundation awarded $2.2 million to 8 new social enterprise partners to support job creation. It has positively impacted hundreds of communities in the past 20 years by providing meaningful employment opportunities for people facing barriers to work, achieving its ambitious goal to create 10,000 jobs by 2024. Regional Foundations1 The Regional Foundations have helped to lay the groundwork for our focus on education, with 40% of grants since 2023 supporting inclusive education. They awarded $3.3 million this year to programs that boost educational and wellbeing outcomes for young people facing disadvantage (refer to case study). Westpac Scholars Trust1 The Trust's landmark pledge is to award 100 scholarships a year, forever. The Trust awarded $5.1 million to scholars this year, bringing its collective impact to $50 million since 2015. Te Waiu O Aotearoa Trust2 The Trust awarded $5,000 scholarships to eight Māori recipients across Aotearoa to support their tertiary studies in business, banking and finance. Investing in local communities Since 2014, we have supported Little Wings, a children’s charity providing free aeromedical transport for seriously ill children in regional and remote communities. Operating from Bankstown, Cessnock and Brisbane airports, Little Wings completes more than 2,300 missions annually. Our partnership, formalised in 2020, helps fund its Medical Wings program, which brings city-based specialists to regional clinics each month. Building on the success of our existing partnership with National Rugby League, we announced a new sponsorship with Cricket Australia. Our support directly contributes to initiatives that elevate participation and visibility of both sports, from grassroots clubs to elite competition. This includes pathway and development programs for schools, young females and First Nations talent to grow the next generation of players and leaders. BUILDING BRIGHT FUTURES Country Education Foundation of Australia (CEF) is a volunteer led organisation helping thousands of young people in regional, rural and remote communities to pursue education and training after school. Operating through 49 local foundations across five states and territories, CEF is powered by more than 400 dedicated volunteers who fundraise, award grants and mentor students, ensuring that distance and disadvantage don’t stand in the way of opportunity. St.George Foundation has awarded a three-year, $300,000 Inspire grant to CEF to help students like Piper (pictured) continue their studies and build bright futures. 1. In FY25, Westpac Group provided support to the Westpac Community Trust and the Westpac Buckland Fund (known as the Westpac Foundation), Westpac Scholars Trust and the St George Foundation Trust (known as St George Foundation, BankSA Foundation and the Bank of Melbourne Foundation). While Westpac was involved in establishing these foundations, they are non-profit organisations that are separate to the Westpac Group. The trustee of St George Foundation Trust (St George Foundation Limited) is a related body corporate of Westpac. 2. Westpac New Zealand provides administrative support and skilled volunteering to Te Waiu O Aotearoa Trust, which is a charitable trust and not part of the Westpac Group. |
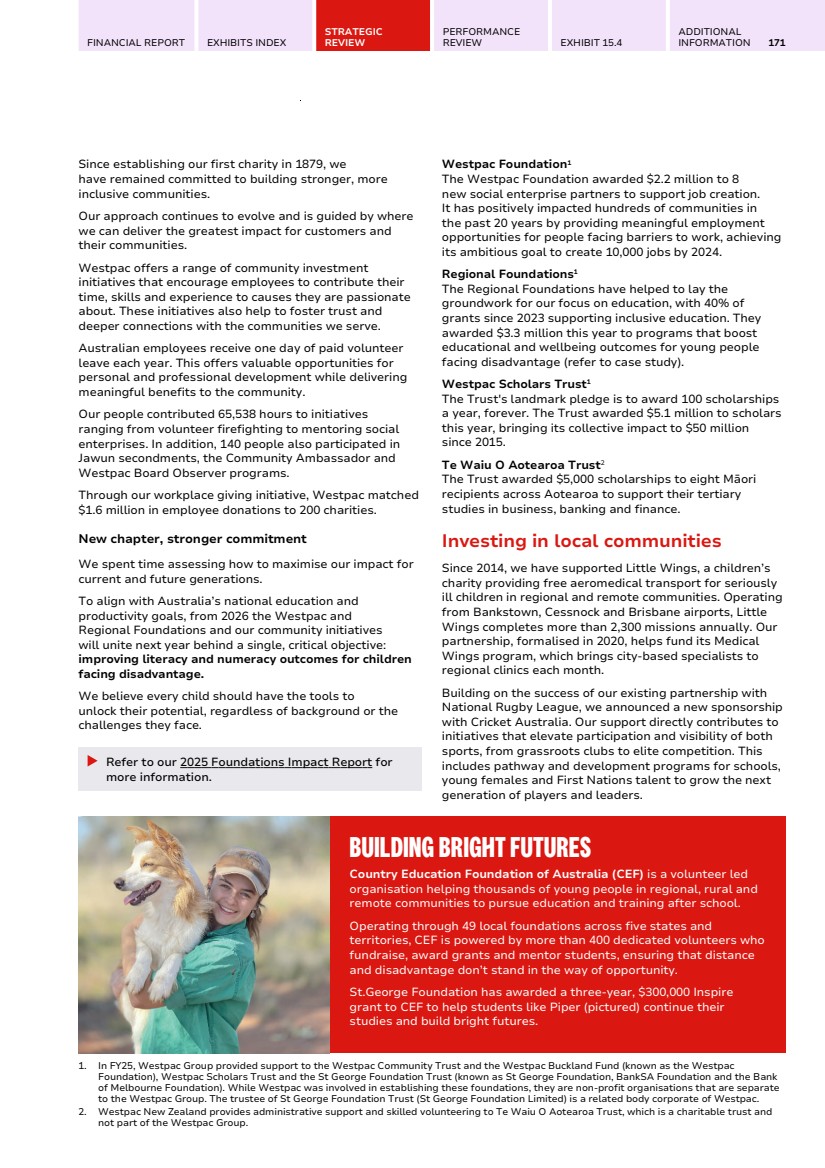
| 172 WESTPAC GROUP 2025 ANNUAL REPORT CREATING VALUE FOR THE COMMUNITY Respecting and advancing human rights We recognise that our activities and relationships can affect the human rights of our people, customers and communities. We are committed to respecting these rights and actively seek opportunities to support and advance them. We have a long-standing commitment to social impact and human rights leadership, having introduced our first Human Rights Position Statement and Action Plan a decade ago. We continue to progress and update our approach where appropriate, to ensure it remains relevant, aligned to our purpose and reflects expectations and standards. The current Human Rights Position Statement and Action Plan sets out our stance on respecting and advancing human rights and the actions we are taking. We also support the UN Guiding Principles on Business and Human Rights, which informs the way we identify, assess and address human rights and modern slavery risks and impacts across our operations and supply chain. The outcomes of customer and supplier assessments are published each year in the 2025 Sustainability Index and Datasheet. More information on Westpac's approach to human rights due diligence, grievance mechanisms and remedy can be found on the Human Rights section of our website and in the Modern Slavery Statement. We are making good progress on the actions outlined in the Human Rights Position Statement and Action Plan, with delivery expected by May 2026 across five strategic priorities. Strategic focus areas FY25 Progress Addressing our salient human rights issues Completed the final phase of our Human Rights Risk Assessment (HRRA). This identified eleven salient human rights issues that represent our most significant areas of human rights risk. Refer to the 2025 Sustainability Index and Datasheet for detailed results. Strengthening grievance mechanisms and approach to remedy Developed a grievance mechanism to respond to human rights concerns from people impacted by our lending to large businesses, incorporating feedback from human rights experts, investors and civil society. We expect to pilot the mechanism in FY26. Supporting and advancing human rights through a just and inclusive transition Developed principles and three action areas to guide our approach to a just transition as we support those more impacted by extreme weather events and the transition to a net-zero economy. Refer to the Climate Transition Plan for more information. Strengthening a focus on child safeguarding Launched a Safety by Design Toolkit for free use by the banking sector, in partnership with the Australian Banking Association. The Toolkit provides guidance on designing products and services to better safeguard customers from financial harm, including children and young people. Strengthening the foundations of our human rights approach Developed an approach to deliver enterprise-wide human rights and modern slavery training and capability improvements. We also finalised a monitoring framework to track and report on our salient human rights risks. SAFEGUARDING CHILDREN Since 2020, Westpac’s Safer Children, Safer Communities (SCSC) Program has committed more than $80 million to more than 50 organisations across Australia and Asia. While funding under the SCSC initiative is now fully allocated, our commitment to child safeguarding continues through our participation in the On Us: Australian Business Coalition for Safeguarding Children and associated Child Safeguarding Business Principles, which guide businesses in recognising and managing their potential or actual risks on children’s safety and wellbeing. The Principles align with national efforts led by the Australian Government to improve child safety across industries and provide a clear, actionable framework for embedding child safety into business operations, risk management and culture. |
| FINANCIAL REPORT EXHIBITS INDEX STRATEGIC REVIEW PERFORMANCE REVIEW EXHIBIT 15.4 ADDITIONAL INFORMATION 173 Ensuring reliable access to cash Maintaining access to cash in communities across Australia carries significant cost. We continue to balance these costs against our responsibility to ensure financial inclusion, particularly for vulnerable customers and regional communities. Our total cost of supplying cash services to Australians was approximately $350 million. This included our continued financial support for Armaguard to help maintain the stability of the national cash distribution system. We are working with government, regulators and industry partners to shape a long-term, sustainable solution for Australia's wholesale cash supply. For information on the other ways we're supporting regional Australia, refer to page 164. Maintaining a sustainable and diverse supply chain We aim to build a stronger, more inclusive society by supporting businesses that create positive change. Through our Supplier Inclusion and Diversity program, we support Indigenous-owned businesses, social enterprises, Australian Disability Enterprises, women-owned businesses and B Corporations - companies certified for their high standards of social and environmental performance, transparency and accountability. We spent $56.1 million with diverse suppliers1 , an increase of $18.2 million from last year. Please refer to the table below for information on how we support Indigenous-owned businesses. Supporting Reconciliation and Indigenous peoples Our vision for reconciliation is an Australia where Aboriginal and Torres Strait Islander peoples have equitable opportunity for economic participation and financial wellbeing. We seek to achieve this through a focus on creating impact for Indigenous customers, employees and communities. The outcomes of the 2022-2025 RAP set out below demonstrate our ongoing commitment to achieving our vision. Our new 2026-2028 Reconciliation Action Plan (RAP) signifies a sharper focus across five priority areas, including Indigenous banking, supporting suppliers, home ownership, Westpac careers and Free, Prior and Informed Consent (FPIC). RAP FOCUS AREA FY25 PROGRESSa Valuing culture: building relationships based on trust and respect; valuing cultures and histories and recognising the importance of self-determination. • Maintained cultural capability with 99.8% of employees completing mandatory learning. • Celebrated and supported Indigenous culture by hosting more than 30 events internally and externally for National Reconciliation Week and NAIDOC Week. • Platinum Sponsor of Garma, a major event celebrating Indigenous culture. • 20 Westpac staff completed a Jawun secondment this year, bringing the total to 100 secondments since April 2022. Meaningful careers: investing in Indigenous careers through dedicated programs to recruit, retain and develop Aboriginal and Torres Strait Islander people. • Aboriginal and Torres Strait Islander workforce representation rose to 1.15% though retention challenges have slowed progress towards our 1.5% target. To address this, we’ve appointed a First Nations Engagement Manager to develop and implement a retention and development strategy for Indigenous employees. • We recruited 11 new cadets through MobTech, all of whom secured permanent roles at Westpac. Better banking experiences: making it easier for Indigenous customers to do business with us and improving financial inclusion and economic participation. • 18,008 unique customers have been supported through our Indigenous call centre since April 2022. • Since 2022, we’ve delivered 146 Remote Services. Backing Indigenous enterprise: helping more Aboriginal and Torres Strait Islander people to grow their businesses as customers, suppliers and partners. • We spent $35.1 million with Indigenous-owned suppliers this year, bringing the total since April 2022 to $67.9 million. This significantly exceeds our RAP target to spend a cumulative $8 million with Indigenous-owned suppliers between 1 April 2022 and 30 September 2025. • Skilled Volunteer Network supported 26 First Nations-focused organisations, including 7 First Nations-led organisations. Respect for self-determination and a deeper understanding of FPIC: working with customers, stakeholders, experts and communities to share knowledge and improve outcomes. • Guided by First Nations perspectives, we developed a framework to support conversations about engagement with customers and partnered with an Indigenous-led organisation to strengthen these principles. • Our 2022-2025 RAP leadership project supports FPIC implementation at Westpac. a. Refer to the 2025 Sustainability Index and Datasheet for further information. 1. Refer to the 2025 Sustainability Index and Datasheet for further information. |
| 174 WESTPAC GROUP 2025 ANNUAL REPORT CREATING VALUE FOR THE ENVIRONMENT We are taking climate action by reducing our operational emissions, supporting customers to transition and providing sustainable finance across Australia and New Zealand. Related material topics (refer to page 149) • Climate change • Natural capital Photo: Aerial photo of Cooktown, Queensland. Key highlights1 89% REDUCTION IN SCOPE 1 AND 2 EMISSIONS SINCE 2021 42% REDUCTION IN SCOPE 3 UPSTREAM EMISSIONS SINCE 2021 37% INCREASE IN SUSTAINABLE FINANCE LENDING 40% INCREASE IN SUSTAINABLE BOND FACILITATION 1. Refer to 2025 Sustainability Report for definitions and detail. |
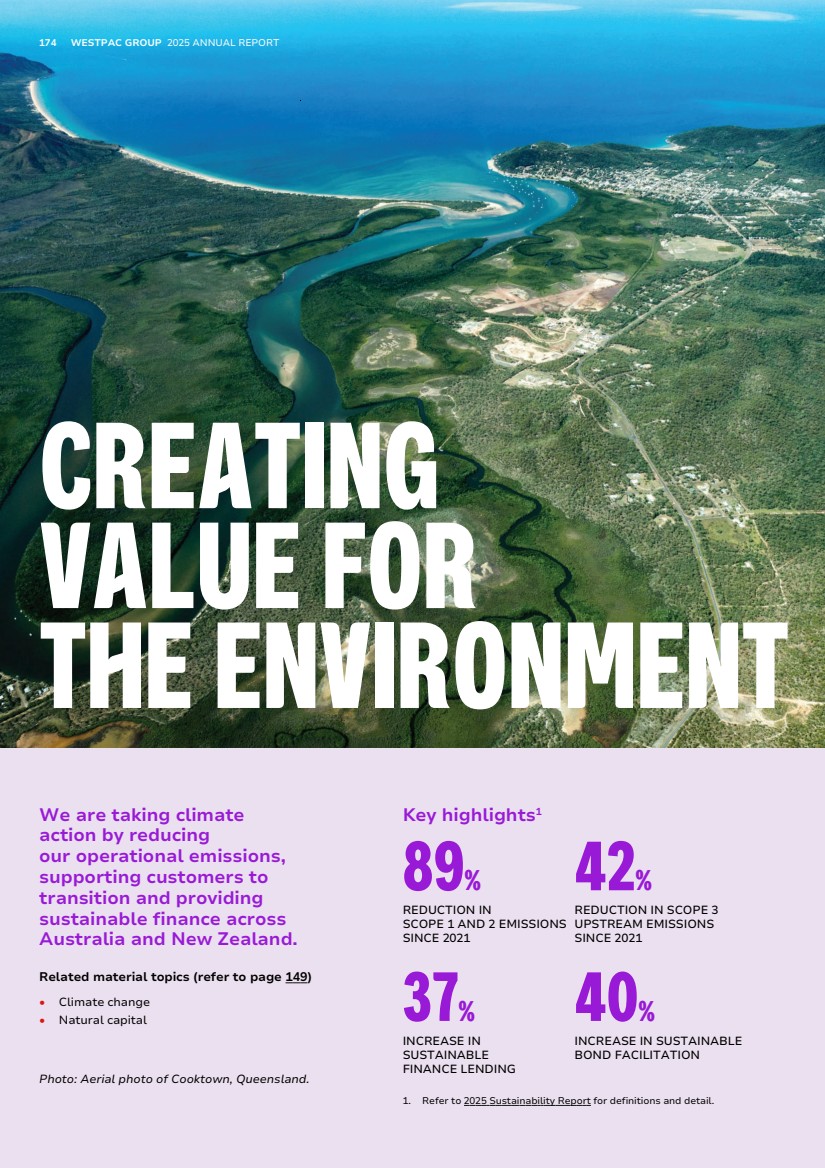
| FINANCIAL REPORT EXHIBITS INDEX STRATEGIC REVIEW PERFORMANCE REVIEW EXHIBIT 15.4 ADDITIONAL INFORMATION 175 To support our purpose and climate ambition to become a net-zero, climate resilient bank, we continue to actively support the transition to a lower-carbon economy and enhance Westpac's climate resilience. This year we made good progress on our climate strategy. We further reduced operational emissions, advanced towards Westpac's 2030 financed emissions sector targets and recorded solid growth in sustainable finance and bond facilitation. We have also lifted our capability to analyse and assess climate-related risks and opportunities, by improving scenario analysis, introducing a climate risk policy and expanding training. This positions us well for the future by supporting our resilience and ability to meet new prudential standards and legislative reporting requirements. Westpac's new Climate Transition Plan (CTP), shaped by stakeholder feedback, outlines our targets and approach to supporting progress towards our climate ambition. The CTP supersedes our 2023-2025 Climate Change Position Statement and Action Plan. Refer to the 2025 Sustainability Report for more information. Reducing the direct impact of our operations We believe in leading through action, demonstrated by our progress towards achieving our operational emissions reduction targets. In FY23, we met our 2025 scope 1 and 2 operational emissions reduction target. In FY24, we delivered our 2030 operational emission target six years ahead of plan. Despite this, we remain focused on further reducing our impact, with scope 1 and 2 operational emissions declining a further 22%, largely from the transition of our fleet towards hybrid or electric vehicles (pictured). The 89% reduction since 2021 places us comfortably ahead of our 2030 target of a 76% decline. We have continued to source the equivalent of 100% of electricity from renewable sources. This has been supported by our long-term virtual power purchase agreements with the Bomen Solar Farm in New South Wales, Ararat Wind Farm in Victoria, and Berri Solar Farm and Battery in South Australia. Westpac’s operational emissions Upstream scope 3 emissions were down 2% in FY25 and 42% lower than the 2021 baseline year, putting us on track to achieve our target of a 50% reduction by 2030. FIGURE 1: WESTPAC'S OPERATIONAL EMISSIONS (MARKET-BASED) (TONNES OF CO2 EQUIVALENT) 133,570 82,092 63,146 Scope 1, 2 and scope 3 Upstream emissionsb 2021a 2023 2025 a. The 2021 reported emissions (above) differ from our 2021 baselines for scope 1, 2 and scope 3 upstream targets as the baseline was adjusted for COVID pandemic and other factors. b. Refer to 2025 Sustainability Report for the scope 3 upstream emissions categories included. |
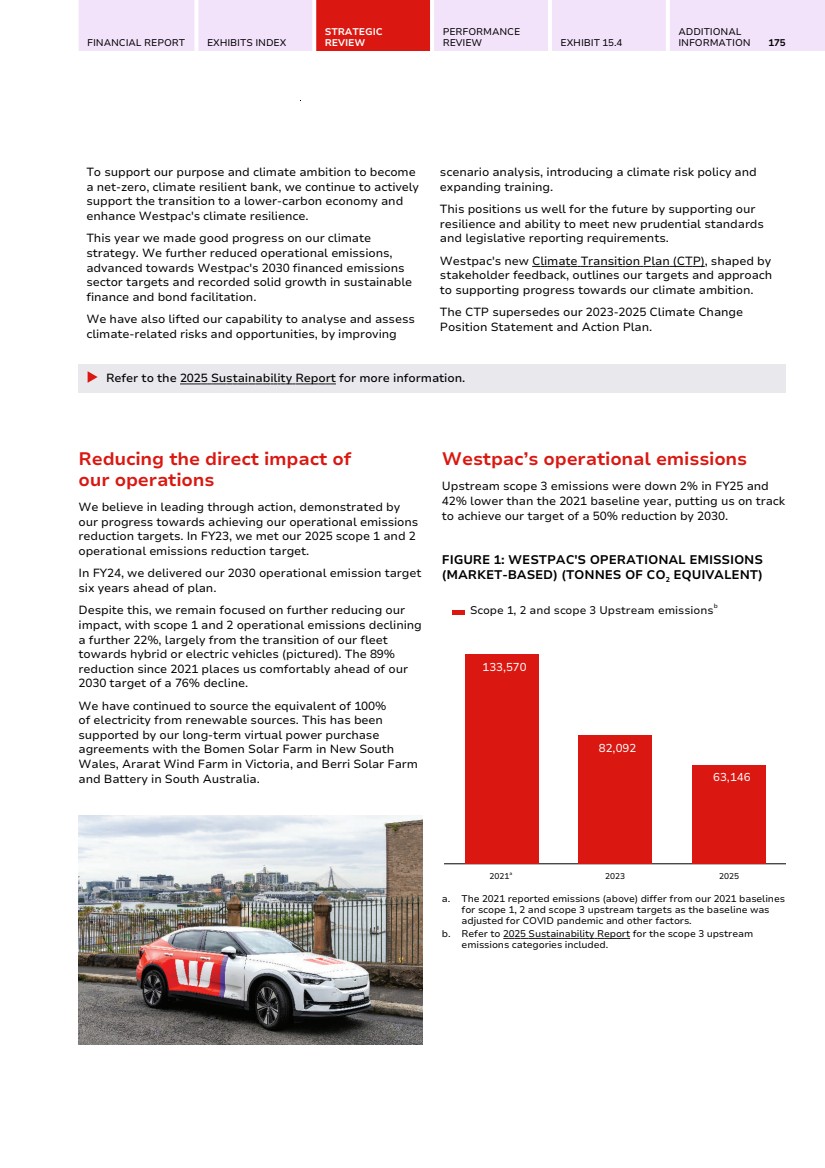
| 176 WESTPAC GROUP 2025 ANNUAL REPORT CREATING VALUE FOR THE ENVIRONMENT Supporting the customer transition With more than 99% of emissions linked to lending, reported as scope 3 financed emissions, helping customers to transition is where we are focusing our efforts to drive meaningful change. Our aspiration is to reduce Westpac's financed emissions in line with the goals of the Paris Agreement. It is complemented by 13 sector targets, including high-emitting industries. This year we reported improved progress for more than 70% of our financed emissions sector targets. We report financed emissions one year in arrears, so the most recent available data is from FY24. Westpac's total financed emissions were 40.7 MtCO2-e for FY241 , slightly higher than in FY23. This was primarily due to: • Adoption of a higher-quality source for emissions factors used to estimate customer emissions; and • A rise in the share of Business and Institutional lending for which we estimate financed emissions. As a part of managing sustainability risks in our lending, we updated our Carbon-Intensive Sector Requirements during the year. Existing customers in-scope of these requirements are now subject to a Customer Climate Transition Plan (CTP) Evaluation when they seek new or renewed corporate lending or bond facilitation. These requirements apply to customers operating in oil and gas, metallurgical coal mining and coal-fired power generation sectors and outline how we engage and consider financing decisions. The CTP Evaluation rates customers’ CTPs on a four-point scale of A to D and informs the actions we will take depending on the rating. If a customer CTP is rated ‘D’ they would not currently be eligible for new or renewed corporate lending or bond facilitation unless financing supported National or Energy Security2 . As we have worked to implement these requirements, we conducted a preliminary analysis of existing in-scope customers’ CTPs. In that review, approximately 55% were rated ‘A’ while 9% were rated ‘D’. Further information can be found in the 2025 Sustainability Report. We have delivered on our FY25 commitment to reduce corporate lending to institutional thermal coal mining customers3 to zero. In FY25, we had in-depth engagements with more than 130 institutional and corporate customers in Australia and New Zealand on their climate transition plans. Of these, 83% had a public report outlining their climate transition strategy. With the introduction of mandatory climate reporting, the maturity of our customers’ disclosures varies. To support our agriculture financed emissions sector targets, we have continued engaging with customers, industry bodies, and at key events. This included sponsoring Meat & Livestock Australia (MLA) Carbon EDGE workshops, which aim to help farmers reduce emissions through best practices in productivity, animal welfare and environmental management. In 2023, as part of setting 2030 Agriculture financed emissions sector targets for Dairy and for Beef and Sheep, we expressed a commitment to no deforestation4 from 31 December 2025 for customers in scope of our targets, and to engage with customers on this commitment. Since that release, we have engaged with rural research and development corporations, members of the agricultural supply chain, peak industry bodies and with customers to understand how this would affect the sector. Following our consultation, we have refined our approach, no longer requiring a formal ‘no deforestation’ commitment, but continuing to develop practical ways to help customers manage deforestation risk effectively. This includes supporting industry efforts that help farmers assess and verify deforestation free status for supply chain reporting. For more detail, refer to the 2025 Sustainability Report. Engaging with customers to better understand their decarbonisation approaches is critically important. By doing this, we can identify where we can offer support and play a meaningful role in the broader climate transition. Strengthening insights We took steps to broaden our scenario analysis by incorporating new data sources to evaluate risks at the customer property level. We also used geospatial mapping to identify regions more susceptible to climate-related impacts. This is improving our understanding of physical risks across our lending. In turn, it enables us to provide more targeted support to customers to help strengthen their climate resilience. Growing sustainable finance Sustainable finance and bond facilitation play a role in assisting customers as they transition. Supported by our Sustainable Finance Framework, sustainable finance lending has reached $39 billion and increased 37% during the year. Cumulative sustainable bond issuance has totalled $22 billion since the start of FY22 and rose 40% in FY25. This progress underscores our support for customers' sustainability objectives. It also helps to position us to achieve our 2030 targets of $55 billion in sustainable finance lending and $40 billion in cumulative bond facilitation. 1. Total financed emissions for scope 1 and 2, and for certain sectors where we estimate scope 3 emissions. 2. National or Energy Security – Circumstances where a government or regulator determines that additional supply, or maintaining current supply is necessary for national or energy security and Westpac’s funding is able to support such additional supply, in which case it may need to be escalated to an appropriate committee. 3. At 30 September 2025. In line with our Sustainability Customer Requirements, we have zero corporate lending and will no longer provide bond facilitation for Institutional customers with ≥15% of their three-year rolling average revenue coming directly from thermal coal mining. 4. Refer to the 2025 Sustainability Report for the full definition of deforestation. |
| FINANCIAL REPORT EXHIBITS INDEX STRATEGIC REVIEW PERFORMANCE REVIEW EXHIBIT 15.4 ADDITIONAL INFORMATION 177 Natural capital We continue to build capability and knowledge on nature-related risks and opportunities, in alignment with our Natural Capital Position Statement. This has helped us better understand our role in supporting customers and suppliers across our value chain on nature topics that are most material to them. At 30 September 2025, 14.2% of lending is in sectors defined by the Taskforce on Nature-related Financial Disclosures (TNFD)1 as having material nature-related dependencies and impacts. Further information is available in the 2025 Sustainability Index and Datasheet. Understanding material nature topics relevant to institutional customers We analysed nature-related disclosures of Australian institutional customers in TNFD priority sectors to better understand their material nature topics1 and inform our ongoing customer engagement. Of the customers reviewed, more than 35% identified at least one nature topic as a key sustainability topic2 , with freshwater, land and biodiversity most commonly cited. This was most prevalent in the food and beverage, paper and forest products, metals and mining, infrastructure and energy sectors. Progressing our approach in agriculture Using the TNFD LEAP framework3 we piloted an approach to assess nature-related dependencies for Australian agribusiness customers. The pilot used geospatial analysis to evaluate the potential dependency on water, native forest and world heritage sites. It provided insights into how agribusiness customers depend on nature and helps build understanding of potential risks and opportunities. We participated in the Australian Sustainable Finance Institute (ASFI) Natural Capital Advisory Group and Agriculture and Land Taxonomy Expansion Pilot Advisory Group, helping to shape draft criteria for the Integrating Nature into Finance research paper. Sustainable financing We continue to offer sustainable finance that encourages improved land use and biodiversity management. In FY25, Westpac: • Coordinated Arranger and Bookrunner for AirTrunk’s SYD1 and SYD2 term loan financing, supporting biodiversity, conservation and disaster relief, delivered through its social impact program; • Supported the structuring and issuance of an innovative nature-focused Sustainability-Linked Bond for Auckland Council. Refer to case study; and • Provided Sustainable Farm Loans to 48% of total agribusiness term lending in New Zealand, totalling NZ$4.02 billion. Supplier engagement We work with Westpac's Australian suppliers to understand their approach to circularity and nature. This has resulted in positive outcomes such as a reduction in packaging of IT equipment, increased volumes of forestry certified paper and the reuse of equipment and materials across our operations and value chain. Additionally, we strengthened our responsible sourcing program by introducing new criteria to assess circularity, reduce deforestation risks and impacts on critical habitats for medium and large suppliers. Environmental performance We also continue to monitor the environmental performance of our operations. Further information is available in the 2025 Sustainability Index and Datasheet. SUSTAINABILITY-LINKED BOND FOR AUCKLAND COUNCIL Westpac supported the structuring and issuance of an innovative nature-focused Sustainability-Linked Bond for Auckland Council. The NZ$250 million three-year wholesale bond is the first in Australasia to include a nature-based target, with Auckland Council targeting to plant one million native ngahere (forest) stems across its regional parks by the end of 2027. If the target is not achieved, Auckland Council will make a donation to organisations supporting the restoration of native ngahere across the Auckland region. Typically, Sustainability-Linked Bonds include additional payments to investors for missed targets. The structure of Auckland Council’s Sustainability-Linked Bond ensures that the Auckland community benefits, irrespective of whether the planting target is met. 1. Taskforce on Nature-related Financial Disclosures. (2024). Sector Guidance Additional Guidance for Financial Institutions v2. 2. Nature is identified as a key sustainability topic if the customer identifies land, freshwater, ocean, biodiversity or nature in general as a key sustainability topic or the customer has set a nature-related target. 3. LEAP is short for Locate, Evaluate, Assess and Prepare. |
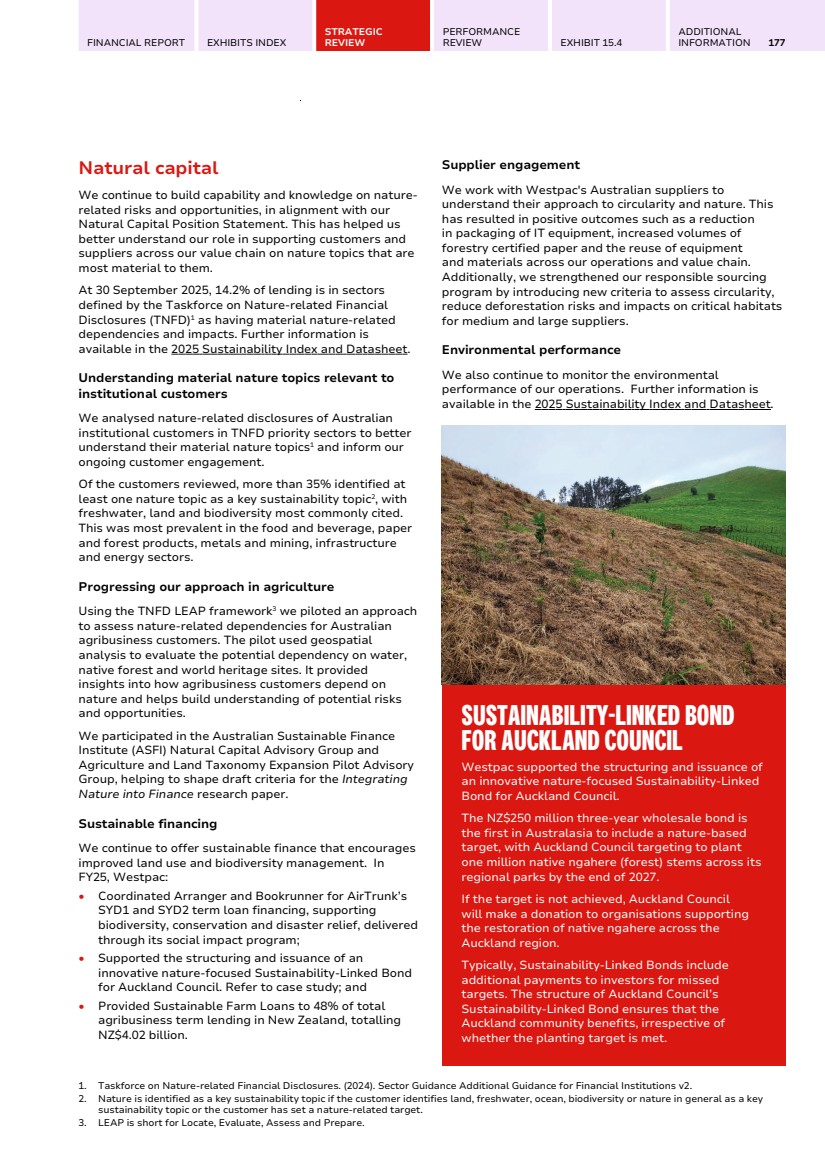
| 178 WESTPAC GROUP 2025 ANNUAL REPORT TRANSFORMATION Our transformation agenda is building a more efficient technology environment to help deliver better outcomes for customers, employees and shareholders. We have established a dedicated transformation office, led by a Chief Transformation Officer and supported by a skilled team, to drive effective transformation across Westpac. UNITE, our business-led, technology-enabled transformation program, is a cornerstone of this agenda. It aims to simplify operations and enhance experiences by consolidating technology stacks, decommissioning legacy systems and streamlining our product suite to make banking simpler for customers. To choose the best path for UNITE, we’ve adopted a 'one best way' approach to deliver Westpac consistently across our channels, processes and products. UNITE comprises four stages: Discovery, Simplify, Implement and Decommission. The Discovery stage is complete, with 51 initiatives underway and eight delivered. Modernising technology Complementing UNITE are two flagship digital innovations, BizEdge and Westpac One. BizEdge, our new business lending origination platform, is accelerating digital capabilities for bankers, with AI-powered tools that support faster, more confident decision-making. Westpac One, our new Institutional platform, will integrate treasury, FX trade and lending with real-time data insights to enhance customer experience and operational performance. These initiatives reflect our commitment to making Westpac simpler, while modernising how we work to deliver better outcomes for customers and our people. UNITE: ONE PRIVATE BANK We completed a successful transition of customers to a single, Private Bank under the Westpac brand. This strategic initiative was designed to enable more customers to benefit from Westpac's enhanced digital experience and improved service offering. Customers who transitioned gave positive feedback, which reflected in a strong Brand NPS1 result for Private Bank. The initiative cost $5 million to complete and has cut related processes and systems by 50%, reducing duplication and streamlining banker workflows. Additionally, it supports our aim to grow Private Bank's balance sheet and funds under management. BIZEDGE WESTPAC ONE Fast, simple, digital business lending origination Leading banking capability for large businesses Objectives • A single digital business lending origination platform that reduces both customer input and banker processing time by 50% FY25 progress • $4.8bn in applications since launch in March • Average time to decision reduced by 45% • Quick and easy log in • Automated company and Personal property Securities Register searches • Built-in National Credit Code assessment • Real-time application tracking Objectives • Progressive, three-year rollout of next generation transaction banking for large organisations • Modern hyper-scalable core banking platform • Real-time corporate treasury management services • Digitised servicing and virtual assistant support • Intelligent AI automation and data insights FY25 progress • Real-time deposit ledger implemented • Connected to the domestic payment scheme (NPP) 1. Refer to the Glossary (pages 324-327) for more information on NPS. |
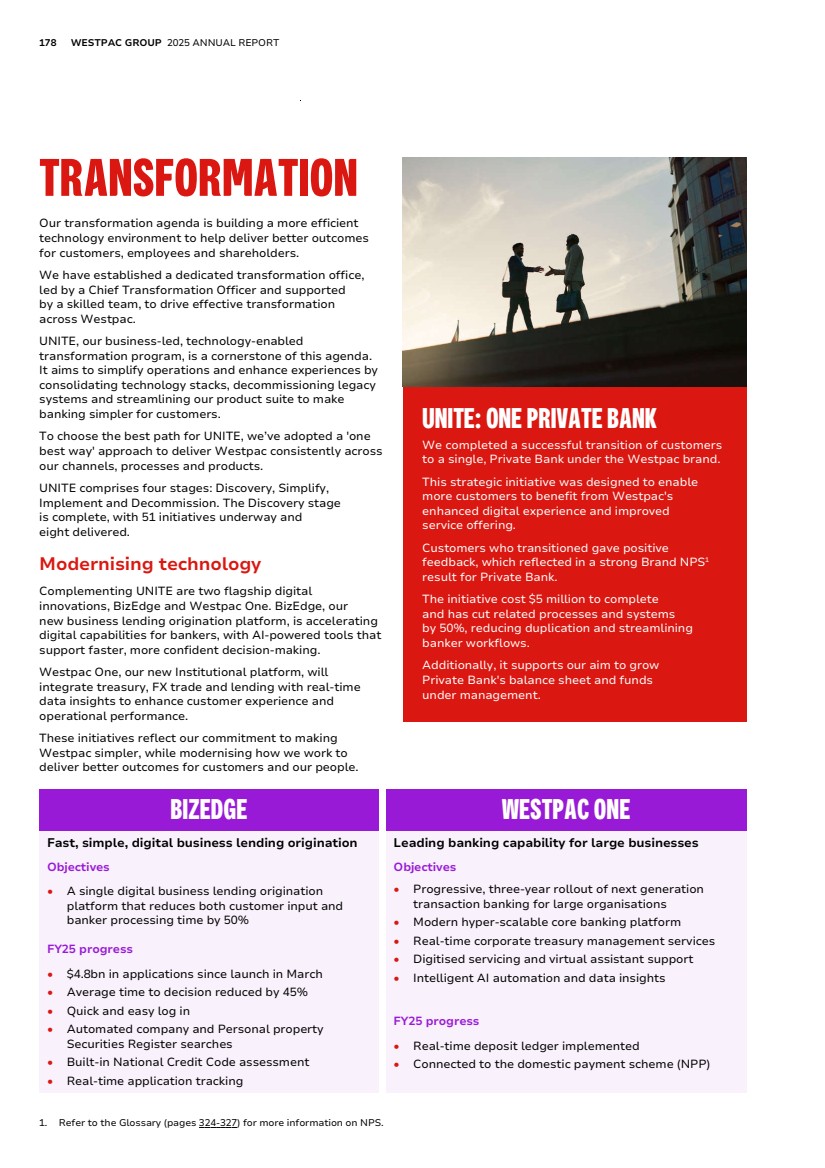
| FINANCIAL REPORT EXHIBITS INDEX STRATEGIC REVIEW PERFORMANCE REVIEW EXHIBIT 15.4 ADDITIONAL INFORMATION 179 DATA, DIGITAL AND AI 15,724 people using GenAI to support how they work 700 mortgage assessors using AI for faster processing #1 banking app in Australia, three years in a row Data analytics, digital innovation, and AI are supporting our evolution into a smarter, safer and more productive bank. As part of our transformation agenda, we are leveraging artificial intelligence and data insights to improve decision-making, accelerate speed to market and enhance customer satisfaction. This investment in modernising technology and data is essential to our AI readiness by improving the integrity, accessibility and usability of data. To centralise and strengthen our efforts, we have appointed a new Group Executive for Data, Digital and AI to support our strategic focus on improving experiences while embedding AI responsibly. We are also equipping our people with the skills needed to gain benefits from these technologies. GenAI training uptake has been strong, with 19,000 eLearning modules and educational sessions completed. More than 3,600 people engaged in the CEO-sponsored AI Shark Tank, showcasing the energy and creativity of our people in applying AI to real-world challenges. Refer to page 167 for more information. Responsible AI and governance We are committed to the ethical, safe and transparent use of AI, supported by a robust governance framework and evolving risk reporting mechanisms to ensure responsible development. We’re guided by Westpac’s Responsible AI Principles, along with our AI Risk Management Standard (AIRMS) and Responsible AI Playbook. Together, they shape how we use AI while ensuring we maintain an external lens that reflects both community expectations and regulatory requirements. Our leadership in this space was recognised internationally, with Westpac shortlisted for the 2025 DataIQ Awards UK in the category of 'Best Responsible AI Program', highlighting our commitment to safe, scalable and ethical AI innovation. Accelerating AI innovation We have been using AI in different forms for more than a decade. Our focus today is on scaling proven generative AI solutions that have tangible benefits through our AI Accelerator. It has delivered 33 solutions to date with a further 27 in delivery. Some of its benefits include: • AI for customer safety: Our Fraud and Scams team are assisted on calls by 'JESS', our Joint Expert Scam Spotter. This AI capability delivered real-time guidance during 20,000 customer calls, yielding unique insights and helping to protect customers from scams and fraud. • AI for faster lending decisions: The Mortgage AI Assessor introduced last year is now supporting 700 assessors to process mortgage applications, saving more than 12,000 hours of assessor time annually. • AI to empower our people: 15,724 employees are actively using Gen AI tools, exceeding our FY25 target of 10,000. We've deployed 10,600 Microsoft 365 Copilot licenses, including access to personal agents via Copilot Studio Lite, enabling staff to interact with data using natural language in a secure environment. A pilot group is now live on Copilot Studio's advanced AI agent capabilities, expediting AI Shark Tank opportunities. • AI for efficiency: Our use of Agentic AI in Data Products is transforming how we work, enabling autonomous AI agents to deliver outcomes up to twelve times faster and helping scale GenAI solutions across the organisation. In recognition of this innovation, we were proud to be named a finalist in the 2025 Finovate Awards in New York. FINANCIAL CRIME AI: SMARTER SURVEILLANCE AT SCALE Westpac has developed an innovative AI-based system to improve its financial crime investigation capability. It can automatically summarise analysis from large volumes of data, making it easier to identify risks and act quickly. By cutting down on manual work, the system supports teams to make faster, more consistent decisions. This helps us to focus on new threats while freeing up our teams to support more customers. |
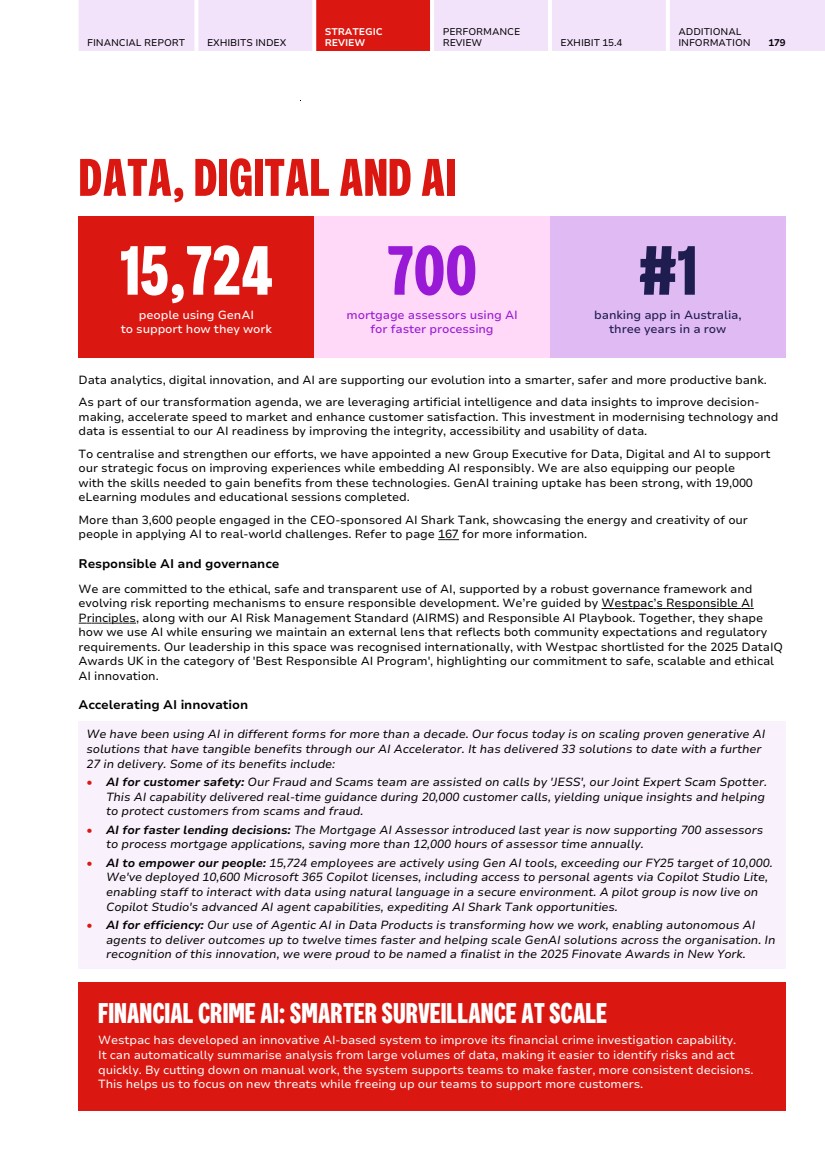
| 180 WESTPAC GROUP 2025 ANNUAL REPORT RISK MANAGEMENT Proactive risk management and a strong risk culture are essential to Westpac’s strength and resilience. They guide the organisation’s operations and decision-making and support our ability to adapt to a changing environment. Westpac’s risk management framework (Framework) outlines how the organisation manages its material risks and delivers better outcomes for customers, communities, its people and other stakeholders. The Framework is centred around customers, a strong risk culture and an effective Three Lines of Defence (3LOD) model. The Risk Management Strategy, which incorporates the Framework, is approved by the Board. It is supported by risk class frameworks, risk appetite statements and policies. These are all reviewed regularly to maintain the effectiveness of the Framework. For further information on the risks we face, refer to 2025 Risk Factors. RISK MANAGEMENT FRAMEWORK COMPONENTS CUSTOM ERS Governance and Management Control Business Strategy Risk Identification Risk Appetite Stress and Scenarios Analysis People and Infrastructure Control Definition and Effectiveness Monitoring and Reporting Actions and Response Risk Culture Three Lines of Defence CUSTOMERS |
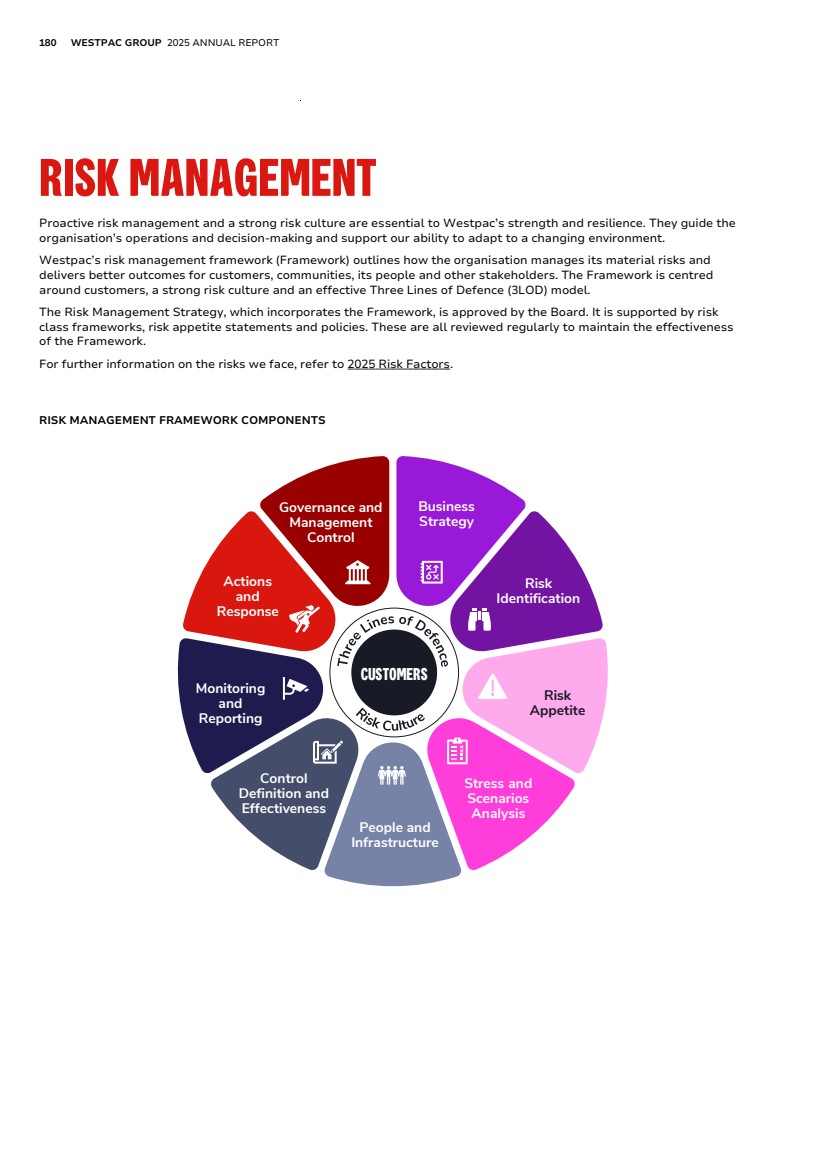
| FINANCIAL REPORT EXHIBITS INDEX STRATEGIC REVIEW PERFORMANCE REVIEW EXHIBIT 15.4 ADDITIONAL INFORMATION 181 Strengthening risk management In December 2020, Westpac entered a Court Enforceable Undertaking (CEU) with The Australian Prudential Regulation Authority (APRA). We committed to remediating specific prudential weaknesses identified by APRA in our culture, governance and accountability, and address the root causes of these issues. In response, Westpac established the Customer Outcomes and Risk Excellence (CORE) Program and appointed an independent reviewer. Prior to this, APRA had imposed a $500 million operational risk capital overlay on Westpac in July 2019 and an additional $500 million operational risk capital overlay in December 2019. In recognition of the progress and improvements in risk management under CORE, in July 2024, APRA reduced its operational risk capital requirement by $500 million. In October 2025, APRA removed the remaining $500 million risk capital overlay, satisfied that the CORE program is complete and the specific prudential issues identified by APRA have been addressed. Promontory Australia, the independent reviewer noted in their final report on the CORE program: “The depth of change to the organisation, both structurally and culturally, means that Westpac is now a simpler, stronger bank." Three Lines of Defence (3LOD) PRINCIPLES First Line owns and manages the risks they originate: − The First Line proactively identifies, evaluates, owns, monitors, manages and controls the existing and emerging risks in their business. It manages business activities within approved risk appetite and policies. − In managing its risk, the First Line establishes and maintains appropriate governance structures, controls, resources and self-assessment processes, including issue identification, recording and escalation procedures. The 3LOD work together to deliver effective risk management outcomes to achieve the Group's Purpose. The 3LOD work together to make sound risk-based decisions through: − strong and proactive engagement, communication, trust and collaboration − management information that is reliable, coherent and transparent. There must also be alignment of activities across the 3LOD to avoid unnecessary duplication, overlap, or gaps. Third Line provides independent and objective assurance: − Group Audit is the Third Line assurance function that provides the Board and Senior Executive with independent and objective evaluation of the adequacy and effectiveness of the Group’s governance, risk management and internal controls. 3LOD IN WESTPAC Second Line provides insight, oversight and challenge of First Line activities: − The Second Line is an independent function that develops risk management frameworks, defines guardrails, provides objective review and challenge regarding the effectiveness of risk management within the First Line business, and executes specific risk management activities where functional independence and/or specific risk capability is required. − Its approach is risk-based and proportionate to First Line activities. THIRD LINE Independent Assurance Audit Function SECOND LINE Insight, Oversight and Challenge Risk Function FIRST LINE Own and manage risk All Divisions and Functions excluding Risk and Audit Functions |
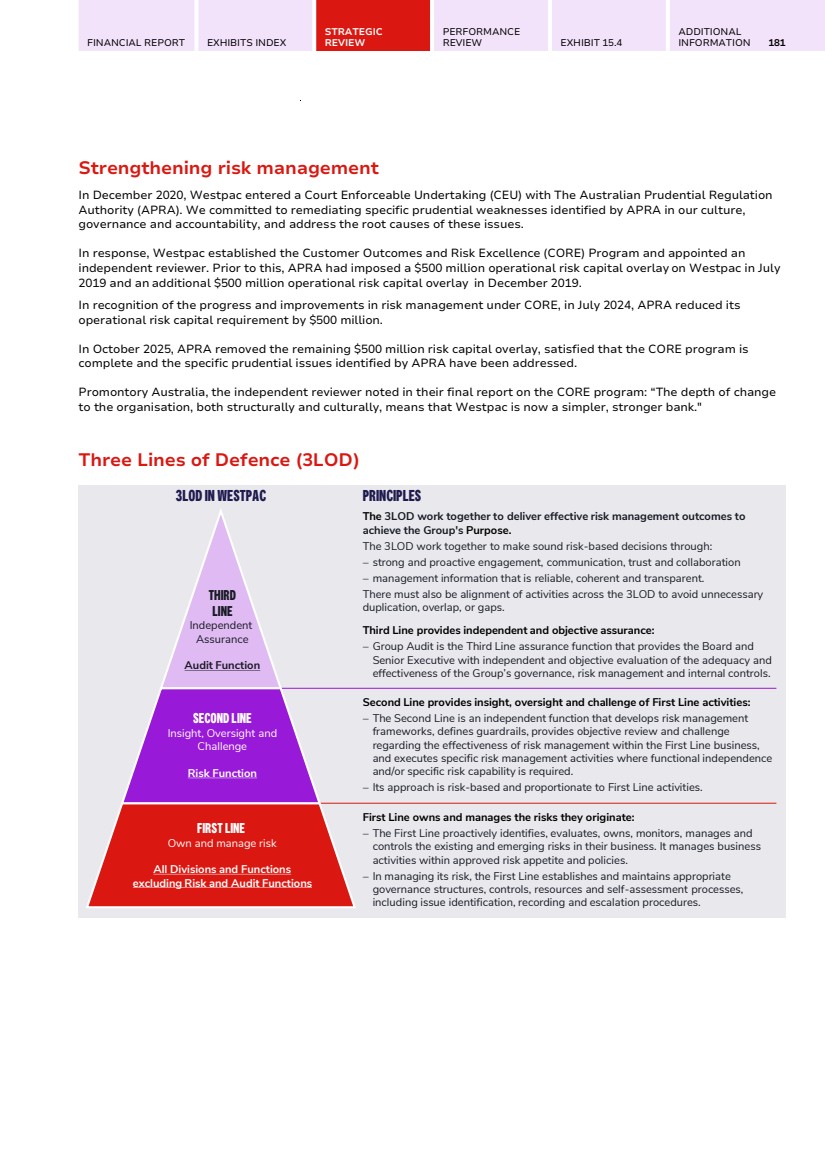
| 182 WESTPAC GROUP 2025 ANNUAL REPORT RISK MANAGEMENT Material risk categories Westpac has identified 11 material risk categories, among other potential risks, that could impact its business activities. 1 Capital Adequacy 2 Funding and Liquidity Risk 3 Credit Risk 4 Market Risk 5 Strategic Risk 6 Risk Culture 7 Operational Risk 8 Compliance and Conduct Risk 9 Financial Crime Risk 10 Cyber Risk 11 Reputational and Sustainability Risk For each material risk category, the Board establishes a risk appetite which is articulated in the Board Risk Appetite Statement (RAS). The RAS lists our material risks, along with the measures and tolerances used to monitor each risk. Most of these measures are monitored by 'green', ‘amber’ and ‘red’ tolerances which indicate when risks are close to, or over, the Board’s approved appetite. The following table provides more detail. MATERIAL RISK CATEGORIES 1 Capital Adequacy Risk The risk that Westpac has an inadequate level or composition of capital to support its normal business activities and to meet its regulatory capital requirements. Risk Appetite and Mitigation We aim to maintain a strong balance sheet including under stressed scenarios. We evaluate capital management through our Internal Capital Adequacy Assessment Process, features of which include: • Capital management strategy; • Considering economic and regulatory requirements and stakeholder perspectives; • Stress-testing considerations; and • Target operating range for key capital ratios. Areas of focus include: • Continuous monitoring of capital forecasts; • Considerations of capital headwinds; and • Actively monitoring the economic outlook and credit risk arising from higher interest rates and cost-of-living pressures. Example of a Risk Appetite measure • CET1 capital ratio – a measure which indicates a bank’s capacity to absorb losses. |
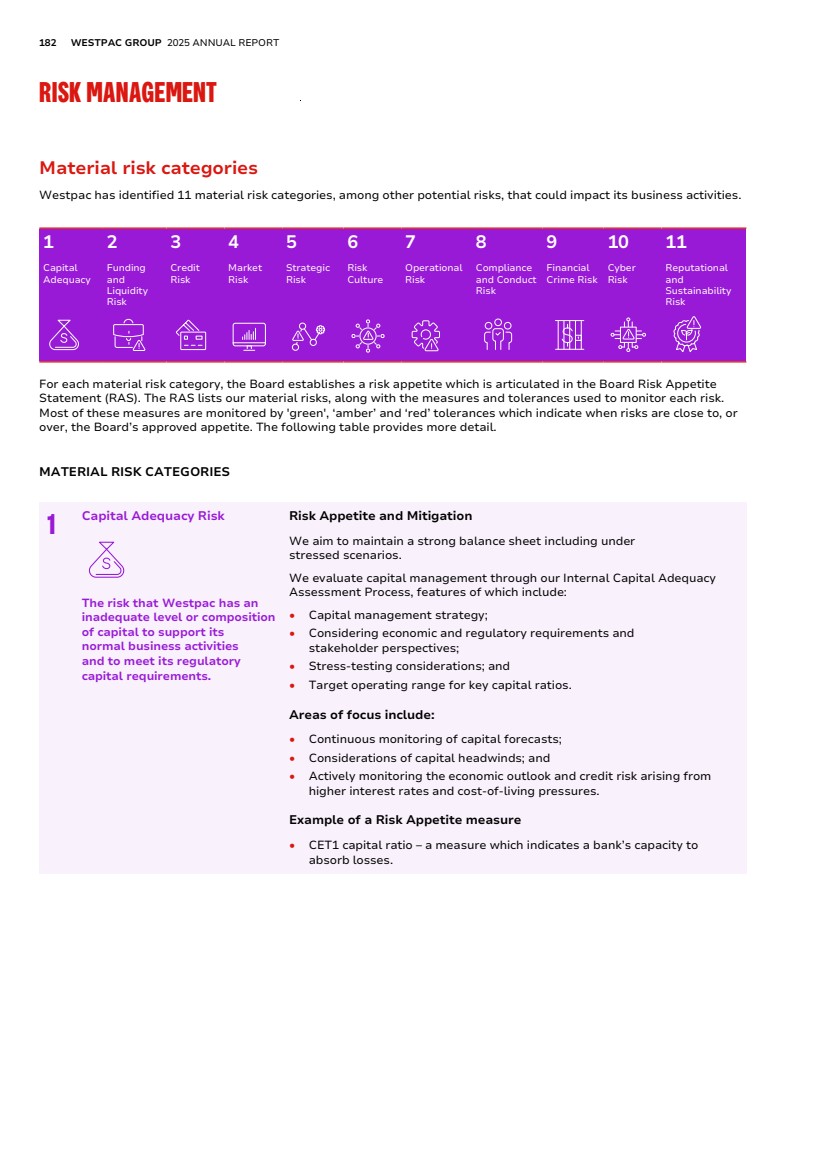
| FINANCIAL REPORT EXHIBITS INDEX STRATEGIC REVIEW PERFORMANCE REVIEW EXHIBIT 15.4 ADDITIONAL INFORMATION 183 2 Funding and Liquidity Risk The risk that Westpac cannot meet its payment obligations or that it does not have the appropriate amount, tenor and composition of funding and liquidity to support its assets. Risk Appetite and Mitigation We aim to manage our balance sheet such that we: • Maintain a diversified, stable and cost-effective funding base; • Can source funding as and when needed; • Have sufficient securable assets to meet our funding and repurchase agreement requirements; and • Fund lending growth with stable funding sources. Further information on funding and liquidity risk management is in Note 21 (page 73). Areas of focus include: • Executing the wholesale funding plan to support balance sheet growth and refinance maturing debt; and • Managing liquidity risk to meet regulatory requirements and Westpac’s liquidity needs in line with market conditions. Examples of a Risk Appetite measure • Net Stable Funding Ratio (NFSR); and • Liquidity Coverage Ratio (LCR). 3 Credit Risk The risk of financial loss where a customer or counterparty fails to meet their financial obligations to Westpac. Risk Appetite and Mitigation We manage credit risk using: • Board approved credit risk limits and approval authorities which are cascaded through the bank; • Clear boundaries to guide appropriate credit risk strategic choices • Reviewing settings and appetite on a regular basis to adjust for changes in the operating environment; and • A range of policies, processes and systems to support credit risk monitoring and management. Further information on credit risk management and provisioning is in Note 10 (page 33) and Note 11 (page 43) to the financial statements and in the September 2025 Pillar 3 report. Areas of focus include: • Responding to heightened credit risk from domestic and international factors including cost of living pressure, higher interest rates, ongoing geopolitical risks, trade disruptions and a more uncertain economic environment; • Stress testing our credit portfolio including for climate related change and the transition to net-zero emissions; and • Assessing the impact of any external events, and provision modelled outcomes including lending growth and conditions for specific customer groups (e.g. including by geography, industry etc.) the adequacy of the overall expected credit loss provision. Example of a Risk Appetite measure • Top 10 exposures to Corporates and Non-Bank Financial Institutions as a % of Total Committed Exposure. |
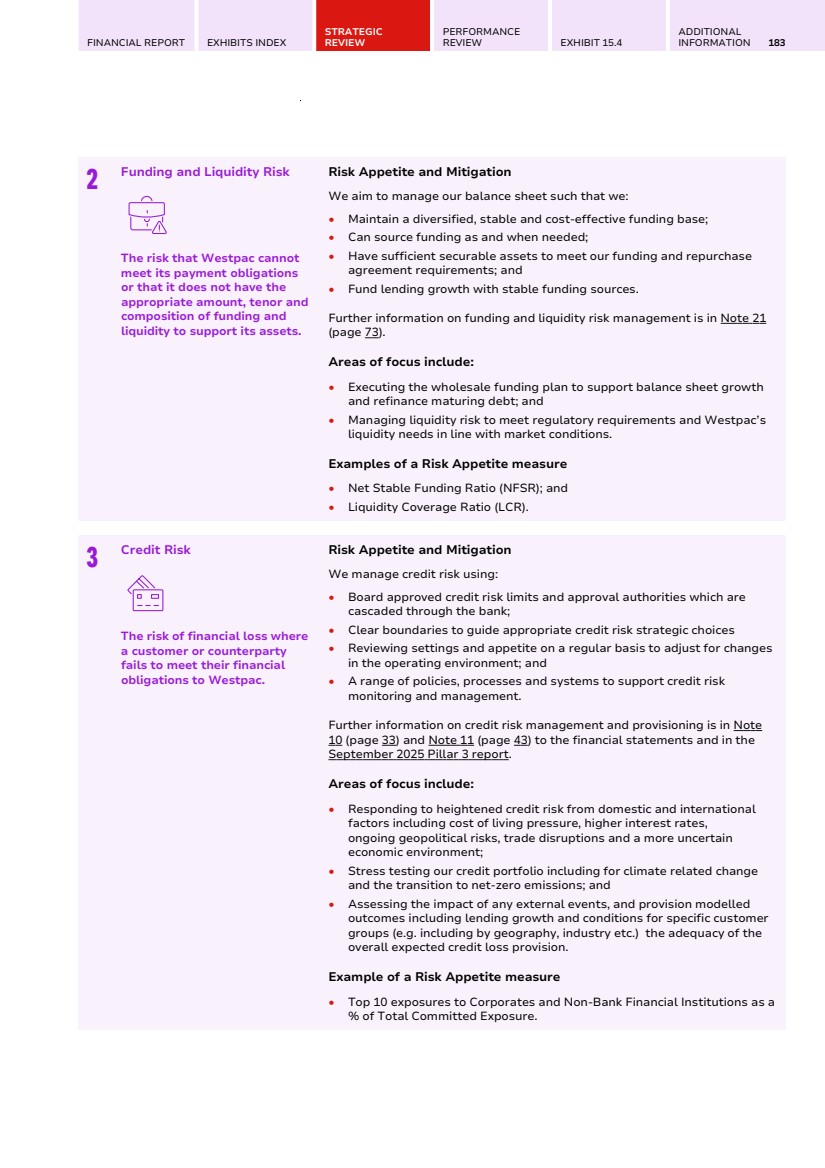
| 184 WESTPAC GROUP 2025 ANNUAL REPORT RISK MANAGEMENT 4 Market Risk The risk of an adverse impact on Westpac’s earnings and economic value resulting from changes in the value of Westpac’s positions due to a change in financial market factors, such as foreign exchange rates, commodity prices, equity prices, credit spreads and interest rates. This includes earnings at risk – the risk to net interest income from interest rate changes, and economic value sensitivity – the risk of variability in the Group’s banking book capital requirements. Risk Appetite and Mitigation We have appetite for market risk in approved products within our limit framework. We manage market risk through the employment of prudent risk management strategies and active monitoring of Board-approved metrics that capture the potential risk of adverse movements in financial markets. The Board has approved a risk appetite for traded and non-traded risks via the measurement of Value at Risk (VaR), Stressed VaR (SVaR), Net Income at Risk (NaR) and risk sensitivities to interest rates for capital hedges and to credit spreads for the liquid securities portfolio. The management of market risk is supported by the Market Risk Management Framework and associated policies, limits, processes, systems and delegated authorities. Further information on market risk management is in Note 21 (page 73). Areas of focus include: • Upgrading/replacing market risk systems and supporting infrastructure; and • Implementing regulatory change related to prudential market risk standards. Example of a Risk Appetite measure • Value at Risk (VaR), a statistic that quantifies the extent of possible financial losses arising from the Bank’s Treasury and Financial Markets businesses. 5 Strategic Risk The risk that Westpac makes inappropriate strategic choices, does not implement its strategies successfully, or does not respond effectively to changes in the environment. Risk Appetite and Mitigation We aim to grow through well-considered initiatives aligned to our strategy and risk appetite. We aim to manage the impact of threats from changes in the environment, which could significantly impact our ability to implement our strategies. We continually evaluate our performance and seek to adapt to changes in the external environment in a timely manner. Areas of focus include: • Technology simplification and transformation; • Delivery of regulatory commitments; and • Invest in digital and data, with the aim of improving the customer experience. Examples of a Risk Appetite measure • Actual ROTE against the Target ROTE; and • Allocation of balance sheet to Australia and New Zealand (% of book in terms of Exposure at Default). |
| FINANCIAL REPORT EXHIBITS INDEX STRATEGIC REVIEW PERFORMANCE REVIEW EXHIBIT 15.4 ADDITIONAL INFORMATION 185 6 Risk Culture The risk that our culture does not promote and reinforce behavioural expectations and structures to identify, understand, discuss and act on risks. Risk Appetite and Mitigation We promote a risk culture that supports our purpose, strategy and values and our ability to manage risk effectively. We regularly assess our risk culture and undertake initiatives to continually improve. Areas of focus include: • Leader led role modelling and training; • Continuing to review, monitor and improve our tools and processes to support the management of risk culture; • Supporting improved capability across key behavioural change areas, including speak up, decision making, ownership, challenge and maturing action planning to drive behavioural change; and • Executing on an integrated culture plan to support driving change at all levels. Example of a Risk Appetite measure • Internal survey results – score for respondents who feel free to speak up without fear of negative consequences. 7 Operational Risk The risk of loss resulting from inadequate or failed internal processes, people and systems or from external events. Risk Appetite and Mitigation We aim to be resilient to operational risk and minimise risk through robust processes and controls. We aim to quickly and effectively remediate material operational issues and incidents. Areas of focus include: • Strengthening the control environment, including risk prevention and automation; and • Strengthening our operational resilience and adopting read-across processes to fully understand underlying issues. Example of a Risk Appetite measure • % of key controls assessed as ‘Unsatisfactory’. 8 Compliance and Conduct Risk The risk of failing to abide by compliance obligations required of us, or otherwise failing to have behaviours and practices that deliver suitable, fair and clear outcomes for customers and that support market integrity. Risk Appetite and Mitigation We establish robust controls and systems to manage compliance and conduct risk. We aim to promptly own, investigate and remediate incidents of non-compliance. We aim to prevent: • Breaches of regulatory requirements; • Conduct that causes unsuitable, unfair or unclear customer outcomes or adversely impacts the integrity of markets; and • Complicated systems or processes that could lead to systemic or material breaches of regulatory requirements. Areas of focus include: • Strengthening the management of our conflicts of interest, product governance, privacy risks and the oversight of regulatory reporting; and • Improving our tools and processes to support alignment of our behaviours and business practices to fair customer outcomes and market integrity. Example of a Risk Appetite measure • Average calendar days to complete all Compliance Assessments. |
| 186 WESTPAC GROUP 2025 ANNUAL REPORT RISK MANAGEMENT 9 Financial Crime Risk The risk that Westpac fails to prevent products and services being used to facilitate financial crime, fails to protect customers and Westpac from fraud and scam events or fails to comply with applicable global financial crime regulatory obligations. Risk Appetite and Mitigation Westpac is committed to protecting the integrity of the Australian financial system and importantly keeping our community safe. This aligns with our purpose of ‘Taking action now to create a better future’. Westpac helps prevent financial crime by proactively identifying, assessing, mitigating and reporting financial crime risks and complying with all applicable global and local financial crime regulatory obligations. Westpac continues to invest significant resources to assist AUSTRAC, law enforcement and the Australian Government (including through the Fintel Alliance) to detect, deter and disrupt financial crime. Areas of focus include: • Simplification and embedding strategic capabilities, improving detection and surveillance capabilities and expanding the use of network analytics; • Collaboration through involvement in Public and Private sector partnerships and other intelligence bodies to disrupt financial crime; and • Uplifting of Know your Customer (KYC) processes and enhancing customer lifecycle management through digital capabilities and automated controls. Example of a Risk Appetite measure • Volume of High/Very High Financial Crime residual risk ratings across Westpac's businesses. 10 Cyber Risk The risk that Westpac’s or its third parties’ data or technology are inappropriately accessed, manipulated or damaged from cyber threats or vulnerabilities. Risk Appetite and Mitigation We proactively manage our cyber risk exposure, to help ensure that we are resilient to cyber threats and vulnerabilities. In managing our cyber risk, we aim to ensure that: • We manage our risks within the appropriate regulatory frameworks; • We do not undermine our strategic, financial, reputational or regulatory standing; and • We implement cyber controls commensurate to the cyber threats we respond to. We recognise that cyber events may occur, however incidents must be managed timely and effectively to limit impact and future likelihood. Areas of focus include: • Enhancing cybersecurity capability including data security controls, application protection controls, identity and access management and strengthening our network perimeters; and • Embedding a consistent cyber risk management framework. Examples of a Risk Appetite measure • Control effectiveness against external cyber threats; and • Supplier security assessment outcomes. |
| FINANCIAL REPORT EXHIBITS INDEX STRATEGIC REVIEW PERFORMANCE REVIEW EXHIBIT 15.4 ADDITIONAL INFORMATION 187 11 Reputational and Sustainability Risk The risk of failing to recognise or address environmental, social or governance (ESG) issues as well as the risk that an action, inaction, transaction, investment or event will reduce trust in Westpac’s integrity and competence. Risk Appetite and Mitigation We aim to maintain the confidence of all stakeholders, aiming to balance the commercial aspects of decisions with stakeholder expectations. Our approach includes considering potential impacts on people, communities and the environment. We recognise that ESG issues can involve interconnected and sometimes competing considerations. Areas of focus include: • Continuing to improve assessment of customers and our supply chain for reputation and sustainability risks through existing governance processes and tools; • Continuing to embed the Climate Risk Policy, aligned with APRA’s CPG 229, including performing a Climate Risk Materiality Assessment to understand the intersection of climate risk across our material risk categories; and • Expanding our salient human rights assessment to include our role as a financial services provider, employer and supporter of communities. Example of a Risk Appetite measure • Reputation ranking from external ranking agency (such as RepTrak) which provides independent assessments of a company’s reputation, brand and ESG. |
| 188 WESTPAC GROUP 2025 ANNUAL REPORT CORPORATE GOVERNANCE OUR APPROACH TO GOVERNANCE Corporate governance is the framework of systems, policies and processes by which we operate and through which our people are both empowered and accountable for making decisions that affect our business, operations, customers and stakeholders. The framework establishes the roles and responsibilities of Westpac’s Board, management team, employees and suppliers. It also establishes the systems, policies and processes for monitoring and evaluating Board and management performance, and the practices for corporate reporting, disclosure, remuneration, risk management and engagement of security holders. Our approach to corporate governance is based on a set of Commitments and Behaviours that underpin our day-to-day activities. Our Commitments and Behaviours are designed to promote transparency, fair dealing, and the protection of stakeholder interests, including our customers, our shareholders, our employees and our community. We aspire to the highest standards of corporate governance, which Westpac sees as fundamental to the sustainability of our business and our performance. As Westpac’s principal listing is on the Australian Securities Exchange (ASX), we have followed the ASX Corporate Governance Principles and Recommendations (fourth edition) (ASXCGC Recommendations) published by the ASX Limited’s Corporate Governance Council (ASXCGC) throughout the year. Westpac’s ordinary shares are also quoted on the NZX Main Board, which is the main board equity security market operated by NZX Limited. BOARD AREAS OF FOCUS IN FY25 This year the Board (including with assistance from its Board Committees) has focused on overseeing: • our UNITE program which is focused on making our processes, systems and technology simpler to enhance customer and employee satisfaction and operational efficiency; • the appointment of Anthony Miller as Westpac's Chief Executive Officer (CEO), who commenced on 16 December 2024; • initiatives to deliver five key priorities: – Customer – striving to be #1 in customer service through a 'whole of bank to whole of customer' approach; – People – investing in our people and fostering a culture of accountability and empowerment; – Risk – completing the Customer Outcomes and Risk Excellence (CORE) program transition; – Transformation – simplifying technology and adopting a 'one best way' approach; and – Performance – improving return on tangible equity and cost-to-income ratio while strengthening our market position; • the introduction of Westpac's updated purpose – 'Taking action now to create a better future' alongside behaviours aligned with three key commitments – Always Deliver, Safely; Make an Impact; and Own it; • ongoing initiatives designed to deliver customer service excellence, including support for customers experiencing hardship and protections against scams; • the Group’s financial and operating performance, including progress in improving the Group’s financial performance relative to peers; • management of current and emerging risks arising from the evolving economic, geopolitical, regulatory, and competitive environment; • Westpac’s capital position and various capital management initiatives; • consideration and assessment of the resilience of the Group’s systems and response to potential cyber incidents and data breaches; • priorities outlined in our Sustainability Strategy and the approval of our updated Climate Change Position and Climate Transition Plan; • ongoing consideration of Board and senior executive succession, as well as Board and Board Committee composition; and • transition of the Westpac Group's external auditor from PricewaterhouseCoopers to KPMG. |
| FINANCIAL REPORT EXHIBITS INDEX STRATEGIC REVIEW PERFORMANCE REVIEW EXHIBIT 15.4 ADDITIONAL INFORMATION 189 THE BOARD Board of Directors The Board is comprised of ten independent Non-executive Directors and the Managing Director and CEO. A profile of each Director can be found on our website at: www.westpac.com.au/about-westpac/ westpac-group/ board-of-directors/. STEVEN GREGG Chairman and Independent Non-executive Director ANTHONY MILLER Managing Director and Chief Executive Officer TIM BURROUGHS Independent Non-executive Director NERIDA CAESAR Independent Non-executive Director DAVID COHEN Independent Non-executive Director PIP GREENWOOD Independent Non-executive Director DEBRA HAZELTON Independent Non-executive Director ANDY MAGUIRE Independent Non-executive Director PETER NASH Independent Non-executive Director MARGARET (MARGIE) SEALE Independent Non-executive Director MICHAEL ULLMER Independent Non-executive Director |

| 190 WESTPAC GROUP 2025 ANNUAL REPORT CORPORATE GOVERNANCE ROLES AND RESPONSIBILITIES The Board The role of the Board is to provide leadership and strategic guidance for Westpac and its related bodies corporate, in addition to overseeing the sound and prudent management of the Westpac Group. The Board Charter outlines the roles and responsibilities of the Board. Key responsibilities are: • approving and overseeing management’s implementation of the strategic direction of the Westpac Group, its business plan and significant corporate strategic initiatives; • appointing the CEO and Chief Financial Officer (CFO), and approving the appointment of Group Executives, the Chief Audit Officer and any other person the Board determines; • overseeing culture across the Group by setting the tone from the top, approving Westpac Group’s Code of Conduct and Purpose, Commitments and Behaviours, and receiving reporting on the Group’s culture; • assessing and reviewing the performance of the Board, its Board Committees, the CEO and the Group Executives; • oversight of the Group’s technology strategy and the implementation of key technology initiatives; • approving the Westpac Director Appointment & Renewal Policy and determining Board size and composition; • approving the Group Remuneration Policy; • approving, in accordance with the Group Remuneration Policy, remuneration arrangements, variable remuneration outcomes and adjustments to variable remuneration where appropriate for Group Executives, other employees who are accountable persons under the Financial Accountability Regime (FAR) (Accountable Person), any person performing a role specified by the Australian Prudential Regulation Authority (APRA) and any other person the Board determines; • approving the annual financial targets and financial statements, and monitoring financial performance against forecast and prior periods; • reviewing and approving capital management initiatives, including determining our dividend policy and the amount, nature and timing of dividends to be paid; • approving the Internal Capital Adequacy Assessment Process, including reviewing Group stress testing outcomes/scenarios, and approving recovery and resolution plans; • considering and approving our overall risk management framework for managing financial and non-financial risks; • approving the Risk Management Strategy and the Board Risk Appetite Statement and monitoring the effectiveness of risk management by the Group; • forming a view of our risk culture and overseeing the identification of, and steps taken to address any desirable changes to risk culture; • considering the social, ethical and environmental impact of our activities, setting standards and monitoring compliance with our sustainability policies and practices, and approving the Westpac Group's sustainability strategy and its position on material sustainability matters; • overseeing and monitoring workplace health and safety (WHS) issues in the Group and considering appropriate WHS reports and information; and • meeting with representatives from our principal regulators on a regular basis. The Board Charter is available on our website at: www.westpac.com.au/about-westpac/westpac-group/ corporate-governance/constitution-board/. WESTPAC’S BOARD AND BOARD COMMITTEE STRUCTURE BOARD COMMITTEES Provide relevant periodic assurances and reports (as appropriate) Provide assurance on the remuneration disclosures in the Remuneration Report Provide assurance on risk components of the annual report and interim financial results announcement Delegation Assurance, Oversight through Reporting Accountability Accountability Delegation Delegation Board Committees will refer matters to the Board or other Board Committees where appropriate. Specific reporting as shown above BOARD Independent Assurance and Advice External Auditors Group Audit Independent Assurance and External Advice Chief Executive Officer Group Executives Remuneration Audit Nominations & Governance Risk |
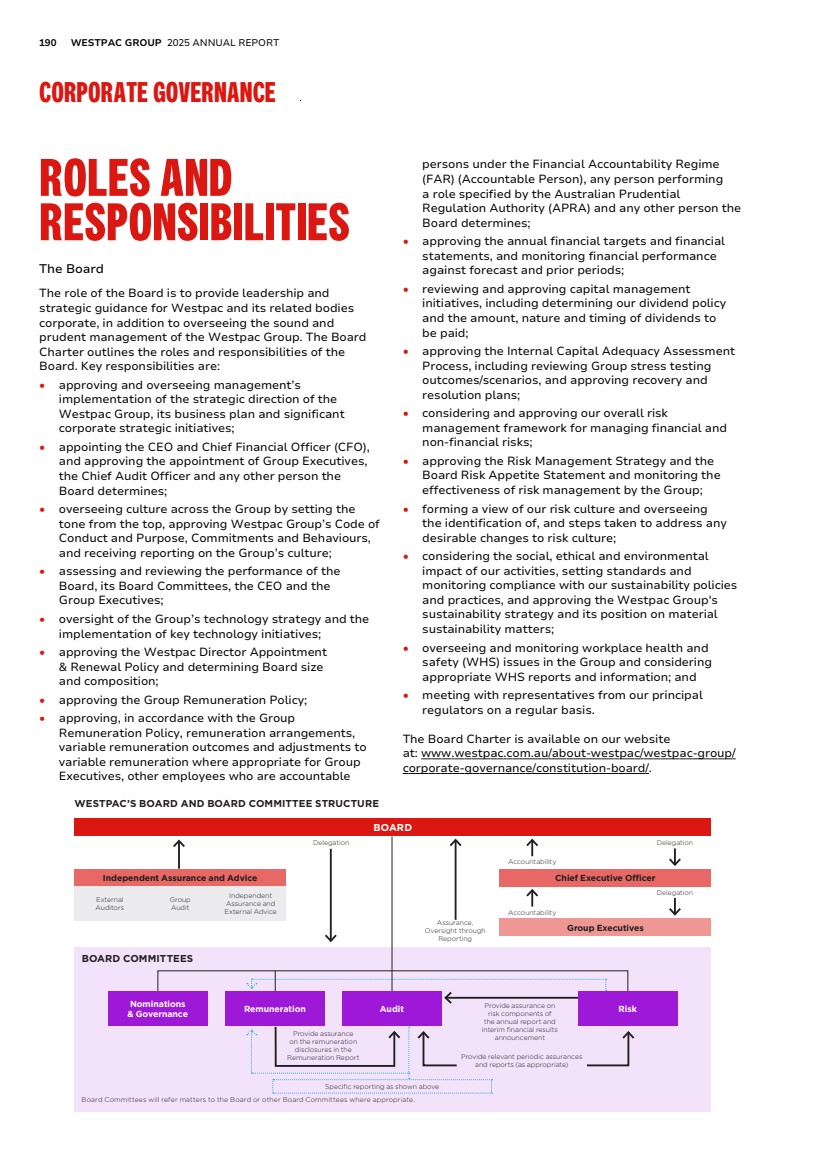
| FINANCIAL REPORT EXHIBITS INDEX STRATEGIC REVIEW PERFORMANCE REVIEW EXHIBIT 15.4 ADDITIONAL INFORMATION 191 The Board has delegated to the CEO, and through the CEO to the Executive Team, responsibility for the day-to-day management of Westpac’s business. These delegations are subject to the limitations and restrictions contained in the delegation instruments. The Board is assisted in meeting its roles and responsibilities by its four standing Board Committees. Further information about each of the Board Committees is set out in the section titled ‘Role of the Board Committees’. Chairman The Board elects one of the independent Non-executive Directors as Chairman. Our Chairman is Steven Gregg. His role includes: • providing effective leadership to the Board in relation to all Board matters; • guiding the agenda and conducting all Board meetings to facilitate discussions, challenge and decision-making; • in conjunction with the Company Secretary, arranging regular Board meetings throughout the year and confirming that minutes of meetings accurately record decisions taken and, as required, the views of individual Directors; • overseeing the process for appraising Directors and the Board as a whole; • overseeing Board succession, including in relation to the Board Chair and Board Committee Chair roles; • acting as a conduit between management and the Board, and being the primary point of communication between the Board and CEO; • representing the views of the Board to the public; and • taking a leading role in creating and maintaining an effective corporate governance system. CEO Our Managing Director and CEO is Anthony Miller. His role includes: • leadership of the Executive Team and, with the Board, overseeing succession planning for the Executive Team; • developing strategic objectives for the business and achievement of the planned results; and • the day-to-day management of the Westpac Group’s operations, subject to the specified delegations of authority approved by the Board. |
| 192 WESTPAC GROUP 2025 ANNUAL REPORT CORPORATE GOVERNANCE Board skills, experience and attributes Westpac seeks to maintain a Board of Directors with a broad range of relevant financial and other skills, knowledge, and experience necessary to guide the business of the Group. The Board uses a skills matrix to illustrate the key skills and experience the Westpac Board is seeking to achieve in its membership collectively and the number of Directors with each skill and experience. The skills matrix also assists to identify focus areas for the continuing education and professional development of Directors. For example, in FY25 these focus areas included technology developments and key environmental, social and governance topics (amongst others), which were facilitated through a combination of structured workshops, targeted deep dives, and site visits aligned with strategic priorities. The skills matrix also assists to identify areas where it may be desirable for specialist external expertise to be retained to supplement the Board’s skills and experience. The skills matrix is set out in Figure 1. FIGURE 1 – BOARD SKILLS, EXPERIENCE AND ATTRIBUTES AS AT 30 SEPTEMBER 2025 SKILLS AND EXPERIENCE DESCRIPTION NUMBER OF DIRECTORS Customer focus Experience in developing and overseeing a strong customer-focused culture in large and complex organisations, and a demonstrable commitment to achieving customer outcomes Strategy An ability to define strategic objectives, constructively question business plans, oversee the implementation of strategy using commercial judgement and bring a global perspective to bear Financial services Experience working in, or advising, the banking and financial services industry with strong knowledge of its economic drivers and global business perspectives Financial acumen Highly proficient in accounting or related financial management and reporting for businesses of significant size Risk management Experience in anticipating, recognising and managing risks, including financial, non-financial and emerging risks, and monitoring risk management frameworks and controls Technology, digital and data Experience in overseeing the application of technology in large and complex organisations, including in areas such as innovation, disruptive technologies, data, cyber-security, digital transformation and customer experience Governance Experience as a Director of a listed entity, with detailed knowledge of governance, including legal, compliance, regulatory and public policy issues applicable to listed entities and highly regulated industries Environment and social Experience in understanding and identifying potential risks and opportunities arising from environmental and social issues People and culture Experience in people matters including workplace health and safety, cultures, morale, inclusion and diversity, management development, succession, remuneration and talent retention initiatives Executive leadership Having held a CEO or a similar senior leadership role in a large complex organisation, and having experience in managing the business through periods of significant change and delivering desired business outcomes Deep experience and knowledge General working experience and knowledge Limited working experience and knowledge In addition to the skills outlined above, the Westpac Board seeks to ensure that it operates as a cohesive team, bringing together a range of perspectives to guide the Group and oversee management. The Westpac Board also expects its members to be committed to supporting our Purpose and upholding our Commitments and Behaviours. |
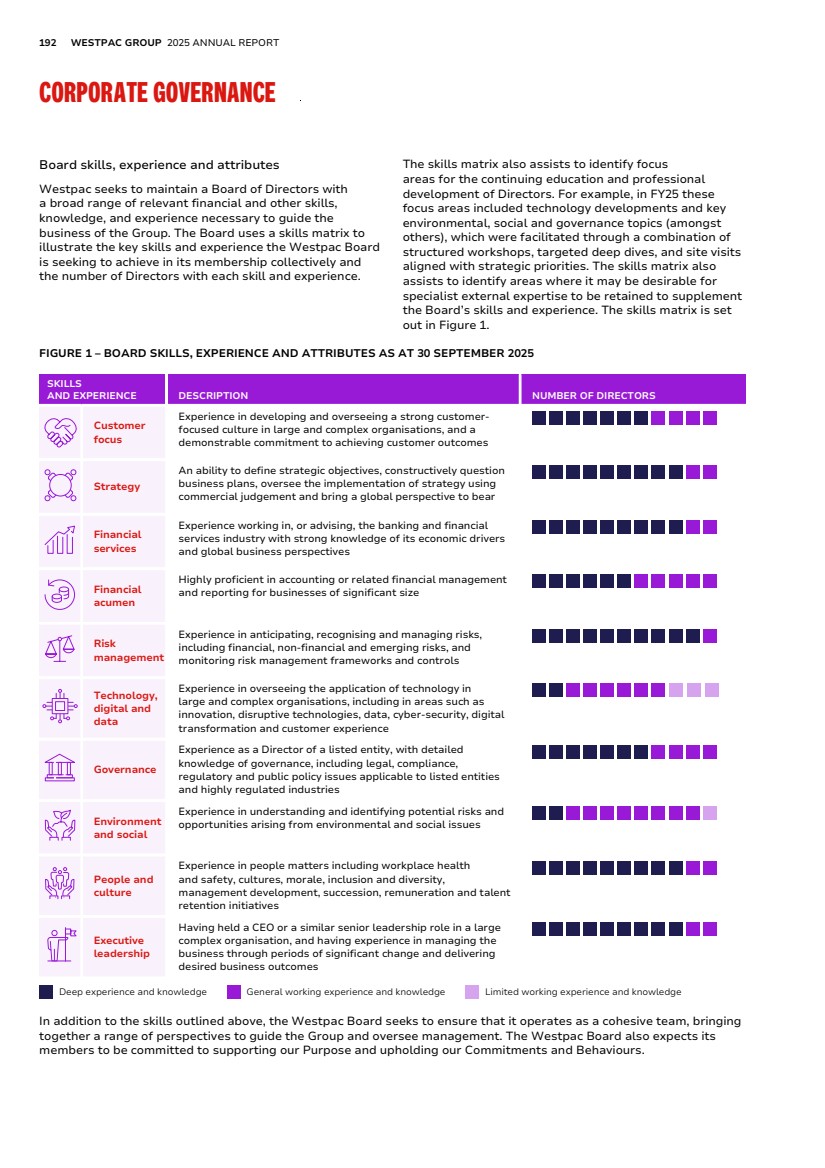
| FINANCIAL REPORT EXHIBITS INDEX STRATEGIC REVIEW PERFORMANCE REVIEW EXHIBIT 15.4 ADDITIONAL INFORMATION 193 Board diversity A diverse group of skilled Directors helps us be a stronger organisation that makes better decisions. In relation to gender diversity, for 2025, the Board Nominations & Governance Committee confirmed its objective of 40% women, 40% men and 20% any gender for the composition of the Westpac Board. In FY25, this objective included the Managing Director and CEO. From FY26, the Managing Director and CEO will be included within the Executive Team objective, with the Board objective applying only to Non-executive Directors1 . As at 30 September 2025, the gender composition of the Board was 64% male and 36% female. Independence All Non-executive Directors satisfy our criteria for independence, which aligns with the guidance provided in the ASXCGC Recommendations. The Board assesses the independence of our Non-executive Directors on appointment and annually. Each Non-executive Director provides an annual attestation of their interests and independence. Directors are considered to be independent if they are independent of management and free from any business or other relationship that could materially interfere with, or could reasonably be perceived to materially interfere with: • the exercise of their unfettered and independent judgement; and • their ability to act in the best interests of Westpac as a whole rather than the interests of another party. Materiality is assessed on a case-by-case basis by reference to each Non-executive Director’s individual circumstances rather than by applying general materiality thresholds. Each Non-executive Director is required to disclose any business or other relationship that they have directly, or as a partner, shareholder or officer of a company or other entity that has an interest or a business or other relationship with Westpac or a Group entity. The Board considers information about any such interests or relationships, including any related financial or other details, when it assesses the Non-executive Director’s independence. APPOINTMENT OF DIRECTORS The Board Nominations & Governance Committee considers and makes recommendations to the Board on candidates for appointment as Directors. Such recommendations pay particular attention to: • the mix of skills, experience, expertise, diversity, independence, and other qualities of existing Directors; and • how the candidate’s attributes will balance and complement those skills and qualities, and address any potential skills gaps in relation to the current and future composition of the Board. Subject to the Constitution and ASX Listing Rules, the Board may appoint a Director, either to fill a casual vacancy or as an addition to the existing Directors. Except for the CEO, a Director appointed by the Board holds office only until the close of the next annual general meeting (AGM) but is eligible for election by shareholders at that meeting. Our Constitution states that a Director (except for the CEO) must not hold office (without re-election) past the third AGM following their appointment or last election, or for more than three years, whichever is longer. Retiring Directors hold office until the conclusion of the meeting at which they retire but are eligible for re-election at that meeting. Our Constitution also provides that at least one Director must stand for election or re-election at each AGM. This requirement could be satisfied by a person standing for election as a new Director; a Director who has been appointed to fill a casual vacancy seeking election; or a Director seeking re-election because of the tenure limitation (referred to in the paragraph above). If there are no such Directors required to stand for election or re-election at the AGM, and no Director volunteers to stand for re-election, the Director who has served the longest in office since their last election or re-election must retire and stand for re-election. The CEO is not required to stand for re-election. Prior to a Director’s appointment or consideration for election or re-election by shareholders, the Board conducts due diligence and considers the results of the Board performance evaluation conducted during the year. Where a Director is seeking election or re-election, Westpac provides shareholders with all material information relevant to a decision on whether or not to elect or re-elect a Director. New Directors receive an induction pack and letter of appointment setting out the expectations of the role, and conditions of appointment including the expected term of appointment and remuneration. This letter aligns to the ASXCGC Recommendations. All new Directors participate in an induction program to familiarise themselves with our business and strategy, culture, commitments and 1. The Westpac Director Appointment & Renewal Policy outlines considerations for the appointment of candidates, including gender diversity for the appointment of Non-executive Directors to the Westpac Board. The Managing Director and CEO is appointed to the Westpac Board due to their executive position. |
| 194 WESTPAC GROUP 2025 ANNUAL REPORT CORPORATE GOVERNANCE behaviours and any current issues before the Board/ Board Committees. The induction program includes an opportunity to review key documents and meet with a range of representatives from the organisation, including the Chairman, the CEO, the Board Committee Chairs and each Group Executive. The Westpac Director Appointment & Renewal Policy limits the tenure of office that any Non-executive Directors other than the Chairman may serve to 9 years, from the date of first election by shareholders. The maximum tenure for the Chairman is 12 years (which includes any term served as a Director prior to being elected as Chairman), from the date of first election by shareholders. The Board, on an exceptional basis, may extend the maximum terms specified above where it considers the extension would benefit the Group. The Board may exercise this discretion on an annual basis, and the Director concerned will be required to stand for re-election annually. The average Board tenure as at 30 September 2025 is set out below. The length of service of each Director is set out in the Directors’ report in our 2025 Annual Report. Conflicts of interest All Directors are required to disclose to the Board any actual, potential or apparent conflicts of interest upon appointment and are required to keep these disclosures up to date. Any Director with a material personal interest in a matter being considered by the Board must declare their interest and may not be present during any related boardroom discussions nor vote on the matter unless the Board resolves otherwise. Continuing education Directors undertake continuing education and training to develop and maintain the skills and knowledge needed to perform their role effectively, including by participating in workshops held throughout the year, attending relevant site visits, and undertaking relevant external education. These activities are planned each year and are included in the Board’s/Board Committees’ calendars. In addition, the Board and Board Committees consider whether additional education and professional development opportunities should be offered as part of the annual Board Effectiveness Review. Access to information All Directors have unrestricted access to company records and information required to perform their duties, and receive regular detailed financial and operational reports from senior management. Each Director also enters into an access and indemnity agreement, which among other things, provides for access to documents for up to seven years after their retirement as a Director. The Chairman and other Non-executive Directors regularly consult with the CEO, CFO and other senior executives, and may consult with, and request additional information from, any of our employees. Access to advice All Directors have access to advice from senior internal legal advisers including the Group General Counsel. The Board collectively, and all Directors individually, can also seek independent professional advice, at Westpac's expense, to help them carry out their responsibilities. While the Chairman’s prior approval is needed, it may not be unreasonably withheld. Remuneration framework Information about our remuneration framework, including policies and practices regarding the remuneration of Non-executive Directors, the CEO and other senior executives, is included in the Remuneration Report in the Directors’ report (which is located in our 2025 Annual Report). Westpac does not provide performance-based remuneration or retirement benefits (other than superannuation) to Non-executive Directors. The Remuneration Report also includes details of Westpac’s hedging policy, which prohibits participants in equity plans from entering into transactions that mitigate the risk associated with the equity award. |
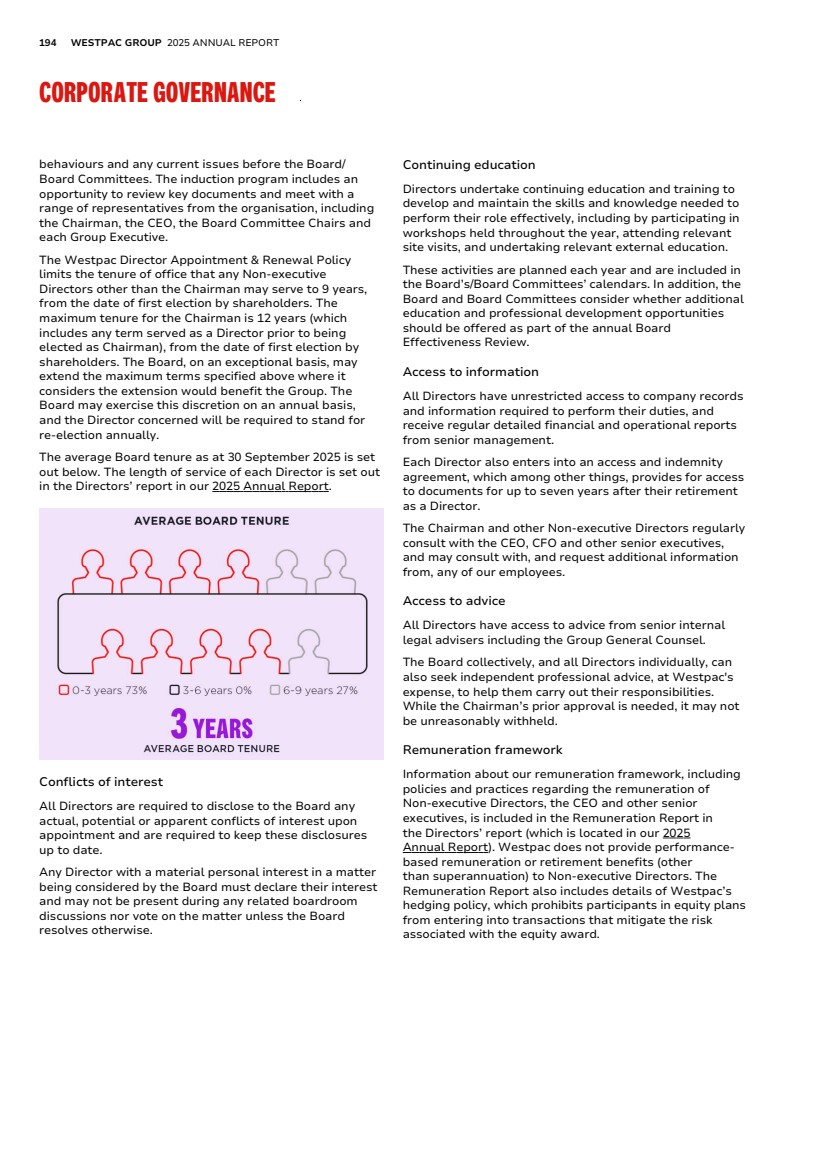
| FINANCIAL REPORT EXHIBITS INDEX STRATEGIC REVIEW PERFORMANCE REVIEW EXHIBIT 15.4 ADDITIONAL INFORMATION 195 PERFORMANCE REVIEWS Board, Board Committees and Directors The Board undertakes ongoing self-assessment as well as an annual performance review, which is periodically conducted by an independent consultant. The review process includes an assessment of the performance of the Board, the Board Committees and each Director, with outputs collected, analysed and presented to the Board. The Board will discuss the results and agree follow-up actions. Directors meet individually with the Chairman to discuss performance feedback (and in the case of the Chairman, performance is discussed with another Board Committee Chair). At the time of this Corporate Governance Statement, the 2025 financial year evaluation has been completed, the Board discussed the results and agreed follow up action on matters relating to Board composition, process, priorities and continuing education. Board assessment of management performance The Board, in conjunction with its Board Remuneration Committee, is responsible for: • selecting, appointing, and determining terms of appointment of, the CEO and the CFO; • determining the CEO’s goals and objectives, and evaluating the CEO’s performance in light of these objectives; • approving the appointment of Group Executives, the Chief Audit Officer, and any other person the Board determines; and • approving individual remuneration arrangements, and adjustments to variable remuneration where appropriate for Group Executives and certain other senior employees, including in light of relevant matters brought to the attention of the Board Remuneration Committee from the CEO, Chief Risk Officer, Chief People Officer, Chief Audit Officer, and Chairs of the Board Risk Committee and Board Audit Committee. All new senior executives receive an employment contract setting out the terms and conditions of their employment, and those that are Accountable Persons also receive an Accountability Statement for their respective role. Briefing sessions are scheduled to discuss our strategies and operations, and the respective roles and responsibilities of the Board and senior management. Under Westpac’s executive remuneration framework, the performance of senior executives is assessed annually. Management performance evaluations for the financial year ended 30 September 2025 were conducted following the end of the financial year. The process for reviewing the performance of senior executives, as well as further information on Westpac’s executive remuneration framework, FY25 performance objectives and performance achieved, is contained in the Remuneration Report in the Directors’ report (which is located in our 2025 Annual Report). |
| 196 WESTPAC GROUP 2025 ANNUAL REPORT CORPORATE GOVERNANCE ROLE OF THE BOARD COMMITTEES The Board is assisted by its four standing Board Committees and the key roles, responsibilities, and composition requirements of each of the Board Committees are outlined in their respective Charter summarised in the table below. The Board Committee Charters are available on our website at www.westpac.com.au/about-westpac/westpac-group/ corporate-governance/constitution-board/. All of the Board Committees are required to: • have at least three independent Non-executive Directors; • comprise a majority of independent Directors; and • with the exception of the Board Nominations & Governance Committee1 , have an independent Non-executive Director as the Committee Chair, who is not the Board Chair. In addition, the Board Risk Committee must have at least one member of the Board Audit Committee and Board Remuneration Committee as members. At present all of the Board Committees are comprised of Non-executive Directors. Board Committee members are chosen for the skills and experience they can contribute to the respective Board Committees and their qualifications are set out in the Directors’ report, in our 2025 Annual Report. COMMITTEE KEY RESPONSIBILITIES Board Risk Committee (BRiskC) • Michael Ullmer (Chairman) • Tim Burroughs • Nerida Caesar • David Cohen • Peter Nash To assist the Board by: • providing oversight of the implementation and operation of the Group's risk management framework; • forming a view of the risk culture within the Group; • reviewing and recommending for approval the Risk Management Strategy, and the Board Risk Appetite Statement; • reviewing and approving individual risk management frameworks and policies and reviewing the monitoring of performance under those frameworks and policies (as appropriate); • reviewing and approving limits and conditions that apply to delegated credit risk and market risk approval authorities; • reviewing and recommending for approval the Internal Capital Adequacy Assessment Process, including target capital ranges, and reviewing and monitoring capital levels for consistency with the Board Risk Appetite Statement; • reviewing stress testing results, and with the Board, providing feedback on future scenarios; • reviewing and recommending Westpac's Recovery and Exit Plan and Westpac's Group-wide resolvability assessments and pre-positioning plans to the Board for approval; • reviewing and assisting the Board to form a view on the sufficiency of recovery capacity to restore financial resilience in periods of stress and oversee the execution of any recovery and exit actions; • reviewing Group cyber risk and cybersecurity reporting, including oversight of the Group’s cyber risk management and controls; • providing oversight of risks associated with the Group’s approach to customer remediation activities, management of customer complaints and hardship; • providing oversight of the Group’s management of other financial and non-financial risks including financial crime risk, reputation and sustainability risks including climate risk; and • monitoring changes anticipated for the economic, geopolitical and business environment, including considering emerging risks. 1. The Board Chair is the Chair of the Board Nominations & Governance Committee. |
| FINANCIAL REPORT EXHIBITS INDEX STRATEGIC REVIEW PERFORMANCE REVIEW EXHIBIT 15.4 ADDITIONAL INFORMATION 197 COMMITTEE KEY RESPONSIBILITIES Board Audit Committee (BAC) • Peter Nash (Chairman) • Nerida Caesar • Michael Ullmer To assist the Board by: • overseeing the integrity of financial statements and financial reporting systems of Westpac and its related bodies corporate; • maintaining oversight of the external audit engagement, and overseeing the external auditor’s qualifications, performance, independence and fees; • overseeing the performance of the internal audit function; • overseeing the integrity of the Group’s corporate reporting including the Group‘s financial and sustainability reporting, and compliance with prudential regulatory reporting and professional accounting requirements; • reviewing and discussing with management and the external auditor the half and full year financial statements, Annual Report disclosures, and the Sustainability Report and recommending their approval to the Board; and • reviewing and discussing the process by which management assures the integrity of information on earnings and key sustainability metrics. Board Remuneration Committee (BRemC) • Margaret Seale (Chair) • Tim Burroughs • Debra Hazelton • Andy Maguire To assist the Board by reviewing and making recommendations in relation to: • the Group’s remuneration framework (as articulated in the Group Remuneration Policy), as well as assessing its compliance with laws, regulations and prudential standards; • individual remuneration arrangements and variable remuneration outcomes for the CEO, Group Executives, other Accountable Persons, and any other person the Board determines; • the remuneration framework, policies, and fee levels (including superannuation) for Non-executive Directors on the Board and subsidiary Boards; • remuneration arrangements on a cohort basis (including variable remuneration outcomes) for certain employees; and • in conjunction with the Board Chair, review and make recommendations on the performance of the CEO, including their goals and objectives as assessed against the Group Performance Review. Board Nominations & Governance Committee (BNGC) • Steven Gregg (Chairman) • Peter Nash • Margaret Seale To assist the Board, including by: • recommending candidates for appointment as Non-executive Directors to the Board and the Boards of significant subsidiaries; • reviewing the process for the induction and continuing education of Directors; • considering succession planning for Non-executive Directors; • assessing the overall skills, experience, expertise and diversity of the Board; • reviewing annually diversity generally within the Group, including approving measurable objectives for achieving diversity and the Group’s progress in achieving such objectives; • reviewing annually the time required to be committed to Westpac business by Non-executive Directors on the Board; and • reviewing and, where required, approving the Group’s corporate governance policies. Information about Board Committee composition changes in FY25 can be found in the Directors' meetings section of the Directors’ report, in our 2025 Annual Report. From time to time, the Board may form other Committees or request Directors to undertake specific extra duties. In addition, the Board may participate (either directly or through representatives) in due diligence committees in relation to strategic decisions and capital and funding activities. For example, in FY24 the Directors UNITE Oversight Group was established to provide oversight of the ongoing UNITE program. Each Board Committee: • will refer to the Board or other Board Committee any matter that comes to their attention that is relevant for the Board or respective Board Committee; and • is entitled to the resources and information it requires and has direct access to our employees and advisers. |
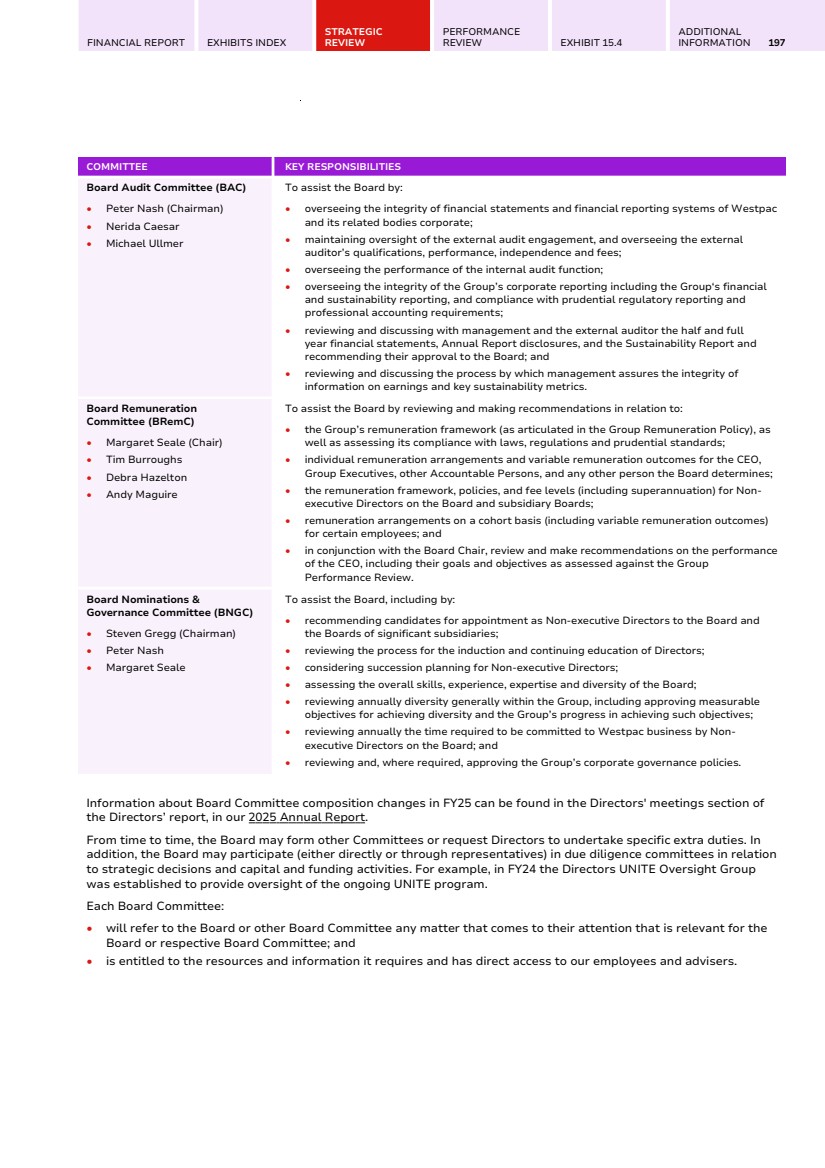
| 198 WESTPAC GROUP 2025 ANNUAL REPORT CORPORATE GOVERNANCE Board and Board Committee meetings The number of meetings of the Board and Board Committees for the financial year ended 30 September 2025, and each Director’s attendance is reported in the Directors' meetings section of the Directors’ report, in our 2025 Annual Report. Scheduled meetings of the Board Committees occur at least quarterly, with the Board Risk Committee meeting at least five times annually. All Board Committees can meet more frequently as necessary. Non-executive Directors regularly meet without management present, so they can discuss issues appropriate to such a forum. Senior executives and other selected employees are invited, where considered appropriate, to participate in Board and Board Committee meetings. They are also available to be contacted by Directors between meetings. All Directors can receive all Board Committee papers and can attend any Board Committee meeting, provided there is no conflict of interest. The CEO attends all Board Committee meetings, except where they have a material personal interest in a matter being considered. Board Audit Committee financial knowledge All Board Audit Committee members have appropriate financial experience, an understanding of the financial services industry and satisfy the independence requirements under the ASXCGC Recommendations, Securities Exchange Act of 1934 (US) (as amended) and its related rules. The Board has determined that Mr Nash is an ‘audit committee financial expert’ and independent in accordance with US securities law. The designation of Mr Nash as an audit committee financial expert does not impose duties, obligations or liability on him that are greater than those imposed on him as a Board Audit Committee member, and does not affect the duties, obligations or liability of any other Board Audit Committee member or Board member. Audit committee financial experts are not deemed as an ‘expert’ for any other purpose. Meeting with Regulators The Directors met with representatives from the Australian Securities and Investments Commission (ASIC), APRA, Australian Financial Complaints Authority (AFCA), and Australian Transaction Reports and Analysis Centre (AUSTRAC) during the course of the year. Role of the Company Secretary Westpac’s Company Secretary attends Board and Board Committee meetings and is responsible for the operation of the Secretariat function, including advising the Board on governance and, in conjunction with management, giving practical effect to the Board’s decisions. The Company Secretary is accountable to the Board, through the Chairman, on all matters to do with the proper functioning of the Board. A profile for the Company Secretary can be found in the Directors’ report, in our 2025 Annual Report. |
| FINANCIAL REPORT EXHIBITS INDEX STRATEGIC REVIEW PERFORMANCE REVIEW EXHIBIT 15.4 ADDITIONAL INFORMATION 199 DIVERSITY At Westpac we’re focused on building a workplace that fosters a diverse and inclusive workforce where our people feel valued, respected and safe. We seek to embrace everything that makes people unique in their identity like age, cultural background, disability, ethnicity, sex, gender identity, marital or family status, religious belief, sexual orientation or socio-economic background. Our Diversity, Equity & Inclusion Strategy and Policy aims to put people at the heart of everything we do and sets out our objective to encourage a more inclusive workplace for our people to support our customers. We are focused on hiring, developing and retaining diverse talent in a culture that embraces and celebrates differences, and allows people to feel safe at work. Our Diversity, Equity, and Inclusion priorities Our Executive Team oversees the Group-wide Diversity, Equity, and Inclusion Strategy and Policy and reviews progress at least annually. We are committed to creating an inclusive environment for all employees by focusing on: • growing leaders who reflect the diversity of our customers and workforce and providing fair and equitable access to career and development opportunities; • incorporating diversity, equity and inclusion considerations into decision-making processes to create accountability for our Diversity, Equity and Inclusion commitments throughout the organisation; and • fostering a safe workplace where inclusive leadership behaviours are consistently demonstrated. Making Inclusion happen We expect all employees to foster a culture which values diversity and includes everybody. The Board Nominations & Governance Committee annually reviews diversity within the Group, including approving diversity and inclusion objectives and overseeing progress in achieving these objectives. Westpac is a signatory to the 40:40 Vision, and the Board Nominations & Governance Committee confirmed the Group’s measurable objectives (which were in place for this reporting period) for achieving gender diversity in the composition of the Board, Executive Team, General Managers, and workforce generally as follows: • achieve 40:40:20 on the Westpac Board; • achieve 40:40:20 in our Executive Team1 ; • achieve 40% (+/- 2%) women in our General Manager population; • achieve 50% (+/- 2%) women in our Senior Leadership2 ; and • maintain at least 50% women in our workforce generally. More information is set out in the table below. % FEMALES SEP-24 SEP-25 TARGET TARGET MET Westpac Board 40 36 40:40:20a Not met Executive Team 50 50 40:40:20a Met General Managers 40 37 40 +/- 2% Not met Senior Leadership 49 49 50 +/- 2% Met Westpac workforce 54 54 50 Met a. 40% women, 40% men and 20% of any gender 1. Includes the full Executive Team other than the CEO. 2. Senior Leadership refers to the proportion of women (permanent and maximum term) in senior leadership roles across the Group. It includes the Executive Team, General Managers, and direct reports to General Managers, excluding administrative or support roles. |
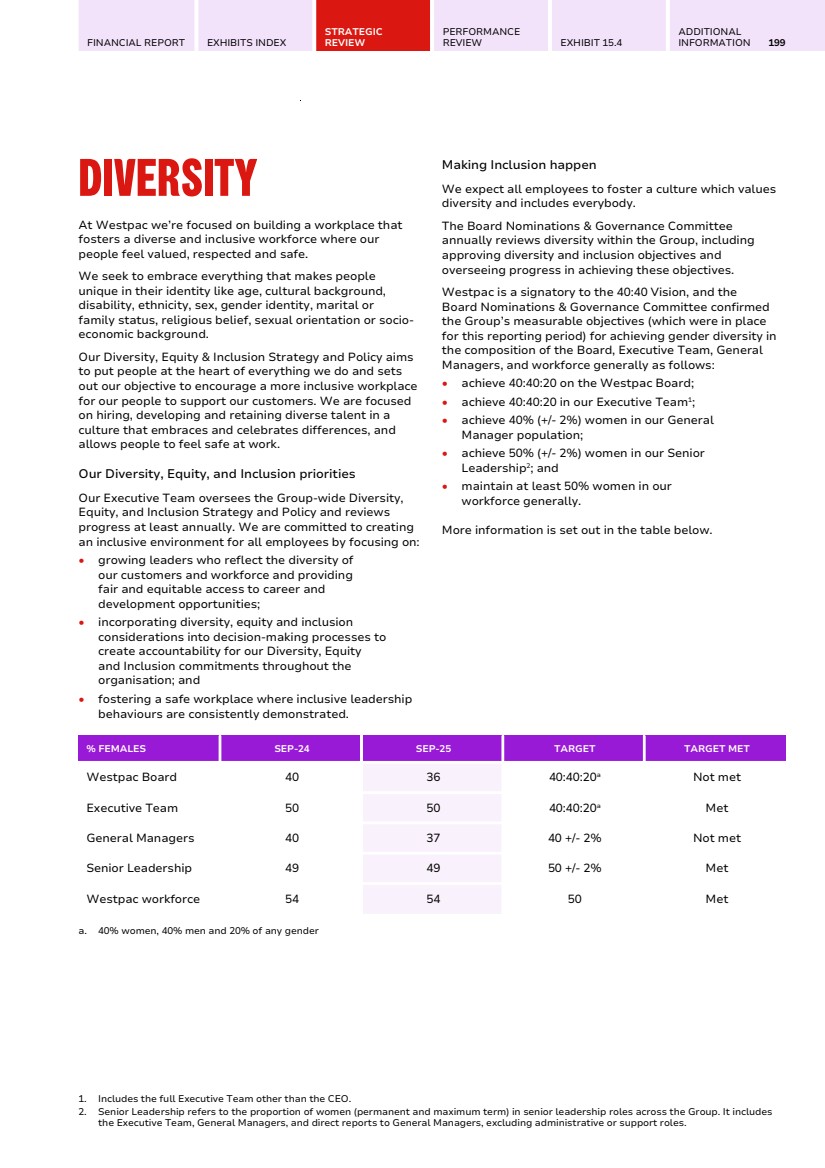
| 200 WESTPAC GROUP 2025 ANNUAL REPORT CORPORATE GOVERNANCE The Board approved a change to measurable objectives for gender diversity from FY26 to enhance our focus on achieving gender diversity throughout the organisation. Our aim is to achieve gender diversity of 40:40:20 at all role levels by FY30, with 40% women, 40% men and 20% of any gender. This new objective allows us to be inclusive of all gender identities and applied at all levels is key to improving our gender pay gap. We are committed to achieving pay equity. We undertake like-for-like and by-level analysis to identify potential gender-based pay equity issues and take action when needed. As part of our commitment to foster a diverse and inclusive place to work, we do not tolerate discrimination, bullying or harassment, including sexual harassment. Our Discrimination, Harassment, Bullying, and Related Conduct and Sexual Harassment policies are available at the following link www.westpac.com.au/ about-westpac/inclusion-and-diversity/. Our ‘Upstander’ initiative aims to grow employee confidence and capability to speak up and take action against behaviours and activities that negatively impact others. We have made progress against our commitments in our fifth Reconciliation Action Plan. Aboriginal and Torres Strait Islander workforce representation rose to 1.15%, though retention challenges have slowed progress towards our 1.5% target. We have implemented measures to support our Indigenous employees, including our Echo leadership and mentoring programs that are designed to support emerging leaders by building leadership capability and career progression. We have also appointed a First Nations Engagement Manager to further develop and implement retention and development strategies for Indigenous employees. We provide mandatory online Indigenous cultural learning to our employees, with an enhanced learning option also available. Our next Reconciliation Action Plan will launch in FY26. Our ten Employee Advocacy Groups help us strengthen an inclusive culture by building trusted communities that celebrate and advocate for gender, LGBTQIA+, young and mature-age employees, cultural diversity in leadership, accessibility, Indigenous employees, veterans, skilled volunteering and supporting victims of domestic and family violence. Westpac offers workplace flexibility and provides employees with a variety of leave options such as parental leave (including support for those who experience pregnancy loss), leave to undergo fertility treatment or arrange adoption of foster care, carers’ leave, culture, wellbeing and lifestyle leave, career breaks, purchased leave, uncapped domestic and family violence support leave, gender affirmation leave, Sorry Business and Sad News leave, volunteer leave, defence reserves and emergency services leave. Further information on our inclusion and diversity programs and performance, as well as a copy of our Diversity, Equity & Inclusion Policy and Westpac’s Workplace Gender Equality Agency (WGEA) report, can be found on our website at www.westpac.com.au/about-westpac/inclusion-and-diversity/. |
| FINANCIAL REPORT EXHIBITS INDEX STRATEGIC REVIEW PERFORMANCE REVIEW EXHIBIT 15.4 ADDITIONAL INFORMATION 201 ETHICAL DECISION MAKING Ethical and responsible decision making is critical to decision-making at Westpac. Our Purpose, Commitments and Behaviours, together with our Code of Conduct and related policies and frameworks, are focused on instilling and reinforcing an ethical and responsible decision-making culture across the Group. What we stand for Westpac’s Purpose is: Taking action now to create a better future. In working to fulfil our Purpose, we are guided by our Commitments and Behaviours. Together, our Purpose, Commitments and Behaviours define what we stand for. They set the direction for our culture by being practical, and actionable, providing clarity about what is valued most and what our people need to do. Our Commitments are the promises we make to each other, our customers, our communities, and stakeholders. Underpinning our three Commitments are our Behaviours which describe how we show up to deliver on those promises clearly, consistently, and with impact. They address important themes such as speaking up, ownership, collaboration and empowerment. We embed our Purpose, Commitments and Behaviours through employee and leadership initiatives and align them with the systems, processes and policies that clarify what we expect from each other, and how we work together, every day. Code of Conduct The Westpac Code of Conduct (Code) sets out a consistent standard and establishes the expectations of our people to do what is right. The Code goes beyond an obligation to comply with laws and policies and is a key aspect of improving conduct to seek to ensure fair outcomes for customers, communities and each other. The Code requires us to apply the ‘Should We?’ Test when making decisions and encourages our people to speak up when our standards are not being met. We take non-compliance with the Code seriously. Material breaches of the Code are reported to the Board Risk Committee. Supporting the Code are numerous frameworks and policies outlining our commitment to sustainable business practices and behaviours. These include our Purpose, Commitments and Behaviours, policies and position statements addressing sustainability themes such as human rights, climate change and other environmental and social impacts. The Code is available on our website at www.westpac.com.au/about-westpac/westpac-group/ corporate-governance/principles-policies/. OUR PURPOSE TAKING ACTION NOW TO CREATE A BETTER FUTURE OUR COMMITMENTS ALWAYS DELIVER, SAFELY MAKE AN IMPACT OWN IT We love to tackle the tough stuff. We're tenacious and committed to finding solutions for customers that keep them safe and manage our risk. We aim to make a real, sustainable difference. We create authentic and lasting value for our customers and the communities we serve. We take accountability and do what we say we will. We're focused on what our customers need from us and we won't give up until we've delivered for them. OUR BEHAVIOURS ASK 'SHOULD WE?' Take thoughtful risks we understand and can manage STOP BUSY WORK Deliver great results for our customers, focusing on outcomes not just tasks DON'T PASS THE BUCK Lean in and collaborate with others to solve problems CUT THROUGH COMPLEXITY Clear obstacles that are in the way of progress BE CURIOUS Seek feedback and data to continuously adapt, innovate, and grow SPEAK UP Speak up if something doesn't feel right IDENTIFY, FIX, SHARE Identify and own mistakes, fix them properly, and share what you learned RESPECTFULLY CHALLENGE IF YOU DISAGREE Value diverse views to find new paths forward TAKE THE LEAD Reimagine what's broken and improve what isn't THE OUTCOMES WE EXPECT |

| 202 WESTPAC GROUP 2025 ANNUAL REPORT CORPORATE GOVERNANCE KEY POLICIES We have a number of key policies that seek to manage our regulatory compliance and human resource requirements. We are also subject to a range of external industry codes, such as the Banking Code of Practice and the ePayments Code. Code of Ethics for Senior Finance Officers Our Code of Accounting Practice and Financial Reporting (COAPFR) complements our Code of Conduct. It is designed to assist our CEO, CFO and other principal financial officers to apply the highest ethical standards to their duties and responsibilities with respect to accounting and financial reporting. The COAPFR requires those officers to: • act honestly and ethically, including in the handling of actual or apparent conflicts of interest between personal and professional relationships; • provide full, fair, accurate, timely and understandable disclosure in reporting and other communications; • comply with applicable laws, rules and regulations; • promptly report violations of the COAPFR; and • be accountable for adherence to the COAPFR. The COAPFR is available on our website at www.westpac.com.au/about-westpac/westpac-group/ corporate- governance/principles-policies/. Delegated authority The Delegated Authority Policy outlines key principles (and forms part of a framework) governing decision-making within the Westpac Group, including channels of escalation and reporting to the Board. The scope of, and limitations to, authority delegated by the Board to the CEO and through the CEO to other Group Executives, is articulated in delegation instruments and covers areas such as expenditure, funding and securitisation, and lending. These delegations help provide clarity on roles, authorities and responsibilities within the Group, and act as an internal tool of empowerment, control and risk management. Any matters or transactions outside the delegations of authority given to management are required to be referred to the Board or relevant Board Committee for approval. Securities trading Westpac’s Group Securities Trading Policy prohibits Directors, employees, secondees and contractors from trading in any securities and other financial products that they possess inside information on. Additionally, individuals are strictly prohibited from disclosing inside information to others who may use it to trade, or from encouraging or procuring others to trade on such information. The policy requirements also extend to associate accounts. In addition, Directors and any employees, secondees or contractors who, by virtue of their seniority or role, may have access to material non-public information about Westpac (known as Key Prescribed Employees and/or Prescribed Employees) are subject to additional trading restrictions. These include blackout periods, prohibiting trading prior to and immediately after release of the annual and half year results. These additional restrictions also apply to their associates. The Westpac Group Securities Trading Policy is available in the Corporate Governance section of our website at www.westpac.com.au/about-westpac/westpac-group/corporate-governance/principles-policies/. Concern reporting and whistleblower protection The Westpac Group Speaking Up Policy encourages all eligible persons to raise any concerns about our activities or behaviours that may be unlawful or unethical. Our senior management are committed to supporting those who speak up. Westpac does not tolerate detrimental conduct related to a Speaking Up report. A person can raise a concern using our whistleblowing channels, including our reporting system ‘Concern Online’ and our Whistleblower Hotline. Both channels enable anonymous reporting. Westpac’s Whistleblower Protection Officers are responsible for providing protections to whistleblowers who are concerned about potentially experiencing detrimental conduct because of speaking up. They also engage directly with whistleblowers to address risks of reprisal. Whistleblowers may raise a concern directly with a Whistleblower Protection Officer. The Westpac Group Speaking Up Policy requires that we investigate concerns in a confidential, fair and objective manner. If the investigation shows that wrongdoing occurred, we are committed to taking action, such as changing our processes and imposing consequences on those involved in wrongdoing. Outcomes may also involve reporting the matter to relevant authorities and regulators. The Board Audit Committee, in conjunction with the Board Risk Committee, oversees Westpac’s Whistleblower Program. Material whistleblower matters raised under the Westpac Group Speaking Up Policy are reported to the Board Risk Committee and may be escalated to the Board Audit Committee as appropriate. The Board Risk Committee also receives regular reporting on whistleblowing, including key metrics, measures and themes that provide insights into the performance of the Whistleblower Program. The Westpac Group Speaking Up Policy is available on our website at www.westpac.com.au/about-westpac/westpac-group/corporate-governance/principles-policies/. Anti-Bribery and Corruption The Westpac Group has an Anti-Bribery and Corruption (ABC) Policy and related bribery and corruption prevention standards, procedures and systems. Material breaches of the ABC Policy are reported to the Board Risk Committee. The ABC Policy is available on our website at www.westpac.com.au/ about-westpac/westpac-group/corporate-governance/ anti-bribery-corruption-policy-procedures/. |
| FINANCIAL REPORT EXHIBITS INDEX STRATEGIC REVIEW PERFORMANCE REVIEW EXHIBIT 15.4 ADDITIONAL INFORMATION 203 Westpac has no tolerance for any form of bribery or corruption. This includes a ban on facilitation payments and offering or soliciting secret commissions. Westpac is committed to preventing, detecting and deterring bribery and corruption by managing its bribery and corruption risk and complying with relevant ABC legislation in all jurisdictions in which it operates or has dealings. This includes the Australian Criminal Code Act 1995 (Cth), the Bribery Act 2010 (UK) and the Foreign Corrupt Practices Act 1977 (US). Under the ABC Policy, Westpac expects that its officers, Directors, employees, agents, contractors, service providers, subsidiaries and third parties acting for or on behalf of Westpac will comply with all applicable ABC laws and will not offer, provide, authorise, request or receive a bribe or anything which may be viewed as a bribe. Fit and Proper Person assessments Westpac’s Board-approved Group Fit and Proper Policy (F&P Policy) outlines how we assess the fitness and propriety of our Directors, Accountable Persons, and other individuals in key positions of responsibility. The F&P Policy supports Westpac in complying with APRA Prudential Standards CPS 520 and SPS 520, the Banking Act 1959 (Cth), Financial Accountability Regime Act 2023 (Cth), Superannuation Industry (Supervision) Act 1993 (Cth), relevant ASIC licensing requirements (Australian Financial Services Licence and Australian Credit Licence) and equivalent offshore regulations as applicable. The Chairman of the Board is responsible for assessing the fitness and propriety of our CEO and Non-executive Directors. The Board (as a collective) is responsible for assessing the fitness and propriety of the Chairman. A Fit and Proper Committee is responsible under delegated authority from the Board for undertaking a fit and proper assessment of all other individuals in key positions of responsibility. In all cases, a fit and proper assessment will be undertaken prior to their initial appointment and they will be re-assessed annually. This involves the relevant individual providing a declaration and background checks (including police and bankruptcy checks) being undertaken as appropriate. Conflicts of interest Westpac’s conflicts of interest framework is designed to identify and manage actual, potential and perceived conflicts of interest. The conflicts of interest framework includes the Group Conflicts of Interest Policy, along with supporting policies, standards and procedures. Under our conflicts of interest framework, any person who acts on behalf of the Westpac Group must: • promptly identify, declare, assess, manage and record conflicts of interest appropriately; • discharge their duties concerning conflicts of interest with integrity, fairness, honesty and due skill, care and diligence; • avoid a conflict of interest where it cannot be effectively managed; and • not solicit, accept or offer money, gifts, favours or entertainment that might influence, or might be seen to influence, their professional judgement. Modern Slavery Under the Australian Modern Slavery Act 2018 (Cth) and Modern Slavery Act 2015 (UK), Westpac is required to prepare an annual statement describing the risks of modern slavery across our operations and supply chain, and the actions taken to address the risks. Westpac published a joint statement for FY24 on behalf of itself and certain reporting entities within the Group that addresses the requirements of both Acts. The Westpac Group’s 2024 Modern Slavery Statement was published in March 2025 and can be located at www. westpac.com.au/ content/dam/public/wbc/documents/pdf/aw/sustainability/ wbc-2024-modern-slavery- statement.pdf. Customer Advocate Westpac’s Customer Advocate provides advice and guidance to our complaints team regarding complaints raised by customers in relation to personal banking and small business matters. In addition, the Customer Advocate recommends changes to policies, procedures and processes, arising from the complaints made by customers, and in particular focuses on how we can best support our vulnerable customers. |
| 204 WESTPAC GROUP 2025 ANNUAL REPORT CORPORATE GOVERNANCE SUSTAINABILITY We view sustainable and responsible business practices as important for our business and our stakeholders. Sustainability is about managing environmental and social risks and opportunities across our business in a way that seeks to balance the needs of our stakeholders – our customers, employees, suppliers, investors and the communities in which we operate. We aim to address the matters we believe are the most material for our business and our stakeholders, now and in the future. Environmental and social risks and opportunities continue to evolve so we seek to monitor these developments while aiming to embed sustainability into our business practices. We participate in a number of voluntary initiatives including the Global Reporting Initiative (GRI), the UN Global Compact and the International Sustainability Standards Board (ISSB) standards. We report on the most material sustainability topics, identified in our annual materiality assessment and aligned with the GRI standards, in our Annual Report and on our website. We are also focused on aligning our reporting with the new Australian Accounting Standards Board requirements for climate-related disclosure (AASB S2), which become mandatory for Westpac from our FY26 reporting year, as well as the Aotearoa New Zealand Climate Standards that have applied to our New Zealand operations since FY24. Sustainability governance and risk management disclosures are included in our Annual Report and our Sustainability Report, which are available on our website at www.westpac.com.au/about-westpac/investor-centre/annual-report/. Material exposure to sustainability risks and other categories of risks Westpac is exposed to environmental and social risks such as climate change risk. We seek to manage our material exposures to these risks, as well as other material risks we face, in accordance with our risk management strategy and frameworks. Further details about the risks we face, and how we seek to manage them, are in our 2025 Annual Report (see sections on 'Creating Value for the Community', 'Creating Value for the Environment' and 'Risk Management') and our 2025 Risk Factors. In addition, our Sustainability Report, our Human Rights Position Statement and Action Plan, and our Modern Slavery Statement are available on our website at www.westpac.com.au/about-westpac/sustainability/. RISK MANAGEMENT Westpac’s risk management framework comprises systems, structures, policies, processes and people that identify, measure, evaluate, monitor, report and control or mitigate sources of material risks. The Risk Management Strategy outlines this framework, Westpac’s material risks, and how they are managed. The Board, with the Board Risk Committee’s assistance, reviews the Risk Management Strategy and Board Risk Appetite Statement annually to satisfy itself that the risk management framework continues to be sound and that Westpac is operating within the risk appetite set by the Board. These reviews were conducted in the 2025 financial year. The Strategic review in the 2025 Annual Report provides more details on the risk management framework, including its structure based on the Three Lines of Defence model; management and the Board Risk Committee; actions taken to enhance risk management during the year; and emerging risks for Westpac. Risk Culture Westpac considers that a strong risk culture is essential for the Group’s risk management framework to operate effectively. Building and maintaining a strong risk culture is a continuing focus of the Board and will help support our ambition to be our customers' number one bank and partner through life. Westpac has embedded processes and tools to continue to improve risk culture, and track progress towards our goal of a risk culture that proactively identifies, manages and mitigates risks, learns from risk events and continuously anticipates new risks and opportunities. An ongoing Group-wide learning program provides an opportunity for employees to spend time on the specifics of risk management. Further information about this work is available in the Strategic review in our 2025 Annual Report. Three Lines of Defence (3LOD) We have adopted and continue to embed a 3LOD model which is designed to enable all our people to understand their own role and responsibilities in the active management of risk. Further information on the 3LOD model is available in the Strategic review section in our 2025 Annual Report. |
| FINANCIAL REPORT EXHIBITS INDEX STRATEGIC REVIEW PERFORMANCE REVIEW EXHIBIT 15.4 ADDITIONAL INFORMATION 205 FINANCIAL REPORTING AND AUDIT Approach to financial reporting Our approach to financial reporting reflects three core principles: • that our financial reports present a true and fair view of our financial position and performance; • that our accounting methods comply with applicable accounting standards and policies; and • that our external auditor is independent and serves security holders’ interests. The Board, through the Board Audit Committee, has regard to Australian and international developments relevant to these principles when reviewing our practices. The Board delegates oversight responsibility for the integrity of financial statements and financial reporting systems to the Board Audit Committee. The Board Risk Committee provides relevant periodic assurances and reports (as appropriate) to the Board Audit Committee. Similarly, the Board delegates oversight responsibility for the preparation of remuneration reports and disclosures to the Board Remuneration Committee, which recommends remuneration reports and related disclosures, and provides relevant assurances, through the Board Audit Committee to the Board for approval. CEO and CFO assurance The Board receives regular reports from management about our financial condition and operational results. Before the Board approves the half year and full year financial statements, the CEO and the CFO declare to the Board that in all material respects: • Westpac’s financial records: – correctly record and explain its transactions, and financial position and performance; – enable true and fair financial statements to be prepared and audited; and – are retained for seven years after the transactions covered by the records are completed; • the financial statements and notes comply with applicable accounting standards; • the financial statements and notes give a true and fair view of Westpac’s financial position and performance; • (in relation to full year financial statements), the consolidated entity disclosure statement is true and correct; • any other matters that are prescribed by the Corporations Act 2001 (Cth) and regulations as they relate to the financial statements and notes are satisfied; and • the declarations above have been formed on the basis of a sound system of risk management and internal control, and that the system is operating effectively in all material respects in relation to financial reporting risks. The CEO and CFO have provided such statements for the financial year ended 30 September 2025. External auditor Our external auditor (for the 2025 financial year) is KPMG, appointed by shareholders at the 2024 AGM. Our KPMG lead audit partner is Ms Kim Lawry. The external auditor receives all Board Audit Committee and Board Risk Committee papers, attends all meetings of these committees and is available to Committee members at any time. The external auditor also attends the AGM to answer questions from shareholders regarding the conduct of its audit, the audit report and financial statements and its independence. The external auditor is required to confirm its independence and compliance with specified independence standards at our half and full financial year, however in practice it confirms its independence on a quarterly basis. We strictly govern our relationship with the external auditor, including restrictions on employment, business relationships, financial interests and use of our financial products by the external auditor. Periodically, the Board Audit Committee consults with the external auditor without the presence of management about internal controls over financial information, reporting and disclosure and the fullness and accuracy of the Group’s financial statements. The Board Audit Committee also meets with the Chief Audit Officer without other members of management being present. Engagement of the external auditor To avoid possible independence or conflict issues, our ‘Pre-approval of engagement of external auditor for audit and non-audit services’ policy (NAS Policy) prohibits the external auditor from carrying out certain types of non-audit services for Westpac. The NAS Policy also limits the extent to which the external auditor can perform other non-audit services. Use of the external auditor for any non-audit services must be assessed and approved in accordance with the pre-approval process set out in the NAS Policy. Group Audit (internal audit) Group Audit is the Third Line assurance function that provides the Board and management with independent and objective evaluation of the adequacy and effectiveness of the Group’s governance, risk management and internal controls. Group Audit is governed by a charter approved by the Board Audit Committee that sets out its purpose, role, scope and responsibilities. Group Audit’s activities conform with the Global Internal Audit Standards (GIAS), including the principles of Ethics and Professionalism. To safeguard the independence and standing of Group Audit, the Chief Audit Officer has a direct (functional) reporting line into the Board Audit Committee, through |
| 206 WESTPAC GROUP 2025 ANNUAL REPORT CORPORATE GOVERNANCE the Chairman of the Board Audit Committee and, for administrative purposes only, to a member of the Senior Executive team, currently the CFO. Group Audit has full, free and unrestricted access to all the Group’s operations, records, data, assets, personnel and physical properties, including outsourced operations pertinent to carrying out internal audit responsibilities. This includes access to the CEO and Senior Executive team, the Board Chairman and Chairman of the Board Audit Committee, other Board members where relevant and external regulators. Board Audit Committee dialogue with management, external audit and Group audit The Board Audit Committee maintains an ongoing dialogue with management, the external auditor and Group Audit, including regarding those matters that are likely to be designated as Key Audit Matters in the external auditor’s report. Key Audit Matters are those matters which, in the opinion of the external auditor, are of the most significance in their audit of the financial report. As part of its oversight responsibilities, the Board Audit Committee also conducts discussions with a wide range of internal and external stakeholders including: • the external auditor, about our major financial reporting risk exposures and the steps management has taken to monitor and control such exposures; • Group Audit and the external auditor concerning their reports regarding significant findings in the conduct of their audits, and overseeing that any issues identified are rectified by management in an appropriate and timely way or reported to the Board Risk Committee (with the Board Risk Committee overseeing management's response to rectifying those issues); • management and the external auditor concerning the half year and full year financial statements; • management and the external auditor regarding any correspondence with regulators or government agencies, and any published reports which raise material issues or could impact on matters regarding the Westpac Group’s financial statements or accounting policies; and • the Group General Counsel regarding any legal matters that may have a material impact on, or require disclosure in, the financial statements. MARKET DISCLOSURE AND SHAREHOLDER COMMUNICATION Verification of periodic corporate reports For periodic corporate reports released to the market which are not required to be audited or reviewed by our external auditor, we have verification and approval processes to support the integrity of the information disclosed. The process varies depending on the report and generally involves the individuals with responsibility for the information confirming to the best of their knowledge that the information is accurate and not misleading. The process may also involve review by internal subject matter experts (and as appropriate, our external advisers); and review by and confirmation from the individual responsible for the corporate report that it is appropriate for release. Such periodic corporate reports may also be required to be approved by the Disclosure Committee or the Disclosure Officer (or delegate) or the Board under our Market Disclosure Policy – as described below. Market disclosure We seek to provide our investors with equal, timely, accurate and balanced disclosure. Our Market Disclosure Policy is available on our website at www.westpac.com.au/about-westpac/westpac-group/ corporate-governance/principles-policies/. The policy provides a framework for how we manage our disclosure obligations and satisfy the disclosure requirements of the ASX, NZX, and other relevant offshore securities exchanges, as well as relevant securities and corporations legislation. Under our policy, and in accordance with our obligations, information that a reasonable person would expect to have a material effect on the price or value of our securities must immediately be disclosed via the ASX unless an exception applies under regulatory requirements. Certain disclosure decisions are the responsibility of the Board (for example, relating to matters of fundamental importance to the Group such as material transactions or material changes in strategic direction). For other decisions concerning potentially market sensitive information, our Disclosure Committee is responsible for determining whether matters should be disclosed publicly under the policy, and for assisting employees in understanding what information may require disclosure to the market on the basis that it is market sensitive. The Disclosure Committee is comprised of the Disclosure Officer (who is the CFO), the Group General Counsel and at least one of the following: the CEO, the Chief Risk Officer, the Group Executive, Customer & Corporate |
| FINANCIAL REPORT EXHIBITS INDEX STRATEGIC REVIEW PERFORMANCE REVIEW EXHIBIT 15.4 ADDITIONAL INFORMATION 207 Services, the Company Secretary of Westpac and the General Manager, Investor Relations. The Disclosure Officer is ultimately responsible for all disclosure-related communication with relevant securities exchanges. The Company Secretary or their delegate is authorised to lodge ASX announcements once they have been approved. A copy of announcements on material issues will also be provided to the Board promptly after release to the ASX, unless previously provided. Before Westpac gives a new and substantive investor or analyst presentation, we will release a copy of that presentation to the market. Once relevant information is disclosed to the market and available to investors, it may also be published on our website. This includes investor discussion packs and presentations on our financial results. Our website also contains Annual Reports, results announcements, speeches and support material given at investor conferences or presentations, notices of meetings and key media releases. Shareholder communication and participation We are committed to keeping shareholders fully informed about Westpac in compliance with our obligations – from our strategy, operations and performance, to our governance and sustainability approach. As part of our investor relations program – and consistent with our Market Disclosure Policy – we carry out a range of activities to facilitate two-way communication with shareholders, including: • providing relevant company information online via our Investor Centre on our website; • giving shareholders the option to receive information and communications electronically or via hard copy; • responding to shareholder queries directly via phone, email and mail; and • enabling shareholders to view major market briefings and maintaining that information in our Investor Centre. Our financial calendar in our Investor Centre lists all major market briefings and shareholder meetings. Announcements on these events may also be made on the ASX. Westpac seeks to facilitate shareholder participation at general meetings. We aim to choose a time and location that is convenient for shareholders. We provide explanatory notes in the Notice of Meeting to shareholders, and the AGM is also webcast live with a replay available for viewing in our Investor Centre. Westpac engages with shareholders and shareholder groups throughout the year to gather feedback and allow them to ask questions. This feedback assists the Group’s decision making and allows us to address any key themes in our reporting and/or at our meeting. Westpac intends to hold an in-person meeting this year. Shareholders unable to attend in person may view the meeting via a live webcast and ask questions online during the meeting. In addition, shareholders will also have the opportunity, prior to the AGM, to submit questions, lodge a direct vote or appoint a proxy, corporate representative or attorney to vote on a shareholder’s behalf at the AGM. Consistent with our practice for voting at meetings of shareholders, voting on all resolutions is conducted by a poll. |
| 208 WESTPAC GROUP 2025 ANNUAL REPORT DIRECTORS' REPORT Our Directors present this report together with the financial statements of the Group for the financial year ended 30 September 2025.1 Board Committee Member Key Chair of each Committee is noted with a red icon. Board Audit Board Remuneration Board Nominations & Governance Board Risk Board of Directors Steven Gregg BCom Age: 64 CHAIRMAN AND INDEPENDENT NON-EXECUTIVE DIRECTOR Appointed: Director since 7 November 2023 and Chairman since 14 December 2023. Board Committees: Chair of the Board Nominations & Governance Committee. Experience: Steven has more than 36 years' experience in global financial services, strategy consulting and professional services across Australia, Asia, Europe and the US. He has extensive experience in global investment banking, including through senior roles with ABN Amro, Chase Manhattan, Lehman Brothers and AMP Morgan Grenfell. His most recent executive role was as a partner at McKinsey & Company where he advised clients in Financial Services and other sectors, primarily in Australia and Asia. Steven has served as Chairman and Director for companies across various sectors and is currently Chairman of Ampol Limited and the Lorna Hodgkinson Foundation (and a Director of Unisson Disability Limited). Steven is also a Director of William Inglis & Son Limited. Steven was formerly the Chairman of The Lottery Corporation, Tabcorp Holdings Limited, Goodman Fielder Limited and Austock Group Limited and formerly a Non-executive Director at Challenger Limited. Directorships of listed entities over the past three years: Ampol Limited (since October 2015, Chairman since August 2017), The Lottery Corporation Limited (May 2022 to March 2024) and Challenger Limited (October 2012 to October 2023). Other principal directorships and interests: Chairman of the Lorna Hodgkinson Foundation (and a Director of Unisson Disability Limited). Board Committees: Anthony Miller LLB (Hons), BA Age: 55 MANAGING DIRECTOR AND CHIEF EXECUTIVE OFFICER Appointed: Director since 16 December 2024. Board Committees: Nil. Experience: Anthony was appointed Westpac Group Chief Executive Officer in December 2024. Since joining the Westpac Group in 2020, Anthony has also held the roles of Chief Executive, Business and Wealth and Chief Executive, Westpac Institutional Bank. Before joining Westpac Group, Anthony was CEO of Australia & New Zealand and Co-Head of Investment Bank, Asia Pacific at Deutsche Bank from 2017. Prior to Deutsche Bank, Anthony was a partner at Goldman Sachs based in Hong Kong within the investment banking division and previously held several roles at Goldman Sachs in Australia and New Zealand having joined the organisation in 2001. Before joining Goldman Sachs, Anthony worked at Credit Suisse. Anthony holds a Bachelor of Law (Honours) from Queensland University of Technology, and Bachelor of Arts (Japanese Language, Modern Asian Studies) from Griffith University. Directorships of listed entities over the past three years: Nil. Other principal directorships and interests: Director of Australian Banking Association, Director of the Institute of International Finance and Director of Financial Markets Foundation for Children. Board Committees: Nil 1. Particulars of the skills, experience, expertise and responsibilities of the Directors at the date of this report, including all directorships of other listed companies held by a Director at any time in the three years’ immediately before 30 September 2025, and the period for which each directorship has been held, are set out in the following pages. |
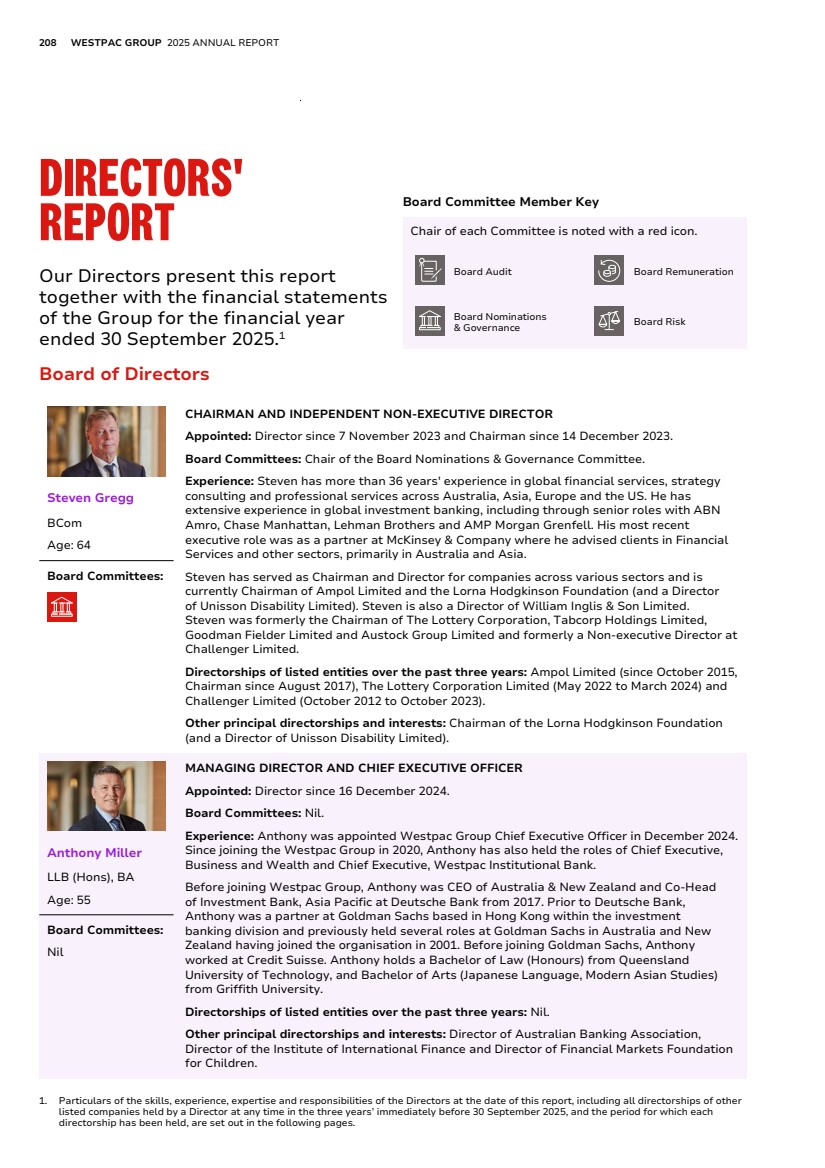
| FINANCIAL REPORT EXHIBITS INDEX STRATEGIC REVIEW PERFORMANCE REVIEW EXHIBIT 15.4 ADDITIONAL INFORMATION 209 Tim Burroughs MA (Hons), B Psy (Hons), FCA, FAICD Age: 71 INDEPENDENT NON-EXECUTIVE DIRECTOR Appointed: Director since 10 March 2023. Board Committees: Member of the Board Remuneration and the Board Risk Committees. Experience: Tim has over 41 years' experience in finance, international banking and mergers and acquisitions. Tim was formerly Chairman of Investment Banking at Goldman Sachs Australia, where he worked for 11 years. Prior to this, Tim held senior positions at Merrill Lynch including Chairman of Mergers and Acquisitions. From 1993 to 1997, Tim was Principal at Centaurus Corporate Finance, a leading independent advisory firm. Over the course of his career, Tim has specialised in providing strategic financial advice to major corporations and their boards. He has advised on capital restructures, capital raisings and more than 100 public company acquisitions. Tim has an engineering degree from Cambridge University and is a Fellow of the Institute of Chartered Accountants. Tim has also studied and taught Psychology at Macquarie University. Directorships of listed entities over the past three years: Nil. Other principal directorships and interests: Panel member of Adara Partners (Australia) Pty Ltd. Board Committees: Nerida Caesar BCom, MBA, GAICD Age: 61 INDEPENDENT NON-EXECUTIVE DIRECTOR Appointed: Director since 1 September 2017. Board Committees: Member of the Board Audit and the Board Risk Committees. Experience: Nerida has over 39 years' of broad ranging commercial and business management experience, with particular depth in technology-led businesses. Nerida was Group Managing Director and Chief Executive Officer, Australia and New Zealand, of Equifax (formerly the ASX listed Veda Group Limited) and was also a former director of Genome One Pty Ltd and Stone and Chalk Limited. Before joining Equifax, Nerida held several senior management roles at Telstra, including Group Managing Director, Enterprise and Government and Group Managing Director, Wholesale. Nerida also held several executive and senior management positions with IBM within Australia and internationally, including as Vice President of IBM’s Intel Server Division for the Asia Pacific region. Directorships of listed entities over the past three years: Nil. Other principal directorships and interests: Co-Chair of Good2Give and its subsidiaries Workplace Giving Australia, Good2Give Research & Technology Fund and ShareGift. Director of NBN Co Ltd, Director of CreditorWatch and Director of O’Connell Street Associates Pty Ltd. Advisor to startups in the technology sector. Board Committees: David Cohen BA LLB, FAPI Age: 65 INDEPENDENT NON-EXECUTIVE DIRECTOR Appointed: Director since 1 April 2025. Board Committees: Member of the Board Risk Committee. Experience: David has over 21 years’ experience in financial services and was Deputy Chief Executive Officer of Commonwealth Bank of Australia (CBA) from November 2018 to December 2023. As Deputy CEO, David oversaw business divestments, facilitated mergers and acquisitions, and improved handling of customer complaints. Prior to this role, David was Group General Counsel, Group Executive Human Resources, Group Executive Corporate Affairs and Chief Risk Officer at CBA. During his 16 years at CBA, he also led the bank through the Hayne Royal Commission into the financial services sector. David’s roles prior to joining CBA include General Counsel at AMP and a Partner at Allens Arthur Robinson. David is Chairman of TAL Life Limited and a Panel Member of Adara Partners (Australia) Pty Ltd. He was previously a director of ASB Bank Limited (NZX). Directorships of listed entities over the past three years: ASB Bank Limited (NZX) (February 2019 to February 2025). Other principal directorships and interests: TAL Life Limited (Director since April 2025 and Chairman since May 2025), TAL Life Insurance Services Limited (Director since April 2025) and Panel Member of Adara Partners (Australia) Pty Ltd. Board Committees: |

| 210 WESTPAC GROUP 2025 ANNUAL REPORT DIRECTORS' REPORT Pip Greenwood LLB Age: 59 INDEPENDENT NON-EXECUTIVE DIRECTOR Appointed: Director since 1 August 2025. Board Committees: Nil. Experience: Pip has more than 25 years' of experience in financial services, capital markets, mergers and acquisitions, and governance, and was one of New Zealand’s leading commercial lawyers and a partner at Russell McVeagh, where she advised on many high-profile New Zealand corporate transactions. Pip also previously served as Board Chair and interim CEO of Russell McVeagh and was a member of the New Zealand Takeovers Panel from 2007 to 2011. Pip is the current Chair of Westpac New Zealand Limited (WNZL) and Chair of The a2 Milk Company Limited. Directorships of listed entities over the past three years: The a2 Milk Company Limited (Director since July 2019 and Chair since 16 November 2023), Fisher & Paykel Healthcare Corporation Limited (June 2017 to September 2025) and Vulcan Steel Limited (August 2019 to October 2022). Other principal directorships and interests: Chair of WNZL. Board Committees: Nil Debra Hazelton BA (Hons), MCom, GAICD Age: 72 INDEPENDENT NON-EXECUTIVE DIRECTOR Appointed: Director since 4 March 2025. Board Committees: Member of the Board Remuneration Committee. Experience: Debra has over 30 years' experience in global financial services, with a particular focus on Australia and Japan. Her executive experience includes national CEO roles in Japan (CBA) and Australia (Mizuho Bank) as well as treasury, corporate/project finance, and human resources/organisational culture. Debra is an experienced Chair and Non-executive Director currently serving as Chair of Export Finance Australia, Vice President of the Australia-Japan Business Co-operation Committee, and a Director of the boards of Persol Holdings Co., Ltd (Tokyo Stock Exchange) and Australia Post. Debra was previously Chair of AMP Ltd and AMP Bank. Debra holds graduate and postgraduate degrees in Economics and Finance as well as Philosophy and Japanese and studied at University of Sydney, UNSW, and Keio University (Tokyo) and was recently awarded the Japanese Minister of Foreign Affairs Commendation for 2024. Directorships of listed entities over the past three years: Persol Holdings Co., Ltd (Tokyo Stock Exchange) (since June 2023) and AMP Limited (June 2019 to April 2024). Other principal directorships and interests: Chair of Export Finance Australia, Vice President of the Australia Japan Business Co-operation Committee and Director of Australia Post. Board Committees: Andy Maguire BA, BAI Age: 59 INDEPENDENT NON-EXECUTIVE DIRECTOR Appointed: Director since 15 July 2024. Board Committees: Member of the Board Remuneration Committee. Experience: Andy has over 36 years’ experience in financial services, and began his career in banking at Lloyds Banking Group. From 2014 to 2020, he served as Group Chief Operating Officer at HSBC Holdings plc, with responsibility for operations, technology, real estate, change and transformation and operational resilience. Previously, he spent 16 years with the Boston Consulting Group, where he became Managing Partner of the London office covering the UK and Ireland, and a member of the firm's global executive committee, as well as formerly serving as Global Head of Retail Banking. Andy is currently Chair of UK banking software fintech Thought Machine Group. He is also an independent Non-executive Director of AIB Group plc, a financial services group operating predominantly in the Republic of Ireland and the UK. Andy previously held Chair positions with RegTech compliance company Napier AI and IT service management provider CX Holdings (Cennox Group). Directorships of listed entities over the past three years: AIB Group p.l.c. (since March 2021). Other principal directorships and interests: Chair of Thought Machine Group. Board Committees: |

| FINANCIAL REPORT EXHIBITS INDEX STRATEGIC REVIEW PERFORMANCE REVIEW EXHIBIT 15.4 ADDITIONAL INFORMATION 211 Peter Nash BCom, FCA, F Fin Age: 63 INDEPENDENT NON-EXECUTIVE DIRECTOR Appointed: Director since 7 March 2018. Board Committees: Chair of the Board Audit Committee. Member of the Board Risk and Board Nominations & Governance Committees. Experience: Peter was formerly a Senior Partner with KPMG until September 2017, having been admitted to the Australian partnership in 1993. He served as the National Chairman of KPMG Australia and served on KPMG’s Global and Regional Boards. His previous positions with KPMG included Regional Head of Audit for Asia Pacific, National Managing Partner for Audit in Australia and head of KPMG Financial Services. Peter has worked in geographically diverse and complex operating environments providing advice on a range of topics including business strategy, risk management, internal controls, business processes and regulatory change. He has also provided financial and commercial advice to many State and Federal Government businesses. Peter is a former member of the Business Council of Australia and its Economic and Regulatory Committee. Directorships of listed entities over the past three years: Johns Lyng Group Limited (October 2017 to October 2025), Mirvac Group (since November 2018) and ASX Limited (June 2019 to September 2025). Other principal directorships and interests: Director of the General Sir John Monash Foundation. Board Committees: Margaret (Margie) Seale BA, FAICD Age: 65 INDEPENDENT NON-EXECUTIVE DIRECTOR Appointed: Director since 1 March 2019. Board Committees: Chair of the Board Remuneration Committee. Member of Board Nominations & Governance Committee. Experience: Margie has more than 26 years' experience in senior executive roles in Australia and overseas, including in consumer goods, global publishing, sales and marketing and the successful transition of traditional business models to digital environments. Prior to her non-executive career, Margie was the Managing Director of Random House Australia and New Zealand and President, Asia Development for Random House Inc. Margie was a Director and then Chair of Penguin Random House Australia Pty Limited, and a Director of Telstra Corporation Limited, Ramsay Health Care Limited, Bank of Queensland Limited and the Australian Publishers’ Association. She also served on the Boards of Chief Executive Women (chairing its Scholarship Committee), the Powerhouse Museum, and the Sydney Writers' Festival. Directorships of listed entities over the past three years: Scentre Group Limited (since February 2016). Other principal directorships and interests: Director of Westpac Scholars Limited, Seaborn Broughton & Walford Pty Limited, Pinchgut Opera Limited and Jana Investment Advisers Pty Ltd. Board Committees: Michael Ullmer AO BSc, FAICD, FCA, SF Fin Age: 74 INDEPENDENT NON-EXECUTIVE DIRECTOR Appointed: Director since 3 April 2023. Board Committees: Chair of the Board Risk Committee. Member of the Board Audit Committee. Experience: Michael has more than 41 years' experience in international banking, finance and professional services. Michael was formerly the Deputy Group Chief Executive Officer of NAB from 2007 until he retired from the Bank in August 2011. He joined NAB in 2004 as Finance Director and held a number of key positions including Chair of the subsidiaries Great Western Bank (US) and JB Were. Prior to NAB, Michael was at CBA, initially as Group Chief Financial Officer and then Group Executive with responsibility for Institutional and Business Banking. Before that, he was a Partner at accounting firms KPMG (1982 to 1992) and Coopers & Lybrand (1992 to 1997). From a philanthropic perspective, throughout his career Michael has been heavily involved in supporting the Arts and Education sectors. Directorships of listed entities over the past three years: Lendlease Corporation Limited (Director from December 2011 to November 2024 and Chairman from November 2018 to November 2024). Other principal directorships and interests: Member of the National Gallery of Victoria Foundation Board. Board Committees: |

| 212 WESTPAC GROUP 2025 ANNUAL REPORT DIRECTORS' REPORT Retired Directors Peter King was appointed a Director on 2 December 2019 and retired as CEO and Managing Director on 15 December 2024, Nora Scheinkestel was appointed as a Director on 1 March 2021 and retired as a Director on 6 November 2024 and Audette Exel was appointed as a Director on 1 September 2021 and retired as a Director on 13 December 2024. Executive Team as at 30 September 2025 Anthony Miller LLB (Hons), BA Age: 55 MANAGING DIRECTOR AND CHIEF EXECUTIVE OFFICER, WESTPAC GROUP Anthony was appointed Westpac Group Chief Executive Officer on 16 December 2024. Since joining the Westpac Group in 2020, Anthony has also held the roles of Chief Executive, Business and Wealth and Chief Executive, Westpac Institutional Bank. Before joining Westpac Group, Anthony was CEO of Australia & New Zealand and Co-Head of Investment Bank, Asia Pacific at Deutsche Bank from 2017. Prior to Deutsche Bank, Anthony was a partner at Goldman Sachs based in Hong Kong within the investment banking division and previously held several roles at Goldman Sachs in Australia and New Zealand having joined the organisation in 2001. Before joining Goldman Sachs, Anthony worked at Credit Suisse. Anthony holds a Bachelor of Law (Honours) from Queensland University of Technology, and Bachelor of Arts (Japanese Language, Modern Asian Studies) from Griffith University. Scott Collary BA, Humanities Age: 61 GROUP CHIEF INFORMATION OFFICER, TECHNOLOGY Scott was appointed as the Group’s Chief Information Officer in August 2023. Prior to this, he held the role of Group Executive, Customer Services & Technology after joining Westpac as Chief Operating Officer in November 2020. Scott has over 35 years' global banking experience, with a breadth of expertise across technology, operations, risk mitigation and commercial functions. Before joining Westpac, Scott was Chief Information & Operations Officer for North America Consumer Businesses at Bank of Montreal, Canada. Prior to that, Scott held senior executive positions at a number of multinational financial institutions including ANZ, Citibank, Fifth Third Bank and Bank of America. Scott holds a Bachelor’s Degree from the University of Maryland in the United States. Kate Dee FCIPD, BA Age: 47 CHIEF PEOPLE OFFICER Kate was appointed Chief People Officer in August 2025, joining Westpac with more than 25 years’ experience across a range of industries. Prior to joining Westpac, Kate was the Chief People Officer at Bupa Asia Pacific, a role she held since 2018. Prior to that, she was the General Manager of Talent at National Australia Bank from 2015 to 2018 after returning from Europe where she oversaw Global Organisational Development as an Executive Director for Time Warner in London. Kate holds Bachelors degrees from Victoria University of Wellington New Zealand. She is a Fellow of both the Chartered Institute of Personnel and Development UK and the Australian Human Resource Institute as well as a member of Chief Executive Women. |

| FINANCIAL REPORT EXHIBITS INDEX STRATEGIC REVIEW PERFORMANCE REVIEW EXHIBIT 15.4 ADDITIONAL INFORMATION 213 Shannon Finch BA (Hons), LLB (Hons), MAICD, FGIA Age: 55 GROUP GENERAL COUNSEL Shannon joined Westpac in November 2021 and leads Westpac’s legal function globally. Shannon has nearly 30 years' legal experience including with the Commonwealth Attorney General’s Department Corporations Law Simplification Unit, Mallesons Stephen Jaques (now King & Wood Mallesons) in Canberra, London and Sydney, including as head of the Sydney office, and as a senior partner of global corporate law firm Jones Day. Shannon is a member of the Business Law Executive of the Law Council of Australia, the AICD Law Committee and was formerly on the Advisory Committee to the Australian Law Reform Commission’s Review of the Legislative Framework for Corporations and Financial Services Regulation. Shannon has experience as a Non-executive Director of Bell Shakespeare (in the Not-for-profit sector), is a member of the AICD and Chief Executive Women, and is a Fellow of the Governance Institute of Australia. Shannon has a Bachelor of Arts (Hons) and Bachelor of Laws (Hons) from the Australian National University. Paul Fowler LLB, BCom (Hons, Finance) Age: 46 CHIEF EXECUTIVE, BUSINESS & WEALTH Paul was appointed Chief Executive, Business and Wealth in May 2025. He oversees banking services for small, medium and commercial sized businesses, Westpac’s wealth businesses including Private Wealth and BT, and Pacific Banking. Prior to joining Westpac, Paul spent 10 years at Commonwealth Bank of Australia where he held various roles, including Executive General Manager of Regional and Agribusiness Banking, Chief Financial Officer of Institutional Banking and Markets, and Executive General Manager, Group Mergers and Acquisitions. Paul spent the first 13 years of his career in investment banking, holding positions at Goldman Sachs and Citigroup in Australia and offshore, where he advised financial services firms on mergers and acquisitions, divestments, and capital management. He holds a Bachelor of Laws and a Bachelor of Commerce (Hons) from the University of New South Wales. Peter Herbert Age: 43 CHIEF TRANSFORMATION OFFICER Peter was appointed Chief Transformation Officer in March 2025 and has responsibility for transformation across the Group, including working across divisions and technology on the delivery of the business-led simplification program, UNITE. Prior to this, Peter was the Acting Chief Executive, Business & Wealth responsible for providing a range of banking and wealth services for customers across Business Lending, Merchant Services, Private Wealth, Westpac’s Pacific banking business and BT. Peter is a seasoned banking executive who joined Westpac in 2020 as the Chief Transformation Officer for Consumer and Business Banking, and the Chief Operating Officer, Business & Wealth. Before joining Westpac, he had an extensive career at HSBC most recently as Chief Operating Officer, Asia Pacific, Retail Banking & Wealth Management. Carolyn Hoy BA (Hons), LLB (Hons) Age: 49 ACTING GROUP EXECUTIVE, CUSTOMER & CORPORATE SERVICES Carolyn was appointed the Acting Group Executive, Customer & Corporate Services in May 2025. She is responsible for operations, customer solutions, fraud prevention, property, procurement and resilience, corporate affairs, and HR and finance services. Carolyn has 25 years’ experience and a background in legal and risk. She has held a range of roles throughout her almost 20-year Westpac tenure, including Head of Group Corporate Legal, Chief of Staff to the CEO, Chief Risk and Compliance Officer for BT, and General Manager Property, Procurement and Resilience. Carolyn holds a Bachelor of Arts (First Class Honours) and Bachelor of Laws (First Class Honours) from the Australian National University and is also a Fellow of the Governance Institute of Australia. |

| 214 WESTPAC GROUP 2025 ANNUAL REPORT DIRECTORS' REPORT Nell Hutton BCom (Hons), MPhil, GAICD Age: 49 CHIEF EXECUTIVE, WESTPAC INSTITUTIONAL BANK Nell was appointed Chief Executive, Westpac Institutional Bank in October 2023. The Institutional Bank provides a range of banking services to Commercial, Corporate, Institutional and Public Sector customers with connections to Australia, New Zealand, Asia, Europe and US markets. Nell first joined Westpac in February 2021 as Managing Director, Financial Markets, after 21 years at Goldman Sachs in London and Australia, most recently as Head of the Global Markets division in Australia and New Zealand. She holds a Master of Philosophy in Finance and Economics from Cambridge University and a Bachelor of Commerce (First Class Honours) from the University of Sydney. Nell is a member of the AICD and Chief Executive Women. Carolyn McCann BBus (Com), BA, GradDipAppFin, GAICD Age: 53 CHIEF EXECUTIVE, CONSUMER Carolyn started at Westpac in 2013 and joined the Group Executive team in 2018. She is currently Chief Executive, Consumer. The Consumer bank provides banking products and services including mortgages, credit cards, personal loans and deposits to customers in Australia. Previously, Carolyn was Group Executive, Customer & Corporate Services, responsible for operations, customer solutions, scams and fraud prevention, property, procurement and resilience, corporate affairs, and HR and finance services. Before joining Westpac, Carolyn spent 13 years at Insurance Australia Group in several senior roles, including Group General Manager, Corporate Affairs & Investor Relations. With more than 27 years’ experience in financial services, Carolyn holds a Bachelor of Arts from The University of Queensland, a Bachelor of Business from Queensland University of Technology, and a Graduate Diploma of Applied Finance and Investment from the Securities Institute of Australia. She is a member of the AICD and Chief Executive Women. Catherine McGrath LLB/BCom Age: 54 CHIEF EXECUTIVE OFFICER, WESTPAC NEW ZEALAND Catherine was appointed Chief Executive Officer of Westpac New Zealand in November 2021. She has more than 25 years' experience working in financial services, spanning business, operational and people leadership roles to which she has driven significant people, structural, technology and strategic change. Prior to joining Westpac, Catherine led large-scale transformations at some of the world’s best known banks including Barclays Group and Lloyds TSB in the UK. This included various positions such as Head of Channels, Managing Director of Transaction Products and Payments, and Transaction Banking Director. Earlier in her career she worked at BNZ, ASB and the Prudential Group. Catherine was raised in New Zealand. She graduated from Canterbury University with a Bachelor of Law and a Bachelor of Commerce. Dr Andrew McMullan PhD (Statistics) Age: 48 CHIEF DATA, DIGITAL AND AI OFFICER Dr Andrew McMullan joined Westpac in September 2025 to lead the transformation of the bank’s data, digital and artificial intelligence capabilities. He plays a key role in driving innovation, improving customer and employee experiences, and supporting Westpac’s strategic program, UNITE. Andrew joined Westpac from CBA, where he was Chief Data and Analytics Officer. He previously served as Chief Analytics Officer, helping scale platforms that enhanced decision-making and customer outcomes. With a career spanning global financial institutions, Andrew is a recognised thought leader in responsible AI and data strategy. He brings deep expertise in delivering secure, scalable and customer-centric solutions that enable innovation, operational efficiency, and trust. Andrew holds a PhD in Statistics from the University of Glasgow. |

| FINANCIAL REPORT EXHIBITS INDEX STRATEGIC REVIEW PERFORMANCE REVIEW EXHIBIT 15.4 ADDITIONAL INFORMATION 215 Michael Rowland B.Comm, FCA Age: 64 CHIEF FINANCIAL OFFICER Michael joined Westpac Group as Chief Financial Officer (CFO) in September 2020a . He is responsible for Westpac’s Finance, Group Audit, Investor Relations, Tax, Treasury, Group Business Controls and Management and Corporate and Business Development functions. Before joining Westpac, Michael was a Partner in Management Consulting at KPMG. Before that he held a number of executive positions at ANZ from 1999 to 2013. These included CFO Institutional Banking, CFO Wealth, CFO New Zealand, CFO Personal Financial Services, CEO Pacific, Managing Director Mortgages and General Manager, Transformation. Michael commenced his career at KPMG, where he was promoted to Tax Partner in 1993. Michael holds a Bachelor of Commerce from the University of Melbourne and a Graduate Diploma of Taxation Law from Monash University. He is a Fellow of the Institute of Chartered Accountants in Australia and New Zealand. Fiona Wild PhD (Chemistry) Age: 53 CHIEF SUSTAINABILITY OFFICER Fiona was appointed Westpac’s Chief Sustainability Officer in March 2025, leading the bank's work on climate, nature, social policy, human rights and Indigenous strategy and engagement. Fiona has more than 25 years of experience working in sustainability. Before joining Westpac, Fiona was the Group Sustainability and Social Value Officer at BHP, accountable for all climate and sustainability-related public policy issues. She joined BHP in 2010 and held a range of senior roles including Vice President Environment, Vice President Climate Change, and Group Climate and Sustainability Officer. In December 2015, Fiona was appointed a permanent member of the Financial Stability Board’s Task Force on Climate-related Financial Disclosures, reporting to the G20. She has also held several Board positions, including Deputy Chair of the Global Carbon Capture and Storage Institute (GCCSI). Fiona holds a PhD in Chemistry from the University of Edinburgh. Ryan Zanin CFA Age: 63 CHIEF RISK OFFICER Ryan was appointed Chief Risk Officer in April 2022. Ryan is responsible for risk management across the Group, which includes credit risk, operational risk, financial crime, compliance and conduct. Ryan has over 40 years' experience in financial services specialising in risk management. Prior to joining Westpac Group, Ryan was Executive Vice President and Chief Risk Officer at Fannie Mae overseeing the company’s governance and strategy for global risk management. Prior to Fannie Mae, Ryan held senior positions at GE Capital, Wells Fargo & Company and Deutsche Bank. Ryan has also been on the Board of Fannie Mae and General Electric Capital Corporation. A Canadian, Ryan began his career at the Bank of Montreal before taking on various roles across Citibank and Bankers Trust Company. Ryan is a Chartered Financial Analyst. Tim Hartin LLB (Hons.), FGIA Age: 50 COMPANY SECRETARY Tim was appointed Company Secretary in November 2011. Previously Tim was Head of Legal – Risk Management & Workouts, Counsel & Secretariat and prior to that, he was Counsel, Corporate Core. Before joining Westpac in 2006, Tim was a Consultant with Gilbert + Tobin, where he provided corporate advisory services to ASX-listed companies. Tim was previously a lawyer at Henderson Boyd Jackson W.S. in Scotland and in London in Herbert Smith’s corporate and corporate finance division. Tim holds a LLB Law (Hons) with options in French from the University of Aberdeen, is a fellow of the Governance Institute of Australia and a member of the Law Advisory Board of the University of Technology, Sydney. Tim is an international lawyer - being a qualified solicitor in Scotland, England + Wales and Australia. a. Michael Rowland retired as CFO and Nathan Goonan commenced as CFO effective 8 October 2025. |

| 216 WESTPAC GROUP 2025 ANNUAL REPORT DIRECTORS' REPORT Operating and financial review Principal activities The principal activities of the Group during the financial year ended 30 September 2025 were the provision of financial services including lending, deposit taking, payments services, investment platforms, leasing finance, general finance, interest rate risk management and foreign exchange services. There have been no significant changes in the nature of the principal activities of the Group during 2025. Operations and financial performance Net profit for 2025 was $6,916 million, a decrease of 1% compared to 2024. The decrease in net profit reflects an increase in operating expenses partly offset by higher income and lower credit impairment charges. Basic earnings per share remained stable at 201.9 cents. The following is a summary of the movements in major line items in net profit for 2025 compared to 2024. Net interest income increased by $627 million or 3% driven by growth in average interest earning assets of 3% and stable net interest margin. Key movements in net interest income included: • Improved interest income from growth in average interest earning assets; and • Disciplined management of deposit funding costs in response to falling asset yields. Non-interest income was $169 million or 6% higher. The key movements included: • Favourable market movements on the value of financial instruments measured at fair value in 2025 of $38 million, compared to a loss of $24 million in 2024; • Higher wealth management income mainly due to volume growth of funds under administration; and • Improvements in transaction fee income, mainly resulting from higher line and guarantee fees. Operating expenses were $972 million or 9% higher. The key movements included: • Higher employee costs of $686 million mainly from restructuring costs and additional staffing attached to our UNITE program; and • A $181 million increase in technology services expenses from inflationary pressure and the impact of our UNITE program; and • A $110 million increase in amortisation and impairment of software assets from projects completed. Credit impairment charges of $424 million represented 5 basis points of average gross loans compared to 7 basis points in 2024. The decrease primarily reflected higher write-back and recoveries partly offset by higher charges from collective assessed exposures. The effective tax rate of 30.97% in 2025 was slightly higher than the Australian corporate tax rate of 30%, mainly due to non tax deductible hybrid instrument distributions. A review of the operations of the Group and its segments and their results for the financial year ended 30 September 2025 is set out in the Creating value for shareholders (pages 152- 159) section which form part of this Directors' report. Further information about our financial position and financial results is included in the Financial Report which forms part of this Directors' report. Dividends Westpac has announced a final ordinary dividend of 77 cents per Westpac ordinary share, totalling $2.6 billion. The dividend will be fully franked and will be paid on 19 December 2025. In 2025, an interim ordinary dividend of 76 cents per Westpac ordinary share totalling $2.6 billion was paid as a fully franked dividend on 27 June 2025 (2024: ordinary dividend of 75 cents and a special dividend of 15 cents per share totalling to $3.1 billion). For the year ended 30 September 2024, a fully franked final dividend of 76 cents per ordinary share totalling $2.6 billion was paid on 19 December 2024. |
| FINANCIAL REPORT EXHIBITS INDEX STRATEGIC REVIEW PERFORMANCE REVIEW EXHIBIT 15.4 ADDITIONAL INFORMATION 217 Significant changes in state of affairs and events during and since the end of the 2025 financial year Significant changes in the state of affairs of the Group during the financial year ended 30 September 2025, or that have occurred since that date, were: • On 16 December 2024, Anthony Miller commenced as CEO and Managing Director. • Following approval by Westpac’s shareholders at the 2024 AGM on 13 December 2024, KPMG commenced as Westpac’s external auditor for the 2025 financial year. • Following completion of the Integrated Plan (IP) in December 2023 (required under the enforceable undertaking entered into with APRA in December 2020 in relation to our risk governance remediation), Westpac continued to focus on the sustainability and effectiveness of the IP uplifts via a transition phase. On 31 December 2024, we completed the transition phase, as confirmed by Promontory Australia (as Independent Reviewer) in February 2025. • On 15 October 2025, APRA announced its decision to lift the CEU and remove Westpac's remaining $500 million operational risk capital overlay. The removal of the $500 million capital overlay will mean Westpac’s Common Equity Tier 1 (CET1) capital ratio will increase by approximately 17 basis points, reflecting a reduction in risk weighted assets of $6,250 million. This change applied with immediate effect. For a discussion of these changes and other significant developments, please refer to Significant developments (pages 268-269) which forms part of this Directors' report. The Directors are not aware of any other matter or circumstance that has occurred since 30 September 2025 that has significantly affected or may significantly affect the operations of the Group, the results of these operations or the state of affairs of the Group in subsequent financial years. Business strategies, developments and expected results Our business strategies, prospects and likely major developments in the Group’s operations in future financial years and the expected results of those operations are discussed in the Strategic Review (pages 144- 272) and in Significant developments (pages 268-269) which form part of this Directors' report. Further information on our business strategies and prospects for future financial years and likely developments in our operations and the expected results of operations have not been included in this report because the Directors believe it would be likely to result in unreasonable prejudice to the Group. Risks to our financial performance, position and our operations Our financial position, our future financial results, our operations and the success of our strategy are subject to a range of risks. These risks are set out and discussed in the Risk Management section (pages 180-187) which forms part of the Directors' report. For additional information on risks relating to Westpac, refer to 2025 Risk Factors as disclosed on the ASX on the same date as this report. |
| 218 WESTPAC GROUP 2025 ANNUAL REPORT DIRECTORS' REPORT Directors’ interests Directors’ interests in securities The following particulars for each Director are set out in the Remuneration Report (pages 222-252) of the Directors’ report for the year ended 30 September 2025 and/or in the table below: • Their relevant interests in our shares or the shares of any of our related bodies corporate; • Their relevant interests in debentures of, or interests in, a registered scheme made available by us or any of our related bodies corporate; • Their rights or options over shares in, debentures of, or interests in, any registered scheme made available by us or any of our related bodies corporate; and • Any contracts: – To which the Director is a party or under which they are entitled to a benefit; and – That confer a right to call for or deliver shares in, debentures of, or interests in, a registered scheme made available by us or any of our related bodies corporate. Directors’ interests in Westpac and related bodies corporate as at 2 November 2025 Number of Relevant Interests in Westpac Ordinary Shares Number of Westpac Share Rights Westpac Banking Corporation Current Directors Steven Gregg 75,208 - Anthony Miller 261,171a 368,811b Tim Burroughs 67,302 - Nerida Caesar 13,583 - David Cohen 1,253 - Pip Greenwood - - Debra Hazeltonc 1,350 - Andy Maguire 6,615 - Peter Nash 15,260 - Margaret Sealed 10,438 - Michael Ullmere 12,570 - Former Directors Peter Kingf 385,807 448,117 Audette Exelg 11,952 Nora Scheinkestelh 17,225 a. Anthony Miller's interest in Westpac ordinary shares includes 14,662 restricted shares held under the Equity Incentive Plan. b. Share rights issued under the Long Term Variable Plan and Equity Incentive Plan. c. Debra Hazelton and her related bodies corporate also hold relevant interests in 10 Westpac Capital Notes 7 (ASX:WBCPJ), 16 Westpac Capital Notes 9 (ASX:WBCPL) and 2 Westpac Capital Notes 10 (ASX:WBCPM). d. Margaret Seale and her related bodies corporate also hold relevant interests in 100 Westpac Capital Notes 7 (ASX:WBCPJ). e. Michael Ullmer and his related bodies corporate also hold relevant interests in 300 Westpac Capital Notes 9 (ASX:WBCPL) and 1,000 Westpac Subordinated Notes. f. Peter King's interest in Westpac ordinary shares includes 54,310 restricted shares held under the Equity Incentive Plan. Figure displayed as at Peter King's retirement date of 15 December 2024. g. Figure displayed as at Audette Exel's retirement date of 13 December 2024. h. Figure displayed as at Nora Scheinkestel's retirement date of 6 November 2024. Note: Certain subsidiaries of Westpac offer a range of registered schemes. The Directors may from time to time invest in these schemes and are required to provide a statement to the ASX when any of their interests in these schemes change. ASIC has exempted each Director from the obligation to notify the ASX of a relevant interest in a security that is an interest in BT Cash Management Trust (ARSN 087 531 539), BT Premium Cash Fund (ARSN 089 299 730) or BT Investor Choice Cash Management Trust (formerly Westpac Cash Management Trust) (ARSN 088 187 928). |
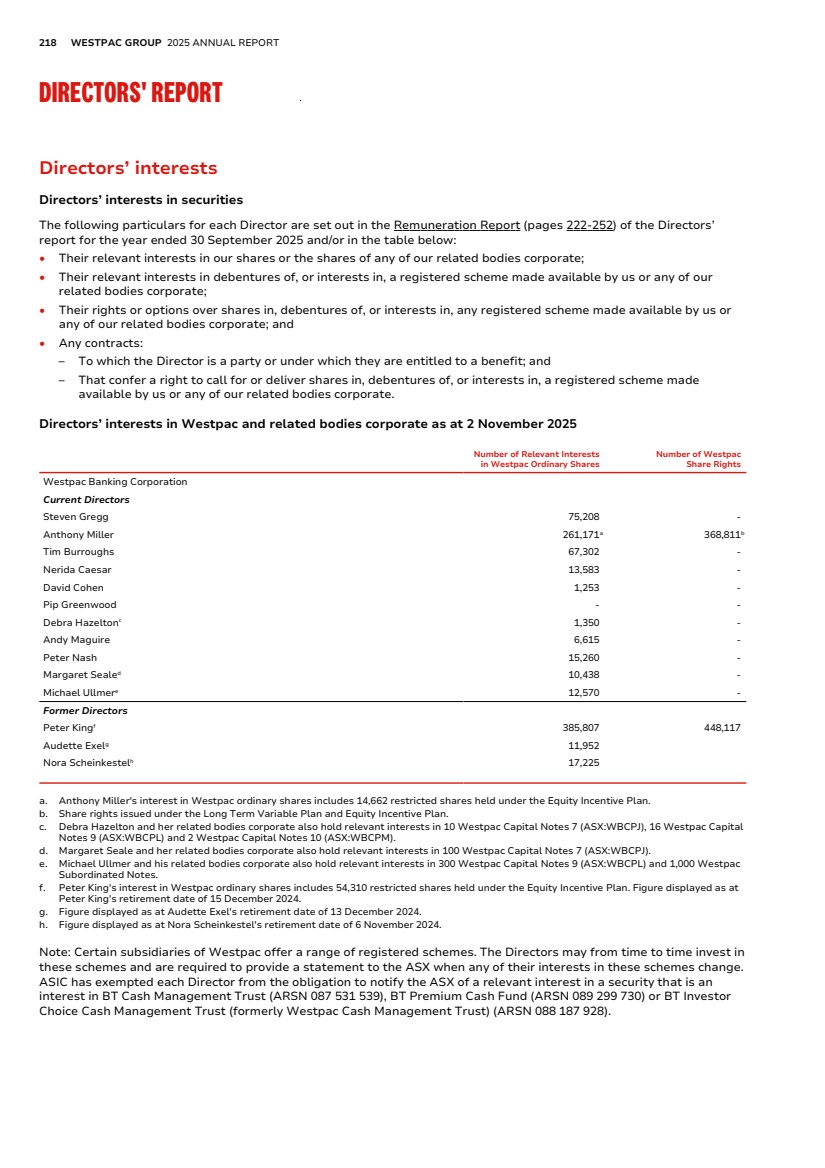
| FINANCIAL REPORT EXHIBITS INDEX STRATEGIC REVIEW PERFORMANCE REVIEW EXHIBIT 15.4 ADDITIONAL INFORMATION 219 Indemnities and insurance Under the Westpac Constitution, unless it is forbidden or would be made void by statute, we indemnify any person who is or has been a Director or Company Secretary of Westpac and of each of our related bodies corporate (except related bodies corporate listed on a recognised stock exchange), any person who is or has been an employee of Westpac or our subsidiaries (except subsidiaries listed on a recognised stock exchange), and any person who is or has been acting as a responsible manager under the terms of an Australian Financial Services Licence of any of Westpac’s wholly-owned subsidiaries against every liability (other than a liability for legal costs) incurred by each such person in their capacity as director, company secretary, employee or responsible manager, as the case may be; and all legal costs incurred in defending or resisting (or otherwise in connection with) proceedings, whether civil or criminal or of an administrative or investigatory nature, in which the person becomes involved because of that capacity. Each of the Directors named in this Directors’ report and the Company Secretary of Westpac has the benefit of this indemnity. Consistent with shareholder approval at the 2000 Annual General Meeting, Westpac has entered into a Deed of Access and Indemnity with each of the Directors, which includes indemnification in identical terms to that provided in the Westpac Constitution. Westpac also executed a deed poll in September 2009 providing indemnification equivalent to that provided under the Westpac Constitution to individuals who are or have been acting as: • statutory officers (other than as a director) of Westpac; • directors and other statutory officers of wholly-owned subsidiaries of Westpac; and • directors and statutory officers of other nominated companies as approved by Westpac in accordance with the terms of the deed poll and Westpac’s Contractual Indemnity Policy. Some employees of Westpac’s related bodies corporate and responsible managers of Westpac and its related bodies corporate are also currently covered by a deed poll that was executed in November 2004, which is on similar terms to the September 2009 deed poll. The Westpac Constitution also permits us, to the extent permitted by law, to pay or agree to pay premiums for contracts insuring any person who is or has been a Director or Company Secretary of Westpac or any of its related bodies corporate against liability incurred by that person in that capacity, including a liability for legal costs, unless: • we are forbidden by statute to pay or agree to pay the premium; or • the contract would, if we paid the premium, be made void by statute. Under the September 2009 deed poll, Westpac also agrees to provide directors’ and officers’ liability insurance to Directors of Westpac and Directors of Westpac’s wholly-owned subsidiaries (except wholly-owned subsidiaries listed on a recognised stock exchange). For the year ended 30 September 2025, the Group has insurance cover which, in certain circumstances, will provide reimbursement for amounts which we have to pay under the indemnities set out above. That cover is subject to the terms and conditions of the relevant insurance, including but not limited to the limit of indemnity provided by the insurance. The insurance policies prohibit disclosure of the premium payable and the nature of the liabilities covered. Share rights outstanding As at the date of this report there are 4,376,980 share rights outstanding in relation to Westpac ordinary shares, held by 111 holders. The latest dates for exercise of the share rights range between 1 October 2026 and 2 December 2039. Holders of outstanding share rights in relation to Westpac ordinary shares do not have any rights under the share rights to participate in any share issue or interest of Westpac or any other body corporate. Proceedings on behalf of Westpac No application has been made and no proceedings have been brought or intervened in, on behalf of Westpac under section 237 of the Corporations Act. |
| 220 WESTPAC GROUP 2025 ANNUAL REPORT DIRECTORS' REPORT Environmental disclosure The Westpac Group’s environmental disclosure is summarised in this Annual Report (pages 174-177) and detailed in our 2025 Sustainability Report and our 2025 Sustainability Index and Datasheet which are available on our website. Additional environmental disclosure is in our Climate Transition Plan which outlines how we are working to achieve our ambition to be a net-zero climate resilient bank and our Natural Capital Position Statement, which looks at how we assess the risks and opportunities associated with nature. This year, our Sustainability Report works towards aligning with Australia’s new Australian Sustainability Reporting Standard AASB S2. Westpac will need to fully comply with the new climate-related disclosure standard, AASB S2 in FY26. Westpac is also a climate reporting entity under the Financial Markets Conduct Act 2013 (NZ) and our 2025 Sustainability Report complies with the Aotearoa New Zealand Climate Standards (NZCS). In Australia we also report our scope 1 and 2 greenhouse gas emissions, energy consumption and production under the National Greenhouse and Energy Reporting (NGER) scheme for the period 1 July through 30 June each year. We are not aware of the Group incurring any material liability (including for rectification costs) under any environmental legislation. Human rights disclosure Our Human Rights Position Statement and Action Plan sets out Westpac Group's commitments and approach to respecting and advancing human rights. It outlines our approach to respecting human rights across our roles as a financial services provider, lender, purchaser of goods and services, employer, and supporter of communities, and integrates our position on child safeguarding. More information on our approach and the Group’s salient human rights issues can be found on the Human Rights section of our website and 2025 Sustainability Index and Datasheet. Under the Modern Slavery Act 2018 (Cth) and Modern Slavery Act 2015 (UK), Westpac is required to prepare an annual statement describing the risks of modern slavery across our operations and supply chain, and the actions taken to address the risks. Westpac published a joint statement for FY24 on behalf of itself and certain reporting entities that addressed the requirements of both Acts. For more information, see the Westpac Group’s 2024 Modern Slavery Statement, published in March 2025. We will release the Group’s FY25 Modern Slavery Statement in March 2026. Rounding of amounts Westpac is an entity to which ASIC Corporations Instrument 2016/191 dated 24 March 2016, relating to the rounding of amounts in directors’ reports and financial reports, applies. Pursuant to this Instrument, amounts in this Directors’ report and the accompanying financial report have been rounded to the nearest million dollars, unless indicated to the contrary. Political engagement In line with Westpac policy, no cash donations were made to political parties during the financial year ended 30 September 2025. Westpac does participate in political engagement activities assessed as directly relevant to the bank and or the banking industry. Such activities include business observer programs attached to annual party conferences, policy dialogue forums and other political engagement activities, such as speeches and events with industry participants. Westpac attends these events to put forward its position on policy matters of importance to customers, suppliers, shareholders and employees. Political expenditure on these events in Australia for the financial year ended 30 September 2025 was $182,406.87. This included expenditure of $120,730.65 with the Australian Labor Party, $59,176.22 with the Liberal Party of Australia, and $2,500 with the National Party of Australia, across Australian state and federal government jurisdictions. In New Zealand, political expenditure for the financial year ended 30 September 2025 was NZ$5,874. |
| FINANCIAL REPORT EXHIBITS INDEX STRATEGIC REVIEW PERFORMANCE REVIEW EXHIBIT 15.4 ADDITIONAL INFORMATION 221 Directors’ meetings The Westpac Banking Corporation Board met 9 times during the financial year ended 30 September 2025. In addition, Directors attended Board strategy sessions and special purpose committee meetings during the financial year. The following table includes: • Names of the Directors that held office at any time during, or since the end of, the financial year. • The number of Board and Board Committee meetings held during the financial year that each Director, as a member of the Board or Board Committee, was eligible to attend, and the number of meetings attended by each Director. The table excludes the attendance of those Directors who attended meetings of Board Committees of which they are not a member. Board Committees Scheduled meetingsa Risk Audit Remuneration Nominations & Governance Heldb Attendedc Heldb Attendedc Heldb Attendedc Heldb Attendedc Heldb Attendedc Director Steven Greggd 9 9 n/a n/a n/a n/a n/a n/a 4 4 Anthony Millere 6 6 n/a n/a n/a n/a n/a n/a n/a n/a Tim Burroughsf 9 9 8 8 n/a n/a 8 8 n/a n/a Nerida Caesarg 9 9 5 5 4 4 n/a n/a n/a n/a David Cohenh 4 4 4 4 n/a n/a n/a n/a n/a n/a Pip Greenwoodi 2 2 n/a n/a n/a n/a n/a n/a n/a n/a Debra Hazeltonj 5 5 n/a n/a n/a n/a 5 5 n/a n/a Andy Maguirek 9 9 n/a n/a n/a n/a 6 6 n/a n/a Peter Nashl 9 9 8 8 4 4 n/a n/a 4 4 Margaret Sealem 9 9 n/a n/a n/a n/a 8 8 4 4 Michael Ullmern 9 9 8 8 4 4 n/a n/a n/a n/a Former Director Peter Kingo 4 4 n/a n/a n/a n/a n/a n/a n/a n/a Audette Exelp 3 3 3 3 1 1 n/a n/a n/a n/a Nora Scheinkestelq 2 2 2 2 n/a n/a 2 2 n/a n/a a. There were no out of cycle Board meetings called. b. The number of meetings held during the time the Director was a member of the Board or Board Committee and that the Director was eligible to attend as a member. c. The number of Board or Board Committee meetings that the Director attended as a member. d. Chairman of the Board and Chair of the Board Nominations & Governance Committee. e. Appointed as a Director on 16 December 2024. f. Member of the Board Risk Committee and Board Remuneration Committee. g. Member of the Board Audit Committee. Appointed as a member of the Board Risk Committee with the appointment taking effect on 13 December 2024. h. Appointed as a Director and a member of the Board Risk Committee on 1 April 2025. i. Appointed as a Director on 1 August 2025. j. Appointed as a Director and a member of the Board Remuneration Committee on 4 March 2025. k. Appointed as a member of the Board Remuneration Committee with the appointment taking effect on 6 November 2024. l. Chair of the Board Audit Committee and member of the Board Risk Committee and Board Nominations & Governance Committee. m. Member of the Board Nominations & Governance Committee and Board Remuneration Committee. Appointed Chair of the Board Remuneration Committee with the appointment taking effect on 6 November 2024 n. Member of the Board Audit Committee and the Board Risk Committee. Appointed Chair of the Board Risk Committee with the appointment taking effect on 13 December 2024 o. Retired as a Director on 15 December 2024. p. Retired as a Director on 13 December 2024. q. Retired as a Director on 6 November 2024. |
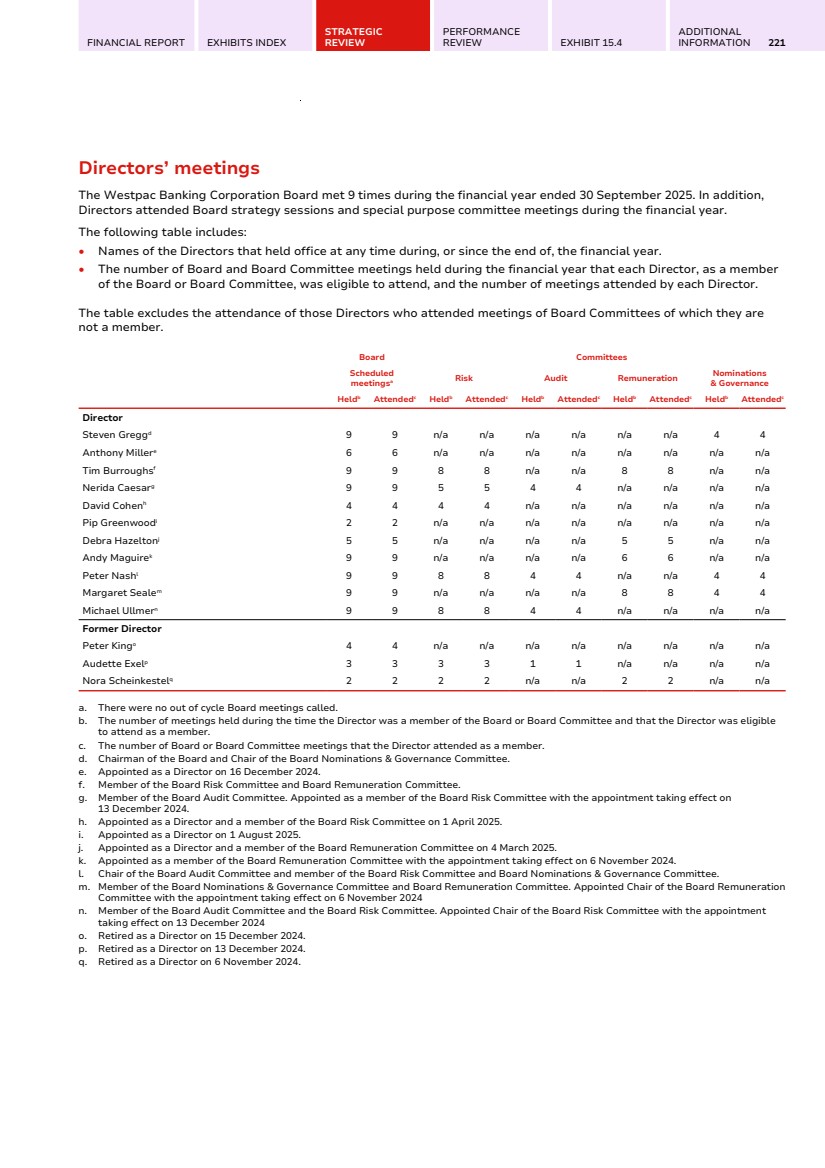
| 222 WESTPAC GROUP 2025 ANNUAL REPORT DIRECTORS' REPORT Remuneration Report LETTER FROM THE CHAIR of the Board Remuneration Committee 2025 was a year of renewal, marked by refreshed leadership and a focus on positioning Westpac for long term growth. Dear shareholders, On behalf of the Board, I am pleased to present the 2025 Remuneration Report. Group performance We invested for the future while delivering sound financial results. Excluding Notable Items, NPAT achieved our target while ROTE was narrowly below target. Our costs were higher than planned, reflecting decisions made for the long term. Cost management will continue to be a priority. We gained market share in business lending while mortgages growth in Australia was at target. Overall, we delivered a total shareholder return of 29% for the financial year. We completed the CORE transition phase, resulting in APRA announcing the release of the remaining $500 million operational risk capital overlay, and made progress on the Group's transformation agenda. We delivered 88% of the 2025 UNITE priorities and delivered the first phases of the Westpac One and the BizEdge platforms. We have completed UNITE program discovery and made the decision to consolidate to a single deposit ledger. Overall, our customer experience needs to improve. Consumer NPS improved, with performance at target, but we have more work to do on Business NPS. Pleasingly, Westpac's relationship banking RSI was the highest in 10 years. Our people remain engaged and advocate for Westpac. Our Organisational Health Index score was 80 despite significant restructuring, exceeding our target of 77 and within the top quartile of workplaces globally. We have more to do to improve the representation of women in senior leadership. Executive performance and remuneration outcomes 2025 short term variable reward (STVR) The 2025 Group STVR Scorecard included four key priorities: Financial performance, Strategic execution, Serving customers, and People. This year we increased the weighting of financial performance from 45% to 50% and increased the weighting of the strategic execution category from 15% to 30%, including risk management which was a separate category in 2024. These changes recognise both feedback from investors and our completion of the CORE program. The Board assessed the CEO's STVR outcome at 85% of target. The CEO’s outcome was impacted by below threshold performance on the Group cost base measure. For Group Executives, STVR outcomes ranged from 92% to 102% of target, reflecting the differentiation of performance outcomes for their respective divisions and individual performance. 2022 long term variable reward (LTVR) The 2022 LTVR award was tested against a relative total shareholder return measure. Westpac delivered a total shareholder return of 77% over the four year performance period, resulting in a 62.5th percentile ranking relative to the financial services comparator group. As a result, the CEO and eligible Group Executives received 75% of their 2022 LTVR. It is pleasing that improved performance has led to a partial vesting of the LTVR. This demonstrates the alignment of our remuneration framework with the experience of shareholders. 2025 total target remuneration As foreshadowed in last year’s report, we increased the total target remuneration for four Group Executives. The increases recognised market comparisons and role accountabilities and were implemented for Carolyn McCann (10%), Catherine McGrath (6%), Michael Rowland (2%) and Ryan Zanin (4%). Carolyn McCann has since been appointed Chief Executive, Consumer and received a further 9% increase. |
| FINANCIAL REPORT EXHIBITS INDEX STRATEGIC REVIEW PERFORMANCE REVIEW EXHIBIT 15.4 ADDITIONAL INFORMATION 223 CEO transition and executive leadership team renewal In December 2024, Anthony Miller (previously Chief Executive, Business & Wealth) succeeded Peter King as Westpac’s CEO. In his first year, Anthony has led the renewal of the Executive Team, advanced the implementation of the UNITE program and continued to reorient the organisation to be more customer focused. The new executive leadership team includes both internal and external appointments and the Board is confident we have the team to deliver on the strategy. Total target remuneration for new appointments So that the remuneration of our executives is appropriately positioned, each year we review internal and external benchmarks. Most of our new executive appointments, except for one, have been appointed on packages lower than their predecessors. Further details are included in the Summary of appointment and exit arrangements (page 224). Buy out awards for remuneration foregone In order to secure the talent required, we follow common market practice and provide buy out awards where necessary. When determining buy outs, our key principle is that the candidate should be no better or worse off and only compensated for remuneration foregone. Further details are included in the Summary of appointment and exit arrangements (page 224). Executive notice periods Following a market review we implemented changes to our executive employment agreement. We reduced the notice period required when an executive leaves Westpac from twelve months to six months. This is effective for all new executives that commenced from January 2025. Remuneration for our people Home finance manager pay framework In 2025, we increased the maximum variable reward opportunity for home finance manager roles from 50% to 80% of fixed pay. We made this change to remain competitive, attract talent and reward outperformance. We have made, and continue to make, refinements to the home finance manager pay framework so we remain tightly focused on risk and conduct management. Gender pay We are determined to pay our people fairly and equitably. We have pay equity for like-for-like roles and have reduced our median gender pay gap for total remuneration from 29.3% to 28.1% for the 2024-25 reporting year. There are a range of programs in place to improve gender diversity across levels, including our sponsorship and career development programs for women. There is more to do to ensure the gap continues to reduce. Refer to Creating value for our people (pages 166-169) for further information. Looking ahead 2026 short term variable reward The Board has set the 2026 Group STVR Scorecard to support the delivery of our priorities. We will maintain a 50% weighting to financial performance, with the remaining weightings of the Group STVR Scorecard focused on UNITE, customer, people, risk, and sustainability. In addition, we have added a leadership behaviours modifier in the Group Executive Scorecards aligned to our objectives to 'always deliver, safely', 'make an impact' and 'own it'. 2026 total target remuneration After reviewing market relativities, the Board determined that Catherine McGrath would receive an increase of 6% to her 2026 total target remuneration. There were no other increases as part of the annual remuneration review. CEO minimum shareholding requirement To strengthen the CEO's alignment with shareholders, the Board increased the CEO's minimum shareholding requirement from 200% to 300% of fixed remuneration. This change is effective from 1 October 2025 and Anthony will have a five year accumulation period from the date he was appointed as CEO. We are pleased that Anthony is well progressed in achieving the increased requirement. We hope you find the report informative and always welcome your feedback. Margaret Seale CHAIR BOARD REMUNERATION COMMITTEE CONTENTS 1. Snapshot of remuneration for 2025 225 5. Further detail on executive remuneration arrangements 237 2. Key management personnel 227 6. Non-executive Director remuneration 242 3. 2025 remuneration outcomes and alignment to performance 228 7. Statutory remuneration details 243 4. Remuneration governance 235 |
| 224 WESTPAC GROUP 2025 ANNUAL REPORT DIRECTORS' REPORT SUMMARY OF APPOINTMENT AND EXIT ARRANGEMENTS During the year, the Board appointed new executives to lead Westpac’s next phase of transformation and growth. The appointments include a mix of internal executives, reflecting the depth of talent and capability at Westpac, as well as external executives. Biographies of our executives are outlined in the Executive Team section of the Annual Report. A summary of executive appointment and exit arrangements is outlined below, with further details included throughout the report. KMP APPOINTMENT ARRANGEMENT Anthony Miller Managing Director & Chief Executive Officer • Total target remuneration of $7,875,000 in line with the previous CEO. • Pro rata 2025 LTVR grant and eligible for pro rata 2025 STVR. Kate Dee Chief People Officer • Total target remuneration of $2,600,000. • Buy out award comprising cash and equity components totalling $2,240,820. • Not eligible for 2025 LTVR or STVR. Paul Fowler Chief Executive, Business & Wealth • Total target remuneration of $3,550,000. • Buy out award comprising cash and equity components totalling $2,882,409. • Pro rata 2025 LTVR grant and eligible for pro rata 2025 STVR. Nathan Goonana Chief Financial Officer • Total target remuneration of $3,900,000. • Buy out award comprising cash and equity components estimated at $7,830,093. Peter Herbert Chief Transformation Officer • Total target remuneration of $2,700,000 as Chief Transformation Officer. • Total target remuneration of $2,100,000 as Acting Chief Executive, Business & Wealth. • Pro rata 2025 LTVR grant and eligible for pro rata 2025 STVR. Carolyn Hoy Acting Group Executive, Customer & Corporate Services • Total target remuneration of $1,700,000. • Pro rata 2025 LTVR grant and eligible for pro rata 2025 STVR. Carolyn McCann Chief Executive, Consumer • Total target remuneration of $4,028,000 as Chief Executive, Consumer. • Total target remuneration of $3,925,000 as Acting Chief Executive, Consumer. • Pro rata 2025 LTVR grant and eligible for pro rata 2025 STVR. Megan Rutter Acting Group Executive, Human Resources • Total target remuneration of $1,525,000. • Pro rata 2025 LTVR grant and eligible for pro rata 2025 STVR. • Ceased as an Acting Group Executive on 4 August 2025. a. Nathan Goonan commenced on 22 September 2025 as an Enterprise Executive and was not considered a KMP for 2025. For the period 22 to 30 September 2025, Nathan received fixed remuneration of $33,244. Nathan was not eligible for any variable remuneration while in the Enterprise Executive role. Nathan commenced as Chief Financial Officer on 8 October 2025. The total value of Nathan's buy out is subject to confirmation prior to being awarded. Further details will be disclosed in the 2026 Remuneration Report. FORMER KMP EXIT ARRANGEMENT Peter King Former Managing Director & Chief Executive Officer • Notice period in line with contractual requirements. • Eligible for pro rata 2025 STVR. • Not eligible for 2025 LTVR. • Unvested equity remains on foot. Christine Parker Former Group Executive, Human Resources • Notice period in line with contractual requirements. • Eligible for pro rata 2025 STVR. • Unvested equity remains on foot. Michael Rowlanda Former Chief Financial Officer • Notice period in line with contractual requirements. • Eligible for pro rata 2026 STVR. • Not eligible for 2026 LTVR. • Unvested equity remains on foot. Jason Yetton Former Chief Executive, Consumer • Notice period in line with contractual requirements. • Eligible for pro rata 2025 STVR. • Unvested equity remains on foot. a. Michael Rowland is due to leave Westpac on 12 December 2025 and is included as a KMP for the full year in the 2025 Remuneration Report. |
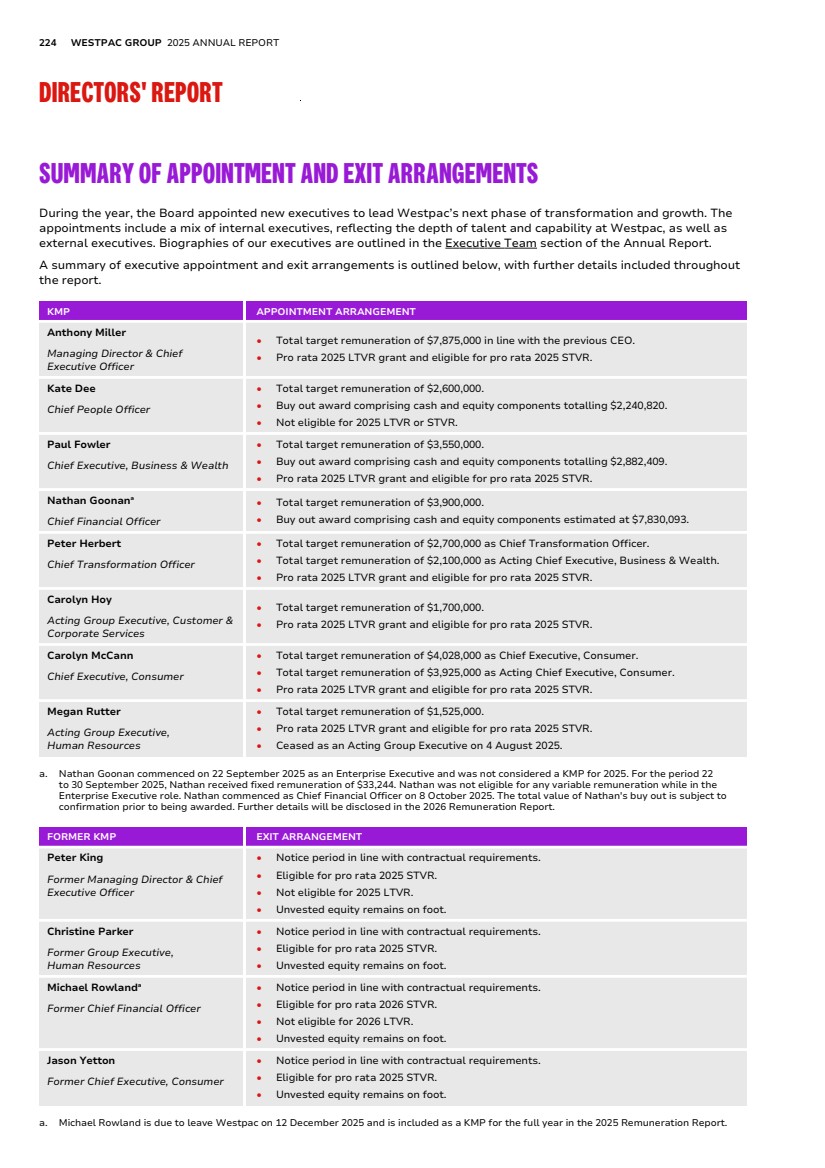
| FINANCIAL REPORT EXHIBITS INDEX STRATEGIC REVIEW PERFORMANCE REVIEW EXHIBIT 15.4 ADDITIONAL INFORMATION 225 1. Snapshot of remuneration for 2025 OUR REMUNERATION STRATEGY AND PRINCIPLES Our remuneration strategy is to attract and retain talented employees. We reward them for achieving high performance and delivering superior long term results for our customers and shareholders. Promote our purpose, values and behaviours Align with our strategy and create sustainable shareholder value Offer market competitive and equitable pay Reward financial and non-financial performance including customer outcomes and risk excellence Reinforce our risk and conduct expectations OUR EXECUTIVE REMUNERATION FRAMEWORK Our executive remuneration framework is designed to align with our strategy, market practice, investor expectations and compliance with Prudential Standard CPS 511 Remuneration (CPS 511). The minimum shareholding requirement is equivalent to two times fixed remuneration for the CEO and one times fixed remuneration for the Group Executives. The minimum shareholding requirement for the CEO will increase to three times fixed remuneration from 1 October 2025. Refer to Section 5.6 for further details. REMUNERATION MIX The remuneration mix is designed with a significant proportion of total remuneration at risk and based on performance. The graphic below sets out the maximum remuneration mix1 showing the relative proportion of each component in the executive remuneration framework as a percentage of total maximum opportunity. Refer to Section 5 for further details of executive remuneration arrangements. 1. The mix shown in the graphic above applies to all individuals in KMP roles with the exception of the Chief Financial Officer (Michael Rowland) and the Chief Risk Officer (Ryan Zanin). Their maximum remuneration mix is comprised of 33% fixed remuneration, 31% maximum STVR, 18% LTVR restricted rights and 18% LTVR performance rights. These roles will transition to the above remuneration mix over time. |
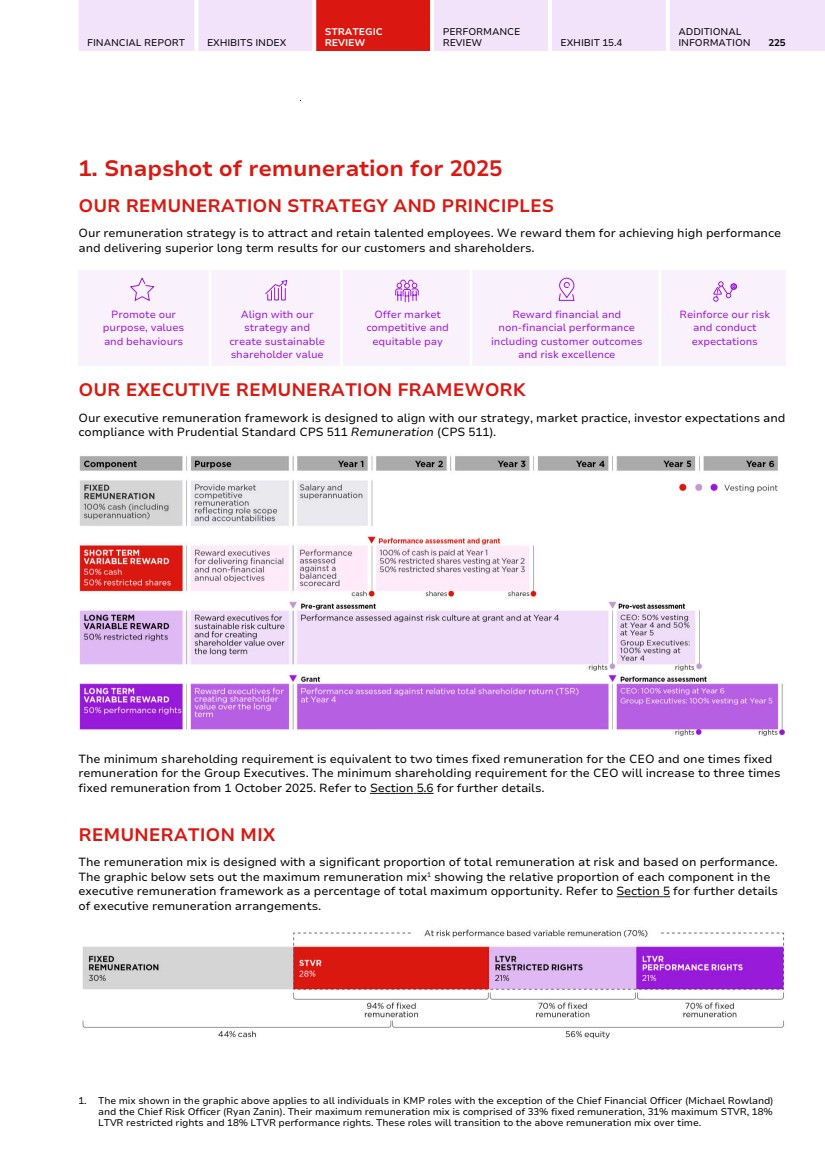
| 226 WESTPAC GROUP 2025 ANNUAL REPORT DIRECTORS' REPORT PERFORMANCE SNAPSHOT Financial performance $6,972m NPAT excluding Notable Items 10.97% ROTE excluding Notable Items Strategic execution 88% UNITE 2025 priorities delivered $500m operational risk capital release Serving customers +1 in Consumer NPS -5 in Business NPS relative to major bank average change 21% reduction in losses from scams People 80 Organisational Health Index score 48.6% women in senior leadership Performance achieved Target Further detail on performance against all measures of the Group STVR Scorecard is set out in Section 3.3. REMUNERATION OUTCOMES 85% CEO's 2025 STVR outcome as a % of target, or 68% as a % of maximum. 92% to 102% Group Executive STVR outcomes range of STVR outcomes as a % of target, or 74% to 82% as % of maximum. 75% LTVR vesting outcome 2022 LTVR vesting outcome. Reflects a TSR of 77% over the four year performance period. |
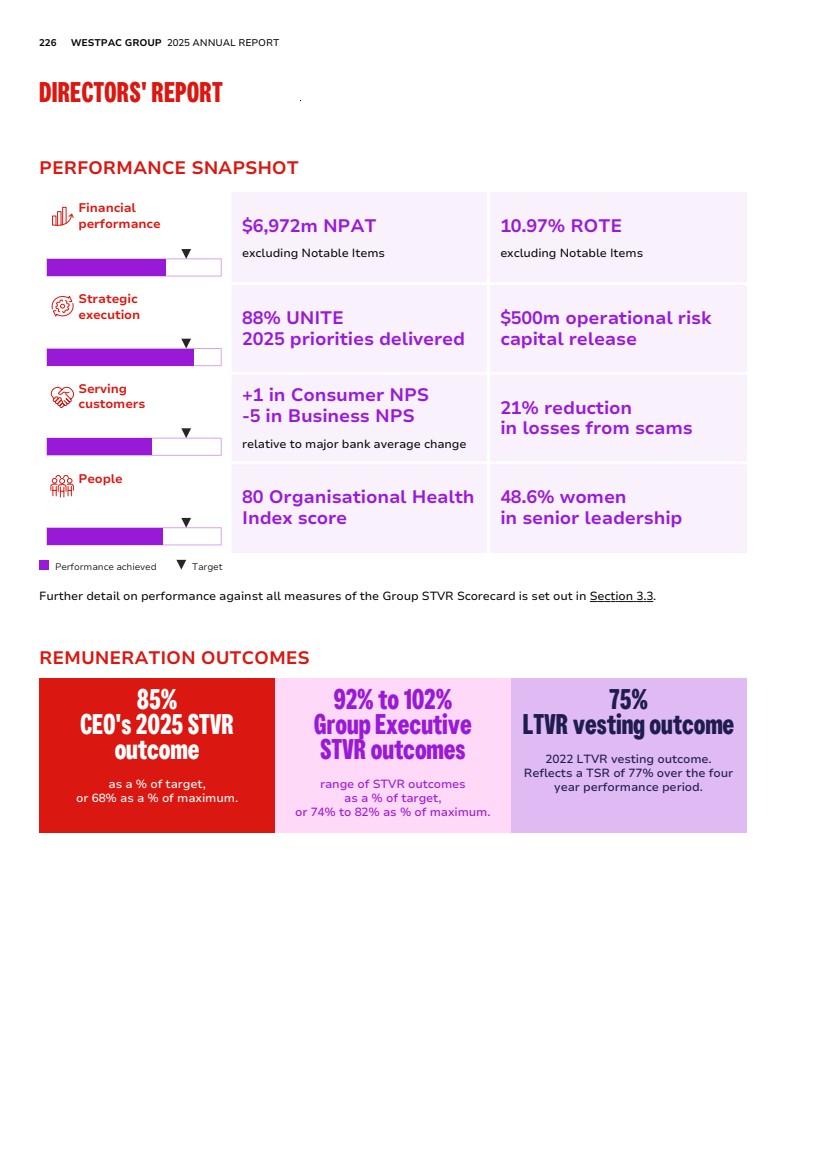
| FINANCIAL REPORT EXHIBITS INDEX STRATEGIC REVIEW PERFORMANCE REVIEW EXHIBIT 15.4 ADDITIONAL INFORMATION 227 2. Key management personnel (KMP) The remuneration of KMP for 2025 is disclosed in this report. KMP are defined as those persons that have the authority and responsibility for planning, directing and controlling the activities of an entity, directly or indirectly, including any Director (whether executive or otherwise) of that entity. Name Position Term as KMP Managing Director & Chief Executive Officer Anthony Millera Managing Director & Chief Executive Officer Full year Group Executives Scott Collary Chief Information Officer Full year Kate Dee Chief People Officer Commenced on 5 August 2025 Paul Fowler Chief Executive, Business & Wealth Commenced on 12 May 2025 Peter Herbertb Chief Transformation Officer Commenced on 5 November 2024 Carolyn Hoy Acting Group Executive, Customer & Corporate Services Commenced on 12 May 2025 Nell Hutton Chief Executive, Westpac Institutional Bank Full year Carolyn McCannc Chief Executive, Consumer Full year Catherine McGrath Chief Executive Officer, Westpac New Zealand Full year Michael Rowland Chief Financial Officer Full year Ryan Zanin Chief Risk Officer Full year Former Executives Peter King Managing Director & Chief Executive Officer Ceased on 15 December 2024 Christine Parker Group Executive, Human Resources Ceased on 1 June 2025 Megan Rutter Acting Group Executive, Human Resources Commenced on 2 June 2025 and ceased on 4 August 2025 Jason Yetton Chief Executive, Consumer Ceased on 11 May 2025 Current Non-executive Directors Steven Gregg Chair Full year Tim Burroughs Director Full year Nerida Caesar Director Full year David Cohen Director Commenced on 1 April 2025 Pip Greenwood Director Commenced on 1 August 2025 Debra Hazelton Director Commenced on 4 March 2025 Andy Maguire Director Full year Peter Nash Director Full year Margaret Seale Director Full year Michael Ullmer AO Director Full year Former Non-executive Directors Nora Scheinkestel Director Retired on 6 November 2024 Audette Exel AO Director Retired on 13 December 2024 a. Anthony Miller was the Chief Executive, Business & Wealth until 4 November 2024 after which he was appointed as the Chief Executive Officer Designate on 5 November 2024 while remaining on the same remuneration arrangements. Anthony Miller was then appointed as the Managing Director & Chief Executive Officer effective 16 December 2024. Anthony's remuneration for all three roles is aggregated and disclosed together for the year. b. Peter Herbert was appointed the Acting Chief Executive, Business & Wealth on 5 November 2024. On 3 March 2025, Peter Herbert was appointed the Chief Transformation Officer whilst continuing as the Acting Chief Executive, Business & Wealth until Paul Fowler commenced. c. Carolyn McCann was the Group Executive, Customer & Corporate Services until she was appointed as the Acting Chief Executive, Consumer on 12 May 2025. Carolyn was appointed Chief Executive, Consumer on 12 August 2025. |
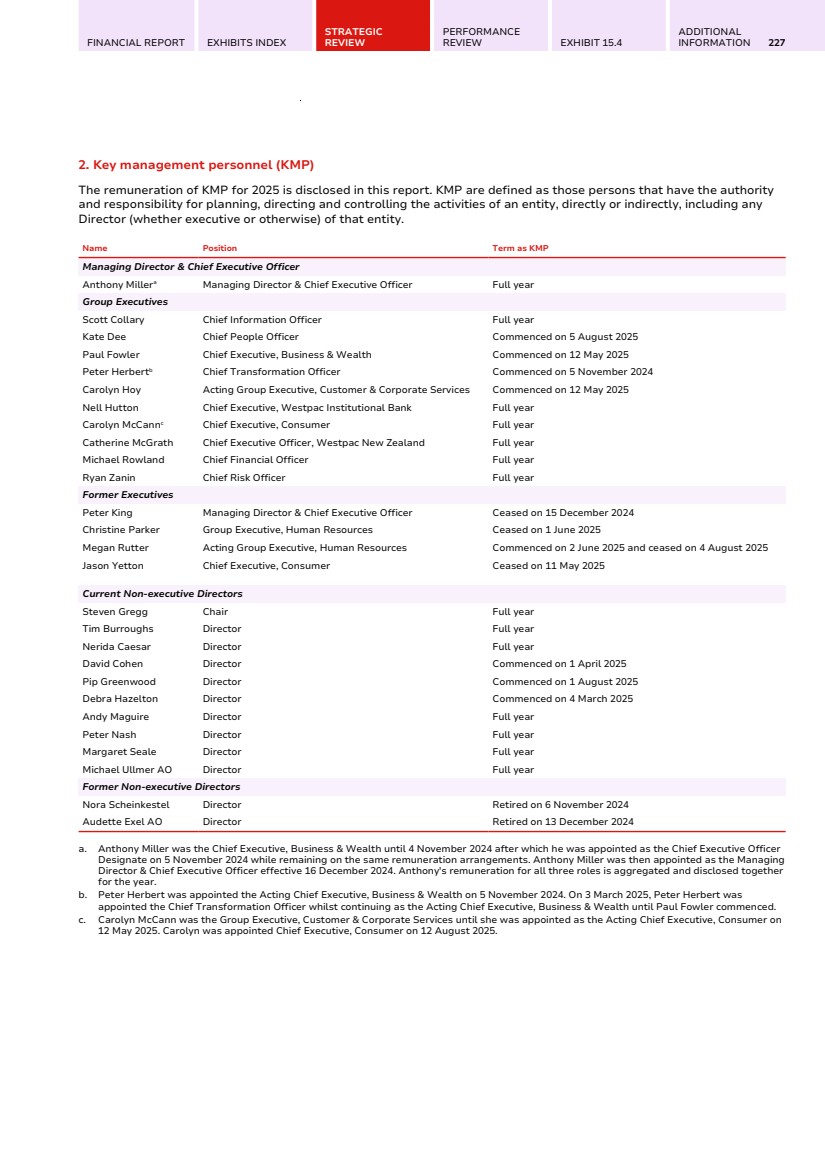
| 228 WESTPAC GROUP 2025 ANNUAL REPORT DIRECTORS' REPORT 3. 2025 remuneration outcomes and alignment to performance 3.1. Group performance The table below summarises variable reward outcomes and Group performance over the last five years. Years ended 30 September 2025 2024 2023 2022 2021 CEO STVR outcome (% of maximum)a 68% 83% 60% 52% 47% CEO STVR outcome (% of target)b 85% 104% 90% 78% 70% Average Group Executive STVR outcome (% of maximum)a 75% 82% 60% 53% 48% Average Group Executive STVR outcome (% of target)b 94% 102% 89% 79% 73% LTVR outcome (% vested) 75% 50% 0% 0% 0% Net profit after tax attributable to owners of WBC ($m) 6,916 6,990 7,195 5,694 5,458 Net profit after tax (excluding Notable Items) ($m)c 6,972 7,113 7,368 6,568 6,953 Return on tangible equity (ROTE) (statutory basis) 10.89% 11.01% 11.39% 9.17% 8.82% Return on tangible equity (ROTE) (excluding Notable Items)c 10.97% 11.21% 11.67% 10.58% 11.23% TSR – four years 77.11% 113.10% (9.27%) (11.15%) (1.95%) TSR – five years 168.98% 34.24% (4.05%) (13.82%) 10.34% Total ordinary dividend (cents per share) 153 151 142 125 118 Special dividend (cents per share) 0 15 0 0 0 Share price – close $38.97 $31.72 $21.15 $20.64 $26.00 a. From 2024, maximum STVR opportunity was reduced from 150% to 125% of target STVR. b. From 2024, target STVR opportunity was reduced from approximately 100% to 75% of fixed remuneration for business roles, and maintained at 75% for functional roles. c. For additional information refer to the Non-AAS financial measures section of the Annual Report for a reconciliation of these measures. 3.2. 2022 LTVR vesting outcome We tested the 2022 LTVR on 1 October 2025. Our TSR for the four year performance period was 77% resulting in a 62.5th percentile ranking relative to the comparator group. This resulted in 75% of the 2022 LTVR award vesting. Performance hurdle Performance start date Test date Performance range Outcome % Vested % Threshold Maximum Lapsed Relative TSR (100% of award) 1 October 2021 1 October 2025 Percentile ranking is at the median Percentile ranking is at the 75th percentile or higher 62.5th percentile ranking relative to the comparator group 75% 25% NPAT (EXCLUDING NOTABLE ITEMS) AND CEO STVR OUTCOME NPAT (excluding Notable Items)($m) CEO STVR (%) NPAT (excluding Notable Items)($m) CEO STVR outcome (% of target) CEO STVR outcome (% of maximum) 2021 2022 2023 2024 2025 0 2,000 4,000 6,000 8,000 40 60 80 100 120 ROTE (EXCLUDING NOTABLE ITEMS) AND CEO STVR OUTCOME ROTE (excluding Notable Items)(%) CEO STVR (%) ROTE (excluding Notable Items)(%) CEO STVR outcome (% of target) CEO STVR outcome (% of maximum) 2021 2022 2023 2024 2025 0 4 8 12 40 60 80 100 120 TSR (Four year period ending 30 September 2025) TSR (%) WBC Peer 1 Peer 2 Peer 3 2022 2023 2024 2025 -40 0 40 80 120 TSR AND LTVR VESTING OUTCOME (Percentile rank over the prior four year period) TSR over 4 years (percentile rank) LTVR award (% vested) TSR over four years (percentile rank) LTVR award (% vested) 2021 2022 2023 2024 2025 0 40 80 20 60 100 0 40 80 20 60 100 |
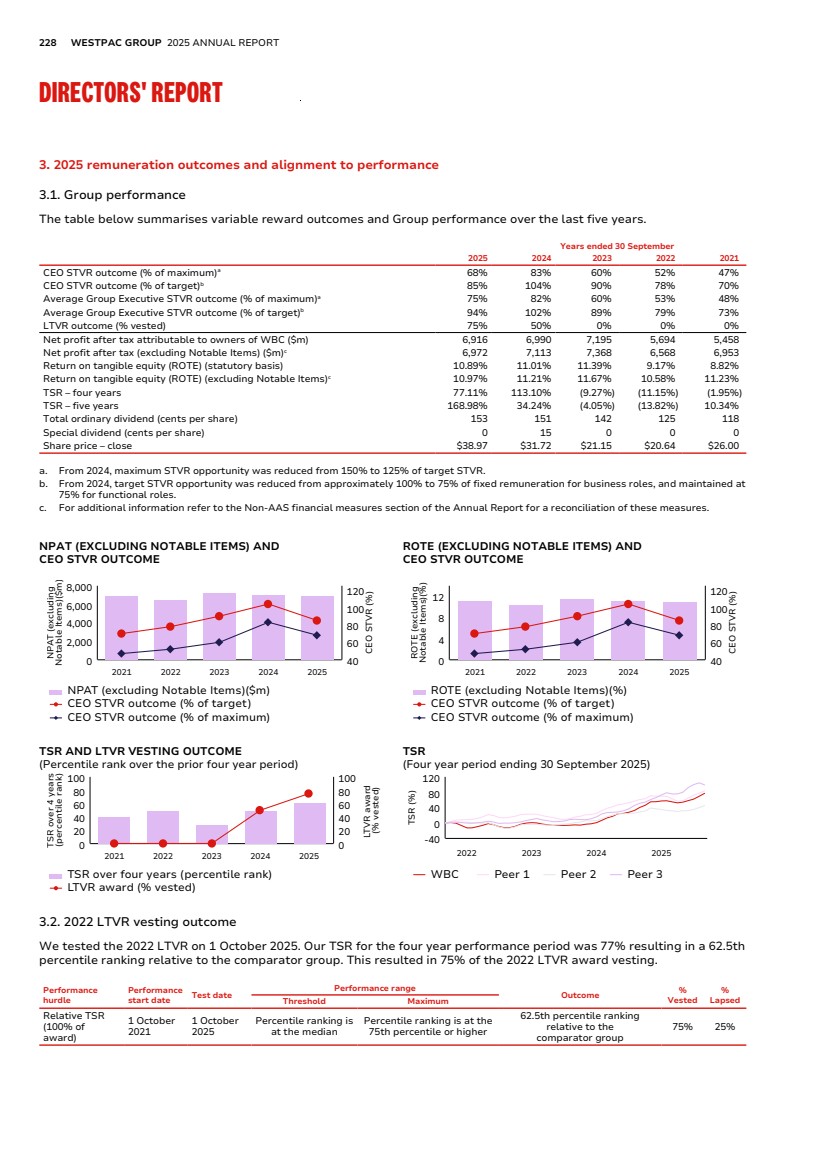
| FINANCIAL REPORT EXHIBITS INDEX STRATEGIC REVIEW PERFORMANCE REVIEW EXHIBIT 15.4 ADDITIONAL INFORMATION 229 3.3. 2025 Group STVR Scorecard The Group’s priorities are set out in the Group STVR Scorecard, which forms part of the CEO’s Scorecard. Common elements appear in Group Executive Scorecards together with individual objectives reflecting divisional measures. For 2025, we increased the financial performance weighting from 45% to 50% to emphasise our focus on delivering value. Risk measures were included within the ‘Strategic execution’ category, which was weighted at 30%. A summary of the performance assessment is provided below and is designed to be read over two pages. Where appropriate, individual measures have been assessed against a Threshold, Target and Stretch rating scale as outlined in the key. Each priority has also been assessed in totality using the same key. Key priority Measure Outcome Outcome commentary Key: Threshold 50-99% Stretch 101-125% Target 100% Performance assessment Financial performance (50%) Deliver current year financial performance (excluding Notable Items): • Net profit after tax -5% $6,971m +5% $6,972m result was at target. We delivered sound financial results against our targets. NPAT (excluding Notable Items) was at target and ROTE (excluding Notable Items) was narrowly below target, supported by a lower credit impairment charge and a higher than targeted net interest margin. Pre-provision profit was below target and our cost base was below threshold. We made decisions in the long term interest of Westpac which necessitated a period of elevated expense growth, including restructuring costs and an increase in UNITE investment spend. As a result, expenses were 3% adverse to target. We have a long-term focus on balance sheet strength with key metrics including the Common Equity Tier 1 capital ratio, Net Stable Funding Ratio, and Liquidity Coverage Ratio all above target operating ranges. Our strong balance sheet position provided us the capacity for dividends to be at the top end of the payout range. We have gained momentum in Australian business lending which increased to 1.37x of ADI financial system growth, which was at stretch. We maintained pricing disciplines and provided consistent service delivery in Australian mortgages with growth at 0.84x of ADI financial system, which was at target. We assessed Financial performance at below target. • Pre-provision profit -5% $10,901m +5% $10,548m result was below target. • Return on tangible equity -5% 11.05% +5% 10.97% result was below target. • Cost base +2% $11,618 -2% $11,916m result was below threshold. Grow market share in key segments compared to system growth <0.8x 0.8x >1x Growth in Australian mortgages was 0.84x of ADI financial system growth, which was at target. 0.8x 1.0x 1.2x Growth in Australian business lending was 1.37x of ADI financial system growth, which was at stretch. Strategic execution (30%) Demonstrate sustainability and effectiveness of the CORE outcomes through the transition phase - Target - On target completion of transition phase as assessed by Promontory, and APRA announced the release of the remaining operational risk capital overlay. Our people have embraced excellence in risk management, demonstrated by our improved risk culture, governance and accountability through the CORE program. We successfully completed the transition phase and APRA announced the release of the remaining $500 million operational risk capital overlay. We made progress with the Group’s transformation agenda, and we are focused on executing UNITE, delivering 88% of 2025 UNITE priorities. The program scope is now finalised and we have embedded a new operating model under the Chief Transformation Officer. This included repointing and co-locating key UNITE resources to support delivery, efficiency, and clear accountability. On broader strategic transformation, we made demonstrable progress in improving our capabilities including the Westpac One transaction banking platform and our BizEdge platform. We have reduced customer losses from scams and the number of days to refund customers for fraud events, both achieving stretch performance. On demonstrating our sustainability and climate strategy, we increased our sustainable lending (total committed exposures and balances) to $39.4bn while we facilitated $6.3bn in bonds in 2025 aligned to our sustainable finance framework. We have engaged 109 institutional customers and 158 commercial customers to support their decarbonisation plans. We assessed Strategic execution at above target. Deliver the 2025 UNITE program priorities and change initiatives to transform the bank - Target - Significant delivery of 2025 UNITE priorities and the BizEdge and Westpac One platforms. Progress our sustainability and climate strategies - Target - Customer losses from scams reduced by 21% and days to refund fraud reduced to <5 days, which was at stretch. $39.4bn of lending at 30 September 2025 and $6.3bn bond facilitation over 2025 for sustainable finance. Serving customers (10%) Improve customer advocacy of Westpac (measured in points relative to major bank average change) 0 +1 +2 Consumer NPS was +1 relative to the major bank average change, which was at target. We want to be our customers' number one bank and took significant steps this year to deliver on our strategy. Australian Consumer NPS increased +1 more than the major bank average change, achieving target. Business NPS although up year on year, disappointingly was behind the major bank average change. Westpac New Zealand Consumer NPS improved +9 (+5 compared to the major bank average change). Our mobile banking app was #1 for the third year in a row as rated by Forrester. Both branch experience and mobile banking maintained their position in major bank NPS rankings (source: Mozart Proprietary Market Study) however were assessed as below target. We have more to do to improve our customers' channel experience across branches and our mobile banking app. Westpac's relationship banking RSI (source: Coalition Greenwich Voice of Client 2025 Large Corporate Relationship Banking Study) was the highest in 10 years and achieved stretch performance. We have mobilised our customer journeys multi year program resulting in time savings for our customers and our people. We assessed Serving customers at below target. +1 +2 +3 Business NPS was -5 relative to the major bank average change, which was below threshold. Improve customer experience of our products, service and channel propositions (measured against major banks) - Target - Westpac branch NPS was #1 relative to other major banks. Westpac mobile app NPS was equal #2 relative to other major banks. People (10%) Maintain top quartile organisation health through Organisational Health Index (OHI) - 77 80 Westpac Group OHI was 80 maintaining our position in the top quartile resulting in stretch performance. We want to be the #1 place to work and we are refreshing our employee value proposition focused on learning and development, employee banking, and health and wellbeing. We set ourselves a high benchmark and achieved top quartile for organisational health with an OHI score of 80, demonstrating that our people remain engaged and our employees are advocates for Westpac. Women in senior leadership was at 48.6% at the end of 2025, which was marginally below the threshold of 48.8%. We continue to invest in building a pipeline of leaders through our development programs for women. We assessed People at below target. Improve representation of women in senior leadership 48.8% 50% >51% Women in senior leadership was 48.6% resulting in below threshold performance. OVERALL GROUP STVR SCORECARD PERFORMANCE ASSESSMENT 85% OF TARGET 68% OF MAXIMUM The Group STVR Scorecard has a modifier that allows the Board to take into account risk and reputation, people risk management and any other matters as determined by the Board. Refer to Section 3.5 for further detail on individual outcomes. |
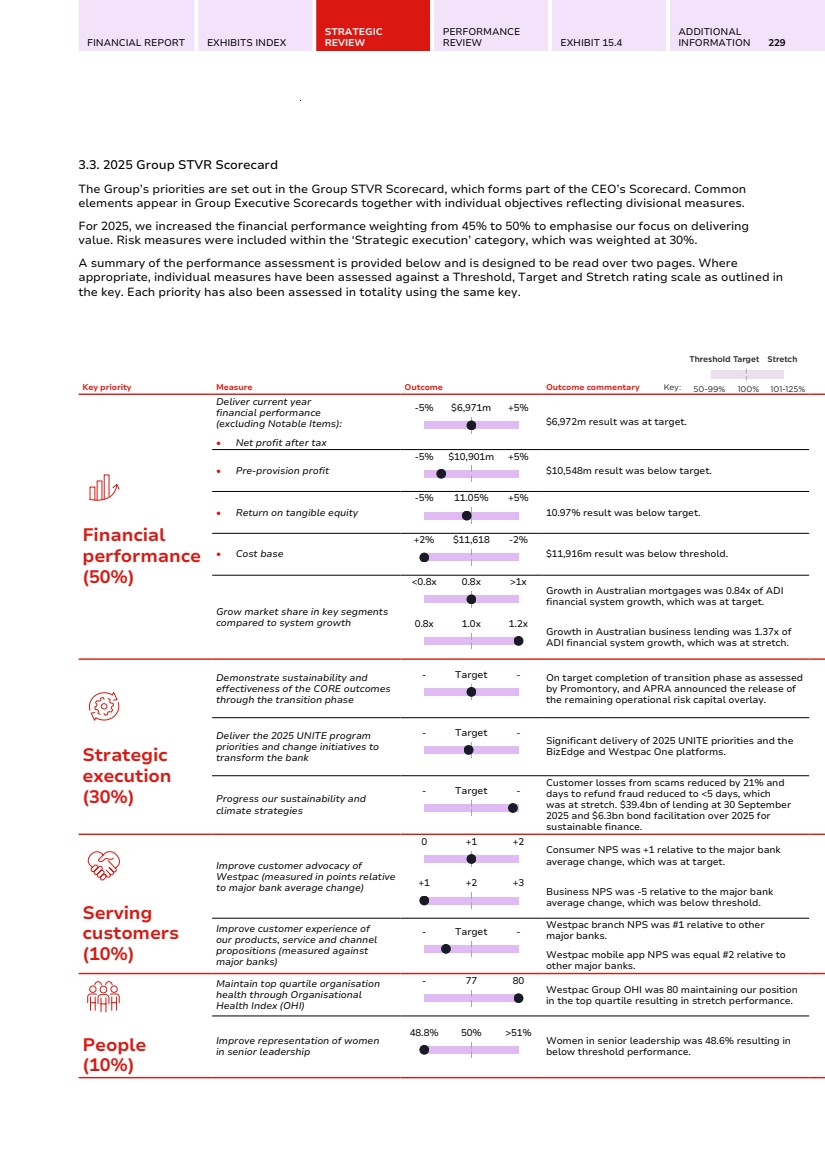
| 230 WESTPAC GROUP 2025 ANNUAL REPORT DIRECTORS' REPORT Overview of how STVR outcomes are determined Target STVR × Scorecard assessment ± Scorecard modifier = Final STVR outcome 75% of fixed remuneration Performance against Westpac and divisional measures Accounts for any aspect of performance not reflected in the Scorecard 50% delivered as deferred equity for shareholder alignment The Board has discretion to adjust all variable reward downwards, including to zero. Significant risk, compliance or conduct matters are assessed against our guidelines, independent of the STVR assessment. Key priority Measure Outcome Outcome commentary Key: Threshold 50-99% Stretch 101-125% Target 100% Performance assessment Financial performance (50%) Deliver current year financial performance (excluding Notable Items): • Net profit after tax -5% $6,971m +5% $6,972m result was at target. We delivered sound financial results against our targets. NPAT (excluding Notable Items) was at target and ROTE (excluding Notable Items) was narrowly below target, supported by a lower credit impairment charge and a higher than targeted net interest margin. Pre-provision profit was below target and our cost base was below threshold. We made decisions in the long term interest of Westpac which necessitated a period of elevated expense growth, including restructuring costs and an increase in UNITE investment spend. As a result, expenses were 3% adverse to target. We have a long-term focus on balance sheet strength with key metrics including the Common Equity Tier 1 capital ratio, Net Stable Funding Ratio, and Liquidity Coverage Ratio all above target operating ranges. Our strong balance sheet position provided us the capacity for dividends to be at the top end of the payout range. We have gained momentum in Australian business lending which increased to 1.37x of ADI financial system growth, which was at stretch. We maintained pricing disciplines and provided consistent service delivery in Australian mortgages with growth at 0.84x of ADI financial system, which was at target. We assessed Financial performance at below target. • Pre-provision profit -5% $10,901m +5% $10,548m result was below target. • Return on tangible equity -5% 11.05% +5% 10.97% result was below target. • Cost base +2% $11,618 -2% $11,916m result was below threshold. Grow market share in key segments compared to system growth <0.8x 0.8x >1x Growth in Australian mortgages was 0.84x of ADI financial system growth, which was at target. 0.8x 1.0x 1.2x Growth in Australian business lending was 1.37x of ADI financial system growth, which was at stretch. Strategic execution (30%) Demonstrate sustainability and effectiveness of the CORE outcomes through the transition phase - Target - On target completion of transition phase as assessed by Promontory, and APRA announced the release of the remaining operational risk capital overlay. Our people have embraced excellence in risk management, demonstrated by our improved risk culture, governance and accountability through the CORE program. We successfully completed the transition phase and APRA announced the release of the remaining $500 million operational risk capital overlay. We made progress with the Group’s transformation agenda, and we are focused on executing UNITE, delivering 88% of 2025 UNITE priorities. The program scope is now finalised and we have embedded a new operating model under the Chief Transformation Officer. This included repointing and co-locating key UNITE resources to support delivery, efficiency, and clear accountability. On broader strategic transformation, we made demonstrable progress in improving our capabilities including the Westpac One transaction banking platform and our BizEdge platform. We have reduced customer losses from scams and the number of days to refund customers for fraud events, both achieving stretch performance. On demonstrating our sustainability and climate strategy, we increased our sustainable lending (total committed exposures and balances) to $39.4bn while we facilitated $6.3bn in bonds in 2025 aligned to our sustainable finance framework. We have engaged 109 institutional customers and 158 commercial customers to support their decarbonisation plans. We assessed Strategic execution at above target. Deliver the 2025 UNITE program priorities and change initiatives to transform the bank - Target - Significant delivery of 2025 UNITE priorities and the BizEdge and Westpac One platforms. Progress our sustainability and climate strategies - Target - Customer losses from scams reduced by 21% and days to refund fraud reduced to <5 days, which was at stretch. $39.4bn of lending at 30 September 2025 and $6.3bn bond facilitation over 2025 for sustainable finance. Serving customers (10%) Improve customer advocacy of Westpac (measured in points relative to major bank average change) 0 +1 +2 Consumer NPS was +1 relative to the major bank average change, which was at target. We want to be our customers' number one bank and took significant steps this year to deliver on our strategy. Australian Consumer NPS increased +1 more than the major bank average change, achieving target. Business NPS although up year on year, disappointingly was behind the major bank average change. Westpac New Zealand Consumer NPS improved +9 (+5 compared to the major bank average change). Our mobile banking app was #1 for the third year in a row as rated by Forrester. Both branch experience and mobile banking maintained their position in major bank NPS rankings (source: Mozart Proprietary Market Study) however were assessed as below target. We have more to do to improve our customers' channel experience across branches and our mobile banking app. Westpac's relationship banking RSI (source: Coalition Greenwich Voice of Client 2025 Large Corporate Relationship Banking Study) was the highest in 10 years and achieved stretch performance. We have mobilised our customer journeys multi year program resulting in time savings for our customers and our people. We assessed Serving customers at below target. +1 +2 +3 Business NPS was -5 relative to the major bank average change, which was below threshold. Improve customer experience of our products, service and channel propositions (measured against major banks) - Target - Westpac branch NPS was #1 relative to other major banks. Westpac mobile app NPS was equal #2 relative to other major banks. People (10%) Maintain top quartile organisation health through Organisational Health Index (OHI) - 77 80 Westpac Group OHI was 80 maintaining our position in the top quartile resulting in stretch performance. We want to be the #1 place to work and we are refreshing our employee value proposition focused on learning and development, employee banking, and health and wellbeing. We set ourselves a high benchmark and achieved top quartile for organisational health with an OHI score of 80, demonstrating that our people remain engaged and our employees are advocates for Westpac. Women in senior leadership was at 48.6% at the end of 2025, which was marginally below the threshold of 48.8%. We continue to invest in building a pipeline of leaders through our development programs for women. We assessed People at below target. Improve representation of women in senior leadership 48.8% 50% >51% Women in senior leadership was 48.6% resulting in below threshold performance. OVERALL GROUP STVR SCORECARD PERFORMANCE ASSESSMENT 85% OF TARGET 68% OF MAXIMUM The Group STVR Scorecard has a modifier that allows the Board to take into account risk and reputation, people risk management and any other matters as determined by the Board. Refer to Section 3.5 for further detail on individual outcomes. |
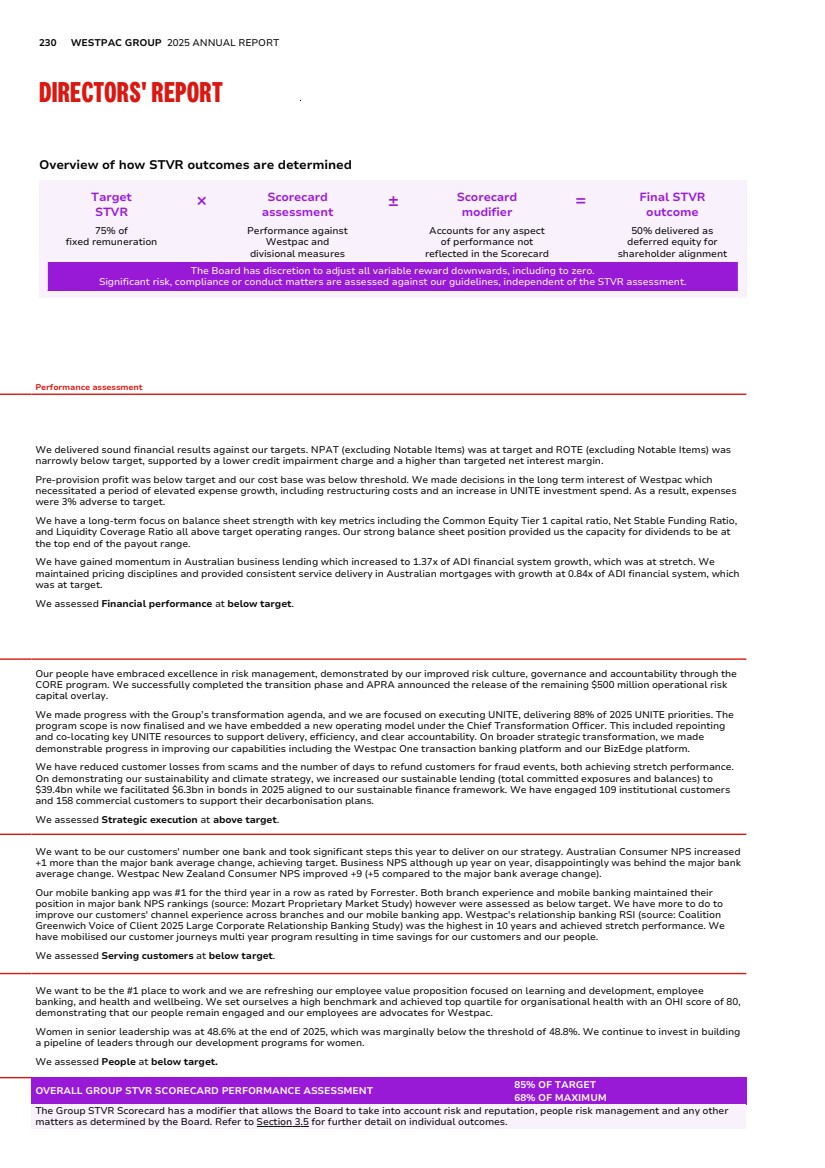
| FINANCIAL REPORT EXHIBITS INDEX STRATEGIC REVIEW PERFORMANCE REVIEW EXHIBIT 15.4 ADDITIONAL INFORMATION 231 |

| 232 WESTPAC GROUP 2025 ANNUAL REPORT DIRECTORS' REPORT 3.4. Total realised remuneration – Chief Executive Officer and Group Executives The table below details the actual remuneration paid and equity1 that vested or lapsed for KMP roles in relation to 2025 and 2024. For 2025, this includes the 2022 LTVR award and for 2024, this includes the 2021 LTVR award. Termination payments and buy out awards are not included. This table is not prepared in accordance with Australian Accounting Standards which differs from the disclosure in Section 7. Fixed remuneration Cash STVR payments Vesting of prior year deferred STVR awards Vesting of prior year LTVR awards Total realised remuneration Prior year LTVR lapsed Name $ $ $ $ $ $ Managing Director & Chief Executive Officer Anthony Miller, Managing Director & Chief Executive Officera 2025 2,250,412 718,500 792,896 2,434,849 6,196,657 811,616 2024 1,277,944 478,000 706,795 1,925,462 4,388,201 1,925,462 Group Executives Scott Collary, Chief Information Officer 2025 1,300,279 445,500 725,293 2,548,098 5,019,170 849,366 2024 1,293,976 508,500 706,444 1,927,412 4,436,332 1,927,412 Kate Dee, Chief People Officer 2025 129,809 - - - 129,809 - 2024 --------------------- Not a KMP in 2024 --------------------- Paul Fowler, Chief Executive, Business & Wealtha 2025 442,256 151,500 - - 593,756 - 2024 --------------------- Not a KMP in 2024 --------------------- Peter Herbert, Chief Transformation Officer 2025 775,066 300,400 - - 1,075,466 - 2024 --------------------- Not a KMP in 2024 --------------------- Carolyn Hoy, Acting Group Executive, Customer & Corporate Services 2025 323,561 112,800 - - 436,361 - 2024 --------------------- Not a KMP in 2024 --------------------- Nell Hutton, Chief Executive, Westpac Institutional Bank 2025 1,283,715 464,000 296,565 - 2,044,280 - 2024 1,278,338 502,000 - - 1,780,338 - Carolyn McCann, Chief Executive, Consumer 2025 1,206,295 438,000 575,951 1,512,103 3,732,349 504,034 2024 1,062,447 437,500 484,098 1,149,441 3,133,486 1,269,346 Catherine McGrath, Chief Executive Officer, Westpac New Zealand 2025 1,032,402 345,588 522,100 1,625,544 3,525,634 541,822 2024 981,129 311,189 502,028 - 1,794,346 - Michael Rowland, Chief Financial Officer 2025 1,303,016 448,500 668,746 1,970,529 4,390,791 656,843 2024 1,274,390 500,500 577,773 1,588,668 3,941,331 1,588,636 Ryan Zanin, Chief Risk Officera 2025 1,774,107 677,000 818,858 1,182,603 4,452,568 394,175 2024 1,699,186 674,000 504,105 - 2,877,291 - Former Executives Peter King, Managing Director & Chief Executive Officer 2025 517,836 132,800 1,515,993 3,680,625 5,847,254 1,226,862 2024 2,502,920 975,000 1,442,898 2,990,401 7,911,219 3,314,178 Christine Parker, Group Executive, Human Resources 2025 696,615 239,500 573,871 1,768,954 3,278,940 589,626 2024 1,041,206 417,000 513,821 1,459,709 3,431,736 1,459,677 Megan Rutter, Acting Group Executive, Human Resources 2025 134,374 40,800 - - 175,174 - 2024 --------------------- Not a KMP in 2024 --------------------- Jason Yetton, Chief Executive, Consumer 2025 781,121 268,500 772,210 2,434,849 4,256,680 811,616 2024 1,277,944 443,000 782,285 2,009,165 4,512,394 3,432,493 a. In addition, some individuals received remuneration in relation to a buy out award: Anthony Miller received a deferred cash payment of $181,250 in March 2025 and had 9,676 restricted shares vest in March 2025; Paul Fowler received a deferred cash payment of $258,904 in September 2025 and had 22,700 restricted shares vest in September 2025; and Ryan Zanin received deferred cash payments of $64,623 in October 2024 and $64,623 in January 2025. 1. The value of deferred STVR is based on the number of restricted shares or share rights multiplied by the five day volume weighted average price (VWAP) up to and including the scheduled date of vesting for 2024 figures, and up to 1 October 2025 for the 2025 figures. The value of LTVR is based on the number of share rights multiplied by the five day VWAP up to and including the scheduled date of testing. Ryan Zanin’s 2022 LTVR award vesting outcome was 75% and the deferral period ends in February 2026. |
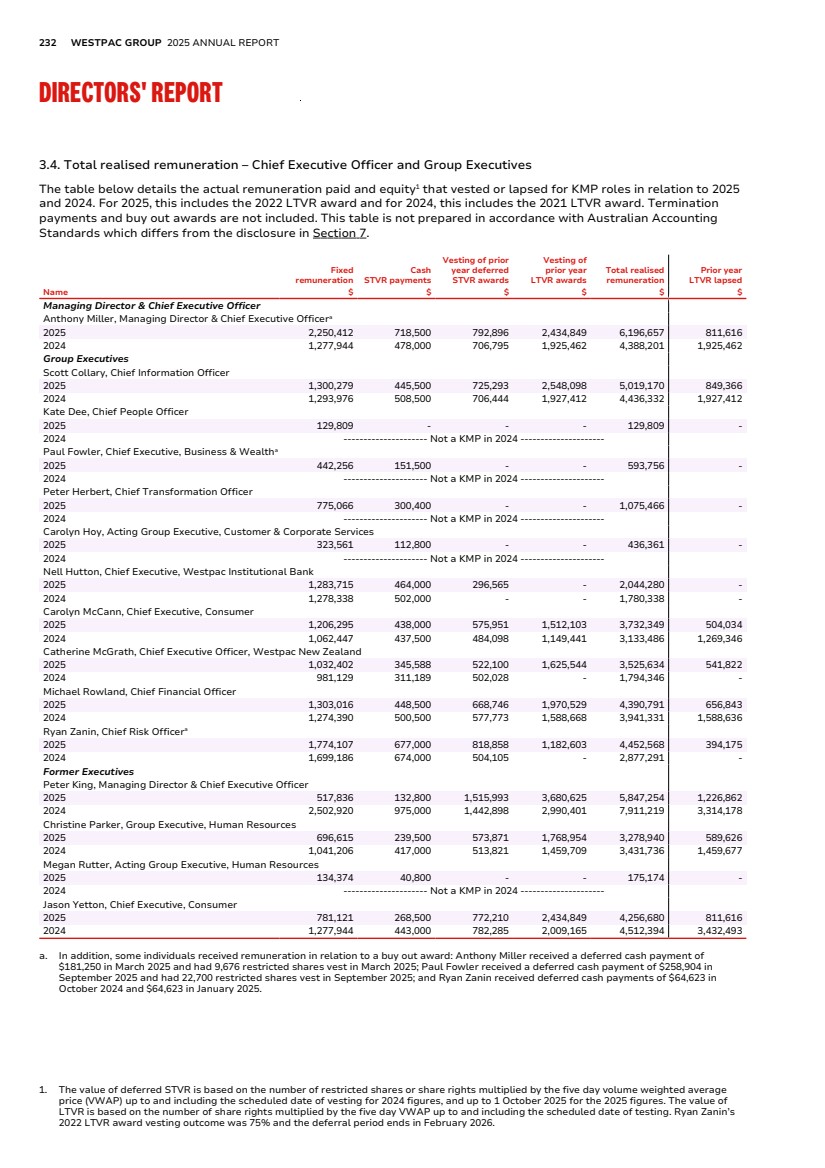
| FINANCIAL REPORT EXHIBITS INDEX STRATEGIC REVIEW PERFORMANCE REVIEW EXHIBIT 15.4 ADDITIONAL INFORMATION 233 3.5. Variable reward awarded for 2025 The table below shows the variable reward awarded1 to the CEO and Group Executives for 2025, including: • STVR outcomes for 2025 (including the cash and deferred equity components); and • equity granted in relation to 2025 LTVR awards. The 2025 LTVR grants are shown at face value in the table below and will be tested on 1 October 2028. 2025 STVR award 2025 LTVR award Name Target STVR opportunity ($) Maximum STVR opportunity ($) STVR outcome (% of target) STVR outcome (% of maximum) STVR outcome ($) Maximum STVR foregone ($) Restricted rights ($)a,b Performance rights ($)a Managing Director & Chief Executive Officer Anthony Miller 1,683,699 2,104,624 85% 68% 1,437,000 667,624 1,571,452 1,571,452 Group Executives Chief Information Officer Scott Collary 968,600 1,210,750 92% 74% 891,000 319,750 904,000 904,000 Chief People Officer Kate Deec n/a n/a n/a n/a n/a n/a n/a n/a Chief Executive, Business & Wealth Paul Fowlerc 328,832 411,040 92% 74% 303,000 108,040 306,910 306,910 Chief Transformation Officer Peter Herbertc 606,153 757,691 92% 74% 558,000 199,691 521,288 348,493 Acting Group Executive, Customer & Corporate Services Carolyn Hoyc 204,247 255,309 92% 74% 188,000 67,309 136,164 n/a Chief Executive, Westpac Institutional Bank Nell Hutton 956,250 1,195,313 97% 78% 928,000 267,313 892,500 892,500 Chief Executive, Consumer Carolyn McCann 903,044 1,128,805 97% 78% 876,000 252,805 842,841 842,841 Chief Executive Officer, Westpac New Zealand Catherine McGrath 751,279 939,098 92% 74% 691,176 247,922 701,193 701,193 Chief Financial Officer Michael Rowland 975,000 1,218,750 92% 74% 897,000 321,750 715,000 715,000 Chief Risk Officer Ryan Zanin 1,327,500 1,659,375 102% 82% 1,354,000 305,375 973,500 973,500 Former Executives Managing Director & Chief Executive Officer Peter Kingc,d 390,411 488,014 85% 68% 332,000 156,014 n/a n/a Group Executive, Human Resources Christine Parkerc 520,957 651,196 92% 74% 479,000 172,196 571,500 571,500 Acting Group Executive, Human Resources Megan Rutterc 73,775 92,219 92% 74% 68,000 24,219 60,361 n/a Chief Executive, Consumer Jason Yettonc 584,229 730,286 92% 74% 537,000 193,286 892,500 892,500 Average Group Executive STVR outcome 94% 75% a. The face value is calculated by multiplying the number of rights by the five day VWAP up to the commencement of the performance period. The five day VWAP was $32.23 for awards made in January 2025. b. Includes LTVR awarded as restricted shares for individuals in Acting Group Executive roles (Carolyn Hoy, Peter Herbert and Megan Rutter) at a face value of $32.60 per share. Carolyn McCann's LTVR in respect of her Acting Group Executive role was delivered in line with the standard Group Executive LTVR, not as restricted shares. c. The information relates to the period the individual was a KMP. Refer to Section 2 for further details. d. Peter King was eligible for 2025 STVR on a pro rata basis. 60% of the outcome is delivered as deferred equity in the form of share rights, vesting after four, five and six years (from 1 October 2024) to meet CPS 511 deferral requirements. The remaining 40% is delivered as cash. 1. The final value of equity received will depend on the share price at the time of vesting and the number of restricted shares or share rights that vest subject to performance conditions (where applicable), service conditions and remuneration adjustments. The value of equity differs from the disclosure in Section 7 which provides the annualised accounting value for unvested equity awards prepared in accordance with Australian Accounting Standards. |
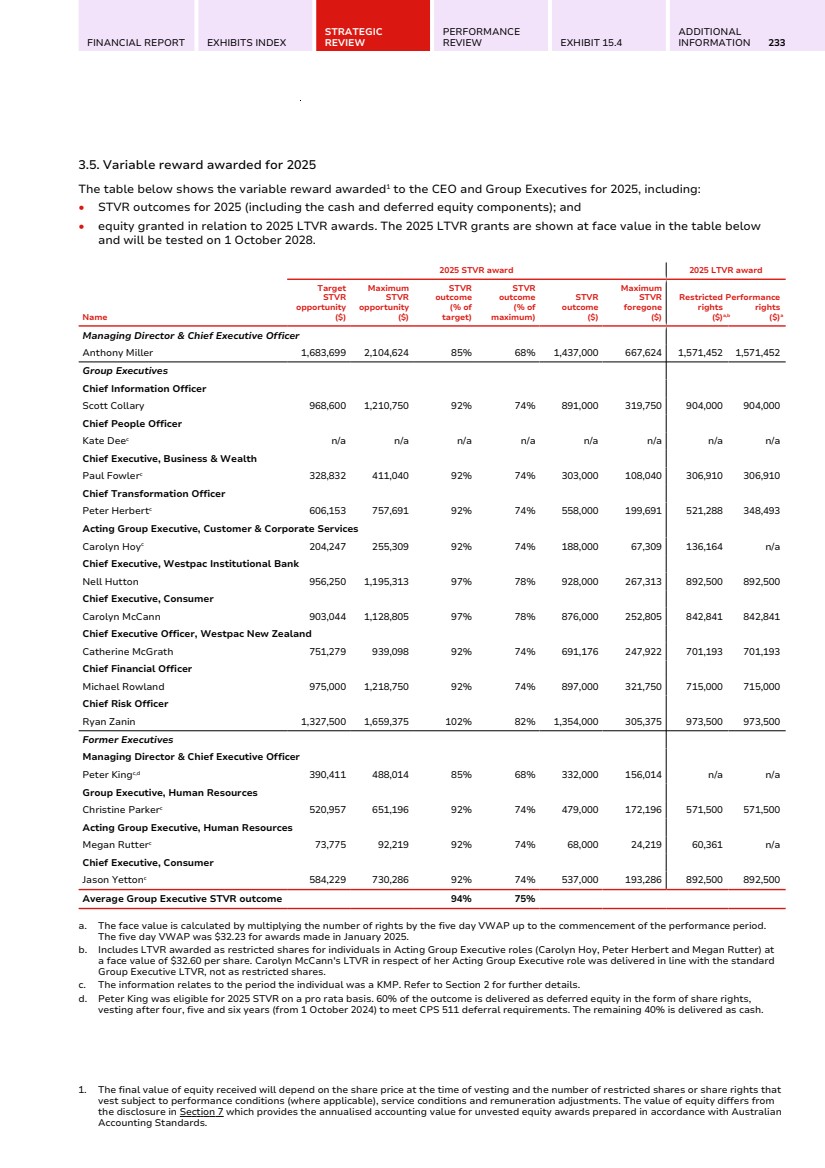
| 234 WESTPAC GROUP 2025 ANNUAL REPORT DIRECTORS' REPORT 2025 LTVR restricted rights pre-grant assessment We awarded the 2025 LTVR restricted rights, outlined in Section 3.5 above, following the pre-grant assessment which was completed in October 2024. The Board determined that the award be granted in full. Further details are available in the 2024 Remuneration Report. 2026 LTVR restricted rights pre-grant assessment The pre-grant assessment for the 2026 LTVR restricted rights was completed in October 2025. The Board determined that the 2026 LTVR restricted rights will be granted in full. The prudential soundness gate was satisfied by reviewing the key capital and liquidity ratios (CET1, LCR and NSFR). The ratios are all above minimum prudential requirements. Group risk culture maturity was assessed as Maintained. The Board had regard to the Group level risk-culture rating which was stable at ‘Systematic’ as well as improving results and positive momentum underlying the risk culture assessment. Other evidence points informing the CPS 220 Risk Management declaration included risk management framework maturity, root cause analyses, prudential attestations, audit and assurance findings and regulatory reviews. There were no significant risk outcomes or serious misconduct issues that arose that were not sufficiently addressed elsewhere. The LTVR restricted rights remain subject to the pre-vest assessment after the four year performance period ending 30 September 2029. The restricted rights also remain subject to remuneration adjustments during and after this period. Pre-grant assessment Outcome Step 1: Assessment Prudential soundness gate: Has Westpac remained safe and secure, taking into account capital position and liquidity? Met Group risk culture: Has Group risk culture maturity been maintained or improved, considering both executive actions or inactions? Maintained Significant risk outcomes: Have risk outcomes arisen that have a significant and material impact on the Group, not sufficiently addressed elsewhere? No adjustment Serious misconduct: Has Westpac suffered from a serious misconduct issue, not sufficiently addressed elsewhere? No adjustment Step 2: Consider Board discretion No adjustment Overall pre-grant assessment Grant in full |
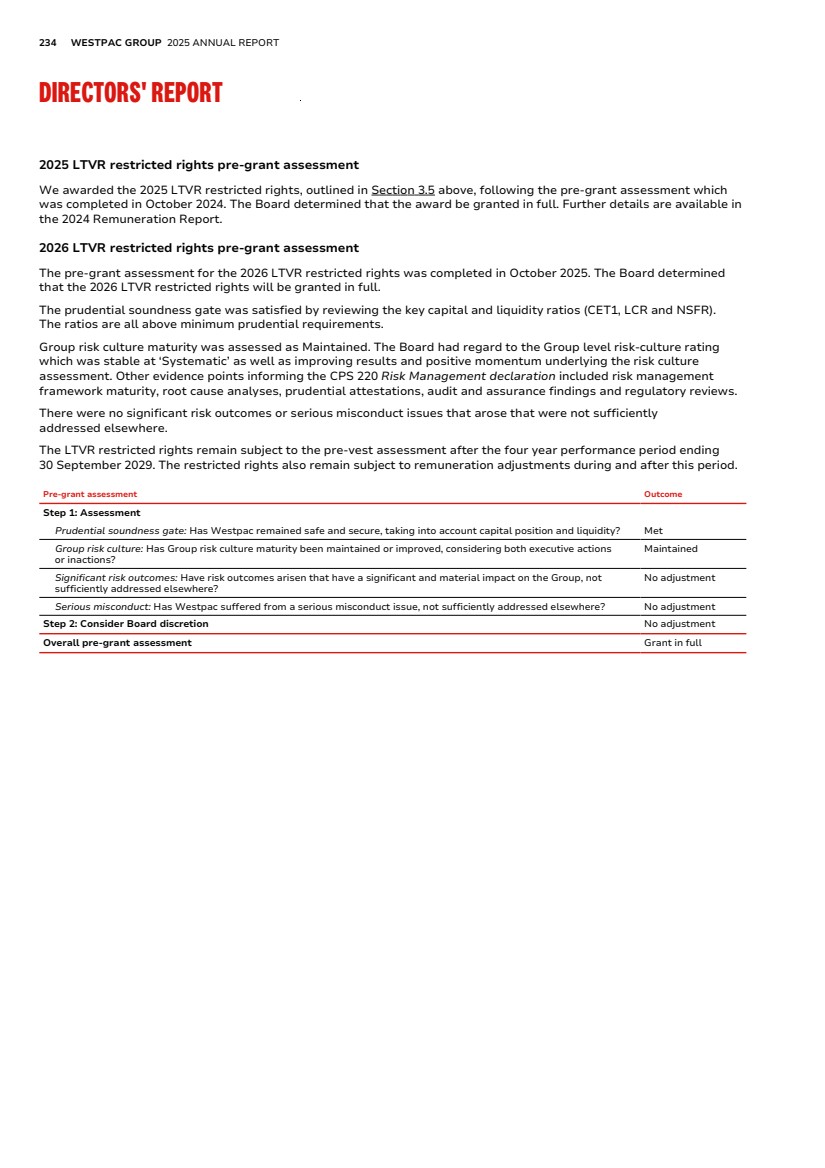
| FINANCIAL REPORT EXHIBITS INDEX STRATEGIC REVIEW PERFORMANCE REVIEW EXHIBIT 15.4 ADDITIONAL INFORMATION 235 4. Remuneration governance 4.1. Group remuneration policy The Group remuneration policy sets out information in relation to remuneration design, arrangements and outcomes across Westpac. The policy is supported by an established governance structure, plans and frameworks. The policy supports our compliance with legal and regulatory requirements. Remuneration strategy Our remuneration strategy is to attract and retain talented employees. We reward them for achieving high performance and delivering superior long term results for our customers and shareholders. Remuneration principles • Promote our purpose, values and behaviours; • Align with our strategy and create sustainable shareholder value; • Offer market competitive and equitable pay; • Reward financial and non-financial performance, including customer outcomes and risk excellence; and • Reinforce our risk and conduct expectations. 4.2. Group remuneration governance Board The Board has overall accountability for the Remuneration Framework and its application. As set out in the Board Charter (and as supported by the Board Remuneration Committee Charter), without limiting its role the Board approves (following recommendation from the Board Remuneration Committee): the Group remuneration policy; the size of the annual Group variable reward pool; performance objectives and remuneration outcomes for the CEO; remuneration arrangements and outcomes for Accountable Persons, specified roles and any other person the Board determines; and equity-based plans. The Board has the absolute discretion to withdraw, defer or adjust aggregate and individual variable reward. Further detail is contained in the Board and Committee Charters which are available on Westpac’s website: https://www.westpac.com.au/about-westpac/westpac-group/corporate-governance/constitution-board/ Board Remuneration Committee The Board Remuneration Committee assists the Board to discharge its responsibility by overseeing the design, operation and monitoring of the Remuneration Framework. Members of the Board Remuneration Committee are independent Non-executive Directors. The Board and the Board Remuneration Committee have free and unfettered access to internal and external personnel in carrying out their respective duties. Further detail is contained in the Board Remuneration Committee Charter which is available on Westpac’s website: https://www.westpac.com.au/about-westpac/westpac-group/corporate-governance/constitution-board/ Management remuneration oversight Other Board Committees The Board and the Board Remuneration Committee receive support from internal groups and committees including, but not limited to, the Group Remuneration Oversight Committee and business-specific remuneration oversight committees. The Board Remuneration Committee seeks feedback from and considers matters raised by the CEO, Chief Risk Officer, the Board Audit Committee Chair and the Board Risk Committee Chair (as appropriate) with respect to remuneration outcomes, adjustments to remuneration in light of relevant matters and the alignment of remuneration with the risk management framework. Cross membership of the Board Remuneration Committee and the Board Risk Committee also supports alignment between risk and remuneration. Independent input is received from the Chief Risk Officer on risk, compliance and conduct matters that may need to be considered in remuneration outcomes. Remuneration advisor The Board or the Board Remuneration Committee may engage an independent remuneration advisor to directly provide specialist information on remuneration for key management personnel. Use of remuneration advisors: In 2025, the Board engaged EY to provide market benchmarking information on Group Executive remuneration and to conduct an independent effectiveness review of the remuneration framework as required by CPS 511. EY did not provide any remuneration recommendations as prescribed under the Corporations Act 2001 (Cth) (Corporations Act) in 2025. |
| 236 WESTPAC GROUP 2025 ANNUAL REPORT DIRECTORS' REPORT 4.3. Our approach to remuneration adjustments Remuneration adjustment is one of the ways we reinforce our risk, compliance and conduct expectations. This includes downward adjustments for adverse outcomes, as well as upward adjustments to reward positive risk behaviours. An upward adjustment in variable reward may be considered for exceptional risk performance not already reflected in the delivery of agreed performance objectives. We have guidelines in place to support the consistent application of proportionate adjustments for significant risk, compliance or conduct matters. The graphic below provides an overview of our remuneration adjustment process and how it may potentially impact individual remuneration outcomes. Remuneration adjustment process BOARD DISCRETION Individual variable remuneration outcomes Reflects Westpac, divisional and individual performance outcomes (including risk and customer outcomes). May be adjusted downward (including to zero) for significant risk, compliance and conduct matters. Board discretion ¹ In year adjustments can include adjustments made through the STVR scorecard modifier and the LTVR pre-grant and pre-vest assessment. An assessment of severity of impact and individual accountability informs whether we trigger an adjustment. We apply judgement to consider whether the size of the adjustment is proportionate and fair. We take into consideration various facts specific to the matter including (but not limited to) the individual’s contribution and proximity to the direct and root causes of the matter, time in role, relative level of influence, findings of previous reviews and previous adjustments for related matters. The quantum of the remuneration adjustment increases with the severity of impact and individual accountability and influences the adjustment tool(s) used. Severity of impact based on: Customer People Reputation Regulation Financial Accountability Action or inaction of the individual Criteria We consider remuneration adjustments when there are significant adverse outcomes for the Group or its customers, beneficiaries, shareholders, counterparties or people related to: The criteria can be applied at an individual or collective level. Risk management Regulatory obligations Conduct Error or misstatement Unexpected events Adjustment tools In year¹ Malus Clawback Indicative order of downward adjustments: 1. Current year STVR 2. Unvested deferred STVR (malus) 3. Unvested LTVR (malus) 4. Unvested retention awards (malus) 5. Unvested buy out awards (malus) 6. Vested or paid VR (clawback) 1 2 3 4 5 6 Adjustment and consequence outcomes Senior leadersa that received downward remuneration adjustments 2 Senior leadersa that received upward remuneration adjustments 4 Employees identified as not having met all risk expectations during performance assessments 1,225 Employees that received downward remuneration adjustmentsb 99 Employees leaving due to consequence outcomes 240 Actions to recognise positive risk management and risk behaviours through our recognition platform 98,051 Employees that received an additional variable reward for achieving great risk outcomesb 1,558 a. These employees are the most senior leaders of Westpac, defined as the Chief Executive Officer, Group Executives and General Managers. b. Data for these measures reflect 2024 outcomes as 2025 outcomes are not yet available. |
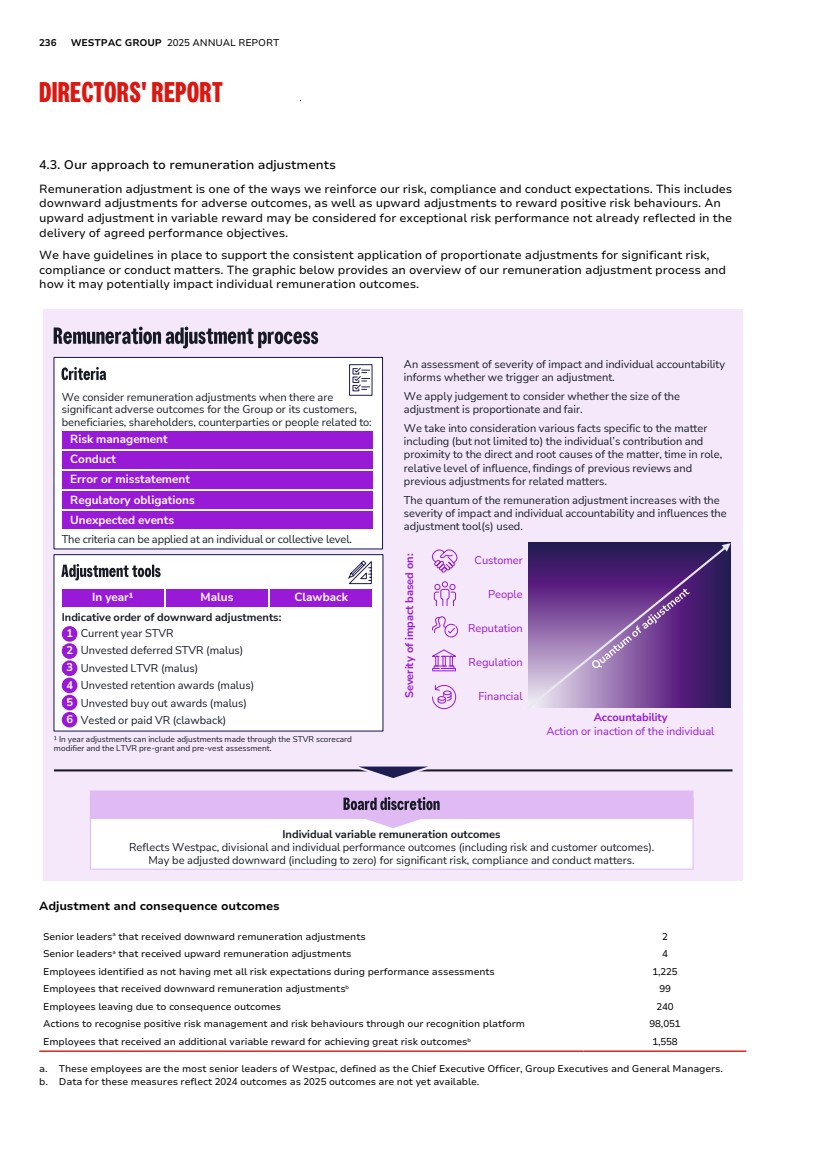
| FINANCIAL REPORT EXHIBITS INDEX STRATEGIC REVIEW PERFORMANCE REVIEW EXHIBIT 15.4 ADDITIONAL INFORMATION 237 5. Further detail on executive remuneration arrangements 5.1. Fixed remuneration The table below sets out the key design features of fixed remuneration. Fixed remuneration Purpose Provide market competitive remuneration reflecting role scope and accountabilities. Opportunity and benchmarking Set with reference to market benchmarks in the financial services industry and large corporates in Australia as appropriate. We also consider the size, responsibilities and complexity of the role, and the skills and experience of the executive. 5.2. Short term variable reward The table below sets out the key design features of the 2025 STVR. Short term variable reward Purpose Reward executives for delivering financial and non-financial annual objectives. Structure and delivery 50% of STVR is awarded in cash and 50% is deferred into equity in the form of restricted shares (or unhurdled share rights for the Group Executive based outside of Australia). One restricted share provides the holder with one Westpac ordinary share at no cost subject to trading restrictions until the time of vesting. One unhurdled share right entitles the holder to one ordinary share at the time of vesting with no exercise cost. Dividends are paid on restricted shares from the grant date. Target and maximum opportunity The target opportunity for the CEO and Group Executives is expressed as a percentage of fixed remuneration and is set at 75% of fixed remuneration (inclusive of superannuation). The target opportunity is set considering a range of factors including market competitiveness. Target STVR: awarded for the delivery of agreed targets for financial and non-financial measures. A reduced outcome can be determined for threshold performance. Maximum STVR: up to 125% of target STVR, awarded in circumstances where outcomes are achieved over and above target. Performance measures STVR awards are determined based on meeting minimum behaviour and risk and compliance gate openers, and performance against a scorecard designed to align with shareholder interests. The STVR Scorecard comprises three components: • Values and behaviours assessment: Demonstration of behaviours in line with Westpac's values of Helpful, Ethical, Leading change, Performing and Simple; • Focus areas: Performance is assessed against a balance of financial and non-financial measures that support the effective execution of Westpac’s strategy; and • Modifier: The modifier allows adjustment upwards or downwards (including to zero), for risk and reputation and people risk management considerations and any other matters as determined by the Board. Further information on the 2025 Group STVR Scorecard is provided in Section 3.3. Deferral period 50% of STVR is deferred into equity for a period of up to two years, which aligns executive remuneration with shareholder interests and acts as a retention mechanism. Deferred STVR vests in equal portions after one and two years, subject to service conditions and adjustment. Delayed vesting Refer to Section 5.4 for further information. Treatment of awards on cessation of employment Refer to Section 5.4 for further information. Remuneration adjustments Refer to Section 5.4 for further information. |
| 238 WESTPAC GROUP 2025 ANNUAL REPORT DIRECTORS' REPORT 5.3. Long term variable reward LTVR is comprised of two components, which are equally weighted, comprising LTVR restricted rights and LTVR performance rights. The tables below set out the key design features of the 2025 LTVR award, as determined by the Board in October 2024. 5.3.1. Long term variable reward restricted rights for 2025 Long term variable reward restricted rights Purpose Reward executives for sustainable risk culture and for creating shareholder value over the long term. Structure and delivery 50% of the LTVR is awarded in restricted share rights (known as restricted rights). For the CEO, 50% vest after four years and 50% vest after five years. For Group Executives, 100% vest after four years. One restricted right provides the holder with one Westpac ordinary share at the time of vesting with no exercise cost. Executives receive dividend equivalent payments as outlined below. Award opportunity The value of LTVR restricted rights awarded to the CEO and Group Executives is expressed as a percentage of fixed remuneration. The value of LTVR restricted rights is set considering a range of factors including market competitiveness. The face value of the 2025 LTVR restricted rights opportunity for the CEO and Group Executives is 70% of fixed remuneration (inclusive of superannuation). Allocation methodology The number of restricted rights each executive receives will be determined by dividing the dollar value of the LTVR restricted rights award by the face value of a restricted right. The face value of a restricted right is the five day VWAP of Westpac shares up to the commencement of the performance period (which is 1 October 2024 for the 2025 LTVR grant). Performance condition The restricted rights are subject to performance conditions which are assessed prior to the grant and prior to vesting. These assessments are known as the pre-grant assessment and the pre-vest assessment. The assessment is focused on maintaining or improving Group risk culture. The assessment will be primarily based on the assessment of collective Group risk culture as part of the Board’s annual attestation to APRA required under Prudential Standard CPS 220 Risk Management, which is a multi factorial, evidence based process. A prudential soundness gate applies. The Board will also consider if there have been any significant risk outcomes or any serious misconduct that have not been sufficiently addressed through performance management or STVR outcomes. Step 1: Assessment of risk factors 1. Prudential soundness gate: Has Westpac remained safe and secure, taking into account capital position and liquidity? Prudential soundness is measured through the common equity tier 1 capital ratio, liquidity coverage ratio and the net stable funding ratio. 2. Group risk culture: Has Group risk culture maturity been maintained or improved, considering both executive actions or inactions? The risk culture assessment involves a series of inputs, a review process and a Board assessment of Group risk culture. 3. Significant risk outcomes: Have risk outcomes arisen that have a significant and material impact on the Group, not sufficiently addressed elsewhere? 4. Serious misconduct: Has Westpac suffered from a serious misconduct issue, not sufficiently addressed elsewhere? Step 2: Consider Board discretion Considerations to guide the application of discretion and the overall assessment include: • The materiality of the adverse impact on Westpac’s financial position, or reputation, or customers, or shareholders, or employees or regulatory standing. • Whether the outcome was specific to Westpac, the banking industry or the broader market. • The extent to which performance and reward outcomes are already impacted (e.g. through remuneration adjustments), at a collective or individual level. • Whether any adjustment should be made on a collective or individual basis. Given the focus on maintaining or improving Group risk culture over the performance period, adjustments are unlikely at the pre-grant assessment and any potential adjustment is more likely at the pre-vest assessment. Assessment of performance outcomes LTVR restricted rights are assessed against risk culture at grant and following a four year performance period. The assessment of performance includes an assessment of risk factors and considers Board discretion. Dividend equivalent payments Dividend equivalent payments are payable to the extent that LTVR vests. For LTVR restricted rights, these are accrued for the performance period and the further deferral period after the performance period (if applicable), and paid at the end of the deferral period. Dividend equivalent payments are calculated by multiplying the number of LTVR restricted rights eligible to vest by the declared dividend price on each respective record date during the applicable period. The calculation excludes franking credits. Exercise period Vested rights may be exercised up to a maximum of two years from the vesting date of the award and will be auto-exercised if not exercised within the period. The exercise price for the rights is zero. No re-testing There is no re-testing. Awards that have not vested after the performance period are lapsed. Early vesting Unvested awards may vest (unless prevented by law) before the performance test date in the event of a change of control in Westpac as determined at the discretion of the Board or where employment ceases due to death or disability. Delayed vesting Refer to Section 5.4 for further information. Treatment of awards on cessation of employment Refer to Section 5.4 for further information. Remuneration adjustments Refer to Section 5.4 for further information. |
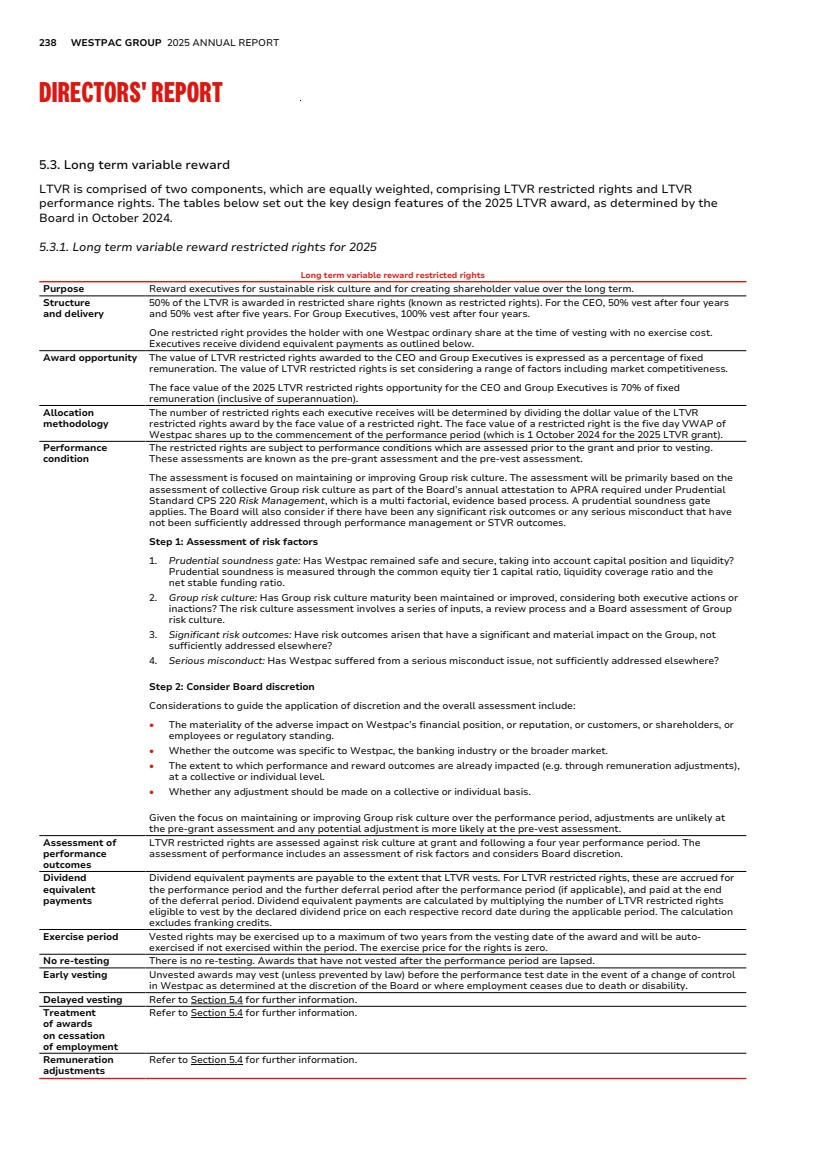
| FINANCIAL REPORT EXHIBITS INDEX STRATEGIC REVIEW PERFORMANCE REVIEW EXHIBIT 15.4 ADDITIONAL INFORMATION 239 5.3.2. Long term variable reward performance rights for 2025 Long term variable reward performance rights Purpose Reward executives for creating shareholder value over the long term. Structure and delivery 50% of the LTVR is awarded in performance share rights (known as performance rights) which vest after six years for the CEO and after five years for Group Executives. One performance right provides the holder with one Westpac ordinary share at the time of vesting with no exercise cost. Executives receive dividend equivalent payments as outlined below. Award opportunity The value of LTVR performance rights awarded to the CEO and Group Executives is expressed as a percentage of fixed remuneration. The value of LTVR performance rights is set considering a range of factors including market competitiveness. The face value of the 2025 LTVR performance rights opportunity for the CEO and Group Executives is 70% of fixed remuneration (inclusive of superannuation). Allocation methodology The number of performance rights each executive receives will be determined by dividing the dollar value of the LTVR performance rights award by the face value of a performance right. The face value of a performance right is the five day VWAP of Westpac shares up to the commencement of the performance period (which is 1 October 2024 for the 2025 LTVR grant). Performance condition LTVR performance rights are subject to an assessment of relative TSR against two comparator groups. The two comparator groups are equally weighted and tested independently against a percentile ranking vesting schedule as outlined below. The Board retains discretion to amend the comparator groups and determine the overall vesting outcome as appropriate. Relative TSR is a measure of the total return delivered to shareholders over the performance period assuming dividends are reinvested, relative to that of peers. The LTVR performance rights conditions aim to achieve long term growth in shareholder value and support alignment between executive reward and shareholder interests. Westpac’s TSR performance Indicative vesting percentage At the 75th percentile or higher 100% Between the median and the 75th percentile Pro-rata vesting between 50% and 100% At the median 50% Below the median 0% The banking comparator group of companies comprises ANZ Group Holdings Limited, Bank of Queensland Limited, Bendigo and Adelaide Bank Limited, Commonwealth Bank of Australia and National Australia Bank Limited. The general ASX comparator group comprises the 20 largest companies on the ASX by market capitalisation, excluding resource companies. The 20 companies are determined at the start of the performance period on 1 October 2024. The general ASX comparator group of companies comprises ANZ Group Holdings Limited, Aristocrat Leisure Limited, Brambles Limited, Coles Group Limited, Commonwealth Bank of Australia, CSL Limited, Goodman Group, James Hardie Industries PLC, Macquarie Group Limited, National Australia Bank Limited, QBE Insurance Group Limited, REA Group Ltd, ResMed Inc, Suncorp Group Limited, Telstra Group Limited, Transurban Group, Wesfarmers Limited, WiseTech Global Limited, Woolworths Group Limited and Xero Limited. In the event of a merger, acquisition or de-listing of any of the 20 companies, that company will be removed from the comparator group. Assessment of performance outcomes LTVR performance rights are subject to relative TSR performance following a four year performance period. The relative TSR result is calculated independently for external objectivity before being provided to the Board to determine the vesting outcome. The Board may exercise discretion in determining the final vesting outcome. Dividend equivalent payments Dividend equivalent payments are payable to the extent that LTVR vests. For LTVR performance rights, these are only accrued for the further deferral period after the performance period and paid at the end of the deferral period. Dividend equivalent payments are calculated by multiplying the number of LTVR performance rights eligible to vest by the declared dividend price on each respective record date during the applicable period. The calculation excludes franking credits. Exercise period Vested rights may be exercised up to a maximum of two years from the vesting date of the award and will be auto-exercised if not exercised within the period. The exercise price for the rights is zero. No re-testing There is no re-testing. Awards that have not vested after the performance period are lapsed. Early vesting Unvested awards may vest (unless prevented by law) before the performance test date in the event of a change of control in Westpac as determined at the discretion of the Board or where employment ceases due to death or disability. Delayed vesting Refer to Section 5.4 for further information. Treatment of awards on cessation of employment Refer to Section 5.4 for further information. Remuneration adjustments Refer to Section 5.4 for further information. |
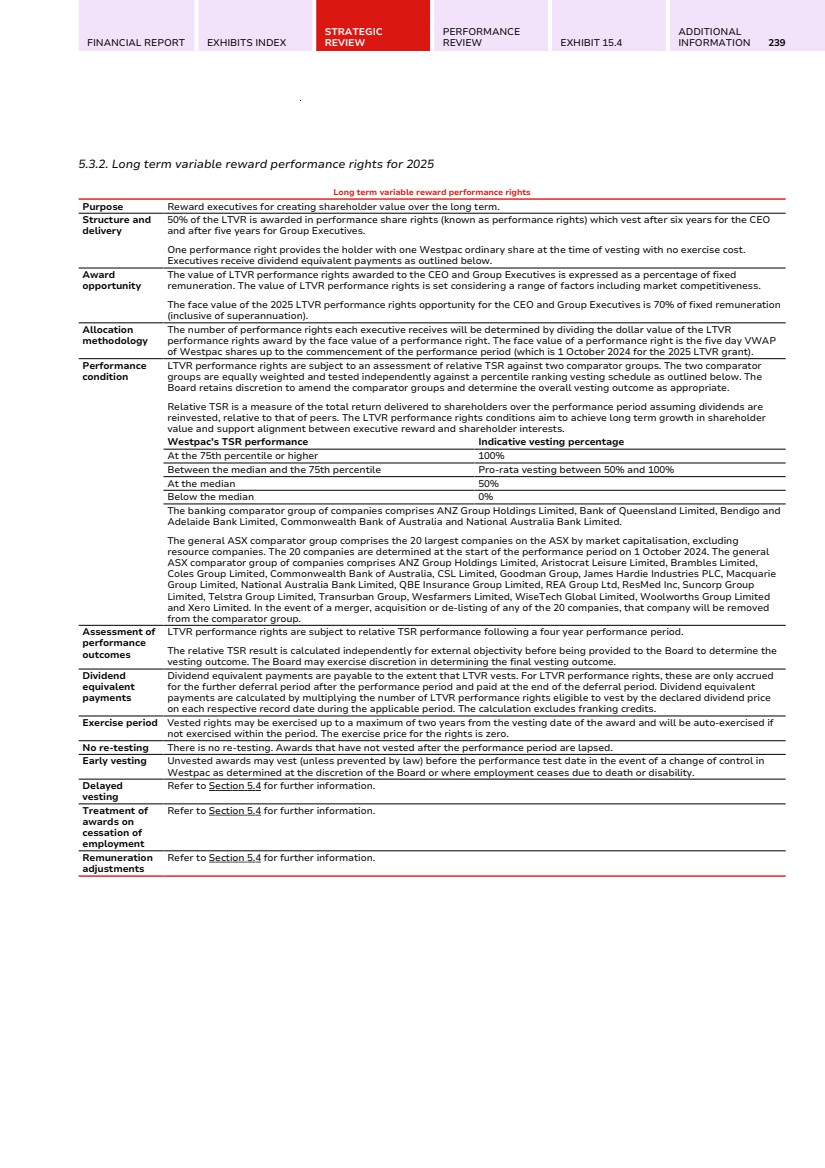
| 240 WESTPAC GROUP 2025 ANNUAL REPORT DIRECTORS' REPORT 5.4. Common design features for variable reward Delayed vesting The Board has discretion (subject to law) to delay vesting of variable reward if the individual is under investigation for adverse risk or conduct events including misconduct, is the subject of or implicated in legal or regulatory proceedings, if the Board considers it reasonable to delay vesting, or if delayed vesting is otherwise required by law. Treatment of awards on cessation of employment Unvested variable reward is forfeited or lapsed where the CEO or a Group Executive resigns or otherwise leaves the Group (except for the reasons listed below) before vesting occurs unless the Board determines that some or all of the unvested variable reward should remain on foot. If the CEO or a Group Executive ceases employment because of death or total and permanent disability, all unvested variable reward immediately vests or becomes exercisable unless prevented by law. If the CEO or a Group Executive ceases employment because they retire, are retrenched or cease employment by agreed separation, unvested variable reward stays on foot subject to applicable performance conditions and subject to any adjustment determined by the Board. Remuneration adjustments The Board has discretion to adjust variable reward (including current year STVR) downwards, including to zero, in specified circumstances including serious misconduct, if serious circumstances or new information come to light which mean that in the Board’s view all or part of the award was not appropriate, or where required by law or prudential standards. The Board will typically apply the adjustment to unvested deferred STVR where an adjustment to current year STVR is considered insufficient or unavailable, followed by an adjustment to unvested LTVR where an adjustment to current and deferred STVR is considered insufficient or unavailable. Clawback may also apply to vested variable reward, to the extent legally permissible and practicable. Refer to Section 4.3 for further information on our approach to remuneration adjustments. 5.5. Acting Group Executive arrangements Carolyn Hoy, Megan Rutter and Peter Herbert (whilst in the Acting Chief Executive, Business & Wealth role) were appointed on differing remuneration arrangements due to the acting nature of their roles. STVR is delivered as 60% cash and 40% as deferred equity in the form of restricted shares vesting in equal portions after one and two years. Maximum STVR opportunity is 125% of target STVR. STVR awards are determined based on meeting minimum behaviour and risk and compliance gate openers, and performance is assessed against a scorecard designed to align with shareholder interests. LTVR is service based with a pre-grant risk assessment. LTVR is awarded in restricted shares vesting over four and five years to satisfy CPS 511 deferral requirements. STVR and LTVR are subject to service conditions and remuneration adjustments. Carolyn McCann commenced the year as Group Executive, Customer & Corporate Services. During the year, Carolyn was appointed to the role of Acting Chief Executive, Consumer and was then appointed permanently to the role of Chief Executive, Consumer. Carolyn remained on Group Executive remuneration arrangements throughout all of these roles. |
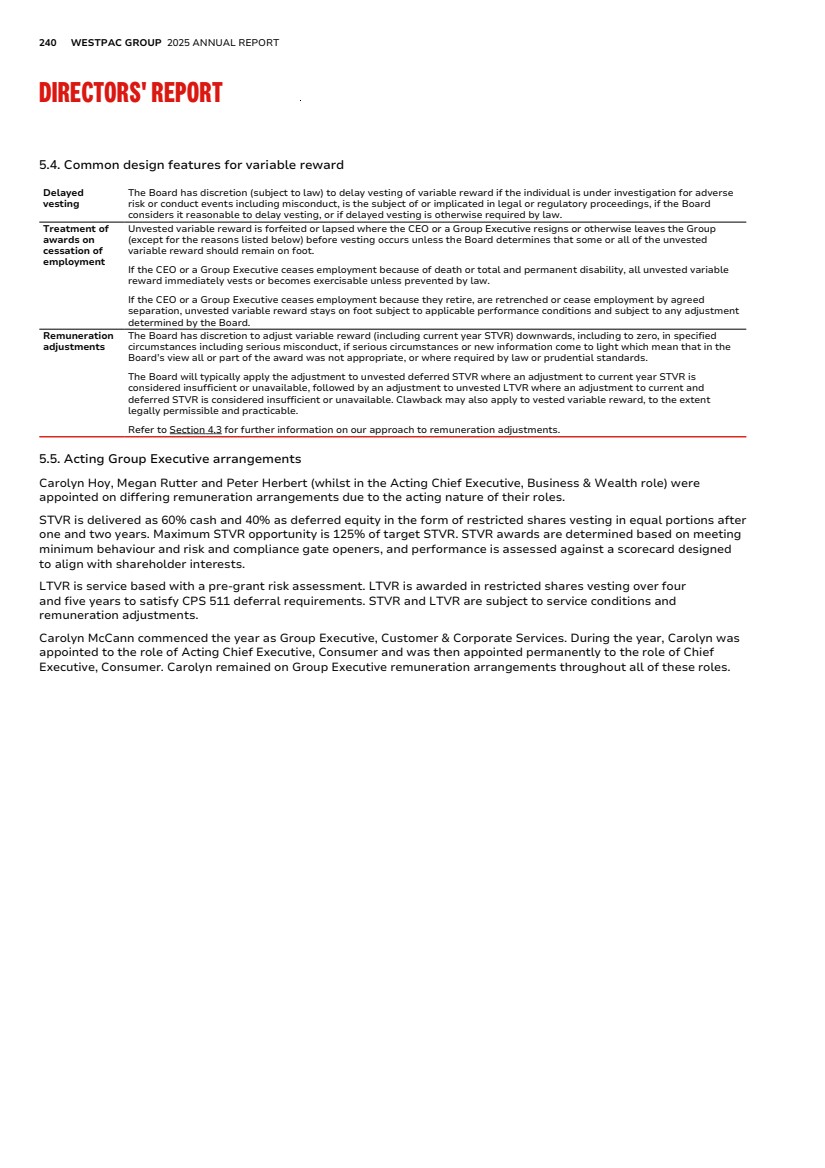
| FINANCIAL REPORT EXHIBITS INDEX STRATEGIC REVIEW PERFORMANCE REVIEW EXHIBIT 15.4 ADDITIONAL INFORMATION 241 5.6. Executive minimum shareholding requirements and current compliance The CEO and Group Executives are required to build and maintain a significant Westpac shareholding to strengthen alignment with shareholder interests. LTVR restricted rights and LTVR performance rights are not included in the calculation of shareholdings until performance conditions are met. At 30 September 2025, the CEO and Group Executives comply with or are on track to meet the requirements. Aspect of the requirements Description Requirement level CEO: Two times fixed remuneration including superannuationa . Group Executives: One times fixed remuneration including superannuation. Sale restrictions Executives are restricted from selling vested equity, other than for the purpose of meeting tax obligations, as follows: • For LTVR awards granted from 1 October 2021 onwards, until the required shareholding level is met; and • For STVR awards, where the required shareholding level is not met at the end of the accumulation period. Accumulation period Within five years of 1 October 2022 (i.e. by 1 October 2027), or appointment to their role, whichever is later. The Board Remuneration Committee retains discretion to make adjustments in exceptional circumstances. Calculation of shareholdings Unvested LTVR (including restricted rights and performance rights) is not included in the calculation of shareholdings until performance conditions are met. Other shareholdings are recognised. This includes: • Shares held in an employee share plan (including deferred STVR); • Shares held outright in the individual’s name either solely or jointly with another person; and • Shares held in a family trust or a self-managed superannuation fund. a. The minimum shareholding requirement for the CEO will increase to three times fixed remuneration from 1 October 2025. 5.7. Hedging policy Participants in Westpac’s equity plans are prohibited from entering, either directly or indirectly, into hedging arrangements for unvested awards and vested awards subject to a holding lock. No financial products may be used to mitigate the risk associated with these awards. Any attempt to hedge awards will result in forfeiture and the Board may consider other disciplinary action. These restrictions satisfy the requirements of the Corporations Act which prohibits hedging of unvested awards. 5.8. Employment agreements The remuneration and other terms of employment for the CEO and Group Executives are formalised in their employment agreements. Each agreement provides for the payment of fixed remuneration (including superannuation contributions), variable reward and other benefits such as death and disablement insurance cover. The table below details the key terms including termination provisions of the employment agreements for the CEO and Group Executives. Term Conditions Duration of agreement Ongoing until notice given by either party. Notice (by the executive or the Group) to terminate employment Twelve months for Executives that commenced before January 2025. Six months for new Executives that commenced from January 2025.a In the event of redundancy, the greater of the relevant notice period or Westpac's general notice and severance entitlements applies. Termination payments on termination without causeb Deferred STVR (which may be awarded on a pro rata basis for the part year served) and unvested LTVR will be treated in accordance with the applicable equity plan rules, and will remain subject to remuneration adjustments if the award is retained. Termination for cause Occurs immediately for misconduct. Deferred STVR and LTVR is forfeited, noting the Board has discretion to determine otherwise. Post-employment restraints CEO: Twelve months non-compete and non-solicitation restraints. Group Executives: Six months non-compete and twelve months non-solicitation restraints. a. Payment in lieu of notice may in certain circumstances be approved by the Board for some or all of the notice period. b. The maximum aggregate liability for termination benefits in respect of notice periods for the CEO and Group Executives at 30 September 2025 was $11.2 million (2024: $12.5 million). |
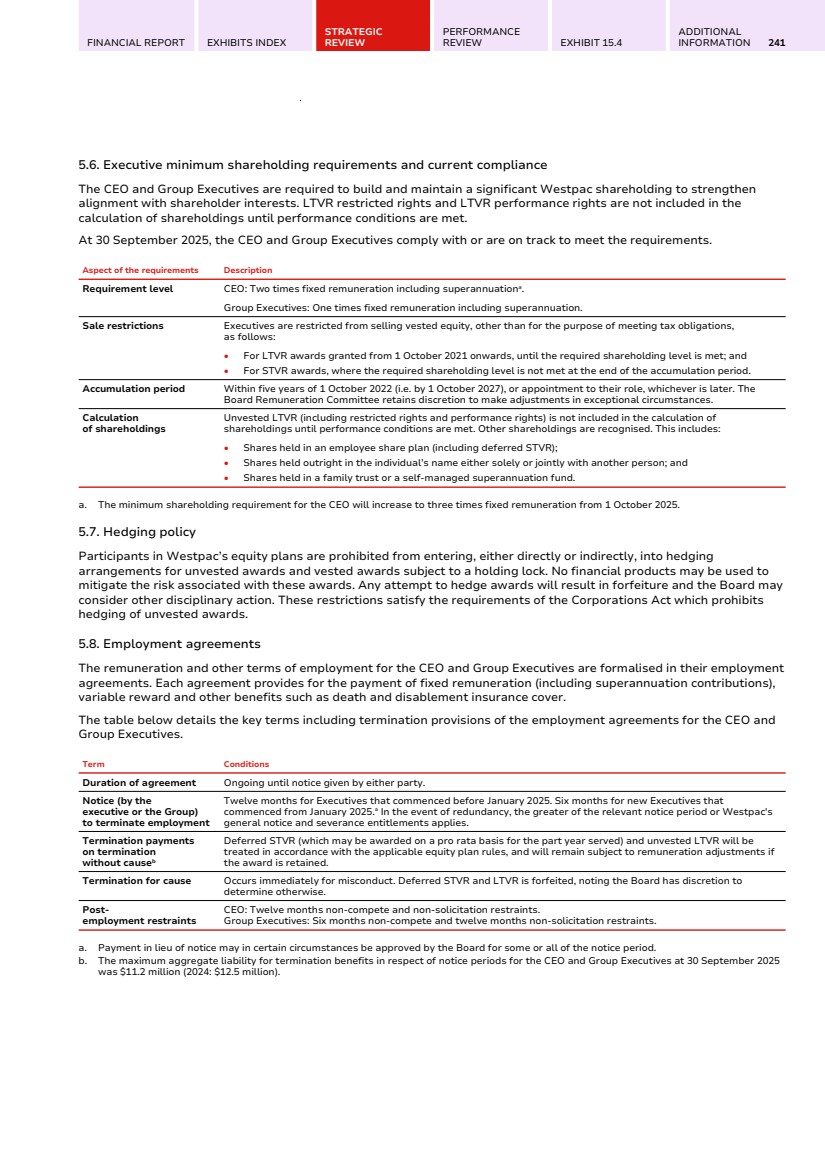
| 242 WESTPAC GROUP 2025 ANNUAL REPORT DIRECTORS' REPORT 6. Non-executive Director remuneration 6.1. Structure and policy Non-executive Director fees are not related to Westpac’s results. Fees are paid in cash and no discretionary payments are made for performance. Non-executive Directors are required to build and maintain a minimum shareholding from their own funds to align their interests with those of shareholders (refer to Section 6.3 for further details). The table below sets out the components of Non-executive Director remuneration. Non-executive Director remuneration Base fees Relate to service on the Westpac Banking Corporation Board. The base fee for the Chair covers all responsibilities, including for Board Committees. Committee fees Additional fees are paid to Non-executive Directors (other than the Board Chair) for chairing or being a member of Board Committees, other than the Board Nominations & Governance Committee. Employer superannuation contributions Reflects statutory superannuation contributions which are capped at the superannuation maximum contributions base as prescribed under the superannuation guarantee legislation. 6.2. Non-executive Director remuneration in 2025 The table below sets out the annual Board and standing Committee fees (exclusive of superannuation). Changes in Board and Committee composition during the year are set out in the Directors' meetings section in the Directors' report. For 2025, $3.4 million (75%) of the fee pool was used. The fee pool of $4.5 million per annum was approved by shareholders at the 2008 Annual General Meeting and includes employer superannuation contributions. The members of the Nominations & Governance Committee do not receive any additional fees for their roles on the Committee. Base and Committee fees Annual fee $ (exclusive of superannuation) Base fees Chair 823,000 Other Non-executive Directors 215,000 Committee Chair fees Board Audit Committee 69,000 Board Risk Committee 69,000 Board Remuneration Committee 69,000 Committee membership fees Board Audit Committee 34,000 Board Risk Committee 34,000 Board Remuneration Committee 34,000 Other fees UNITE oversight group 34,000 Additional duties Committee Chair fee (per meeting) 4,000 Additional duties Committee fee (per meeting) 2,000 6.3. Non-executive Director minimum shareholding requirement Non-executive Directors are required to build and maintain a holding in Westpac ordinary shares with a value not less than the Board base fee (and in case of the Chair, the Chair's fee), within five years of appointment to the Board. At 30 September 2025, all Non-executive Directors comply with or are on track to meet the requirement. |
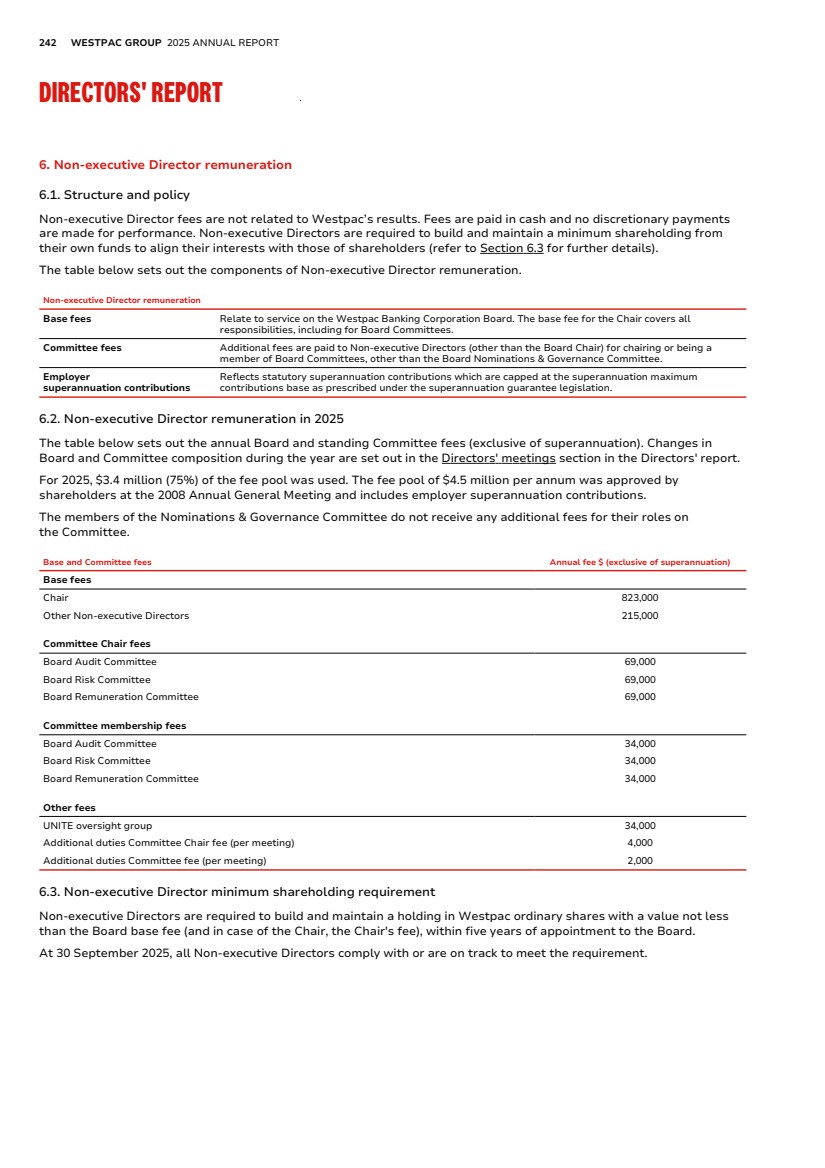
| FINANCIAL REPORT EXHIBITS INDEX STRATEGIC REVIEW PERFORMANCE REVIEW EXHIBIT 15.4 ADDITIONAL INFORMATION 243 7. Statutory remuneration details 7.1. Details of Non-executive Director remuneration The table below details Non-executive Director remuneration. Short-term benefits Post-employment benefits Westpac Banking Corporation Board feesa Non-monetary benefitsb Superannuation Total Name $ $ $ $ Non-executive Directors Steven Gregg, Chair 2025 826,165 11,786 30,440 868,391 2024 680,727 5,893 30,017 716,637 Tim Burroughs 2025 285,337 - 30,137 315,474 2024 269,410 - 28,054 297,464 Nerida Caesar 2025 312,585 - 30,250 342,835 2024 258,208 - 27,674 285,882 David Cohenc 2025 125,458 - 14,753 140,211 2024 --------------------- Not a KMP in 2024 --------------------- Pip Greenwoodc 2025 35,558 1,540 4,267 41,365 2024 --------------------- Not a KMP in 2024 --------------------- Debra Hazeltonc 2025 144,611 - 16,730 161,341 2024 --------------------- Not a KMP in 2024 --------------------- Andy Maguire 2025 282,009 23,409 30,223 335,641 2024 53,631 - 6,168 59,798 Peter Nash 2025 354,650 - 30,166 384,816 2024 339,478 - 28,316 367,795 Margaret Seale 2025 282,865 - 30,240 313,105 2024 263,977 - 26,459 290,436 Michael Ullmer AO 2025 313,361 - 30,260 343,621 2024 300,846 - 8,214 309,060 Former Non-executive Directors Audette Exel AOc 2025 66,022 - 6,505 72,527 2024 316,232 - 28,211 344,443 Nora Scheinkestelc 2025 36,337 - - 36,337 2024 340,346 - - 340,346 Total fees 2025 3,064,958 36,735 253,971 3,355,664 2024d 3,050,685 7,649 194,029 3,252,364 a. Includes base fees, Committee fees and any other fees. b. Non-monetary benefits are determined on the basis of the cost to the Group including associated fringe benefits tax (FBT) where applicable and includes bank funded car parking and relocation costs. c. The information relates to the period the individual was a KMP. Refer to Section 2 for further details. d. Total fees for 2024 shown as reported in the 2024 Annual Report. The total fees for 2024 include individuals that are not KMP in 2025 and therefore their individual remuneration is not included in the above table. |
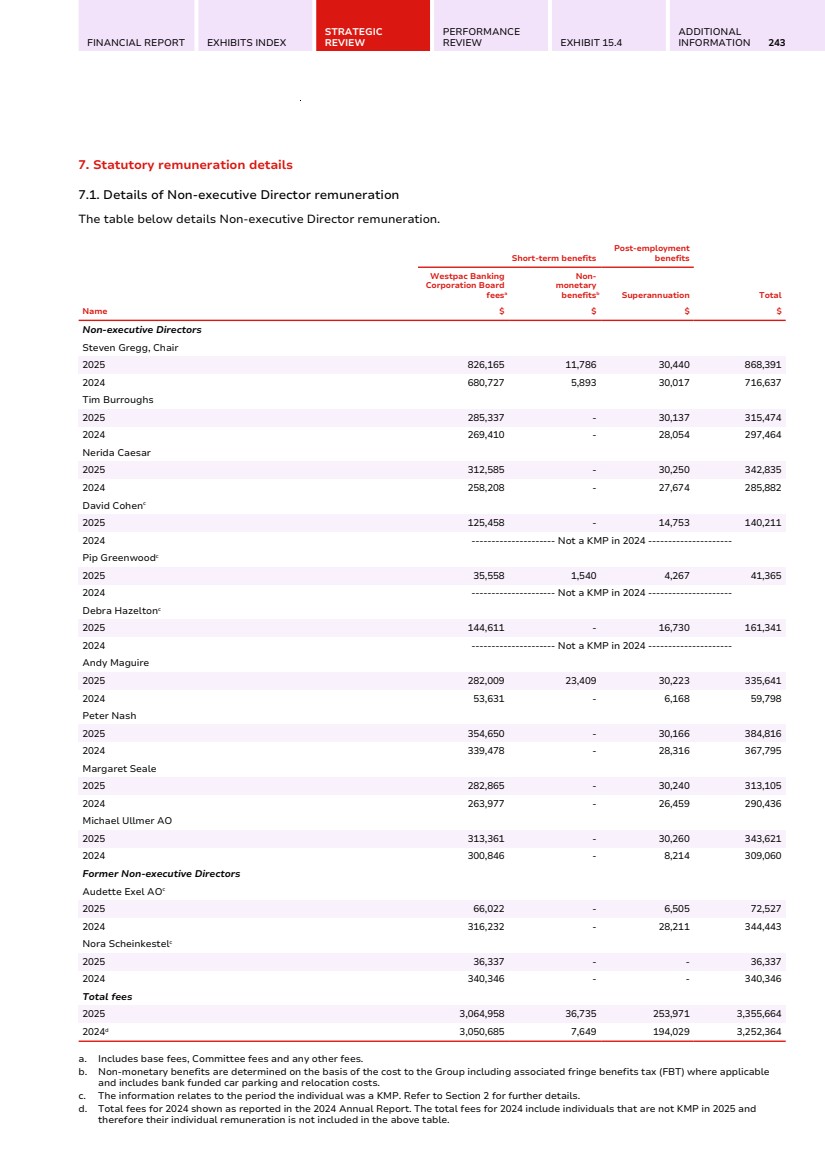
| 244 WESTPAC GROUP 2025 ANNUAL REPORT DIRECTORS' REPORT 7.2. Statutory remuneration details – Chief Executive Officer and Group Executives The table below details remuneration for the CEO and Group Executives prepared and audited in accordance with Australian Accounting Standards. Short term benefits Post-employment benefits Other long term benefits Share-based payments Fixed remunerationa Cash STVR awardb Non-monetary benefitsc Other paymentsd Superannuation benefitse Long service leave Restricted sharesf Restricted rightsg Performance rightsg Totalh $ $ $ $ $ $ $ $ $ $ Managing Director & Chief Executive Officer Anthony Miller, Managing Director & Chief Executive Officer 2025 2,293,520 718,500 5,039 17,386 42,556 107,886 593,423 538,282 636,411 4,953,003 2024 1,279,390 478,000 3,315 166,277 37,898 19,056 684,787 238,441 717,728 3,624,892 Group Executives Scott Collary, Chief Information Officer 2025 1,230,253 445,500 5,894 - 35,894 19,190 463,192 463,401 632,523 3,295,847 2024 1,300,753 508,500 8,333 - 34,739 21,537 563,784 241,512 740,674 3,419,832 Kate Dee, Chief People Officeri 2025 128,485 - 504 175,334 10,470 1,979 176,404 14,220 14,220 521,616 2024 ------------------------------------------------------- Not a KMP in 2024 ------------------------------------------------------- Paul Fowler, Chief Executive, Business & Wealthi 2025 440,166 151,500 1,266 100,724 20,797 6,591 768,571 30,943 9,841 1,530,399 2024 ------------------------------------------------------- Not a KMP in 2024 ------------------------------------------------------- Peter Herbert, Chief Transformation Officeri 2025 718,273 300,400 5,042 - 29,501 20,816 390,850 53,579 30,832 1,549,293 2024 ------------------------------------------------------- Not a KMP in 2024 ------------------------------------------------------- Carolyn Hoy, Acting Group Executive, Customer & Corporate Servicesi 2025 306,243 112,800 1,266 - 36,093 48,639 123,751 - - 628,792 2024 ------------------------------------------------------- Not a KMP in 2024 ------------------------------------------------------- Nell Hutton, Chief Executive, Westpac Institutional Bank 2025 1,271,484 464,000 4,606 - 37,030 18,946 1,168,985 457,506 175,213 3,597,770 2024 1,230,101 502,000 5,359 - 35,046 17,352 1,132,285 238,441 105,932 3,266,516 Carolyn McCann, Chief Executive, Consumer 2025 1,334,025 438,000 5,894 - 39,024 54,728 410,402 401,849 433,132 3,117,054 2024 1,038,679 437,500 5,359 - 36,479 15,727 398,684 198,233 482,393 2,613,054 Catherine McGrath, Chief Executive Officer, Westpac New Zealand 2025 877,583 345,588 10,613 - 127,886 - - 674,684 442,664 2,479,018 2024 857,768 311,189 8,386 - 119,894 - - 523,182 388,367 2,208,786 Michael Rowland, Chief Financial Officer 2025 1,260,305 448,500 8,987 - 35,892 20,840 296,066 867,559 689,837 3,627,986 2024 1,249,398 500,500 3,315 - 34,007 18,870 465,327 186,823 579,245 3,037,485 Ryan Zanin, Chief Risk Officer 2025 1,795,959 677,000 88,792 5,964 2,027 28,630 857,798 488,077 608,097 4,552,344 2024 1,663,065 674,000 151,817 116,682 2,097 25,268 730,310 249,101 541,063 4,153,403 |
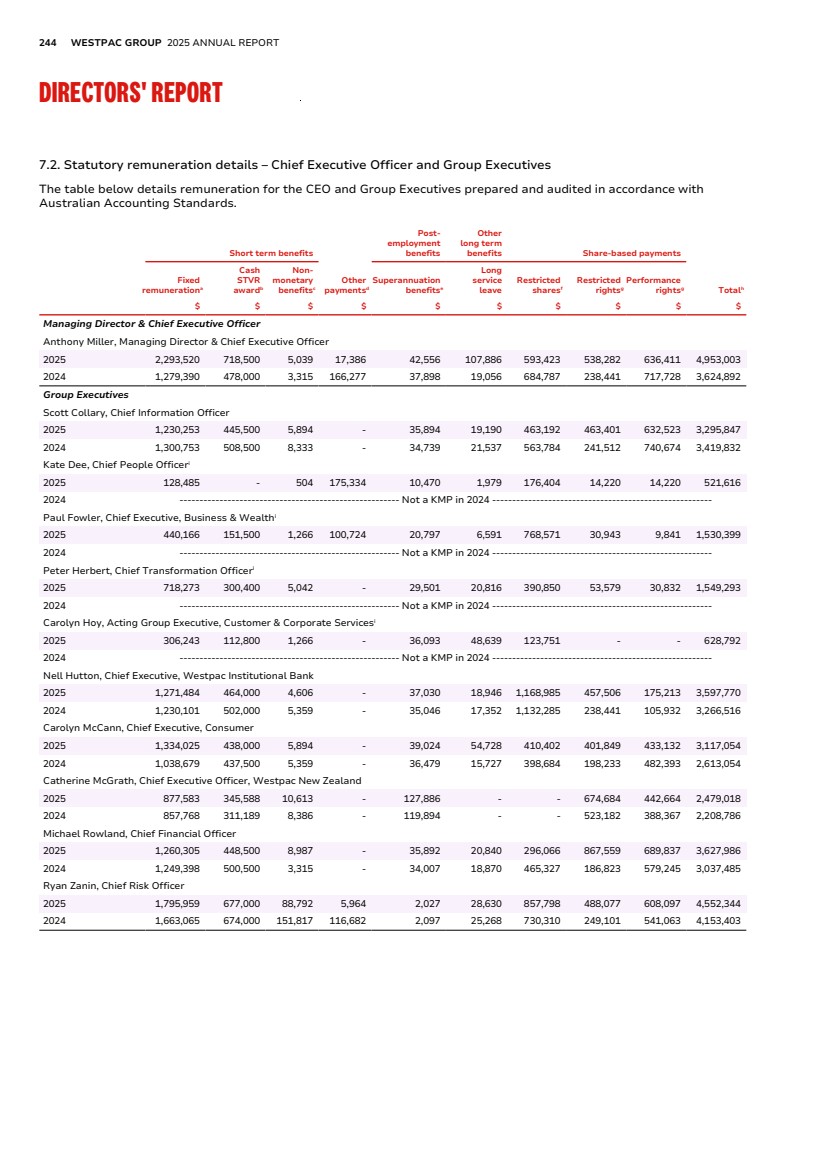
| FINANCIAL REPORT EXHIBITS INDEX STRATEGIC REVIEW PERFORMANCE REVIEW EXHIBIT 15.4 ADDITIONAL INFORMATION 245 Short term benefits Post-employment benefits Other long term benefits Share-based payments Fixed remunerationa Cash STVR awardb Non-monetary benefitsc Other paymentsd Superannuation benefitse Long service leave Restricted sharesf Restricted rightsg Performance rightsg Totalh $ $ $ $ $ $ $ $ $ $ Former Executives Peter King, Managing Director & Chief Executive Officeri,j 2025 542,944 132,800 5,388 2,500,000 5,301 7,998 617,464 1,395,939 1,645,019 6,852,853 2024 2,418,943 975,000 20,823 - 48,249 22,024 1,198,595 728,328 1,521,487 6,933,449 Christine Parker, Group Executive, Human Resourcesi,j,k 2025 650,691 239,500 3,531 936,073 22,533 9,767 318,968 1,296,357 1,064,385 4,541,805 2024 1,045,623 417,000 3,315 - 32,976 16,896 401,268 152,684 524,412 2,594,174 Megan Rutter, Acting Group Executive, Human Resourcesi 2025 130,840 40,800 286 - 8,051 2,379 76,539 - - 258,895 2024 ------------------------------------------------------- Not a KMP in 2024 ------------------------------------------------------- Jason Yetton, Chief Executive, Consumeri,j,l 2025 741,396 268,500 5,060 1,082,559 24,710 13,927 371,703 1,918,994 1,559,134 5,985,983 2024 1,200,082 443,000 3,315 - 38,009 19,050 539,012 238,441 770,574 3,251,483 a. Fixed remuneration is the total cost of cash salary, salary sacrificed benefits and an accrual for annual leave. Superannuation in excess of the maximum contribution base that is paid as cash is also included. b. The cash STVR award is typically paid in December following the end of the financial year. c. Non-monetary benefits are determined on the basis of the cost to the Group (including associated FBT, where applicable) and may include annual health checks, provision of taxation advice, bank funded car parking, executive life insurance as well as relocation costs and travel allowances. d. Includes payments on termination or other contracted amounts for current KMP. The cash portion of buy out arrangements is recognised as an expense from commencement date as a KMP to the end of the deferral period. For Kate Dee and Paul Fowler, the cash buy out is recognised as an expense over 12 months from their commencement date to reflect a minimum service period. For Anthony Miller, the cash buy out arrangement was agreed on 25 March 2021 and the remaining 5% of the cash portion of the buy out was paid in 2025. For Kate Dee, the cash buy out arrangement was agreed on 5 September 2025 and is due to be paid in March 2026. For Paul Fowler, the cash buy out arrangement was agreed on 30 June 2025 and 100% of the cash portion of the buy out was paid in September 2025. For Ryan Zanin, the cash buy out arrangement was agreed on 30 August 2022 and the remaining 12% of this award was paid in 2025. e. Includes Group life and salary continuance insurance cover provided at no cost to the individual. Superannuation benefits have been calculated consistent with AASB 119 Employee Benefits. f. Restricted shares are amortised from the start of the performance period when the award was earned through to the end of the relevant service period. A portion of the restricted shares held by Anthony Miller, Kate Dee and Paul Fowler represents an allocation made to compensate them for remuneration foregone from their previous employer on resignation to join Westpac. For Paul Fowler, the allocation that vested during the year is being recognised as an expense over 12 months from Paul's commencement date to reflect a minimum service period. g. Share rights are amortised over the performance and the relevant service period. They are calculated based on the fair value at the grant date (being the invitation opt out date) of hurdled and unhurdled share rights granted during the financial year up to 30 September 2025. Fair value is calculated using an external valuation based on the invitation opt out date. The 2025 value for Catherine McGrath includes 29% attributed to deferred STVR awards. h. The table includes remuneration details of individuals that are KMP for 2025, whereas the totals presented in Note 34 to the financial statements includes former KMP who ceased as KMP in 2024. The percentage of total remuneration which is performance related (i.e. cash STVR plus relevant share-based payments) was: Anthony Miller 50%, Scott Collary 61%, Kate Dee 5%, Paul Fowler 15%, Peter Herbert 38%, Carolyn Hoy 24%, Nell Hutton 53%, Carolyn McCann 54%, Catherine McGrath 59%, Michael Rowland 63%, Ryan Zanin 53%, Peter King 55%, Christine Parker 64%, Megan Rutter 30% and Jason Yetton 69%. The percentage of total remuneration delivered in the form of share rights was: Anthony Miller 24%, Scott Collary 33%, Kate Dee 5%, Paul Fowler 3%, Peter Herbert 5%, Carolyn Hoy 0%, Nell Hutton 18%, Carolyn McCann 27%, Catherine McGrath 45%, Michael Rowland 43%, Ryan Zanin 24%, Peter King 44%, Christine Parker 52%, Megan Rutter 0% and Jason Yetton 58%. i. The information relates to the period the individual was a KMP. Refer to Section 2 for further details. j. The share-based payment values reflect the accruals for unvested equity up to the end of each relevant service period. Whilst the full value is being accrued in 2025 for all unvested equity, the awards may or may not vest subject to the relevant performance conditions. k. Christine Parker commenced as an Enterprise Executive on 2 June 2025 and provided transition support to the Group until ceasing as an Executive on 1 July 2025. For the period from 2 June 2025 to 1 July 2025, Christine received remuneration of $147,096. This amount has been excluded from the table above as Christine was not a KMP during this period. l. Jason Yetton commenced as an Enterprise Executive on 12 May 2025 and provided transition support to the Group until commencing a period of leave on 14 June 2025. Jason ceased as an Executive on 1 July 2025. For the period from 12 May 2025 to 1 July 2025, Jason received remuneration of $304,792. This amount has been excluded from the table above as Jason was not a KMP during this period. |
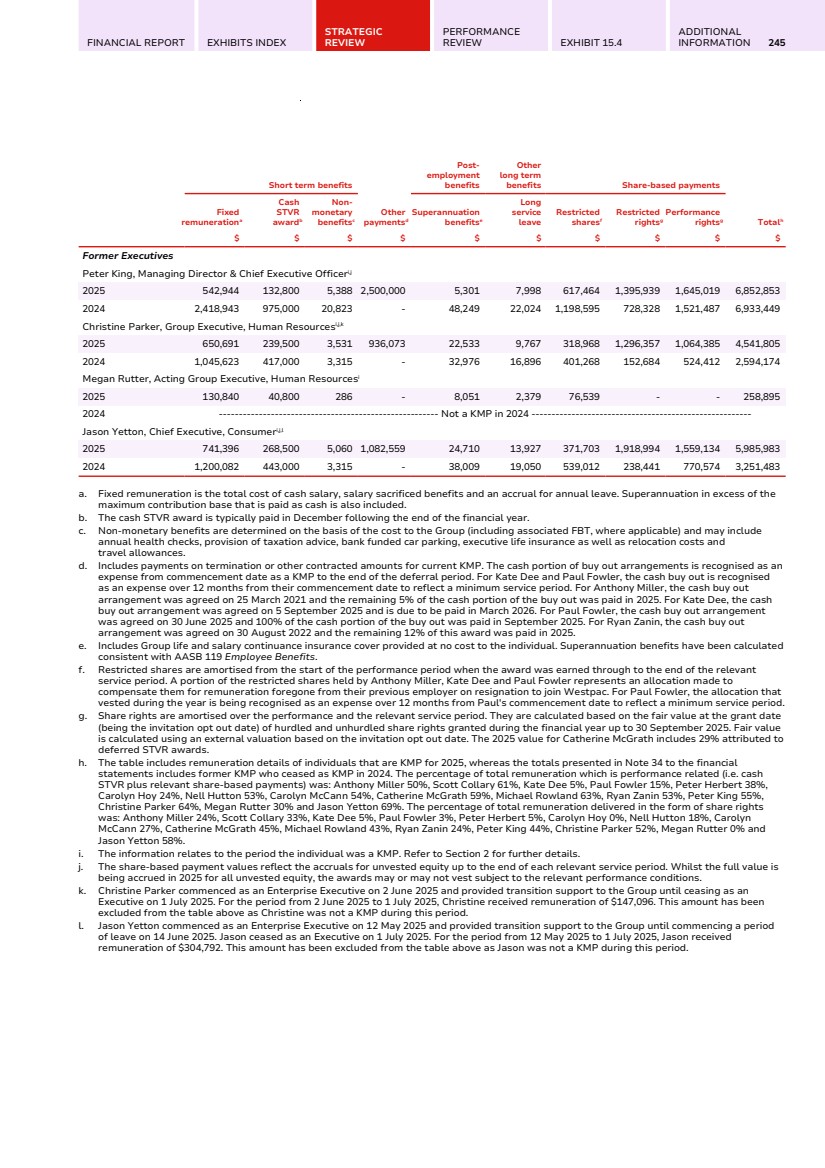
| 246 WESTPAC GROUP 2025 ANNUAL REPORT DIRECTORS' REPORT 7.3. Movement in equity-settled instruments during the year The table below shows the movements in the number and value of equity instruments for the CEO and Group Executives during 2025. Name Type of equity-based instrument Number granteda Number vestedb Number exercisedc Value granted $ d Value exercised $ e Value forfeited or lapsed $ e Managing Director & Chief Executive Officer Anthony Miller Restricted shares 14,662 31,791 - 478,861 - - Restricted rights 48,756 - - 1,592,947 - - Performance rights 48,758 60,246 60,246 679,192 1,943,536 1,934,499 Group Executives Scott Collary Restricted shares 15,598 22,104 - 509,431 - - Restricted rights 28,048 - - 918,852 - - Performance rights 28,048 60,307 60,307 361,398 1,945,504 1,936,458 Kate Deef Restricted shares 19,351 - - 744,626 - - Restricted rights - - - - - - Performance rights - - - - - - Paul Fowlerf Restricted shares 83,979 22,700 - 2,811,617 - - Restricted rights 9,522 - - 318,797 - - Performance rights 9,522 - - 126,690 - - Peter Herbertf Restricted shares 22,726 - - 742,231 - 298,856 Restricted rights 10,812 - - 342,200 - - Performance rights 10,813 - - 156,680 - 706,660 Carolyn Hoyf Restricted shares 4,176 - - 150,503 - 90,037 Restricted rights - - - - - - Performance rights - - - - - - Nell Hutton Restricted shares 15,398 26,474 - 502,899 - - Restricted rights 27,691 - - 907,157 - - Performance rights 27,692 - - 356,811 - - Carolyn McCann Restricted shares 13,420 15,147 - 438,297 - - Restricted rights 26,150 - - 857,661 - - Performance rights 26,150 35,965 35,965 338,059 1,133,257 1,154,804 Catherine McGrath Unhurdled share rights 10,277 15,708 - 313,623 - - Restricted rights 22,035 - - 721,867 - - Performance rights 22,035 - - 283,919 - - Michael Rowland Restricted shares 15,352 18,078 - 501,396 - - Restricted rights 22,184 - - 726,748 - - Performance rights 22,184 49,708 49,708 285,841 1,603,580 1,596,092 Ryan Zanin Restricted shares 20,674 15,773 - 675,213 - - Restricted rights 30,204 - - 989,483 - - Performance rights 30,205 - - 389,190 - - |
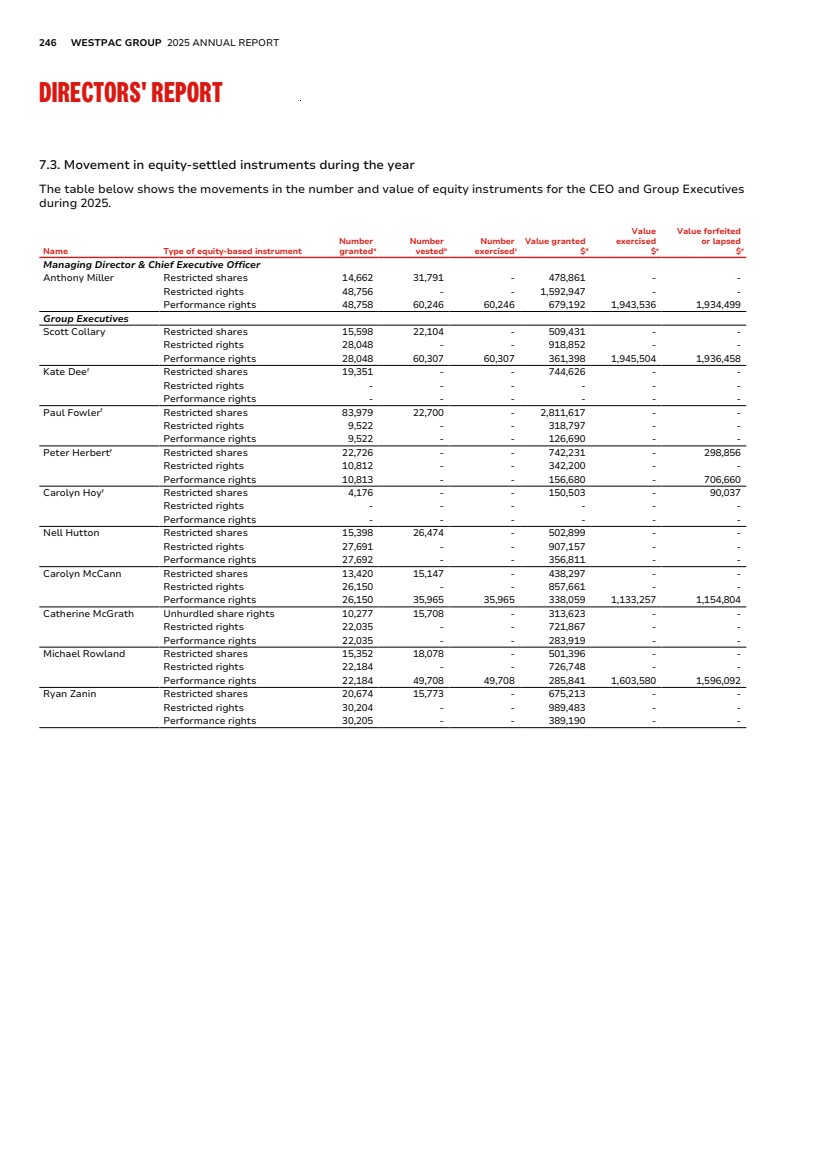
| FINANCIAL REPORT EXHIBITS INDEX STRATEGIC REVIEW PERFORMANCE REVIEW EXHIBIT 15.4 ADDITIONAL INFORMATION 247 Name Type of equity-based instrument Number granteda Number vestedb Number exercisedc Value granted $ d Value exercised $ e Value forfeited or lapsed $ e Former Executives Peter Kingf Restricted shares 29,907 45,147 - 955,828 - - Restricted rights - - - - - - Performance rights - 93,567 93,567 - 3,018,471 3,004,436 Christine Parkerf Restricted shares 12,791 16,077 - 417,754 - - Restricted rights 17,731 - - 580,868 - - Performance rights 17,732 45,673 45,673 228,477 1,473,411 1,466,528 Megan Rutterf Restricted shares - - - - - - Restricted rights - - - - - - Performance rights - - - - - - Jason Yettonf Restricted shares 13,588 24,477 - 443,784 - - Restricted rights 27,691 - - 907,157 - - Performance rights 27,692 62,865 62,865 356,811 2,028,025 2,018,595 a. Restricted rights and performance rights granted to the CEO are approved by shareholders at the Annual General Meeting each year. We do not grant options. We award deferred STVR in the form of restricted shares (or unhurdled share rights for KMP in New Zealand). 2024 deferred STVR was awarded on 27 December 2024 (based on the invitation opt out date) for the CEO and Group Executives. The deferral period commenced on 1 October 2024. 50% of the award will vest on 15 November 2025 and 50% will vest on 15 November 2026 (subject to service conditions and remuneration adjustments). b. 50% of the performance rights granted in 2021 vested in October 2024 when assessed against the relative TSR performance condition. 100% of the deferred STVR due to vest in 2024 vested at the end of the deferral period. For Anthony Miller, 9,676 of the 31,791 restricted shares that vested were in relation to a buy out award representing the remaining 8% of the total number of shares allocated for that award. For Paul Fowler, 22,700 of the 22,700 restricted shares that vested were in relation to a buy out award representing 27% of the total number of shares allocated for that award and the remaining portions of the award are due to vest through to May 2030. c. Vested share rights granted prior to September 2023 may be exercised up to a maximum of 15 years from their commencement date. Vested share rights granted after September 2023 may be exercised up to two years following the vesting date, otherwise the share rights will be auto-exercised at the end of the term. d. For performance rights and unhurdled share rights, the value granted represents the number of securities granted multiplied by the fair value per instrument as set out in the table in the sub-section titled ‘Overview of unvested equity awards’. For restricted shares and restricted rights, the value granted represents the number of shares or rights granted multiplied by the closing price of a Westpac ordinary share on the date the awards were granted. These values, which represent the full value of the equity-based awards made to the CEO and Group Executives in 2025, do not reconcile with the amount shown in the table in Section 7.2 which shows the amount amortised in the current year. The minimum total value of the grants for future financial years is zero and an estimate of the maximum possible total value in future financial years is the fair value, as shown above. e. The value of each share right exercised, forfeited or lapsed is calculated based on the closing price of a Westpac ordinary share on the date of exercise (or forfeiture or lapse). The overall values reflect forfeitures or lapses as a result of a failure to meet service or performance conditions. f. The information relates to the period the individual was a KMP. Refer to Section 2 for further details. |
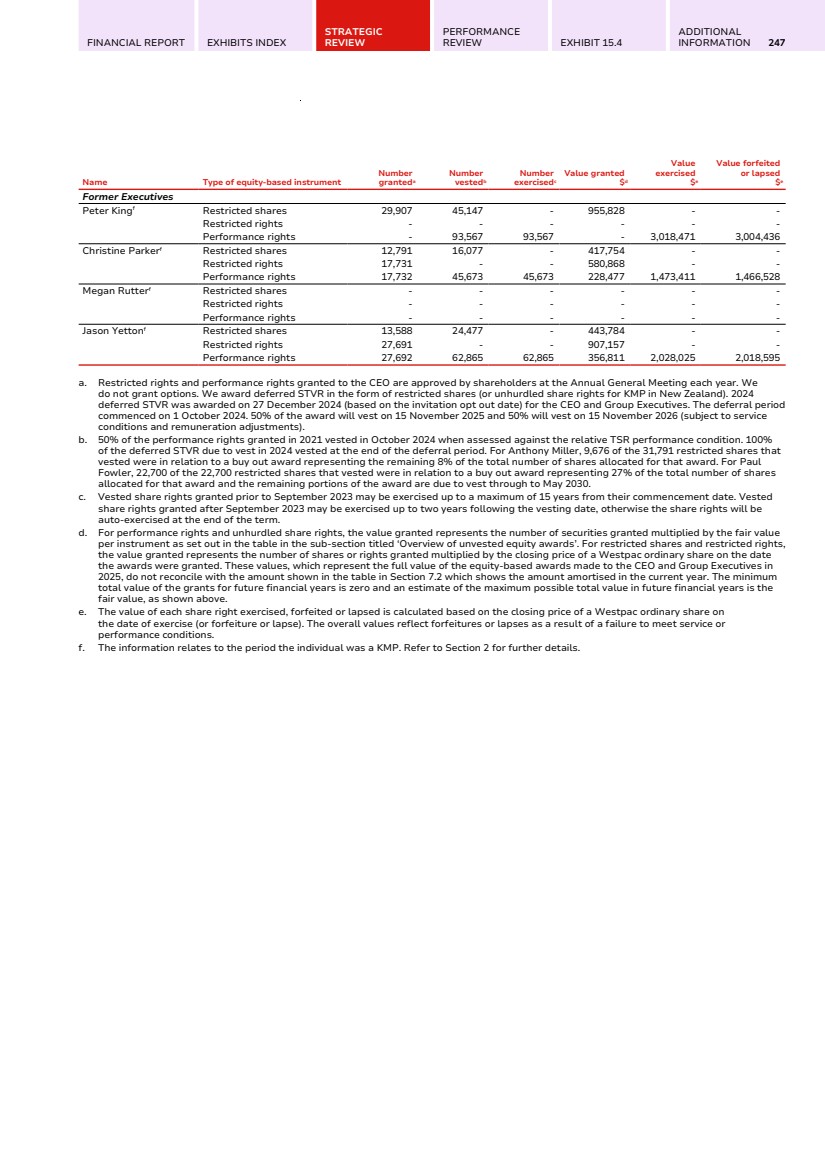
| 248 WESTPAC GROUP 2025 ANNUAL REPORT DIRECTORS' REPORT 7.4. Overview of unvested equity awards The table below outlines key details of unvested equity awards as at 30 September 2025 awarded to the CEO and Group Executives for KMP roles. All awards are subject to service conditions, performance conditions (where applicable), deferral periods and remuneration adjustments. Further details of the awards can be located in prior Annual Reports. Fair values Fair values are determined in accordance with the requirements of AASB 2 Share-based Payment. For STVR and LTVR restricted rights, the fair value is calculated using the closing price of the grant date, which for accounting purposes is the invitation opt out date. For LTVR performance rights and unhurdled share rights, fair values are independently calculated by PFS Consulting at the grant date (which is the invitation opt out date). For the LTVR performance rights, a Monte Carlo simulation pricing model is used. Allocation values The value granted to executives for remuneration purposes differs from the fair value used for accounting purposes. For STVR grants prior to 2024, the allocation is determined by dividing the dollar value of the STVR award by the five day VWAP up to the grant date. For STVR grants from 2024 onwards, the allocation is determined by dividing the dollar value of the STVR award by the five day VWAP up to Westpac's variable reward payment date each year which is typically in December each year. Refer to Section 5.2 for further details of STVR. For LTVR grants, the allocation is determined by dividing the dollar value of the LTVR awards by the face value of a share right. The face value of a share right is the five day VWAP up to the commencement of the performance period. Refer to Section 5.3 for further details of LTVR. Award name Accounting grant date Performance period start date Performance period end date Deferral period end date Expiry Fair value Performance conditions 2024 STVRa 27 Dec 2024 1 Oct 2023 30 Sep 2024 15 Nov 2025 (tranche one) and 15 Nov 2026 (tranche two) N/A $32.66 Service (noting STVR Scorecard assessment was completed) 2023 STVR 19 Jan 2024 1 Oct 2022 30 Sep 2023 1 Oct 2025 (tranche two) N/A $23.20b Service (noting STVR Scorecard assessment was completed) 2025 LTVR performance rights CEO: 27 Dec 2024 Group Executives: 6 Dec 2024 1 Oct 2024 30 Sep 2028 CEO: 15 Nov 2030 Group Executives: 15 Nov 2029 CEO: 15 Nov 2032 Group Executives: 15 Nov 2031 CEO: $12.98 (Banking), $15.16 (General ASX) Group Executives: $11.17 (Banking), $14.60 (General ASX) Two equal tranches: Relative TSR - Banking comparators Relative TSR - General ASX comparators 2025 LTVR performance rights - part year KMP or additional award Paul Fowler: 7 Jul 2025 Peter Herbert: 27 Mar 2025 Carolyn McCann: 7 Jul 2025 and 5 Sep 2025 1 Oct 2024 30 Sep 2028 Paul Fowler: 13 May 2030 Peter Herbert: 15 Nov 2029 Carolyn McCann: 15 Nov 2029 Paul Fowler: 13 May 2032 Peter Herbert: 15 Nov 2031 Carolyn McCann: 15 Nov 2031 Paul Fowler: $11.47 (Banking), $15.14 (General ASX) Peter Herbert: $14.02 (Banking), $14.96 (General ASX) Carolyn McCann: $11.47 (Banking), $15.14 (General ASX) and $20.93 (Banking), $22.35 (General ASX) Two equal tranches: Relative TSR - Banking comparators Relative TSR - General ASX comparators 2025 LTVR restricted rights CEO: 27 Dec 2024 Group Executives: 6 Dec 2024 1 Oct 2024 30 Sep 2028 CEO: 50% on 15 Nov 2028 (tranche one) and 50% on 15 Nov 2029 (tranche two) Group Executives: 15 Nov 2028 CEO: 15 Nov 2030 (tranche one) and 15 Nov 2031 (tranche two) Group Executives: 15 Nov 2030 CEO: $32.66 Group Executives: $32.76 Pre-vest assessment of risk culture (noting a pre-grant assessment was completed) 2025 LTVR restricted rights - part year KMP or additional award Paul Fowler: 7 Jul 2025 Peter Herbert: 27 Mar 2025 Carolyn McCann: 7 Jul 2025 and 5 Sep 2025 1 Oct 2024 30 Sep 2028 Paul Fowler: 13 May 2029 Peter Herbert: 15 Nov 2028 Carolyn McCann: 15 Nov 2028 Paul Fowler: 13 May 2031 Peter Herbert: 15 Nov 2030 Carolyn McCann: 15 Nov 2030 Paul Fowler: $33.48 Peter Herbert: $31.65 Carolyn McCann: $33.48 and $38.17 Pre-vest assessment of risk culture (noting a pre-grant assessment was completed) |
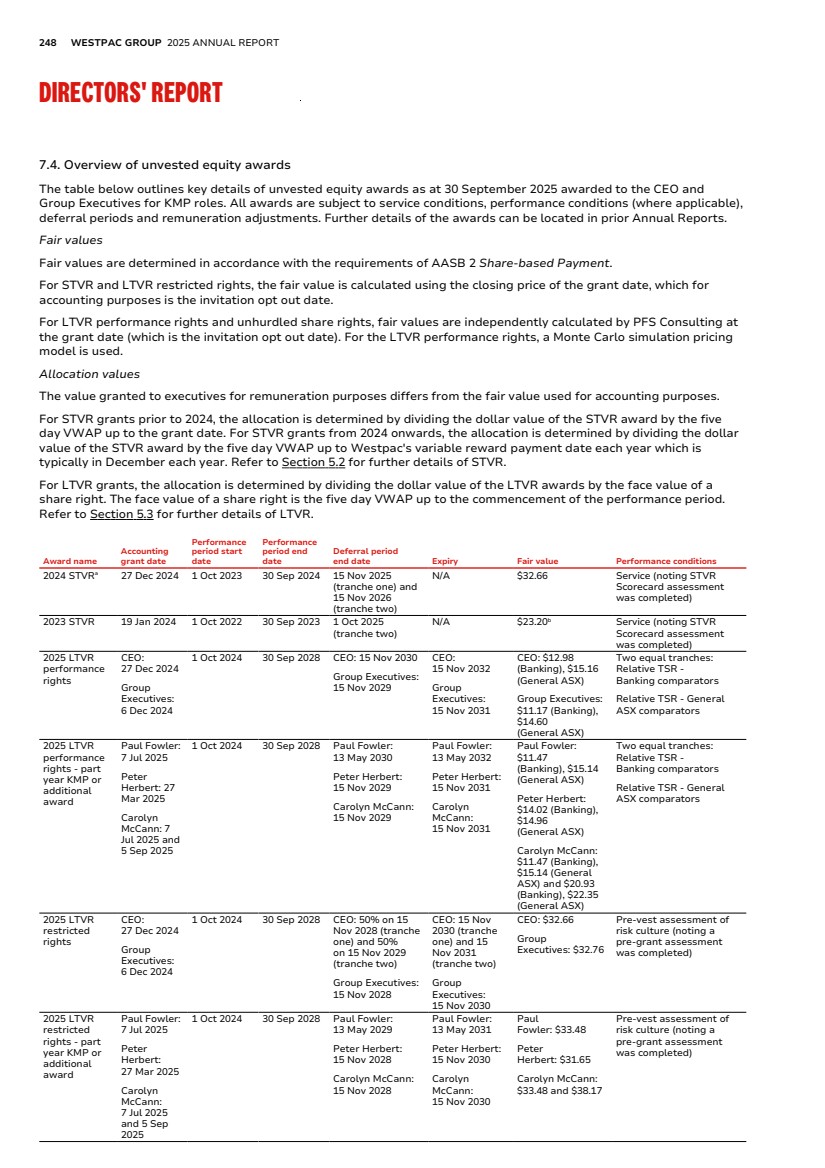
| FINANCIAL REPORT EXHIBITS INDEX STRATEGIC REVIEW PERFORMANCE REVIEW EXHIBIT 15.4 ADDITIONAL INFORMATION 249 Award name Accounting grant date Performance period start date Performance period end date Deferral period end date Expiry Fair value Performance conditions 2024 LTVR performance rights 19 Jan 2024 1 Oct 2023 30 Sep 2027 CEO: 15 Nov 2029 Group Executives: 15 Nov 2028 CEO: 15 Nov 2031 Group Executives: 15 Nov 2030 $12.81 Relative TSR 2024 LTVR restricted rights 19 Jan 2024 1 Oct 2023 30 Sep 2027 CEO: 50% on 15 Nov 2027 (tranche one) and 50% on 15 Nov 2028 (tranche two) Group Executives: 15 Nov 2027 CEO: 15 Nov 2029 (tranche one) and 15 Nov 2030 (tranche two) Group Executives: 15 Nov 2029 $23.20 Pre-vest assessment of risk culture (noting a pre-grant assessment was completed) 2023 LTVR performance rights 15 Dec 2022 1 Oct 2022 30 Sep 2026 25 Oct 2026 1 Oct 2037 $11.90 Relative TSR 2022 LTVR performance rightsc CEO: 16 Dec 2021 Group Executives: 15 Dec 2021 1 Oct 2021 30 Sep 2025 1 Nov 2025 1 Oct 2036 CEO: $5.81 Group Executives: $5.82 Relative TSR Acting Group Executive awards 2025 LTVR restricted shares Peter Herbert: 27 Dec 2024 Carolyn Hoy: 14 Aug 2025 Megan Rutter: 14 Aug 2025 1 Oct 2024 30 Sep 2028 Peter Herbert: 15 Nov 2028 (tranche one) and 15 Nov 2029 (tranche two) Carolyn Hoy: 13 May 2029 (tranche one) and 13 May 2030 (tranche two) Megan Rutter: 3 Jun 2029 (tranche one) and 3 Jun 2030 (tranche two) N/A Peter Herbert: $32.66 Carolyn Hoy: $36.04 Megan Rutter: $36.04 Service with a pre-grant risk assessment Other awards 2025 Buy out restricted shares - Kate Deed 12 Sep 2025 N/A N/A 1 Mar 2027 (tranche one), 1 Mar 2028 (tranche two), 6 Aug 2029 (tranche three and four), 6 Aug 2030 (tranche five and six) N/A $38.48 Service to 1 Jan 2026 (tranche four and six), 1 Mar 2027 (tranche one, two, three and five) 2025 Buy out restricted shares - Paul Fowlerd 7 Jul 2025 N/A N/A 1 Sep 2026 (tranche two), 13 May 2029 (tranche three to five), 13 May 2030 (tranche six to eight) N/A $33.48 Service to 1 Sep 2026 (tranche two, three and six), 1 Sep 2027 (tranche four and seven), 1 Sep 2028 (tranche five and eight) 2024 UNITE share rights - Peter Herbert 31 Oct 2024 1 Oct 2024 30 Sep 2028 15 Nov 2029 15 Nov 2031 $25.12 UNITE program deliverables and performance metrics 2023 restricted shares - Ryan Zanin 19 Jan 2024 N/A N/A 24 Jan 2026 (tranche one), 24 Jan 2028 (tranche two) and 24 Jan 2029 (tranche three) N/A $23.20 Service to 22 Jan 2026 a. The 2024 STVR award for Peter King was granted on 12 December 2024 with a fair value of $31.96. STVR for Catherine McGrath was granted as share rights with a fair value of $31.28 for tranche one and $29.79 for tranche two. b. For Catherine McGrath, STVR was granted with a fair value of $21.18. c. We tested the 2022 LTVR performance rights on 1 October 2025. Our TSR for the four year performance period was 77% resulting in a 62.5th percentile ranking relative to the comparator group. This resulted in 75% of the 2022 LTVR award vesting. Carolyn McCann was granted an additional 2022 LTVR award on 4 March 2022 to recognise an expanded role at a fair value of $8.05. Ryan Zanin's pro rata 2022 LTVR award was granted after his commencement on 17 May 2022 at a fair value of $9.32 and is due to vest on 4 February 2026. d. Buy out awards are subject to remuneration adjustments. Restricted shares granted as part of buy out awards are eligible to receive dividends. |
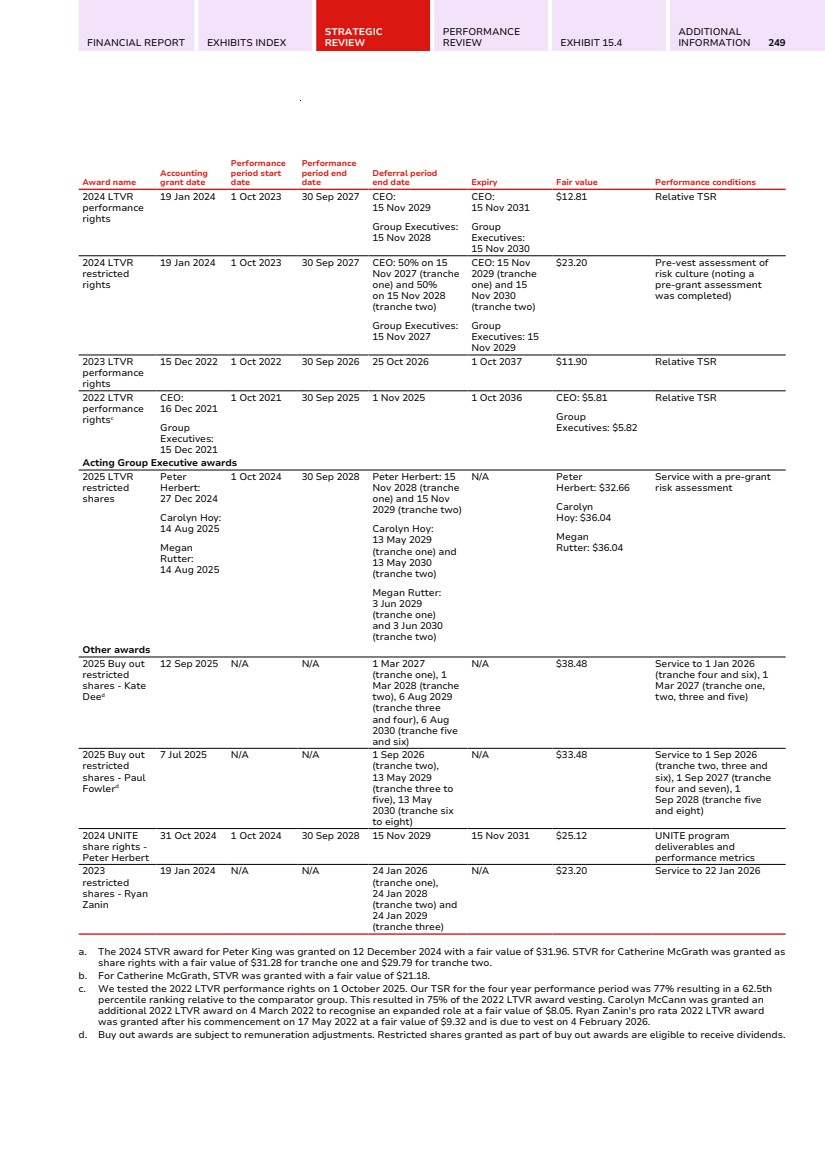
| 250 WESTPAC GROUP 2025 ANNUAL REPORT DIRECTORS' REPORT 7.5. Details of Westpac equity holdings of Non-executive Directors The table below sets out details of relevant interests in Westpac ordinary shares held by Non-executive Directors (including their related parties) during the year ended 30 September 20251 . Number held at start of the year Changes during the year Number held at end of the year Non-executive Directors Steven Gregg 75,208 - 75,208 Tim Burroughs 67,302 - 67,302 Nerida Caesar 13,583 - 13,583 David Cohena n/a - 1,253 Pip Greenwooda n/a - - Debra Hazeltona,b n/a 1,150 1,350 Andy Maguire - 6,615 6,615 Peter Nash 15,360 - 15,360 Margaret Sealec 26,158 - 26,158 Michael Ullmer AOd 12,570 - 12,570 Former Non-executive Directors Audette Exel AOa 11,952 - n/a Nora Scheinkestela 17,225 - n/a a. The information relates to the period the individual was a KMP. Refer to Section 2 for further details. b. In addition to holding ordinary shares, Debra Hazelton and her related parties held interests in 10 Westpac Capital Notes 7 (ASX:WBCPJ), 16 Westpac Capital Notes 9 (ASX:WBCPL) and 2 Westpac Capital Notes 10 (ASX:WBCPM) at year end. c. In addition to holding ordinary shares, Margaret Seale and her related parties held interests in 100 Westpac Capital Notes 7 (ASX:WBCPJ) at year end. d. In addition to holding ordinary shares, Michael Ullmer AO and his related parties held interests in 300 Westpac Capital Notes 9 (ASX:WBCPL) and 1,000 Westpac Subordinated Notes at year end. 1. Other than as disclosed above, no share interests include non-beneficially held shares. |
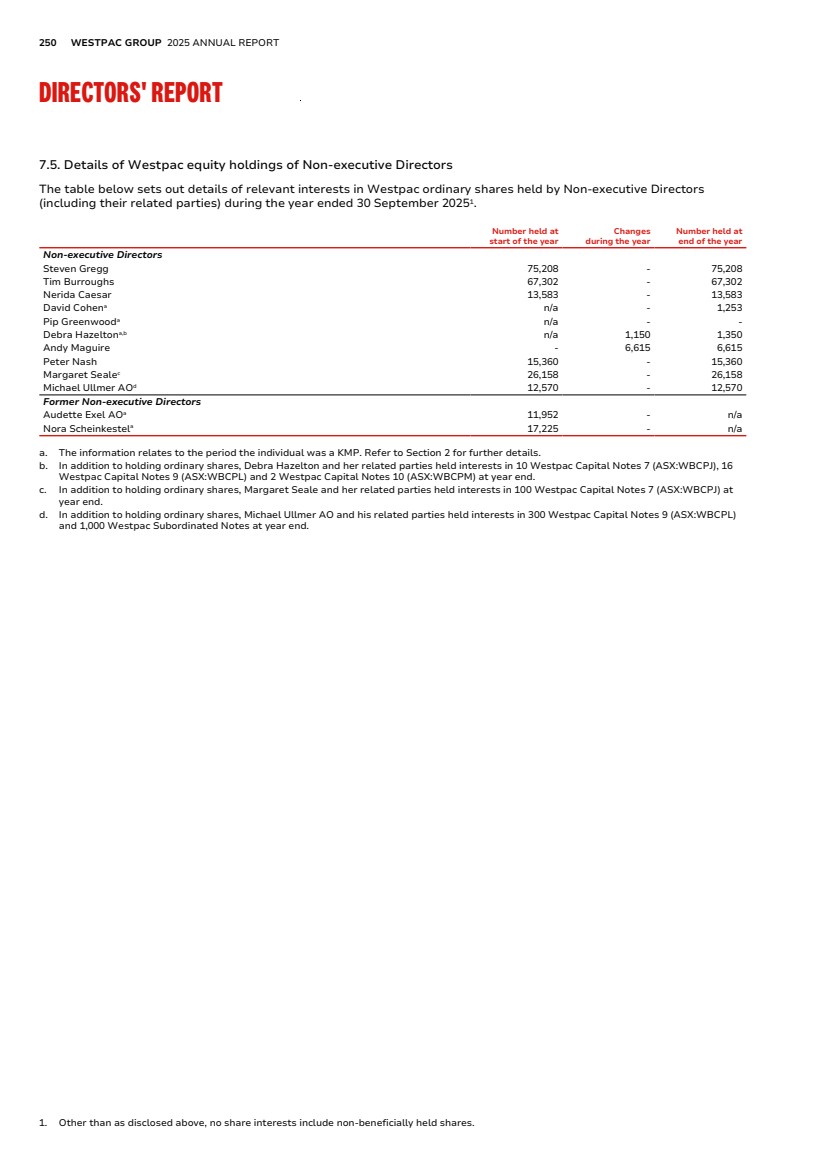
| FINANCIAL REPORT EXHIBITS INDEX STRATEGIC REVIEW PERFORMANCE REVIEW EXHIBIT 15.4 ADDITIONAL INFORMATION 251 7.6. Details of Westpac equity holdings of executive Key Management Personnel The table below details Westpac equity held and movement in that equity by the CEO and Group Executives (including their related parties) for the year ended 30 September 20251 . Name Type of equity-based instrument Number held at start of the year Number granted during the year as remuneration Received on exercise and/or exercised during the year Number forfeited or lapsed during the year Other changes during the year Number held at end of the year Number vested and exercisable at end of the year Managing Director & Chief Executive Officer Anthony Miller Ordinary shares 186,263 14,662 60,246 - - 261,171 - Restricted rights 42,318 48,756 - - - 91,074 - Performance rights 349,471 48,758 (60,246) (60,246) - 277,737 - Group Executives Scott Collary Ordinary shares 140,543 15,598 60,307 - - 216,448 - Restricted rights 42,863 28,048 - - - 70,911 - Performance rights 358,820 28,048 (60,307) (60,307) - 266,254 - Kate Deea Ordinary shares n/a 19,351 - - - 19,351 - Restricted rights n/a - - - - - - Performance rights n/a - - - - - - Paul Fowlera Ordinary shares n/a 83,979 - - - 83,979 - Restricted rights n/a 9,522 - - - 9,522 - Performance rights n/a 9,522 - - - 9,522 - Peter Herberta Ordinary shares n/a 22,726 - (9,398) (11,000) 66,204 - Restricted rights n/a 10,812 - - - 10,812 - Performance rights n/a 10,813 - (22,222) - 13,412 - Carolyn Hoya Ordinary shares n/a 4,176 - (2,446) - 70,937 - Restricted rights n/a - - - - - - Performance rights n/a - - - - - - Nell Hutton Ordinary shares 165,060 15,398 - - (26,474) 153,984 - Restricted rights 42,318 27,691 - - - 70,009 - Performance rights 42,319 27,692 - - - 70,011 - Carolyn McCann Ordinary shares 111,091 13,420 35,965 - - 160,476 - Restricted rights 35,182 26,150 - - - 61,332 - Performance rights 225,642 26,150 (35,965) (35,964) - 179,863 - Catherine McGrath Ordinary shares - - - - - - - Unhurdled share rights 31,471 10,277 - - - 41,748 22,931 Restricted rights 31,670 22,035 - - - 53,705 - Performance rights 165,153 22,035 - - - 187,188 - Michael Rowland Ordinary shares 55,516 15,352 49,708 - (49,708) 70,868 - Restricted rights 33,157 22,184 - - - 55,341 - Performance rights 283,638 22,184 (49,708) (49,707) - 206,407 - Ryan Zanin Ordinary shares 53,236 20,674 - - - 73,910 - Restricted rights 44,210 30,204 - - - 74,414 - Performance rights 195,145 30,205 - - - 225,350 - Former Executives Peter Kinga Ordinary shares 262,333 29,907 93,567 - - n/a n/a Restricted rights 82,977 - - - - n/a n/a Performance rights 552,274 - (93,567) (93,567) - n/a n/a Christine Parkera Ordinary shares 70,407 12,791 45,673 - (45,637) n/a n/a Restricted rights 27,098 17,731 - - - n/a n/a Performance rights 254,053 17,732 (45,673) (45,672) - n/a n/a Megan Ruttera Ordinary shares n/a - - - - n/a n/a Restricted rights n/a - - - - n/a n/a Performance rights n/a - - - - n/a n/a Jason Yettona Ordinary shares 78,446 13,588 62,865 - - n/a n/a Restricted rights 42,318 27,691 - - - n/a n/a Performance rights 354,709 27,692 (62,865) (62,865) - n/a n/a a. The information relates to the period the individual was a KMP. Refer to Section 2 for further details. 1. The highest number of shares held by an individual in the table is 0.0076% of total Westpac ordinary shares outstanding as at 30 September 2025. |
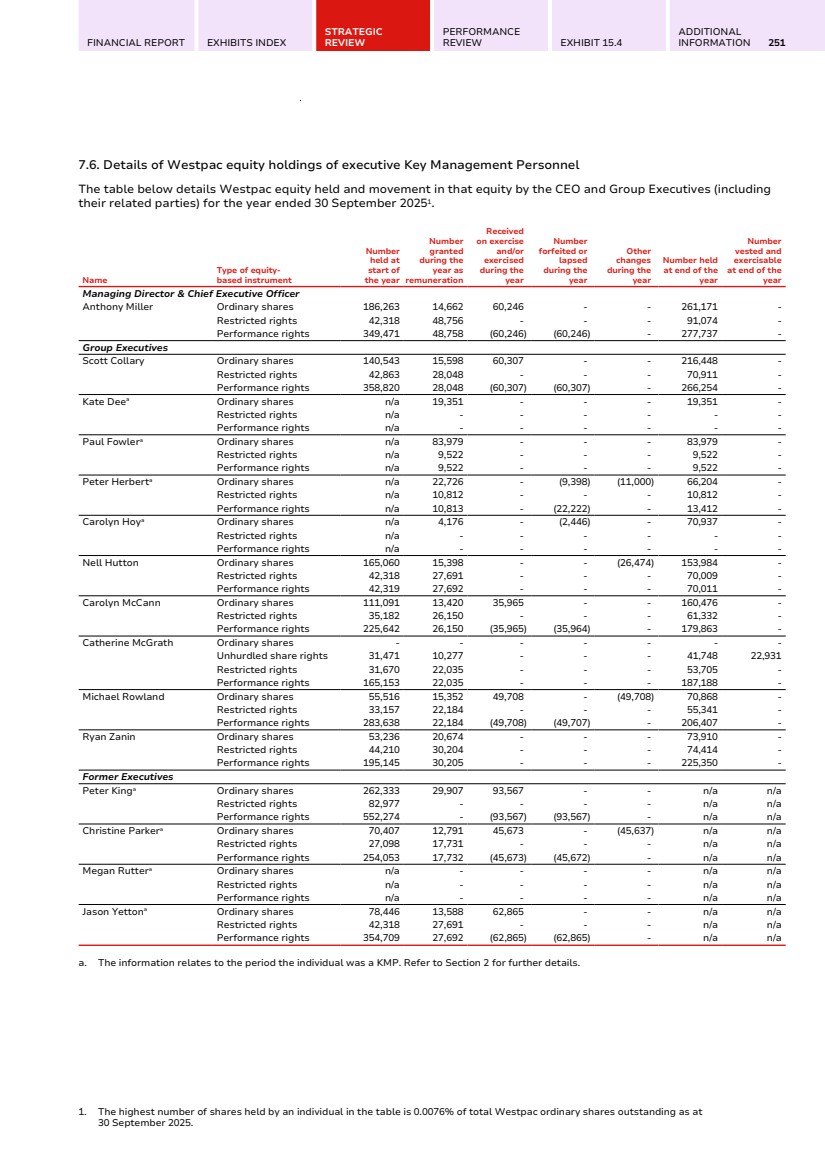
| 252 WESTPAC GROUP 2025 ANNUAL REPORT DIRECTORS' REPORT 7.7. Loans to Non-executive Directors and executive Key Management Personnel Financial instrument transactions are provided in the ordinary course of business. These transactions are at arm's-length on terms and conditions as they apply to all employees. The table below details loans to Non-executive Directors, the CEO and Group Executives (including their related parties) of the Group. Balance at start of the year $ Interest paid and payable for the year $ a Interest not charged during the year $ Balance at end of the year $ Number in Group at end of the year Non-executive Directors 3,012,367 219,801 - 5,164,496 3 CEO and Group Executives 29,051,817 783,342 - 10,650,782 8 Total 32,064,184 1,003,143 - 15,815,278 11 a. Interest paid considers the impact of offset accounts. The table below details KMP (including their related parties) with aggregate loans above $100,000 during 2025. Balance at start of the year $ Interest paid and payable for the year $ a Interest not charged during the year $ Balance at end of the year $ Highest indebtedness during the year $ Non-executive Directors Pip Greenwoodb n/a 18,824 - 1,810,489 1,810,489 Peter Nash 2,498,978 174,905 - 2,901,009 3,651,731 Margaret Seale 413,389 26,072 - 452,998 464,906 CEO and Group Executives Anthony Miller 1,389,164 233 - 1,255,659 1,389,164 Scott Collary 2,166,513 37,935 - 1,926,836 2,179,191 Kate Deeb n/a 18,958 - 2,397,798 2,400,949 Paul Fowlerb n/a 1,602 - 3,330,621 3,330,621 Nell Hutton 14,432,940 456,000 - - 14,439,811 Carolyn McCann 3,250,672 117,003 - 1,717,986 3,254,146 Former Executives Peter Kingb 1,158,000 - - n/a 1,158,000 Christine Parkerb 5,396,236 91,899 - n/a 5,396,236 Megan Rutterb n/a 6,160 - n/a 684,947 Jason Yettonb 1,258,292 53,407 - n/a 1,477,283 a. Interest paid considers the impact of offset accounts. b. The information relates to the period the individual was a KMP. Refer to Section 2 for further details. Other transactions relating to KMP Accrual for dividend equivalent payments The non-current liability owing as a result of dividend equivalent payments that have been accrued for the 2024 LTVR restricted rights and the 2025 LTVR restricted rights was $821,065 as at 30 September 2025. Details of the LTVR restricted rights can be found in Section 5.3.1. Other financial instrument transactions Other financial instrument transactions relating to personal banking activities occur from time to time in the ordinary course of business with KMP and their relevant related parties. These transactions principally involve personal banking and deposit transactions, and financial and investment services. These transactions are on normal commercial terms and conditions no more favourable than those provided to other employees and customers. |
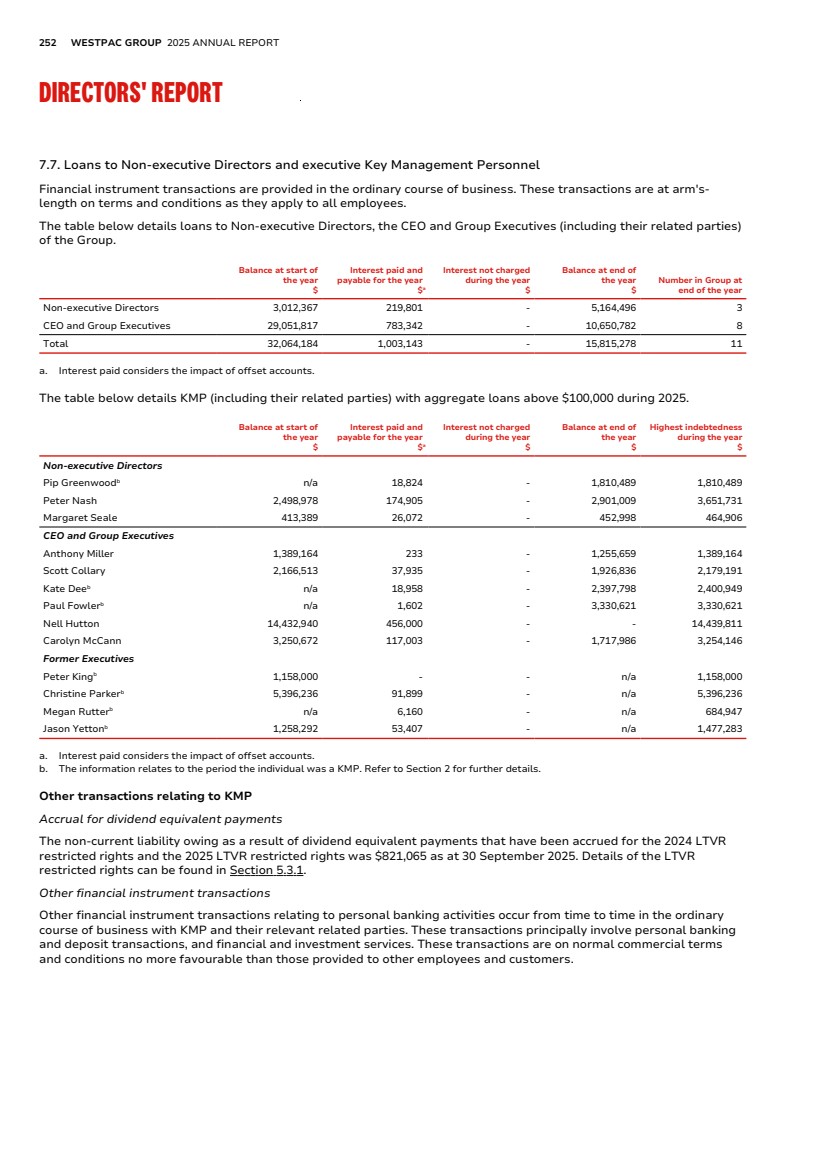
| FINANCIAL REPORT EXHIBITS INDEX STRATEGIC REVIEW PERFORMANCE REVIEW EXHIBIT 15.4 ADDITIONAL INFORMATION 253 Auditor Non-audit services We engage KPMG on assignments additional to their statutory audit duties where their expertise or experience with Westpac or a controlled entity is important. Details of the non-audit service amounts paid or payable for non-audit services provided by KPMG during the 2025 financial year and PricewaterhouseCoopers (PwC) during the 2024 financial year are set out in Note 33 (page 119) to the financial statements. KPMG also provides audit and non-audit services to non-consolidated entities, non-consolidated trusts of which a Westpac Group entity is trustee, manager or responsible entity and non-consolidated superannuation funds or pension funds. The fees in respect of these services were approximately $0.2 million in total to KPMG and $6.4 million to PwC (2024: $6.6 million to PwC). KPMG may also provide audit and non-audit services to other entities in which Westpac holds a minority interest and which are not consolidated. Westpac is not aware of the amount of any fees paid to KPMG by those entities. Westpac has a policy on engaging KPMG for audit and non-audit services, details of which are set out in its 2025 Corporate Governance Statement in the section ‘Engagement of the external auditor’. The Board has considered the position and, in accordance with the advice received from the Board Audit Committee, is satisfied that the provision of the non-audit services during 2025 by KPMG is compatible with the general standard of independence for auditors imposed by the Corporations Act. The Directors are satisfied, in accordance with advice received from the Board Audit Committee, that the provision of non-audit services by KPMG, as set out above, did not compromise the auditor independence requirements of the Corporations Act for the following reasons: • all non-audit services provided by KPMG for the year have been reviewed by the Board Audit Committee, which is of the view that they do not impact the impartiality and objectivity of KPMG; and • based on quarterly independence declarations made by KPMG to the Board Audit Committee during the year, none of the services undermine the general principles relating to auditor independence including reviewing or auditing KPMG’s own work, acting in a management or a decision-making capacity for the company, acting as advocate for the company or jointly sharing economic risk and rewards. The Directors’ Report is signed in accordance with a resolution of the Board of Directors. Steven Gregg Chairman 2 November 2025 Anthony Miller Managing Director & Chief Executive Officer 2 November 2025 |
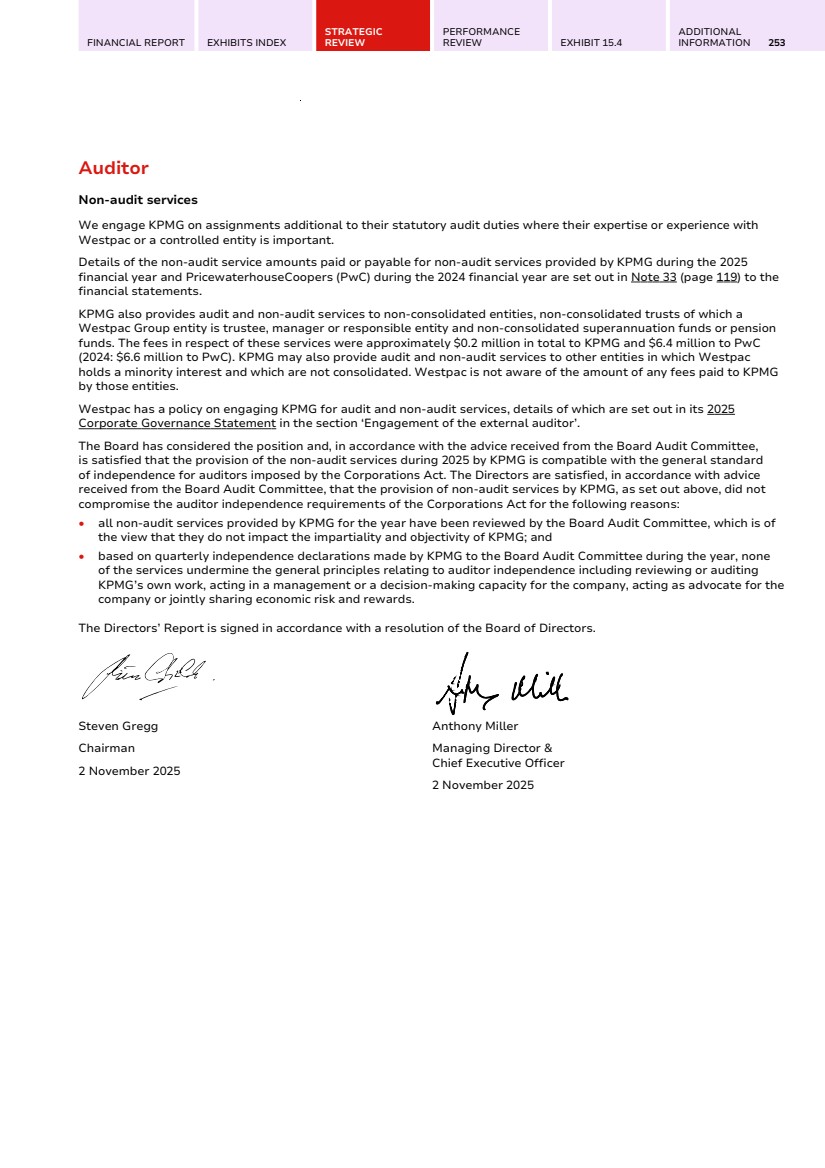
| 254 WESTPAC GROUP 2025 ANNUAL REPORT RISK FACTORS Our business is subject to risks that can adversely impact our financial performance, financial condition and future performance. The 2025 Annual Report Annual Report sets out our approach to managing risks, major risk categories that could impact our business, as well as key focus areas. The 2025 Risk Factors provides investors and potential investors with further information in relation to our current and emerging risks, as well as potential consequences if those risks materialise. The content of the 2025 Risk Factors is current as of the publication date, but its relevance may be impacted by subsequent developments. Risks and risk management strategies are inherently dynamic, evolving alongside changes in the external environment, market conditions and organisational priorities. The risks and uncertainties described below are not exhaustive and can emerge together or in quick succession, uncorrelated with the below order. Additional risks and uncertainties that we are currently unaware of or deem immaterial, may also become important factors that affect us. If any of the following risks materialise, our business, prospects, reputation, financial performance or financial condition could be materially adversely affected, which may subsequently cause the price of our securities or the level of dividends to decline and, as a security holder, you could lose all, or part, of your investment. You should carefully consider the risks described (individually and in combination) and the other information in the 2025 Risk Factors and in the 2025 Annual Report and subsequent disclosures before investing in, or continuing to own, our securities. Risks relating to our business1 We have experienced, and could in the future experience, information security risks, including cyberattacks - Cyber risk - Cyber attacks - Operational risk - Information security risks - Data breaches - Third party risk Our operations depend on the secure processing, storage and transmission of information on our systems and those of external suppliers. Despite protective measures, including to protect the confidentiality, availability and integrity of our information, our information assets may face security breaches, unauthorised access, malware, social engineering, denial of service attacks, ransomware, destructive attacks, employee misconduct, human error or other external and internal threats. These could adversely impact our and others’ confidential information and system availability. Information security risks are heightened by factors such as new technologies, increased digitisation, larger volumes of sensitive data, sophisticated cyber crime, supply chain disruptions, remote and hybrid working, targeting of critical infrastructure providers, geopolitical tensions, terrorism, state sponsored attacks, and AI-enhanced cyberattacks (which can increase the speed, breadth, complexity and effectiveness of cyberattacks). These factors could compromise our information assets and disrupt operations for us, our customers, suppliers and counterparties. Adverse events such as data breaches, cyberattacks, espionage and errors (including human-related), are increasing in frequency and impact, potentially causing financial instability, reputational damage, service disruption, contagion risk, in addition to economic and non-economic losses to us, our customers, shareholders, suppliers, counterparties and others. Our protective systems and processes have not always been, and may not always be, effective and human error can occur. Westpac, our customers and other stakeholders could suffer losses from cyberattacks, information security breaches or ineffective cyber resilience. Consequences could be severe if customer data is being held in breach of legal or regulatory obligations and that data is compromised as part of an information security incident. We may not always predict, prevent or effectively respond to such incidents, or effectively respond to and/or rectify the resulting damage. Our suppliers, counterparties, and other parties involved in or who facilitate our activities, financial platforms and infrastructure as well as our customers’ suppliers and counterparties are also at risk, which could impact us. As cyberattacks increase globally, so does the likelihood of regulatory enforcement and legal actions, including class actions related to information security failures, misleading disclosures, or deficient responses to incidents. Consequences of attacks could include damage to technology infrastructure (including data centres), government intervention, service disruptions, loss of customers and market share, data loss, cyber extortion, customer remediation and/or compensation, breaches of the law or other obligations, vulnerability to fraud or scams, litigation, fines, and increased regulatory scrutiny or other enforcement action. 1. A reference to "customer" in this document includes a "member", as appropriate. |
| FINANCIAL REPORT EXHIBITS INDEX STRATEGIC REVIEW PERFORMANCE REVIEW EXHIBIT 15.4 ADDITIONAL INFORMATION 255 Such outcomes could negatively affect our business, prospects, reputation, financial performance or financial condition. As cyber threats evolve, we may need to allocate significant resources and incur additional costs to enhance our systems, address vulnerabilities or incidents and respond to regulatory changes. We could suffer losses due to geopolitical events - Geopolitical risks - Conflicts - Operational risk - Credit risk We, our customers and our suppliers operate businesses, engage in trade with and hold assets in different geographic locations. Significant risks subsist including from geopolitical instability, conflicts, trade tensions, tariffs, sanctions, social disruption, civil unrest, war, terrorist activity, acts of international hostility, and complicity with or inaction regarding certain types of crimes. Such events or the uncertainty related to the potential for such events are and could continue to directly and indirectly impact our and our customers’ operations, affect domestic and international economic stability and/or impact consumer and investor confidence, which in turn could disrupt industries, businesses, service providers and supply chains and ultimately adversely impact economic activity. Potential outcomes include material labour shortages, higher energy costs and commodity prices, volatility in markets, damage to property and disruptions where essential services, logistics and infrastructure are materially impacted. Such impacts could affect asset values and impact customers’ repayment ability, and our ability to recover amounts owing. All of these impacts could adversely affect our business, prospects, financial performance or financial condition. The current global landscape, marked by significant and prolonged conflicts, increasing protectionist policies (and uncertainties surrounding such policies) and heightened tensions, risks further intensifying these impacts . We could be adversely affected by legal or regulatory change - Compliance and conduct risk - Regulators' expectations - Legal and regulatory change - Fines, penalties, other costs and capital overlays We operate in a highly regulated industry with an environment of sustained legal and regulatory change and ongoing scrutiny of financial services providers. Our business, prospects, reputation, financial performance and financial condition have been, and could in the future be, adversely affected by domestic and international changes to laws, regulations, policies, supervisory activities, regulator expectations, and industry codes such as the Banking Code of Practice. Such changes may affect how we operate and have altered, and may in the future alter, the way we provide our products and services, sometimes requiring us to change, suspend or discontinue our offerings. Industry-wide reviews and inquiries could further reshape laws, regulations, policy or regulatory expectations. Past and potential effects of such reviews include limiting our flexibility, requiring us to incur substantial costs (e.g. system changes, incurring Compensation Scheme of Last Resort levies, liabilities related to scams, fraud or operational costs relating to scam management or other industry wide issues), absorbing specialist resources, impacting profitability and requiring us to retain additional capital, which impacts our ability to pursue strategic initiatives or implement other changes, resulting in us being unable to increase or maintain market share and/or creating pressure on margins and fees. A failure to manage legal or regulatory changes effectively and in the timeframes required has resulted, and could in the future result, in the Group not meeting its compliance obligations. It could also result in enforcement actions, penalties, fines, civil litigation, capital impacts, and ultimately loss of or variations to business licences. Frequent and large volumes of regulatory change also contribute to execution risk, as technology, systems and process updates may not always be successful in keeping pace and there is heightened risk of flaws, human error or unintended consequences. Managing these changes may require significant management attention, costs and resources, including the availability of skilled personnel, which may be limited. There is additional information on certain aspects of regulatory changes affecting the Group in the Significant Developments section and in the sections titled ‘Critical accounting assumptions and estimates’ and ‘Future developments’ in Note 1 to the financial statements in the 2025 Annual Report. |
| 256 WESTPAC GROUP 2025 ANNUAL REPORT RISK FACTORS We have been and could be adversely affected by failing to comply with laws, regulations or regulatory policy - Compliance and conduct risk - Regulators' expectations - Legal and regulatory - Industry codes - Fines, penalties and capital overlays We are responsible for complying with all applicable legal and regulatory requirements and industry codes of practice in the jurisdictions where we operate or obtain funding. Our compliance and conduct risks are exacerbated by the complexity and volume of regulation, as well as ongoing regulatory change. These risks increase when there is ambiguity or multiple ways of interpreting our obligations and rights, conflicting laws between jurisdictions or regimes, or where there is limited industry consultation or a lack of regulatory guidance, particularly with respect to new or untested regulations. Our compliance and conduct management system, which is designed to mitigate these risks, has not always been, and may not always be, effective. Breakdowns have occurred, and may in the future occur due to factors such as poor judgement, flaws in the design or implementation of controls or processes, or the implementation of new measures. Such issues can lead to non-compliance (including failures to meet expectations or obligations to appropriately report or provide information to regulators or customers), potentially resulting in adverse outcomes for Westpac, our customers or other stakeholders. Ongoing reviews and change programs continue to identify compliance issues. Compliance and conduct risk has occurred, and could continue to occur, through the provision of products and services (including through our platforms) that may not meet legal or regulatory requirements, third party needs or expectations (including those of our customers, regulators or the market), especially for vulnerable customers, customers in hardship and indigenous customers. This risk has occurred, and could continue to occur, from deliberate, reckless, negligent, accidental or unintentional conduct of our employees, officers, contractors, agents, authorised representatives, credit representatives, trustees (including of our platforms) and/or external service providers, resulting in circumvention of, or inadequate implementation of, controls, processes (including monitoring), policies or procedures. This could occur through a failure to meet professional obligations (including fiduciary, suitability and responsible lending requirements), human error or weaknesses in risk culture, corporate governance or organisational culture or poor product design and implementation (including failing to adequately code or connect our systems with products, failing in whole or in part to consider customer needs or selling products and services outside of target markets). Inadequate supervision and oversight of our distribution channels can heighten these risks. Non-compliance by our people may negatively impact other employees, leading to outcomes including litigation and reputational damage. Additionally, third party conduct (e.g. where customers misrepresent their position on product applications and we have failed to identify it) may limit our recourse and regulatory outcomes may not be mitigated by third party culpability. These factors have resulted, and could continue to result, in poor customer outcomes (including for vulnerable customers and customers in hardship) such as inappropriate charging, failure to meet contractual, or compliance obligations (or to promptly detect, report and/or remedy non-compliance), and other outcomes including impacts which may compromise the integrity of the markets in which we operate or data we report, reputational damage, increased regulatory surveillance or investigation and employment disputes. We are currently subject to a number of investigations, reviews and industry inquiries by, and have and continue to respond to a number of requests from, domestic and international regulators including APRA, ASIC, the ATO, the ACCC, AUSTRAC, BCCC, ACMA, FINRA, AFCA, the OAIC, RBNZ, New Zealand Financial Markets Authority, New Zealand Commerce Commission, the Fair Work Ombudsman, the SEC, BaFin and BPNG’s Financial Analysis and Supervision Unit, involving significant resources and costs, potentially diverting specialist resources from other work. Regulatory reviews and investigations have, and may in the future, result in a regulator taking administrative or enforcement action against us and/or our representatives. Regulators have broad powers and may issue directions (e.g. for product design and distribution and remedial action), pursue civil or criminal proceedings, seek substantial fines and penalties, and other compliance or enforcement outcomes. These risks are heightened (and penalties have been and may be higher) where contraventions are not promptly detected or addressed, where we fail to meet our obligations (or the expectations of regulators), where there are patterns of behaviour indicating systemic conduct or where there has been an awareness of contraventions, especially in areas of heightened regulatory focus, such as vulnerable customers, customers in hardship and indigenous customers. Additionally, regulatory investigations may lead to adverse findings against directors and management, including potential disqualification. The resources allocated to these reviews and investigations can impede other activities, including change and remediation programs. APRA can require, and has required, us to hold additional capital either through a capital overlay or higher risk weighted assets (including in response to a failure to comply with prudential standards and/or expectations in relation to, for example, stress testing and liquidity management). Capital overlays could have an adverse impact on our financial performance. |

| FINANCIAL REPORT EXHIBITS INDEX STRATEGIC REVIEW PERFORMANCE REVIEW EXHIBIT 15.4 ADDITIONAL INFORMATION 257 The evolving political and regulatory landscape has seen (and may continue to see) expansion of regulators’ powers, materially increased civil penalties and fines and increased criminal prosecutions against institutions and/or their employees and representatives (including where there is no fault element). This could also result in reputational damage and impact the willingness of customers, investors and other stakeholders to deal with us. Given our size and scale of activities, a failure by us may result in multiple contraventions, which could lead to significant penalties, remedial action and other consequences (e.g. regulatory damage). Regulatory investigations or actions commenced against the Group have exposed, and may in the future expose, the Group to an increased risk of litigation brought by third parties (including through class action proceedings), which may require us to pay (sometimes substantial) compensation to third parties and/or to undertake further remediation activities. Market developments suggest there is an expanding scope for potential claims, including in relation to cyber incidents, financial crime and ESG issues. We have incurred significant remediation costs on a number of occasions (including compensation payments and costs of correcting issues) and new issues may arise requiring remediation. We have faced, and may continue to face, challenges in effectively and reliably scoping, quantifying and implementing remediation activities (whether or not such activities are prompted by a regulator), including determining how to compensate impacted parties properly, fairly and in a timely way. Investigation of the underlying issue may be impeded due to the passage of time, technical system constraints, or inadequacy of records. Delays in remediation may occur due to factors such as the number of affected parties and their responsiveness, ongoing investigations or litigation, and regulatory requirements. Remediation programs may not prevent regulatory action or investigations, litigation or other proceedings from being pursued, or sanctions being imposed. Regulatory investigations, inquiries, litigation, fines, penalties, infringement notices, disclosures, revocation, suspension or variation of conditions of regulatory licences or other enforcement or administrative action or agreements (such as enforceable undertakings) have and could, either individually or in aggregate with other regulatory action, adversely affect our business, prospects, reputation, financial performance or financial condition and increase class action risk. There is additional information on certain regulatory and other matters that may affect the Group in the Significant Developments section and in Note 25 to the financial statements in the 2025 Annual Report. We have suffered, and in the future could suffer, losses and be adversely affected by the failure to implement effective risk management - Risk management - Controls and processes - Risk culture - Risk governance - Fines, penalties Our risk management framework has not always been, and may not in the future be, fully effective. Resources allocated to identifying, measuring, evaluating, monitoring, reporting, controlling or mitigating material risks may sometimes be inadequate. This may arise due to inadequacies in the design of the framework or key risk management policies, controls and processes, the design or operation of our remuneration structures and consequence management processes, technology failures, our corporate structure, incomplete implementation or embedment, or failure by our people (including contractors, agents, authorised representatives and credit representatives) to comply with or properly implement our policies and processes. The potential for these types of failings is heightened if we lack sufficiently skilled, trained or qualified personnel or capacity, including people, processes and technology, to appropriately manage risks. Although we periodically review our risk management framework to determine if it remains appropriate, all risk management frameworks have inherent limitations (and may also be ineffective because of weaknesses in risk culture or governance), and some risks may exist or emerge that we have not anticipated or identified. For example, where there is a lack of awareness of our policies, controls and processes or where they are not adequately complied with, monitored, audited or enforced. This may result in poor decision-making or risk and control weaknesses not being identified, escalated or acted upon. Risks are measured and monitored against our risk appetite, and when outside of appetite, we aim to take steps to bring such risks back into appetite, including framework and policy design improvements. However, bringing risks back within appetite may be delayed or ineffective, due to factors including complexity, information technology system enhancement delays, staffing constraints (including where staff are occupied by other regulatory change or remediation projects), operational failures or external factors beyond our control, resulting in certain risks remaining outside of appetite for periods of time. If any of our governance or risk management processes and procedures prove ineffective or inadequate or are not appropriately implemented or we fail to bring risks into appetite, we may face sustained or increased regulatory scrutiny and action. While a stronger risk culture fosters early self-identification and remediation, it may also highlight concerns that trigger further regulatory action. This may result in financial losses, additional capital requirements, compliance breaches, fines, reputational damage, and/or significant remediation, which could adversely affect our business, prospects, financial performance or financial condition. |
| 258 WESTPAC GROUP 2025 ANNUAL REPORT RISK FACTORS We could suffer losses due to technology failures - Operational risk - Information and technology - Change management - Technology failure - UNITE program - Outages Maintaining the reliability, availability, integrity, confidentiality, security and resilience of our information and technology is crucial to our business. Despite existing processes to preserve, monitor and facilitate the availability of and recovery of, our systems, there is a risk that our information and technology systems may be inadequate, could be compromised, fail to operate properly or result in outages, including from events wholly or partially beyond our control. A technology deficiency or failure could lead to failures to meet contractual, legal or compliance obligations (such as a requirement to issue communications, retain records and/or data for a certain period, or to destroy records and/or data after a certain period, or other risk management, privacy, business continuity management or outsourcing obligations). Our stakeholders, including employees and customers may be adversely affected, including by being unable to access or be covered by our or a third party’s products or services (or being inappropriately charged for them), as a result of systems failures, privacy breaches, or the loss of personal data. This could result in business disruption, reputational damage, financial loss, remediation costs, regulatory investigations and/or action, or others commencing litigation. Technology issues in the financial sector can also affect multiple institutions, meaning we could impact, or be impacted by, other institutions. The use of legacy systems, as well as work underway to uplift our technological capabilities, may heighten transfer risks, the risk of a technology failure, change management issues and the risk of non-compliance with our regulatory obligations or poor customer outcomes. Projects aimed at simplifying/streamlining our systems (including our UNITE program) will require significant resources (including specialist expertise) and incur costs. These risks may be heightened while those projects are being undertaken, or post-implementation where there are unanticipated outcomes or impacts. These projects may also not be completed on time, may not deliver the expected benefits or may require further resources or funding than anticipated. The success of such projects relies in part on having robust governance arrangements and appropriate oversight at Board and senior executive level. Shortcomings in these areas could elevate the risk of regulatory non-compliance, poor customer outcomes, delays, increased costs or demand on resources. Failure to regularly renew and enhance our technology to deliver new products and services, comply with regulatory obligations and ongoing regulatory changes, improve automation of systems and controls, meet our customers’ and regulators’ expectations, or to effectively implement new technology projects, could result in cost and time overruns, technology failures (including due to human error in implementation), reduced productivity, outages, operational failures or instability, compliance failures, reputational damage and/or loss of market share. Climate change and other sustainability factors such as human rights and natural capital may have adverse effects on our business - Climate and nature risks - Physical and transition risks - Social and human rights risks - Credit risk - Operational risk - Reputational and sustainability risk - Compliance and conduct risks Climate and other sustainability-related risks have had and are likely to have adverse effects on us, our customers, external suppliers, and the communities in which we operate. Managing these risks is challenging given significant uncertainties in modelling and impact assessment. Climate related risks may manifest as physical risks, transition risks or liability risks. Physical risks include direct risks to us, our customers, suppliers and other stakeholders. These risks could arise from increases and variability in temperatures, precipitation changes, rising sea levels, loss of natural capital or biodiversity loss, and more severe and frequent climatic events, including fires, storms, floods and droughts. Such events could also increase human rights risk and/or increase customer vulnerability. Impacts may arise through damage, disruption or changes to business activities, operations, asset values and insurability of assets (or insurance availability/affordability), resulting in higher costs and/or reduced revenues to ourselves or customers. In turn, impacts on customers could lead to higher impairment charges in our lending portfolio. Transition risks may arise through the transition to a lower carbon economy, which in turn could impact Westpac through changes such as in consumer behaviour and market sentiment. These risks may emerge gradually and orderly, or abruptly and disorderly, or a combination of both. Impacts could result from climate change mitigation |

| FINANCIAL REPORT EXHIBITS INDEX STRATEGIC REVIEW PERFORMANCE REVIEW EXHIBIT 15.4 ADDITIONAL INFORMATION 259 efforts, the obsolescence of certain businesses due to the energy transition, changes in investor appetite, shifting customer preferences, technology developments and regulatory changes. Such risks could also emerge through lending to customers facing reduced revenues, asset devaluation and rising costs, thereby increasing our credit risk. Additionally, Westpac may be impacted by transition risks, and from adverse effects to the broader economy including as they relate to interest rates, inflation and growth (or lack thereof). Our ambition to become a net-zero, climate resilient bank, has led and will continue to lead to changes in policies and processes which may pose execution risk. Our ability to meet our ambition and targets depends partly on the broader economy’s orderly transition to net-zero, which may be impacted by external factors including (but not limited to) government policies, investment levels, electricity grid capacity, and constraints in the development and supply of technology, infrastructure and skilled labour. Our transition efforts, including to meet our targets and commitments, may also be impacted by the challenges faced by customers in executing their transition plans. Natural capital loss, referring to the depletion of renewable and non-renewable natural resources that combine to yield a flow of benefits to people, poses a risk to us. This risk emerges primarily through our exposure to customers that are materially dependent on or may impact natural resources. This loss can contribute to, and be accelerated by, climate change. Increasing recognition and response to this risk also create heightened regulatory and stakeholder expectations on Westpac. We may be exposed to social and human rights risks through our products and services, operations and supply chain. Failure to identify and manage these risks may cause, contribute to, or be directly linked to adverse social and human rights impacts. This includes the risk that we provide services to, or rely on services provided by, parties involved in human rights abuses or criminal activity. There is also the potential exploitation of our platforms and products for illicit purposes. Our ability to identify, assess, and mitigate these risks may be constrained by a range of factors including the increasing sophistication of perpetrators. Data used to assess and manage climate, and other sustainability-related risks continues to mature. Reliance on third party data (which may not be sufficiently available or reliable), may affect our decision making, target setting and reporting, and affect our ability to meet our targets and commitments. Associated risks may increase where disclosure of additional data is required by mandatory reporting. Actual or perceived failure to adapt our strategy, governance, procedures, systems and/or controls to manage or disclose climate and other sustainability-related risks and opportunities (including, for example, perceived misstatement of, or failure to adequately implement or meet, sustainability claims, commitments and/or targets) may give rise to business, reputational, legal and regulatory risks. This includes financial and credit risks that may impact our profitability and outlook, and the risk of regulatory action or litigation (including class actions) against us and/or our customers. We may also be subject, from time to time, to legal and business challenges due to actions instituted by activist or other groups. For example, our financing of businesses that are perceived to be more correlated with climate-related risks and/or that are considered not to be managing these issues responsibly have received feedback from some stakeholders and attracted scrutiny from activists. Scrutiny from regulators, shareholders, activists and other stakeholders on climate-related risk management practices, lending policies, targets and commitments, and other sustainability products, claims and marketing practices will likely remain high. Applicable legal and regulatory regimes, policies, and reporting and other standards are also evolving. For example, in Australia and New Zealand, mandatory climate reporting has been introduced, and there is an increased compliance and enforcement focus by ASIC and the ACCC on a range of issues related to sustainability and sustainable finance, along with the monitoring/investigation of related claims. All of this increases compliance, legal and regulatory risks, and costs. For further detail on the identification, assessment and management of these risks, please refer to the 2025 Sustainability Report, and the Creating Value for the Community, Creating Value for the Environment and Risk Management sections of the 2025 Annual Report. The failure to comply with financial crime obligations has had, and could have further, adverse effects on our business and reputation - Financial crime risk - Bribery and corruption - Tax evasion - Money laundering and terrorism financing - Economic and trade sanctions The Group is subject to a range of financial crime laws across its jurisdictions, including anti-money laundering and counter-terrorism financing (AML/CTF), anti-bribery and corruption, economic and trade sanctions and tax transparency (collectively, Financial Crime Laws). Financial Crime Laws are complex and impose a diverse range of obligations elevating regulatory, operational and compliance risks. In certain jurisdictions (e.g. the Pacific region), financial crime risks are elevated beyond the Group’s risk appetite requiring an appropriate action plan to reduce risk, and to return within appetite. |

| 260 WESTPAC GROUP 2025 ANNUAL REPORT RISK FACTORS The Group must comply with a range of reporting obligations under the Financial Crime Laws, including international funds transfer instructions, threshold transaction reports, suspicious matter reports, Foreign Account Tax Compliance Act (FATCA) and Common Reporting Standard (CRS) reports. The Group must also ensure that we know who our customers are and that we have appropriate ongoing customer due diligence in place. The failure to comply with Financial Crime Laws has had, and in the future could potentially have, adverse impacts for the Group. The Group operates in a constantly evolving landscape, particularly with ongoing legislative reform impacting Financial Crime Laws, emergence of new payment technologies, increased regulatory focus on digital assets, and increasing use of economic and trade sanctions to manage issues of international concern. These developments may require updates to the Group’s systems, policies, processes and controls to manage emerging financial crime risks for the Group, including scams, fraud and technology-enabled crime. The Australian AML/CTF reforms, due to their scale and complexity, will require a multi-year implementation program involving complex technology, policy and control framework updates. The Group is actively engaging with AUSTRAC and is progressing the development of a phased implementation plan. However, implementation risk remains elevated due to the breadth of change and complexity involved. The industry (including Westpac) has challenges meeting the legislation’s effective date of 31 March 2026. Notwithstanding AUSTRAC’s acknowledgement of this and its published regulatory expectations noting that AUSTRAC does not expect immediate compliance, there is a risk that our implementation program or timeframes will not be adequate. Compliance with financial crime obligations remains a regulatory priority. Regulators globally continue to investigate and take enforcement actions for identified non-compliance, often seeking significant penalties. Given the scale and complexity of the Group’s operations, undetected failures or ineffective implementation, monitoring or remediation of a system, policy, process or control (including a regulatory reporting obligation) has resulted, and could in the future result, in a significant number of breaches of AML/CTF or other Financial Crime Laws, which could lead to significant financial penalties and other adverse impacts for the Group, such as reputational damage and litigation risk. While the Group has systems, policies, processes and controls in place designed to manage its financial crime obligations (including reporting obligations), these have not always been, and may not in the future always be, effective, due to reasons such as control deficiencies, technology failures or changes in financial crime risks or typologies. Our analysis, reviews and regulatory feedback, have highlighted that our systems, policies, processes and controls are not always operating satisfactorily in a number of respects and require improvement. The Group continues to have an increased focus on financial crime risk management and, as such, further issues requiring attention have been identified and may continue to emerge. Although the Group provides updates to various regulators on its remediation and other program activities, there is no assurance that those or other regulators will agree that its remediation and program update activities will be adequate or effectively enhance the Group’s compliance programs. Failure to comply with financial crime obligations has resulted, and could in the future result, in significant regulatory enforcement actions, reputational risks and other consequences as detailed in other sections of the 2025 Risk Factors. There is additional information on financial crime matters in the Significant Developments section in the 2025 Annual Report. Reputational damage has harmed, and could in the future harm, our business and prospects - Reputational and sustainability risk - Negative customer outcomes We face reputational risk where our plans, processes, performance and behaviours differ from the expectations, beliefs and perceptions of our stakeholders. Our actions, inactions or associations (or those of our customers, employees, suppliers, contractors, agents, authorised representatives, credit representatives, joint-venture partners, strategic partners or other counterparties) could result in reputational damage when they cause, or are perceived to cause, a negative outcome for customers, shareholders, the community or other stakeholders. This could arise from, for example, failure or perceived failure to adequately monitor, prevent or respond to community, environmental, social and ethical issues or expectations or failure to comply with regulatory requirements or expectations. We are also exposed to contagion risk from incidents in (or affecting) other financial institutions and/or the financial sector more broadly (e.g. issues affecting the cash-in-transit industry and the potential for disruption to the availability of cash, as well as flow on consequences including runs on cash) as well as from others whom we may have relationships with. Failure, or perceived failure, to address issues that could or do give rise to reputational risk, has created, and could in the future create, additional legal risk, including regulatory investigations, regulatory enforcement actions, fines and penalties or litigation or other actions brought by third parties (including class actions), and the requirement to remediate and compensate customers, including prospective customers, investors and the market. It could also result in losing customers or restricting our ability to efficiently access capital markets. This could adversely affect our business, prospects, financial performance or financial condition. |

| FINANCIAL REPORT EXHIBITS INDEX STRATEGIC REVIEW PERFORMANCE REVIEW EXHIBIT 15.4 ADDITIONAL INFORMATION 261 We have and could suffer losses due to litigation - Compliance and conduct risk - Enforcement action - Litigation - Class actions - Substantial fines and penalties Litigation has been, and could in the future be, commenced against us by a range of plaintiffs, such as customers, shareholders, employees, suppliers, counterparties, activists, receivers and regulators and may, either individually or in aggregate, adversely affect the Group’s business, operations, prospects, reputation or financial condition. There could be a range of reasons for litigation, including allegations relating to failure to comply with contractual, legal or regulatory requirements. Recently, there has been an increase in class action proceedings in the broader market, many of which have resulted in significant monetary settlements. The risk of class actions has been heightened by a number of factors, including regulatory enforcement actions and willingness by regulators to commence proceedings, increased regulatory investigations and inquiries, media scrutiny, increased prospect of regulatory reforms (including those that may eliminate any actual or perceived barriers to such litigation), and the growth of third party litigation funding. Class actions commenced against competitors could also lead to similar proceedings against us and may also impact attitudes of counterparties to Westpac proceedings or Westpac’s standing more broadly. There has also been an increase in proceedings related to third party scams and fraud activity, and the bank has been and may be joined to such proceedings, and an increase in shareholder derivative actions. Activism strategies directed at financial institutions, particularly related to climate change, sustainability, diversity equity and inclusion initiatives and energy transition, have also increased globally in recent years. These strategies may involve litigation to highlight issues, enforce legal or regulatory standards, or influence the target’s operations and activities. We are currently, and may continue to be, exposed to such litigation and/or activist strategies. Litigation is subject to many uncertainties, and the outcome may not be predicted accurately. Furthermore, the Group’s ability to respond to and defend litigation may be adversely affected by inadequate record keeping. The Group’s ability to settle litigation on reasonable terms will be affected by attitudes of counterparties. Costs will be incurred associated with managing, responding to and/or defending litigation. Depending on the outcome of any litigation, the Group has been, and may in the future be, required to comply with broad court orders, including compliance orders, adverse publicity orders, enforcement orders or otherwise pay significant damages, fines, penalties or legal costs. The actual amount paid following a settlement or determination by a Court for any legal proceedings may be materially higher or lower than any relevant provision (where applicable) or that any contingent liability may be larger than anticipated. There is also a risk that additional litigation or contingent liabilities arise, all of which could adversely affect our business, prospects, reputation, financial performance or financial condition. There is additional information on certain legal proceedings that may affect the Group in Note 25 to the financial statements in the 2025 Annual Report. We are exposed to adverse funding market conditions - Market risk - Volatility and disruption - Funding and liquidity risk - Credit risk We rely on deposits and global funding markets to fund our business and source liquidity. Our funding costs are subject to funding market and general economic and geopolitical conditions, in addition to our credit profile. Funding market conditions, and the behaviour of market participants, can shift significantly over very short periods of time, resulting in extreme volatility, disruption and decreased liquidity. The main risks we face relate to reduced market confidence, market access, appetite for exposure to Westpac; increased cost of funding; and impacts from deterioration in macroeconomic conditions. Additionally, shifts in investment preferences could result in deposit withdrawals, increasing our reliance on other funding sources. These other sources may offer lower levels of liquidity at higher costs. If market conditions deteriorate due to economic, political, regulatory, or other reasons (including those idiosyncratic to Westpac), there may be a loss of confidence in bank deposits, leading to unexpected withdrawals. These events can transpire quickly and be exacerbated by information transmission on social media. This could increase funding costs, constrain our liquidity, funding and lending activities and threaten our financial solvency. In such events, even robust levels of capital may not be sufficient to safeguard Westpac against detrimental loss of funding. If our current sources of funding become insufficient, we may need to seek alternatives, subject to market conditions, our credit ratings, reputation and confidence issues, and market capacity. These alternatives may be more expensive |
| 262 WESTPAC GROUP 2025 ANNUAL REPORT RISK FACTORS or on unfavourable terms. If we are unable to source appropriate funding, we may be forced to reduce or suspend business activities (e.g. lending) or operate with smaller liquidity buffers. If we are unable to source funding or generate liquidity for an extended period, we may not be able to pay our debts as and when they fall due or meet other contractual obligations. These outcomes may adversely affect our financial performance, liquidity, capital resources or financial condition. We also enter into collateralised derivative obligations, which may require us to post additional collateral based on market movements. This has the potential to adversely affect our liquidity or ability to use derivatives to hedge interest rate, currency and other financial risks. We could be adversely affected by the risk of inadequate capital levels - Capital adequacy - Capital risk - Regulatory capital requirements The Group is subject to the risk of an inadequate level or composition of capital to support business activities, meet regulatory capital requirements under normal or stressed conditions, and to maintain our solvency. Even robust levels of capital may not be sufficient to ensure our ongoing sustainability in the event of a bank run, where depositors quickly withdraw funds because of concerns about bank failure. Our capital levels are determined by regulation and risk appetite and informed by stress testing. We establish buffers on regulatory requirements to maintain capital adequacy during stressed periods by considering factors such as our balance sheet, forecasts, portfolio mix, potential capital headwinds (including real estate valuations, inflation and rising interest rates) and stressed outcomes. Stress testing models and assumptions may or may not accurately predict the nature and magnitude of particular stress events. The macroeconomic environment, stressed conditions and/or regulatory framework could result in a material increase to risk weighted assets, impact our capital adequacy, trigger capital distribution constraints, threaten our financial viability and/or require a highly dilutive capital raise. Capital distribution constraints apply when an ADI’s CET1 Capital ratio is within the prudential capital buffer range (consisting of the Capital Conservation Buffer plus any Countercyclical Capital Buffer). Such constraints could impact future dividends and distributions on Additional Tier 1 (AT1) capital instruments, noting APRA’s intention to phase out AT1 capital instruments effective 1 January 2027. Should AT1 and Tier 2 capital securities that we have issued be converted into ordinary shares (for example where our CET1 ratio falls below a certain level or APRA determines we would become non-viable without conversion of capital instruments or equivalent support), this could significantly dilute the value of existing ordinary shares. See further discussion in the Significant Developments section in the 2025 Annual Report. Our business is substantially dependent on the Australian and New Zealand economies, and could be adversely affected by a material downturn or shock to these economies or other financial systems - Strategic risk - Macroeconomic risks - Market disruption - Domestic and international economic conditions - Geopolitical risks - Credit risk Our revenues and earnings are dependent on domestic and international economic activity, business conditions and the level of financial services our customers require. Most of our business is conducted in Australia and New Zealand so our performance is influenced by the level and cyclical nature of activity in these countries. The financial services industry and capital markets have been, and may continue to be, adversely affected by volatility, global economic conditions (including inflation and rising interest rates), external events, geopolitical instability, political developments, cyberattacks or a major systemic shock. Market and economic disruptions (or the possibility of interest rates remaining higher for longer than anticipated) could cause consumer and business spending to decrease, unemployment to rise, demand for our products and services to decline and credit losses to increase, thereby reducing our earnings. These events could undermine confidence in the financial system, reduce liquidity, impair access to funding and adversely affect our customers and counterparties. Conversely, an environment with falling interest rates could reduce margins and impact earnings. Given Australia’s reliance on exports, a slowdown in economic growth or change in policy settings of Australia’s major trading partners, which may be caused by their foreign policies (including the adoption of protectionist trade measures such as tariffs or sanctions) could negatively impact the Australian economy. This could result in reduced demand for our products and services and affect supply chains, the level of economic activity and the ability of our borrowers to repay their loans. The nature and consequences of any such events are difficult to predict but each of these factors could adversely affect our business, prospects, financial performance or financial condition. |
| FINANCIAL REPORT EXHIBITS INDEX STRATEGIC REVIEW PERFORMANCE REVIEW EXHIBIT 15.4 ADDITIONAL INFORMATION 263 Declines in asset markets could adversely affect our operations or profitability and an increase in impairments and provisioning could adversely affect our financial performance or financial condition - Market risk - Decline in asset values - Impairments - Credit risk Declines in asset markets, including equity, bond, interest rates, foreign exchange, commodities and property markets, have adversely affected, and could in the future adversely affect, our operations and profitability. Declining asset prices including as a result of changes in fiscal or monetary policies or changes in legislation, could also impact customers and counterparties and the value of security (including residential and commercial property) we hold. This may impact our ability to recover amounts owing to us if customers or counterparties default. It may also affect our impairment charges and provisions, in turn impacting our financial performance, financial condition and capital levels. Declining asset prices could also impact our wealth management business as its earnings partly depend on fees based on the value of securities and/or assets held or managed. Credit risk may arise from foreign exchange restrictions or nationalisation of borrowers, which could impair asset values or repayment capacity in offshore jurisdictions. Credit risk also arises from potential counterparty default in derivative, clearing and settlement contracts we enter into. Such risk may also arise from our dealings in, and holdings of, debt securities issued by other institutions, government agencies or sovereigns, the financial conditions of which may be affected to varying degrees by economic conditions in global financial markets. We establish provisions for credit impairment based on accounting and regulatory standards using current information and our expectations. If economic conditions deteriorate beyond our expectations, some customers and/or counterparties could experience higher financial stress, leading to an increase in impairments, defaults and write-offs, and higher provisioning beyond current modelled outcomes. Changes in regulatory expectations or requirements in relation to the treatment of customers, for example in hardship, could lead to increased impairments and/or higher provisioning. Such events could adversely affect our liquidity, capital resources, financial performance or financial condition. We could be adversely affected by the failure to maintain our credit ratings - Availability of funding - Cost of funding - Downgrade Credit ratings are independent opinions on our creditworthiness. Our credit ratings can affect the cost and availability of our funding and may be important to investors, certain institutional customers and counterparties when evaluating their investments in the Group, our products and services. A rating downgrade could be driven by a downgrade of Australia’s sovereign credit rating, a material weakening in our financial performance, or one or more of the risks identified in the 2025 Risk Factors or by other events including regulatory changes or changes to the methodologies rating agencies use to determine credit ratings. A credit rating or rating outlook could be downgraded or revised where credit rating agencies believe there is a very high level of uncertainty on the impact to key rating factors from a significant event. A downgrade to our credit ratings could adversely affect our cost of funds, collateral requirements, liquidity, competitive position, our access to capital markets and our financial stability. The extent and nature of these impacts would depend on various factors, including the extent of any rating change, differences across agencies (split ratings) and whether competitors or the sector are also impacted. We face intense competition in all aspects of our business - Margins - Regulatory scrutiny - Strategic risk - New entrants The financial services industry is highly competitive, with a range of firms, including retail and commercial banks, investment banks, other financial service companies, fintech companies and businesses in other industries with financial services aspirations (including those who are not subject to the same capital and regulatory requirements or who derive substantial revenue from other markets, which may allow them to operate more flexibly and with lower costs of funds). Emerging competitors are also increasingly altering the competitive environment by adopting new business models or seeking to use new technologies to disrupt existing business models. |
| 264 WESTPAC GROUP 2025 ANNUAL REPORT RISK FACTORS Increased scrutiny by regulators in the sector and other legislative reforms may also change the competitive environment by stimulating competition and improving customer choice. It may also prompt increased competition from new and existing firms. Competition in the various markets we operate in has led, and may continue to lead, to a decline in our margins or market share. Deposits fund a significant portion of our balance sheet and have been a relatively stable source of funding. If we fail to successfully compete for deposits, we may face increased funding costs, leading us to seek access to other types of funding, or result in reduced lending. Our ability to compete depends on our ability to offer products and services that attract and retain customers and meet their evolving preferences and expectations. Failure to adapt could result in lost customers, which could negatively impact our business, prospects, financial performance or financial condition. For more detail refer to the Operating Environment section in the 2025 Annual Report. We have suffered, and could continue to suffer, losses due to operational risk - Operational risk - Change execution - Records management - Ineffective processes and controls - Fraud and scams - Third parties - AI - UNITE program Operational risk is the risk of loss resulting from inadequate or failed internal processes, people and systems or from external events. It includes, among other things, model, data, operations, change execution and third party risks. While we have policies, processes and controls to manage these risks, they have not always been, or may not be, effective. Ineffective processes and controls (including those of contractors, agents, authorised representatives, credit representatives, customers, trustees, brokers, independent financial advisors and other third parties, or inadequate monitoring, supervision and oversight of their activities or of our employees’ activities) have resulted in, and could continue to result in, adverse outcomes (including financial or otherwise) for Westpac, our customers, trustees, employees or other third parties. Operational breakdowns can occur if measures are implemented too quickly (including without sufficient validation), or not quickly enough, in response to external events, potentially leading to financial losses, customer remediation, regulatory scrutiny and intervention, fines, penalties and capital overlays and, depending on the nature of the failure, litigation, including class action proceedings. Examples of operational risks include: • Fraud and scams. We have incurred, and could in the future incur, losses from fraud and scams, including fraudulent applications for loans, products or services (including misrepresentations by customers (or their representatives) or brokers), incorrect or fraudulent payments or (mis)conduct (including through the use of platforms, funds, portfolios or accounts to commit investment scams or frauds, whether or not as a result of unauthorised access to our systems or our customer accounts), and misuse of accounts by money mules. Our representatives, such as our employees, may be involved including knowingly or unknowingly. Such losses, including the potential for additional customer or other third party compensation, increased levies and financial penalties (including for non-compliance), could increase significantly due to regulatory change. This includes if the Group does not adhere to obligations set out in or further to the Scams Prevention Framework within the Competition and Consumer Act 2010 (Cth), which was introduced by the Scams Prevention Framework Act 2025 (Cth). Fraudulent conduct can also arise where identification records are compromised due to third party cybersecurity events. Our risks are heightened by real-time transaction capability, and we are also exposed to contagion risk from incidents affecting other organisations. If systems, procedures and protocols for preventing and managing fraud, scams or improper access (including for improper or non-compliant purposes) to our systems and customer accounts fail, or are inadequate or ineffective, they could lead to losses which could adversely affect Westpac, our customers, business, prospects, reputation, financial performance or financial condition. Regulatory and compliance requirements can impede the ability to swiftly identify or respond to a fraud or scam, or to communicate with affected parties. • Records management. A failure to adequately implement and monitor effective records management policies and processes could impact our ability to safeguard information, locate records, respond to regulatory notices, conduct remediation, and meet record retention, protection and destruction obligations. Where there are inadequacies in implementation of the records management lifecycle in our systems or embedding records management across the Group, these risks are further heightened. Where records are not adequately protected or retained for longer than required this could increase the impacts of cyber and privacy incidents such as data breaches. |
| FINANCIAL REPORT EXHIBITS INDEX STRATEGIC REVIEW PERFORMANCE REVIEW EXHIBIT 15.4 ADDITIONAL INFORMATION 265 • Artificial Intelligence (AI). As AI adoption to support our customers and business increases, we may become more exposed to risks associated with the use of this technology, such as lack of transparency, over-reliance on a limited number of vendors, inaccurate data input, unintentional bias, breaches of confidentiality and privacy obligations, inaccurate or opaque outputs and unexplainable decisions, amplifications of biases or other unintended consequences that are inconsistent with our policies or values. In addition, failure or delays in adopting AI could lead to competitive disadvantages or otherwise not leveraging capability that could support management of risk or improve customer outcomes. Leveraging AI could have financial, regulatory, conduct, reputational and customer impacts. • Third party. We rely on third parties, both in Australia and overseas, to provide services to us and our customers. Failures by these third parties, including our authorised representatives and credit representatives, to deliver services as required and in accordance with law, regulation and regulatory expectations could disrupt our ability to provide products and services and adversely impact our customers, operations, financial performance or reputation. For example, we rely on third parties to provide cash transport, handling and storage services. Reduced demand for cash, disruptions or other issues (including legal or regulatory changes, litigation, claims, industrial action or the viability or solvency of providers) impacting the cash-in-transit (CIT) industry, exposes us to operational risk including loss of (or delays in accessing) significant amounts of cash held by CIT providers on our behalf (this risk is exacerbated for us as we currently provide commercial cash distribution for the industry under an arrangement with one key industry participant which terminates in July 2026), reduced availability of cash in the system generally (which could lead to a run on cash), potential increased costs (for example, to enable us/third party providers to meet legal or regulatory requirements), and related consequences where we or our customers suffer loss or damage due to disruptions to CIT services. • Change execution. We face risks in delivering technology and other change programs (such as our UNITE program), including that a change program fails to deliver the desired outcomes, or fails to reduce, pre-empt, mitigate and manage the challenges associated with transformation delivery. If our technology systems or financial infrastructure do not operate correctly, this may also cause loss or damage to us or our customers. This can also arise from complexities in our systems, and the interaction between those systems. This could include, for example, where systems issues result in incorrect fees or charges being applied to customers, or other poor customer outcomes. All these issues could potentially lead to transfer risks, cost and time overruns, business disruptions and delays, product governance failures, technology challenges, financial losses, customer remediation and retention issues, regulatory scrutiny and intervention, capital overlays and litigation. • Insurance coverage. There is a risk that we will not be able to obtain and/or have not obtained appropriate insurance coverage for the risks that we may be exposed to. This could be due to lack of available or adequate insurance, an increase in the cost of insurance, or failure of the insurance underwriter. If an insurance policy is not available or does not respond to a loss, we will not have the ability to recover such loss from an insurance policy. We could suffer losses due to market volatility - Market risk - Geopolitical risks - Volatility and disruption - Credit risk Market risk is the risk of an adverse impact on the Group’s financial performance, financial position, capital and liquidity, resulting from changes in market factors, such as foreign exchange rates, commodity prices, credit spreads and interest rates. Market risk is present in both banking book and trading book. We are exposed to market risk due to our financial markets businesses, asset and liability management, our holdings in liquid asset securities, dependence on accessing capital markets and our defined benefit plan. Changes in market factors could be driven by a variety of developments including economic disruption, geopolitical events, trade tensions, market liquidity or concerns relating to major market participants or sectors. The resulting market volatility could potentially lead to losses and may adversely affect our financial performance and capital position. As a financial intermediary, we underwrite listed and unlisted debt securities. We could suffer losses if we fail to syndicate or sell down this risk to others. This risk is more pronounced in times of heightened market volatility. Poor data quality could adversely affect our business and operations - Operational risk - Data quality - Poor customer and risk outcomes Having accurate, complete and reliable data, supported by appropriate data controls, retention and, destruction methods and access to internal frameworks and processes, is critical to the effective operation of our businesses. |
| 266 WESTPAC GROUP 2025 ANNUAL REPORT RISK FACTORS Data plays a key role in determining how we provide products and services to customers, the effectiveness of our systems and risk management frameworks, strategic planning and our ability to make effective decisions. Some of our businesses are, and may continue to be, affected by poor data quality and/or limited data availability due to a number of factors, including inadequacies across systems, processes and policies, or ineffectively implemented data management frameworks. This could lead to poor customer service outcomes, adverse risk management outcomes, deficient system outputs and processes. This is because data quality inadequacies render such data unreliable to assist in making informed business decisions. Deficiencies with internal systems and processes could negatively impact our decision-making in areas such as the provision of credit to a customer, and the terms on which a credit facility is provided. The production of accurate data is also critical for other functions across the Group, such as financial and other reporting (internal and external). Poor data quality and availability impacts our ability to effectively monitor and manage operations across the Group, comply with production notices, respond to regulatory notices, defend and respond to litigation and conduct remediation activities. Conflicting data retention or destruction obligations may increase such risks. Poor data and/or poor data retention/destruction methods and deficient controls that result in control gaps and weaknesses could negatively impact our ability to meet compliance obligations (including regulatory reporting obligations). Previously, this has led to regulatory investigations or adverse findings and actions against the Group, and such risks remain if we fail to maintain an acceptable level of data quality and effective oversight practices. Our data related frameworks and processes must be continuously reviewed, and improved where required, to ensure our data quality and data management practices remain relevant, fit for purpose and sustainable. This is because outdated or unsustainable practices may lead to inefficient data management practices and/or poor quality data. Potential consequences from holding poor quality data and/or having poor data oversight and controls include adverse impacts to the Group’s ability to effectively operate our existing businesses, securing prospective business from third parties, and our reputation, financial performance and financial condition. Certain strategic decisions may have adverse effects on our business - Strategic risk - Warranties and indemnities - Divestments and acquisitions - Implementation risk We evaluate and implement strategic decisions, priorities and objectives including opportunities to simplify or streamline, diversify or innovate our business or products. These activities can be complex, costly and may not proceed as planned. For example, we may experience difficulties completing certain transactions, separating or integrating businesses in the scheduled timeframe or at all, disruptions to operations, diversion of management resources or higher than expected transaction costs, impacts on third parties, and there may be differing market views about a strategic choice, which may cause reputational damage. Any failure to successfully divest businesses may expose us to higher operating costs and higher inherent risks in those businesses. Decisions to retain businesses may also expose us to the higher inherent risks in those businesses. For example, our Pacific businesses face several risks including heightened operational, sovereign, financial crime and exchange control risks which could adversely affect our customers, business, prospects, reputation, financial performance or financial condition. In divesting businesses, we have given (and could in future divestments give) warranties and indemnities in favour of counterparties relating to certain pre-completion matters and certain other commitments, including in relation to transitional services. These could result in a liability to make significant payments to these counterparties while these obligations remain on foot. To manage risks related to conduct and customer redress associated with divestments, we hold additional operational risk capital pursuant to APRA’s published guidance. These contingent liabilities are described in Note 25 to the financial statements in the 2025 Annual Report. Acquiring and investing in businesses also carries risks and costs, including underperformance, assumption of unknown and unaccounted for liabilities, regulatory risks or overvaluation of a target business. Operational, cultural, governance, compliance and risk appetite differences between us and an acquired business may lead to longer and costlier integration. Internal factors, for example, inadequate funding, resourcing, business capabilities or operating model, or failing to identify, understand or respond effectively to changes in the external business environment, including economic, geopolitical, regulatory, consumer sentiment, technological, environmental, social and competitive factors, may hinder successful strategy implementation. This could adversely affect us, including our ability to increase or maintain market share or resulting pressure on margins and fees. |

| FINANCIAL REPORT EXHIBITS INDEX STRATEGIC REVIEW PERFORMANCE REVIEW EXHIBIT 15.4 ADDITIONAL INFORMATION 267 These risks could negatively impact our business, growth prospects, reputation, engagement with regulators, financial performance or financial condition. Other risks • Failure to recruit and retain key executives, employees and Directors with appropriate skills and qualifications may have an adverse effect on our business, prospects, reputation, financial performance or financial condition. Macro-environmental factors including unemployment rates, migration levels and the level of competition in the talent market may also have an adverse impact on attracting specialist skills for the Group. In particular, attracting and retaining employees with skills and experience in technology related fields – such as cyber security and artificial intelligence – is critical in the coming years. • Changes to the critical accounting assumptions and estimates (outlined in Note 1 to the financial statements in the 2025 Annual Report) could expose the Group to losses greater than those anticipated or recognised, which could adversely affect our financial performance, financial condition and reputation. |

| 268 WESTPAC GROUP 2025 ANNUAL REPORT INFORMATION ON WESTPAC Significant developments Westpac significant developments – Australia Changes to Board of Directors and Executive Team On 1 August 2025, Pip Greenwood commenced as an Independent Non-executive Director of the Board. On 12 May 2025, Paul Fowler commenced as the Chief Executive of Business & Wealth. On 5 August 2025, Kate Dee commenced as the new Chief People Officer, following the retirement of Christine Parker. On 12 August 2025, Westpac announced the appointment of Carolyn McCann as the new Chief Executive, Consumer, effective immediately. Carolyn McCann had been acting in that role since 12 May 2025. Carolyn Hoy commenced as the Acting Group Executive of Customer & Corporate Services on 12 May 2025. On 1 September 2025, Dr Andrew McMullan commenced in the new executive role of Chief Data, Digital and AI Officer. On 8 October 2025, Nathan Goonan commenced as the Chief Financial Officer, following the retirement of Michael Rowland. Increase in the CET1 capital operating target The Board has determined a target post dividend CET1 capital ratio of above 11.25% in normal operating conditions. This target includes consideration of APRA's increase in the minimum CET1 ratio of 0.25% to 10.50% effective 1 January 2027 and replaces the previous CET1 capital operating range of between 11.00% and 11.50%. On market buyback As at 30 September 2025, Westpac had completed $2.5 billion of the $3.5 billion on market share buyback previously announced, with 88.7 million Westpac ordinary shares purchased at an average price of $28.00. The ordinary shares bought back were subsequently cancelled. The timing and actual number of shares purchased under the buyback will depend on market conditions and other considerations. Westpac reserves the right to vary, suspend or terminate the buyback at any time. Regulatory and risk developments Financial crime Westpac continues to improve its financial crime risk management with significant ongoing work focusing on AML/CTF, Sanctions, Anti-Bribery and Corruption, the US Foreign Account Tax Compliance Act (FATCA) and Common Reporting Standard (CRS). Through this work, we continue to undertake activities to strengthen and remediate our Financial Crime Program, and to improve regulatory reporting, including in relation to International Funds Transfer Instructions, Threshold Transaction Reports, Suspicious Matter Reports, FATCA and CRS reporting and equivalent reports in jurisdictions outside Australia. With ongoing regulatory focus on financial crime, further areas of potential non-compliance have been, and may continue to be identified, and we continue to liaise with the Australian Transaction Reports and Analysis Centre (AUSTRAC), the Australian Taxation Office (ATO) and local regulators in jurisdictions outside Australia, including to remediate findings and adopt recommendations from regulators. In 2024, the Australian Parliament enacted the Anti-Money Laundering and Counter-Terrorism Financing Amendment Act 2024 (Cth), introducing major reforms to the AML/CTF regime. A substantial number of reforms will take effect from 31 March 2026, including provisions that apply to our permanent offshore establishments. In response, we are updating our policies, procedures, systems and controls. Full implementation will require a multi-year implementation program, including complex technology upgrades to customer due diligence and reporting infrastructure. Timing challenges are an industry wide issue. AUSTRAC has acknowledged this and published its regulatory expectations, noting that AUSTRAC does not expect immediate compliance. AUSTRAC does expect reporting entities to continue to implement current money laundering controls and show sustained effort and progress against implementation plans. We will continue to engage with AUSTRAC to support a phased implementation approach. Details about the consequences of failing to comply with financial crime obligations are set out in the 2025 Risk Factors. New climate reporting standards New mandatory climate-related reporting standards were approved in September 2024 by the Australian Accounting Standards Board and legislation requiring compliance has been passed by the Australian Parliament. These new requirements will apply to Westpac from its financial year ending 30 September 2026. APRA capital requirements Operational risk capital overlays In 2019, APRA applied $1 billion of additional capital overlays to our operational risk capital requirement. These overlays were applied through an increase in risk weighted assets (RWA). On 19 July 2024, APRA announced its decision to reduce Westpac’s total operational risk capital overlay from $1 billion to $500 million. On 15 October 2025, APRA announced its decision to lift the CEU and remove Westpac’s remaining $500 million operational risk capital overlay. The removal of the $500 million capital overlay will mean Westpac’s Common Equity Tier 1 (CET1) capital ratio will increase by approximately 17 basis points, reflecting a reduction in risk weighted assets of $6,250 million. This change applied with immediate effect. Further details are set out in Strengthening Risk Management (page 181). |
| FINANCIAL REPORT EXHIBITS INDEX STRATEGIC REVIEW PERFORMANCE REVIEW EXHIBIT 15.4 ADDITIONAL INFORMATION 269 APRA announcement to phase out AT1 capital as eligible bank capital On 8 July 2025 APRA released a consultation paper on implementing the phase out of AT1 capital instruments. This included changes to APRA's prudential and reporting frameworks resulting from the removal of AT1 capital instruments. Under the revisions, large internationally active banks such as Westpac will replace 1.5% of AT1 capital with 1.25% of Tier 2 capital and 0.25% of CET1 capital. The total CET1 requirement, including regulatory buffers, will increase from 10.25% to 10.50%. There is no overall increase in total capital requirements for banks. APRA has also proposed changes to the leverage ratio, which will see the leverage ratio calculation based on CET1 capital rather than Tier 1 capital. Should the changes be implemented as proposed, this will result in a reduction in the reported leverage ratio. The minimum leverage ratio of 3.5% is proposed to remain unchanged. APRA intends to finalise changes to the relevant prudential standards in 2025, with the updated framework coming into effect from 1 January 2027. In addition, from this date, existing AT1 capital instruments would be eligible to be included as Tier 2 capital, until their first scheduled call date. Existing Westpac AT1 capital instruments would reach their first scheduled optional redemption dates by 2031 at the latest. Westpac significant developments – New Zealand RBNZ review of overseas bank branches On 21 August 2024, the RBNZ released the proposed Branch Standard under the Deposit Takers Act 2023 (NZ). The proposed Branch Standard will require that overseas bank branches only conduct business with wholesale clients; the total size of an overseas bank’s branch cannot exceed NZ$15 billion in total assets; and dual-operating branches (such as Westpac’s New Zealand Branch) only conduct business with “large corporate and institutional clients” (LCIC). Policy decisions released by the RBNZ on 17 July 2025 propose that LCIC means those with consolidated annual turnover of over NZ$50 million, total assets of over NZ$75 million or total assets under management of over NZ$250million (for funds management entities only). The implementation date is expected to be 1 December 2028. Westpac’s New Zealand Branch currently provides financial markets, trade finance and international payment products and services to customers referred by WNZL. We expect the RBNZ’s Branch Standard will require changes to the activities Westpac’s New Zealand Branch undertakes, and as a result, WNZL may also make changes to the scope of the activities it undertakes. RBNZ review of capital settings for deposit takers On 31 March 2025, the RBNZ announced a review of the key capital settings for deposit takers. On 25 August 2025, it released a consultation paper. For Group 1 deposit takers (including WNZL) the key proposals include: • Removal of AT1 instruments from the capital stack. • Two options for capital ratio requirements: – Option 1: A total CET1 capital ratio requirement of 14%, with a total capital ratio requirement of 17% (including a prudential capital buffer (‘PCB’) ratio of 8%). – Option 2: A total CET1 capital ratio requirement of 12%, with a total capital ratio requirement of 15% (including a PCB ratio of 6%) and an additional Loss Absorbing Capacity (LAC) requirement of 6%. Tier 2 capital and LAC instruments would be required to be issued internally (for example to WBC) and LAC would take a form similar to Tier 2 capital. • More granular standardised risk weights, including lower risk weights in some areas. • Setting the long-run level for the counter-cyclical capital buffer component of the PCB at 1%. The RBNZ is expected to make its final decisions in December 2025 with the implementation timeline to be announced in the first quarter of the 2026 calendar year. The outcome of the review remains uncertain. General regulatory changes affecting our businesses RBA review of merchant card payment costs and surcharging On 15 July 2025, the RBA released a consultation paper as part of its review of merchant card payment costs and surcharging. Relevantly, the RBA proposes to remove surcharges on debit and credit cards, lower the cap on interchange fees paid by merchant acquirers to card issuers (including Westpac) and improve transparency on card payment fees. The RBA intends to complete its review in March 2026. We are considering the impact of the proposed changes, including on our products, systems and financial outcomes. Legal proceedings Our entities are parties to legal proceedings from time to time arising from the conduct of our business. Certain litigation and class actions are further described as required in Note 25 to the financial statements (page 96) in this Annual Report. Supervision and regulation Australia Within Australia, we are subject to supervision and regulation by seven principal agencies and bodies: the Australian Prudential Regulation Authority (APRA); the Reserve Bank of Australia (RBA); the Australian Securities and Investments Commission (ASIC); Australian Securities Exchange Limited (ASX); the Australian Competition and Consumer Commission (ACCC); the Australian Transaction Reports and Analysis Centre (AUSTRAC) and the Office of the Australian Information Commissioner (OAIC). APRA is the prudential regulator of the Australian financial services industry. As an Authorised Deposit-taking Institution (ADI), we report prudential information to APRA, including information in relation to capital adequacy, large exposures, credit quality and liquidity. The RBA is responsible for monetary policy, maintaining financial system stability and promoting the safety and efficiency of the payments system. The RBA is an active participant in the financial markets, manages Australia’s |
| 270 WESTPAC GROUP 2025 ANNUAL REPORT INFORMATION ON WESTPAC foreign reserves, issues Australian currency notes and provides certain banking services to the Australian Government and its agencies. It also manages Australia's gold and foreign exchange reserves. ASIC is Australia’s corporate, markets, financial services and consumer credit regulator. It is responsible for the regulation of Australian companies and consumer protection within the financial sector. ASIC is an independent Australian government body and was established under the Australian Securities and Investments Commission Act 2001 (Cth). It carries out most of its regulatory functions and supervision under the Corporations Act 2001 (Cth) (Corporations Act). ASX acts as a market operator, clearing house and payments system facilitator for Australia’s primary national market for trading of securities issued by listed companies. Some of our securities (including our ordinary shares) are listed on the ASX and we therefore have obligations to comply with the ASX Listing Rules, which have statutory backing under the Corporations Act. The ACCC promotes competition in markets. It is the federal regulator responsible for monitoring compliance with Australia's competition and consumer protection laws, in particular the Competition and Consumer Act 2010 (Cth). AUSTRAC is Australia’s financial intelligence unit and anti-money laundering and counter-terrorism financing regulator. It oversees the compliance of Australian reporting entities (including Westpac) with the requirements under the Anti-Money Laundering and Counter-Terrorism Financing Act 2006 (Cth) and related instruments. These requirements include: • implementing programs for identifying and monitoring customers, and for managing the risks of money laundering and terrorism financing; • reporting suspicious matters, threshold transactions and international funds transfer instructions; and • submitting an annual compliance report. The OAIC's primary responsibilities are privacy, freedom of information and government information policy, including under the Privacy Act 1988 (Cth) (Privacy Act). Its functions include handling complaints about the handling of personal information, conducting investigations and undertaking enforcement actions in relation to potential breaches of the Privacy Act. New Zealand The Reserve Bank of New Zealand (RBNZ) is responsible for supervising New Zealand registered banks and protects the financial stability of New Zealand through the application of minimum prudential obligations. The New Zealand prudential supervision regime requires that registered banks publish disclosure statements, which contain information on financial performance and risk positions as well as attestations by the directors about the bank’s compliance with its conditions of registration and certain other matters. The Financial Markets Authority (FMA) and the New Zealand Commerce Commission (NZCC) are the two primary conduct and enforcement regulators. The FMA and NZCC are responsible for ensuring that markets are fair and transparent and are supported by confident and informed investors and consumers. Regulation of markets and their participants is undertaken through a combination of market supervision, corporate governance and licensing approvals. In New Zealand, other relevant regulator mandates include those relating to taxation, privacy and foreign affairs and trade. Banks in New Zealand are also subject to a number of self-regulatory regimes. Examples include Payments NZ, the New Zealand Bankers’ Association (NZBA) and the Financial Services Council (FSC). Examples of industry agreed codes include the NZBA’s Code of Banking Practice and FSC’s Code of Conduct. United States Our New York branch is a US federally licensed branch and therefore is subject to supervision, examination and regulation by the US Office of the Comptroller of the Currency and the Board of Governors of the Federal Reserve System (the US Federal Reserve) under the US International Banking Act of 1978 (IBA) and related regulations. A US federal branch must maintain, with a US Federal Reserve member bank, a capital equivalency deposit as prescribed by the US Comptroller of the Currency, which is at least equal to 5% of its total liabilities (including acceptances, but excluding accrued expenses, and amounts due and other liabilities to other branches, agencies and subsidiaries of the foreign bank). In addition, a US federal branch is subject to periodic onsite examination by the US Comptroller of the Currency. Such examination may address risk management, operations, asset quality, compliance with the record keeping and reporting, and any additional requirements prescribed by the US Comptroller of the Currency from time to time. A US federal branch of a foreign bank is, by virtue of the IBA, subject to the receivership powers exercisable by the US Comptroller of the Currency. As of 22 June 2016, we elected to be treated as a financial holding company in the US pursuant to the Bank Holding Company Act of 1956 and Federal Reserve Board Regulation Y. Our election will remain effective so long as we meet certain capital and management standards prescribed by the US Federal Reserve. Westpac and some of its affiliates are engaged in various activities that are subject to regulation by other US federal regulatory agencies, including the US Securities and Exchange Commission, US Financial Industry Regulatory Authority, the US Commodity Futures Trading Commission and the National Futures Association. Section 219 of the Iran Threat Reduction and Syria Human Rights Act of 2012 added Section 13(r) to the U.S. Securities Exchange Act of 1934, as amended, requiring each SEC reporting issuer to disclose in its annual and, if applicable, quarterly reports whether it or any of its affiliates have knowingly engaged in specified activities, transactions or dealings relating to Iran or with the Government of Iran or certain designated persons or entities involved in terrorism or the proliferation of |
| FINANCIAL REPORT EXHIBITS INDEX STRATEGIC REVIEW PERFORMANCE REVIEW EXHIBIT 15.4 ADDITIONAL INFORMATION 271 weapons of mass destruction during the period covered by the report. Section 219 requires disclosure even of certain activities not prohibited by U.S. or other law and even if such activities were conducted outside the United States by non-U.S. affiliates in compliance with local law. Westpac and WNZL have engaged in activity that is relevant for this purpose. Westpac and WNZL (as a wholly owned subsidiary) maintain compliance policies and procedures to comply with all applicable economic sanctions laws and regulations. In that context, and only after confirming that such transactions did not involve prohibited or sanctionable activity under U.S. or other economic sanctions, the above Westpac Group entities outside the United States engaged in a limited number of activities reportable under Section 219 during the period covered by this annual report, as described below. No U.S. persons or entities, or entities owned or controlled by U.S. persons were involved in these activities. There are two matters requiring disclosure for this reporting period 1 October 2024 to 30 September 2025: 1. Payments to the Embassy of Iran in Australia. During 1 October 2024 to 30 September 2025, retail and business customers of Westpac remitted AUD payments to accounts held for the Embassy of Iran in Australia with an unaffiliated bank in Australia. It was observed that the purpose of these transactions related to consular purposes of the Embassy, such as obtaining a driver’s license or passport fees and services. Westpac is not a U.S. person or owned or controlled by U.S. persons and therefore its transactions that do not include any U.S. jurisdictional elements are not subject to the Iranian Transactions and Sanctions Regulations (ITSR) at Part 560 of title 31, Code of Federal Regulations, issued by the U.S. Department of the Treasury’s Office of Foreign Assets Control. In addition, transactions that are “ordinarily incident to travel to” Iran are exempt from the ITSR (at 31 Code of Federal Regulations Section 560.210(d). All payments were facilitated through the NPP domestic payments platform. This activity contributed an insignificant amount of gross revenues and net profit to the Group. 2. Payments to the Embassy of Iran in New Zealand. During 1 October 2024 to 30 September 2025, New Zealand based customers of WNZL remitted domestic NZD payments from their accounts at WNZL to accounts held for the Embassy of Iran with an unaffiliated bank in New Zealand. It was observed that the purpose of these transactions related to diplomatic and consular duties of the Embassy. All payments were facilitated through WNZL's domestic NZD payments platform. This activity contributed an insignificant amount of gross revenues and net profit to the Group. WNZL is not a U.S. person or owned or controlled by U.S. persons and therefore its transactions that do not include any U.S. jurisdictional elements are not subject to the ITSR at Part 560 of title 31, Code of Federal Regulations, issued by the U.S. Department of the Treasury's Office of Foreign Assets Control. In addition, transactions that are "ordinarily incident to travel to" Iran are exempt from the ITSR (at 31 Code of Federal Regulations Section 560.210(d)). Westpac and WNZL intend to continue to process payments to the Embassies of Iran in Australia and New Zealand but only under limited circumstances where the Group believes the funds transfers conform to its compliance policies, procedures and all applicable sanctions laws and regulations. Anti-money laundering regulation and related requirements Australia Westpac has a Group-wide program to manage its obligations under the Anti-Money Laundering and Counter- Terrorism Financing Act 2006 (Cth). We continue to actively engage with the regulator, AUSTRAC, on our activities. Our Anti-Money Laundering and Counter-Terrorism Financing Policy (AML/CTF Policy) sets out how the Westpac Group complies with its legislative obligations. The AML/CTF Policy applies to all business segments and employees (permanent, temporary and third party providers) working in Australia, New Zealand and overseas. United States The USA PATRIOT Act of 2001 requires US financial institutions, including the US branches of foreign banks, to take certain steps to prevent, detect and report individuals and entities involved in international money laundering and the financing of terrorism. The required actions include verifying the identity of financial institutions and other customers and counterparties, terminating correspondent accounts for foreign ‘shell banks’ and obtaining information about the owners of foreign bank clients and the identity of the foreign bank’s agent for service of process in the US. The anti-money laundering compliance requirements of the USA PATRIOT Act include requirements to appoint a qualified BSA Officer, adopt and implement an effective anti-money laundering program, report suspicious transactions or activities, and implement due diligence procedures for correspondent and other customer accounts in line with the CDD rule. Westpac’s New York Branch and Westpac Capital Markets LLC maintain an anti-money laundering compliance program designed to address US legal requirements. US economic and trade sanctions, as administered by the Office of Foreign Assets Control (OFAC), prohibit or significantly restrict US financial institutions, including the US branches and operations of foreign banks, and other US persons from doing business with certain persons, entities and jurisdictions. Westpac’s New York Branch and Westpac Capital Markets LLC maintain compliance programs designed to comply with OFAC sanctions programs, and Westpac has a Group-wide program to ensure adequate compliance. Legal proceedings Our entities are parties from time to time in legal proceedings arising from the conduct of our business. Material legal proceedings, if any, are described in Note |
| 272 WESTPAC GROUP 2025 ANNUAL REPORT INFORMATION ON WESTPAC 25 to the financial statements and/or under the Significant developments section above. Where appropriate as required by the accounting standards, a provision has been raised in respect of these proceedings and disclosed in the financial statements. Cybersecurity management and governance The Group Chief Information Security Officer (CISO) reports to the Chief Information Officer, a member of the Executive Team. The CISO is a member of key cybersecurity governance forums and is responsible for leading and managing the cybersecurity function, setting the cybersecurity strategy and direction, and overseeing the implementation, operation and execution of the cybersecurity policies, standards, controls, and capabilities, including for third parties who are engaged to manage Westpac’s information assets. We have implemented a range of cybersecurity processes, technologies, and controls to facilitate our efforts to assess, identify, and manage such risks, including regular network and endpoint monitoring, access controls, vulnerability assessments, penetration testing, annual information security training for employees, and tabletop cybersecurity incident response exercises. We have an Incident Response Plan which guides the actions we are to take in the event of a suspected or confirmed cybersecurity incident. The plan includes processes to triage, investigate, contain, and remediate the incident. The plan is designed to contain and minimise the impact of a cybersecurity incident on our customers. We also maintain a Business Continuity Plan, which provides procedures for maintaining the continuity of critical business processes in the event of business interruption, including any that involve cybersecurity incidents which may significantly impact our operations. Our cybersecurity team is informed about and monitors the prevention, mitigation, detection and remediation of cybersecurity threats through their management of, and participation in, the strategy processes. The CISO and the cybersecurity team have relevant expertise and experience in various aspects of cybersecurity, such as strategy, governance, risk management, threat intelligence, incident response, security operations, architecture, engineering, testing and awareness. The CISO has extensive experience in information technology and cybersecurity. The cybersecurity team consists of qualified and competent professionals who have diverse backgrounds and skills in cybersecurity. The cybersecurity team regularly participates in training, education, and development programs to enhance their knowledge and skills to keep up with the evolving cybersecurity landscape. As part of its cybersecurity risk management, Westpac engages with third parties for independent reviews and assessments of its cybersecurity policies, standards, controls, and capabilities. These third parties include external auditors, industry bodies, consultants, and specialists. The purpose of these engagements is to obtain assurance, validation, benchmarking and improvement recommendations on Westpac's cybersecurity posture and maturity. Westpac holds ISO27001, PCI-DSS and SOC 2 Type 2 certifications for areas of the Group. The CISO escalates key cybersecurity risk and control issues, as appropriate, to the Technology Risk Committee (TRC) or to the appropriate Line of Business and Divisional Committees. The TRC, a senior management committee, oversees the technology function and technology risk management. The TRC reports to the Group Executive Risk Committee (GRISKCO), the executive management committee responsible for overseeing the group's strategy, performance, and risk management. The Board of Directors receives periodic updates from the CIO and the CISO regarding cybersecurity matters. The Board is ultimately responsible for the oversight of the cybersecurity risk management. The Board delegates some of its oversight responsibilities to the Board Risk Committee, which assists the Board in the oversight of cybersecurity risk management. During the period covered by this 2025 Annual Report, we have not experienced any cybersecurity incidents which have materially affected or are reasonably likely to materially affect our business strategy, results of operations, or financial condition. However, institutions like ours, as well as our employees, service providers and other third parties have experienced a significant increase in information security and cybersecurity risk in recent years and will likely continue to be the target of increasing sophisticated cyber-related attacks. |
| FINANCIAL REPORT EXHIBITS INDEX STRATEGIC REVIEW PERFORMANCE REVIEW EXHIBIT 15.4 ADDITIONAL INFORMATION 273 PERFORMANCE REVIEW GROUP PERFORMANCE Full Year 2025 results overview Review of earnings Credit quality SEGMENT REPORTING Consumer Business & Wealth Institutional New Zealand Group Businesses REVIEW OF EARNINGS: 2024 - 2023 Group performance Segment performance FINANCIAL STATEMENTS |

| 274 WESTPAC GROUP 2025 ANNUAL REPORT GROUP PERFORMANCE Full Year 2025 results overview Group performance Full Year 2025 results overview Our financial performance reflected our strategy of balancing growth and return while investing for the future. We maintained a strong financial position with capital, funding and liquidity all above regulatory minimums. Fully franked ordinary dividends increased to 153 cents per share, including a final dividend of 77 cents per share. That equates to a full year ordinary dividend payout ratio of 76% of net profit, towards the upper end of our preferred payout range. Net profit was delivered through disciplined management of net interest margins and balance sheet growth across our businesses. The rise in operating income reflected our strategy of balancing growth and returns. Growth in operating expenses reflected higher staff and technology costs, while the low level of impairment charges reflected credit quality improvements across all segments. The balance sheet recorded solid growth with deposits and loans rising by 7% and 6% respectively. Consumer deposits increased 10%, deposits in Business rose 6% and Institutional deposits climbed 10%. Business lending was up 15% with strong growth in our target sectors. In Institutional, deeper client relationships and improved service supported loan growth of 17%. Housing loans, excluding RAMS, rose 5%. We are focused on building stronger customer relationships while investing to improve our market position to deliver long term value for shareholders. Customer service excellence is essential to our future success. We’ve improved our everyday banking experience through simplifying onboarding and improving the rewards for loyalty. We’re expanding with more bankers offering local expertise and new retail and business banking service centres in growth regions. We are transforming the company through our ‘One Best Way’ approach, driving simplification, consistency, efficiency and innovation to make banking easier and more cost-effective. UNITE aims to unlock value by resolving structural legacy technology and operational issues. The Discovery phase is complete and 8 initiatives have been delivered. Notable Items Notable Items Notable Items reduced net profit after tax in 2025 by $56 million (2024: $123 million reduction) and increased net profit after tax in Second Half 2025 by $84 million (First Half 2025: $140 million reduction). Details of Notable Items (post tax) are presented below: Category Net profit impact Full Year 2025 Net profit impact Second Half 2025 Detail Hedging items $56 million reduction $84 million benefit • The unrealised fair value loss on hedges of accrual accounted term funding transactions for the year was $43 million reduction (2H25: $49 million benefit; 1H25: $92 million reduction; 2024: $128 million reduction); and • The net ineffectiveness on qualifying hedges was a reduction of $13 million (2H25: $35 million benefit; 1H25: $48 million reduction; 2024: $5 million benefit). Total Notable Items $56 million reduction $84 million benefit Review of earnings Review of earnings Net interest income Net interest income increased 3% to $19,380 million. Notable Items relating to hedging items including unrealised revaluation of economic hedges of term funding reduced income by of $93 million. Excluding Notable Items net-interest income increased by 3% to $19,473 million with key drivers outline below. Net interest income excluding the impact of Notable Items Net interest income increased 3% to $19,473 million. Key drivers included: • Higher core net interest income, up 3% to $18,191 million. Balance sheet growth was partly offset by lower net interest margin; • Treasury and Markets income, down 2% to $1,282 million due to a stronger performance from Treasury in the prior year. Average interest-earning assets increased by 3% to $1,002.9 billion, including growth of 11% in business loans and 2% in housing loans. This was partially offset by the reduction in personal loans and the runoff and subsequent sale of the auto finance portfolio in March 2025. Average liquid assets increased by 2% while other interest-earning assets decreased by 8% due to the reduction in collateral balances. |
| FINANCIAL REPORT EXHIBITS INDEX STRATEGIC REVIEW PERFORMANCE REVIEW EXHIBIT 15.4 ADDITIONAL INFORMATION 275 Review of earnings (Continued) Net interest margin movement The NIM of 1.93% was flat. NIM comprised: • Core NIM of 1.81%, which contracted by 1 basis point with key drivers described below; • Treasury and Markets contribution of 13 basis points, which was stable; and • Notable Items relating to hedging items including unrealised revaluations of economic hedges of term funding detracted 1 basis point. Net interest margin excluding the impact of Notable Items NIM decreased 1 basis point to 1.94%. NIM comprised: • Core NIM of 1.81%, which contracted by 1 basis point with key drivers described below; and • Treasury and Markets contribution of 13 basis points, which was stable. Core NIM comprised the following movements: • Loan interest spread: 1 basis point narrower. Higher spreads in New Zealand mortgages driven by fixed rate repricing was more than offset by tighter spreads in Australia due to competition and the sale of the auto finance portfolio; • Deposit interest spread: 2 basis points decrease with a mix shift towards lower spread savings products, margin compression in term deposits and the impact from lower interest rates. Earnings on hedged deposits were higher; • Liquid Assets: 2 basis points increase as average liquid assets rose by less than average lending assets; • Wholesale funding: 1 basis point decrease from the impact of higher funding costs, with the final Term Funding Facility (TFF) draw downs maturing in the prior year; and • Capital and Other: 1 basis point increase primarily from higher earnings on hedged capital balances. Loans Loans increased by 6% to $851.9 billion and comprised the following movements: • Growth in Australian housing loans, excluding RAMS, of 5% to $497.0 billion, mainly in variable rate mortgages with the mix of investor lending increasing throughout the year as part of a targeted strategy; • RAMS housing loans contracted by 28% to $21.6 billion as the portfolio is closed to new business; • Australian personal lending was down 4%1 to $9.0 billion reflecting subdued new lending; • Growth in Australian business lending of 14%1 to $221.8 billion. Growth in Institutional lending was in the infrastructure, resources, energy and property sectors. Business segment growth was diversified, with strong growth in the target sectors of health, professional services and agriculture and the SME sub segment; • Growth in New Zealand lending of 4% to NZ$107.3 billion with growth mainly in owner occupied mortgages; and • Growth in other overseas loan balances to $12.6 billion. Execution of our strategy in Institutional has led to offshore financing where there is a strong nexus to Australia. Deposits Customer deposits grew by 7% to $723.0 billion and comprised the following movements: • Australian deposits up 8% to $642.6 billion, supported by strong growth in household deposits, an increase in business transaction balances driven by new account openings and retention, and a targeted institutional strategy to maintain strength in the public sector and grow share in financial institutions; • New Zealand deposits were up 2% to $81.0 billion in NZ$ terms reflecting an increase in savings and non-interest bearing balances as customers preferred the flexibility in the falling interest rate environment; and • Other overseas deposits were up 39% to $9.2 billion, primarily from growth in Institutional offshore term deposits. The deposit to loan ratio of 84.9% was 137 basis points higher than 30 September 2024, with deposit growth more than funding loan growth during the year. Non-interest income Non-interest income increased by 6% to $3,004 million. This included Notable Items of $13 million related to hedging items including unrealised revaluations of economic hedges. Excluding Notable Items non-interest income increased by 5% to $2,991 million with key drivers outline below. Non-interest income excluding the impact of Notable Items Non-interest income increased by 5% to $2,991 million. 1. Movement excludes the auto finance portfolio which was sold in March 2025. |
| 276 WESTPAC GROUP 2025 ANNUAL REPORT GROUP PERFORMANCE Review of earnings (Continued) Net fee income increased by 4% to $1,732 million reflecting an increase in card fees and higher business and Institutional lending fees from a larger balance sheet. Net wealth management income increased by 8% to $476 million from higher funds under administration. Trading and other income increased by 7% to $783 million reflecting higher sales and risk management income, including rates and foreign exchange. Operating expenses Total operating expenses increased 9% to $11,916 million. The increase included a restructuring charge of $273 million in the Second Half of 2025 to support targeted productivity initiatives under our Fit for Growth program. Excluding this charge, operating expenses increased by 6% due to the ramp up in UNITE investment, wage growth and higher software amortisation. Lower occupancy costs provided a partial offset. The expense to income ratio excluding Notable Items was 53.0%, up from 50.3%. Staff expenses1 increased by 7% to $6,326 million mainly due to wage growth, UNITE and the investment in bankers. Average FTE increased by 1% with the increase to support UNITE and the investment in bankers more than offsetting reductions from productivity initiatives. Occupancy expenses decreased by 7% to $652 million with further reductions in the Group's corporate and branch footprint. Technology expenses increased 13% to $3,136 million due to higher costs related to the UNITE program, an increase in software amortisation related to projects completed in prior years and higher software maintenance and licensing costs. Other Expenses1 decreased by 3% to $1,529 million due to lower professional and servicing costs and higher costs in the prior year from the closure of RAMS, partly offset by higher litigation and remediation costs, and advertising spend. Fit for Growth restructuring expenses to support targeted productivity initiatives were $273 million in the Second Half of 2025. Investment spend Total investment spend of $1,918 million was 9% higher, primarily due to the increased investment in UNITE. The proportion of investment spend expensed increased by 4 percentage points to 60%. UNITE accounted for 34%, growth and productivity initiatives accounted for 30% and 36% was directed towards risk and regulatory activities. UNITE investment spend increased to $660 million with 74% expensed. Key achievements: • One identity verification process following the consolidation of 20 processes; • Functionality for multiple offset accounts for all eligible home loan customers, providing customers with greater choice and control over their finances; • One BankTrade system, simplifies process while reducing risk and complexity; • Transitioned customers to a single Private Bank under the Westpac brand enabling customers to benefit from an enhanced service offering; and • Banker and customer experience has improved with the consolidation of the two chat platforms to one. Spend in the year focused on prioritised initiatives, including: • Mortgage simplification to a single suite of products, processes and applications; • Moving to One Wealth Platform; • Migrated 6,000 bankers onto Digital Banker; • Consolidating seven collections systems to one system; and • Streamlining fraud operations from four workflow systems to one solution. Growth and Productivity investments include: • Launch and progressive rollout of new features on the integrated business lending origination platform, BizEdge; • The Westpac One Core transaction banking platform achieved New Payments Platform certification, representing significant progress towards delivering real-time treasury management; • Launched Westpac OnlinePay to help business customers accept payments with a virtual terminal; • Enabled Click to Pay on eligible Westpac cards, allowing fast, secure online checkout without sharing card details with merchants; • Enabled onboarding from overseas for eligible customers; 1. Excludes Fit for Growth restructuring expenses. |
| FINANCIAL REPORT EXHIBITS INDEX STRATEGIC REVIEW PERFORMANCE REVIEW EXHIBIT 15.4 ADDITIONAL INFORMATION 277 Review of earnings (Continued) • Implemented AI-driven solutions and integrated M365 Copilot for over 10,000+ employees to help streamline workflows, reduce manual effort and enhance the quality of work; and • Technology and digital capability improvements for customer experience in New Zealand. Risk and Regulatory investments include: • Ongoing improvement of scam prevention capabilities to enhance customer protection; • Core payments platform upgraded, including migration of domestic high value payments and international payments processing to a new application; • Compliance with revised regulation, including the 2025 Banking Code of Practice, Prudential Standard CPS 230, Operational Risk Management and Prudential Standard APS 117, Capital Adequacy - Interest Rate Risk in the Banking Book; and • Continuing to enhance records management systems and processes. Capitalised software Capitalised software decreased $261 million or 10% compared to September 2024. The decrease reflects increased amortisation due to the completion of key projects such as One Banking Platform, payments and investment to comply with RBNZ’s outsourcing policy, BS11. Additions included ongoing investment in payment systems and UNITE. This has resulted in average amortisation period reducing by 0.4 years to 2.7 years from September 2024. Credit impairment charges The credit impairment charge of $424 million represented 5 basis points of average loans, down from 7 basis points in the prior year. The lower impairment charge was mainly due to an increase in write-backs and recoveries partly offset by a higher CAP charge. The CAP charge of $458 million comprised write-offs of $561 million which was partly offset by a benefit in other changes in CAP of $103 million. Write-offs were largely within the credit card and personal loan portfolios. The other changes in CAP were due to: • A reduction from an improved economic outlook for commercial property prices and interest rates; • A reduction in mortgage 90+ day delinquencies from 1.05% to 0.70%; • An increase in the downside scenario weight of 5 percentage points reflecting a rise in geopolitical instability; and • An increase for new portfolio overlays. The IAP benefit of $34 million comprised: • New IAPs of $408 million, mostly in the services and wholesale & retail trade sectors and the mortgages portfolio; • Recoveries of $247 million, mostly within the credit cards and personal loan portfolios; and • Write-backs of $195 million, mostly in the wholesale & retail trade and manufacturing sectors. Income tax expense The rise in the effective tax rate to 31.0%, up from 30.8%, was mainly due to benefits from prior period tax adjustments in Full Year 2024 not repeated in Full Year 2025. The effective tax rate is above the Australian corporate tax rate of 30%. Credit quality Credit quality Stressed exposures as a percentage of total committed exposures were 1.28% a decrease of 17 basis points. The composition and drivers of stressed exposures were: • Impaired exposures of 15 basis points: a 1 basis point decrease reflecting lower impaired balances in the Business portfolio; • Non-performing, 90+ days past due and not impaired exposures of 32 basis points: a 15 basis point decrease reflecting lower mortgage 90+ day delinquencies; • Non-performing, less than 90 days past due and not impaired exposures of 30 basis points: a 7 basis point increase reflecting a rise in mortgages categorised as non-performing after exiting 90+ days past due; and • Watchlist and substandard exposures of 51 basis points: an 8 basis point decrease reflecting lower stress in the Business and New Zealand portfolios. Impaired exposures to gross loans were flat at 0.24%. The provision coverage of the impaired portfolio was 40%, down from 41% at 30 September 2024. Impaired exposures have an appropriate level of provision cover. |
| 278 WESTPAC GROUP 2025 ANNUAL REPORT GROUP PERFORMANCE Credit quality (Continued) Portfolios Stressed exposures in Institutional reduced by 6 basis points to 0.70%, driven by strong volume growth along with lower stress in the trade and, transport and storage sectors. Impaired exposures to TCE increased by 4 basis points to 0.09%, driven by a large single name downgrade in the services sector. Australian Business stressed exposures decreased by 43 basis points to 4.81%, due to improvement in the property and trade sectors. Impaired exposures to TCE decreased by 16 basis points to 0.49% with improvement in the agriculture and manufacturing sectors. Australian mortgage 90+ day delinquencies decreased 39 basis points to 0.73% due to a reduction in hardship and a change to serviceability treatment. Properties in possession were 154, a reduction of 47 reflecting fewer properties being repossessed. Australian other consumer 90+ day delinquencies reduced 34 basis points to 1.13%, driven by the sale of the auto finance portfolio in First Half 2025. In New Zealand, stressed exposure to TCE decreased by 26 basis points to 1.47%. This was driven by a reduction in watchlist exposures in the mining and agriculture sectors. New Zealand mortgage 90+ day delinquencies were 3 basis points lower at 0.46%. Other consumer 90+ day delinquencies were 17 basis points lower at 0.70%. Improvements reflect easing of cost of living pressures. Provisioning Total provisions decreased 2% to $4,987 million driven by a reduction in CAPs. The decrease in modelled CAPs of $168 million was due to: • An improved outlook for commercial property prices and interest rates; • Lower mortgage 90+ day delinquencies; and • The sale of the auto finance portfolio. This was partly offset by a 5 percentage point increase in the downside scenario weight reflecting a rise in geopolitical instability, including in relation to the potential impact of international trade policies. Overlays were $59 million higher. Key movements included: • New overlays related to portfolio seasoning and geographical areas experiencing higher stress not included in modelled outcomes; • Release of the construction sector, Australian mortgages and consumer finance overlays as the expected risks did not materialise or are reflected in modelled outcomes. IAPs remained relatively flat over the year. |
| FINANCIAL REPORT EXHIBITS INDEX STRATEGIC REVIEW PERFORMANCE REVIEW EXHIBIT 15.4 ADDITIONAL INFORMATION 279 SEGMENT REPORTING Segment reporting The impact of Notable Items on net profit, income and expenses have been excluded from the Segment Performance section. Consumer Consumer Net profit increased 4% to $2,282 million. The 4% increase in pre-provision profit included a modest impact from segment compositional changes in Full Year 2025. Full Year 2024 comparatives have not been restated. Excluding composition changes, pre-provision profit also increased 4%, with operating income rising 4% and operating expenses increasing 4%. The increase in operating income reflected 3 basis points of net interest margin expansion while expenses rose reflecting a step up in UNITE spend and inflationary pressures that were partly offset from the benefits of a simpler operating model and a smaller property footprint. Net interest income up 3% • The net interest margin increased 3 basis points to 1.73%. Key drivers included: – Favourable portfolio mix as deposit growth outpaced lending growth, resulting in a higher deposit to loan ratio; – Stabilising lending spreads reflecting customers switching from lower spread fixed rate mortgages to higher spread variable rate mortgages was offset by competition to both retain and attract new mortgage customers; – Lower deposit spreads reflecting a mix shift towards higher interest rate, lower margin savings accounts, a lower interest rate environment and compression in term deposit spreads. These impacts were partly offset by higher returns on hedged deposits and proactive repricing; – Higher funding costs primarily due to the widening of the spread between the bank bill and overnight index swap rates; and – Higher returns on hedge capital balances provided a benefit. • Loans increased by 3% to $525.4 billion. Mortgage growth of 3% was below system, reflecting the decision to close RAMS to new business. Excluding this impact, mortgages grew 5%, representing 0.8x APRA housing system growth. Almost all new flow was in variable rate mortgages, with the mix of investor loans increasing throughout the year as part of a targeted strategy; • Deposits were up 10% to $366.3 billion representing 1.0x APRA household deposits system growth. Growth in savings balances of $20.9 billion reflected the continued shift in customer preference to towards higher yielding flexible products. Mortgage offset balances increased by 15% to $72.7 billion as fixed rate mortgage customers shifted onto variable rate mortgages with deposit offset features; and • With deposit growth continuing to exceed loan growth, the deposit to loan ratio improved 417 basis points to 69.7%. Non-interest income up 6% • Non-interest income increased 6% to $561 million due to higher credit card fees and scheme incentives, which was partly offset by higher customer remediation costs. Expenses up 3% • Operating expenses increased 3%. Excluding compositional changes operating expenses increased 4%. This was driven by: – The step up in UNITE investment, although this was partly offset by lower spend across other investments; and – Inflationary pressures from both wages and salaries and third-party vendor costs. • The benefits from a simpler operating model and a smaller property footprint, including branches and ATMs, partly offset other cost pressures. Impairment charge of $217 million • Impairment charges to average loans were 4 basis points, down 1 basis point from the prior year. The charge reflects write-offs in cards and personal lending and an increase in the downside scenario weight. This was partly offset by a release of portfolio overlay provisions. • Stressed exposure to TCE improved by 19 basis points to 0.91% reflecting the continued resilience of customers. Mortgage 90+ day delinquencies decreased 39 basis points to 0.73% due to a reduction in hardship and a change to serviceability treatment. Other consumer loan 90+ day delinquencies decreased 10 basis points to 1.13%. |
| 280 WESTPAC GROUP 2025 ANNUAL REPORT SEGMENT REPORTING Business & Wealth Business & Wealth Net profit declined 7% to $2,186 million. Pre-provision profit fell 4% to $3,383 million reflecting the impact of segment compositional changes in Full Year 2025. Full Year 2024 comparatives have not been restated. This includes moving the merchant services business from Business & Wealth to Institutional and auto finance from Business & Wealth to Group Businesses following the completion of its sale. Excluding the impact of compositional changes, pre-provision profit fell 1% with a 3% increase in operating income more than offset by a 10% increase in operating expenses. Operating income reflected strong growth in lending balances which was partly offset by a lower net interest margin, while operating expenses increased due to the step up in UNITE spend and investment in front line bankers. Net interest income flat • Excluding compositional changes, net interest income increased 3%. • Strong balance sheet growth was offset by 50 basis points of margin contraction. The decline in net interest margin included the impact from segment compositional changes and provision releases in the prior period. Excluding these impacts, the net interest margin contracted by 39 basis points. Drivers included: – Portfolio mix shift as lending growth outpaced deposit growth, reflected in a lower deposit to loan ratio; – Lower deposit spreads from the impact of a lower cash rate environment and an increase in customers switching to higher yielding accounts. Favourable product mix with growth in transaction and savings accounts and a contraction in term deposits as well as higher returns on hedged deposits partly offset these impacts; and – Lower lending spreads reflecting competitive market dynamics, partly offset by higher returns on hedged capital balances. • Loans increased by 13% to $115.2 billion. Business lending grew 15% with growth diversified across most sectors and segments. Target sectors of agriculture, health and professional services all grew between 17% and 24%. This was partly offset by the wind down and subsequent sale of the $2.1 billion auto finance portfolio; and • Deposits increased 6% to $152.3 billion primarily driven by strong new account growth and proactive retention strategies. Non-interest income down 4% • Non-interest income decreased 4% reflecting compositional changes. Excluding this impact, non-interest income increased 7% reflecting: – Higher platforms revenue, reflecting a 9% increase in funds under administration from strong equity markets and flows into the GIS platform; and – Higher lending fees due to a larger loan book. Expenses up 4% • Operating expenses increased 4%. Excluding compositional changes, operating expenses increased 10% reflecting: – The step up in UNITE investment; – An investment in 135 business bankers and banker tools to drive growth; and – Inflationary pressures on salaries and wages and third party vendor costs, largely offset by lower investment spend on non-UNITE initiatives. Impairment charge of $245 million • The impairment charge of 23 basis points of average loans compared to 14 basis points in the prior year. The charge reflects higher overlays, an increase in the downside scenario and new IAPs in the wholesale & retail trade sector. • Credit quality metrics improved with stressed exposures to TCE decreasing 55 basis points to 5.01%, mostly within the property sector. The proportion of impaired exposures to TCE decreased 18 basis points to 0.50%. |
| FINANCIAL REPORT EXHIBITS INDEX STRATEGIC REVIEW PERFORMANCE REVIEW EXHIBIT 15.4 ADDITIONAL INFORMATION 281 Institutional Institutional Net profit increased 15% to $1,575 million. Pre-provision profit increased 6% to $2,161 million with the inclusion of the merchants business following compositional changes to segments in Full Year 2025. Full Year 2024 comparatives have not been restated. Excluding this impact, pre-provision profit increased 2%, with a 5% rise in operating income more than offsetting an 11% increase in operating expenses. The growth in operating income reflects lending growth and higher earnings on capital. The 11% increase in operating expenses was driven by increased investment spend, including the step up of UNITE and higher software amortisation, in addition to an increase in bankers to support growth. Net interest income up 8% • Solid balance sheet growth more than offset a decline in the net interest margin. The net interest margin contracted 5 basis points, including a benefit from Markets and composition changes. Excluding this, the net interest margin declined 13 basis points reflecting an increase in funding costs, in part due to lending growth outpacing deposit growth, and lending spreads contracted reflecting market dynamics. These were partly offset by higher returns on hedged capital; • Loans increased 17% to $117.7 billion from strengthening relationships with existing clients, predominantly in the infrastructure, property and energy sectors. Offshore lending where there is a clear nexus to Australia or New Zealand also contributed to growth; and • Deposits increased 10% to $131.4 billion driven by transactional, term products and savings accounts. The growth reflects a targeted strategy to maintain strength in the public sector and grow in financial institutions. Non-interest income up 10% • Non-interest income increased 10% to $1,395 million. Excluding the impact of composition changes, non-interest income increased 2%. This was driven by: – Higher fee income from a larger loan book; and – A modest increase in Markets reflecting higher sales and risk management income including rates and foreign exchange. Expenses up 12% • Expenses were up 12% to $1,647 million. Excluding the impact of composition changes, expenses increased 11%. Movements reflected: – Higher investment costs including software amortisation from prior investments and the ramp up of UNITE; and – Inflationary pressures on salaries and wages as well as an increase in front-line staff to support relationships and lending growth. Impairment benefit of $1 million • Impairment benefit of $1 million, compared to a $120 million charge in the prior year. The benefit was driven by revisions to economic forecasts partly offset by new IAPs within the service sector. • Stressed exposures to TCE improved 6 basis points to 0.70% driven by portfolio growth and lower stress in the wholesale & retail trade and transport & storage sectors. The proportion of impaired exposures to TCE deteriorated modestly to 0.09%. |
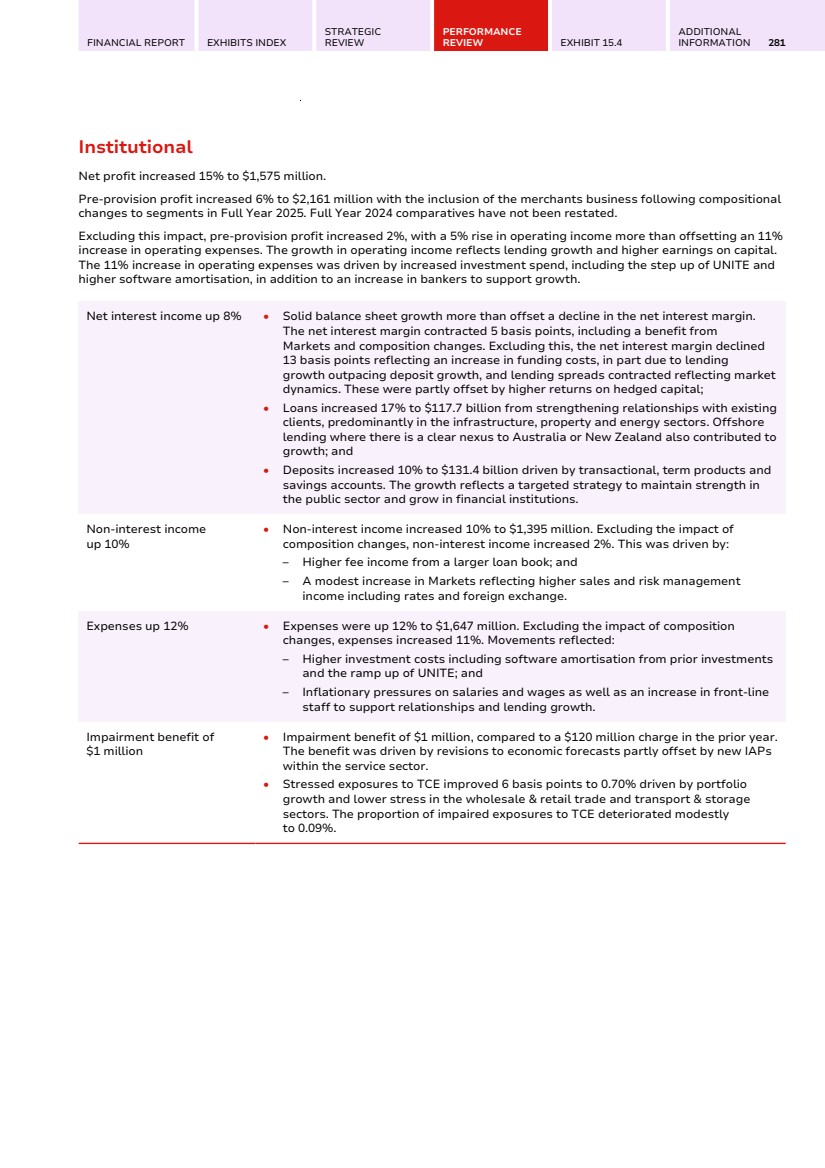
| 282 WESTPAC GROUP 2025 ANNUAL REPORT SEGMENT REPORTING New Zealand New Zealand All figures are in NZ$ unless otherwise stated. Net profit increased 13% to $1,197 million, including a credit impairment benefit. Pre-provision profit increased 8% to $1,618 million, reflecting an 8% increase in operating income which more than offset a 7% increase in operating expenses. Operating income reflected growth in lending and a higher net interest margin, while operating expenses were driven by higher staff expenses, third party vendor costs, software amortisation and higher investment spend. Net interest income up 9% • The net interest margin increased 15 basis points, reflecting improved housing lending spreads and higher returns on transaction deposits and capital balances. This was partly offset by competition for term deposits and lower business lending spreads from competitive pressures. • Loans increased 4%, primarily driven from housing growth. Business conditions continue to reflect a challenging economic environment. Key drivers included: – Mortgage growth of 5%, represents 0.9x RBNZ housing system growth. Expectations for the RBNZ to continue to cut interest rates drove a shift in customers preference to shorter fixed rate tenors and variable rate loans; and – Business lending growth of 2% reflecting higher corporate and medium sized business lending. This was partly offset by a decline in agriculture and institutional lending. • Deposits increased 2% to $81.0 billion, reflecting an increase in savings and transaction balances as customers preferred to retain funds in at call accounts in a falling interest rate environment. The contraction in term deposits reflected a reduction in Institutional term deposits as growth in higher quality household deposits was achieved. Non-interest income down 3% • Non-interest income declined 3% to $270 million reflecting lower cards income. Expenses up 7% • Operating expenses increased 7%, reflecting: – Higher staff expenses and third-party vendor costs; – Increase in technology investment to enhance core infrastructure and digital capability; and – Higher software amortisation. Impairment benefit of $44 million • The impairment benefit to average loans was 4 basis points, compared to a charge of 3 basis points in the prior year. The benefit was driven by write-backs and a CAP benefit, largely in the mortgages portfolio. • Stressed exposures to TCE decreased 26 basis points to 1.47% mostly due to lower watchlist exposures in the agriculture sector. Impaired exposures to TCE increased by 3 basis points to 0.19%. |
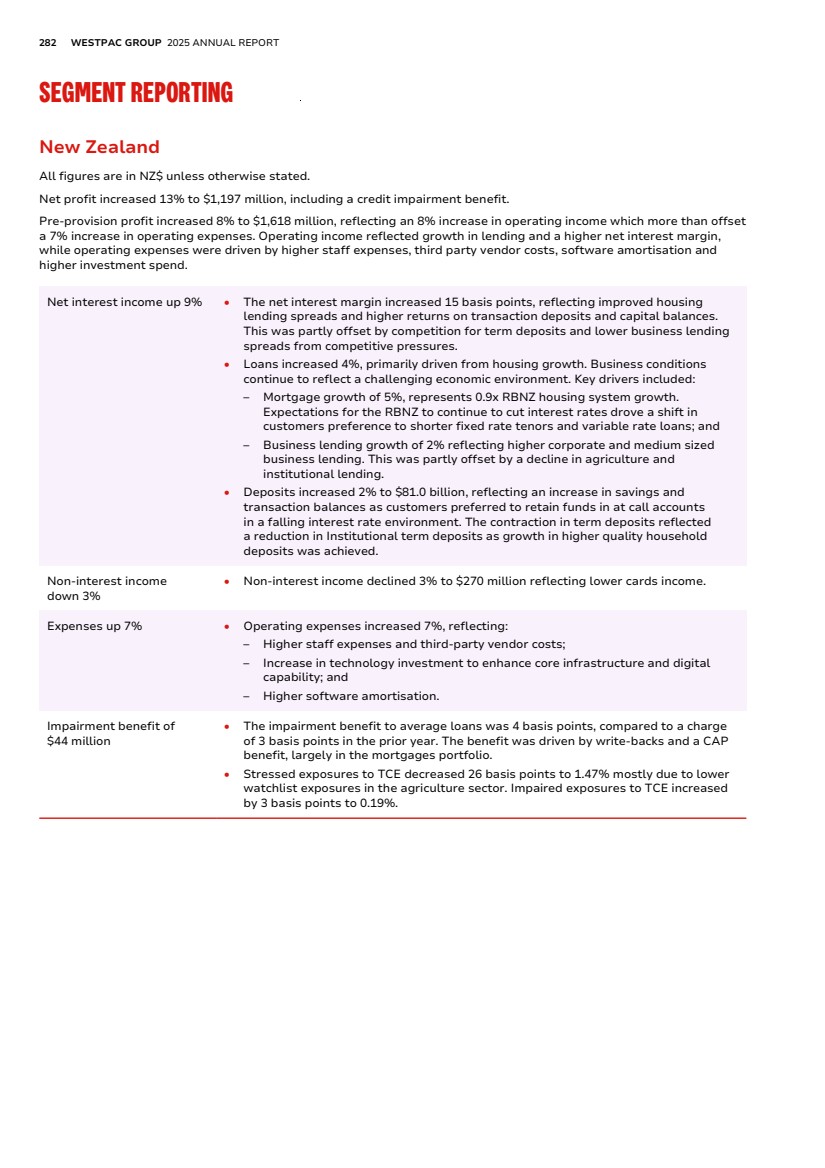
| FINANCIAL REPORT EXHIBITS INDEX STRATEGIC REVIEW PERFORMANCE REVIEW EXHIBIT 15.4 ADDITIONAL INFORMATION 283 Group Businesses Group Businesses Net loss of $161 million compared to a net profit of $227 million in the prior year. Pre-provision profit of $40 million compared to a profit of $513 million in the prior year, including a modest impact from segment compositional changes in Full Year 2025. Full Year 2024 comparatives have not been restated. Excluding composition changes, pre-provision profit also decreased 92% reflecting higher operating expenses. Net operating income down 1% • Income was down $9 million reflecting composition changes. Excluding this impact, operating income decreased $158 million reflecting a decline in income on surplus capital as interest rates reduced. Expenses up 58% • Operating expenses increased 58% or $464 million. Excluding compositional changes, operating expenses increased 34% or $323 million reflecting: – A $273 million restructuring charge to support targeted productivity initiatives through the Fit for Growth program; and – Increases in certain employee provisions and remediation costs. |
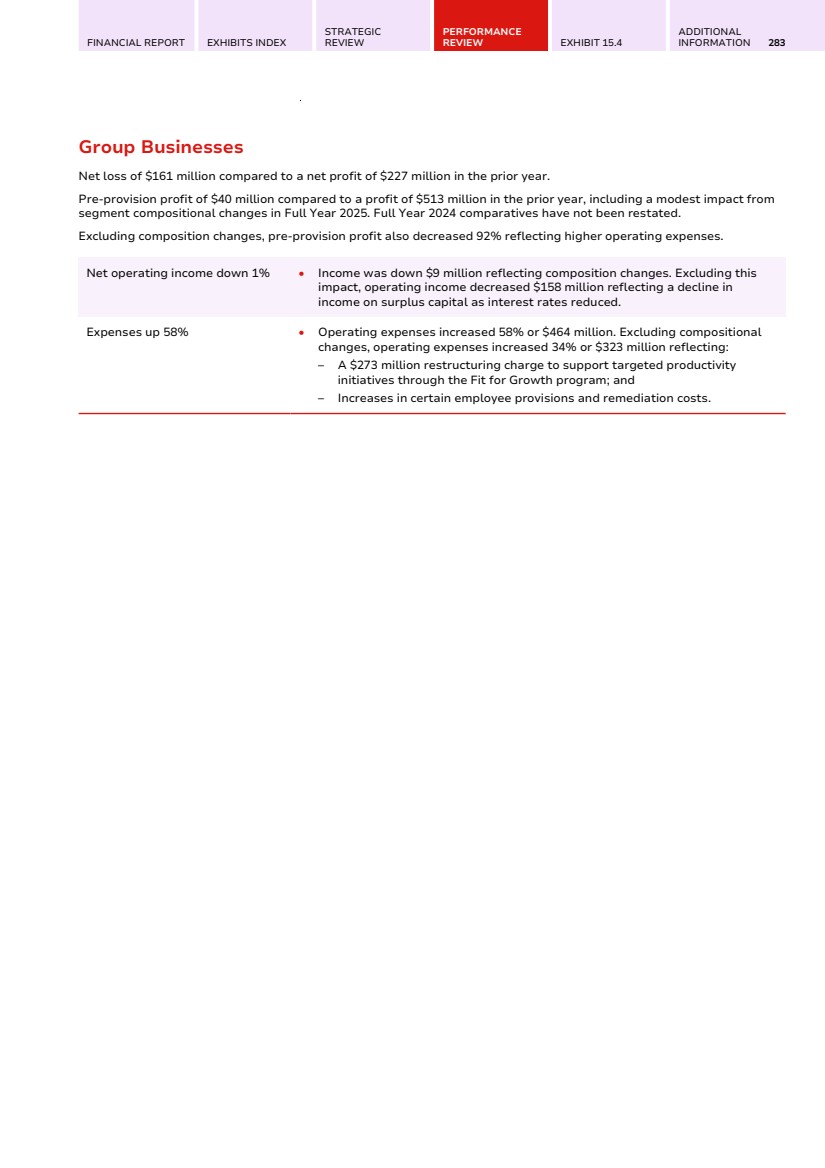
| 284 WESTPAC GROUP 2025 ANNUAL REPORT REVIEW OF EARNINGS: 2024 - 2023 Group performance Review of earnings: 2024 - 2023 Group performance $7.0BN Statutory net profit down 3% on FY23 $7.1BN Net profit excluding Notable Items down 3% on FY23 Statutory net profit for 2024 was $6,990 million, a decrease of 3% on the prior year. Excluding Notable Items, net profit decreased of 3% and pre-provision profit declined by 4% with operating income stable while operating expenses increased 7%. Operating income reflected solid loan growth constrained by a modest decline in net interest margin. The increase in operating expenses was driven by higher software amortisation and technology costs along with the impact of closing RAMS to new business. Net interest income increased 2% as an increase in average interest earnings assets more than offset a 2 basis point decline in net interest margin, from 1.95% to 1.93%. Excluding Notable Items net interest income increased 3% with stronger Treasury and Markets performance and lending growth offsetting a modest decline in net interest margin. Average interest earning assets increased 3% with growth in business lending and owner-occupied mortgages, partly offset by auto finance loan runoff. The deposit to loan ratio increased to 83.5%, with customer deposit growth of 5% broadly funding loan growth during the year. Non-interest income decreased by 15%. The contribution to revenue from business sold was $140 million in the prior period. This related to Advance Asset Management Limited, BT's superannuation business and Westpac Life Insurance Ltd prior to their exit. Excluding Notable Items and the impact of businesses sold in the prior period, non-interest income decreased 5% driven by reduction on other income attributable to losses on commodity and FX derivatives. Operating expenses were 2% higher. Excluding Notable Items operating expenses increased by 7% mainly due to higher software amortisation, higher third-party technology vendor expenses and costs related to closing RAMS to new business. The reduction in operating expenses was partly offset by Cost Reset actions. Credit impairment charges of $537 million represented 7 basis points of average loans, down from 9 basis points in the prior year. The charge reflected the impact of: • Higher inflation, rising interest rates and expectation of slowing economic activity; and • Deterioration in credit quality metrics through the year including increased stressed exposures in mortgages and institutional lending. The effective tax rate of 30.8% was slightly above the Australian corporate tax rate of 30% due to certain non tax deductible expenses. The Board determined a final ordinary dividend of 76 cents per share. The FY24 ordinary dividends of $1.51 per share were 9 cents or 6% higher than the ordinary dividends in the prior year and represented a payout ratio of 74.6%. The 2024 final ordinary dividend was fully franked. |
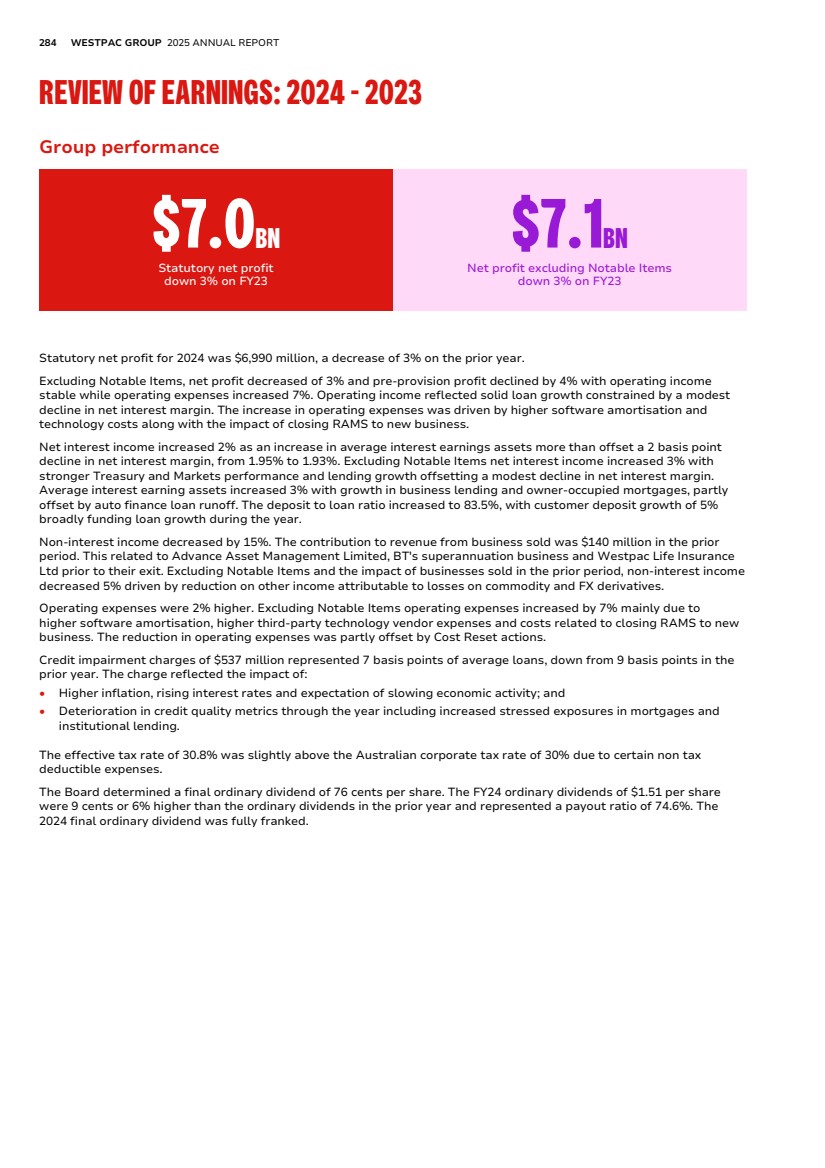
| FINANCIAL REPORT EXHIBITS INDEX STRATEGIC REVIEW PERFORMANCE REVIEW EXHIBIT 15.4 ADDITIONAL INFORMATION 285 Segment performance Segment performance Consumer Net profit of $2,184 million was $461 million or 17% lower. • Net-interest income declined 7% reflecting a 18 basis point reduction in the net interest margin driven by price competition in mortgages and narrower deposit spreads; • Non-interest income rose 1% reflecting the higher credit card fees which was partly offset by higher customer remediation costs.; • Operating expenses rose 6% driven by higher wage and vendor services inflation and increased amortisation, offset by a simpler operating model; and • Impairments charge of $248 million was slightly higher than previous year reflecting higher mortgage and consumer loan delinquencies, which was partly offset by reductions in mortgage overlay. 31% Contribution to Group profit Business and Wealth Net profit of $2,356 million was $270 million or 13% higher. • Net-interest income increased 7% reflecting 18 basis point increase to net interest margin as rising interest rates supported higher deposit spreads and returns on both hedged deposits and capital; • Non-interest income declined 5% due to lower merchant fees and auto finance fees; • Operating expenses increased 7% due to inflationary pressures on salaries and vendor costs, higher investment in BizEdge and investment in business bankers; and • Impairment charge of $142 million reflected a less favourable outlook for commercial property which was offset by a reduction in the downside scenario weight in First Half 2024. Auto finance continued to run-down with $4.2 billion remaining at 30 September 2024. Platforms funds under advisement increased by 11% reflecting higher equity markets valuation and dividend distributions. 34% Contribution to Group profit Westpac Institutional Bank Net profit of $1,367 million was $30 million or 2% higher. • Net-interest income increased by 16% driven by growth in loans of 9% and a 4 basis point increase to net interest margin which benefited from higher interest rates which supported loan and deposit spreads and returns on capital • Non-interest income declined 7% driven by lower sales and risk management income and a reduction from derivative valuation adjustments driven by tightening credit spreads; • Operating expenses increased by 11% reflecting higher software amortisation from investment and higher inflationary pressures on salaries and wages; and • Impairment charge of $120 million was slightly higher than previous year driven by a higher CAP charge reflecting an increase in stressed exposures and revised economic projections. 20% Contribution to Group profit Westpac New Zealand Net profit of NZ$1,055 million was NZ$92 million or 10% higher than 2023, primarily driven by higher returns on both transaction deposits and capital balances, and higher non-interest income from investment income from increased activity. This was partly offset by inflationary pressures on salaries and wages, and increased investment for regulatory activities. 14% Contribution to Group profit |
| 286 WESTPAC GROUP 2025 ANNUAL REPORT REVIEW OF EARNINGS: 2024 - 2023 Segment performance (Continued) Group Businesses Net profit of $110 million was $129 million lower than 2023. • Higher net-interest income reflecting increase in treasury earnings due to favourable positioning for interest rate volatility; and • Lower operating expenses due to favourable employee provision movements, and lower consulting and third-party costs. For further discussion and analysis of the financial year ended 30 September 2024 compared to 2023, please refer to “Group Performance” and “Segment Reporting” on pages 276-313 in our Annual Report on Form 20-F for the fiscal year ended 30 September 2024, which was filed with the US Securities and Exchange Commission on 5 November 2024 and which sections are incorporated herein by reference. |
| FINANCIAL REPORT EXHIBITS INDEX STRATEGIC REVIEW PERFORMANCE REVIEW EXHIBIT 15.4 ADDITIONAL INFORMATION 287 FINANCIAL STATEMENTS Financial statements The financial statements section is presented on pages 1-135. |

| 288 WESTPAC GROUP 2025 ANNUAL REPORT EXHIBIT 15.4 Cybersecurity management and governance Exhibit 15.4 Cybersecurity management and governance The Group Chief Information Security Officer (CISO) reports to the Chief Information Officer, a member of the Executive Team. The CISO is a member of key cybersecurity governance forums and is responsible for leading and managing the cybersecurity function, setting the cybersecurity strategy and direction, and overseeing the implementation, operation and execution of the cybersecurity policies, standards, controls, and capabilities, including for third parties who are engaged to manage Westpac’s information assets. We have implemented a range of cybersecurity processes, technologies, and controls to facilitate our efforts to assess, identify, and manage such risks, including regular network and endpoint monitoring, access controls, vulnerability assessments, penetration testing, annual information security training for employees, and tabletop cybersecurity incident response exercises. We have an Incident Response Plan which guides the actions we are to take in the event of a suspected or confirmed cybersecurity incident. The plan includes processes to triage, investigate, contain, and remediate the incident. The plan is designed to contain and minimise the impact of a cybersecurity incident on our customers. We also maintain a Business Continuity Plan, which provides procedures for maintaining the continuity of critical business processes in the event of business interruption, including any that involve cybersecurity incidents which may significantly impact our operations. Our cybersecurity team is informed about and monitors the prevention, mitigation, detection and remediation of cybersecurity threats through their management of, and participation in, the strategy processes. The CISO and the cybersecurity team have relevant expertise and experience in various aspects of cybersecurity, such as strategy, governance, risk management, threat intelligence, incident response, security operations, architecture, engineering, testing and awareness. The CISO has extensive experience in information technology and cybersecurity. The cybersecurity team consists of qualified and competent professionals who have diverse backgrounds and skills in cybersecurity. The cybersecurity team regularly participates in training, education, and development programs to enhance their knowledge and skills to keep up with the evolving cybersecurity landscape. As part of its cybersecurity risk management, Westpac engages with third parties for independent reviews and assessments of its cybersecurity policies, standards, controls, and capabilities. These third parties include external auditors, industry bodies, consultants, and specialists. The purpose of these engagements is to obtain assurance, validation, benchmarking and improvement recommendations on Westpac's cybersecurity posture and maturity. Westpac holds ISO27001, PCI-DSS and SOC 2 Type 2 certifications for areas of the Group. The CISO escalates key cybersecurity risk and control issues, as appropriate, to the Technology Risk Committee (TRC) or to the appropriate Line of Business and Divisional Committees. The TRC, a senior management committee, oversees the technology function and technology risk management. The TRC reports to the Group Executive Risk Committee (GRISKCO), the executive management committee responsible for overseeing the group's strategy, performance, and risk management. The Board of Directors receives periodic updates from the CIO and the CISO regarding cybersecurity matters. The Board is ultimately responsible for the oversight of the cybersecurity risk management. The Board delegates some of its oversight responsibilities to the Board Risk Committee, which assists the Board in the oversight of cybersecurity risk management. During the period covered by this 2025 Annual Report, we have not experienced any cybersecurity incidents which have materially affected or are reasonably likely to materially affect our business strategy, results of operations, or financial condition. However, institutions like ours, as well as our employees, service providers and other third parties have experienced a significant increase in information security and cybersecurity risk in recent years and will likely continue to be the target of increasing sophisticated cyber-related attacks. |
| FINANCIAL REPORT EXHIBITS INDEX STRATEGIC REVIEW PERFORMANCE REVIEW EXHIBIT 15.4 ADDITIONAL INFORMATION 289 ADDITIONAL INFORMATION READING THIS REPORT SHAREHOLDER INFORMATION OTHER WESTPAC BUSINESS INFORMATION GLOSSARY OF ABBREVIATIONS AND DEFINED TERMS |

| 290 WESTPAC GROUP 2025 ANNUAL REPORT READING THIS REPORT Disclosure regarding forward-looking statements Reading this report Disclosure regarding forward-looking statements This 2025 Annual Report contains statements that constitute ‘forward-looking statements’ within the meaning of Section 21E of the US Securities Exchange Act of 1934. Forward-looking statements are statements that are not historical facts. Forward-looking statements appear in a number of places in this 2025 Annual Report and include statements regarding our current intent, belief or expectations with respect to our business and operations, macro and micro economic and market conditions, results of operations and financial condition and performance, capital adequacy and liquidity and risk management, including, without limitation, future loan loss provisions and financial support to certain borrowers, forecasted economic indicators and performance metric outcomes, indicative drivers, climate- and other sustainability-related statements, commitments, targets, projections and metrics, and other estimated and proxy data. Words such as ‘will’, ‘may’, ‘expect’, ‘intend’, ‘seek’, ‘would’, ‘should’, ‘could’, ‘continue’, ‘plan’, ‘estimate’, ‘anticipate’, ‘believe’, ‘probability’, ‘indicative’, ‘risk’, ‘aim’, ‘outlook’, ‘forecast’, ‘assumption’, ‘projection’, ‘target’, ‘goal’, ‘guidance’, ‘objective’, ‘ambition’ or other similar words, are used to identify forward-looking statements. These statements reflect our current views on future events and are subject to change, certain known and unknown risks, uncertainties and assumptions and other factors which are, in many instances, beyond our control (and the control of our officers, employees, agents, and advisors), and have been made based on management’s and/or the Board's current expectations or beliefs concerning future developments and their potential effect upon Westpac. Forward-looking statements may also be made, verbally or in writing, by members of Westpac’s management or Board in connection with this 2025 Annual Report. Such statements are subject to the same limitations, uncertainties, assumptions and disclaimers set out in this document. There can be no assurance that future developments or performance will align with our expectations or that the effect of future developments on us will be those anticipated. Actual results could differ materially from those we expect or which are expressed or implied in forward-looking statements, depending on various factors including, but not limited to: • information security breaches, including cyberattacks • geopolitical events, conflicts, trade tensions (including the adoption of protectionist trade measures (including tariffs) or sanctions) or other changes in countries in which Westpac, its customers or suppliers operate • the effect of, and changes in, laws, regulations, policies, supervisory activities, regulator expectations and industry codes of practice • actual or alleged failure to comply with laws, regulations or regulatory policy • the effectiveness of our risk management, including our framework, policies, processes, practices, governance, accountability and culture • the reliability and security of Westpac’s technology and risks associated with changes to technology systems that we use or are used in connection with our business • climate-related risks (including physical, transition and liability risks) that may arise from changing climate patterns, and risks associated with the transition to a lower carbon economy (including Westpac’s ambition to become a net-zero, climate resilient bank) or risks from legal and regulatory action, or risks from other sustainability factors such as human rights and natural capital • the failure to comply with financial crime obligations (including anti-money laundering and counter-terrorism financing laws, anti-bribery and corruption laws, sanctions laws and tax transparency laws) • internal and external events which may adversely impact our reputation • litigation and other legal proceedings and regulator investigations and enforcement actions (including the liability of Westpac to pay significant monetary settlements and legal costs in order to resolve a dispute) • adverse funding market conditions including market volatility, disruptions and decreased liquidity • inadequate capital levels • material downturn or shock to the economies of Australia or New Zealand, or a slowdown in economic growth or change in policy settings of Australia’s major trading partners • declines in asset markets or an increase in impairments and provisioning • failure to maintain our credit ratings • the effects of market competition and competition regulatory policy impacting the areas in which we operate • operational risks resulting from inadequate or failed internal processes, people and systems or from external events • market risk resulting from changes in market factors, such as foreign exchange rates, commodity prices, equity prices, credit spreads and interest rates • poor data quality, data availability, data controls, data retention or data destruction • evaluation and implementation of strategic decisions, priorities and objectives including to simplify, streamline, diversify, innovate, separate, divest, retain, acquire, invest and integrate • failure to recruit and retain key executives, employees and Directors • changes to our critical accounting assumptions and estimates; and |
| FINANCIAL REPORT EXHIBITS INDEX STRATEGIC REVIEW PERFORMANCE REVIEW EXHIBIT 15.4 ADDITIONAL INFORMATION 291 Disclosure regarding forward-looking statements (Continued) • various other factors including those beyond Westpac’s control. The above list is not exhaustive. For certain other factors that may impact on forward-looking statements made by Westpac, refer to Risk Management (page 180) and the 2025 Risk Factors. When relying on forward-looking statements to make decisions with respect to Westpac, investors and others relying on information in this 2025 Annual Report should carefully consider the foregoing factors and other uncertainties and events. Except as required by law, we assume no obligation to revise or update any forward-looking statements in this 2025 Annual Report, whether from new information, future events, conditions, or otherwise, after the date of this 2025 Annual Report. Further important information regarding climate change and sustainability-related statements This 2025 Annual Report contains forward-looking statements and other representations relating to ESG topics, including but not limited to climate change, net zero, climate resilience, natural capital, emissions intensity, human rights and other sustainability-related statements, commitments, targets, projections, scenarios, risk and opportunity assessments, pathways, forecasts, estimated projections and other proxy data. These are subject to known and unknown risks, and there are significant uncertainties, limitations, risks and assumptions in the metrics and modelling on which these statements rely. In particular, the metrics, methodologies and data relating to climate and sustainability are rapidly evolving and maturing, including variations in approaches and common standards in estimating and calculating emissions, and uncertainty around future climate- and sustainability-related policy and legislation. There are inherent limits in the current scientific understanding of climate change and its impacts. Some material contained in this 2025 Annual Report may include information including, without limitation, methodologies, modelling, scenarios, reports, benchmarks, tools and data, derived from publicly available or government or industry sources that have not been independently verified. No representation or warranty is made as to the accuracy, completeness or reliability of such information. There is a risk that the estimates, judgements, assumptions, views, models, scenarios or projections used by Westpac may turn out to be incorrect. These risks may cause actual outcomes, including the ability to meet commitments and targets, to differ materially from those expressed or implied in this 2025 Annual Report and the 2025 Risk Factors. The climate- and sustainability-related forward-looking statements made in this 2025 Annual Report and the 2025 Risk Factors are not guarantees or predictions of future performance and Westpac gives no representation, warranty or assurance (including as to the quality, accuracy or completeness of these statements), nor guarantee that the occurrence of the events expressed or implied in any forward-looking statement will occur. There are usually differences between forecast and actual results because events and actual circumstances frequently do not occur as forecast and these differences may be material. Westpac will continue to review and develop its approach to ESG as this subject area matures. |
| 292 WESTPAC GROUP 2025 ANNUAL REPORT READING THIS REPORT Non-AAS financial measures Non-AAS financial measures Westpac’s statutory results are prepared in accordance with AAS and are also compliant with IFRS. In assessing Westpac’s performance and that of our operating segments we use a number of financial measures, including amounts, measures and ratios that are presented on a non-AAS basis, as described below. Non-AAS financial measures and ratios do not have standardised meanings under AAS. As such they are unlikely to be directly comparable to similar measures presented by other companies and should not be viewed in isolation from, or as a substitute for, the AAS results. Our non-AAS measures fall within the following categories: MEASURE/RATIO DESCRIPTION FURTHER INFORMATION Income statement measures excluding Notable Items The net interest income, non-interest income, operating expenses and segment reporting sections of this report include performance measures that exclude Notable Items. Notable Items are items that management believes are not reflective of Westpac’s ongoing business performance. Details of Notable Items are included in Impact of Notable Items (page 294). Performance measures which are adjusted for one or more of these items include: • Net interest income • Non-interest income (including net fee income, net wealth management, trading income and other income) • Net operating income (including net interest income and non-interest income) • Operating expenses (including staff expenses, occupancy expenses, technology expenses and other expenses) • Pre-provision profit • Income tax (expense)/benefit • Net profit • Net profit attributable to owners of WBC • Net profit attributable to owners of WBC (adjusted for RSP dividends) • Core net interest income • Core NIM Management considers this information useful as these measures provide a view that reflects Westpac’s ongoing business performance. See pages 297-298 Pre-provision profit Pre-provision profit is net profit/(loss) excluding credit impairment (charges)/benefits and income tax (expense)/benefit. This is calculated as net interest income plus non-interest income less operating expenses. This includes (charges)/benefits relating to provisions and impairment other than from expected credit losses. Management considers this information useful as this measure provides readers with a view of the impact of the operating performance of Westpac. See page 298 Basic earnings per share excluding Notable Items and Diluted earnings per share excluding Notable Items Basic earnings per share excluding Notable Items is calculated as net profit attributable to owners of WBC (adjusted for RSP dividends) excluding Notable Items divided by the weighted average number of ordinary shares on issue during the period, adjusted for treasury shares. Diluted earnings per share is calculated by adjusting the basic earnings per share excluding Notable Items by assuming all dilutive potential ordinary shares are converted. Management considers this information useful as these measures provide a view of the basic and diluted earnings per share based on the ongoing operating performance of Westpac. See pages 297-298 |
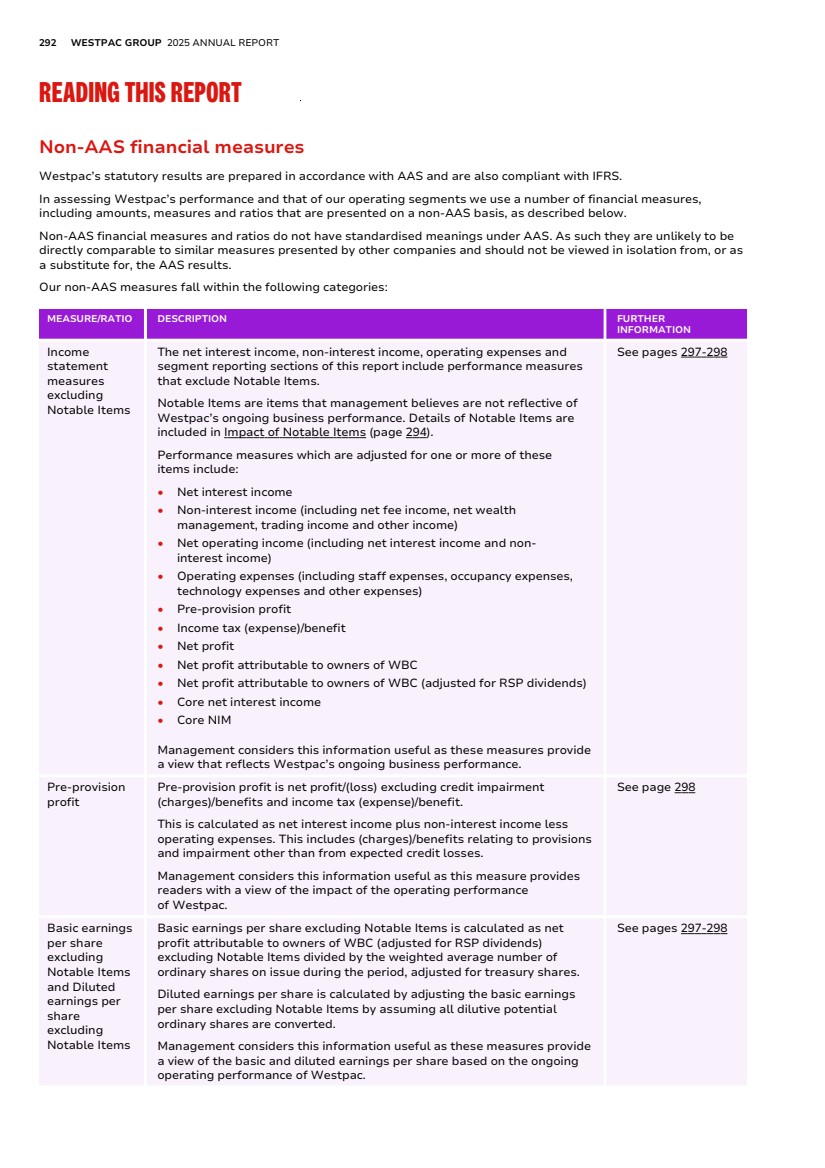
| FINANCIAL REPORT EXHIBITS INDEX STRATEGIC REVIEW PERFORMANCE REVIEW EXHIBIT 15.4 ADDITIONAL INFORMATION 293 Non-AAS financial measures (Continued) MEASURE/RATIO DESCRIPTION FURTHER INFORMATION Core net interest income and core net interest margin (NIM) Core net interest income is calculated as net interest income excluding Treasury and Markets income. Core NIM is calculated as core net interest income (annualised where applicable) divided by average interest earning assets. Management considers this information useful as these measures provide a view of the underlying performance of Westpac’s net interest income and margin, for lending, deposit and wholesale funding. See page 298 Adjusted dividend payout ratio Calculated as ordinary dividend paid/declared on issued shares (net of Treasury shares) divided by the net profit attributable to owners of WBC (adjusted for RSP dividends) excluding Notable Items. Management considers this information useful as it provides a view of the dividend payout ratio based on the ongoing operating performance of Westpac. See pages 297-298 Expense to income ratio excluding Notable Items Calculated as operating expenses excluding Notable Items divided by net operating income excluding Notable Items. Management considers this information useful as this measure provides a view of the efficiency of the ongoing operating performance of Westpac. See page 297 Average tangible ordinary equity, Return on average tangible ordinary equity (ROTE) and ROTE excluding Notable Items Average tangible ordinary equity is calculated as average ordinary equity less average intangible assets (excluding capitalised software). Return on average tangible ordinary equity is calculated as net profit attributable to owners of WBC adjusted for RSP dividends (annualised where applicable) divided by average tangible ordinary equity. ROTE excluding Notable Items is calculated as net profit attributable to owners of WBC adjusted for RSP dividends (annualised where applicable) excluding Notable Items divided by average tangible ordinary equity. Management considers this information useful as these measures are commonly used as a performance measure by WBC, investors, analysts and others in assessing Westpac's application of equity. See pages 297-298 Return on average ordinary equity (ROE) excluding Notable Items ROE excluding Notable Items is calculated as net profit attributable to owners of WBC adjusted for RSP dividends (annualised where applicable) excluding Notable Items divided by average ordinary equity. Management considers this information useful as this measure provides a view that reflects Westpac’s ongoing business performance. See pages 297-298 |
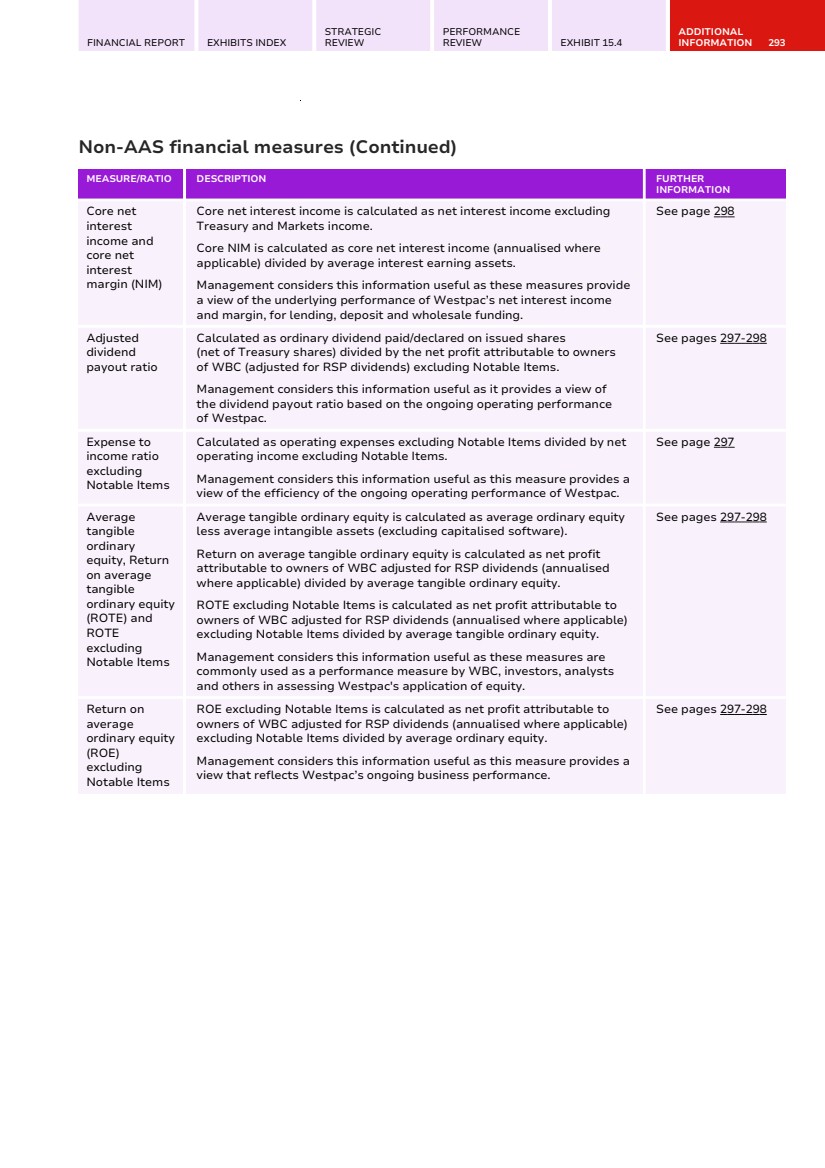
| 294 WESTPAC GROUP 2025 ANNUAL REPORT READING THIS REPORT Non-AAS financial measures (Continued) Impact of Notable Items To assist in explaining our financial performance, we report Notable Items, which represent certain items that are not considered to be reflective of Westpac's ongoing business performance. Notable Items fall into the following categories: • Unrealised fair value gains/(losses) on economic hedges that do not qualify for hedge accounting • Net ineffectiveness on qualifying hedges • Large items that are not reflective of Westpac's ordinary operations. In individual reporting periods large items may include: – Provisions for remediation, litigation, fines and penalties – The impact of asset sales and revaluations – The write-down of assets (including goodwill and capitalised software) – Restructuring costs In determining dividends, the impact of Notable Items is typically excluded. Notable Items reduced net profit after tax in 2025 by $56 million (2024: $123 million, 2023: $173 million). Details of Notable Items (post tax) impacting on 2025 results are presented below: Category Net profit impact Detail 2025 Unrealised fair value gains/ (losses) on economic hedges that do not qualify for hedge accounting $43 million reduction The unrealised fair value loss on hedges of accrual accounted term funding transactions for the year was $43 million. This represents a timing difference for the statutory results but does not affect profits over the life of the hedge. Net ineffectiveness on qualifying hedges $13 million reduction The net ineffectiveness on qualifying hedges of $13 million for the period arises from the fair value movement in these hedges which reverses over time and therefore does not affect profits over time. Total Notable Items $56 million reduction Details of Notable Items (post tax) impacting on 2024 results are presented below: 2024 Unrealised fair value gains/ (losses) on economic hedges that do not qualify for hedge accounting $128 million reduction The unrealised fair value loss on hedges of accrual accounted term funding transactions for the year was $128 million. This represents a timing difference for the statutory results but does not affect profits over the life of the hedge. Net ineffectiveness on qualifying hedges $5 million benefit The net ineffectiveness on qualifying hedges of $5 million for the period arises from the fair value movement in these hedges which reverses over time and therefore does not affect profits over time. Total Notable Items $123 million reduction Details of Notable Items (post tax) impacting on 2023 results are presented below: |
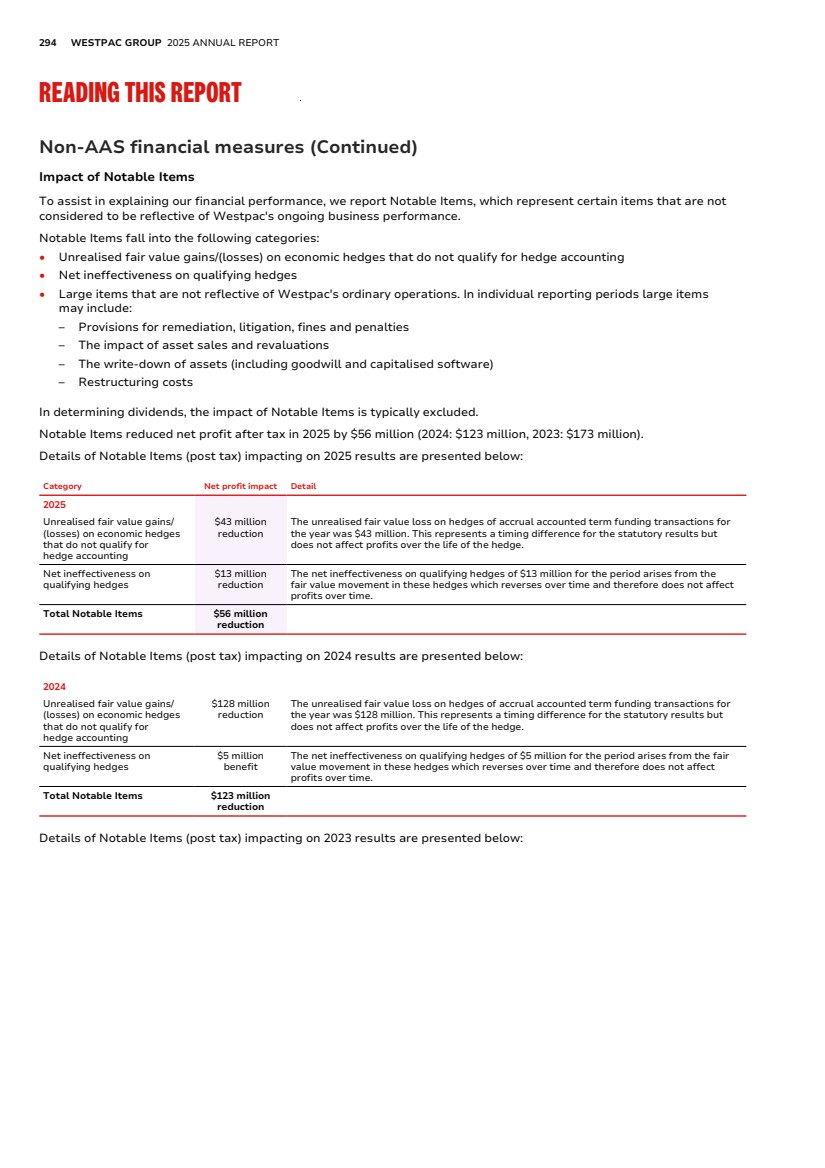
| FINANCIAL REPORT EXHIBITS INDEX STRATEGIC REVIEW PERFORMANCE REVIEW EXHIBIT 15.4 ADDITIONAL INFORMATION 295 Non-AAS financial measures (Continued) Category Net profit impact Detail 2023 The impact of asset sales and revaluations $256 million benefit Gain on the sale of Advance Asset Management Limited of $243 million. This also includes a tax refund related to transaction and separation costs. Provision for remediation, litigation, fines and penalties $176 million reduction Net operating income - $103 million • Decrease in revenue due to additional repayments to institutional, business and superannuation customers. Expenses - $132 million • An increase in provisions for costs associated with customer remediation programs, regulatory investigations and litigation of $90 million. • Estimated costs for the one-off levy for the Commonwealth’s Compensation Scheme of Last Resort of $42 million. Restructuring costs $140 million reduction Costs associated with accelerating organisation simplification and the discontinuance of specialist businesses. The write-down of assets $87 million reduction The write-down of property assets and costs related to the reduction in corporate office space and accelerated consolidation of branches. Unrealised fair value gains/ (losses) on economic hedges that do not qualify for hedge accounting $92 million reduction The unrealised fair value loss on hedges of accrual accounted term funding transactions for the year was $92 million. This represents a timing difference for the statutory results but does not affect profits over the life of the hedge. Net ineffectiveness on qualifying hedges $66 million benefit The net ineffectiveness on qualifying hedges of $66 million for the period arises from the fair value movement in these hedges which reverses over time and therefore does not affect profits over time. Total Notable Items $173 million reduction |
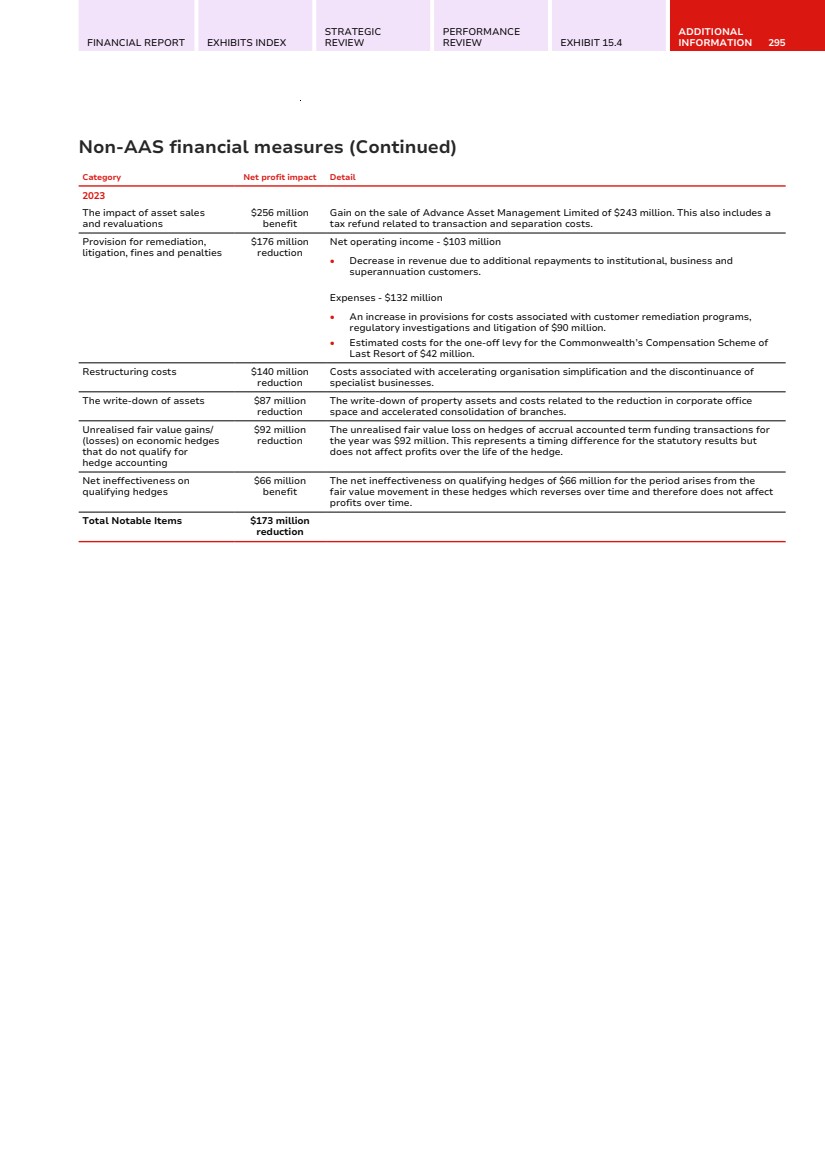
| 296 WESTPAC GROUP 2025 ANNUAL REPORT READING THIS REPORT Non-AAS financial measures (Continued) A summary of 2025, 2024 and 2023 Notable Items is presented below: $m Hedging items Large items Total 2025 Net interest income (93) - (93) Non-interest income 13 - 13 Net operating income (80) - (80) Operating expenses - - - Pre-provision profit (80) - (80) Income tax (expense)/benefit and NCI 24 - 24 Net profit/(loss) (56) - (56) 2024 Net interest income (163) - (163) Non-interest income (12) - (12) Net operating income (175) - (175) Operating expenses - - - Pre-provision profit (175) - (175) Income tax (expense)/benefit and NCI 52 - 52 Net profit/(loss) (123) - (123) 2023 Net interest income (19) (78) (97) Non-interest income (18) 218 200 Net operating income (37) 140 103 Operating expenses - (460) (460) Pre-provision profit (37) (320) (357) Income tax (expense)/benefit and NCI 11 173 184 Net profit/(loss) (26) (147) (173) |
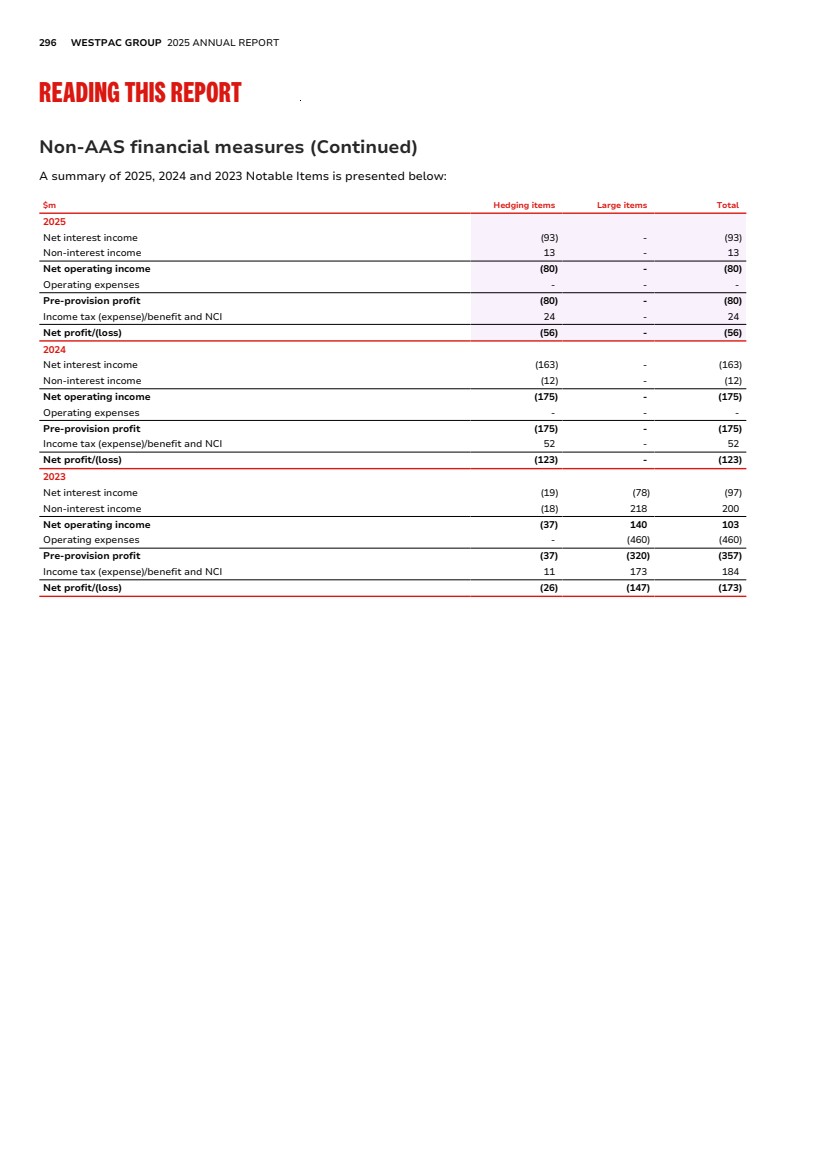
| FINANCIAL REPORT EXHIBITS INDEX STRATEGIC REVIEW PERFORMANCE REVIEW EXHIBIT 15.4 ADDITIONAL INFORMATION 297 Non-AAS financial measures (Continued) Calculation of Non-AAS financial measures Details of the calculation of non-AAS financial measures not disclosed elsewhere are provided below: Reconciliation of statutory income statement performance measures to performance measures excluding Notable Items $m Statutory measure Hedging items Large items Ex Notable Items measure 2025 Net interest income 19,380 93 - 19,473 Trading income 717 (13) - 704 Income tax (expense)/benefit and NCI (3,128) (24) - (3,152) 2024 Net interest income 18,753 163 - 18,916 Trading income 704 12 - 716 Income tax (expense)/benefit and NCI (3,117) (52) - (3,169) 2023 Net interest income 18,317 19 78 18,414 Net wealth management income 562 - 10 572 Trading income 717 18 15 750 Other income 404 - (243) 161 Operating expenses (10,692) - 460 (10,232) Income tax (expense)/benefit and NCI (3,110) (11) (173) (3,294) Expense to income ratio (excluding Notable Items) $m 2025 2024 2023 Operating expenses 11,916 10,944 10,692 Less: Notable Items (operating expenses) - - (460) Operating expenses excluding Notable Items 11,916 10,944 10,232 Net operating income 22,384 21,588 21,645 Add/(less): Notable Items (net interest income) 93 163 97 Add/(less): Notable Items (non-interest income) (13) 12 (200) Net operating income excluding Notable Items 22,464 21,763 21,542 Expense to income ratio (excluding Notable Items) 53.04% 50.29% 47.50% Net profit attributable to owners of WBC (adjusted for RSP dividends) excluding Notable Items $m 2025 2024 2023 2022 2021 Net profit attributable to owners of WBC 6,916 6,990 7,195 5,694 5,458 Adjustment for restricted share dividends (6) (7) (5) (3) (2) Net profit attributable to owners of WBC (adjusted for RSP dividends) 6,910 6,983 7,190 5,691 5,456 Add/(less): Notable Items (post tax) 56 123 173 874 1,495 Net profit attributable to owners of WBC (adjusted for RSP dividends) excluding Notable Items 6,966 7,106 7,363 6,565 6,951 Average tangible ordinary equity and Return on average tangible ordinary equity (ROTE) $m 2025 2024 2023 2022 2021 Net profit attributable to owners of WBC (adjusted for RSP dividends) 6,910 6,983 7,190 5,691 5,456 Average ordinary equity 71,544 71,493 71,229 70,268 70,849 Less: Intangible assets (average) (10,586) (10,758) (10,664) (10,182) (11,310) Add: Computer software (average) 2,518 2,680 2,552 1,992 2,361 Average tangible ordinary equity 63,476 63,415 63,117 62,078 61,900 Return on average tangible ordinary equity (ROTE) 10.89% 11.01% 11.39% 9.17% 8.81% |
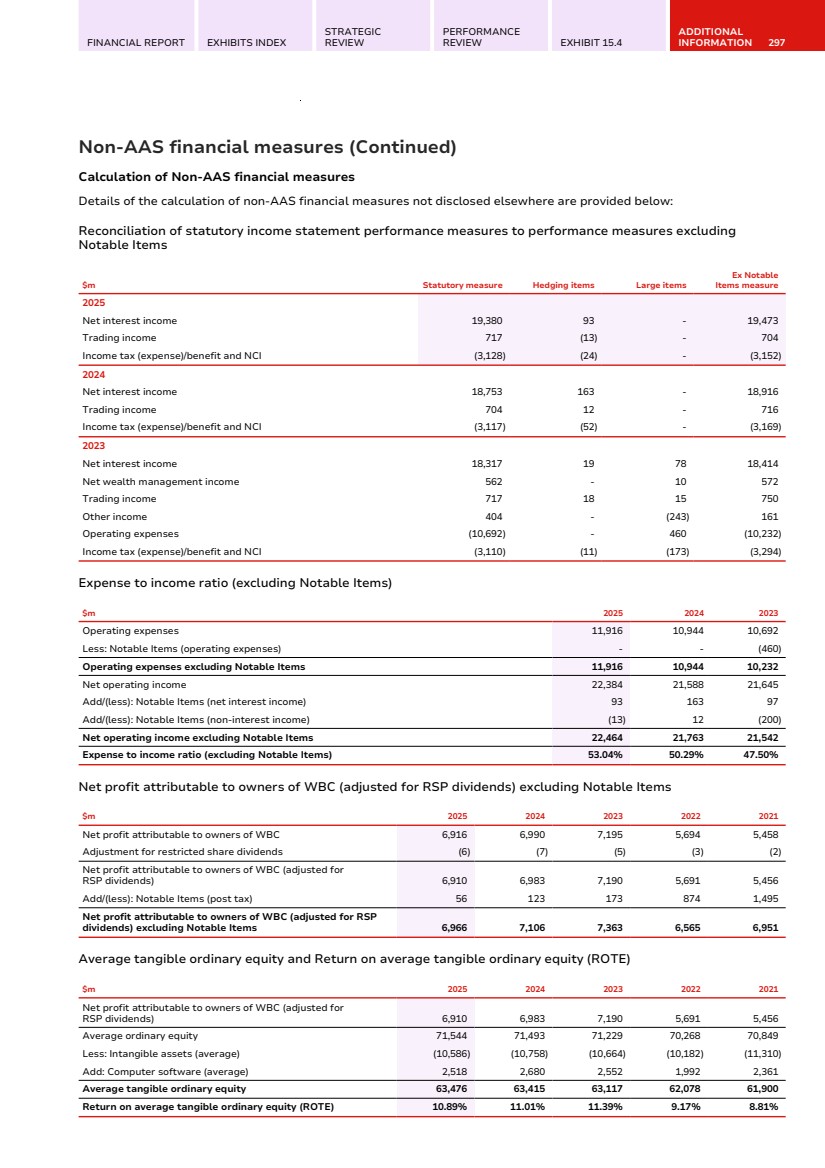
| 298 WESTPAC GROUP 2025 ANNUAL REPORT READING THIS REPORT Non-AAS financial measures (Continued) ROE (excluding Notable Items) and ROTE (excluding Notable Items) $m 2025 2024 2023 2022 2021 Net profit attributable to owners of WBC (adjusted for RSP dividends) excluding Notable Items 6,966 7,106 7,363 6,565 6,951 Average ordinary equity 71,544 71,493 71,229 70,268 70,849 Average tangible ordinary equity 63,476 63,415 63,117 62,078 61,900 Return on average ordinary equity (excluding Notable Items) 9.74% 9.94% 10.34% 9.34% 9.81% Return on average tangible ordinary equity (excluding Notable Items) 10.97% 11.21% 11.67% 10.58% 11.23% Pre-provision profit $m 2025 2024 2023 Net interest income 19,380 18,753 18,317 Non-interest income 3,004 2,835 3,328 Operating expenses (11,916) (10,944) (10,692) Pre-provision profit 10,468 10,644 10,953 Adjusted dividend payout ratio $m 2025 2024 2023 Ordinary dividend paid/declared on issued shares (net of Treasury shares) 5,227 5,208 4,975 Divided by: Net profit attributable to owners of WBC (adjusted for RSP dividends) excluding Notable Items 6,966 7,106 7,363 Adjusted dividend payout ratio (excluding Notable Items)a 75.04% 73.29% 67.57% a. Dividend used in calculation not subjected to rounding. Core net interest income (excluding Notable Items) and core NIM (excluding Notable Items) $m 2025 2024 2023 Net interest income 19,380 18,753 18,317 Less: Treasurya (946) (893) (710) Less: Markets (243) (252) (166) Core net interest income 18,191 17,608 17,441 Add: Non-hedging Notable Itemsa - - 78 Core net interest income (excluding Notable Items) 18,191 17,608 17,519 Average interest earning assets 1,002,856 970,055 940,449 Core NIM 1.81% 1.82% 1.85% Core NIM (excluding Notable Items) 1.81% 1.82% 1.86% a. Hedging Notable Items are included in the Treasury net interest income. Earnings per ordinary share (excluding Notable Items) 2025 2024 2023 Basic Diluted Basic Diluted Basic Diluted Net profit attributable to owners of WBC (adjusted for RSP dividends) ($m) 6,910 7,358 6,983 7,466 7,190 7,595 Add/(less): Notable Items ($m) 56 56 123 123 173 173 Adjusted net profit attributable to owners of WBC (adjusted for RSP dividends) (excluding Notable Items) ($m) 6,966 7,414 7,106 7,589 7,363 7,768 Adjusted weighted average number of ordinary shares 3,422 3,690 3,476 3,895 3,502 3,891 Earnings per ordinary share (excluding Notable Items) (cents) 203.6 200.9 204.4 194.8 210.3 199.6 |
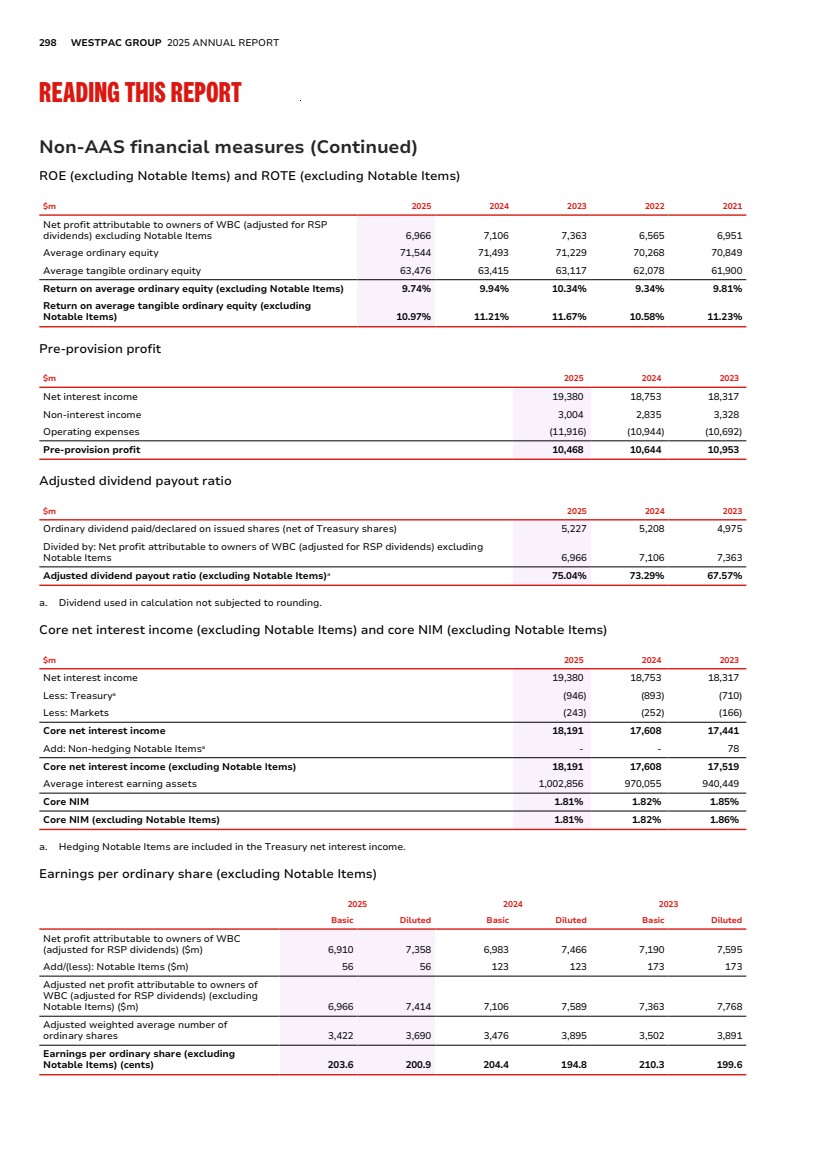
| FINANCIAL REPORT EXHIBITS INDEX STRATEGIC REVIEW PERFORMANCE REVIEW EXHIBIT 15.4 ADDITIONAL INFORMATION 299 Currency of presentation, exchange rates and certain definitions Currency of presentation, exchange rates and certain definitions In this Annual Report, ‘financial statements’ means our audited consolidated balance sheets as at 30 September 2025 and 30 September 2024 and income statements, statements of comprehensive income, changes in equity and cash flows for each of the years ended 30 September 2025, 2024 and 2023 together with accompanying notes which are included in this Annual Report. Our financial year ends on 30 September. As used throughout this Annual Report, the financial year ended 30 September 2025 is referred to as 2025 and other financial years are referred to in a corresponding manner. All dollar values in this report are in Australian dollars unless otherwise noted or the context otherwise requires, references to ‘dollars’, ‘dollar amounts’, ‘$’, ‘AUD’ or ‘A$’ are to Australian dollars. References to ‘US$’, ‘USD’ or ‘US dollars’ are to United States dollars, references to ‘NZ$’, ‘NZD’ or ‘NZ dollars’ are to New Zealand dollars and references to 'GBP' are to British Pound Sterling. Refer to Exchange rates (page 299) for information regarding the rates of exchange between the Australian dollar and the US dollar applied by Westpac as part of its operating activities for 2025, 2024 and 2023. Any discrepancies between totals and sums of components in tables contained in this Annual Report are due to rounding. Percentage (%) movements are shown as % unless otherwise stated to all the tables in this document and represent the percentage change between 2025 and 2024. Information on terms, acronyms and calculations used in this report are provided in the Glossary of Abbreviations and Defined Terms (page 324). Exchange rates Exchange rates For each of the years indicated, the high, low, average and year-end noon buying rates1 for Australian dollars were: Year Ended 30 September (US$ per A$1.00) 2026a 2025 2024 2023 2022 2021 High 0.6615 0.6895 0.6934 0.7102 0.7598 0.7953 Low 0.6588 0.5980 0.6290 0.6219 0.6437 0.7006 Averageb n/a 0.6411 0.6620 0.6651 0.7097 0.7490 Close (on 30 September)c n/a 0.6614 0.6934 0.6451 0.6437 0.7228 a. Through to 3 October 2025. On 3 October 2025, the noon buying rate was A$1.00 = 0.6615. b. The average is calculated by using the average of the exchange rates on the last day of each month during the period. c. The noon buying rate as such date may differ from the rate used in the preparation of our consolidated financial statements at such date. Refer to Note 1(a) to the financial statements. For each of the months indicated, the high and low noon buying rates for Australian dollars were: Month (US$ per A$1.00) October 2025a September 2025 August 2025 July 2025 June 2025 May 2025 High 0.6615 0.6678 0.6546 0.6601 0.6573 0.6489 Low 0.6588 0.6514 0.6421 0.6430 0.6423 0.6369 a. Through to 3 October 2025. On 3 October 2025, the noon buying rate was A$1.00 = 0.6615. Exchange rates against A$ Twelve months to/as at 30 Sept 2025 2024 2023 Currency Average Spot Average Spot Average Spot US$ 0.6442 0.6599 0.6594 0.6929 0.6662 0.6467 GBP 0.4932 0.4907 0.5201 0.5176 0.5435 0.5284 NZ$ 1.0981 1.1377 1.0846 1.0885 1.0846 1.0738 1. The noon buying rate in New York City for cable transfers in Australian dollars as certified for customs purposes by the Federal Reserve Bank of New York. |
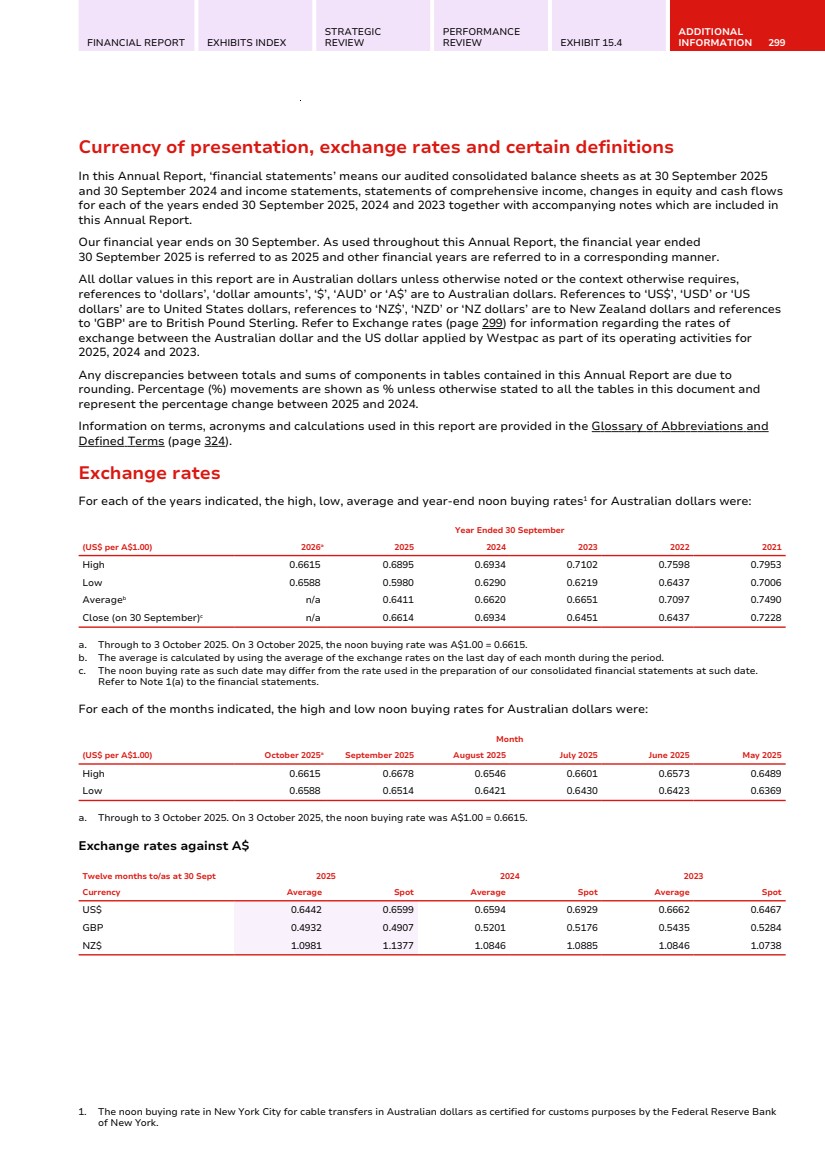
| 300 WESTPAC GROUP 2025 ANNUAL REPORT READING THIS REPORT Exchange rates (Continued) Impact of exchange rate movements on Westpac's results 2025 vs 2024 2024 vs 2023 Growth FX impact ($m) Growth ex- FX Growth FX impact ($m) Growth ex- FX Net interest income 3% (32) 4% 2% (2) 2% Non-interest income 6% 3 6% (15%) 9 (15%) Net operating income 4% (29) 4% - 7 - Operating expenses 9% 8 9% 2% (9) 2% Pre-provision profit (2%) (21) (2%) (3%) (2) (3%) Impairment (charges)/benefits (21%) - (21%) (17%) - (17%) Profit before income tax expense (1%) (21) - (2%) (2) (2%) Income tax expense - 6 - - - - Profit after income tax expense (1%) (15) (1%) (3%) (2) (3%) Profit attributable to non-controlling interests (NCI) - - - (100%) - (100%) Net profit attributable to owners of WBC (1%) (15) (1%) (3%) (2) (3%) Exchange rate risk on future NZ$ earnings Westpac’s policy in relation to the hedging of the future earnings of Westpac’s New Zealand division is to manage the economic risk for volatility of the NZ$ against A$. Westpac manages these flows over a time horizon under which up to 100% of the expected earnings for the following 12 months and 50% of the expected earnings for the subsequent 12 months can be hedged. NZ Future Earnings hedges are only implemented when AUD/NZD is trading at the low end of the range or is expected to move higher over the next 6 months. As at 30 September 2025, Westpac has 1 hedge in place covering one month of forecast up to October 2025, for NZ$96 million, with an average all-in rate of 1.0686. |
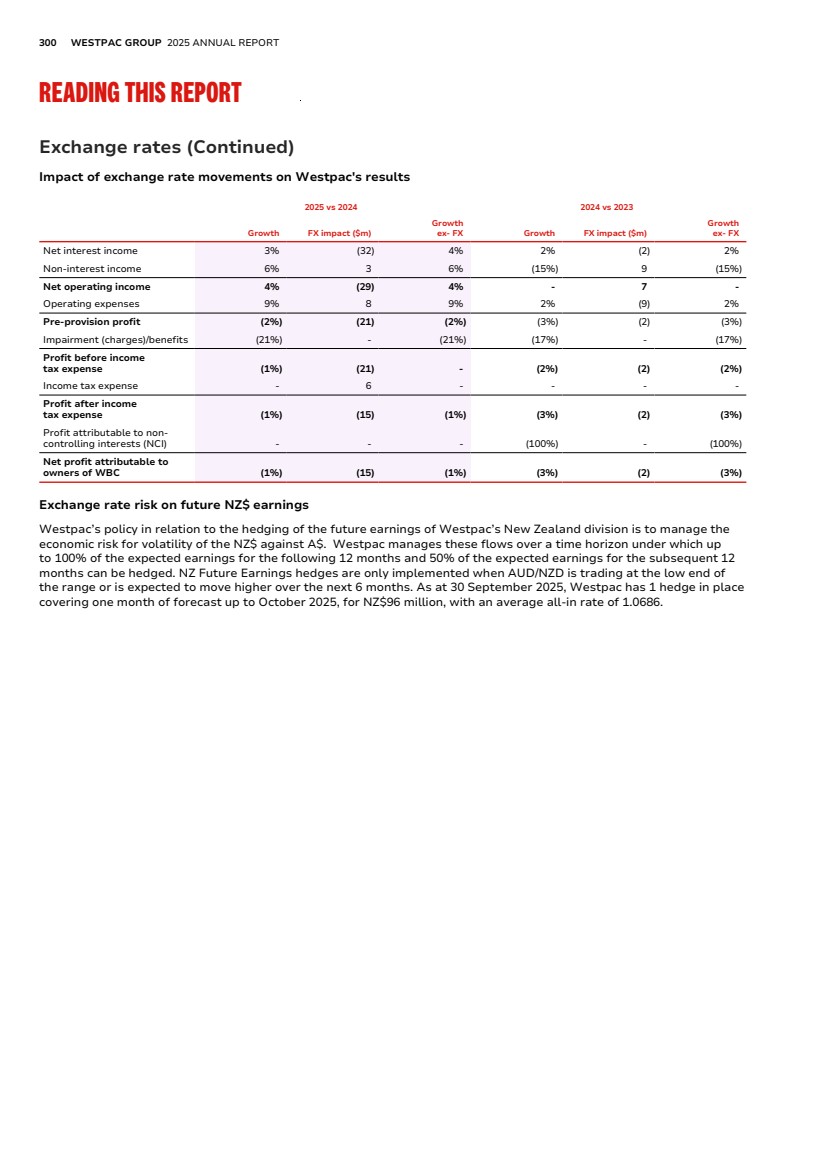
| FINANCIAL REPORT EXHIBITS INDEX STRATEGIC REVIEW PERFORMANCE REVIEW EXHIBIT 15.4 ADDITIONAL INFORMATION 301 Selected consolidated financial and operating data Selected consolidated financial and operating data The information contained in the Strategic Review and Performance Review sections as of, and for the financial years ended, 30 September 2025, 2024 and 2023 were derived from the Financial Report, except for certain data that are derived from filings with our regulators or data that are specifically attributed to other sources. This information is not audited and should be read together with our audited information contained in the Financial Report section of this Annual Report Audited information KPMG has audited the financial statements as of 30 September 2025 and the accompanying notes contained within the Financial Report of this Annual Report and has issued an unmodified audit report. PwC has audited the financial statements as of 30 September 2024 and for each of the two years in the period ended 30 September 2024, including the accompanying notes, contained within the Financial Report of this Annual Report and has issued an unmodified audit report. All other sections of the Annual Report have not been subject to audit by KPMG or PwC. The financial information contained in this Annual Report includes information extracted from the audited financial statements together with information that has not been audited. Presentation changes Presentation changes Comparative information has been revised where appropriate to conform to changes in presentation in the current year and to enhance comparability. References to websites References to websites Information contained in or accessible through the websites mentioned in this Annual Report does not form part of this Annual Report unless we specifically state that it is incorporated by reference and forms part of this Annual Report. |
| 302 WESTPAC GROUP 2025 ANNUAL REPORT SHAREHOLDER INFORMATION Shareholder Information Westpac ordinary shares Top 20 ordinary shareholders as at 30 September 2025 Number of Fully Paid Ordinary Shares % Held HSBC Custody Nominees (Australia) Limited 908,063,861 26.55 J P Morgan Nominees Australia Pty Limited 551,713,949 16.13 Citicorp Nominees Pty Limited 238,581,359 6.98 BNP Paribas Nominees Pty Ltd <Agency Lending A/C> 69,237,624 2.02 BNP Paribas NOMS Pty Ltd 39,172,236 1.15 National Nominees Limited 30,044,569 0.88 HSBC Custody Nominees (Australia) Limited <NT-Comnwlth Super Corp A/C> 24,425,199 0.71 Pacific Custodians Pty Limited <WBC Plans Ctrl A/C> 18,561,498 0.54 Netwealth Investments Limited <Wrap Services A/C> 17,743,987 0.52 BNP Paribas Nominees Pty Ltd <HUB24 Custodial Serv Ltd> 16,741,749 0.49 Australian Foundation Investment Company Limited 13,282,500 0.39 Citicorp Nominees Pty Limited <Colonial First State Inv A/C> 12,527,449 0.37 HSBC Custody Nominees (Australia) Limited 6,844,937 0.20 IOOF Investment Services Limited <IPS Superfund A/C> 6,824,296 0.20 BNP Paribas NOMS (NZ) Ltd 6,265,861 0.18 Argo Investments Limited 5,807,648 0.17 IOOF Investment Services Limited <IOOF IDPS A/C> 5,445,695 0.16 Mutual Trust Pty Ltd 4,900,519 0.14 BNP Paribas Nominees Pty Ltd <Clearstream> 4,850,892 0.14 UBS Nominees Pty Ltd 4,117,750 0.12 Total of Top 20 registered shareholdersa 1,985,153,578 58.04 a. As recorded on the holder register by holder reference number. As at 30 September 2025, there were 571,807 holders of our ordinary shares compared to 585,176 in 2024 and 654,993 in 2023. Ordinary shareholders with a registered address in Australia held approximately 99% of our fully paid share capital at 30 September 2025 (approximately 96% in 2024 and 98% in 2023). Substantial shareholders as at 30 September 2025 As at 30 September 2025, BlackRock Group (comprised of BlackRock Inc. and its subsidiaries), State Street Corporation (comprised of State Street Corporation and its subsidiaries), and The Vanguard Group (comprised of The Vanguard Group, Inc. and its controlled entities) had a ‘substantial holding’ of our shares within the meaning of the Corporations Act. A person has a substantial holding of our shares if the total votes attached to our voting shares in which they or their associates have relevant interests is 5% or more of the total number of votes attached to all our voting shares. The above table of the Top 20 ordinary shareholders includes shareholders that may hold shares for the benefit of third parties. BlackRock Group has been a substantial shareholder since 4 April 2017 (221,964,794 equity securities as at 24 March 2020). State Street Corporation has been a substantial shareholder since 20 July 2022 (226,119,322 equity securities as at 6 August 2024). The Vanguard Group has been a substantial shareholder since 12 May 2022 (206,182,459 equity securities as at 18 December 2024). Control of registrant We are not directly or indirectly owned or controlled by any other corporation(s) or by any foreign government. Refer to the section ‘Exchange controls and other limitations affecting security holders’, which provides information on the Foreign Acquisitions and Takeovers Act 1975, Corporations Act 2001 and Financial Sector (Shareholdings) Act 1998, which impose limits on equity holdings. At 30 September 2025, our Directors and Executive Officers owned beneficially, directly or indirectly, an aggregate of 1,396,727 (0.0408%) of the fully paid ordinary shares outstanding. |
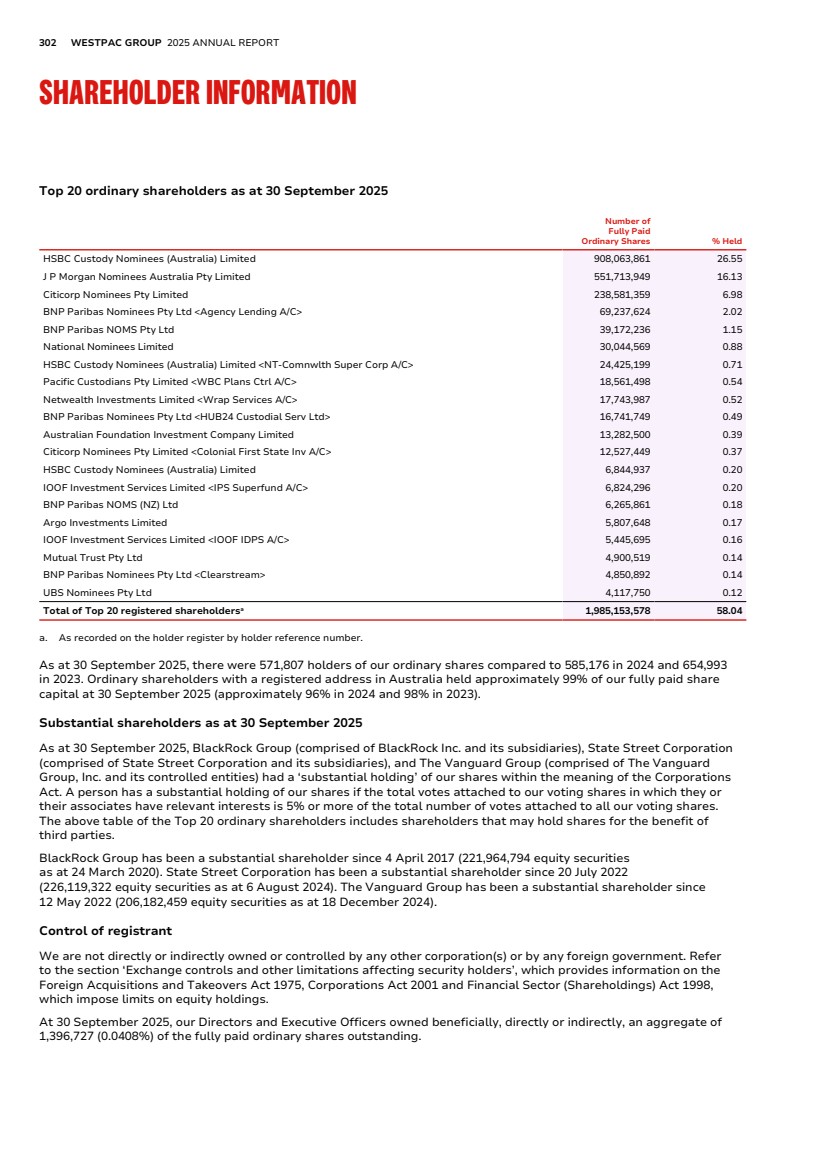
| FINANCIAL REPORT EXHIBITS INDEX STRATEGIC REVIEW PERFORMANCE REVIEW EXHIBIT 15.4 ADDITIONAL INFORMATION 303 Westpac ordinary shares (Continued) Analysis by range of holdings of ordinary shares as at 30 September 2025 Number of Shares Number of Holders of Fully Paid Ordinary Shares % Number of Fully Paid Ordinary Shares % Number of Holders of Share Options and Rights 1 – 1,000 329,053 57.55 111,830,426 3.27 24,237 1,001 – 5,000 182,310 31.88 438,783,353 12.83 334 5,001 – 10,000 35,838 6.27 252,056,538 7.37 56 10,001 – 100,000 24,030 4.20 503,446,729 14.72 124 100,001 and over 576 0.10 2,114,236,259 61.81 16 Totals 571,807 100.00 3,420,353,305 100.00 24,767 There were 10,654 shareholders holding less than a marketable parcel ($500) based on a market price of $38.970 per share at the close of trading on 30 September 2025. Voting rights of ordinary shares Holders of our fully paid ordinary shares have, at general meetings (including special general meetings), one vote on a show of hands and, upon a poll, one vote for each fully paid ordinary share held by them. Westpac Capital Notes 7 Westpac Capital Notes 7 Top 20 holders of Westpac Capital Notes 7 as at 30 September 2025 Number of Westpac Capital Notes 7 % Held BNP Paribas Nominees Pty Ltd <Agency Lending A/C> 1,026,588 5.96 HSBC Custody Nominees (Australia) Limited 940,798 5.46 Citicorp Nominees Pty Limited 815,764 4.74 Citicorp Nominees Pty Limited <143212 NMMT Ltd A/C> 582,886 3.38 BNP Paribas Nominees Pty Ltd <HUB24 Custodial Serv Ltd> 471,502 2.74 Netwealth Investments Limited <Wrap Services A/C> 278,062 1.61 Mutual Trust Pty Ltd 225,749 1.31 Netwealth Investments Limited <Super Services A/C> 157,401 0.91 Dimbulu Pty Ltd 150,000 0.87 HSBC Custody Nominees (Australia) Limited - GSI EDA 145,000 0.84 HSBC Custody Nominees (Australia) Limited - A/C 2 121,392 0.71 J P Morgan Nominees Australia Pty Limited 113,876 0.66 Marrosan Investments Pty Ltd 110,000 0.64 Bond Street Custodians Limited <BENQLD - D79772 A/C> 100,000 0.58 IOOF Investment Services Limited <IPS Superfund A/C> 97,983 0.57 A R E Investments Pty Limited 95,070 0.55 BNP Paribas Nominees Pty Ltd <Pitcher Partners> 90,706 0.53 IOOF Investment Services Limited <IOOF IDPS A/C> 85,152 0.49 BNP Paribas NOMS Pty Ltd 83,460 0.48 V S Access Pty Ltd <V S Access A/C> 64,624 0.38 Total of Top 20 registered shareholdersa 5,756,013 33.41 a. As recorded on the holder register by holder reference number. |
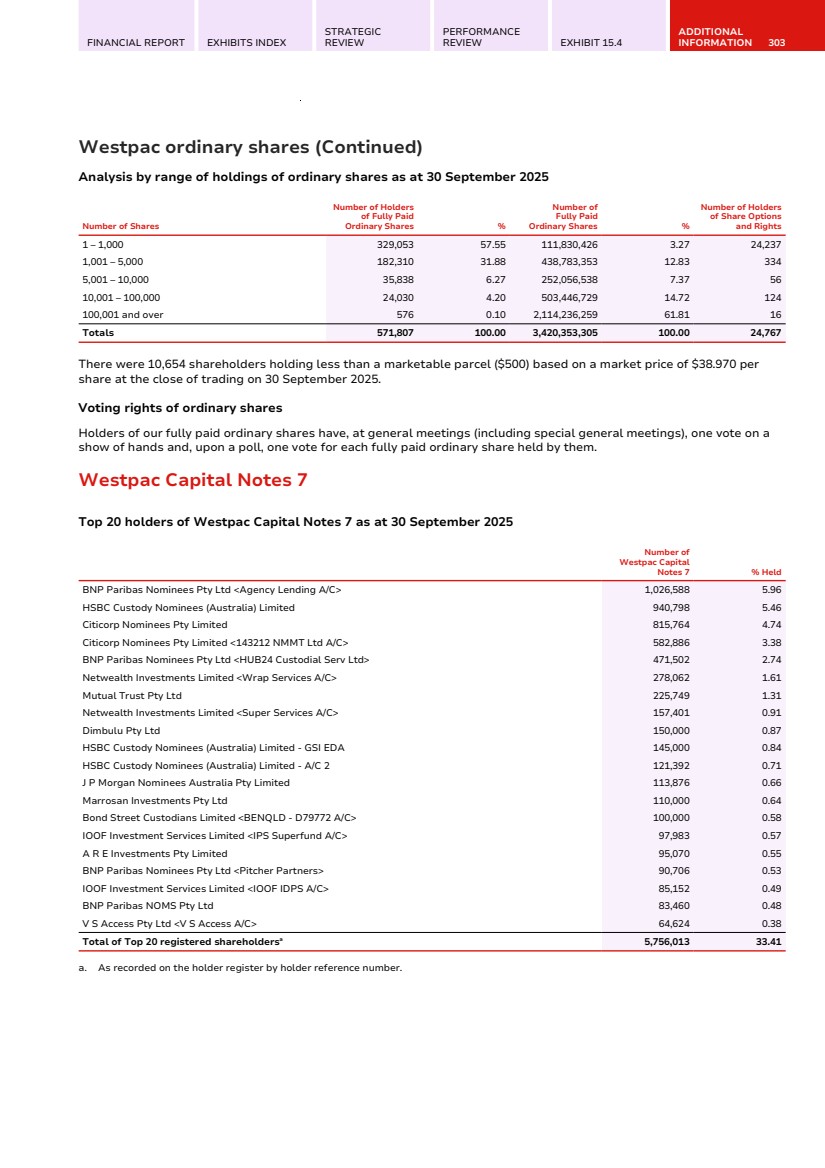
| 304 WESTPAC GROUP 2025 ANNUAL REPORT SHAREHOLDER INFORMATION Westpac Capital Notes 7 (Continued) Analysis by range of holdings of Westpac Capital Notes 7 as at 30 September 2025 Number of Shares Number of Holders of Westpac Capital Notes 7 % Number of Westpac Capital Notes 7 % 1 – 1,000 15,028 87.98 5,255,759 30.50 1,001 – 5,000 1,840 10.77 3,902,320 22.65 5,001 – 10,000 130 0.76 959,124 5.57 10,001 – 100,000 70 0.41 1,973,142 11.45 100,001 and over 13 0.08 5,139,018 29.83 Totals 17,081 100.00 17,229,363 100.00 There were 3 security holders holding less than a marketable parcel ($500) of Westpac Capital Notes 7 based on a market price of $102.310 at the close of trading on 30 September 2025. |

| FINANCIAL REPORT EXHIBITS INDEX STRATEGIC REVIEW PERFORMANCE REVIEW EXHIBIT 15.4 ADDITIONAL INFORMATION 305 Westpac Capital Notes 8 Westpac Capital Notes 8 Top 20 holders of Westpac Capital Notes 8 as at 30 September 2025 Number of Westpac Capital Notes 8 % Held BNP Paribas Nominees Pty Ltd <Agency Lending A/C> 3,839,682 21.94 HSBC Custody Nominees (Australia) Limited 1,132,055 6.47 Citicorp Nominees Pty Limited 737,308 4.21 BNP Paribas Nominees Pty Ltd <HUB24 Custodial Serv Ltd> 375,688 2.15 Netwealth Investments Limited <Wrap Services A/C> 279,869 1.60 Mutual Trust Pty Ltd 253,060 1.44 Dimbulu Pty Ltd 200,000 1.14 HSBC Custody Nominees (Australia) Limited - A/C 2 170,985 0.98 IOOF Investment Services Limited <IPS Superfund A/C> 155,483 0.89 J P Morgan Nominees Australia Pty Limited 142,015 0.81 Netwealth Investments Limited <Super Services A/C> 103,248 0.59 IOOF Investment Services Limited <IOOF IDPS A/C> 95,697 0.55 BNP Paribas Nominees Pty Ltd <Pitcher Partners> 75,644 0.43 BNP Paribas Nominees Pty Ltd <IB Au Noms Retailclient> 62,722 0.36 Megt (Australia) Ltd 61,516 0.35 V S Access Pty Ltd <V S Access A/C> 52,220 0.30 Invia Custodian Pty Limited <Wehi - Investment Pool A/C> 43,735 0.25 Adirel Holdings Pty Ltd 33,000 0.19 HSBC Custody Nominees (Australia) Limited - GSI EDA 30,000 0.17 Bond Street Custodians Limited <RVK - D93096 A/C> 29,684 0.17 Total of Top 20 registered shareholdersa 7,873,611 44.99 a. As recorded on the holder register by holder reference number. Analysis by range of holdings of Westpac Capital Notes 8 as at 30 September 2025 Number of Shares Number of Holders of Westpac Capital Notes 8 % Number of Westpac Capital Notes 8 % 1 – 1,000 13,873 88.47 4,795,543 27.40 1,001 – 5,000 1,628 10.38 3,241,084 18.52 5,001 – 10,000 118 0.75 854,108 4.88 10,001 – 100,000 52 0.33 1,219,872 6.97 100,001 and over 11 0.07 7,389,393 42.23 Totals 15,682 100.00 17,500,000 100.00 There were 5 security holders holding less than a marketable parcel ($500) of Westpac Capital Notes 8 based on a market price of $104.260 at the close of trading on 30 September 2025. |
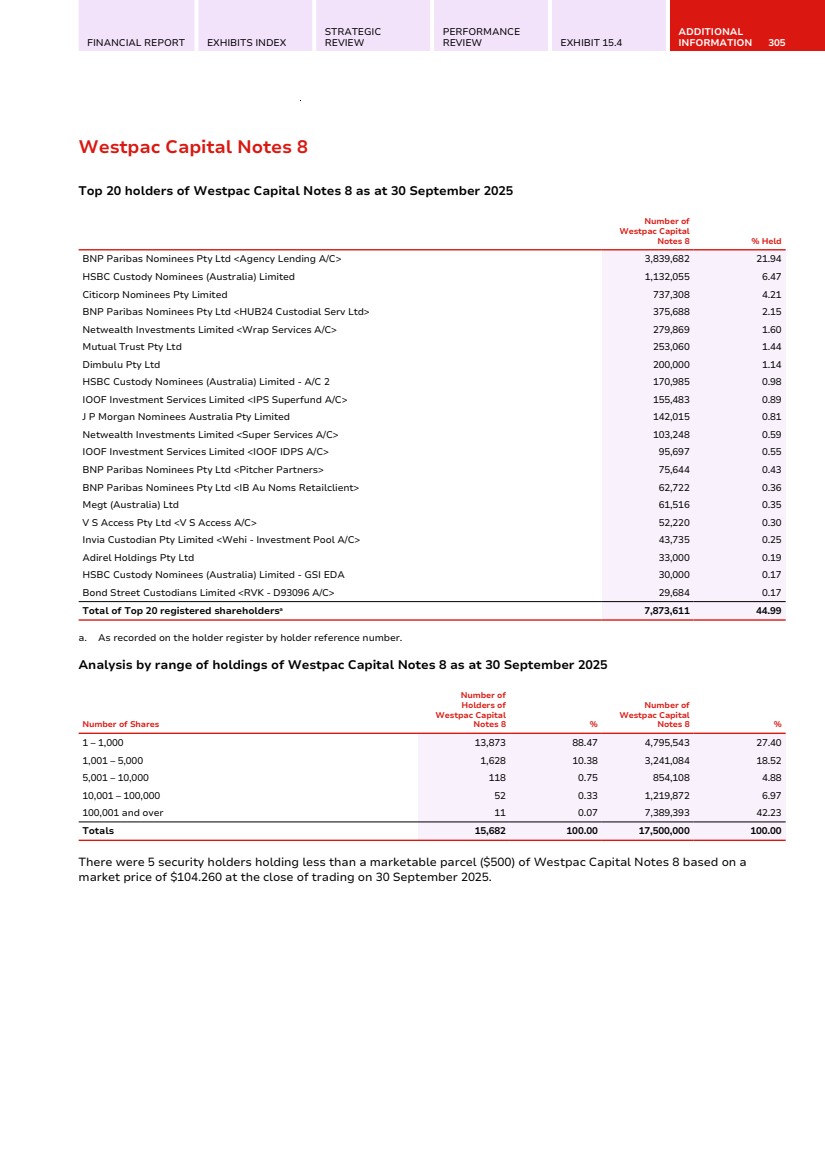
| 306 WESTPAC GROUP 2025 ANNUAL REPORT SHAREHOLDER INFORMATION Westpac Capital Notes 9 Westpac Capital Notes 9 Top 20 holders of Westpac Capital Notes 9 as at 30 September 2025 Number of Westpac Capital Notes 9 % Held BNP Paribas Nominees Pty Ltd <Agency Lending A/C> 3,813,523 25.27 HSBC Custody Nominees (Australia) Limited 1,062,218 7.04 Citicorp Nominees Pty Limited 529,056 3.51 BNP Paribas Nominees Pty Ltd <HUB24 Custodial Serv Ltd> 496,495 3.29 Bond Street Custodians Limited <BENQLD - D79696 A/C> 275,000 1.82 Netwealth Investments Limited <Wrap Services A/C> 264,110 1.75 HSBC Custody Nominees (Australia) Limited - A/C 2 208,821 1.38 Netwealth Investments Limited <Super Services A/C> 156,358 1.04 Mutual Trust Pty Ltd 115,435 0.77 Dimbulu Pty Ltd 100,000 0.66 BNP Paribas Nominees Pty Ltd <Pitcher Partners> 90,565 0.60 Royal Freemasons' Benevolent Institution 82,000 0.54 IOOF Investment Services Limited <IPS Superfund A/C> 66,758 0.44 Marrosan Investments Pty Ltd 50,000 0.33 IOOF Investment Services Limited <IOOF IDPS A/C> 49,893 0.33 Bond Street Custodians Limited <BENQLD - D80279 A/C> 40,832 0.27 Pesutu Pty Ltd <Karedis Super A/C> 32,826 0.22 Sir Moses Montefiore Jewish Home <Income A/C> 30,000 0.20 HSBC Custody Nominees (Australia) Limited - GSI EDA 30,000 0.20 Morris Commercial P/L 30,000 0.20 Total of Top 20 registered shareholdersa 7,523,890 49.86 a. As recorded on the holder register by holder reference number. Analysis by range of holdings of Westpac Capital Notes 9 as at 30 September 2025 Number of Securities Number of Holders of Westpac Capital Notes 9 % Number of Westpac Capital Notes 9 % 1 – 1,000 8,979 86.30 3,534,436 23.42 1,001 – 5,000 1,270 12.21 2,644,532 17.53 5,001 – 10,000 93 0.89 677,896 4.49 10,001 – 100,000 53 0.51 1,313,000 8.70 100,001 and over 9 0.09 6,921,016 45.86 Totals 10,404 100.00 15,090,880 100.00 There were 4 security holders holding less than a marketable parcel ($500) of Westpac Capital Notes 9 based on a market price of $104.410 at the close of trading on 30 September 2025. |
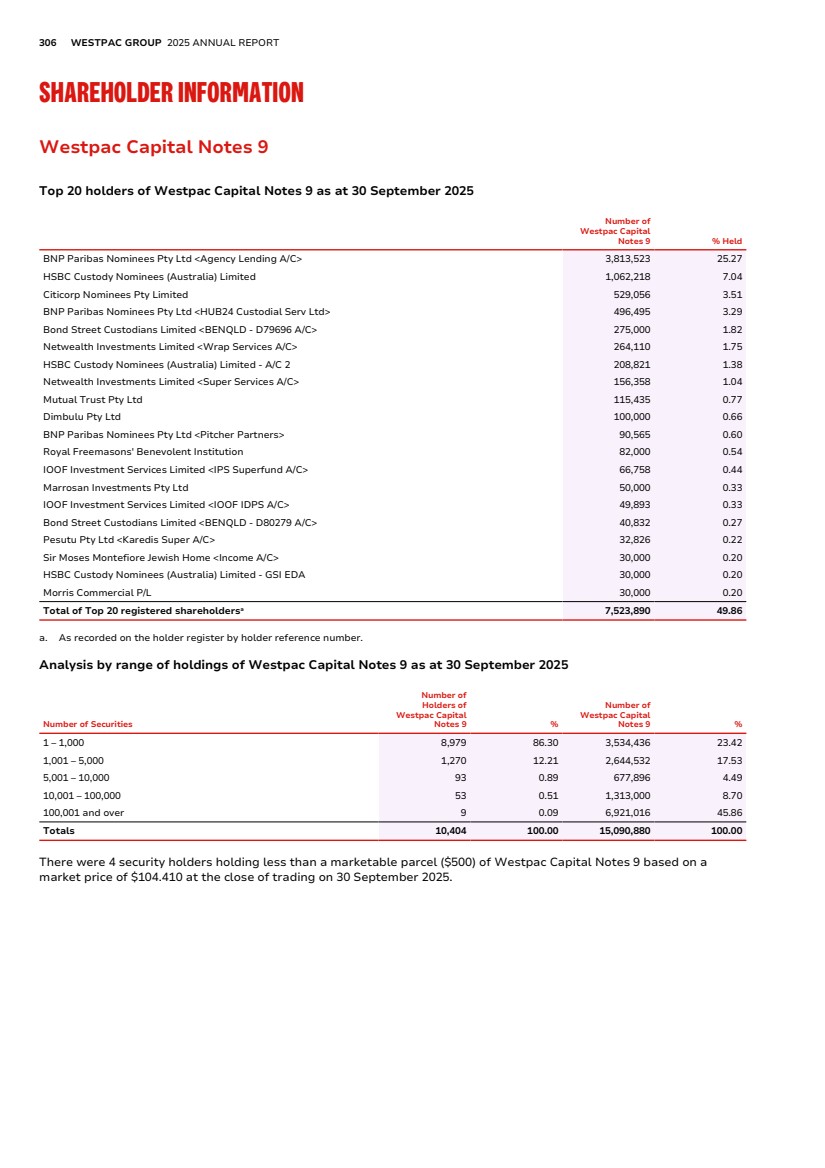
| FINANCIAL REPORT EXHIBITS INDEX STRATEGIC REVIEW PERFORMANCE REVIEW EXHIBIT 15.4 ADDITIONAL INFORMATION 307 Westpac Capital Notes 10 Westpac Capital Notes 10 Top 20 holders of Westpac Capital Notes 10 as at 30 September 2025 Number of Westpac Capital Notes 10 % Held HSBC Custody Nominees (Australia) Limited 1,554,642 8.88 Citicorp Nominees Pty Limited 1,210,928 6.92 BNP Paribas Nominees Pty Ltd <HUB24 Custodial Serv Ltd> 569,907 3.26 HSBC Custody Nominees (Australia) Limited - A/C 2 460,971 2.63 Netwealth Investments Limited <Wrap Services A/C> 432,275 2.47 Mutual Trust Pty Ltd 206,659 1.18 Bond Street Custodians Limited <BENQLD - D79696 A/C> 200,000 1.14 Netwealth Investments Limited <Super Services A/C> 164,482 0.94 J P Morgan Nominees Australia Pty Limited 163,742 0.94 IOOF Investment Services Limited <IPS Superfund A/C> 137,745 0.79 Tandom Pty Ltd 125,499 0.72 BNP Paribas Nominees Pty Ltd <Pitcher Partners> 124,953 0.71 Elmore Super Pty Ltd <The Peabody Super Fund A/C> 105,900 0.60 Dimbulu Pty Ltd 100,000 0.57 V S Access Pty Ltd <V S Access A/C> 90,000 0.51 IOOF Investment Services Limited <IOOF IDPS A/C> 69,196 0.40 BNP Paribas Nominees Pty Ltd <IB Au Noms Retailclient> 57,622 0.33 J C Family Investments Pty Limited <J Herrington Super Fund A/C> 54,007 0.31 John E Gill Trading Pty Ltd 50,000 0.29 Willimbury Pty Ltd 50,000 0.29 Total of Top 20 registered shareholdersa 5,928,528 33.88 a. As recorded on the holder register by holder reference number. Analysis by range of holdings of Westpac Capital Notes 10 as at 30 September 2025 Number of Securities Number of Holders of Westpac Capital Notes 10 % Number of Westpac Capital Notes 10 % 1 – 1,000 11,346 83.20 4,600,533 26.29 1,001 – 5,000 2,028 14.87 4,316,725 24.67 5,001 – 10,000 166 1.22 1,215,936 6.95 10,001 – 100,000 84 0.62 1,909,103 10.91 100,001 and over 13 0.09 5,457,703 31.18 Totals 13,637 100.00 17,500,000 100.00 There were 4 security holders holding less than a marketable parcel ($500) of Westpac Capital Notes 10 based on a market price of $106.170 at the close of trading on 30 September 2025. Voting rights of Westpac Capital Notes 7, Westpac Capital Notes 8, Westpac Capital Notes 9 and Westpac Capital Notes 10 In accordance with the terms of issue, holders of Westpac Capital Notes 7, Westpac Capital Notes 8, Westpac Capital Notes 9 and Westpac Capital Notes 10 have no right to vote at any general meeting of Westpac before conversion into Westpac ordinary shares. If conversion occurs (in accordance with the applicable terms of the relevant AT1 instrument), holders of Westpac Capital Notes 7, Westpac Capital Notes 8, Westpac Capital Notes 9 or Westpac Capital Notes 10 (as applicable) will become holders of Westpac ordinary shares and have the voting rights that attach to Westpac ordinary shares. Unquoted securities Unquoted securities Westpac also has the following unquoted securities on issue: USD 1.25 billion AT1 securities (comprised of 3 individual notes) which are all held by Cede & Co. as nominee for the Depository Trust Company. See Note 14 (page 56) to the financial statements for further information. |
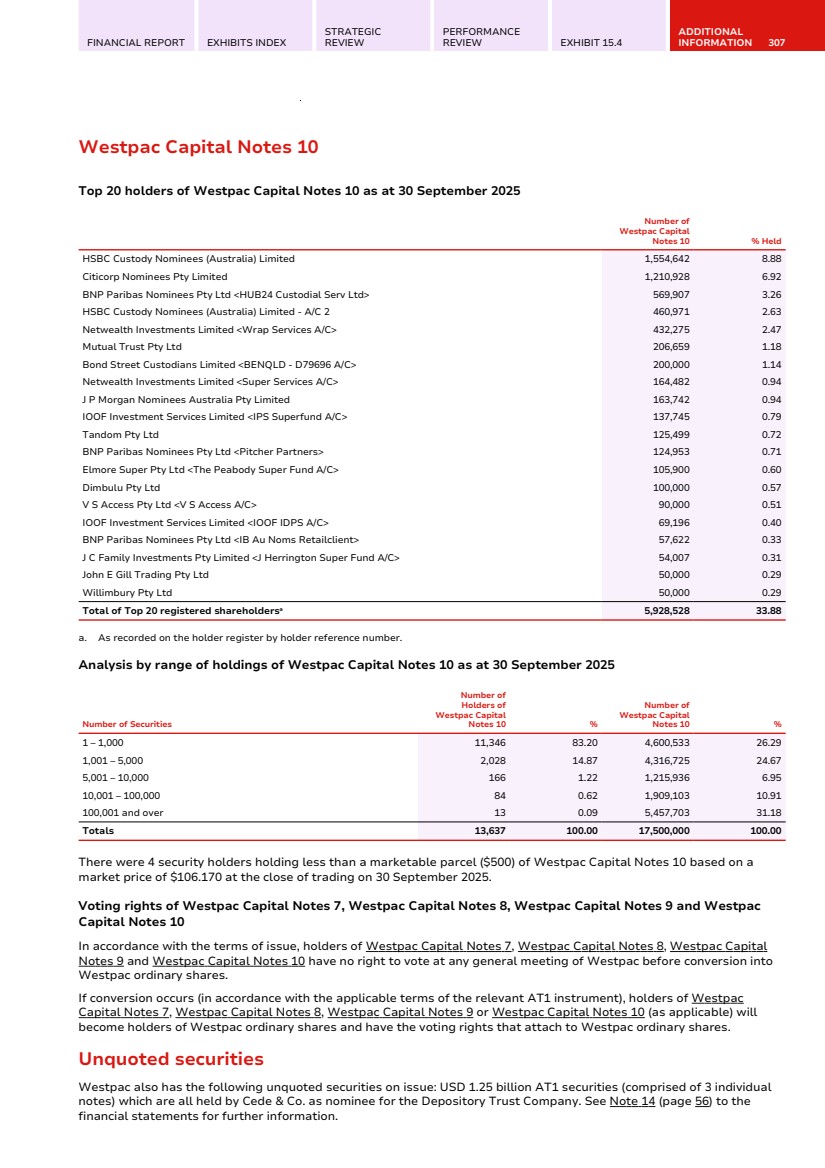
| 308 WESTPAC GROUP 2025 ANNUAL REPORT SHAREHOLDER INFORMATION Information on domicile Information on domicile Domicile1 of ordinary shareholders as at 30 September 2025 Number of Holders % of Holdings Number of Issued Shares and Options % of Issued Shares and Options Australia 550,677 96.30 3,378,371,138 98.77 New Zealand 17,872 3.13 31,179,232 0.91 United Kingdom 1,291 0.23 2,377,259 0.07 United States 477 0.08 1,214,872 0.04 Other overseas 1,490 0.26 7,210,804 0.21 Total 571,807 100.00 3,420,353,305 100.00 Domicile1 of holders of Westpac Capital Notes 7 as at 30 September 2025 Number of Holders % of Holdings Number of Issued Westpac Capital Notes 7 % of Issued Westpac Capital Notes 7 Australia 17,061 99.89 17,216,020 99.92 New Zealand 3 0.02 1,460 0.01 United Kingdom 4 0.02 3,077 0.02 United States 6 0.03 5,026 0.03 Other overseas 7 0.04 3,780 0.02 Total 17,081 100.00 17,229,363 100.00 Domicile1 of holders of Westpac Capital Notes 8 as at 30 September 2025 Number of Holders % of Holdings Number of Issued Westpac Capital Notes 8 % of Issued Westpac Capital Notes 8 Australia 15,664 99.89 17,492,398 99.96 New Zealand 2 0.01 400 0.00 United Kingdom 3 0.02 2,073 0.01 United States 5 0.03 2,828 0.02 Other overseas 8 0.05 2,301 0.01 Total 15,682 100.00 17,500,000 100.00 Domicile1 of holders of Westpac Capital Notes 9 as at 30 September 2025 Number of Holders % of Holdings Number of Issued Westpac Capital Notes 9 % of Issued Westpac Capital Notes 9 Australia 10,395 99.91 15,078,156 99.92 New Zealand 0 0.00 0 0.00 United Kingdom 0 0.00 0 0.00 United States 3 0.03 4,200 0.03 Other overseas 6 0.06 8,524 0.05 Total 10,404 100.00 15,090,880 100.00 Domicile1 of holders of Westpac Capital Notes 10 as at 30 September 2025 Number of Holders % of Holdings Number of Issued Westpac Capital Notes 10 % of Issued Westpac Capital Notes 10 Australia 13,624 99.91 17,490,551 99.95 New Zealand 1 0.01 100 0.00 United Kingdom 2 0.01 952 0.01 United States 3 0.02 970 0.01 Other overseas 7 0.05 7,427 0.03 Total 13,637 100.00 17,500,000 100.00 1. Based on registered address holder. |
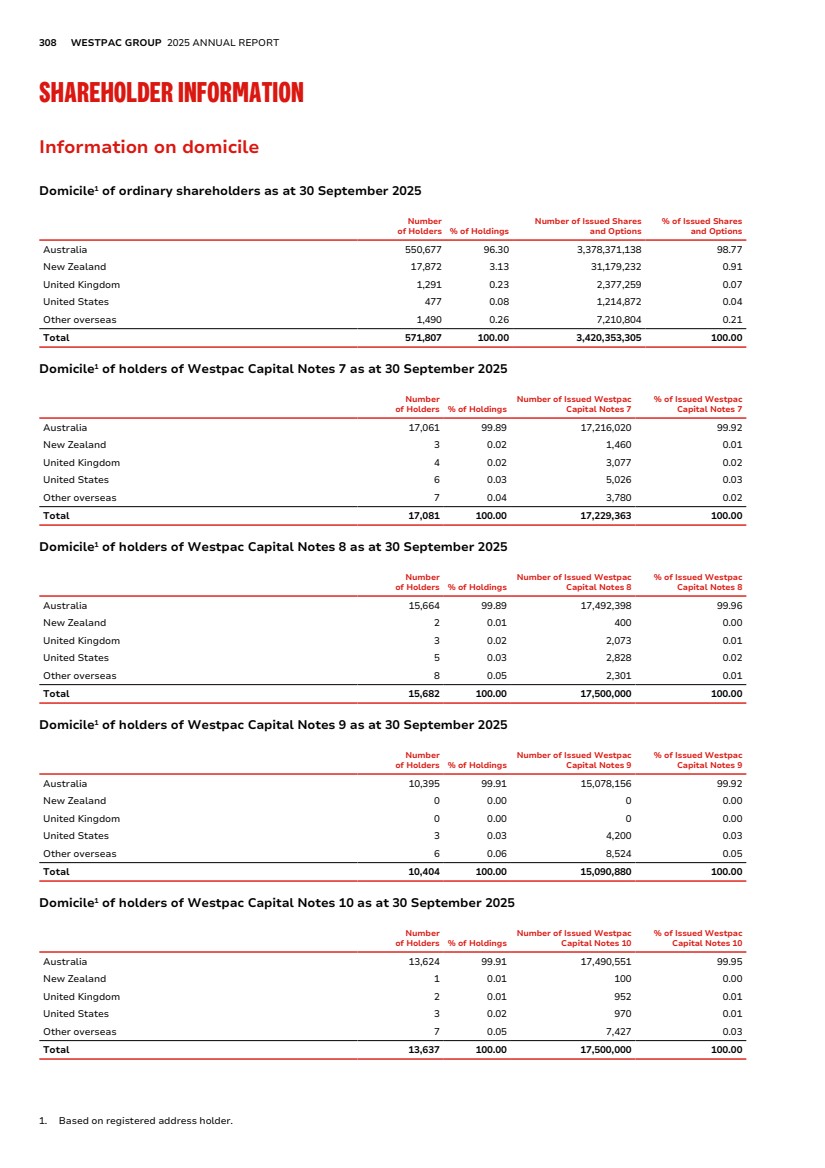
| FINANCIAL REPORT EXHIBITS INDEX STRATEGIC REVIEW PERFORMANCE REVIEW EXHIBIT 15.4 ADDITIONAL INFORMATION 309 Financial calendar Financial calendar Westpac shares are listed on the securities exchanges in Australia (ASX) and New Zealand (NZX). Westpac Capital Notes 7, Westpac Capital Notes 8, Westpac Capital Notes 9 and Westpac Capital Notes 10 are listed on the ASX. Important dates to note are set out below, subject to change. Payment of any distribution, dividend or interest payment is subject to the relevant payment conditions and the key dates for each payment will be confirmed to the ASX for securities listed on the ASX. Westpac Ordinary Shares (ASX code: WBC, NZX code: WBC) Ex-dividend date for final dividend 6 November 2025 Record date for final dividend 7 November 2025 Annual General Meeting 11 December 2025 Final dividend payable 19 December 2025 Financial Half Year end 31 March 2026 Interim Results and dividend announcement 5 May 2026 Ex-dividend date for interim dividend 8 May 2026 Record date for interim dividend 11 May 2026 Interim dividend payable 26 June 2026 Financial Year end 30 September 2026 Final Results and dividend announcement 2 November 2026 Ex-dividend date for final dividend 5 November 2026 Record date for final dividend 6 November 2026 Annual General Meeting 16 December 2026a Final dividend payable 21 December 2026 a. Details regarding the location of the meeting and the business to be dealt with will be contained in a Notice of Meeting sent to shareholders in November before the meeting. Westpac Capital Notes 7 (ASX code: WBCPJ) Ex-date for quarterly distribution 11 December 2025 Record date for quarterly distribution 12 December 2025a Payment date for quarterly distribution 22 December 2025 Ex-date for quarterly distribution 12 March 2026 Record date for quarterly distribution 13 March 2026a Payment date for quarterly distribution 23 March 2026b Ex-date for quarterly distribution 11 June 2026 Record date for quarterly distribution 12 June 2026a Payment date for quarterly distribution 22 June 2026 Ex-date for quarterly distribution 11 September 2026 Record date for quarterly distribution 14 September 2026 Payment date for quarterly distribution 22 September 2026 Ex-date for quarterly distribution 11 December 2026 Record date for quarterly distribution 14 December 2026 Payment date for quarterly distribution 22 December 2026 a. Adjusted to immediately preceding business day as record date falls on a non-ASX business day or a date on which banks are not open for general business in Sydney. b. Adjusted to next business day as payment date falls on a non-ASX business day or a date on which banks are not open for general business in Sydney. |
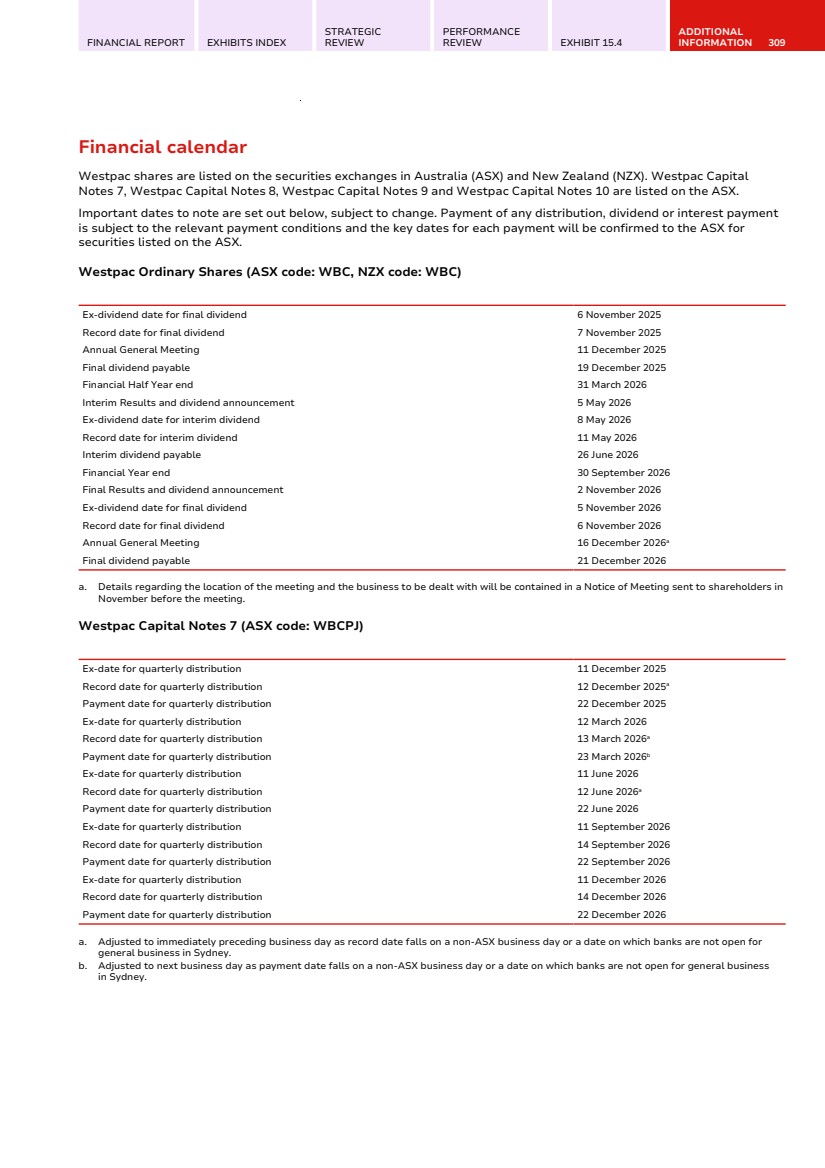
| 310 WESTPAC GROUP 2025 ANNUAL REPORT SHAREHOLDER INFORMATION Financial calendar (Continued) Westpac Capital Notes 8 (ASX code: WBCPK) Ex-date for quarterly distribution 11 December 2025 Record date for quarterly distribution 12 December 2025a Payment date for quarterly distribution 22 December 2025b Ex-date for quarterly distribution 12 March 2026 Record date for quarterly distribution 13 March 2026 Payment date for quarterly distribution 23 March 2026b Ex-date for quarterly distribution 11 June 2026 Record date for quarterly distribution 12 June 2026a Payment date for quarterly distribution 22 June 2026b Ex-date for quarterly distribution 10 September 2026 Record date for quarterly distribution 11 September 2026a Payment date for quarterly distribution 21 September 2026 Ex-date for quarterly distribution 10 December 2026 Record date for quarterly distribution 11 December 2026a Payment for quarterly distribution 21 December 2026 a. Adjusted to immediately preceding business day as record date falls on a non-ASX business day or a date on which banks are not open for general business in Sydney. b. Adjusted to next business day as payment date falls on a non-ASX business day or a date on which banks are not open for general business in Sydney. Westpac Capital Notes 9 (ASX code: WBCPL) Ex-date for quarterly distribution 11 December 2025 Record date for quarterly distribution 12 December 2025a Payment date for quarterly distribution 22 December 2025 Ex-date for quarterly distribution 12 March 2026 Record date for quarterly distribution 13 March 2026a Payment date for quarterly distribution 23 March 2026b Ex-date for quarterly distribution 11 June 2026 Record date for quarterly distribution 12 June 2026a Payment date for quarterly distribution 22 June 2026 Ex-date for quarterly distribution 11 September 2026 Record date for quarterly distribution 14 September 2026 Payment date for quarterly distribution 22 September 2026 Ex-date for quarterly distribution 11 December 2026 Record date for quarterly distribution 14 December 2026 Payment date for quarterly distribution 22 December 2026 a. Adjusted to immediately preceding business day as record date falls on a non-ASX business day or a date on which banks are not open for general business in Sydney. b. Adjusted to next business day as payment date falls on a non-ASX business day or a date on which banks are not open for general business in Sydney. |
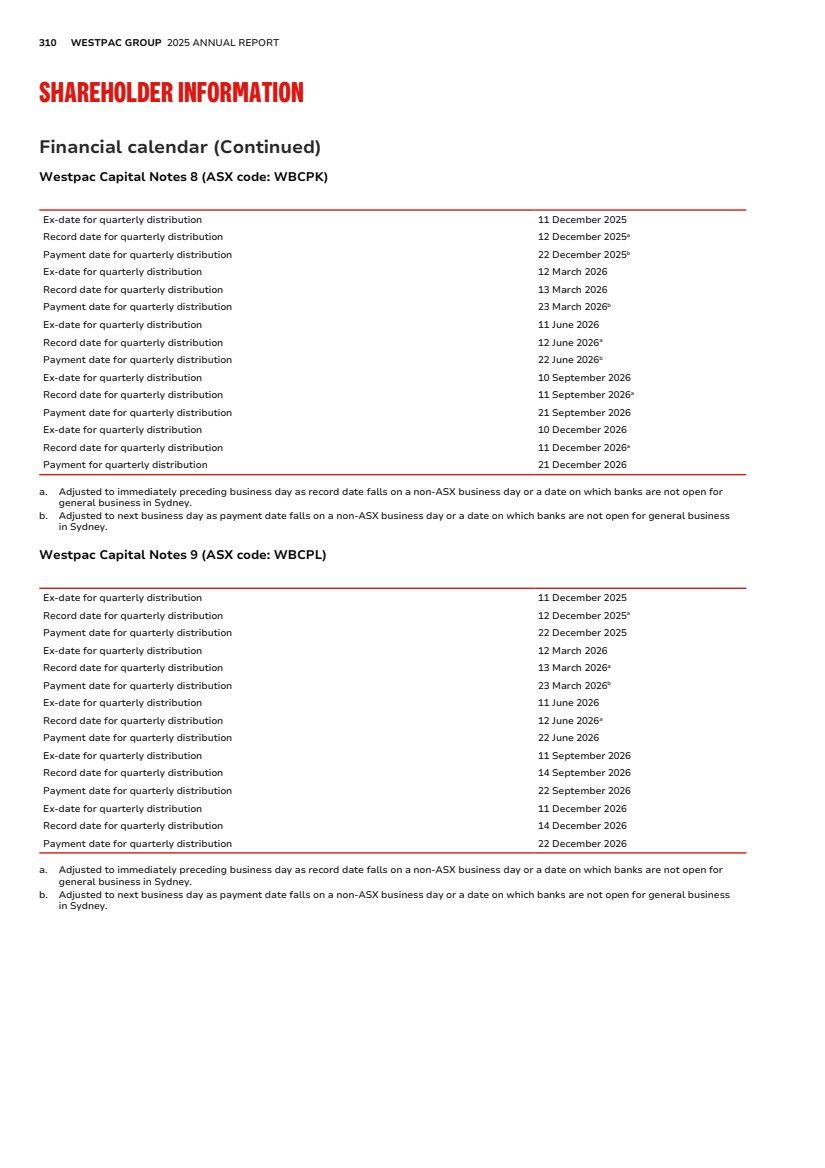
| FINANCIAL REPORT EXHIBITS INDEX STRATEGIC REVIEW PERFORMANCE REVIEW EXHIBIT 15.4 ADDITIONAL INFORMATION 311 Financial calendar (Continued) Westpac Capital Notes 10 (ASX code: WBCPM) Ex-date for quarterly distribution 11 December 2025 Record date for quarterly distribution 12 December 2025a Payment date for quarterly distribution 22 December 2025 Ex-date for quarterly distribution 12 March 2026 Record date for quarterly distribution 13 March 2026a Payment date for quarterly distribution 23 March 2026b Ex-date for quarterly distribution 11 June 2026 Record date for quarterly distribution 12 June 2026a Payment date for quarterly distribution 22 June 2026 Ex-date for quarterly distribution 11 September 2026 Record date for quarterly distribution 14 September 2026 Payment date for quarterly distribution 22 September 2026 Ex-date for quarterly distribution 11 December 2026 Record date for quarterly distribution 14 December 2026 Payment date for quarterly distribution 22 December 2026 a. Adjusted to immediately preceding business day as record date falls on a non-ASX business day or a date on which banks are not open for general business in Sydney. b. Adjusted to next business day as payment date falls on a non-ASX business day or a date on which banks are not open for general business in Sydney. |
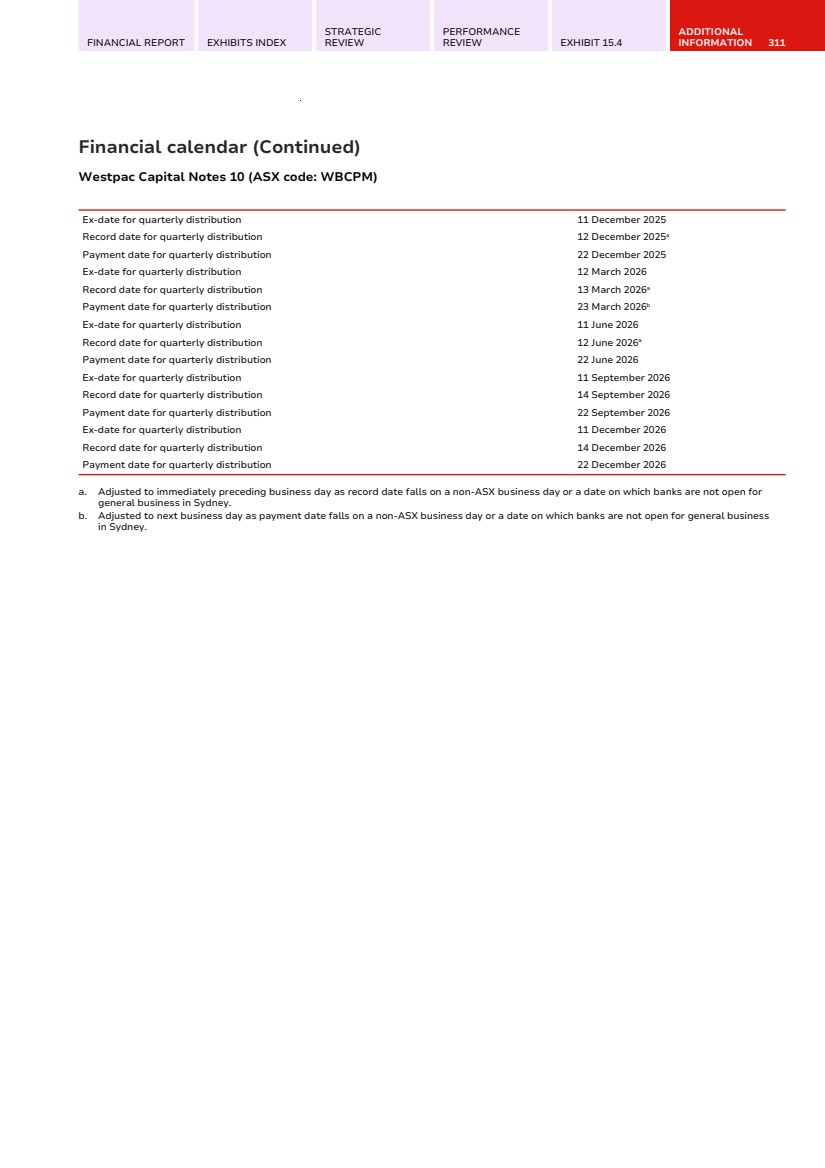
| 312 WESTPAC GROUP 2025 ANNUAL REPORT SHAREHOLDER INFORMATION Exchange controls and other limitations affecting security holders Exchange controls and other limitations affecting security holders Australian exchange controls Australian laws control and regulate or permit the control and regulation of a broad range of payments and transactions involving non-residents of Australia. Pursuant to a number of exemptions, authorities and approvals, there are no general restrictions from transferring funds from Australia or placing funds to the credit of non-residents of Australia. However, Australian foreign exchange controls are implemented from time to time against prescribed countries, entities and persons. At the present time, these include: (a) withholding taxes in relation to remittances or dividends (to the extent they are unfranked) and interest payments; (b) the financial sanctions administered by the Department of Foreign Affairs and Trade (DFAT) in accordance with the Autonomous Sanctions Act 2011 (Cth) and the Autonomous Sanctions Regulations 2011, specifically, in relation to transactions involving the transfer of funds or payments to, by the order of, or on behalf of individuals or entities designated by the Minister of Foreign Affairs as published on the DFAT Sanctions Webpage (https://www.dfat.gov.au/ international-relations/security/sanctions); (c) the United Nations Security Council (UNSC) financial sanctions administered by DFAT, including: – Terrorist Asset Freezing Regime In accordance with the Charter of the United Nations Act 1945 (Cth) and the Charter of the United Nations (Dealings with Assets) Regulations 2008, a person is prohibited from using or dealing with funds, financial assets or economic resources of persons or entities listed as terrorists by the Minister for Foreign Affairs in the Commonwealth of Australia Gazette. It is also a criminal offence to make assets available to such persons or entities; and – Country-based sanctions Under the Charter of the United Nations Act 1945 and associated regulations, UNSC financial sanctions have been implemented. It is an offence to use or deal with funds, financial assets or economic resources of certain persons or entities associated with countries designated by the UNSC. It is also a criminal offence to make assets available to such persons or entities. Limitations affecting security holders The following Australian laws impose limitations on the right of non-residents or non-citizens of Australia to hold, own or vote Westpac shares. Foreign Acquisitions and Takeovers Act 1975 Acquisitions of interests in shares in Australian companies by foreign persons that meet certain thresholds are required to be notified to the Treasurer of Australia (through the Foreign Investment Review Board) and to obtain a no objections notification under the Foreign Acquisitions and Takeovers Act 1975 (Cth). That legislation applies to any acquisition by a foreign person, including a corporation or group of associated foreign persons, which results in ownership of 20% or more of the issued shares of an Australian company or the ability to control 20% or more of the total voting power. In addition, the legislation applies to any acquisition by a foreign government investor of 10% or more of the total voting power or ownership of an Australian company (or any interest if the foreign government investor acquires any control or influence– for example the right to appoint a director). Further, this lower 10% or control/influence threshold also applies to any acquisition by a foreign person, including a corporation or group of associated foreign persons, insofar as Westpac Banking Corporation owns or operates a critical banking asset as defined in the Security of Critical Infrastructure Act 2018 (Cth). The legislation requires any persons proposing to make any such acquisition to first notify the Treasurer of their intention to do so. Where such an acquisition has already occurred in the absence of a no objections notification, the Treasurer has the power to order divestment if he considers the acquisition to be contrary to Australia’s national interest. Financial Sector (Shareholdings) Act 1998 The Financial Sector (Shareholdings) Act 1998 (Cth) imposes restrictions on shareholdings in Australian financial sector companies (which includes Westpac). Under that legislation a person (including a corporation) may not hold more than a 20% ‘stake’ in a financial sector company without prior approval from the Treasurer of Australia. A person’s stake in a financial sector company is equal to the aggregate of the person’s voting power in the company and the voting power of the person’s associates. The concept of voting power is broadly defined. The Treasurer may approve a higher percentage stake if the Treasurer is satisfied that it is in the national interest to do so. In addition, even if a person’s stake in a financial sector company does not exceed the 20% limit, the Treasurer has the power to declare that a person has ‘practical control’ of a financial sector company and require the person to relinquish that control or reduce their stake in that company. Corporations Act 2001 The Corporations Act 2001 (Cth) prohibits any person (including a corporation) from acquiring a relevant interest in our voting shares if, after the acquisition, that person or any other person would be entitled to exercise more than 20% of the voting power in our shares. The prohibition is subject to certain limited exceptions. In addition, under the Corporations Act, a person is required to give a notice to us and to the ASX providing certain prescribed information, including their name, address and details of their relevant interests in our voting shares if they begin to have, or cease to have, a substantial holding in us, or if they already have a substantial holding and there is a movement of at least 1% in their holding. Such notice must, generally, be provided within two business days after the person becomes aware of that information. A person will have a substantial holding if the total votes attached to our voting shares in which they or their associates have relevant interests is 5% or more of the total number of votes attached to all our voting shares. |
| FINANCIAL REPORT EXHIBITS INDEX STRATEGIC REVIEW PERFORMANCE REVIEW EXHIBIT 15.4 ADDITIONAL INFORMATION 313 Exchange controls and other limitations affecting security holders (Continued) The concepts of ‘associate’ and ‘relevant interest’ are broadly defined in the Corporations Act and investors are advised to seek their own advice on their scope. In general terms, a person will have a relevant interest in a share if they: (a) are the holder of that share; (b) have power to exercise, or control the exercise of, a right to vote attached to that share; or (c) have power to dispose of, or control the exercise of a power to dispose of, that share. It does not matter how remote the relevant interest is or how it arises. If two or more persons can jointly exercise any one of these powers, each of them is taken to have that power. Nor does it matter that the power or control is express or implied, formal or informal, exercisable either alone or jointly with someone else. Enforceability of foreign judgments in Australia We are an Australian public corporation with limited liability. All of our Directors and Executive Officers reside outside the US. Substantially all or a substantial portion of the assets of all or many of such persons are located outside the US. As a result, it may not be possible for investors to effect service of process within the US upon such persons or to enforce against them judgments obtained in US courts predicated upon the civil liability provisions of the federal securities laws of the US. There may be doubt as to the enforceability in Australia, in original actions or in actions for enforcement of judgments of US courts, of civil liabilities predicated upon the federal securities laws of the US. Taxation Taxation Australian taxation The following discussion is a summary of certain Australian taxation implications of the ownership and disposition of ordinary shares for shareholders holding their shares on capital account. This discussion is based on the laws in force at the date of the Annual Report and the Convention between the Government of Australia and the Government of the United States of America for the Avoidance of Double Taxation and The Prevention of Fiscal Evasion with Respect to Taxes on Income (the Tax Treaty), and is subject to any changes in Australian law and any change in the Tax Treaty occurring after that date. This discussion is intended only as a descriptive summary and does not purport to be a complete analysis of all the potential Australian tax implications of owning and disposing of ordinary shares. The specific tax position of each investor will determine the applicable Australian income tax implications for that investor and we recommend that investors consult their own tax advisers concerning the implications of owning and disposing of ordinary shares. Taxation of dividends Under the Australian dividend imputation system, Australian tax paid at the company level is imputed (or allocated) to shareholders by means of imputation credits (also called franking credits) which attach to dividends paid by the company to the shareholder. Such dividends are termed ‘franked dividends’. When an Australian resident individual shareholder receives a franked dividend, the shareholder may be entitled, depending upon their particular circumstances, to a tax offset to the extent of the franking credits, which may be offset against the Australian income tax payable by the shareholder. An Australian resident shareholder may, in certain circumstances, be entitled to a refund of excess tax offsets. The extent to which a dividend is franked typically depends upon a company’s available franking credits at the time of payment of the dividend. Accordingly, a dividend paid to a shareholder may be wholly or partly franked or wholly unfranked. Fully franked dividends paid to non-resident shareholders are exempt from Australian dividend withholding tax. Dividends paid to a non-resident shareholder which are not fully franked are subject to dividend withholding tax at the rate of 30% (unless reduced by a double tax treaty) to the extent they are unfranked. In the case of residents of the US who are entitled to the benefits of the Tax Treaty and are beneficially entitled to the dividends, the rate is reduced to 15% under the Tax Treaty, provided the shares are not effectively connected with a permanent establishment or a fixed base of the non-resident in Australia through which the non-resident carries on business in Australia or provides independent personal services. In the case of residents of the US that have a permanent establishment or fixed base in Australia where the shares in respect of which the dividends are paid are attributable to that permanent establishment or fixed base, there is no dividend withholding tax. Rather, such dividends will be taxed on a net assessment basis and, where the dividends are franked, entitlement to a tax offset may arise. Fully franked dividends paid to non-resident shareholders and dividends that have been subject to dividend withholding tax should not be subject to any further Australian income tax. There are circumstances where a shareholder may not be entitled to the benefit of franking credits. The application of these rules depends upon the shareholder’s own circumstances, including the period during which the shares are held and the extent to which the shareholder is ‘at risk’ in relation to their shareholding. Gain or loss on disposition of shares Generally, any profit made by a resident shareholder on disposal of shares will be subject to capital gains tax. However, if the shareholder is regarded as a trader or speculator, or carries on a business of investing for profit, any profits may be taxed as ordinary income. A discount may be available on capital gains on shares held for 12 months or more by Australian resident individuals, trusts or complying superannuation entities. The discount is one half for individuals and trusts, and one third for complying superannuation entities. Companies |
| 314 WESTPAC GROUP 2025 ANNUAL REPORT SHAREHOLDER INFORMATION Taxation (Continued) are not eligible for the capital gains tax discount. For shares acquired prior to 21 September 1999, an alternative basis of calculation of the capital gain may be available which allows the use of an indexation formula. Normal rates of income tax would apply to capital gains so calculated. Any capital loss can only be offset against capital gains. Excess capital losses may be able to be carried forward for offset against future capital gains. Generally, subject to two exceptions, a non-resident disposing of shares in an Australian public company who holds those shares on capital account will be free from income tax in Australia. The main exceptions are: • shares held as part of a trade or business conducted through a permanent establishment in Australia. In such a case, any profit on disposal would be assessable to tax. Losses may give rise to capital losses or be otherwise deductible; and • shares held in companies where the shareholder and its associates have held at the time of disposal (or at least 12 months in the 24 months prior to disposal) a holding of 10% or more in the company and more than 50% of the company’s assets are represented by interests in Australian real property (which is unlikely to be the case for Westpac). In such a case, capital gains tax would apply. United States taxation The following discussion is a summary of certain US federal income tax implications of the ownership and disposition of ordinary shares by US holders (as defined below) that hold the ordinary shares as capital assets. This discussion is based on the US Internal Revenue Code of 1986, as amended, its legislative history, existing and proposed regulations, published rulings and court decisions, and the Tax Treaty, all as currently in effect and all of which are subject to change, possibly on a retroactive basis. This discussion is intended only as a descriptive summary. It does not purport to be a complete analysis of all the potential US federal income tax consequences of owning and disposing of ordinary shares and does not address US federal income tax considerations that may be relevant to US holders subject to special treatment under US federal income tax law (such as banks, insurance companies, real estate investment trusts, regulated investment companies, dealers in securities, brokers, tax-exempt entities, retirement plans, certain former citizens or residents of the US, persons holding ordinary shares as part of a straddle, hedge, conversion or other integrated transaction, persons that have a ‘functional currency’ other than the US dollar, persons that own 10% or more (by vote or value) of our stock, persons that generally mark their securities to market for US federal income tax purposes or persons that receive ordinary shares as compensation). As this is a complex area, we recommend investors consult their own tax advisers concerning the US federal, state and/or local implications of owning and disposing of ordinary shares. For the purposes of this discussion you are a US holder if you are a beneficial owner of ordinary shares and you are for US federal income tax purposes: • an individual who is a citizen or resident of the US; • a corporation created or organised in or under the laws of the US or any state thereof or the District of Columbia; • an estate, the income of which is subject to US federal income taxation regardless of its source; or • a trust, if a US court can exercise primary supervision over the trust’s administration and one or more US persons are authorised to control all substantial decisions of the trust, or certain electing trusts that were in existence on 19 August 1996 and were treated as domestic trusts on that date. If an entity treated as a partnership for US federal income tax purposes owns the ordinary shares, the US federal income tax implications of the ownership and disposition of ordinary shares will generally depend upon the status and activities of such partnership and its partners. Such an entity should consult its own tax adviser concerning the US federal income tax implications to it and its partners of owning and disposing of ordinary shares. Taxation of dividends If you are a US holder, you must include in your income as a dividend, the gross amount of any distributions paid by us out of our current or accumulated earnings and profits (as determined for US federal income tax purposes) without reduction for any Australian tax withheld from such distribution. We have not maintained and do not plan to maintain calculations of earnings and profits for US federal income tax purposes, and as a result, you may need to include the entire amount of any distribution in income as a dividend. If you are a non-corporate US holder, dividends paid to you that constitute qualified dividend income may be taxable to you at a preferential tax rate so long as certain holding period and other requirements are met. Dividends we pay with respect to the ordinary shares generally will be qualified dividend income so long as we are not a passive foreign investment company (PFIC) during the taxable year in which the dividend is paid or the preceding taxable year. Each non-corporate US holder should consult their own tax advisor regarding the possible applicability of the reduced tax rate and the related restrictions and special rules. Dividends paid by us constitute ordinary income that must generally be included in income when actually or constructively received. Such dividends will not be eligible for the dividends-received deduction generally allowed to corporate shareholders with respect to dividends received from US corporations. The amount of the dividend that you must include in your income as a US holder will be the US dollar value of the Australian dollar payments made, determined at the spot Australian dollar/US dollar rate on the date the dividend distribution is included in your income, regardless of whether the payment is in fact converted into US dollars. Generally, any gain or loss resulting from currency exchange fluctuations during the period from the date you include the dividend payment in income to the date you convert the payment into US dollars will be treated as ordinary income or loss and will not be eligible for the special tax rate applicable to qualified dividend income. This gain or loss generally will be income from sources within the US for foreign tax |
| FINANCIAL REPORT EXHIBITS INDEX STRATEGIC REVIEW PERFORMANCE REVIEW EXHIBIT 15.4 ADDITIONAL INFORMATION 315 Taxation (Continued) credit limitation purposes. Distributions on an ordinary share in excess of current and accumulated earnings and profits, as determined for US federal income tax purposes, will be treated as a non-taxable return of capital to the extent of your basis in such ordinary share and thereafter as capital gain. Subject to certain limitations, Australian tax withheld in accordance with the Tax Treaty and paid over to Australia may be claimed as a foreign tax credit against your US federal income tax liability. Special rules apply in determining the foreign tax credit limitation with respect to dividends that are subject to a preferential tax rate. A US holder that does not elect to claim a US foreign tax credit for Australian income tax withheld may instead claim a deduction for such withheld tax, but only for a taxable year in which the US holder elects to do so with respect to all non-US income taxes paid or accrued in such taxable year. Dividends paid by us generally will be income from sources outside the US for foreign tax credit limitation purposes. Under the foreign tax credit rules, dividends may, depending on your circumstances, generally be ‘passive category’ or ‘general category’ income for purposes of computing the foreign tax credit. The rules relating to US foreign tax credits are very complex, and each US holder should consult its own tax adviser regarding the application of such rules. Taxation of capital gains If you sell, exchange or otherwise dispose of your ordinary shares, you will generally recognise a capital gain or loss for US federal income tax purposes equal to the difference between the US dollar value of the amount that you realise and your tax basis, determined in US dollars, in your ordinary shares. A capital gain of a non-corporate US holder is generally taxed at a reduced rate if the holder has a holding period greater than one year. The deductibility of capital losses is subject to limitations. Such capital gain or loss generally will be income from sources within the US, for foreign tax credit limitation purposes. Medicare tax In addition to regular US federal income tax, certain US holders that are individuals, estates or trusts are subject to a 3.8% tax on all or a portion of their ‘net investment income’, which may include all or a portion of their dividend income and net gain from the sale, exchange or other disposition of their ordinary shares. Passive foreign investment company considerations We believe that we will not be treated as a passive foreign investment company (PFIC) for US federal income tax purposes, and this discussion assumes we are not a PFIC. However, the determination as to whether we are a PFIC is made annually at the end of each taxable year and therefore could change. If we were to be treated as a PFIC, a US holder of ordinary shares could be subject to certain adverse tax consequences. Disclosure requirements for specified foreign financial assets Individual US holders (and certain US entities specified in US Internal Revenue Service (IRS) guidance) who, during any taxable year, hold any interest in any specified foreign financial asset, generally will be required to file with their US federal income tax returns certain information on IRS Form 8938 if the aggregate value of all such assets exceeds certain specified amounts. ‘Specified foreign financial asset’ generally includes any financial account maintained with a non-US financial institution and may also include the ordinary shares if they are not held in an account maintained with a financial institution. Substantial penalties may be imposed, and the period of limitations on assessment and collection of US federal income taxes may be extended, in the event of a failure to comply. US holders should consult their own tax advisers as to the possible application to them of this filing requirement. Information reporting and backup withholding Under certain circumstances, information reporting and/or backup withholding may apply to US holders with respect to payments on or the proceeds from the sale, exchange or other disposition of the ordinary shares, unless an applicable exemption is satisfied. Backup withholding is not an additional tax. Any amounts withheld under the backup withholding rules generally will be allowed as a refund or credit against a US holder’s US federal income tax liability if the required information is furnished by the US holder on a timely basis to the IRS. |
| 316 WESTPAC GROUP 2025 ANNUAL REPORT SHAREHOLDER INFORMATION Our constitution Our constitution Overview We were incorporated in 1850 under the Bank of New South Wales Act 1850 (NSW), a special piece of legislation passed by the New South Wales Parliament at a time when there was no general companies’ legislation in Australia. On 23 August 2002, Westpac became registered under the Corporations Act 2001 (Cth) (Corporations Act) as a public company limited by shares. As part of the process of becoming a company regulated under the Corporations Act, shareholders adopted a new constitution at the AGM on 15 December 2000, which came into operation on 23 August 2002. Our constitution has been subsequently amended by shareholders on 15 December 2005, 13 December 2007, 13 December 2012 and 15 December 2021. Our objects and purposes Our constitution does not contain a statement of our objects and purposes. As a company regulated by the Corporations Act, we have the legal capacity and powers of an individual both within and outside Australia, and all the powers of a body corporate, including the power to issue and cancel shares, to issue debentures, to distribute our property among our equity holders (either in kind or otherwise), to give security by charging our uncalled capital, to grant a floating charge over our property and to do any other act permitted by any law. Directors’ voting powers Under clause 9.11(a) of our constitution, subject to complying with the Corporations Act regarding disclosure of and voting on matters involving material personal interests, our Directors may: 1. hold any office or place of profit in our company, except that of auditor; 2. hold any office or place of profit in any other company, body corporate, trust or entity promoted by our company or in which it has an interest of any kind; 3. enter into any contract or arrangement with our company; 4. participate in any association, institution, fund, trust or scheme for past or present employees or Directors of our company or persons dependent on or connected with them; 5. act in a professional capacity (or be a member of a firm that acts in a professional capacity) for our company, except as auditor; and 6. participate in, vote on and be counted in a quorum for any meeting, resolution or decision of the Directors and be present at any meeting where any matter is being considered by the Directors. Under clause 9.11(b) of our constitution, a Director may do any of the above despite the fiduciary relationship of the Director’s office: 1. without any liability to account to our company for any direct or indirect benefit accruing to the Director; and 2. without affecting the validity of any contract or arrangement. Under the Corporations Act, however, a Director who has a material personal interest in any matter to be considered at any Board meeting must not be present while the matter is being considered or vote on the matter, unless the other Directors resolve to allow that Director to be present and vote or a declaration is made by ASIC permitting that Director to participate and vote. These restrictions do not apply to a limited range of matters set out in section 191(2) of the Corporations Act, where the Director’s interest: 1. arises because the Director is a shareholder of the company and is held in common with other shareholders; 2. arises in relation to the Director’s remuneration as a Director of the company; 3. relates to a contract the company is proposing to enter into that is subject to shareholder approval and will not impose obligations on the company if not approved by shareholders; 4. arises merely because the Director is a guarantor or has given an indemnity or security for all or part of a loan (or proposed loan) to the company; 5. arises merely because the Director has a right of subrogation in relation to a guarantee or indemnity referred to in (d); 6. relates to a contract that insures, or would insure, the Director against liabilities the Director incurs as an officer of the company (but only if the contract does not make the company or related body corporate the insurer); 7. relates to any payment by the company or a related body corporate in respect of certain indemnities permitted by the Corporations Act or any contract relating to such an indemnity; or 8. is in a contract or proposed contract with, or for the benefit of, or on behalf of, a related body corporate and arises merely because the Director is a Director of that related body corporate. If there are not enough Directors to form a quorum for the Board meeting because of Directors’ interests in a particular matter, a general meeting for shareholders may be called to consider the matter and interested Directors are entitled to vote on any proposal to requisition such a meeting. Under clause 9.7 of our constitution, the maximum aggregate amount of annual remuneration to be paid to our Non-Executive Directors must be approved by our shareholders. This aggregate amount is paid to the Non-Executive Directors in such manner as the Board from time to time determines. Directors’ remuneration is one of the exceptions under section 191 of the Corporations Act to the prohibitions against being present and voting on any matter in which a Director has a material personal interest. Directors’ borrowing powers Clause 10.2 of our constitution empowers our Directors, as a Board, to exercise all the powers of Westpac to borrow or raise money, to charge any property or business of Westpac or all or any of its uncalled capital and to issue debentures or give any other security for a |
| FINANCIAL REPORT EXHIBITS INDEX STRATEGIC REVIEW PERFORMANCE REVIEW EXHIBIT 15.4 ADDITIONAL INFORMATION 317 Our constitution (Continued) debt, liability or obligation of Westpac or of any other person. Such powers may only be changed by amending the constitution, which requires a special resolution (that is, a resolution passed by at least 75% of the votes cast by members entitled to vote on the resolution and for which notice has been given in accordance with the Corporations Act). Minimum number of Directors Our constitution requires that the minimum number of Directors is determined in accordance with the Corporations Act or other regulations. Currently the Corporations Act prescribes three as a minimum number of Directors for a public company and APRA governance standards specify five as the minimum number of Directors for APRA regulated entities. Westpac’s current number of Directors is above these prescribed minimums. Share rights The rights attaching to our ordinary shares are set out in the Corporations Act and in our constitution, and may be summarised as follows: a. Profits and dividends Holders of ordinary shares are entitled to receive such dividends on those shares as may be determined by our Directors from time to time. Dividends that are paid but not claimed may be invested by our Directors for the benefit of Westpac until claimed or required to be dealt with in accordance with any law relating to unclaimed monies. Under the Corporations Act, Westpac must not pay a dividend unless our assets exceed our liabilities immediately before the dividend is declared and the excess is sufficient for payment of the dividend. In addition, the payment must be fair and reasonable to the company’s shareholders as a whole and must not materially prejudice our ability to pay our creditors. Subject to the Corporations Act, the constitution, the rights of persons (if any) entitled to shares with special rights to a dividend and any contrary terms of issue of or applying to any shares, our Directors may determine that a dividend is payable, fix the amount and the time for payment and authorise the payment or crediting by Westpac to, or at the direction of, each shareholder entitled to that dividend. If any dividends are returned unclaimed, we are generally obliged, under the Banking Act 1959 (Cth) (Banking Act), to hold those amounts as unclaimed monies for a period of seven years. If at the end of that period the monies remain unclaimed by the shareholder concerned, we must submit an annual unclaimed money return to ASIC by 31 March each year containing the unclaimed money as at 31 December of the previous year. Upon such payment being made, we are discharged from further liability in respect of that amount. Our Directors may, before paying any dividend, set aside out of our profits such sums as they think proper as reserves, to be applied, at the discretion of our Directors, for any purpose for which the profits may be properly applied. Our Directors may carry forward so much of the profits remaining as they consider ought not to be distributed as dividends without transferring those profits to a reserve. The following additional restrictions apply to our ability to declare and/or pay dividends: 1. if the payment of the dividend would breach or cause a breach by us of applicable capital adequacy or other supervisory requirements of APRA, including where Westpac’s Common Equity Tier 1 Capital Ratio falls within APRA’s capital conservation buffer range (consisting of the capital conservation buffer plus any countercyclical capital buffer, currently 5.75% of risk-weighted assets). Currently, one such requirement is that a dividend should not be paid without APRA’s prior consent if payment of that dividend, after taking into account all other dividends (if any) paid on our shares and payments on more senior capital instruments, in the preceding 12 consecutive months to which they relate, would cause the aggregate of such dividend payments to exceed our after tax earnings for the preceding 12 consecutive months, as reflected in our relevant audited consolidated financial statements; and 2. if, under the Banking Act, we are directed by APRA not to pay a dividend; 3. if the declaration or payment of the dividend would result in us becoming insolvent; or 4. if any interest payment, dividend or distribution on certain Additional Tier 1 securities issued by us is not paid in accordance with the terms of those securities, we may be restricted from declaring and/or paying dividends on ordinary shares. This restriction is subject to a number of exceptions. b. Voting rights Holders of our fully paid ordinary shares have, at general meetings, one vote on a show of hands and, upon a poll, one vote for each fully paid share held by them. c. Voting and re-election of Directors Under our constitution, each Director, apart from the Managing Director, must not hold office without re-election past the third AGM following the Director’s appointment or last election, whichever is longer. A retiring Director holds office until the conclusion of the meeting at which that Director retires but is eligible for re-election at that meeting. In addition, there must be an election of Directors at each AGM. This is consistent with the requirements of the ASX Listing Rules. Under the Corporations Act, the election or re-election of each Director by shareholders at a general meeting of a public company must proceed as a separate item, unless the shareholders first resolve that the elections or re-elections may be voted on collectively. A resolution to allow collective voting in relation to elections or re-elections is effective only if no votes are cast against that resolution. Any resolution electing or re-electing two or more Directors in contravention of this requirement is void. d. Winding up Subject to any preferential entitlement of holders of preference shares on issue at the relevant time, holders |
| 318 WESTPAC GROUP 2025 ANNUAL REPORT SHAREHOLDER INFORMATION Our constitution (Continued) of our ordinary shares are entitled to share equally in any surplus assets if we are wound up. e. Sinking fund provisions We do not have any class of shares on issue that is subject to any sinking fund provisions. Variation of rights attaching to our shares Under the Corporations Act, unless otherwise provided by the terms of issue of a class of shares, the terms of issue of a class of shares in Westpac can only be varied or cancelled in any way by a special resolution of Westpac and with either the written consent of our shareholders holding at least 75% of the votes in that class of shares or with the sanction of a special resolution passed at a separate meeting of the holders of that class of shares. Convening general meetings Under our constitution, our Directors may convene and arrange to hold a general meeting of Westpac whenever they think fit and must do so if required to do so under the Corporations Act and ASX Listing Rules. Under the Corporations Act, our Directors must call and arrange to hold a general meeting of Westpac if requested to do so by our shareholders who hold at least 5% of the votes that may be cast at the general meeting. Shareholders who hold at least 5% of the votes that may be cast at a general meeting may also call and arrange to hold a general meeting of Westpac at their own expense. At least 28 days notice must be given of a meeting of our shareholders. Written notice must be given to all shareholders entitled to attend and vote at the meeting. All ordinary shareholders are entitled to attend and, subject to the constitution and the Corporations Act, to vote at general meetings of Westpac. Limitations on securities ownership A number of limitations apply in relation to the ownership of our shares, and these are described in more detail in the section ‘Limitations affecting security holders’. Change in control restrictions Restrictions apply under the Corporations Act, the Financial Sector (Shareholdings) Act 1998 (Cth) and the Foreign Acquisitions and Takeovers Act 1975 (Cth). For more detailed descriptions of these restrictions, refer to the sections ‘Limitations affecting security holders’, ‘Foreign Acquisitions and Takeovers Act 1975’, ‘Financial Sector (Shareholdings) Act 1998’, and ‘Corporations Act 2001’. Substantial shareholder disclosure There is no provision in our constitution that requires a shareholder to disclose the extent of their ownership of our shares. Under the Corporations Act, however, any person who begins or ceases to have a substantial holding of our shares must notify us within two business days after they become aware of that information. A further notice must be given to us if there is an increase or decrease of 1% in a person’s substantial holding. Copies of these notices must also be given to the ASX. A person has a substantial holding of our shares if the total votes attached to our voting shares in which they or their associates have relevant interests is 5% or more of the total number of votes attached to all our voting shares. For more details, refer to the section ‘Corporations Act 2001’. We also have a statutory right under the Corporations Act to trace the beneficial ownership of our shares by giving a direction to a shareholder, or certain other persons, requiring disclosure to us of, among other things, their own relevant interest in our shares and the name and address of each other person who has a relevant interest in those shares, the nature and extent of that interest and the circumstances that gave rise to that other person’s interest. Such disclosure must, except in certain limited circumstances, be provided within two business days after the direction is received. Australian Company and Business Numbers All Australian companies have a unique nine-digit identifier, referred to as an Australian Company Number (ACN), which must be included on public documents, eligible negotiable instruments and the company’s common seal. In addition, entities can apply for registration on the Australian Business Register and be allocated a unique eleven-digit identifier known as an Australian Business Number (ABN). For Australian companies, the last nine digits of their ABN are identical to their ACN. The ABN may be quoted on documents in lieu of the ACN. Our ACN is 007 457 141 and our ABN is 33 007 457 141. Documents on display We are subject to the disclosure requirements of the US Securities Exchange Act of 1934, as amended. In accordance with these requirements, we file Annual Reports with, and furnish other information to, the US Securities & Exchange Commission (SEC). The SEC also maintains a website at www.sec.gov that contains reports, proxy statements and other information regarding registrants that file electronically with the SEC. Since April 2002, we have filed our reports on Form 20-F and have furnished other information to the SEC in electronic format which may be accessed through this website. |
| FINANCIAL REPORT EXHIBITS INDEX STRATEGIC REVIEW PERFORMANCE REVIEW EXHIBIT 15.4 ADDITIONAL INFORMATION 319 Dividend reinvestment plan Dividend reinvestment plan The Board has determined a fully franked final ordinary dividend of 77 cents per share, to be paid on 19 December 2025 to shareholders on the register at the record date of 7 November 2025. The 2025 final and interim ordinary dividend represents a payout ratio of 75.65%. In addition to being fully franked, the final ordinary dividend will carry NZ$0.06 in New Zealand imputation credits that may be used by New Zealand tax residents. Westpac operates a DRP that is available to holders of fully paid ordinary shares who are resident in, or whose address on the register of shareholders is in Australia or New Zealand. Shareholders can choose to receive their 2025 final ordinary dividend as cash or reinvest it in additional shares under the DRP. As noted in Note 28 (page 106) to the financial statements, the Board has made certain determinations in relation to the DRP for the 2025 final ordinary dividend only, including that the market price will be set over 15 trading days commencing 12 November 2025 and will not include a discount. Shareholders who wish to commence participation in the DRP, or to vary their current participation election, must do so by 5.00pm (Sydney time) on 10 November 2025. Shareholders can provide these instructions: • Online for shareholders with holdings that have a market value of less than $1,000,000 within their MUFG Corporate Markets portfolio, by logging into or creating a Portfolio via the Westpac share registry’s website at au.investorcentre.mpms.mufg.com and electing the DRP or amending their existing instructions online; or • By completing and returning a DRP application or variation form to Westpac’s share registry. Registry contact details are listed in the Useful information section (page 320). Information on related entities Information on related entities a. Changes in control of Westpac entities During the twelve months ended 30 September 2025 the following entities were acquired, formed, or incorporated: • Series 2024-2 WST Trust (formed 4 October 2024) During the twelve months ended 30 September 2025, the following controlled entities ceased to be controlled: • Asgard Wealth Solutions Pty Limited (deregistered 3 November 2024) • Series 2014-2 WST Trust (terminated 3 March 2025) • Series 2015-1 WST Trust (terminated 2 June 2025) • Danaby Pty Limited (deregistered 18 September 2025) • Sallmoor Pty. Ltd. (deregistered 18 September 2025) • St. George Business Finance Pty Limited (deregistered 18 September 2025) • Waratah Receivables Corporation Pty Limited (deregistered 22 September 2025) • Magnitude Group Pty Ltd (deregistered 22 September 2025) • Westpac RE Pty Limited (deregistered 25 September 2025) • Westpac Securities Administration Pty Limited (deregistered 25 September 2025) b. Associates As at 30 September 2025 Ownership Interest Held (%) Akahu Technologies Ltd 33.7% OpenAgent Pty Ltd 22.3% mx51 Group Pty Ltd 22.2% Lawpath Holdings Pty Ltd 15.1% Safe Will Pty Ltd 12.6% |
| 320 WESTPAC GROUP 2025 ANNUAL REPORT SHAREHOLDER INFORMATION Useful information Useful information Key sources of information for shareholders We report our full year performance to shareholders, in late October or early November, in the following forms: an Annual Report; a Climate Report; an Investor Discussion Pack and earnings releases. Electronic communications Shareholders can elect to receive the following communications electronically: • Annual Report; • Dividend statements when paid by direct credit or via Westpac’s Dividend Reinvestment Plan (DRP); • Notices of Meetings and proxy forms; and • Major company announcements. Opt for electronic communications by logging into Westpac’s Share Registrar’s Investor Centre at au.investorcentre.mpms.mufg.com. Online information Australia Westpac’s website www.westpac.com.au provides information for shareholders and customers, including: • access to internet banking and online investing services; • details on Westpac’s products and services; • company history, results, market releases and news; and • corporate responsibility and Westpac in the community activities. New Zealand Westpac’s New Zealand website www.westpac.co.nz provides: • access to internet banking services; • details on products and services; • economic updates, news and information, key financial results; and • sponsorships and other community activities. Stock exchange listings Westpac ordinary shares are listed on: • Australian Securities Exchange (code WBC); • New Zealand Exchange Limited (code WBC). We do not sponsor or endorse and are not affiliated in any way with trading in our equity securities in any market or under any facility other than direct trading in our ordinary shares listed on the Australian Securities Exchange and New Zealand Exchange Limited. Westpac Investor Relations Investors can access the Investor Centre at www.westpac.com.au/investorcentre. The Investor Centre includes the current Westpac share price and links to the latest ASX announcements. Information other than that relating to your shareholding can be obtained from: • Westpac Investor Relations 275 Kent Street Sydney NSW 2000 Australia Telephone: +61 2 9178 2977 Email: investorrelations@westpac.com.au Westpac sustainability For further information on Westpac’s sustainability approach, policies and performance please visit westpac.com.au/sustainability Email: sustainability@westpac.com.au Share registrars Shareholders can check and update their information in Westpac’s Share Registrars’ online Investor Centres, see details below. In Australia, broker sponsored holders must contact their broker to amend their address. Australia – Ordinary shares on the main register, Westpac Capital Notes 7, Westpac Capital Notes 8, Westpac Capital Notes 9 and Westpac Capital Notes 10. MUFG Corporate Markets (AU) Limited Liberty Place Level 41 161 Castlereagh Street Sydney NSW 2000 Australia Postal address: Locked Bag A6015, Sydney South NSW 1235, Australia Website: au.investorcentre.mpms.mufg.com Email: westpac@cm.mpms.mufg.com Telephone: 1800 804 255 (free call within Australia) International: +61 1800 804 255 Facsimile: +61 2 9287 0303 New Zealand – Ordinary shares MUFG Pension & Market Services (NZ) Limited Level 30 PwC Tower 15 Customs Street West Auckland 1010, New Zealand Postal address: P.O. Box 91976, Auckland 1142, New Zealand Website: nz.investorcentre.mpms.mufg.com Email: enquiries.nz@cm.mpms.mufg.com Telephone: 0800 002 727 (free call within New Zealand) International: +64 9 375 5998 |
| FINANCIAL REPORT EXHIBITS INDEX STRATEGIC REVIEW PERFORMANCE REVIEW EXHIBIT 15.4 ADDITIONAL INFORMATION 321 OTHER WESTPAC BUSINESS INFORMATION Property Other Westpac business information Property Occupied premises are primarily in Australia, New Zealand and Pacific including 749 branches (2024: 762) as at 30 September 2025. This includes 125 (2024: 111) co-located branches in Australia which support multiple brands. With the exception of 2 freehold branches, all retail premises occupied in Australia and New Zealand are held under commercial leases with terms generally ranging between 12 months and 7 years. The carrying value of our directly owned Corporate and Retail premises and sites was $57 million (2024: $45 million). Head office is located at Westpac Place, 275 Kent Street, Sydney with leases over levels 1-23, allowing continued occupation until 2030. There is also a lease over levels 1-28 of International Tower 2, Barangaroo, Sydney until 2030, of which 9 floors are sublet. Together these sites provide a current capacity for approximately 16,500 staff on a hybrid working basis. In the Sydney metropolitan area, the lease commitment for the corporate office at Kogarah expires in 2034 and provides capacity for approximately 2,000 staff on a hybrid working basis. The lease for 8 levels at 8 Parramatta Square, Parramatta provides capacity for approximately 3,000 staff on a hybrid working basis. In Melbourne, there is a lease over the majority of 150 Collins Street until 2033, providing capacity for approximately 2,000 staff. Westpac on Takutai is Westpac New Zealand’s head office, located at the eastern end of Britomart Precinct near Customs Street in Auckland, comprising 21,904 square metres of office space across two buildings. The lease commitments at this site extend to 30 June 2031, with two six-year options to extend thereafter. Significant long-term agreements Significant long-term agreements We have no individual contracts, other than contracts entered into in the ordinary course of business, that would constitute a material contract. Related party disclosures Related party disclosures Details of our related party disclosures are set out in Note 34 (page 120) to the financial statements and details of Directors’ interests in securities are set out in the Remuneration Report (page 222) included in the Directors’ Report. Other than as disclosed in Note 34 (page 120) to the financial statements and the Remuneration Report (page 222), if applicable, loans made to parties related to Directors and other key management personnel of Westpac are made in the ordinary course of business on normal terms and conditions (including interest rates and collateral). Loans are made on the same terms and conditions (including interest rates and collateral) as they apply to other employees and certain customers in accordance with established policy. These loans do not involve more than the normal risk of collectability or present any other unfavourable features. |
| 322 WESTPAC GROUP 2025 ANNUAL REPORT OTHER WESTPAC BUSINESS INFORMATION Auditor’s remuneration Auditor’s remuneration Auditor’s remuneration, to the external auditor for the years ended 30 September 2025 and 2024 is provided in Note 33 (page 119) to the financial statements. Audit related services Westpac’s Group Finance function monitors the application of the pre-approval process in respect of audit, audit-related and non-audit services provided by KPMG under Westpac’s Pre-Approval of Engagement of KPMG for Audit or Non-Audit Services Policy (‘Pre-Approval Policy’). Group Finance promptly brings to the attention of the Board Audit Committee any exceptions that need to be approved pursuant to paragraph (c)(7)(i)(C) of Rule 2-01 of Regulation S-X. The Pre-Approval Policy is communicated to Westpac’s divisions through publication on the Westpac intranet. During the year ended 30 September 2025, there were no fees paid by Westpac to KPMG that required approval by the Board Audit Committee pursuant to paragraph (c)(7)(i)(C) of Rule 2-01 of Regulation S-X. Westpac debt programs and issuing shelves Westpac debt programs and issuing shelves Access in a timely and flexible manner to a diverse range of debt markets and investors is provided by the following programs and issuing shelves as at 30 September 2025: Program Limit Issuer(s) Program/Issuing Shelf Type Australia No limit WBC Debt Issuance Program No limit WBC Capital Notes Program New Zealand No limit WNZL Medium Term Note Program Euro Market No limit WBC Euro Commercial Paper and Certificate of Deposit Program USD 20 billion WNZL Euro Commercial Paper and Certificate of Deposit Program USD 70 billion WBC Euro Medium Term Note Program USD 10 billion WSNZLa Euro Medium Term Note Program USD 40 billion WBCb Global Covered Bond Program EUR 5 billion WSNZLc Global Covered Bond Program Japan JPY 750 billion WBC Samurai shelf JPY 750 billion WBC Uridashi shelf United States USD 45 billion WBC US Commercial Paper Program USD 10 billion WSNZLa US Commercial Paper Program USD 35 billion WBC US Medium Term Note Program USD 10 billion WNZL US Medium Term Note Program No limit WBC (NY Branch) Certificate of Deposit Program No limit WBC US Securities and Exchange Commission registered shelves a. Notes issued under this program by Westpac Securities NZ Limited, London branch are guaranteed by Westpac New Zealand Limited, its parent company. b. Notes issued under this program are guaranteed by BNY Trust Company of Australia Limited as trustee of the Westpac Covered Bond Trust. c. Notes issued under this program by Westpac Securities NZ Limited, London branch are guaranteed by Westpac New Zealand Limited, its parent company, and Westpac NZ Covered Bond Limited. |
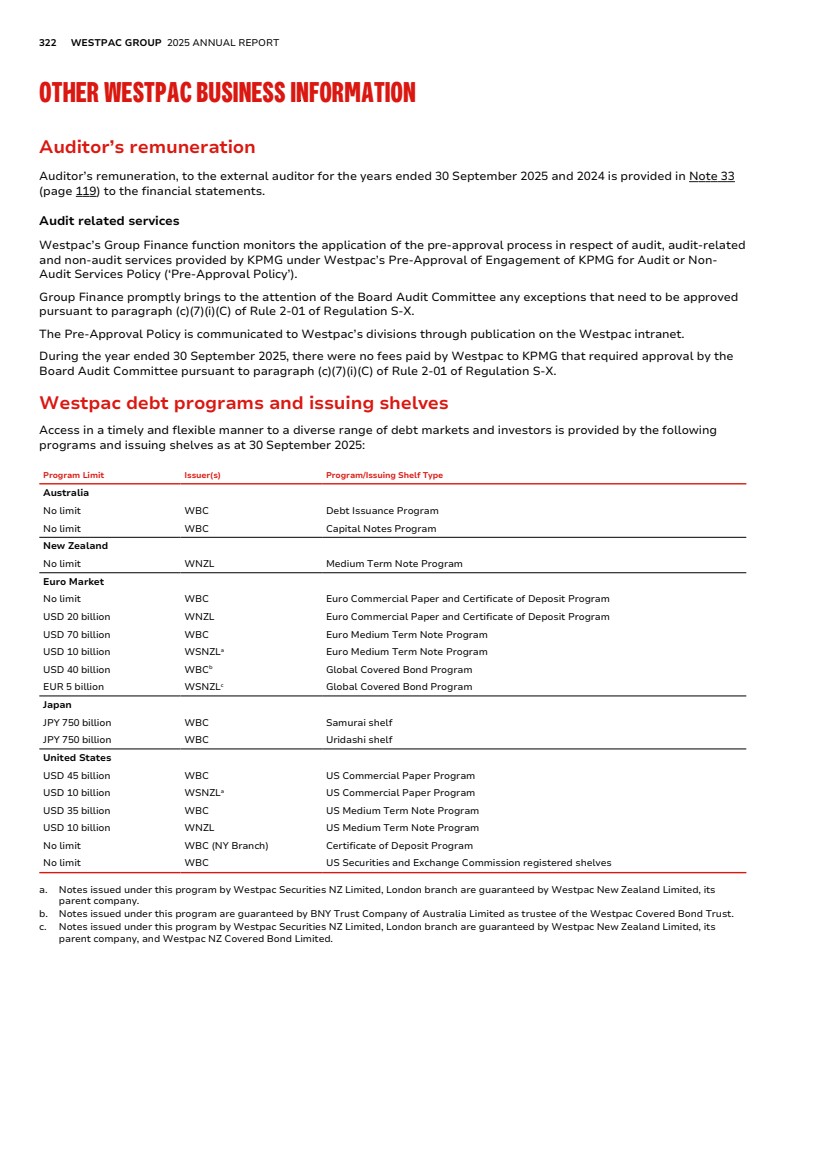
| FINANCIAL REPORT EXHIBITS INDEX STRATEGIC REVIEW PERFORMANCE REVIEW EXHIBIT 15.4 ADDITIONAL INFORMATION 323 OTHER WESTPAC BUSINESS INFORMATION Commitments Other Westpac business information Commitments Contractual obligations and commitments In connection with our operating activities we enter into certain contractual obligations and commitments. The following table shows our significant contractual obligations as at 30 September 2025: $m Up to 1 year Over 1 year to 3 years Over 3 years to 5 years Over 5 years Total On balance sheet long-term debt 32,120 55,821 36,451 12,347 136,739 Lease liabilities 424 725 589 249 1,987 Total contractual cash obligations 32,544 56,546 37,040 12,596 138,726 The above table excludes deposits and other liabilities taken in the normal course of banking business and short-term and undated liabilities. Commercial commitments1 The following table shows our significant commercial commitments as at 30 September 2025: $m Up to 1 year Over 1 year to 3 years Over 3 years to 5 years Over 5 years Total Financial guarantees, letters of credit and other credit substitutes 6,820 3,934 1,190 3,777 15,721 Performance-related contingencies 4,611 1,609 455 34 6,709 Remaining commitments to extend credit 58,429 42,787 19,995 77,528 198,739 Total undrawn credit commitments 69,860 48,330 21,640 81,339 221,169 Financial reporting Internal control over financial reporting The US Congress passed the Public Company Accounting Reform and Investor Protection Act in July 2002, which is commonly known as the Sarbanes-Oxley Act of 2002 (SOx). SOx is a wide ranging piece of US legislation concerned largely with financial reporting and corporate governance. We are obligated to comply with SOx by virtue of being a foreign registrant with the SEC and we have established procedures designed to comply with all applicable requirements of SOx. Disclosure controls and procedures Our management, with the participation of our CEO and CFO, evaluated the effectiveness of the design and operation of our disclosure controls and procedures (as defined in Rule 13a-15(e) under the US Securities Exchange Act of 1934) as of 30 September 2025. Based upon this evaluation, our CEO and CFO have concluded that the design and operation of our disclosure controls and procedures were effective as of 30 September 2025. Management’s report on internal control over financial reporting Rule 13a-15(a) under the US Securities Exchange Act of 1934 requires us to maintain an effective system of internal control over financial reporting. Refer to the sections headed ‘Management’s report on internal control over financial reporting’ and ‘Report of independent registered public accounting firm’ in Section 3 for those reports. Changes in our internal control over financial reporting There has been no change in our internal control over financial reporting (as defined in Rule 13a-15(f) of the US Securities Exchange Act of 1934) for the year ended 30 September 2025 that has been identified and that has materially affected, or is reasonably likely to materially affect, our internal control over financial reporting. 1. The numbers in this table are notional amounts (refer to Note 25 to the financial statements). |
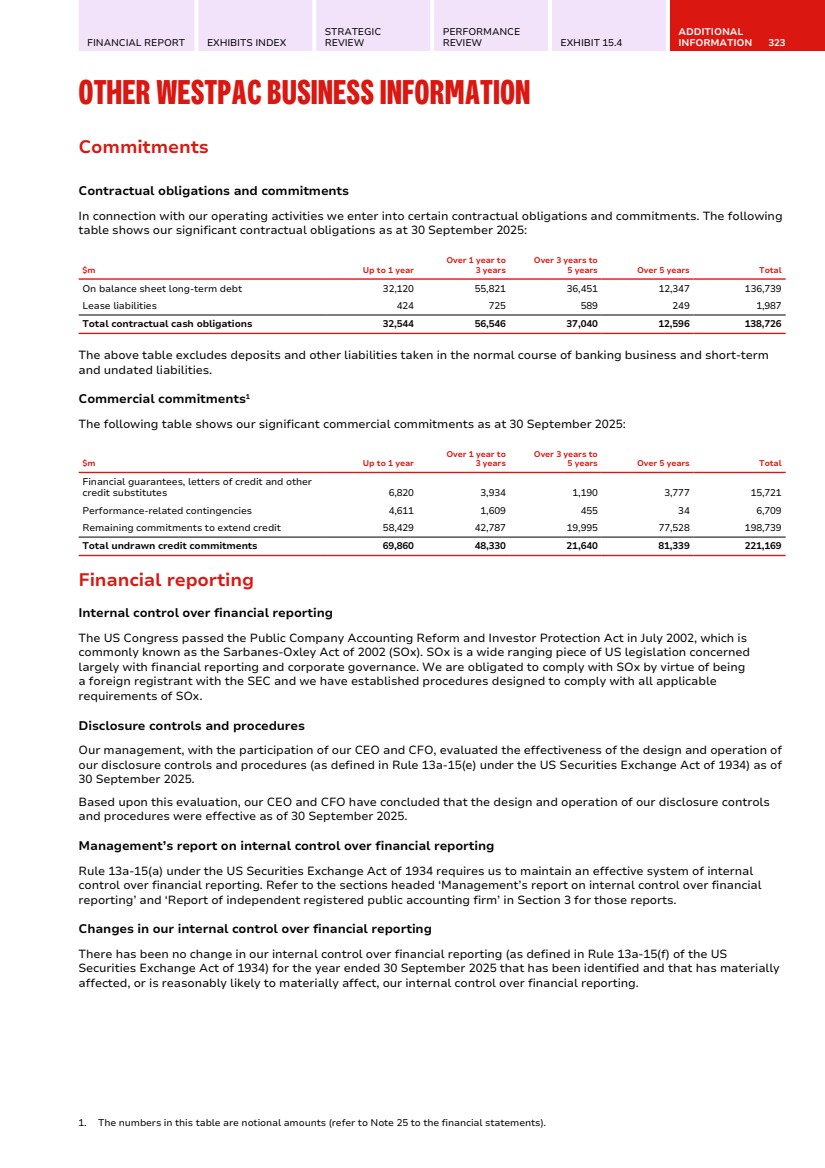
| 324 WESTPAC GROUP 2025 ANNUAL REPORT GLOSSARY OF ABBREVIATIONS AND DEFINED TERMS Glossary of Abbreviations and Defined Terms Shareholder value Adjusted dividend payout ratio Ordinary dividend paid/declared on issued shares (net of Treasury shares) divided by the net profit attributable to owners of WBC (adjusted for RSP dividends) excluding Notable Items. Average ordinary equity Average total equity less average non-controlling interests. Average tangible ordinary equity Average ordinary equity less intangible assets (excluding capitalised software). Average total equity The average balance of shareholders’ equity, including non-controlling interests. Basic earnings per share excluding Notable Items and Diluted earnings per share excluding Notable Items • Basic earnings per share excluding Notable Items is calculated as net profit attributable to owners of WBC (adjusted for RSP dividends) excluding Notable Items divided by the weighted average number of ordinary shares on issue during the period, adjusted for treasury shares. • Diluted earnings per share is calculated by adjusting the basic earnings per share excluding Notable Items by assuming all dilutive potential ordinary shares are converted. Dividend payout ratio Ordinary dividend paid/declared on issued shares (net of Treasury shares) divided by the net profit attributable to owners of WBC (adjusted for RSP dividends). Earnings per ordinary share • Basic earnings per ordinary share is calculated by dividing the net profit attributable to owners of WBC (adjusted for RSP dividends) by the weighted average number of ordinary shares on issue during the period, adjusted for treasury shares. • Diluted earnings per ordinary share is calculated by adjusting the basic earnings per ordinary share by assuming all dilutive potential ordinary shares are converted. Fully franked ordinary dividends per share (cents) Dividends paid out of retained profits which carry a credit for Australian company income tax paid by Westpac. Net tangible assets per ordinary share Net tangible assets (total equity less goodwill and other intangible assets less non-controlling interests) divided by the number of ordinary shares on issue (less Treasury shares held). Pre-provision profit Net interest income plus non-interest income less operating expenses. Return on average ordinary equity (ROE) Net profit attributable to the owners of WBC adjusted for RSP dividends (annualised where applicable) divided by average ordinary equity. Return on average tangible ordinary equity (ROTE) Net profit attributable to the owners of WBC adjusted for RSP dividends (annualised where applicable) divided by average tangible ordinary equity. ROE excluding Notable Items Net profit attributable to owners of WBC adjusted for RSP dividends excluding Notable Items (annualised where applicable) divided by average ordinary equity. ROTE excluding Notable Items Net profit attributable to owners of WBC adjusted for RSP dividends excluding Notable Items (annualised where applicable) divided by average tangible ordinary equity. Weighted average ordinary shares Weighted average number of fully paid ordinary shares listed on the Australian Stock Exchange for the relevant period less Westpac shares held by Westpac (‘Treasury shares’). Productivity and efficiency Expense to income ratio Operating expenses divided by net operating income. Expense to income ratio excluding Notable Items Operating expenses excluding Notable Items divided by net operating income excluding Notable Items. Full time equivalent employees (FTE) A calculation based on the number of hours worked by full and part-time employees as part of their normal duties. For example, the full time equivalent of one FTE is 76 hours paid work per fortnight. Business Performance Average Where possible, daily balances are used to calculate the average balance for the period. Average interest bearing liabilities The average balance of liabilities owed by Westpac that incur an interest expense. Where possible, daily balances are used to calculate the average balance for the period. Average interest earning assets The average balance of assets held by Westpac that generate interest income. Where possible, daily balances are used to calculate the average balance for the period. Core net interest income excluding Notable Items Net interest income excluding Notable Items and Treasury & Markets. Core NIM Calculated by dividing core net interest income (annualised where applicable) by average interest earning assets. Net interest margin (NIM) Calculated by dividing net interest income (annualised where applicable) by average interest earning assets. Net profit Net profit attributable to owners of WBC. TSR Total shareholder return. |
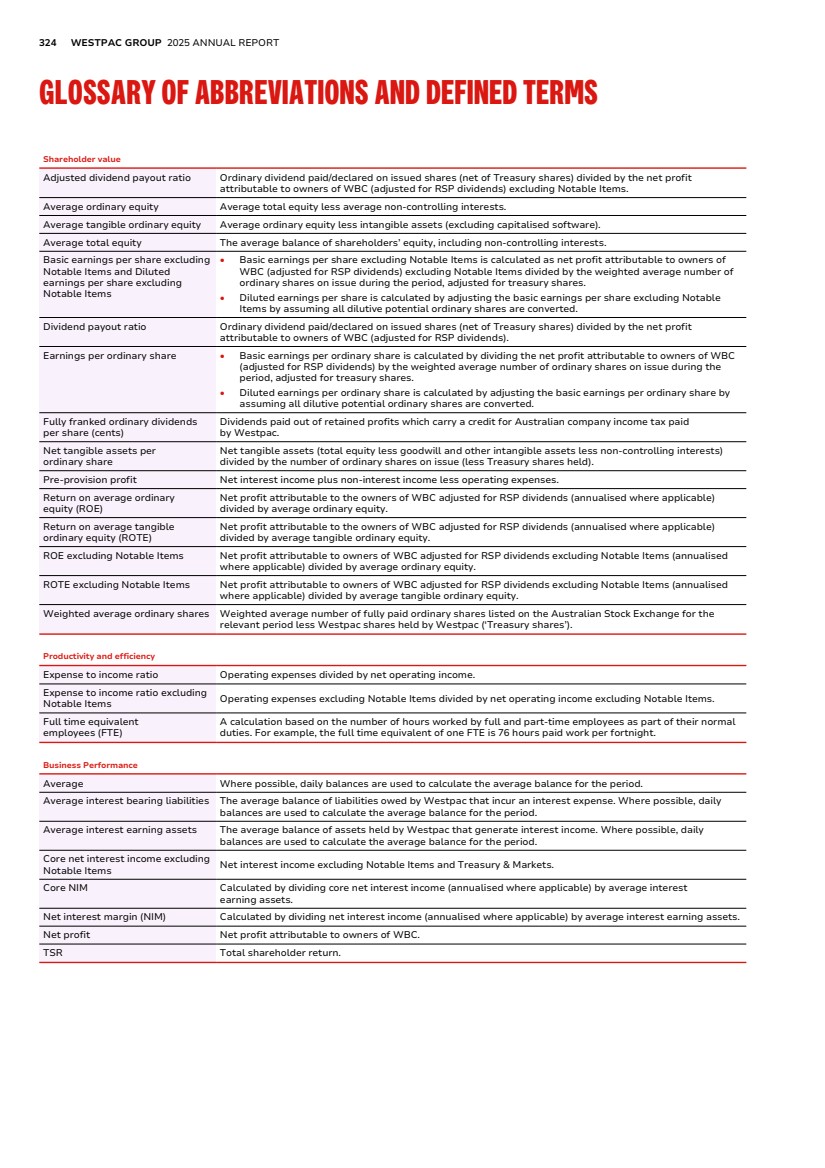
| FINANCIAL REPORT EXHIBITS INDEX STRATEGIC REVIEW PERFORMANCE REVIEW EXHIBIT 15.4 ADDITIONAL INFORMATION 325 Capital Adequacy Australian Prudential Regulation Authority (APRA) leverage ratio The leverage ratio is defined by APRA as Tier 1 capital divided by the “Exposure measure” and is expressed as a percentage. “Exposure measure” includes on-balance sheet exposures, derivatives exposures, securities financing transaction (SFT) exposures, and other off-balance sheet exposures. Common equity tier 1 (CET1) capital ratio Common equity tier 1 (CET1) capital divided by risk weighted assets, as defined by APRA. Credit risk weighted assets (Credit RWA) Credit risk weighted assets represent risk weighted assets (on-balance sheet and off-balance sheet) that relate to credit exposures and therefore exclude market risk, operational risk and IRRBB. Internationally comparable capital ratios Internationally comparable methodology references the ABA study on the comparability of APRA’s capital framework released on 10 March 2023. Operational risk The risk of loss resulting from inadequate or failed internal processes, people and systems or from external events, including legal risk but excluding strategic or reputational risk. Risk weighted assets (RWA) Assets (both on and off-balance sheet) are risk weighted according to each asset’s inherent potential for default and what the likely losses would be in case of default. In the case of non-asset backed risks (i.e. market, IRRBB and operational risk), RWA is determined by multiplying the capital requirements for those risks by 12.5. Tier 1 capital ratio Total Tier 1 capital divided by risk weighted assets, as defined by APRA. Total capital ratio Total capital divided by risk weighted assets, as defined by APRA. Funding and liquidity Deposit to loan ratio Customer deposits divided by loans. Funding for Lending Programme (FLP) A facility that was established by the RBNZ in December 2020 to provide 3 year term funding to eligible New Zealand institutions via repurchase transactions, subject to qualifying conditions, to help support lending to New Zealand customers. The facility closed to new draw downs in December 2022. High Quality Liquid Assets (HQLA) Assets which meet APRA’s criteria for inclusion as HQLA in the numerator of the LCR. Liquid assets HQLA and non LCR qualifying liquid assets, but excludes internally securitised assets that are eligible for a repurchase agreement with the RBA and the RBNZ. Liquidity Coverage Ratio (LCR) An APRA requirement to maintain an adequate level of unencumbered high quality liquid assets, to meet liquidity needs for a 30 calendar day period under an APRA-defined severe stress scenario. Absent a situation of financial stress, the value of the LCR must not be less than 100%. LCR is calculated as the percentage ratio of stock of HQLA, and qualifying RBNZ securities over the total net cash out-flows in a modelled 30 day defined stressed scenario. Net Stable Funding Ratio (NSFR) The NSFR is defined as the ratio of the amount of available stable funding (ASF) to the amount of required stable funding (RSF) defined by APRA. The amount of ASF is the portion of an ADI’s capital and liabilities expected to be a reliable source of funds over a one year time horizon. The amount of RSF is a function of the liquidity characteristics and residual maturities of an ADI’s assets and off-balance sheet activities. ADIs must maintain an NSFR of at least 100%. Term funding from central banks Term funding from central banks includes the drawn balances of the RBNZ FLP and Term Lending Facility. Wholesale funding Wholesale funding includes debt issues, loan capital, certificates of deposit, term funding from central banks and interbank placements. Credit quality Collectively assessed provisions (CAPs) Collectively assessed provisions for expected credit loss under AASB 9 represent the Expected Credit Loss (ECL) which is collectively assessed in pools of similar assets with similar risk characteristics. This incorporates forward-looking information and does not require an actual loss event to have occurred for an impairment provision to be recognised. Default Credit exposures that are non-performing. Exposure at default (EAD) EAD is calculated at facility level and includes outstandings as well as the proportion of committed undrawn that is expected to be drawn in the event of a future default. Impaired exposures Includes exposures that have deteriorated to the point where full collection of interest and principal is in doubt, based on an assessment of the customer’s outlook, cash flow, and the net realisation of value of assets to which recourse is held: • Facilities 90 days or more past due, and full recovery is in doubt: exposures where contractual payments are 90 or more days in arrears and the net realisable value of assets to which recourse is held may not be sufficient to allow full collection of interest and principal, including overdrafts or other revolving facilities that remain continuously outside approved limits by material amounts for 90 or more calendar days; • Non-accrual facilities: exposures with individually assessed impairment provisions held against them, excluding restructured loans; • Restructured facilities: exposures where the original contractual terms have been formally modified to provide for concessions of interest or principal for reasons related to the financial difficulties of the customer; • Other assets acquired through security enforcement (includes other real estate owned): includes the value of any other assets acquired as full or partial settlement of outstanding obligations through the enforcement of security arrangements; or • Any other facilities where the full collection of interest and principal is in doubt. Impaired exposures provisions to impaired exposures Impairment provisions relating to impaired exposures include individually assessed provisions plus the proportion of the collectively assessed provisions that relate to impaired exposures. Impairment charges/(benefit) to average loans Calculated as impairment charges/(benefit) (annualised where applicable) divided by average gross loans. |
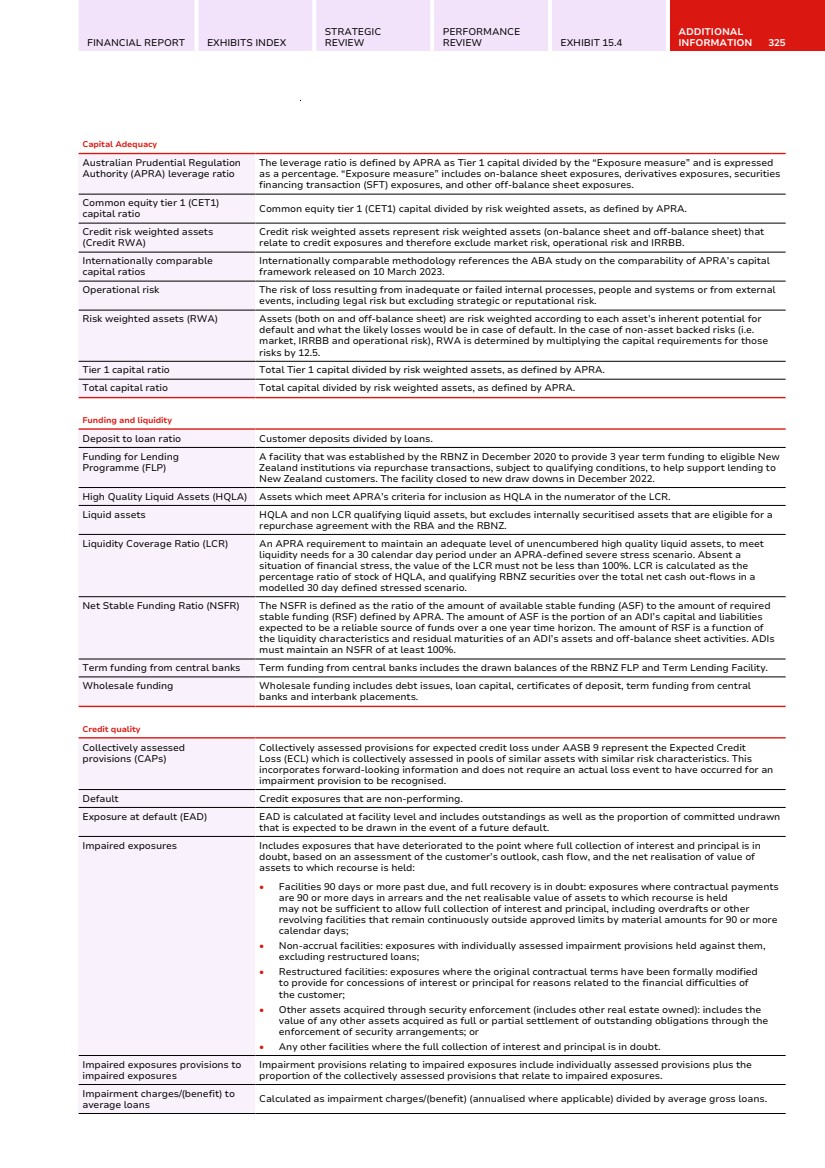
| 326 WESTPAC GROUP 2025 ANNUAL REPORT GLOSSARY OF ABBREVIATIONS AND DEFINED TERMS Credit quality Individually assessed provisions (IAPs) Provisions raised for losses on loans that are known to be impaired and are assessed on an individual basis. The estimated losses on these impaired loans is based on expected future cash flows discounted to their present value and, as this discount unwinds, interest will be recognised in the income statement. Loss given default (LGD) The loss that is expected to arise in the event of a default. Non-performing not impaired exposures Includes those credit exposures that are in default, but where it is expected that the full value of principal and accrued interest can be collected, generally by reference to the value of security held. Performing exposures Credit exposures that are not non-performing. Probability of default (PD) Probability of default is a through-the-cycle assessment of the likelihood of a customer defaulting on its financial obligations within one year. Provision for expected credit losses (ECL) Expected credit losses are a probability-weighted estimate of the cash shortfalls expected to result from defaults over the relevant time frame. They are determined by evaluating a range of possible outcomes and taking into account the time value of money, past events, current conditions and forecasts of future economic conditions. Stage 1: 12 months ECL - performing For financial assets where there has been no significant increase in credit risk since origination a provision for 12 months expected credit losses is recognised. Interest revenue is calculated on the gross carrying amount of the financial asset. Stage 2: Lifetime ECL - performing For financial assets where there has been a significant increase in credit risk since origination but where the asset is still performing a provision for lifetime expected losses is recognised. Interest revenue is calculated on the gross carrying amount of the financial asset. Stage 3: Lifetime ECL - non-performing For financial assets that are non-performing a provision for lifetime expected losses is recognised. Interest revenue is calculated on the carrying amount net of the provision for ECL rather than the gross carrying amount. Stressed exposures Watchlist and substandard credit exposures plus non-performing exposures. Total committed exposure (TCE) Represents the sum of the committed portion of direct lending (including funds placement overall and deposits placed), contingent and pre-settlement risk plus the committed portion of secondary market trading and underwriting risk. Watchlist and substandard Loan facilities where customers are experiencing operating weakness and financial difficulty but are not expected to incur loss of interest or principal. Sustainability ESG Environment, social and governance FPIC Free, Prior and Informed Consent NZBA Net-Zero Banking Alliance OHI Organisational Health Index RAP Reconciliation Action Plan TNFD Taskforce on Nature-related Financial Disclosures |
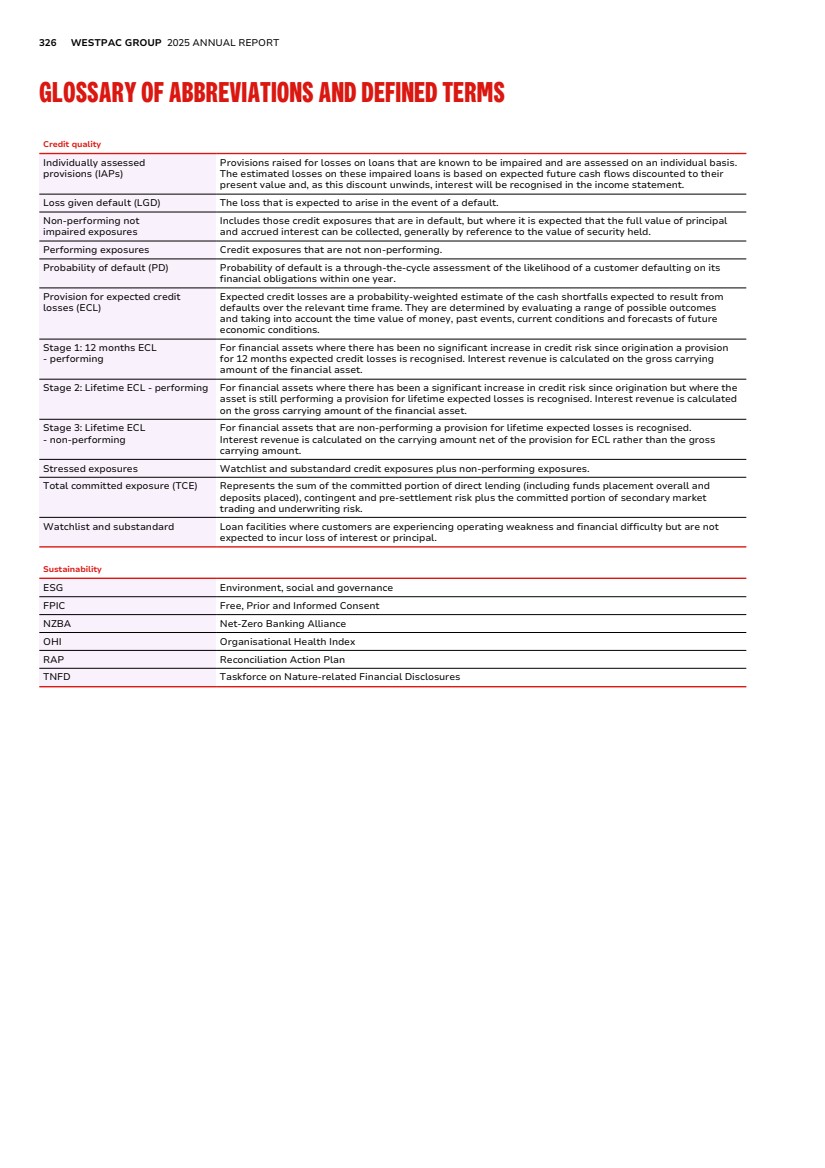
| FINANCIAL REPORT EXHIBITS INDEX STRATEGIC REVIEW PERFORMANCE REVIEW EXHIBIT 15.4 ADDITIONAL INFORMATION 327 Other AAS Australian Accounting Standards AASB Australian Accounting Standards Board ABA Australian Banking Association ACCC Australian Competition and Consumer Commission ADI Authorised Deposit-taking Institution AGM Annual General Meeting AI Artificial Intelligence ALM Asset and Liability Management AML Anti-Money Laundering APRA Australian Prudential Regulation Authority APS Australian Prudential Standard ASIC Australian Securities and Investments Commission ASX Australian Securities Exchange ATM Automated Teller Machine ATO Australian Taxation Office AUSTRAC Australian Transaction Reports and Analysis Centre BBSW Bank bill swap rate BCCC The Banking Code Compliance Committee bps Basis points CORE program Customer Outcomes and Risk Excellence Credit Value Adjustment (CVA) CVA adjusts the fair value of over-the-counter derivatives for credit risk. CVA is employed on the majority of derivative positions and reflects the market view of the counterparty credit risk. A Debit Valuation Adjustment is employed to adjust for our own credit risk. CTF Counter-Terrorism Financing DRP Dividend Reinvestment Plan D-SIB Domestic systemically important bank EIP Executive Incentive Plan FATCA Foreign Account Tax Compliance Act Full Year 2023 (FY23) Twelve months ended 30 September 2023 Full Year 2024 (FY24) Twelve months ended 30 September 2024 Full Year 2025 (FY25) Twelve months ended 30 September 2025 Full Year 2026 (FY26) Twelve months ended 30 September 2026 Funding Value Adjustment (FVA) FVA relates to the funding cost or benefit associated with the uncollateralised portion of the derivative portfolio. FVIS Fair value through income statement FVOCI Fair value through other comprehensive income FX Foreign exchange IFRS International Financial Reporting Standards IRRBB Interest Rate Risk in the Banking Book LTVR Long term variable reward NCI Non-controlling interests Non-interest earning/bearing Instruments which do not carry an entitlement to interest NPS® Net Promoter Score. Consumer: RFI Consumer Atlas, Sep-25, 6MMA, MFI customers. Business: RFI Business Atlas, Sep-25, 6MMA, MFI businesses. Business includes Small Business, SME (12MMA) and Commercial customers, weighted by number of businesses in each segment. The ranking refers to Westpac's position relative to the other three major Australian banks (ANZ, CBA and NAB) OAIC The Office of the Australian Information Commissioner OCI Other comprehensive income PwC PricewaterhouseCoopers RBA Reserve Bank of Australia RBNZ Reserve Bank of New Zealand RSP Restricted Share Plan Runoff Scheduled and unscheduled repayments and debt repayments, net of redraws Second Half 2025 Six months ended 30 September 2025 Segment reporting Segment reporting is presented on a management reporting basis. Internal charges and transfer pricing adjustments are included in the performance of each segment reflecting the management structure rather than the legal entity (these results cannot be compared to results for individual legal entities). Where management reporting structures or accounting classifications have changed, financial results for comparative periods have been restated and may differ from results previously reported. Overhead costs are allocated to revenue generating segments. Westpac’s internal transfer pricing frameworks facilitate risk transfer, profitability measurement, capital allocation and segment alignment, tailored to the jurisdictions in which Westpac operates. Transfer pricing allows Westpac to measure the relative contribution of products and segments to Westpac’s interest margin and other dimensions of performance. Key components of Westpac’s transfer pricing frameworks are funds transfer pricing for interest rate and liquidity risk and allocation of basis and contingent liquidity costs, including capital allocation. SME Small to medium size enterprises SPPI Solely payments of principal and interest STVR Short term variable reward UNITE program A business-led, technology-enabled simplification program Value at Risk (VaR) A statistical estimate of the potential loss in earnings over a specified period of time and to a given level of confidence based on historical market movements. WNZL Westpac New Zealand Limited |