| ASX RELEASE Westpac Banking Corporation Level 18, 275 Kent Street Sydney, NSW, 2000 13 February 2026 Pillar 3 Report as at 31 December 2025 Westpac Banking Corporation (“Westpac”) today provides the attached Pillar 3 Report (December 2025). For further information: Hayden Cooper Justin McCarthy Group Head of Media Relations General Manager, Investor Relations 0402 393 619 0422 800 321 This document has been authorised for release by Tim Hartin, Company Secretary. |
| PILLAR3 REPORT WESTPAC DECEMBER 2025 INCORPORATING THE REQUIREMENTSOF APS 330 WESTPACBANKING CORPORATION ABN 33 007 457 141 |
| Acknowledgement of Indigenous Peoples Westpac acknowledges the First Peoples of Australia. We recognise their ongoing role as Traditional Owners of the land and waters of this country and pay our respects to Elders, past and present. We extend our respect to Westpac’s Aboriginal and Torres Strait Islander employees, partners and stakeholders and to the Indigenous Peoples in the other locations where we operate. In Aotearoa (New Zealand) we also acknowledge tāngata whenua and the unique relationship that Indigenous Peoples share with all New Zealanders under Te Tiriti o Waitangi. 2 WESTPAC GROUP DECEMBER 2025 PILLAR 3 REPORT Content OVERVIEW 3 Introduction 4 Key Metrics 5 Group Structure 8 Capital Overview 10 RISK MANAGEMENT 14 Credit Risk Management 15 Leverage Ratio 16 Funding and Liquidity Risk Management 17 OTHER INFORMATION 18 Management's Declaration 19 Appendices 20 Glossary 21 Disclosure regarding forward-looking statements 23 In this report references to ‘Westpac’, 'WBC', ‘Westpac Group’, ‘the Group’, ‘we’, ‘us’ and ‘our’ are to Westpac Banking Corporation ABN 33 007 457 141 and its subsidiaries unless it clearly means just Westpac Banking Corporation. In this report, unless otherwise stated or the context otherwise requires, references to 'dollars', 'dollar amounts', ‘$’, ‘AUD’ or ‘A$’ are to Australian dollars. References to ‘US$’, ‘USD’ or ‘US dollars’ are to United States dollars, references to ‘NZ$’, ‘NZD’ or ‘NZ dollars’ are to New Zealand dollars, references to 'EUR' are to European Euro, references to 'SGD' are to Singapore dollars and references to 'JPY' are Japanese Yen. Any discrepancies between totals and the sum of components in tables contained in this report are due to rounding. In this report, unless otherwise stated, disclosures reflect the Australian Prudential Regulation Authority’s (APRA) implementation of Basel III. Information contained in or accessible through the websites mentioned in this report does not form part of this report unless we specifically state that it is incorporated by reference and forms part of this report. Information on those websites owned by Westpac is current as at the date of this report. Except as required by law, we assume no obligation to revise or update those websites after the date of this report. We are not in a position to verify information on websites owned and/or operated by third parties. Westpac Banking Corporation ABN 33 007 457 141 |
| OVERVIEW RISK MANAGEMENT OTHER INFORMATION 3 OVERVIEW INTRODUCTION KEY METRICS KM1: Key metrics GROUP STRUCTURE CAPITAL OVERVIEW OV1: Overview of Risk Weighted Assets (RWA) Summary of Credit Risk CMS1: Comparison of modelled and standardised RWA at risk level |

| 4 WESTPAC GROUP DECEMBER 2025 PILLAR 3 REPORT INTRODUCTION Introduction Westpac Banking Corporation is an Authorised Deposit-taking Institution (ADI) subject to regulation by the Australian Prudential Regulation Authority (APRA). Westpac is primarily accredited to use the Advanced Internal Ratings-Based Approach (A-IRB) for credit risk, the Standardised Measurement Approach (SMA) for operational risk and is required to apply the Pillar 1 Basel capital framework in our assessment of traded market risk and interest rate risk in the banking book (IRRBB). This report has been prepared in accordance with APS 330 Public Disclosure (APS 330) and Westpac's Board approved Prudential Disclosure Policy. This report provides prudential information about our risk management practices and measures. Westpac is required to comply with the disclosure requirements issued by the Basel Committee on Banking Supervision (BCBS), subject to certain amendments by APRA. Disclosures requirements vary, for quarterly, semi-annual and annual Pillar 3 reports. In addition to this report, the regulatory disclosures section of Westpac's website1 contains the reporting requirements for capital instruments under paragraph 37 of APS 330 and CCA: Main features of regulatory capital instruments. Capital instruments disclosures are updated when: • A new capital instrument is issued that will form part of regulatory capital; or • A capital instrument is redeemed, converted into Common equity tier 1 (CET1) capital, written off, or its terms and conditions are changed. 1. http://www.westpac.com.au/about-westpac/investor-centre/financial-information/regulatory-disclosures/ |
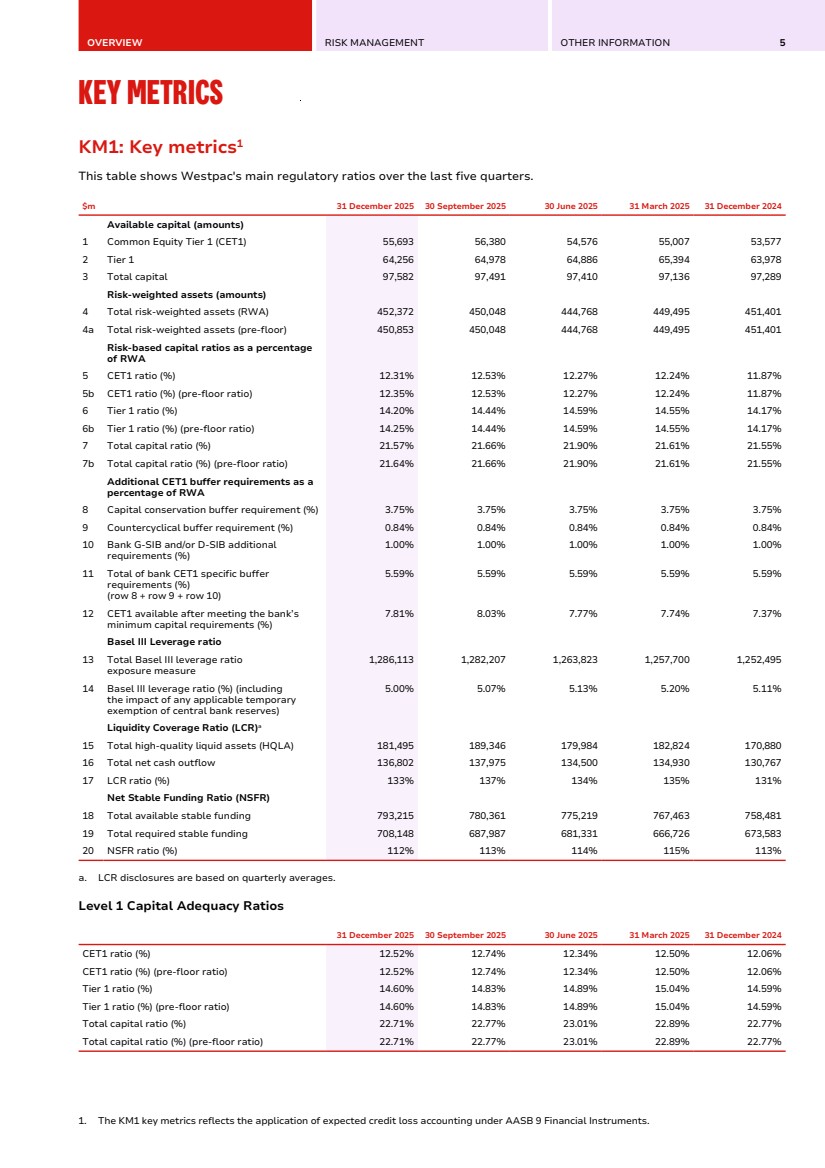
| OVERVIEW RISK MANAGEMENT OTHER INFORMATION 5 KEY METRICS KM1: Key metrics1 Key Metrics KM1: Key metrics1 This table shows Westpac's main regulatory ratios over the last five quarters. $m 31 December 2025 30 September 2025 30 June 2025 31 March 2025 31 December 2024 Available capital (amounts) 1 Common Equity Tier 1 (CET1) 55,693 56,380 54,576 55,007 53,577 2 Tier 1 64,256 64,978 64,886 65,394 63,978 3 Total capital 97,582 97,491 97,410 97,136 97,289 Risk-weighted assets (amounts) 4 Total risk-weighted assets (RWA) 452,372 450,048 444,768 449,495 451,401 4a Total risk-weighted assets (pre-floor) 450,853 450,048 444,768 449,495 451,401 Risk-based capital ratios as a percentage of RWA 5 CET1 ratio (%) 12.31% 12.53% 12.27% 12.24% 11.87% 5b CET1 ratio (%) (pre-floor ratio) 12.35% 12.53% 12.27% 12.24% 11.87% 6 Tier 1 ratio (%) 14.20% 14.44% 14.59% 14.55% 14.17% 6b Tier 1 ratio (%) (pre-floor ratio) 14.25% 14.44% 14.59% 14.55% 14.17% 7 Total capital ratio (%) 21.57% 21.66% 21.90% 21.61% 21.55% 7b Total capital ratio (%) (pre-floor ratio) 21.64% 21.66% 21.90% 21.61% 21.55% Additional CET1 buffer requirements as a percentage of RWA 8 Capital conservation buffer requirement (%) 3.75% 3.75% 3.75% 3.75% 3.75% 9 Countercyclical buffer requirement (%) 0.84% 0.84% 0.84% 0.84% 0.84% 10 Bank G-SIB and/or D-SIB additional requirements (%) 1.00% 1.00% 1.00% 1.00% 1.00% 11 Total of bank CET1 specific buffer requirements (%) (row 8 + row 9 + row 10) 5.59% 5.59% 5.59% 5.59% 5.59% 12 CET1 available after meeting the bank’s minimum capital requirements (%) 7.81% 8.03% 7.77% 7.74% 7.37% Basel III Leverage ratio 13 Total Basel III leverage ratio exposure measure 1,286,113 1,282,207 1,263,823 1,257,700 1,252,495 14 Basel III leverage ratio (%) (including the impact of any applicable temporary exemption of central bank reserves) 5.00% 5.07% 5.13% 5.20% 5.11% Liquidity Coverage Ratio (LCR)a 15 Total high-quality liquid assets (HQLA) 181,495 189,346 179,984 182,824 170,880 16 Total net cash outflow 136,802 137,975 134,500 134,930 130,767 17 LCR ratio (%) 133% 137% 134% 135% 131% Net Stable Funding Ratio (NSFR) 18 Total available stable funding 793,215 780,361 775,219 767,463 758,481 19 Total required stable funding 708,148 687,987 681,331 666,726 673,583 20 NSFR ratio (%) 112% 113% 114% 115% 113% a. LCR disclosures are based on quarterly averages. Level 1 Capital Adequacy Ratios 31 December 2025 30 September 2025 30 June 2025 31 March 2025 31 December 2024 CET1 ratio (%) 12.52% 12.74% 12.34% 12.50% 12.06% CET1 ratio (%) (pre-floor ratio) 12.52% 12.74% 12.34% 12.50% 12.06% Tier 1 ratio (%) 14.60% 14.83% 14.89% 15.04% 14.59% Tier 1 ratio (%) (pre-floor ratio) 14.60% 14.83% 14.89% 15.04% 14.59% Total capital ratio (%) 22.71% 22.77% 23.01% 22.89% 22.77% Total capital ratio (%) (pre-floor ratio) 22.71% 22.77% 23.01% 22.89% 22.77% 1. The KM1 key metrics reflects the application of expected credit loss accounting under AASB 9 Financial Instruments. |
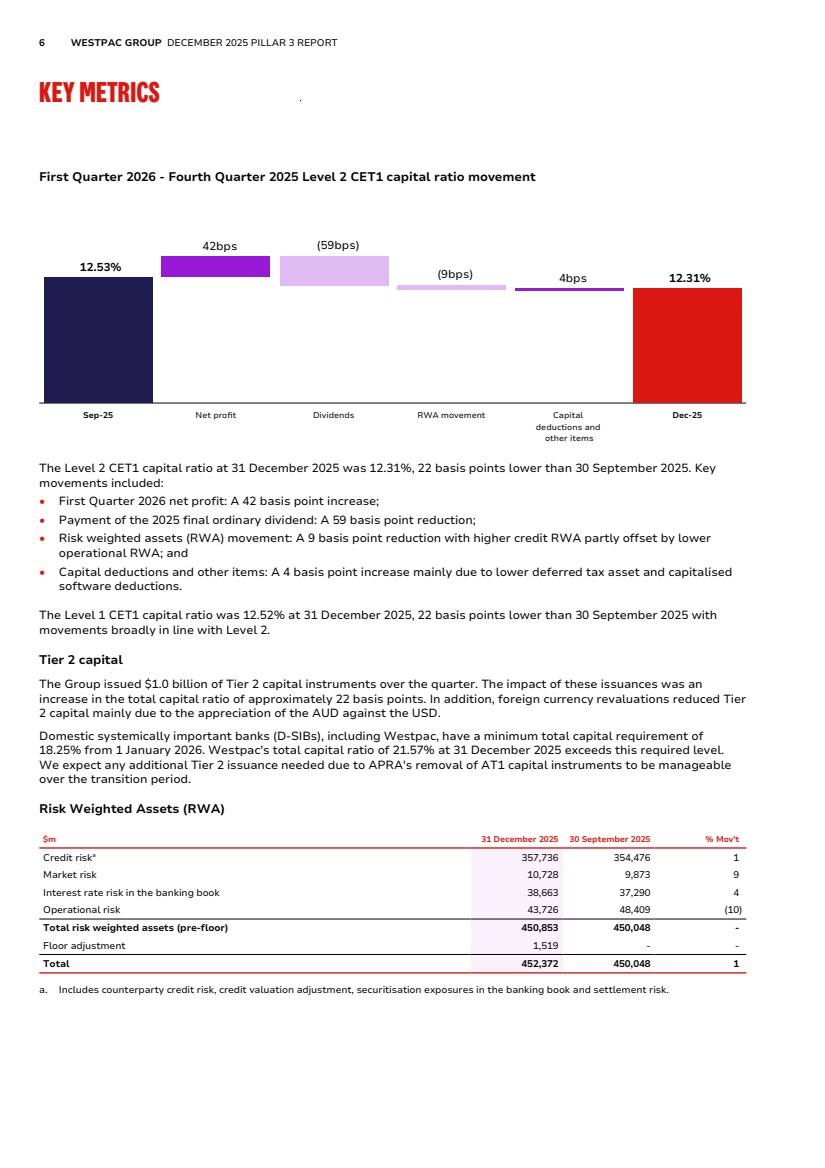
| 6 WESTPAC GROUP DECEMBER 2025 PILLAR 3 REPORT KEY METRICS First Quarter 2026 - Fourth Quarter 2025 Level 2 CET1 capital ratio movement 12.53% 42bps (59bps) (9bps) 4bps 12.31% Sep-25 Net profit Dividends RWA movement Capital deductions and other items Dec-25 The Level 2 CET1 capital ratio at 31 December 2025 was 12.31%, 22 basis points lower than 30 September 2025. Key movements included: • First Quarter 2026 net profit: A 42 basis point increase; • Payment of the 2025 final ordinary dividend: A 59 basis point reduction; • Risk weighted assets (RWA) movement: A 9 basis point reduction with higher credit RWA partly offset by lower operational RWA; and • Capital deductions and other items: A 4 basis point increase mainly due to lower deferred tax asset and capitalised software deductions. The Level 1 CET1 capital ratio was 12.52% at 31 December 2025, 22 basis points lower than 30 September 2025 with movements broadly in line with Level 2. Tier 2 capital The Group issued $1.0 billion of Tier 2 capital instruments over the quarter. The impact of these issuances was an increase in the total capital ratio of approximately 22 basis points. In addition, foreign currency revaluations reduced Tier 2 capital mainly due to the appreciation of the AUD against the USD. Domestic systemically important banks (D-SIBs), including Westpac, have a minimum total capital requirement of 18.25% from 1 January 2026. Westpac's total capital ratio of 21.57% at 31 December 2025 exceeds this required level. We expect any additional Tier 2 issuance needed due to APRA's removal of AT1 capital instruments to be manageable over the transition period. Risk Weighted Assets (RWA) $m 31 December 2025 30 September 2025 % Mov't Credit riska 357,736 354,476 1 Market risk 10,728 9,873 9 Interest rate risk in the banking book 38,663 37,290 4 Operational risk 43,726 48,409 (10) Total risk weighted assets (pre-floor) 450,853 450,048 - Floor adjustment 1,519 - - Total 452,372 450,048 1 a. Includes counterparty credit risk, credit valuation adjustment, securitisation exposures in the banking book and settlement risk. |
| OVERVIEW RISK MANAGEMENT OTHER INFORMATION 7 Total RWA increased by 0.5% to $452.4 billion over the quarter with higher credit RWA partly offset by lower operational RWA. Credit RWA increased by $3.3 billion. Key movements included: • A $10.5 billion increase from higher lending primarily in Corporate and Residential Mortgages; • A $3.2 billion decrease due to improvements in Residential Mortgages delinquency rates and Corporate credit quality metrics; • A $2.3 billion decrease from the removal of a $1 billion APRA RWA overlay related to the usage of a customer risk grade proxy on a small sub-set of non-retail exposures and data refinements mainly in Corporate; • A $1.0 billion decrease from foreign currency translation impacts, predominately the appreciation of the AUD against the NZD and USD; and • A $0.7 billion decrease from counterparty credit risk and mark-to-market related credit risk due to decreases in the mark-to-market value of derivatives from changes in underlying foreign currency rates. Non-credit RWA decreased by $2.5 billion. Key movements included: • Operational RWA: $4.7 billion decrease from: – A $6.25 billion reduction following the removal of the remaining $500 million operational risk capital overlay; and – A $1.6 billion increase due to the annual SMA operational risk review based on the latest annual audited financial statements. • IRRBB RWA: A $1.4 billion increase from the unwind of the embedded gain component due to higher interest rates and additional capital required for increased core deposit hedging partly offset by reductions resulting from the revised APS 117 standard changes; and • Market RWA: A $0.9 billion increase mainly from higher market risk exposures. The capital floor RWA adjustment as at 31 December 2025 was $1.5 billion driven mainly from higher lending in Corporate and Residential Mortgages. Leverage ratio The leverage ratio represents the percentage of Tier 1 capital relative to the Exposure Measure1 . At 31 December 2025, Westpac's leverage ratio was 5.00%, down 7 basis points from 30 September 2025. The ratio remains well above APRA's current regulatory minimum requirement of 3.5%. The decrease in the leverage ratio was mainly due to higher total exposures mostly from higher lending and lower Tier 1 capital following the payment of the 2025 final ordinary dividend, partly offset by lower securities financing transaction (SFT) exposures. APRA has announced changes to banks' capital requirements with effect from 1 January 2027, as outlined in the Capital Overview section. This includes changes to CET1, Tier 1, total capital and the leverage ratio. Liquidity Coverage Ratio (LCR) Westpac’s average LCR for the quarter ended 31 December 2025 was 133% (30 September 2025: 137%), well above the regulatory minimum of 100%. The decrease in the ratio was due to lower average liquid assets. Net Stable Funding Ratio (NSFR) Westpac had an NSFR of 112% as of 31 December 2025 (30 September 2025: 113%) and continues to be above the regulatory minimum of 100%. The decrease in the ratio is attributable to an increase in required stable funding driven by higher lending, partially offset by an increase in available stable funding driven by growth in customer deposits. 1. As defined under Attachment D of APS 110: Capital Adequacy. |
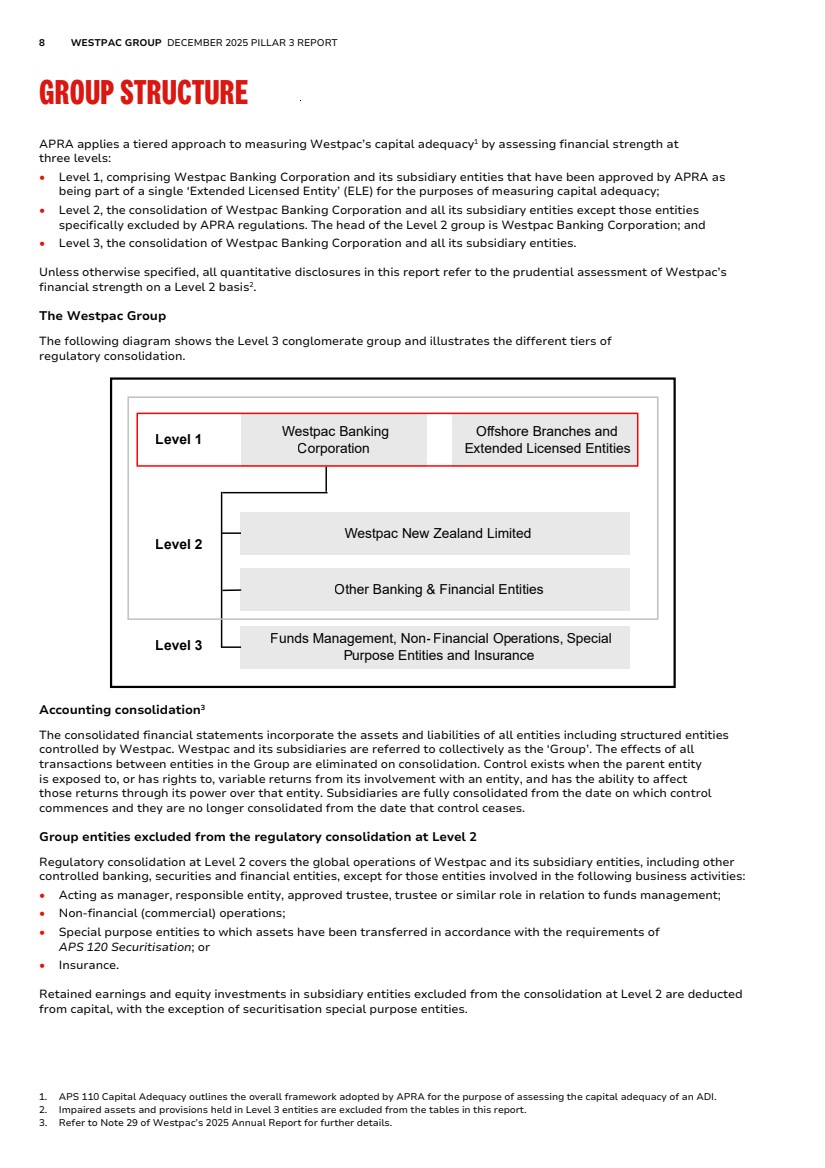
| 8 WESTPAC GROUP DECEMBER 2025 PILLAR 3 REPORT GROUP STRUCTURE Group Structure APRA applies a tiered approach to measuring Westpac’s capital adequacy1 by assessing financial strength at three levels: • Level 1, comprising Westpac Banking Corporation and its subsidiary entities that have been approved by APRA as being part of a single ‘Extended Licensed Entity’ (ELE) for the purposes of measuring capital adequacy; • Level 2, the consolidation of Westpac Banking Corporation and all its subsidiary entities except those entities specifically excluded by APRA regulations. The head of the Level 2 group is Westpac Banking Corporation; and • Level 3, the consolidation of Westpac Banking Corporation and all its subsidiary entities. Unless otherwise specified, all quantitative disclosures in this report refer to the prudential assessment of Westpac’s financial strength on a Level 2 basis2 . The Westpac Group The following diagram shows the Level 3 conglomerate group and illustrates the different tiers of regulatory consolidation. Westpac Banking Corporation Offshore Branches and Extended Licensed Entities Westpac New Zealand Limited Other Banking & Financial Entities Funds Management, Non- Financial Operations, Special Purpose Entities and Insurance Level 3 Level 2 Level 1 Accounting consolidation3 The consolidated financial statements incorporate the assets and liabilities of all entities including structured entities controlled by Westpac. Westpac and its subsidiaries are referred to collectively as the ‘Group’. The effects of all transactions between entities in the Group are eliminated on consolidation. Control exists when the parent entity is exposed to, or has rights to, variable returns from its involvement with an entity, and has the ability to affect those returns through its power over that entity. Subsidiaries are fully consolidated from the date on which control commences and they are no longer consolidated from the date that control ceases. Group entities excluded from the regulatory consolidation at Level 2 Regulatory consolidation at Level 2 covers the global operations of Westpac and its subsidiary entities, including other controlled banking, securities and financial entities, except for those entities involved in the following business activities: • Acting as manager, responsible entity, approved trustee, trustee or similar role in relation to funds management; • Non-financial (commercial) operations; • Special purpose entities to which assets have been transferred in accordance with the requirements of APS 120 Securitisation; or • Insurance. Retained earnings and equity investments in subsidiary entities excluded from the consolidation at Level 2 are deducted from capital, with the exception of securitisation special purpose entities. 1. APS 110 Capital Adequacy outlines the overall framework adopted by APRA for the purpose of assessing the capital adequacy of an ADI. 2. Impaired assets and provisions held in Level 3 entities are excluded from the tables in this report. 3. Refer to Note 29 of Westpac’s 2025 Annual Report for further details. |
| OVERVIEW RISK MANAGEMENT OTHER INFORMATION 9 Subsidiary banking entities Westpac New Zealand Limited (WNZL), a wholly owned subsidiary entity, is a registered bank incorporated in New Zealand and regulated by, among others, the Reserve Bank of New Zealand (RBNZ) for prudential purposes. WNZL uses both A-IRB and Standardised methodologies for credit risk and SMA for operational risk. Other subsidiary banking entities in the Group include Westpac Bank PNG Limited and Westpac Europe GMBH. For the purposes of determining Westpac’s capital adequacy, subsidiary banking entities are consolidated at Level 2. Customer operations Westpac is one of Australia's leading providers of banking and certain financial services, operating under multiple brands in Australia and in New Zealand, with a small presence in Europe, North America, Asia and the Pacific. Westpac provides banking products and services through its digital and online channels, supported by a branch and ATM network, contact centres and relationship and product managers. Restrictions and major impediments on the transfer of funds or regulatory capital within the Group Certain subsidiary banking and trustee entities are subject to specific and local prudential regulation in their own right, including capital adequacy requirements and investment or intra-group exposure limits. Westpac seeks to ensure that its subsidiary entities are adequately capitalised and adhere to regulatory requirements at all times. Dividends and capital are repatriated in line with the Group’s policy subject to subsidiary Board approval and local regulations. Intra-group exposure limits Exposures to related entities are managed within the prudential limits prescribed by APRA in APS 222 Associations with Related Entities1 . Westpac has an internal limit structure and approval process governing credit exposures to related entities. This limit structure and approval process, combined with APRA’s prudential limits, is designed to reduce the potential for unacceptable contagion risk. Updates to large and related entity exposure limit calculations resulting from the changes to banks' capital requirements are outlined in the Capital Overview section. These changes are effective from 1 January 2027. 1. For the purposes of APS 222, subsidiaries controlled by Westpac, other than subsidiaries that form part of the ELE, represent ‘related entities’. Prudential and internal limits apply to intra-group exposures between the ELE and related entities, both on an individual and aggregate basis. |
| 10 WESTPAC GROUP DECEMBER 2025 PILLAR 3 REPORT CAPITAL OVERVIEW Capital Overview Capital management strategy Westpac's capital management strategy is reviewed on an ongoing basis, including through an annual Internal Capital Adequacy Assessment Process (ICAAP). Key considerations include: • Regulatory capital minimums together with the capital conservation buffer and countercyclical capital buffer comprise the Total CET1 Requirement. The total CET1 requirement is currently at least 10.25% and 10.50% effective 1 January 20271 ; • Strategy, business mix and operations and contingency plans; • Perspectives of external stakeholders including rating agencies as well as equity and debt investors; and • A stress testing framework that tests our resilience under a range of adverse economic scenarios. The Board has determined a target post dividend CET1 capital ratio of above 11.25% in normal operating conditions. Regulatory developments Interest Rate Risk in the Banking Book APRA’s revised APS 117 Capital Adequacy: Interest Rate Risk in the Banking Book came into effect on 1 October 2025. The revised requirements include implementation of APRA’s reaccreditation outcomes for Westpac’s IRRBB models which are reflected in the 31 December 2025 amounts of this Pillar 3 report. Comparatives remain unchanged and are based on the prior APS 117. APRA's phase out of Additional Tier 1 (AT1) capital as eligible bank capital On 4 December 2025, APRA published the final changes to the relevant prudential and reporting standards resulting from the phase out of AT1 with an effective date of 1 January 2027. Under these revised standards, large internationally active banks such as Westpac will replace 1.5% of AT1 capital with 1.25% of Tier 2 capital and 0.25% of CET1 capital. The total CET1 requirement, including regulatory buffers, will increase from 10.25% to 10.50%. There is no overall increase in total capital requirements for banks. On implementation of these revised prudential and reporting standards, existing AT1 capital instruments would be included in the calculation of the amount of total capital, until their first scheduled call date. Existing Westpac AT1 capital instruments would reach their first scheduled optional redemption dates by 2031 at the latest. In addition, effective 1 January 2027 the minimum leverage ratio requirement will be 3.25% based on CET1 capital replacing the current requirement of 3.50% based on Tier 1 capital. APS 221 Large Exposures and APS 222 Associations with Related Entities exposure limits remain unchanged, however will be based on CET1 capital rather than Tier 1 capital. RBNZ capital review On 17 December 2025, the RBNZ published its decisions on the key capital settings for deposit takers. For Group 1 deposit takers2 , including WNZL, the key proposals include: • A total CET1 capital ratio requirement of 12%, with a total capital ratio requirement of 15% (including a Prudential Capital Buffer ratio of 6%) and an additional Loss Absorbing Capacity (LAC) requirement of 6%; • Tier 2 capital and LAC instruments will be required to be issued internally to parents (for example to WBC) and LAC will take a form similar to Tier 2 capital; • Removal of AT1 instruments from the capital stack; • More granular standardised risk weights, including lower risk weights in some areas; and • Setting the long-run level for the counter-cyclical capital buffer component of the Prudential Capital Buffer at 1%. The RBNZ will consult on the LAC instrument design and implementation timelines for options affecting both future LAC and Tier 2 instruments and the phase-out of existing AT1 and Tier 2 instruments during 2026 and 2027. 1. Noting that APRA may apply higher CET1 requirements for an individual ADI. 2. New Zealand deposit takers with total assets of NZ$100 billion or more. |
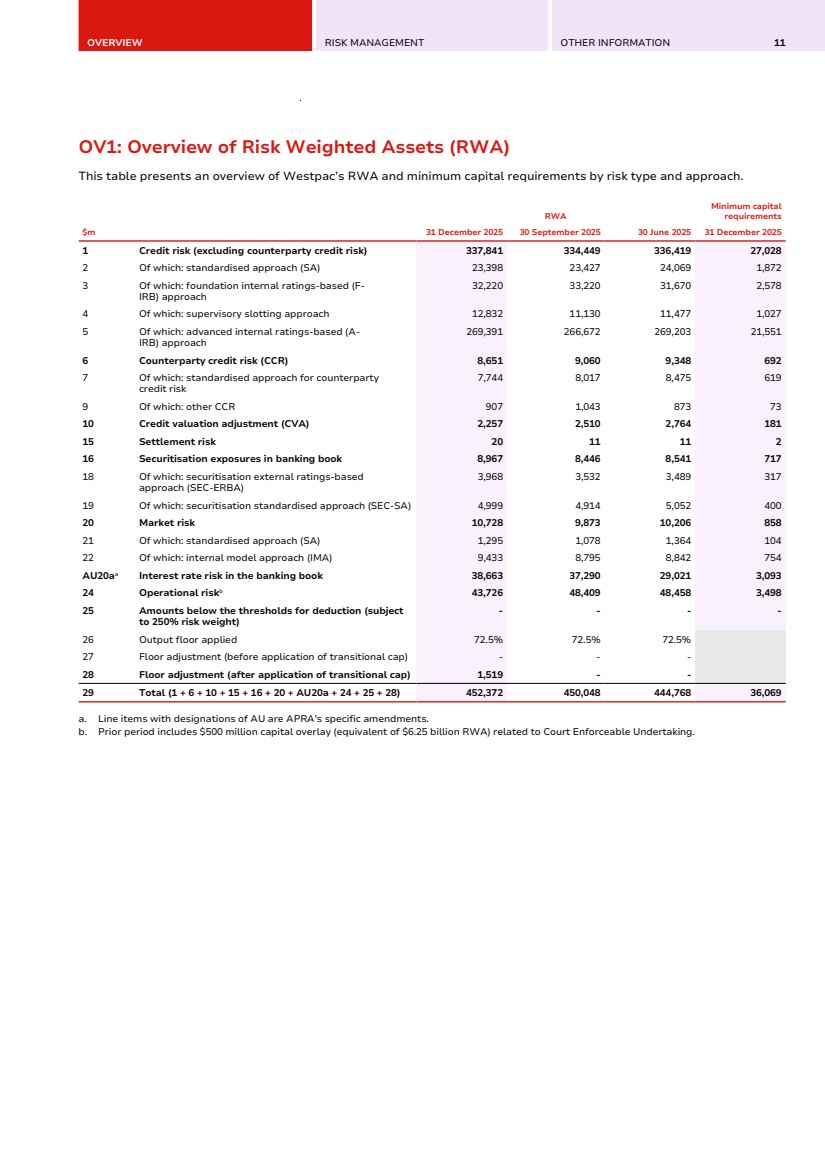
| OVERVIEW RISK MANAGEMENT OTHER INFORMATION 11 OV1: Overview of Risk Weighted Assets (RWA) OV1: Overview of Risk Weighted Assets (RWA) This table presents an overview of Westpac’s RWA and minimum capital requirements by risk type and approach. $m RWA Minimum capital requirements 31 December 2025 30 September 2025 30 June 2025 31 December 2025 1 Credit risk (excluding counterparty credit risk) 337,841 334,449 336,419 27,028 2 Of which: standardised approach (SA) 23,398 23,427 24,069 1,872 3 Of which: foundation internal ratings-based (F-IRB) approach 32,220 33,220 31,670 2,578 4 Of which: supervisory slotting approach 12,832 11,130 11,477 1,027 5 Of which: advanced internal ratings-based (A-IRB) approach 269,391 266,672 269,203 21,551 6 Counterparty credit risk (CCR) 8,651 9,060 9,348 692 7 Of which: standardised approach for counterparty credit risk 7,744 8,017 8,475 619 9 Of which: other CCR 907 1,043 873 73 10 Credit valuation adjustment (CVA) 2,257 2,510 2,764 181 15 Settlement risk 20 11 11 2 16 Securitisation exposures in banking book 8,967 8,446 8,541 717 18 Of which: securitisation external ratings-based approach (SEC-ERBA) 3,968 3,532 3,489 317 19 Of which: securitisation standardised approach (SEC-SA) 4,999 4,914 5,052 400 20 Market risk 10,728 9,873 10,206 858 21 Of which: standardised approach (SA) 1,295 1,078 1,364 104 22 Of which: internal model approach (IMA) 9,433 8,795 8,842 754 AU20aa Interest rate risk in the banking book 38,663 37,290 29,021 3,093 24 Operational riskb 43,726 48,409 48,458 3,498 25 Amounts below the thresholds for deduction (subject to 250% risk weight) - - - - 26 Output floor applied 72.5% 72.5% 72.5% 27 Floor adjustment (before application of transitional cap) - - - 28 Floor adjustment (after application of transitional cap) 1,519 - - 29 Total (1 + 6 + 10 + 15 + 16 + 20 + AU20a + 24 + 25 + 28) 452,372 450,048 444,768 36,069 a. Line items with designations of AU are APRA's specific amendments. b. Prior period includes $500 million capital overlay (equivalent of $6.25 billion RWA) related to Court Enforceable Undertaking. |
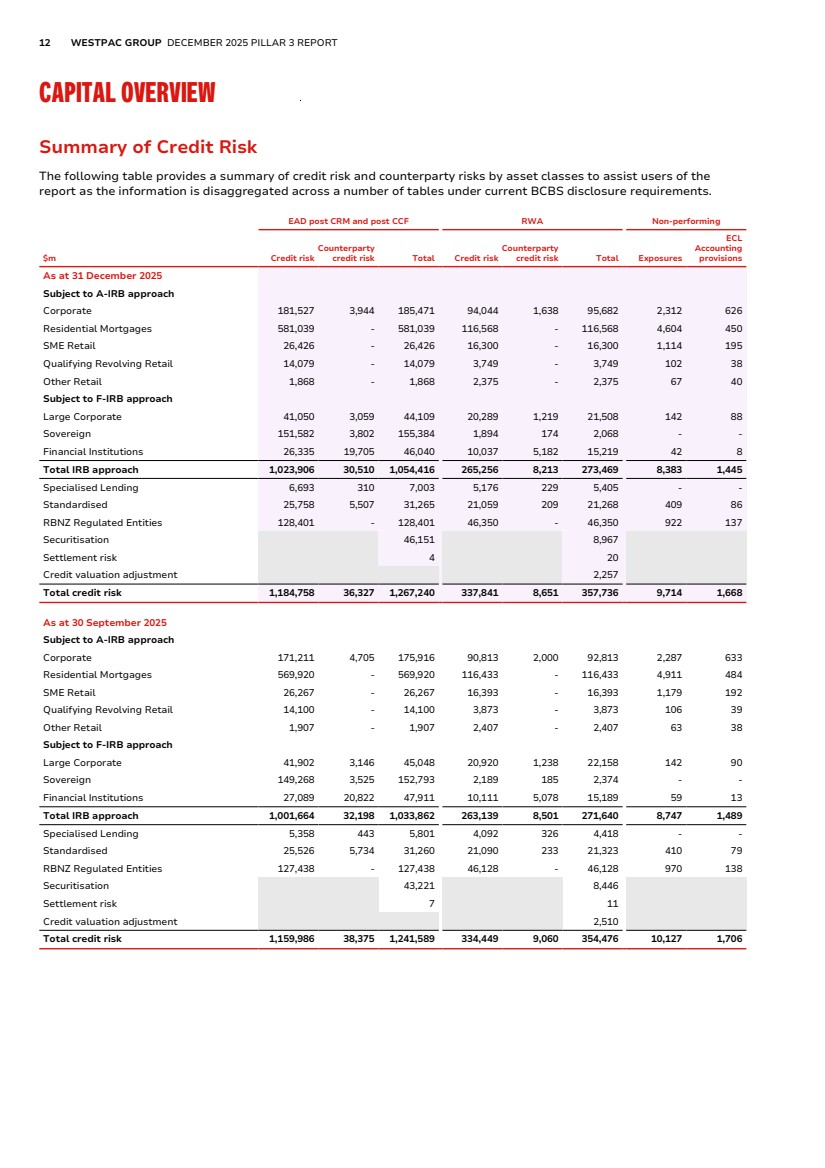
| 12 WESTPAC GROUP DECEMBER 2025 PILLAR 3 REPORT CAPITAL OVERVIEW Summary of Credit Risk Summary of Credit Risk The following table provides a summary of credit risk and counterparty risks by asset classes to assist users of the report as the information is disaggregated across a number of tables under current BCBS disclosure requirements. EAD post CRM and post CCF RWA Non-performing $m Credit risk Counterparty credit risk Total Credit risk Counterparty credit risk Total Exposures ECL Accounting provisions As at 31 December 2025 Subject to A-IRB approach Corporate 181,527 3,944 185,471 94,044 1,638 95,682 2,312 626 Residential Mortgages 581,039 - 581,039 116,568 - 116,568 4,604 450 SME Retail 26,426 - 26,426 16,300 - 16,300 1,114 195 Qualifying Revolving Retail 14,079 - 14,079 3,749 - 3,749 102 38 Other Retail 1,868 - 1,868 2,375 - 2,375 67 40 Subject to F-IRB approach Large Corporate 41,050 3,059 44,109 20,289 1,219 21,508 142 88 Sovereign 151,582 3,802 155,384 1,894 174 2,068 - - Financial Institutions 26,335 19,705 46,040 10,037 5,182 15,219 42 8 Total IRB approach 1,023,906 30,510 1,054,416 265,256 8,213 273,469 8,383 1,445 Specialised Lending 6,693 310 7,003 5,176 229 5,405 - - Standardised 25,758 5,507 31,265 21,059 209 21,268 409 86 RBNZ Regulated Entities 128,401 - 128,401 46,350 - 46,350 922 137 Securitisation 46,151 8,967 Settlement risk 4 20 Credit valuation adjustment 2,257 Total credit risk 1,184,758 36,327 1,267,240 337,841 8,651 357,736 9,714 1,668 As at 30 September 2025 Subject to A-IRB approach Corporate 171,211 4,705 175,916 90,813 2,000 92,813 2,287 633 Residential Mortgages 569,920 - 569,920 116,433 - 116,433 4,911 484 SME Retail 26,267 - 26,267 16,393 - 16,393 1,179 192 Qualifying Revolving Retail 14,100 - 14,100 3,873 - 3,873 106 39 Other Retail 1,907 - 1,907 2,407 - 2,407 63 38 Subject to F-IRB approach Large Corporate 41,902 3,146 45,048 20,920 1,238 22,158 142 90 Sovereign 149,268 3,525 152,793 2,189 185 2,374 - - Financial Institutions 27,089 20,822 47,911 10,111 5,078 15,189 59 13 Total IRB approach 1,001,664 32,198 1,033,862 263,139 8,501 271,640 8,747 1,489 Specialised Lending 5,358 443 5,801 4,092 326 4,418 - - Standardised 25,526 5,734 31,260 21,090 233 21,323 410 79 RBNZ Regulated Entities 127,438 - 127,438 46,128 - 46,128 970 138 Securitisation 43,221 8,446 Settlement risk 7 11 Credit valuation adjustment 2,510 Total credit risk 1,159,986 38,375 1,241,589 334,449 9,060 354,476 10,127 1,706 |
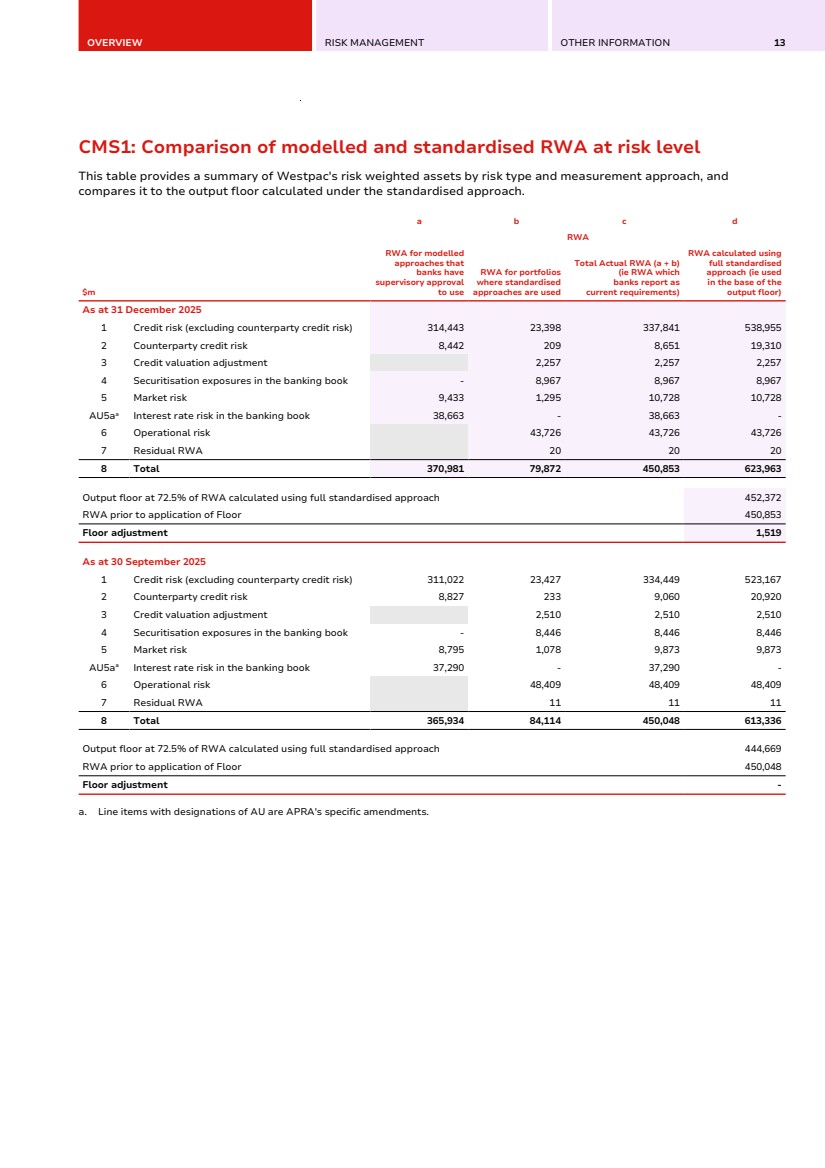
| OVERVIEW RISK MANAGEMENT OTHER INFORMATION 13 CMS1: Comparison of modelled and standardised RWA at risk level CMS1: Comparison of modelled and standardised RWA at risk level This table provides a summary of Westpac's risk weighted assets by risk type and measurement approach, and compares it to the output floor calculated under the standardised approach. $m a b c d RWA RWA for modelled approaches that banks have supervisory approval to use RWA for portfolios where standardised approaches are used Total Actual RWA (a + b) (ie RWA which banks report as current requirements) RWA calculated using full standardised approach (ie used in the base of the output floor) As at 31 December 2025 1 Credit risk (excluding counterparty credit risk) 314,443 23,398 337,841 538,955 2 Counterparty credit risk 8,442 209 8,651 19,310 3 Credit valuation adjustment 2,257 2,257 2,257 4 Securitisation exposures in the banking book - 8,967 8,967 8,967 5 Market risk 9,433 1,295 10,728 10,728 AU5aa Interest rate risk in the banking book 38,663 - 38,663 - 6 Operational risk 43,726 43,726 43,726 7 Residual RWA 20 20 20 8 Total 370,981 79,872 450,853 623,963 Output floor at 72.5% of RWA calculated using full standardised approach 452,372 RWA prior to application of Floor 450,853 Floor adjustment 1,519 As at 30 September 2025 1 Credit risk (excluding counterparty credit risk) 311,022 23,427 334,449 523,167 2 Counterparty credit risk 8,827 233 9,060 20,920 3 Credit valuation adjustment 2,510 2,510 2,510 4 Securitisation exposures in the banking book - 8,446 8,446 8,446 5 Market risk 8,795 1,078 9,873 9,873 AU5aa Interest rate risk in the banking book 37,290 - 37,290 - 6 Operational risk 48,409 48,409 48,409 7 Residual RWA 11 11 11 8 Total 365,934 84,114 450,048 613,336 Output floor at 72.5% of RWA calculated using full standardised approach 444,669 RWA prior to application of Floor 450,048 Floor adjustment - a. Line items with designations of AU are APRA's specific amendments. |
| 14 WESTPAC GROUP DECEMBER 2025 PILLAR 3 REPORT RISK MANAGEMENT CREDIT RISK MANAGEMENT CR8: RWA flow statements of credit risk exposures under IRB LEVERAGE RATIO LR2: Leverage ratio common disclosure template FUNDING AND LIQUIDITY RISK MANAGEMENT LIQ1: Liquidity Coverage Ratio |

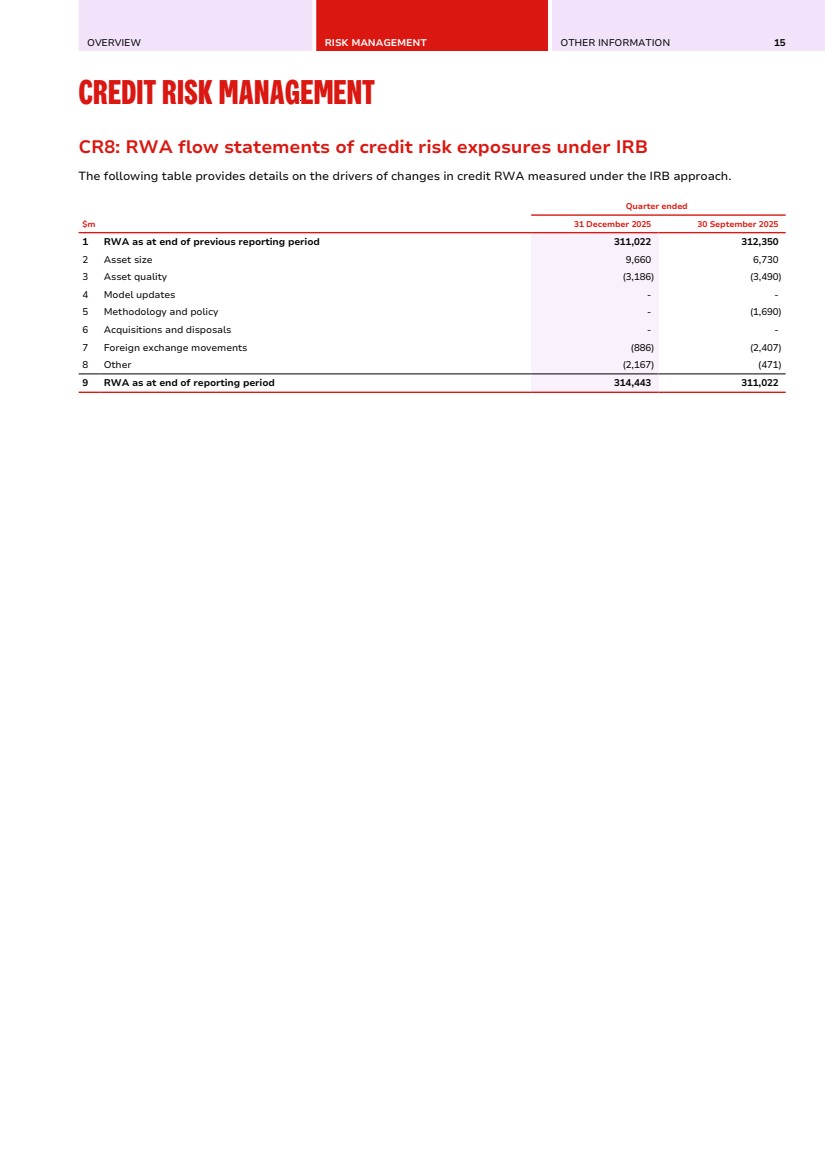
| OVERVIEW RISK MANAGEMENT OTHER INFORMATION 15 CREDIT RISK MANAGEMENT CR8: RWA flow statements of credit risk exposures under IRB Credit Risk Management CR8: RWA flow statements of credit risk exposures under IRB The following table provides details on the drivers of changes in credit RWA measured under the IRB approach. $m Quarter ended 31 December 2025 30 September 2025 1 RWA as at end of previous reporting period 311,022 312,350 2 Asset size 9,660 6,730 3 Asset quality (3,186) (3,490) 4 Model updates - - 5 Methodology and policy - (1,690) 6 Acquisitions and disposals - - 7 Foreign exchange movements (886) (2,407) 8 Other (2,167) (471) 9 RWA as at end of reporting period 314,443 311,022 |
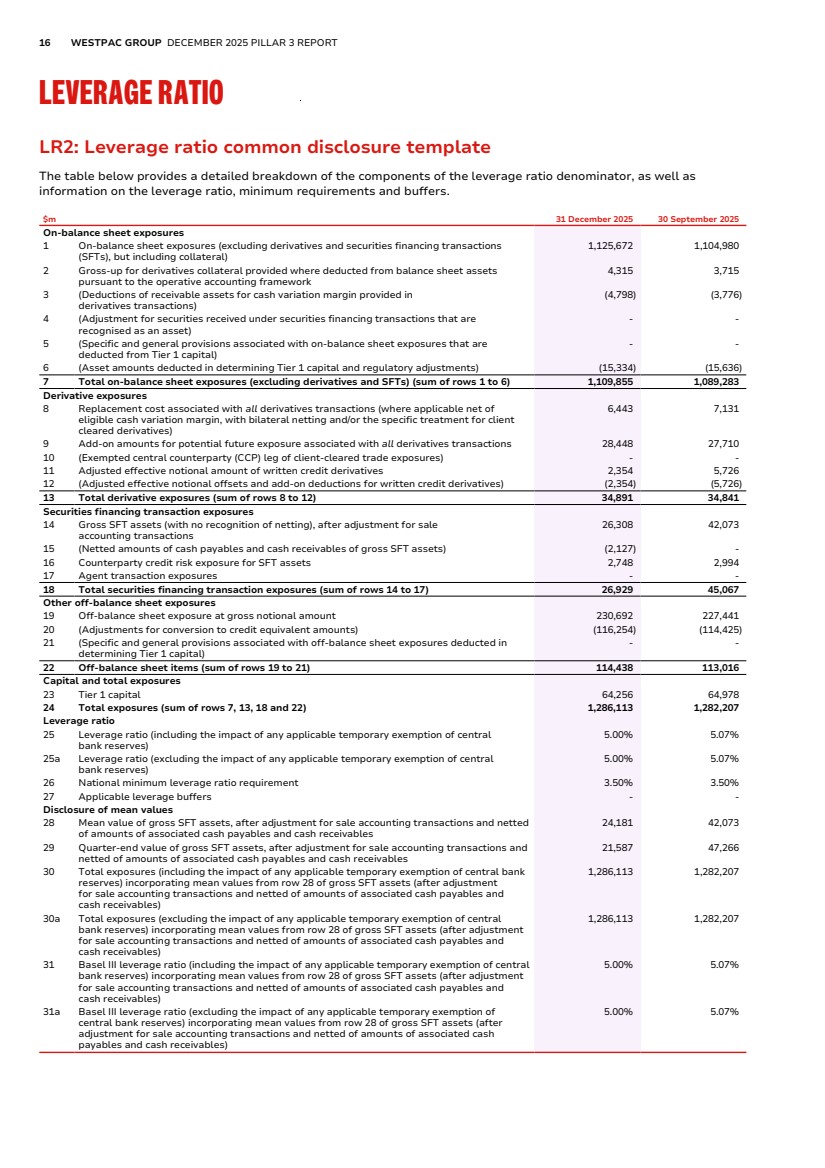
| 16 WESTPAC GROUP DECEMBER 2025 PILLAR 3 REPORT LEVERAGE RATIO LR2: Leverage ratio common disclosure template Leverage Ratio LR2: Leverage ratio common disclosure template The table below provides a detailed breakdown of the components of the leverage ratio denominator, as well as information on the leverage ratio, minimum requirements and buffers. $m 31 December 2025 30 September 2025 On-balance sheet exposures 1 On-balance sheet exposures (excluding derivatives and securities financing transactions (SFTs), but including collateral) 1,125,672 1,104,980 2 Gross-up for derivatives collateral provided where deducted from balance sheet assets pursuant to the operative accounting framework 4,315 3,715 3 (Deductions of receivable assets for cash variation margin provided in derivatives transactions) (4,798) (3,776) 4 (Adjustment for securities received under securities financing transactions that are recognised as an asset) - - 5 (Specific and general provisions associated with on-balance sheet exposures that are deducted from Tier 1 capital) - - 6 (Asset amounts deducted in determining Tier 1 capital and regulatory adjustments) (15,334) (15,636) 7 Total on-balance sheet exposures (excluding derivatives and SFTs) (sum of rows 1 to 6) 1,109,855 1,089,283 Derivative exposures 8 Replacement cost associated with all derivatives transactions (where applicable net of eligible cash variation margin, with bilateral netting and/or the specific treatment for client cleared derivatives) 6,443 7,131 9 Add-on amounts for potential future exposure associated with all derivatives transactions 28,448 27,710 10 (Exempted central counterparty (CCP) leg of client-cleared trade exposures) - - 11 Adjusted effective notional amount of written credit derivatives 2,354 5,726 12 (Adjusted effective notional offsets and add-on deductions for written credit derivatives) (2,354) (5,726) 13 Total derivative exposures (sum of rows 8 to 12) 34,891 34,841 Securities financing transaction exposures 14 Gross SFT assets (with no recognition of netting), after adjustment for sale accounting transactions 26,308 42,073 15 (Netted amounts of cash payables and cash receivables of gross SFT assets) (2,127) - 16 Counterparty credit risk exposure for SFT assets 2,748 2,994 17 Agent transaction exposures - - 18 Total securities financing transaction exposures (sum of rows 14 to 17) 26,929 45,067 Other off-balance sheet exposures 19 Off-balance sheet exposure at gross notional amount 230,692 227,441 20 (Adjustments for conversion to credit equivalent amounts) (116,254) (114,425) 21 (Specific and general provisions associated with off-balance sheet exposures deducted in determining Tier 1 capital) - - 22 Off-balance sheet items (sum of rows 19 to 21) 114,438 113,016 Capital and total exposures 23 Tier 1 capital 64,256 64,978 24 Total exposures (sum of rows 7, 13, 18 and 22) 1,286,113 1,282,207 Leverage ratio 25 Leverage ratio (including the impact of any applicable temporary exemption of central bank reserves) 5.00% 5.07% 25a Leverage ratio (excluding the impact of any applicable temporary exemption of central bank reserves) 5.00% 5.07% 26 National minimum leverage ratio requirement 3.50% 3.50% 27 Applicable leverage buffers - - Disclosure of mean values 28 Mean value of gross SFT assets, after adjustment for sale accounting transactions and netted of amounts of associated cash payables and cash receivables 24,181 42,073 29 Quarter-end value of gross SFT assets, after adjustment for sale accounting transactions and netted of amounts of associated cash payables and cash receivables 21,587 47,266 30 Total exposures (including the impact of any applicable temporary exemption of central bank reserves) incorporating mean values from row 28 of gross SFT assets (after adjustment for sale accounting transactions and netted of amounts of associated cash payables and cash receivables) 1,286,113 1,282,207 30a Total exposures (excluding the impact of any applicable temporary exemption of central bank reserves) incorporating mean values from row 28 of gross SFT assets (after adjustment for sale accounting transactions and netted of amounts of associated cash payables and cash receivables) 1,286,113 1,282,207 31 Basel III leverage ratio (including the impact of any applicable temporary exemption of central bank reserves) incorporating mean values from row 28 of gross SFT assets (after adjustment for sale accounting transactions and netted of amounts of associated cash payables and cash receivables) 5.00% 5.07% 31a Basel III leverage ratio (excluding the impact of any applicable temporary exemption of central bank reserves) incorporating mean values from row 28 of gross SFT assets (after adjustment for sale accounting transactions and netted of amounts of associated cash payables and cash receivables) 5.00% 5.07% |
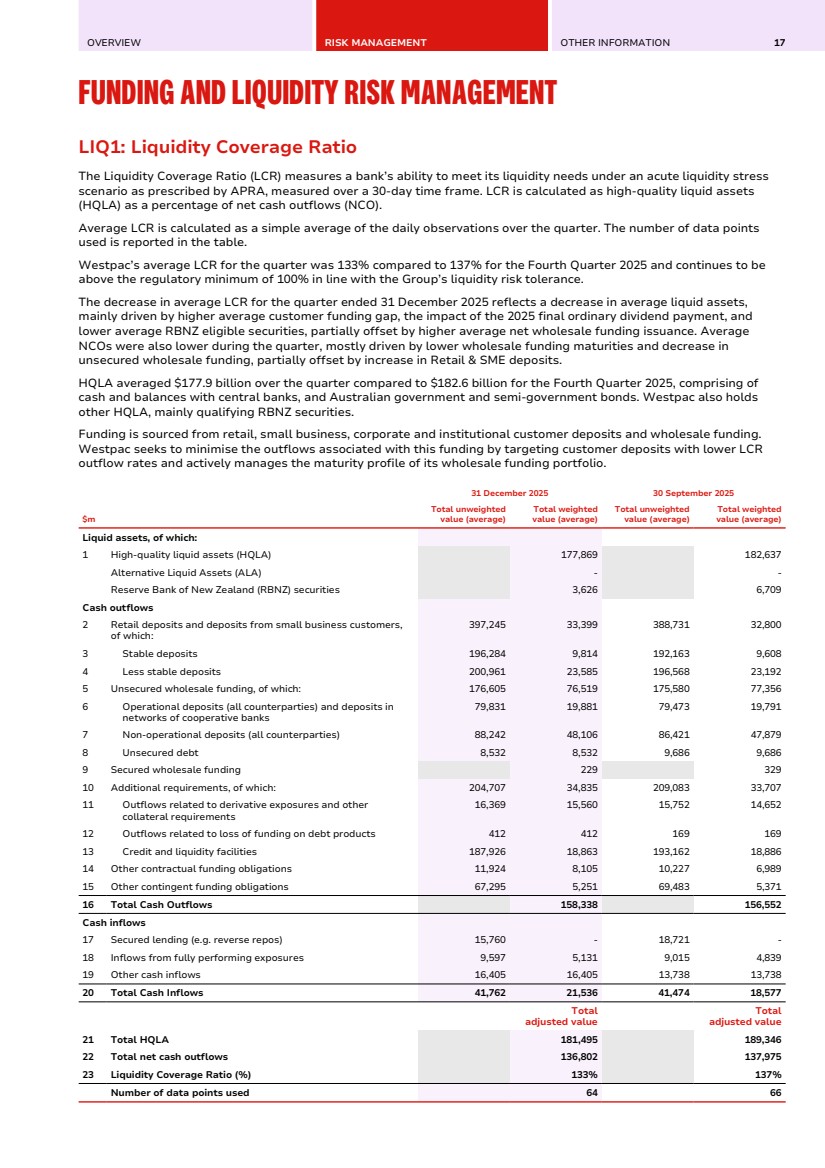
| OVERVIEW RISK MANAGEMENT OTHER INFORMATION 17 FUNDING AND LIQUIDITY RISK MANAGEMENT LIQ1: Liquidity Coverage Ratio Funding and Liquidity Risk Management LIQ1: Liquidity Coverage Ratio The Liquidity Coverage Ratio (LCR) measures a bank’s ability to meet its liquidity needs under an acute liquidity stress scenario as prescribed by APRA, measured over a 30-day time frame. LCR is calculated as high-quality liquid assets (HQLA) as a percentage of net cash outflows (NCO). Average LCR is calculated as a simple average of the daily observations over the quarter. The number of data points used is reported in the table. Westpac’s average LCR for the quarter was 133% compared to 137% for the Fourth Quarter 2025 and continues to be above the regulatory minimum of 100% in line with the Group’s liquidity risk tolerance. The decrease in average LCR for the quarter ended 31 December 2025 reflects a decrease in average liquid assets, mainly driven by higher average customer funding gap, the impact of the 2025 final ordinary dividend payment, and lower average RBNZ eligible securities, partially offset by higher average net wholesale funding issuance. Average NCOs were also lower during the quarter, mostly driven by lower wholesale funding maturities and decrease in unsecured wholesale funding, partially offset by increase in Retail & SME deposits. HQLA averaged $177.9 billion over the quarter compared to $182.6 billion for the Fourth Quarter 2025, comprising of cash and balances with central banks, and Australian government and semi-government bonds. Westpac also holds other HQLA, mainly qualifying RBNZ securities. Funding is sourced from retail, small business, corporate and institutional customer deposits and wholesale funding. Westpac seeks to minimise the outflows associated with this funding by targeting customer deposits with lower LCR outflow rates and actively manages the maturity profile of its wholesale funding portfolio. 31 December 2025 30 September 2025 $m Total unweighted value (average) Total weighted value (average) Total unweighted value (average) Total weighted value (average) Liquid assets, of which: 1 High-quality liquid assets (HQLA) 177,869 182,637 Alternative Liquid Assets (ALA) - - Reserve Bank of New Zealand (RBNZ) securities 3,626 6,709 Cash outflows 2 Retail deposits and deposits from small business customers, of which: 397,245 33,399 388,731 32,800 3 Stable deposits 196,284 9,814 192,163 9,608 4 Less stable deposits 200,961 23,585 196,568 23,192 5 Unsecured wholesale funding, of which: 176,605 76,519 175,580 77,356 6 Operational deposits (all counterparties) and deposits in networks of cooperative banks 79,831 19,881 79,473 19,791 7 Non-operational deposits (all counterparties) 88,242 48,106 86,421 47,879 8 Unsecured debt 8,532 8,532 9,686 9,686 9 Secured wholesale funding 229 329 10 Additional requirements, of which: 204,707 34,835 209,083 33,707 11 Outflows related to derivative exposures and other collateral requirements 16,369 15,560 15,752 14,652 12 Outflows related to loss of funding on debt products 412 412 169 169 13 Credit and liquidity facilities 187,926 18,863 193,162 18,886 14 Other contractual funding obligations 11,924 8,105 10,227 6,989 15 Other contingent funding obligations 67,295 5,251 69,483 5,371 16 Total Cash Outflows 158,338 156,552 Cash inflows 17 Secured lending (e.g. reverse repos) 15,760 - 18,721 - 18 Inflows from fully performing exposures 9,597 5,131 9,015 4,839 19 Other cash inflows 16,405 16,405 13,738 13,738 20 Total Cash Inflows 41,762 21,536 41,474 18,577 Total adjusted value Total adjusted value 21 Total HQLA 181,495 189,346 22 Total net cash outflows 136,802 137,975 23 Liquidity Coverage Ratio (%) 133% 137% Number of data points used 64 66 |
| 18 WESTPAC GROUP DECEMBER 2025 PILLAR 3 REPORT OTHER INFORMATION MANAGEMENT'S DECLARATION APPENDICES Appendix I – Regulatory capital instruments GLOSSARY DISCLOSURE REGARDING FORWARD-LOOKING STATEMENTS |

| OVERVIEW RISK MANAGEMENT OTHER INFORMATION 19 MANAGEMENT'S DECLARATION Management's Declaration I hereby certify that the information set out in the December 2025 Pillar 3 report has been prepared in accordance with Westpac's disclosure policy and complies with the requirements of the Australian Prudential Standards, APS 330 Public Disclosure. Nathan Goonan Chief Financial Officer Sydney 12 February 2026 |
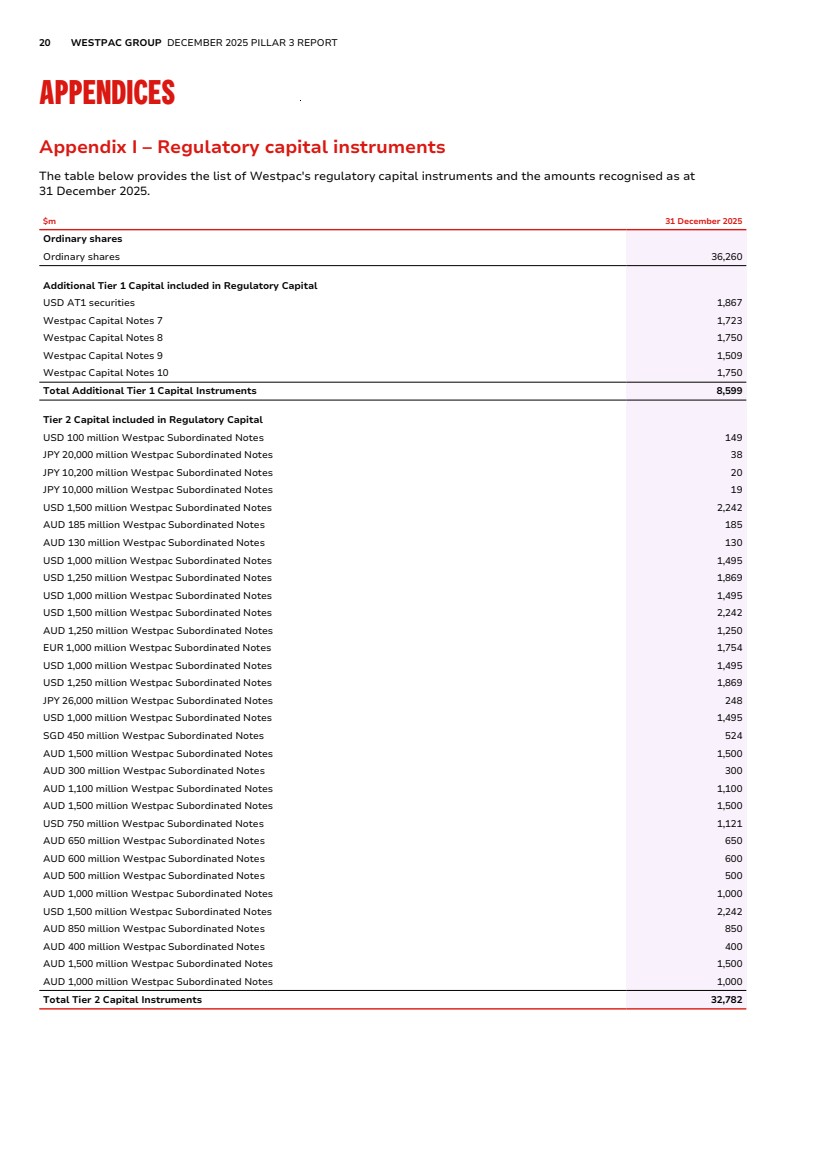
| 20 WESTPAC GROUP DECEMBER 2025 PILLAR 3 REPORT APPENDICES Appendix I – Regulatory capital instruments Appendices Appendix I – Regulatory capital instruments The table below provides the list of Westpac's regulatory capital instruments and the amounts recognised as at 31 December 2025. $m 31 December 2025 Ordinary shares Ordinary shares 36,260 Additional Tier 1 Capital included in Regulatory Capital USD AT1 securities 1,867 Westpac Capital Notes 7 1,723 Westpac Capital Notes 8 1,750 Westpac Capital Notes 9 1,509 Westpac Capital Notes 10 1,750 Total Additional Tier 1 Capital Instruments 8,599 Tier 2 Capital included in Regulatory Capital USD 100 million Westpac Subordinated Notes 149 JPY 20,000 million Westpac Subordinated Notes 38 JPY 10,200 million Westpac Subordinated Notes 20 JPY 10,000 million Westpac Subordinated Notes 19 USD 1,500 million Westpac Subordinated Notes 2,242 AUD 185 million Westpac Subordinated Notes 185 AUD 130 million Westpac Subordinated Notes 130 USD 1,000 million Westpac Subordinated Notes 1,495 USD 1,250 million Westpac Subordinated Notes 1,869 USD 1,000 million Westpac Subordinated Notes 1,495 USD 1,500 million Westpac Subordinated Notes 2,242 AUD 1,250 million Westpac Subordinated Notes 1,250 EUR 1,000 million Westpac Subordinated Notes 1,754 USD 1,000 million Westpac Subordinated Notes 1,495 USD 1,250 million Westpac Subordinated Notes 1,869 JPY 26,000 million Westpac Subordinated Notes 248 USD 1,000 million Westpac Subordinated Notes 1,495 SGD 450 million Westpac Subordinated Notes 524 AUD 1,500 million Westpac Subordinated Notes 1,500 AUD 300 million Westpac Subordinated Notes 300 AUD 1,100 million Westpac Subordinated Notes 1,100 AUD 1,500 million Westpac Subordinated Notes 1,500 USD 750 million Westpac Subordinated Notes 1,121 AUD 650 million Westpac Subordinated Notes 650 AUD 600 million Westpac Subordinated Notes 600 AUD 500 million Westpac Subordinated Notes 500 AUD 1,000 million Westpac Subordinated Notes 1,000 USD 1,500 million Westpac Subordinated Notes 2,242 AUD 850 million Westpac Subordinated Notes 850 AUD 400 million Westpac Subordinated Notes 400 AUD 1,500 million Westpac Subordinated Notes 1,500 AUD 1,000 million Westpac Subordinated Notes 1,000 Total Tier 2 Capital Instruments 32,782 |
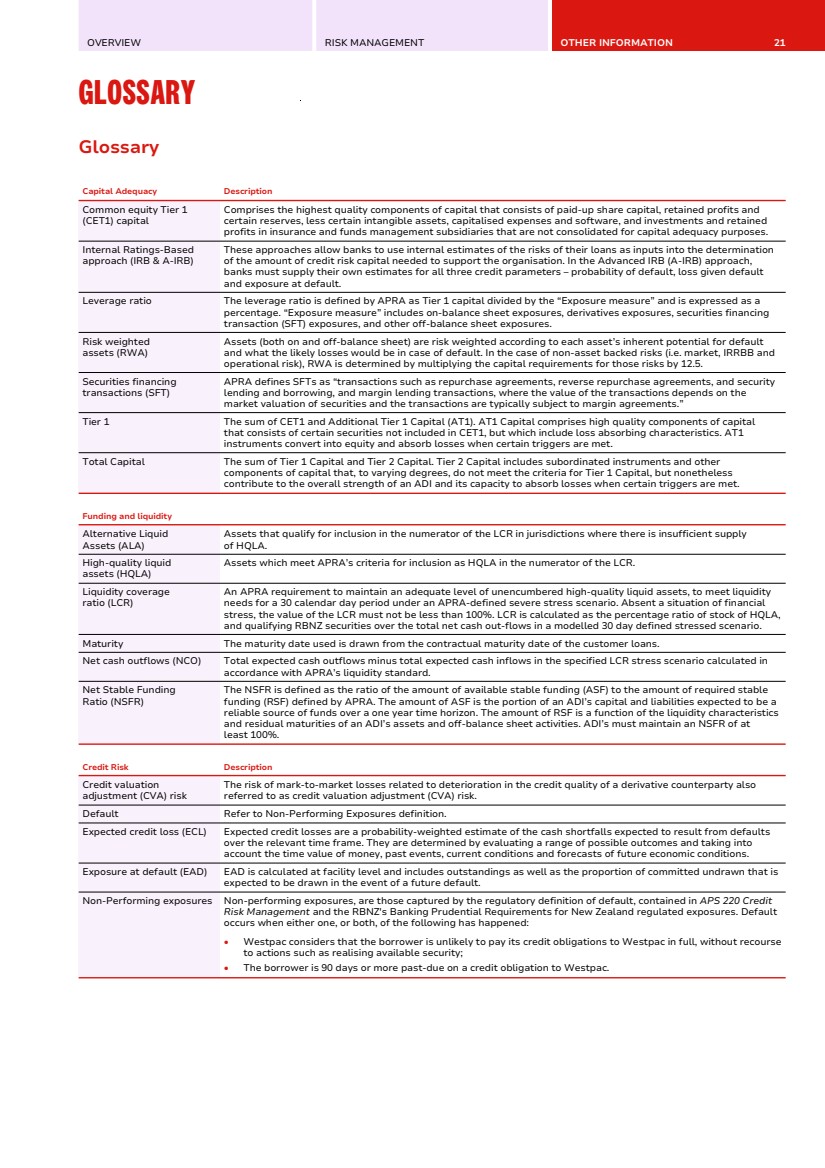
| OVERVIEW RISK MANAGEMENT OTHER INFORMATION 21 GLOSSARY Glossary Glossary Capital Adequacy Description Common equity Tier 1 (CET1) capital Comprises the highest quality components of capital that consists of paid-up share capital, retained profits and certain reserves, less certain intangible assets, capitalised expenses and software, and investments and retained profits in insurance and funds management subsidiaries that are not consolidated for capital adequacy purposes. Internal Ratings-Based approach (IRB & A-IRB) These approaches allow banks to use internal estimates of the risks of their loans as inputs into the determination of the amount of credit risk capital needed to support the organisation. In the Advanced IRB (A-IRB) approach, banks must supply their own estimates for all three credit parameters – probability of default, loss given default and exposure at default. Leverage ratio The leverage ratio is defined by APRA as Tier 1 capital divided by the “Exposure measure” and is expressed as a percentage. “Exposure measure” includes on-balance sheet exposures, derivatives exposures, securities financing transaction (SFT) exposures, and other off-balance sheet exposures. Risk weighted assets (RWA) Assets (both on and off-balance sheet) are risk weighted according to each asset’s inherent potential for default and what the likely losses would be in case of default. In the case of non-asset backed risks (i.e. market, IRRBB and operational risk), RWA is determined by multiplying the capital requirements for those risks by 12.5. Securities financing transactions (SFT) APRA defines SFTs as “transactions such as repurchase agreements, reverse repurchase agreements, and security lending and borrowing, and margin lending transactions, where the value of the transactions depends on the market valuation of securities and the transactions are typically subject to margin agreements.” Tier 1 The sum of CET1 and Additional Tier 1 Capital (AT1). AT1 Capital comprises high quality components of capital that consists of certain securities not included in CET1, but which include loss absorbing characteristics. AT1 instruments convert into equity and absorb losses when certain triggers are met. Total Capital The sum of Tier 1 Capital and Tier 2 Capital. Tier 2 Capital includes subordinated instruments and other components of capital that, to varying degrees, do not meet the criteria for Tier 1 Capital, but nonetheless contribute to the overall strength of an ADI and its capacity to absorb losses when certain triggers are met. Funding and liquidity Alternative Liquid Assets (ALA) Assets that qualify for inclusion in the numerator of the LCR in jurisdictions where there is insufficient supply of HQLA. High-quality liquid assets (HQLA) Assets which meet APRA’s criteria for inclusion as HQLA in the numerator of the LCR. Liquidity coverage ratio (LCR) An APRA requirement to maintain an adequate level of unencumbered high-quality liquid assets, to meet liquidity needs for a 30 calendar day period under an APRA-defined severe stress scenario. Absent a situation of financial stress, the value of the LCR must not be less than 100%. LCR is calculated as the percentage ratio of stock of HQLA, and qualifying RBNZ securities over the total net cash out-flows in a modelled 30 day defined stressed scenario. Maturity The maturity date used is drawn from the contractual maturity date of the customer loans. Net cash outflows (NCO) Total expected cash outflows minus total expected cash inflows in the specified LCR stress scenario calculated in accordance with APRA’s liquidity standard. Net Stable Funding Ratio (NSFR) The NSFR is defined as the ratio of the amount of available stable funding (ASF) to the amount of required stable funding (RSF) defined by APRA. The amount of ASF is the portion of an ADI’s capital and liabilities expected to be a reliable source of funds over a one year time horizon. The amount of RSF is a function of the liquidity characteristics and residual maturities of an ADI’s assets and off-balance sheet activities. ADI’s must maintain an NSFR of at least 100%. Credit Risk Description Credit valuation adjustment (CVA) risk The risk of mark-to-market losses related to deterioration in the credit quality of a derivative counterparty also referred to as credit valuation adjustment (CVA) risk. Default Refer to Non-Performing Exposures definition. Expected credit loss (ECL) Expected credit losses are a probability-weighted estimate of the cash shortfalls expected to result from defaults over the relevant time frame. They are determined by evaluating a range of possible outcomes and taking into account the time value of money, past events, current conditions and forecasts of future economic conditions. Exposure at default (EAD) EAD is calculated at facility level and includes outstandings as well as the proportion of committed undrawn that is expected to be drawn in the event of a future default. Non-Performing exposures Non-performing exposures, are those captured by the regulatory definition of default, contained in APS 220 Credit Risk Management and the RBNZ's Banking Prudential Requirements for New Zealand regulated exposures. Default occurs when either one, or both, of the following has happened: • Westpac considers that the borrower is unlikely to pay its credit obligations to Westpac in full, without recourse to actions such as realising available security; • The borrower is 90 days or more past-due on a credit obligation to Westpac. |
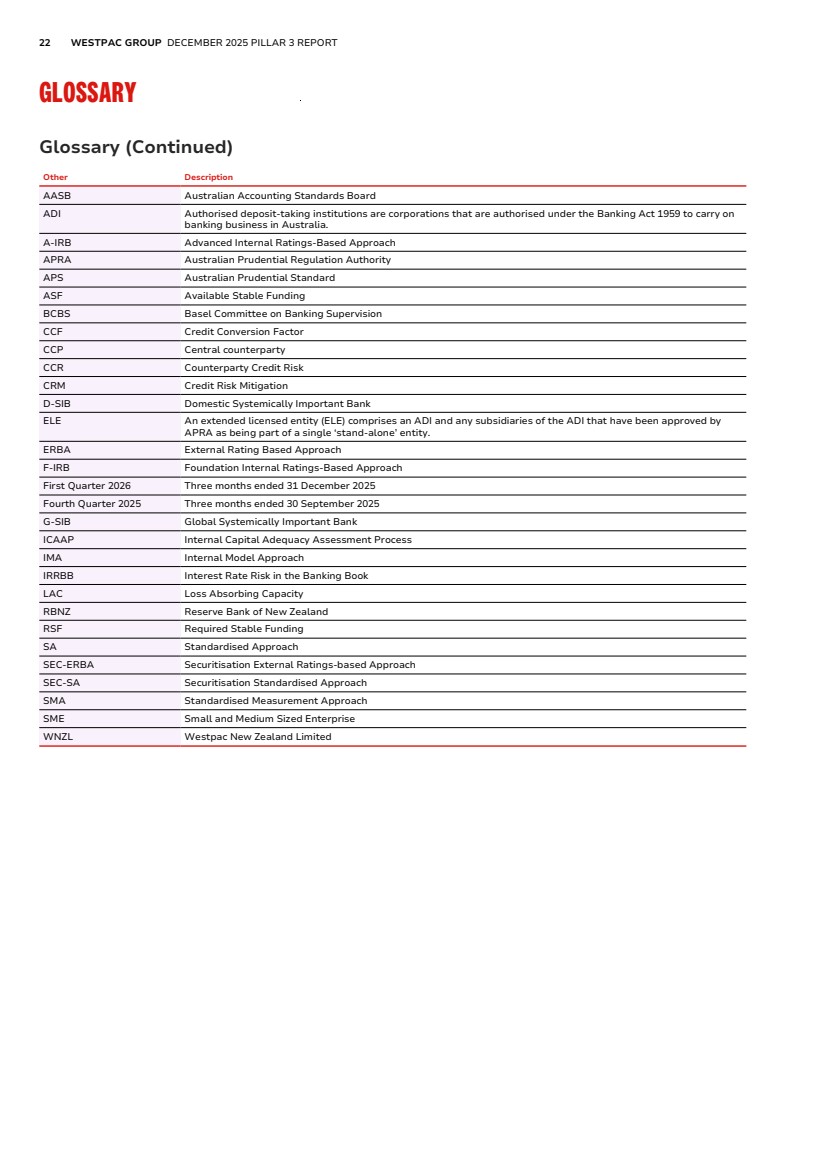
| 22 WESTPAC GROUP DECEMBER 2025 PILLAR 3 REPORT GLOSSARY Glossary (Continued) Other Description AASB Australian Accounting Standards Board ADI Authorised deposit-taking institutions are corporations that are authorised under the Banking Act 1959 to carry on banking business in Australia. A-IRB Advanced Internal Ratings-Based Approach APRA Australian Prudential Regulation Authority APS Australian Prudential Standard ASF Available Stable Funding BCBS Basel Committee on Banking Supervision CCF Credit Conversion Factor CCP Central counterparty CCR Counterparty Credit Risk CRM Credit Risk Mitigation D-SIB Domestic Systemically Important Bank ELE An extended licensed entity (ELE) comprises an ADI and any subsidiaries of the ADI that have been approved by APRA as being part of a single ‘stand-alone’ entity. ERBA External Rating Based Approach F-IRB Foundation Internal Ratings-Based Approach First Quarter 2026 Three months ended 31 December 2025 Fourth Quarter 2025 Three months ended 30 September 2025 G-SIB Global Systemically Important Bank ICAAP Internal Capital Adequacy Assessment Process IMA Internal Model Approach IRRBB Interest Rate Risk in the Banking Book LAC Loss Absorbing Capacity RBNZ Reserve Bank of New Zealand RSF Required Stable Funding SA Standardised Approach SEC-ERBA Securitisation External Ratings-based Approach SEC-SA Securitisation Standardised Approach SMA Standardised Measurement Approach SME Small and Medium Sized Enterprise WNZL Westpac New Zealand Limited |
| OVERVIEW RISK MANAGEMENT OTHER INFORMATION 23 DISCLOSURE REGARDING FORWARD-LOOKING STATEMENTS Disclosure regarding forward-Looking statements Disclosure regarding forward-looking statements Disclosure regarding forward-Looking statements The information contained in this report contains statements that constitute “forward-looking statements” within the meaning of section 21E of the U.S. Securities Exchange Act of 1934. Forward-looking statements are statements that are not historical facts. Forward-looking statements appear in a number of places in this report and include statements regarding Westpac’s current intent, belief or expectations with respect to its business and operations, macro and micro economic and market conditions, results of operations and financial condition and performance, capital adequacy and liquidity and risk management, including, without limitation, future loan loss provisions and financial support to certain borrowers, forecasted economic indicators and performance metric outcomes, indicative drivers, climate- and other sustainability-related statements, commitments, targets, projections and metrics, and other estimated and proxy data. Words such as ‘will’, ‘may’, ‘expect’, ‘intend’, ‘seek’, ‘would’, ‘should’, ‘could’, ‘continue’, ‘plan’, ‘estimate’, ‘anticipate’, ‘believe’, ‘probability’, ‘indicative’, ‘risk’, ‘aim’, ‘outlook’, ‘forecast’, ‘f’cast’, ‘f’, ‘assumption’, ‘projection’, ‘target,’ goal’, ‘guidance’, 'objective', ‘ambition’ or other similar words, are used to identify forward-looking statements. These statements reflect Westpac’s current views on future events and are subject to change, certain known and unknown risks, uncertainties and assumptions and other factors which are, in many instances, beyond Westpac’s control (and the control of Westpac’s officers, employees, agents, and advisors), and have been made based on management’s and/or the Board's current expectations or beliefs concerning future developments and their potential effect upon Westpac. Forward-looking statements may also be made, verbally or in writing, by members of Westpac’s management or Board in connection with this report. Such statements are subject to the same limitations, uncertainties, assumptions and disclaimers set out in this report. There can be no assurance that future developments or performance will align with Westpac’s expectations or that the effect of future developments on Westpac will be those anticipated. Actual results could differ materially from those Westpac expects or which are expressed or implied in forward-looking statements, depending on various factors including, but not limited to, those described in the risk factors in Westpac’s 2025 Risk Factors. When relying on forward-looking statements to make decisions with respect to Westpac, investors and others relying on information in this report should carefully consider such factors and other uncertainties and events. Except as required by law, Westpac assumes no obligation to revise or update any forward-looking statements in this report, whether from new information, future events, conditions or otherwise, after the date of this report. |

| WESTPAC.COM.AU |