.3 Second Quarter 2026 Financial Results Presentation July 22, 2026 Quarterly Earnings Report
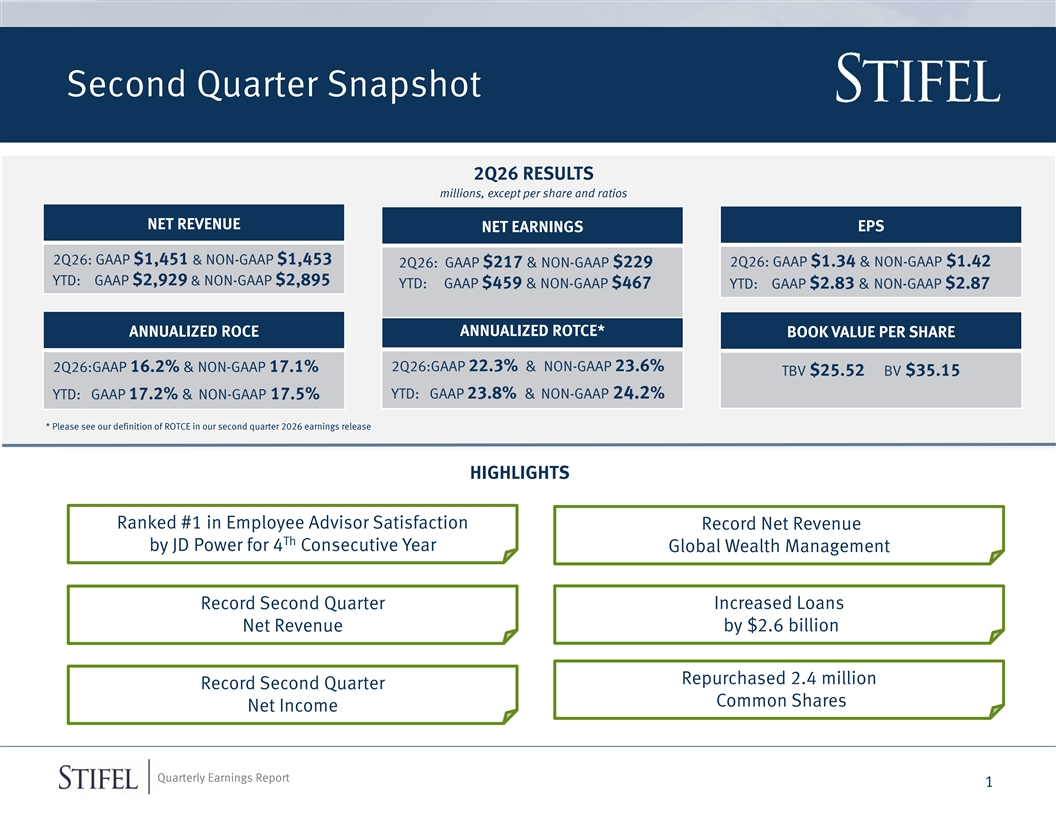
Second Quarter Snapshot 2Q26 RESULTS millions, except per share and ratios NET REVENUE NET EARNINGS EPS 2Q26: GAAP $1,451 & NON-GAAP $1,453 2Q26: GAAP $1.34 & NON-GAAP $1.42 2Q26: GAAP $217 & NON-GAAP $229 YTD: GAAP $2,929 & NON-GAAP $2,895 YTD: GAAP $459 & NON-GAAP $467 YTD: GAAP $2.83 & NON-GAAP $2.87 ANNUALIZED ROTCE* ANNUALIZED ROCE BOOK VALUE PER SHARE 2Q26:GAAP 16.2% & NON-GAAP 17.1% 2Q26:GAAP 22.3% & NON-GAAP 23.6% TBV $25.52 BV $35.15 YTD: GAAP 23.8% & NON-GAAP 24.2% YTD: GAAP 17.2% & NON-GAAP 17.5% * Please see our definition of ROTCE in our second quarter 2026 earnings release HIGHLIGHTS Ranked #1 in Employee Advisor Satisfaction Record Net Revenue Th by JD Power for 4 Consecutive Year Global Wealth Management Record Second Quarter Increased Loans Net Revenue by $2.6 billion Repurchased 2.4 million Record Second Quarter Common Shares Net Income Quarterly Earnings Report 1
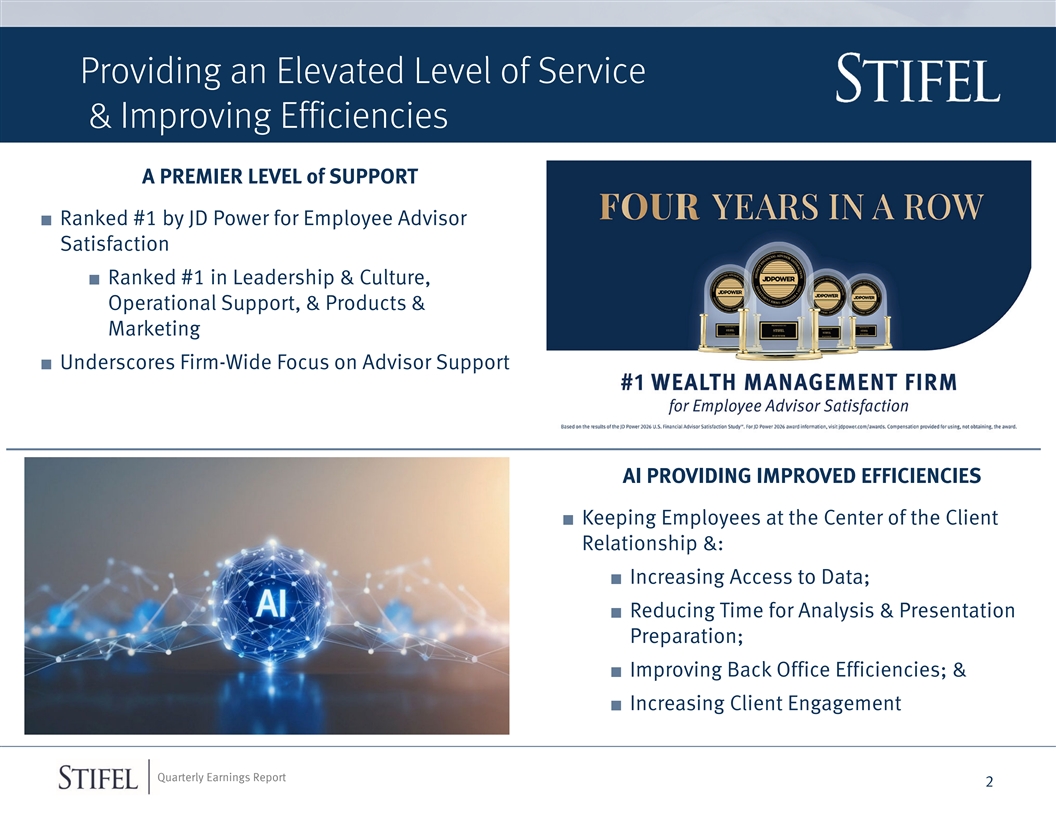
Providing an Elevated Level of Service & Improving Efficiencies A PREMIER LEVEL of SUPPORT ■ Ranked #1 by JD Power for Employee Advisor Satisfaction ■ Ranked #1 in Leadership & Culture, Operational Support, & Products & Marketing ■ Underscores Firm-Wide Focus on Advisor Support AI PROVIDING IMPROVED EFFICIENCIES ■ Keeping Employees at the Center of the Client Relationship &: ■ Increasing Access to Data; ■ Reducing Time for Analysis & Presentation Preparation; ■ Improving Back Office Efficiencies; & ■ Increasing Client Engagement Quarterly Earnings Report 2
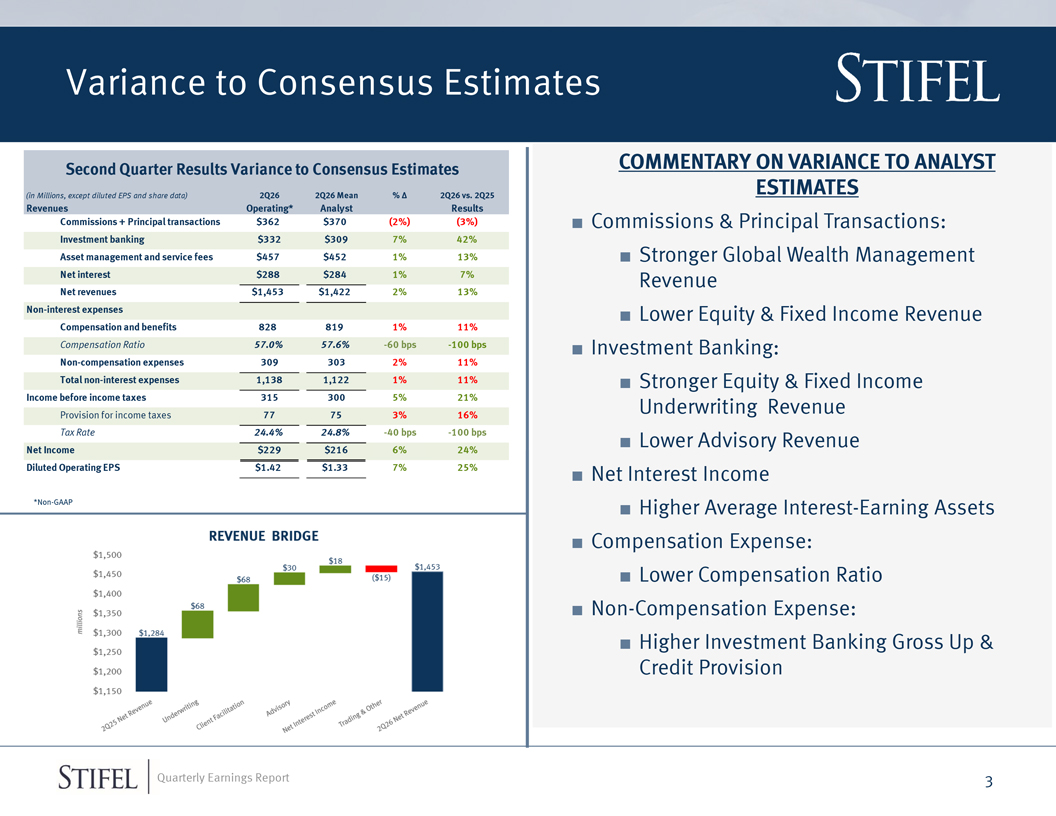
Variance to Consensus Estimates COMMENTARY ON VARIANCE TO ANALYST Second Quarter Results Variance to Consensus Estimates ESTIMATES (in Millions, except diluted EPS and share data) 2Q26 2Q26 Mean % ∆ 2Q26 vs. 2Q25 Revenues Operating* Analyst Results Commissions + Principal transactions $362 $370 (2%) (3%) ■ Commissions & Principal Transactions: Investment banking $332 $309 7% 42% Asset management and service fees $457 $452 1% 13%■ Stronger Global Wealth Management Net interest $288 $284 1% 7% Revenue Net revenues $1,453 $1,422 2% 13% Non-interest expenses ■ Lower Equity & Fixed Income Revenue Compensation and benefits 828 819 1% 11% Compensation Ratio 57.0% 57.6% -60 bps -100 bps ■ Investment Banking: Non-compensation expenses 309 303 2% 11% Total non-interest expenses 1,138 1,122 1% 11% ■ Stronger Equity & Fixed Income Income before income taxes 315 300 5% 21% Underwriting Revenue Provision for income taxes 77 75 3% 16% Tax Rate 24.4% 24.8% -40 bps -100 bps ■ Lower Advisory Revenue Net Income $229 $216 6% 24% Diluted Operating EPS $1.42 $1.33 7% 25% ■ Net Interest Income *Non-GAAP ■ Higher Average Interest-Earning Assets * Impact of Legal Reserves calculated as legal reserves of $67 million, an adjusted tax rate of 25%, divided by the diluted ■ Compensation Expense: average share count. ■ Lower Compensation Ratio ■ Non-Compensation Expense: ■ Higher Investment Banking Gross Up & Credit Provision Quarterly Earnings Report 3
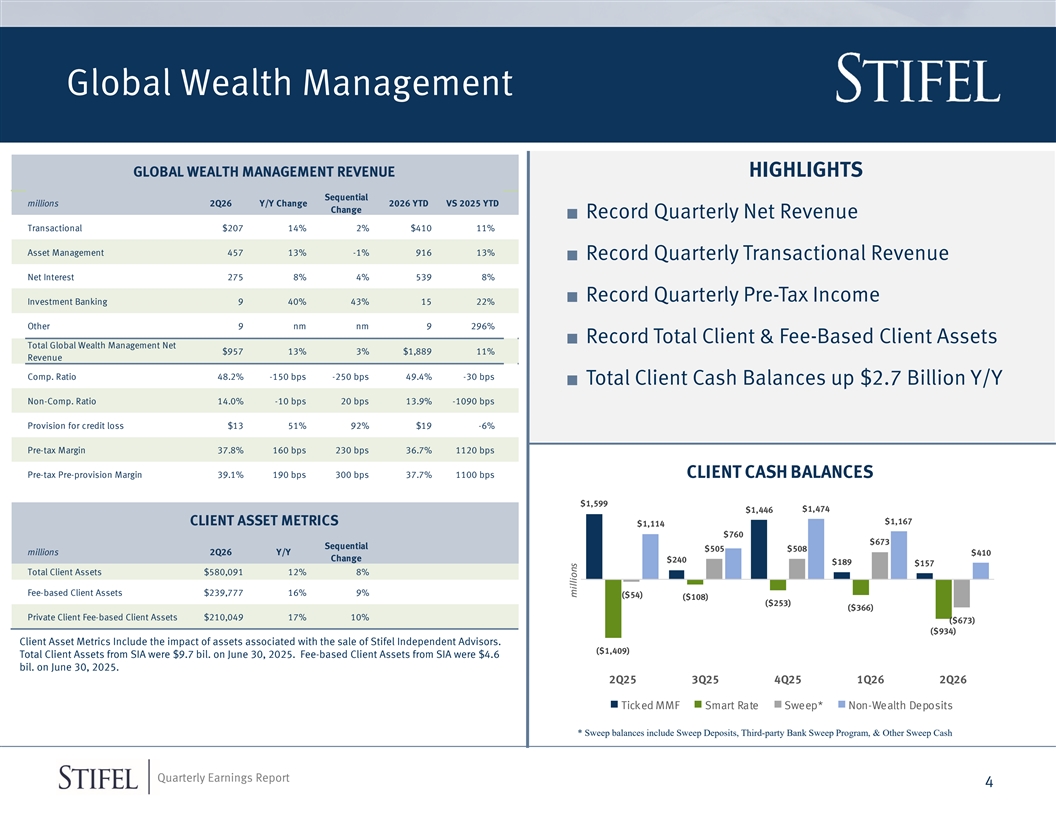
Global Wealth Management GLOBAL WEALTH MANAGEMENT REVENUE HIGHLIGHTS Sequential millions 2Q26 Y/Y Change 2026 YTD VS 2025 YTD Change ■ Record Quarterly Net Revenue Transactional $207 14% 2% $410 11% Asset Management 457 13% -1% 916 13% ■ Record Quarterly Transactional Revenue Net Interest 275 8% 4% 539 8% ■ Record Quarterly Pre-Tax Income Investment Banking 9 40% 43% 15 22% Other 9 nm nm 9 296% ■ Record Total Client & Fee-Based Client Assets Total Global Wealth Management Net $957 13% 3% $1,889 11% Revenue Comp. Ratio 48.2% -150 bps -250 bps 49.4% -30 bps ■ Total Client Cash Balances up $2.7 Billion Y/Y Non-Comp. Ratio 14.0% -10 bps 20 bps 13.9% -1090 bps Provision for credit loss $13 51% 92% $19 -6% Pre-tax Margin 37.8% 160 bps 230 bps 36.7% 1120 bps Pre-tax Pre-provision Margin 39.1% 190 bps 300 bps 37.7% 1100 bps CLIENT CASH BALANCES $1,599 $1,474 $1,446 $1,167 CLIENT ASSET METRICS $1,114 $760 $673 Sequential $505 $508 millions 2Q26 Y/Y $410 Change $240 $189 $157 Total Client Assets $580,091 12% 8% Fee-based Client Assets $239,777 16% 9% ($54) ($108) ($253) ($366) Private Client Fee-based Client Assets $210,049 17% 10% ($673) ($934) Client Asset Metrics Include the impact of assets associated with the sale of Stifel Independent Advisors. ($1,409) Total Client Assets from SIA were $9.7 bil. on June 30, 2025. Fee-based Client Assets from SIA were $4.6 bil. on June 30, 2025. 2Q25 3Q25 4Q25 1Q26 2Q26 Ticked MMF Smart Rate Sweep* Non-Wealth Deposits * Sweep balances include Sweep Deposits, Third-party Bank Sweep Program, & Other Sweep Cash Quarterly Earnings Report 4 millions
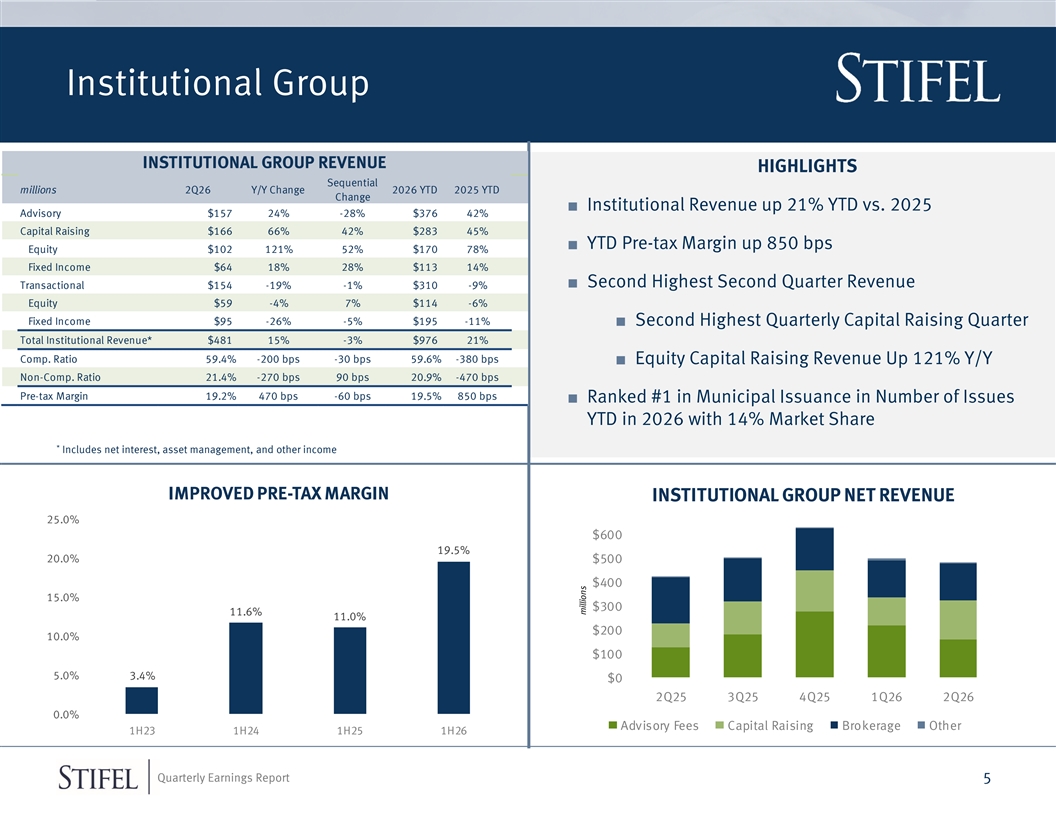
Institutional Group INSTITUTIONAL GROUP REVENUE HIGHLIGHTS Sequential millions 2Q26 Y/Y Change 2026 YTD 2025 YTD Change ■ Institutional Revenue up 21% YTD vs. 2025 Advisory $157 24% -28% $376 42% Capital Raising $166 66% 42% $283 45% ■ YTD Pre-tax Margin up 850 bps Equity $102 121% 52% $170 78% Fixed Income $64 18% 28% $113 14% ■ Second Highest Second Quarter Revenue Transactional $154 -19% -1% $310 -9% Equity $59 -4% 7% $114 -6% Fixed Income $95 -26% -5% $195 -11% ■ Second Highest Quarterly Capital Raising Quarter Total Institutional Revenue* $481 15% -3% $976 21% Comp. Ratio 59.4% -200 bps -30 bps 59.6% -380 bps ■ Equity Capital Raising Revenue Up 121% Y/Y Non-Comp. Ratio 21.4% -270 bps 90 bps 20.9% -470 bps Pre-tax Margin 19.2% 470 bps -60 bps 19.5% 850 bps ■ Ranked #1 in Municipal Issuance in Number of Issues YTD in 2026 with 14% Market Share * Includes net interest, asset management, and other income IMPROVED PRE-TAX MARGIN INSTITUTIONAL GROUP NET REVENUE 25.0% $600 19.5% 20.0% $500 $400 15.0% $300 11.6% 11.0% $200 10.0% $100 5.0% 3.4% $0 2Q25 3Q25 4Q25 1Q26 2Q26 0.0% Advisory Fees Capital Raising Brokerage Other 1H23 1H24 1H25 1H26 * 2021 revenue based on annualized results through 9/30/2021 Quarterly Earnings Report 5 millions
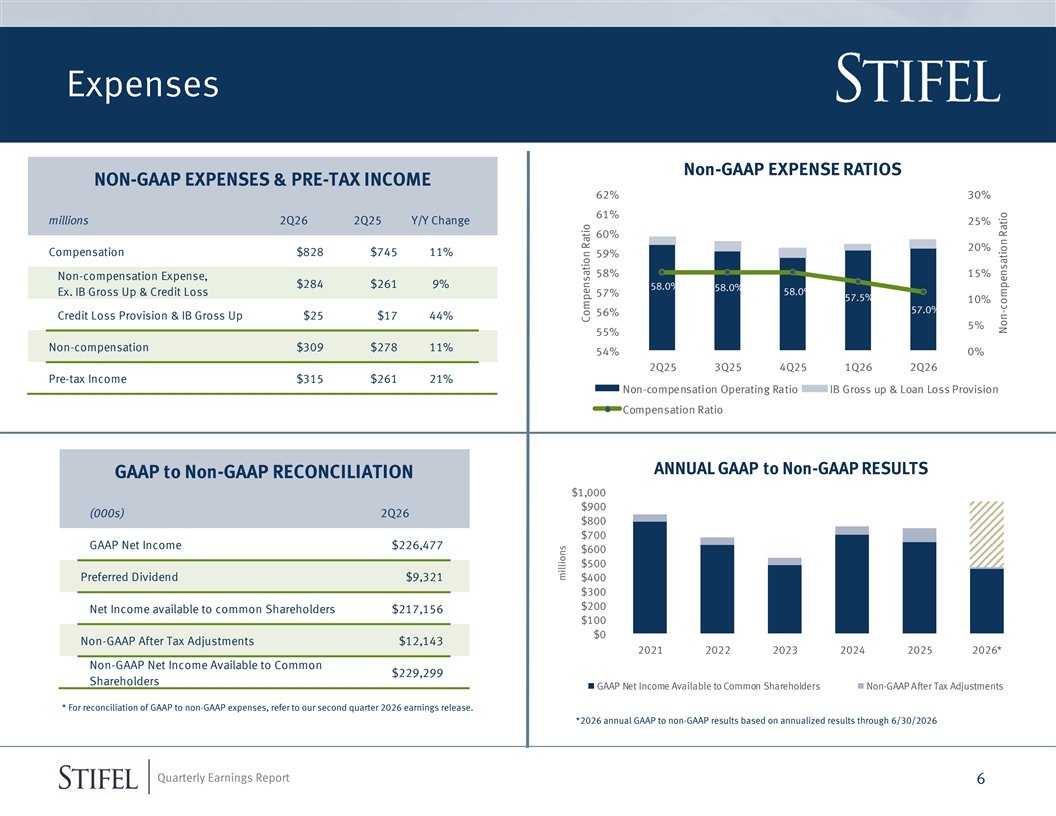
Expenses Non-GAAP EXPENSE RATIOS NON-GAAP EXPENSES & PRE-TAX INCOME 62% 30% 61% millions 2Q26 2Q25 Y/Y Change 25% 60% 20% Compensation $828 $745 11% 59% 58% 15% Non-compensation Expense, $284 $261 9% 58.0% 58.0% 58.0% Ex. IB Gross Up & Credit Loss 57% 57.5% 10% 57.0% 56% Credit Loss Provision & IB Gross Up $25 $17 44% 5% 55% Non-compensation $309 $278 11% 54% 0% 2Q25 3Q25 4Q25 1Q26 2Q26 Pre-tax Income $315 $261 21% Non-compensation Operating Ratio IB Gross up & Loan Loss Provision Compensation Ratio ANNUAL GAAP to Non-GAAP RESULTS GAAP to Non-GAAP RECONCILIATION $1,000 $900 (000s) 2Q26 $800 $700 GAAP Net Income $226,477 $600 $500 Preferred Dividend $9,321 $400 $300 $200 Net Income available to common Shareholders $217,156 $100 $0 Non-GAAP After Tax Adjustments $12,143 2021 2022 2023 2024 2025 2026* Non-GAAP Net Income Available to Common $229,299 Shareholders GAAP Net Income Available to Common Shareholders Non-GAAP After Tax Adjustments * For reconciliation of GAAP to non-GAAP expenses, refer to our second quarter 2026 earnings release. *2026 annual GAAP to non-GAAP results based on annualized results through 6/30/2026 Quarterly Earnings Report 6 millions Compensation Ratio Non-compensation Ratio
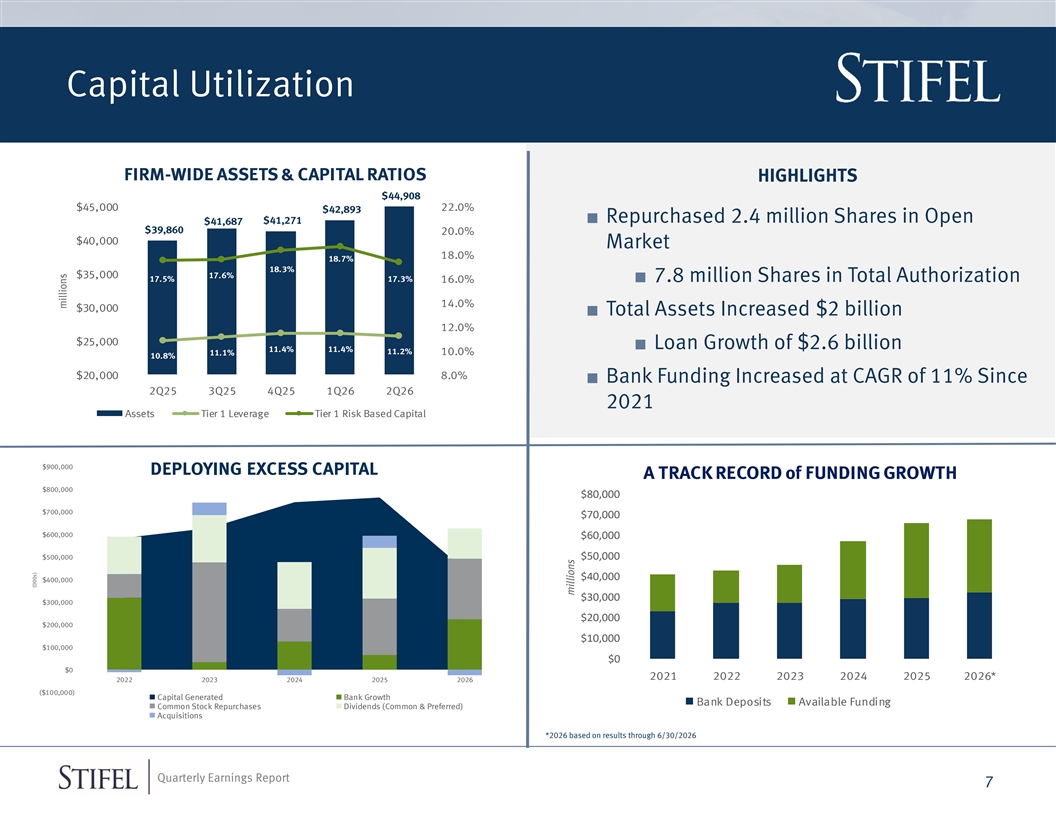
Capital Utilization FIRM-WIDE ASSETS & CAPITAL RATIOS HIGHLIGHTS $44,908 $45,000 22.0% $42,893 ■ Repurchased 2.4 million Shares in Open $41,271 $41,687 $39,860 20.0% $40,000 Market 18.0% 18.7% 18.3% $35,000 17.6% 17.5% 17.3% 16.0%■ 7.8 million Shares in Total Authorization 14.0% $30,000 ■ Total Assets Increased $2 billion 12.0% $25,000 ■ Loan Growth of $2.6 billion 11.4% 11.4% 11.2% 10.0% 11.1% 10.8% $20,000 8.0% ■ Bank Funding Increased at CAGR of 11% Since 2Q25 3Q25 4Q25 1Q26 2Q26 2021 Assets Tier 1 Leverage Tier 1 Risk Based Capital $900,000 DEPLOYING EXCESS CAPITAL A TRACK RECORD of FUNDING GROWTH $800,000 $80,000 $700,000 $70,000 $600,000 $60,000 $500,000 $50,000 $40,000 $400,000 $30,000 $300,000 $20,000 $200,000 $10,000 $100,000 $0 $0 2021 2022 2023 2024 2025 2026* 2022 2023 2024 2025 2026 ($100,000) Capital Generated Bank Growth Bank Deposits Available Funding Common Stock Repurchases Dividends (Common & Preferred) Acquisitions *2026 based on results through 6/30/2026 Quarterly Earnings Report 7 (000s) millions millions

Concluding Remarks Quarterly Earnings Report

Second Quarter 2026 Financial Results Presentation July 22, 2026 Quarterly Earnings Report
Disclaimer Forward-Looking Statements This presentation may contain “forward-looking statements” within the meaning of the Private Securities Litigation Reform Act of 1995 that involve significant risks, assumptions, and uncertainties, including statements relating to the market opportunity and future business prospects of Stifel Financial Corp., as well as Stifel, Nicolaus & Company, Incorporated and its subsidiaries (collectively, “SF” or the “Company”). These statements can be identified by the use of the words “may,” “will,” “should,” “could,” “would,” “plan,” “potential,” “estimate,” “project,” “believe,” “intend,” “anticipate,” “expect,” and similar expressions. All statements not dealing with historical results are forward-looking and are based on various assumptions. The forward-looking statements are subject to risks and uncertainties that could cause actual results to differ materially from those expressed in or implied by the statements. For information about the risks and important factors that could affect the Company’s future results, financial condition and liquidity, see “Risk Factors” in Part I of the Company’s Annual Report on Form 10-K for the year ended December 31, 2025. Forward-looking statements speak only as to the date they are made. The Company disclaims any intent or obligation to update forward-looking statements to reflect circumstances or events that occur after the date the forward-looking statements are made. Use of Non-GAAP Financial Measures The Company prepares its Consolidated Financial Statements using accounting principles generally accepted in the United States (U.S. GAAP). The Company may disclose certain “non-GAAP financial measures” in the course of its earnings releases, earnings conference calls, financial presentations and otherwise. The Securities and Exchange Commission defines a “non-GAAP financial measure” as a numerical measure of historical or future financial performance, financial position, or cash flows that is subject to adjustments that effectively exclude, or include, amounts from the most directly comparable measure calculated and presented in accordance with U.S. GAAP. Non-GAAP financial measures disclosed by the Company are provided as additional information to analysts, investors and other stakeholders in order to provide them with greater transparency about, or an alternative method for assessing the Company’s financial condition or operating results. These measures are not in accordance with, or a substitute for U.S. GAAP, and may be different from or inconsistent with non-GAAP financial measures used by other companies. Whenever the Company refers to a non-GAAP financial measure, it will also define it or present the most directly comparable financial measure calculated and presented in accordance with U.S. GAAP, along with a reconciliation of the differences between the non-GAAP financial measure it references and such comparable U.S. GAAP financial measure. Quarterly Earnings Report 10