.2 United Bankshares, Inc. (UBSI) Fourth Quarter & Fiscal Year 2025 Earnings Review January 22, 2026
FORWARD LOOKING STATEMENTS This presentation and statements made by United Bankshares, Inc. (“UBSI”) and its management contain forward-looking statements within the meaning of Section 27A of the Securities Act of 1933 and Section 21E of the Securities Exchange Act of 1934. These forward-looking statements are intended to be covered by the safe harbor provisions for forward-looking statements contained in the Private Securities Litigation Reform Act of 1995. These forward-looking statements include, but are not limited to, statements about (i) projections of income, expenses, provision expense, capital structure and other financial information; (ii) UBSI’s plans, objectives, expectations and intentions and other statements contained in this presentation that are not historical facts; and (iii) other statements identified by words such as “expects,” “anticipates,” “intends,” “plans,” “believes,” “seeks,” “estimates,” “targets,” “projects,” “will,” or words of similar meaning generally intended to identify forward-looking statements. These forward-looking statements are based upon the current beliefs and expectations of the management of UBSI and are inherently subject to significant business, economic and competitive uncertainties and contingencies, many of which are beyond the control of UBSI. In addition, these forward-looking statements are subject to assumptions with respect to future business strategies and decisions that are subject to change. Actual results may differ materially from the anticipated results discussed in these forward-looking statements because of possible uncertainties. The following factors, among others, could cause actual results to differ materially from the anticipated results or other expectations expressed in the forward-looking statements: (1) the effects of and changes in trade and monetary and fiscal policies and laws, including the interest rate policies of the Federal Reserve and the trade and tariff policies; (2) general competitive, economic, political and market conditions and other factors that may affect future results of UBSI, including changes in asset quality and credit risk; the inability to sustain revenue and earnings growth; changes in interest rates and capital markets; inflation; customer borrowing, repayment, investment and deposit practices; the impact, extent and timing of technological changes; capital management activities; and other actions of the Federal Reserve Board and legislative and regulatory actions and reforms; (3) deposit attrition, client loss or revenue loss following completed mergers or acquisitions that may be greater than anticipated; (4) regulatory change risk resulting from new laws, rules, regulations, or accounting principles, including, without limitation, the possibility that regulatory agencies may require higher levels of capital above the current regulatory-mandated minimums and the possibility of changes in accounting standards, policies, principles and practices; (5) the cost and effects of cyber incidents or other failures, interruptions, or security breaches of UBSI’s systems and those of our customers or third-party providers; (6) competitive pressures on product pricing and services; (7) success, impact, and timing of UBSI’s business strategies, including market acceptance of any new products or services; (8) volatility and disruptions in global capital and credit markets; (9) operational, technological, cultural, regulatory, legal, credit and other risks associated with the exploration, consummation and integration of potential future acquisitions; (10) catastrophic events such as hurricanes, tornados, earthquakes, floods or other natural or human disasters, including public health crises and infectious disease outbreaks, as well as any government actions in response to such events; (11) geopolitical risk from terrorist activities and armed conflicts that may result in economic and supply disruptions, and loss of market and consumer confidence; (12) the risks of fluctuations in market prices for UBSI common stock that may or may not reflect economic condition or performance of UBSI; (13) the nature, extent, timing, and results of governmental actions, examinations, reviews, reforms, regulations, and interpretations; and (14) other factors that may affect future results of UBSI, as disclosed in UBSI’s Annual Report on Form 10-K, Quarterly Reports on Form 10-Q, and Current Reports on Form 8-K, filed by UBSI with the U.S. Securities and Exchange Commission (“SEC”) and available on the SEC’s website at http://www.sec.gov, any of which could cause actual results to differ materially from future results expressed, implied or otherwise anticipated by such forward-looking statements. UBSI cautions that the foregoing list of factors is not exclusive. UBSI does not undertake any obligation to update any forward-looking statement to reflect circumstances or events that occur after the date the forward-looking statements are made. 2
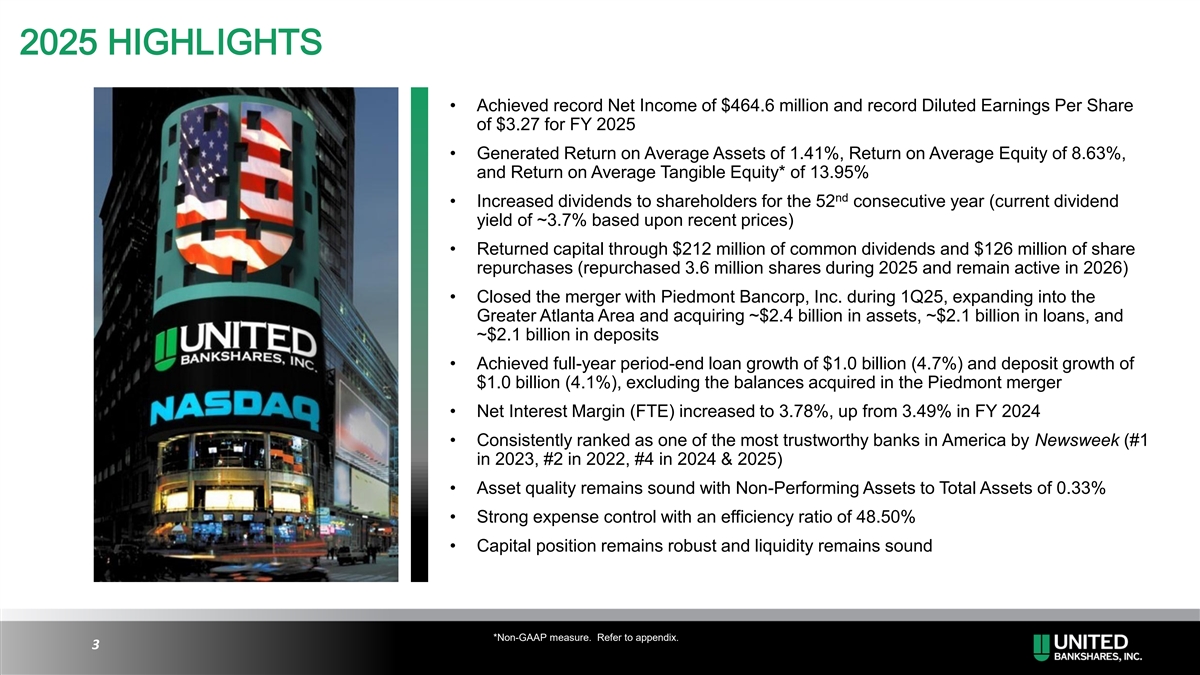
2025 HIGHLIGHTS • Achieved record Net Income of $464.6 million and record Diluted Earnings Per Share of $3.27 for FY 2025 • Generated Return on Average Assets of 1.41%, Return on Average Equity of 8.63%, and Return on Average Tangible Equity* of 13.95% nd • Increased dividends to shareholders for the 52 consecutive year (current dividend yield of ~3.7% based upon recent prices) • Returned capital through $212 million of common dividends and $126 million of share repurchases (repurchased 3.6 million shares during 2025 and remain active in 2026) • Closed the merger with Piedmont Bancorp, Inc. during 1Q25, expanding into the Greater Atlanta Area and acquiring ~$2.4 billion in assets, ~$2.1 billion in loans, and ~$2.1 billion in deposits • Achieved full-year period-end loan growth of $1.0 billion (4.7%) and deposit growth of $1.0 billion (4.1%), excluding the balances acquired in the Piedmont merger • Net Interest Margin (FTE) increased to 3.78%, up from 3.49% in FY 2024 • Consistently ranked as one of the most trustworthy banks in America by Newsweek (#1 in 2023, #2 in 2022, #4 in 2024 & 2025) • Asset quality remains sound with Non-Performing Assets to Total Assets of 0.33% • Strong expense control with an efficiency ratio of 48.50% • Capital position remains robust and liquidity remains sound *Non-GAAP measure. Refer to appendix. 3
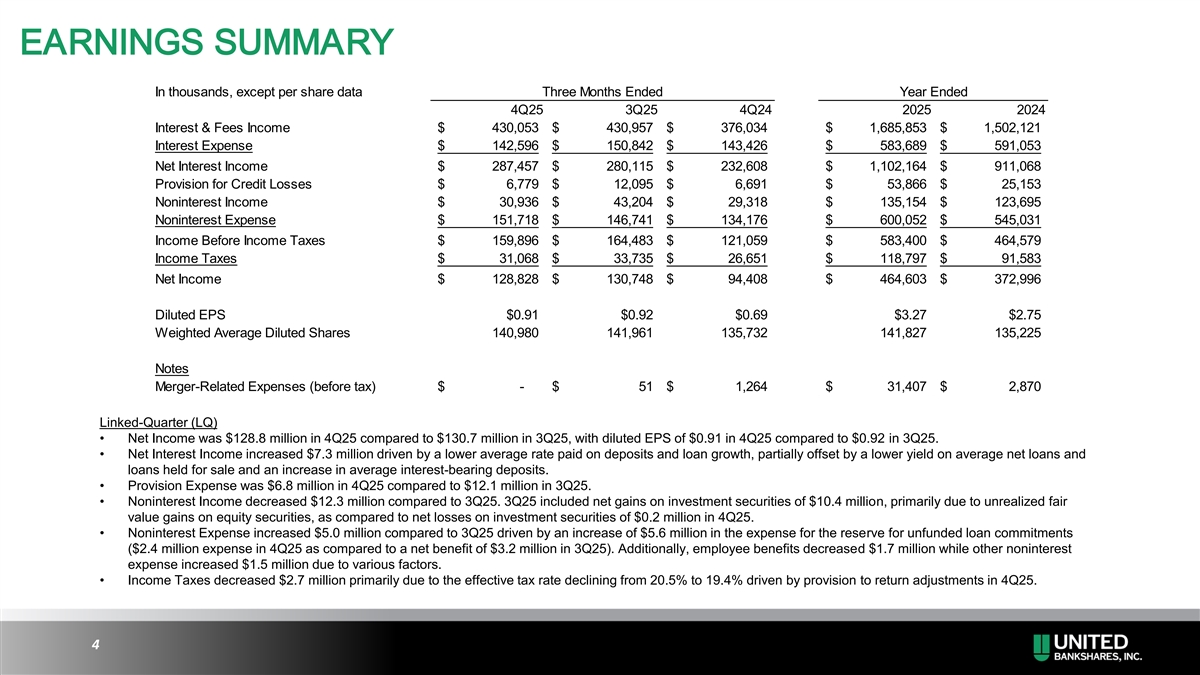
EARNINGS SUMMARY In thousands, except per share data Three Months Ended Year Ended 4Q25 3Q25 4Q24 2025 2024 Interest & Fees Income $ 430,053 $ 430,957 $ 376,034 $ 1,685,853 $ 1,502,121 Interest Expense $ 142,596 $ 150,842 $ 143,426 $ 583,689 $ 591,053 Net Interest Income $ 287,457 $ 280,115 $ 232,608 $ 1,102,164 $ 911,068 Provision for Credit Losses $ 6,779 $ 12,095 $ 6,691 $ 53,866 $ 25,153 Noninterest Income $ 30,936 $ 43,204 $ 29,318 $ 135,154 $ 123,695 Noninterest Expense $ 151,718 $ 146,741 $ 134,176 $ 600,052 $ 545,031 Income Before Income Taxes $ 159,896 $ 164,483 $ 121,059 $ 583,400 $ 464,579 Income Taxes $ 31,068 $ 33,735 $ 26,651 $ 118,797 $ 91,583 Net Income $ 128,828 $ 130,748 $ 94,408 $ 464,603 $ 372,996 Diluted EPS $0.91 $0.92 $0.69 $3.27 $2.75 Weighted Average Diluted Shares 140,980 141,961 135,732 141,827 135,225 Notes Merger-Related Expenses (before tax) $ - $ 51 $ 1,264 $ 31,407 $ 2,870 Linked-Quarter (LQ) • Net Income was $128.8 million in 4Q25 compared to $130.7 million in 3Q25, with diluted EPS of $0.91 in 4Q25 compared to $0.92 in 3Q25. • Net Interest Income increased $7.3 million driven by a lower average rate paid on deposits and loan growth, partially offset by a lower yield on average net loans and loans held for sale and an increase in average interest-bearing deposits. • Provision Expense was $6.8 million in 4Q25 compared to $12.1 million in 3Q25. • Noninterest Income decreased $12.3 million compared to 3Q25. 3Q25 included net gains on investment securities of $10.4 million, primarily due to unrealized fair value gains on equity securities, as compared to net losses on investment securities of $0.2 million in 4Q25. • Noninterest Expense increased $5.0 million compared to 3Q25 driven by an increase of $5.6 million in the expense for the reserve for unfunded loan commitments ($2.4 million expense in 4Q25 as compared to a net benefit of $3.2 million in 3Q25). Additionally, employee benefits decreased $1.7 million while other noninterest expense increased $1.5 million due to various factors. • Income Taxes decreased $2.7 million primarily due to the effective tax rate declining from 20.5% to 19.4% driven by provision to return adjustments in 4Q25. 4
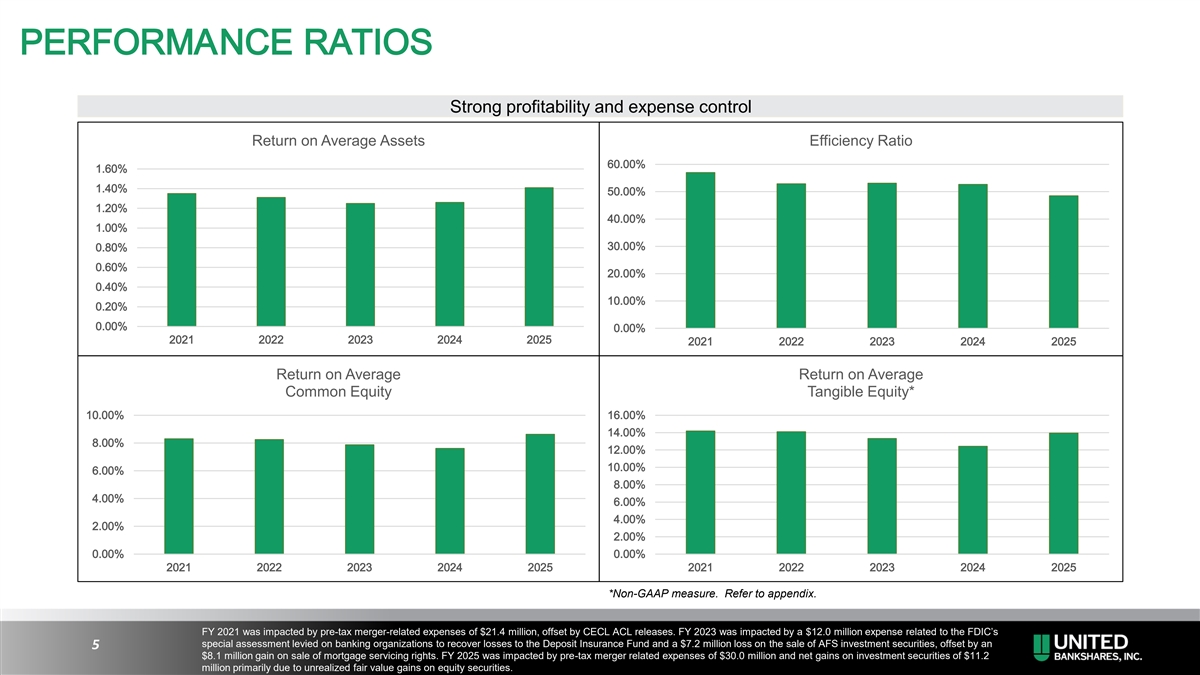
PERFORMANCE RATIOS Strong profitability and expense control Return on Average Assets Efficiency Ratio 60.00% 1.60% 1.40% 50.00% 1.20% 40.00% 1.00% 30.00% 0.80% 0.60% 20.00% 0.40% 10.00% 0.20% 0.00% 0.00% 2021 2022 2023 2024 2025 2021 2022 2023 2024 2025 Return on Average Return on Average Common Equity Tangible Equity* 10.00% 16.00% 14.00% 8.00% 12.00% 10.00% 6.00% 8.00% 4.00% 6.00% 4.00% 2.00% 2.00% 0.00% 0.00% 2021 2022 2023 2024 2025 2021 2022 2023 2024 2025 *Non-GAAP measure. Refer to appendix. FY 2021 was impacted by pre-tax merger-related expenses of $21.4 million, offset by CECL ACL releases. FY 2023 was impacted by a $12.0 million expense related to the FDIC’s special assessment levied on banking organizations to recover losses to the Deposit Insurance Fund and a $7.2 million loss on the sale of AFS investment securities, offset by an 5 $8.1 million gain on sale of mortgage servicing rights. FY 2025 was impacted by pre-tax merger related expenses of $30.0 million and net gains on investment securities of $11.2 million primarily due to unrealized fair value gains on equity securities.
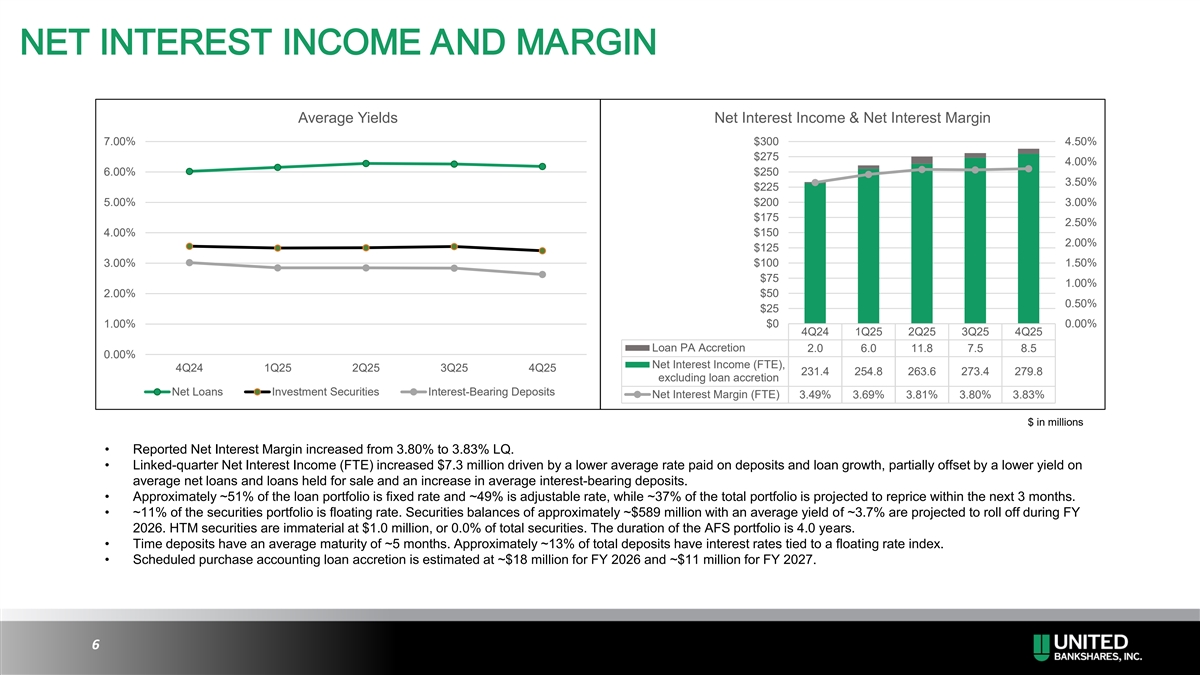
NET INTEREST INCOME AND MARGIN Average Yields Net Interest Income & Net Interest Margin 7.00% $300 4.50% $275 4.00% 6.00% $250 3.50% $225 5.00% $200 3.00% $175 2.50% 4.00% $150 2.00% $125 3.00% $100 1.50% $75 1.00% 2.00% $50 0.50% $25 1.00% $0 0.00% 4Q24 1Q25 2Q25 3Q25 4Q25 Loan PA Accretion 2.0 6.0 11.8 7.5 8.5 0.00% Net Interest Income (FTE), 4Q24 1Q25 2Q25 3Q25 4Q25 231.4 254.8 263.6 273.4 279.8 excluding loan accretion Net Loans Investment Securities Interest-Bearing Deposits Net Interest Margin (FTE) 3.49% 3.69% 3.81% 3.80% 3.83% $ in millions • Reported Net Interest Margin increased from 3.80% to 3.83% LQ. • Linked-quarter Net Interest Income (FTE) increased $7.3 million driven by a lower average rate paid on deposits and loan growth, partially offset by a lower yield on average net loans and loans held for sale and an increase in average interest-bearing deposits. • Approximately ~51% of the loan portfolio is fixed rate and ~49% is adjustable rate, while ~37% of the total portfolio is projected to reprice within the next 3 months. • ~11% of the securities portfolio is floating rate. Securities balances of approximately ~$589 million with an average yield of ~3.7% are projected to roll off during FY 2026. HTM securities are immaterial at $1.0 million, or 0.0% of total securities. The duration of the AFS portfolio is 4.0 years. • Time deposits have an average maturity of ~5 months. Approximately ~13% of total deposits have interest rates tied to a floating rate index. • Scheduled purchase accounting loan accretion is estimated at ~$18 million for FY 2026 and ~$11 million for FY 2027. 6
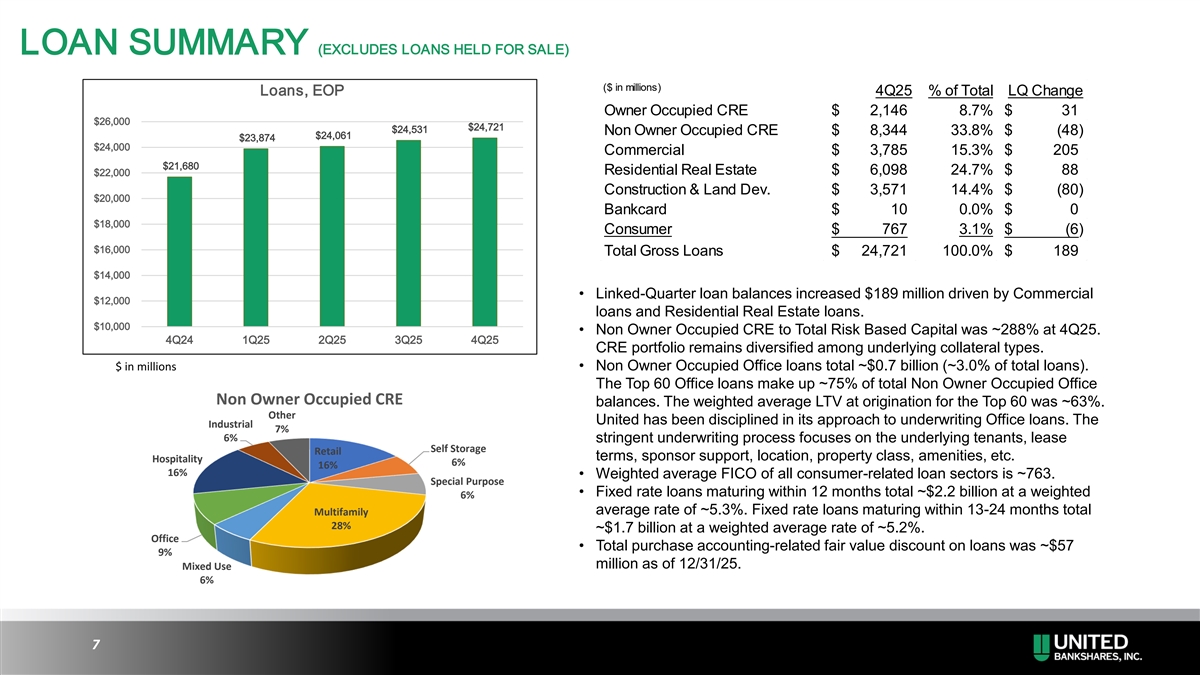
LOAN SUMMARY (EXCLUDES LOANS HELD FOR SALE) ($ in millions) Loans, EOP 4Q25 % of Total LQ Change Owner Occupied CRE $ 2 ,146 8.7% $ 31 $26,000 $24,721 $24,531 Non Owner Occupied CRE $ 8 ,344 33.8% $ (48) $24,061 $23,874 $24,000 Commercial $ 3 ,785 15.3% $ 205 $21,680 Residential Real Estate $ 6 ,098 24.7% $ 88 $22,000 Construction & Land Dev. $ 3,571 14.4% $ (80) $20,000 Bankcard $ 10 0.0% $ 0 $18,000 Consumer $ 767 3.1% $ (6) $16,000 Total Gross Loans $ 24,721 100.0% $ 189 $14,000 • Linked-Quarter loan balances increased $189 million driven by Commercial $12,000 loans and Residential Real Estate loans. $10,000 • Non Owner Occupied CRE to Total Risk Based Capital was ~288% at 4Q25. 4Q24 1Q25 2Q25 3Q25 4Q25 CRE portfolio remains diversified among underlying collateral types. $ in millions • Non Owner Occupied Office loans total ~$0.7 billion (~3.0% of total loans). The Top 60 Office loans make up ~75% of total Non Owner Occupied Office Non Owner Occupied CRE balances. The weighted average LTV at origination for the Top 60 was ~63%. Other United has been disciplined in its approach to underwriting Office loans. The Industrial 7% 6% stringent underwriting process focuses on the underlying tenants, lease Self Storage Retail terms, sponsor support, location, property class, amenities, etc. Hospitality 6% 16% 16% • Weighted average FICO of all consumer-related loan sectors is ~763. Special Purpose • Fixed rate loans maturing within 12 months total ~$2.2 billion at a weighted 6% average rate of ~5.3%. Fixed rate loans maturing within 13-24 months total Multifamily 28% ~$1.7 billion at a weighted average rate of ~5.2%. Office • Total purchase accounting-related fair value discount on loans was ~$57 9% million as of 12/31/25. Mixed Use 6% 7
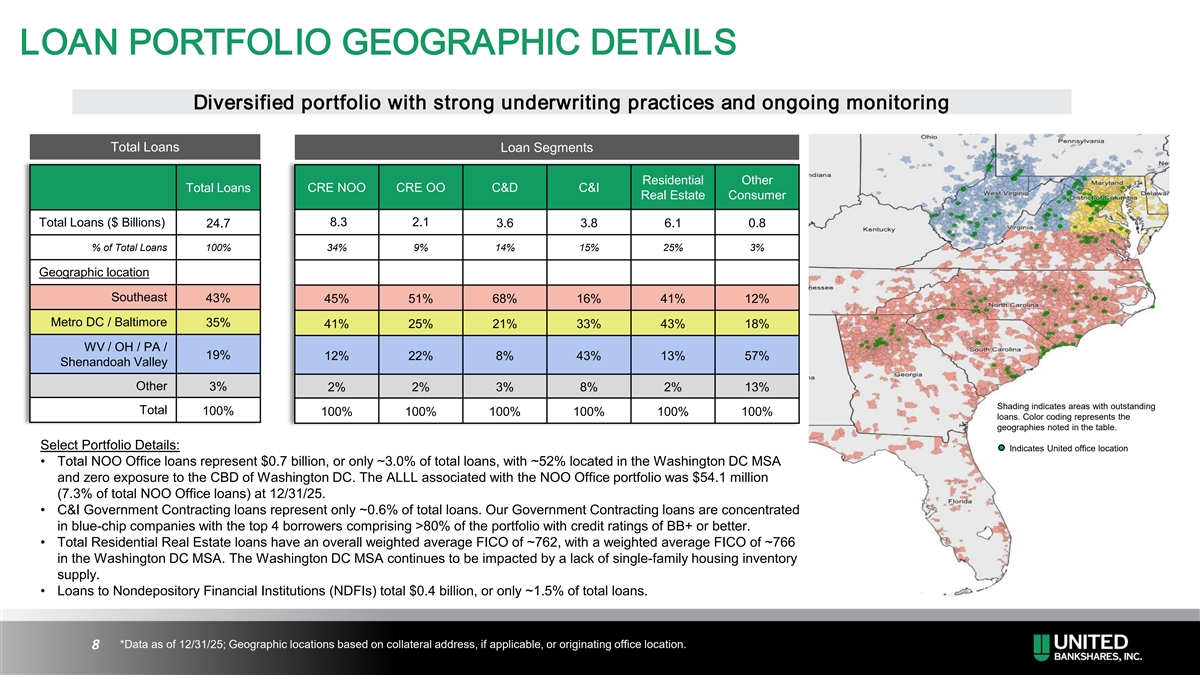
LOAN PORTFOLIO GEOGRAPHIC DETAILS Diversified portfolio with strong underwriting practices and ongoing monitoring Total Loans Loan Segments Residential Other Total Loans CRE NOO CRE OO C&D C&I Real Estate Consumer Total Loans ($ Billions) 8.3 2.1 24.7 3.6 3.8 6.1 0.8 % of Total Loans 100% 34% 9% 14% 15% 25% 3% Geographic location Southeast 43% 45% 51% 68% 16% 41% 12% Metro DC / Baltimore 35% 41% 25% 21% 33% 43% 18% WV / OH / PA / 19% 12% 22% 8% 43% 13% 57% Shenandoah Valley Other 3% 2% 2% 3% 8% 2% 13% Shading indicates areas with outstanding Total 100% 100% 100% 100% 100% 100% 100% loans. Color coding represents the geographies noted in the table. Select Portfolio Details: Indicates United office location • Total NOO Office loans represent $0.7 billion, or only ~3.0% of total loans, with ~52% located in the Washington DC MSA and zero exposure to the CBD of Washington DC. The ALLL associated with the NOO Office portfolio was $54.1 million (7.3% of total NOO Office loans) at 12/31/25. • C&I Government Contracting loans represent only ~0.6% of total loans. Our Government Contracting loans are concentrated in blue-chip companies with the top 4 borrowers comprising >80% of the portfolio with credit ratings of BB+ or better. • Total Residential Real Estate loans have an overall weighted average FICO of ~762, with a weighted average FICO of ~766 in the Washington DC MSA. The Washington DC MSA continues to be impacted by a lack of single-family housing inventory supply. • Loans to Nondepository Financial Institutions (NDFIs) total $0.4 billion, or only ~1.5% of total loans. *Data as of 12/31/25; Geographic locations based on collateral address, if applicable, or originating office location. 8
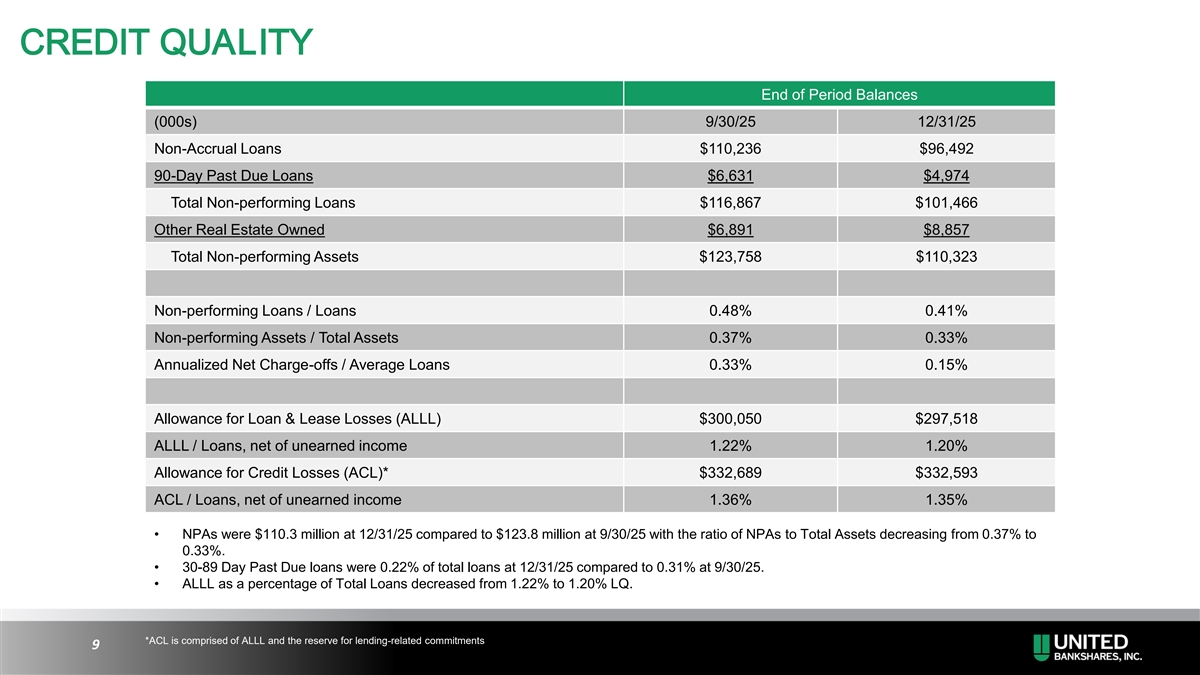
CREDIT QUALITY End of Period Balances (000s) 9/30/25 12/31/25 Non-Accrual Loans $110,236 $96,492 90-Day Past Due Loans $6,631 $4,974 Total Non-performing Loans $116,867 $101,466 Other Real Estate Owned $6,891 $8,857 Total Non-performing Assets $123,758 $110,323 Non-performing Loans / Loans 0.48% 0.41% Non-performing Assets / Total Assets 0.37% 0.33% Annualized Net Charge-offs / Average Loans 0.33% 0.15% Allowance for Loan & Lease Losses (ALLL) $300,050 $297,518 ALLL / Loans, net of unearned income 1.22% 1.20% Allowance for Credit Losses (ACL)* $332,689 $332,593 ACL / Loans, net of unearned income 1.36% 1.35% • NPAs were $110.3 million at 12/31/25 compared to $123.8 million at 9/30/25 with the ratio of NPAs to Total Assets decreasing from 0.37% to 0.33%. • 30-89 Day Past Due loans were 0.22% of total loans at 12/31/25 compared to 0.31% at 9/30/25. • ALLL as a percentage of Total Loans decreased from 1.22% to 1.20% LQ. *ACL is comprised of ALLL and the reserve for lending-related commitments 9
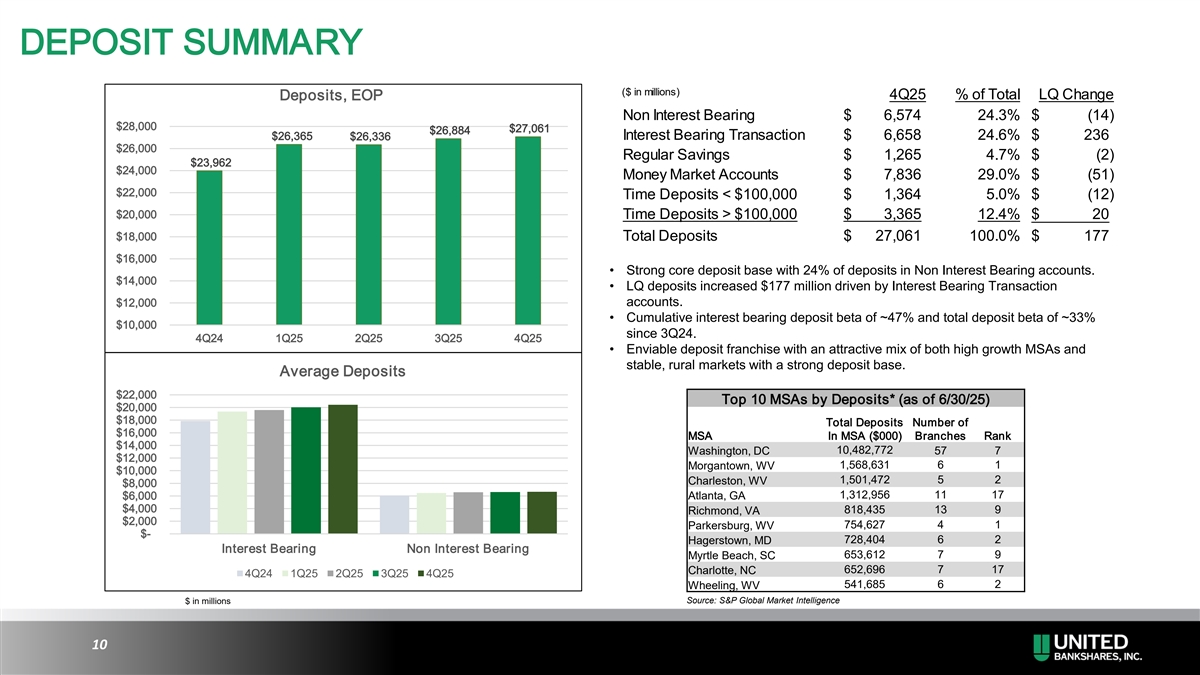
DEPOSIT SUMMARY ($ in millions) Deposits, EOP 4Q25 % of Total LQ Change Non Interest Bearing $ 6,574 24.3% $ (14) $28,000 $27,061 $26,884 $26,365 $26,336 Interest Bearing Transaction $ 6,658 24.6% $ 236 $26,000 Regular Savings $ 1,265 4.7% $ ( 2) $23,962 $24,000 Money Market Accounts $ 7,836 29.0% $ (51) $22,000 Time Deposits < $100,000 $ 1,364 5.0% $ (12) $20,000 Time Deposits > $100,000 $ 3,365 12.4% $ 20 $18,000 Total Deposits $ 27,061 100.0% $ 177 $16,000 • Strong core deposit base with 24% of deposits in Non Interest Bearing accounts. $14,000 • LQ deposits increased $177 million driven by Interest Bearing Transaction $12,000 accounts. • Cumulative interest bearing deposit beta of ~47% and total deposit beta of ~33% $10,000 since 3Q24. 4Q24 1Q25 2Q25 3Q25 4Q25 • Enviable deposit franchise with an attractive mix of both high growth MSAs and stable, rural markets with a strong deposit base. Average Deposits $22,000 Top 10 MSAs by Deposits* (as of 6/30/25) $20,000 $18,000 Total Deposits Number of $16,000 MSA In MSA ($000) Branches Rank $14,000 10,482,772 Washington, DC 57 7 $12,000 1,568,631 6 1 Morgantown, WV $10,000 1,501,472 5 2 Charleston, WV $8,000 1,312,956 11 17 $6,000 Atlanta, GA $4,000 818,435 13 9 Richmond, VA $2,000 754,627 4 1 Parkersburg, WV $- 728,404 6 2 Hagerstown, MD Interest Bearing Non Interest Bearing 653,612 7 9 Myrtle Beach, SC 652,696 7 17 Charlotte, NC 4Q24 1Q25 2Q25 3Q25 4Q25 Wheeling, WV 541,685 6 2 $ in millions Source: S&P Global Market Intelligence 10
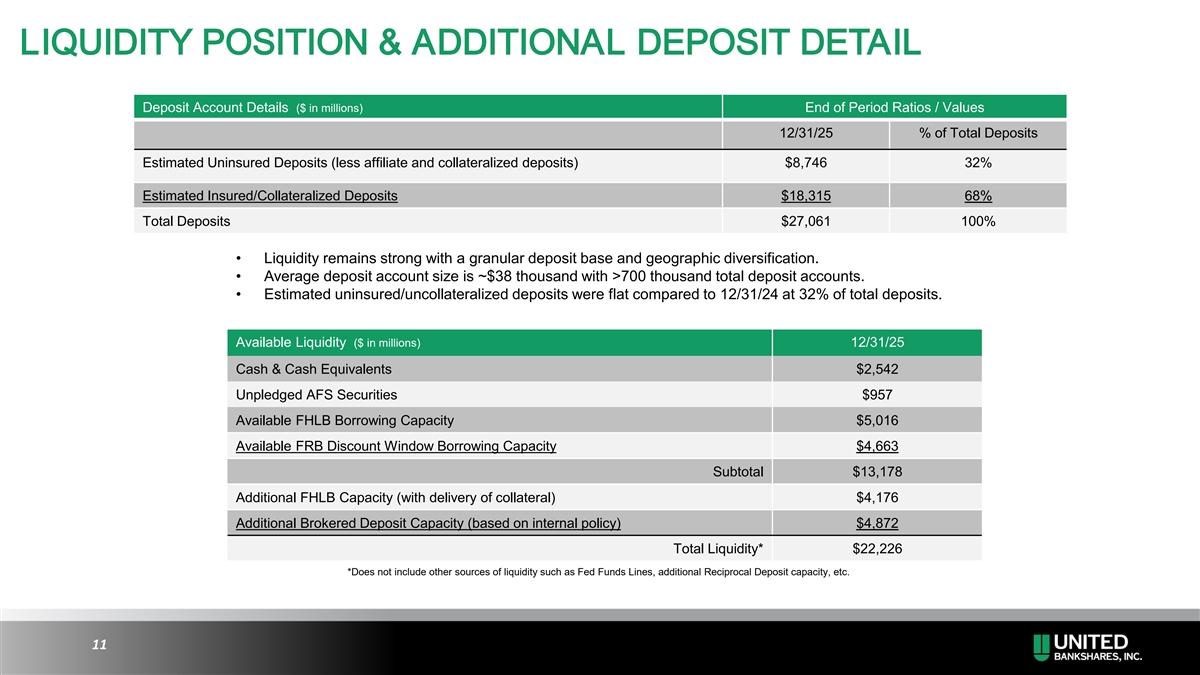
LIQUIDITY POSITION & ADDITIONAL DEPOSIT DETAIL Deposit Account Details ($ in millions) End of Period Ratios / Values 12/31/25 % of Total Deposits Estimated Uninsured Deposits (less affiliate and collateralized deposits) $8,746 32% Estimated Insured/Collateralized Deposits $18,315 68% Total Deposits $27,061 100% • Liquidity remains strong with a granular deposit base and geographic diversification. • Average deposit account size is ~$38 thousand with >700 thousand total deposit accounts. • Estimated uninsured/uncollateralized deposits were flat compared to 12/31/24 at 32% of total deposits. Available Liquidity ($ in millions) 12/31/25 Cash & Cash Equivalents $2,542 Unpledged AFS Securities $957 Available FHLB Borrowing Capacity $5,016 Available FRB Discount Window Borrowing Capacity $4,663 Subtotal $13,178 Additional FHLB Capacity (with delivery of collateral) $4,176 Additional Brokered Deposit Capacity (based on internal policy) $4,872 Total Liquidity* $22,226 *Does not include other sources of liquidity such as Fed Funds Lines, additional Reciprocal Deposit capacity, etc. 11
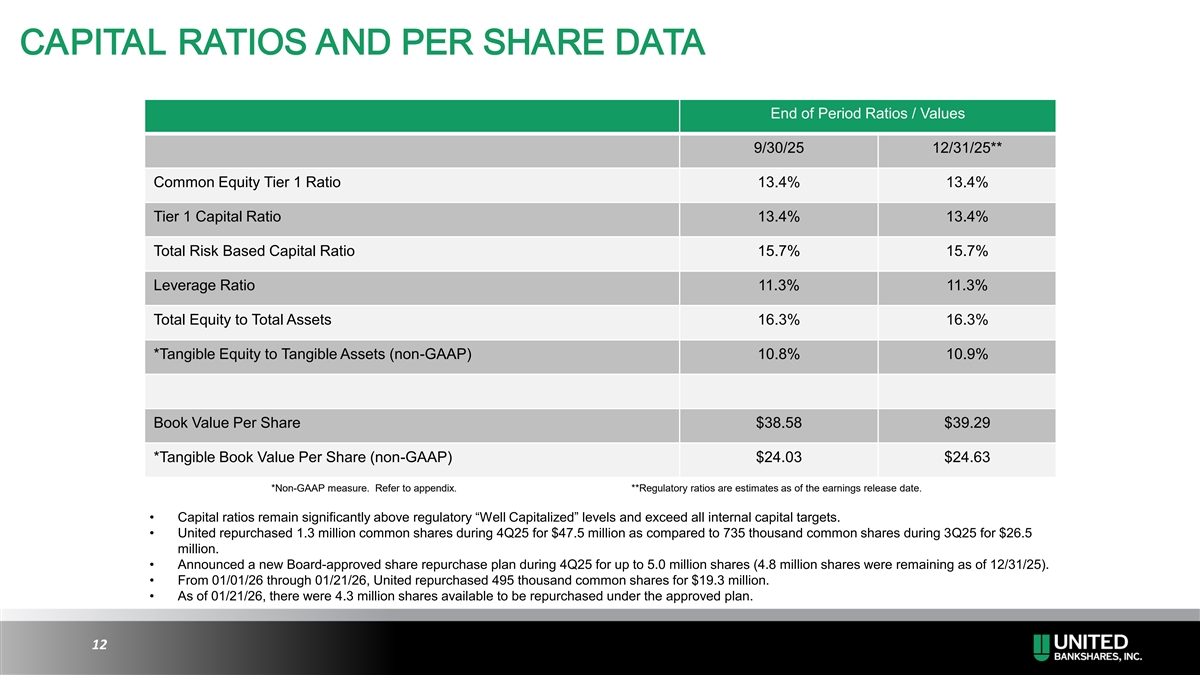
CAPITAL RATIOS AND PER SHARE DATA End of Period Ratios / Values 9/30/25 12/31/25** Common Equity Tier 1 Ratio 13.4% 13.4% Tier 1 Capital Ratio 13.4% 13.4% Total Risk Based Capital Ratio 15.7% 15.7% Leverage Ratio 11.3% 11.3% Total Equity to Total Assets 16.3% 16.3% *Tangible Equity to Tangible Assets (non-GAAP) 10.8% 10.9% Book Value Per Share $38.58 $39.29 *Tangible Book Value Per Share (non-GAAP) $24.03 $24.63 *Non-GAAP measure. Refer to appendix. **Regulatory ratios are estimates as of the earnings release date. • Capital ratios remain significantly above regulatory “Well Capitalized” levels and exceed all internal capital targets. • United repurchased 1.3 million common shares during 4Q25 for $47.5 million as compared to 735 thousand common shares during 3Q25 for $26.5 million. • Announced a new Board-approved share repurchase plan during 4Q25 for up to 5.0 million shares (4.8 million shares were remaining as of 12/31/25). • From 01/01/26 through 01/21/26, United repurchased 495 thousand common shares for $19.3 million. • As of 01/21/26, there were 4.3 million shares available to be repurchased under the approved plan. 12
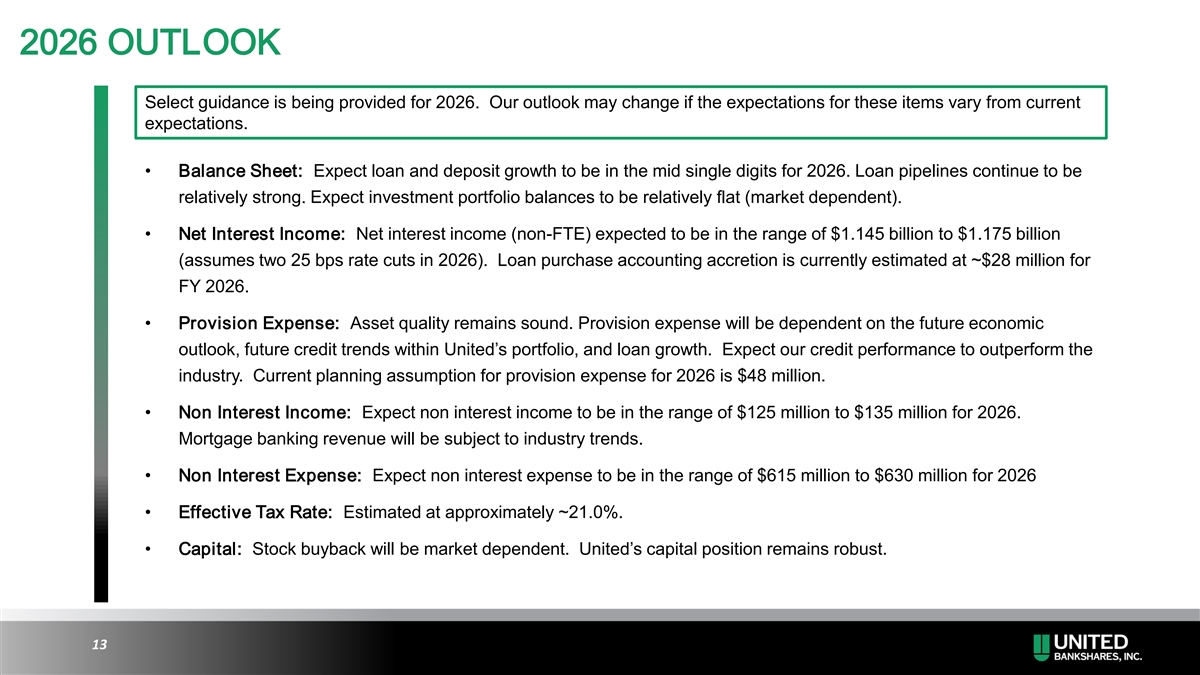
2026 OUTLOOK Select guidance is being provided for 2026. Our outlook may change if the expectations for these items vary from current expectations. • Balance Sheet: Expect loan and deposit growth to be in the mid single digits for 2026. Loan pipelines continue to be relatively strong. Expect investment portfolio balances to be relatively flat (market dependent). • Net Interest Income: Net interest income (non-FTE) expected to be in the range of $1.145 billion to $1.175 billion (assumes two 25 bps rate cuts in 2026). Loan purchase accounting accretion is currently estimated at ~$28 million for FY 2026. • Provision Expense: Asset quality remains sound. Provision expense will be dependent on the future economic outlook, future credit trends within United’s portfolio, and loan growth. Expect our credit performance to outperform the industry. Current planning assumption for provision expense for 2026 is $48 million. • Non Interest Income: Expect non interest income to be in the range of $125 million to $135 million for 2026. Mortgage banking revenue will be subject to industry trends. • Non Interest Expense: Expect non interest expense to be in the range of $615 million to $630 million for 2026 • Effective Tax Rate: Estimated at approximately ~21.0%. • Capital: Stock buyback will be market dependent. United’s capital position remains robust. 13
INVESTMENT THESIS • Premier Mid-Atlantic and Southeast franchise with an attractive mix of high growth MSAs and smaller stable markets with a strong deposit base • Consistently high-performing company with a culture of disciplined risk management and expense control • 52 consecutive years of dividend increases evidences United’s strong profitability, solid asset quality, and sound capital management over a very long period of time • Experienced management team with a proven track record of execution • Committed to our mission of excellence in service to our employees, our customers, our shareholders and our communities • Attractive valuation with a current Price-to-Earnings Ratio of ~12.1x (based upon median 2026 street consensus estimate of $3.40 per Bloomberg) 14
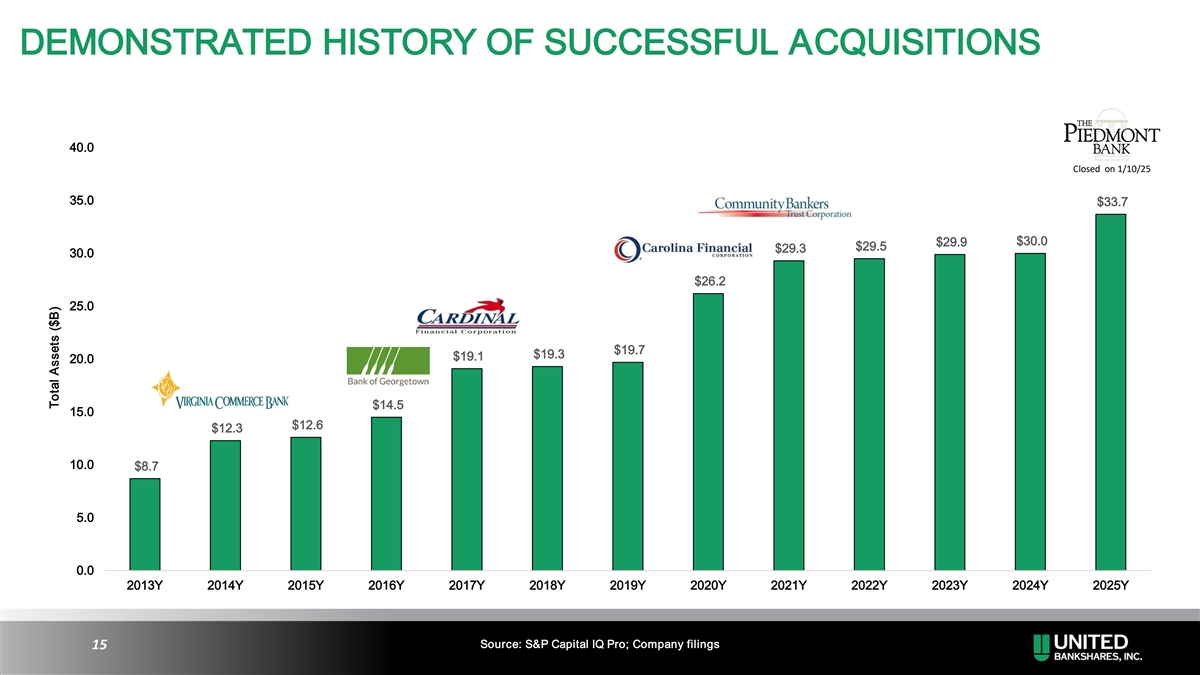
DEMONSTRATED HISTORY OF SUCCESSFUL ACQUISITIONS 40.0 Closed on 1/10/25 35.0 $33.7 $30.0 $29.9 $29.5 $29.3 30.0 $26.2 25.0 $19.7 $19.3 $19.1 20.0 $14.5 15.0 $12.6 $12.3 10.0 $8.7 5.0 0.0 2013Y 2014Y 2015Y 2016Y 2017Y 2018Y 2019Y 2020Y 2021Y 2022Y 2023Y 2024Y 2025Y Source: S&P Capital IQ Pro; Company filings 15 Total Assets ($B)
APPENDIX 16
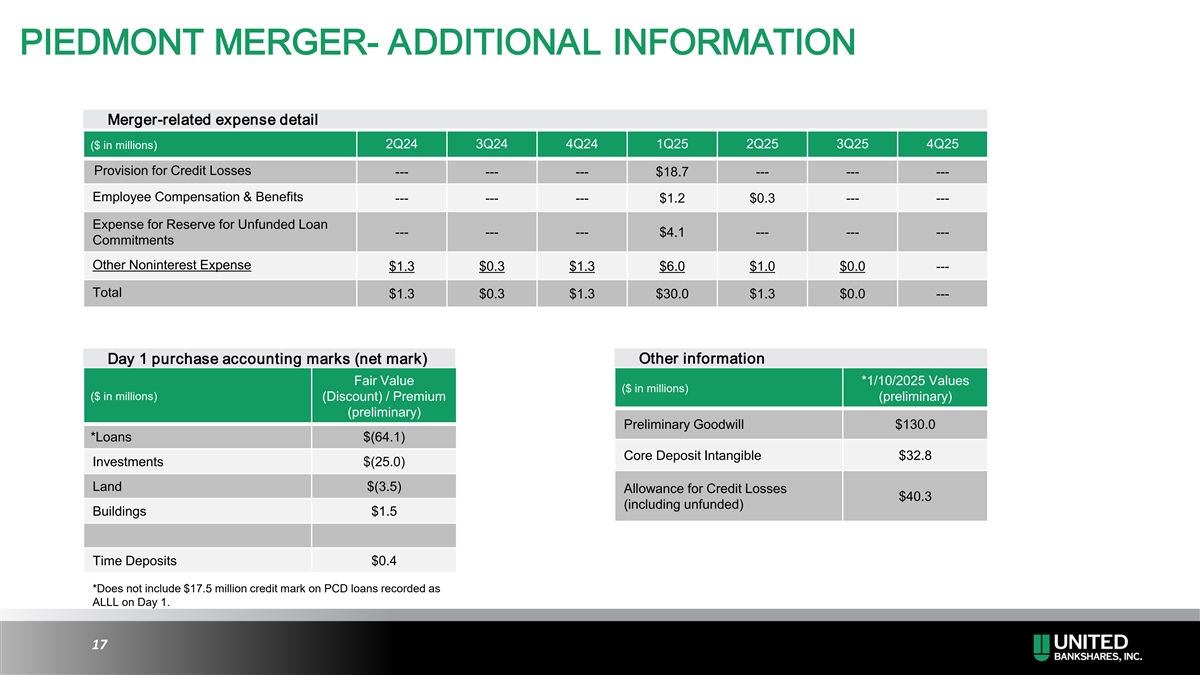
PIEDMONT MERGER- ADDITIONAL INFORMATION Merger-related expense detail ($ in millions) 2Q24 3Q24 4Q24 1Q25 2Q25 3Q25 4Q25 Provision for Credit Losses --- --- --- $18.7 --- --- --- Employee Compensation & Benefits --- --- --- $1.2 $0.3 --- --- Expense for Reserve for Unfunded Loan --- --- --- $4.1 --- --- --- Commitments Other Noninterest Expense $1.3 $0.3 $1.3 $6.0 $1.0 $0.0 --- Total $1.3 $0.3 $1.3 $30.0 $1.3 $0.0 --- Day 1 purchase accounting marks (net mark) Other information Fair Value *1/10/2025 Values ($ in millions) ($ in millions) (Discount) / Premium (preliminary) (preliminary) Preliminary Goodwill $130.0 *Loans $(64.1) Core Deposit Intangible $32.8 Investments $(25.0) Land $(3.5) Allowance for Credit Losses $40.3 (including unfunded) Buildings $1.5 Time Deposits $0.4 *Does not include $17.5 million credit mark on PCD loans recorded as ALLL on Day 1. 17
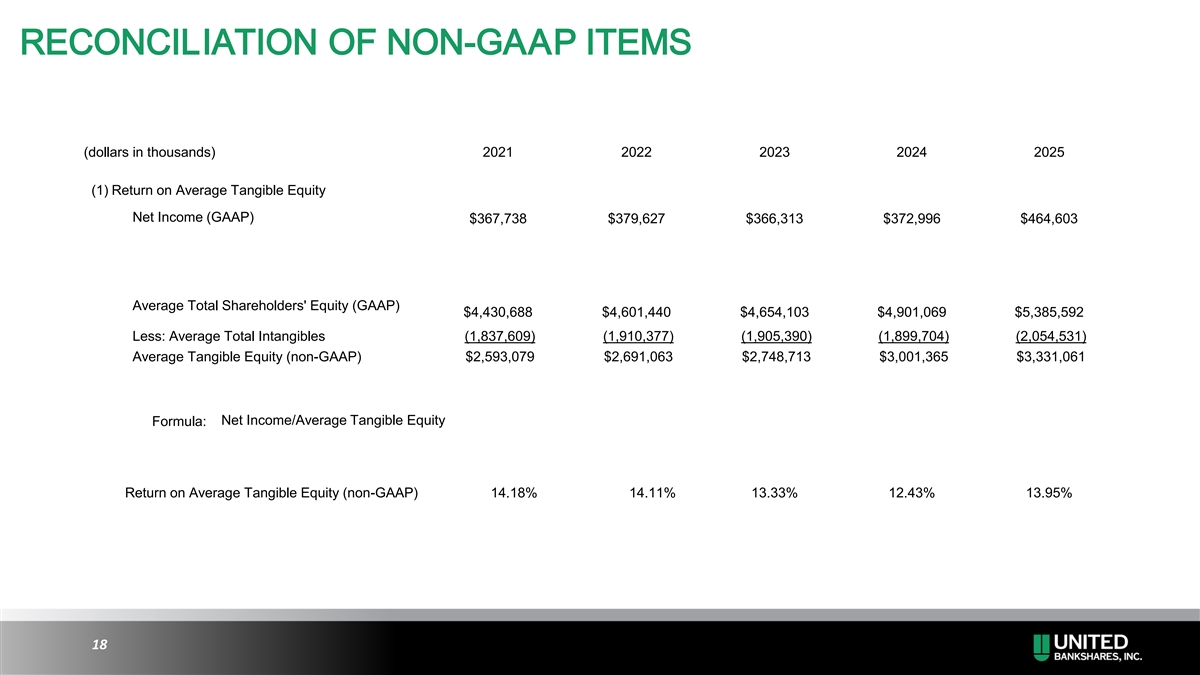
RECONCILIATION OF NON-GAAP ITEMS (dollars in thousands) 2021 2022 2023 2024 2025 (1) Return on Average Tangible Equity Net Income (GAAP) $367,738 $379,627 $366,313 $372,996 $464,603 Average Total Shareholders' Equity (GAAP) $4,430,688 $4,601,440 $4,654,103 $4,901,069 $5,385,592 Less: Average Total Intangibles (1,837,609) (1,910,377) (1,905,390) (1,899,704) (2,054,531) Average Tangible Equity (non-GAAP) $2,593,079 $2,691,063 $2,748,713 $3,001,365 $3,331,061 Net Income/Average Tangible Equity Formula: Return on Average Tangible Equity (non-GAAP) 14.18% 14.11% 13.33% 12.43% 13.95% 18
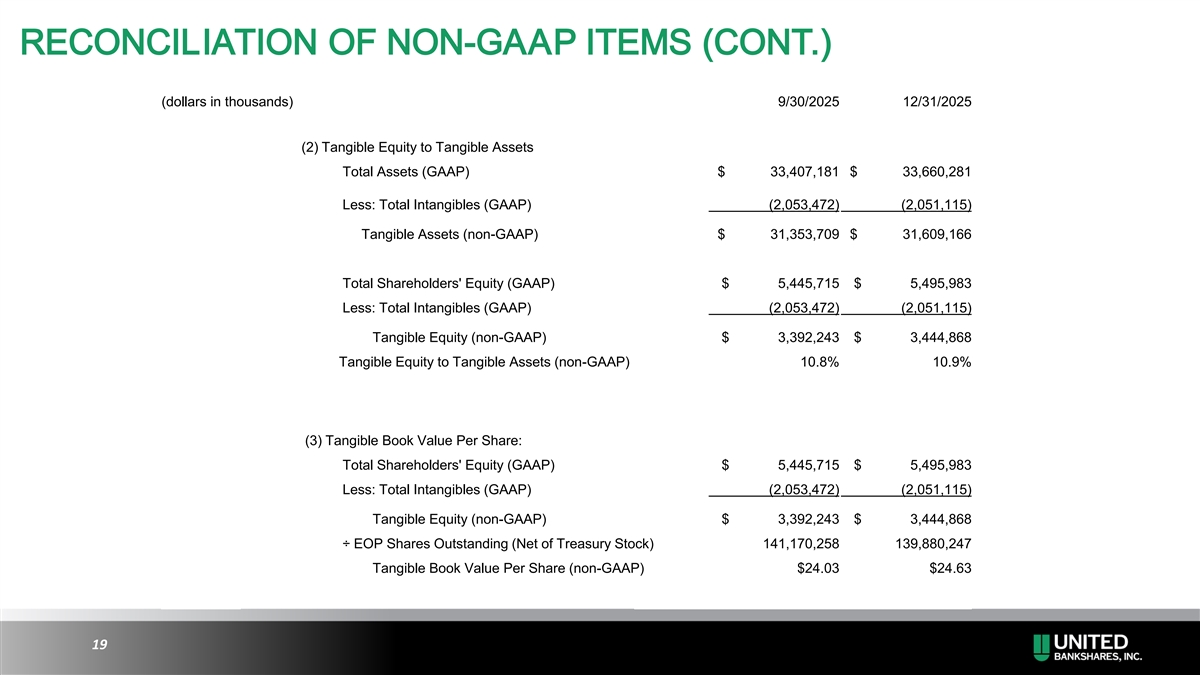
RECONCILIATION OF NON-GAAP ITEMS (CONT.) (dollars in thousands) 9/30/2025 12/31/2025 (2) Tangible Equity to Tangible Assets Total Assets (GAAP) $ 33,407,181 $ 33,660,281 Less: Total Intangibles (GAAP) (2,053,472) (2,051,115) Tangible Assets (non-GAAP) $ 31,353,709 $ 31,609,166 Total Shareholders' Equity (GAAP) $ 5,445,715 $ 5,495,983 Less: Total Intangibles (GAAP) (2,053,472) (2,051,115) Tangible Equity (non-GAAP) $ 3,392,243 $ 3,444,868 Tangible Equity to Tangible Assets (non-GAAP) 10.8% 10.9% (3) Tangible Book Value Per Share: Total Shareholders' Equity (GAAP) $ 5,445,715 $ 5,495,983 Less: Total Intangibles (GAAP) (2,053,472) (2,051,115) Tangible Equity (non-GAAP) $ 3,392,243 $ 3,444,868 ÷ EOP Shares Outstanding (Net of Treasury Stock) 141,170,258 139,880,247 Tangible Book Value Per Share (non-GAAP) $24.03 $24.63 19