
1 F O U R T H Q U A R T E R · F I S C A L 2 0 2 6 Financial Results Quarter ended July 31, 2026
2 Forward-Looking Statements This presentation includes certain statements that are “forward-looking” statements within the meaning of the U.S. Private Securities Litigation Reform Act of 1995, Section 27A of the Securities Act of 1933, as amended, and Section 21E of the Securities Exchange Act of 1934, as amended. These forward-looking statements are made based on management’s current expectations and beliefs regarding future and anticipated developments and their effects upon THOR and inherently involve uncertainties and risks. These forward-looking statements are not a guarantee of future performance and actual results may differ materially from our expectations. Factors which could cause materially different results include, among others: the impact of inflation on the cost of our products as well as on general consumer demand; the level of consumer confidence and the level of discretionary consumer spending; the effect of raw material and commodity price fluctuations, including the impact of tariffs, and/or raw material, commodity or chassis supply constraints; the impact of war, military conflict, terrorism and/or cyber-attacks, including state-sponsored or ransom attacks; the impact of sudden or significant adverse changes in the cost and/or availability of energy or fuel, including those caused by geopolitical events, on our costs of operation, on raw material prices, on our suppliers, on our independent dealers or on retail customers; the dependence on a small group of suppliers for certain components used in production, including chassis; interest rates and interest rate fluctuations and their potential impact on the general economy and, specifically, on our independent dealers and consumers and our profitability; the ability to ramp production up or down quickly in response to rapid changes in demand or market share while also managing associated costs, including labor-related costs and production capacity costs; the level and magnitude of warranty and recall claims incurred; the ability of our suppliers to financially support any defects in their products; the financial health of our independent dealers and their ability to successfully manage through various economic conditions; legislative, trade, regulatory and tax law and/or policy developments including their potential impact on our independent dealers, retail customers or on our suppliers; the costs of compliance with governmental regulation; the impact of an adverse outcome or conclusion related to current or future litigation or regulatory audits or investigations; public perception of and the costs related to environmental, social and governance matters; legal and compliance issues including those that may arise in conjunction with recently completed transactions; the ability to realize anticipated benefits of strategic initiatives including realignments or other reorganizational actions; the impact of exchange rate fluctuations; restrictive lending practices which could negatively impact our independent dealers and/or retail consumers; management changes; the success of new and existing products and services; the ability to maintain strong brands and develop innovative products that meet consumer demands; changes in consumer preferences; the risks associated with acquisitions, including: the pace and successful closing of an acquisition, the integration and financial impact thereof, the level of achievement of anticipated operating synergies from acquisitions, the potential for unknown or understated liabilities related to acquisitions, the potential loss of existing customers of acquisitions and our ability to retain key management personnel of acquired companies; a shortage of necessary personnel for production and increasing labor costs and related employee benefits costs to attract and retain production personnel in times of high demand; the loss or reduction of sales to key independent dealers, and stocking level decisions of our independent dealers; disruption of the delivery of units to independent dealers or the disruption of delivery of raw materials, including chassis, to our facilities; increasing costs for freight and transportation; the ability to protect our information technology systems, including confidential and personal information, from data breaches, cyber-attacks and/or network disruptions; asset impairment charges; competition; the impact of losses under repurchase agreements; the impact of the strength of the U.S. dollar on international demand for products priced in U.S. dollars; general economic, market, public health and political conditions in the various countries in which our products are produced and/or sold; the impact of adverse weather conditions and/or weather-related events; the impact of changing emissions and other related climate change regulations in the various jurisdictions in which our products are produced, used and/or sold; changes to our investment and capital allocation strategies or other facets of our strategic plan; and changes in market liquidity conditions, credit ratings and other factors that may impact our access to future funding and the cost of debt. These and other risks and uncertainties are discussed more fully in Item 1A of our Annual Report on Form 10-K for the year ended July 31, 2026. We disclaim any obligation or undertaking to disseminate any updates or revisions to any forward-looking statements contained in this presentation or to reflect any change in our expectations after the date hereof or any change in events, conditions or circumstances on which any statement is based, except as required by law.
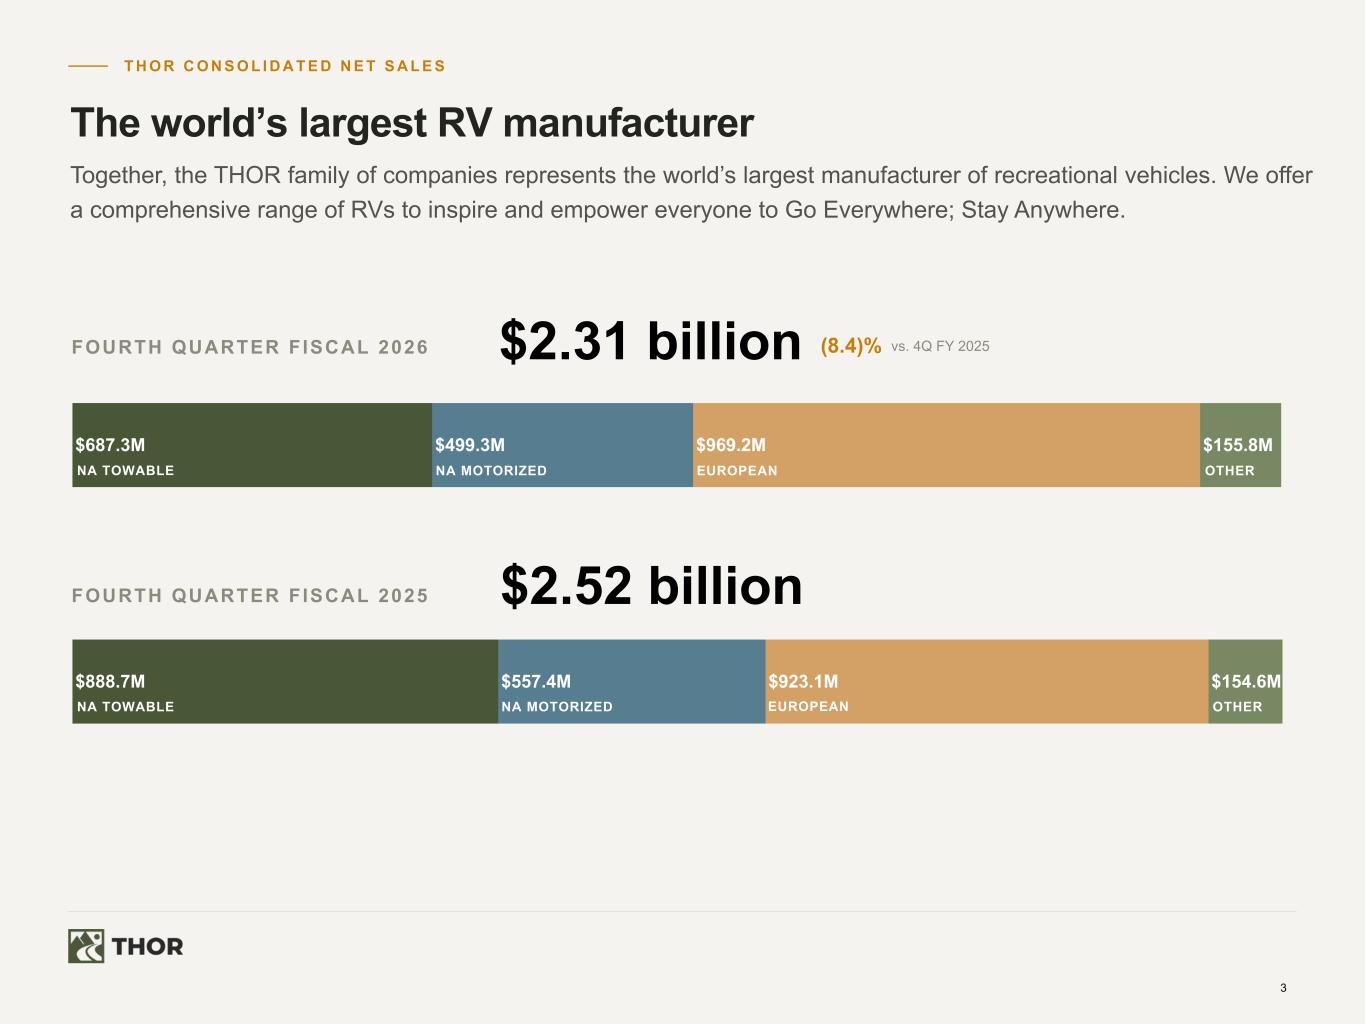
3 $888.7M $557.4M $923.1M $154.6M T H O R C O N S O L I D A T E D N E T S A L E S The world’s largest RV manufacturer Together, the THOR family of companies represents the world’s largest manufacturer of recreational vehicles. We offer a comprehensive range of RVs to inspire and empower everyone to Go Everywhere; Stay Anywhere. FOURTH QUARTER FISCAL 2026 $2.31 billion (8.4)% vs. 4Q FY 2025 FOURTH QUARTER FISCAL 2025 $2.52 billion NA TOWABLE NA MOTORIZED EUROPEAN OTHER $687.3M $499.3M $969.2M $155.8M NA TOWABLE NA MOTORIZED EUROPEAN OTHER
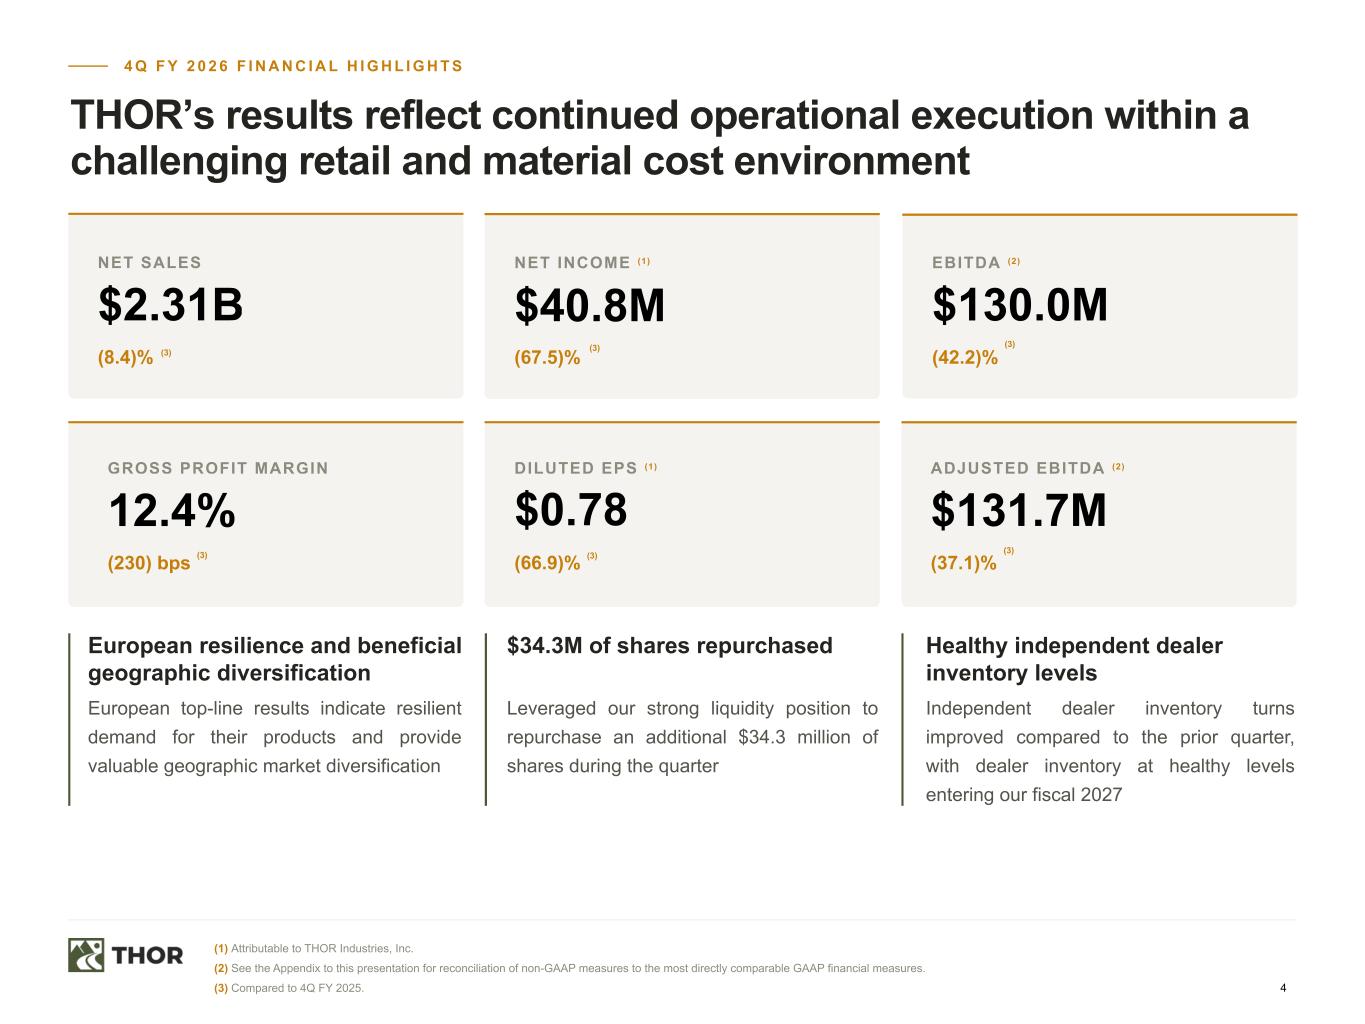
4 4 Q F Y 2 0 2 6 F I N A N C I A L H I G H L I G H T S THOR’s results reflect continued operational execution within a challenging retail and material cost environment European resilience and beneficial geographic diversification European top-line results indicate resilient demand for their products and provide valuable geographic market diversification $34.3M of shares repurchased Leveraged our strong liquidity position to repurchase an additional $34.3 million of shares during the quarter Healthy independent dealer inventory levels Independent dealer inventory turns improved compared to the prior quarter, with dealer inventory at healthy levels entering our fiscal 2027 (3) Compared to 4Q FY 2025. (2) See the Appendix to this presentation for reconciliation of non-GAAP measures to the most directly comparable GAAP financial measures. (1) Attributable to THOR Industries, Inc. NET SALES $2.31B (8.4)% (3) GROSS PROFIT MARGIN 12.4% (230) bps DILUTED EPS (1) $0.78 (66.9)% (3) (3) NET INCOME (1) $40.8M (67.5)% (3) EBITDA (2) $130.0M (42.2)% ADJUSTED EBITDA (2) $131.7M (37.1)% (3) (3)
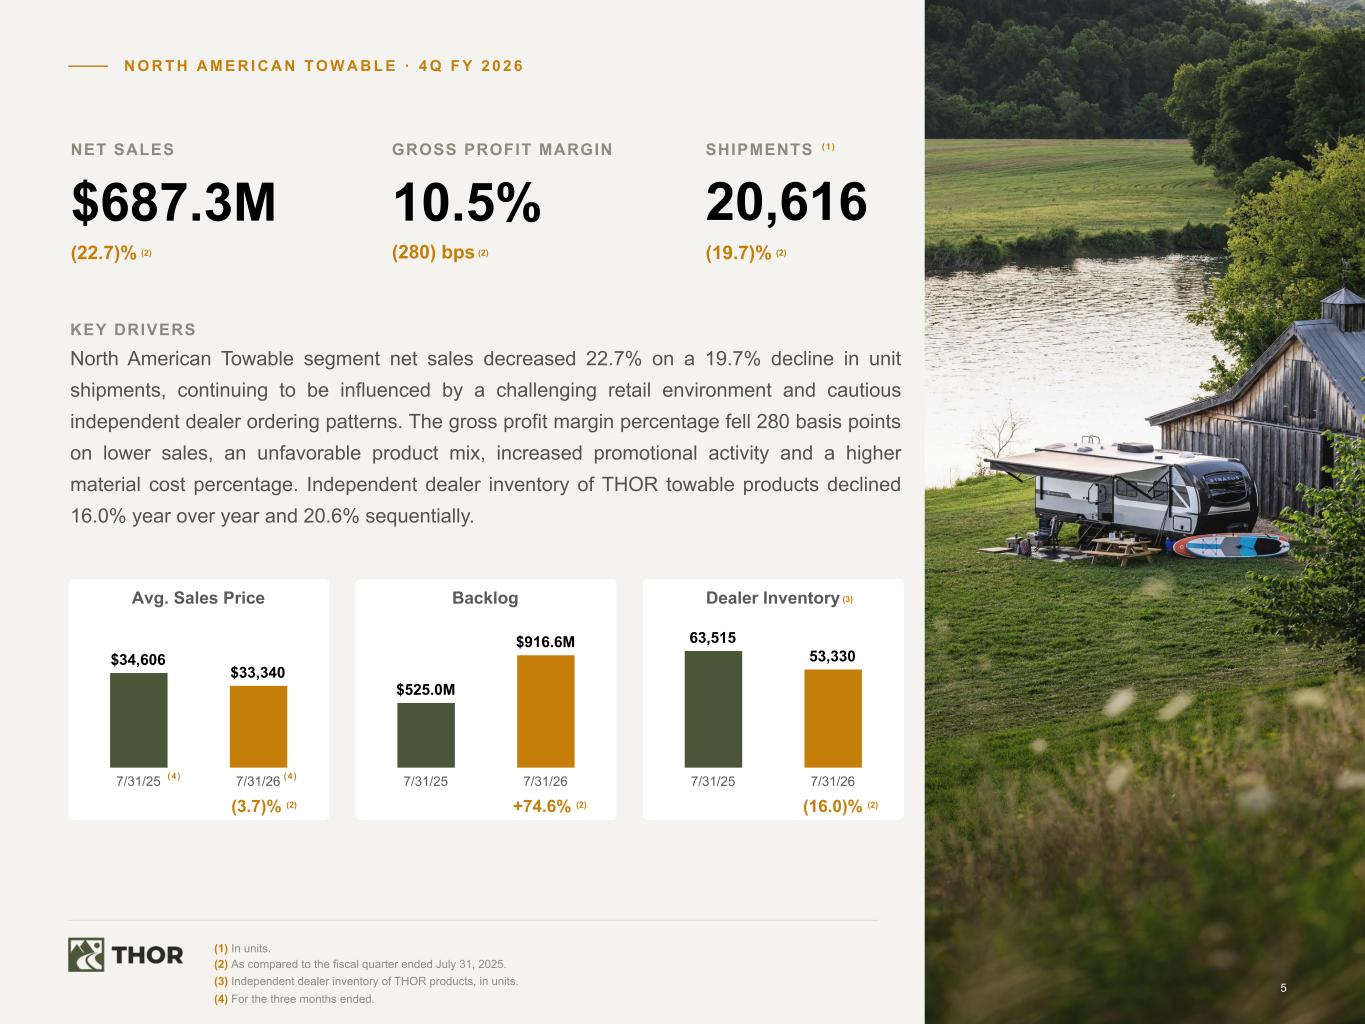
5 N O R T H A M E R I C A N T O W A B L E · 4 Q F Y 2 0 2 6 +74.6% (2) KEY DRIVERS North American Towable segment net sales decreased 22.7% on a 19.7% decline in unit shipments, continuing to be influenced by a challenging retail environment and cautious independent dealer ordering patterns. The gross profit margin percentage fell 280 basis points on lower sales, an unfavorable product mix, increased promotional activity and a higher material cost percentage. Independent dealer inventory of THOR towable products declined 16.0% year over year and 20.6% sequentially. (1) In units. (2) As compared to the fiscal quarter ended July 31, 2025. (4) For the three months ended. (16.0)% (2) NET SALES $687.3M (22.7)% GROSS PROFIT MARGIN 10.5% (280) bps SHIPMENTS 20,616 (19.7)%(2) (1 ) Avg. Sales Price $34,606 $33,340 7/31/25 7/31/26 Backlog $525.0M $916.6M 7/31/25 7/31/26 Dealer Inventory 63,515 53,330 7/31/25 7/31/26 (3) (2) (2) (3) Independent dealer inventory of THOR products, in units. (4 ) (4 ) (3.7)% (2)
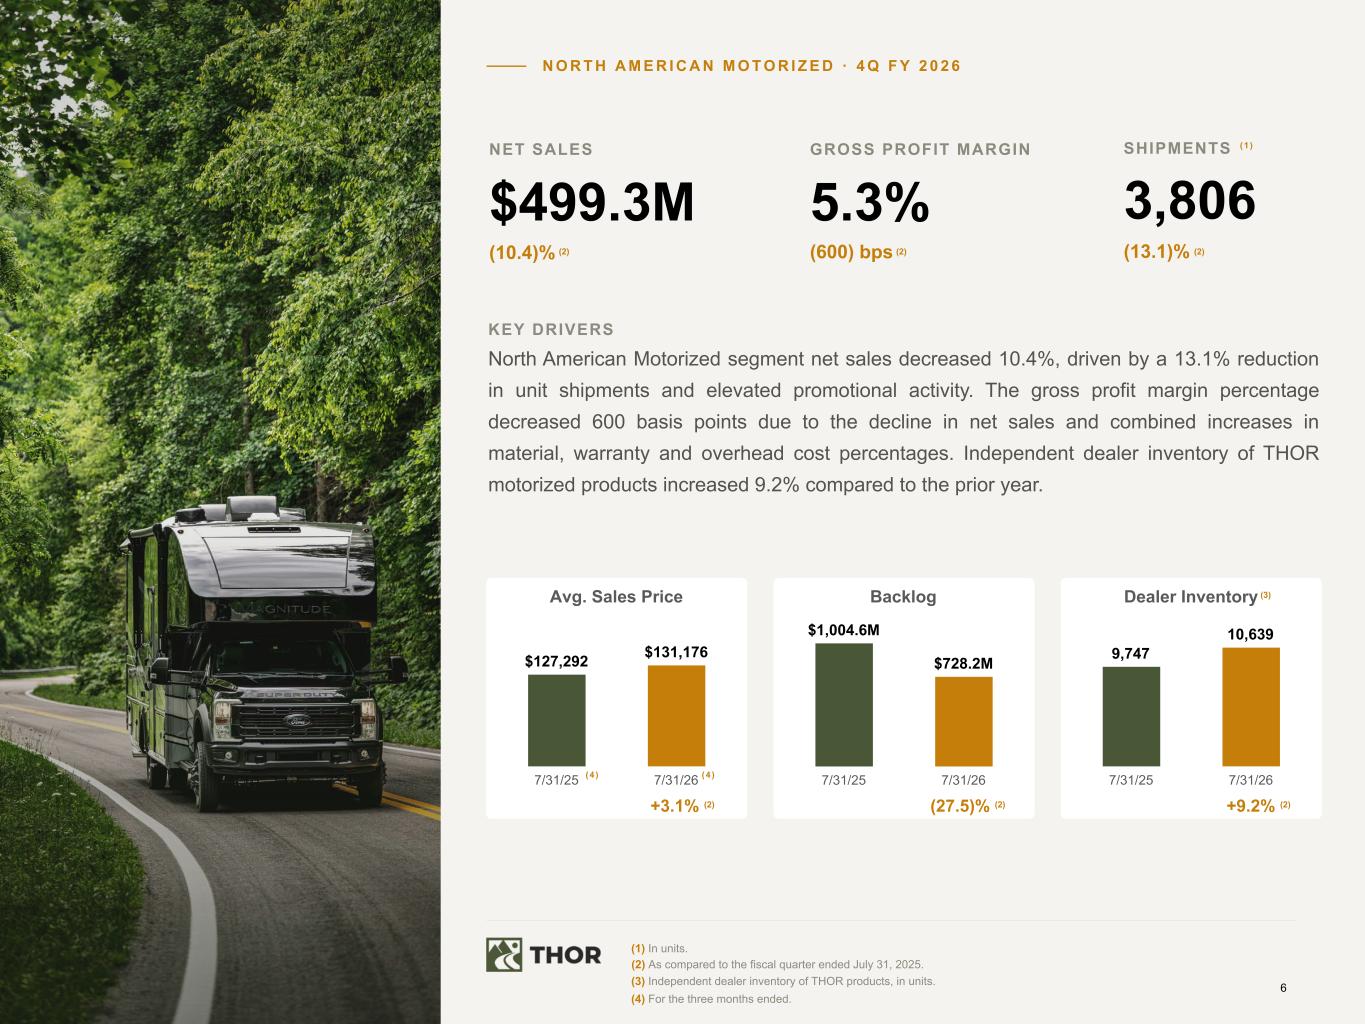
6 N O R T H A M E R I C A N M O T O R I Z E D · 4 Q F Y 2 0 2 6 (1) In units. (2) As compared to the fiscal quarter ended July 31, 2025. (4) For the three months ended. (27.5)% (2) KEY DRIVERS North American Motorized segment net sales decreased 10.4%, driven by a 13.1% reduction in unit shipments and elevated promotional activity. The gross profit margin percentage decreased 600 basis points due to the decline in net sales and combined increases in material, warranty and overhead cost percentages. Independent dealer inventory of THOR motorized products increased 9.2% compared to the prior year. +9.2% (2) NET SALES $499.3M (10.4)% GROSS PROFIT MARGIN 5.3% (600) bps SHIPMENTS 3,806 (13.1)%(2) (1 ) Avg. Sales Price $127,292 $131,176 7/31/25 7/31/26 Backlog $1,004.6M $728.2M 7/31/25 7/31/26 Dealer Inventory 9,747 10,639 7/31/25 7/31/26 (3) (2) (2) (4 ) (4 ) +3.1% (2) (3) Independent dealer inventory of THOR products, in units.
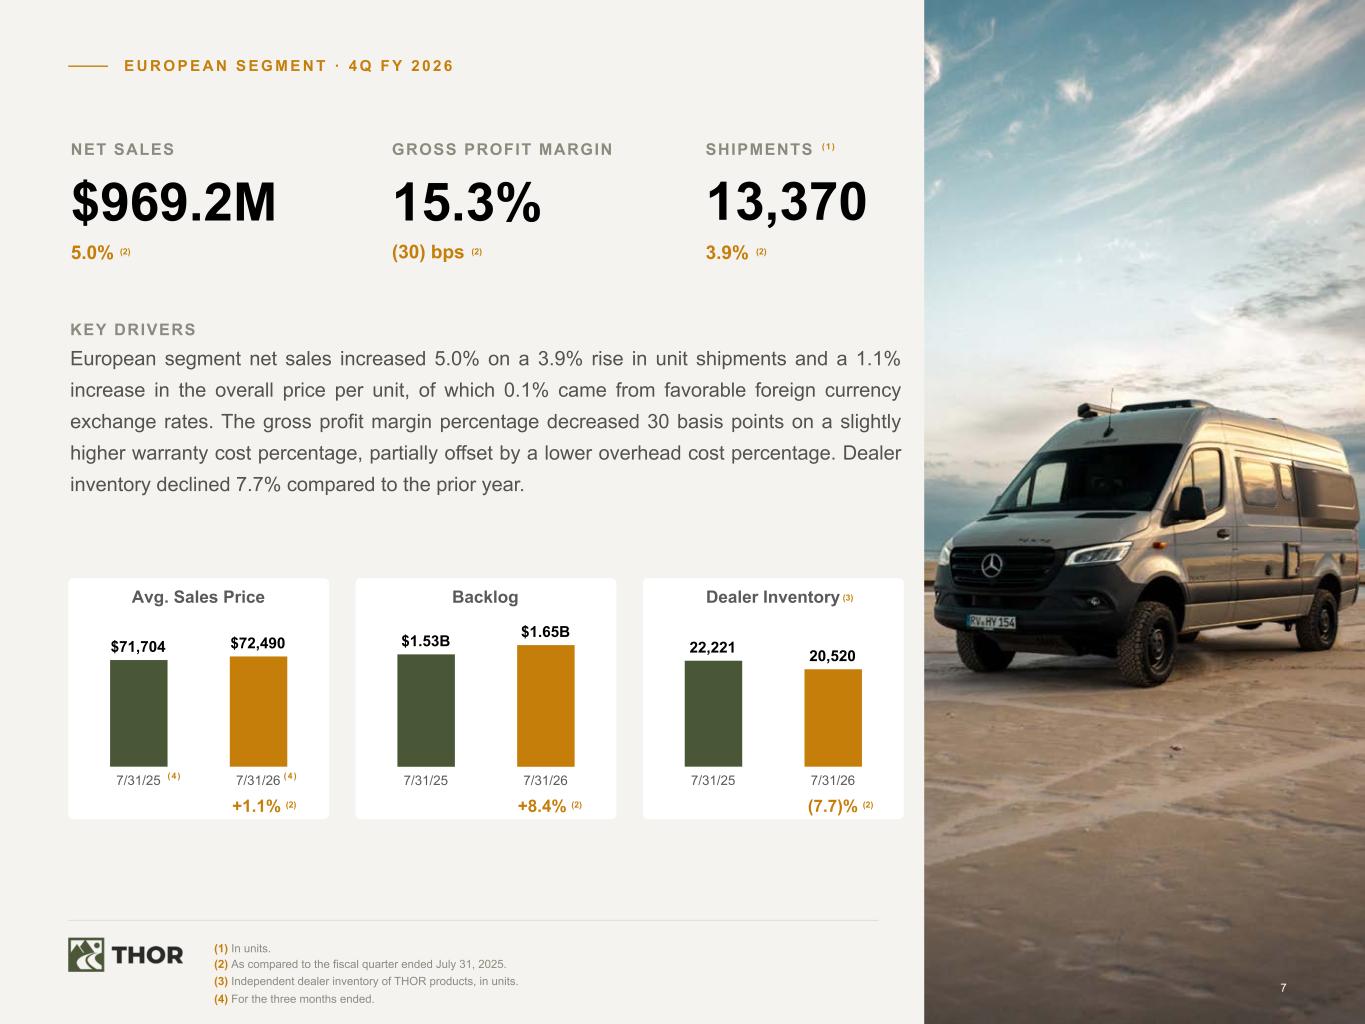
7 E U R O P E A N S E G M E N T · 4 Q F Y 2 0 2 6 (1) In units. (2) As compared to the fiscal quarter ended July 31, 2025. (4) For the three months ended. +8.4% (2) KEY DRIVERS European segment net sales increased 5.0% on a 3.9% rise in unit shipments and a 1.1% increase in the overall price per unit, of which 0.1% came from favorable foreign currency exchange rates. The gross profit margin percentage decreased 30 basis points on a slightly higher warranty cost percentage, partially offset by a lower overhead cost percentage. Dealer inventory declined 7.7% compared to the prior year. (7.7)% (2) NET SALES $969.2M 5.0% GROSS PROFIT MARGIN 15.3% (30) bps SHIPMENTS 13,370 3.9%(2) (1 ) Avg. Sales Price $71,704 $72,490 7/31/25 7/31/26 Backlog $1.53B $1.65B 7/31/25 7/31/26 Dealer Inventory 22,221 20,520 7/31/25 7/31/26 (3) (2) (2) (4 ) (4 ) +1.1% (2) (3) Independent dealer inventory of THOR products, in units.
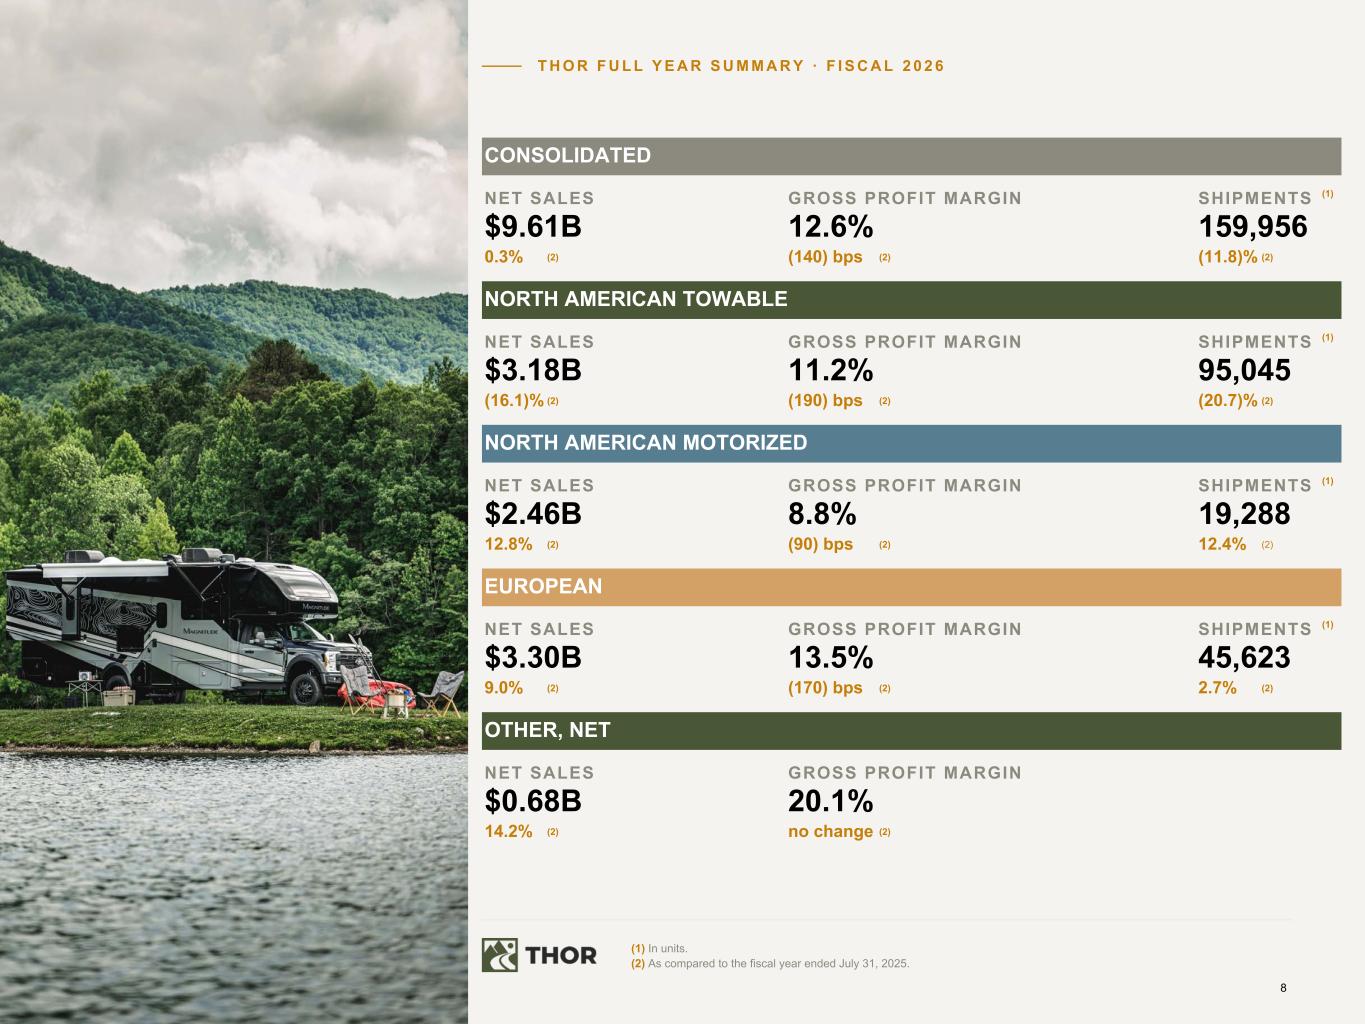
8 T H O R F U L L Y E A R S U M M A R Y · F I S C A L 2 0 2 6 (1) In units. (2) As compared to the fiscal year ended July 31, 2025. CONSOLIDATED NET SALES GROSS PROFIT MARGIN SHIPMENTS (1) $9.61B 12.6% 159,956 0.3% (2) (140) bps (2) (11.8)% (2) NORTH AMERICAN TOWABLE NET SALES GROSS PROFIT MARGIN SHIPMENTS (1) $3.18B 11.2% 95,045 (16.1)% (2) (190) bps (2) (20.7)% (2) NORTH AMERICAN MOTORIZED NET SALES GROSS PROFIT MARGIN SHIPMENTS (1) $2.46B 8.8% 19,288 12.8% (2) (90) bps (2) 12.4% (2) EUROPEAN NET SALES GROSS PROFIT MARGIN SHIPMENTS (1) $3.30B 13.5% 45,623 9.0% (2) (170) bps (2) 2.7% (2) OTHER, NET NET SALES GROSS PROFIT MARGIN $0.68B 20.1% 14.2% (2) no change (2)
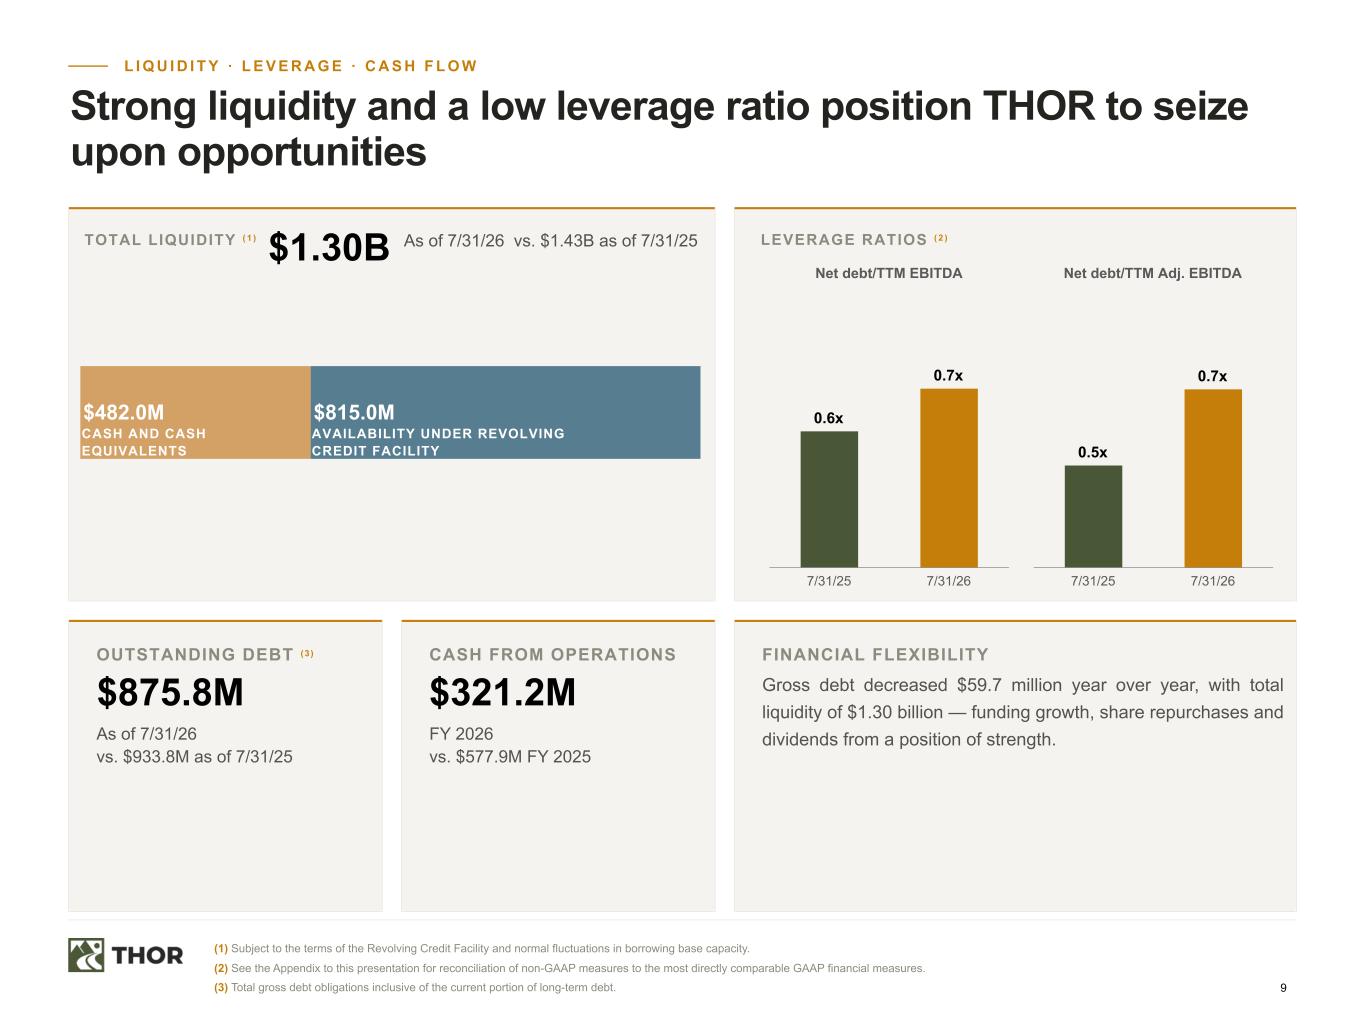
9 L I Q U I D I T Y · L E V E R A G E · C A S H F L O W Strong liquidity and a low leverage ratio position THOR to seize upon opportunities TOTAL LIQUIDITY ( 1 ) $1.30B As of 7/31/26 vs. $1.43B as of 7/31/25 LEVERAGE RATIOS ( 2 ) OUTSTANDING DEBT (3 ) $875.8M As of 7/31/26 vs. $933.8M as of 7/31/25 CASH FROM OPERATIONS $321.2M FY 2026 vs. $577.9M FY 2025 FINANCIAL FLEXIBILITY Gross debt decreased $59.7 million year over year, with total liquidity of $1.30 billion — funding growth, share repurchases and dividends from a position of strength. (2) See the Appendix to this presentation for reconciliation of non-GAAP measures to the most directly comparable GAAP financial measures. (3) Total gross debt obligations inclusive of the current portion of long-term debt. $482.0M $815.0M CASH AND CASH EQUIVALENTS AVAILABILITY UNDER REVOLVING CREDIT FACILITY Net debt/TTM EBITDA 0.6x 0.7x 7/31/25 7/31/26 Net debt/TTM Adj. EBITDA 0.5x 0.7x 7/31/25 7/31/26 (1) Subject to the terms of the Revolving Credit Facility and normal fluctuations in borrowing base capacity.
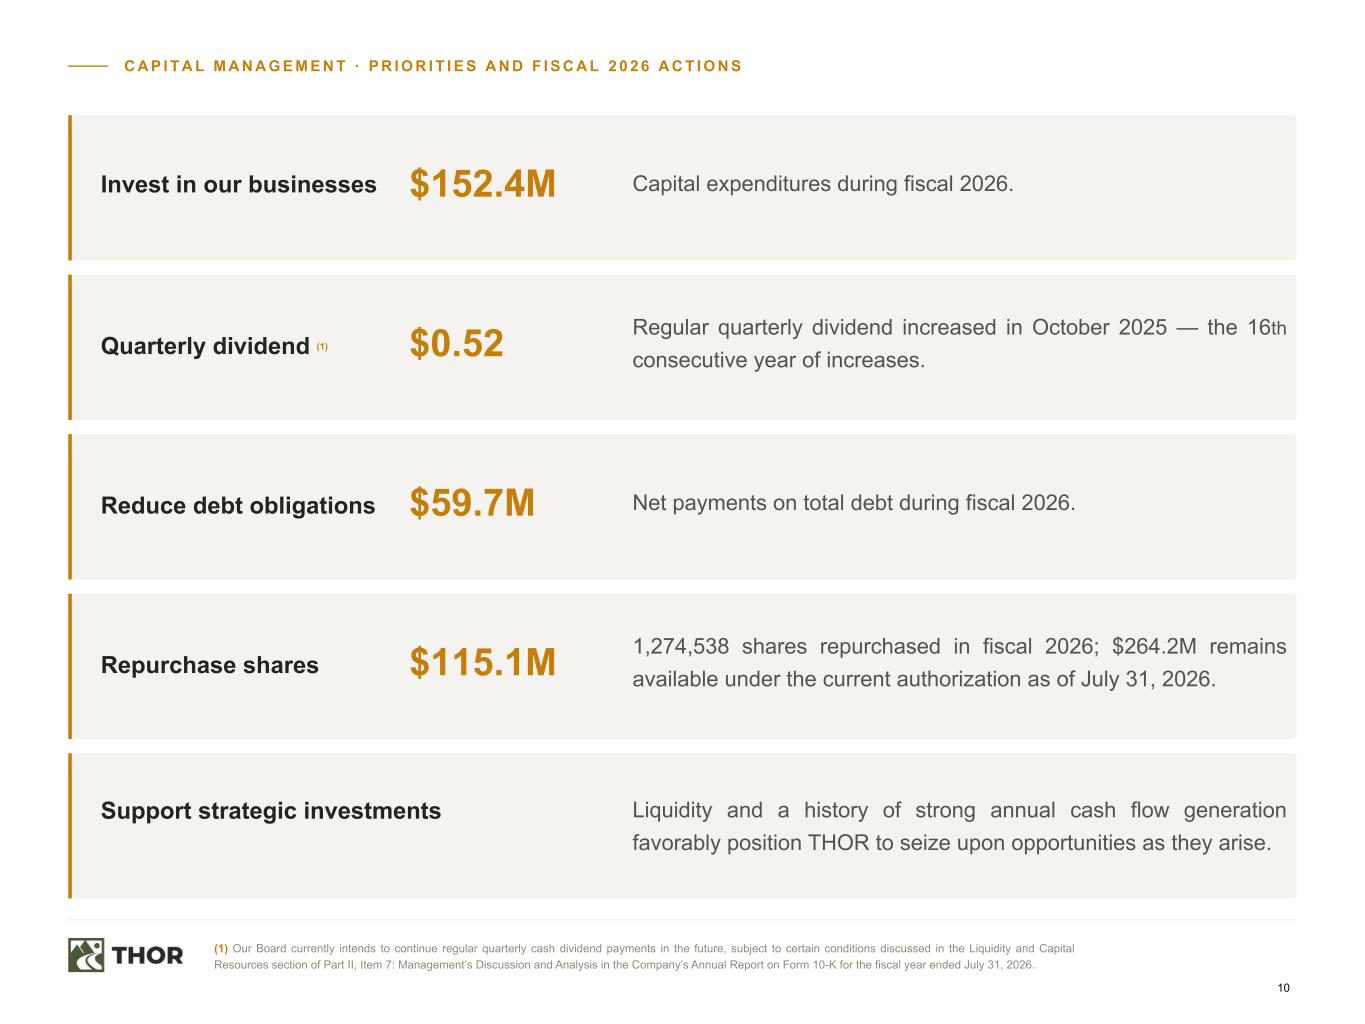
10 C A P I T A L M A N A G E M E N T · P R I O R I T I E S A N D F I S C A L 2 0 2 6 A C T I O N S Invest in our businesses $152.4M Capital expenditures during fiscal 2026. Quarterly dividend (1) $0.52 Regular quarterly dividend increased in October 2025 — the 16th consecutive year of increases. Reduce debt obligations $59.7M Net payments on total debt during fiscal 2026. Repurchase shares $115.1M 1,274,538 shares repurchased in fiscal 2026; $264.2M remains available under the current authorization as of July 31, 2026. Support strategic investments Liquidity and a history of strong annual cash flow generation favorably position THOR to seize upon opportunities as they arise. (1) Our Board currently intends to continue regular quarterly cash dividend payments in the future, subject to certain conditions discussed in the Liquidity and Capital Resources section of Part II, Item 7: Management’s Discussion and Analysis in the Company’s Annual Report on Form 10-K for the fiscal year ended July 31, 2026.
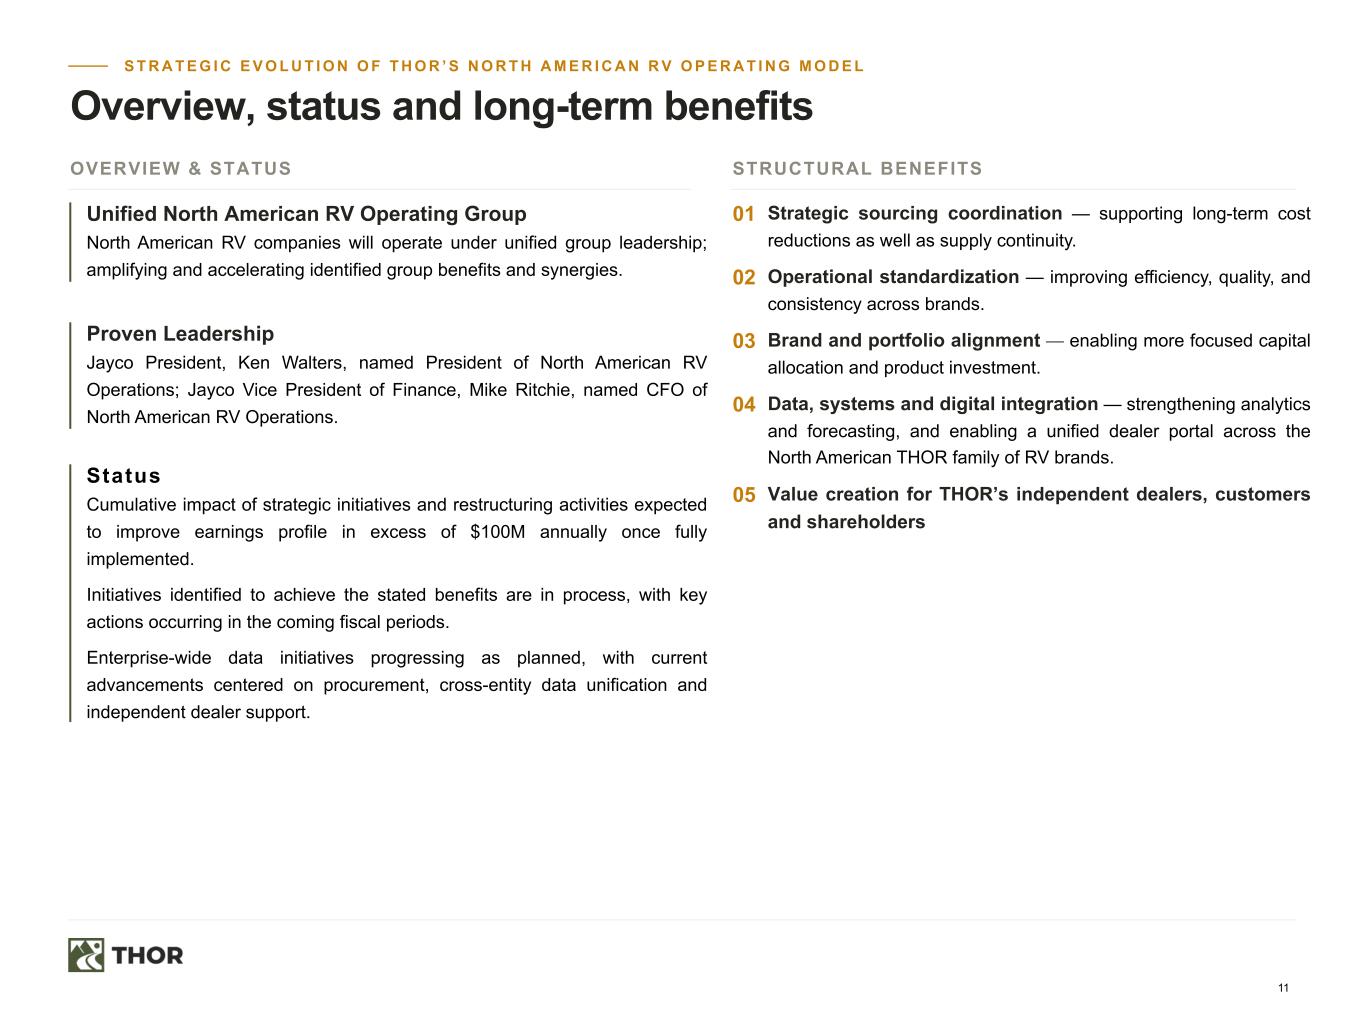
11 S T R A T E G I C E V O L U T I O N O F T H O R ’ S N O R T H A M E R I C A N R V O P E R A T I N G M O D E L Overview, status and long-term benefits OVERVIEW & STATUS Unified North American RV Operating Group North American RV companies will operate under unified group leadership; amplifying and accelerating identified group benefits and synergies. Proven Leadership Jayco President, Ken Walters, named President of North American RV Operations; Jayco Vice President of Finance, Mike Ritchie, named CFO of North American RV Operations. Status Cumulative impact of strategic initiatives and restructuring activities expected to improve earnings profile in excess of $100M annually once fully implemented. Initiatives identified to achieve the stated benefits are in process, with key actions occurring in the coming fiscal periods. Enterprise-wide data initiatives progressing as planned, with current advancements centered on procurement, cross-entity data unification and independent dealer support. STRUCTURAL BENEFITS 01 Strategic sourcing coordination — supporting long-term cost reductions as well as supply continuity. 02 Operational standardization — improving efficiency, quality, and consistency across brands. 03 Brand and portfolio alignment — enabling more focused capital allocation and product investment. 04 Data, systems and digital integration — strengthening analytics and forecasting, and enabling a unified dealer portal across the North American THOR family of RV brands. 05 Value creation for THOR’s independent dealers, customers and shareholders
12 Appendix Non-GAAP reconciliations · Industry and market data
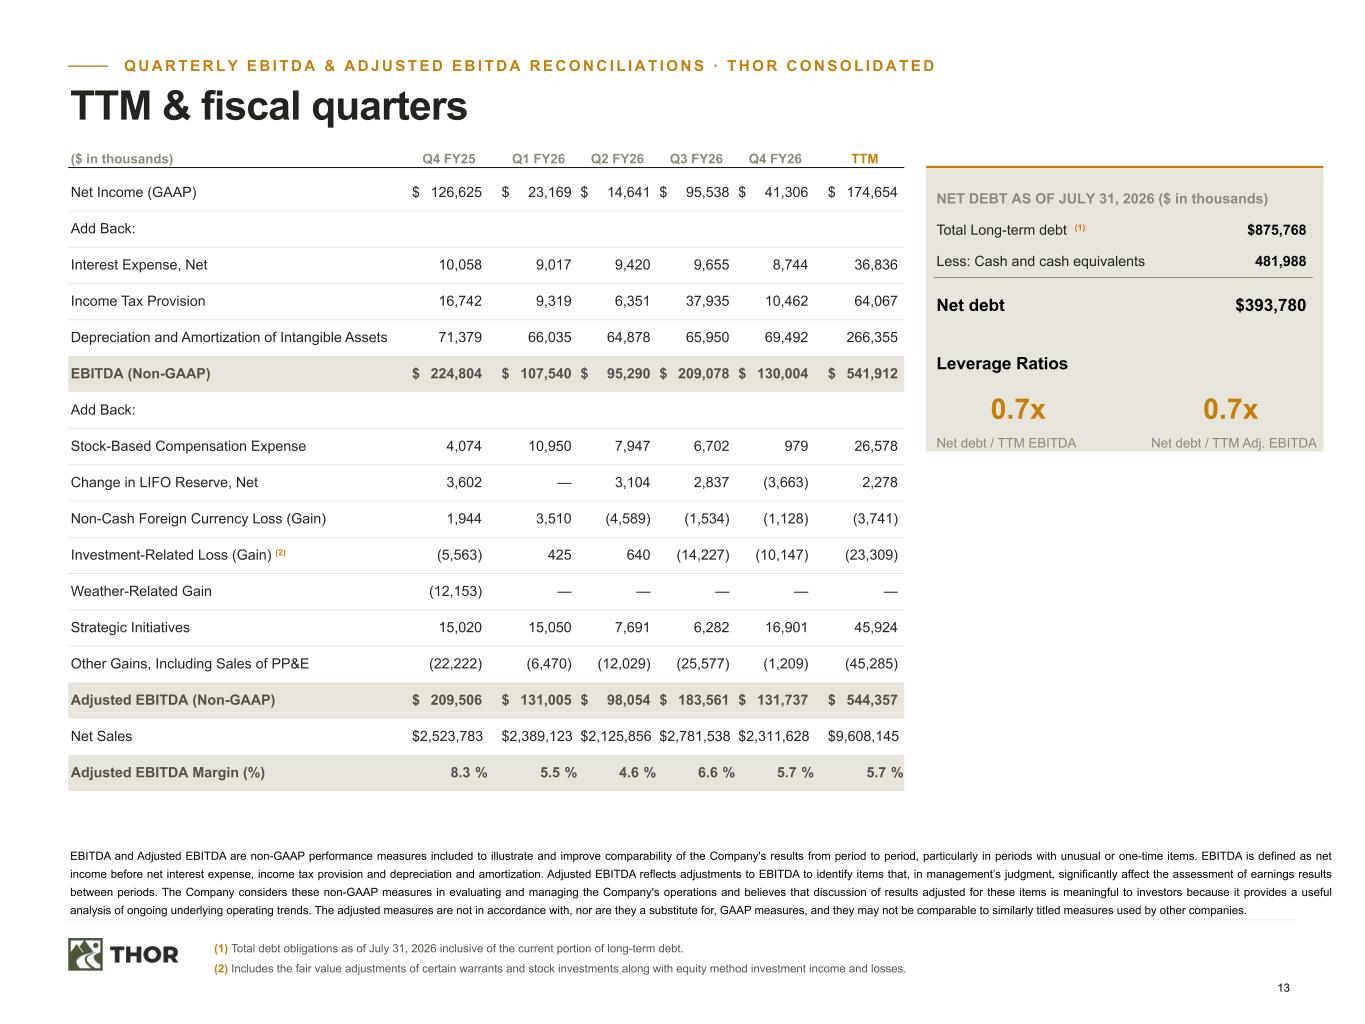
13 Q U A R T E R L Y E B I T D A & A D J U S T E D E B I T D A R E C O N C I L I A T I O N S · T H O R C O N S O L I D A T E D TTM & fiscal quarters EBITDA and Adjusted EBITDA are non-GAAP performance measures included to illustrate and improve comparability of the Company's results from period to period, particularly in periods with unusual or one-time items. EBITDA is defined as net income before net interest expense, income tax provision and depreciation and amortization. Adjusted EBITDA reflects adjustments to EBITDA to identify items that, in management’s judgment, significantly affect the assessment of earnings results between periods. The Company considers these non-GAAP measures in evaluating and managing the Company's operations and believes that discussion of results adjusted for these items is meaningful to investors because it provides a useful analysis of ongoing underlying operating trends. The adjusted measures are not in accordance with, nor are they a substitute for, GAAP measures, and they may not be comparable to similarly titled measures used by other companies. (1) Total debt obligations as of July 31, 2026 inclusive of the current portion of long-term debt. (2) Includes the fair value adjustments of certain warrants and stock investments along with equity method investment income and losses. ($ in thousands) Q4 FY25 Q1 FY26 Q2 FY26 Q3 FY26 Q4 FY26 TTM Net Income (GAAP) $ 126,625 $ 23,169 $ 14,641 $ 95,538 $ 41,306 $ 174,654 Add Back: Interest Expense, Net 10,058 9,017 9,420 9,655 8,744 36,836 Income Tax Provision 16,742 9,319 6,351 37,935 10,462 64,067 Depreciation and Amortization of Intangible Assets 71,379 66,035 64,878 65,950 69,492 266,355 EBITDA (Non-GAAP) $ 224,804 $ 107,540 $ 95,290 $ 209,078 $ 130,004 $ 541,912 Add Back: Stock-Based Compensation Expense 4,074 10,950 7,947 6,702 979 26,578 Change in LIFO Reserve, Net 3,602 — 3,104 2,837 (3,663) 2,278 Non-Cash Foreign Currency Loss (Gain) 1,944 3,510 (4,589) (1,534) (1,128) (3,741) Investment-Related Loss (Gain) (2) (5,563) 425 640 (14,227) (10,147) (23,309) Weather-Related Gain (12,153) — — — — — Strategic Initiatives 15,020 15,050 7,691 6,282 16,901 45,924 Other Gains, Including Sales of PP&E (22,222) (6,470) (12,029) (25,577) (1,209) (45,285) Adjusted EBITDA (Non-GAAP) $ 209,506 $ 131,005 $ 98,054 $ 183,561 $ 131,737 $ 544,357 Net Sales $ 2,523,783 $ 2,389,123 $ 2,125,856 $ 2,781,538 $ 2,311,628 $ 9,608,145 Adjusted EBITDA Margin (%) 8.3 % 5.5 % 4.6 % 6.6 % 5.7 % 5.7 % NET DEBT AS OF JULY 31, 2026 ($ in thousands) Total Long-term debt (1) $875,768 Less: Cash and cash equivalents 481,988 Net debt $393,780 Leverage Ratios 0.7x 0.7x Net debt / TTM EBITDA Net debt / TTM Adj. EBITDA
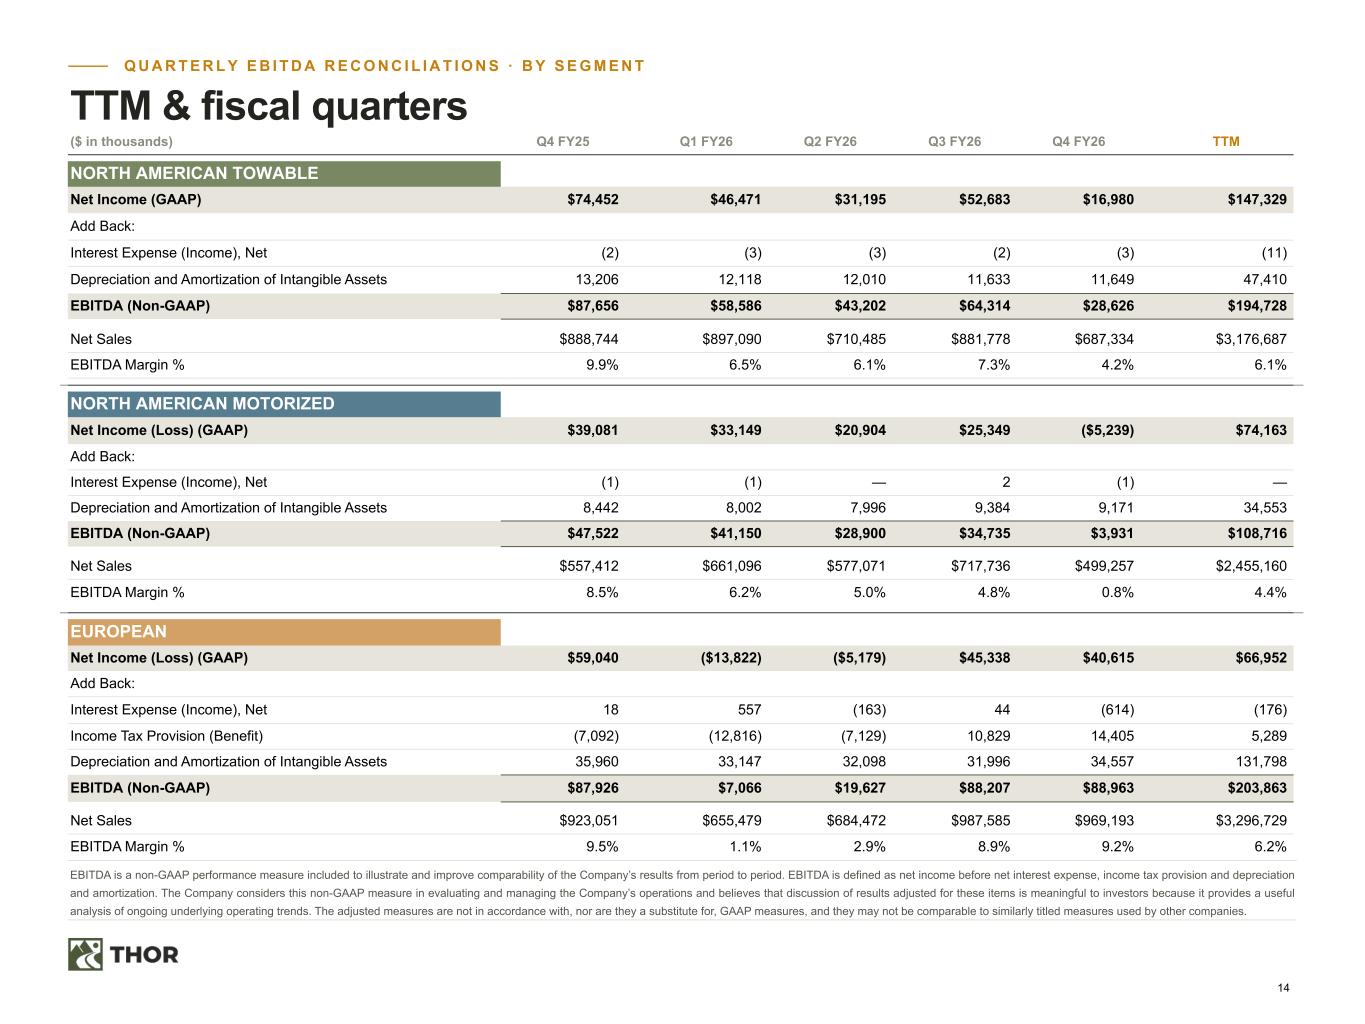
14 Q U A R T E R L Y E B I T D A R E C O N C I L I A T I O N S · B Y S E G M E N T TTM & fiscal quarters EBITDA is a non-GAAP performance measure included to illustrate and improve comparability of the Company’s results from period to period. EBITDA is defined as net income before net interest expense, income tax provision and depreciation and amortization. The Company considers this non-GAAP measure in evaluating and managing the Company’s operations and believes that discussion of results adjusted for these items is meaningful to investors because it provides a useful analysis of ongoing underlying operating trends. The adjusted measures are not in accordance with, nor are they a substitute for, GAAP measures, and they may not be comparable to similarly titled measures used by other companies. ($ in thousands) Q4 FY25 Q1 FY26 Q2 FY26 Q3 FY26 Q4 FY26 TTM NORTH AMERICAN TOWABLE Net Income (GAAP) $74,452 $46,471 $31,195 $52,683 $16,980 $147,329 Add Back: Interest Expense (Income), Net (2) (3) (3) (2) (3) (11) Depreciation and Amortization of Intangible Assets 13,206 12,118 12,010 11,633 11,649 47,410 EBITDA (Non-GAAP) $87,656 $58,586 $43,202 $64,314 $28,626 $194,728 Net Sales $888,744 $897,090 $710,485 $881,778 $687,334 $3,176,687 EBITDA Margin % 9.9 % 6.5 % 6.1 % 7.3 % 4.2 % 6.1 % NORTH AMERICAN MOTORIZED Net Income (Loss) (GAAP) $39,081 $33,149 $20,904 $25,349 ($5,239) $74,163 Add Back: Interest Expense (Income), Net (1) (1) — 2 (1) — Depreciation and Amortization of Intangible Assets 8,442 8,002 7,996 9,384 9,171 34,553 EBITDA (Non-GAAP) $47,522 $41,150 $28,900 $34,735 $3,931 $108,716 Net Sales $557,412 $661,096 $577,071 $717,736 $499,257 $2,455,160 EBITDA Margin % 8.5 % 6.2 % 5.0 % 4.8 % 0.8 % 4.4 % EUROPEAN Net Income (Loss) (GAAP) $59,040 ($13,822) ($5,179) $45,338 $40,615 $66,952 Add Back: Interest Expense (Income), Net 18 557 (163) 44 (614) (176) Income Tax Provision (Benefit) (7,092) (12,816) (7,129) 10,829 14,405 5,289 Depreciation and Amortization of Intangible Assets 35,960 33,147 32,098 31,996 34,557 131,798 EBITDA (Non-GAAP) $87,926 $7,066 $19,627 $88,207 $88,963 $203,863 Net Sales $923,051 $655,479 $684,472 $987,585 $969,193 $3,296,729 EBITDA Margin % 9.5 % 1.1 % 2.9 % 8.9 % 9.2 % 6.2 %
15 T H E T H O R F A M I L Y O F B R A N D S We consist of a trusted family of brands that are loved by RV consumers NORTH AMERICAN RV BRANDS EUROPEAN RV BRANDS AND SERVICES OWNED SUPPLIERS
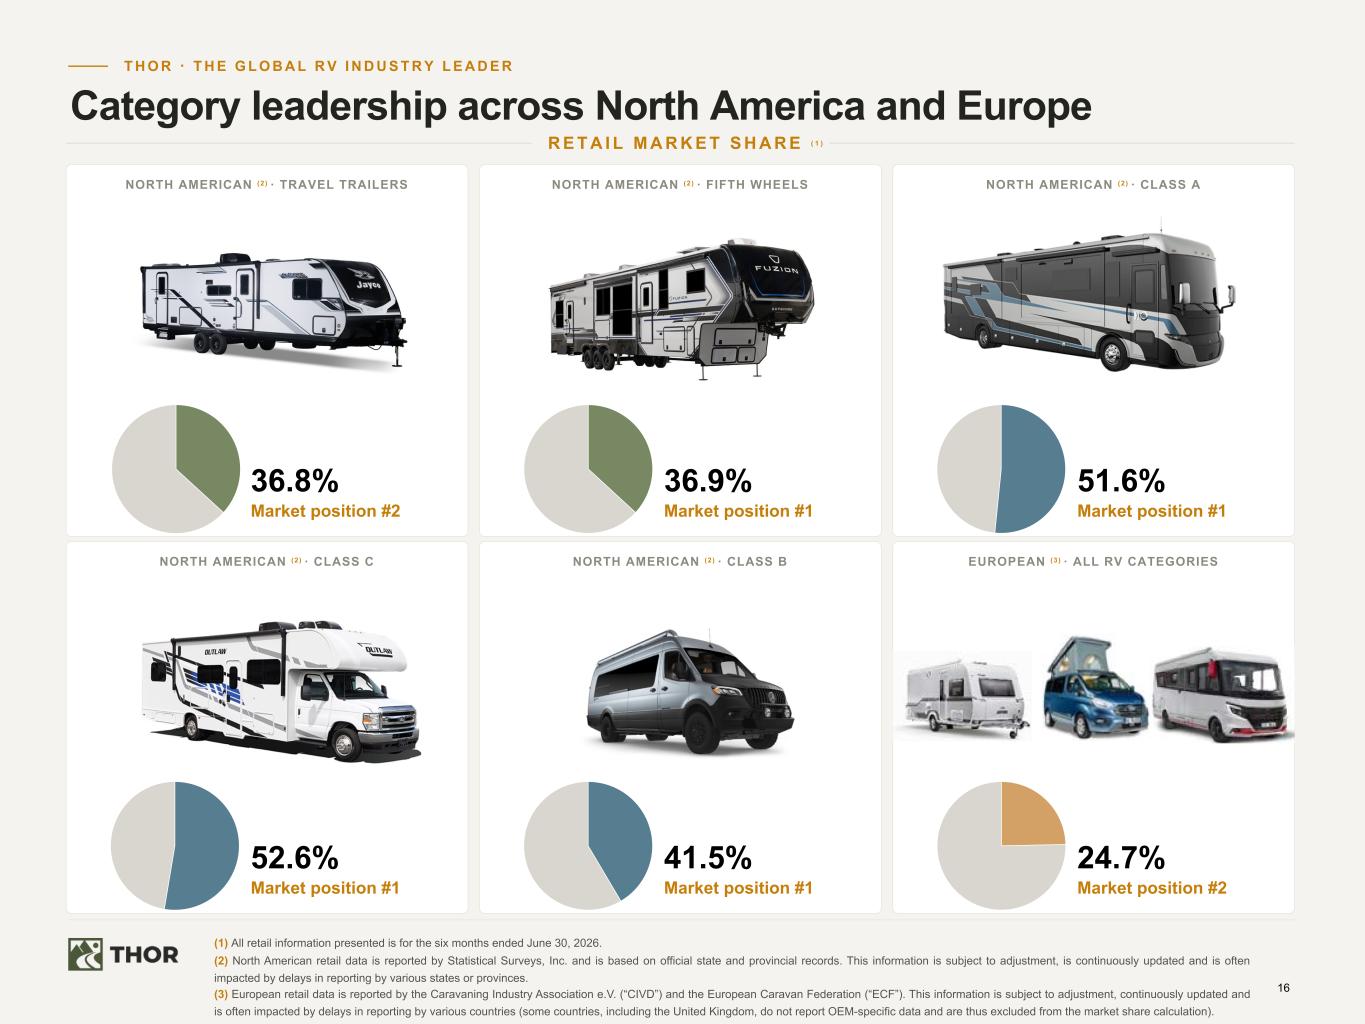
16 T H O R · T H E G L O B A L R V I N D U S T R Y L E A D E R Category leadership across North America and Europe R E T A I L M A R K E T S H A R E ( 1 ) NORTH AMERICAN (2 ) · TRAVEL TRAILERS 36.8% Market position #2 NORTH AMERICAN (2 ) · FIFTH WHEELS 36.9% Market position #1 51.6% Market position #1 NORTH AMERICAN (2 ) · CLASS C 52.6% Market position #1 NORTH AMERICAN (2 ) · CLASS B 41.5% Market position #1 EUROPEAN (3 ) · ALL RV CATEGORIES 24.7% Market position #2 (1) All retail information presented is for the six months ended June 30, 2026. (2) North American retail data is reported by Statistical Surveys, Inc. and is based on official state and provincial records. This information is subject to adjustment, is continuously updated and is often impacted by delays in reporting by various states or provinces. (3) European retail data is reported by the Caravaning Industry Association e.V. (“CIVD”) and the European Caravan Federation (“ECF”). This information is subject to adjustment, continuously updated and is often impacted by delays in reporting by various countries (some countries, including the United Kingdom, do not report OEM-specific data and are thus excluded from the market share calculation). NORTH AMERICAN (2 ) · CLASS A
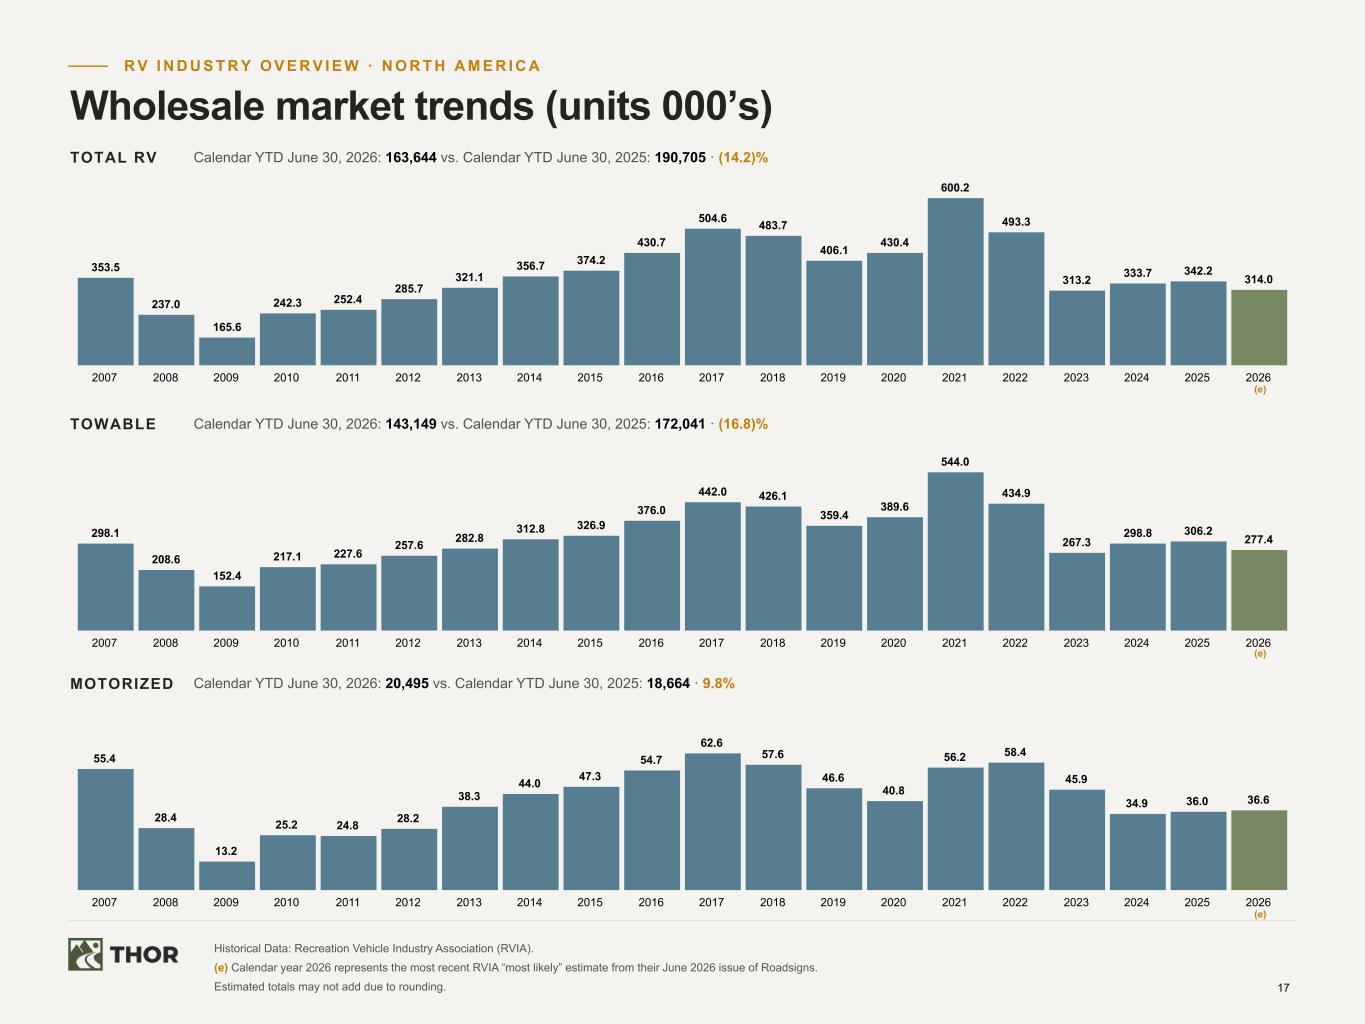
17 55.4 28.4 13.2 25.2 24.8 28.2 38.3 44.0 47.3 54.7 62.6 57.6 46.6 40.8 56.2 58.4 45.9 34.9 36.0 36.6 2007 2008 2009 2010 2011 2012 2013 2014 2015 2016 2017 2018 2019 2020 2021 2022 2023 2024 2025 2026 298.1 208.6 152.4 217.1 227.6 257.6 282.8 312.8 326.9 376.0 442.0 426.1 359.4 389.6 544.0 434.9 267.3 298.8 306.2 277.4 2007 2008 2009 2010 2011 2012 2013 2014 2015 2016 2017 2018 2019 2020 2021 2022 2023 2024 2025 2026 353.5 237.0 165.6 242.3 252.4 285.7 321.1 356.7 374.2 430.7 504.6 483.7 406.1 430.4 600.2 493.3 313.2 333.7 342.2 314.0 2007 2008 2009 2010 2011 2012 2013 2014 2015 2016 2017 2018 2019 2020 2021 2022 2023 2024 2025 2026 R V I N D U S T R Y O V E R V I E W · N O R T H A M E R I C A Wholesale market trends (units 000’s) TOTAL RV Calendar YTD June 30, 2026: 163,644 vs. Calendar YTD June 30, 2025: 190,705 · (14.2)% TOWABLE Calendar YTD June 30, 2026: 143,149 vs. Calendar YTD June 30, 2025: 172,041 · (16.8)% MOTORIZED Calendar YTD June 30, 2026: 20,495 vs. Calendar YTD June 30, 2025: 18,664 · 9.8% Historical Data: Recreation Vehicle Industry Association (RVIA). (e) Calendar year 2026 represents the most recent RVIA “most likely” estimate from their June 2026 issue of Roadsigns. Estimated totals may not add due to rounding. (e) (e) (e)
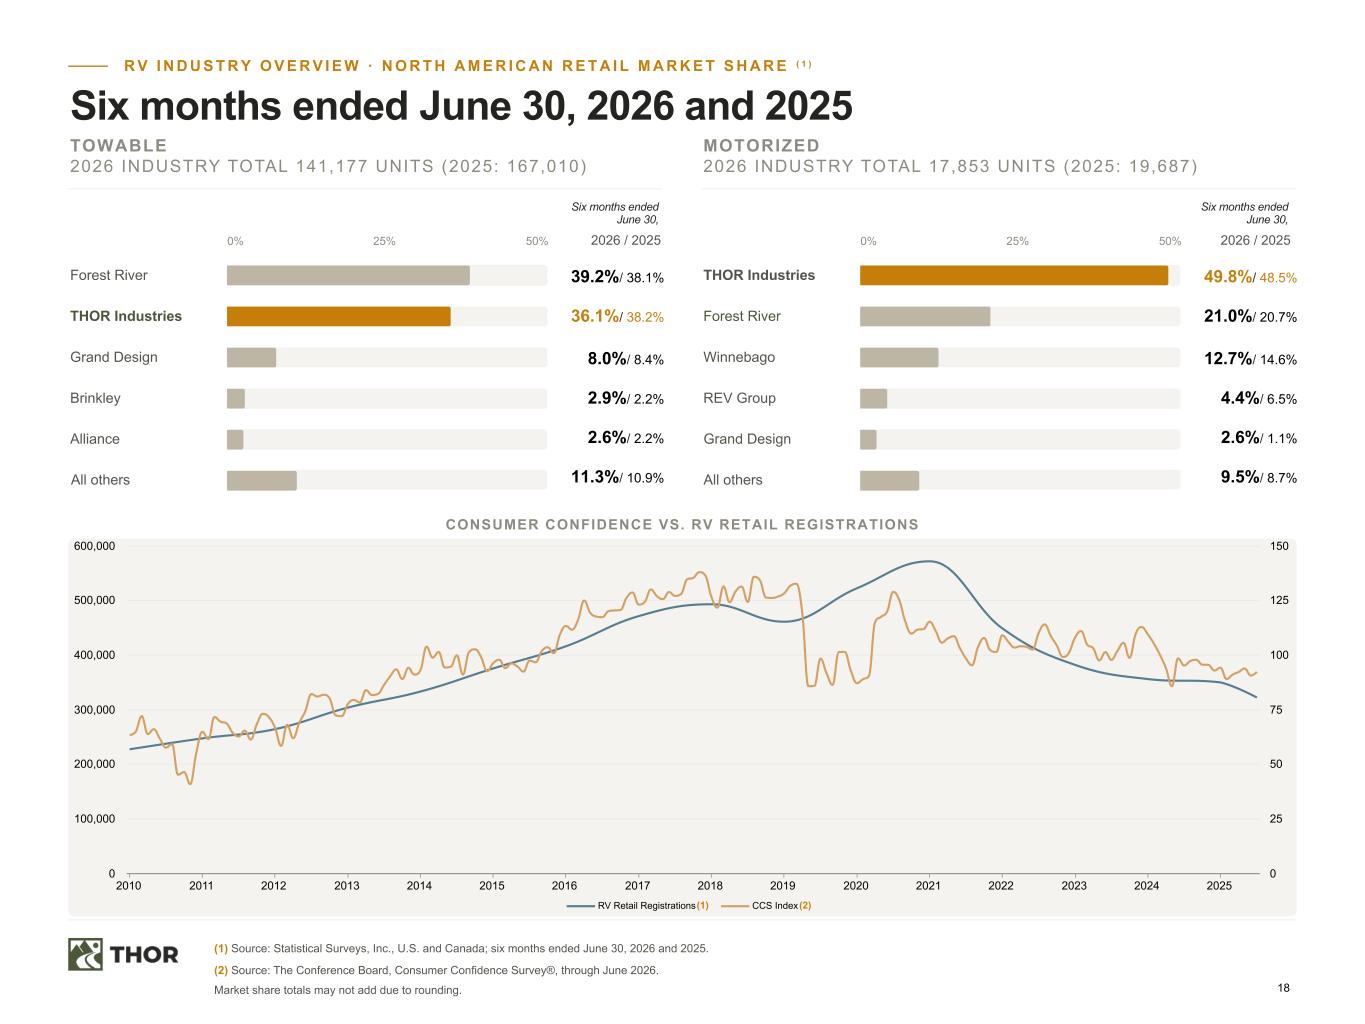
18 R V I N D U S T R Y O V E R V I E W · N O R T H A M E R I C A N R E T A I L M A R K E T S H A R E ( 1 ) Six months ended June 30, 2026 and 2025 TOWABLE 2026 INDUSTRY TOTAL 141,177 UNITS (2025: 167,010) 0% 25% 50% Six months ended June 30, 2026 / 2025 Forest River 39.2%/ 38.1% THOR Industries 36.1%/ 38.2% Grand Design 8.0%/ 8.4% Brinkley 2.9%/ 2.2% Alliance 2.6%/ 2.2% All others 11.3%/ 10.9% MOTORIZED 2026 INDUSTRY TOTAL 17,853 UNITS (2025: 19,687) CONSUMER CONFIDENCE VS. RV RETAIL REGISTRATIONS (1) Source: Statistical Surveys, Inc., U.S. and Canada; six months ended June 30, 2026 and 2025. (2) Source: The Conference Board, Consumer Confidence Survey®, through June 2026. Market share totals may not add due to rounding. 0% 25% 50% Six months ended June 30, 2026 / 2025 THOR Industries 49.8%/ 48.5% Forest River 21.0%/ 20.7% Winnebago 12.7%/ 14.6% REV Group 4.4%/ 6.5% Grand Design 2.6%/ 1.1% All others 9.5%/ 8.7% RV Retail Registrations CCS Index 2010 2011 2012 2013 2014 2015 2016 2017 2018 2019 2020 2021 2022 2023 2024 2025 0 100,000 200,000 300,000 400,000 500,000 600,000 0 25 50 75 100 125 150 (1) (2)
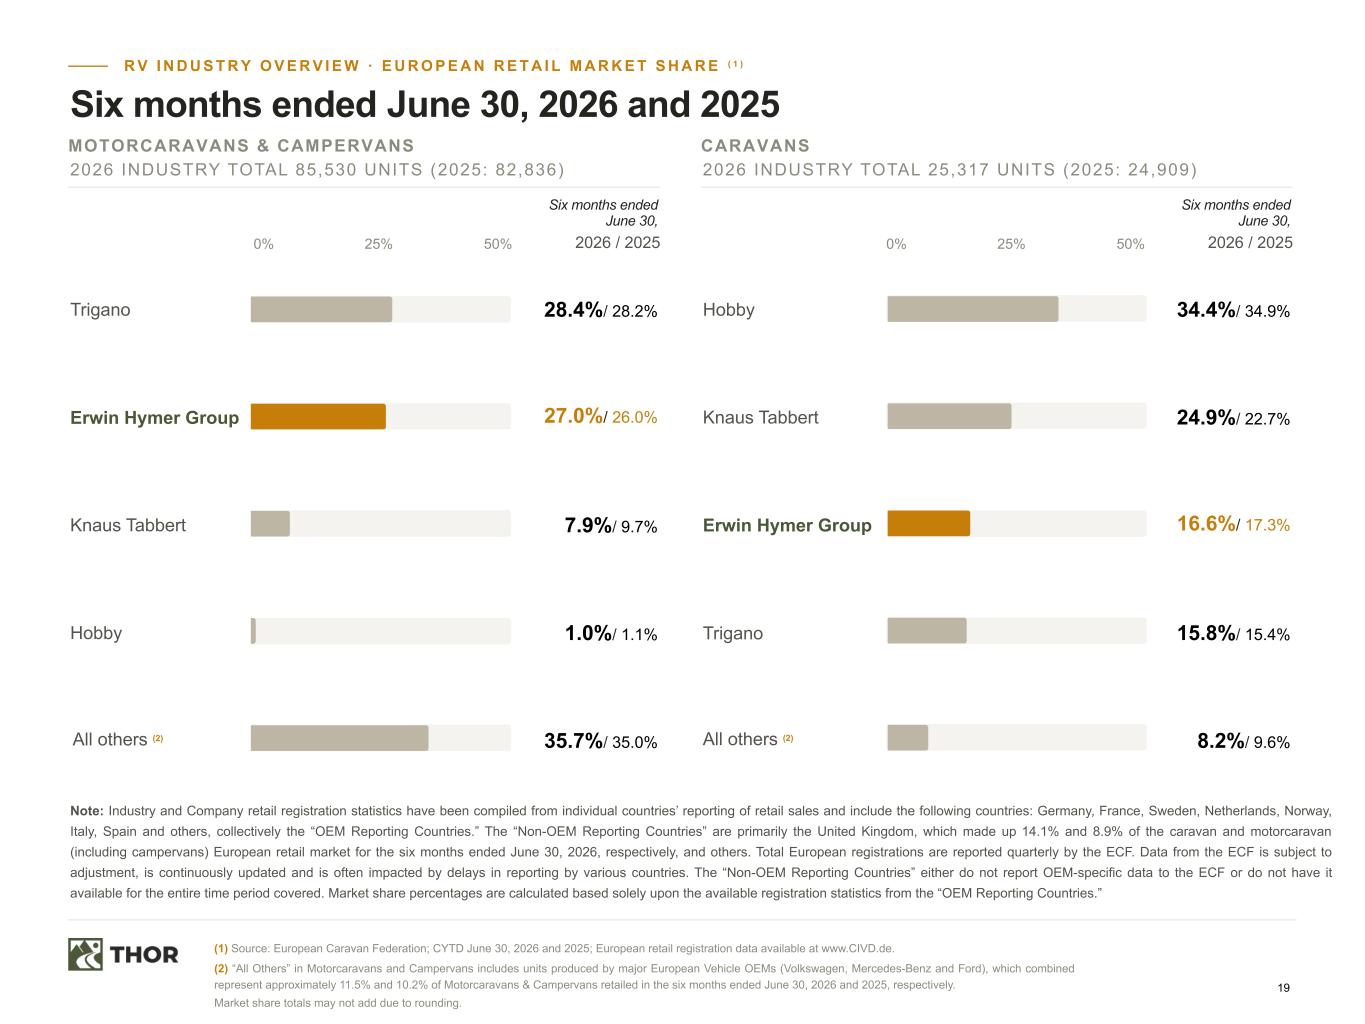
19 R V I N D U S T R Y O V E R V I E W · E U R O P E A N R E T A I L M A R K E T S H A R E ( 1 ) Six months ended June 30, 2026 and 2025 CARAVANS 2026 INDUSTRY TOTAL 25,317 UNITS (2025: 24,909) 0% 25% 50% Six months ended June 30, 2026 / 2025 Hobby 34.4%/ 34.9% Knaus Tabbert 24.9%/ 22.7% Erwin Hymer Group 16.6%/ 17.3% Trigano 15.8%/ 15.4% All others (2) 8.2%/ 9.6% MOTORCARAVANS & CAMPERVANS 2026 INDUSTRY TOTAL 85,530 UNITS (2025: 82,836) 0% 25% 50% Six months ended June 30, 2026 / 2025 Trigano 28.4%/ 28.2% Erwin Hymer Group 27.0%/ 26.0% Knaus Tabbert 7.9%/ 9.7% Hobby 1.0%/ 1.1% 35.7%/ 35.0% Note: Industry and Company retail registration statistics have been compiled from individual countries’ reporting of retail sales and include the following countries: Germany, France, Sweden, Netherlands, Norway, Italy, Spain and others, collectively the “OEM Reporting Countries.” The “Non-OEM Reporting Countries” are primarily the United Kingdom, which made up 14.1% and 8.9% of the caravan and motorcaravan (including campervans) European retail market for the six months ended June 30, 2026, respectively, and others. Total European registrations are reported quarterly by the ECF. Data from the ECF is subject to adjustment, is continuously updated and is often impacted by delays in reporting by various countries. The “Non-OEM Reporting Countries” either do not report OEM-specific data to the ECF or do not have it available for the entire time period covered. Market share percentages are calculated based solely upon the available registration statistics from the “OEM Reporting Countries.” (1) Source: European Caravan Federation; CYTD June 30, 2026 and 2025; European retail registration data available at www.CIVD.de. (2) “All Others” in Motorcaravans and Campervans includes units produced by major European Vehicle OEMs (Volkswagen, Mercedes-Benz and Ford), which combined represent approximately 11.5% and 10.2% of Motorcaravans & Campervans retailed in the six months ended June 30, 2026 and 2025, respectively. All others (2) Market share totals may not add due to rounding.
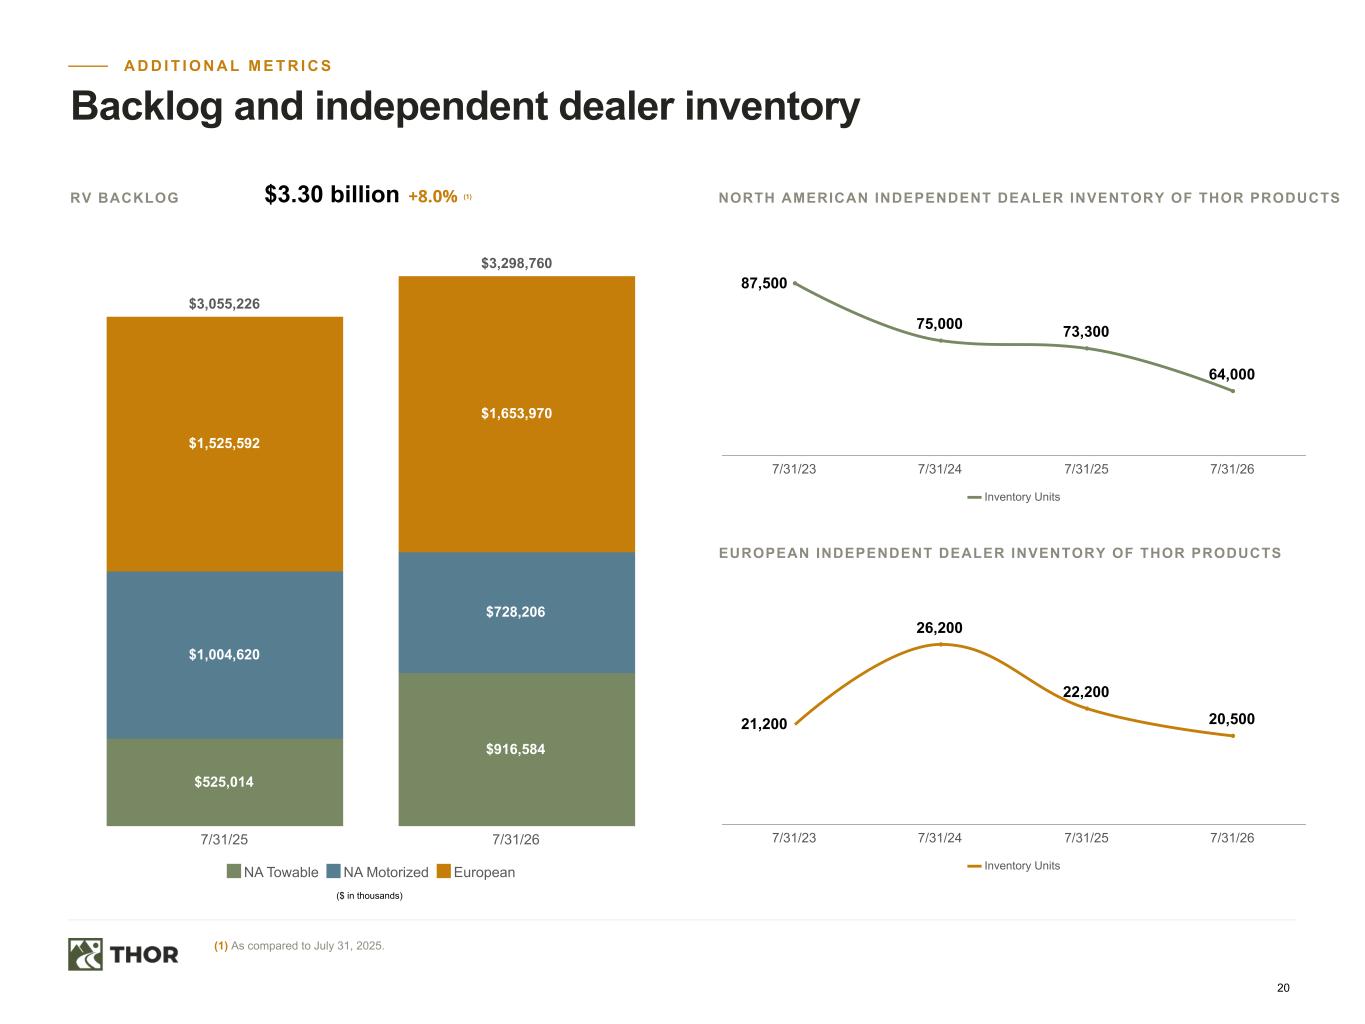
20 A D D I T I O N A L M E T R I C S Backlog and independent dealer inventory (1) As compared to July 31, 2025. $3,055,226 $3,298,760 $525,014 $916,584 $1,004,620 $728,206 $1,525,592 $1,653,970 NA Towable NA Motorized European 7/31/25 7/31/26 87,500 75,000 73,300 64,000 Inventory Units 7/31/23 7/31/24 7/31/25 7/31/26 21,200 26,200 22,200 20,500 Inventory Units 7/31/23 7/31/24 7/31/25 7/31/26 ($ in thousands) RV BACKLOG $3.30 billion +8.0% (1) NORTH AMERICAN INDEPENDENT DEALER INVENTORY OF THOR PRODUCTS EUROPEAN INDEPENDENT DEALER INVENTORY OF THOR PRODUCTS

21 T H O R I N V E S T O R R E L A T I O N S C O N T A C T Daniel Martin Director of Investor Relations & International Finance investors@thorindustries.com (574) 970-7460