
.2
Financial Results Fourth Quarter & Fiscal 2025
2 Forward - Looking Statements This presentation includes certain statements that are “forward - looking” statements within the meaning of the U . S . Private Securities Litigation Reform Act of 1995 , Section 27 A of the Securities Act of 1933 , as amended, and Section 21 E of the Securities Exchange Act of 1934 , as amended . These forward - looking statements are made based on management’s current expectations and beliefs regarding future and anticipated developments and their effects upon THOR, and inherently involve uncertainties and risks . These forward - looking statements are not a guarantee of future performance . We cannot assure you that actual results will not differ materially from our expectations . Factors which could cause materially different results include, among others : the impact of inflation on the cost of our products as well as on general consumer demand ; the effect of raw material and commodity price fluctuations, including the impact of tariffs, and/or raw material, commodity or chassis supply constraints ; the impact of war, military conflict, terrorism and/or cyber - attacks, including state - sponsored or ransom attacks ; the impact of sudden or significant adverse changes in the cost and/or availability of energy or fuel, including those caused by geopolitical events, on our costs of operation, on raw material prices, on our suppliers, on our independent dealers or on retail customers ; the dependence on a small group of suppliers for certain components used in production, including chassis ; interest rates and interest rate fluctuations and their potential impact on the general economy and, specifically, on our independent dealers and consumers and our profitability ; the ability to ramp production up or down quickly in response to rapid changes in demand or market share while also managing associated costs, including labor - related costs and production capacity costs ; the level and magnitude of warranty and recall claims incurred ; the ability of our suppliers to financially support any defects in their products ; the financial health of our independent dealers and their ability to successfully manage through various economic conditions ; legislative, trade, regulatory and tax law and/or policy developments including their potential impact on our independent dealers, retail customers or on our suppliers ; the costs of compliance with governmental regulation ; the impact of an adverse outcome or conclusion related to current or future litigation or regulatory audits or investigations ; public perception of and the costs related to environmental, social and governance matters ; legal and compliance issues including those that may arise in conjunction with recently completed transactions ; the ability to realize anticipated benefits of strategic realignments or other reorganizational actions ; the level of consumer confidence and the level of discretionary consumer spending ; the impact of exchange rate fluctuations ; restrictive lending practices which could negatively impact our independent dealers and/or retail consumers ; management changes ; the success of new and existing products and services ; the ability to maintain strong brands and develop innovative products that meet consumer demands ; changes in consumer preferences ; the risks associated with acquisitions, including : the pace and successful closing of an acquisition, the integration and financial impact thereof, the level of achievement of anticipated operating synergies from acquisitions, the potential for unknown or understated liabilities related to acquisitions, the potential loss of existing customers of acquisitions and our ability to retain key management personnel of acquired companies ; a shortage of necessary personnel for production and increasing labor costs and related employee benefits to attract and retain production personnel in times of high demand ; the loss or reduction of sales to key independent dealers, and stocking level decisions of our independent dealers ; disruption of the delivery of units to independent dealers or the disruption of delivery of raw materials, including chassis, to our facilities ; increasing costs for freight and transportation ; the ability to protect our information technology systems, including confidential and personal information, from data breaches, cyber - attacks and/or network disruptions ; asset impairment charges ; competition ; the impact of losses under repurchase agreements ; the impact of the strength of the U . S . dollar on international demand for products priced in U . S . dollars ; general economic, market, public health and political conditions in the various countries in which our products are produced and/or sold ; the impact of adverse weather conditions and/or weather - related events ; the impact of changing emissions and other related climate change regulations in the various jurisdictions in which our products are produced, used and/or sold ; changes to our investment and capital allocation strategies or other facets of our strategic plan ; and changes in market liquidity conditions, credit ratings and other factors that may impact our access to future funding and the cost of debt . These and other risks and uncertainties are discussed more fully in Item 1 A of our Annual Report on Form 10 - K for the year ended July 31 , 2025 . We disclaim any obligation or undertaking to disseminate any updates or revisions to any forward - looking statements contained in this presentation or to reflect any change in our expectations after the date hereof or any change in events, conditions or circumstances on which any statement is based, except as required by law .
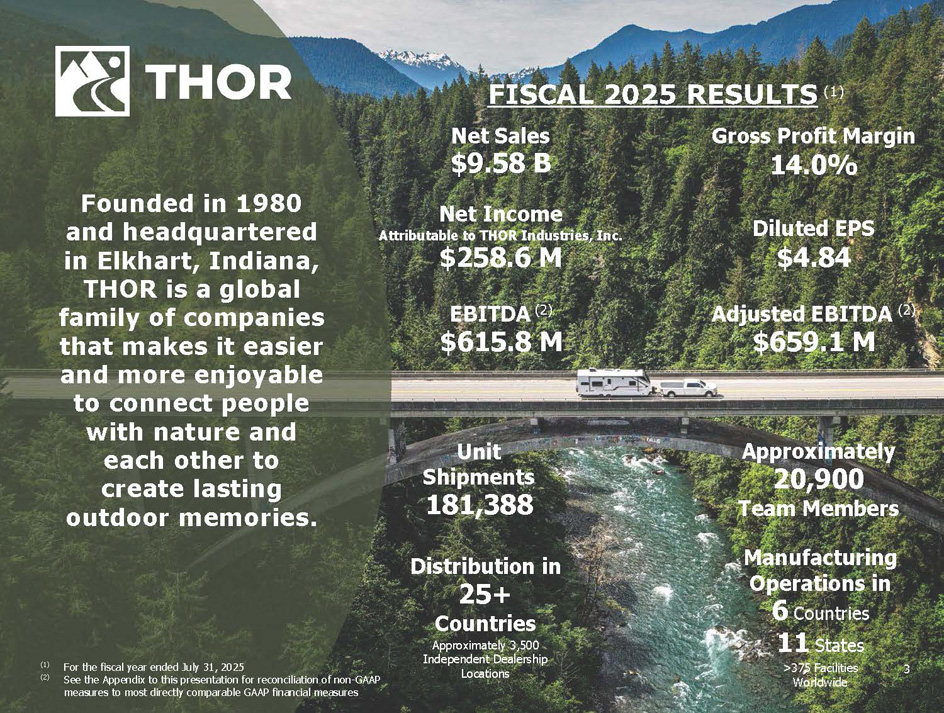
3 Founded in 1980 and headquartered in Elkhart, Indiana, THOR is a global family of companies that makes it easier and more enjoyable to connect people with nature and each other to create lasting outdoor memories. Approximately 20,900 Team Members EBITDA (2) $615.8 M Adjusted EBITDA (2) $659.1 M Gross Profit Margin 14.0% Diluted EPS $4.84 FISCAL 2025 RESULTS (1) Net Sales $9.58 B Net Income Attributable to THOR Industries, Inc. $258.6 M (1) (2) For the fiscal year ended July 31, 2025 See the Appendix to this presentation for reconciliation of non - GAAP measures to most directly comparable GAAP financial measures Unit Shipments 181,388 Distribution in 25+ Countries Approximately 3,500 Independent Dealership Locations Manufacturing Operations in 6 Countries 11 States >375 Facilities Worldwide
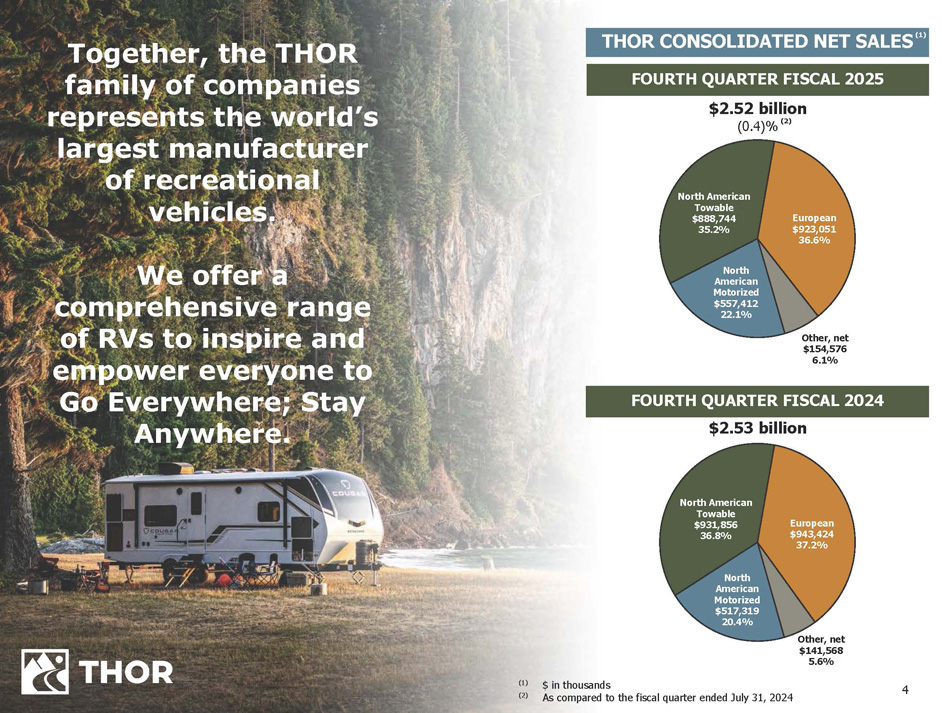
4 Together, the THOR family of companies represents the world’s largest manufacturer of recreational vehicles. We offer a comprehensive range of RVs to inspire and empower everyone to Go Everywhere; Stay Anywhere. (1) (2) $ in thousands As compared to the fiscal quarter ended July 31, 2024 Other, net $154,576 6.1% North American Motorized $557,412 22.1% North American Towable $888,744 35.2% European $923,051 36.6% FOURTH QUARTER FISCAL 2025 $2.52 billion (0.4)% (2) North American Motorized $517,319 20.4% Other, net $141,568 5.6% North American Towable $931,856 36.8% European $943,424 37.2% FOURTH QUARTER FISCAL 2024 $2.53 billion THOR CONSOLIDATED NET SALES (1)
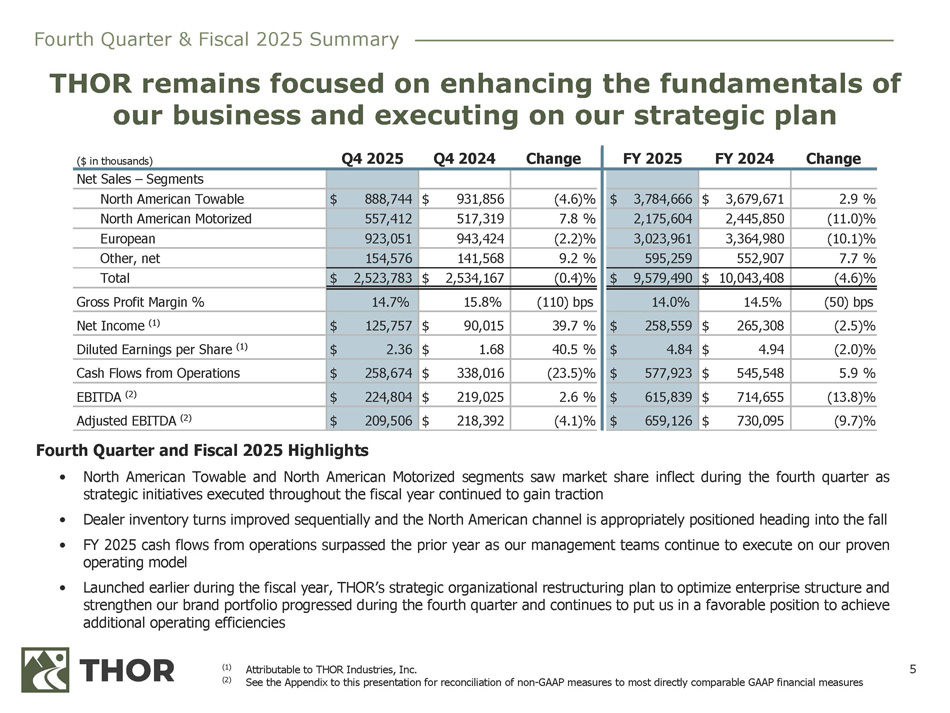
5 Change FY 2024 FY 2025 Change Q4 2024 Q4 2025 ($ in thousands) Net Sales – Segments 2.9 % $ 3,679,671 $ 3,784,666 (4.6)% $ 931,856 $ 888,744 North American Towable (11.0)% 2,445,850 2,175,604 7.8 % 517,319 557,412 North American Motorized (10.1)% 3,364,980 3,023,961 (2.2)% 943,424 923,051 European 7.7 % 552,907 595,259 9.2 % 141,568 154,576 Other, net (4.6)% $ 10,043,408 $ 9,579,490 (0.4)% $ 2,534,167 $ 2,523,783 Total (50) bps 14.5% 14.0% (110) bps 15.8% 14.7% Gross Profit Margin % (2.5)% $ 265,308 $ 258,559 39.7 % $ 90,015 $ 125,757 Net Income (1) (2.0)% $ 4.94 $ 4.84 40.5 % $ 1.68 $ 2.36 Diluted Earnings per Share (1) 5.9 % $ 545,548 $ 577,923 (23.5)% $ 338,016 $ 258,674 Cash Flows from Operations (13.8)% $ 714,655 $ 615,839 2.6 % $ 219,025 $ 224,804 EBITDA (2) (9.7)% $ 730,095 $ 659,126 (4.1)% $ 218,392 $ 209,506 Adjusted EBITDA (2) THOR remains focused on enhancing the fundamentals of our business and executing on our strategic plan (1) (2) Attributable to THOR Industries, Inc. See the Appendix to this presentation for reconciliation of non - GAAP measures to most directly comparable GAAP financial measures Fourth Quarter & Fiscal 2025 Summary Fourth Quarter and Fiscal 2025 Highlights • North American Towable and North American Motorized segments saw market share inflect during the fourth quarter as strategic initiatives executed throughout the fiscal year continued to gain traction • Dealer inventory turns improved sequentially and the North American channel is appropriately positioned heading into the fall • FY 2025 cash flows from operations surpassed the prior year as our management teams continue to execute on our proven operating model • Launched earlier during the fiscal year, THOR’s strategic organizational restructuring plan to optimize enterprise structure and strengthen our brand portfolio progressed during the fourth quarter and continues to put us in a favorable position to achieve additional operating efficiencies
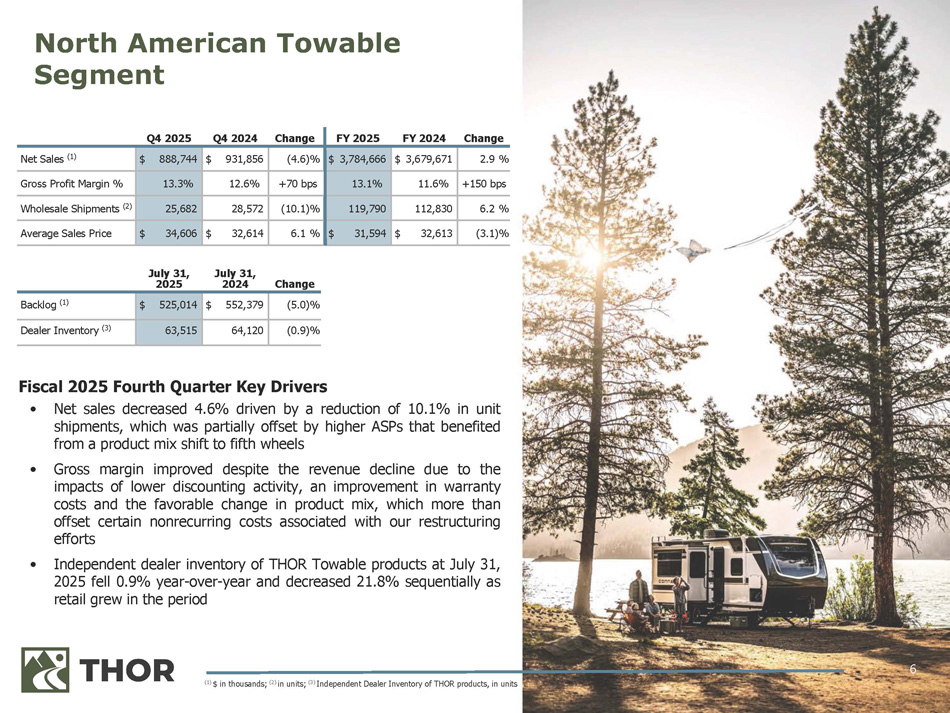
6 Fiscal 2025 Fourth Quarter Key Drivers • Net sales decreased 4 . 6 % driven by a reduction of 10 . 1 % in unit shipments, which was partially offset by higher ASPs that benefited from a product mix shift to fifth wheels • Gross margin improved despite the revenue decline due to the impacts of lower discounting activity, an improvement in warranty costs and the favorable change in product mix, which more than offset certain nonrecurring costs associated with our restructuring efforts • Independent dealer inventory of THOR Towable products at July 31 , 2025 fell 0 . 9 % year - over - year and decreased 21 . 8 % sequentially as retail grew in the period North American Towable Segment Change FY 2024 FY 2025 Change Q4 2024 Q4 2025 2.9 % $ 3,679,671 $ 3,784,666 (4.6)% $ 931,856 $ 888,744 Net Sales (1) +150 bps 11.6% 13.1% +70 bps 12.6% 13.3% Gross Profit Margin % 6.2 % 112,830 119,790 (10.1)% 28,572 25,682 Wholesale Shipments (2) (3.1)% $ 32,613 $ 31,594 6.1 % $ 32,614 $ 34,606 Average Sales Price July 31, 2025 July 31, 2024 Change (5.0)% $ 552,379 $ 525,014 Backlog (1) (0.9)% 64,120 63,515 Dealer Inventory (3) (1) $ in thousands; (2) in units; (3) Independent Dealer Inventory of THOR products, in units
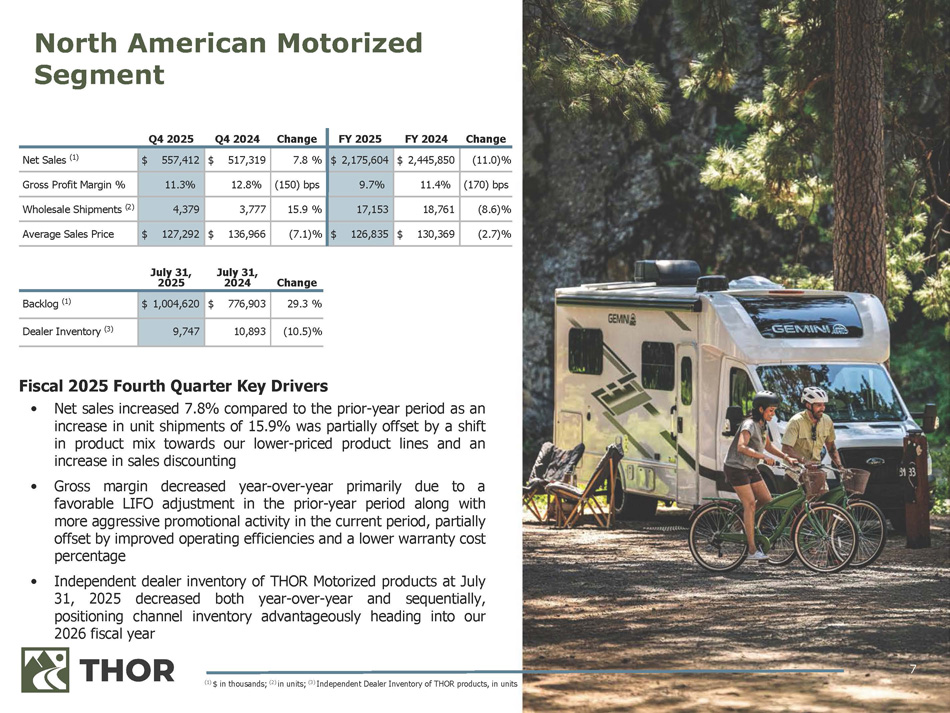
7 Fiscal 2025 Fourth Quarter Key Drivers • Net sales increased 7 . 8 % compared to the prior - year period as an increase in unit shipments of 15 . 9 % was partially offset by a shift in product mix towards our lower - priced product lines and an increase in sales discounting • Gross margin decreased year - over - year primarily due to a favorable LIFO adjustment in the prior - year period along with more aggressive promotional activity in the current period, partially offset by improved operating efficiencies and a lower warranty cost percentage • Independent dealer inventory of THOR Motorized products at July 31 , 2025 decreased both year - over - year and sequentially, positioning channel inventory advantageously heading into our 2026 fiscal year Change FY 2024 FY 2025 Change Q4 2024 Q4 2025 (11.0)% $ 2,445,850 $ 2,175,604 7.8 % $ 517,319 $ 557,412 Net Sales (1) (170) bps 11.4% 9.7% (150) bps 12.8% 11.3% Gross Profit Margin % (8.6)% 18,761 17,153 15.9 % 3,777 4,379 Wholesale Shipments (2) (2.7)% $ 130,369 $ 126,835 (7.1)% $ 136,966 $ 127,292 Average Sales Price July 31, 2025 July 31, 2024 Change 29.3 % $ 776,903 $ 1,004,620 Backlog (1) (10.5)% 10,893 9,747 Dealer Inventory (3) North American Motorized Segment (1) $ in thousands; (2) in units; (3) Independent Dealer Inventory of THOR products, in units
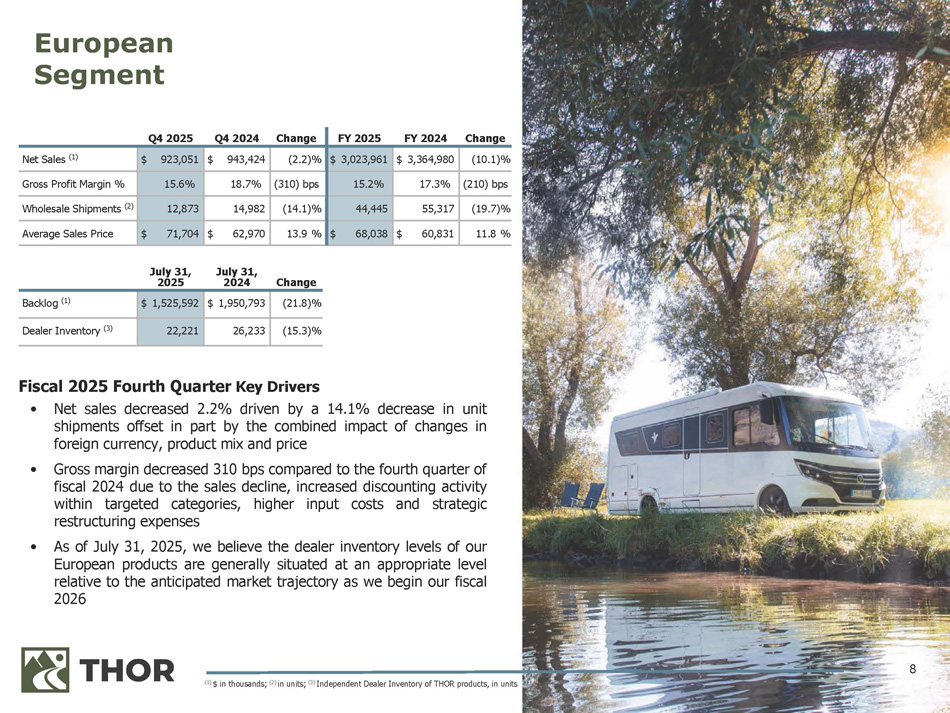
8 Fiscal 2025 Fourth Quarter Key Drivers • Net sales decreased 2 . 2 % driven by a 14 . 1 % decrease in unit shipments offset in part by the combined impact of changes in foreign currency, product mix and price • Gross margin decreased 310 bps compared to the fourth quarter of fiscal 2024 due to the sales decline, increased discounting activity within targeted categories, higher input costs and strategic restructuring expenses • As of July 31 , 2025 , we believe the dealer inventory levels of our European products are generally situated at an appropriate level relative to the anticipated market trajectory as we begin our fiscal 2026 Change FY 2024 FY 2025 Change Q4 2024 Q4 2025 (10.1)% $ 3,364,980 $ 3,023,961 (2.2)% $ 943,424 $ 923,051 Net Sales (1) (210) bps 17.3% 15.2% (310) bps 18.7% 15.6% Gross Profit Margin % (19.7)% 55,317 44,445 (14.1)% 14,982 12,873 Wholesale Shipments (2) 11.8 % $ 60,831 $ 68,038 13.9 % $ 62,970 $ 71,704 Average Sales Price July 31, 2025 July 31, 2024 Change (21.8)% $ 1,950,793 $ 1,525,592 Backlog (1) (15.3)% 26,233 22,221 Dealer Inventory (3) European Segment (1) $ in thousands; (2) in units; (3) Independent Dealer Inventory of THOR products, in units
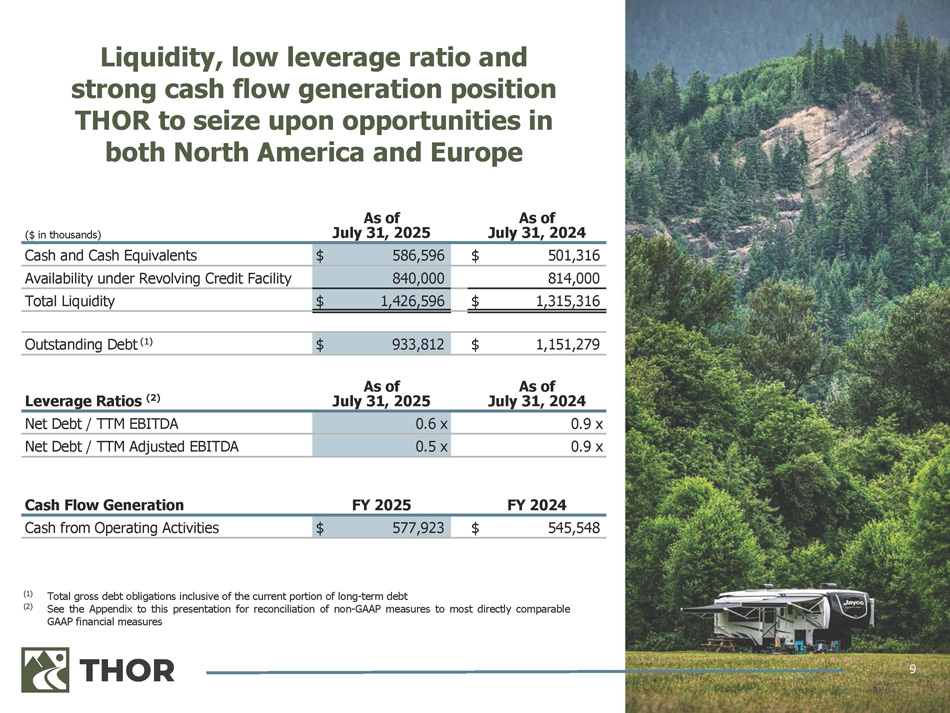
9 ($ in thousands) As of July 31, 2025 As of July 31, 2024 $ 501,316 $ 586,596 Cash and Cash Equivalents 814,000 840,000 Availability under Revolving Credit Facility $ 1,315,316 $ 1,426,596 Total Liquidity $ 1,151,279 $ 933,812 Outstanding Debt (1) Leverage Ratios (2) As of July 31, 2025 As of July 31, 2024 0.9 x 0.6 x Net Debt / TTM EBITDA 0.9 x 0.5 x Net Debt / TTM Adjusted EBITDA Cash Flow Generation FY 2025 FY 2024 $ 545,548 $ 577,923 Cash from Operating Activities (1) (2) Total gross debt obligations inclusive of the current portion of long - term debt See the Appendix to this presentation for reconciliation of non - GAAP measures to most directly comparable GAAP financial measures Liquidity, low leverage ratio and strong cash flow generation position THOR to seize upon opportunities in both North America and Europe
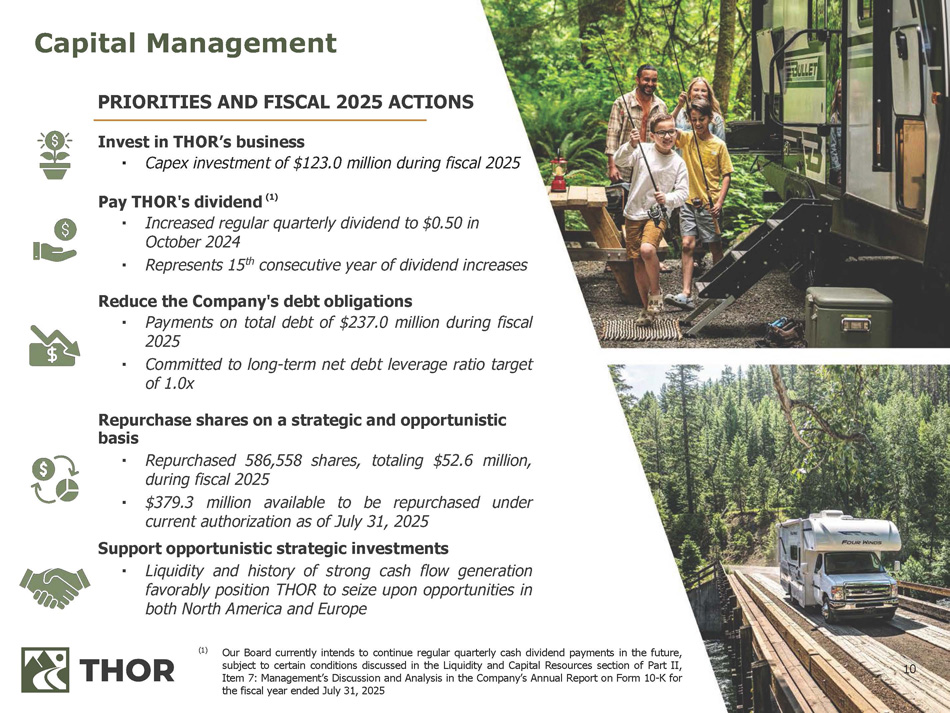
10 Capital Management PRIORITIES AND FISCAL 2025 ACTIONS Invest in THOR’s business ▪ Capex investment of $123.0 million during fiscal 2025 Pay THOR's dividend (1) ▪ Increased regular quarterly dividend to $0.50 in October 2024 ▪ Represents 15 th consecutive year of dividend increases Reduce the Company's debt obligations ▪ Payments on total debt of $237.0 million during fiscal 2025 ▪ Committed to long - term net debt leverage ratio target of 1.0x Repurchase shares on a strategic and opportunistic basis ▪ Repurchased 586 , 558 shares, totaling $ 52 . 6 million, during fiscal 2025 ▪ $ 379 . 3 million available to be repurchased under current authorization as of July 31 , 2025 Support opportunistic strategic investments ▪ Liquidity and history of strong cash flow generation favorably position THOR to seize upon opportunities in both North America and Europe (1) Our Board currently intends to continue regular quarterly cash dividend payments in the future, subject to certain conditions discussed in the Liquidity and Capital Resources section of Part II, Item 7 : Management’s Discussion and Analysis in the Company’s Annual Report on Form 10 - K for the fiscal year ended July 31 , 2025
11 Financial performance for the fourth quarter and full fiscal year yielded strong results amidst a highly volatile macroeconomic backdrop Continued execution of our strategic initiatives led to market share inflections during the fourth quarter for both our North American Motorized and Towable segments, driving a sequential improvement in dealer inventory turns and positioning the channel appropriately heading into the fall Improved generation of cash from operations during the fiscal year resulting from management’s execution of our proven operating model was used to further invest in our business, to fund returns to shareholders in the form of dividends and stock repurchases and to reduce debt We are optimistic that the strategic realignment of Heartland under Jayco will generate sustainable cost savings and, along with the comprehensive refresh of Keystone’s product portfolio, present the opportunity to drive long - term profitable share gains Key Takeaways from the Fourth Quarter and Fiscal 2025
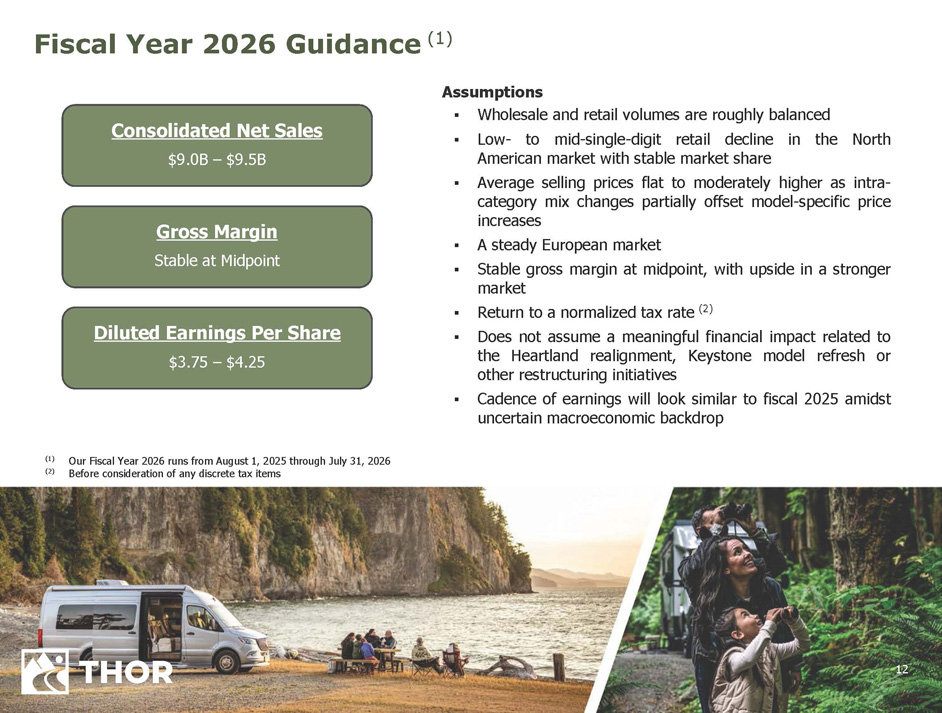
12 Fiscal Year 2026 Guidance (1) (1) (2) Our Fiscal Year 2026 runs from August 1, 2025 through July 31, 2026 Before consideration of any discrete tax items Consolidated Net Sales $9.0B – $9.5B Gross Margin Stable at Midpoint Assumptions ▪ Wholesale and retail volumes are roughly balanced ▪ Low - to mid - single - digit retail decline in the North American market with stable market share ▪ Average selling prices flat to moderately higher as intra - category mix changes partially offset model - specific price increases ▪ A steady European market ▪ Stable gross margin at midpoint, with upside in a stronger market ▪ Return to a normalized tax rate ( 2 ) ▪ Does not assume a meaningful financial impact related to the Heartland realignment, Keystone model refresh or other restructuring initiatives ▪ Cadence of earnings will look similar to fiscal 2025 amidst uncertain macroeconomic backdrop Diluted Earnings Per Share $3.75 – $4.25

13 Appendix
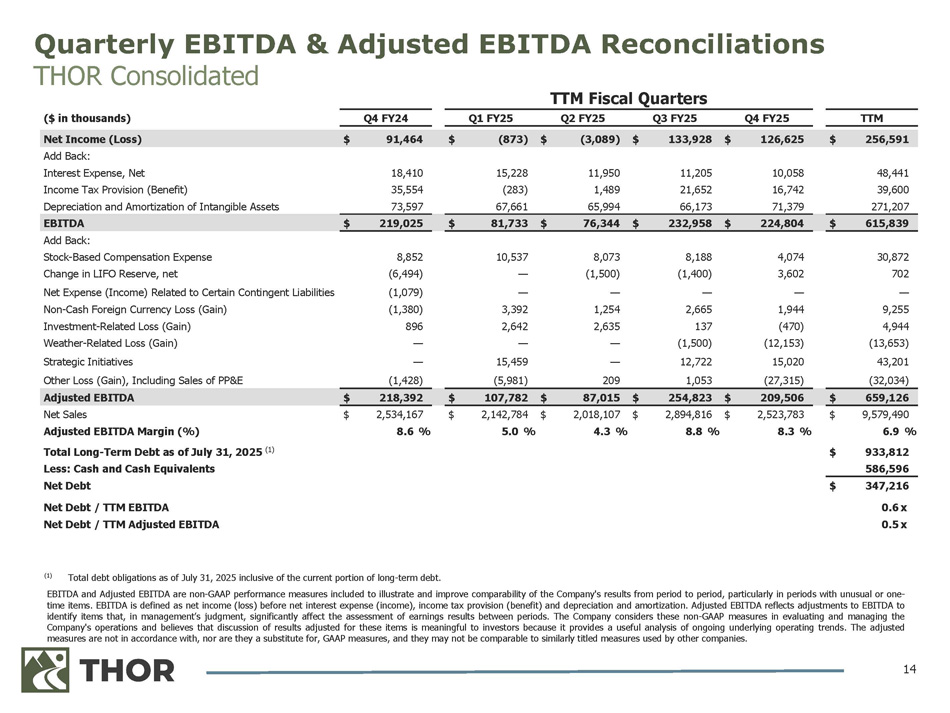
EBITDA and Adjusted EBITDA are non - GAAP performance measures included to illustrate and improve comparability of the Company's results from period to period, particularly in periods with unusual or one - time items . EBITDA is defined as net income (loss) before net interest expense (income), income tax provision (benefit) and depreciation and amortization . Adjusted EBITDA reflects adjustments to EBITDA to identify items that, in management’s judgment, significantly affect the assessment of earnings results between periods . The Company considers these non - GAAP measures in evaluating and managing the Company's operations and believes that discussion of results adjusted for these items is meaningful to investors because it provides a useful analysis of ongoing underlying operating trends . The adjusted measures are not in accordance with, nor are they a substitute for, GAAP measures, and they may not be comparable to similarly titled measures used by other companies . 14 Quarterly EBITDA & Adjusted EBITDA Reconciliations THOR Consolidated TTM Q4 FY25 Q3 FY25 Q2 FY25 Q1 FY25 Q4 FY24 ($ in thousands) $ 256,591 $ 126,625 $ 133,928 $ (3,089) $ (873) $ 91,464 Net Income (Loss) 48,441 10,058 11,205 11,950 15,228 18,410 Add Back: Interest Expense, Net 39,600 16,742 21,652 1,489 (283) 35,554 Income Tax Provision (Benefit) 271,207 71,379 66,173 65,994 67,661 73,597 Depreciation and Amortization of Intangible Assets $ 615,839 $ 224,804 $ 232,958 $ 76,344 $ 81,733 $ 219,025 EBITDA 30,872 4,074 8,188 8,073 10,537 8,852 Add Back: Stock - Based Compensation Expense 702 3,602 (1,400) (1,500) — (6,494) Change in LIFO Reserve, net — — — — — (1,079) Net Expense (Income) Related to Certain Contingent Liabilities 9,255 1,944 2,665 1,254 3,392 (1,380) Non - Cash Foreign Currency Loss (Gain) 4,944 (470) 137 2,635 2,642 896 Investment - Related Loss (Gain) (13,653) (12,153) (1,500) — — — Weather - Related Loss (Gain) 43,201 15,020 12,722 — 15,459 — Strategic Initiatives (32,034) (27,315) 1,053 209 (5,981) (1,428) Other Loss (Gain), Including Sales of PP&E $ 659,126 $ 209,506 $ 254,823 $ 87,015 $ 107,782 $ 218,392 Adjusted EBITDA $ 9,579,490 $ 2,523,783 $ 2,894,816 $ 2,018,107 $ 2,142,784 $ 2,534,167 Net Sales 6.9 % 8.3 % 8.8 % 4.3 % 5.0 % 8.6 % Adjusted EBITDA Margin (%) $ 933,812 Total Long - Term Debt as of July 31, 2025 (1) 586,596 Less: Cash and Cash Equivalents $ 347,216 Net Debt 0.6 x 0.5 x Net Debt / TTM EBITDA Net Debt / TTM Adjusted EBITDA TTM Fiscal Quarters (1) Total debt obligations as of July 31, 2025 inclusive of the current portion of long - term debt.
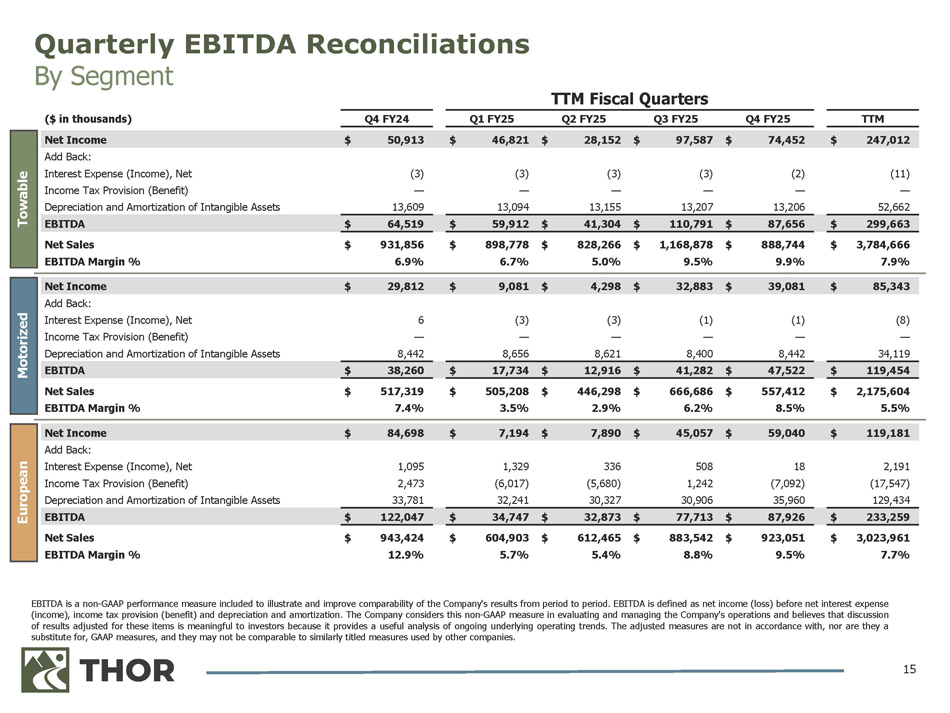
EBITDA is a non - GAAP performance measure included to illustrate and improve comparability of the Company's results from period to period . EBITDA is defined as net income (loss) before net interest expense (income), income tax provision (benefit) and depreciation and amortization . The Company considers this non - GAAP measure in evaluating and managing the Company's operations and believes that discussion of results adjusted for these items is meaningful to investors because it provides a useful analysis of ongoing underlying operating trends . The adjusted measures are not in accordance with, nor are they a substitute for, GAAP measures, and they may not be comparable to similarly titled measures used by other companies . 15 Quarterly EBITDA Reconciliations By Segment ($ in thousands) Q4 FY24 Q1 FY25 TTM Fiscal Quarters Q2 FY25 Q3 FY25 Q4 FY25 TTM $ 247,012 $ 74,452 $ 97,587 $ 28,152 $ 46,821 $ 50,913 Net Income Add Back: (11) (2) (3) (3) (3) (3) Interest Expense (Income), Net — — — — — — Income Tax Provision (Benefit) 52,662 13,206 13,207 13,155 13,094 13,609 Depreciation and Amortization of Intangible Assets $ 299,663 $ 87,656 $ 110,791 $ 41,304 $ 59,912 $ 64,519 EBITDA $ 3,784,666 $ 888,744 $ 1,168,878 $ 828,266 $ 898,778 $ 931,856 Net Sales 7.9% 9.9% 9.5% 5.0% 6.7% 6.9% EBITDA Margin % $ 85,343 $ 39,081 $ 32,883 $ 4,298 $ 9,081 $ 29,812 Net Income Add Back: (8) (1) (1) (3) (3) 6 Interest Expense (Income), Net — — — — — — Income Tax Provision (Benefit) 34,119 8,442 8,400 8,621 8,656 8,442 Depreciation and Amortization of Intangible Assets $ 119,454 $ 47,522 $ 41,282 $ 12,916 $ 17,734 $ 38,260 EBITDA $ 2,175,604 $ 557,412 $ 666,686 $ 446,298 $ 505,208 $ 517,319 Net Sales 5.5% 8.5% 6.2% 2.9% 3.5% 7.4% EBITDA Margin % $ 119,181 $ 59,040 $ 45,057 $ 7,890 $ 7,194 $ 84,698 Net Income Add Back: 2,191 18 508 336 1,329 1,095 Interest Expense (Income), Net (17,547) (7,092) 1,242 (5,680) (6,017) 2,473 Income Tax Provision (Benefit) 129,434 35,960 30,906 30,327 32,241 33,781 Depreciation and Amortization of Intangible Assets $ 233,259 $ 87,926 $ 77,713 $ 32,873 $ 34,747 $ 122,047 EBITDA $ 3,023,961 $ 923,051 $ 883,542 $ 612,465 $ 604,903 $ 943,424 Net Sales 7.7% 9.5% 8.8% 5.4% 5.7% 12.9% EBITDA Margin % Towable Motorized European
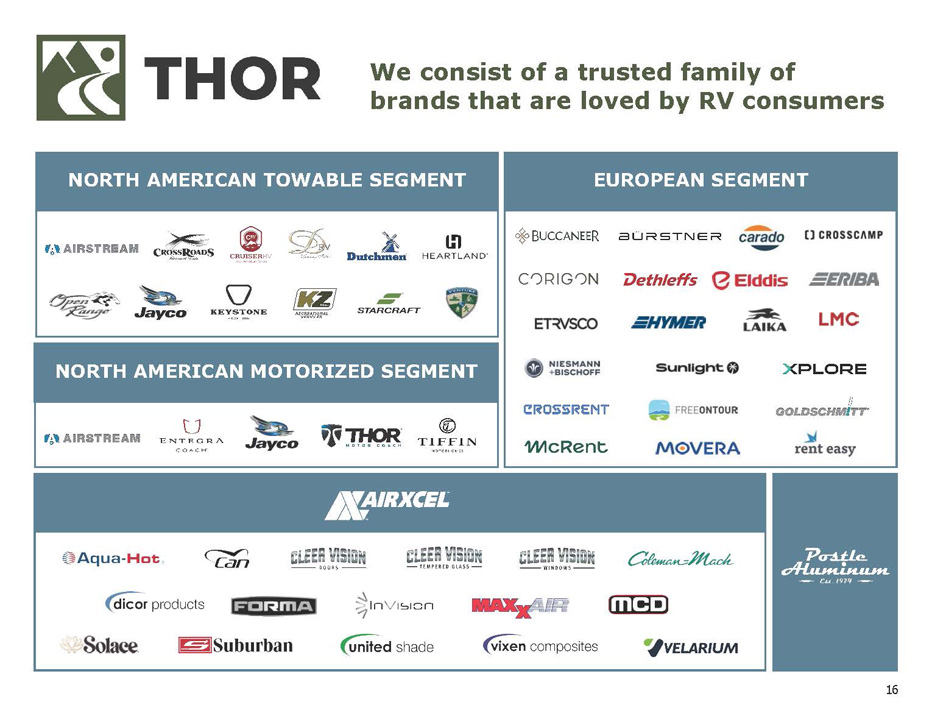
16 EUROPEAN SEGMENT NORTH AMERICAN MOTORIZED SEGMENT NORTH AMERICAN TOWABLE SEGMENT We consist of a trusted family of brands that are loved by RV consumers
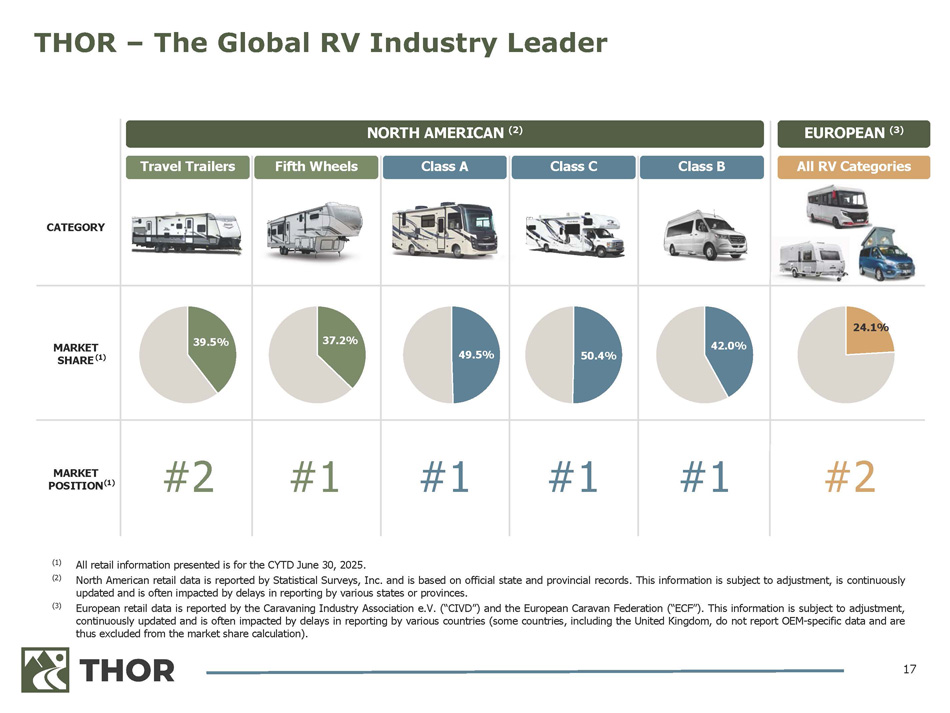
17 (1) (2) All retail information presented is for the CYTD June 30 , 2025 . North American retail data is reported by Statistical Surveys, Inc . and is based on official state and provincial records . This information is subject to adjustment, is continuously updated and is often impacted by delays in reporting by various states or provinces . European retail data is reported by the Caravaning Industry Association e . V . (“CIVD”) and the European Caravan Federation (“ECF ” ) . This information is subject to adjustment, continuously updated and is often impacted by delays in reporting by various countries (some countries, including the United Kingdom, do not report OEM - specific data and are thus excluded from the market share calculation) . (3) EUROPEAN (3) All RV Categories NORTH AMERICAN (2) CATEGORY Class B Class C Class A Fifth Wheels Travel Trailers 24.1% 42.0% 50.4% 49.5% 37.2% 39.5% MARKET SHARE (1) #2 #1 #1 #1 #1 #2 MARKET POSITION (1) THOR – The Global RV Industry Leader
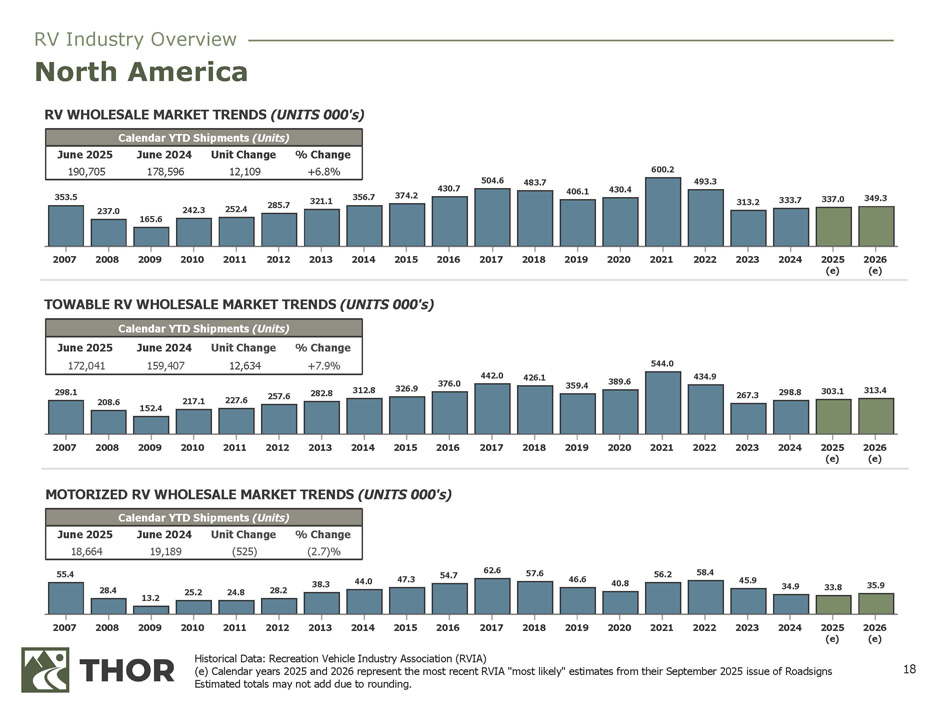
18 55.4 28.4 13.2 25.2 24.8 28.2 38.3 44.0 47.3 54.7 62.6 57.6 46.6 40.8 56.2 58.4 45.9 34.9 33.8 35.9 2007 2008 2009 2010 2011 2012 2013 2014 2015 2016 2017 2018 2019 2020 2021 2022 2023 2024 2025 2026 (e) (e) 298.1 208.6 152.4 217.1 227.6 257.6 282.8 312.8 326.9 376.0 442.0 426.1 359.4 389.6 544.0 434.9 267.3 298.8 303.1 313.4 2026 2025 2024 2023 2022 2021 2020 2019 2018 2017 2016 2015 2014 2013 2012 2011 2010 2009 2008 2007 (e) (e) 353.5 237.0 165.6 242.3 252.4 285.7 321.1 356.7 374.2 430.7 504.6 483.7 406.1 430.4 600.2 493.3 313.2 333.7 337.0 349.3 2026 2025 2024 2023 2022 2021 2020 2019 2018 2017 2016 2015 2014 2013 2012 2011 2010 2009 2008 2007 (e) (e) TOWABLE RV WHOLESALE MARKET TRENDS (UNITS 000's) Calendar YTD Shipments (Units) % Change Unit Change June 2024 June 2025 +6.8% 12,109 178,596 190,705 Calendar YTD Shipments (Units) % Change Unit Change June 2024 June 2025 +7.9% 12,634 159,407 172,041 Calendar YTD Shipments (Units) % Change Unit Change June 2024 June 2025 (2.7)% (525) 19,189 18,664 Historical Data: Recreation Vehicle Industry Association (RVIA) (e) Calendar years 2025 and 2026 represent the most recent RVIA "most likely" estimates from their September 2025 issue of Roadsigns Estimated totals may not add due to rounding. RV Industry Overview North America RV WHOLESALE MARKET TRENDS (UNITS 000's) MOTORIZED RV WHOLESALE MARKET TRENDS (UNITS 000's)
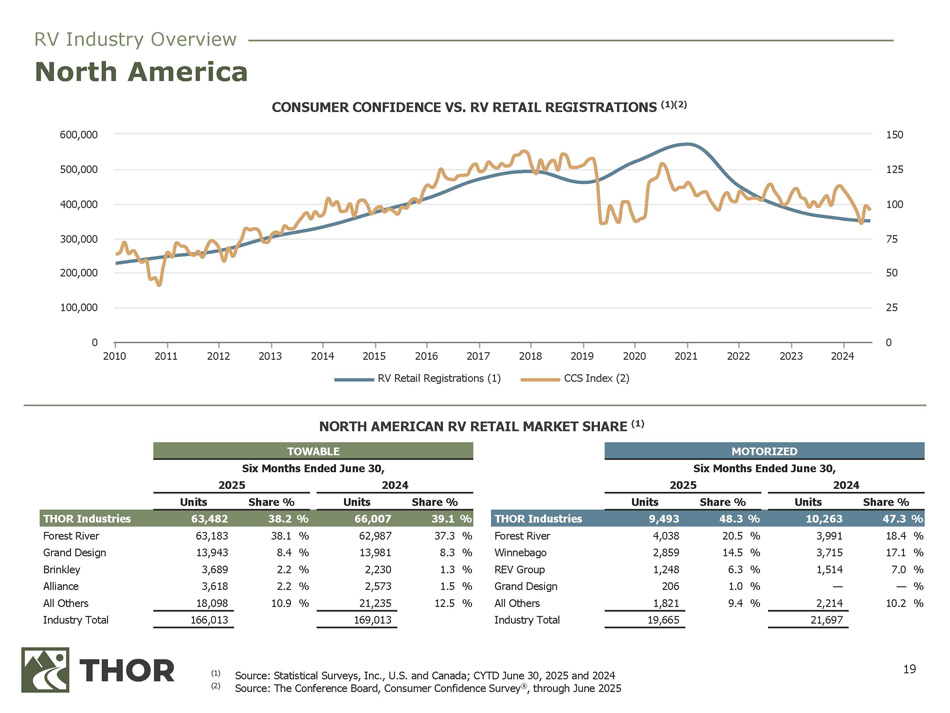
19 NORTH AMERICAN RV RETAIL MARKET SHARE (1) 2015 2016 2017 RV Retail Registrations (1) 2019 2020 CCS Index (2) 2010 2011 2012 2013 2014 2018 2021 2022 2023 2024 0 100,000 200,000 300,000 400,000 500,000 600,000 0 25 50 75 100 125 150 (1) (2) Source: Statistical Surveys, Inc., U.S. and Canada; CYTD June 30, 2025 and 2024 Source: The Conference Board, Consumer Confidence Survey ® , through June 2025 CONSUMER CONFIDENCE VS. RV RETAIL REGISTRATIONS (1)(2) 47.3 % 10,263 48.3 % 9,493 THOR Industries 39.1 % 66,007 38.2 % 63,482 THOR Industries % 18.4 3,991 % 20.5 4,038 Forest River % 37.3 62,987 % 38.1 63,183 Forest River % 17.1 3,715 % 14.5 2,859 Winnebago % 8.3 13,981 % 8.4 13,943 Grand Design % 7.0 1,514 % 6.3 1,248 REV Group % 1.3 2,230 % 2.2 3,689 Brinkley % — — % 1.0 206 Grand Design % 1.5 2,573 % 2.2 3,618 Alliance % 10.2 2,214 % 9.4 1,821 All Others % 12.5 21,235 % 10.9 18,098 All Others 21,697 19,665 Industry Total 169,013 166,013 Industry Total TOWABLE Six Months Ended June 30, 2025 2024 Units Share % Units Share % MOTORIZED Six Months Ended June 30, 2025 2024 Units Share % Units Share % North America RV Industry Overview
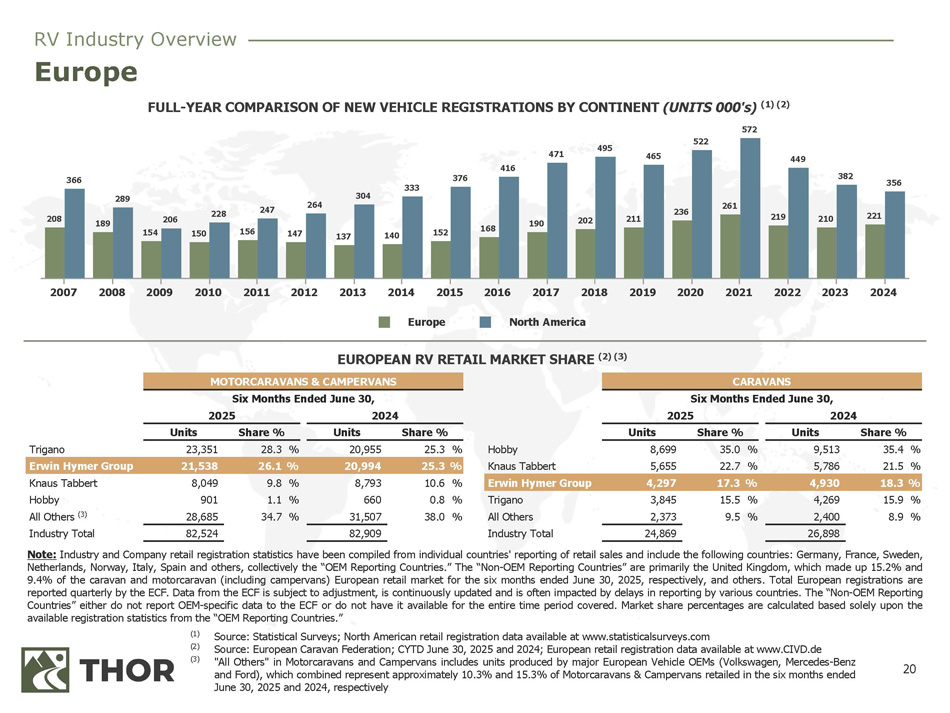
20 EUROPEAN RV RETAIL MARKET SHARE (2) (3) 208 189 154 150 156 147 137 140 152 168 190 202 211 236 261 219 210 221 366 289 206 228 247 264 304 333 376 416 471 495 465 449 382 356 Europe North America 2007 2008 2009 2010 2011 2012 2013 2014 2015 2016 2017 2018 2019 2020 2021 2022 2023 2024 FULL - YEAR COMPARISON OF NEW VEHICLE REGISTRATIONS BY CONTINENT (UNITS 000's) (1) (2) 572 522 (1) (2) (3) Source : Statistical Surveys ; North American retail registration data available at www . statisticalsurveys . com Source : European Caravan Federation ; CYTD June 30 , 2025 and 2024 ; European retail registration data available at www . CIVD . de "All Others" in Motorcaravans and Campervans includes units produced by major European Vehicle OEMs (Volkswagen, Mercedes - Benz and Ford), which combined represent approximately 10 . 3 % and 15 . 3 % of Motorcaravans & Campervans retailed in the six months ended June 30 , 2025 and 2024 , respectively CARAVANS Six Months Ended June 30, 2025 2024 Units Share % Units Share % MOTORCARAVANS & CAMPERVANS Six Months Ended June 30, 2025 2024 Units Share % Units Share % 35.4 % 9,513 35.0 % 8,699 Hobby 25.3 % 20,955 28.3 % 23,351 Trigano 21.5 % 5,786 22.7 % 5,655 Knaus Tabbert 25.3 % 20,994 26.1 % 21,538 Erwin Hymer Group 18.3 % 4,930 17.3 % 4,297 Erwin Hymer Group 10.6 % 8,793 9.8 % 8,049 Knaus Tabbert 15.9 % 4,269 15.5 % 3,845 Trigano 0.8 % 660 1.1 % 901 Hobby 8.9 % 2,400 9.5 % 2,373 All Others 38.0 % 31,507 34.7 % 28,685 All Others (3) 26,898 24,869 Industry Total 82,909 82,524 Industry Total Note : Industry and Company retail registration statistics have been compiled from individual countries' reporting of retail sales and include the following countries : Germany, France, Sweden, Netherlands, Norway, Italy, Spain and others, collectively the “OEM Reporting Countries . ” The “Non - OEM Reporting Countries” are primarily the United Kingdom, which made up 15 . 2 % and 9 . 4 % of the caravan and motorcaravan (including campervans) European retail market for the six months ended June 30 , 2025 , respectively, and others . Total European registrations are reported quarterly by the ECF . Data from the ECF is subject to adjustment, is continuously updated and is often impacted by delays in reporting by various countries . The “Non - OEM Reporting Countries” either do not report OEM - specific data to the ECF or do not have it available for the entire time period covered . Market share percentages are calculated based solely upon the available registration statistics from the “OEM Reporting Countries . ” Europe RV Industry Overview
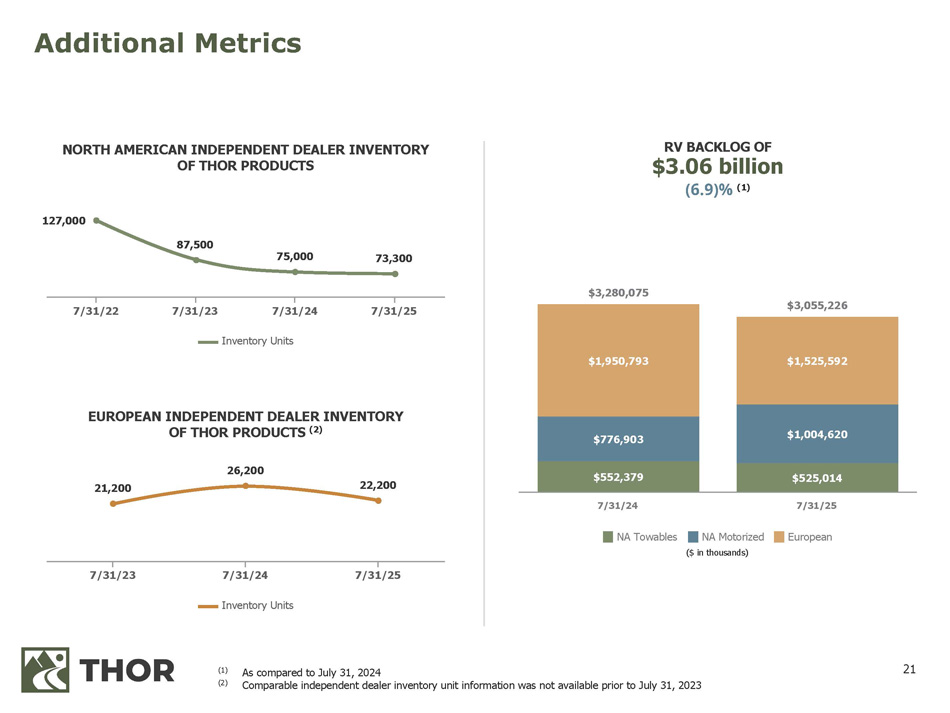
21 Additional Metrics $3,280,075 $3,055,226 $552,379 $525,014 $776,903 $1,004,620 $1,950,793 $1,525,592 NA Towables NA Motorized ($ in thousands) European 7/31/24 7/31/25 127,000 87,500 75,000 73,300 Inventory Units 7/31/22 7/31/23 7/31/24 7/31/25 NORTH AMERICAN INDEPENDENT DEALER INVENTORY OF THOR PRODUCTS RV BACKLOG OF $3.06 billion (6.9)% (1) (1) (2) As compared to July 31, 2024 Comparable independent dealer inventory unit information was not available prior to July 31, 2023 21,200 26,200 22,200 Inventory Units 7/31/23 7/31/24 7/31/25 EUROPEAN INDEPENDENT DEALER INVENTORY OF THOR PRODUCTS (2)

www.thorindustries.com THOR INVESTOR RELATIONS CONTACT: Seth Woolf Head of Corporate Development & Investor Relations swoolf@thorindustries.com (574) 294 - 7718