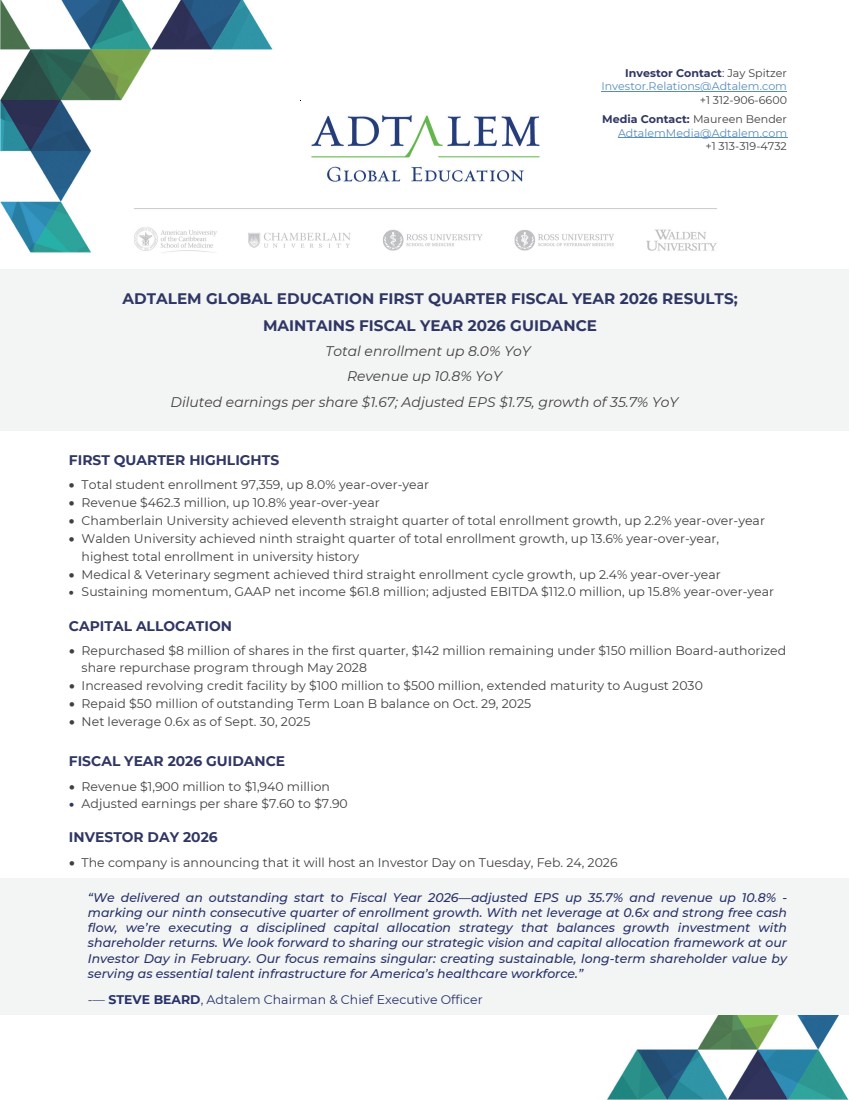
| Investor Contact: Jay Spitzer Investor.Relations@Adtalem.com +1 312-906-6600 Media Contact: Maureen Bender AdtalemMedia@Adtalem.com +1 313-319-4732 ADTALEM GLOBAL EDUCATION FIRST QUARTER FISCAL YEAR 2026 RESULTS; MAINTAINS FISCAL YEAR 2026 GUIDANCE Total enrollment up 8.0% YoY Revenue up 10.8% YoY Diluted earnings per share $1.67; Adjusted EPS $1.75, growth of 35.7% YoY FIRST QUARTER HIGHLIGHTS • Total student enrollment 97,359, up 8.0% year-over-year • Revenue $462.3 million, up 10.8% year-over-year • Chamberlain University achieved eleventh straight quarter of total enrollment growth, up 2.2% year-over-year • Walden University achieved ninth straight quarter of total enrollment growth, up 13.6% year-over-year, highest total enrollment in university history • Medical & Veterinary segment achieved third straight enrollment cycle growth, up 2.4% year-over-year • Sustaining momentum, GAAP net income $61.8 million; adjusted EBITDA $112.0 million, up 15.8% year-over-year CAPITAL ALLOCATION • Repurchased $8 million of shares in the first quarter, $142 million remaining under $150 million Board-authorized share repurchase program through May 2028 • Increased revolving credit facility by $100 million to $500 million, extended maturity to August 2030 • Repaid $50 million of outstanding Term Loan B balance on Oct. 29, 2025 • Net leverage 0.6x as of Sept. 30, 2025 FISCAL YEAR 2026 GUIDANCE • Revenue $1,900 million to $1,940 million • Adjusted earnings per share $7.60 to $7.90 INVESTOR DAY 2026 • The company is announcing that it will host an Investor Day on Tuesday, Feb. 24, 2026 “We delivered an outstanding start to Fiscal Year 2026—adjusted EPS up 35.7% and revenue up 10.8% - marking our ninth consecutive quarter of enrollment growth. With net leverage at 0.6x and strong free cash flow, we’re executing a disciplined capital allocation strategy that balances growth investment with shareholder returns. We look forward to sharing our strategic vision and capital allocation framework at our Investor Day in February. Our focus remains singular: creating sustainable, long-term shareholder value by serving as essential talent infrastructure for America’s healthcare workforce.” — STEVE BEARD, Adtalem Chairman & Chief Executive Officer |
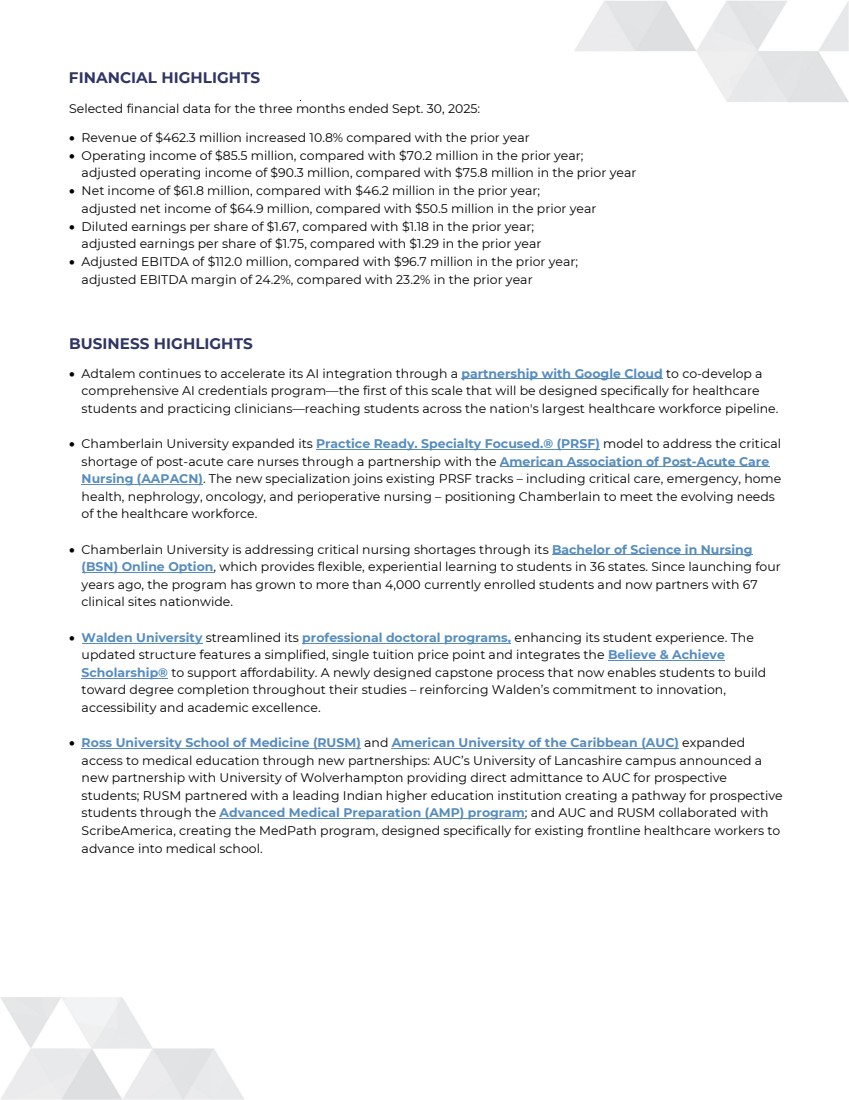
| FINANCIAL HIGHLIGHTS Selected financial data for the three months ended Sept. 30, 2025: • Revenue of $462.3 million increased 10.8% compared with the prior year • Operating income of $85.5 million, compared with $70.2 million in the prior year; adjusted operating income of $90.3 million, compared with $75.8 million in the prior year • Net income of $61.8 million, compared with $46.2 million in the prior year; adjusted net income of $64.9 million, compared with $50.5 million in the prior year • Diluted earnings per share of $1.67, compared with $1.18 in the prior year; adjusted earnings per share of $1.75, compared with $1.29 in the prior year • Adjusted EBITDA of $112.0 million, compared with $96.7 million in the prior year; adjusted EBITDA margin of 24.2%, compared with 23.2% in the prior year BUSINESS HIGHLIGHTS • Adtalem continues to accelerate its AI integration through a partnership with Google Cloud to co-develop a comprehensive AI credentials program—the first of this scale that will be designed specifically for healthcare students and practicing clinicians—reaching students across the nation's largest healthcare workforce pipeline. • Chamberlain University expanded its Practice Ready. Specialty Focused.® (PRSF) model to address the critical shortage of post-acute care nurses through a partnership with the American Association of Post-Acute Care Nursing (AAPACN). The new specialization joins existing PRSF tracks – including critical care, emergency, home health, nephrology, oncology, and perioperative nursing – positioning Chamberlain to meet the evolving needs of the healthcare workforce. • Chamberlain University is addressing critical nursing shortages through its Bachelor of Science in Nursing (BSN) Online Option, which provides flexible, experiential learning to students in 36 states. Since launching four years ago, the program has grown to more than 4,000 currently enrolled students and now partners with 67 clinical sites nationwide. • Walden University streamlined its professional doctoral programs, enhancing its student experience. The updated structure features a simplified, single tuition price point and integrates the Believe & Achieve Scholarship® to support affordability. A newly designed capstone process that now enables students to build toward degree completion throughout their studies – reinforcing Walden’s commitment to innovation, accessibility and academic excellence. • Ross University School of Medicine (RUSM) and American University of the Caribbean (AUC) expanded access to medical education through new partnerships: AUC’s University of Lancashire campus announced a new partnership with University of Wolverhampton providing direct admittance to AUC for prospective students; RUSM partnered with a leading Indian higher education institution creating a pathway for prospective students through the Advanced Medical Preparation (AMP) program; and AUC and RUSM collaborated with ScribeAmerica, creating the MedPath program, designed specifically for existing frontline healthcare workers to advance into medical school. |
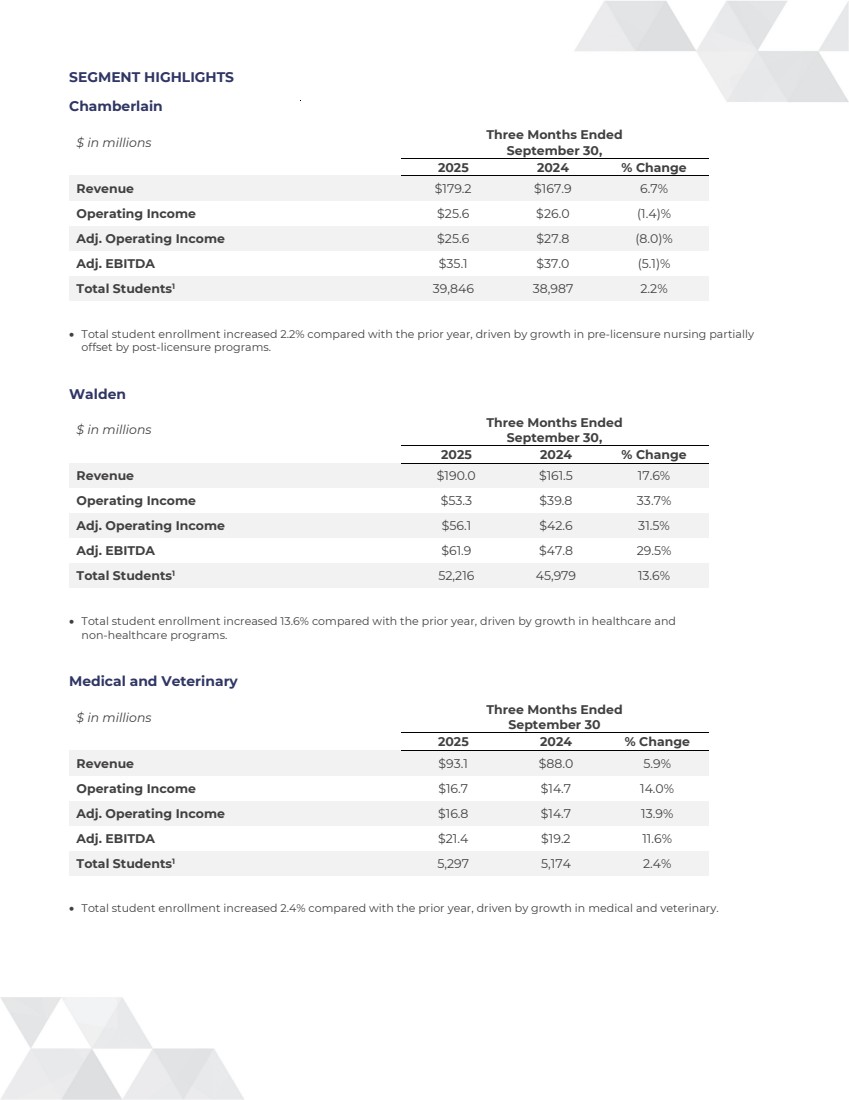
| SEGMENT HIGHLIGHTS Chamberlain $ in millions Three Months Ended September 30, 2025 2024 % Change Revenue $179.2 $167.9 6.7% Operating Income $25.6 $26.0 (1.4)% Adj. Operating Income $25.6 $27.8 (8.0)% Adj. EBITDA $35.1 $37.0 (5.1)% Total Students1 39,846 38,987 2.2% • Total student enrollment increased 2.2% compared with the prior year, driven by growth in pre-licensure nursing partially offset by post-licensure programs. Walden $ in millions Three Months Ended September 30, 2025 2024 % Change Revenue $190.0 $161.5 17.6% Operating Income $53.3 $39.8 33.7% Adj. Operating Income $56.1 $42.6 31.5% Adj. EBITDA $61.9 $47.8 29.5% Total Students1 52,216 45,979 13.6% • Total student enrollment increased 13.6% compared with the prior year, driven by growth in healthcare and non-healthcare programs. Medical and Veterinary $ in millions Three Months Ended September 30 2025 2024 % Change Revenue $93.1 $88.0 5.9% Operating Income $16.7 $14.7 14.0% Adj. Operating Income $16.8 $14.7 13.9% Adj. EBITDA $21.4 $19.2 11.6% Total Students1 5,297 5,174 2.4% • Total student enrollment increased 2.4% compared with the prior year, driven by growth in medical and veterinary. |
| FISCAL YEAR 2026 OUTLOOK Adtalem maintains guidance for fiscal year 2026, with revenue in the range of $1,900 million to $1,940 million, approximately 6.0% to 8.5% growth year-over-year. Adjusted earnings per share to be in the range of $7.60 to $7.90, approximately 14.0% to 18.5% growth year-over-year. INVESTOR DAY 2026 Adtalem is announcing our upcoming Investor Day, scheduled for Feb. 24, 2026. Additional information can be found at investors.adtalem.com. CONFERENCE CALL AND WEBCAST INFORMATION Adtalem will hold a conference call to discuss its first quarter fiscal year 2026 results today at 4:00 p.m. CT (5:00 p.m. ET). The call can be accessed by dialing +1 877-407-6184 (U.S. participants) or +1 201-389-0877 (international participants) and stating “Adtalem earnings call” or by using conference ID: 13756230. The call will be simulcast through the Adtalem investor relations website at: https://investors.adtalem.com. Adtalem will archive a replay of the call for 30 days. To access the replay, dial +1 877-660-6853 (U.S.) or +1 201-612-7415 (international), conference ID: 13756230, or visit the Adtalem investor relations website. ABOUT ADTALEM GLOBAL EDUCATION Adtalem Global Education is the largest provider of healthcare education in the U.S., shaping the future of healthcare by preparing a dynamic workforce with high-quality academic programs. We innovate education pathways, align with industry needs and empower individuals to reach their full potential. Our commitment to excellence and access is reflected in our expansive network of institutions, serving over 97,000 students and supported by a strong community of approximately 365,000 alumni and over 10,000 dedicated employees. CAUTIONARY DISCLOSURE REGARDING FORWARD-LOOKING STATEMENTS Certain statements contained in this release are forward-looking statements as defined in the Private Securities Litigation Reform Act of 1995. Forward-looking statements provide current expectations of future events based on certain assumptions and include any statement that does not directly relate to any historical or current fact, which includes statements regarding Adtalem’s future growth. Forward-looking statements generally can be identified by the use of forward-looking terminology such as “future,” “believe,” “expect,” “anticipate,” “estimate,” “plan,” “intend,” “may,” “will,” “would,” “could,” “can,” “continue,” “preliminary,” “potential,” “range,” and similar terms. These forward-looking statements are subject to risk and uncertainties that could cause actual results to differ materially from those described in the statements. Important factors that could cause actual results to differ materially from the expectations expressed or implied by our forward-looking statements are disclosed in Item 1A. “Risk Factors,” of our Annual Report on Form 10-K. You should evaluate forward-looking statements in the context of these risks and uncertainties and are cautioned to not place undue reliance on such forward-looking statements. We caution you that these factors, performance or developments we expect or anticipate or, even if substantially realized, that they will result in the consequences or affect us or our operations in the way we expect. All forward-looking statements are based on information available to use as of the date any such statements are made, and Adtalem assumes no obligation to publicly update or revise its forward-looking statements even if experience or future changes make it clear that any projected results expressed or implied therein will not be realized, except as required by law. A reconciliation of non-GAAP guidance measures to corresponding GAAP measures is not available on a forward-looking basis without unreasonable effort due to the uncertainty of special items that may be incurred in the future, although these special items could be material to Adtalem's results in accordance with GAAP. 1) Represents total students attending sessions during each institution’s most recent enrollment period in Q1 FY 2026 and Q1 FY 2025. ### |
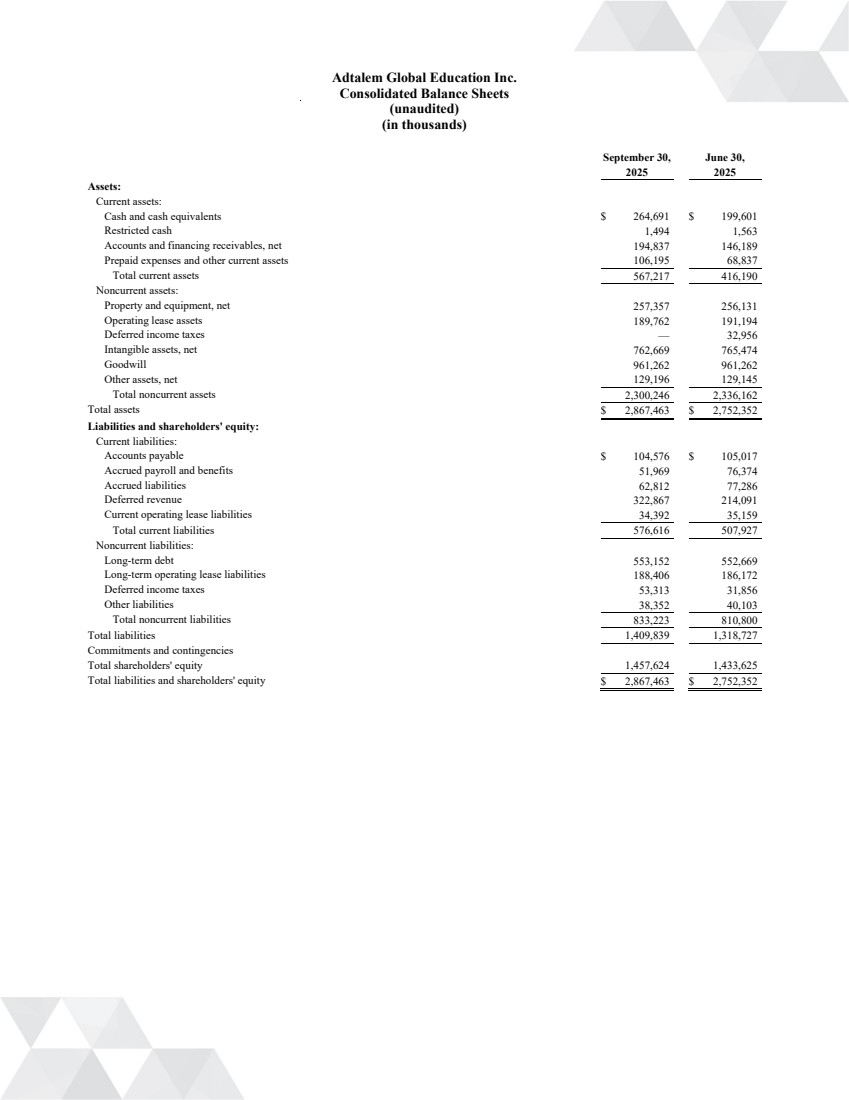
| Adtalem Global Education Inc. Consolidated Balance Sheets (unaudited) (in thousands) September 30, June 30, 2025 2025 Assets: Current assets: Cash and cash equivalents $ 264,691 $ 199,601 Restricted cash 1,494 1,563 Accounts and financing receivables, net 194,837 146,189 Prepaid expenses and other current assets 106,195 68,837 Total current assets 567,217 416,190 Noncurrent assets: Property and equipment, net 257,357 256,131 Operating lease assets 189,762 191,194 Deferred income taxes — 32,956 Intangible assets, net 762,669 765,474 Goodwill 961,262 961,262 Other assets, net 129,196 129,145 Total noncurrent assets 2,300,246 2,336,162 Total assets $ 2,867,463 $ 2,752,352 Liabilities and shareholders' equity: Current liabilities: Accounts payable $ 104,576 $ 105,017 Accrued payroll and benefits 51,969 76,374 Accrued liabilities 62,812 77,286 Deferred revenue 322,867 214,091 Current operating lease liabilities 34,392 35,159 Total current liabilities 576,616 507,927 Noncurrent liabilities: Long-term debt 553,152 552,669 Long-term operating lease liabilities 188,406 186,172 Deferred income taxes 53,313 31,856 Other liabilities 38,352 40,103 Total noncurrent liabilities 833,223 810,800 Total liabilities 1,409,839 1,318,727 Commitments and contingencies Total shareholders' equity 1,457,624 1,433,625 Total liabilities and shareholders' equity $ 2,867,463 $ 2,752,352 |
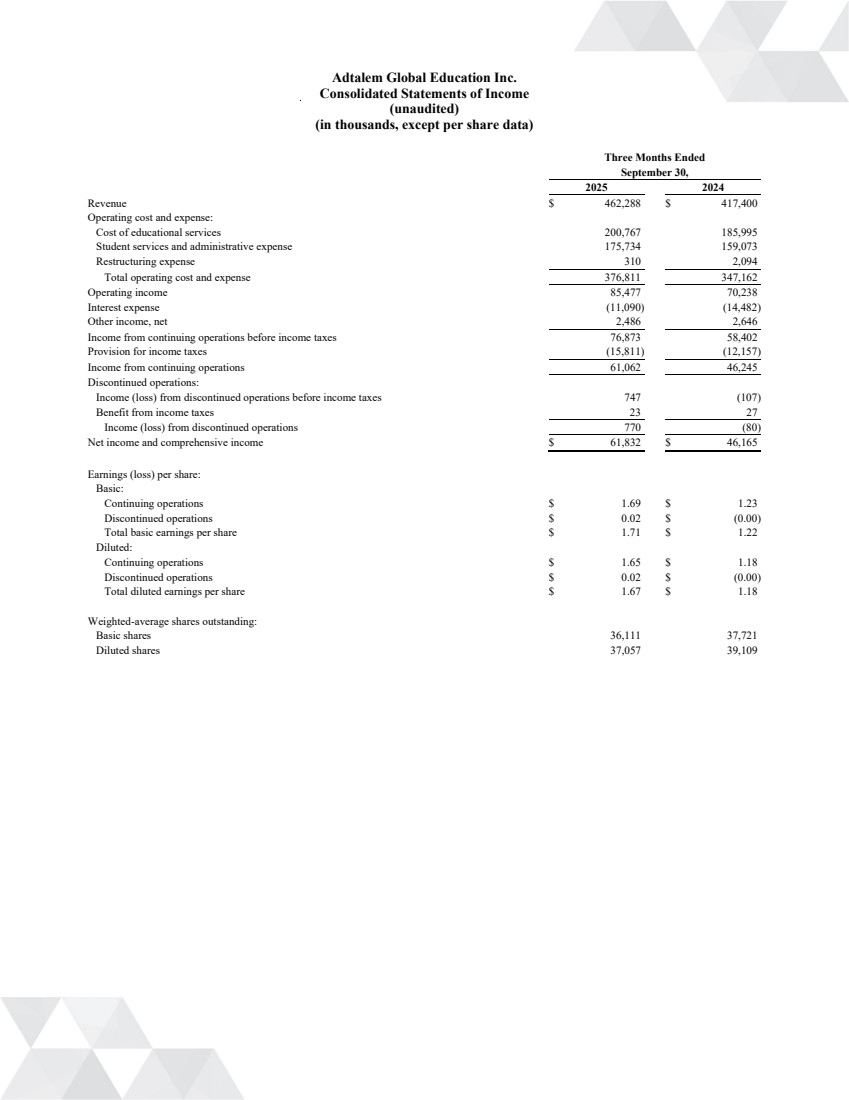
| Adtalem Global Education Inc. Consolidated Statements of Income (unaudited) (in thousands, except per share data) Three Months Ended September 30, 2025 2024 Revenue $ 462,288 $ 417,400 Operating cost and expense: Cost of educational services 200,767 185,995 Student services and administrative expense 175,734 159,073 Restructuring expense 310 2,094 Total operating cost and expense 376,811 347,162 Operating income 85,477 70,238 Interest expense (11,090) (14,482) Other income, net 2,486 2,646 Income from continuing operations before income taxes 76,873 58,402 Provision for income taxes (15,811) (12,157) Income from continuing operations 61,062 46,245 Discontinued operations: Income (loss) from discontinued operations before income taxes 747 (107) Benefit from income taxes 23 27 Income (loss) from discontinued operations 770 (80) Net income and comprehensive income $ 61,832 $ 46,165 Earnings (loss) per share: Basic: Continuing operations $ 1.69 $ 1.23 Discontinued operations $ 0.02 $ (0.00) Total basic earnings per share $ 1.71 $ 1.22 Diluted: Continuing operations $ 1.65 $ 1.18 Discontinued operations $ 0.02 $ (0.00) Total diluted earnings per share $ 1.67 $ 1.18 Weighted-average shares outstanding: Basic shares 36,111 37,721 Diluted shares 37,057 39,109 |
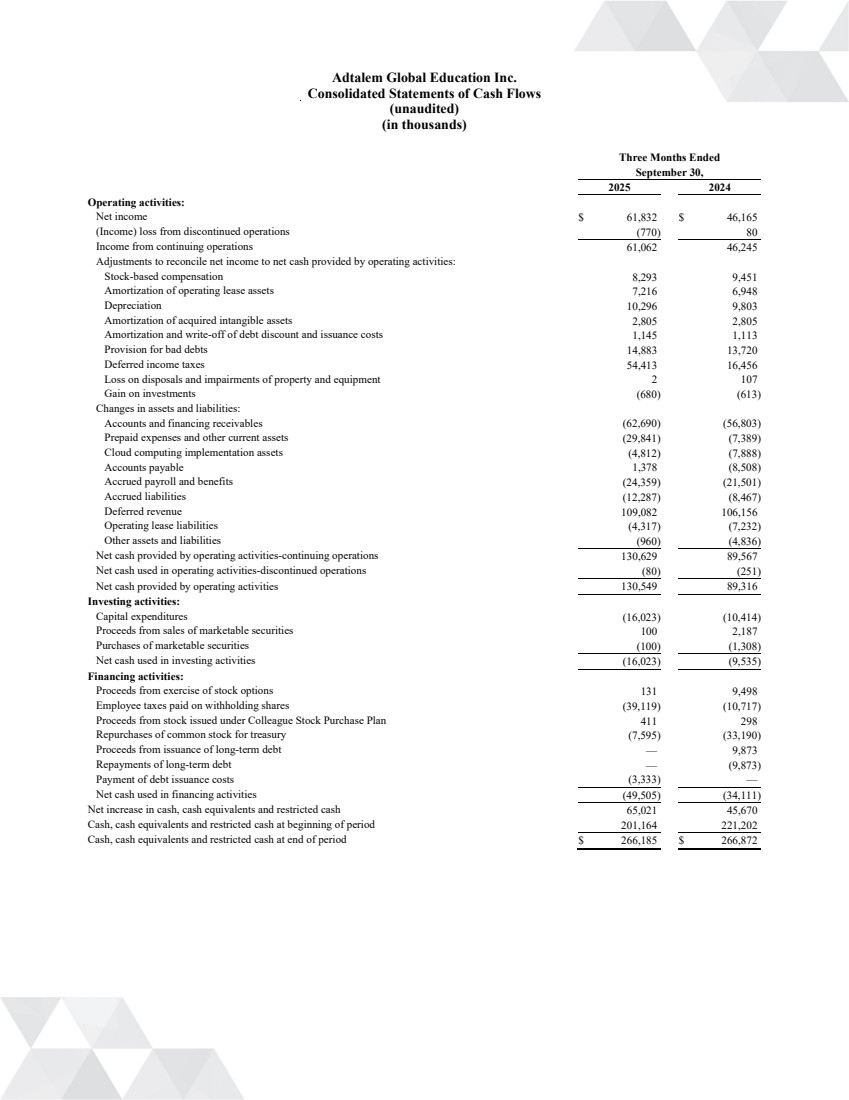
| Adtalem Global Education Inc. Consolidated Statements of Cash Flows (unaudited) (in thousands) Three Months Ended September 30, 2025 2024 Operating activities: Net income $ 61,832 $ 46,165 (Income) loss from discontinued operations (770) 80 Income from continuing operations 61,062 46,245 Adjustments to reconcile net income to net cash provided by operating activities: Stock-based compensation 8,293 9,451 Amortization of operating lease assets 7,216 6,948 Depreciation 10,296 9,803 Amortization of acquired intangible assets 2,805 2,805 Amortization and write-off of debt discount and issuance costs 1,145 1,113 Provision for bad debts 14,883 13,720 Deferred income taxes 54,413 16,456 Loss on disposals and impairments of property and equipment 2 107 Gain on investments (680) (613) Changes in assets and liabilities: Accounts and financing receivables (62,690) (56,803) Prepaid expenses and other current assets (29,841) (7,389) Cloud computing implementation assets (4,812) (7,888) Accounts payable 1,378 (8,508) Accrued payroll and benefits (24,359) (21,501) Accrued liabilities (12,287) (8,467) Deferred revenue 109,082 106,156 Operating lease liabilities (4,317) (7,232) Other assets and liabilities (960) (4,836) Net cash provided by operating activities-continuing operations 130,629 89,567 Net cash used in operating activities-discontinued operations (80) (251) Net cash provided by operating activities 130,549 89,316 Investing activities: Capital expenditures (16,023) (10,414) Proceeds from sales of marketable securities 100 2,187 Purchases of marketable securities (100) (1,308) Net cash used in investing activities (16,023) (9,535) Financing activities: Proceeds from exercise of stock options 131 9,498 Employee taxes paid on withholding shares (39,119) (10,717) Proceeds from stock issued under Colleague Stock Purchase Plan 411 298 Repurchases of common stock for treasury (7,595) (33,190) Proceeds from issuance of long-term debt — 9,873 Repayments of long-term debt — (9,873) Payment of debt issuance costs (3,333) — Net cash used in financing activities (49,505) (34,111) Net increase in cash, cash equivalents and restricted cash 65,021 45,670 Cash, cash equivalents and restricted cash at beginning of period 201,164 221,202 Cash, cash equivalents and restricted cash at end of period $ 266,185 $ 266,872 |
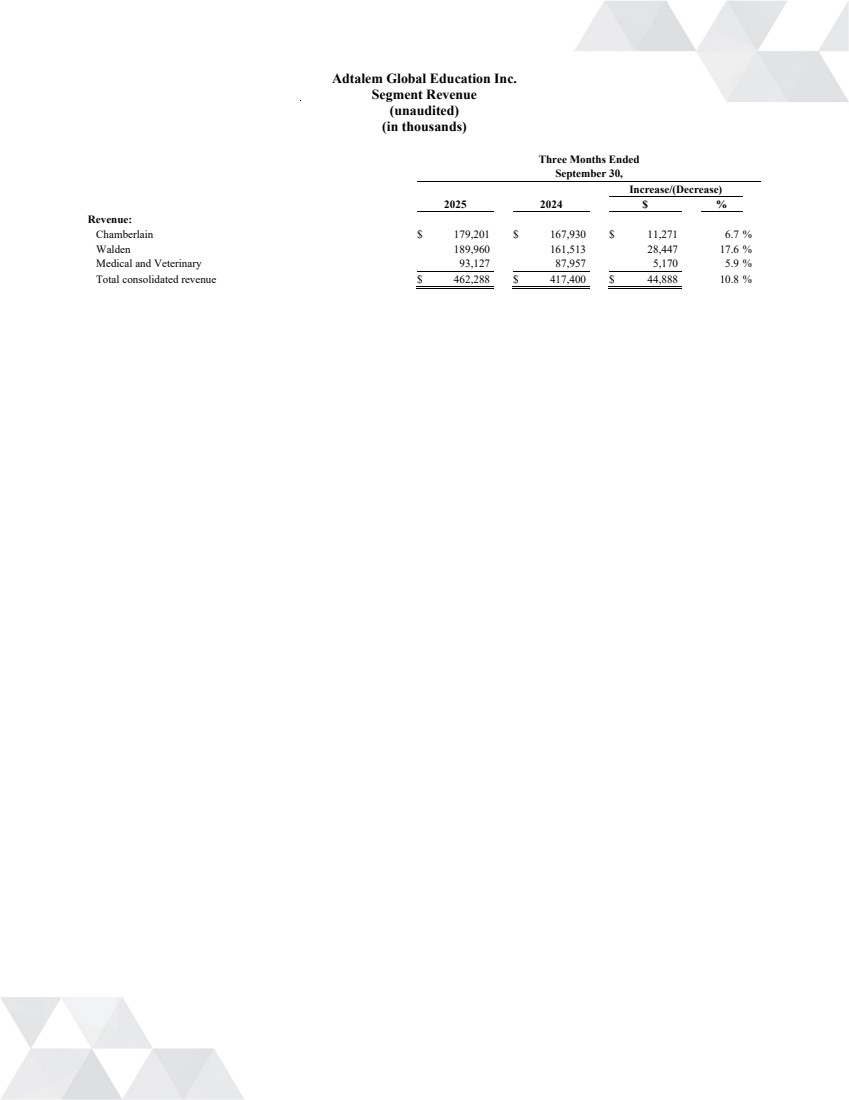
| Adtalem Global Education Inc. Segment Revenue (unaudited) (in thousands) Three Months Ended September 30, Increase/(Decrease) 2025 2024 $ % Revenue: Chamberlain $ 179,201 $ 167,930 $ 11,271 6.7 % Walden 189,960 161,513 28,447 17.6 % Medical and Veterinary 93,127 87,957 5,170 5.9 % Total consolidated revenue $ 462,288 $ 417,400 $ 44,888 10.8 % |
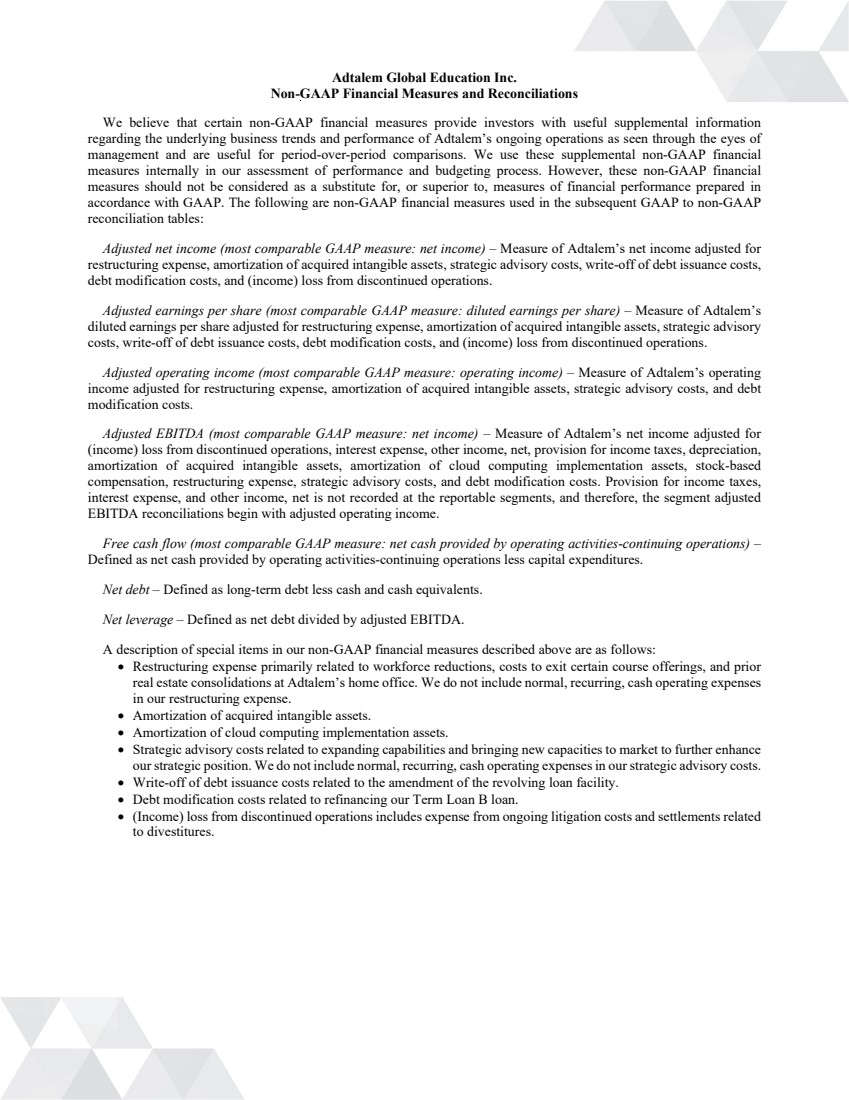
| Adtalem Global Education Inc. Non-GAAP Financial Measures and Reconciliations We believe that certain non-GAAP financial measures provide investors with useful supplemental information regarding the underlying business trends and performance of Adtalem’s ongoing operations as seen through the eyes of management and are useful for period-over-period comparisons. We use these supplemental non-GAAP financial measures internally in our assessment of performance and budgeting process. However, these non-GAAP financial measures should not be considered as a substitute for, or superior to, measures of financial performance prepared in accordance with GAAP. The following are non-GAAP financial measures used in the subsequent GAAP to non-GAAP reconciliation tables: Adjusted net income (most comparable GAAP measure: net income) – Measure of Adtalem’s net income adjusted for restructuring expense, amortization of acquired intangible assets, strategic advisory costs, write-off of debt issuance costs, debt modification costs, and (income) loss from discontinued operations. Adjusted earnings per share (most comparable GAAP measure: diluted earnings per share) – Measure of Adtalem’s diluted earnings per share adjusted for restructuring expense, amortization of acquired intangible assets, strategic advisory costs, write-off of debt issuance costs, debt modification costs, and (income) loss from discontinued operations. Adjusted operating income (most comparable GAAP measure: operating income) – Measure of Adtalem’s operating income adjusted for restructuring expense, amortization of acquired intangible assets, strategic advisory costs, and debt modification costs. Adjusted EBITDA (most comparable GAAP measure: net income) – Measure of Adtalem’s net income adjusted for (income) loss from discontinued operations, interest expense, other income, net, provision for income taxes, depreciation, amortization of acquired intangible assets, amortization of cloud computing implementation assets, stock-based compensation, restructuring expense, strategic advisory costs, and debt modification costs. Provision for income taxes, interest expense, and other income, net is not recorded at the reportable segments, and therefore, the segment adjusted EBITDA reconciliations begin with adjusted operating income. Free cash flow (most comparable GAAP measure: net cash provided by operating activities-continuing operations) – Defined as net cash provided by operating activities-continuing operations less capital expenditures. Net debt – Defined as long-term debt less cash and cash equivalents. Net leverage – Defined as net debt divided by adjusted EBITDA. A description of special items in our non-GAAP financial measures described above are as follows: • Restructuring expense primarily related to workforce reductions, costs to exit certain course offerings, and prior real estate consolidations at Adtalem’s home office. We do not include normal, recurring, cash operating expenses in our restructuring expense. • Amortization of acquired intangible assets. • Amortization of cloud computing implementation assets. • Strategic advisory costs related to expanding capabilities and bringing new capacities to market to further enhance our strategic position. We do not include normal, recurring, cash operating expenses in our strategic advisory costs. • Write-off of debt issuance costs related to the amendment of the revolving loan facility. • Debt modification costs related to refinancing our Term Loan B loan. • (Income) loss from discontinued operations includes expense from ongoing litigation costs and settlements related to divestitures. |
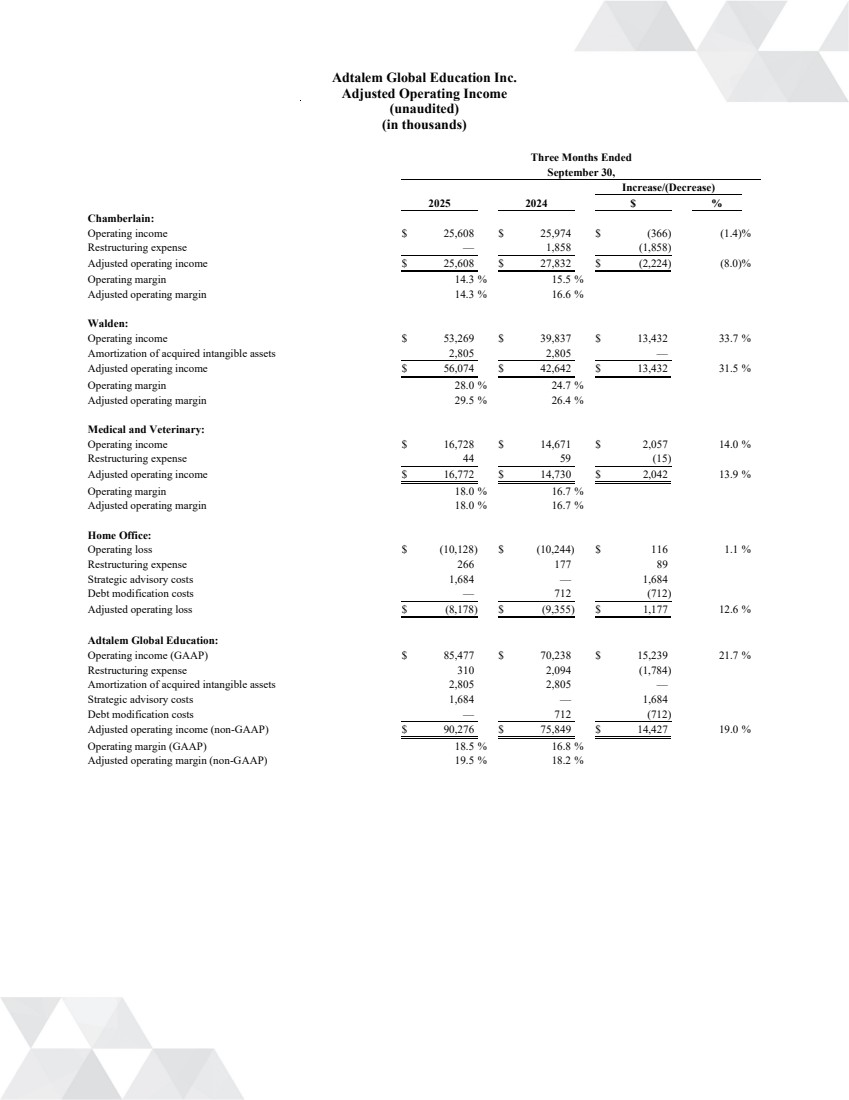
| Adtalem Global Education Inc. Adjusted Operating Income (unaudited) (in thousands) Three Months Ended September 30, Increase/(Decrease) 2025 2024 $ % Chamberlain: Operating income $ 25,608 $ 25,974 $ (366) (1.4)% Restructuring expense — 1,858 (1,858) Adjusted operating income $ 25,608 $ 27,832 $ (2,224) (8.0)% Operating margin 14.3 % 15.5 % Adjusted operating margin 14.3 % 16.6 % Walden: Operating income $ 53,269 $ 39,837 $ 13,432 33.7 % Amortization of acquired intangible assets 2,805 2,805 — Adjusted operating income $ 56,074 $ 42,642 $ 13,432 31.5 % Operating margin 28.0 % 24.7 % Adjusted operating margin 29.5 % 26.4 % Medical and Veterinary: Operating income $ 16,728 $ 14,671 $ 2,057 14.0 % Restructuring expense 44 59 (15) Adjusted operating income $ 16,772 $ 14,730 $ 2,042 13.9 % Operating margin 18.0 % 16.7 % Adjusted operating margin 18.0 % 16.7 % Home Office: Operating loss $ (10,128) $ (10,244) $ 116 1.1 % Restructuring expense 266 177 89 Strategic advisory costs 1,684 — 1,684 Debt modification costs — 712 (712) Adjusted operating loss $ (8,178) $ (9,355) $ 1,177 12.6 % Adtalem Global Education: Operating income (GAAP) $ 85,477 $ 70,238 $ 15,239 21.7 % Restructuring expense 310 2,094 (1,784) Amortization of acquired intangible assets 2,805 2,805 — Strategic advisory costs 1,684 — 1,684 Debt modification costs — 712 (712) Adjusted operating income (non-GAAP) $ 90,276 $ 75,849 $ 14,427 19.0 % Operating margin (GAAP) 18.5 % 16.8 % Adjusted operating margin (non-GAAP) 19.5 % 18.2 % |
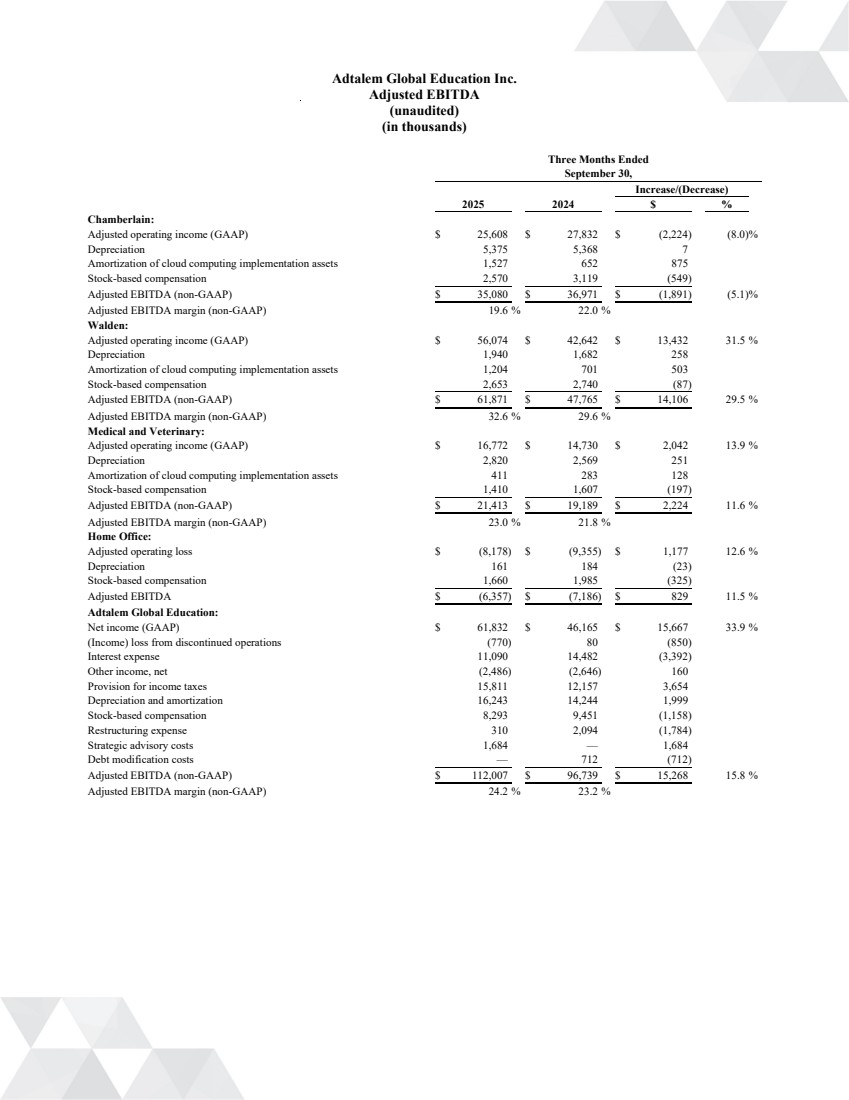
| Adtalem Global Education Inc. Adjusted EBITDA (unaudited) (in thousands) Three Months Ended September 30, Increase/(Decrease) 2025 2024 $ % Chamberlain: Adjusted operating income (GAAP) $ 25,608 $ 27,832 $ (2,224) (8.0)% Depreciation 5,375 5,368 7 Amortization of cloud computing implementation assets 1,527 652 875 Stock-based compensation 2,570 3,119 (549) Adjusted EBITDA (non-GAAP) $ 35,080 $ 36,971 $ (1,891) (5.1)% Adjusted EBITDA margin (non-GAAP) 19.6 % 22.0 % Walden: Adjusted operating income (GAAP) $ 56,074 $ 42,642 $ 13,432 31.5 % Depreciation 1,940 1,682 258 Amortization of cloud computing implementation assets 1,204 701 503 Stock-based compensation 2,653 2,740 (87) Adjusted EBITDA (non-GAAP) $ 61,871 $ 47,765 $ 14,106 29.5 % Adjusted EBITDA margin (non-GAAP) 32.6 % 29.6 % Medical and Veterinary: Adjusted operating income (GAAP) $ 16,772 $ 14,730 $ 2,042 13.9 % Depreciation 2,820 2,569 251 Amortization of cloud computing implementation assets 411 283 128 Stock-based compensation 1,410 1,607 (197) Adjusted EBITDA (non-GAAP) $ 21,413 $ 19,189 $ 2,224 11.6 % Adjusted EBITDA margin (non-GAAP) 23.0 % 21.8 % Home Office: Adjusted operating loss $ (8,178) $ (9,355) $ 1,177 12.6 % Depreciation 161 184 (23) Stock-based compensation 1,660 1,985 (325) Adjusted EBITDA $ (6,357) $ (7,186) $ 829 11.5 % Adtalem Global Education: Net income (GAAP) $ 61,832 $ 46,165 $ 15,667 33.9 % (Income) loss from discontinued operations (770) 80 (850) Interest expense 11,090 14,482 (3,392) Other income, net (2,486) (2,646) 160 Provision for income taxes 15,811 12,157 3,654 Depreciation and amortization 16,243 14,244 1,999 Stock-based compensation 8,293 9,451 (1,158) Restructuring expense 310 2,094 (1,784) Strategic advisory costs 1,684 — 1,684 Debt modification costs — 712 (712) Adjusted EBITDA (non-GAAP) $ 112,007 $ 96,739 $ 15,268 15.8 % Adjusted EBITDA margin (non-GAAP) 24.2 % 23.2 % |
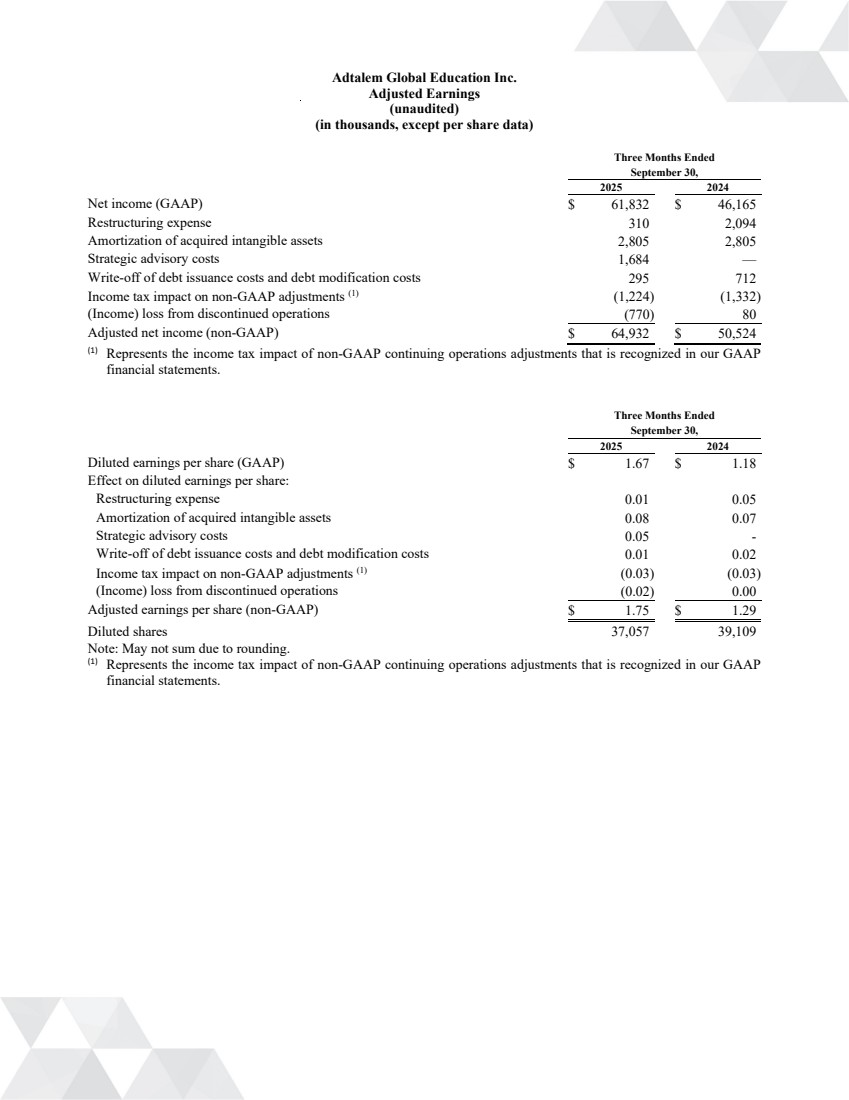
| Adtalem Global Education Inc. Adjusted Earnings (unaudited) (in thousands, except per share data) Three Months Ended September 30, 2025 2024 Net income (GAAP) $ 61,832 $ 46,165 Restructuring expense 310 2,094 Amortization of acquired intangible assets 2,805 2,805 Strategic advisory costs 1,684 — Write-off of debt issuance costs and debt modification costs 295 712 Income tax impact on non-GAAP adjustments (1) (1,224) (1,332) (Income) loss from discontinued operations (770) 80 Adjusted net income (non-GAAP) $ 64,932 $ 50,524 (1) Represents the income tax impact of non-GAAP continuing operations adjustments that is recognized in our GAAP financial statements. Three Months Ended September 30, 2025 2024 Diluted earnings per share (GAAP) $ 1.67 $ 1.18 Effect on diluted earnings per share: Restructuring expense 0.01 0.05 Amortization of acquired intangible assets 0.08 0.07 Strategic advisory costs 0.05 - Write-off of debt issuance costs and debt modification costs 0.01 0.02 Income tax impact on non-GAAP adjustments (1) (0.03) (0.03) (Income) loss from discontinued operations (0.02) 0.00 Adjusted earnings per share (non-GAAP) $ 1.75 $ 1.29 Diluted shares 37,057 39,109 Note: May not sum due to rounding. (1) Represents the income tax impact of non-GAAP continuing operations adjustments that is recognized in our GAAP financial statements. |
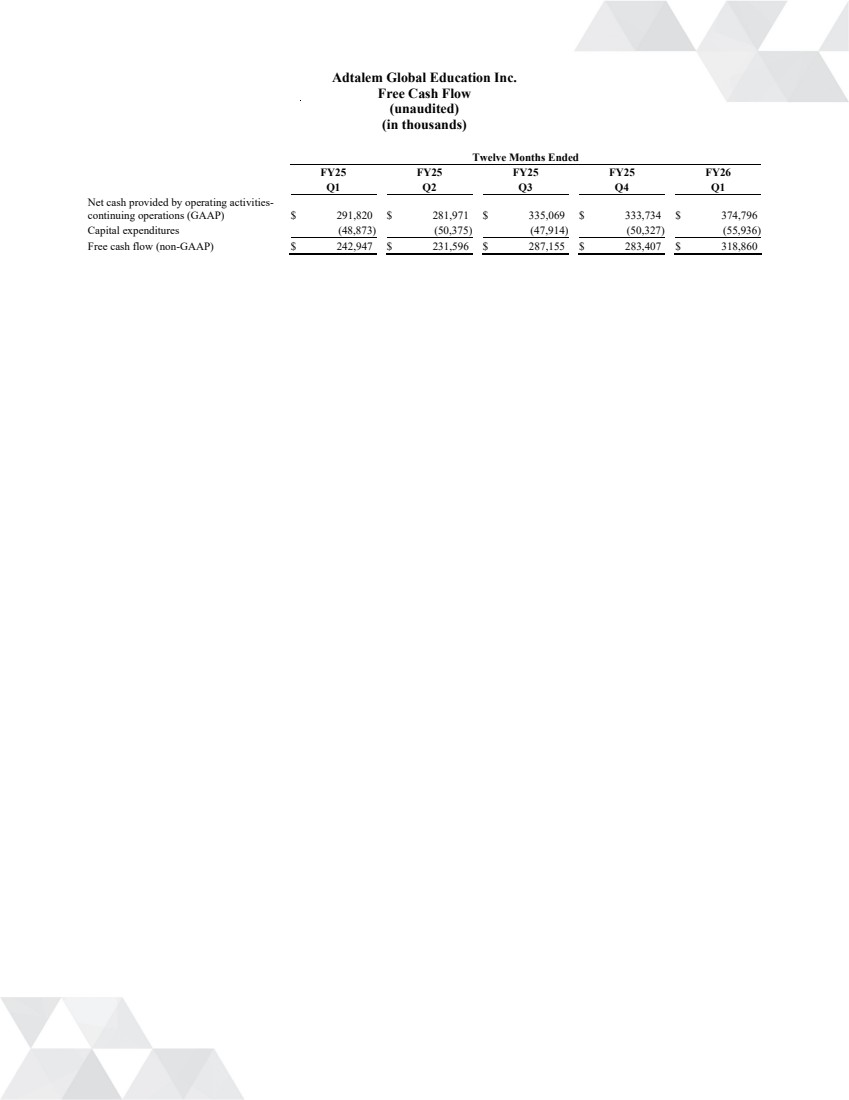
| Adtalem Global Education Inc. Free Cash Flow (unaudited) (in thousands) Twelve Months Ended FY25 FY25 FY25 FY25 FY26 Q1 Q2 Q3 Q4 Q1 Net cash provided by operating activities-continuing operations (GAAP) $ 291,820 $ 281,971 $ 335,069 $ 333,734 $ 374,796 Capital expenditures (48,873) (50,375) (47,914) (50,327) (55,936) Free cash flow (non-GAAP) $ 242,947 $ 231,596 $ 287,155 $ 283,407 $ 318,860 |
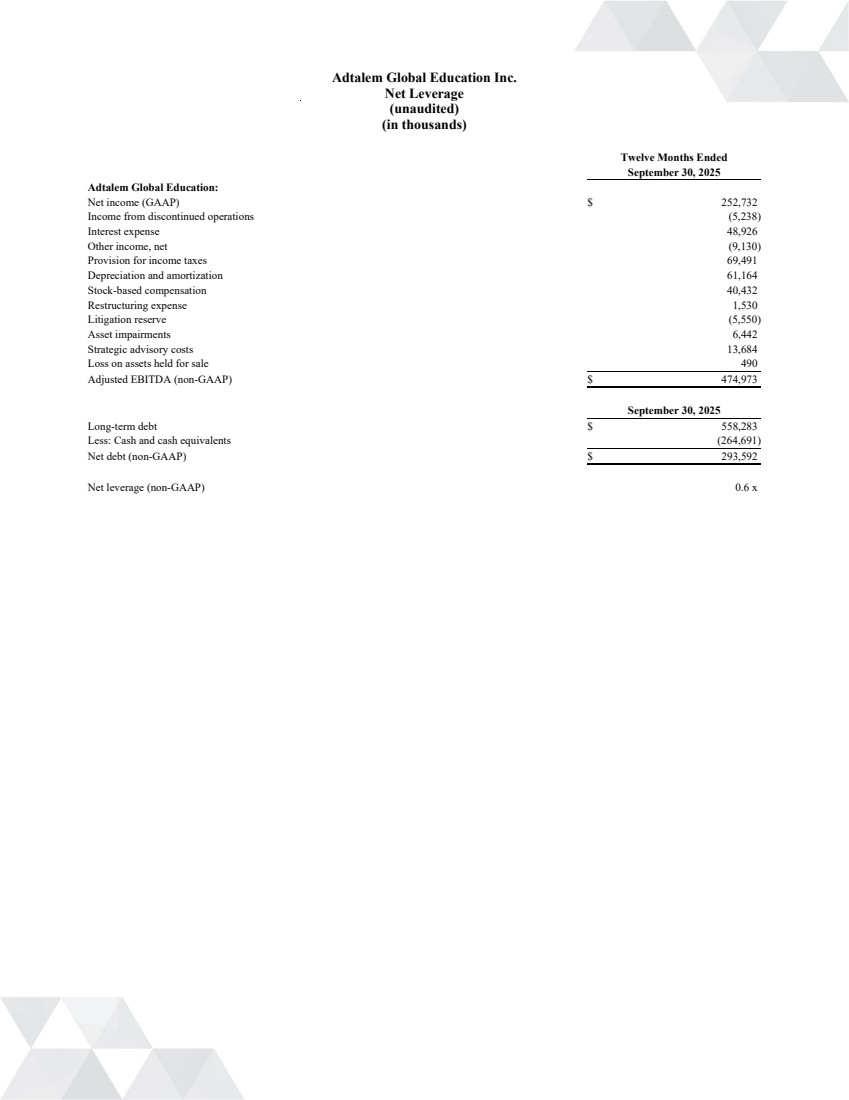
| Adtalem Global Education Inc. Net Leverage (unaudited) (in thousands) Twelve Months Ended September 30, 2025 Adtalem Global Education: Net income (GAAP) $ 252,732 Income from discontinued operations (5,238) Interest expense 48,926 Other income, net (9,130) Provision for income taxes 69,491 Depreciation and amortization 61,164 Stock-based compensation 40,432 Restructuring expense 1,530 Litigation reserve (5,550) Asset impairments 6,442 Strategic advisory costs 13,684 Loss on assets held for sale 490 Adjusted EBITDA (non-GAAP) $ 474,973 September 30, 2025 Long-term debt $ 558,283 Less: Cash and cash equivalents (264,691) Net debt (non-GAAP) $ 293,592 Net leverage (non-GAAP) 0.6 x |