EARNINGS PRESENTATION SECOND QUARTER 2026 2026
2SECOND QUARTER 2026 EARNINGS PRESENTATION Cautionary Notice Regarding Forward-Looking Statements This presentation contains “forward-looking statements” within the meaning, and protections, of Section 27A of the Securities Act of 1933, as amended, and Section 21E of the Securities Exchange Act of 1934, as amended, including, without limitation, statements about future financial and operating results, cost savings, enhanced revenues, economic and seasonal conditions in the Company’s markets, and improvements or impacts to reported earnings that may be realized from cost controls, tax law changes, conversion of preferred shares into common shares, new initiatives and for integration of banks (including Villages Bancorporation, Inc. (“VBI”)) that the Company has acquired, or expects to acquire, as well as statements with respect to Seacoast's objectives, strategic plans, expectations and intentions and other statements that are not historical facts. Actual results may differ from those set forth in the forward-looking statements. Forward-looking statements include statements with respect to the Company’s beliefs, plans, objectives, goals, expectations, anticipations, assumptions, estimates and intentions about future performance and involve known and unknown risks, uncertainties and other factors, which may be beyond the Company’s control, and which may cause the actual results, performance or achievements of Seacoast Banking Corporation of Florida (“Seacoast” or the “Company”) or its wholly-owned banking subsidiary, Seacoast National Bank (“Seacoast Bank”), to be materially different from results, performance or achievements expressed or implied by such forward-looking statements. The Company undertakes no obligation to update any forward-looking statements, whether as a result of new information, future events or otherwise, except as required by law. All statements other than statements of historical fact could be forward-looking statements. You can identify these forward- looking statements through the use of words such as "may", "will", "anticipate", "assume", "should", "support", "indicate", "would", "believe", "contemplate", "expect", "estimate", "continue", "further", "plan", "point to", "project", "could", "intend", "target" or other similar words and expressions of the future. Forward-looking statements also include statements relating to expectations regarding net interest income, net interest margin, loan growth, deposit growth and mix, credit quality, noninterest income and expense, capital levels and liquidity. These forward-looking statements may not be realized due to a variety of factors, including, without limitation: the impact of current and future economic and market conditions generally (including seasonality) and in the financial services industry, nationally and within Seacoast’s primary market areas, including the effects of continued inflationary pressures, changes in interest rates, tariffs or trade wars (including reduced consumer spending), slowdowns in economic growth, and the potential for high unemployment rates, as well as the financial stress on borrowers and changes to customer and client behavior and credit risk as a result of the foregoing; potential impacts of adverse developments in the banking industry, or as encountered by other financial institutions that adversely affect Seacoast, and including impacts on customer confidence, deposit outflows, liquidity and the regulatory response thereto (including increases in the cost of our deposit insurance assessments), the Company's ability to effectively manage its liquidity risk and any growth plans, and the availability of capital and funding; governmental monetary and fiscal policies, including interest rate policies of the Board of Governors of the Federal Reserve, as well as risks related to legislative, tax and regulatory changes, including those that impact the money supply and inflation; the risks of continued changes in interest rates on the level and composition of deposits (as well as the cost of, and competition for, deposits), loan demand, liquidity and the values of loan collateral, securities, and interest rate sensitive assets and liabilities; interest rate risks (including the impacts of interest rates on macroeconomic conditions, and on our net interest income), sensitivities and the shape of the yield curve; changes in accounting policies, rules and practices; changes in retail distribution strategies, customer preferences and behavior generally and as a result of economic factors, including heightened or persistent inflation; changes in borrower credit risks and payment behaviors, and changes in the availability and cost of credit and capital in the financial markets; changes in the prices, values and sales volumes of residential and commercial real estate, especially as they relate to the value of collateral supporting the Company’s loans; the Company’s concentration in commercial real estate loans and in real estate collateral in Florida; Seacoast’s ability to comply with any regulatory requirements and the risk that the regulatory environment may not be conducive to or may prohibit or delay the consummation of future mergers and/or business combinations, may increase the length of time and amount of resources required to consummate such transactions, and may reduce the anticipated benefit; inaccuracies or other failures from the use of models, including the failure of assumptions and estimates (including with respect to our financial statements), as well as differences in, and changes to, economic, market and credit conditions; the impact on the valuation of Seacoast’s investments due to market volatility or counterparty payment risk, as well as the effect of a decline in stock market prices on our fee income from our wealth management business; statutory and regulatory dividend restrictions; increases in regulatory capital requirements for banking organizations generally; the risks of mergers, acquisitions and divestitures, including Seacoast’s ability to continue to identify acquisition targets, successfully acquire and integrate desirable financial institutions and realize expected revenues and revenue synergies, and limit deposit, customer and employee attrition; changes in technology or products that may be more difficult, costly, or less effective than anticipated; the timely development and acceptance of new products and services as well as risks (including reputational and litigation) attendant thereto, and perceived overall value of these products and services by users; risks associated with the development and use of artificial intelligence; the Company’s ability to identify and address increased cybersecurity risks, including those impacting vendors and other third parties which may be exacerbated by developments in generative artificial intelligence; fraud or misconduct by internal or external parties, which Seacoast may not be able to prevent, detect or mitigate; inability of Seacoast’s risk management framework to manage risks associated with the Company’s business; dependence on key suppliers or vendors to obtain equipment or services for the business on acceptable terms; reduction in or the termination of Seacoast’s ability to use the online- or mobile-based platform that is critical to the Company’s business growth strategy; the effects of war or other conflicts, regime change, civil unrest, acts of terrorism, natural disasters, including hurricanes in the Company’s footprint, health emergencies, epidemics or pandemics, or other catastrophic events that may affect general economic conditions and/or increase costs, including, but not limited to, property and casualty and other insurance costs; Seacoast’s ability to maintain adequate internal controls over financial reporting; potential or actual claims, damages, penalties, fines, costs, unexpected outcomes and reputational damage resulting from new, existing, pending or future litigation, regulatory proceedings and enforcement actions; the risks that deferred tax assets could be reduced if estimates of future taxable income from the Company’s operations and tax planning strategies are less than currently estimated, the results of tax audit findings, challenges to our tax positions, or adverse changes or interpretations of tax laws; the effects of competition (including the inability to grow, or attrition of deposits, customers, and employees) from other commercial banks, thrifts, mortgage banking firms, consumer finance companies, credit unions, non-bank financial technology providers, securities brokerage firms, insurance companies, private credit funds, money market and other mutual funds and other financial institutions; the failure of assumptions underlying the establishment of reserves for expected credit losses; impairment of our goodwill or other intangible assets, risks related to, and the costs associated with, environmental, social and governance matters (“ESG”) and anti-ESG matters, including the scope and pace of related rulemaking activity and disclosure requirements and potential litigation and enforcement; legislative, regulatory or supervisory actions related to so-called “de-banking,” including any new prohibitions, requirements or enforcement priorities that could affect customer relationships, compliance obligations, or operational practices; government actions or inactions, including a deterioration of the credit rating for U.S. long-term sovereign debt, actions that the U.S. government may take to avoid exceeding the debt ceiling, and uncertainties surrounding the federal budget and economic policy, including the impact of tariffs and trade policies; the risk that balance sheet, revenue growth, and loan growth expectations may differ from actual results; and other factors and risks described herein and under “Risk Factors” in any of the Company's subsequent reports filed with the SEC and available on its website at www.sec.gov. All written or oral forward-looking statements attributable to us are expressly qualified in their entirety by this cautionary notice, including, without limitation, those risks and uncertainties described in the Company’s annual report on Form 10-K for the year ended December 31, 2025 and in other periodic reports that the Company files with the SEC. Such reports are available upon request from the Company, or from the Securities and Exchange Commission, including through the SEC's Internet website at www.sec.gov.
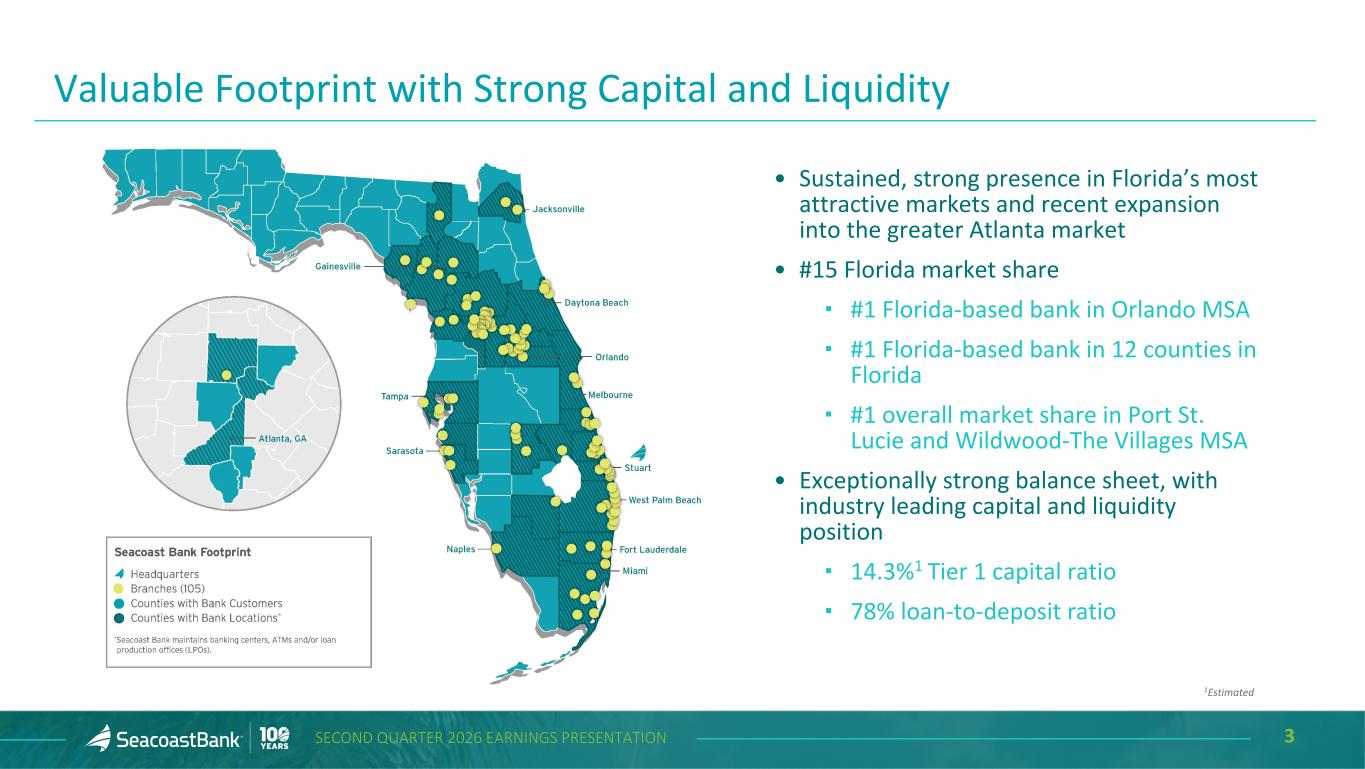
3SECOND QUARTER 2026 EARNINGS PRESENTATION • Sustained, strong presence in Florida’s most attractive markets and recent expansion into the greater Atlanta market • #15 Florida market share ▪ #1 Florida-based bank in Orlando MSA ▪ #1 Florida-based bank in 12 counties in Florida ▪ #1 overall market share in Port St. Lucie and Wildwood-The Villages MSA • Exceptionally strong balance sheet, with industry leading capital and liquidity position ▪ 14.3%1 Tier 1 capital ratio ▪ 78% loan-to-deposit ratio Valuable Footprint with Strong Capital and Liquidity 1Estimated
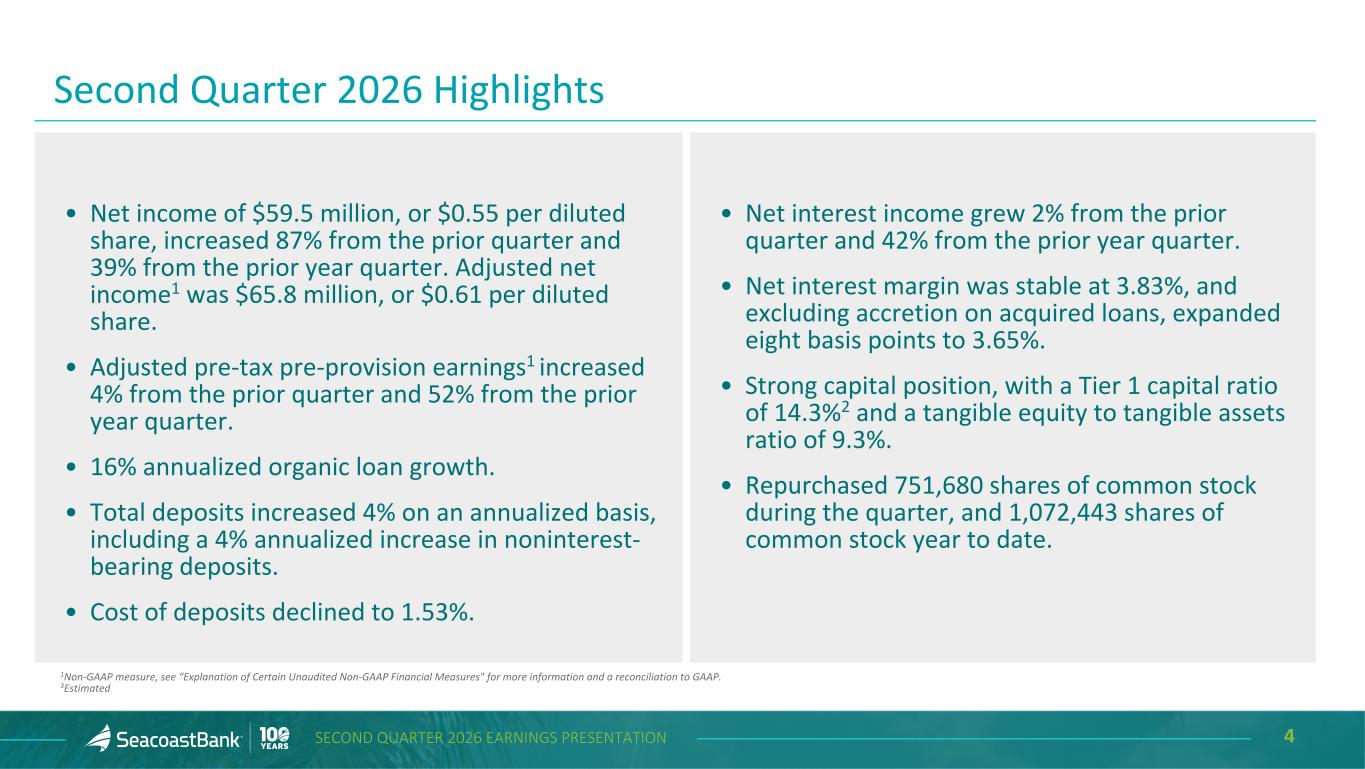
4SECOND QUARTER 2026 EARNINGS PRESENTATION • Net income of $59.5 million, or $0.55 per diluted share, increased 87% from the prior quarter and 39% from the prior year quarter. Adjusted net income1 was $65.8 million, or $0.61 per diluted share. • Adjusted pre-tax pre-provision earnings1 increased 4% from the prior quarter and 52% from the prior year quarter. • 16% annualized organic loan growth. • Total deposits increased 4% on an annualized basis, including a 4% annualized increase in noninterest- bearing deposits. • Cost of deposits declined to 1.53%. Second Quarter 2026 Highlights • Net interest income grew 2% from the prior quarter and 42% from the prior year quarter. • Net interest margin was stable at 3.83%, and excluding accretion on acquired loans, expanded eight basis points to 3.65%. • Strong capital position, with a Tier 1 capital ratio of 14.3%2 and a tangible equity to tangible assets ratio of 9.3%. • Repurchased 751,680 shares of common stock during the quarter, and 1,072,443 shares of common stock year to date. 1Non-GAAP measure, see “Explanation of Certain Unaudited Non-GAAP Financial Measures" for more information and a reconciliation to GAAP. 3Estimated
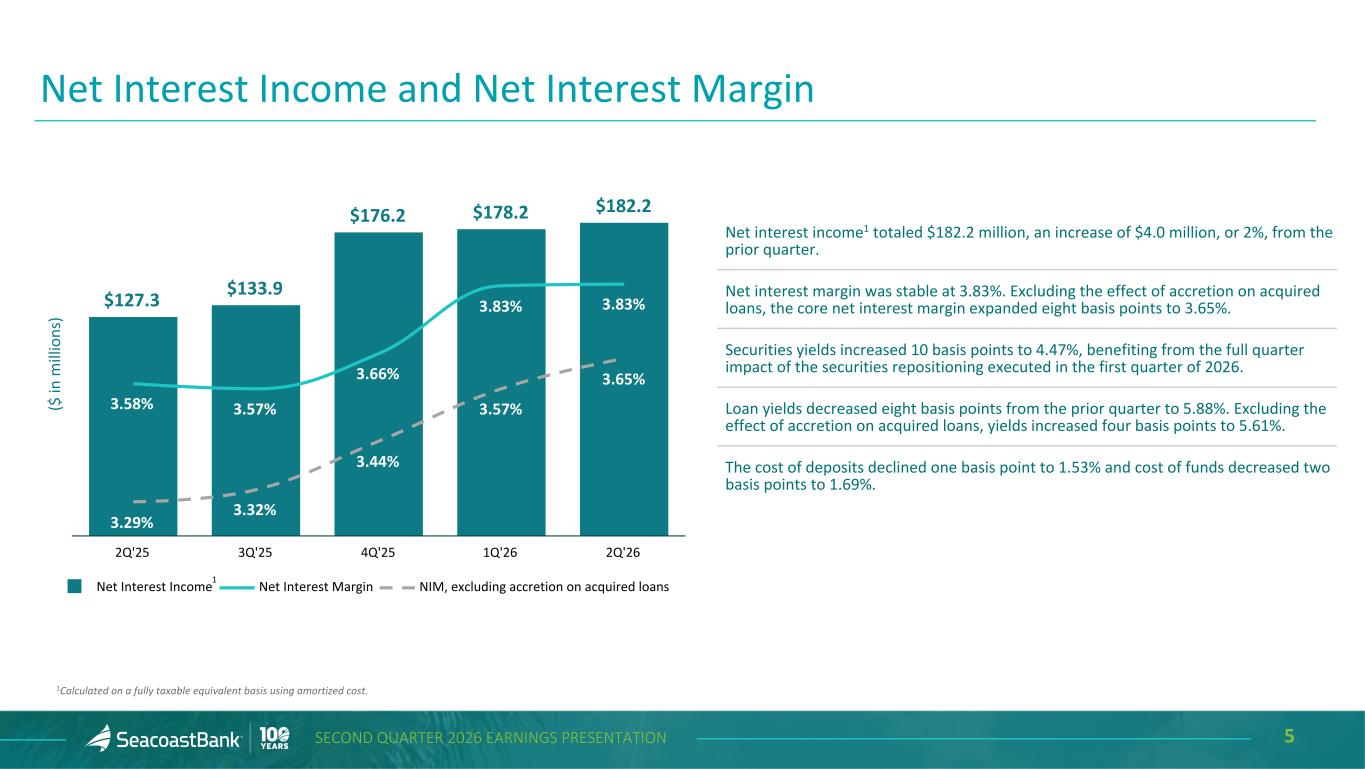
5SECOND QUARTER 2026 EARNINGS PRESENTATION Net Interest Income and Net Interest Margin ($ in m ill io ns ) $127.3 $133.9 $176.2 $178.2 $182.2 3.58% 3.57% 3.66% 3.83% 3.83% 3.29% 3.32% 3.44% 3.57% 3.65% Net Interest Income Net Interest Margin NIM, excluding accretion on acquired loans 2Q'25 3Q'25 4Q'25 1Q'26 2Q'26 Net interest income1 totaled $182.2 million, an increase of $4.0 million, or 2%, from the prior quarter. Net interest margin was stable at 3.83%. Excluding the effect of accretion on acquired loans, the core net interest margin expanded eight basis points to 3.65%. Securities yields increased 10 basis points to 4.47%, benefiting from the full quarter impact of the securities repositioning executed in the first quarter of 2026. Loan yields decreased eight basis points from the prior quarter to 5.88%. Excluding the effect of accretion on acquired loans, yields increased four basis points to 5.61%. The cost of deposits declined one basis point to 1.53% and cost of funds decreased two basis points to 1.69%. 1 1Calculated on a fully taxable equivalent basis using amortized cost.
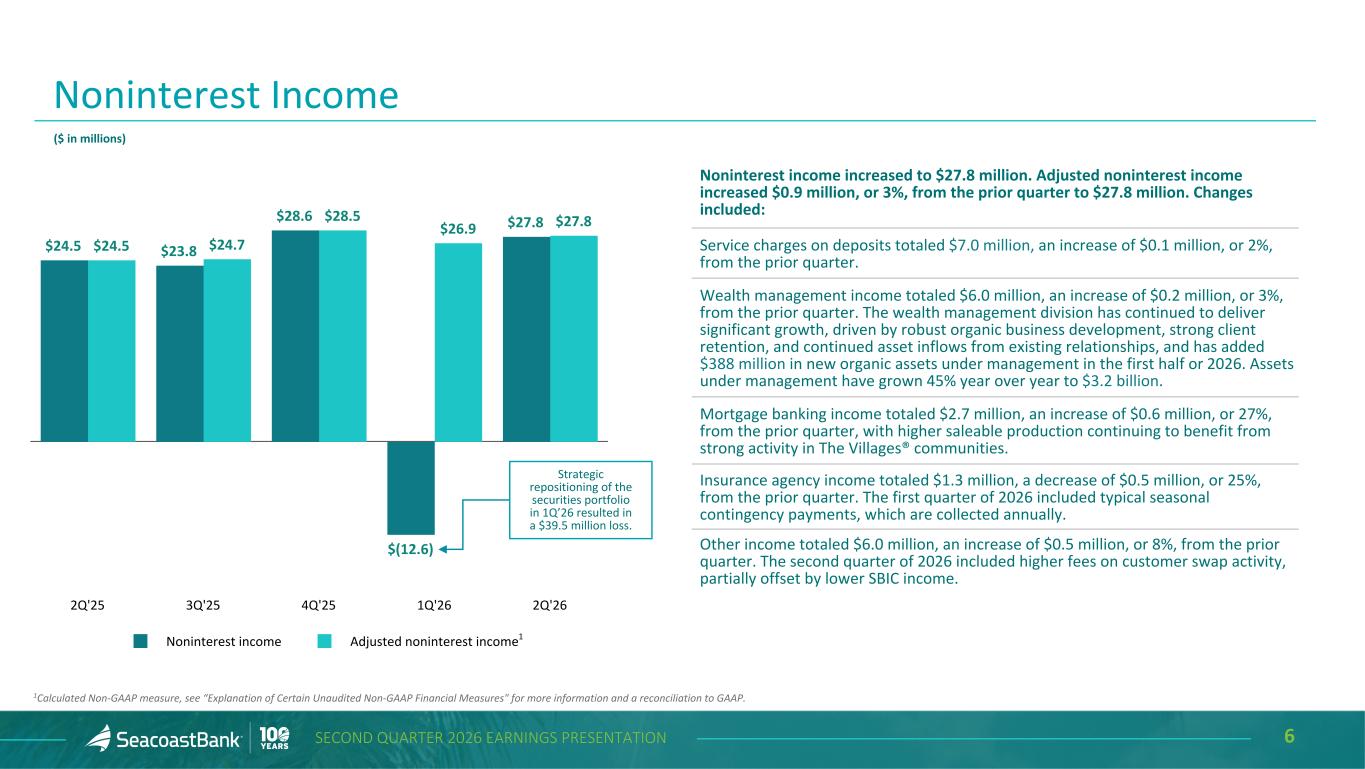
6SECOND QUARTER 2026 EARNINGS PRESENTATION $24.5 $23.8 $28.6 $(12.6) $27.8 $24.5 $24.7 $28.5 $26.9 $27.8 Noninterest income Adjusted noninterest income 2Q'25 3Q'25 4Q'25 1Q'26 2Q'26 Noninterest income increased to $27.8 million. Adjusted noninterest income increased $0.9 million, or 3%, from the prior quarter to $27.8 million. Changes included: Service charges on deposits totaled $7.0 million, an increase of $0.1 million, or 2%, from the prior quarter. Wealth management income totaled $6.0 million, an increase of $0.2 million, or 3%, from the prior quarter. The wealth management division has continued to deliver significant growth, driven by robust organic business development, strong client retention, and continued asset inflows from existing relationships, and has added $388 million in new organic assets under management in the first half or 2026. Assets under management have grown 45% year over year to $3.2 billion. Mortgage banking income totaled $2.7 million, an increase of $0.6 million, or 27%, from the prior quarter, with higher saleable production continuing to benefit from strong activity in The Villages® communities. Insurance agency income totaled $1.3 million, a decrease of $0.5 million, or 25%, from the prior quarter. The first quarter of 2026 included typical seasonal contingency payments, which are collected annually. Other income totaled $6.0 million, an increase of $0.5 million, or 8%, from the prior quarter. The second quarter of 2026 included higher fees on customer swap activity, partially offset by lower SBIC income. Noninterest Income ($ in millions) 1 1Calculated Non-GAAP measure, see “Explanation of Certain Unaudited Non-GAAP Financial Measures" for more information and a reconciliation to GAAP. Strategic repositioning of the securities portfolio in 1Q’26 resulted in a $39.5 million loss.
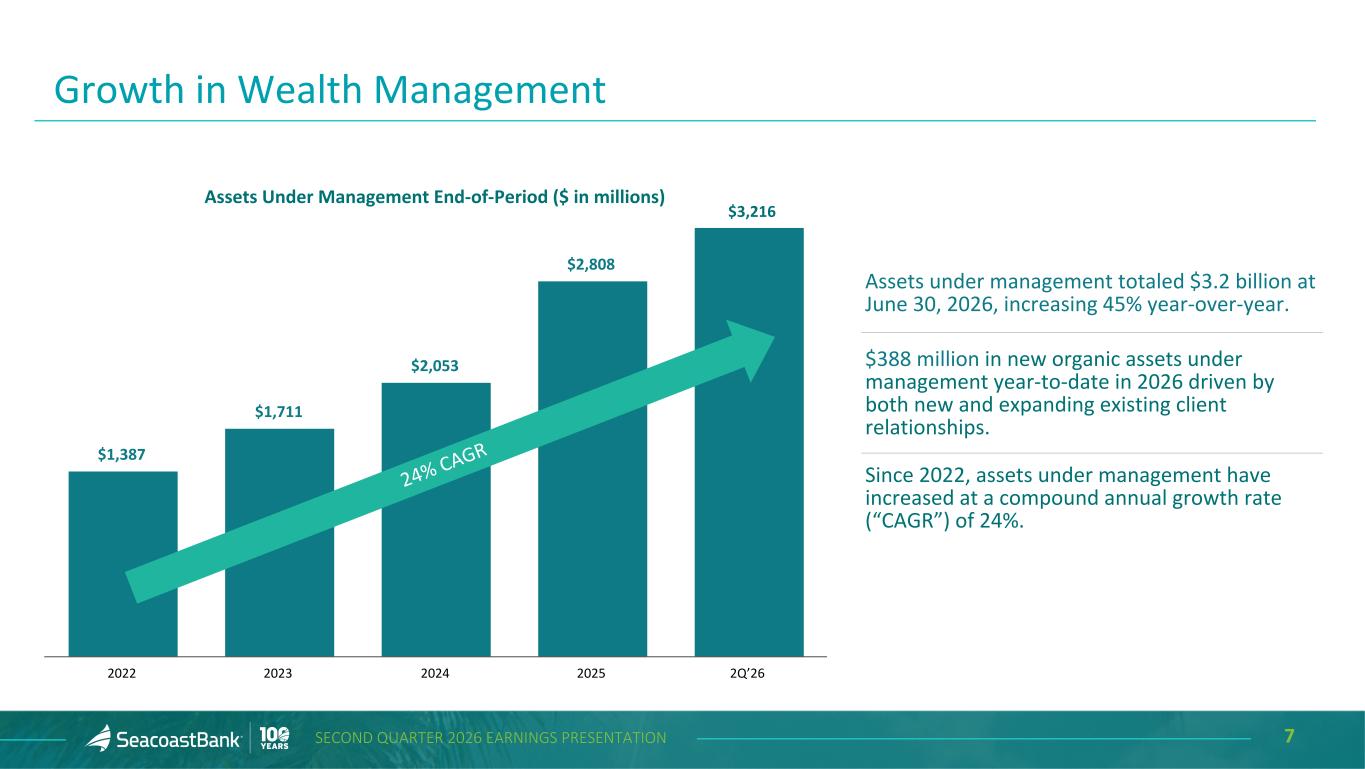
7SECOND QUARTER 2026 EARNINGS PRESENTATION $1,387 $1,711 $2,053 $2,808 2022 2023 2024 2025 2Q’26 Growth in Wealth Management Assets under management totaled $3.2 billion at June 30, 2026, increasing 45% year-over-year. $388 million in new organic assets under management year-to-date in 2026 driven by both new and expanding existing client relationships. Since 2022, assets under management have increased at a compound annual growth rate (“CAGR”) of 24%. 24% CAG R Assets Under Management End-of-Period ($ in millions) $3,216
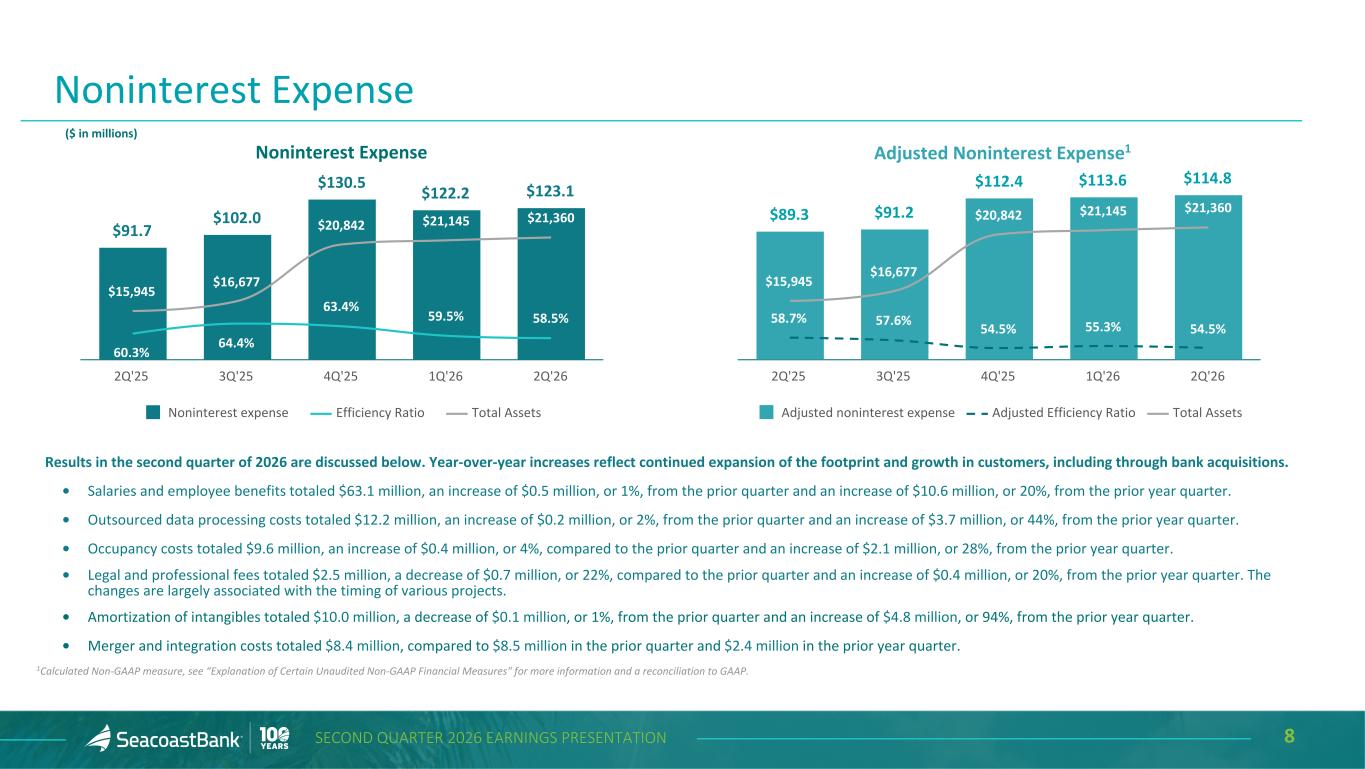
8SECOND QUARTER 2026 EARNINGS PRESENTATION $89.3 $91.2 $112.4 $113.6 $114.8 58.7% 57.6% 54.5% 55.3% 54.5% Adjusted noninterest expense Adjusted Efficiency Ratio Total Assets 2Q'25 3Q'25 4Q'25 1Q'26 2Q'26 Noninterest Expense Results in the second quarter of 2026 are discussed below. Year-over-year increases reflect continued expansion of the footprint and growth in customers, including through bank acquisitions. • Salaries and employee benefits totaled $63.1 million, an increase of $0.5 million, or 1%, from the prior quarter and an increase of $10.6 million, or 20%, from the prior year quarter. • Outsourced data processing costs totaled $12.2 million, an increase of $0.2 million, or 2%, from the prior quarter and an increase of $3.7 million, or 44%, from the prior year quarter. • Occupancy costs totaled $9.6 million, an increase of $0.4 million, or 4%, compared to the prior quarter and an increase of $2.1 million, or 28%, from the prior year quarter. • Legal and professional fees totaled $2.5 million, a decrease of $0.7 million, or 22%, compared to the prior quarter and an increase of $0.4 million, or 20%, from the prior year quarter. The changes are largely associated with the timing of various projects. • Amortization of intangibles totaled $10.0 million, a decrease of $0.1 million, or 1%, from the prior quarter and an increase of $4.8 million, or 94%, from the prior year quarter. • Merger and integration costs totaled $8.4 million, compared to $8.5 million in the prior quarter and $2.4 million in the prior year quarter. 1Calculated Non-GAAP measure, see “Explanation of Certain Unaudited Non-GAAP Financial Measures" for more information and a reconciliation to GAAP. ($ in millions) $91.7 $102.0 $130.5 $122.2 $123.1 60.3% 64.4% 63.4% 59.5% 58.5% Noninterest expense Efficiency Ratio Total Assets 2Q'25 3Q'25 4Q'25 1Q'26 2Q'26 Noninterest Expense $15,945 $16,677 $20,842 $21,145 $21,360 Adjusted Noninterest Expense1 $15,945 $16,677 $20,842 $21,145 $21,360
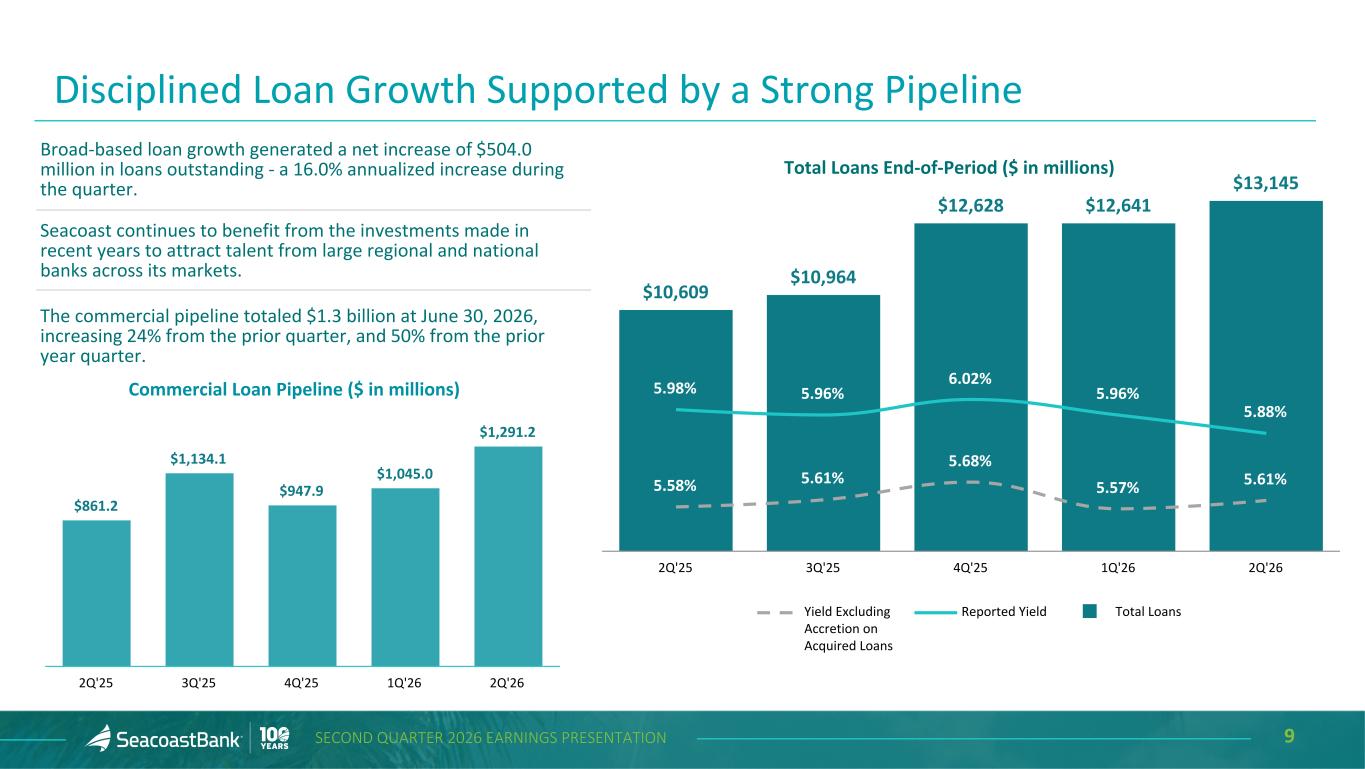
9SECOND QUARTER 2026 EARNINGS PRESENTATION $10,609 $10,964 $12,628 $12,641 $13,145 5.98% 5.96% 6.02% 5.96% 5.88% 5.58% 5.61% 5.68% 5.57% 5.61% Yield Excluding Accretion on Acquired Loans Reported Yield Total Loans 2Q'25 3Q'25 4Q'25 1Q'26 2Q'26 $861.2 $1,134.1 $947.9 $1,045.0 $1,291.2 2Q'25 3Q'25 4Q'25 1Q'26 2Q'26 Commercial Loan Pipeline ($ in millions) Total Loans End-of-Period ($ in millions) Disciplined Loan Growth Supported by a Strong Pipeline Broad-based loan growth generated a net increase of $504.0 million in loans outstanding - a 16.0% annualized increase during the quarter. Seacoast continues to benefit from the investments made in recent years to attract talent from large regional and national banks across its markets. The commercial pipeline totaled $1.3 billion at June 30, 2026, increasing 24% from the prior quarter, and 50% from the prior year quarter.
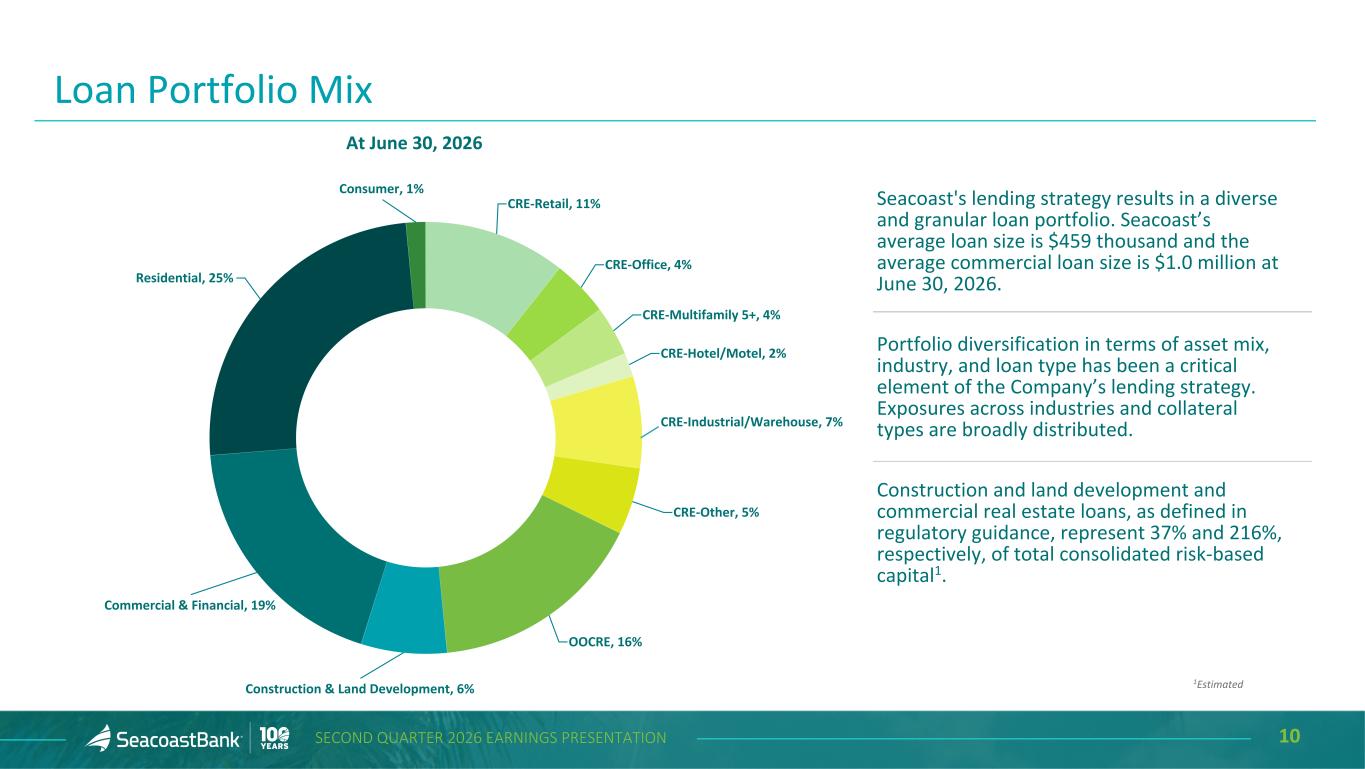
10SECOND QUARTER 2026 EARNINGS PRESENTATION At June 30, 2026 CRE-Retail, 11% CRE-Office, 4% CRE-Multifamily 5+, 4% CRE-Hotel/Motel, 2% CRE-Industrial/Warehouse, 7% CRE-Other, 5% OOCRE, 16% Construction & Land Development, 6% Commercial & Financial, 19% Residential, 25% Consumer, 1% Loan Portfolio Mix Seacoast's lending strategy results in a diverse and granular loan portfolio. Seacoast’s average loan size is $459 thousand and the average commercial loan size is $1.0 million at June 30, 2026. Portfolio diversification in terms of asset mix, industry, and loan type has been a critical element of the Company’s lending strategy. Exposures across industries and collateral types are broadly distributed. Construction and land development and commercial real estate loans, as defined in regulatory guidance, represent 37% and 216%, respectively, of total consolidated risk-based capital1. 1Estimated
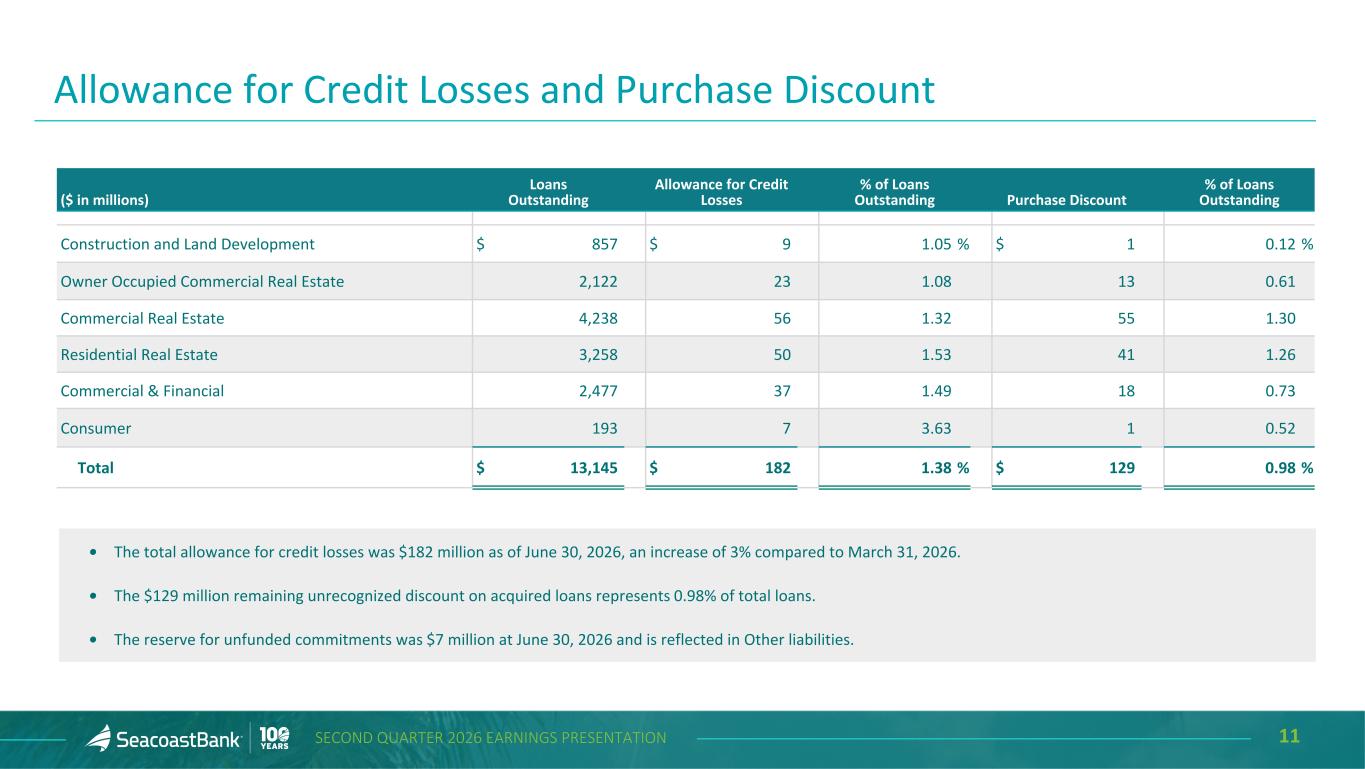
11SECOND QUARTER 2026 EARNINGS PRESENTATION Allowance for Credit Losses and Purchase Discount ($ in millions) Loans Outstanding Allowance for Credit Losses % of Loans Outstanding Purchase Discount % of Loans Outstanding Construction and Land Development $ 857 $ 9 1.05 % $ 1 0.12 % Owner Occupied Commercial Real Estate 2,122 23 1.08 13 0.61 Commercial Real Estate 4,238 56 1.32 55 1.30 Residential Real Estate 3,258 50 1.53 41 1.26 Commercial & Financial 2,477 37 1.49 18 0.73 Consumer 193 7 3.63 1 0.52 Total $ 13,145 $ 182 1.38 % $ 129 0.98 % • The total allowance for credit losses was $182 million as of June 30, 2026, an increase of 3% compared to March 31, 2026. • The $129 million remaining unrecognized discount on acquired loans represents 0.98% of total loans. • The reserve for unfunded commitments was $7 million at June 30, 2026 and is reflected in Other liabilities.
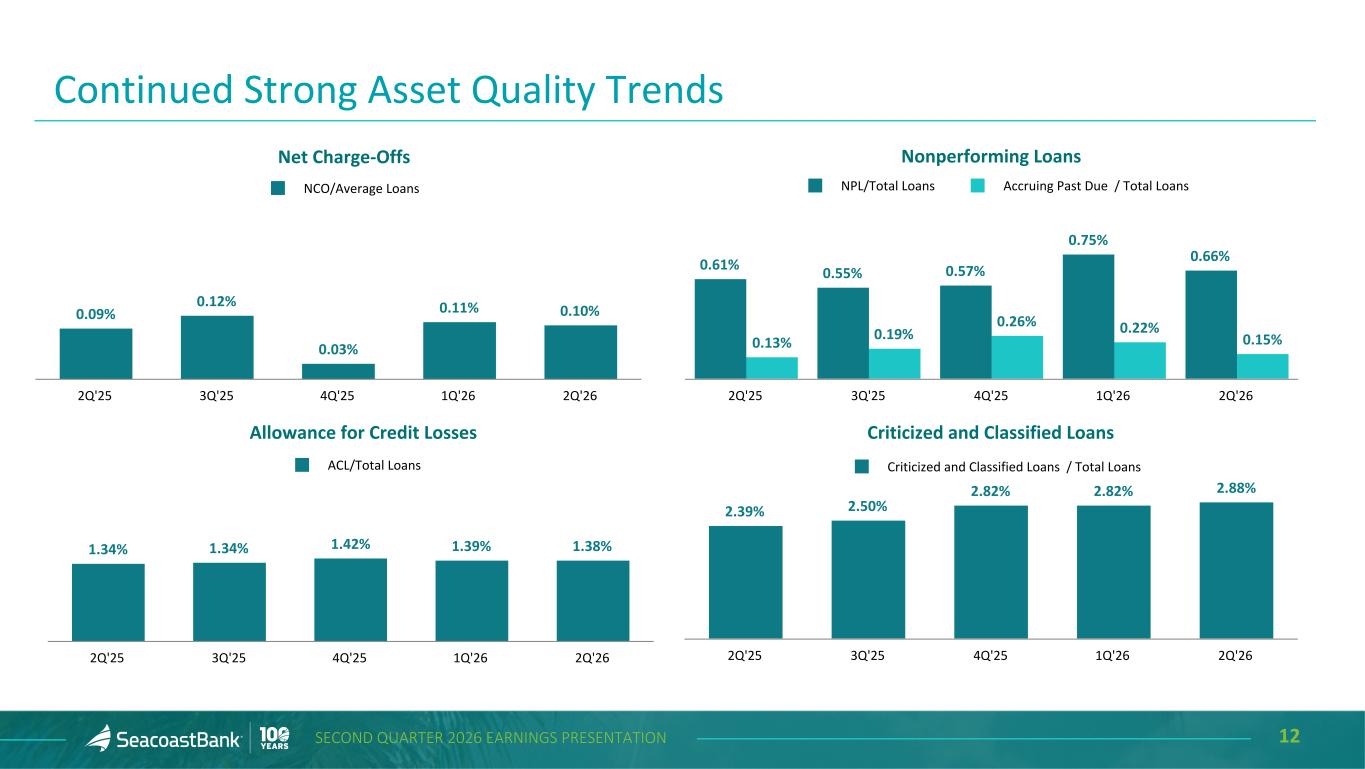
12SECOND QUARTER 2026 EARNINGS PRESENTATION 0.09% 0.12% 0.03% 0.11% 0.10% NCO/Average Loans 2Q'25 3Q'25 4Q'25 1Q'26 2Q'26 1.34% 1.34% 1.42% 1.39% 1.38% ACL/Total Loans 2Q'25 3Q'25 4Q'25 1Q'26 2Q'26 Continued Strong Asset Quality Trends Nonperforming Loans 0.61% 0.55% 0.57% 0.75% 0.66% 0.13% 0.19% 0.26% 0.22% 0.15% NPL/Total Loans Accruing Past Due / Total Loans 2Q'25 3Q'25 4Q'25 1Q'26 2Q'26 2.39% 2.50% 2.82% 2.82% 2.88% Criticized and Classified Loans / Total Loans 2Q'25 3Q'25 4Q'25 1Q'26 2Q'26 Criticized and Classified LoansAllowance for Credit Losses Net Charge-Offs
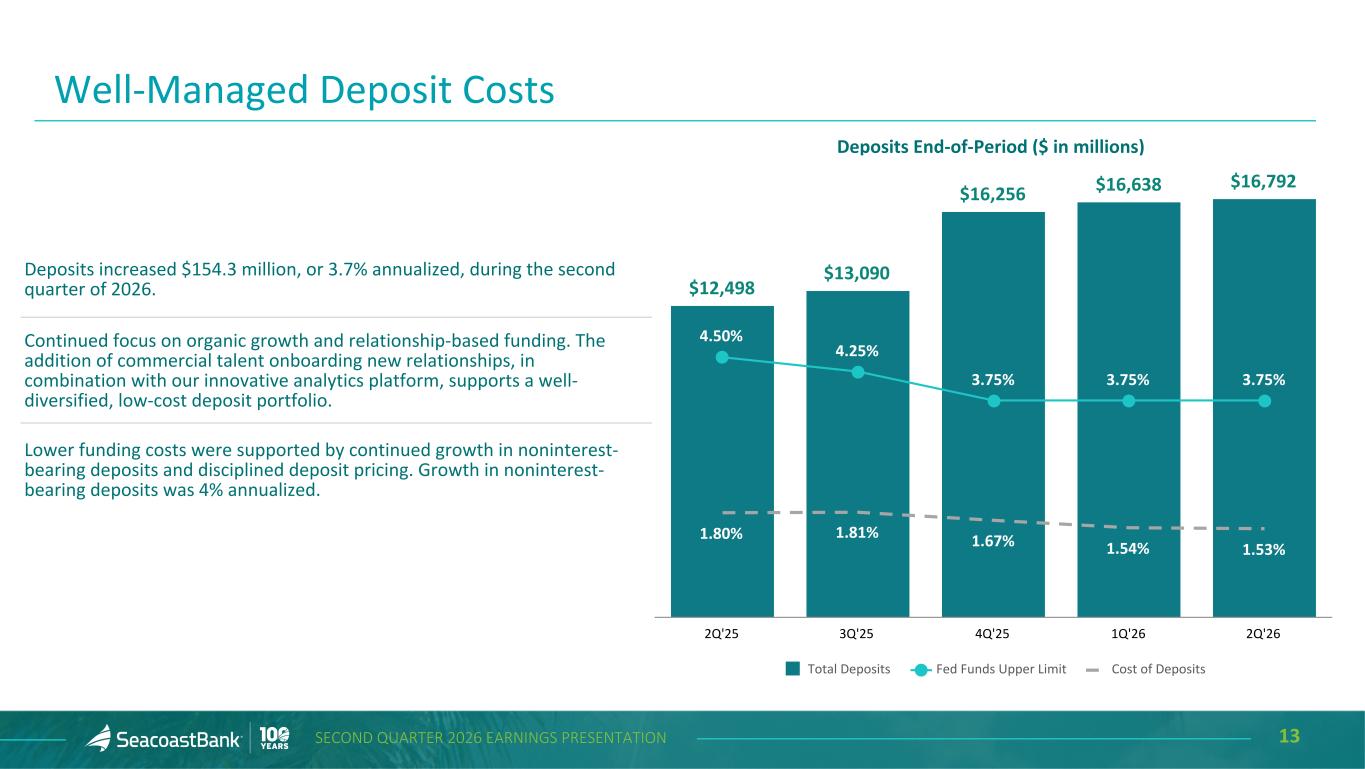
13SECOND QUARTER 2026 EARNINGS PRESENTATION Well-Managed Deposit Costs Deposits increased $154.3 million, or 3.7% annualized, during the second quarter of 2026. Continued focus on organic growth and relationship-based funding. The addition of commercial talent onboarding new relationships, in combination with our innovative analytics platform, supports a well- diversified, low-cost deposit portfolio. Lower funding costs were supported by continued growth in noninterest- bearing deposits and disciplined deposit pricing. Growth in noninterest- bearing deposits was 4% annualized. $12,498 Deposits End-of-Period ($ in millions) $12,498 $13,090 $16,256 $16,638 $16,792 4.50% 4.25% 3.75% 3.75% 3.75% 1.80% 1.81% 1.67% 1.54% 1.53% Total Deposits Fed Funds Upper Limit Cost of Deposits 2Q'25 3Q'25 4Q'25 1Q'26 2Q'26
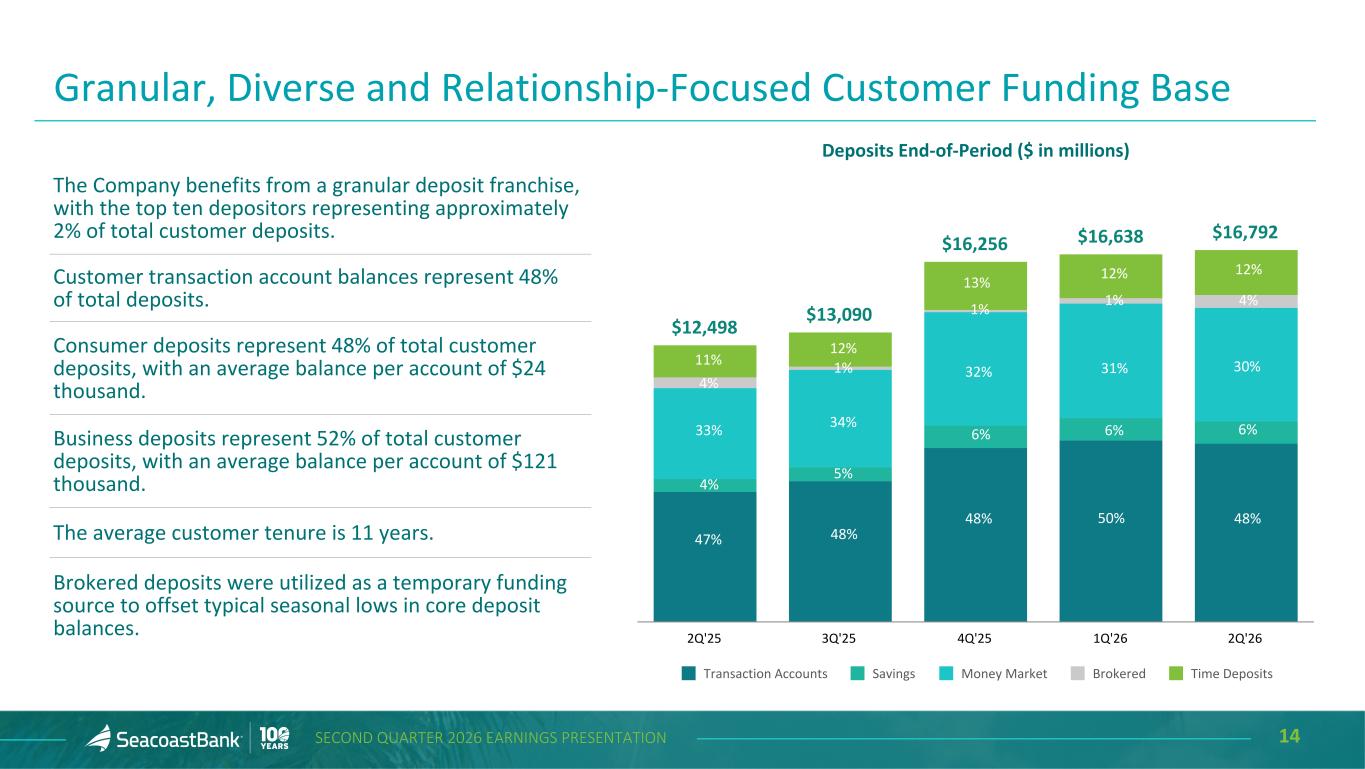
14SECOND QUARTER 2026 EARNINGS PRESENTATION Deposits End-of-Period ($ in millions) $12,498 $13,090 $16,256 $16,638 $16,792 Transaction Accounts Savings Money Market Brokered Time Deposits 2Q'25 3Q'25 4Q'25 1Q'26 2Q'26 Granular, Diverse and Relationship-Focused Customer Funding Base The Company benefits from a granular deposit franchise, with the top ten depositors representing approximately 2% of total customer deposits. Customer transaction account balances represent 48% of total deposits. Consumer deposits represent 48% of total customer deposits, with an average balance per account of $24 thousand. Business deposits represent 52% of total customer deposits, with an average balance per account of $121 thousand. The average customer tenure is 11 years. Brokered deposits were utilized as a temporary funding source to offset typical seasonal lows in core deposit balances. 48%50%48% 48%47% 6%6%6% 5% 4% 33% 34% 32% 31% 30% 4% 1% 1% 1% 4% 11% 12% 13% 12% 12%
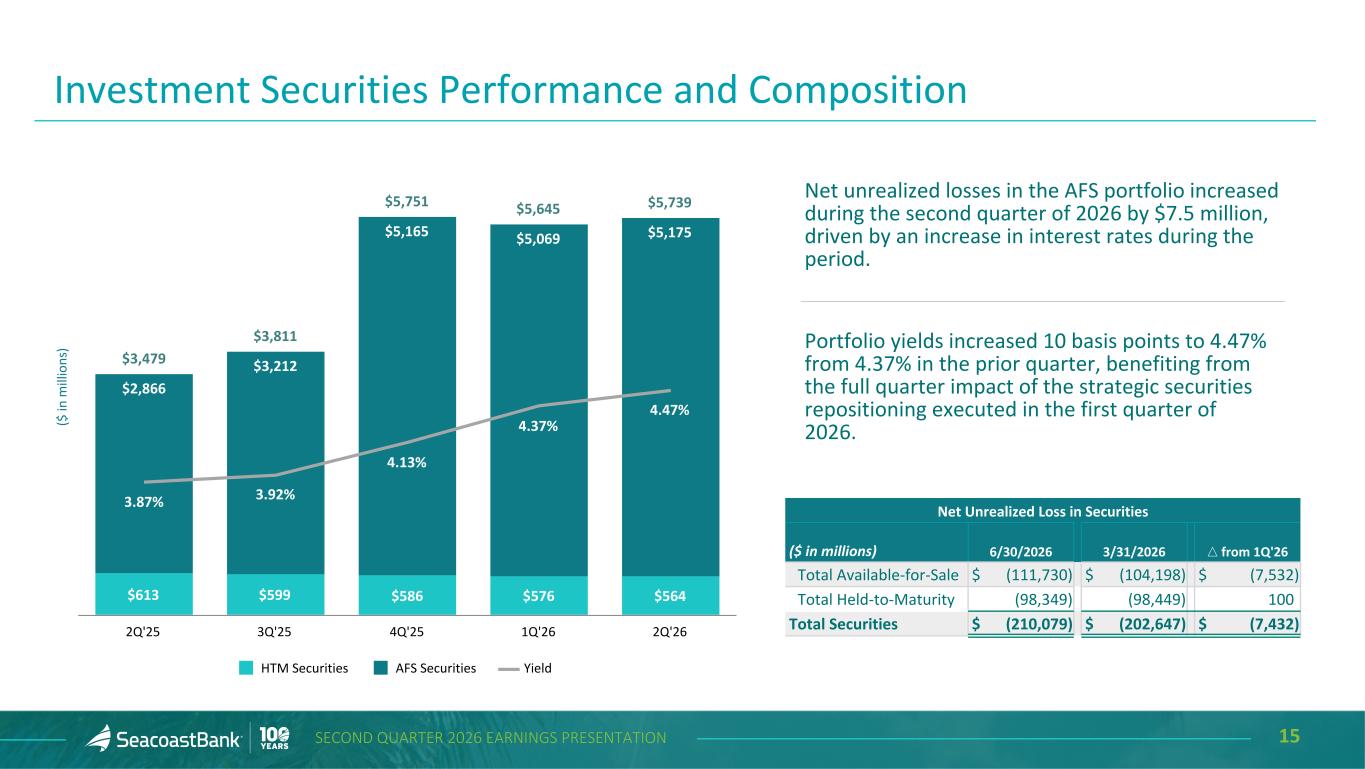
15SECOND QUARTER 2026 EARNINGS PRESENTATION Investment Securities Performance and Composition Net unrealized losses in the AFS portfolio increased during the second quarter of 2026 by $7.5 million, driven by an increase in interest rates during the period. Portfolio yields increased 10 basis points to 4.47% from 4.37% in the prior quarter, benefiting from the full quarter impact of the strategic securities repositioning executed in the first quarter of 2026. Net Unrealized Loss in Securities ($ in millions) 6/30/2026 3/31/2026 △ from 1Q'26 Total Available-for-Sale $ (111,730) $ (104,198) $ (7,532) Total Held-to-Maturity (98,349) (98,449) 100 Total Securities $ (210,079) $ (202,647) $ (7,432) ($ in m ill io ns ) $3,479 $3,811 $5,751 $5,645 $5,739 $613 $599 $586 $576 $564 $2,866 $3,212 $5,165 $5,069 $5,175 3.87% 3.92% 4.13% 4.37% 4.47% HTM Securities AFS Securities Yield 2Q'25 3Q'25 4Q'25 1Q'26 2Q'26
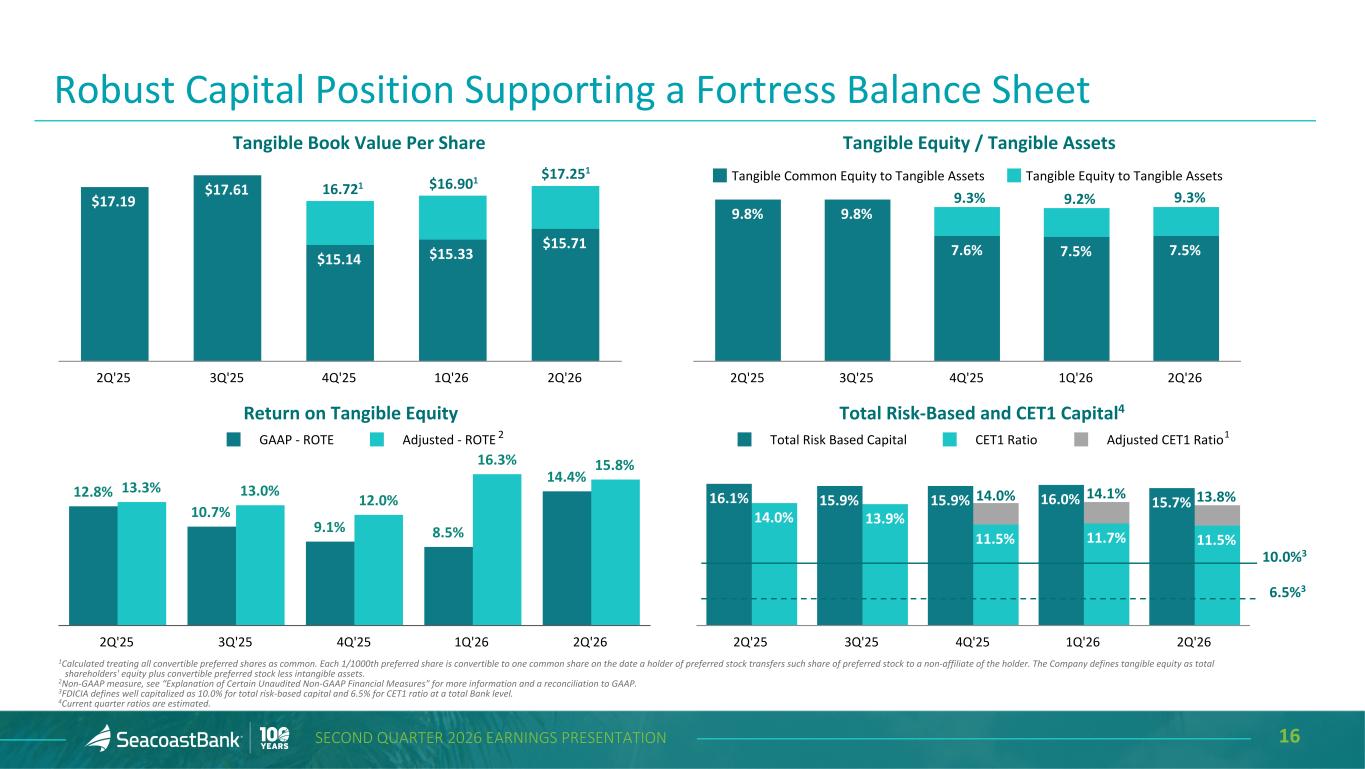
16SECOND QUARTER 2026 EARNINGS PRESENTATION $17.19 $17.61 $15.14 $15.33 $15.71 2Q'25 3Q'25 4Q'25 1Q'26 2Q'26 16.1% 15.9% 15.9% 16.0% 15.7% 14.0% 13.9% 11.5% 11.7% 11.5% Total Risk Based Capital CET1 Ratio Adjusted CET1 Ratio 2Q'25 3Q'25 4Q'25 1Q'26 2Q'26 12.8% 10.7% 9.1% 8.5% 14.4% 13.3% 13.0% 12.0% 16.3% 15.8% GAAP - ROTE Adjusted - ROTE 2Q'25 3Q'25 4Q'25 1Q'26 2Q'26 1Calculated treating all convertible preferred shares as common. Each 1/1000th preferred share is convertible to one common share on the date a holder of preferred stock transfers such share of preferred stock to a non-affiliate of the holder. The Company defines tangible equity as total shareholders' equity plus convertible preferred stock less intangible assets. 2Non-GAAP measure, see “Explanation of Certain Unaudited Non-GAAP Financial Measures" for more information and a reconciliation to GAAP. 3FDICIA defines well capitalized as 10.0% for total risk-based capital and 6.5% for CET1 ratio at a total Bank level. 4Current quarter ratios are estimated. Tangible Book Value Per Share Tangible Equity / Tangible Assets Total Risk-Based and CET1 Capital4Return on Tangible Equity 2 10.0%3 6.5%3 Robust Capital Position Supporting a Fortress Balance Sheet $16.901 $17.251 16.721 9.8% 9.8% 7.6% 7.5% 7.5% Tangible Common Equity to Tangible Assets Tangible Equity to Tangible Assets 2Q'25 3Q'25 4Q'25 1Q'26 2Q'26 9.2% 9.3%9.3% 14.0% 14.1% 13.8% 1
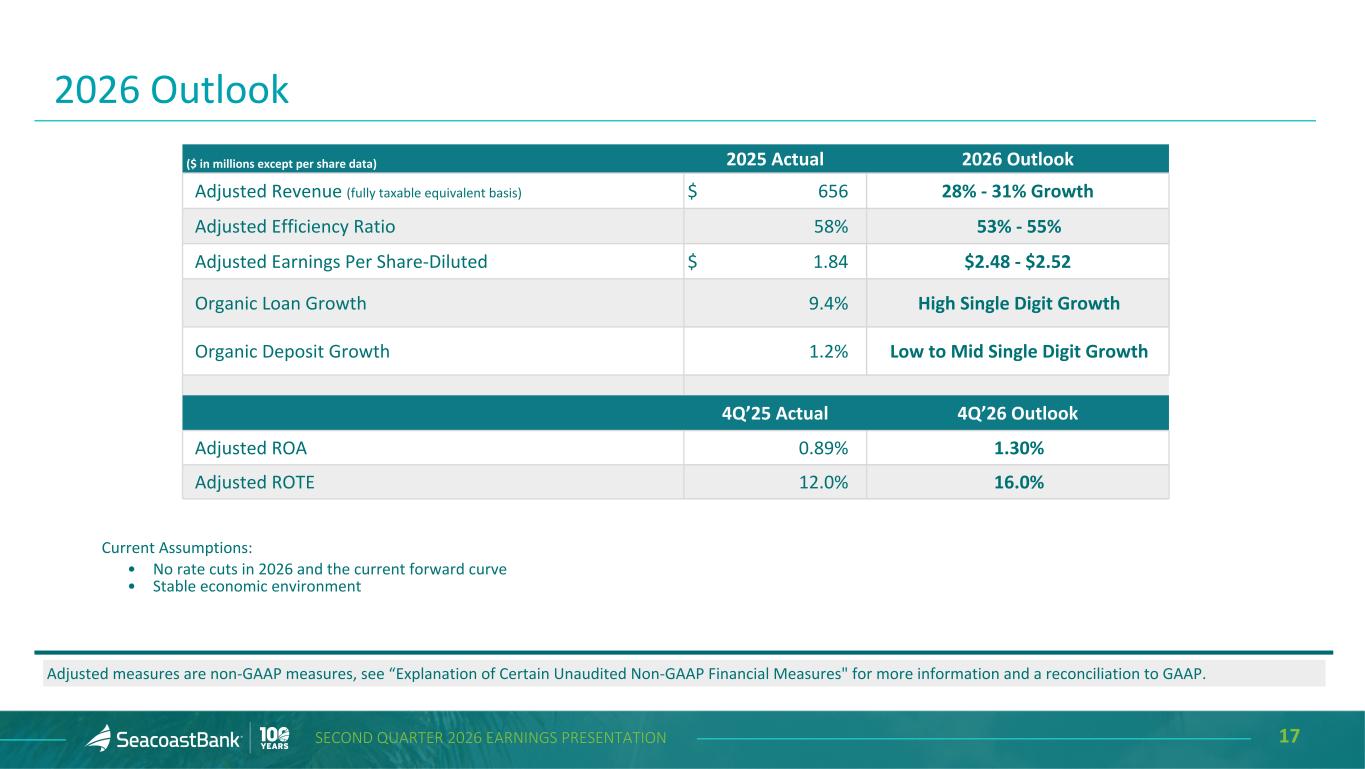
17SECOND QUARTER 2026 EARNINGS PRESENTATION 2026 Outlook ($ in millions except per share data) 2025 Actual 2026 Outlook Adjusted Revenue (fully taxable equivalent basis) $ 656 28% - 31% Growth Adjusted Efficiency Ratio 58 % 53% - 55% Adjusted Earnings Per Share-Diluted $ 1.84 $2.48 - $2.52 Organic Loan Growth 9.4 % High Single Digit Growth Organic Deposit Growth 1.2 % Low to Mid Single Digit Growth 4Q’25 Actual 4Q’26 Outlook Adjusted ROA 0.89 % 1.30% Adjusted ROTE 12.0 % 16.0% Adjusted measures are non-GAAP measures, see “Explanation of Certain Unaudited Non-GAAP Financial Measures" for more information and a reconciliation to GAAP. Current Assumptions: • No rate cuts in 2026 and the current forward curve • Stable economic environment
18SECOND QUARTER 2026 EARNINGS PRESENTATION Appendix
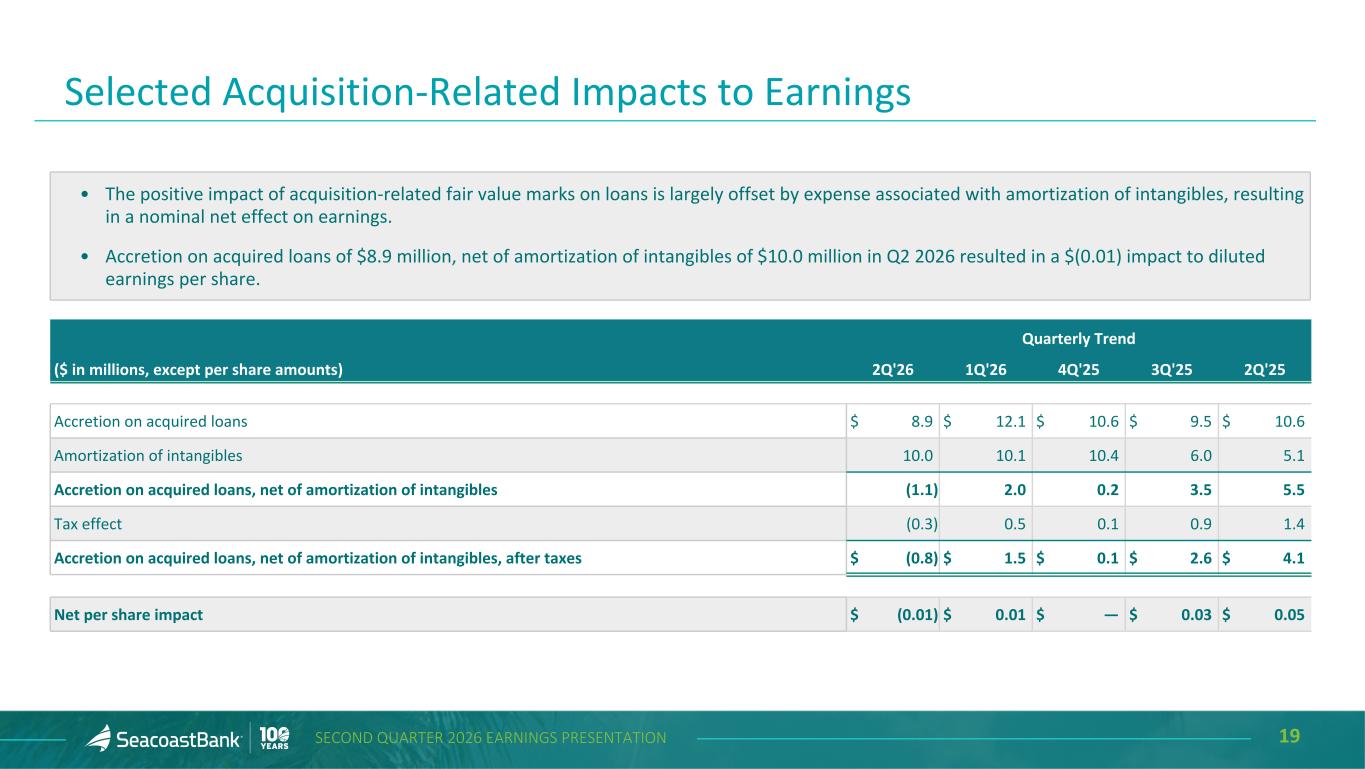
19SECOND QUARTER 2026 EARNINGS PRESENTATION Selected Acquisition-Related Impacts to Earnings Quarterly Trend ($ in millions, except per share amounts) 2Q'26 1Q'26 4Q'25 3Q'25 2Q'25 Accretion on acquired loans $ 8.9 $ 12.1 $ 10.6 $ 9.5 $ 10.6 Amortization of intangibles 10.0 10.1 10.4 6.0 5.1 Accretion on acquired loans, net of amortization of intangibles (1.1) 2.0 0.2 3.5 5.5 Tax effect (0.3) 0.5 0.1 0.9 1.4 Accretion on acquired loans, net of amortization of intangibles, after taxes $ (0.8) $ 1.5 $ 0.1 $ 2.6 $ 4.1 Net per share impact $ (0.01) $ 0.01 $ — $ 0.03 $ 0.05 • The positive impact of acquisition-related fair value marks on loans is largely offset by expense associated with amortization of intangibles, resulting in a nominal net effect on earnings. • Accretion on acquired loans of $8.9 million, net of amortization of intangibles of $10.0 million in Q2 2026 resulted in a $(0.01) impact to diluted earnings per share.

20SECOND QUARTER 2026 EARNINGS PRESENTATION Recognition 3rd consecutive year 4th consecutive year 2nd consecutive year 6th consecutive year 5th consecutive year 2nd consecutive year 1st time winner
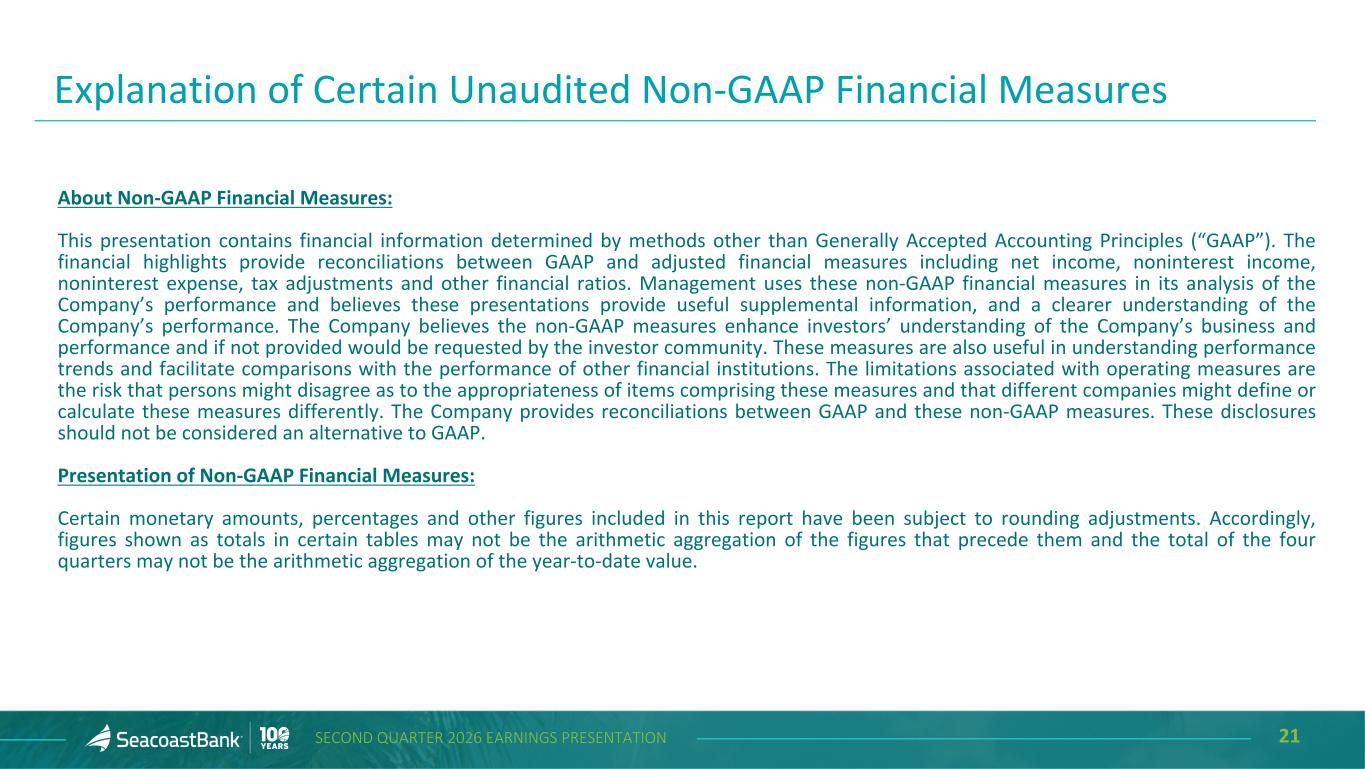
21SECOND QUARTER 2026 EARNINGS PRESENTATION About Non-GAAP Financial Measures: This presentation contains financial information determined by methods other than Generally Accepted Accounting Principles (“GAAP”). The financial highlights provide reconciliations between GAAP and adjusted financial measures including net income, noninterest income, noninterest expense, tax adjustments and other financial ratios. Management uses these non-GAAP financial measures in its analysis of the Company’s performance and believes these presentations provide useful supplemental information, and a clearer understanding of the Company’s performance. The Company believes the non-GAAP measures enhance investors’ understanding of the Company’s business and performance and if not provided would be requested by the investor community. These measures are also useful in understanding performance trends and facilitate comparisons with the performance of other financial institutions. The limitations associated with operating measures are the risk that persons might disagree as to the appropriateness of items comprising these measures and that different companies might define or calculate these measures differently. The Company provides reconciliations between GAAP and these non-GAAP measures. These disclosures should not be considered an alternative to GAAP. Presentation of Non-GAAP Financial Measures: Certain monetary amounts, percentages and other figures included in this report have been subject to rounding adjustments. Accordingly, figures shown as totals in certain tables may not be the arithmetic aggregation of the figures that precede them and the total of the four quarters may not be the arithmetic aggregation of the year-to-date value. Explanation of Certain Unaudited Non-GAAP Financial Measures
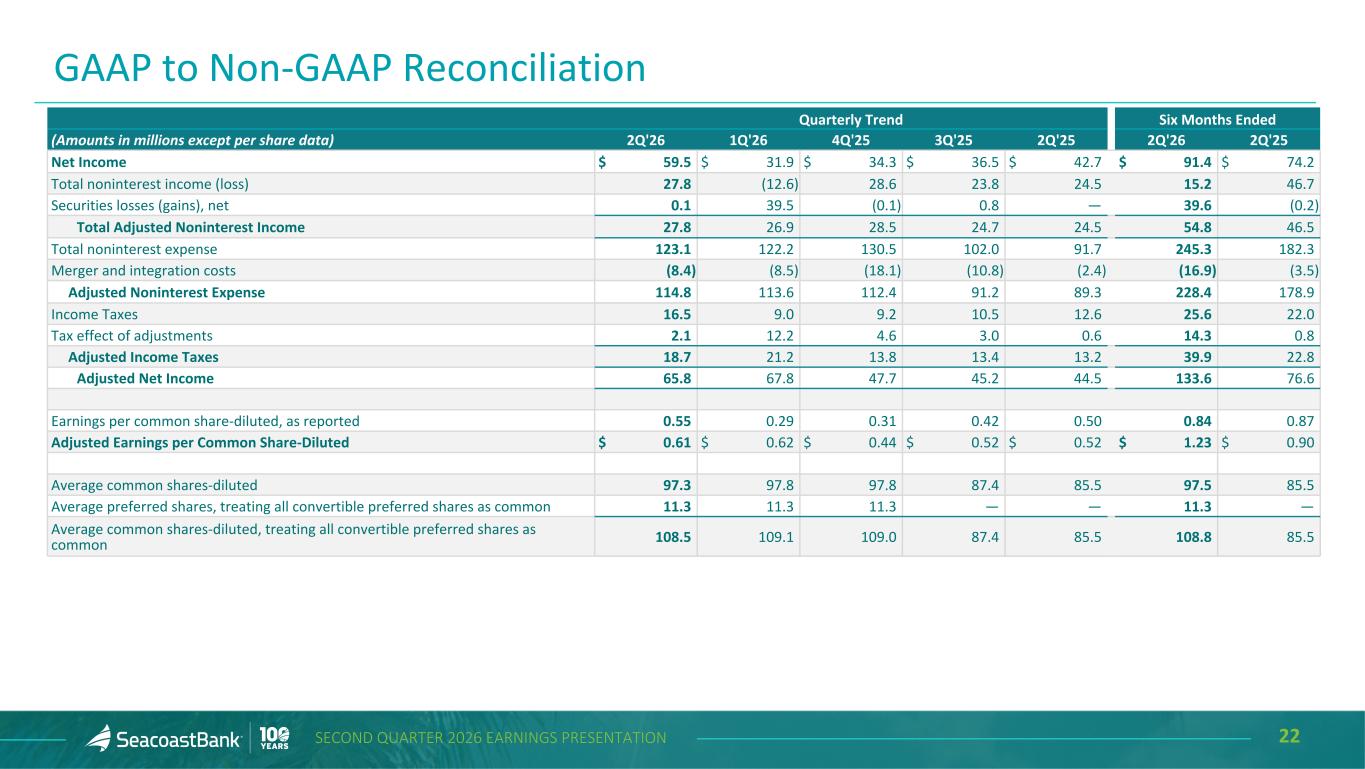
22SECOND QUARTER 2026 EARNINGS PRESENTATION Quarterly Trend Six Months Ended (Amounts in millions except per share data) 2Q'26 1Q'26 4Q'25 3Q'25 2Q'25 2Q'26 2Q'25 Net Income $ 59.5 $ 31.9 $ 34.3 $ 36.5 $ 42.7 $ 91.4 $ 74.2 Total noninterest income (loss) 27.8 (12.6) 28.6 23.8 24.5 15.2 46.7 Securities losses (gains), net 0.1 39.5 (0.1) 0.8 — 39.6 (0.2) Total Adjusted Noninterest Income 27.8 26.9 28.5 24.7 24.5 54.8 46.5 Total noninterest expense 123.1 122.2 130.5 102.0 91.7 245.3 182.3 Merger and integration costs (8.4) (8.5) (18.1) (10.8) (2.4) (16.9) (3.5) Adjusted Noninterest Expense 114.8 113.6 112.4 91.2 89.3 228.4 178.9 Income Taxes 16.5 9.0 9.2 10.5 12.6 25.6 22.0 Tax effect of adjustments 2.1 12.2 4.6 3.0 0.6 14.3 0.8 Adjusted Income Taxes 18.7 21.2 13.8 13.4 13.2 39.9 22.8 Adjusted Net Income 65.8 67.8 47.7 45.2 44.5 133.6 76.6 Earnings per common share-diluted, as reported 0.55 0.29 0.31 0.42 0.50 0.84 0.87 Adjusted Earnings per Common Share-Diluted $ 0.61 $ 0.62 $ 0.44 $ 0.52 $ 0.52 $ 1.23 $ 0.90 Average common shares-diluted 97.3 97.8 97.8 87.4 85.5 97.5 85.5 Average preferred shares, treating all convertible preferred shares as common 11.3 11.3 11.3 — — 11.3 — Average common shares-diluted, treating all convertible preferred shares as common 108.5 109.1 109.0 87.4 85.5 108.8 85.5 GAAP to Non-GAAP Reconciliation
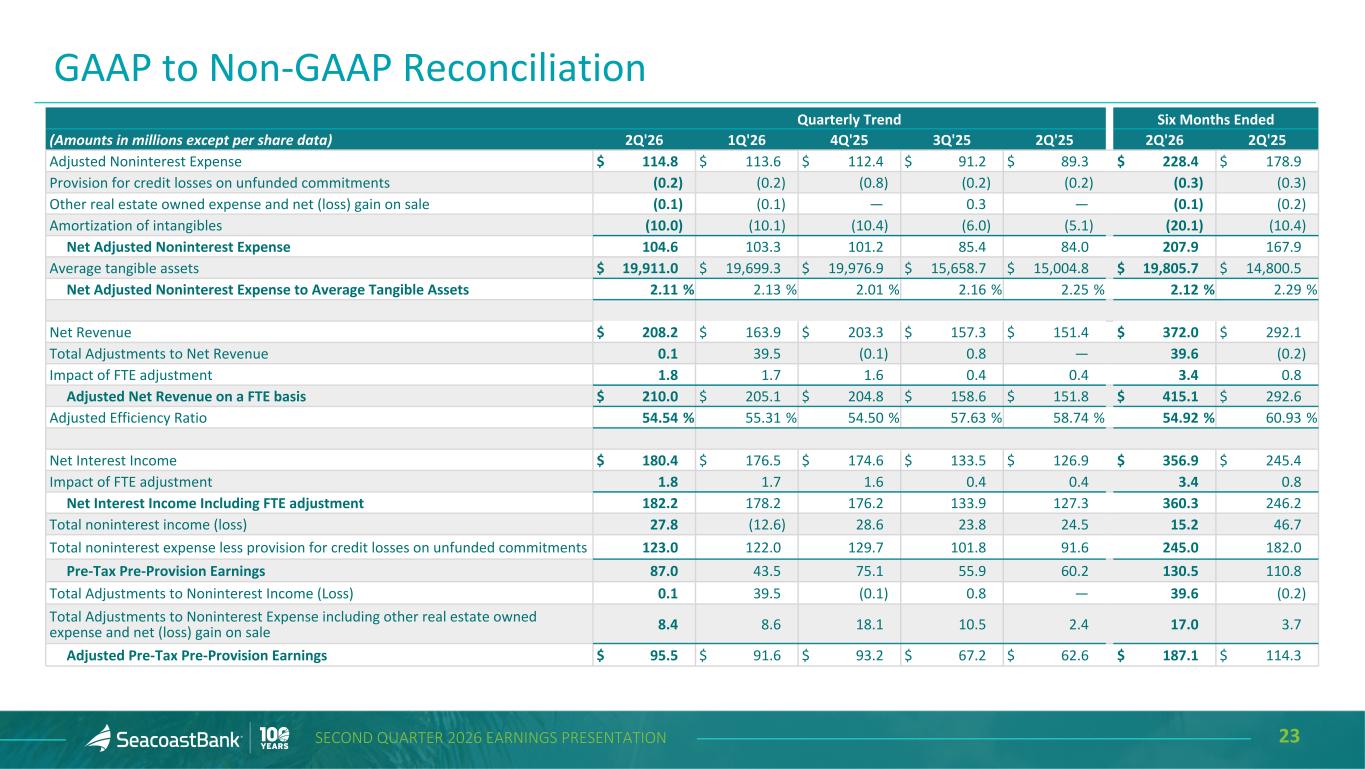
23SECOND QUARTER 2026 EARNINGS PRESENTATION GAAP to Non-GAAP Reconciliation Quarterly Trend Six Months Ended (Amounts in millions except per share data) 2Q'26 1Q'26 4Q'25 3Q'25 2Q'25 2Q'26 2Q'25 Adjusted Noninterest Expense $ 114.8 $ 113.6 $ 112.4 $ 91.2 $ 89.3 $ 228.4 $ 178.9 Provision for credit losses on unfunded commitments (0.2) (0.2) (0.8) (0.2) (0.2) (0.3) (0.3) Other real estate owned expense and net (loss) gain on sale (0.1) (0.1) — 0.3 — (0.1) (0.2) Amortization of intangibles (10.0) (10.1) (10.4) (6.0) (5.1) (20.1) (10.4) Net Adjusted Noninterest Expense 104.6 103.3 101.2 85.4 84.0 207.9 167.9 Average tangible assets $ 19,911.0 $ 19,699.3 $ 19,976.9 $ 15,658.7 $ 15,004.8 $ 19,805.7 $ 14,800.5 Net Adjusted Noninterest Expense to Average Tangible Assets 2.11 % 2.13 % 2.01 % 2.16 % 2.25 % 2.12 % 2.29 % Net Revenue $ 208.2 $ 163.9 $ 203.3 $ 157.3 $ 151.4 $ 372.0 $ 292.1 Total Adjustments to Net Revenue 0.1 39.5 (0.1) 0.8 — 39.6 (0.2) Impact of FTE adjustment 1.8 1.7 1.6 0.4 0.4 3.4 0.8 Adjusted Net Revenue on a FTE basis $ 210.0 $ 205.1 $ 204.8 $ 158.6 $ 151.8 $ 415.1 $ 292.6 Adjusted Efficiency Ratio 54.54 % 55.31 % 54.50 % 57.63 % 58.74 % 54.92 % 60.93 % Net Interest Income $ 180.4 $ 176.5 $ 174.6 $ 133.5 $ 126.9 $ 356.9 $ 245.4 Impact of FTE adjustment 1.8 1.7 1.6 0.4 0.4 3.4 0.8 Net Interest Income Including FTE adjustment 182.2 178.2 176.2 133.9 127.3 360.3 246.2 Total noninterest income (loss) 27.8 (12.6) 28.6 23.8 24.5 15.2 46.7 Total noninterest expense less provision for credit losses on unfunded commitments 123.0 122.0 129.7 101.8 91.6 245.0 182.0 Pre-Tax Pre-Provision Earnings 87.0 43.5 75.1 55.9 60.2 130.5 110.8 Total Adjustments to Noninterest Income (Loss) 0.1 39.5 (0.1) 0.8 — 39.6 (0.2) Total Adjustments to Noninterest Expense including other real estate owned expense and net (loss) gain on sale 8.4 8.6 18.1 10.5 2.4 17.0 3.7 Adjusted Pre-Tax Pre-Provision Earnings $ 95.5 $ 91.6 $ 93.2 $ 67.2 $ 62.6 $ 187.1 $ 114.3
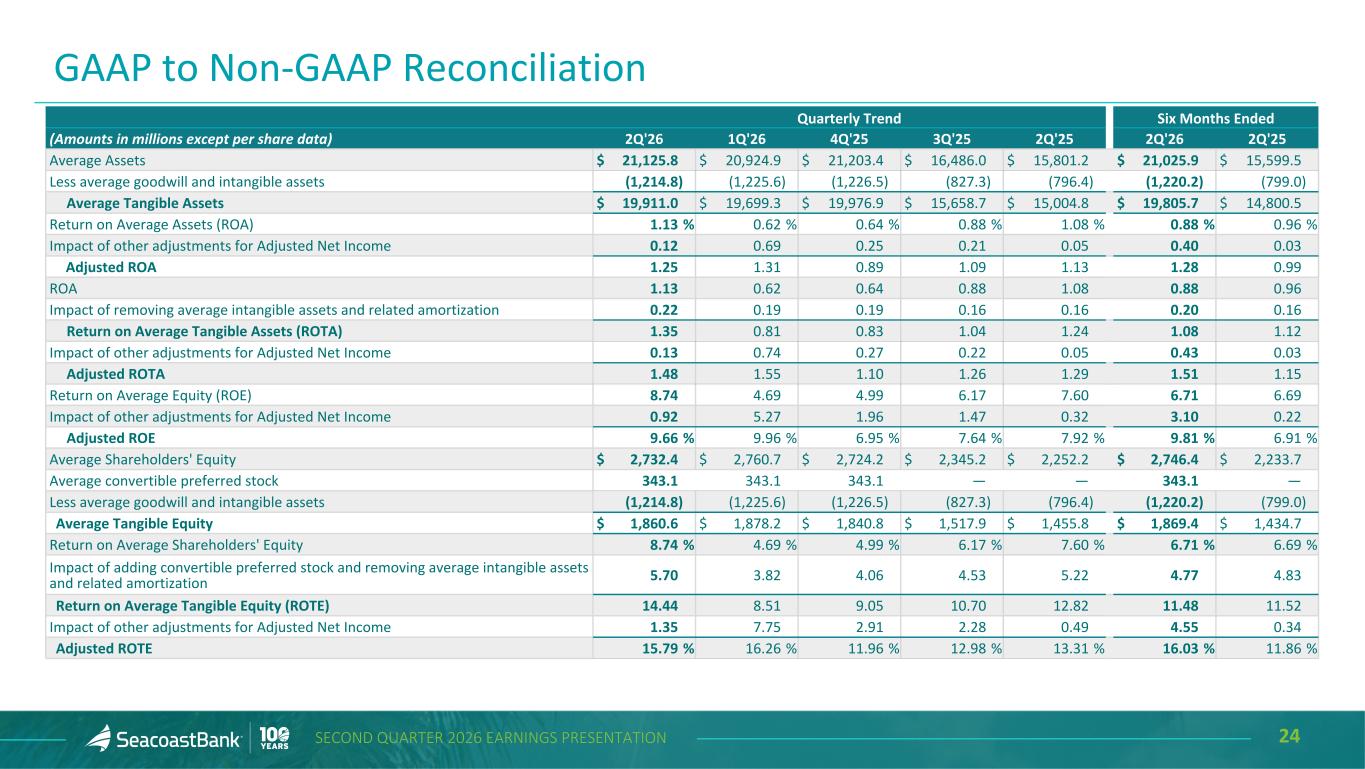
24SECOND QUARTER 2026 EARNINGS PRESENTATION Quarterly Trend Six Months Ended (Amounts in millions except per share data) 2Q'26 1Q'26 4Q'25 3Q'25 2Q'25 2Q'26 2Q'25 Average Assets $ 21,125.8 $ 20,924.9 $ 21,203.4 $ 16,486.0 $ 15,801.2 $ 21,025.9 $ 15,599.5 Less average goodwill and intangible assets (1,214.8) (1,225.6) (1,226.5) (827.3) (796.4) (1,220.2) (799.0) Average Tangible Assets $ 19,911.0 $ 19,699.3 $ 19,976.9 $ 15,658.7 $ 15,004.8 $ 19,805.7 $ 14,800.5 Return on Average Assets (ROA) 1.13 % 0.62 % 0.64 % 0.88 % 1.08 % 0.88 % 0.96 % Impact of other adjustments for Adjusted Net Income 0.12 0.69 0.25 0.21 0.05 0.40 0.03 Adjusted ROA 1.25 1.31 0.89 1.09 1.13 1.28 0.99 ROA 1.13 0.62 0.64 0.88 1.08 0.88 0.96 Impact of removing average intangible assets and related amortization 0.22 0.19 0.19 0.16 0.16 0.20 0.16 Return on Average Tangible Assets (ROTA) 1.35 0.81 0.83 1.04 1.24 1.08 1.12 Impact of other adjustments for Adjusted Net Income 0.13 0.74 0.27 0.22 0.05 0.43 0.03 Adjusted ROTA 1.48 1.55 1.10 1.26 1.29 1.51 1.15 Return on Average Equity (ROE) 8.74 4.69 4.99 6.17 7.60 6.71 6.69 Impact of other adjustments for Adjusted Net Income 0.92 5.27 1.96 1.47 0.32 3.10 0.22 Adjusted ROE 9.66 % 9.96 % 6.95 % 7.64 % 7.92 % 9.81 % 6.91 % Average Shareholders' Equity $ 2,732.4 $ 2,760.7 $ 2,724.2 $ 2,345.2 $ 2,252.2 $ 2,746.4 $ 2,233.7 Average convertible preferred stock 343.1 343.1 343.1 — — 343.1 — Less average goodwill and intangible assets (1,214.8) (1,225.6) (1,226.5) (827.3) (796.4) (1,220.2) (799.0) Average Tangible Equity $ 1,860.6 $ 1,878.2 $ 1,840.8 $ 1,517.9 $ 1,455.8 $ 1,869.4 $ 1,434.7 Return on Average Shareholders' Equity 8.74 % 4.69 % 4.99 % 6.17 % 7.60 % 6.71 % 6.69 % Impact of adding convertible preferred stock and removing average intangible assets and related amortization 5.70 3.82 4.06 4.53 5.22 4.77 4.83 Return on Average Tangible Equity (ROTE) 14.44 8.51 9.05 10.70 12.82 11.48 11.52 Impact of other adjustments for Adjusted Net Income 1.35 7.75 2.91 2.28 0.49 4.55 0.34 Adjusted ROTE 15.79 % 16.26 % 11.96 % 12.98 % 13.31 % 16.03 % 11.86 % GAAP to Non-GAAP Reconciliation
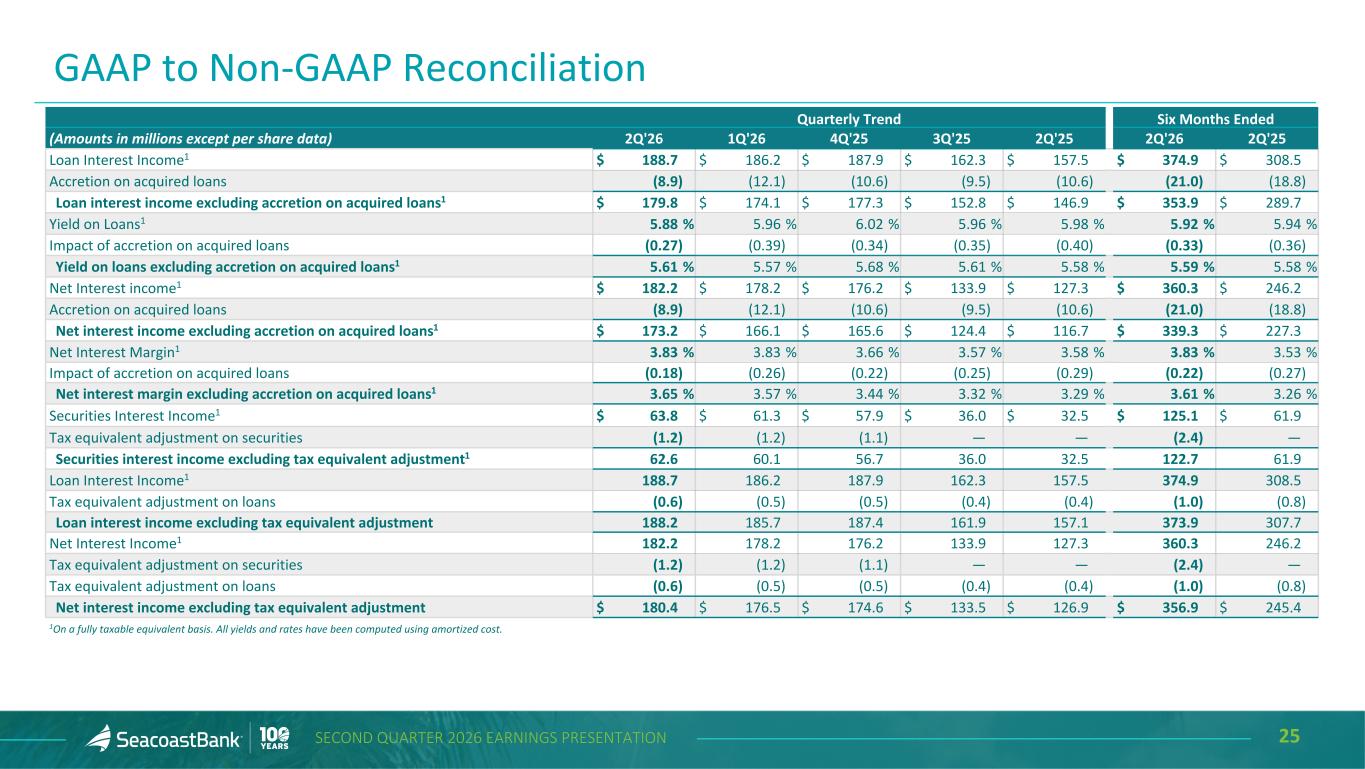
25SECOND QUARTER 2026 EARNINGS PRESENTATION Quarterly Trend Six Months Ended (Amounts in millions except per share data) 2Q'26 1Q'26 4Q'25 3Q'25 2Q'25 2Q'26 2Q'25 Loan Interest Income1 $ 188.7 $ 186.2 $ 187.9 $ 162.3 $ 157.5 $ 374.9 $ 308.5 Accretion on acquired loans (8.9) (12.1) (10.6) (9.5) (10.6) (21.0) (18.8) Loan interest income excluding accretion on acquired loans1 $ 179.8 $ 174.1 $ 177.3 $ 152.8 $ 146.9 $ 353.9 $ 289.7 Yield on Loans1 5.88 % 5.96 % 6.02 % 5.96 % 5.98 % 5.92 % 5.94 % Impact of accretion on acquired loans (0.27) (0.39) (0.34) (0.35) (0.40) (0.33) (0.36) Yield on loans excluding accretion on acquired loans1 5.61 % 5.57 % 5.68 % 5.61 % 5.58 % 5.59 % 5.58 % Net Interest income1 $ 182.2 $ 178.2 $ 176.2 $ 133.9 $ 127.3 $ 360.3 $ 246.2 Accretion on acquired loans (8.9) (12.1) (10.6) (9.5) (10.6) (21.0) (18.8) Net interest income excluding accretion on acquired loans1 $ 173.2 $ 166.1 $ 165.6 $ 124.4 $ 116.7 $ 339.3 $ 227.3 Net Interest Margin1 3.83 % 3.83 % 3.66 % 3.57 % 3.58 % 3.83 % 3.53 % Impact of accretion on acquired loans (0.18) (0.26) (0.22) (0.25) (0.29) (0.22) (0.27) Net interest margin excluding accretion on acquired loans1 3.65 % 3.57 % 3.44 % 3.32 % 3.29 % 3.61 % 3.26 % Securities Interest Income1 $ 63.8 $ 61.3 $ 57.9 $ 36.0 $ 32.5 $ 125.1 $ 61.9 Tax equivalent adjustment on securities (1.2) (1.2) (1.1) — — (2.4) — Securities interest income excluding tax equivalent adjustment1 62.6 60.1 56.7 36.0 32.5 122.7 61.9 Loan Interest Income1 188.7 186.2 187.9 162.3 157.5 374.9 308.5 Tax equivalent adjustment on loans (0.6) (0.5) (0.5) (0.4) (0.4) (1.0) (0.8) Loan interest income excluding tax equivalent adjustment 188.2 185.7 187.4 161.9 157.1 373.9 307.7 Net Interest Income1 182.2 178.2 176.2 133.9 127.3 360.3 246.2 Tax equivalent adjustment on securities (1.2) (1.2) (1.1) — — (2.4) — Tax equivalent adjustment on loans (0.6) (0.5) (0.5) (0.4) (0.4) (1.0) (0.8) Net interest income excluding tax equivalent adjustment $ 180.4 $ 176.5 $ 174.6 $ 133.5 $ 126.9 $ 356.9 $ 245.4 1On a fully taxable equivalent basis. All yields and rates have been computed using amortized cost. GAAP to Non-GAAP Reconciliation
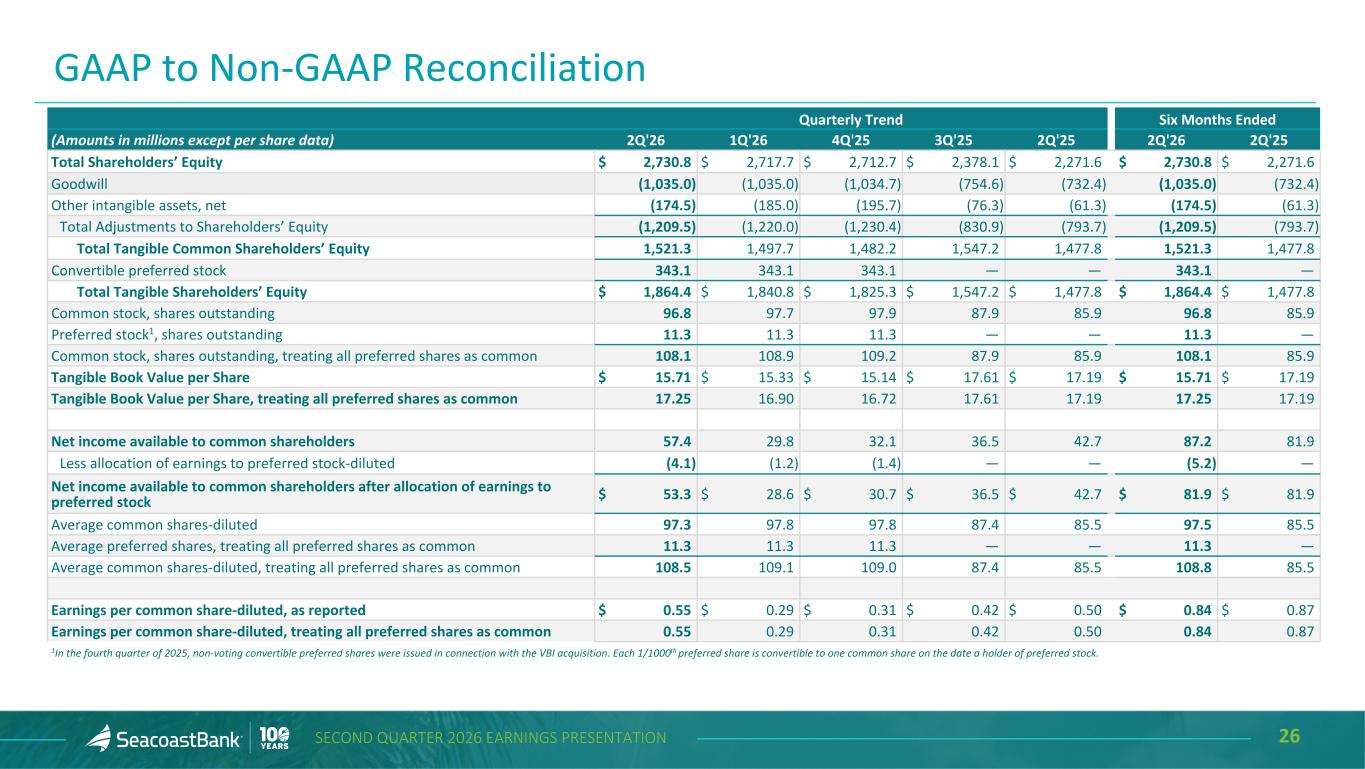
26SECOND QUARTER 2026 EARNINGS PRESENTATION Quarterly Trend Six Months Ended (Amounts in millions except per share data) 2Q'26 1Q'26 4Q'25 3Q'25 2Q'25 2Q'26 2Q'25 Total Shareholders’ Equity $ 2,730.8 $ 2,717.7 $ 2,712.7 $ 2,378.1 $ 2,271.6 $ 2,730.8 $ 2,271.6 Goodwill (1,035.0) (1,035.0) (1,034.7) (754.6) (732.4) (1,035.0) (732.4) Other intangible assets, net (174.5) (185.0) (195.7) (76.3) (61.3) (174.5) (61.3) Total Adjustments to Shareholders’ Equity (1,209.5) (1,220.0) (1,230.4) (830.9) (793.7) (1,209.5) (793.7) Total Tangible Common Shareholders’ Equity 1,521.3 1,497.7 1,482.2 1,547.2 1,477.8 1,521.3 1,477.8 Convertible preferred stock 343.1 343.1 343.1 — — 343.1 — Total Tangible Shareholders’ Equity $ 1,864.4 $ 1,840.8 $ 1,825.3 $ 1,547.2 $ 1,477.8 $ 1,864.4 $ 1,477.8 Common stock, shares outstanding 96.8 97.7 97.9 87.9 85.9 96.8 85.9 Preferred stock1, shares outstanding 11.3 11.3 11.3 — — 11.3 — Common stock, shares outstanding, treating all preferred shares as common 108.1 108.9 109.2 87.9 85.9 108.1 85.9 Tangible Book Value per Share $ 15.71 $ 15.33 $ 15.14 $ 17.61 $ 17.19 $ 15.71 $ 17.19 Tangible Book Value per Share, treating all preferred shares as common 17.25 16.90 16.72 17.61 17.19 17.25 17.19 Net income available to common shareholders 57.4 29.8 32.1 36.5 42.7 87.2 81.9 Less allocation of earnings to preferred stock-diluted (4.1) (1.2) (1.4) — — (5.2) — Net income available to common shareholders after allocation of earnings to preferred stock $ 53.3 $ 28.6 $ 30.7 $ 36.5 $ 42.7 $ 81.9 $ 81.9 Average common shares-diluted 97.3 97.8 97.8 87.4 85.5 97.5 85.5 Average preferred shares, treating all preferred shares as common 11.3 11.3 11.3 — — 11.3 — Average common shares-diluted, treating all preferred shares as common 108.5 109.1 109.0 87.4 85.5 108.8 85.5 Earnings per common share-diluted, as reported $ 0.55 $ 0.29 $ 0.31 $ 0.42 $ 0.50 $ 0.84 $ 0.87 Earnings per common share-diluted, treating all preferred shares as common 0.55 0.29 0.31 0.42 0.50 0.84 0.87 1In the fourth quarter of 2025, non-voting convertible preferred shares were issued in connection with the VBI acquisition. Each 1/1000th preferred share is convertible to one common share on the date a holder of preferred stock. GAAP to Non-GAAP Reconciliation