MAGNA INTERNATIONAL INC.
Management's Discussion and Analysis of Results of Operations and Financial Position
Unless otherwise noted, all amounts in this Management's Discussion and Analysis of Results of Operations and Financial Position ["MD&A"] are in U.S. dollars and all tabular amounts are in millions of U.S. dollars, except per share figures, which are in U.S. dollars. When we use the terms "we", "us", "our" or "Magna", we are referring to Magna International Inc. and its subsidiaries and jointly controlled entities, unless the context otherwise requires.
This MD&A should be read in conjunction with the audited consolidated financial statements for the year ended December 31, 2025 ["consolidated financial statements"] included in our 2025 Annual Report to Shareholders.
This MD&A may contain statements that are forward looking. Refer to the "Forward-Looking Statements" section in this MD&A for a more detailed discussion of our use of forward-looking statements.
This MD&A has been prepared as at February 25, 2026.
HIGHLIGHTS
INDUSTRY PRODUCTION ENVIRONMENT
| · | Global light vehicle production in 2025 rose 3% from 2024, with China increasing 7%, while North America and Europe declined 2% and 1%, respectively. |
SALES & EARNINGS
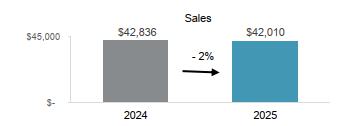
| · | Total sales declined 2% to $42.0 billion in 2025 compared to 2024. The sales decline primarily reflects lower vehicle production in North America and Europe, our two largest markets, the end of production on certain programs, lower engineering revenue, and net customer price concessions. These were partially offset by the launch of new programs, and the net strengthening of foreign currencies against the U.S. dollar, among other factors. |
| · | Income from operations before income taxes decreased to $1.3 billion, from $1.5 billion last year, mainly as a result of higher Other expense, net in 2025. |
| · | Adjusted EBIT increased to $2.4 billion, largely reflecting the continued productivity and efficiency improvements, including the benefit of operational excellence initiatives and prior restructuring actions, higher equity income, higher supply chain costs in 2024, and lower investments in research, development and our new mobility business. These factors were partially offset by lower net favourable commercial items, reduced earnings on lower sales, and unfavourable product mix, among other factors. |
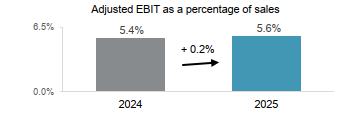
| · | Adjusted EBIT as a percentage of sales(1) increased 20 basis points to 5.6%. |
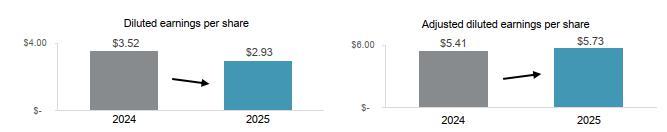
| · | Diluted earnings per share were $2.93 and Adjusted diluted earnings per share(1) were $5.73 in 2025. |
| · | Adjusted diluted earnings per share increased 6% from 2024, primarily reflecting higher Adjusted EBIT(1), lower income attributable to non-controlling interests and fewer weighted average diluted shares outstanding during the year. |
CASH & CAPITAL DEPLOYMENT
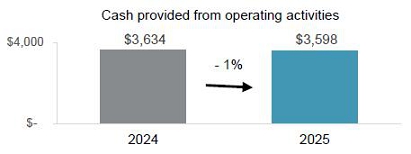
| · | Cash generated from operating activities was $3.6 billion, largely unchanged from 2024. |
| · | We continued to invest in our business, including $1.3 billion for fixed assets and $499 million in investment and other asset spending. |
| · | We returned $681 million to shareholders in 2025 through $544 million in dividends and $137 million in share repurchases. |
| · | During the fourth quarter, our Board of Directors increased our quarterly dividend to $0.495 per share, our 16th consecutive year of dividend increases. |
| · | We raised €575 million and $400 million in the form of Senior Notes, largely to refinance $950 million in Senior Notes that were repaid in 2025. |
| · | Our Board of Directors approved a new Normal Course Issuer Bid ["NCIB"] to purchase up to 25.3 million of our Common Shares. The NCIB will terminate no later than November 6, 2026. |
STRATEGIC UPDATES
| · | Utilizing our strong innovation pipeline, we won substantial additional business across our portfolio, including: |
| · | high-voltage programs for hybrids and electric vehicles ["EVs"] with multiple customers; |
| · | a large ADAS program with a North American-based global OEM; and |
| · | Gen 3 core seat structure awards across multiple China-based OEMs. |
| · | In addition, we: |
| · | won a 2025 Automotive News PACEpilot award for thermal sensing technology; |
| · | won a JD Power Platinum Plant Quality Award, acknowledging our quality and precision in producing the BMW Z4 at our Complete Vehicles Assembly operation in Graz, Austria; |
| · | were named to Fortune's "World’s Most Admired Companies" list for the 9th consecutive year; and |
| · | earned a record 151 customer awards across Magna for quality and operating performance. |
1 Adjusted EBIT, Adjusted EBIT as a percentage of sales, and Adjusted diluted earnings per share are Non-GAAP financial measures. Refer to the section "Use of Non-GAAP Measures".
Magna International Inc. Annual Report 2025 1
OVERVIEW
OUR BUSINESS
Magna is one of the world's largest automotive suppliers and a trusted partner to automakers in the industry's most critical markets—North America, Europe, and China. With a global team of approximately 156,000(2) employees and footprint spanning 28 countries, we bring unmatched scale, trusted reliability, and proven execution. Backed by nearly seven decades of experience, we combine deep manufacturing expertise with innovative vehicle systems to deliver performance, safety, and quality. For further information about Magna (NYSE:MGA; TSX:MG), please visit www.magna.com or follow us on social.
FORWARD-LOOKING STATEMENTS
Certain statements in this MD&A may constitute "forward-looking information" or "forward-looking statements" (collectively, "forward-looking statements"). Any such forward-looking statements are intended to provide information about management's current expectations and plans and may not be appropriate for other purposes. Forward-looking statements may include financial and other projections, as well as statements regarding our future plans, strategic objectives or economic performance, or the assumptions underlying any of the foregoing, and other statements that are not recitations of historical fact. We use words such as "may", "would", "could", "should", "will", "likely", "expect", "anticipate", "assume", "believe", "intend", "plan", "aim", "forecast", "outlook", "project", "potential", "estimate", "target" and similar expressions suggesting future outcomes or events to identify forward-looking statements.
Forward-looking statements are based on information currently available to us and are based on assumptions and analyses made by us in light of our experience and our perception of historical trends, current conditions and expected future developments, as well as other factors we believe are appropriate in the circumstances. While we believe we have a reasonable basis for making any such forward-looking statements, they are not a guarantee of future performance or outcomes. Whether actual results and developments conform to our expectations and predictions is subject to a number of risks, assumptions, and uncertainties, many of which are beyond our control, and the effects of which can be difficult to predict, including the risk factors which are described later in this MD&A.
INDUSTRY TRENDS
Our business and operating results are dependent on light vehicle production by our customers in three key regions – North America, Europe, and China. While we supply systems and components to many original equipment manufacturers ["OEMs"] globally, we do not supply systems and components for every vehicle, nor is the value of our content consistent from one vehicle to the next. As a result, customer and program mix relative to market trends, as well as the value of our content on specific vehicle production programs, are also important drivers of our results.
Ordinarily, OEM production volumes are aligned with vehicle sales levels and thus affected by changes in such levels. Aside from vehicle sales levels, production volumes may be impacted by a range of factors, including: certain geopolitical factors, such as free trade arrangements and tariffs; OEM, supplier or sub-supplier disruptions; relative currency values; commodities prices; supply chains and infrastructure; labour disruptions and the availability and relative cost of skilled labour; regulatory frameworks; and other factors.
Overall vehicle sales levels are significantly affected by changes in consumer confidence levels, which may in turn be impacted by consumer perceptions and general trends related to the job, housing, and stock markets, as well as other macroeconomic and political factors. Other factors which may impact vehicle sales levels and thus production volumes include: vehicle affordability; interest rates and/or availability of credit; fuel and energy prices; relative currency values; considerations applicable to EVs, including EV range, charging infrastructure, electricity pricing, and availability of government rebates; and other factors.
We continue to implement a business strategy which is rooted in our best assessment as to the rate and direction of change in the automotive industry. Our short and medium-term operational success, as well as our ability to create long-term value through our business strategy, are subject to a number of risks and uncertainties which are discussed later in this MD&A.
2 Number of employees includes approximately 144,000 employees at our wholly owned or controlled entities and approximately 12,000 employees at operations accounted for under the equity method.
2 Magna International Inc. Annual Report 2025
USE OF NON-GAAP FINANCIAL MEASURES
In addition to results presented in accordance with accounting principles generally accepted in the United States of America ["U.S. GAAP"], this MD&A includes the use of Adjusted earnings before interest and taxes ["Adjusted EBIT"], Adjusted EBIT as a percentage of sales, Adjusted diluted earnings per share, Adjusted Return on Invested Capital, and Adjusted income taxes [collectively, the "Non-GAAP Measures"]. We believe these Non-GAAP financial measures provide additional information that is useful to investors in understanding our underlying performance and trends through the same financial measures employed by our management. Readers should be aware that Non-GAAP Measures have no standardized meaning under U.S. GAAP and accordingly may not be comparable to the calculation of similar measures by other companies. We believe that Adjusted EBIT, Adjusted EBIT as a percentage of sales, Adjusted diluted earnings per share, Adjusted Return on Invested Capital, and Adjusted income taxes provide useful information to our investors for measuring our operational performance as they exclude certain items that are not reflective of ongoing operating profit and facilitate a comparison with prior periods. The presentation of any Non-GAAP Measures should not be considered in isolation or as a substitute for our related financial results prepared in accordance with U.S. GAAP. Non-GAAP financial measures are presented together with the most directly comparable U.S. GAAP financial measure, and a reconciliation to the most directly comparable U.S. GAAP financial measure, can be found in the "Non-GAAP Financial Measures Reconciliation" and "Income Taxes" section of this MD&A.
RESULTS OF OPERATIONS
AVERAGE FOREIGN EXCHANGE
| 2025 | 2024 | Change | ||||||||||
| 1 Canadian dollar equals U.S. dollars | 0.716 | 0.730 | - | 2 | % | |||||||
| 1 euro equals U.S. dollars | 1.130 | 1.082 | + | 4 | % | |||||||
| 1 Chinese renminbi equals U.S. dollars | 0.139 | 0.139 | — | |||||||||
The preceding table reflects the average foreign exchange rates between the most common currencies in which we conduct business and our U.S. dollar reporting currency.
The results of operations for which the functional currency is not the U.S. dollar are translated into U.S. dollars using the average exchange rates for the relevant period. Throughout this MD&A, reference is made to the impact of translation of foreign operations on reported U.S. dollar amounts where relevant.
Our results can also be affected by the impact of movements in exchange rates on foreign currency transactions (such as raw material purchases or sales denominated in foreign currencies). However, as a result of hedging programs employed by us, foreign currency transactions in the current period have not been fully impacted by movements in exchange rates. We record foreign currency transactions at the hedged rate where applicable.
Finally, foreign exchange gains and losses on revaluation and/or settlement of monetary items denominated in a currency other than an operation's functional currency impact reported results. These gains and losses are recorded in selling, general and administrative expense.
LIGHT VEHICLE PRODUCTION VOLUMES
Our operating results are mostly dependent on light vehicle production in the regions reflected in the table below:
Light Vehicle Production Volumes (thousands of units)
| 2025 | 2024 | Change | ||||||||||
| North America | 15,242 | 15,523 | - | 2 | % | |||||||
| Europe | 16,666 | 16,845 | - | 1 | % | |||||||
| China | 32,689 | 30,483 | + | 7 | % | |||||||
| Rest of World | 27,639 | 26,815 | + | 3 | % | |||||||
| Global | 92,236 | 89,666 | + | 3 | % | |||||||
Magna International Inc. Annual Report 2025 3
RESULTS OF OPERATIONS – FOR THE YEAR ENDED DECEMBER 31, 2025
SALES
Sales decreased 2%, or $826 million, to $42.01 billion for 2025 compared to $42.84 billion for 2024 primarily due to:
| · | lower light vehicle production in North America and Europe on certain ongoing programs, and the end of production of certain programs, including the: |
| · | Chevrolet Malibu; |
| · | Ford Edge; and |
| · | Ford Escape; |
| · | lower engineering revenue, primarily in our Complete Vehicles segment; |
| · | net customer price concessions subsequent to 2024; |
| · | lower complete vehicle assembly volumes, primarily due to the end of production of the Jaguar I-Pace, and Jaguar E-Pace, partially offset by the launch of the Mercedes-Benz G-Class during the fourth quarter of 2024; |
| · | the divestiture of certain operations in India during 2024, net of acquisitions, which decreased sales by $112 million; and |
| · | net commercial items, which had an unfavourable impact on a year-over-year basis, including a resolution with Ford for a product-related matter during the fourth quarter of 2025 as described in Note 24, "Contingencies", of our consolidated financial statements. |
These factors were partially offset by:
| · | the launch of new programs during or subsequent to 2024, including the: |
| · | Mercedes-Benz G-Class; |
| · | GMC Acadia, Chevrolet Traverse & Buick Enclave; |
| · | Skoda Elroq; |
| · | Audi A5; |
| · | Cadillac Vistiq; and |
| · | BMW 1-Series; |
| · | the net strengthening of foreign currencies against the U.S. dollar, which increased reported U.S. dollar sales by $555 million; and |
| · | net customer recoveries, including for higher tariff costs incurred during the year. |
COST OF GOODS SOLD
| 2025 | 2024 | Change | ||||||||||
| Material | $ | 25,595 | $ | 25,991 | $ | (396 | ) | |||||
| Direct labour | 2,965 | 3,127 | (162 | ) | ||||||||
| Overhead | 7,461 | 7,919 | (458 | ) | ||||||||
| Cost of goods sold | $ | 36,021 | $ | 37,037 | $ | (1,016 | ) | |||||
Cost of goods sold decreased $1.02 billion to $36.02 billion for 2025 compared to $37.04 billion for 2024, primarily due to:
| · | productivity and efficiency improvements, including the benefit of operational excellence initiatives and prior restructuring actions; |
| · | lower material, direct labour, and overhead associated with lower production sales; |
| · | lower net engineering costs on lower engineering revenue, primarily in our Complete Vehicles segment; |
| · | a decrease in material, direct labour, and overhead associated with lower sales in our Complete Vehicles segment, which has a higher material content compared to our consolidated average; |
| · | the divestiture of certain operations in India during 2024, net of acquisitions; |
| · | net commercial items, which had a favourable impact on a year-over-year basis; and |
| · | higher supply chain costs in 2024, due in part to a supplier bankruptcy. |
4 Magna International Inc. Annual Report 2025
These factors were partially offset by:
| · | the net strengthening of foreign currencies against the U.S. dollar, which increased reported U.S. dollar costs of goods sold by $478 million; |
| · | higher net tariff costs; |
| · | higher production input costs net of customer recoveries, primarily for labour; and |
| · | higher pre-operating costs incurred at new facilities. |
SELLING, GENERAL AND ADMINISTRATIVE ["SG&A"]
SG&A expense increased $160 million to $2.22 billion for 2025 compared to $2.06 billion for 2024, primarily as a result of:
| · | higher costs to accelerate our operational excellence initiatives; |
| · | the net strengthening of foreign currencies against the U.S. dollar, which increased SG&A by $39 million; |
| · | higher incentive compensation, stock-based compensation, and employee profit sharing; |
| · | lower net transactional foreign exchange gains in 2025 compared to 2024; |
| · | a gain on sale of an equity method investment during 2024; and |
| · | higher pre-operating costs incurred at new facilities. |
These factors were partially offset by:
| · | lower investments in research, development and our new mobility business; |
| · | lower labour and benefit costs; |
| · | lower restructuring costs; |
| · | lower provisions against certain accounts receivable and other balances; and |
| · | divestitures, net of acquisitions during or subsequent to 2024. |
DEPRECIATION
Depreciation increased $37 million to $1.55 billion for 2025 compared to $1.51 billion for 2024, primarily due to increased capital deployed at new and existing facilities, including to support the launch of programs, and the net strengthening of foreign currencies against the U.S. dollar, which increased depreciation by $20 million. These factors were partially offset by the end of production of certain programs.
AMORTIZATION OF ACQUIRED INTANGIBLE ASSETS
Amortization of acquired intangible assets decreased $1 million to $111 million for 2025 compared to $112 million for 2024 primarily due to the impairment of acquired intangible assets at two European lighting facilities in our Power & Vision segment during 2024, partially offset by the net strengthening of foreign currencies against the U.S. dollar.
INTEREST EXPENSE, NET
During 2025, we recorded net interest expense of $209 million compared to $211 million for 2024. The $2 million decrease was primarily a result of lower interest expense on decreased short-term borrowings and term loan balances, each at lower interest rates. These factors were partially offset by interest incurred on a value added tax ("VAT") reassessment; lower interest income on cash and investments due to reduced cash balances and lower interest rates; and higher net interest expense on Senior Notes issued during 2025, compared to Senior Notes repaid during 2025.
EQUITY INCOME
Equity income increased $42 million to $143 million for 2025 compared to $101 million for 2024, primarily as a result of:
| · | net commercial items, which had a favourable impact on a year-over-year basis; |
| · | earnings on higher sales and favourable product mix at certain equity-accounted entities; |
| · | lower launch costs at certain facilities; and |
| · | productivity and efficiency improvements at certain equity-accounted entities. |
These factors were partially offset by higher impairment charges on long-lived assets at certain equity-accounted entities.
Magna International Inc. Annual Report 2025 5
OTHER EXPENSE, NET
| 2025 | 2024 | |||||||
| Impairment of assets (1) | $ | 615 | $ | 79 | ||||
| Restructuring activities (2) | 118 | 187 | ||||||
| Investments (3) | 3 | 9 | ||||||
| Impacts related to Fisker Inc. ["Fisker"] (4) | — | 198 | ||||||
| Gain on business combination (5) | — | (9 | ) | |||||
| Other expense, net | $ | 736 | $ | 464 | ||||
| (1) | Impairment of assets |
During 2025, we concluded that indicators of impairment were present for finite-lived intangible assets and goodwill in the Electronics reporting unit within our Power & Vision segment. The conclusion was based on lower than expected sales and reduced volume projections, reflecting slower growth relative to expectations. Contributing factors include OEM delays in sourcing cycles as they reassess vehicle architectures, as well as a change in market dynamics in China. Accordingly, we undertook impairment analyses to determine the fair value of the finite-lived intangible assets and goodwill utilizing estimated discounted cash flows to derive fair values. Based on the analyses, the carrying value of the reporting unit’s finite-lived intangible assets exceeded fair value by $212 million, and the carrying value of net assets exceeded the fair value of the reporting unit by $379 million. As a result, we recorded a $591 million [$554 million after tax] non-cash impairment charge. The finite-lived intangible asset impairment charges included $158 million related to patents and technology, and $54 million related to customer relationship intangibles. The inputs utilized in the analyses are classified as Level 3 inputs within the fair value hierarchy as defined in ASC 820, "Fair Value Measurement", and primarily consist of expected revenues and costs, estimated production volumes, future growth rates and the appropriate discount rates (based on weighted average cost of capital).
During 2025, we also recorded an impairment charge of $24 million [$24 million after tax] on fixed assets and other assets at a European facility in our Body Exteriors & Structures segment.
During 2024, we recorded an impairment charge of $79 million [$79 million after tax] on fixed assets, right of use assets and intangible assets at two European facilities in our Power & Vision segment.
| (2) | Restructuring activities |
We recorded restructuring charges related to significant plant closures and consolidations primarily in Europe and to a lesser extent in North America.
| 2025 | 2024 | |||||||
| Complete Vehicles (i) | $ | 58 | $ | 55 | ||||
| Power & Vision (ii) | 51 | 104 | ||||||
| Body Exteriors & Structures (iii) | 9 | 28 | ||||||
| Other expense, net | 118 | 187 | ||||||
| Tax effect | (4 | ) | (28 | ) | ||||
| Net loss attributable to Magna | $ | 114 | $ | 159 | ||||
(i) During 2025, we recorded $58 million [$58 million after tax] of charges related to rightsizing activities at two facilities in Europe.
(ii) During 2025, we recorded $41 million [$37 million after tax] of charges related to significant rightsizing activities and plant consolidations at facilities primarily in Europe, as well as $10 million [$10 million after tax] of equity losses related to our share of restructuring activities at an equity method investee.
(iii) During 2025, we recorded $9 million [$9 million after tax] of charges related to rightsizing activities at two facilities in Europe.
6 Magna International Inc. Annual Report 2025
| (3) | Investments |
| 2025 | 2024 | |||||||
| Revaluation loss (gain) on public company warrants | $ | 8 | $ | (17 | ) | |||
| Non-cash impairment charge (iv) | 2 | 13 | ||||||
| Net revaluation (gain) loss on public and private equity investments | (4 | ) | 13 | |||||
| Sales of public equity investments | (3 | ) | — | |||||
| Other expense, net | 3 | 9 | ||||||
| Tax effect | 1 | 3 | ||||||
| Net loss attributable to Magna | $ | 4 | $ | 12 | ||||
(iv) The non-cash impairment charge relates to the impairment of a private equity investment.
| (4) | Impacts related to Fisker |
During 2024, Fisker filed for Chapter 11 bankruptcy protection in the United States and for similar protection in Austria. As a result, we recorded impairment charges on our Fisker related net assets and supplier related settlements, including our Fisker warrants, which were received in connection with the agreements with Fisker for platform sharing, engineering and manufacturing of the Fisker Ocean SUV. We also recorded additional restructuring charges during 2024 related to our Fisker related assembly operations. In the course of such bankruptcy proceedings, we terminated our manufacturing agreement for the Fisker Ocean SUV and recognized the remaining $196 million of deferred revenue into income.
| 2025 | 2024 | |||||||
| Impairment and supplier related settlements | $ | — | $ | 330 | ||||
| Impairment of Fisker warrants | — | 33 | ||||||
| Additional restructuring related to Complete Vehicles | — | 31 | ||||||
| Recognition of deferred revenue | — | (196 | ) | |||||
| Other income, net | — | 198 | ||||||
| Tax effect | — | (37 | ) | |||||
| Net loss attributable to Magna | $ | — | $ | 161 | ||||
| (5) | Gain on business combination |
During 2024, we acquired a business in our Body Exteriors & Structures segment for $5 million, resulting in a bargain purchase gain of $9 million [$9 million after tax].
INCOME FROM OPERATIONS BEFORE INCOME TAXES
Income from operations before income taxes was $1.31 billion for 2025 compared to $1.54 billion for 2024. The $234 million decrease is a result of the following changes, each as discussed above:
| 2025 | 2024 | Change (i) | ||||||||||
| Sales | $ | 42,010 | $ | 42,836 | $ | (826 | ) | |||||
| Costs and expenses | ||||||||||||
| Cost of goods sold | 36,021 | 37,037 | 1,016 | |||||||||
| Selling, general & administrative | 2,221 | 2,061 | (160 | ) | ||||||||
| Depreciation | 1,547 | 1,510 | (37 | ) | ||||||||
| Amortization of acquired intangible assets | 111 | 112 | 1 | |||||||||
| Interest expense, net | 209 | 211 | 2 | |||||||||
| Equity income | (143 | ) | (101 | ) | 42 | |||||||
| Other expense, net | 736 | 464 | (272 | ) | ||||||||
| Income from operations before income taxes | $ | 1,308 | $ | 1,542 | $ | (234 | ) | |||||
| (i) | Change represents the increase (decrease) on Income from operations before income taxes. |
Magna International Inc. Annual Report 2025 7
INCOME TAXES
| 2025 | 2024 | |||||||||||||||
| Income taxes as reported | $ | 425 | 32.5 | % | $ | 446 | 28.9 | % | ||||||||
| Tax effect on Other expense, net and Amortization of acquired intangible assets | 58 | (10.1 | ) | 85 | (3.8 | ) | ||||||||||
| Adjustments to Deferred Tax Valuation Allowances | — | — | (51 | ) | (2.4 | ) | ||||||||||
| Adjusted income taxes | $ | 483 | 22.4 | % | $ | 480 | 22.7 | % | ||||||||
During 2024 we increased the valuation allowance against certain deferred tax assets in Austria, which was partially offset by the release of certain valuation allowances in Spain, Czechia and Brazil ["Adjustments to Deferred Tax Valuation Allowances"].
Excluding the tax effect on Other expense, net and Amortization of acquired intangible assets, as well as the Adjustments to Deferred Tax Valuation Allowances, our effective income tax rate decreased to 22.4% for 2025 compared to 22.7% for 2024, primarily due to the net favourable impact of foreign exchange adjustments recognized for U.S. GAAP purposes on a year-over-year basis, partially offset by a change in mix of earnings.
On July 4, 2025, the US enacted H.R. 1 "A bill to provide for reconciliation pursuant to Title II of H. Con. Res. 14", commonly referred to as the One Big Beautiful Bill Act. The impact on Magna's consolidated financial statements was not material.
INCOME ATTRIBUTABLE TO NON-CONTROLLING INTERESTS
Income attributable to non-controlling interests was $54 million for 2025 compared to $87 million for 2024. The $33 million decrease was primarily due to lower income at our non-wholly owned operations in China, and the acquisition of the non-controlling 35% interest in a consolidated subsidiary during 2025.
NET INCOME ATTRIBUTABLE TO MAGNA INTERNATIONAL INC.
Net income attributable to Magna International Inc. was $829 million for 2025 compared to $1.01 billion for 2024. This $180 million decrease was as a result of a decrease in income from operations before income taxes of $234 million, partially offset by a decrease in income attributable to non-controlling interests of $33 million, and a decrease in income taxes of $21 million.
8 Magna International Inc. Annual Report 2025
EARNINGS PER SHARE
| 2025 | 2024 | % Change | ||||||||||
| Earnings per Common Share | ||||||||||||
| Basic | $ | 2.94 | $ | 3.52 | - | 16 | % | |||||
| Diluted | $ | 2.93 | $ | 3.52 | - | 17 | % | |||||
| Weighted average number of Common Shares outstanding (millions) | ||||||||||||
| Basic | 281.7 | 286.8 | - | 2 | % | |||||||
| Diluted | 282.5 | 286.9 | - | 2 | % | |||||||
| Adjusted diluted earnings per share | $ | 5.73 | $ | 5.41 | + | 6 | % | |||||
Diluted earnings per share was $2.93 for 2025, compared to $3.52 for 2024. The $0.59 decrease was substantially as a result of: lower net income attributable to Magna International Inc., as discussed above; partially offset by a decrease in the weighted average number of diluted shares outstanding. The decrease in the weighted average number of diluted shares outstanding was substantially due to the purchase and cancellation of Common Shares, subsequent to 2024, pursuant to our normal course issuer bid.
Other expense, net, and Amortization of acquired intangible assets, each after tax, negatively impacted diluted earnings per share by $2.80 in 2025 and $1.89 in 2024, respectively. Adjusted diluted earnings per share, as reconciled in the "Non-GAAP Financial Measures Reconciliation" section, was $5.73 for 2025, compared to $5.41 for 2024, an increase of $0.32.
Magna International Inc. Annual Report 2025 9
NON-GAAP PERFORMANCE MEASURES - FOR THE YEAR ENDED DECEMBER 31, 2025
ADJUSTED EBIT AS A PERCENTAGE OF SALES
The table below shows the change in Magna's Sales and Adjusted EBIT by segment, as well as the impact each segment's changes had on Magna's Adjusted EBIT as a percentage of sales, for 2025 compared to 2024:
| Adjusted EBIT | ||||||||||||
| Adjusted | as a percentage | |||||||||||
| Sales | EBIT | of sales | ||||||||||
| 2024 | $ | 42,836 | $ | 2,329 | 5.4 | % | ||||||
| Increase (decrease) related to: | ||||||||||||
| Body Exteriors & Structures | (381 | ) | 64 | + | 0.2 | % | ||||||
| Power & Vision | (193 | ) | (122 | ) | - | 0.3 | % | |||||
| Seating Systems | 98 | (13 | ) | — | ||||||||
| Complete Vehicles | (338 | ) | 21 | + | 0.1 | % | ||||||
| Corporate and Other | (12 | ) | 85 | + | 0.2 | % | ||||||
| 2025 | $ | 42,010 | $ | 2,364 | 5.6 | % | ||||||
Adjusted EBIT as a percentage of sales increased to 5.6% for 2025 compared to 5.4% for 2024 primarily due to:
| · | productivity and efficiency improvements, including the benefit of operational excellence initiatives and prior restructuring actions; |
| · | higher equity income; |
| · | higher supply chain costs in 2024, due in part to a supplier bankruptcy; |
| · | lower investments in research, development and our new mobility business; and |
| · | provisions related to the insolvency of two Chinese OEMs during 2024. |
These factors were partially offset by:
| · | net commercial items, which had an unfavourable impact on a year-over-year basis, including a resolution with Ford for a product-related matter during the fourth quarter of 2025; |
| · | unfavourable product mix; |
| · | higher employee profit sharing, stock-based and incentive compensation; |
| · | higher production input costs net of customer recoveries, primarily for labour; |
| · | higher pre-operating costs incurred at new facilities; |
| · | higher net tariff costs; |
| · | reduced earnings on lower sales; and |
| · | lower net transactional foreign exchange gains in 2025 compared to 2024. |
10 Magna International Inc. Annual Report 2025
ADJUSTED RETURN ON INVESTED CAPITAL
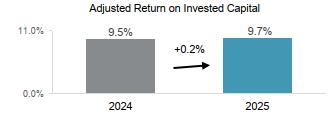
Adjusted Return on Invested Capital increased to 9.7% for 2025, compared to 9.5% for 2024, as a result of an increase in Adjusted After-tax operating profits, partially offset by higher Average Invested Capital.
Average Invested Capital increased $48 million to $18.92 billion for 2025, compared to $18.88 billion for 2024, primarily due to:
| · | average investment in operating lease right-of-use assets in excess of average amortization expense on operating lease right-of-use assets; |
| · | average investment in fixed assets in excess of average depreciation expense on fixed assets; and |
| · | the net strengthening of foreign currencies against the U.S. dollar. |
These factors were partially offset by:
| · | long-lived asset impairments during or subsequent to 2024; |
| · | a decrease in average operating assets and liabilities; |
| · | divestitures, net of acquisitions, during or subsequent to 2024; and |
| · | lower net investments in public and private equity companies and public company warrants. |
Magna International Inc. Annual Report 2025 11
SEGMENT ANALYSIS
We are a global automotive supplier that has complete vehicle engineering and contract manufacturing expertise, as well as product capabilities which include body, chassis, exterior, seating, powertrain, active driver assistance, electronics, mechatronics, mirrors, lighting and roof systems. We also have electronic and software capabilities across many of these areas.
Our reporting segments are: Body Exteriors & Structures; Power & Vision; Seating Systems; and Complete Vehicles.
| Sales | Adjusted EBIT | |||||||||||||||||||||||
| 2025 | 2024 | Change | 2025 | 2024 | Change | |||||||||||||||||||
| Body Exteriors & Structures | $ | 16,618 | $ | 16,999 | $ | (381 | ) | $ | 1,347 | $ | 1,283 | $ | 64 | |||||||||||
| Power & Vision | 15,198 | 15,391 | (193 | ) | 688 | 810 | (122 | ) | ||||||||||||||||
| Seating Systems | 5,898 | 5,800 | 98 | 210 | 223 | (13 | ) | |||||||||||||||||
| Complete Vehicles | 4,848 | 5,186 | (338 | ) | 151 | 130 | 21 | |||||||||||||||||
| Corporate and Other | (552 | ) | (540 | ) | (12 | ) | (32 | ) | (117 | ) | 85 | |||||||||||||
| Total reportable segments | $ | 42,010 | $ | 42,836 | $ | (826 | ) | $ | 2,364 | $ | 2,329 | $ | 35 | |||||||||||
BODY EXTERIORS & STRUCTURES
| 2025 | 2024 | Change | ||||||||||||||
| Sales | $ | 16,618 | $ | 16,999 | $ | (381 | ) | - | 2 | % | ||||||
| Adjusted EBIT | $ | 1,347 | $ | 1,283 | $ | 64 | + | 5 | % | |||||||
| Adjusted EBIT as a percentage of sales | 8.1 | % | 7.5 | % | + | 0.6 | % | |||||||||
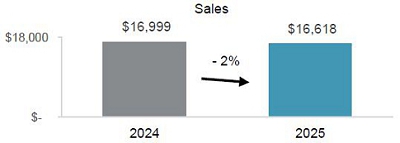
Sales – Body Exteriors & Structures
Sales decreased 2%, or $381 million, to $16.62 billion for 2025, compared to $17.00 billion for 2024, primarily due to:
| · | lower light vehicle production in North America and Europe on certain ongoing programs, and the end of production of certain programs, including the: |
| · | Chevrolet Malibu; |
| · | BMW X4; and |
| · | Ford Edge; |
| · | the divestiture of certain operations in India during 2024, which decreased sales by $119 million; and |
| · | net customer price concessions. |
These factors were partially offset by:
| · | the launch of programs during or subsequent to 2024, including the: |
| · | GMC Acadia, Chevrolet Traverse & Buick Enclave; |
| · | Skoda Elroq; and |
| · | Ford Expedition & Lincoln Navigator; |
| · | the net strengthening of foreign currencies against the U.S. dollar, which increased reported U.S. dollar sales by $98 million; and |
| · | net commercial items, which had a favourable impact on a year-over-year basis. |
12 Magna International Inc. Annual Report 2025
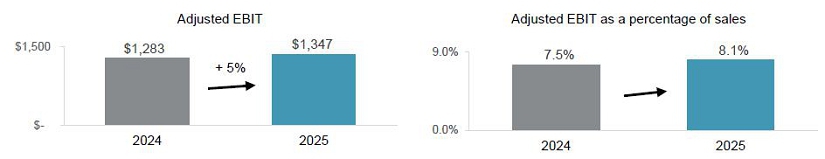
Adjusted EBIT and Adjusted EBIT as a percentage of sales – Body Exteriors & Structures
Adjusted EBIT increased $64 million to $1,347 million for 2025, compared to $1,283 million for 2024, and Adjusted EBIT as a percentage of sales increased to 8.1% from 7.5%. These increases were primarily due to:
| · | productivity and efficiency improvements, including the benefit of operational excellence initiatives and prior restructuring actions; |
| · | net commercial items, which had a favourable impact on a year-over-year basis; |
| · | higher supply chain costs in 2024, due in part to a supplier bankruptcy; and |
| · | provisions related to the insolvency of two Chinese OEMs during 2024. |
These factors were partially offset by:
| · | net transactional foreign exchange losses in 2025, compared to net transactional foreign exchange gains in 2024; |
| · | higher pre-operating costs incurred at new facilities; |
| · | reduced earnings on lower sales; |
| · | higher production input costs net of customer recoveries, primarily for labour; |
| · | higher launch costs; |
| · | unfavourable product mix; |
| · | higher net tariff costs; and |
| · | the divestiture of certain operations in India in 2024. |
POWER & VISION
| 2025 | 2024 | Change | ||||||||||||
| Sales | $ | 15,198 | $ | 15,391 | $ | (193 | ) | - | 1 | % | ||||
| Adjusted EBIT | $ | 688 | $ | 810 | $ | (122 | ) | - | 15 | % | ||||
| Adjusted EBIT as a percentage of sales | 4.5 | % | 5.3 | % | - | 0.8 | % | |||||||
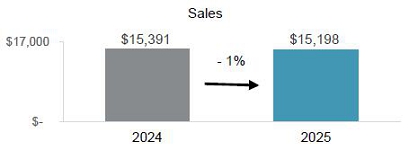
Sales – Power & Vision
Sales decreased 1%, or $193 million, to $15.20 billion for 2025, compared to $15.39 billion for 2024, primarily due to:
| · | lower light vehicle production in North America and Europe on certain ongoing programs, and the end of production of certain programs, including the: |
| · | Jeep Renegade & Fiat 500X; |
| · | Subaru Outback; and |
| · | Ford Focus; |
| · | net customer price concessions; and |
| · | net commercial items, which had an unfavourable impact on a year-over-year basis, including a resolution with Ford for a product-related matter during the fourth quarter of 2025. |
Magna International Inc. Annual Report 2025 13
These factors were partially offset by:
| · | the launch of programs during or subsequent to 2024, including the: |
| · | GMC Acadia, Chevrolet Traverse & Buick Enclave; |
| · | Jetour Freedom; and |
| · | Mercedes-Benz G-Class; |
| · | the net strengthening of foreign currencies against the U.S. dollar, which increased reported U.S. dollar sales by $232 million; and |
| · | net customer recoveries, including for higher tariff costs incurred during the year. |
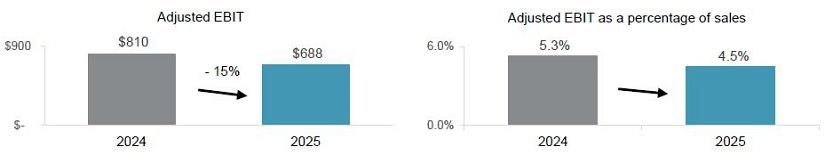
Adjusted EBIT and Adjusted EBIT as a percentage of sales – Power & Vision
Adjusted EBIT decreased $122 million to $688 million for 2025, compared to $810 million for 2024, and Adjusted EBIT as a percentage of sales decreased to 4.5% from 5.3%. These decreases were primarily due to:
| · | net commercial items, which had an unfavourable impact on a year-over-year basis, including a resolution with Ford for a product-related matter during the fourth quarter of 2025; |
| · | reduced earnings on lower sales; |
| · | net transactional foreign exchange losses in 2025, compared to net transactional foreign exchange gains in 2024; |
| · | higher net warranty costs of $27 million; |
| · | unfavourable product mix; |
| · | higher employee profit sharing, stock-based compensation, and incentive compensation; and |
| · | higher net tariff costs. |
These factors were partially offset by:
| · | productivity and efficiency improvements, including the benefit of operational excellence initiatives and prior restructuring actions; |
| · | lower launch costs; and |
| · | higher equity income. |
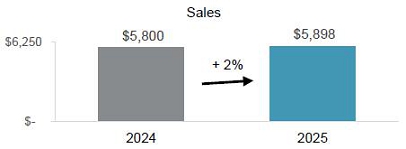
SEATING SYSTEMS
| 2025 | 2024 | Change | |||||||||||
| Sales | $ | 5,898 | $ | 5,800 | $ | 98 | + | 2 | % | ||||
| Adjusted EBIT | $ | 210 | $ | 223 | $ | (13 | ) | - | 6 | % | |||
| Adjusted EBIT as a percentage of sales | 3.6 | % | 3.8 | % | - | 0.2 | % | ||||||
14 Magna International Inc. Annual Report 2025
Sales – Seating Systems
Sales increased 2%, or $98 million, to $5.90 billion for 2025, compared to $5.80 billion for 2024, primarily due to:
| · | the launch of programs during or subsequent to 2024, including the: |
| · | Audi A5; |
| · | Skoda Elroq; and |
| · | GMC Acadia, Chevrolet Traverse & Buick Enclave; |
| · | the net strengthening of foreign currencies against the U.S. dollar, which increased reported U.S. dollar sales by $58 million; and |
| · | net customer recoveries, including for higher tariff costs incurred during the year. |
These factors were partially offset by:
| · | lower light vehicle production in North America and Europe on certain ongoing programs, and the end of production of certain programs, including the: |
| · | Ford Escape; and |
| · | Ford Edge; and |
| · | net customer price concessions. |
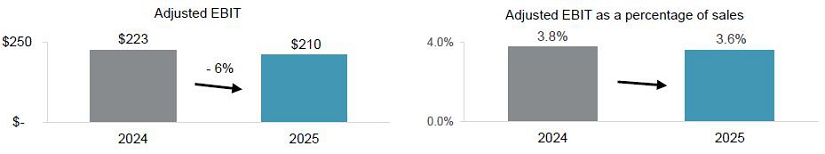
Adjusted EBIT and Adjusted EBIT as a percentage of sales – Seating Systems
Adjusted EBIT decreased $13 million to $210 million for 2025, compared to $223 million for 2024, and Adjusted EBIT as a percentage of sales decreased to 3.6% from 3.8%. These decreases were primarily due to:
| · | net commercial items, which had an unfavourable impact on a year-over-year basis; |
| · | net transactional foreign exchange losses in 2025, compared to net transactional foreign exchange gains in 2024; |
| · | higher production input costs net of customer recoveries, primarily relating to labour and certain commodities; |
| · | higher launch costs; |
| · | higher restructuring costs; and |
| · | higher net tariff costs. |
These factors were partially offset by:
| · | productivity and efficiency improvements, including the benefit of operational excellence initiatives and prior restructuring actions; |
| · | provisions related to the insolvency of a Chinese OEM during 2024; |
| · | higher equity income; |
| · | the benefit of government research and development incentives in 2025; and |
| · | earnings on higher sales. |
COMPLETE VEHICLES
| 2025 | 2024 | Change | |||||||||||||
| Complete Vehicle Assembly Volumes (thousands of units)(i) | 70.9 | 71.9 | (1.0 | ) | - | 1 | % | ||||||||
| Sales | $ | 4,848 | $ | 5,186 | $ | (338 | ) | - | 7 | % | |||||
| Adjusted EBIT | $ | 151 | $ | 130 | $ | 21 | + | 16 | % | ||||||
| Adjusted EBIT as a percentage of sales | 3.1 | % | 2.5 | % | + | 0.6 | % | ||||||||
(i) Vehicles produced at our Complete Vehicle operations are included in Europe Light Vehicle Production volumes.
Magna International Inc. Annual Report 2025 15
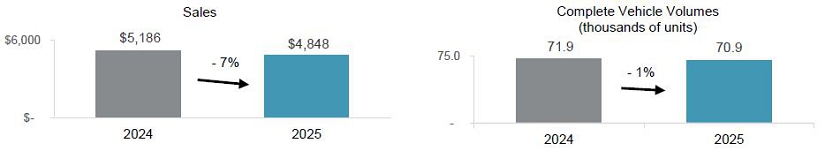
Sales – Complete Vehicles
Sales decreased 7%, or $338 million, to $4.85 billion for 2025, compared to $5.19 billion for 2024, and complete vehicle assembly volumes decreased 1%. The decrease in volumes was primarily due to lower volumes with full-costed contractual arrangements partially offset by higher volumes with value-added contractual arrangements.
The decrease in sales is primarily a result of: lower complete vehicle assembly volumes, including the end of production of the Jaguar I-Pace and Jaguar E-Pace; and lower engineering revenue. These factors were partially offset by: the launch of the Mercedes-Benz G-Class during the fourth quarter of 2024; and an $184 million increase in reported U.S. dollar sales as a result of the strengthening of the euro against the U.S. dollar.
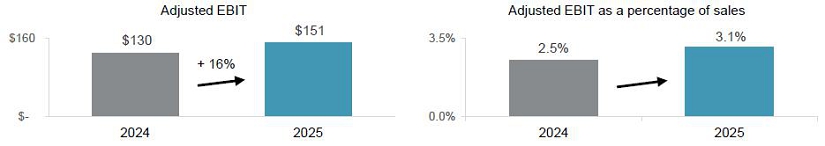
Adjusted EBIT and Adjusted EBIT as a percentage of sales – Complete Vehicles
Adjusted EBIT increased $21 million to $151 million for 2025, compared to $130 million for 2024, and Adjusted EBIT as a percentage of sales increased to 3.1% from 2.5%. These increases were primarily due to:
| · | productivity and efficiency improvements, including the benefit of operational excellence initiatives and prior restructuring actions; |
| · | higher earnings due to favourable program mix; |
| · | lower production input costs net of customer recoveries, primarily relating to labour; and |
| · | the net strengthening of foreign currencies against the U.S. dollar, which had a $5 million favourable impact on reported U.S. dollar Adjusted EBIT. |
These factors were partially offset by:
| · | lower income on lower engineering sales; |
| · | net commercial items, which had an unfavourable impact on a year-over-year basis; and |
| · | reduced earnings on lower complete vehicle assembly volumes. |
CORPORATE AND OTHER
Adjusted EBIT was a loss of $32 million for 2025 compared to a loss of $117 million for 2024. The $85 million improvement was primarily the result of:
| · | net transactional foreign exchange gains in 2025, compared to net transactional foreign exchange losses in 2024; |
| · | lower investments in research, development and our new mobility business; |
| · | an increase in fees received from our divisions; |
| · | lower restructuring costs; and |
| · | higher equity income. |
These factors were partially offset by:
| · | higher incentive and stock-based compensation; |
| · | a gain on the sale of an equity-method investment during 2024; |
| · | higher consulting and legal costs; and |
| · | higher costs to accelerate operational excellence initiatives. |
16 Magna International Inc. Annual Report 2025
FINANCIAL CONDITION, LIQUIDITY AND CAPITAL RESOURCES
OPERATING ACTIVITIES
| 2025 | 2024 | Change | |||||||
| Net income | $ | 883 | $ | 1,096 | |||||
| Items not involving current cash flows | 2,368 | 1,857 | |||||||
| 3,251 | 2,953 | $ | 298 | ||||||
| Changes in operating assets and liabilities | 347 | 681 | (334 | ) | |||||
| Cash provided from operating activities | $ | 3,598 | $ | 3,634 | $ | (36 | ) | ||
Cash provided from operating activities
Comparing 2025 to 2024, cash provided from operating activities decreased by $36 million primarily as a result of lower changes in operating assets and liabilities, and lower net income, partially offset by higher items not involving current cash flows. The key components of this decrease were:
| · | a $394 million decrease in cash received from customers; |
| · | a $182 million increase in cash taxes; |
| · | a $65 million increase in cash paid for labour; and |
| · | lower dividends received from equity investments of $14 million. |
These factors were partially offset by a $615 million decrease in cash paid for materials and overhead.
Changes in operating assets and liabilities
During 2025, we generated $347 million from operating assets and liabilities primarily consisting of:
| · | a $792 million decrease in production and other receivables, including due to customer recoveries; |
| · | a $186 million increase in other accrued liabilities; |
| · | a $127 million decrease in production inventory; and |
| · | a $35 million decrease in tooling investment for current and upcoming program launches. |
These factors were partially offset by:
| · | a $568 million decrease in accounts payable; |
| · | a $176 million decrease in taxes payable; and |
| · | a $49 million decrease in accrued wages and salaries. |
Magna International Inc. Annual Report 2025 17
INVESTING ACTIVITIES
| 2025 | 2024 | Change | ||||||||
| Fixed asset additions | $ | (1,313 | ) | $ | (2,178 | ) | ||||
| Acquisitions | (1 | ) | (86 | ) | ||||||
| Increase in investments, other assets and intangible assets | (499 | ) | (617 | ) | ||||||
| Increase in public and private equity investments | (8 | ) | (12 | ) | ||||||
| Proceeds from dispositions of fixed assets, other assets and investments | 121 | 219 | ||||||||
| Net cash inflow from disposal of facilities | — | 82 | ||||||||
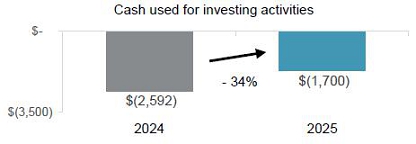
| Cash used for investing activities | $ | (1,700 | ) | $ | (2,592 | ) | $ | 892 | ||
Cash used for investing activities in 2025 was $892 million lower compared to 2024. The change between 2025 and 2024 was primarily due to an $865 million decrease in cash used for fixed assets, a $118 million decrease in cash used for investments, other assets and intangible assets, and an $85 million decrease in cash used for acquisitions. These factors were partially offset by the net cash inflow from the disposal of certain operations in India during 2024, and lower proceeds from dispositions of fixed assets, other assets and investments.
FINANCING ACTIVITIES
| 2025 | 2024 | Change | ||||||||
| Issues of debt | $ | 1,048 | $ | 778 | ||||||
| Decrease in short-term borrowings | (318 | ) | (182 | ) | ||||||
| Repayments of debt | (1,397 | ) | (815 | ) | ||||||
| Issue of Common Shares on exercise of stock options | 2 | 30 | ||||||||
| Tax withholdings on vesting of equity awards | (5 | ) | (8 | ) | ||||||
| Repurchase of Common Shares | (137 | ) | (207 | ) | ||||||
| Dividends paid | (544 | ) | (539 | ) | ||||||
| Dividends paid to non-controlling interests | (59 | ) | (46 | ) | ||||||
| Acquisition of non-controlling interest | (122 | ) | — | |||||||
| Cash used for financing activities | $ | (1,532 | ) | $ | (989 | ) | $ | (543 | ) | |
During 2025, we issued the following Senior Notes [the "Senior Notes"]:
| Settlement Date | Net
Cash Proceeds (i) |
Maturity Date | |||||
| €575 million Senior Notes at 3.625% | May 21, 2025 | €569 million | May 21, 2031 | ||||
| $400 million Senior Notes at 5.875% | May 22, 2025 | $397 million | June 1, 2035 | ||||
(i) Net cash proceeds represent the public offering price less the underwriting discount, before expenses.
Net cash proceeds received from the Senior Notes issuances was $1,042 million, which were issued for general corporate purposes, including the repayment of $300 million in Senior Notes on May 23, 2025, and $650 million in Senior Notes on September 24, 2025.
The Senior Notes are unsecured obligations and do not include any financial covenants. We may redeem the Senior Notes in whole or in part at any time, and from time to time, at specified redemption prices determined in accordance with the terms of the indenture governing the Senior Notes. Refer to Note 17, "Debt" of our consolidated financial statements.
Short-term borrowings decreased $318 million during 2025, primarily due to a $271 million decrease in notes outstanding under the U.S. commercial paper program.
During 2025, we repaid $100 million outstanding under the 3-year tranche and $300 million outstanding under the 5-year tranche of our syndicated, unsecured, delayed draw term loan facility [the "Term Loan"].
18 Magna International Inc. Annual Report 2025
During 2025, we repurchased 3.0 million Common Shares under normal course issuer bids for aggregate cash consideration of $137 million.
During 2025, we acquired the non-controlling 35% interest in a consolidated subsidiary, increasing our interest to 100%. The total purchase price was $143 million, of which $122 million was paid during 2025. The remaining $21 million is expected to be paid during the first quarter of 2026.
Cash dividends paid per Common Share were $1.94 for 2025, compared to $1.90 for 2024.
FINANCING RESOURCES
| 2025 | 2024 | Change | |||||||||
| Liabilities | |||||||||||
| Short-term borrowing | $ | — | $ | 271 | |||||||
| Long-term debt due within one year | 27 | 708 | |||||||||
| Current portion of operating lease liabilities | 328 | 293 | |||||||||
| Long-term debt | 4,685 | 4,134 | |||||||||
| Operating lease liabilities | 1,649 | 1,662 | |||||||||
| $ | 6,689 | $ | 7,068 | $ | (379 | ) | |||||
Financial liabilities decreased $379 million to $6.69 billion as at December 31, 2025, primarily as a result of the repayments of $300 million and $650 million in Senior Notes during the second and third quarters of 2025, respectively, repayment of $100 million and $300 million of the 3-year tranche and 5-year tranche Term Loan during the second and fourth quarter of 2025, respectively, and a decrease in notes outstanding under the U.S. commercial paper program. These decreases were partially offset by the issuance of €575 million and $400 million of Senior Notes during the second quarter of 2025, the strengthening of foreign currencies against the U.S. dollar, and renewing existing and entering into new operating lease agreements.
CASH RESOURCES
In 2025, our cash resources increased by $365 million to $1.6 billion, primarily as a result of cash provided from operating activities, partially offset by cash used for investing and financing activities. In addition to our cash resources at December 31, 2025, we had term and operating lines of credit totaling $4.0 billion, of which $3.9 billion was unused and available.
On March 21, 2025, we amended our $800 million 364-day syndicated revolving credit facility, including to extend the maturity date from June 24, 2025 to June 24, 2026. As of December 31, 2025, we have not borrowed any funds under this credit facility.
On March 21, 2025, we amended our $2.7 billion syndicated revolving credit facility, including to extend the maturity date from June 25, 2029 to June 25, 2030. As of December 31, 2025, we have no amounts outstanding under this credit facility.
On March 21, 2025, we amended our Term Loan to include an additional 3-year delayed draw tranche of $650 million with a draw expiration date of July 12, 2025. On July 8, 2025, we reduced the tranche amount from $650 million to $350 million and extended the draw expiration date to January 12, 2026. On January 12, 2026, the term loan facility expired with no amount drawn.
MAXIMUM NUMBER OF SHARES ISSUABLE
The following table presents the maximum number of shares that would be outstanding if all the dilutive instruments outstanding at February 25, 2026 were exercised:
| Common Shares | 278,795,469 | ||
| Stock options (i) and share awards | 4,129,151 | ||
| 282,924,620 |
| (i) | Options to purchase Common Shares are exercisable by the holder in accordance with the vesting provisions and upon payment of the exercise price as may be determined from time to time pursuant to our stock option plans. |
Magna International Inc. Annual Report 2025 19
CONTRACTUAL OBLIGATIONS
A purchase obligation is defined as an agreement to purchase goods or services that is enforceable and legally binding on us and that specifies all significant terms, including: fixed or minimum quantities to be purchased; fixed, minimum or variable price provisions; and the approximate timing of the transaction. Consistent with our customer obligations, substantially all of our purchases are made under purchase orders with our suppliers which are requirements-based and accordingly do not specify minimum quantities. Other long-term liabilities are defined as long-term liabilities that are recorded on our consolidated balance sheet. Based on this definition, the following table includes only those contracts which include fixed or minimum obligations.
At December 31, 2025, we had contractual obligations requiring annual payments as follows:
| 2026 | 2027- 2028 |
2029- 2030 |
Thereafter | Total | ||||||||||||||||
| Operating leases | $ | 400 | $ | 670 | $ | 514 | $ | 892 | $ | 2,476 | ||||||||||
| Long-term debt | 27 | 742 | 1,488 | 2,481 | 4,738 | |||||||||||||||
| Unconditional purchase obligations: | ||||||||||||||||||||
| Materials and services | 2,154 | 1,049 | 644 | 260 | 4,107 | |||||||||||||||
| Capital | 409 | 107 | 54 | 20 | 590 | |||||||||||||||
Total contractual obligations |
$ | 2,990 | $ | 2,568 | $ | 2,700 | $ | 3,653 | $ | 11,911 | ||||||||||
Our unfunded obligation with respect to employee future benefit plans, which have been actuarially determined, was $490 million at December 31, 2025. These obligations are as follows:
| Retirement | Termination and | |||||||||||||||
| Pension | Medical | Long-term Service | ||||||||||||||
| Liability | Liability | Arrangements | Total | |||||||||||||
| Projected benefit obligation | $ | 479 | $ | 17 | $ | 417 | $ | 913 | ||||||||
| Less plan assets at fair value | (423 | ) | — | — | (423 | ) | ||||||||||
| Ending funded status – Plan deficit | $ | 56 | $ | 17 | $ | 417 | $ | 490 | ||||||||
Foreign Currency Activities
Our North American operations negotiate sales contracts with OEMs for payment in U.S. dollars, Canadian dollars and Mexican pesos. Materials and equipment are purchased in various currencies depending upon competitive factors, including relative currency values. Our North American operations use labour and materials which are paid for in U.S. dollars, Canadian dollars and Mexican pesos. Our Mexican operations generally use the U.S. dollar as the functional currency.
Our European operations negotiate sales contracts with OEMs for payment principally in euros. Our European operations' material, equipment and labour are principally paid for in euros and U.S. dollars.
Our Asian operations negotiate sales contracts with OEMs for payment principally in Chinese renminbi. Our Asian operations' material, equipment and labour are paid for principally in Chinese renminbi.
We employ hedging programs, primarily through the use of foreign exchange forward contracts, in an effort to manage our foreign exchange exposure, which arises when manufacturing facilities have committed to the delivery of products for which the selling price or material purchases have been quoted in foreign currencies and for labour in countries where the local currency is not a division's functional currency. These commitments represent our contractual obligations to deliver products over the duration of the product programs, which can last a number of years. The amount and timing of the forward contracts will be dependent upon a number of factors, including anticipated production delivery schedules and anticipated production costs, which may be paid in the foreign currency. Despite these measures, significant long-term fluctuations in relative currency values, in particular a significant change in the relative values of the U.S. dollar, Canadian dollar, euro, Chinese renminbi or Mexican peso, could have an adverse effect on our profitability and financial condition (as discussed throughout this MD&A).
20 Magna International Inc. Annual Report 2025
NON-GAAP FINANCIAL MEASURES RECONCILIATION
The reconciliation of Non-GAAP financial measures is as follows:
ADJUSTED EBIT
| 2025 | 2024 | |||||||
| Net income | $ | 883 | $ | 1,096 | ||||
| Add: | ||||||||
| Amortization of acquired intangible assets | 111 | 112 | ||||||
| Interest expense, net | 209 | 211 | ||||||
| Other expense, net | 736 | 464 | ||||||
| Income taxes | 425 | 446 | ||||||
| Adjusted EBIT | $ | 2,364 | $ | 2,329 | ||||
ADJUSTED EBIT AS A PERCENTAGE OF SALES
| 2025 | 2024 | |||||||
| Sales | $ | 42,010 | $ | 42,836 | ||||
| Adjusted EBIT | $ | 2,364 | $ | 2,329 | ||||
| Adjusted EBIT as a percentage of sales | 5.6 | % | 5.4 | % | ||||
ADJUSTED DILUTED EARNINGS PER SHARE
| 2025 | 2024 | |||||||
| Net income attributable to Magna International Inc. | $ | 829 | $ | 1,009 | ||||
| Add (deduct): | ||||||||
| Amortization of acquired intangible assets | 111 | 112 | ||||||
| Other expense, net | 736 | 464 | ||||||
| Tax effect on Amortization of acquired intangible assets and Other expense, net | (58 | ) | (85 | ) | ||||
| Adjustments to Deferred Tax Valuation Allowances | — | 51 | ||||||
| Adjusted net income attributable to Magna International Inc. | $ | 1,618 | $ | 1,551 | ||||
| Diluted weighted average number of Common Shares outstanding during the period (millions) | 282.5 | 286.9 | ||||||
| Adjusted diluted earnings per share | $ | 5.73 | $ | 5.41 | ||||
Magna International Inc. Annual Report 2025 21
ADJUSTED RETURN ON INVESTED CAPITAL
Adjusted Return on Invested Capital is calculated as Adjusted After-tax operating profits divided by Average Invested Capital for the period. Average Invested Capital for the twelve month period is averaged on a five-fiscal quarter basis.
| 2025 | 2024 | |||||||
| Net Income | $ | 883 | $ | 1,096 | ||||
| Add (deduct): | ||||||||
| Amortization of acquired intangible assets | 111 | 112 | ||||||
| Interest expense, net | 209 | 211 | ||||||
| Other expense, net | 736 | 464 | ||||||
| Tax effect on Interest expense, net, Amortization of acquired intangible assets and Other expense, net | (107 | ) | (133 | ) | ||||
| Adjustments to Deferred Tax Valuation Allowances | — | 51 | ||||||
| Adjusted After-tax operating profits | $ | 1,832 | $ | 1,801 | ||||
| As at December 31, | ||||||||
| 2025 | 2024 | |||||||
| Total Assets | $ | 31,417 | $ | 31,039 | ||||
| Excluding: | ||||||||
| Cash and cash equivalents | (1,612 | ) | (1,247 | ) | ||||
| Deferred tax assets | (864 | ) | (819 | ) | ||||
| Less Current Liabilities | (10,989 | ) | (12,097 | ) | ||||
| Excluding: | ||||||||
| Short-term borrowing | — | 271 | ||||||
| Long-term debt due within one year | 27 | 708 | ||||||
| Current portion of operating lease liabilities | 328 | 293 | ||||||
| Invested Capital | $ | 18,307 | $ | 18,148 | ||||
| 2025 | 2024 | |||||||
| Adjusted After-tax operating profits | $ | 1,832 | $ | 1,801 | ||||
| Average Invested Capital | $ | 18,923 | $ | 18,875 | ||||
| Adjusted Return on Invested Capital | 9.7 | % | 9.5 | % | ||||
22 Magna International Inc. Annual Report 2025
SUBSEQUENT EVENT
NORMAL COURSE ISSUER BID
Subsequent to December 31, 2025, we purchased 3,510,743 Common Shares for cancellation and 191,858 Common Shares to satisfy stock-based compensation awards each under our existing normal course issuer bid for cash consideration of $214 million.
SIGNIFICANT ACCOUNTING POLICIES AND CRITICAL ACCOUNTING ESTIMATES
Our significant accounting policies are more fully described in Note 2, "Significant Accounting Policies", to our consolidated financial statements. The preparation of our audited consolidated financial statements requires management to make estimates and assumptions that affect the reported amounts of assets, liabilities, revenues and expenses and the related disclosure of contingent assets and liabilities, as of the date of our consolidated financial statements. These estimates and assumptions are based on our historical experience, and various other assumptions we believe to be reasonable in the circumstances. Since these estimates and assumptions are subject to an inherent degree of uncertainty, actual results in these areas may differ significantly from our estimates.
We believe the following critical accounting policies and estimates affect the more subjective or complex judgements and estimates used in the preparation of our consolidated financial statements and accompanying notes. Management has discussed the development and selection of the following critical accounting policies with the Audit Committee of the Board of Directors, and the Audit Committee has reviewed our disclosure relating to critical accounting policies in this MD&A.
revenue recognition – complete vehicle assembly arrangements
Our complete vehicle assembly contracts with customers are complex and often include promises to transfer multiple products and services, some of which may be implicitly contracted. Each good or service is evaluated to determine whether it represents a distinct performance obligation, and whether it should be characterized as revenue or as a reimbursement of costs incurred. The total transaction price is then allocated to the distinct performance obligations based on the expected cost plus a margin approach and recognized as revenue.
Additionally, as the terms of our complete vehicle assembly contracts with customers differ with respect to the ownership of components related to the assembly process, we must determine whether we are acting as principal in these arrangements, or acting as an agent in which case the revenue recognized would principally reflect the assembly fee.
Significant interpretation and judgement is sometimes required to determine the appropriate accounting for these contracts including: (i) combining contracts that may impact the allocation of the transaction price between products and services; (ii) determining whether performance obligations are considered distinct and are required to be accounted for separately or combined; and (iii) the allocation of the transaction price to each distinct performance obligation and determining when to recognize revenue.
Impairment Assessments – goodwilL, long-lived assetS, AND EQUITY METHOD INVESTMENTS
We review goodwill at the reporting unit level for impairment in the fourth quarter of each year or more frequently if events or changes in circumstances indicate that goodwill might be impaired. Goodwill impairment is assessed by comparing the fair value of a reporting unit to the underlying carrying value of the reporting unit's net assets, including goodwill. If a reporting unit's carrying amount exceeds its fair value, an impairment is recognized based on that difference. The fair value of a reporting unit is determined using the estimated discounted future cash flows of the reporting unit.
During the fourth quarter of 2025, we assessed goodwill impairment based on a comparison of each reporting unit's fair value to the underlying carrying amount of net assets, including goodwill. Through this analysis, the Electronics reporting unit within our Power & Vision segment demonstrated indicators of impairment due to lower than expected sales and reduced volume projections. As a result, we recorded a $379 million non-cash impairment charge within Other expense, net. The impairment was measured under an income approach, utilizing discounted cash flows to derive the fair value of the reporting unit. The inputs utilized in the analyses were classified as Level 3 inputs within the fair value hierarchy as defined in ASC 820, "Fair Value Measurement" and primarily consist of expected revenues and costs, estimated production volumes, future growth rates and appropriate discount rates (based on weighted average cost of capital). To the extent that future profitability continues to decline as compared to forecasted profitability or if adverse changes occur to key assumptions or other fair value measurement inputs, additional impairment of our goodwill could occur in the future. Refer to Note 4, "Other Expense, Net" of the notes to our consolidated financial statements for additional information.
In addition to our review of goodwill, we evaluate fixed assets and other long-lived assets for impairment whenever indicators of impairment exist. Indicators of impairment include the bankruptcy of a significant customer, or the early termination, loss, renegotiation of the terms of, significant volume decrease in, or delay in the implementation of, any significant production contract. If the sum of the undiscounted future cash flows expected to result from the assets, without interest charges, is less than the carrying amount of the assets, an asset impairment may be recognized in our consolidated financial statements. The amount of impairment to be recognized is calculated as the difference between the fair value and carrying amount of the asset.
Magna International Inc. Annual Report 2025 23
During the fourth quarter of 2025, we concluded that there were indicators of impairment related to finite-lived intangible assets in the Electronics reporting unit within our Power & Vision segment due to lower than expected sales and declines in volume projections. As a result, we recorded a $212 million non-cash impairment charge within Other expense, net of which $158 million related to patents and technology and $54 million related to customer relationship intangibles. The impairment was measured based on a comparison of the asset's fair value to the carrying value. Fair value of finite-lived intangible assets is determined using estimated discounted future cash flows. The inputs utilized in the analyses were classified as Level 3 inputs within the fair value hierarchy as defined in ASC 820, "Fair Value Measurement" and primarily consist of expected revenues and costs, estimated production volumes, and appropriate discount rates (based on weighted average cost of capital). To the extent that future profitability continues to decline as compared to forecasted profitability or if adverse changes occur to key assumptions or other fair value measurement inputs, additional impairment of our finite-lived intangible assets could occur in the future. Refer to Note 4, "Other Expense, Net" of the notes to our consolidated financial statements for additional information.
As of December 31, 2025, we had equity method investments of $846 million. We monitor our investments for indicators of other-than-temporary declines in value on an ongoing basis in accordance with U.S. GAAP. If we determine that an other-than-temporary decline in value has occurred, we recognize an impairment loss, which is measured as the difference between the book value and the fair value of the investment. Fair value is generally determined using an income approach based on discounted cash flows.
We believe that the impairment assessments for goodwill, long-lived assets, and equity method investments contain "critical accounting estimates" because: (i) they are subject to significant measurement uncertainty and are susceptible to change, which could materially impact our assessment for fair value, as management is required to make forward-looking assumptions regarding the impact of improvement plans on current operations, in-sourcing and other new business opportunities, program pricing and cost assumptions on current and future business, the timing of new program launches and future forecasted production volumes, and the appropriate discount rates (based on a weighted average cost of capital ranging from 10.5% to 15.5% at December 31, 2025); and (ii) any resulting impairment loss could have a material impact on our consolidated net income and on the amount of assets reported in our consolidated balance sheet.
Warranty
We record product warranty costs, which include product liability and recall costs. Under most customer agreements, we only account for existing or probable claims on product default issues when amounts related to such issues are probable and reasonably estimable. For certain products, we record an estimate of future warranty-related costs based on the terms of the specific customer agreements and/or our warranty experience.
Product liability and recall provisions are established based on our best estimate of the amounts necessary to settle existing claims. These estimates typically require assumptions from management regarding: the number of units that may be returned; the cost of the product being replaced; labour to remove and replace the defective part; and the customer's administrative costs relating to the recall. In making this estimate, judgement is also required as to the ultimate negotiated sharing of the cost between us, the customer and, in some cases a supplier. Where applicable, insurance recoveries related to such provisions are also recorded.
We monitor warranty activity on an ongoing basis and revise our best estimate as necessary. Due to the uncertainty and potential volatility of the factors contributing to developing estimates of the amounts necessary to settle existing claims, actual product liability costs could be materially different from our best estimate.
Income Taxes
The determination of tax liabilities involves dealing with uncertainties in the application of complex tax laws. Significant judgement and estimates are required in determining our provision for income taxes, deferred tax assets and liabilities, and liabilities for unrecognized tax benefits. We recognize tax benefits from uncertain tax positions only if it is more likely than not that the tax position will be sustained on examination by the taxing authorities, based on the technical merits of the position. The tax benefits recognized in the financial statements from such positions are then measured based on the largest benefit that has a greater than 50% likelihood of being realized upon ultimate settlement.
At December 31, 2025, we had gross unrecognized tax benefits of $191 million excluding interest and penalties, of which $113 million, if recognized, would affect our effective tax rate. The gross unrecognized tax benefits differ from the amount that would affect our effective tax rate due primarily to the impact of the valuation allowances on deferred tax assets.
Deferred tax assets and liabilities are recognized for the estimated future tax effects attributable to temporary differences between financial statement carrying value of existing assets and liabilities and their respective tax bases and tax loss and credit carryforwards. Deferred tax assets and liabilities are measured using the enacted tax rates and laws that will be in effect when the differences are expected to reverse. Accounting standards require that we assess whether valuation allowances should be established or maintained against our deferred income tax assets, based on consideration of all available evidence, using a "more-likely-than-not" standard. The factors used to assess the likelihood of realization are: history of losses, forecasts of future pre-tax income and tax planning strategies that could be implemented to realize the deferred tax assets. On a quarterly basis, we evaluate the realizability of deferred tax assets by assessing our valuation allowances and by adjusting the amount of such allowances as necessary. We use tax planning strategies to realize deferred tax assets in order to avoid the potential loss of these tax benefits. Changes in our estimates, due to unforeseen events or otherwise, could have a material impact on our financial condition and results of operations. Refer to Note 13, "Income Taxes" of the notes to our consolidated financial statements for additional information.
24 Magna International Inc. Annual Report 2025
Employee Future Benefit Plans
The determination of the obligation and expense for defined benefit pension, termination and long service arrangements and other post-retirement benefits, such as retiree healthcare and medical benefits, is dependent on the selection of certain assumptions used by actuaries in calculating such amounts. Those assumptions include, among others, the discount rate, expected long-term rate of return on plan assets and rates of increase in compensation costs. Actual results that differ from the assumptions used are accumulated and amortized over future periods and therefore impact the recognized expense in future periods. Significant changes in assumptions or significant plan amendments could materially affect our future employee benefit obligations and future expense.
At December 31, 2025, we had past service costs and actuarial experience losses of $73 million included in accumulated other comprehensive income that will be amortized to future employee benefit expense over the expected average remaining service life of employees or over the expected average life expectancy of retired employees, depending on the status of the plan.
COMMITMENTS AND CONTINGENCIES
From time to time, we may be contingently liable for litigation, legal and/or regulatory actions and proceedings and other claims. Refer to Note 24, "Contingencies" of our audited consolidated financial statements for the year ended December 31, 2025.
For a discussion of risk factors relating to legal and other claims/actions against us, refer to "Item 5. Risk Factors" in our Annual Information Form, filed with the securities commissions in Canada, our Annual Report on Form 40-F, filed with the United States Securities and Exchange Commission, and subsequent filings.
CONTROLS AND PROCEDURES
Disclosure Controls and Procedures
Disclosure controls and procedures (as defined in Rules 13a-15(e) and 15d-15(e) under the Securities Exchange Act of 1934, as amended [the "Exchange Act"]), are designed to ensure that material information required to be disclosed in reports filed or submitted under the Exchange Act is recorded, processed, summarized and reported on a timely basis, and that such information is accumulated and communicated to senior management, including the Company's Chief Executive Officer and Chief Financial Officer, as appropriate, to enable them to make timely decisions regarding required disclosure of such information. We have conducted an evaluation of our disclosure controls and procedures as of December 31, 2025, under the supervision, and with the participation of our Chief Executive Officer and our Chief Financial Officer. Based on this evaluation, our Chief Executive Officer and our Chief Financial Officer have concluded that our disclosure controls and procedures (as this term is defined in the rules adopted by Canadian securities regulatory authorities and the United States Securities and Exchange Commission ["SEC"]) are effective as of December 31, 2025.
Management's Annual Report on Internal Control over Financial Reporting
Internal control over financial reporting is a process designed to provide reasonable, but not absolute, assurance regarding the reliability of financial reporting and preparation of financial statements for external purposes in accordance with U.S. GAAP. Our management is responsible for establishing and maintaining adequate internal control over financial reporting. Due to its inherent limitations, internal control over financial reporting may not prevent or detect misstatements on a timely basis. Additionally, projections of any evaluation of the effectiveness of internal control over financial reporting to future periods are subject to the risk that the controls may become inadequate because of changes in conditions, or that the degree of compliance with the policies or procedures may deteriorate. Our management used the Committee of Sponsoring Organizations of the Treadway Commission ["COSO"] Internal Control-Integrated Framework (2013) to evaluate the effectiveness of internal control over financial reporting.
Based on this evaluation, our Chief Executive Officer and our Chief Financial Officer have assessed the effectiveness of our internal control over financial reporting and concluded that, as at December 31, 2025, such internal control over financial reporting is effective. The Company's internal control over financial reporting as of December 31, 2025, has been audited by Deloitte LLP, an Independent Registered Public Accounting Firm, who also audited the Company's consolidated financial statements for the year ended December 31, 2025. Deloitte LLP expressed an unqualified opinion on the effectiveness of the Company's internal control over financial reporting. This report precedes our audited consolidated financial statements for the year ended December 31, 2025.
Magna International Inc. Annual Report 2025 25
Changes in Internal Controls over Financial Reporting
There have been no changes in our internal controls over financial reporting that occurred during 2025 that have materially affected or are reasonably likely to materially affect, our internal control over financial reporting.
RISK FACTORS
Our short and medium-term operational success, as well as our ability to create long-term value through our business strategy, are subject to risks and uncertainties. The following are the more significant risks:
Macroeconomic, geopolitical and other risks
| · | Geopolitical Risks: Geopolitical crises could create a number of risks, including: disruption of energy supplies (particularly natural gas and oil); shipping/transportation and logistics, vehicle production and/or supply chains; weakening economic growth and consumer confidence; increasing inflation; increasing physical or cybersecurity threats; and/or worsening other risks described elsewhere in these Risk Factors, such as commodity prices, relative foreign exchange rates and risks of doing business in foreign markets. An expansion or worsening of existing geopolitical crises, or the occurrence of significant new geopolitical risks, could have a material adverse effect on our business and operations. |
| · | Threats to Free Trade Agreements: Historical growth in the automotive industry has been aided by the free movement of goods, services, people and capital through bilateral and regional trade agreements, particularly in North America pursuant to the North American Free Trade Agreement (1994 – 2020) and the United States-Mexico-Canada Agreement ["USMCA"] (2020 – Present). Measures implemented by the current U.S administration have created an unpredictable trade environment by imposing or expanding tariffs, and in some cases, modifying or suspending some of the tariffs recently imposed. The overall climate of trade and tariff unpredictability presents a number of challenges for the entire automotive supply chain, including: |
| · | Disruption of integrated supply chains – U.S. tariff and trade policies risk disrupting integrated global and regional automotive supply chains, given the stated aim of repatriating manufacturing to the U.S. Continuing uncertainty appears to be impacting OEM production/footprint decision-making and presents industry-wide challenges with planning, forecasting and efficient capital allocation. |
| · | Input costs – U.S. tariffs, together with retaliatory measures, risk increasing our input costs, the prices paid by our customers for our products, as well as the price consumers pay for vehicles. Significant or sustained unmitigated tariff cost increases which are not recovered from our customers could have a material adverse effect on our profitability. |
| · | Vehicle affordability – to the extent tariffs erode vehicle affordability, consumer demand for vehicles may decline, prompting a reduction in vehicle production volumes, which is a material driver of our operations, sales and profitability. |
| · | International Trade Disputes: International trade disputes could, among other things, reduce demand for and production of vehicles, disrupt global supply chains, distort commodity pricing, impair the ability of automotive suppliers and vehicle manufacturers to make efficient long-term investment decisions, create volatility in relative foreign exchange rates, and contribute to stock market volatility. The imposition of sanctions, tariffs and/or the escalation of trade disputes which interfere with automotive supply chains could have an adverse effect on our operations, profitability and ability to effectively execute our corporate strategy. |
| · | Planning and Forecasting Challenges: Macroeconomic and geopolitical uncertainty, together with unpredictable government policy-making, including with respect to trade and tariffs, continue to present operational planning and forecasting challenges for OEMs, Tier 1 suppliers, and other automotive suppliers. In recent years, OEMs have taken actions such as: unplanned shutdowns of production lines and/or plants; reductions in their vehicle production plans; and changes to their product mix. Such OEM actions can result in a number of direct and indirect consequences for automotive suppliers like Magna, including: lower sales; significant production inefficiencies resulting from our production lines being stopped/restarted unexpectedly; and unrecoverable costs and changes, including from sub-suppliers that have been adversely affected by production inefficiencies. If prolonged, the occurrence/recurrence of any such actions could have a material adverse effect on our operations, sales and profitability. Additionally, planning and forecasting uncertainty could result in greater variability between market expectations and our actual financial and operating results which, in turn, could increase volatility in our stock price. |
| · | Interest Rates: Key consumer borrowing rates in North America and Europe remain elevated compared to levels experienced prior to 2020. The availability and cost of credit are both factors affecting consumer confidence, which is a critical driver of vehicle sales and thus automotive production. A material, sustained decrease in consumer demand for vehicles could result in reductions to vehicle production from levels assumed in our business plan, which could have a material adverse effect on our profitability and financial condition. Higher interest rates will also have an adverse effect on our borrowing costs and, if prolonged, could have an adverse effect on our profitability. |
RISKS RELATED TO THE AUTOMOTIVE INDUSTRY
| · | Pace of EV Adoption: Although the number of EVs sold globally continues to grow, the rate of growth has moderated in some markets due to consumer hesitancy related to issues such as: vehicle affordability; reduced availability of government rebates for the purchase of EVs; concerns regarding evolving battery technologies; anxiety regarding driving range; inadequacy of charging infrastructure; new EV OEMs and models with little or no operating and warranty history; and rapid depreciation and deterioration in residual values for EVs. If planned production volumes for EV programs do not materialize, we may not be able to recover our capital investments related to such programs, or to recover such investments within the timeframes contemplated, which could have a material adverse effect on our profitability and financial condition. |
26 Magna International Inc. Annual Report 2025
| · | North American EV Program Deferrals, Cancellations and Volume Reductions: Certain OEMs, primarily in North America, continue updating their EV strategies by deferring or cancelling planned EV programs and/or reducing production volumes below the levels at which we previously quoted. We are pursuing commercial recoveries from our customers as a result of these actions, but we may be unable to fully recover various pre-production, tooling, engineering, and other costs incurred in advance of production, or unable to recover them within the timeframe originally contemplated in our business plan. We may also experience production inefficiencies, including as a result of unutilized or underutilized production capacity and/or disruptions to our workforce plans at affected facilities. The deferral or cancellation of EV programs, or reduction in planned production volumes, combined with the failure to secure commercial recoveries from our customers to fully offset associated costs and inefficiencies, may have a material adverse effect on our profitability. |
| · | Economic Cyclicality: Ordinarily, the global automotive industry is cyclical, with potential for regional differences in the timing of expansion and contraction of economic cycles. In normal industry cycles, lower consumer confidence typically translates to lower vehicle sales and production volumes. Examples of factors which often reduce consumer confidence include: worsening economic, political, and other conditions; consumer perceptions and general trends related to the job, housing, and stock markets; military conflict; increasing inflation (particularly fuel and energy prices); and rising interest rates. A significant decline in vehicle production volumes from levels assumed in our business plan could have a material adverse effect on our profitability and financial condition. |
| · | Regional Production Volumes: North America, Europe and China are key automotive producing regions for us, and our operating results are primarily dependent on car and light truck production by our customers in these regions. A significant or sustained decline in vehicle production volumes in any or all these geographic regions could have a material adverse effect on our operations, sales, and profitability. |
| · | Deteriorating Vehicle Affordability: Higher vehicle prices continue to create affordability challenges for consumers. Factors contributing to higher vehicle prices include: tariffs; costs related to advanced electronic systems; elevated vehicle finance costs; increased commodity costs; and changes in relative foreign exchange rates. A material, sustained decrease in consumer demand for vehicles due to deteriorating vehicle affordability could result in reductions to vehicle production from levels assumed in our business plan, which could have a material adverse effect on our profitability and financial condition. |
| · | Intense Competition: The automotive supply industry is highly competitive. Some of our competitors have higher or more rapidly growing market share than we do in certain product or geographic markets. Additionally, a number of established electronics and semiconductor chip companies have entered or expanded their presence in the automotive industry. At the same time, disruptive technology innovators continue introducing novel product and service solutions which traditional automotive suppliers may not be able to match. Failure to successfully compete with existing or new competitors could affect our ability to fully implement our corporate strategy. |
STRATEGIC RISKS
| · | Evolution of the Vehicle: The success of our corporate strategy is correlated to our ability to grow our business and capabilities in product areas which demonstrate long-term growth. Some systems in our product portfolio are expected to decline over the long-term, including manual transmissions, mechanical all-wheel drive/four-wheel drive systems and fuel tank systems. The failure to grow our sales of higher growth products at or above the industry rates of growth for such products could have a material adverse effect on our profitability and financial condition. |
| · | Evolving Business Risk Profile: The risk profile of our business continues to evolve due to our exposure to product areas such as battery enclosures, electrified powertrains, advanced driver assistance systems ["ADAS"] and electronics. As a result, we may face new or heightened risks, including: forecasting, planning and capital allocation risks due to uncertainties regarding the shift from internal combustion engine ["ICE"] to EV production volumes; take-rates for ADAS systems and/or features offered to consumers as optional items; reduction in demand for certain products which are unique to ICE vehicles; challenges in quoting for profitable returns on products with leading-edge technologies; rigorous testing and validation requirements from OEM customers for complex new products; increased warranty and recall risks on new products and leading-edge technologies; increased product liability risks; increased counterparty risk; heightened risk of technological obsolescence of some of our products, processes and/or assets; and difficulties in attracting or retaining employees with critical skills in high-demand areas. Realization of one or more such risks could have a material adverse effect on our operations, profitability, or financial condition. |
| · | Technology and Innovation: While we continue to invest in technology and innovation which we believe will be critical to our long-term growth, the automotive industry is experiencing significant electrical, electronic, and software-driven change and disruption. Our ability to anticipate changes in technology and to successfully develop and introduce new and enhanced products and/or manufacturing processes on a timely basis will be significant factors in our ability to remain competitive. Additionally, our success is dependent on our ability to attract, develop and retain employees with the required technical and/or software skills. If we are unsuccessful or are less successful than our competitors in consistently developing innovative products and/or processes, we may be placed at a competitive disadvantage in bidding for new business and may not be able to recover some or all our engineering, research, and development costs, which could have a material adverse effect on our profitability, financial condition, and ability to fully implement our corporate strategy. |
Magna International Inc. Annual Report 2025 27
| · | Investments in Mobility and Technology Companies: In addition to our development activities, we have invested in various mobility and technology companies, as well as funds that invest in such companies, and may continue to do so in the future. However, investing in such companies involves a high degree of risk, including the potential loss of some or all of our investment value and/or supply continuity risks to the extent we have supply relations with them. There is currently no public market for the shares or units of some of these investments and, as a result, we may be unable to monetize such investments in the future. In some cases, we may have equity in technology-driven suppliers with which we have commercial supply relations; while the value of such equity may be affected by the commercial prospects of such programs, our ability to exit our investments may be impaired by the existence of our commercial supply relationship. Investments in companies or funds which are currently or subsequently become publicly traded are "marked-to-market" quarterly, which may result in us recording unrealized gains or losses in any given quarter. The realization of any of the foregoing investment-related risks could have an adverse effect on our profitability and financial condition. |
CUSTOMER-RELATED RISKS
| · | Customer Concentration: Although we supply parts to all major OEMs, a significant majority of our sales are to six customers: General Motors, Mercedes-Benz, Ford, BMW, Volkswagen and Stellantis. Additionally, growth rates of OEMs differ by region and segment, with significant growth by some EV-focused OEMs in certain markets, such as China. Shifts in market share away from our top customers could have a material adverse effect on our profitability to the extent we are unable to offset such lost sales with sufficient sales growth to alternative OEMs. |
| · | Market Shifts: While we supply parts for a wide variety of vehicles produced globally, we do not supply parts for all vehicles produced, nor is the number or value of parts evenly distributed among the vehicles for which we do supply parts. Additionally, in recent years, we have experienced a concentration in content on certain EV models. Shifts in market shares away from vehicles on which we have significant content, as well as vehicle segments in which our sales may be more heavily concentrated, could have a material adverse effect on our sales and profitability. |
| · | Growth of Chinese OEMs: A number of China-based OEMs ["COEMs"], including BYD, Chery, GAC, Geely, Huawei, Nio, Xiaomi, and XPeng, have demonstrated significant commercial success in China in recent years and some are seeking to export vehicles to, or localize production in, Europe. While we are targeting growth with some of these COEMs, we may not have relationships with them which are as well established as those with our traditional customers. The failure to sufficiently grow our sales to those COEMs which achieve significant commercial success could adversely impact our long-term strategy. Additionally, to the extent COEMs win market share from our traditional customers, our profitability may be adversely affected if we are unable to offset lost sales by winning business with such COEMs or on alternative programs with sufficient volumes and margins. |
| · | Dependence on Outsourcing: We depend on outsourcing by OEMs, including the outsourcing of complete vehicle assembly to our contract vehicle manufacturing business. The extent of such outsourcing is based on a number of factors, including: the cost, quality, and timeliness of outsourced production relative to in-house production by an OEM; the degree of unutilized capacity at an OEM's facilities; collective bargaining agreements and labour relations between OEMs and labour unions; impact of tariffs on OEMs' manufacturing footprints; and other factors. Currently, many OEMs have excess vehicle assembly capacity, particularly in Europe and China. Additionally, since EVs have fewer components than vehicles with internal combustion engines, some OEMs may insource production of certain components or systems to maintain employment levels committed to in collective bargaining agreements and/or in connection with government incentives. A reduction in outsourcing by OEMs, or the loss of any material production or assembly programs combined with the failure to secure alternative programs with sufficient volumes and margins, could have a material adverse effect on our profitability. |
| · | Consumer Take Rate Shifts: Shifts in consumer preferences may impact "take rates" for certain types of products we sell. Examples of such products include: all-wheel drive systems; power liftgates; active aerodynamics systems; ADAS; and complete vehicles with certain option packages or option choices. Where shifts in consumer preferences result in higher "take rates" for products that we do not sell or for products we sell at a lower margin, our profitability may be adversely affected. |
| · | Customer Purchase Orders: Contracts from our customers consist of blanket purchase orders which generally provide for the supply of a customer's annual requirements rather than a specific quantity of products and can be terminated by a customer at any time. We may have various tooling, engineering, dedicated program capital, and other costs incurred in advance of production which cannot be easily recovered from our customers if a purchase order is terminated and/or if forecast production volumes fail to materialize within the timeframe contemplated in our business plan. We may also experience production inefficiencies, including as a result of unutilized or underutilized production capacity and/or disruptions to our workforce plans at facilities affected by the cancellation or reduction of production volumes. The failure to secure commercial recoveries from customers to offset such costs and other operating inefficiencies may have a material adverse effect on our profitability. |
28 Magna International Inc. Annual Report 2025
| · | Potential OEM Production-Related Disruptions: Any significant OEM production disruptions, including as a result of labour unrest at customer or sub-supplier facilities, parts shortages, or natural disasters, would lead to disruptions to our production, which could have a material adverse effect on our sales and profitability. |
SUPPLY CHAIN RISKS
| · | Supply Base: We rely on a number of suppliers to supply us with a wide range of components required in connection with our business. The financial health of automotive suppliers is impacted by a number of factors, including economic conditions and production volumes. A significant worsening of economic conditions or reduction in production volumes could deteriorate the financial condition of our supply base, which could lead to, among other things: disruptions in the supply of critical components to us or our customers; and/or temporary shutdowns of our production line(s) or the production line(s) of our customers. The occurrence of any such factors could have a material adverse effect on our profitability. |
| · | Supplier Claims: Input cost increases, shortfalls in vehicle production volumes, program deferrals or cancellations, intellectual property claims, tariff costs, and other factors could give rise to commercial or legal cost recovery claims against us by our suppliers, which could have an adverse effect on our profitability. |
| · | Supply Chain Disruptions: OEMs and Tier 1 automotive suppliers may experience supply disruptions, constraints and/or price increases on critical manufacturing inputs (including semiconductor chips), for a number of different reasons, including: competing demand from non-automotive sectors; government regulation or intervention; trade and tariff disputes; geopolitical and/or military conflict; interruption of shipping or other transportation routes; natural catastrophes; labour disruptions; shortages of parts and/or materials; intellectual property claims; and pandemics. Supply chain disruptions which prevent us from the timely supply of products to our customers could result in a range of potential adverse consequences, including: unrecoverable price increases; elevated, unrecoverable costs such as those for premium freight or re-sourcing of supply; penalties, business interruption claims, or other commercial claims by our customers and suppliers; loss of future business; and reputational damage. The impacts of prolonged supply chain disruptions or constraints could have a material adverse effect on our operations and profitability. |
| · | Regional Energy Supply and Pricing: Regional energy supplies have from time to time been disrupted due to geopolitical and military conflict, supply/demand imbalances, government regulation, severe weather events, and challenges related to the transition to renewable energy generation. Unforeseen supply disruptions, demand spikes, prolonged energy disruptions and/or significant energy price increases could have a material adverse effect on our operations and profitability. |
MANUFACTURING / OPERATIONAL RISKS
| · | Product Launch: The launch of production is a complex process, the success of which depends on a wide range of factors, including: the timing and frequency of design changes by our customers relative to the start of production; product maturity and complexity; production readiness of our own, as well as our customers' and suppliers' manufacturing facilities; robustness of manufacturing and validation processes; launch volumes; quality and production readiness of tooling and equipment; sufficiency of skilled employees; and initial product quality. Failure by us to successfully launch a new product or complete vehicle could result in commercial or litigation claims against us which could have a material adverse effect on our profitability. Additionally, a significant product or program launch failure could adversely affect our reputation, future business prospects with one or more customers, and/or ability to execute our corporate strategy. |
| · | Operational Underperformance: From time to time, we may have operating divisions which are not performing at expected levels of profitability. The size and complexity of automotive manufacturing operations often makes it difficult to achieve a quick turnaround of underperforming divisions. Significant or prolonged underperformance at any of our operating divisions could have a material adverse effect on our profitability and operations. |
| · | Restructuring Costs: We may sell some product lines and/or downsize, close, or sell some of our operating divisions. By taking such actions, we will incur restructuring, downsizing and/or other significant non-recurring costs. These costs may be higher in some countries than others and could have a material adverse effect on our profitability. |
| · | Impairments: We have recorded significant impairment charges related to equity interests in joint ventures, goodwill, and long-lived assets in the past and may do so again in the future. The occurrence of any of a number of potential scenarios could result in indicators of impairment, including: the early termination, loss, renegotiation of the terms of, or delay in the implementation of, any significant production contract; the technological obsolescence of any of our products or production assets; production volumes that are lower than expected; and the insolvency of a customer. In conducting our impairment analysis, we make forward-looking assumptions regarding: the impact of turnaround plans on underperforming operations; new business opportunities; program price and cost assumptions on current and future business; the timing and success of new program launches; and forecast production volumes. To the extent such forward-looking assumptions are not met, any resulting impairment loss could have a material adverse effect on our profitability. |
| · | Skilled Labour Attraction/Retention: Our business is based on successfully attracting, developing, and retaining employees at all levels of the company from "shopfloor" to Executive Management. The markets for highly skilled workers, as well as talented professionals and leaders in our industry are extremely competitive, particularly in the major global automotive and technology centres in which many of our operations are located. The inability to meet our needs for skilled workers and talented professionals and leaders, whether through recruitment or internal training and development activities could impact our ability to profitably conduct business and/or effectively implement our corporate strategy. |
Magna International Inc. Annual Report 2025 29
PRICING RISKS
| · | Quote/Pricing Assumptions: The time between award of new production business and start of production typically ranges between two and four years. Since product pricing is typically determined at the time of award, we are subject to significant pricing risk due to changes in input costs, tariff costs, variance in production volumes, and other quote assumptions from the time of award through the start of production. The inability to quote effectively, or the occurrence of a material change in input costs, tariff costs, production volumes, or other quote assumptions between program award and production, could have a material adverse effect on our profitability. |
| · | Customer Pricing Pressure/Contractual Arrangements: We face ongoing pricing pressure from OEMs, including through: quoting pre-requirements; long-term supply agreements with mutually agreed price reductions over the life of the agreement; non-contractual annual price concession demands; pressure to absorb costs related to product design, engineering and tooling, and/or amortize such costs through the piece price for the product; pressure to assume incremental warranty costs; and OEM refusal to fully offset inflationary price increases and/or tariff costs. OEMs possess significant leverage over their suppliers due to their purchasing power and the highly competitive nature of the automotive supply industry. As a result of the broad portfolio of parts we supply to our largest OEM customers, such customers may be able to exert greater leverage over us as compared to our competitors. We attempt to offset price concessions and costs in a number of ways, including through commercial negotiations with our customers, improved operating efficiencies and cost reduction efforts. Our inability to fully offset and/or fully recover any such incremental costs over the life of production could have a material adverse effect on our profitability. Moreover, while we attempt to negotiate contractual terms with our suppliers that align with the contractual terms between us and our OEM customers, we may not always be successful in doing so. Any such gaps between our customer and supplier contract terms could, in certain circumstances, have an adverse effect on our profitability. |
| · | Commodity Price Volatility: Prices for certain key raw materials and commodities used in our parts, including steel, aluminum, resin, and energy can be volatile. In some cases, our risk is mitigated because we purchase steel, aluminum, and to a more limited extent, resin under customer resale programs. Where such commodity purchases are not made under customer resale programs, we seek to offset commodity price increases by: passing such increases to our customers; engineering products with reduced commodity content; implementing hedging strategies; or otherwise. To the extent we are unable to offset commodity price increases, such additional commodity costs could have an adverse effect on our profitability. |
| · | Scrap Steel/Aluminum Price Volatility: Some of our manufacturing facilities generate a significant amount of engineered scrap steel and/or aluminum in their manufacturing processes but recover some of the value through the sale of such scrap. Scrap steel and scrap aluminum prices can also be volatile and do not necessarily move in the same direction as steel or aluminum prices. Declines in scrap steel/aluminum prices from time to time could have an adverse effect on our profitability. |
WARRANTY / RECALL RISKS
| · | Repair/Replacement Costs: We are responsible for the repair and replacement costs associated with any defective products that we supply to our customers. Certain of our products, such as transmissions and battery enclosures, typically have a higher unit and labour service cost in the event of replacement. Other products, such as cameras, radars and side door latches, are supplied in multiples of two or four for a single vehicle, which could result in significant cost in the event all such products need to be replaced. OEMs and/or government regulators can initiate recalls of safety or regulated products, which could place us at risk for the administrative costs of the recall in addition to the repair/replacement costs of defective products, even in situations where we dispute the need for a recall or the responsibility for any alleged defect. The obligation to repair or replace defective products could have a material adverse effect on our operations and profitability. To the extent such obligation arises as a result of a product recall, we may face reputational damage, and the combination of administrative and repair/replacement costs could have a material adverse effect on our profitability. |
| · | Warranty Provisions: In certain circumstances, we are at risk for warranty, product liability and recall costs. We are currently experiencing increased customer pressure to assume greater warranty responsibility. Certain customers seek to impose partial responsibility for warranty costs where the underlying root cause of a product or system failure cannot be determined, or where the root cause is disputed, as in the case of the Ford warranty claim disclosed in Note 24, "Contingencies" of our consolidated financial statements. Warranty provisions for our products are based on our best estimate of the amounts necessary to settle existing or probable claims related to product defects. Warranty claims which exceed warranty provisions could have a material adverse effect on our profitability. In addition, warranty provisions for our powertrain systems, electronics and complete vehicle programs are also established based on our or our customers' warranty experience with the applicable type of product and, in some cases, the terms in the applicable customer agreements. Actual warranty experience which results in costs that exceed our warranty provisions, could have a material adverse effect on our profitability. |
| · | Product Liability: We cannot guarantee that the design, engineering, testing, validation, and manufacturing measures we employ to ensure high-quality products will be completely effective, particularly as electronic content and product complexity increases and/or as we enter newer product areas such as e-Drives or ADAS. If our products fail to perform as expected or as required by governmental regulations, and/or to the extent any such failure results in, or is alleged to result in, bodily injury and/or property damage or other losses, our customers or government regulators may initiate a product recall of such products and/or third party product liability claims may be brought against us. The defense of product liability claims, particularly class action claims in North America, may be costly and judgements against us could impair our reputation and have a material adverse effect on our profitability. |
30 Magna International Inc. Annual Report 2025
IT SECURITY / CYBERSECURITY RISKS
| · | IT/Cybersecurity Breach: Although we have established and continue to enhance security controls intended to protect our IT systems and infrastructure, there is no guarantee that such security measures will be effective in preventing unauthorized physical access or cyber-attacks. A significant breach of our IT systems could: result in theft of funds; cause disruptions in our manufacturing operations; lead to the loss, destruction, or inappropriate use of sensitive data, including employees' personal data; or result in theft of our, our customers' or our suppliers' intellectual property or confidential information. The occurrence of any of the foregoing could adversely affect our operations and/or reputation and could lead to claims against us that could have a material adverse effect on our profitability. |
| · | Product Cybersecurity: The risk of vehicle cyber-attacks has risen with the proliferation of technology designed to connect vehicles to external networks. Although vehicle and systems-level cybersecurity controls and protections are typically managed and/or specified by our OEM customers, we cannot provide assurance that such controls and protections will be effective in preventing cyber intrusion through one of our products. Furthermore, an OEM customer may still seek to hold us financially responsible, even where the OEM specified the cybersecurity controls and protections. Any such cyber intrusion could cause reputational damage and lead to claims against us that have an adverse effect on our profitability. |
OTHER BUSINESS RISKS
| · | Joint Ventures: We conduct certain of our operations through joint ventures with contractual arrangements under which we share management responsibilities with our joint venture partner(s). Joint venture operations carry a range of risks, including those relating to: failure of our joint venture partner(s) to satisfy contractual obligations; potential conflicts between us and our joint venture partner(s); strategic objectives of joint venture partners that may differ from our own; potential delays in decision-making; a limited ability to implement some or all of our policies, practices and controls, or to control legal and regulatory compliance, within the joint venture(s); and other risks inherent to non-wholly-owned operations. The likelihood of such occurrences and their potential effect on us varies depending on the joint venture arrangement, however, the occurrence of any such risks could have an adverse effect on our operations, profitability, and reputation. |
| · | Intellectual Property: We own intellectual property that is important to our business and product portfolio. Our intellectual property is an important factor in protecting our innovation activities and maintaining our competitive advantage. From time to time, our intellectual property rights may be challenged, including through the assertion of intellectual property infringement claims which could result in us: being prevented from producing and selling certain products; having to license the infringed product/technology; and/or incurring monetary damages. The foregoing consequences could have an adverse effect on our sales, profitability, and ability to fully implement our corporate strategy. |
| · | Risks of Doing Business in Foreign Markets: Conducting business in markets outside our traditional markets of North America and Europe carries a number of potential risks, including those relating to: political, civil and economic instability and uncertainty; military conflict; corruption risks; high inflation and our ability to recover inflation-related cost increases; trade, customs and tax risks; potential sanctions and export control risk; expropriation risks; currency exchange rates; currency controls; limitations on the repatriation of funds; insufficient infrastructure; competition to attract and retain qualified employees; and other risks associated with conducting business internationally. The likelihood of such occurrences and their potential effect on us vary from country to country and are unpredictable, however, the occurrence of any such risks could have an adverse effect on our operations, profitability, and financial condition. |
| · | Tax Risks: At any given time, we may face tax exposures arising out of changes in tax or transfer pricing laws (including changes to the enforcement or interpretation of existing laws), adverse court rulings, tax reassessments or otherwise. To the extent we cannot implement measures to offset these exposures, they may have an adverse effect on our profitability. We have incurred losses in some countries which we may not be able to fully or partially offset against income we have earned in those countries. In some cases, we may not be able to utilize these losses at all if we cannot generate profits in those countries and/or if we have ceased conducting business in those countries altogether. Our inability to utilize tax losses could adversely affect our profitability. |
| · | Relative Foreign Exchange Rates: Our profitability is affected by movements of our U.S. dollar reporting currency against the Canadian dollar, the euro, the Chinese renminbi, and other currencies in which we generate revenues and incur expenses. Significant long-term fluctuations in relative currency values, in particular a significant change in the relative values of the U.S. dollar, Canadian dollar, euro, or Chinese renminbi, could have an adverse effect on our profitability and financial condition, and any sustained change in such relative currency values could adversely impact our competitiveness in certain geographic regions. |
Magna International Inc. Annual Report 2025 31
| · | Returns on Capital Investments: In recent years, we have invested significant amounts of money in our business through capital expenditures to support new facilities, expansion of existing facilities, purchases of production equipment and acquisitions. Returns achieved on such investments in the past are not necessarily indicative of the returns we may achieve on future investments, and our inability to achieve returns on future investments which equal or exceed returns on past investments could have a material adverse effect on our level of profitability. |
| · | Financial Flexibility: The occurrence of an economic shock not contemplated in our business plan, a rapid deterioration of conditions or a prolonged recession could result in the depletion of our cash resources, which could have a material adverse effect on our operations and financial condition. |
| · | Credit Ratings Changes: There is no assurance that any credit rating currently assigned to us will remain in effect for any period of time or that any rating will not be revised or withdrawn entirely by a rating agency in the future. A downgrade in the credit ratings assigned to us or our industry by one or more agencies could increase our cost of borrowing or impact our ability to negotiate loans, which could have an adverse effect on our profitability, financial condition, and the trading price of our Common Shares. |
| · | Stock Price Fluctuation: Trading prices of our Common Shares cannot be predicted and may fluctuate significantly due to a variety of factors, many of which are outside of our control. |
LEGAL, REGULATORY AND OTHER RISKS
| · | Legal and Regulatory Proceedings: From time to time, we may become involved in regulatory proceedings, or become liable for legal, contractual, and other claims by various parties, including customers, suppliers, former employees, class action plaintiffs and others. Depending on the nature or duration of any potential proceedings or claims, we may incur substantial costs and expenses, be required to devote significant management time and resources to the matters and suffer reputational damage. On an ongoing basis, we attempt to assess the likelihood of any adverse judgements or outcomes to these proceedings or claims, although it is difficult to predict final outcomes with any degree of certainty. Except as disclosed from time to time in our consolidated financial statements and/or our MD&A, we do not believe that any of the proceedings or claims to which we are currently a party will have a material adverse effect on our profitability; however, we cannot provide any assurance to this effect. |
| · | Changes in Laws: A significant change in the current regulatory environment in our principal markets, including: changes in laws or the enforcement or interpretation of existing laws; the imposition of tariffs and trade barriers; stricter regulatory approaches to CO2 emissions, software and data privacy; sourcing of electronics components; and access to rare earth minerals; and other laws which impose additional costs on automotive manufacturers or consumers, could have an adverse effect on our profitability. |
32 Magna International Inc. Annual Report 2025