
Magna International Inc.
First Quarter Report
2026
.2
Magna International Inc.
First Quarter Report
2026
MAGNA INTERNATIONAL INC.
Management's Discussion and Analysis of Results of Operations and Financial Position
Unless otherwise noted, all amounts in this Management's Discussion and Analysis of Results of Operations and Financial Position ["MD&A"] are in U.S. dollars and all tabular amounts are in millions of U.S. dollars, except per share figures, which are in U.S. dollars. When we use the terms "we", "us", "our" or "Magna", we are referring to Magna International Inc. and its subsidiaries and jointly controlled entities, unless the context otherwise requires.
This MD&A should be read in conjunction with the unaudited interim consolidated financial statements for the three months ended March 31, 2026 included in this Quarterly Report, and the audited consolidated financial statements and MD&A for the year ended December 31, 2025 included in our 2025 Annual Report to Shareholders.
This MD&A may contain statements that are forward looking. Refer to the "Forward-Looking Statements" section in this MD&A for a more detailed discussion of our use of forward-looking statements.
This MD&A has been prepared as at April 30, 2026.
HIGHLIGHTS
Comparing the first quarters of 2026 and 2025:
| · | Global light vehicle production decreased 7%, including 4%, 4% and 12% lower production in North America, Europe and China, respectively. |
| · | Total sales increased 3% to $10.4 billion, largely reflecting the strengthening of currencies against the U.S. dollar and the launch of new programs, partially offset by the end of production of certain programs, lower global light vehicle production, and lower complete vehicle assembly sales. |
| · | Income from operations before income taxes decreased by $138 million to $87 million, largely reflecting a loss on assets held for sale related to the pending disposals of our Lighting and Rooftop Systems businesses. Adjusted EBIT(1) increased 58% to $558 million, reflecting the benefits of operational excellence and other cost-savings initiatives, higher equity income, lower warranty costs, and net transactional foreign exchange gains, partially offset by lower earnings on lower local currency sales including engineering revenue, and higher net tariff costs. |
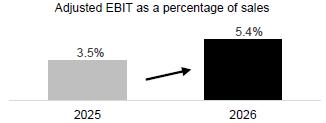
| · | Adjusted EBIT as a percentage of sales(1) increased 190 basis points to 5.4%. |
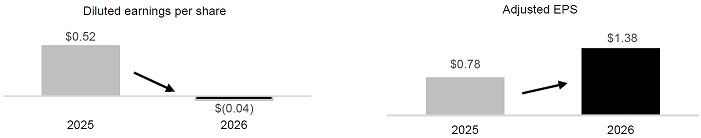
| · | Diluted loss per share was $0.04, compared to diluted earnings per share of $0.52 last year, and Adjusted EPS(1) was $1.38, up 77% from last year. The increase in Adjusted EPS was mainly due to higher Adjusted EBIT. |
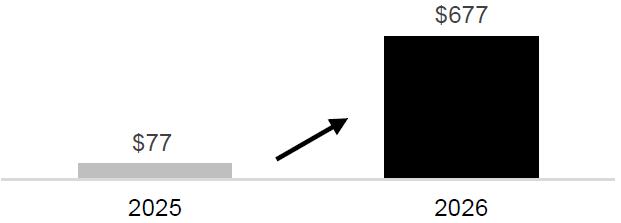
| · | Cash from operating activities increased $600 million to $677 million. |
In addition, during this period, we:
| · | Announced the sale of our Lighting and Rooftop Systems businesses within the Power & Vision segment, with closing expected in the second half of 2026; |
| · | Returned $575 million to shareholders, including $440 million in share repurchases and $135 million in dividends; |
| · | Launched a second electric vehicle model for Guangzhou Automobile Group Co. ("GAC"), a China-based OEM, in our Complete Vehicle assembly facility in Graz, Austria; and |
| · | Were recognized by Ethisphere as one of the World's Most Ethical Companies for 2026, the fifth consecutive year we have received this recognition. |
1 Adjusted EBIT, Adjusted EBIT as a percentage of sales, and Adjusted EPS are Non-GAAP financial measures. Refer to the section "Use of Non-GAAP Measures".
| Magna International Inc. First Quarter Report 2026 | 1 |
OVERVIEW
OUR BUSINESS
Magna is one of the world's largest automotive suppliers and a trusted partner to automakers in the industry's most critical markets—North America, Europe, and China. With a global team and footprint spanning 28 countries, we bring unmatched scale, trusted reliability, and proven execution. Backed by nearly seven decades of experience, we combine deep manufacturing expertise with innovative vehicle system technologies to deliver performance, safety, and quality. For further information about Magna (NYSE:MGA; TSX:MG), please visit www.magna.com or follow us on social.
INDUSTRY TRENDS & RISKS
Our business and operating results are dependent on light vehicle production by our customers in three key regions – North America, Europe, and China. While we supply systems and components to many original equipment manufacturers ["OEMs"] globally, we do not supply systems and components for every vehicle, nor is the value of our content consistent from one vehicle to the next. As a result, customer and program mix relative to market trends, as well as the value of our content on specific vehicle production programs, are also important drivers of our results.
Ordinarily, OEM production volumes are aligned with vehicle sales levels and thus affected by changes in such levels. Aside from vehicle sales levels, production volumes may be impacted by a range of factors, including: geopolitical factors, such as military conflicts and tariffs; supply chains, including disruption to supply of and/or increased costs of steel, aluminum, resins, and energy supplies, as well as semiconductor and memory (DRAM) chips; OEM, supplier or sub-supplier disruptions; relative currency values; commodity prices; infrastructure; labour disruptions, as well as the availability and relative cost of skilled labour; regulatory frameworks; and other factors.
Overall vehicle sales levels are significantly affected by changes in consumer confidence levels, which may in turn be impacted by consumer perceptions and general trends related to the job, housing, and stock markets, as well as other macroeconomic and political factors. Other factors which may impact vehicle sales levels and thus production volumes include: vehicle affordability; interest rates and/or availability of credit; fuel and energy prices; relative currency values; and considerations applicable to EVs, including EV range, charging infrastructure, electricity pricing, and availability of government rebates.
While the foregoing economic, political and other factors are part of the general context in which the global automotive industry operates, there are a number of significant industry trends that are shaping the future of the industry and creating opportunities and risks for automotive suppliers. We continue to implement a business strategy which is rooted in our best assessment as to the rate and direction of change in the automotive industry. Our short and medium-term operational success, as well as our ability to create long-term value through our business strategy, are subject to a number of risks and uncertainties. Significant industry trends, our business strategy and the major risks we face, are discussed in our Annual Information Form ["AIF"] and Annual Report on Form 40-F ["Form 40-F"] in respect of the year ended December 31, 2025, together with subsequent filings. Those industry trends and risk factors remain substantially unchanged in respect of the first quarter ended March 31, 2026.
| 2 | Magna International Inc. First Quarter Report 2026 |
USE OF NON-GAAP FINANCIAL MEASURES
In addition to results presented in accordance with accounting principles generally accepted in the United States of America ["U.S. GAAP"], this MD&A includes the use of Adjusted earnings before interest and taxes ["Adjusted EBIT"], Adjusted EBIT as a percentage of sales, Adjusted diluted earnings per share ["Adjusted EPS"], Adjusted Return on Invested Capital, and Adjusted income taxes [collectively, the "Non-GAAP Measures"]. We believe these Non-GAAP financial measures provide additional information that is useful to investors in understanding our underlying performance and trends through the same financial measures employed by our management. Readers should be aware that Non-GAAP Measures have no standardized meaning under U.S. GAAP and accordingly may not be comparable to the calculation of similar measures by other companies. We believe that Adjusted EBIT, Adjusted EBIT as a percentage of sales, Adjusted EPS, Adjusted Return on Invested Capital, and Adjusted income taxes provide useful information to our investors for measuring our operational performance as they exclude certain items that are not reflective of ongoing operating profit and facilitate a comparison with prior periods. The presentation of any Non-GAAP Measures should not be considered in isolation or as a substitute for our related financial results prepared in accordance with U.S. GAAP. Non-GAAP financial measures are presented together with the most directly comparable U.S. GAAP financial measure, and a reconciliation to the most directly comparable U.S. GAAP financial measure, can be found in the "Non-GAAP Financial Measures Reconciliation" and "Income Taxes" section of this MD&A.
RESULTS OF OPERATIONS
AVERAGE FOREIGN EXCHANGE
| For the
three months ended March 31, | ||||||||||||
| 2026 | 2025 | Change | ||||||||||
| 1 Canadian dollar equals U.S. dollars | 0.730 | 0.697 | + | 5 | % | |||||||
| 1 euro equals U.S. dollars | 1.171 | 1.053 | + | 11 | % | |||||||
| 1 Chinese renminbi equals U.S. dollars | 0.144 | 0.138 | + | 4 | % | |||||||
The preceding table reflects the average foreign exchange rates between the most common currencies in which we conduct business and our U.S. dollar reporting currency.
The results of operations for which the functional currency is not the U.S. dollar are translated into U.S. dollars using the average exchange rates for the relevant period. Throughout this MD&A, reference is made to the impact of translation of foreign operations on reported U.S. dollar amounts where relevant.
Our results can also be affected by the impact of movements in exchange rates on foreign currency transactions (such as raw material purchases, or sales denominated in foreign currencies). However, as a result of hedging programs employed by us, foreign currency transactions in the current period may not have been fully impacted by movements in exchange rates. We record foreign currency transactions at the hedged rate where applicable.
Finally, foreign exchange gains and losses on revaluation and/or settlement of monetary items denominated in a currency other than an operation's functional currency impact reported results. These gains and losses are recorded in selling, general and administrative expense.
LIGHT VEHICLE PRODUCTION VOLUMES
Our operating results are mostly dependent on light vehicle production in the regions reflected in the table below:
Light Vehicle Production Volumes (thousands of units)
| For the
three months ended March 31, | ||||||||||||
| 2026 | 2025 | Change | ||||||||||
| North America | 3,542 | 3,696 | - | 4 | % | |||||||
| Europe | 4,067 | 4,233 | - | 4 | % | |||||||
| China | 6,225 | 7,060 | - | 12 | % | |||||||
| Other | 6,653 | 7,027 | - | 5 | % | |||||||
| Global | 20,487 | 22,016 | - | 7 | % | |||||||
| Magna International Inc. First Quarter Report 2026 | 3 |
RESULTS OF OPERATIONS - FOR THE THREE MONTHS ENDED MARCH 31, 2026
SALES
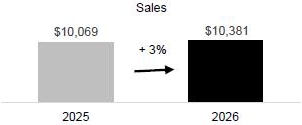
Sales increased 3%, or $312 million, to $10.38 billion for the first quarter of 2026 compared to $10.07 billion for the first quarter of 2025 primarily due to:
| · | the net strengthening of foreign currencies against the U.S. dollar, which increased reported U.S. dollar sales by $520 million; and |
| · | the launch of new programs during or subsequent to the first quarter of 2025. |
These factors were partially offset by:
| · | the end of production of certain programs; |
| · | lower light vehicle production in North America, Europe and China; |
| · | lower complete vehicle assembly volumes with full-cost contractual arrangements; |
| · | lower engineering revenue, primarily in our Complete Vehicles segment; and |
| · | net customer price concessions subsequent to the first quarter of 2025. |
COST OF GOODS SOLD
| For the three months ended March 31, | ||||||||||||
| 2026 | 2025 | Change | ||||||||||
| Material | $ | 6,354 | $ | 6,229 | $ | 125 | ||||||
| Direct labour | 748 | 727 | 21 | |||||||||
| Overhead | 1,856 | 1,871 | (15 | ) | ||||||||
| Cost of goods sold | $ | 8,958 | $ | 8,827 | $ | 131 | ||||||
Cost of goods sold increased $131 million to $8.96 billion for the first quarter of 2026 compared to $8.83 billion for the first quarter of 2025, primarily due to:
| · | the net strengthening of foreign currencies against the U.S. dollar, which increased reported U.S. dollar costs of goods sold by $452 million; |
| · | higher net tariff costs; |
| · | higher commodity costs; and |
| · | higher pre-operating costs incurred at new facilities. |
These factors were partially offset by:
| · | productivity and efficiency improvements, including the benefit of operational excellence initiatives and prior restructuring actions; |
| · | lower material, direct labour, and overhead associated with lower local currency sales; |
| · | lower net engineering costs on lower engineering revenue, primarily in our Complete Vehicles segment; and |
| · | lower warranty costs. |
| 4 | Magna International Inc. First Quarter Report 2026 |
SELLING, GENERAL AND ADMINISTRATIVE ["SG&A"]
SG&A expense increased $18 million to $557 million for the first quarter of 2026 compared to $539 million for the first quarter of 2025, primarily as a result of:
| · | the net strengthening of foreign currencies against the U.S. dollar, which increased SG&A by $30 million; |
| · | higher implementation costs related to operational excellence initiatives; and |
| · | higher incentive and stock-based compensation expense. |
These factors were partially offset by:
| · | higher net transactional foreign exchange gains in the first quarter of 2026 compared to net transactional foreign exchange losses during the first quarter of 2025; and |
| · | lower restructuring costs. |
DEPRECIATION
Depreciation increased $34 million to $403 million for the first quarter of 2026 compared to $369 million for the first quarter of 2025, primarily due to the net strengthening of foreign currencies against the U.S. dollar, which increased depreciation by $19 million; increased capital deployed at new and existing facilities, including to support the launch of programs; and the end of production of certain programs.
AMORTIZATION OF ACQUIRED INTANGIBLE ASSETS
Amortization of acquired intangible assets decreased $7 million to $19 million for the first quarter of 2026 compared to $26 million for the first quarter of 2025 primarily due to the impairment of acquired intangible assets at an Electronics facility in our Power & Vision segment during the fourth quarter of 2025, partially offset by the net strengthening of foreign currencies against the U.S. dollar, which increased amortization of acquired intangible assets by $2 million.
INTEREST EXPENSE, NET
During the first quarter of 2026, we recorded net interest expense of $37 million compared to $50 million for the first quarter of 2025. The $13 million decrease was primarily a result of lower interest expense due to repayment of the $100 million 3-year tranche and $300 million 5-year tranche of the Company's syndicated, unsecured, delayed draw term loan facility; decreased short-term borrowings at lower interest rates; and higher interest income on cash and investments due to increased balances. These factors were partially offset by higher net interest expense on Senior Notes issued during the second quarter of 2025, compared to Senior Notes repaid during the second and third quarter of 2025.
EQUITY INCOME
Equity income increased $75 million to $95 million for the first quarter of 2026 compared to $20 million for the first quarter of 2025, primarily as a result of:
| · | a favourable commercial item within our Power & Vision segment during the first quarter of 2026; |
| · | earnings on higher sales and favourable product mix at certain entities; and |
| · | net productivity and efficiency improvements. |
| Magna International Inc. First Quarter Report 2026 | 5 |
OTHER EXPENSE, NET
| For the
three months ended March 31, | ||||||||
| 2026 | 2025 | |||||||
| Loss on assets held for sale (1) | $ | 485 | $ | — | ||||
| Restructuring activities (2) | 26 | 44 | ||||||
| Investments (3) | (96 | ) | 9 | |||||
| Other expense, net | $ | 415 | $ | 53 | ||||
| (1) | Loss on assets held for sale Sale of Lighting Business |
During the first quarter of 2026, we entered into a definitive agreement to sell our European Lighting business to Mutares SE & Co. KGaA. Under the terms of the agreement, we are required to provide the buyer with an agreed upon amount of funding. Fair value less costs to sell was estimated to be negative $23 million, resulting in an impairment loss of $73 million [$73 million after tax], subject to customary closing adjustments.
During the first quarter of 2026, we committed to a plan to sell our Lighting business in North America, South America, and China. Subsequent to March 31, 2026, we entered into a definitive agreement with AURELIUS Investment Lux Alpha SARL to sell the business. Fair value less costs to sell was estimated to be $66 million, resulting in an impairment loss of $345 million [$312 million after tax], subject to customary closing adjustments and potential earn-out payments.
Sale of Rooftop Systems Business
During the first quarter of 2026, we entered into a definitive agreement to sell our Rooftop Systems business to Mutares SE & Co. KGaA. Under the terms of the agreement, we are required to provide the buyer with an agreed upon amount of funding. Fair value less costs to sell was estimated to be negative $25 million, resulting in an impairment loss of $67 million [$67 million after tax], subject to customary closing adjustments and potential earn-out payments.
These businesses are reported within our Power & Vision segment. The following table summarizes the total impairment loss recognized during the first quarter of 2026:
| Lighting | Rooftop Systems | Total | ||||||||||
| Total asset impairment | $ | 416 | $ | 67 | $ | 483 | ||||||
| Costs to sell incurred during the first quarter of 2026 | 2 | — | 2 | |||||||||
| Total impairment loss | $ | 418 | $ | 67 | $ | 485 | ||||||
| (2) | Restructuring activities |
In the first quarter of 2026, we recorded restructuring charges of $21 million [$20 million after tax] in our Complete Vehicles segment related to rightsizing activities at a facility in Europe, and $5 million [$5 million after tax] in our Power & Vision segment related to plant closures and consolidations at facilities in Europe.
In the first quarter of 2025, we recorded restructuring charges of $33 million [$33 million after tax] in our Complete Vehicles segment related to rightsizing activities at a facility in Europe, and $11 million [$11 million after tax] in our Power & Vision segment related to significant rightsizing activities and plant consolidations at facilities in Europe.
| (3) | Investments |
| For the
three months ended March 31, | ||||||||
| 2026 | 2025 | |||||||
| Net revaluation (gain) loss on public and private equity investments | $ | (110 | ) | $ | 2 | |||
| Non-cash impairment charge | 14 | — | ||||||
| Revaluation loss on public company warrants | — | 8 | ||||||
| Gain on sales of public equity investments | — | (1 | ) | |||||
| Other (income) expense, net | (96 | ) | 9 | |||||
| Tax effect | — | (1 | ) | |||||
| Net (gain) loss attributable to Magna | $ | (96 | ) | $ | 8 | |||
During the first quarter of 2026, we recorded an unrealized gain of $108 million [$108 million after tax] resulting from the revaluation of our existing private equity investment in Waymo LLC ("Waymo") following Waymo's completion of a new financing round. The non-cash impairment charge relates to the impairment of a private equity investment.
| 6 | Magna International Inc. First Quarter Report 2026 |
INCOME FROM OPERATIONS BEFORE INCOME TAXES
Income from operations before income taxes was $87 million for the first quarter of 2026 compared to $225 million for the first quarter of 2025. The $138 million decrease is a result of the following changes, each as discussed above:
| For the
three months ended March 31, | ||||||||||||
| 2026 | 2025 | Change (i) | ||||||||||
| Sales | $ | 10,381 | $ | 10,069 | $ | 312 | ||||||
| Costs and expenses | ||||||||||||
| Cost of goods sold | 8,958 | 8,827 | (131 | ) | ||||||||
| Selling, general & administrative | 557 | 539 | (18 | ) | ||||||||
| Depreciation | 403 | 369 | (34 | ) | ||||||||
| Amortization of acquired intangible assets | 19 | 26 | 7 | |||||||||
| Interest expense, net | 37 | 50 | 13 | |||||||||
| Equity income | (95 | ) | (20 | ) | 75 | |||||||
| Other expense, net | 415 | 53 | (362 | ) | ||||||||
| Income from operations before income taxes | $ | 87 | $ | 225 | $ | (138 | ) | |||||
(i) Change represents the increase (decrease) on Income from operations before income taxes.
INCOME TAXES
| For the three months ended March 31, | ||||||||||||||||
| 2026 | 2025 | |||||||||||||||
| Income taxes as reported | $ | 88 | 101.1 | % | $ | 72 | 32.0 | % | ||||||||
| Tax effect on Other expense, net and Amortization of acquired intangible assets | 36 | (77.3 | ) | 6 | (6.3 | ) | ||||||||||
| Adjusted income taxes | $ | 124 | 23.8 | % | $ | 78 | 25.7 | % | ||||||||
Excluding the tax effect on Other expense, net and Amortization of acquired intangible assets, our effective income tax rate decreased to 23.8% for the first quarter of 2026, compared to 25.7% for the first quarter of 2025, primarily due to a change in mix of earnings, lower losses not benefitted in Europe and the net favourable impact of foreign exchange adjustments recognized for U.S. GAAP purposes on a year-over-year basis. These factors were partially offset by unfavourable changes in our reserves for uncertain tax positions.
INCOME ATTRIBUTABLE TO NON-CONTROLLING INTERESTS
Income attributable to non-controlling interests was $11 million for the first quarter of 2026 compared to $7 million for the first quarter of 2025. The $4 million increase was primarily due to the acquisition of the non-controlling 35% interest in a consolidated subsidiary, which had losses during the third quarter of 2025, prior to the acquisition. This factor was partially offset by lower income at certain entities in China.
NET (LOSS) INCOME ATTRIBUTABLE TO MAGNA INTERNATIONAL INC.
Net (loss) income attributable to Magna International Inc. was a loss of $12 million for the first quarter of 2026 compared to income of $146 million for the first quarter of 2025. This $158 million decrease was as a result of a decrease in income from operations before income taxes of $138 million, an increase in income taxes of $16 million, and an increase in income attributable to non-controlling interests of $4 million.
| Magna International Inc. First Quarter Report 2026 | 7 |
(LOSS) EARNINGS PER SHARE
| For the
three months ended March 31, | ||||||||||||
| 2026 | 2025 | % Change | ||||||||||
| (Loss) earnings per Common Share | ||||||||||||
| Basic | $ | (0.04 | ) | $ | 0.52 | — | ||||||
| Diluted | $ | (0.04 | ) | $ | 0.52 | — | ||||||
| Weighted average number of Common Shares outstanding (millions) | ||||||||||||
| Basic | 278.1 | 282.0 | - | 1 | % | |||||||
| Diluted | 278.1 | 282.0 | - | 1 | % | |||||||
| Adjusted EPS | $ | 1.38 | $ | 0.78 | + | 77 | % | |||||
Diluted loss per share was $0.04 for the first quarter of 2026, compared to diluted earnings per share of $0.52 for the first quarter of 2025. The $0.56 decrease was driven primarily by lower net income attributable to Magna International Inc., as discussed above, and a slight decrease in the weighted average number of diluted shares outstanding as a result of the purchase and cancellation of Common Shares subsequent to the first quarter of 2025, pursuant to our normal course issuer bid, partially offset by the exercise of stock options during the same period.
Other expense, net, and Amortization of acquired intangible assets, each after tax, negatively impacted diluted earnings per share by $1.42 in the first quarter of 2026 and $0.26 in the first quarter of 2025, respectively. Adjusted EPS, as reconciled in the "Non-GAAP Financial Measures Reconciliation" section, was $1.38 for the first quarter of 2026, compared to $0.78 for the first quarter of 2025, an increase of $0.60 or 77%.
| 8 | Magna International Inc. First Quarter Report 2026 |
NON-GAAP PERFORMANCE MEASURES - FOR THE THREE MONTHS ENDED MARCH 31, 2026
ADJUSTED EBIT AS A PERCENTAGE OF SALES
The table below shows the change in Magna's Sales and Adjusted EBIT by segment, as well as the impact each segment's changes had on Magna's Adjusted EBIT as a percentage of sales, for the first quarter of 2026 compared to the first quarter of 2025:
| Sales | Adjusted EBIT | Adjusted EBIT as a percentage of sales | ||||||||||
| First quarter of 2025 | $ | 10,069 | $ | 354 | 3.5 | % | ||||||
| Increase (decrease) related to: | ||||||||||||
| Body Exteriors & Structures | 113 | 44 | + | 0.4 | % | |||||||
| Power & Vision | 235 | 128 | + | 1.2 | % | |||||||
| Seating Systems | 28 | 55 | + | 0.5 | % | |||||||
| Complete Vehicles | (52 | ) | (12 | ) | - | 0.1 | % | |||||
| Corporate and Other | (12 | ) | (11 | ) | - | 0.1 | % | |||||
| First quarter of 2026 | $ | 10,381 | $ | 558 | 5.4 | % | ||||||
Adjusted EBIT as a percentage of sales increased to 5.4% for the first quarter of 2026 compared to 3.5% for the first quarter of 2025 primarily due to:
| · | productivity and efficiency improvements, including the benefit of operational excellence initiatives and prior restructuring actions; |
| · | higher equity income, including a favourable commercial item within our Power & Vision segment during the first quarter of 2026; |
| · | lower warranty costs; |
| · | net transactional foreign exchange gains in the first quarter of 2026, compared to net transactional foreign exchange losses in the first quarter of 2025; and |
| · | net commercial items, which had a favourable impact on a year-over-year basis. |
These factors were partially offset by:
| · | higher net tariff costs; |
| · | lower income on lower engineering revenue; |
| · | reduced earnings on lower local currency sales; and |
| · | net unfavourable product mix. |
| Magna International Inc. First Quarter Report 2026 | 9 |
ADJUSTED RETURN ON INVESTED CAPITAL
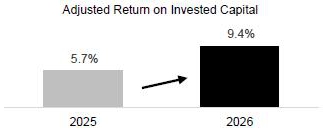
Adjusted Return on Invested Capital increased to 9.4% for the first quarter of 2026, compared to 5.7% for the first quarter of 2025, as a result of an increase in Adjusted After-tax operating profits, and lower Average Invested Capital.
Average Invested Capital decreased $558 million to $18.02 billion for the first quarter of 2026, compared to $18.58 billion for the first quarter of 2025, primarily due to:
| · | long-lived asset impairments during or subsequent to the first quarter of 2025; |
| · | average depreciation expense on fixed assets in excess of average investment in fixed assets; and |
| · | average amortization expense on operating lease right-of-use assets in excess of average investment in operating lease right-of-use assets. |
These factors were partially offset by:
| · | the net strengthening of foreign currencies against the U.S. dollar; |
| · | a decrease in average operating assets and liabilities; and |
| · | higher net investments in public and private equity companies. |
| 10 | Magna International Inc. First Quarter Report 2026 |
SEGMENT ANALYSIS
We are a global automotive supplier that has complete vehicle engineering and contract manufacturing expertise, as well as product capabilities which include body, chassis, exterior, seating, powertrain, active driver assistance, electronics, mechatronics, mirrors, lighting and roof systems. We also have electronic and software capabilities across many of these areas.
Our reporting segments are: Body Exteriors & Structures; Power & Vision; Seating Systems; and Complete Vehicles.
| For the three months ended March 31, | ||||||||||||||||||||||||
| Sales | Adjusted EBIT | |||||||||||||||||||||||
| 2026 | 2025 | Change | 2026 | 2025 | Change | |||||||||||||||||||
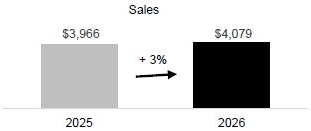
| Body Exteriors & Structures | $ | 4,079 | $ | 3,966 | $ | 113 | $ | 274 | $ | 230 | $ | 44 | ||||||||||||
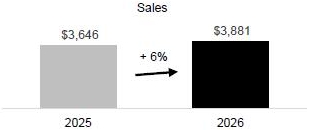
| Power & Vision | 3,881 | 3,646 | 235 | 252 | 124 | 128 | ||||||||||||||||||
| Seating Systems | 1,340 | 1,312 | 28 | 25 | (30 | ) | 55 | |||||||||||||||||
| Complete Vehicles | 1,224 | 1,276 | (52 | ) | 32 | 44 | (12 | ) | ||||||||||||||||
| Corporate and Other | (143 | ) | (131 | ) | (12 | ) | (25 | ) | (14 | ) | (11 | ) | ||||||||||||
| Total reportable segments | $ | 10,381 | $ | 10,069 | $ | 312 | $ | 558 | $ | 354 | $ | 204 | ||||||||||||
BODY EXTERIORS & STRUCTURES
| For the
three months ended March 31, | ||||||||||||||||
| 2026 | 2025 | Change | ||||||||||||||
| Sales | $ | 4,079 | $ | 3,966 | $ | 113 | + | 3 | % | |||||||
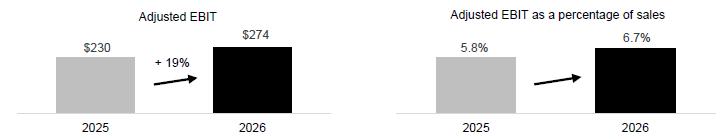
| Adjusted EBIT | $ | 274 | $ | 230 | $ | 44 | + | 19 | % | |||||||
| Adjusted EBIT as a percentage of sales | 6.7 | % | 5.8 | % | + | 0.9 | % | |||||||||
Sales — Body Exteriors & Structures
Sales increased 3%, or $113 million, to $4.08 billion for the first quarter of 2026, compared to $3.97 billion for the first quarter of 2025, primarily due to:
| · | the net strengthening of foreign currencies against the U.S. dollar, which increased reported U.S. dollar sales by $145 million; |
| · | the launch of programs during or subsequent to the first quarter of 2025; and |
| · | net commercial items, which had a favourable impact on a year-over-year basis. |
These factors were partially offset by:
| · | lower light vehicle production in North America, Europe and China; |
| · | the end of production of certain programs; and |
| · | net customer price concessions. |
| Magna International Inc. First Quarter Report 2026 | 11 |
Adjusted EBIT and Adjusted EBIT as a percentage of sales — Body Exteriors & Structures
Adjusted EBIT increased $44 million to $274 million for the first quarter of 2026, compared to $230 million for the first quarter of 2025, and Adjusted EBIT as a percentage of sales increased to 6.7% from 5.8%. These increases were primarily due to:
| · | productivity and efficiency improvements, including the benefit of operational excellence initiatives and prior restructuring actions; |
| · | net commercial items, which had a favourable impact on a year-over-year basis; |
| · | net transactional foreign exchange gains in the first quarter of 2026, compared to net transactional foreign exchange losses |
| · | in the first quarter of 2025; and |
| · | the net strengthening of foreign currencies against the U.S. dollar, which had an $8 million favourable impact on reported |
| · | U.S. dollar Adjusted EBIT. |
These factors were partially offset by:
| · | reduced earnings on lower local currency sales; |
| · | net unfavourable product mix; and |
| · | higher commodity costs partially offset by higher scrap recoveries. |
POWER & VISION
| For the
three months ended March 31, | ||||||||||||||||
| 2026 | 2025 | Change | ||||||||||||||
| Sales | $ | 3,881 | $ | 3,646 | $ | 235 | + | 6 | % | |||||||
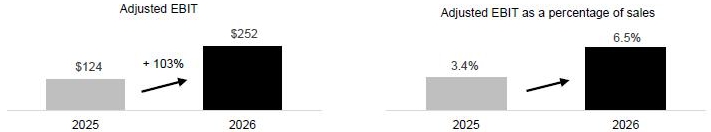
| Adjusted EBIT | $ | 252 | $ | 124 | $ | 128 | + | 103 | % | |||||||
| Adjusted EBIT as a percentage of sales | 6.5 | % | 3.4 | % | + | 3.1 | % | |||||||||
Sales — Power & Vision
Sales increased 6%, or $235 million, to $3.88 billion for the first quarter of 2026, compared to $3.65 billion for the first quarter of 2025, primarily due to:
| · | the net strengthening of foreign currencies against the U.S. dollar, which increased reported U.S. dollar sales by $211 million; and |
| · | the launch of programs during or subsequent to the first quarter of 2025. |
These factors were partially offset by:
| · | lower light vehicle production in North America, Europe and China; |
| · | the end of production of certain programs; and |
| · | net customer price concessions. |
| 12 | Magna International Inc. First Quarter Report 2026 |
Adjusted EBIT and Adjusted EBIT as a percentage of sales — Power & Vision
Adjusted EBIT increased $128 million to $252 million for the first quarter of 2026, compared to $124 million for the first quarter of 2025, and Adjusted EBIT as a percentage of sales increased to 6.5% from 3.4%. These increases were primarily due to:
| · | productivity and efficiency improvements, including the benefit of operational excellence initiatives and prior restructuring actions; |
| · | higher equity income of $70 million, including a favourable commercial item during the first quarter of 2026; |
| · | net transactional foreign exchange gains in the first quarter of 2026, compared to net transactional foreign exchange losses in the first quarter of 2025; |
| · | the net strengthening of foreign currencies against the U.S. dollar, which had an $8 million favourable impact on reported U.S. dollar Adjusted EBIT; and |
| · | earnings on higher local currency sales. |
These factors were partially offset by higher net tariff costs and net unfavourable product mix.
SEATING SYSTEMS
| For the three months ended March 31, | ||||||||||||||||
| 2026 | 2025 | Change | ||||||||||||||
| Sales | $ | 1,340 | $ | 1,312 | $ | 28 | + | 2 | % | |||||||
| Adjusted EBIT | $ | 25 | $ | (30 | ) | $ | 55 | — | ||||||||
| Adjusted EBIT as a percentage of sales | 1.9 | % | (2.3 | )% | + | 4.2 | % | |||||||||
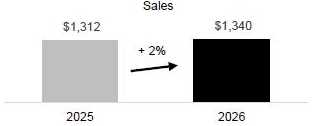
Sales — Seating Systems
Sales increased 2%, or $28 million, to $1.34 billion for the first quarter of 2026, compared to $1.31 billion for the first quarter of 2025, primarily due to:
| · | the launch of programs during or subsequent to the first quarter of 2025; |
| · | the net strengthening of foreign currencies against the U.S. dollar, which increased reported U.S. dollar sales by $56 million; and |
| · | net commercial items, which had a favourable impact on a year-over-year basis. |
These factors were partially offset by:
| · | lower light vehicle production in North America, Europe and China; |
| · | the end of production of certain programs; and |
| · | net customer price concessions. |
| Magna International Inc. First Quarter Report 2026 | 13 |
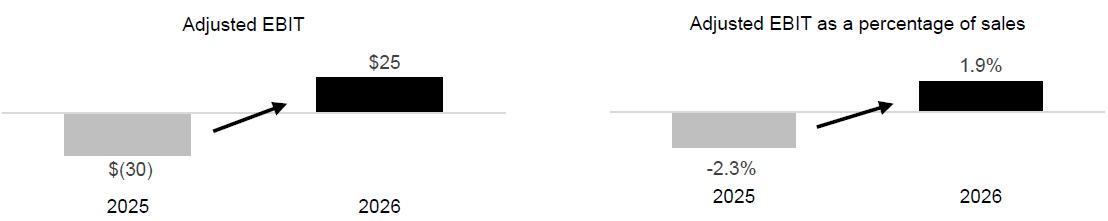
Adjusted EBIT and Adjusted EBIT as a percentage of sales – Seating Systems
Adjusted EBIT increased $55 million to $25 million for the first quarter of 2026, compared to a loss of $30 million for the first quarter of 2025, and Adjusted EBIT as a percentage of sales increased to 1.9% from -2.3%. These increases were primarily due to:
| · | lower warranty costs of $32 million; |
| · | productivity and efficiency improvements, including the benefit of operational excellence initiatives and prior restructuring actions; |
| · | net commercial items, which had a favourable impact on a year-over-year basis; |
| · | net transactional foreign exchange gains in the first quarter of 2026, compared to net transactional foreign exchange losses in the first quarter of 2025; |
| · | lower pre-operating costs incurred at new facilities; and |
| · | higher equity income. |
These factors were partially offset by reduced earnings on lower local currency sales.
COMPLETE VEHICLES
| For the
three months ended March 31, | ||||||||||||||||
| 2026 | 2025 | Change | ||||||||||||||
| Complete Vehicle Assembly Volumes (thousands of units)(i) | 24.8 | 17.4 | + | 7.4 | + | 43 | % | |||||||||
| Sales | $ | 1,224 | $ | 1,276 | $ | (52 | ) | - | 4 | % | ||||||
| Adjusted EBIT | $ | 32 | $ | 44 | $ | (12 | ) | - | 27 | % | ||||||
| Adjusted EBIT as a percentage of sales | 2.6 | % | 3.4 | % | - | 0.8 | % | |||||||||
(i) Vehicles produced at our Complete Vehicle operations are included in Europe Light Vehicle Production volumes.
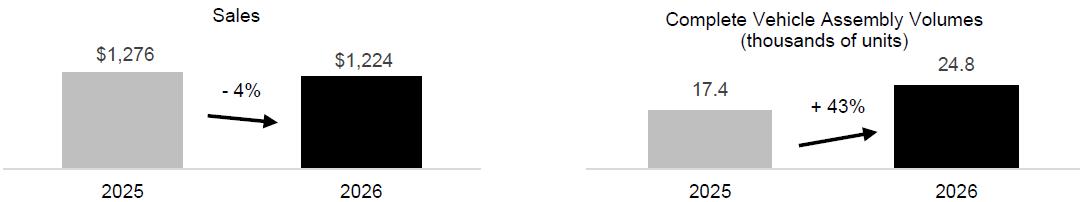
Sales – Complete Vehicles
Sales decreased 4%, or $52 million, to $1.22 billion for the first quarter of 2026, compared to $1.28 billion for the first quarter of 2025, while complete vehicle assembly volumes increased 43%. The increase in volumes was primarily due to higher volumes with value-added contractual arrangements.
The decrease in sales is primarily a result of lower complete vehicle assembly volumes with full-costed contractual arrangements, and lower engineering revenue. These factors were partially offset by a $120 million increase in reported U.S. dollar sales as a result of the strengthening of the euro against the U.S. dollar, and the launch of certain programs with value-added contractual arrangements during the third quarter of 2025.
| 14 | Magna International Inc. First Quarter Report 2026 |
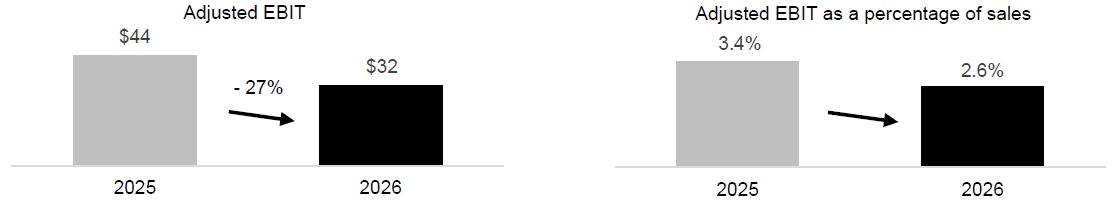
Adjusted EBIT and Adjusted EBIT as a percentage of sales – Complete Vehicles
Adjusted EBIT decreased $12 million to $32 million for the first quarter of 2026, compared to $44 million for the first quarter of 2025, and Adjusted EBIT as a percentage of sales decreased to 2.6% from 3.4%.
These decreases were primarily due to lower income on lower engineering revenue.
This factor was partially offset by:
| · | productivity and efficiency improvements, including the benefit of operational excellence initiatives and prior restructuring actions; |
| · | higher earnings due to net favourable program mix; and |
| · | the net strengthening of foreign currencies against the U.S. dollar, which had a $3 million favourable impact on reported U.S. dollar Adjusted EBIT. |
CORPORATE AND OTHER
Adjusted EBIT was a loss of $25 million for the first quarter of 2026 compared to a loss of $14 million for the first quarter of 2025. The $11 million decrease was primarily the result of:
| · | higher consulting and legal costs; |
| · | higher incentive and stock-based compensation expense; and |
| · | higher investments in research and development. |
| Magna International Inc. First Quarter Report 2026 | 15 |
FINANCIAL CONDITION, LIQUIDITY AND CAPITAL RESOURCES
OPERATING ACTIVITIES
Cash provided from operating activities
| For the
three months ended March 31, | ||||||||||||
| 2026 | 2025 | Change | ||||||||||
| Net (loss) income | $ | (1 | ) | $ | 153 | |||||||
| Items not involving current cash flows | 638 | 394 | ||||||||||
| 637 | 547 | $ | 90 | |||||||||
| Changes in operating assets and liabilities | 40 | (470 | ) | 510 | ||||||||
| Cash provided from operating activities | $ | 677 | $ | 77 | $ | 600 | ||||||
Cash provided from operating activities
Comparing the first quarter of 2026 to 2025, cash provided from operating activities increased by $600 million primarily as a result of higher changes in operating assets and liabilities, and higher items not involving current cash flows, partially offset by lower net income. The key components of this increase were:
| · | a $341 million decrease in cash paid for materials and overhead; |
| · | a $232 million increase in cash received from customers; |
| · | a $31 million decrease in cash taxes; and |
| · | a $13 million decrease in cash interest paid. |
These factors were partially offset by a $15 million decrease in dividends received from equity investments.
Changes in operating assets and liabilities
During the first quarter of 2026, we generated $40 million from operating assets and liabilities primarily consisting of:
| · | a $568 million increase in accounts payable; |
| · | a $178 million decrease in tooling investment for current and upcoming program launches; |
| · | a $174 million increase in other accrued liabilities; |
| · | a $69 million increase in accrued wages and salaries; |
| · | a $12 million decrease in prepaids and other; and |
| · | a $9 million increase in taxes payable. |
These factors were partially offset by:
| · | a $1,432 million increase in production and other receivables, partially offset by $475 million collection of customer recoveries; and |
| · | a $13 million increase in production inventory. |
| 16 | Magna International Inc. First Quarter Report 2026 |
INVESTING ACTIVITIES
Cash used for investing activities
| For the
three months ended March 31, | ||||||||||||
| 2026 | 2025 | Change | ||||||||||
| Fixed asset additions | $ | (219 | ) | $ | (268 | ) | ||||||
| Acquisitions | — | (4 | ) | |||||||||
| Increase in investments, other assets and intangible assets | (168 | ) | (148 | ) | ||||||||
| Increase in public and private equity investments | (1 | ) | (1 | ) | ||||||||
| Proceeds from dispositions of fixed assets, other assets and investments | 82 | 26 | ||||||||||
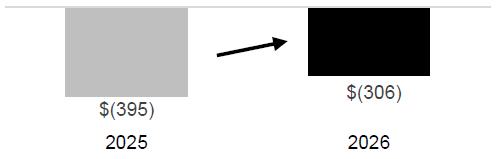
| Cash used for investing activities | $ | (306 | ) | $ | (395 | ) | $ | 89 | ||||
Cash used for investing activities in the first quarter of 2026 was $89 million lower compared to the first quarter of 2025. The change between the first quarter of 2026, and the first quarter of 2025, was primarily due to: a $56 million increase in proceeds from dispositions of fixed assets, other assets and investments, and a $49 million decrease in cash used for fixed assets. These factors were partially offset by a $20 million increase in cash used for investments, other assets and intangible assets due to an $80 million increase in an equity method investment offset by a $60 million decrease in other assets and intangible assets.
FINANCING ACTIVITIES
| For the
three months ended March 31, | ||||||||||||
| 2026 | 2025 | Change | ||||||||||
| Issues of debt | $ | 2 | $ | 1 | ||||||||
| Increase in short-term borrowings | 143 | 328 | ||||||||||
| Repayments of debt | (10 | ) | (7 | ) | ||||||||
| Issue of Common Shares on exercise of stock options | 86 | — | ||||||||||
| Tax withholdings on vesting of equity awards | (9 | ) | (4 | ) | ||||||||
| Repurchase of Common Shares | (440 | ) | (51 | ) | ||||||||
| Dividends paid | (135 | ) | (136 | ) | ||||||||
| Cash (used for) provided by financing activities | $ | (363 | ) | $ | 131 | $ | (494 | ) | ||||
Short-term borrowings increased $143 million during the first quarter of 2026, primarily due to a $135 million increase in notes outstanding under the U.S. commercial paper program.
During the first quarter of 2026, we repurchased 7.6 million Common Shares under normal course issuer bids for aggregate cash consideration of $440 million.
Cash dividends paid per Common Share were $0.495 for the first quarter of 2026, compared to $0.485 for the first quarter of 2025.
| Magna International Inc. First Quarter Report 2026 | 17 |
FINANCING RESOURCES
| As at March 31, | As at December 31, | |||||||||||
| 2026 | 2025 | Change | ||||||||||
| Liabilities | ||||||||||||
| Short-term borrowing | $ | 136 | $ | — | ||||||||
| Long-term debt due within one year | 20 | 27 | ||||||||||
| Current portion of operating lease liabilities | 328 | 328 | ||||||||||
| Long-term debt | 4,643 | 4,685 | ||||||||||
| Operating lease liabilities | 1,573 | 1,649 | ||||||||||
| $ | 6,700 | $ | 6,689 | $ | 11 | |||||||
Financial liabilities increased $11 million to $6.70 billion as at March 31, 2026, primarily as a result of an increase in notes outstanding under the U.S. commercial paper program. This increase was partially offset by the weakening of foreign currencies against the U.S. dollar.
CASH RESOURCES
In the first quarter of 2026, our cash resources, including restricted cash equivalents, increased by $16 million to $1.6 billion, primarily as a result of cash provided from operating activities, partially offset by cash used for investing and financing activities. In addition to our cash resources at March 31, 2026, we had lines of credit totaling $3.7 billion, of which $3.4 billion was available.
On January 12, 2026, our $350 million 3-year tranche syndicated, unsecured, delayed draw term loan facility expired with no amount drawn.
On April 22, 2026, we extended the maturity date of our $800 million 364-day syndicated revolving credit facility from June 24, 2026, to June 24, 2027. The facility can be drawn in U.S. dollars or Canadian dollars. As of March 31, 2026, no amounts are outstanding under this credit facility.
On April 22, 2026, we extended the maturity date of our $2.7 billion syndicated revolving credit facility from June 25, 2030 to June 25, 2031. As at March 31, 2026, no amounts are outstanding under this credit facility.
MAXIMUM NUMBER OF SHARES ISSUABLE
The following table presents the maximum number of shares that would be outstanding if all the dilutive instruments outstanding at April 30, 2026 were exercised:
| Common Shares | 272,224,550 | |||
| Stock options (i) and share awards | 4,559,643 | |||
| 276,784,193 |
| (i) | Options to purchase Common Shares are exercisable by the holder in accordance with the vesting provisions and upon payment of the exercise price as may be determined from time to time pursuant to our stock option plans. |
CONTRACTUAL OBLIGATIONS
There have been no material changes with respect to the contractual obligations requiring annual payments during the first quarter of 2026 that are outside the ordinary course of our business. Refer to our MD&A included in our 2025 Annual Report.
| 18 | Magna International Inc. First Quarter Report 2026 |
NON-GAAP FINANCIAL MEASURES RECONCILIATION
The reconciliation of Non-GAAP financial measures is as follows:
ADJUSTED EBIT
| For the
three months ended March 31, | ||||||||
| 2026 | 2025 | |||||||
| Net (Loss) Income | $ | (1 | ) | $ | 153 | |||
| Add: | ||||||||
| Amortization of acquired intangible assets | 19 | 26 | ||||||
| Interest expense, net | 37 | 50 | ||||||
| Other expense, net | 415 | 53 | ||||||
| Income taxes | 88 | 72 | ||||||
| Adjusted EBIT | $ | 558 | $ | 354 | ||||
ADJUSTED EBIT AS A PERCENTAGE OF SALES
| For the three months ended March 31, | ||||||||
| 2026 | 2025 | |||||||
| Sales | $ | 10,381 | $ | 10,069 | ||||
| Adjusted EBIT | $ | 558 | $ | 354 | ||||
| Adjusted EBIT as a percentage of sales | 5.4 | % | 3.5 | % | ||||
ADJUSTED EPS
| For the
three months ended March 31, | ||||||||
| 2026 | 2025 | |||||||
| Net (loss) income attributable to Magna International Inc. | $ | (12 | ) | $ | 146 | |||
| Add (deduct): | ||||||||
| Amortization of acquired intangible assets | 19 | 26 | ||||||
| Other expense, net | 415 | 53 | ||||||
| Tax effect on Amortization of acquired intangible assets and Other expense, net | (36 | ) | (6 | ) | ||||
| Adjusted net income attributable to Magna International Inc. | $ | 386 | $ | 219 | ||||
| Diluted weighted average number of Common Shares outstanding during the period (millions) | 278.1 | 282.0 | ||||||
| Adjusted Dilutive impact of stock option and share awards (ii) | 1.8 | — | ||||||
| Adjusted diluted weighted average number of Common Shares outstanding during the period (millions) | 279.9 | 282.0 | ||||||
| Adjusted EPS | $ | 1.38 | $ | 0.78 | ||||
| (ii) | During the first quarter of 2026, we generated Adjusted net income attributable to Magna International Inc. while reporting a net loss attributable to Magna International Inc. As a result, certain stock-based compensation awards are dilutive for Adjusted EPS and are included in the adjusted diluted weighted average number of Common Shares outstanding. The dilutive impact was determined using the treasury stock method. |
| Magna International Inc. First Quarter Report 2026 | 19 |
ADJUSTED RETURN ON INVESTED CAPITAL
Adjusted Return on Invested Capital is calculated as Adjusted After-tax operating profits divided by Average Invested Capital for the period. Average Invested Capital for the three month period is averaged on a two-fiscal quarter basis.
| For the
three months ended March 31, | ||||||||
| 2026 | 2025 | |||||||
| Net (Loss) Income | $ | (1 | ) | $ | 153 | |||
| Add (deduct): | ||||||||
| Amortization of acquired intangible assets | 19 | 26 | ||||||
| Interest expense, net | 37 | 50 | ||||||
| Other expense, net | 415 | 53 | ||||||
| Tax effect on Interest expense, net, Amortization of acquired intangible assets and Other expense, net | (45 | ) | (19 | ) | ||||
| Adjusted After-tax operating profits | $ | 425 | $ | 263 | ||||
| As at March 31, | ||||||||
| 2026 | 2025 | |||||||
| Total Assets | $ | 31,660 | $ | 32,074 | ||||
| Excluding: | ||||||||
| Cash and cash equivalents | (1,605 | ) | (1,059 | ) | ||||
| Deferred tax assets | (881 | ) | (862 | ) | ||||
| Less Current Liabilities | (11,923 | ) | (13,068 | ) | ||||
| Excluding: | ||||||||
| Short-term borrowing | 136 | 614 | ||||||
| Long-term debt due within one year | 20 | 1,005 | ||||||
| Current portion of operating lease liabilities | 328 | 305 | ||||||
| Invested Capital | $ | 17,735 | $ | 19,009 | ||||
| For the
three months ended March 31, | ||||||||
| 2026 | 2025 | |||||||
| Adjusted After-tax operating profits | $ | 425 | $ | 263 | ||||
| Average Invested Capital | $ | 18,021 | $ | 18,579 | ||||
| Adjusted Return on Invested Capital | 9.4 | % | 5.7 | % | ||||
| 20 | Magna International Inc. First Quarter Report 2026 |
SUBSEQUENT EVENT
NORMAL COURSE ISSUER BID
Subsequent to March 31, 2026, we purchased 2,300,000 Common Shares for cancellation under our existing normal course issuer bid for cash consideration of $136 million.
COMMITMENTS AND CONTINGENCIES
From time to time, we may be contingently liable for litigation, legal and/or regulatory actions and proceedings, and other claims. Refer to Note 15, "Contingencies" of our unaudited interim consolidated financial statements for the three months ended March 31, 2026.
For a discussion of risk factors relating to legal and other claims/actions against us, refer to "Risk Factors" in our Annual Information Form, filed with the securities commissions in Canada, our Annual Report on Form 40-F, filed with the United States Securities and Exchange Commission, each in respect of the year ended December 31, 2025, and updated in our subsequent quarterly filings.
CONTROLS AND PROCEDURES
There have been no changes in our internal controls over financial reporting that occurred during the three months ended March 31, 2026, that have materially affected, or are reasonably likely to materially affect, our internal control over financial reporting.
| Magna International Inc. First Quarter Report 2026 | 21 |
FORWARD-LOOKING STATEMENTS
Certain statements in this MD&A may constitute "forward-looking information" or "forward-looking statements" (collectively, "forward-looking statements"). Any such forward-looking statements are intended to provide information about management's current expectations and plans and may not be appropriate for other purposes. Forward-looking statements may include financial and other projections, as well as statements regarding our future plans, strategic objectives or economic performance, or the assumptions underlying any of the foregoing, and other statements that are not recitations of historical fact. We use words such as "may", "would", "could", "should", "will", "likely", "expect", "anticipate", "assume", "believe", "intend", "plan", "aim", "forecast", "outlook", "project", "potential", "estimate", "target" and similar expressions suggesting future outcomes or events to identify forward-looking statements.
Forward-looking statements are based on information currently available to us and are based on assumptions and analyses made by us in light of our experience and our perception of historical trends, current conditions and expected future developments, as well as other factors we believe are appropriate in the circumstances. While we believe we have a reasonable basis for making any such forward-looking statements, they are not a guarantee of future performance or outcomes. Whether actual results and developments conform to our expectations and predictions is subject to a number of risks, assumptions, and uncertainties, many of which are beyond our control, and the effects of which can be difficult to predict, including, without limitation:
Macroeconomic, Geopolitical and Other Risks
· geopolitical crises and military conflicts; · threats to free trade agreements; · international trade disputes; · planning and forecasting challenges; · interest rate levels;
Risks Related to the Automotive Industry
· pace of EV adoption; · North American EV program deferrals, cancellations and volume reductions; · economic cyclicality; · regional production volume declines; · deteriorating vehicle affordability; · intense competition;
Strategic Risks
· evolution of the vehicle; · evolving business risk profile; · technology and innovation; · investments in mobility and technology companies;
Customer-Related Risks
· customer concentration; · market shifts; · evolving OEM competitive landscape; · dependence on outsourcing; · consumer take rate shifts; · nature of customer blanket purchase orders; · potential OEM production-related disruptions;
Supply Chain Risks
· supply chain disruptions; · regional energy supply and pricing; · financial condition of supply base; · supplier claims;
Manufacturing/Operational Risks
· product launch; · operational underperformance; · restructuring costs; · impairments; · skilled labour attraction/retention; |
Pricing Risks
· quote/pricing assumptions; · customer pricing pressure/contractual arrangements; · commodity cost volatility; · scrap steel/aluminum price volatility;
Warranty/Recall Risks
· repair/replace costs; · warranty provisions; · product liability;
IT Security/Cybersecurity Risks
· IT/cybersecurity breach; · product cybersecurity breach; · risks related to the use of artificial intelligence;
Merger and Acquisition Risks
· inherent merger and acquisition risks; · acquisition integration and synergies;
Other Business Risks
· joint ventures; · intellectual property; · risks of doing business in foreign markets; · tax risks; · relative foreign exchange rates; · returns on capital investments; · financial flexibility; · credit ratings changes; · stock price fluctuation;
Legal and Regulatory Risks
· legal and regulatory proceedings; and · changes in laws. |
| 22 | Magna International Inc. First Quarter Report 2026 |
In evaluating forward-looking statements, we caution readers not to place undue reliance on any forward-looking statement. Additionally, readers should specifically consider the various factors which could cause actual events or results to differ materially from those indicated by such forward-looking statements, including the risks, assumptions and uncertainties above which are:
| · | discussed under the "Industry Trends and Risks" heading of our Management's Discussion and Analysis; and |
| · | set out in our Annual Information Form filed with securities commissions in Canada, our annual report on Form 40-F filed with the United States Securities and Exchange Commission, and subsequent filings. |
Readers should also consider discussion of our risk mitigation activities with respect to certain risk factors, which can also be found in our Annual Information Form. Additional information about Magna, including our Annual Information Form, is available through the System for Electronic Data Analysis and Retrieval+ (SEDAR+) at www.sedarplus.ca, as well as on the United States Securities and Exchange Commission’s Electronic Data Gathering, Analysis and Retrieval System (EDGAR), which can be accessed at www.sec.gov.
| Magna International Inc. First Quarter Report 2026 | 23 |
MAGNA INTERNATIONAL INC.
CONSOLIDATED STATEMENTS OF (LOSS) INCOME
[Unaudited]
[U.S. dollars in millions, except per share figures]
| Three months
ended March 31, | ||||||||||||
| Note | 2026 | 2025 | ||||||||||
| Sales | 17 | $ | 10,381 | $ | 10,069 | |||||||
| Costs and expenses | ||||||||||||
| Cost of goods sold | 8,958 | 8,827 | ||||||||||
| Selling, general and administrative | 557 | 539 | ||||||||||
| Depreciation | 403 | 369 | ||||||||||
| Amortization of acquired intangible assets | 19 | 26 | ||||||||||
| Interest expense, net | 37 | 50 | ||||||||||
| Equity income | (95 | ) | (20 | ) | ||||||||
| Other expense, net | 3 | 415 | 53 | |||||||||
| Income from operations before income taxes | 87 | 225 | ||||||||||
| Income taxes | 12 | 88 | 72 | |||||||||
| Net (loss) income | (1 | ) | 153 | |||||||||
| Income attributable to non-controlling interests | (11 | ) | (7 | ) | ||||||||
| Net (loss) income attributable to Magna International Inc. | $ | (12 | ) | $ | 146 | |||||||
| (Loss) Earnings per Common Share: | 4 | |||||||||||
| Basic | $ | (0.04 | ) | $ | 0.52 | |||||||
| Diluted | $ | (0.04 | ) | $ | 0.52 | |||||||
| Cash dividends paid per Common Share | $ | 0.495 | $ | 0.485 | ||||||||
| Weighted average number of Common Shares outstanding during the period [in millions]: | 4 | |||||||||||
| Basic | 278.1 | 282.0 | ||||||||||
| Diluted | 278.1 | 282.0 | ||||||||||
See accompanying notes
| 24 | Magna International Inc. First Quarter Report 2026 |
MAGNA INTERNATIONAL INC.
CONSOLIDATED STATEMENTS OF COMPREHENSIVE (LOSS) INCOME
[Unaudited]
[U.S. dollars in millions]
| Three
months ended March 31, |
||||||||||||
| Note | 2026 | 2025 | ||||||||||
| Net (loss) income | $ | (1 | ) | $ | 153 | |||||||
| Other comprehensive (loss) income, net of tax: | 14 | |||||||||||
| Net unrealized (loss) gain on translation of net investment in foreign operations | (54 | ) | 187 | |||||||||
| Net unrealized (loss) gain on cash flow hedges | (6 | ) | 49 | |||||||||
| Reclassification of net (gain) loss on cash flow hedges to net income | (13 | ) | 16 | |||||||||
| Pension and post retirement benefits | (1 | ) | — | |||||||||
| Reclassification of net loss on pensions to net income | — | 1 | ||||||||||
| Other comprehensive (loss) income | (74 | ) | 253 | |||||||||
| Comprehensive (loss) income | (75 | ) | 406 | |||||||||
| Comprehensive income attributable to non-controlling interests | (13 | ) | (8 | ) | ||||||||
| Comprehensive (loss) income attributable to Magna International Inc. | $ | (88 | ) | $ | 398 | |||||||
| See accompanying notes | ||||||||||||
| Magna International Inc. First Quarter Report 2026 | 25 |
MAGNA INTERNATIONAL INC.
CONSOLIDATED BALANCE SHEETS
[Unaudited]
[U.S. dollars in millions]
| Note | As
at 2026 | As at December 31, 2025 | ||||||||||
| ASSETS | ||||||||||||
| Current assets | ||||||||||||
| Cash and cash equivalents | 5 | $ | 1,605 | $ | 1,612 | |||||||
| Accounts receivable | 8,215 | 7,593 | ||||||||||
| Inventories | 7 | 3,964 | 4,126 | |||||||||
| Prepaid expenses and other | 5, 6 | 405 | 407 | |||||||||
| Assets held for sale | 2 | 316 | — | |||||||||
| 14,505 | 13,738 | |||||||||||
| Investments | 8 | 1,289 | 1,103 | |||||||||
| Fixed assets, net | 9,012 | 9,507 | ||||||||||
| Operating lease right-of-use assets | 1,865 | 1,928 | ||||||||||
| Intangible assets, net | 454 | 490 | ||||||||||
| Goodwill | 2,464 | 2,512 | ||||||||||
| Other assets | 9 | 1,190 | 1,275 | |||||||||
| Deferred tax assets | 881 | 864 | ||||||||||
| $ | 31,660 | $ | 31,417 | |||||||||
| LIABILITIES AND SHAREHOLDERS' EQUITY | ||||||||||||
| Current liabilities | ||||||||||||
| Short-term borrowing | 11 | $ | 136 | $ | — | |||||||
| Long-term debt due within one year | 20 | 27 | ||||||||||
| Accounts payable | 7,216 | 6,895 | ||||||||||
| Other accrued liabilities | 10 | 2,878 | 2,745 | |||||||||
| Accrued salaries and wages | 920 | 888 | ||||||||||
| Income taxes payable | 129 | 106 | ||||||||||
| Current portion of operating lease liabilities | 328 | 328 | ||||||||||
| Liabilities held for sale | 2 | 296 | — | |||||||||
| 11,923 | 10,989 | |||||||||||
| Long-term debt | 11 | 4,643 | 4,685 | |||||||||
| Operating lease liabilities | 1,573 | 1,649 | ||||||||||
| Long-term employee benefit liabilities | 530 | 554 | ||||||||||
| Other long-term liabilities | 426 | 399 | ||||||||||
| Deferred tax liabilities | 293 | 302 | ||||||||||
| 19,388 | 18,578 | |||||||||||
| Shareholders' equity | ||||||||||||
| Common Shares [issued: 274,424,550; December 31, 2025 - 280,242,006] | 13 | 3,383 | 3,352 | |||||||||
| Contributed surplus | 117 | 142 | ||||||||||
| Retained earnings | 9,246 | 9,765 | ||||||||||
| Accumulated other comprehensive loss | 14 | (833 | ) | (766 | ) | |||||||
| 11,913 | 12,493 | |||||||||||
| Non-controlling interests | 6 | 359 | 346 | |||||||||
| 12,272 | 12,839 | |||||||||||
| $ | 31,660 | $ | 31,417 | |||||||||
See accompanying notes
| 26 | Magna International Inc. First Quarter Report 2026 |
MAGNA INTERNATIONAL INC.
CONSOLIDATED STATEMENTS OF CASH FLOWS
[Unaudited]
[U.S. dollars in millions]
| Three
months ended March 31, | ||||||||||||
| Note | 2026 | 2025 | ||||||||||
| Cash (used for) provided from: | ||||||||||||
| OPERATING ACTIVITIES | ||||||||||||
| Net (loss) income | $ | (1 | ) | $ | 153 | |||||||
| Items not involving current cash flows | 5 | 638 | 394 | |||||||||
| 637 | 547 | |||||||||||
| Changes in operating assets and liabilities | 5 | 40 | (470 | ) | ||||||||
| Cash provided from operating activities | 677 | 77 | ||||||||||
| INVESTMENT ACTIVITIES | ||||||||||||
| Fixed asset additions | (219 | ) | (268 | ) | ||||||||
| Acquisitions | — | (4 | ) | |||||||||
| Increase in investments, other assets and intangible assets | (168 | ) | (148 | ) | ||||||||
| Increase in public and private equity investments | (1 | ) | (1 | ) | ||||||||
| Proceeds from dispositions of fixed assets, other assets and investments | 82 | 26 | ||||||||||
| Cash used for investing activities | (306 | ) | (395 | ) | ||||||||
| FINANCING ACTIVITIES | ||||||||||||
| Issues of debt | 11 | 2 | 1 | |||||||||
| Increase in short-term borrowing | 143 | 328 | ||||||||||
| Repayments of debt | (10 | ) | (7 | ) | ||||||||
| Issue of Common Shares on exercise of stock options | 86 | - | ||||||||||
| Tax withholdings on vesting of equity awards | (9 | ) | (4 | ) | ||||||||
| Repurchase of Common Shares | 13 | (440 | ) | (51 | ) | |||||||
| Dividends | (135 | ) | (136 | ) | ||||||||
| Cash (used for) provided by financing activities | (363 | ) | 131 | |||||||||
| Effect of exchange rate changes on cash and cash equivalents | 8 | (1 | ) | |||||||||
| Net increase (decrease) in cash and cash equivalents during the period | 16 | (188 | ) | |||||||||
| Cash and cash equivalents, beginning of period | 1,612 | 1,247 | ||||||||||
| Cash and cash equivalents, end of period | 5 | $ | 1,628 | $ | 1,059 | |||||||
See accompanying notes
| Magna International Inc. First Quarter Report 2026 | 27 |
MAGNA INTERNATIONAL INC.
CONSOLIDATED STATEMENTS OF CHANGES IN EQUITY
[Unaudited]
[U.S. dollars in millions]
| Common Shares |
| ||||||||||||||||||||||||||||
| Note | Number | Stated Value | Contributed Surplus | Retained Earnings | AOCL[i] | Non- controlling Interest | Total Equity | ||||||||||||||||||||||
| [in millions] | |||||||||||||||||||||||||||||
| Balance, December 31, 2025 | 280.3 | $ | 3,352 | $ | 142 | $ | 9,765 | $ | (766 | ) | $ | 346 | $ | 12,839 | |||||||||||||||
| Net (loss) income | (12 | ) | 11 | (1 | ) | ||||||||||||||||||||||||
| Other comprehensive (loss) income | (76 | ) | 2 | (74 | ) | ||||||||||||||||||||||||
| Shares issued on exercise of stock options | 1.6 | 105 | (19 | ) | 86 | ||||||||||||||||||||||||
| Release of stock and stock units | 0.4 | 21 | (21 | ) | — | ||||||||||||||||||||||||
| Tax withholdings on vesting of equity awards | (0.2 | ) | (2 | ) | (7 | ) | (9 | ) | |||||||||||||||||||||
| Repurchase and cancellation under normal course issuer bid | 13 | (7.6 | ) | (95 | ) | (363 | ) | 9 | (449 | ) | |||||||||||||||||||
| Stock-based compensation expense | 17 | 17 | |||||||||||||||||||||||||||
| Acquisition of non-controlling interest | (2 | ) | (2 | ) | |||||||||||||||||||||||||
| Dividends paid | 2 | (137 | ) | (135 | ) | ||||||||||||||||||||||||
| Balance, March 31, 2026 | 274.5 | $ | 3,383 | $ | 117 | $ | 9,246 | $ | (833 | ) | $ | 359 | $ | 12,272 | |||||||||||||||
Common Shares |
| ||||||||||||||||||||||||||||
| Note | Number | Stated Value | Contributed Surplus | Retained Earnings | AOCL[i] | Non- controlling Interest | Total Equity | ||||||||||||||||||||||
| [in millions] | |||||||||||||||||||||||||||||
| Balance, December 31, 2024 | 282.9 | $ | 3,359 | $ | 149 | $ | 9,598 | $ | (1,584 | ) | $ | 418 | $ | 11,940 | |||||||||||||||
| Net income | 146 | 7 | 153 | ||||||||||||||||||||||||||
| Other comprehensive income | 252 | 1 | 253 | ||||||||||||||||||||||||||
| Release of stock and stock units | 0.2 | 18 | (18 | ) | — | ||||||||||||||||||||||||
| Tax withholdings on vesting of equity awards | (0.1 | ) | (1 | ) | (3 | ) | (4) | ||||||||||||||||||||||
| Repurchase and cancellation under normal course issuer bid | 13 | (1.3 | ) | (16 | ) | (38 | ) | 2 | (52) | ||||||||||||||||||||
| Stock-based compensation expense | 12 | 12 | |||||||||||||||||||||||||||
| Dividends paid | 2 | (138 | ) | (136) | |||||||||||||||||||||||||
| Balance, March 31, 2025 | 281.7 | $ | 3,362 | $ | 143 | $ | 9,565 | $ | (1,330 | ) | $ | 426 | $ | 12,166 | |||||||||||||||
(i) AOCL is Accumulated Other Comprehensive Loss.
See accompanying notes
| 28 | Magna International Inc. First Quarter Report 2026 |
MAGNA INTERNATIONAL INC.
NOTES TO INTERIM CONSOLIDATED FINANCIAL STATEMENTS
[Unaudited]
[All amounts in U.S. dollars and all tabular amounts in millions unless otherwise noted]
1. SIGNIFICANT ACCOUNTING POLICIES
[a] Basis of Presentation
The unaudited interim consolidated financial statements of Magna International Inc. and its subsidiaries [collectively "Magna" or the "Company"] have been prepared in U.S. dollars in accordance with accounting principles generally accepted in the United States of America ["GAAP"]. The unaudited interim consolidated financial statements do not conform in all respects to the requirements of GAAP for annual financial statements. Accordingly, these unaudited interim consolidated financial statements should be read in conjunction with the December 31, 2025 audited consolidated financial statements and notes thereto included in the Company's 2025 Annual Report.
The unaudited interim consolidated financial statements reflect all adjustments, which consist only of normal and recurring adjustments, necessary to present fairly the financial position as at March 31, 2026 and the results of operations, changes in equity, and cash flows for the three-month periods ended March 31, 2026 and 2025.
[b] Use of Estimates
The preparation of the unaudited interim consolidated financial statements in conformity with GAAP requires management to make estimates and assumptions that affect the amounts reported and disclosed in the interim consolidated financial statements and accompanying notes. Actual results could differ materially from those estimates.
| Magna International Inc. First Quarter Report 2026 | 29 |
MAGNA INTERNATIONAL INC.
NOTES TO INTERIM CONSOLIDATED FINANCIAL STATEMENTS
[Unaudited]
[All amounts in U.S. dollars and all tabular amounts in millions unless otherwise noted]
2. ASSETS AND LIABILITIES HELD FOR SALE
Sale of Lighting Business
During the first quarter of 2026, the Company entered into a definitive agreement to sell its European Lighting business to Mutares SE & Co. KGaA ("Lighting Europe Agreement"). As of March 31, 2026, the Company committed to a plan to sell its Lighting business in North America, South America, and China. Subsequent to March 31, 2026, the Company entered into a definitive agreement with AURELIUS Investment Lux Alpha SARL to sell the business ("Lighting Rest of World Agreement").
Sale of Rooftop Systems Business
During the first quarter of 2026, the Company entered into a definitive agreement to sell its Rooftop Systems business to Mutares SE & Co. KGaA ("Rooftop Systems Agreement").
Held for sale classification
The Company determined that the assets and liabilities of its Lighting and Rooftop Systems businesses met the criteria to be classified as held for sale as of March 31, 2026. These businesses are reported within the Company's Power & Vision segment and did not meet the criteria to be classified as discontinued operations. The transactions are expected to close in the second half of 2026, subject to customary closing conditions and regulatory approvals.
Accordingly, the held for sale assets and liabilities of the Lighting and Rooftop Systems businesses were reclassified in the consolidated balance sheet at March 31, 2026 to current assets held for sale or current liabilities held for sale, respectively, as the sale of such assets and liabilities is expected within one year.
The following table summarizes the carrying value of the major classes of assets and liabilities of the Lighting and Rooftop Systems businesses which were classified as held for sale as of March 31, 2026, after giving effect to the loss on assets held for sale recorded in the first quarter of 2026. Refer to Note 3[a]. Other Expense, net for additional information.
| March 31, 2026 | ||||||||||||
| Lighting | Rooftop
Systems | Total | ||||||||||
| Accounts receivable | $ | 165 | $ | 8 | $ | 173 | ||||||
| Inventories | 77 | 6 | 83 | |||||||||
| Income taxes receivable | 12 | — | 12 | |||||||||
| Prepaid expenses and other | 13 | — | 13 | |||||||||
| Deferred tax assets | 35 | — | 35 | |||||||||
| Assets held for sale | $ | 302 | $ | 14 | $ | 316 | ||||||
| Accounts payable | $ | 180 | $ | 9 | $ | 189 | ||||||
| Accrued salaries and wages | 24 | 4 | 28 | |||||||||
| Other accrued liabilities | 14 | 15 | 29 | |||||||||
| Current lease liabilities | 6 | 2 | 8 | |||||||||
| Long-term employee benefit liabilities | 8 | 3 | 11 | |||||||||
| Long-term lease liabilities | 25 | 6 | 31 | |||||||||
| Liabilities held for sale | $ | 257 | $ | 39 | $ | 296 | ||||||
| 30 | Magna International Inc. First Quarter Report 2026 |
MAGNA INTERNATIONAL INC.
NOTES TO INTERIM CONSOLIDATED FINANCIAL STATEMENTS
[Unaudited]
[All amounts in U.S. dollars and all tabular amounts in millions unless otherwise noted]
3. OTHER EXPENSE, NET
| Three
months ended March 31, | ||||||||||||
| 2026 | 2025 | |||||||||||
| Loss on assets held for sale | [a] | $ | 485 | $ | — | |||||||
| Restructuring activities | [b] | 26 | 44 | |||||||||
| Investments | [c] | (96 | ) | 9 | ||||||||
| $ | 415 | $ | 53 | |||||||||
[a] Loss on assets held for sale
Sale of Lighting Business
Under the terms of the Lighting Europe Agreement, the Company is required to provide the buyer with an agreed upon amount of funding. Fair value less costs to sell was determined to be negative $23 million, resulting in an impairment loss of $73 million [$73 million after tax].
Under the terms of the Lighting Rest of World Agreement, fair value less costs to sell was determined to be $66 million, resulting in an impairment loss of $345 million [$312 million after tax].
Sale of Rooftop Systems Business
Under the terms of the Rooftop Systems Agreement, the Company is required to provide the buyer with an agreed upon amount of funding. Fair value less costs to sell was determined to be negative $25 million, resulting in an impairment loss of $67 million [$67 million after tax].
The following table summarizes the adjustments recognized to the major classes of assets as of March 31, 2026:
| March 31, 2026 | ||||||||||||
| Lighting | Rooftop
Systems | Total | ||||||||||
| Accounts receivable | $ | 81 | $ | 13 | $ | 94 | ||||||
| Inventories | 51 | 26 | 77 | |||||||||
| Fixed assets, net | 225 | 12 | 237 | |||||||||
| Operating lease, right-of-use-assets | 22 | 7 | 29 | |||||||||
| Intangibles, net | 3 | 4 | 7 | |||||||||
| Goodwill[i] | 21 | — | 21 | |||||||||
| Other Assets | 13 | 5 | 18 | |||||||||
| Total asset impairment | $ | 416 | $ | 67 | $ | 483 | ||||||
| Costs to sell incurred during the first quarter of 2026 | $ | 2 | $ | — | $ | 2 | ||||||
| Total impairment loss | $ | 418 | $ | 67 | $ | 485 | ||||||
[i] $21 million of goodwill was allocated to the Lighting business in North America, South America, and China from the Mechatronics, Mirrors and Lighting reporting unit based on its relative fair value.
[b] Restructuring activities
In the first quarter of 2026, the Company recorded restructuring charges of $21 million [$20 million after tax] in its Complete Vehicles segment related to rightsizing activities at a facility in Europe, and $5 million [$5 million after tax] in its Power & Vision segment related to plant closures and consolidations at facilities in Europe.
In the first quarter of 2025, the Company recorded restructuring charges of $33 million [$33 million after tax] in its Complete Vehicles segment related to rightsizing activities at a facility in Europe, and $11 million [$11 million after tax] in its Power & Vision segment related to significant rightsizing activities and plant consolidations at facilities in Europe.
| Magna International Inc. First Quarter Report 2026 | 31 |
MAGNA INTERNATIONAL INC.
NOTES TO INTERIM CONSOLIDATED FINANCIAL STATEMENTS
[Unaudited]
[All amounts in U.S. dollars and all tabular amounts in millions unless otherwise noted]
3. OTHER EXPENSE, NET (CONTINUED)
[c] Investments
| Three months ended March 31, | ||||||||
| 2026 | 2025 | |||||||
| Net revaluation (gain) loss on public and private equity investments | $ | (110 | ) | $ | 2 | |||
| Non-cash impairment charge | 14 | — | ||||||
| Revaluation loss on public company warrants | — | 8 | ||||||
| Gain on sales of public equity investments | — | (1 | ) | |||||
| Other (income) expense, net | (96 | ) | 9 | |||||
| Tax effect | — | (1 | ) | |||||
| Net (gain) loss attributable to Magna | $ | (96 | ) | $ | 8 | |||
During the first quarter of 2026, the Company recorded an unrealized gain of $108 million [$108 million after tax] resulting from the revaluation of its existing private equity investment in Waymo LLC ("Waymo") following Waymo's completion of a new financing round. The non-cash impairment charge relates to the impairment of a private equity investment.
| 32 | Magna International Inc. First Quarter Report 2026 |
MAGNA INTERNATIONAL INC.
NOTES TO INTERIM CONSOLIDATED FINANCIAL STATEMENTS
[Unaudited]
[All amounts in U.S. dollars and all tabular amounts in millions unless otherwise noted]
4. EARNINGS PER SHARE
| Three
months ended March 31, | ||||||||
| 2026 | 2025 | |||||||
| Basic (loss) earnings per Common Share: | ||||||||
| Net (loss) income attributable to Magna International Inc. | $ | (12 | ) | $ | 146 | |||
| Weighted average number of Common Shares outstanding | 278.1 | 282.0 | ||||||
| Basic (loss) earnings per Common Share | $ | (0.04 | ) | $ | 0.52 | |||
| Diluted (loss) earnings per Common Share [a]: | ||||||||
| Net (loss) income attributable to Magna International Inc. | $ | (12 | ) | $ | 146 | |||
| Weighted average number of Common Shares outstanding | 278.1 | 282.0 | ||||||
| Stock options and share awards | — | — | ||||||
| 278.1 | 282.0 | |||||||
| Diluted (loss) earnings per Common Share | $ | (0.04 | ) | $ | 0.52 | |||
[a] For the three months ended March 31, 2026, diluted earnings per Common Share excluded 5.3 million [2025 - 5.8 million] Common Shares issuable under the Company's stock-based compensation plans because the effect of including them would have been anti-dilutive. The dilutive effect of participating securities using the two-class method was excluded from the calculation of earnings per share because the effect would be immaterial.
| Magna International Inc. First Quarter Report 2026 | 33 |
| MAGNA INTERNATIONAL INC. |
| NOTES TO INTERIM CONSOLIDATED FINANCIAL STATEMENTS |
| [Unaudited] |
| [All amounts in U.S. dollars and all tabular amounts in millions unless otherwise noted] |
| 5. | DETAILS OF CASH FROM OPERATING ACTIVITIES |
| [a] | Cash and cash equivalents consist of: |
| March 31, | December 31, | |||||||
| 2026 | 2025 | |||||||
| Cash | $ | 747 | $ | 960 | ||||
| Bank term deposits and bankers' acceptances | 858 | 652 | ||||||
| Cash and cash equivalents | $ | 1,605 | $ | 1,612 | ||||
| Restricted cash equivalents included in prepaid expenses and other [note 6] | 23 | — | ||||||
| $ | 1,628 | $ | 1,612 | |||||
| [b] | Items not involving current cash flows: |
Three months ended March 31, | ||||||||
| 2026 | 2025 | |||||||
| Depreciation | $ | 403 | $ | 369 | ||||
| Amortization of acquired intangible assets | 19 | 26 | ||||||
| Amortization of other assets and intangible assets included in cost of goods sold | 59 | 51 | ||||||
| Deferred revenue amortization | (100 | ) | (57 | ) | ||||
| Other non-cash charges | 4 | 13 | ||||||
| Deferred tax recovery | (50 | ) | (23 | ) | ||||
| Dividends received (less than) in excess of equity income | (84 | ) | 6 | |||||
| Non-cash portion of Other expense, net [note 3] | 387 | 9 | ||||||
| $ | 638 | $ | 394 | |||||
| [c] | Changes in operating assets and liabilities: |
| Three months
ended March 31, | ||||||||
| 2026 | 2025 | |||||||
| Accounts receivable | $ | (733 | ) | $ | (696 | ) | ||
| Inventories | (28 | ) | 39 | |||||
| Prepaid expenses and other | 12 | (10 | ) | |||||
| Accounts payable | 537 | 70 | ||||||
| Accrued salaries and wages | 69 | 7 | ||||||
| Other accrued liabilities | 174 | 185 | ||||||
| Income taxes payable (receivable) | 9 | (65 | ) | |||||
| $ | 40 | $ | (470 | ) | ||||
| 34 | Magna International Inc. First Quarter Report 2026 |
| MAGNA INTERNATIONAL INC. |
| NOTES TO INTERIM CONSOLIDATED FINANCIAL STATEMENTS |
| [Unaudited] |
| [All amounts in U.S. dollars and all tabular amounts in millions unless otherwise noted] |
| 6. | ACQUISITION OF NON-CONTROLLING INTEREST |
On August 29, 2025, the Company acquired the non-controlling 35% interest in a consolidated subsidiary, increasing the Company’s interest to 100%. The total purchase price was $143 million, of which $122 million was paid in 2025. The remaining $21 million was deposited into escrow during the first quarter of 2026 and is included in prepaid expenses and other. The acquisition was accounted for as an equity transaction, and resulted in a reduction to the Company’s non-controlling interest of $99 million and contributed surplus of $44 million.
| 7. | INVENTORIES |
Inventories consist of:
| March 31, | December 31, | |||||||
| 2026 | 2025 | |||||||
| Raw materials and supplies | $ | 1,576 | $ | 1,647 | ||||
| Work-in-process | 471 | 484 | ||||||
| Finished goods | 608 | 661 | ||||||
| Tooling and engineering | 1,309 | 1,334 | ||||||
| $ | 3,964 | $ | 4,126 | |||||
Tooling and engineering inventory represents costs incurred on tooling and engineering services contracts in excess of billed and unbilled amounts included in accounts receivable.
| 8. | INVESTMENTS |
March 31, 2026 | December 31,
2025 | |||||||
| Equity method investments | $ | 947 | $ | 846 | ||||
| Public and private equity investments | 316 | 225 | ||||||
| Debt investments | 26 | 32 | ||||||
| $ | 1,289 | $ | 1,103 | |||||
Cumulative unrealized gains and losses on equity securities held as at March 31, 2026 were $122 million and $11 million [$19 million and $18 million as at December 31, 2025], respectively.
| 9. | OTHER ASSETS |
Other assets consist of:
March 31, 2026 | December 31,
2025 | |||||||
| Preproduction costs related to long-term supply agreements | $ | 742 | $ | 759 | ||||
| Long-term receivables | 223 | 286 | ||||||
| Pension overfunded status | 75 | 75 | ||||||
| Unrealized gain on cash flow hedges | 79 | 83 | ||||||
| Other, net | 71 | 72 | ||||||
| $ | 1,190 | $ | 1,275 | |||||
| Magna International Inc. First Quarter Report 2026 | 35 |
| MAGNA INTERNATIONAL INC. |
| NOTES TO INTERIM CONSOLIDATED FINANCIAL STATEMENTS |
| [Unaudited] |
| [All amounts in U.S. dollars and all tabular amounts in millions unless otherwise noted] |
| 10. | WARRANTY |
The following is a continuity of the Company's warranty accruals:
| 2026 | 2025 | |||||||
| Balance, beginning of period | $ | 383 | $ | 309 | ||||
| Expense, net | 28 | 55 | ||||||
| Settlements | (36 | ) | (51 | ) | ||||
| Transfer to liabilities held for sale [note 2] | (5 | ) | — | |||||
| Foreign exchange and other | — | 5 | ||||||
| Balance, March 31 | $ | 370 | $ | 318 | ||||
| 11. | DEBT |
Short-term borrowings
[a] Commercial Paper Program
As at March 31, 2026, $135 million [no amounts outstanding as at December 31, 2025] of notes were outstanding under the U.S. commercial paper program, with a weighted average interest rate of 4.19%. The U.S. notes are backstopped by the Company's existing global credit facility. As at March 31, 2026, no notes were outstanding under the euro-commercial paper program [no amounts outstanding as at December 31, 2025].
[b] Credit Facilities
On April 22, 2026, the Company extended the maturity date of its $800 million 364-day syndicated revolving credit facility from June 24, 2026, to June 24, 2027. The facility can be drawn in U.S. dollars or Canadian dollars. As at March 31, 2026, no amounts are outstanding under this credit facility.
Long-term borrowings
[a] Global Credit Facility
On April 22, 2026, the Company extended the maturity date of its $2.7 billion syndicated revolving credit facility from June 25, 2030 to June 25, 2031. As at March 31, 2026, no amounts are outstanding under this credit facility.
[b] Term Loan Facilities
On January 12, 2026, the Company’s $350 million 3-year tranche syndicated, unsecured, delayed draw term loan facility expired with no amount drawn.
| 12. | INCOME TAXES |
For the three months ended March 31, 2026, the Company’s effective income tax rate does not reflect the customary rate primarily due to the loss on assets held for sale and revaluations of investments described in note 3.
For the three months ended March 31, 2025, the Company’s effective income tax rate does not reflect the customary rate due to higher losses not benefited in Europe.
| 36 | Magna International Inc. First Quarter Report 2026 |
| MAGNA INTERNATIONAL INC. |
| NOTES TO INTERIM CONSOLIDATED FINANCIAL STATEMENTS |
| [Unaudited] |
| [All amounts in U.S. dollars and all tabular amounts in millions unless otherwise noted] |
| 13. | CAPITAL STOCK |
| [a] | During the first quarter of 2026, the Company repurchased 7.6 million shares under a normal course issuer bid for cash consideration of $440 million. |
| [b] | The following table presents the maximum number of shares that would be outstanding if all the dilutive instruments outstanding at April 30, 2026 were exercised or converted: |
| Common Shares | 272,224,550 | |||
| Stock options [i] and share awards | 4,559,643 | |||
| 276,784,193 |
| [i] | Options to purchase Common Shares are exercisable by the holder in accordance with the vesting provisions and upon payment of the exercise price as may be determined from time to time pursuant to the Company's stock option plans. |
| 14. | ACCUMULATED OTHER COMPREHENSIVE LOSS |
The following is a continuity schedule of accumulated other comprehensive loss:
| 2026 | 2025 | |||||||
| Accumulated net unrealized loss on translation of net investment in foreign operations | ||||||||
| Balance, beginning of period | $ | (802 | ) | $ | (1,368 | ) | ||
| Net unrealized (loss) gain | (56 | ) | 186 | |||||
| Repurchase of shares under normal course issuer bid | 9 | 2 | ||||||
| Balance, March 31 | (849 | ) | (1,180 | ) | ||||
| Accumulated net unrealized gain (loss) on cash flow hedges [i] | ||||||||
| Balance, beginning of period | 99 | (113 | ) | |||||
| Net unrealized (loss) gain | (6 | ) | 49 | |||||
| Reclassifications to net income | (13 | ) | 16 | |||||
| Balance, March 31 | 80 | (48 | ) | |||||
| Accumulated net unrealized loss on other long-term liabilities | ||||||||
| Balance, beginning of period | (65 | ) | (103 | ) | ||||
| Revaluation | (1 | ) | — | |||||
| Reclassifications to net income | — | 1 | ||||||
| Balance, March 31 | (66 | ) | (102 | ) | ||||
| Accumulated net unrealized gain on available-for-sale investments | ||||||||
| Balance, beginning of period | 2 | — | ||||||
| Balance, March 31 | 2 | — | ||||||
| Total accumulated other comprehensive loss | $ | (833 | ) | $ | (1,330 | ) | ||
| [i] | The amount of income tax expense that has been netted in the accumulated net unrealized (loss) gain on cash flow hedges is as follows: |
| 2026 | 2025 | |||||||
| Balance, beginning of period | $ | (39 | ) | $ | 44 | |||
| Net unrealized gain (loss) | 3 | (17 | ) | |||||
| Reclassifications to net income | 4 | (7 | ) | |||||
| Balance, March 31 | $ | (32 | ) | $ | 20 | |||
The amount of other comprehensive gain that is expected to be reclassified to net income over the next 12 months is $75 million.
| Magna International Inc. First Quarter Report 2026 | 37 |
| MAGNA INTERNATIONAL INC. |
| NOTES TO INTERIM CONSOLIDATED FINANCIAL STATEMENTS |
| [Unaudited] |
| [All amounts in U.S. dollars and all tabular amounts in millions unless otherwise noted] |
| 15. | FINANCIAL INSTRUMENTS |
| [a] | Financial assets and liabilities |
The Company's financial assets and financial liabilities consist of the following:
| March 31, | December 31, | |||||||
| 2026 | 2025 | |||||||
| Financial assets | ||||||||
| Cash and cash equivalents | $ | 1,605 | $ | 1,612 | ||||
| Restricted cash equivalents included in prepaid expenses and other [note 6] | 23 | — | ||||||
| Accounts receivable | 8,215 | 7,593 | ||||||
| Public and private equity investments | 316 | 225 | ||||||
| Debt investments | 26 | 32 | ||||||
| Long-term receivables included in other assets | 223 | 286 | ||||||
| Financial assets held for sale [note 2] | ||||||||
| Accounts receivable held for sale | 173 | — | ||||||
| $ | 10,581 | $ | 9,748 | |||||
| Financial liabilities | ||||||||
| Short-term borrowing | $ | 136 | $ | — | ||||
| Long-term debt (including current portion) | 4,663 | 4,712 | ||||||
| Operating lease liability (including current portion) | 1,901 | 1,977 | ||||||
| Accounts payable | 7,216 | 6,895 | ||||||
| Financial liabilities held for sale [note 2] | ||||||||
| Accounts payable held for sale | 189 | — | ||||||
| $ | 14,105 | $ | 13,584 | |||||
| Foreign currency contracts designated as effective hedges, measured at fair value | ||||||||
| Prepaid expenses | $ | 97 | $ | 98 | ||||
| Other assets | 79 | 83 | ||||||
| Other accrued liabilities | (27 | ) | (19 | ) | ||||
| Other long-term liabilities | (40 | ) | (19 | ) | ||||
| $ | 109 | $ | 143 | |||||
| [b] | Supplier financing program |
The Company has supplier financing programs with third-party financial institutions that provide financing to suppliers that provide tooling related materials. These arrangements allow these suppliers to elect to be paid by a financial institution at a discount earlier than the maturity date of the receivable, which may extend from 6 to 18 months. The Company pays the full amount owing to the financial institution on the maturity dates. Amounts outstanding under these programs as at March 31, 2026 were $92 million [$116 million as at December 31, 2025] and are presented within accounts payable.
| [c] | Fair value |
The Company determines the estimated fair values of its financial instruments based on valuation methodologies it believes are appropriate; however, considerable judgment is required to develop these estimates. Accordingly, these estimated fair values are not necessarily indicative of the amounts the Company could realize in a current market exchange. The estimated fair value amounts can be materially affected by the use of different assumptions or methodologies. The methods and assumptions used to estimate the fair value of financial instruments are described below:
Cash and cash equivalents, restricted cash equivalents, accounts receivable, accounts payable and short-term borrowings
Due to the short period to maturity of the instruments, the carrying values as presented in the consolidated balance sheets are reasonable estimates of fair values.
| 38 | Magna International Inc. First Quarter Report 2026 |
| MAGNA INTERNATIONAL INC. |
| NOTES TO INTERIM CONSOLIDATED FINANCIAL STATEMENTS |
| [Unaudited] |
| [All amounts in U.S. dollars and all tabular amounts in millions unless otherwise noted] |
| 15. | Financial instruments (CONTINUED) |
Publicly traded and private equity securities
The fair value of the Company’s investments in publicly traded equity securities is determined using the closing price on the measurement date, as reported on the stock exchange on which the securities are traded [Level 1 input based on the GAAP fair value hierarchy].
The Company estimates the value of its private equity securities based on valuation methods using the observable transaction price at the transaction date and other observable inputs including rights and obligations of the securities held by the Company [Level 3 input based on the GAAP fair value hierarchy].
Senior Notes
At March 31, 2026, the net book value and the estimated fair value of the Company’s Senior Notes were $4.6 billion. The fair value of our Senior Notes are classified as Level 1 when quoted prices in active markets are available and Level 2 when the quoted prices are from less active markets or when other observable inputs are used to determine fair value.
| [d] | Credit risk |
The Company's financial assets that are exposed to credit risk consist primarily of cash and cash equivalents, accounts receivable, debt investments, and foreign exchange and commodity forward contracts with positive fair values. Cash and cash equivalents, which consist of short-term investments, are only invested in bank term deposits and bank commercial paper with an investment grade credit rating. Credit risk is further reduced by limiting the amount which is invested in certain major financial institutions.
The Company is also exposed to credit risk from the potential default by any of its counterparties on its foreign exchange forward contracts. The Company mitigates this credit risk by dealing with counterparties who are major financial institutions that the Company anticipates will satisfy their obligations under the contracts.
In the normal course of business, the Company is exposed to credit risk from its customers, substantially all of which are in the automotive industry and are subject to credit risks associated with the automotive industry. For the three months ended March 31, 2026, sales to the Company's six largest customers represented 76% of the Company's total sales; and substantially all of its sales are to customers with which the Company has ongoing contractual relationships. The Company conducts business with newer electric vehicle-focused customers, which poses incremental credit risk due to their relatively short operating histories; limited financial resources; less mature product development and validation processes; uncertain market acceptance of their products/services; and untested business models. These factors may elevate the Company’s risks in dealing with such customers, particularly with respect to recovery of: pre-production (including tooling, engineering, and launch) and production receivables; inventory; fixed assets and capitalized preproduction expenditures; as well as other third party obligations related to such items. As at March 31, 2026, the Company’s balance sheet exposure related to newer electric vehicle-focused customers was approximately $200 million [$200 million as at December 31, 2025] and sales to these customers represented less than 5% of the Company’s total sales. In determining the allowance for expected credit losses, the Company considers changes in customers’ credit ratings, liquidity, customers’ historical payments and loss experience, current economic conditions, and the Company's expectations of future economic conditions.
| Magna International Inc. First Quarter Report 2026 | 39 |
| MAGNA INTERNATIONAL INC. |
| NOTES TO INTERIM CONSOLIDATED FINANCIAL STATEMENTS |
| [Unaudited] |
| [All amounts in U.S. dollars and all tabular amounts in millions unless otherwise noted] |
| 15. | Financial instruments (continued) |
| [e] | Interest rate risk |
The Company is not exposed to significant interest rate risk due to the short-term maturity of its monetary current assets and current liabilities. In particular, the amount of interest income earned on cash and cash equivalents is impacted more by investment decisions made and the demands to have available cash on hand, than by movements in interest rates over a given period.
The Company is exposed to interest rate risk on its Term Loans as the interest rate is variable, however the Company is not exposed to interest rate risk on Senior Notes as the interest rates are fixed.
| [f] | Currency risk and foreign exchange contracts |
The Company is exposed to fluctuations in foreign exchange rates when manufacturing facilities have committed to the delivery of products for which the selling price has been quoted in currencies other than the facilities' functional currency, and when materials and equipment are purchased in currencies other than the facilities' functional currency. In an effort to manage this net foreign exchange exposure, the Company employs hedging programs, primarily through the use of foreign exchange forward contracts.
At March 31, 2026, the Company had outstanding foreign exchange forward contracts representing commitments to buy and sell various foreign currencies. Significant commitments are as follows:
| For Canadian dollars | For U.S. dollars | For Euros | |||||||||||||||||||||
| Weighted | Mexican | Weighted | Weighted | Czech | Weighted | ||||||||||||||||||
| U.S. dollar | average | Peso | average | U.S. dollar | average | Koruna | average | ||||||||||||||||
| amount | rate | amount | rate | amount | rate | Amount | rate | ||||||||||||||||
| Buy | 193 | 1.34464 | 23,931 | 0.04871 | 1,505 | 0.84526 | 13,138 | 0.03978 | |||||||||||||||
| (Sell) | (1,755 | ) | 0.74534 | (74 | ) | 20.21642 | (1,617 | ) | 1.17936 | — | — | ||||||||||||
Forward contracts mature at various dates through 2030. Foreign currency exposures are reviewed quarterly.
| 40 | Magna International Inc. First Quarter Report 2026 |
| MAGNA INTERNATIONAL INC. |
| NOTES TO INTERIM CONSOLIDATED FINANCIAL STATEMENTS |
| [Unaudited] |
| [All amounts in U.S. dollars and all tabular amounts in millions unless otherwise noted] |
| 16. | CONTINGENCIES |
From time to time, the Company may become involved in regulatory proceedings, or become liable for legal, contractual and other claims by various parties, including customers, suppliers, former employees, class action plaintiffs and others. On an ongoing basis, the Company attempts to assess the likelihood of any adverse judgements or outcomes to these proceedings or claims, together with potential ranges of probable costs and losses. A determination of the provision required, if any, for these contingencies is made after analysis of each individual issue. The required provision may change in the future due to new developments in each matter or changes in approach such as a change in settlement strategy in dealing with these matters.
In the third quarter of 2025, Ford initiated recalls covering approximately 3.8 million vehicles equipped with rearview cameras or image processing modules supplied by the Company. Ford also announced a new 15-year extended warranty program for up to approximately 14.9 million vehicles also equipped with rearview cameras supplied by us. Ford is claiming approximately $288 million in costs related to these recalls and warranty claims. Additional recalls and/or extended warranty programs remain possible. The Company is in technical and commercial discussions with Ford, however, at this time, root cause determinations have not been made and/or confirmed for the vehicles covered by Ford’s recalls and warranty extension program. Even after root cause(s) have been determined, other challenges make it difficult to fully quantify the Company’s potential financial exposure, if any. These challenges include: integration with other vehicle systems and non-camera components; the age of affected vehicles; duration of the original warranty; number of affected vehicles brought to Ford dealers for inspection; and dealer discretion to determine the nature of the remedy to be applied, which may range from software upgrades, inspection of the rearview camera and other components, repairs, or replacement of the rearview camera. In the absence of certainty as to the scope of potentially affected vehicles, the root cause(s) of the alleged product failures, and/or the related costs of service actions, the Company is unable to fully estimate its potential exposure, if any, for recall-related costs and the extension of product warranties by Ford to affected vehicle owners. If the Company is determined to be fully or partially responsible for defective rearview cameras, any recall and extended warranty costs in excess of amounts accrued could be material to the Company’s profitability in the period(s) in which such costs are recognized or provided for.
As a result of the bankruptcy of Fisker, Inc., owners of Fisker Ocean SUVs have asserted claims for alleged vehicle defects and breaches of state “lemon laws” against J.P. Morgan Chase, N.A. [“Chase”], the direct financer of approximately 2,000 such vehicles in the United States. Chase has indicated that it will seek indemnification from the Company, as contract manufacturer, for damages and legal costs incurred with the resolution of these claims. The Company has insufficient information to determine the existence or extent of potential liability, if any, related to this matter at this time.
| Magna International Inc. First Quarter Report 2026 | 41 |
| MAGNA INTERNATIONAL INC. |
| NOTES TO INTERIM CONSOLIDATED FINANCIAL STATEMENTS |
| [Unaudited] |
| [All amounts in U.S. dollars and all tabular amounts in millions unless otherwise noted] |
| 17. | SEGMENTED INFORMATION |
Magna is a global automotive supplier which has complete vehicle engineering and contract manufacturing expertise, as well as product capabilities which include body, chassis, exterior, seating, powertrain, active driver assistance, electronics, mirrors & lighting, mechatronics, and roof systems.
The Company is organized under four operating segments: Body Exteriors & Structures, Power & Vision, Seating Systems, and Complete Vehicles. These segments have been determined on the basis of technological opportunities, product similarities, market and operating factors, and are also the Company's reportable segments.
The Company's chief operating decision maker is the Chief Executive Officer. The chief operating decision maker uses Adjusted Earnings before Interest and Income Taxes ["Adjusted EBIT"] as the measure of segment profit or loss, since management believes Adjusted EBIT is the most appropriate measure of operational profitability or loss for its reporting segments. The chief operating decision maker uses Adjusted EBIT to assess operating performance, allocate resources, and to help plan the Company's long-term strategic direction and future global growth. Adjusted EBIT is calculated by taking Net income and adding back Amortization of acquired intangible assets, Income taxes, Interest expense, net and Other expense (income), net.
| [a] | The following tables show segment information for the Company's reporting segments and a reconciliation of Adjusted EBIT to the Company's consolidated net income: |
| Three months ended March 31, 2026 | ||||||||||||||||||||||||
| Fixed | ||||||||||||||||||||||||
| Total | External | Adjusted | Equity | asset | ||||||||||||||||||||
| sales | sales | EBIT [ii] | Depreciation | income | additions | |||||||||||||||||||
| Body Exteriors & Structures | $ | 4,079 | $ | 4,018 | $ | 274 | $ | 206 | $ | (1 | ) | $ | 87 | |||||||||||
| Power & Vision | 3,881 | 3,801 | 252 | 145 | (84 | ) | 95 | |||||||||||||||||
| Seating Systems | 1,340 | 1,335 | 25 | 25 | (10 | ) | 18 | |||||||||||||||||
| Complete Vehicles | 1,224 | 1,219 | 32 | 19 | — | 11 | ||||||||||||||||||
| Corporate & Other [i] | (143 | ) | 8 | (25 | ) | 8 | — | 8 | ||||||||||||||||
| Total Reportable Segments | $ | 10,381 | $ | 10,381 | $ | 558 | $ | 403 | $ | (95 | ) | $ | 219 | |||||||||||
| Three months ended March 31, 2025 | ||||||||||||||||||||||||
| Fixed | ||||||||||||||||||||||||
| Total | External | Adjusted | Equity | asset | ||||||||||||||||||||
| sales | sales | EBIT [ii] | Depreciation | income | additions | |||||||||||||||||||
| Body Exteriors & Structures | $ | 3,966 | $ | 3,908 | $ | 230 | $ | 184 | $ | (1 | ) | $ | 129 | |||||||||||
| Power & Vision | 3,646 | 3,575 | 124 | 135 | (14 | ) | 104 | |||||||||||||||||
| Seating Systems | 1,312 | 1,310 | (30 | ) | 25 | (4 | ) | 17 | ||||||||||||||||
| Complete Vehicles | 1,276 | 1,267 | 44 | 18 | (1 | ) | 12 | |||||||||||||||||
| Corporate & Other [i] | (131 | ) | 9 | (14 | ) | 7 | — | 6 | ||||||||||||||||
| Total Reportable Segments | $ | 10,069 | $ | 10,069 | $ | 354 | $ | 369 | $ | (20 | ) | $ | 268 | |||||||||||
[i] Included in Corporate & Other Adjusted EBIT are intercompany fees charged to the automotive segments.
[ii] The following table reconciles Net income to Adjusted EBIT:
| Three months
ended March 31, | ||||||||
| 2026 | 2025 | |||||||
| Net income | $ | (1 | ) | $ | 153 | |||
| Add: | ||||||||
| Amortization of acquired intangible assets | 19 | 26 | ||||||
| Interest expense, net | 37 | 50 | ||||||
| Other expense, net | 415 | 53 | ||||||
| Income taxes | 88 | 72 | ||||||
| Adjusted EBIT | $ | 558 | $ | 354 | ||||
| 42 | Magna International Inc. First Quarter Report 2026 |
| MAGNA INTERNATIONAL INC. |
| NOTES TO INTERIM CONSOLIDATED FINANCIAL STATEMENTS |
| [Unaudited] |
| [All amounts in U.S. dollars and all tabular amounts in millions unless otherwise noted] |
| 17. | Segmented Information (CONTINUED) |
Other segment items constitute the difference between External sales by segment and Adjusted EBIT by segment, and are comprised of cost of goods sold, selling, general, and administrative expenses, depreciation, and equity income. No significant expense categories are being provided to the chief operating decision maker on a regular basis.
| [b] | The following table shows segment information for Goodwill, Investments, and Net Assets for the Company's reporting segments: |
| March 31, 2026 | December 31, 2025 | |||||||||||||||||||||||
| Goodwill | Investments | Net Assets | Goodwill | Investments | Net Assets | |||||||||||||||||||
| Body Exteriors & Structures | $ | 458 | $ | 26 | $ | 8,584 | $ | 461 | $ | 24 | $ | 8,725 | ||||||||||||
| Power & Vision [i] | 1,613 | 628 | 6,379 | 1,654 | 524 | 6,699 | ||||||||||||||||||
| Seating Systems | 261 | 217 | 1,338 | 260 | 226 | 1,372 | ||||||||||||||||||
| Complete Vehicles | 113 | 116 | 421 | 116 | 115 | 471 | ||||||||||||||||||
| Corporate & Other | 19 | 302 | 1,062 | 21 | 214 | 1,029 | ||||||||||||||||||
| Total Reportable Segments | $ | 2,464 | $ | 1,289 | $ | 17,784 | $ | 2,512 | $ | 1,103 | $ | 18,296 | ||||||||||||
[i] Includes $20 million of net assets held for sale
| [c] | The following table reconciles Total Assets to Net Assets: |
March 31, 2026 | December 31,
2025 | |||||||
| Total Assets | $ | 31,660 | $ | 31,417 | ||||
| Deduct assets not included in segment net assets: | ||||||||
| Cash and cash equivalents | (1,605 | ) | (1,612 | ) | ||||
| Deferred tax assets | (881 | ) | (864 | ) | ||||
| Long-term receivables from joint venture partners | (84 | ) | (117 | ) | ||||
| Assets held for sale | (47 | ) | — | |||||
| Deduct liabilities included in segment net assets: | ||||||||
| Accounts payable | (7,216 | ) | (6,895 | ) | ||||
| Accrued salaries and wages | (920 | ) | (888 | ) | ||||
| Other accrued liabilities | (2,878 | ) | (2,745 | ) | ||||
| Liabilities held for sale | (245 | ) | — | |||||
| Segment Net Assets | $ | 17,784 | $ | 18,296 | ||||
| 18. | SUBSEQUENT EVENT |
Normal Course Issuer Bid
Subsequent to March 31, 2026, the Company purchased 2,300,000 Common Shares for cancellation under its existing normal course issuer bid for cash consideration of $136 million.
| Magna International Inc. First Quarter Report 2026 | 43 |