.2
May 1, 2026 Q1 2026 Results Q1 2026 Results Webcast 01MAY26 1

Vice President, Investor Relations Louis Tonelli Q1 2026 Results Webcast 01MAY26 2
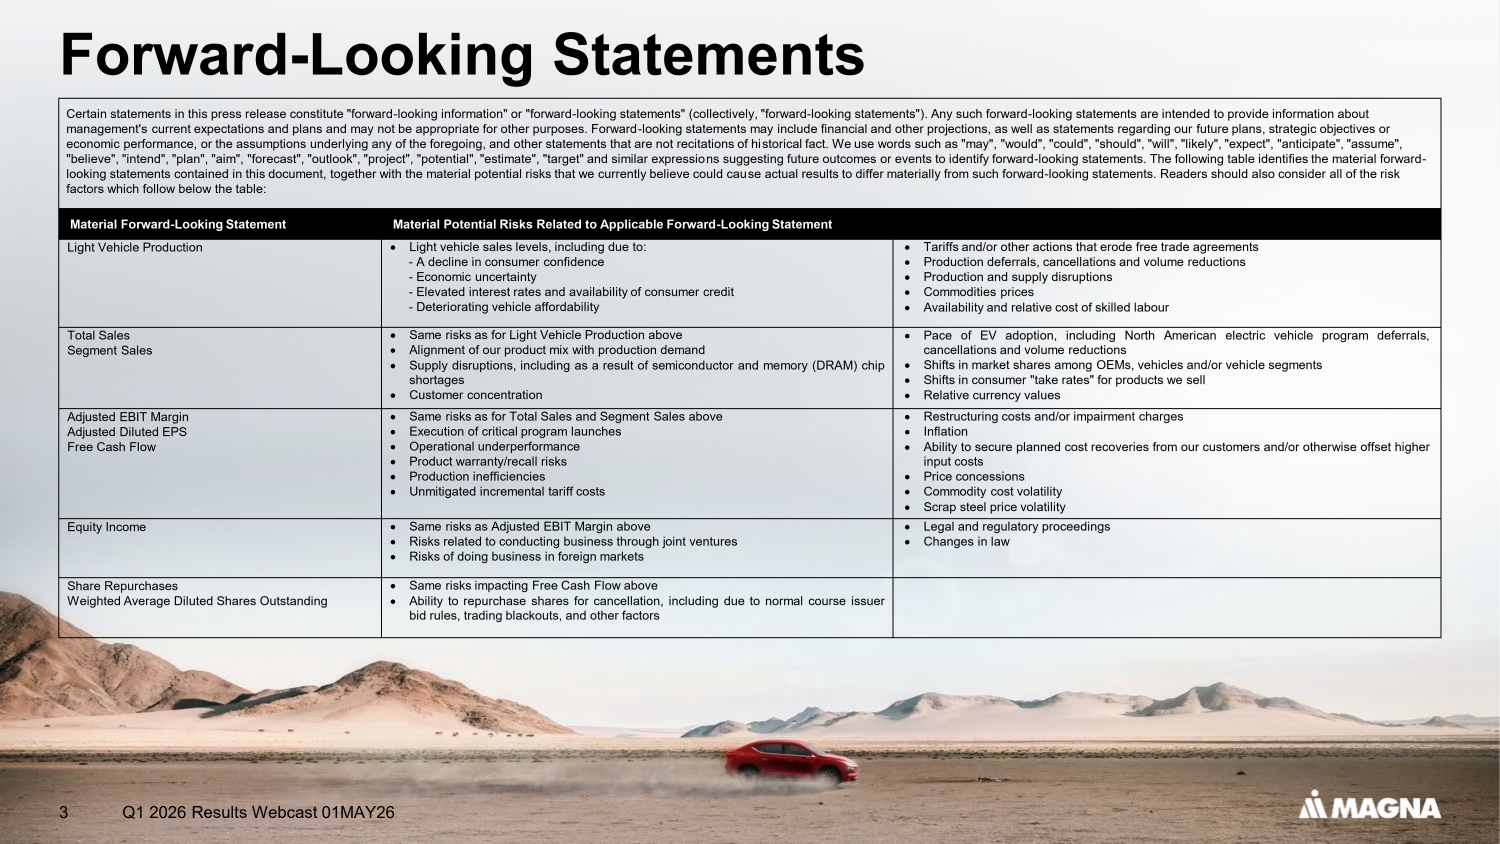
Forward - Looking Statements Certain statements in this press release constitute "forward - looking information" or "forward - looking statements" (collectively, "forward - looking statements"). Any such forward - looking statements are intended to provide information about management's current expectations and plans and may not be appropriate for other purposes. Forward - looking statements may includ e financial and other projections, as well as statements regarding our future plans, strategic objectives or economic performance, or the assumptions underlying any of the foregoing, and other statements that are not recitations of hi sto rical fact. We use words such as "may", "would", "could", "should", "will", "likely", "expect", "anticipate", "assume", "believe", "intend", "plan", "aim", "forecast", "outlook", "project", "potential", "estimate", "target" and similar expressio ns suggesting future outcomes or events to identify forward - looking statements. The following table identifies the material forward - looking statements contained in this document, together with the material potential risks that we currently believe could cau se actual results to differ materially from such forward - looking statements. Readers should also consider all of the risk factors which follow below the table: Material Potential Risks Related to Applicable Forward - Looking Statement Material Forward - Looking Statement Tariffs and/or other actions that erode free trade agreements Production deferrals, cancellations and volume reductions Production and supply disruptions Commodities prices Availability and relative cost of skilled labour Light vehicle sales levels, including due to : - A decline in consumer confidence - Economic uncertainty - Elevated interest rates and availability of consumer credit - Deteriorating vehicle affordability Light Vehicle Production Pace of EV adoption, including North American electric vehicle program deferrals, cancellations and volume reductions Shifts in market shares among OEMs, vehicles and/or vehicle segments Shifts in consumer "take rates" for products we sell Relative currency values Same risks as for Light Vehicle Production above Alignment of our product mix with production demand Supply disruptions, including as a result of semiconductor and memory (DRAM) chip shortages Customer concentration Total Sales Segment Sales Restructuring costs and/or impairment charges Inflation Ability to secure planned cost recoveries from our customers and/or otherwise offset higher input costs Price concessions Commodity cost volatility Scrap steel price volatility Same risks as for Total Sales and Segment Sales above Execution of critical program launches Operational underperformance Product warranty/recall risks Production inefficiencies Unmitigated incremental tariff costs Adjusted EBIT Margin Adjusted Diluted EPS Free Cash Flow Legal and regulatory proceedings Changes in law Same risks as Adjusted EBIT Margin above Risks related to conducting business through joint ventures Risks of doing business in foreign markets Equity Income Same risks impacting Free Cash Flow above Ability to repurchase shares for cancellation, including due to normal course issuer bid rules, trading blackouts, and other factors Share Repurchases Weighted Average Diluted Shares Outstanding Q1 2026 Results Webcast 01MAY26 3
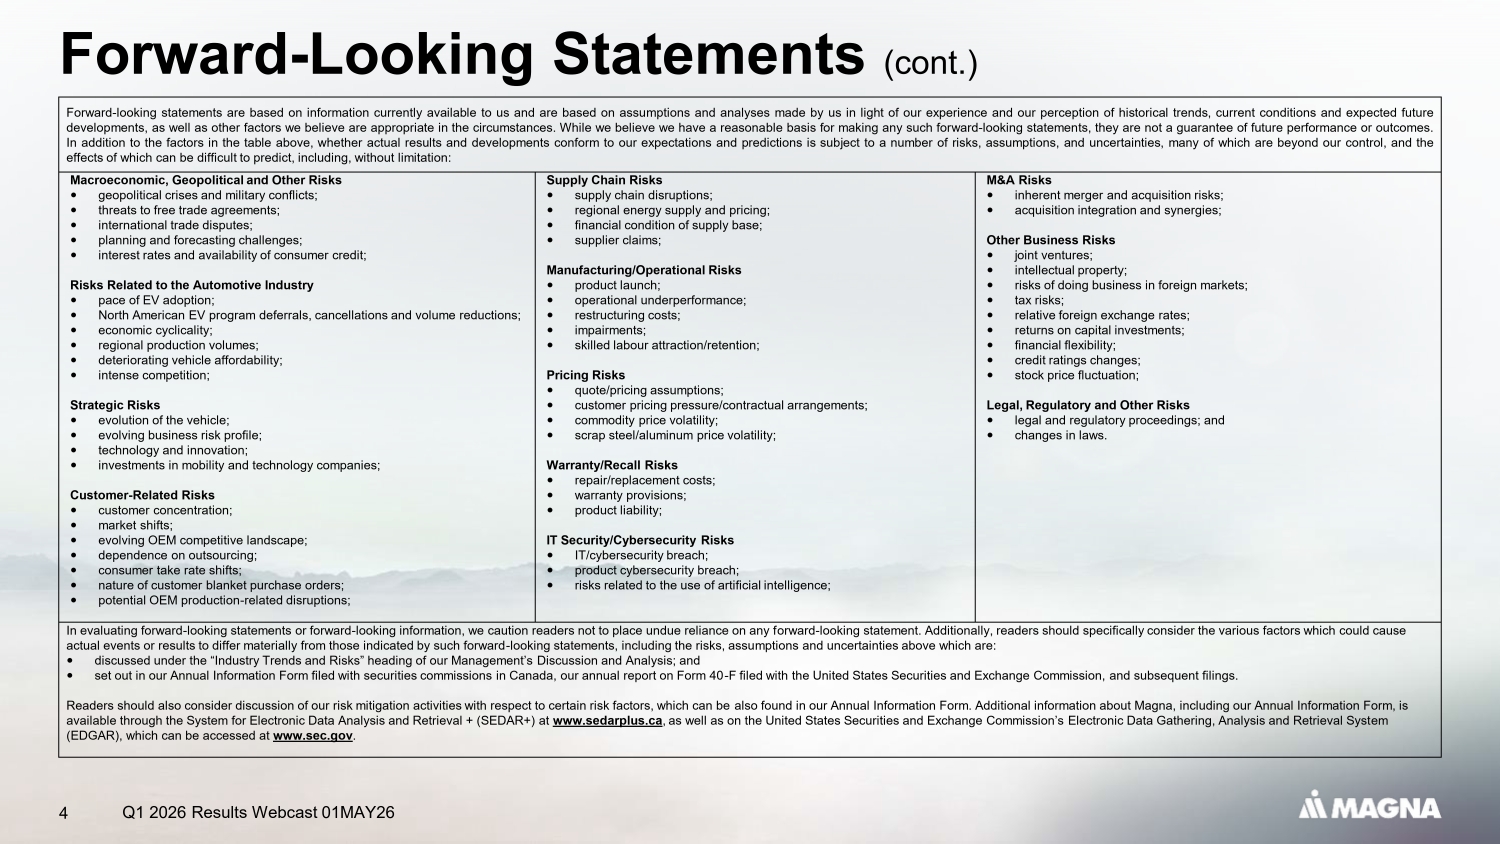
Forward - Looking Statements (cont.) 4 Forward - looking statements are based on information currently available to us and are based on assumptions and analyses made by us in light of our experience and our perception of historical trends, current conditions and expected future developments, as well as other factors we believe are appropriate in the circumstances . While we believe we have a reasonable basis for making any such forward - looking statements, they are not a guarantee of future performance or outcomes . In addition to the factors in the table above, whether actual results and developments conform to our expectations and predictions is subject to a number of risks, assumptions, and uncertainties, many of which are beyond our control, and the effects of which can be difficult to predict, including, without limitation : M&A Risks inherent merger and acquisition risks; acquisition integration and synergies; Other Business Risks joint ventures; intellectual property; risks of doing business in foreign markets; tax risks; relative foreign exchange rates; returns on capital investments; financial flexibility; credit ratings changes; stock price fluctuation; Legal, Regulatory and Other Risks legal and regulatory proceedings; and changes in laws. Supply Chain Risks supply chain disruptions; regional energy supply and pricing; financial condition of supply base; supplier claims; Manufacturing/Operational Risks product launch; operational underperformance; restructuring costs; impairments; skilled labour attraction/retention; Pricing Risks quote/pricing assumptions; customer pricing pressure/contractual arrangements; commodity price volatility; scrap steel/aluminum price volatility; Warranty/Recall Risks repair/replacement costs; warranty provisions; product liability; IT Security/Cybersecurity Risks IT/cybersecurity breach; product cybersecurity breach; risks related to the use of artificial intelligence; Macroeconomic, Geopolitical and Other Risks geopolitical crises and military conflicts; threats to free trade agreements; international trade disputes; planning and forecasting challenges; interest rates and availability of consumer credit; Risks Related to the Automotive Industry pace of EV adoption; North American EV program deferrals, cancellations and volume reductions; economic cyclicality; regional production volumes; deteriorating vehicle affordability; intense competition; Strategic Risks evolution of the vehicle; evolving business risk profile; technology and innovation; investments in mobility and technology companies; Customer - Related Risks customer concentration; market shifts; evolving OEM competitive landscape; dependence on outsourcing; consumer take rate shifts; nature of customer blanket purchase orders; potential OEM production - related disruptions; In evaluating forward - looking statements or forward - looking information, we caution readers not to place undue reliance on any f orward - looking statement. Additionally, readers should specifically consider the various factors which could cause actual events or results to differ materially from those indicated by such forward - looking statements, including the risks, assu mptions and uncertainties above which are: discussed under the “Industry Trends and Risks” heading of our Management’s Discussion and Analysis; and set out in our Annual Information Form filed with securities commissions in Canada, our annual report on Form 40 - F filed with th e United States Securities and Exchange Commission, and subsequent filings. Readers should also consider discussion of our risk mitigation activities with respect to certain risk factors, which can be als o found in our Annual Information Form. Additional information about Magna, including our Annual Information Form, is available through the System for Electronic Data Analysis and Retrieval + (SEDAR+) at www.sedarplus.ca , as well as on the United States Securities and Exchange Commission’s Electronic Data Gathering, Analysis and Retrieval Syst em (EDGAR), which can be accessed at www.sec.gov . Q1 2026 Results Webcast 01MAY26
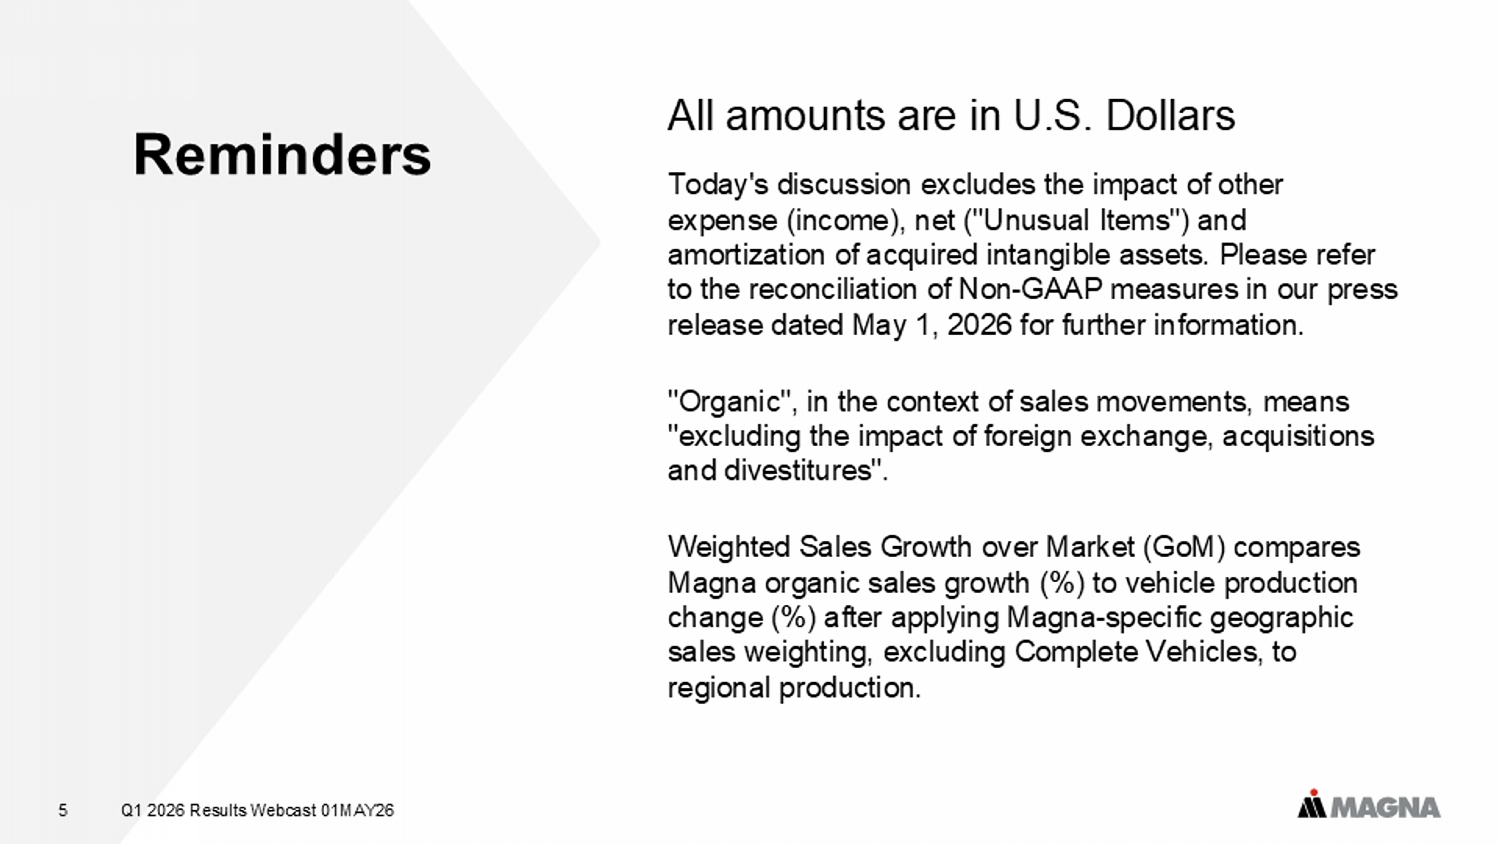
Today's discussion excludes the impact of other expense (income), net ("Unusual Items") and amortization of acquired intangible assets. Please refer to the reconciliation of Non - GAAP measures in our press release dated May 1, 2026 for further information. "Organic", in the context of sales movements, means "excluding the impact of foreign exchange, acquisitions and divestitures". Weighted Sales Growth over Market (GoM) compares Magna organic sales growth (%) to vehicle production change (%) after applying Magna - specific geographic sales weighting, excluding Complete Vehicles, to regional production. All amounts are in U.S. Dollars Reminders Q1 2026 Results Webcast 01MAY26 5
Chief Executive Officer Swamy Kotagiri Q1 2026 Results Webcast 01MAY26 6
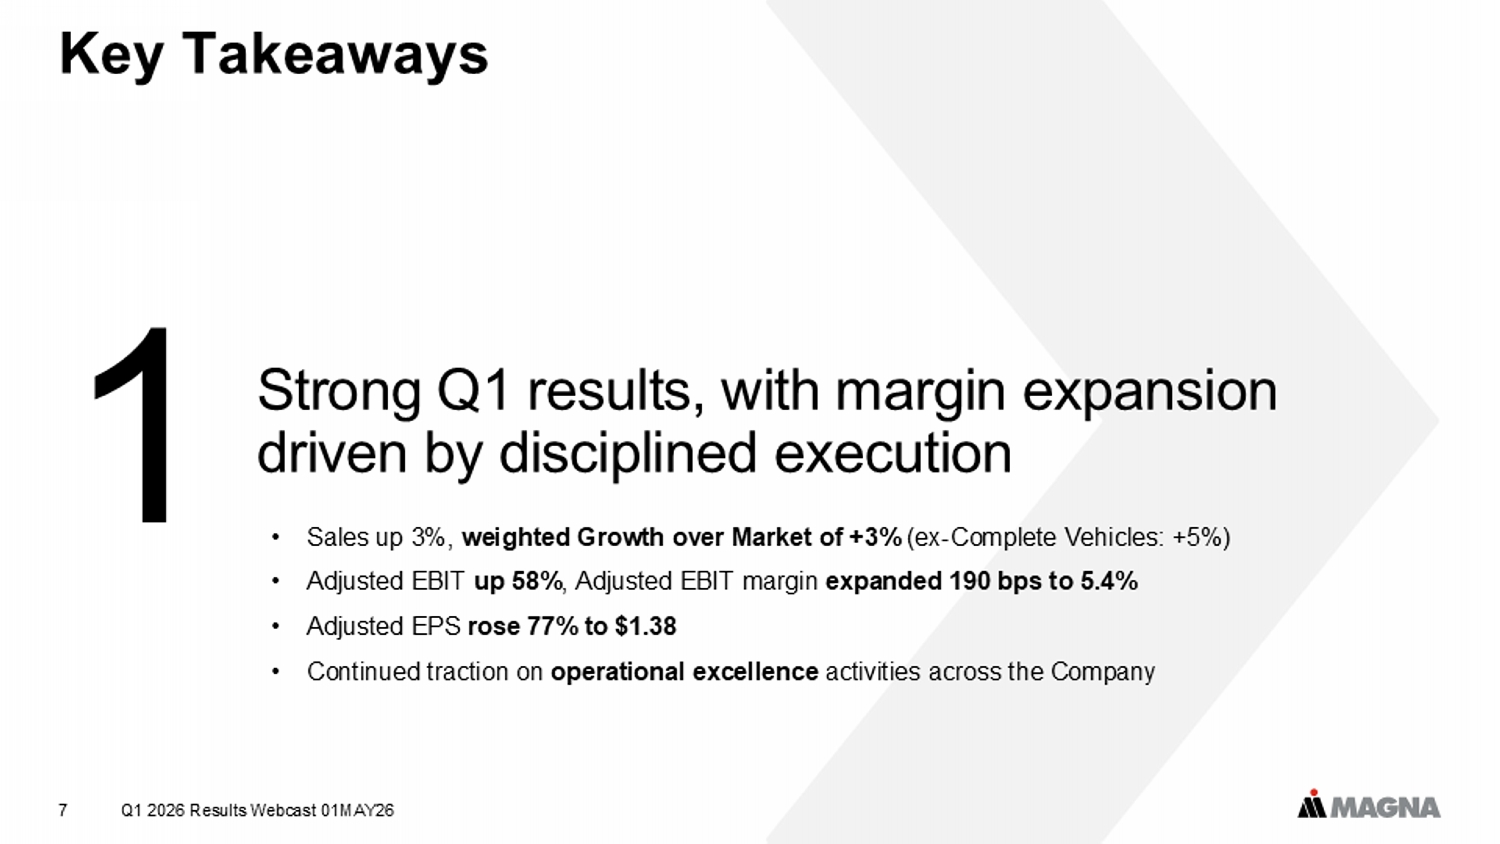
Key Takeaways Q1 2026 Results Webcast 01MAY26 7 Strong Q1 results, with margin expansion driven by disciplined execution 1 • Sales up 3%, weighted Growth over Market of +3% (ex - Complete Vehicles: +5%) • Adjusted EBIT up 58% , Adjusted EBIT margin expanded 190 bps to 5.4% • Adjusted EPS rose 77% to $1.38 • Continued traction on operational excellence activities across the Company
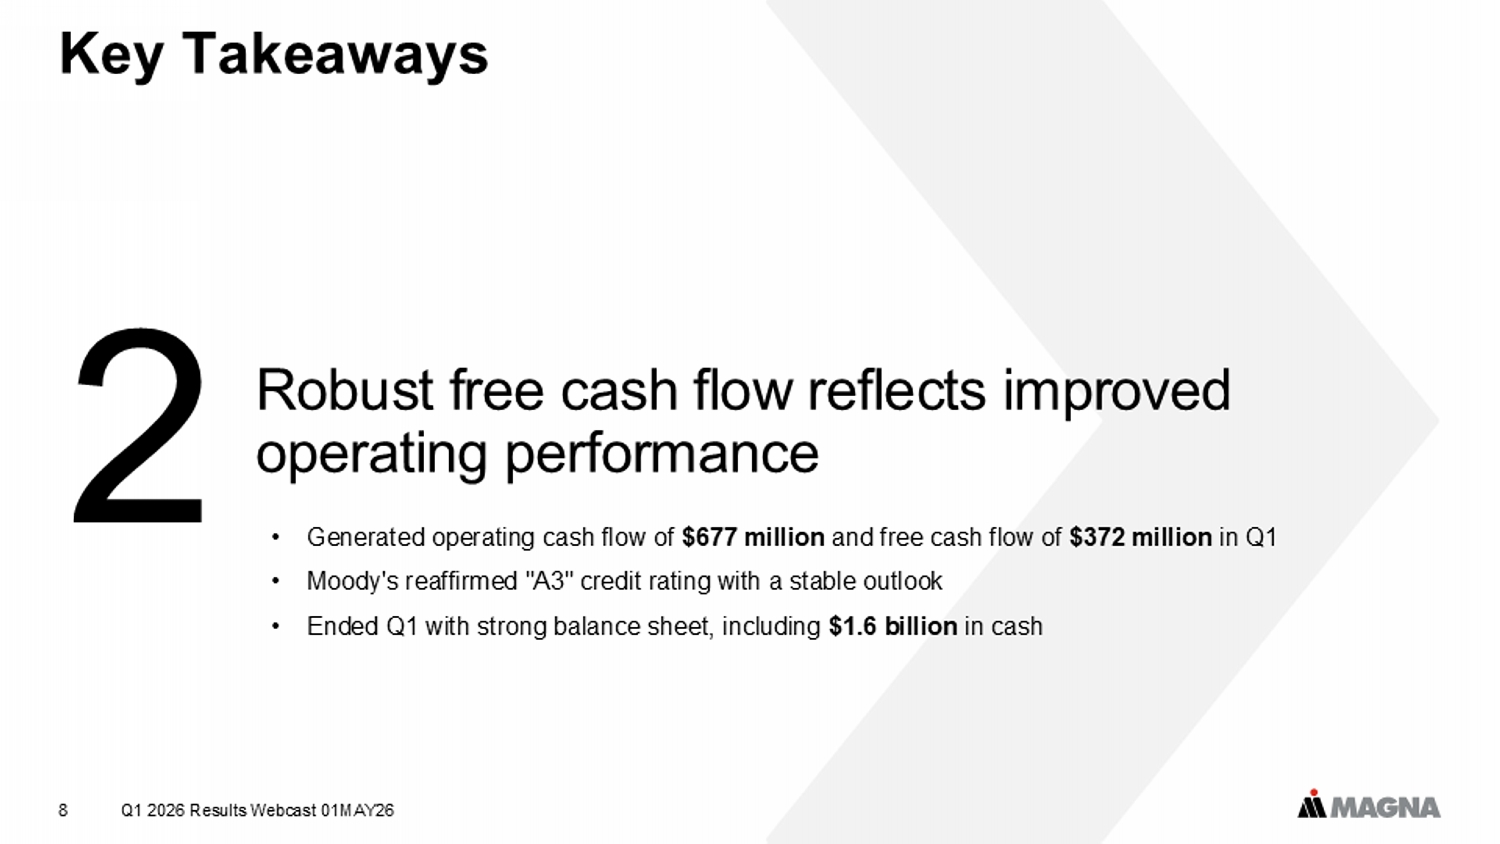
Key Takeaways Q1 2026 Results Webcast 01MAY26 8 Robust free cash flow reflects improved operating performance 2 • Generated operating cash flow of $677 million and free cash flow of $372 million in Q1 • Moody's reaffirmed "A3" credit rating with a stable outlook • Ended Q1 with strong balance sheet, including $1.6 billion in cash
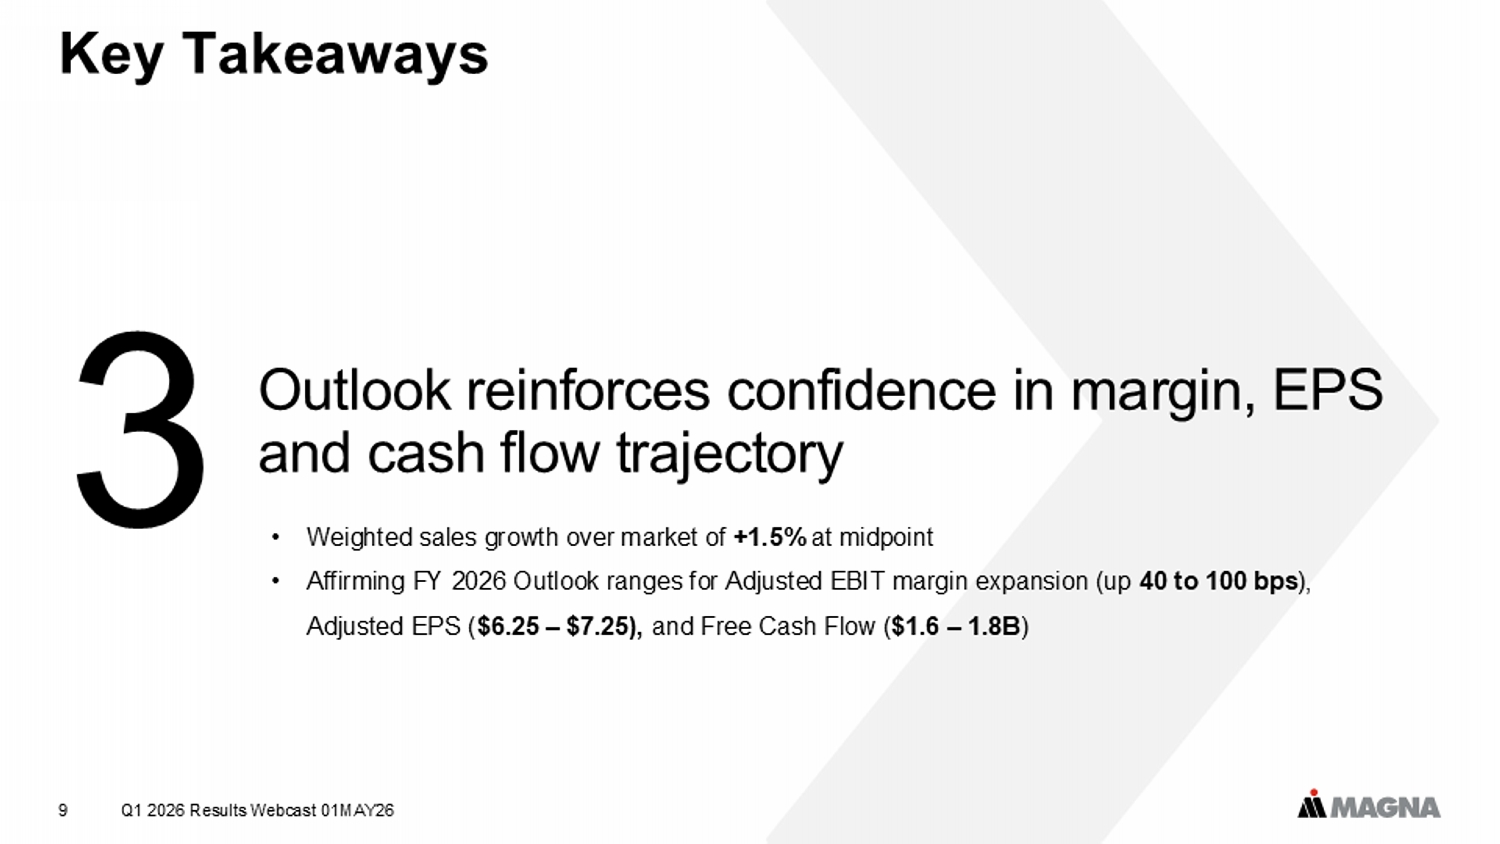
Key Takeaways Q1 2026 Results Webcast 01MAY26 9 Outlook reinforces confidence in margin, EPS and cash flow trajectory 3 • Weighted sales growth over market of +1.5% at midpoint • Affirming FY 2026 Outlook ranges for Adjusted EBIT margin expansion (up 40 to 100 bps ), Adjusted EPS ( $6.25 – $7.25), and Free Cash Flow ( $1.6 – 1.8B )
Key Takeaways Q1 2026 Results Webcast 01MAY26 10 Executing our proven capital allocation framework 4 • Continue to invest in business to support profitable growth • Returned $575 million in capital to shareholders in Q1, through share repurchases and dividends • ~17 million shares remaining at March 31, 2026 under current buyback authorization (NCIB); Company plans to repurchase remaining shares • Announced dispositions of Lighting and Rooftop Systems businesses
Q1 2026 Results Webcast 01MAY26 11 Announced Dispositions of Lighting and Rooftop Systems Businesses • Transactions consistent with our long - standing guiding principles around portfolio management
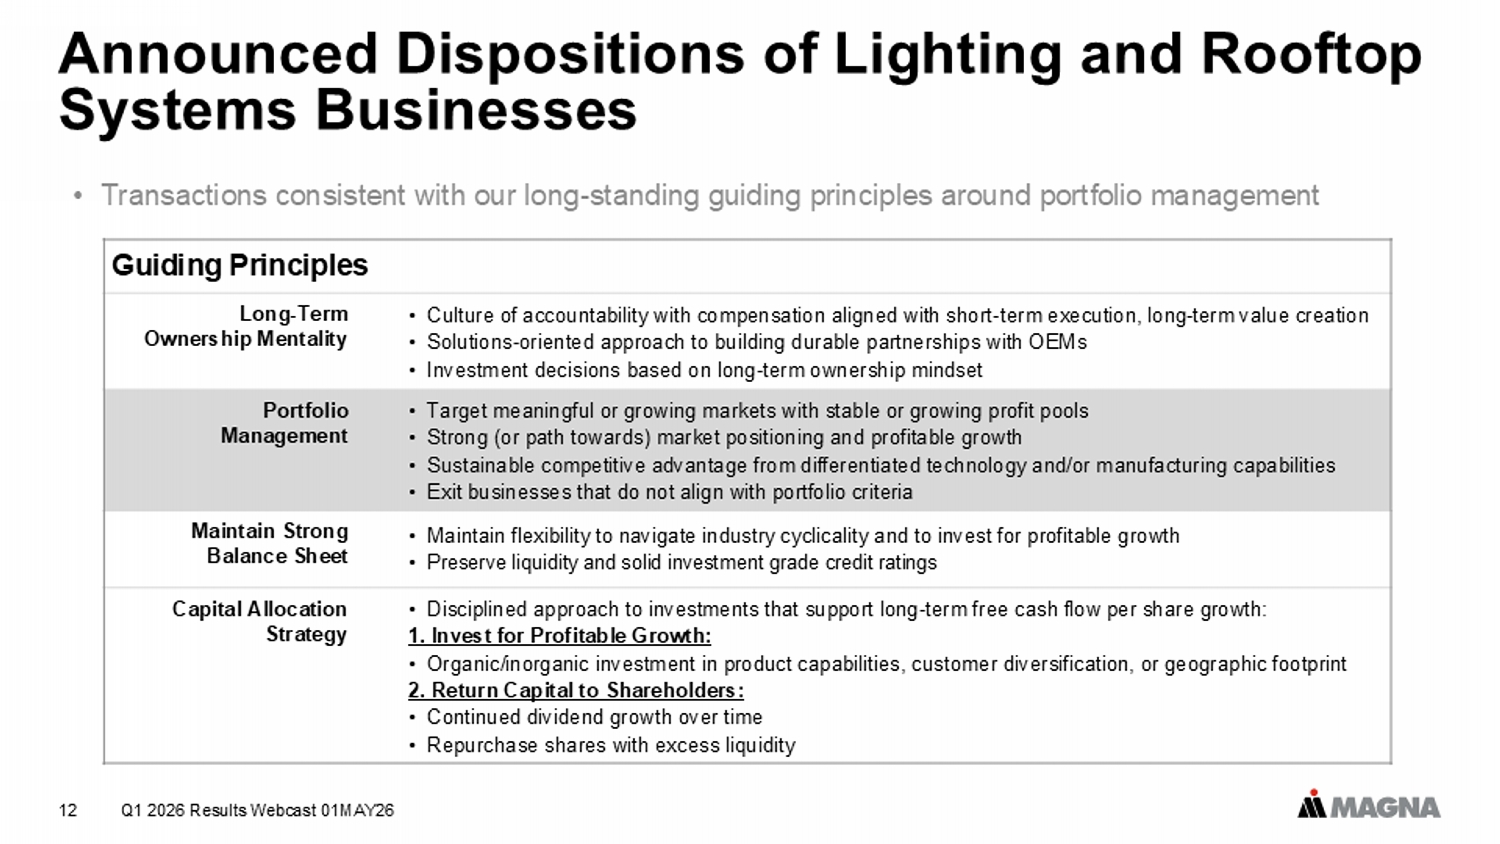
Q1 2026 Results Webcast 01MAY26 12 Announced Dispositions of Lighting and Rooftop Systems Businesses • Transactions consistent with our long - standing guiding principles around portfolio management Guiding Principles • Culture of accountability with compensation aligned with short - term execution, long - term value creation • Solutions - oriented approach to building durable partnerships with OEMs • Investment decisions based on long - term ownership mindset Long - Term Ownership Mentality • Target meaningful or growing markets with stable or growing profit pools • Strong (or path towards) market positioning and profitable growth • Sustainable competitive advantage from differentiated technology and/or manufacturing capabilities • Exit businesses that do not align with portfolio criteria Portfolio Management • Maintain flexibility to navigate industry cyclicality and to invest for profitable growth • Preserve liquidity and solid investment grade credit ratings Maintain Strong Balance Sheet • Disciplined approach to investments that support long - term free cash flow per share growth: 1. Invest for Profitable Growth: • Organic/inorganic investment in product capabilities, customer diversification, or geographic footprint 2. Return Capital to Shareholders: • Continued dividend growth over time • Repurchase shares with excess liquidity Capital Allocation Strategy
Q1 2026 Results Webcast 01MAY26 13 Announced Dispositions of Lighting and Rooftop Systems Businesses • Transactions consistent with our long - standing guiding principles around portfolio management • Allow us to streamline our portfolio and focus on businesses that advance our long - term growth, margin and return objectives
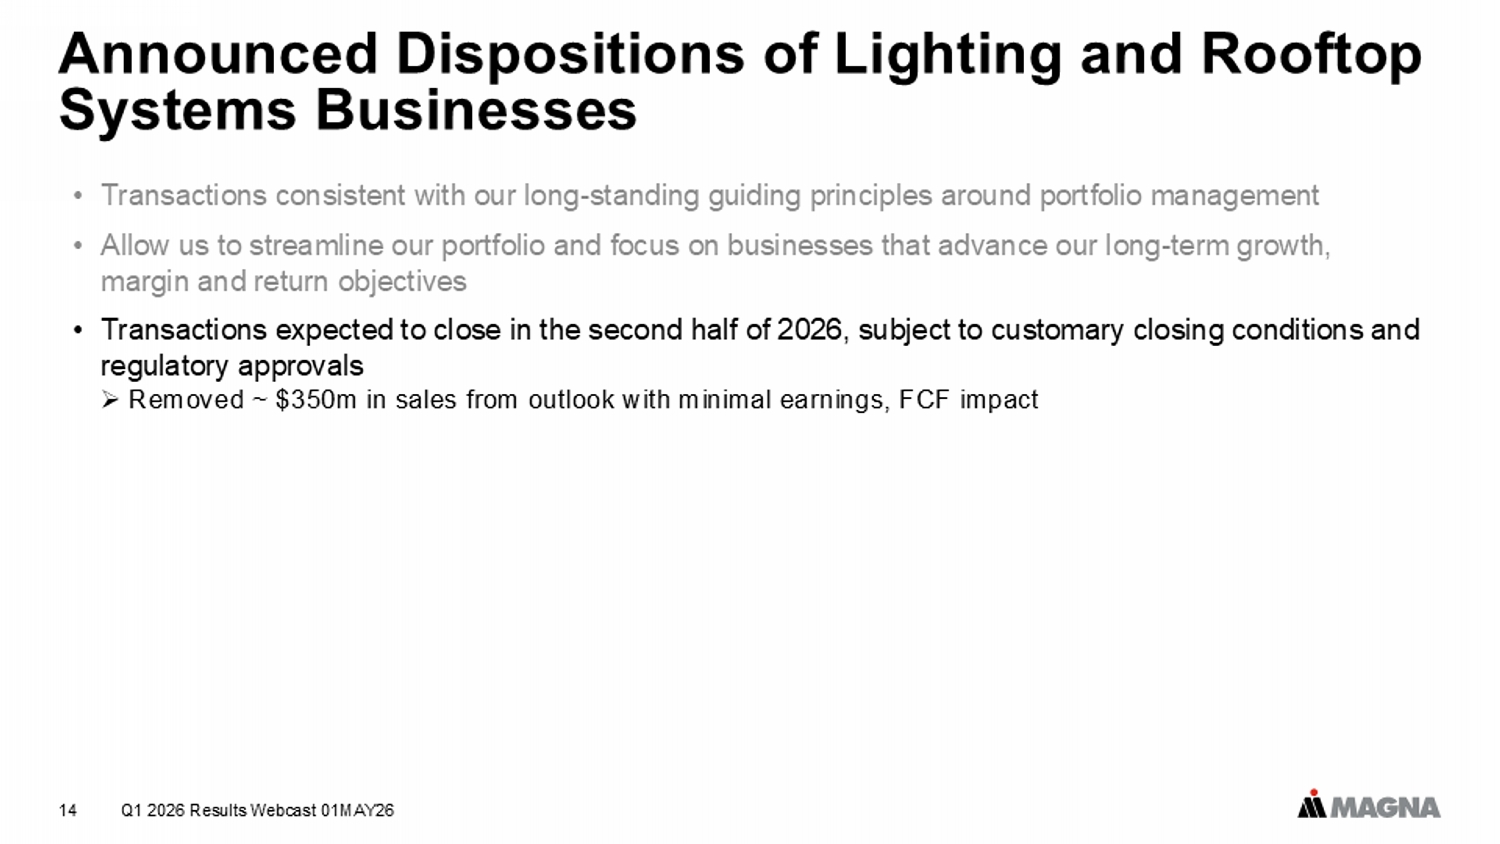
Q1 2026 Results Webcast 01MAY26 14 Announced Dispositions of Lighting and Rooftop Systems Businesses • Transactions consistent with our long - standing guiding principles around portfolio management • Allow us to streamline our portfolio and focus on businesses that advance our long - term growth, margin and return objectives • Transactions expected to close in the second half of 2026, subject to customary closing conditions and regulatory approvals » Removed ~ $350m in sales from outlook with minimal earnings, FCF impact
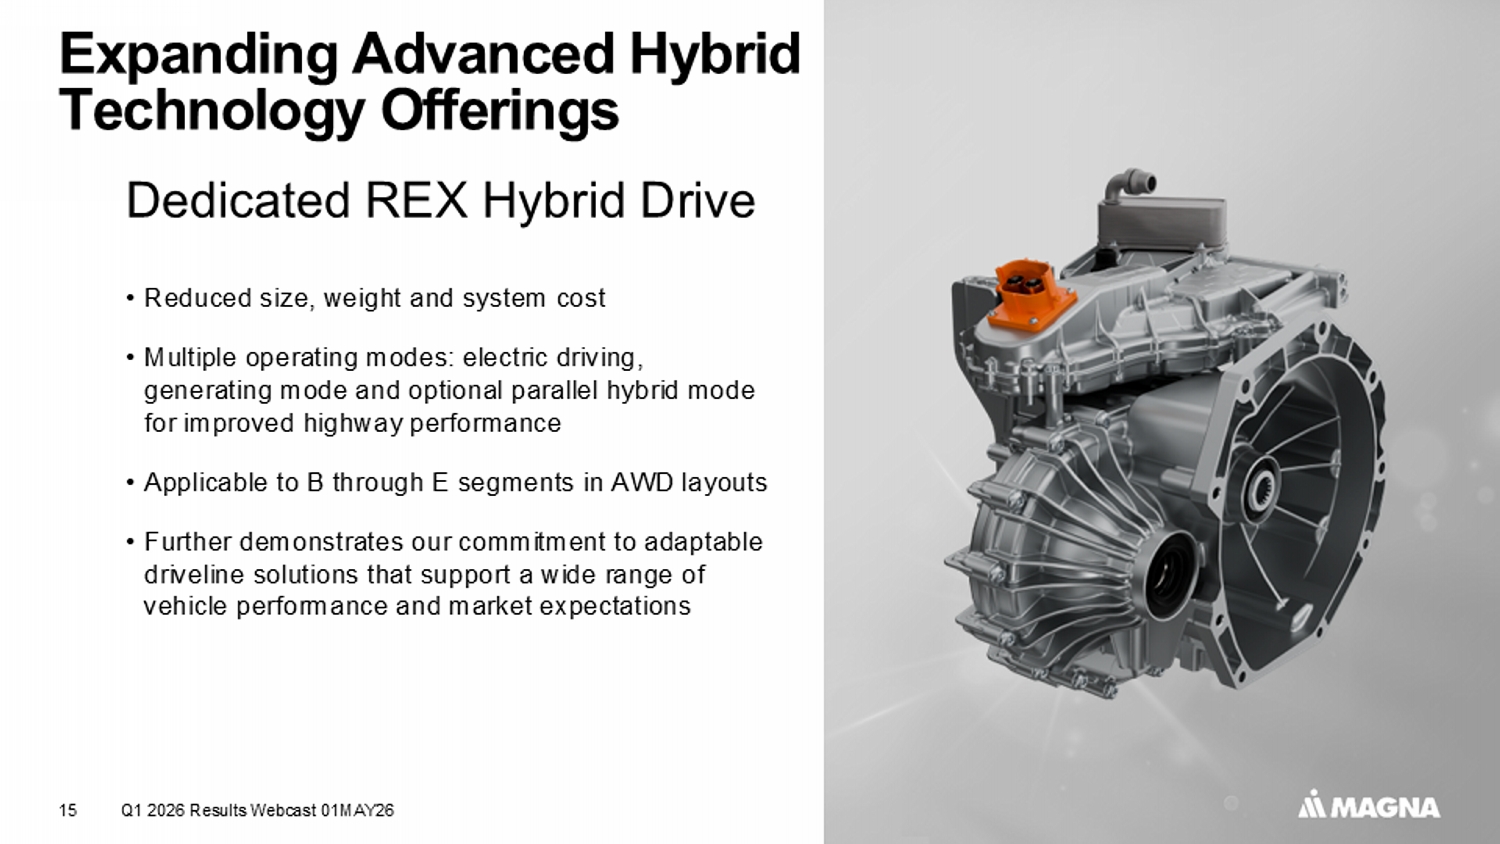
Expanding Advanced Hybrid Technology Offerings Dedicated REX Hybrid Drive 15 • Reduced size, weight and system cost • Multiple operating modes: electric driving, generating mode and optional parallel hybrid mode for improved highway performance • Applicable to B through E segments in AWD layouts • Further demonstrates our commitment to adaptable driveline solutions that support a wide range of vehicle performance and market expectations Q1 2026 Results Webcast 01MAY26
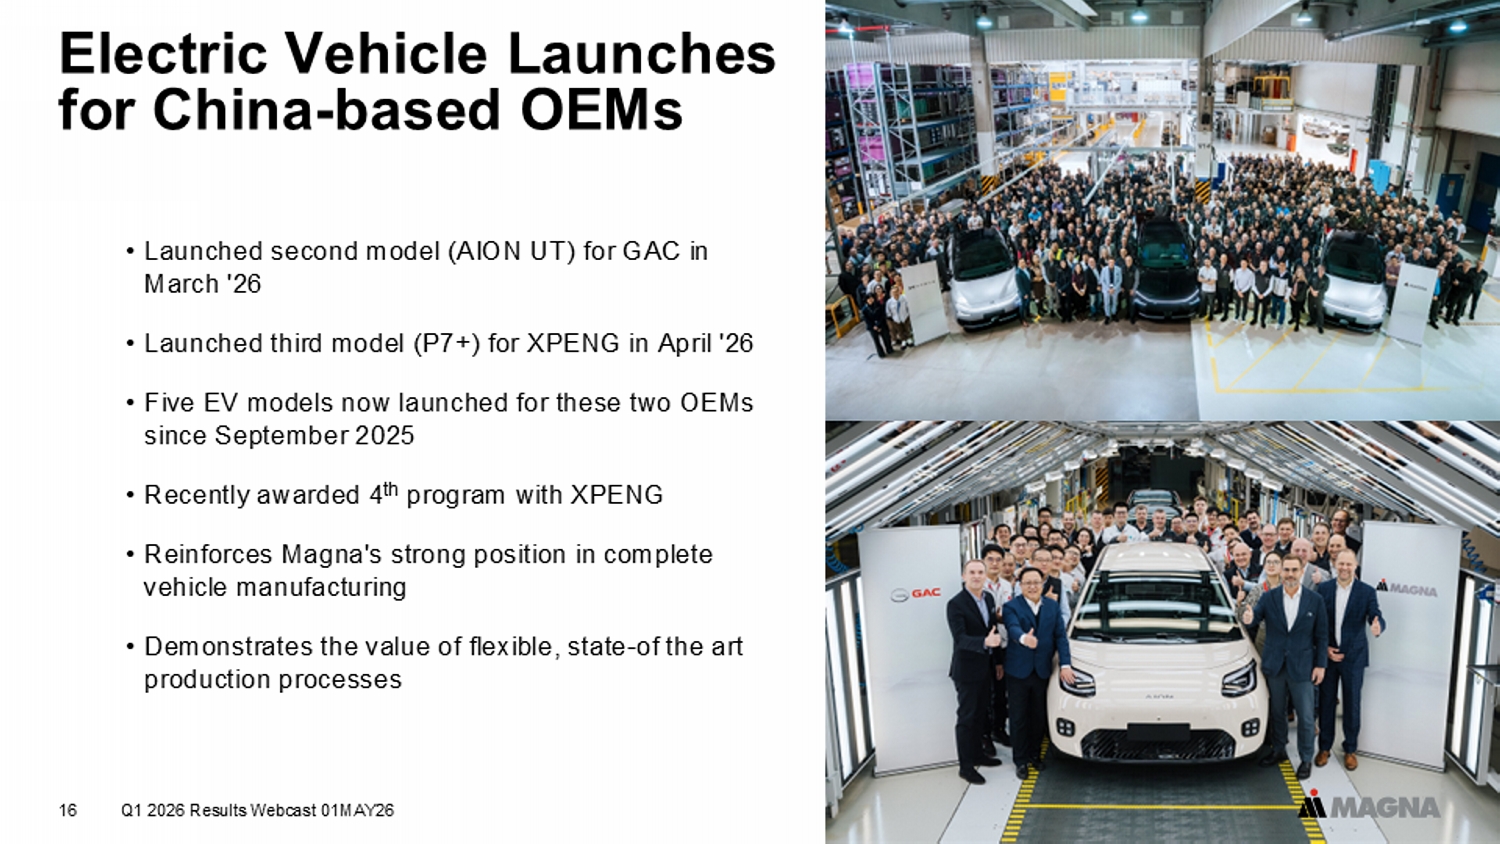
Electric Vehicle Launches for China - based OEMs 16 • Launched second model (AION UT) for GAC in March '26 • Launched third model (P7+) for XPENG in April '26 • Five EV models now launched for these two OEMs since September 2025 • Recently awarded 4 th program with XPENG • Reinforces Magna's strong position in complete vehicle manufacturing • Demonstrates the value of flexible, state - of the art production processes Q1 2026 Results Webcast 01MAY26

Named to Ethisphere's World's Most Ethical Companies List 17 • Ethisphere's annual recognition honours global leaders in ethical business practices • 2026 represents 5 th consecutive year Magna has been recognized • Reflects Magna's commitment to integrity, ethical decision - making and doing what's right Q1 2026 Results Webcast 01MAY26

EVP & Chief Financial Officer Phil Fracassa Q1 2026 Results Webcast 01MAY26 18
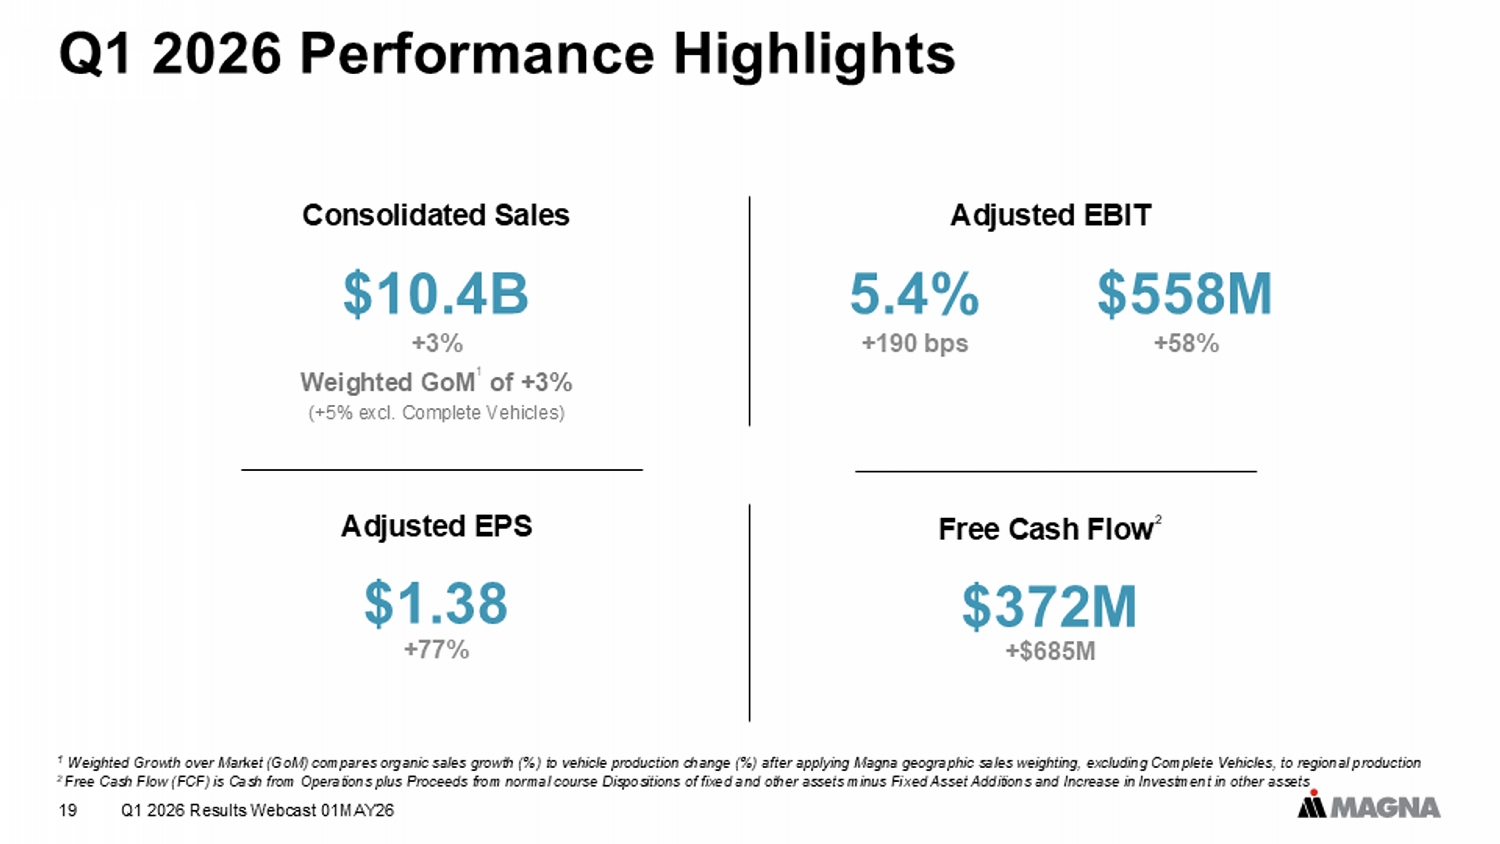
Q1 2026 Results Webcast 01MAY26 19 Q1 2026 Performance Highlights Consolidated Sales $10.4B Weighted GoM 1 of +3% (+5% excl. Complete Vehicles) +3% Adjusted EPS $1.38 +77% Free Cash Flow 2 $372M 1 Weighted Growth over Market (GoM) compares organic sales growth (%) to vehicle production change (%) after applying Magna geo gra phic sales weighting, excluding Complete Vehicles, to regional production 2 Free Cash Flow (FCF) is Cash from Operations plus Proceeds from normal course Dispositions of fixed and other assets minus Fi xed Asset Additions and Increase in Investment in other assets Adjusted EBIT 5.4% +190 bps $558M +58% +$685M
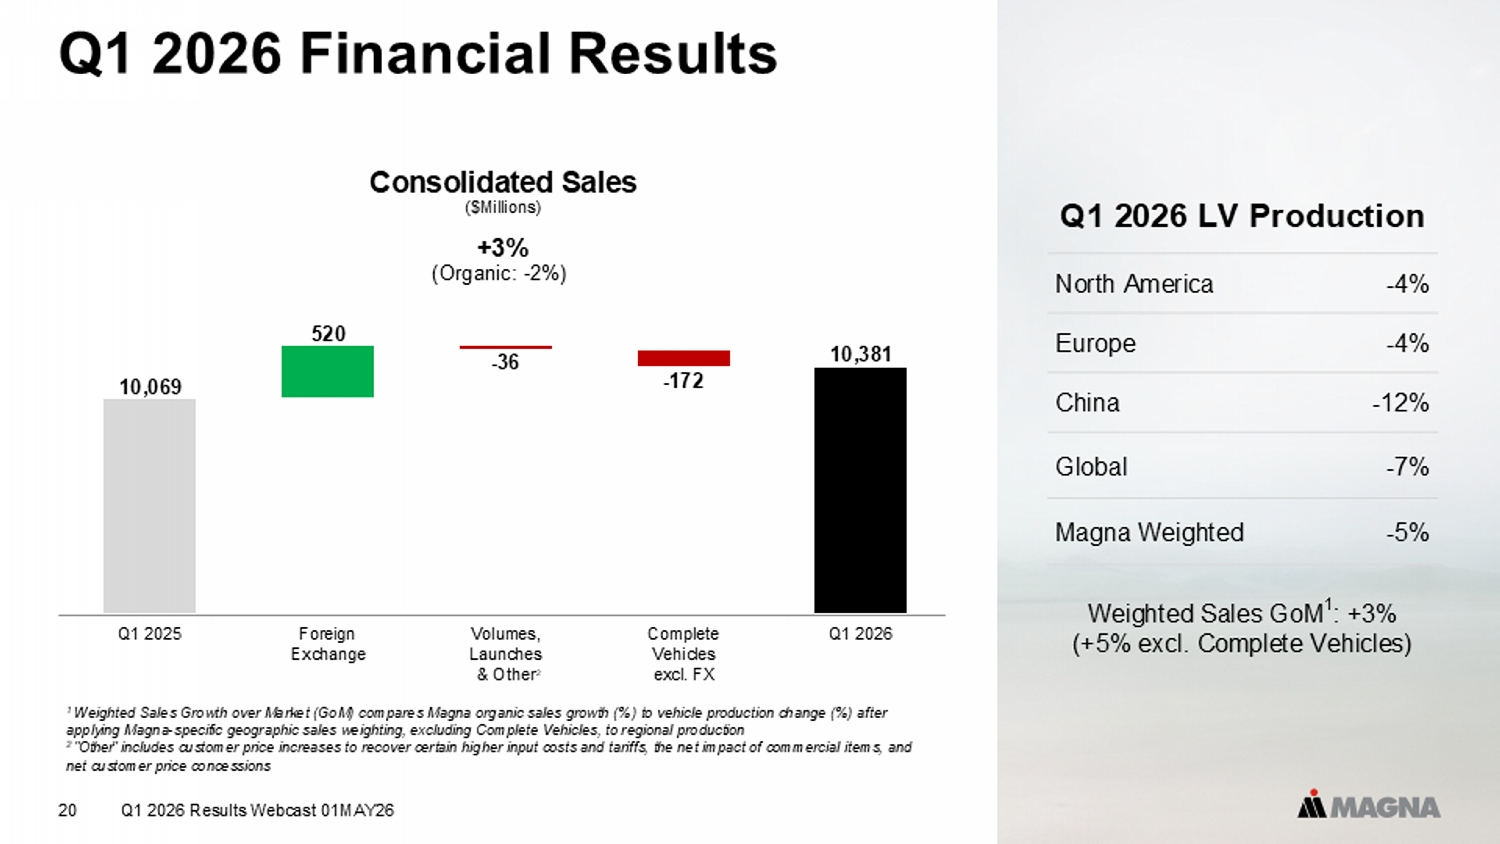
Q1 2026 Financial Results Q1 2026 Results Webcast 01MAY26 20 1 Weighted Sales Growth over Market (GoM) compares Magna organic sales growth (%) to vehicle production change (%) after applying Magna - specific geographic sales weighting, excluding Complete Vehicles, to regional production 2 "Other" i ncludes customer price increases to recover certain higher input costs and tariffs, the net impact of commercial items, and net customer price concessions Q1 2026 LV Production - 4% North America - 4% Europe - 12% China - 7% Global - 5% Magna Weighted Weighted Sales GoM 1 : +3% (+5% excl. Complete Vehicles) Consolidated Sales ($Millions) +3% 10,069 520 - 36 - 172 10,381 Q1 2025 Foreign Exchange Volumes, Launches & Other Complete Vehicles excl. FX Q1 2026 2 (Organic: - 2%)
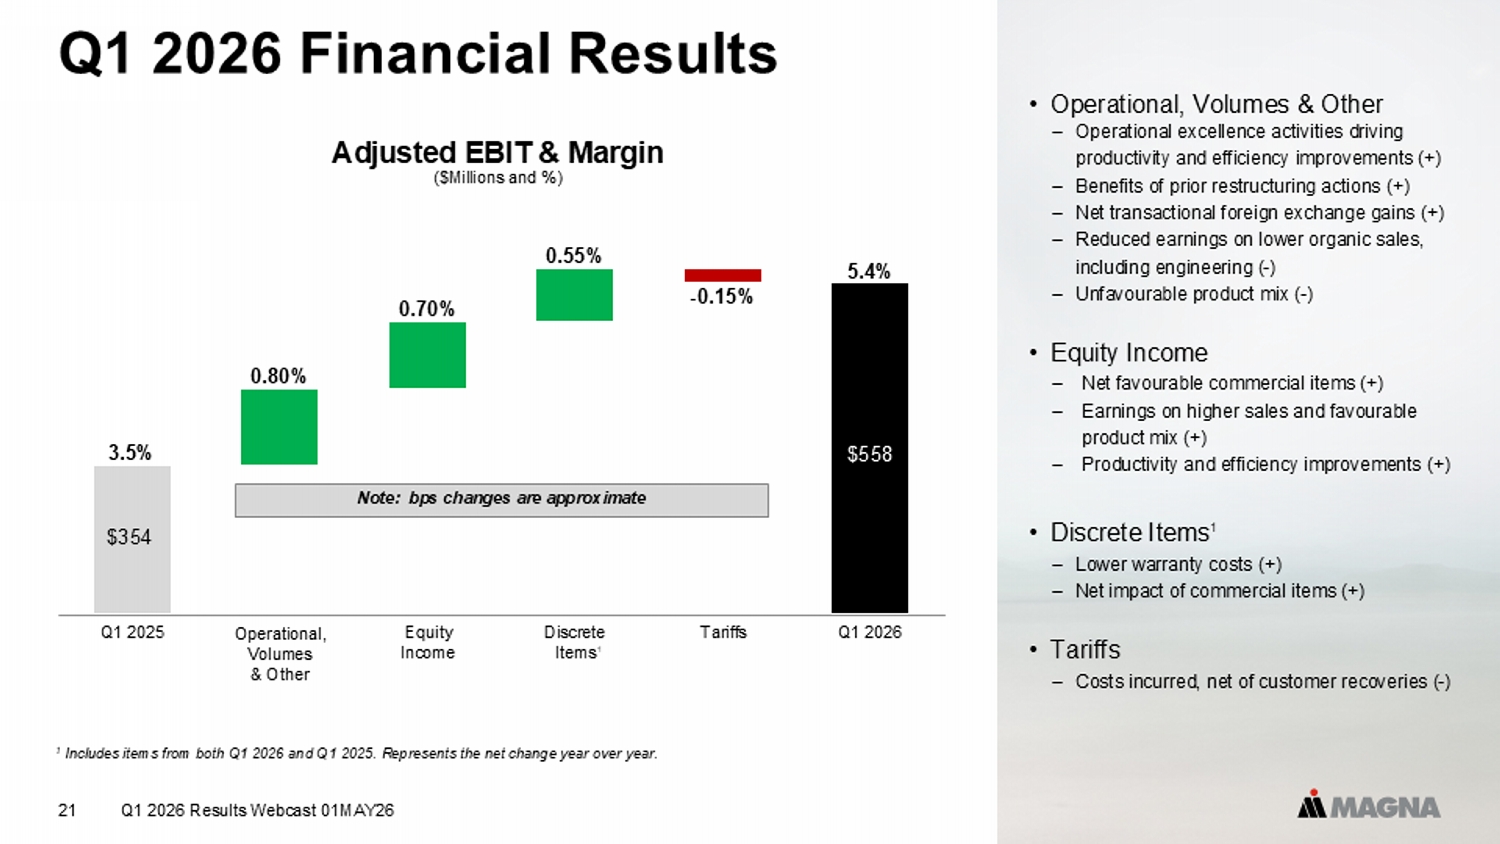
• Operational, Volumes & Other Operational excellence activities driving productivity and efficiency improvements (+) Benefits of prior restructuring actions (+) Net transactional foreign exchange gains (+) Reduced earnings on lower organic sales, including engineering ( - ) Unfavourable product mix ( - ) • Equity Income Net favourable commercial items (+) Earnings on higher sales and favourable product mix (+) Productivity and efficiency improvements (+) • Discrete Items 1 Lower warranty costs (+) N et impact of commercial items (+) • Tariffs Costs incurred, net of customer recoveries ( - ) Q1 2026 Results Webcast 01MAY26 21 Q1 2026 Financial Results 1 Includes items from both Q1 2026 and Q1 2025. Represents the net change year over year. 0.80% 0.70% 0.55% - 0.15% 3.5% 5.4% Q1 2025 Operational, Volumes & Other Equity Income Discrete Items Tariffs Q1 2026 $558 $354 Adjusted EBIT & Margin ($Millions and %) Note: bps changes are approximate 1
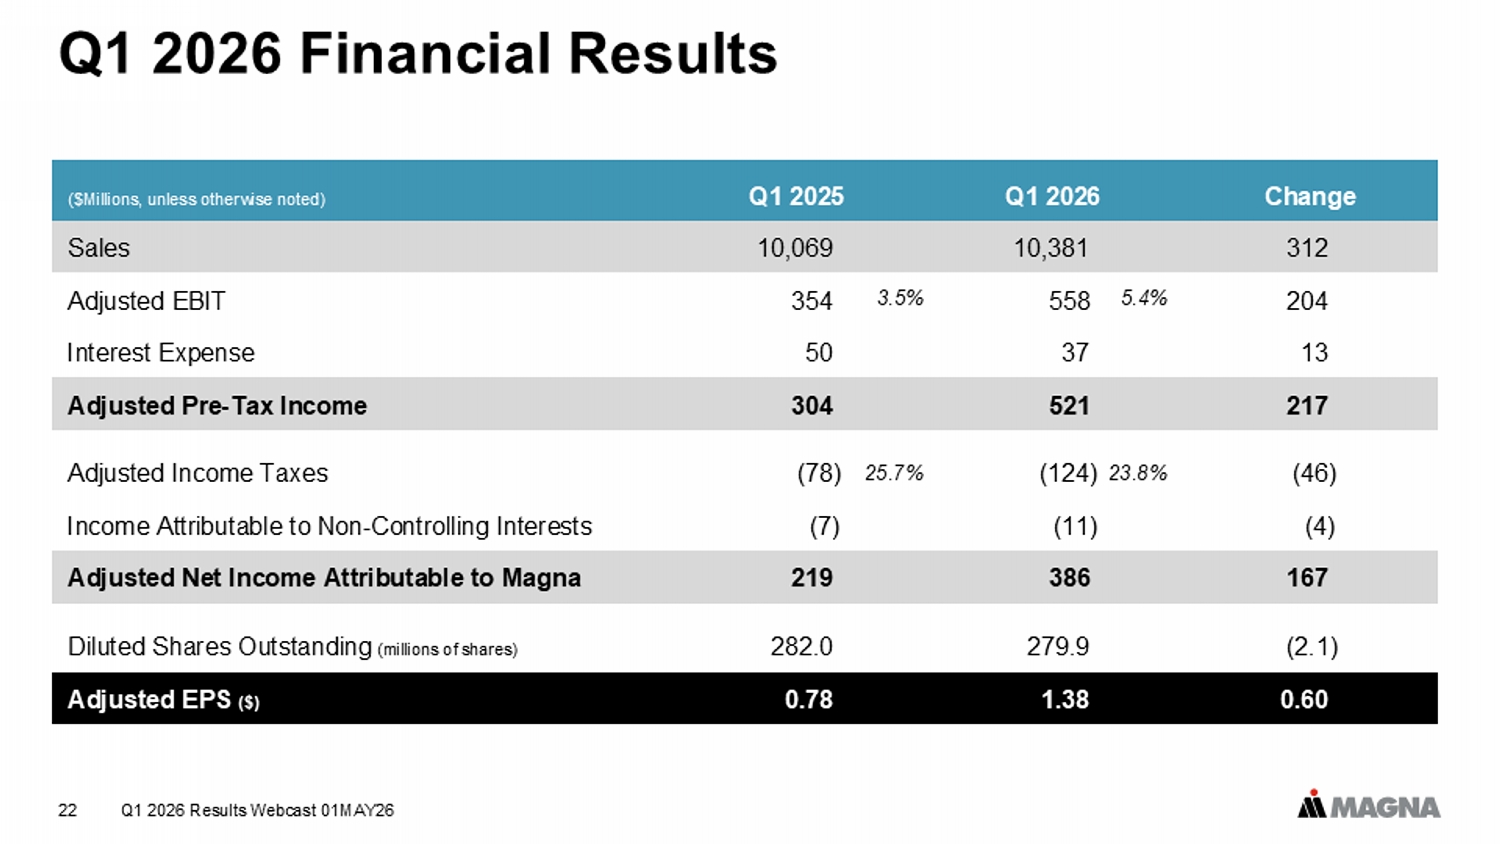
Q1 2026 Results Webcast 01MAY26 22 Q1 2026 Financial Results Change Q1 2026 Q1 2025 ($Millions, unless otherwise noted) 312 10,381 10,069 Sales 204 558 354 Adjusted EBIT 13 37 50 Interest Expense 217 521 304 Adjusted Pre - Tax Income (46) (124) (78) Adjusted Income Taxes (4) (11) (7) Income Attributable to Non - Controlling Interests 167 386 219 Adjusted Net Income Attributable to Magna (2.1) 279.9 282.0 Diluted Shares Outstanding (millions of shares) 0.60 1.38 0.78 Adjusted EPS ($) 25.7% 23.8% 3.5% 5.4%
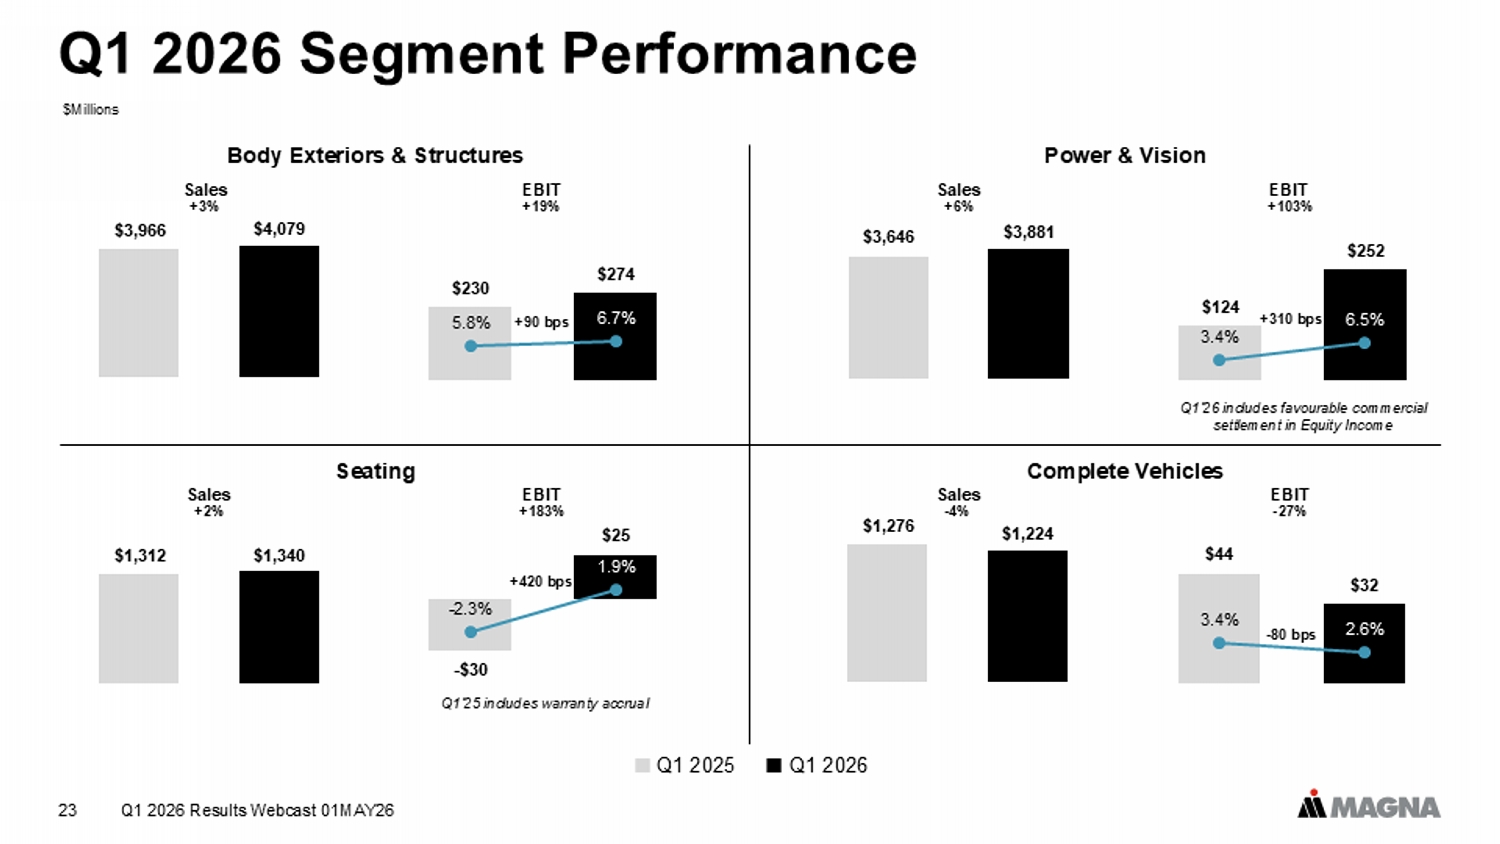
Q1 2026 Segment Performance Q1 2025 Q1 2026 Seating Power & Vision Complete Vehicles Body Exteriors & Structures $3,966 $4,079 $0,000 $0,500 $1,000 $1,500 $2,000 $2,500 $3,000 $3,500 $4,000 $4,500 $230 $274 5.8% 6.7% 0.0 0.1 0.1 0.2 0.2 0.3 0.3 $0 $100 $200 $300 $400 $500 Sales +3% EBIT +19% $1,312 $1,340 $0 $200 $400 $600 $800 $1,000 $1,200 $1,400 $1,600 $1,800 - $30 $25 - 2.3% 1.9% -0.1 -0.1 0.0 0.0 0.0 0.0 0.0 0.1 0.1 -$50 -$40 -$30 -$20 -$10 $0 $10 $20 $30 $40 $50 Sales +2% EBIT +183% $3,646 $3,881 $0 $500 $1,000 $1,500 $2,000 $2,500 $3,000 $3,500 $4,000 $4,500 $124 $252 3.4% 6.5% 0.0 0.1 0.1 0.2 0.2 0.3 0.3 $0 $50 $100 $150 $200 $250 $300 $350 $400 Sales +6% EBIT +103% $1,276 $1,224 $0 $200 $400 $600 $800 $1,000 $1,200 $1,400 $44 $32 3.4% 2.6% 0.0 0.0 0.0 0.1 0.1 0.1 0.1 0.1 $0 $10 $20 $30 $40 $50 $60 $70 Sales - 4% EBIT - 27% +90 bps +420 bps +310 bps $Millions 23 Q1 2026 Results Webcast 01MAY26 Q1'25 includes warranty accrual - 80 bps Q1'26 includes favourable commercial settlement in Equity Income
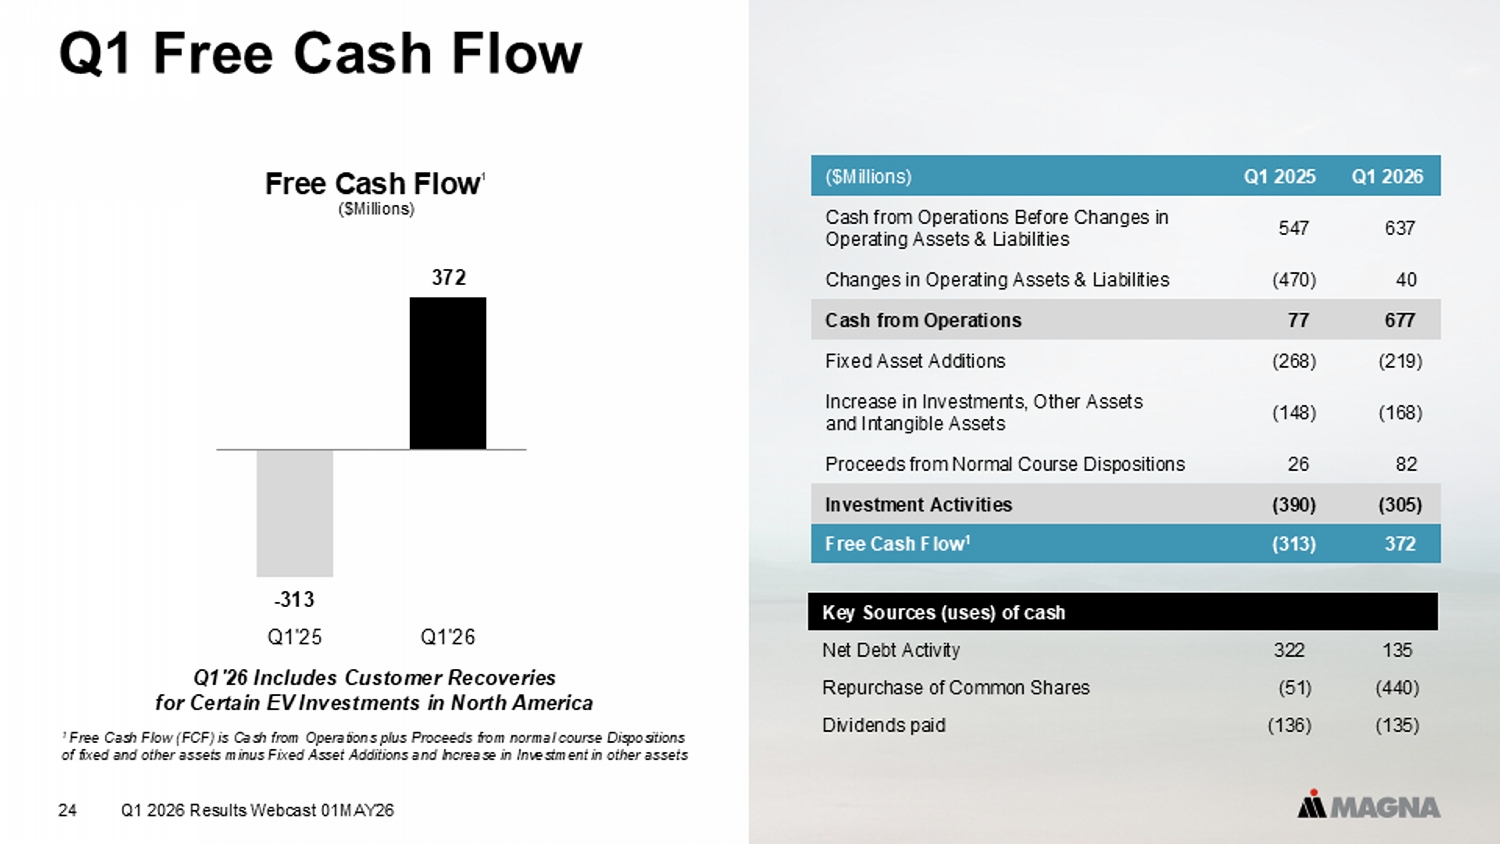
Q1 2026 Results Webcast 01MAY26 24 Q1 Free Cash Flow Free Cash Flow 1 ($Millions) - 313 372 -400 -300 -200 -100 0 100 200 300 400 500 Q1'25 Q1'26 1 Free Cash Flow (FCF) is Cash from Operations plus Proceeds from normal course Dispositions of fixed and other assets minus Fixed Asset Additions and Increase in Investment in other assets Key Sources (uses) of cash 135 322 Net Debt Activity (440) (51) Repurchase of Common Shares (135) (136) Dividends paid Q1 2026 Q1 2025 ($Millions) 637 547 Cash from Operations Before Changes in Operating Assets & Liabilities 40 (470) Changes in Operating Assets & Liabilities 677 77 Cash from Operations (219) (268) Fixed Asset Additions (168) (148) Increase in Investments, Other Assets and Intangible Assets 82 26 Proceeds from Normal Course Dispositions (305) (390) Investment Activities 372 (313) Free Cash Flow 1 Q1'26 Includes Customer Recoveries for Certain EV Investments in North America
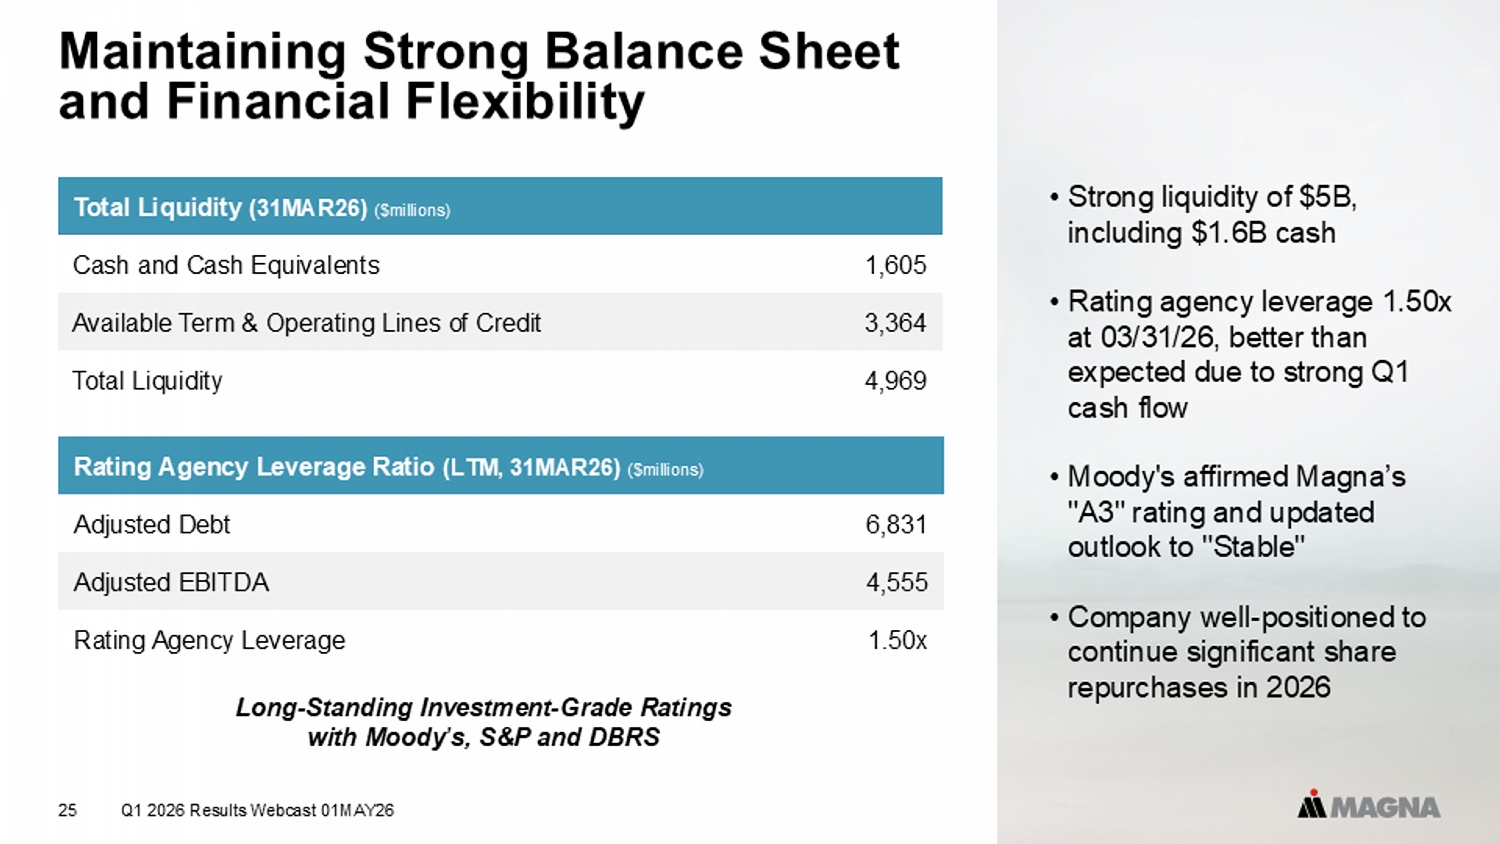
Maintaining Strong Balance Sheet and Financial Flexibility Q1 2026 Results Webcast 01MAY26 25 Rating Agency Leverage Ratio (LTM, 31MAR26) ($millions) 6,831 Adjusted Debt 4,555 Adjusted EBITDA 1.50x Rating Agency Leverage Total Liquidity (31MAR26) ($millions) 1,605 Cash and Cash Equivalents 3,364 Available Term & Operating Lines of Credit 4,969 Total Liquidity Long - Standing Investment - Grade Ratings with Moody's, S&P and DBRS • Strong liquidity of $5B, including $1.6B cash • Rating agency leverage 1.50x at 03/31/26, better than expected due to strong Q1 cash flow • Moody's affirmed Magna’s "A3" rating and updated outlook to "Stable" • Company well - positioned to continue significant share repurchases in 2026
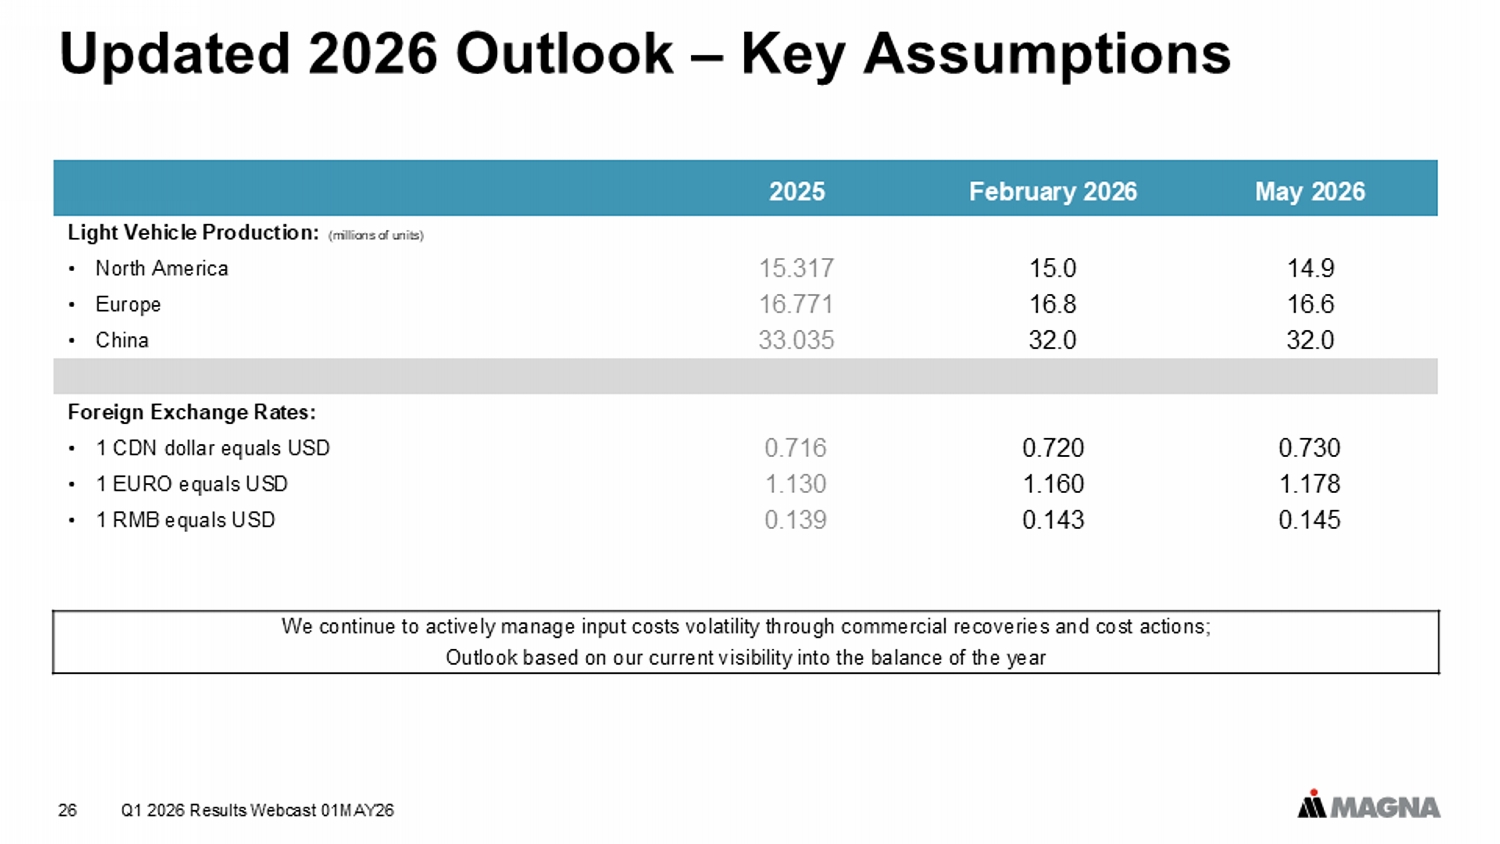
Q1 2026 Results Webcast 01MAY26 26 Updated 2026 Outlook – Key Assumptions May 2026 February 2026 2025 Light Vehicle Production: (millions of units) 14.9 15.0 15.317 • North America 16.6 16.8 16.771 • Europe 32.0 32.0 33.035 • China Foreign Exchange Rates: 0.730 0.720 0.716 • 1 CDN dollar equals USD 1.178 1.160 1.130 • 1 EURO equals USD 0.145 0.143 0.139 • 1 RMB equals USD We continue to actively manage input costs volatility through commercial recoveries and cost actions; Outlook based on our current visibility into the balance of the year
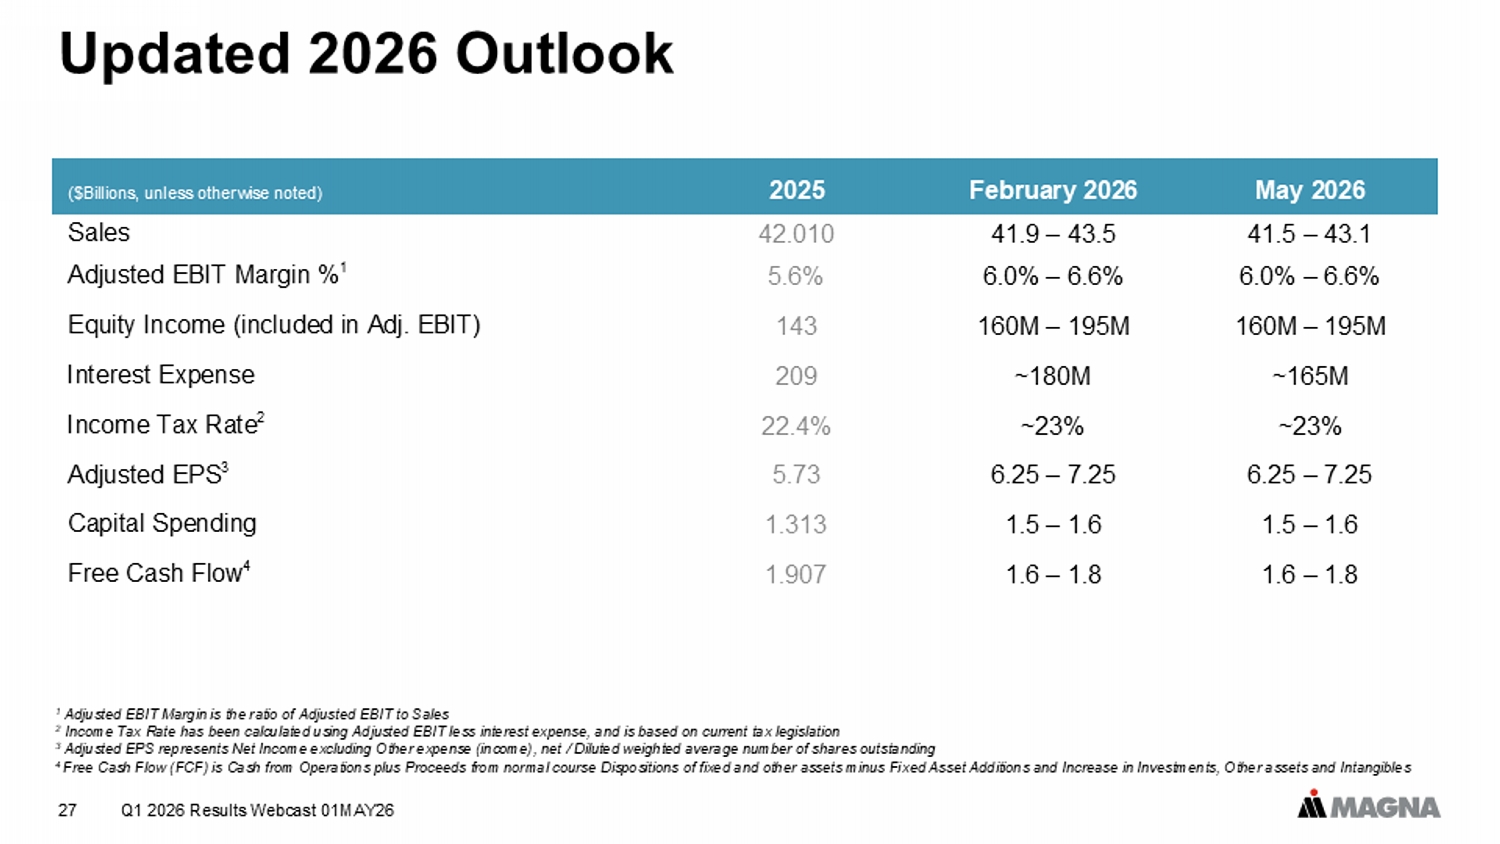
Q1 2026 Results Webcast 01MAY26 27 Updated 2026 Outlook May 2026 February 2026 2025 ($Billions, unless otherwise noted) 41.5 – 43.1 41.9 – 43.5 42.010 Sales 6.0% – 6.6% 6.0% – 6.6% 5.6% Adjusted EBIT Margin % 1 160M – 195M 160M – 195M 143 Equity Income (included in Adj. EBIT) ~165M ~180M 209 Interest Expense ~23% ~23% 22.4% Income Tax Rate 2 6.25 – 7.25 6.25 – 7.25 5.73 Adjusted EPS 3 1.5 – 1.6 1.5 – 1.6 1.313 Capital Spending 1.6 – 1.8 1.6 – 1.8 1.907 Free Cash Flow 4 1 Adjusted EBIT Margin is the ratio of Adjusted EBIT to Sales 2 Income Tax Rate has been calculated using Adjusted EBIT less interest expense, and is based on current tax legislation 3 Adjusted EPS represents Net Income excluding Other expense (income), net / Diluted weighted average number of shares outstand in g 4 Free Cash Flow (FCF) is Cash from Operations plus Proceeds from normal course Dispositions of fixed and other assets minus Fi xed Asset Additions and Increase in Investments, Other assets and Intangibles
Chief Executive Officer Swamy Kotagiri Q1 2026 Results Webcast 01MAY26 28
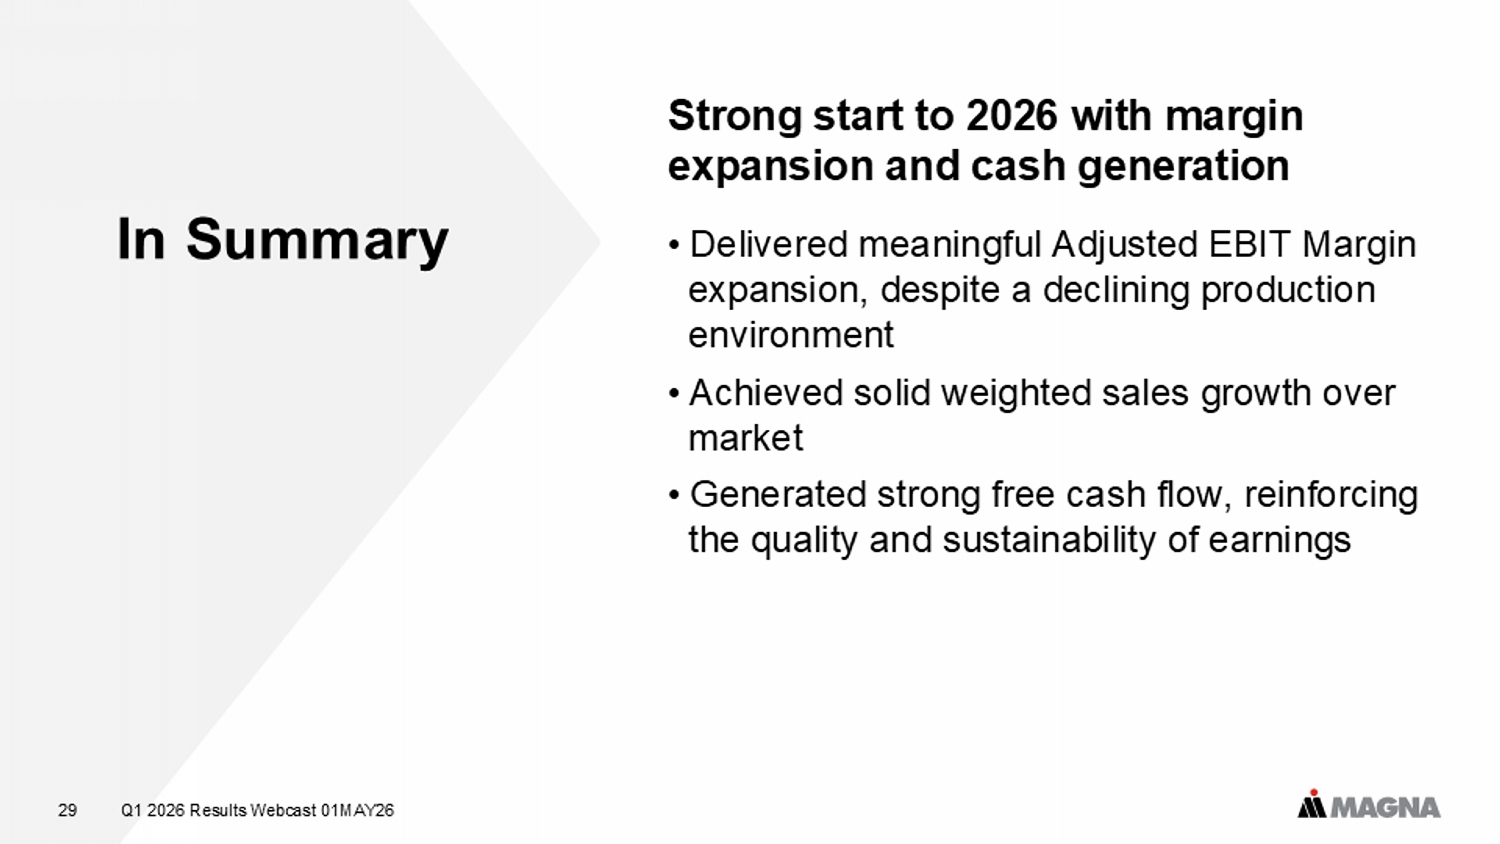
• Delivered meaningful Adjusted EBIT Margin expansion, despite a declining production environment • Achieved solid weighted sales growth over market • Generated strong free cash flow, reinforcing the quality and sustainability of earnings Strong start to 2026 with margin expansion and cash generation In Summary Q1 2026 Results Webcast 01MAY26 29
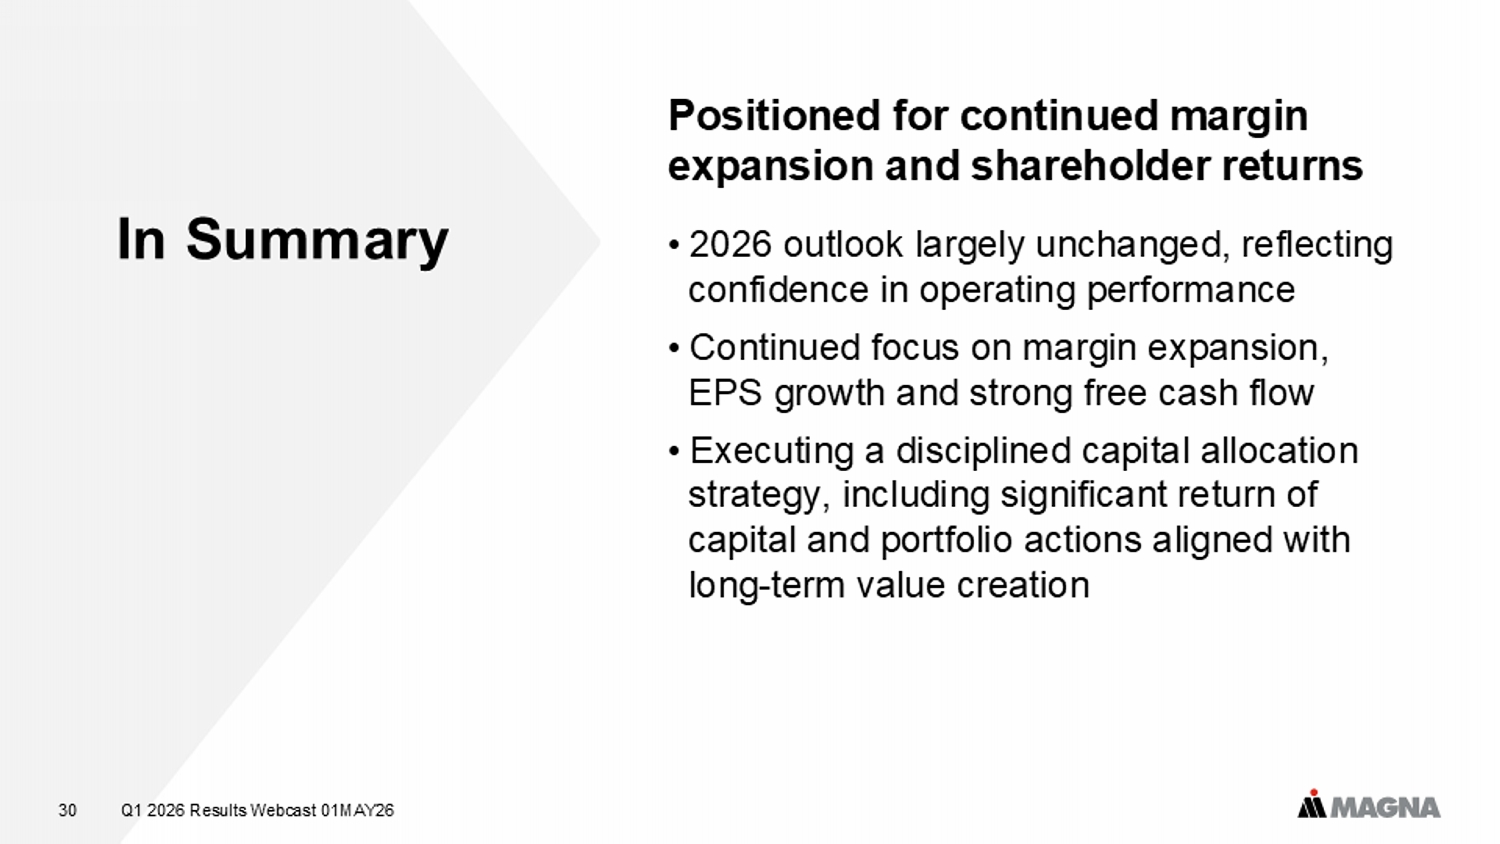
• 2026 outlook largely unchanged, reflecting confidence in operating performance • Continued focus on margin expansion, EPS growth and strong free cash flow • Executing a disciplined capital allocation strategy, including significant return of capital and portfolio actions aligned with long - term value creation Positioned for continued margin expansion and shareholder returns In Summary Q1 2026 Results Webcast 01MAY26 30
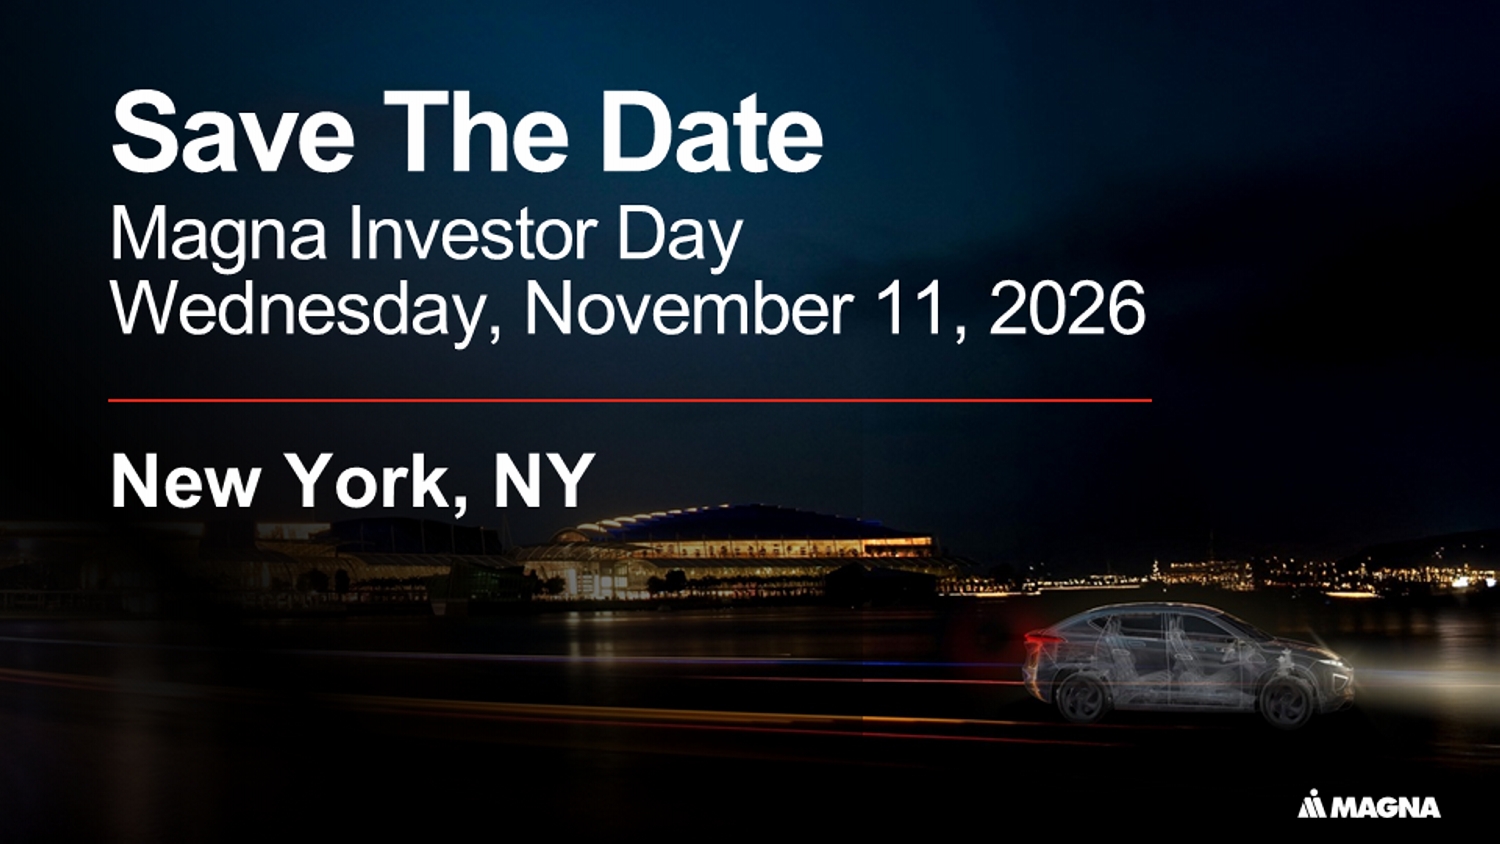
Magna Investor Day Wednesday, November 11, 2026 Save The Date New York, NY

Q1 2026 Results Webcast 01MAY26 32 Q&A
Q1 2026 Results Webcast 01MAY26 33 Q1 2026 Results Appendix
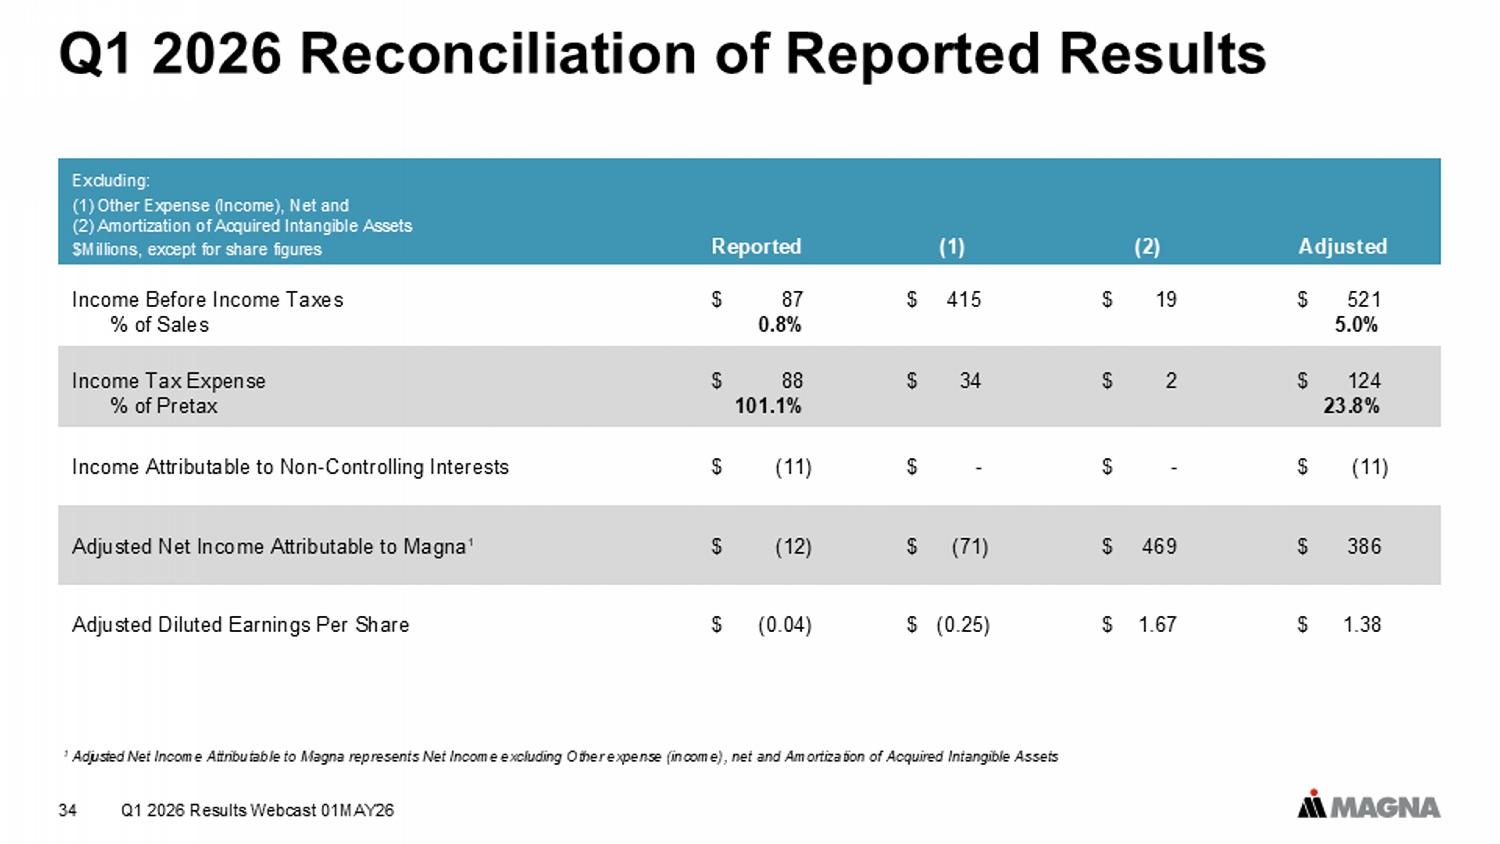
Q1 2026 Results Webcast 01MAY26 34 Q1 2026 Reconciliation of Reported Results Adjusted (2) (1) Reported Excluding: (1) Other Expense (Income), Net and (2) Amortization of Acquired Intangible Assets $Millions, except for share figures $ 521 $ 19 $ 415 $ 87 Income Before Income Taxes 5.0% 0.8% % of Sales $ 124 $ 2 $ 34 $ 88 Income Tax Expense 23.8% 101.1% % of Pretax $ (11) $ - $ - $ (11) Income Attributable to Non - Controlling Interests $ 386 $ 469 $ (71) $ (12) Adjusted Net Income Attributable to Magna 1 $ 1.38 $ 1.67 $ (0.25) $ (0.04) Adjusted Diluted Earnings Per Share 1 Adjusted Net Income Attributable to Magna represents Net Income excluding Other expense (income), net and Amortization of Acquired Int ang ible Assets
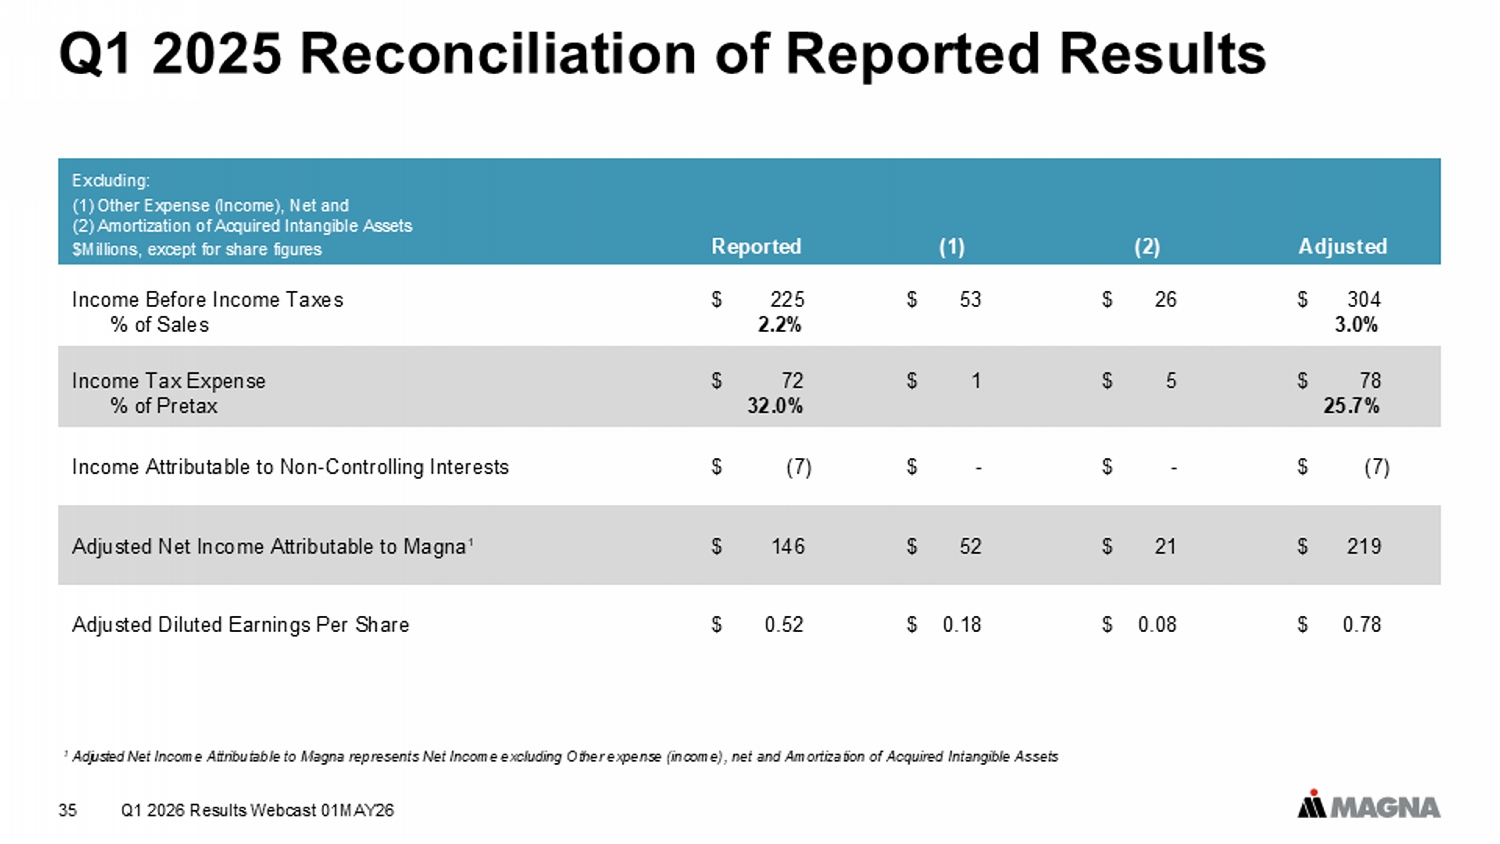
Q1 2026 Results Webcast 01MAY26 35 Q1 2025 Reconciliation of Reported Results Adjusted (2) (1) Reported Excluding: (1) Other Expense (Income), Net and (2) Amortization of Acquired Intangible Assets $Millions, except for share figures $ 304 $ 26 $ 53 $ 225 Income Before Income Taxes 3.0% 2.2% % of Sales $ 78 $ 5 $ 1 $ 72 Income Tax Expense 25.7% 32.0% % of Pretax $ (7) $ - $ - $ (7) Income Attributable to Non - Controlling Interests $ 219 $ 21 $ 52 $ 146 Adjusted Net Income Attributable to Magna 1 $ 0.78 $ 0.08 $ 0.18 $ 0.52 Adjusted Diluted Earnings Per Share 1 Adjusted Net Income Attributable to Magna represents Net Income excluding Other expense (income), net and Amortization of Acquired Int ang ible Assets
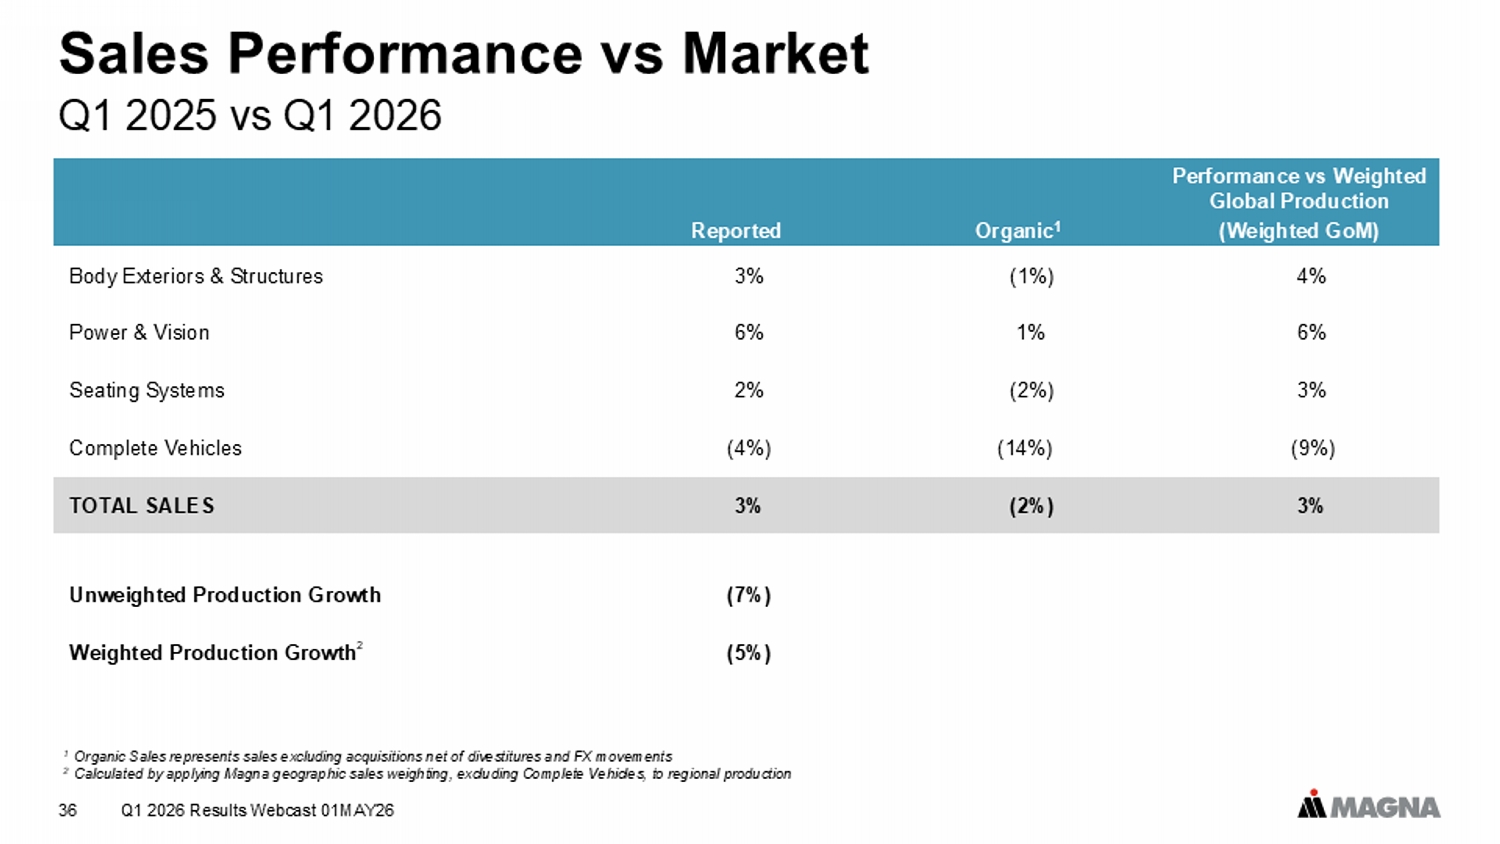
Q1 2026 Results Webcast 01MAY26 36 Q1 2025 vs Q1 2026 Sales Performance vs Market Performance vs Weighted Global Production (Weighted GoM) Organic 1 Reported 4% (1%) 3% Body Exteriors & Structures 6% 1% 6% Power & Vision 3% (2%) 2% Seating Systems (9%) (14%) (4%) Complete Vehicles 3% (2%) 3% TOTAL SALES (7%) Unweighted Production Growth (5%) Weighted Production Growth 2 1 Organic Sales represents sales excluding acquisitions net of divestitures and FX movements 2 Calculated by applying Magna geographic sales weighting, excluding Complete Vehicles, to regional production
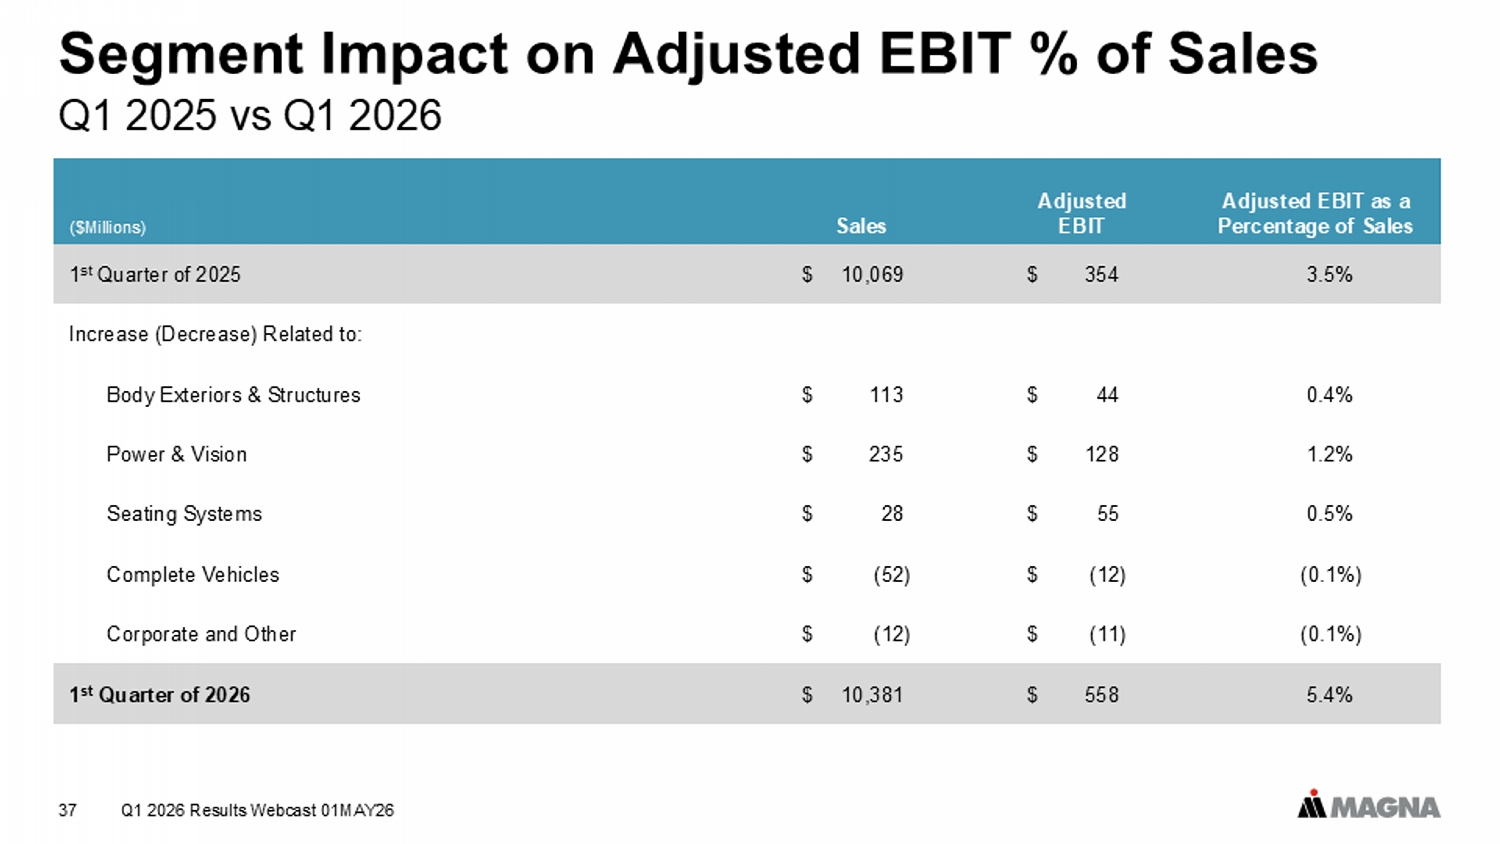
Q1 2026 Results Webcast 01MAY26 37 Q1 2025 vs Q1 2026 Segment Impact on Adjusted EBIT % of Sales Adjusted EBIT as a Percentage of Sales Adjusted EBIT Sales ($Millions) 3.5% $ 354 $ 10,069 1 st Quarter of 2025 Increase (Decrease) Related to: 0.4% $ 44 $ 113 Body Exteriors & Structures 1.2% $ 128 $ 235 Power & Vision 0.5% $ 55 $ 28 Seating Systems (0.1%) $ (12) $ (52) Complete Vehicles (0.1%) $ (11) $ (12) Corporate and Other 5.4% $ 558 $ 10,381 1 st Quarter of 2026
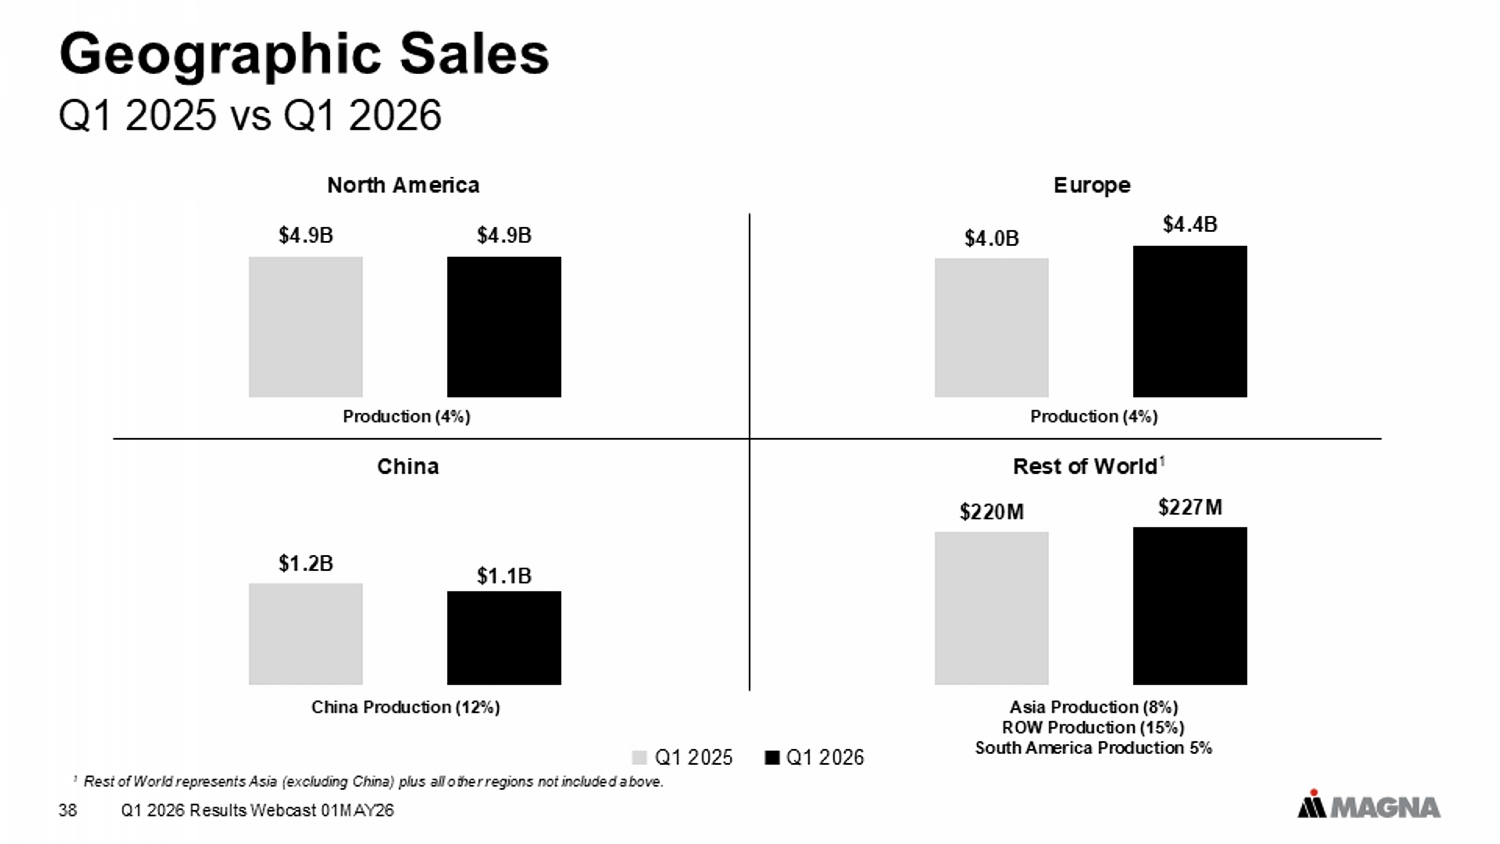
Q1 2026 Results Webcast 01MAY26 38 Q1 2025 vs Q1 2026 Geographic Sales Q1 2025 Q1 2026 China China Production (12%) $1.2B $1.1B $0.00B $0.20B $0.40B $0.60B $0.80B $1.00B $1.20B $1.40B $1.60B $1.80B $2.00B $4.9B $4.9B $0.0B $1.0B $2.0B $3.0B $4.0B $5.0B $6.0B North America Production (4%) $4.0B $4.4B $0.0B $0.5B $1.0B $1.5B $2.0B $2.5B $3.0B $3.5B $4.0B $4.5B $5.0B Europe Production (4%) $220M $227M $0M $50M $100M $150M $200M $250M Asia Production (8%) ROW Production (15%) South America Production 5% Rest of World 1 1 Rest of World represents Asia (excluding China) plus all other regions not included above.
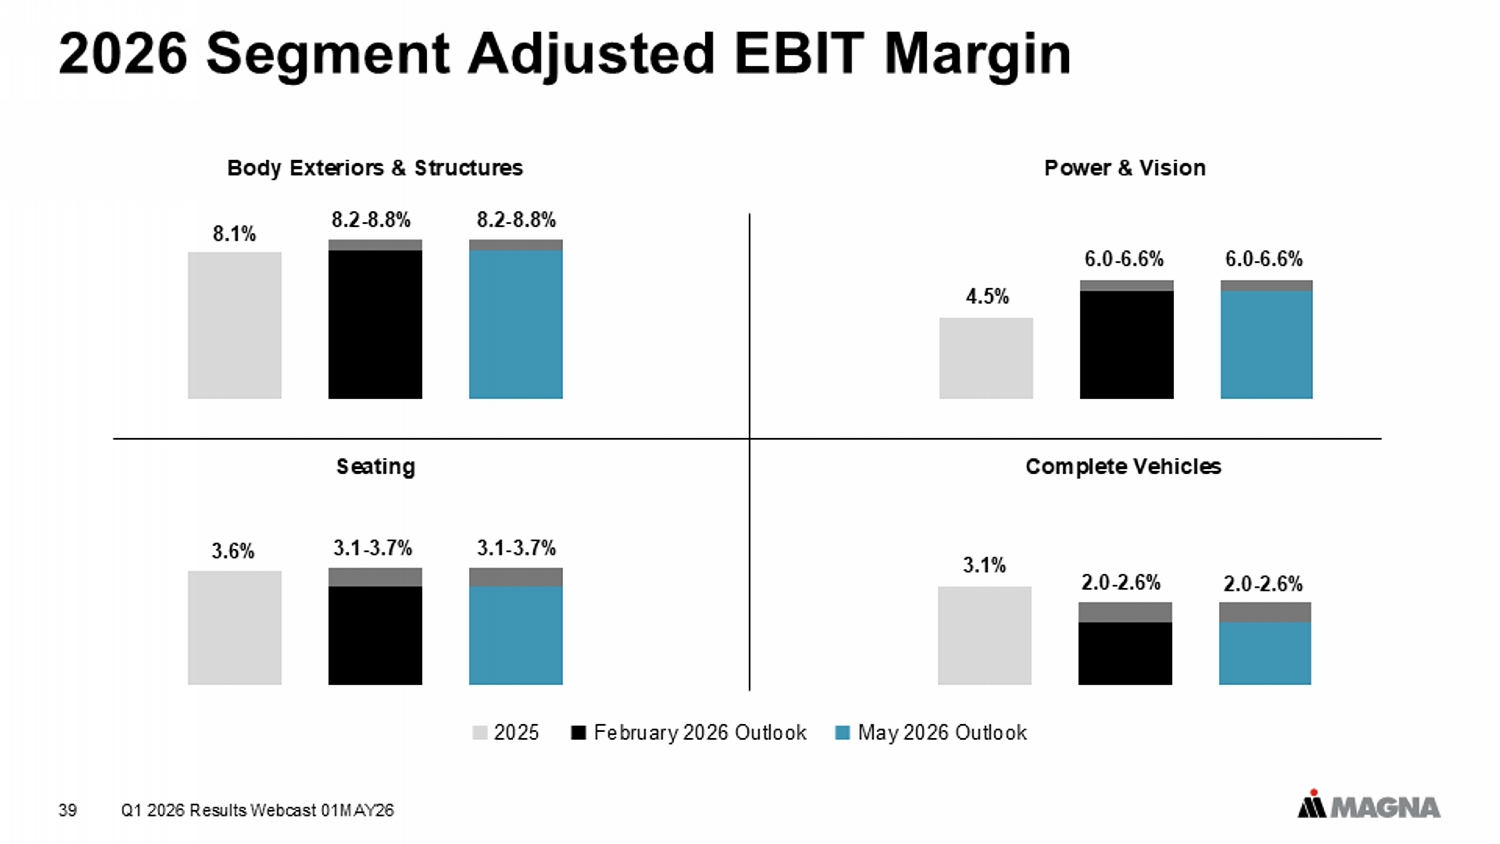
Q1 2026 Results Webcast 01MAY26 39 2026 Segment Adjusted EBIT Margin 2025 February 2026 Outlook May 2026 Outlook Seating Power & Vision Complete Vehicles Body Exteriors & Structures 8.1% 8.2 - 8.8% 8.2 - 8.8% 3.6% 3.1 - 3.7% 3.1 - 3.7% 4.5% 6.0 - 6.6% 6.0 - 6.6% 3.1% 2.0 - 2.6% 2.0 - 2.6%
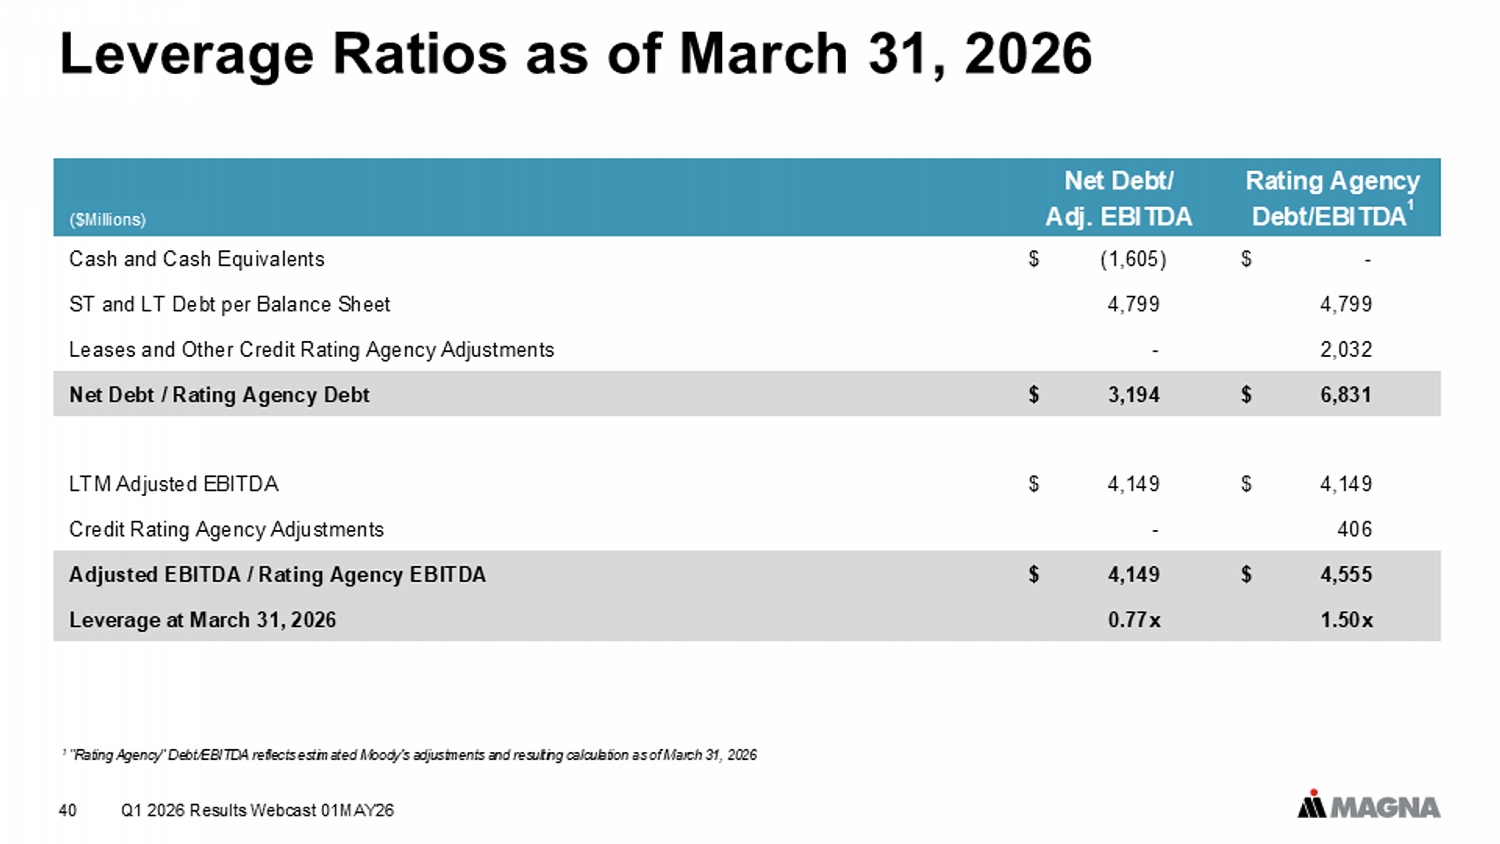
Q1 2026 Results Webcast 01MAY26 40 Leverage Ratios as of March 31, 2026 Rating Agency Debt/EBITDA 1 Net Debt/ Adj. EBITDA ($Millions) $ - $ (1,605) Cash and Cash Equivalents 4,799 4,799 ST and LT Debt per Balance Sheet 2,032 - Leases and Other Credit Rating Agency Adjustments $ 6,831 $ 3,194 Net Debt / Rating Agency Debt $ 4,149 $ 4,149 LTM Adjusted EBITDA 406 - Credit Rating Agency Adjustments $ 4,555 $ 4,149 Adjusted EBITDA / Rating Agency EBITDA 1.50x 0.77x Leverage at March 31, 2026 1 "Rating Agency" Debt/EBITDA reflects estimated Moody's adjustments and resulting calculation as of March 31, 2026

Q1 2026 Results Webcast 01MAY26 41