
.2
Table of Contents
Certain information in this Supplemental Information Package contains Non-GAAP financial measures. These Non-GAAP financial measures are REIT industry financial measures that are not calculated in accordance with accounting principles generally accepted in the United States of America. Please see page 15 for a definition of these Non-GAAP financial measures and page 7 for the reconciliation of certain captions in the Supplemental Information Package to the statement of operations as reported in the Company’s filings with the SEC on Form 10-Q.
| UMH Properties, Inc. | First Quarter FY 2026 Supplemental Information | 2 |
(dollars in thousands except per share amounts) (unaudited)
| Three Months Ended | ||||||||
| March 31, 2026 | March 31, 2025 | |||||||
| Operating Information | ||||||||
| Number of Communities (1) | 145 | 141 | ||||||
| Total Sites (1) | 27,114 | 26,508 | ||||||
| Rental and Related Income | $ | 59,469 | $ | 54,574 | ||||
| Community Operating Expenses (2) | $ | 25,236 | $ | 23,011 | ||||
| Community NOI (2) | $ | 34,233 | $ | 31,563 | ||||
| Expense Ratio | 42.4 | % | 42.2 | % | ||||
| Sales of Manufactured Homes | $ | 6,369 | $ | 6,651 | ||||
| Number of Homes Sold | 73 | 71 | ||||||
| Number of Rentals Added, net | 121 | 109 | ||||||
| Net Income | $ | 7,689 | $ | 4,810 | ||||
| Net Income (Loss) Attributable to Common Shareholders | $ | 2,580 | $ | (271 | ) | |||
| Adjusted EBITDA excluding Non-Recurring Other Expense | $ | 32,826 | $ | 29,385 | ||||
| FFO Attributable to Common Shareholders | $ | 18,140 | $ | 18,172 | ||||
| Normalized FFO Attributable to Common Shareholders | $ | 19,356 | $ | 18,820 | ||||
| Shares Outstanding and Per Share Data | ||||||||
| Weighted Average Shares Outstanding | ||||||||
| Basic | 84,998 | 82,391 | ||||||
| Diluted | 85,371 | 83,335 | ||||||
| Net Income Attributable to Shareholders per Share- | ||||||||
| Basic and Diluted | $ | 0.03 | $ | (0.00 | ) | |||
| FFO per Share- (3) | ||||||||
| Basic and Diluted | $ | 0.21 | $ | 0.22 | ||||
| Normalized FFO per Share- (3) | ||||||||
| Basic and Diluted | $ | 0.23 | $ | 0.23 | ||||
| Dividends per Common Share | $ | 0.225 | $ | 0.215 | ||||
| Balance Sheet | ||||||||
| Total Assets | $ | 1,687,617 | $ | 1,549,306 | ||||
| Total Liabilities | $ | 791,583 | $ | 635,111 | ||||
| Market Capitalization | ||||||||
| Total Debt, Net of Unamortized Debt Issuance Costs | $ | 759,870 | $ | 606,301 | ||||
| Equity Market Capitalization | $ | 1,228,523 | $ | 1,548,830 | ||||
| Series D Preferred Stock | $ | 324,552 | $ | 321,804 | ||||
| Total Market Capitalization | $ | 2,312,945 | $ | 2,476,935 | ||||
| (1) | Includes Sebring Square, Rum Runner and Honey Ridge, three communities owned in joint ventures with Nuveen Real Estate in which the company has a 40% interest. | |
| (2) | Excludes non-recurring legal and professional fees of $76 and $18 for the three months ended March 31, 2026 and 2025, respectively. | |
| (3) | Please see Definitions on page 15. |
| UMH Properties, Inc. | First Quarter FY 2026 Supplemental Information | 3 |
(in thousands except per share amounts)
| March 31, 2026 | December 31, 2025 | |||||||
| (unaudited) | ||||||||
| ASSETS | ||||||||
| Investment Property and Equipment | ||||||||
| Land | $ | 92,824 | $ | 92,824 | ||||
| Site and Land Improvements | 1,099,430 | 1,093,424 | ||||||
| Buildings and Improvements | 51,538 | 51,524 | ||||||
| Rental Homes and Accessories | 647,028 | 631,618 | ||||||
| Total Investment Property | 1,890,820 | 1,869,390 | ||||||
| Equipment and Vehicles | 36,726 | 35,889 | ||||||
| Total Investment Property and Equipment | 1,927,546 | 1,905,279 | ||||||
| Accumulated Depreciation | (550,699 | ) | (533,864 | ) | ||||
| Net Investment Property and Equipment | 1,376,847 | 1,371,415 | ||||||
| Other Assets | ||||||||
| Cash and Cash Equivalents | 37,410 | 72,100 | ||||||
| Marketable Securities at Fair Value | 26,430 | 23,758 | ||||||
| Inventory of Manufactured Homes | 44,399 | 42,370 | ||||||
| Notes and Other Receivables, net | 105,973 | 104,587 | ||||||
| Prepaid Expenses and Other Assets | 15,548 | 13,778 | ||||||
| Land Development Costs | 49,729 | 39,898 | ||||||
| Investment in Joint Ventures | 31,281 | 31,130 | ||||||
| Total Other Assets | 310,770 | 327,621 | ||||||
| TOTAL ASSETS | $ | 1,687,617 | $ | 1,699,036 | ||||
| LIABILITIES AND SHAREHOLDERS’ EQUITY | ||||||||
| Liabilities | ||||||||
| Mortgages Payable, net of unamortized debt issuance costs | $ | 554,041 | $ | 556,129 | ||||
| Other Liabilities | ||||||||
| Accounts Payable | 6,979 | 5,663 | ||||||
| Loans Payable, net of unamortized debt issuance costs | 27,961 | 27,696 | ||||||
| Series A Bonds, net of unamortized debt issuance costs | 101,963 | 101,751 | ||||||
| Series B Bonds, net of unamortized debt issuance costs | 75,905 | 75,651 | ||||||
| Accrued Liabilities and Deposits | 13,593 | 14,115 | ||||||
| Tenant Security Deposits | 11,141 | 10,835 | ||||||
| Total Other Liabilities | 237,542 | 235,711 | ||||||
| Total Liabilities | 791,583 | 791,840 | ||||||
| COMMITMENTS AND CONTINGENCIES | ||||||||
| Shareholders’ Equity: | ||||||||
| Series D- 6.375% Cumulative Redeemable Preferred Stock, $0.10 par value per share: 18,700 shares authorized as of March 31, 2026 and December 31, 2025; 12,982 and 12,916 shares issued and outstanding as of March 31, 2026 and December 31, 2025, respectively | 324,552 | 322,899 | ||||||
| Common Stock- $0.10 par value per share: 183,714 shares authorized as of March 31, 2026 and December 31, 2025, respectively; 85,137 and 84,850 shares issued and outstanding as of March 31, 2026 and December 31, 2025, respectively | 8,514 | 8,485 | ||||||
| Excess Stock- $0.10 par value per share: 3,000 shares authorized; no shares issued or outstanding as of March 31, 2026 and December 31, 2025 | -0- | -0- | ||||||
| Additional Paid-In Capital | 586,740 | 599,520 | ||||||
| Accumulated Deficit | (25,364 | ) | (25,364 | ) | ||||
| Total UMH Properties, Inc. Shareholders’ Equity | 894,442 | 905,540 | ||||||
| Non-Controlling Interest in Consolidated Subsidiaries | 1,592 | 1,656 | ||||||
| Total Shareholders’ Equity | 896,034 | 907,196 | ||||||
| TOTAL LIABILITIES AND SHAREHOLDERS’ EQUITY | $ | 1,687,617 | $ | 1,699,036 | ||||
| UMH Properties, Inc. | First Quarter FY 2026 Supplemental Information | 4 |
Consolidated Statements of Income (Loss)
(in thousands except per share amounts) (unaudited)
| Three Months Ended | ||||||||
| March 31, 2026 | March 31, 2025 | |||||||
| INCOME: | ||||||||
| Rental and Related Income | $ | 59,469 | $ | 54,574 | ||||
| Sales of Manufactured Homes | 6,369 | 6,651 | ||||||
| TOTAL INCOME | 65,838 | 61,225 | ||||||
| EXPENSES: | ||||||||
| Community Operating Expenses | 25,312 | 23,029 | ||||||
| Cost of Sales of Manufactured Homes | 4,076 | 4,345 | ||||||
| Selling Expenses | 1,867 | 1,615 | ||||||
| General and Administrative Expenses | 5,092 | 5,999 | ||||||
| Depreciation Expense | 17,976 | 16,663 | ||||||
| TOTAL EXPENSES | 54,323 | 51,651 | ||||||
| OTHER INCOME (EXPENSE): | ||||||||
| Interest Income | 2,174 | 2,263 | ||||||
| Dividend Income | 302 | 374 | ||||||
| Loss on Marketable Securities, net | (36,418 | ) | -0- | |||||
| Increase (Decrease) in Fair Value of Marketable Securities | 39,083 | (1,562 | ) | |||||
| Other Income | 195 | 177 | ||||||
| Loss on Investment in Joint Ventures | (64 | ) | (81 | ) | ||||
| Interest Expense | (9,095 | ) | (5,934 | ) | ||||
| TOTAL OTHER INCOME (EXPENSE) | (3,823 | ) | (4,763 | ) | ||||
| Income before Loss on Sales of Investment Property and Equipment | 7,692 | 4,811 | ||||||
| Loss on Sales of Investment Property and Equipment | (3 | ) | (1 | ) | ||||
| NET INCOME | 7,689 | 4,810 | ||||||
| Preferred Dividends | (5,173 | ) | (5,129 | ) | ||||
| Loss Attributable to Non-Controlling Interest | 64 | 48 | ||||||
NET INCOME (LOSS) ATTRIBUTABLE TO COMMON SHAREHOLDERS | $ | 2,580 | $ | (271 | ) | |||
NET INCOME (LOSS) ATTRIBUTABLE TO COMMON SHAREHOLDERS PER SHARE – | ||||||||
| Basic and Diluted | $ | 0.03 | $ | (0.00 | ) | |||
| WEIGHTED AVERAGE COMMON SHARES OUTSTANDING: | ||||||||
| Basic | 84,998 | 82,391 | ||||||
| Diluted | 85,371 | 83,335 | ||||||
| UMH Properties, Inc. | First Quarter FY 2026 Supplemental Information | 5 |
Consolidated Statements of Cash Flows
(in thousands) (unaudited)
| Three Months Ended | ||||||||
| March 31, 2026 | March 31, 2025 | |||||||
| CASH FLOWS FROM OPERATING ACTIVITIES: | ||||||||
| Net Income | $ | 7,689 | $ | 4,810 | ||||
| Non-Cash Items Included in Net Income: | ||||||||
| Depreciation | 17,976 | 16,663 | ||||||
| Amortization of Financing Costs | 881 | 599 | ||||||
| Stock Compensation Expense | 1,152 | 1,813 | ||||||
| Provision for Uncollectible Notes and Other Receivables | 407 | 450 | ||||||
| Loss on Marketable Securities, net | 36,418 | -0- | ||||||
| (Increase) Decrease in Fair Value of Marketable Securities | (39,083 | ) | 1,562 | |||||
| Loss on Sales of Investment Property and Equipment | 3 | 1 | ||||||
| Loss on Investment in Joint Ventures | 158 | 185 | ||||||
| Changes in Operating Assets and Liabilities: | ||||||||
| Inventory of Manufactured Homes | (2,029 | ) | (6,026 | ) | ||||
| Notes and Other Receivables, net of notes acquired with acquisitions | (1,793 | ) | (3,432 | ) | ||||
| Prepaid Expenses and Other Assets | (2,035 | ) | 441 | |||||
| Accounts Payable | 1,316 | (889 | ) | |||||
| Accrued Liabilities and Deposits | (522 | ) | (3,574 | ) | ||||
| Tenant Security Deposits | 306 | 176 | ||||||
| Net Cash Provided by Operating Activities | 20,844 | 12,779 | ||||||
| CASH FLOWS FROM INVESTING ACTIVITIES: | ||||||||
| Purchase of Manufactured Home Communities | -0- | (25,367 | ) | |||||
| Purchase of Investment Property and Equipment | (24,394 | ) | (20,656 | ) | ||||
| Proceeds from Sales of Investment Property and Equipment | 983 | 1,003 | ||||||
| Additions to Land Development Costs | (9,460 | ) | (10,611 | ) | ||||
| Purchase of Marketable Securities through automatic reinvestments | (7 | ) | (7 | ) | ||||
| Investment in Joint Ventures | (309 | ) | (773 | ) | ||||
| Net Cash Used in Investing Activities | (33,187 | ) | (56,411 | ) | ||||
| CASH FLOWS FROM FINANCING ACTIVITIES: | ||||||||
| Net Payments from Short-Term Borrowings | 126 | 371 | ||||||
| Principal Payments of Mortgages and Loans | (2,340 | ) | (9,391 | ) | ||||
| Financing Costs on Debt | (24 | ) | -0- | |||||
| Proceeds from At-The-Market Preferred Equity Program, net of offering costs | 1,464 | 982 | ||||||
| Proceeds from At-The-Market Common Equity Program, net of offering costs | -0- | 9,237 | ||||||
| Proceeds from Issuance of Common Stock in the DRIP, net of dividend reinvestments | 1,306 | 1,776 | ||||||
| Proceeds from Exercise of Stock Options | 97 | 354 | ||||||
| Preferred Dividends Paid | (5,173 | ) | (5,129 | ) | ||||
| Common Dividends Paid, net of dividend reinvestments | (18,068 | ) | (16,893 | ) | ||||
| Net Cash Used in Financing Activities | (22,612 | ) | (18,693 | ) | ||||
| NET DECREASE IN CASH, CASH EQUIVALENTS AND RESTRICTED CASH | (34,955 | ) | (62,325 | ) | ||||
| CASH, CASH EQUIVALENTS AND RESTRICTED CASH AT BEGINNING OF PERIOD | 80,926 | 108,811 | ||||||
| CASH, CASH EQUIVALENTS AND RESTRICTED CASH AT END OF PERIOD | $ | 45,971 | $ | 46,486 | ||||
| UMH Properties, Inc. | First Quarter FY 2026 Supplemental Information | 6 |
Reconciliation of Net Income to Adjusted EBITDA and Net Income (Loss) Attributable to Common Shareholders to FFO and Normalized FFO
(in thousands) (unaudited)
| Three Months Ended | ||||||||
| March 31, 2026 | March 31, 2025 | |||||||
| Net Income | $ | 7,689 | $ | 4,810 | ||||
| Interest Expense | 9,095 | 5,934 | ||||||
| Franchise Taxes | 150 | 150 | ||||||
| Depreciation Expense | 17,976 | 16,663 | ||||||
| Depreciation Expense from Unconsolidated Joint Ventures | 246 | 217 | ||||||
| (Increase) Decrease in Fair Value of Marketable Securities | (39,083 | ) | 1,562 | |||||
| Loss on Marketable Securities, net | 36,418 | -0- | ||||||
| Adjusted EBITDA | 32,491 | 29,336 | ||||||
| Non-Recurring Other Expense (1) | 335 | 49 | ||||||
| Adjusted EBITDA excluding Non-Recurring Other Expense | $ | 32,826 | $ | 29,385 | ||||
| Reconciliation of Net Income (Loss) Attributable to Common Shareholders to Funds from Operations | ||||||||
| Net Income (Loss) Attributable to Common Shareholders | $ | 2,580 | $ | (271 | ) | |||
| Depreciation Expense | 17,976 | 16,663 | ||||||
| Depreciation Expense from Unconsolidated Joint Ventures | 246 | 217 | ||||||
| Loss on Sales of Investment Property and Equipment | 3 | 1 | ||||||
| (Increase) Decrease in Fair Value of Marketable Securities | (39,083 | ) | 1,562 | |||||
| Loss on Marketable Securities, net | 36,418 | -0- | ||||||
| Funds from Operations Attributable to Common Shareholders (“FFO”) | 18,140 | 18,172 | ||||||
| Adjustments: | ||||||||
| Amortization of Financing Costs | 881 | 599 | ||||||
| Non-Recurring Other Expense (1) | 335 | 49 | ||||||
| Normalized Funds from Operations Attributable to Common Shareholders (“Normalized FFO”) | $ | 19,356 | $ | 18,820 | ||||
| (1) | Consists
of one-time legal and professional fees for the three months ended March 31, 2026 and 2025. |
| UMH Properties, Inc. | First Quarter FY 2026 Supplemental Information | 7 |
Market Capitalization, Debt and Coverage Ratios
(in thousands except per share data) (unaudited)
| Three Months Ended | Year Ended | |||||||||||
| March 31, 2026 | March 31, 2025 | December 31, 2025 | ||||||||||
| Shares Outstanding | 85,137 | 82,825 | 84,850 | |||||||||
| Market Price Per Share | $ | 14.43 | $ | 18.70 | $ | 15.91 | ||||||
| Equity Market Capitalization | $ | 1,228,523 | $ | 1,548,830 | 1,349,971 | |||||||
| Total Debt | 759,870 | 606,301 | 761,227 | |||||||||
| Preferred | 324,552 | 321,804 | 322,899 | |||||||||
| Total Market Capitalization | $ | 2,312,945 | $ | 2,476,935 | $ | 2,434,097 | ||||||
| Total Debt | $ | 759,870 | $ | 606,301 | $ | 761,227 | ||||||
| Less: Cash and Cash Equivalents | (37,410 | ) | (35,199 | ) | (72,100 | ) | ||||||
| Net Debt | 722,460 | 571,102 | 689,127 | |||||||||
| Less: Marketable Securities at Fair Value (“Securities”) | (26,430 | ) | (30,328 | ) | (23,758 | ) | ||||||
| Net Debt Less Securities | $ | 696,030 | $ | 540,774 | $ | 665,369 | ||||||
| Interest Expense | $ | 9,095 | $ | 5,934 | $ | 29,683 | ||||||
| Capitalized Interest | 1,474 | 1,291 | 5,928 | |||||||||
| Preferred Dividends | 5,173 | 5,129 | 20,533 | |||||||||
| Total Fixed Charges | $ | 15,742 | $ | 12,354 | $ | 56,144 | ||||||
| Adjusted EBITDA excluding Non-Recurring Other Expense | $ | 32,826 | $ | 29,385 | $ | 127,284 | ||||||
| Debt and Coverage Ratios | ||||||||||||
| Net Debt / Total Market Capitalization | 31.2 | % | 23.1 | % | 28.3 | % | ||||||
| Net Debt Plus Preferred / Total Market Capitalization | 45.3 | % | 36.0 | % | 41.6 | % | ||||||
| Net Debt Less Securities / Total Market Capitalization | 30.1 | % | 21.8 | % | 27.3 | % | ||||||
| Net Debt Less Securities
Plus Preferred / Total Market Capitalization | 44.1 | % | 34.8 | % | 40.6 | % | ||||||
| Interest Coverage | 3.1 | x | 4.1 | x | 3.6 | x | ||||||
| Fixed Charge Coverage | 2.1 | x | 2.4 | x | 2.3 | x | ||||||
| Net Debt / Adjusted
EBITDA excluding Non-Recurring Other Expense | 5.5 | x | 4.9 | x | 5.4 | x | ||||||
| Net Debt Less Securities
/ Adjusted EBITDA excluding Non-Recurring Other Expense | 5.3 | x | 4.6 | x | 5.2 | x | ||||||
| Net Debt Plus Preferred
/ Adjusted EBITDA excluding Non-Recurring Other Expense | 8.0 | x | 7.6 | x | 8.0 | x | ||||||
| Net Debt Less Securities Plus Preferred / Adjusted EBITDA excluding Non-Recurring Other Expense | 7.8 | x | 7.3 | x | 7.8 | x | ||||||
| UMH Properties, Inc. | First Quarter FY 2026 Supplemental Information | 8 |
(in thousands) (unaudited)
| Three Months Ended | Year Ended | |||||||||||
| March 31, 2026 | March 31, 2025 | December 31, 2025 | ||||||||||
| Debt Outstanding | ||||||||||||
| Mortgages Payable: | ||||||||||||
| Fixed Rate Mortgages | $ | 559,779 | 479,879 | $ | 562,095 | |||||||
| Unamortized Debt Issuance Costs | (5,738 | ) | (3,507 | ) | (5,966 | ) | ||||||
| Mortgages, Net of Unamortized Debt Issuance Costs | $ | 554,041 | $ | 476,372 | $ | 556,129 | ||||||
| Loans Payable: | ||||||||||||
| Unsecured Line of Credit | $ | -0- | $ | -0- | $ | -0- | ||||||
| Other Loans Payable | 28,567 | 29,883 | 28,464 | |||||||||
| Total Loans Before Unamortized Debt Issuance Costs | 28,567 | 29,883 | 28,464 | |||||||||
| Unamortized Debt Issuance Costs | (606 | ) | (1,069 | ) | (768 | ) | ||||||
| Loans, Net of Unamortized Debt Issuance Costs | $ | 27,961 | $ | 28,814 | $ | 27,696 | ||||||
| Series A Bonds Payable: | ||||||||||||
| Series A Bonds | $ | 102,670 | $ | 102,670 | $ | 102,670 | ||||||
| Unamortized Debt Issuance Costs | (707 | ) | (1,555 | ) | (919 | ) | ||||||
Series A Bonds, Net of Unamortized Debt Issuance Costs | $ | 101,963 | $ | 101,115 | $ | 101,751 | ||||||
| Series B Bonds Payable: | ||||||||||||
| Series B Bonds | $ | 80,230 | $ | -0- | $ | 80,230 | ||||||
| Unamortized Debt Issuance Costs | (4,325 | ) | -0- | (4,579 | ) | |||||||
Series B Bonds, Net of Unamortized Debt Issuance Costs | $ | 75,905 | $ | -0- | $ | 75,651 | ||||||
| Total Debt, Net of Unamortized Debt Issuance Costs | $ | 759,870 | $ | 606,301 | $ | 761,227 | ||||||
| % Fixed/Floating | ||||||||||||
| Fixed | 99.3 | % | 99.0 | % | 99.3 | % | ||||||
| Floating | 0.7 | % | 1.0 | % | 0.7 | % | ||||||
| Total | 100.0 | % | 100.0 | % | 100.0 | % | ||||||
| Weighted Average Interest Rates (1) | ||||||||||||
| Mortgages Payable | 4.75 | % | 4.18 | % | 4.73 | % | ||||||
| Loans Payable | 6.35 | % | 6.50 | % | 6.38 | % | ||||||
| Series A Bonds Payable | 4.72 | % | 4.72 | % | 4.72 | % | ||||||
| Series B Bonds Payable | 5.85 | % | N/A | 5.85 | % | |||||||
| Total Average | 4.92 | % | 4.39 | % | 4.90 | % | ||||||
| Weighted Average Maturity (Years) | ||||||||||||
| Mortgages Payable | 5.9 | 4.2 | 6.1 | |||||||||
| (1) | Weighted average interest rates do not include the effect of unamortized debt issuance costs. |
| UMH Properties, Inc. | First Quarter FY 2026 Supplemental Information | 9 |
(in thousands) (unaudited)
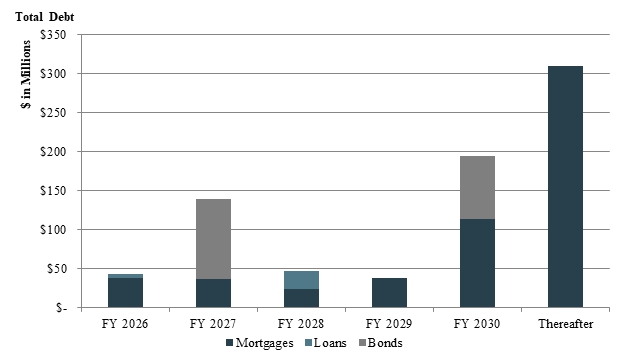
| As of March 31, 2026: | ||||||||||||||||||||
| Year Ended | Mortgages | Loans | Bonds | Total | % of Total | |||||||||||||||
| 2026 | $ | 37,796 | $ | 5,417 | $ | -0- | $ | 43,213 | 5.6 | % | ||||||||||
| 2027 | 36,773 | -0- | 102,670 | (1) | 139,443 | 18.1 | % | |||||||||||||
| 2028 | 23,802 | 23,150 | -0- | 46,952 | 6.1 | % | ||||||||||||||
| 2029 | 38,522 | -0- | -0- | 38,522 | 5.0 | % | ||||||||||||||
| 2030 | 113,790 | -0- | 80,230 | (2) | 194,020 | 25.1 | % | |||||||||||||
| Thereafter | 309,096 | -0- | -0- | 309,096 | 40.1 | % | ||||||||||||||
| Total Debt Before Unamortized Debt Issuance Costs | 559,779 | 28,567 | 182,900 | 771,246 | 100.0 | % | ||||||||||||||
| Unamortized Debt Issuance Costs | (5,738 | ) | (606 | ) | (5,032 | ) | (11,376 | ) | ||||||||||||
| Total Debt, Net of Unamortized Debt Issuance Costs | $ | 554,041 | $ | 27,961 | $ | 177,868 | $ | 759,870 | ||||||||||||
| (1) | Represents $102.7 million balance outstanding of the Company’s Series A Bonds due February 28, 2027. |
| (2) | Represents $80.2 million balance outstanding of the Company’s Series B Bonds due June 30, 2030. |
| UMH Properties, Inc. | First Quarter FY 2026 Supplemental Information | 10 |
Securities Portfolio Performance
(in thousands) (unaudited)
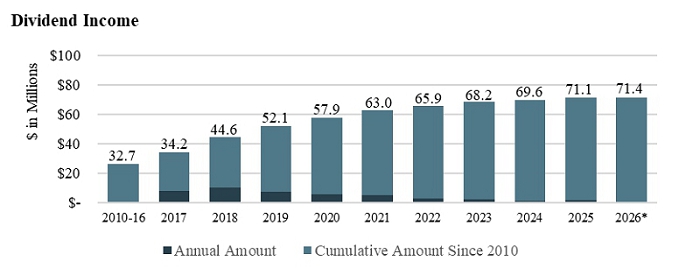
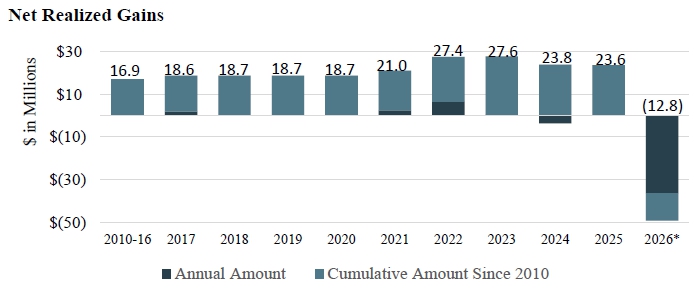
| Year Ended | Securities Available for Sale | Dividend Income | Net Realized Gain (Loss) on Securities | Net Realized Gain (Loss) on Securities & Dividend Income | ||||||||||||
| 2010-2016 | 108,755 | $ | 26,101 | $ | 16,903 | $ | 43,004 | |||||||||
| 2017 | 132,964 | 8,135 | 1,747 | 9,882 | ||||||||||||
| 2018 | 99,596 | 10,367 | 20 | 10,387 | ||||||||||||
| 2019 | 116,186 | 7,535 | -0- | 7,535 | ||||||||||||
| 2020 | 103,172 | 5,729 | -0- | 5,729 | ||||||||||||
| 2021 | 113,748 | 5,098 | 2,342 | 7,440 | ||||||||||||
| 2022 | 42,178 | 2,903 | 6,394 | 9,297 | ||||||||||||
| 2023 | 34,506 | 2,318 | 183 | 2,501 | ||||||||||||
| 2024 | 31,883 | 1,452 | (3,778 | ) | (2,326 | ) | ||||||||||
| 2025 | 23,758 | 1,477 | (221 | ) | 1,256 | |||||||||||
| 2026* | 26,430 | 302 | (36,418 | ) | (36,116 | ) | ||||||||||
| $ | 71,417 | $ | (12,828 | ) | $ | 58,589 | ||||||||||
* For the three months ended March 31, 2026.
| UMH Properties, Inc. | First Quarter FY 2026 Supplemental Information | 11 |
(unaudited)
| March 31, 2026 | March 31, 2025 | % Change | ||||||||||
| UMH Communities (1) | 142 | 139 | 2.2 | % | ||||||||
| Total Sites | 26,644 | 26,150 | 1.9 | % | ||||||||
| Occupied Sites | 23,606 | 22,996 | 610 sites, 2.7 | % | ||||||||
| Occupancy % | 88.6 | % | 87.9 | % | 70 bps | |||||||
| Total Rentals | 11,025 | 10,442 | 5.6 | % | ||||||||
| Occupied Rentals | 10,430 | 9,873 | 5.6 | % | ||||||||
| Rental Occupancy % | 94.6 | % | 94.6 | % | 0 bps | |||||||
| Monthly Rent Per Site | $ | 581 | $ | 554 | 4.9 | % | ||||||
| Monthly Rent Per Home Rental Including Site | $ | 1,060 | $ | 1,007 | 5.3 | % | ||||||
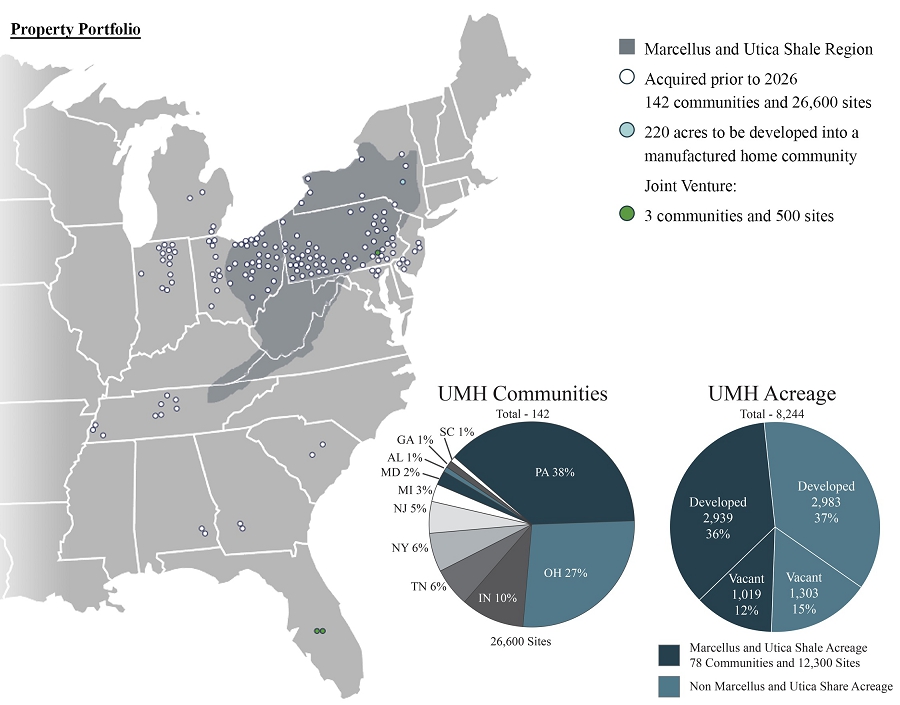
| State | Number | Total Acreage | Developed Acreage | Vacant Acreage | Total Sites | Occupied Sites | Occupancy Percentage | Monthly Rent Per Site | Total Rentals | Occupied Rentals | Rental Occupancy Percentage | Monthly Rent Per Home Rental (3) | ||||||||||||||||||||||||||||||||||||
| Pennsylvania | 53 | 2,392 | 1,909 | 483 | 7,999 | 7,043 | 88.0 | % | $ | 607 | 3,347 | 3,121 | 93.2 | % | $ | 1,051 | ||||||||||||||||||||||||||||||||
| Ohio | 38 | 2,069 | 1,557 | 512 | 7,374 | 6,608 | 89.6 | % | $ | 536 | 3,238 | 3,082 | 95.2 | % | $ | 1,013 | ||||||||||||||||||||||||||||||||
| Indiana | 14 | 1,111 | 929 | 182 | 4,102 | 3,700 | 90.2 | % | $ | 545 | 2,070 | 1,965 | 94.9 | % | $ | 1,054 | ||||||||||||||||||||||||||||||||
| Tennessee | 9 | 733 | 407 | 326 | 2,063 | 1,902 | 92.2 | % | $ | 604 | 966 | 930 | 96.3 | % | $ | 1,104 | ||||||||||||||||||||||||||||||||
| New York (2) | 8 | 819 | 327 | 492 | 1,368 | 1,206 | 88.2 | % | $ | 675 | 517 | 478 | 92.5 | % | $ | 1,225 | ||||||||||||||||||||||||||||||||
| New Jersey | 7 | 428 | 264 | 164 | 1,530 | 1,453 | 95.0 | % | $ | 748 | 40 | 35 | 87.5 | % | $ | 1,370 | ||||||||||||||||||||||||||||||||
| Michigan | 4 | 241 | 222 | 19 | 1,090 | 966 | 88.6 | % | $ | 544 | 434 | 423 | 97.5 | % | $ | 1,121 | ||||||||||||||||||||||||||||||||
| Maryland | 3 | 159 | 124 | 35 | 260 | 218 | 83.8 | % | $ | 650 | -0- | -0- | N/A | N/A | ||||||||||||||||||||||||||||||||||
| Alabama | 2 | 69 | 62 | 7 | 292 | 168 | 57.5 | % | $ | 262 | 153 | 144 | 94.1 | % | $ | 1,129 | ||||||||||||||||||||||||||||||||
| South Carolina | 2 | 157 | 55 | 102 | 321 | 244 | 76.0 | % | $ | 314 | 191 | 189 | 99.0 | % | $ | 1,146 | ||||||||||||||||||||||||||||||||
| Georgia | 2 | 66 | 66 | -0- | 245 | 98 | 40.0 | % | $ | 396 | 69 | 63 | 91.3 | % | $ | 1,203 | ||||||||||||||||||||||||||||||||
| Total UMH as of March 31, 2026 | 142 | 8,244 | 5,922 | 2,322 | 26,644 | 23,606 | 88.6 | % | $ | 581 | 11,025 | 10,430 | 94.6 | % | $ | 1,060 | ||||||||||||||||||||||||||||||||
| (1) | Excludes two Florida communities and one Pennsylvania community owned through joint ventures with Nuveen Real Estate in which the company has a 40% interest. |
| (2) | Total and Vacant Acreage of 220 acres for Mountain View Estates property is included in the above summary. |
| (3) | Includes home and site rent charges. |
| UMH Properties, Inc. | First Quarter FY 2026 Supplemental Information | 12 |
(in thousands) (unaudited)
| For Three Months Ended | ||||||||||||||||
| March 31, 2026 | March 31, 2025 | Change | % Change | |||||||||||||
| Same Property Community Net Operating Income (“NOI”) | ||||||||||||||||
| Rental and Related Income | $ | 57,865 | $ | 53,802 | $ | 4,063 | 7.6 | % | ||||||||
| Community Operating Expenses | 22,981 | 21,238 | 1,743 | 8.2 | % | |||||||||||
| Same Property Community NOI | $ | 34,884 | $ | 32,564 | $ | 2,320 | 7.1 | % | ||||||||
| March 31, 2026 | March 31, 2025 | Change | ||||||||||
| Total Sites | 25,777 | 25,608 | 0.7 | % | ||||||||
| Occupied Sites | 22,930 | 22,518 | 412 sites, 1.8 | % | ||||||||
| Occupancy % | 89.0 | % | 87.9 | % | 110 bps | |||||||
| Number of Properties | 135 | 135 | N/A | |||||||||
| Total Rentals | 10,852 | 10,283 | 5.5 | % | ||||||||
| Occupied Rentals | 10,270 | 9,718 | 5.7 | % | ||||||||
| Rental Occupancy | 94.6 | % | 94.5 | % | 10 bps | |||||||
| Monthly Rent Per Site | $ | 581 | $ | 553 | 5.1 | % | ||||||
| Monthly Rent Per Home Rental Including Site | $ | 1,058 | $ | 1,004 | 5.4 | % | ||||||
Same Property includes all UMH communities owned as of January 1, 2025, with the exception of Memphis Blues, Duck River Estates and River Bluff Estates.
| UMH Properties, Inc. | First Quarter FY 2026 Supplemental Information | 13 |
(dollars in thousands)
| Year of Acquisition | Number of Communities | Sites | Occupancy % at Acquisition | Purchase Price | Price Per Site | Total Acres | ||||||||||||||||||
| 2021 | 3 | 543 | 59 | % | $ | 18,300 | $ | 34 | 113 | |||||||||||||||
| 2022 | 7 | 1,480 | 65 | % | $ | 86,223 | $ | 58 | 461 | |||||||||||||||
| 2023 | 1 | 118 | -0- | % | $ | 3,650 | $ | 31 | 26 | |||||||||||||||
| 2025 | 5 | 587 | 78 | % | $ | 41,825 | $ | 71 | 160 | |||||||||||||||
| UMH Properties, Inc. | First Quarter FY 2026 Supplemental Information | 14 |
Investors and analysts following the real estate industry utilize funds from operations available to common shareholders (“FFO”), normalized funds from operations available to common shareholders (“Normalized FFO”), Community NOI, Same Property Community NOI, and earnings before interest, taxes, depreciation, amortization and acquisition costs (“Adjusted EBITDA excluding Non-Recurring Other Expense”), variously defined, as supplemental performance measures. While the Company believes net income (loss) available to common shareholders, as defined by accounting principles generally accepted in the United States of America (U.S. GAAP), is the most appropriate measure, it considers Community NOI, Same Property Community NOI, Adjusted EBITDA excluding Non-Recurring Other Expense, FFO and Normalized FFO, given their wide use by and relevance to investors and analysts, appropriate supplemental performance measures. FFO, reflecting the assumption that real estate asset values rise or fall with market conditions, principally adjusts for the effects of U.S. GAAP depreciation and amortization of real estate assets. FFO also adjusts for the effects of the change in the fair value of marketable securities and gains and losses realized on marketable securities. Normalized FFO reflects the same assumptions as FFO except that it also adjusts for amortization of financing costs and certain one-time charges. Community NOI and Same Property Community NOI provide a measure of rental operations and do not factor in depreciation and amortization and non-property specific expenses such as general and administrative expenses. Adjusted EBITDA excluding Non-Recurring Other Expense provides a tool to further evaluate the ability to incur and service debt and to fund dividends and other cash needs. In addition, Community NOI, Same Property Community NOI, Adjusted EBITDA, excluding Non-Recurring Other Expense, FFO and Normalized FFO are commonly used in various ratios, pricing multiples, yields and returns and valuation of calculations used to measure financial position, performance and value.
FFO, as defined by The National Association of Real Estate Investment Trusts (“Nareit”), is calculated to be equal to net income (loss) applicable to common shareholders, as defined by U.S. GAAP, excluding certain gains or losses from sales of previously depreciated real estate assets, impairment charges related to depreciable real estate assets, the change in the fair value of marketable securities, and the gain or loss on the sale of marketable securities plus certain non-cash items such as real estate asset depreciation and amortization. Included in the Nareit FFO White Paper - 2018 Restatement, is an option pertaining to assets incidental to our main business in the calculation of Nareit FFO to make an election to include or exclude gains and losses on the sale of these assets, such as marketable equity securities, and include or exclude mark-to-market changes in the value recognized on these marketable equity securities. In conjunction with the adoption of the FFO White Paper - 2018 Restatement, for all periods presented, we have elected to exclude the gains and losses realized on marketable securities and change in the fair value of marketable securities from our FFO calculation. Nareit created FFO as a non-GAAP supplemental measure of REIT operating performance.
Normalized FFO is calculated as FFO excluding amortization and certain one-time charges.
Normalized FFO per Diluted Common Share is calculated using diluted weighted shares outstanding of 85.4 million shares for the three months ended March 31, 2026, and 83.3 million shares for the three months ended March 31, 2025. Common stock equivalents resulting from stock options in the amount of 373,000 for the year ended March 31, 2026 were included in the computation of Diluted Net Income per share. Common stock equivalents resulting from stock options in the amount of 944,000 shares for the three months ended March 31, 2025 were excluded from the computation of Diluted Net Loss per Share as their effect would have been anti-dilutive.
Community NOI is calculated as rental and related income less community operating expenses such as real estate taxes, repairs and maintenance, community salaries, utilities, insurance and other expenses.
Same Property Community NOI is calculated as Community NOI, using all properties owned as of January 1, 2025, with the exception of Memphis Blues, Duck River Estates and River Bluff Estates.
Adjusted EBITDA excluding Non-Recurring Other Expense is calculated as net income (loss) plus interest expense, franchise taxes, depreciation, the change in the fair value of marketable securities and the gain (loss) on sales of marketable securities, adjusted for non-recurring other expenses.
Community NOI, Same Property Community NOI, Adjusted EBITDA excluding Non-Recurring Other Expense, FFO and Normalized FFO do not represent cash generated from operating activities in accordance with U.S. GAAP and are not necessarily indicative of cash available to fund cash needs, including the repayment of principal on debt and payment of dividends and distributions. Community NOI, Same Property Community NOI, Adjusted EBITDA excluding Non-Recurring Other Expense, FFO and Normalized FFO should not be considered as substitutes for net income (loss) applicable to common shareholders (calculated in accordance with U.S. GAAP) as a measure of results of operations, or cash flows (calculated in accordance with U.S. GAAP) as a measure of liquidity. Community NOI, Same Property Community NOI, Adjusted EBITDA excluding Non-Recurring Other Expense, FFO and Normalized FFO as currently calculated by the Company may not be comparable to similarly titled, but variously calculated, measures of other REITs.
| UMH Properties, Inc. | First Quarter FY 2026 Supplemental Information | 15 |