.4
MANAGEMENT’S DISCUSSION AND ANALYSIS (“MD&A”)
CAUTIONARY STATEMENT ON FORWARD-LOOKING INFORMATION
| BARRICK YEAR-END 2018 |
17 | MANAGEMENT’S DISCUSSION AND ANALYSIS |
| BARRICK YEAR-END 2018 |
18 | MANAGEMENT’S DISCUSSION AND ANALYSIS |
| BARRICK YEAR-END 2018 |
19 | MANAGEMENT’S DISCUSSION AND ANALYSIS |
OVERVIEW
| BARRICK YEAR-END 2018 |
20 | MANAGEMENT’S DISCUSSION AND ANALYSIS |
FULL YEAR FINANCIAL AND OPERATING HIGHLIGHTS
| 1 | These are non-GAAP financial performance measures with no standardized meaning under IFRS and therefore may not be comparable to similar measures presented by other issuers. For further information and a detailed reconciliation of each non-GAAP measure to the most directly comparable IFRS measure, please see pages 61 to 76 of this MD&A. |
| 2 | Cost of sales applicable to gold per ounce is calculated using cost of sales applicable to gold on an attributable basis (removing the non-controlling interest of 40% Pueblo Viejo, 36.1% Acacia and 40% South Arturo from cost of sales), divided by attributable gold ounces sold. Cost of sales applicable to copper per pound is calculated using cost of sales applicable to copper including our proportionate share of cost of sales attributable to equity method investments (Zaldívar and Jabal Sayid), divided by consolidated copper pounds sold (including our proportionate share of copper pounds sold from our equity method investments). |
| 3 | Outlook for 2019 includes Loulo-Gounkoto on an 80% basis, Kibali on a 45% basis, Tongon on an 89.7% basis, and Morila on a 40% basis, which were acquired as a result of the merger with Randgold on January 1, 2019. |
| BARRICK YEAR-END 2018 |
21 | MANAGEMENT’S DISCUSSION AND ANALYSIS |
| ($ millions, except per share amounts in dollars) | For the years ended December 31 |
For the three months ended December 31 |
||||||||||||||||||
| 2018 | 2017 | 2016 | 2018 | 2017 | ||||||||||||||||
| Net (loss) earnings attributable to equity holders of the Company |
($1,545 | ) | $1,438 | $655 | ($1,197 | ) | ($314 | ) | ||||||||||||
| Per share (dollars)1 |
(1.32 | ) | 1.23 | 0.56 | (1.02 | ) | (0.27 | ) | ||||||||||||
| Adjusted net earnings2 |
409 | 876 | 818 | 69 | 253 | |||||||||||||||
| Per share (dollars)1,2 |
0.35 | 0.75 | 0.70 | 0.06 | 0.22 | |||||||||||||||
| Operating cash flow |
1,765 | 2,065 | 2,640 | 411 | 590 | |||||||||||||||
| Free cash flow2 |
$365 | $669 | $1,514 | $37 | $240 | |||||||||||||||
| 1 | Calculated using weighted average number of shares outstanding under the basic method of earnings per share of 1,167 million shares in 2018 (2017: 1,166 million shares; 2016: 1,165 million shares). |
| 2 | Adjusted net earnings, adjusted net earnings per share, and free cash flow are non-GAAP financial performance measures with no standardized meaning under IFRS and therefore may not be comparable to similar measures of performance presented by other issuers. For further information and a detailed reconciliation of the non-GAAP measures used in this section of the MD&A to the most directly comparable IFRS measures, please see pages 61 to 76 of this MD&A. |
| BARRICK YEAR-END 2018 |
22 | MANAGEMENT’S DISCUSSION AND ANALYSIS |
Net Earnings (Loss), Adjusted Net Earnings1, Operating Cash Flow and Free Cash Flow1
| 1 | These are non-GAAP financial performance measures with no standardized meaning under IFRS and therefore may not be comparable to similar measures of performance presented by other issuers. For further information and a detailed reconciliation of the non-GAAP measures used in this section of the MD&A to the most directly comparable IFRS measures, please see pages 61 to 76 of this MD&A. |
| 2 | Estimated impact of foreign exchange. |
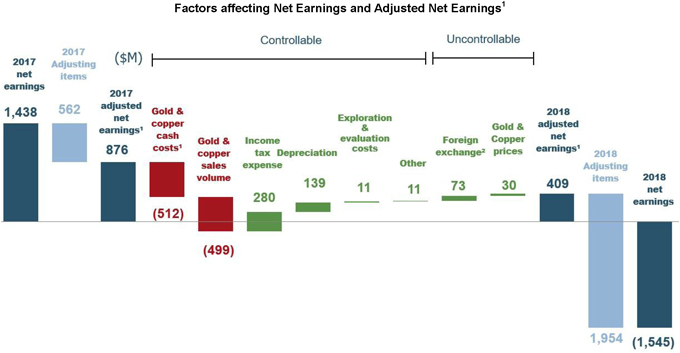
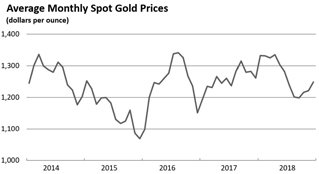
Net earnings attributable to equity holders of Barrick (“net earnings”) for 2018 was a net loss of $1,545 million compared with net earnings of $1,438 million in the prior year. This significant decrease in net earnings was primarily due to net impairment charges of $900 million ($799 million net of tax and non-controlling interest), primarily relating to impairments of $405 million (no tax impact) of non-current assets at Lagunas Norte, and $246 million ($160 million net of tax) of non-current assets and $154 million (no tax impact) of goodwill at the Veladero mine. This was combined with the de-recognition of deferred tax assets of $814 million, and inventory impairment at Lagunas Norte of $166 million. After adjusting for items that are not indicative of future operating earnings, adjusted net earnings1 of $409 million in 2018 were $467 million lower than the prior year primarily due to the impact of lower grades and recoveries across most operations as disclosed in previous guidance combined with higher direct mining costs and the divestment of 50% of the Veladero mine on June 30, 2017. The increase in direct mining costs was mainly attributable to higher energy prices and consumption. This was further impacted by lower throughput at Acacia as a result of reduced operations at Bulyanhulu, lower tonnage processed at Lagunas Norte, and higher government imposts at Veladero. This was partially offset by lower income tax expense related to lower earnings and sales volumes, and lower depreciation. Earnings were also positively impacted by favorable foreign exchange movements and higher realized gold prices1 of $1,267 per ounce compared to $1,258 per ounce in the prior year.
Significant adjusting items to net earnings (pre-tax and non-controlling interest effects) in 2018 include:
| • | $900 million ($799 million net of tax and non-controlling interest) in net impairment charges primarily relating to Veladero and Lagunas Norte; |
| • | $742 million in significant tax adjustments primarily relating to the de-recognition of deferred tax assets of $814 million, partially offset by a deferred tax recovery of $107 million on United States withholding taxes; |
| • | Additional adjustments relating to the inventory impairment at Lagunas Norte of $166 million, a write-off of a Western Australia long-term stamp duty tax receivable of $43 million, and costs associated with the merger with Randgold of $37 million; partially offset by |
| • | $68 million ($46 million net of tax and non-controlling interest) in disposition gains mainly relating to the sale of a non-core royalty asset at Acacia. |
Refer to page 62 for a full list of reconciling items between net earnings and adjusted net earnings1 for the current and prior year.
| BARRICK YEAR-END 2018 |
23 | MANAGEMENT’S DISCUSSION AND ANALYSIS |
| 1 | These are non-GAAP financial performance measures with no standardized meaning under IFRS and therefore may not be comparable to similar measures of performance presented by other issuers. For further information and a detailed reconciliation of the non-GAAP measures used in this section of the MD&A to the most directly comparable IFRS measures, please see pages 61 to 76 of this MD&A. |
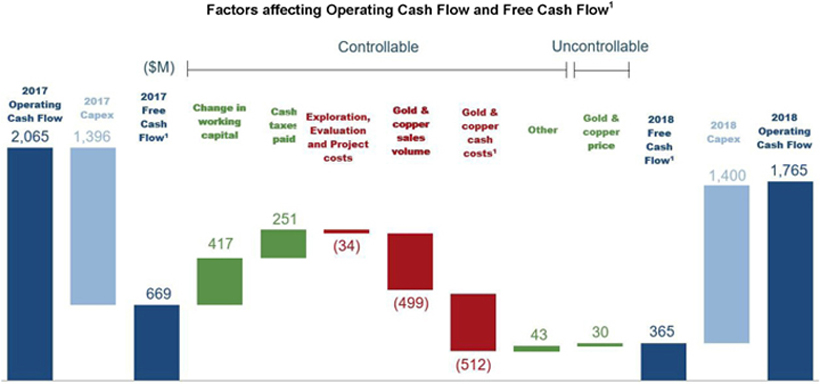
In 2018, we generated $1,765 million in operating cash flow, compared to $2,065 million of operating cash flow in the prior year. The decrease of $300 million was due to the impact of lower grades and recoveries across most operations as disclosed in previous guidance combined with higher direct mining costs and the divestment of 50% of the Veladero mine on June 30, 2017. The increase in direct mining costs was mainly attributable to higher energy prices and consumption. This was further impacted by lower throughput at Acacia as a result of reduced operations at Bulyanhulu, lower tonnage processed at Lagunas Norte, and higher government imposts at Veladero. This was partially offset by a favorable movement in working capital, mainly as a result of increased drawdown of inventory and the timing of payments and changes in other current assets and liabilities. Operating cash flow was also positively affected by lower cash taxes paid as a result of lower earnings and sales volumes, and higher realized gold prices1 of $1,267 per ounce compared to $1,258 per ounce in the prior year.
Free cash flow1 for 2018 was $365 million, compared to $669 million in the prior year, reflecting lower operating cash flows. Capital expenditures were in line with the prior year, as an increase in project capital expenditures was offset by a decrease in minesite sustaining capital expenditures. The increase in project capital expenditures is primarily a result of greater spending incurred at Crossroads, the Cortez Range Front declines, the Goldrush exploration declines, the Deep South Expansion at Barrick Nevada, and the construction of the third shaft at Turquoise Ridge. Minesite sustaining capital expenditures decreased mainly due to the completion of several initiatives occurring in the prior year, including the Goldstrike underground cooling and ventilation project; digitization initiatives; the autoclave thiosulfate water treatment plant conversion at the Goldstrike autoclaves; the optimization of development sequencing at Turquoise Ridge; and the construction of phases 4B and 5B of the leach pad expansion at Veladero.
| BARRICK YEAR-END 2018 |
24 | MANAGEMENT’S DISCUSSION AND ANALYSIS |
| BARRICK YEAR-END 2018 |
25 | MANAGEMENT’S DISCUSSION AND ANALYSIS |
| BARRICK YEAR-END 2018 |
26 | MANAGEMENT’S DISCUSSION AND ANALYSIS |
| BARRICK YEAR-END 2018 |
27 | MANAGEMENT’S DISCUSSION AND ANALYSIS |
Key Business Developments
| BARRICK YEAR-END 2018 |
28 | MANAGEMENT’S DISCUSSION AND ANALYSIS |
Outlook for 2019
Operating Unit Guidance
Our 2018 gold and copper production, cost of sales, cash costs1, all-in sustaining costs1 and 2019 forecast gold and copper production, cost of sales, cash costs1 and all-in sustaining costs1 ranges by operating unit are as follows:
| Operating Unit
|
2018
|
2018 cost of
|
2018
|
2018 all-in sustaining ($/oz)
|
2019 forecast
|
2019 forecast cost of sales1 ($/oz)
|
2019 forecast cash costs2 ($/oz)
|
2019 forecast sustaining
| ||||||||
| Gold |
||||||||||||||||
| Barrick Nevada3 |
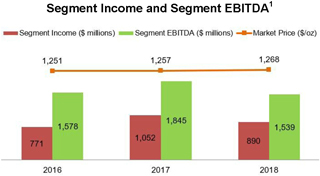
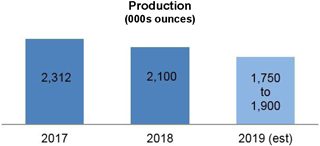
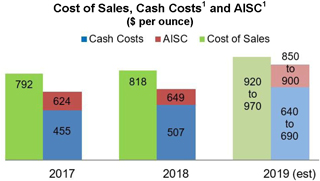
2,100 | $818 | $507 | $649 | 1,750 - 1,900 | $920 - $970 | $640 - $690 | $850 - $900 | ||||||||
| Pueblo Viejo (60%) |
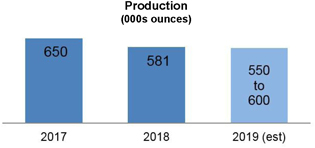
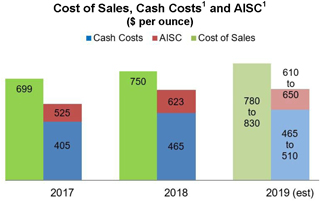
581 | 750 | 465 | 623 | 550 - 600 | 780 - 830 | 465 - 510 | 610 - 650 | ||||||||
| Loulo-Gounkoto (80%)4,5 |
520 - 570 | 800 - 850 | 575 - 625 | 810 - 850 | ||||||||||||
| Kibali (45%)4,5 |
330 - 350 | 890 - 940 | 555 - 605 | 670 - 730 | ||||||||||||
| Kalgoorlie (50%) |
314 | 899 | 732 | 857 | 280 - 300 | 920 - 970 | 740 - 790 | 920 - 960 | ||||||||
| Turquoise Ridge (75%) |
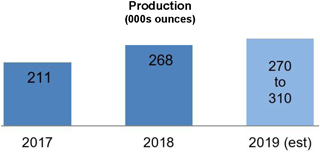
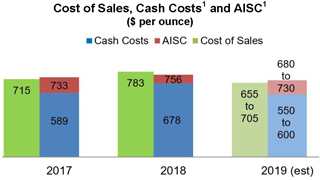
268 | 783 | 678 | 756 | 270 - 310 | 655 - 705 | 550 - 600 | 680 - 730 | ||||||||
| Tongon (89.7%)4,5 |
250 - 270 | 945 - 995 | 710 - 760 | 780 - 820 | ||||||||||||
| Porgera (47.5%) |
204 | 996 | 796 | 1,083 | 240 - 260 | 980 - 1,030 | 800 - 850 | 985 - 1,025 | ||||||||
| Veladero (50%) |
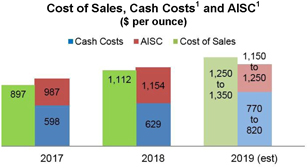
278 | 1,112 | 629 | 1,154 | 230 - 250 | 1,250 - 1,350 | 770 - 820 | 1,150 - 1,250 | ||||||||
| Hemlo |
171 | 1,157 | 1,046 | 1,318 | 200 - 220 | 890 - 940 | 765 - 815 | 1,100 - 1,200 | ||||||||
| Acacia (63.9%) |
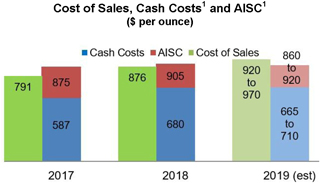
334 | 876 | 680 | 905 | 320 - 350 | 920 - 970 | 665 - 710 | 860 - 920 | ||||||||
| Other Sites6
|
277
|
1,387
|
590
|
778
|
190 - 250
|
1,075 - 1,165
|
895 - 945
|
1,055 - 1,115
| ||||||||
|
Total Consolidated Barrick5,7,8,9 |
4,527
|
$892
|
$588
|
$806
|
5,100 - 5,600
|
$880 - $940
|
$650 - $700
|
$870 - $920
| ||||||||
|
2018
|
2018 cost of
|
2018 C1 costs2 ($/lb)
|
2018 all-in ($/lb)
|
2019 forecast
|
2019 forecast cost of sales1
|
2019 forecast
|
2019 forecast sustaining
| |||||||||
| Copper |
||||||||||||||||
| Lumwana |
224 | $2.51 | $2.08 | $3.08 | 210 - 240 | $2.25 - $2.50 | $1.80 - $2.10 | $2.75 - $3.15 | ||||||||
| Zaldívar (50%) |
104 | 2.55 | 1.97 | 2.47 | 120 - 130 | 2.40 - 2.70 | 1.65 - 1.85 | 2.00 - 2.20 | ||||||||
| Jabal Sayid (50%) |
55 | 1.73 | 1.53 | 1.92 | 45 - 60 | 2.00 - 2.30 | 1.60 - 1.90 | 1.60 - 1.90 | ||||||||
|
Total Copper9 |
383
|
$2.40
|
$1.97
|
$2.82
|
375 - 430
|
$2.30 - $2.70
|
$1.70 - $2.00
|
$2.40 - $2.90
| ||||||||
| 1 | 2018 cost of sales applicable to gold per ounce is calculated using cost of sales applicable to gold on an attributable basis (removing the non-controlling interest of 40% Pueblo Viejo, 36.1% Acacia and 40% South Arturo from cost of sales), divided by attributable gold ounces sold. 2019 cost of sales applicable to gold per ounce also removes the non-controlling interest of 20% Loulo-Gounkoto and 10.3% of Tongon from cost of sales. Cost of sales applicable to copper per pound is calculated using cost of sales applicable to copper including our proportionate share of cost of sales attributable to equity method investments (Zaldívar and Jabal Sayid), divided by consolidated copper pounds sold (including our proportionate share of copper pounds sold from our equity method investments). |
| 2 | Cash costs, all-in sustaining costs and C1 cash costs are non-GAAP financial performance measures with no standardized meaning under IFRS and therefore may not be comparable to similar measures of performance presented by other issuers. For further information and a detailed reconciliation of the non-GAAP measures used in this section of the MD&A to the most directly comparable IFRS measures, please see pages 61 to 76 of this MD&A. |
| 3 | Reflects production and sales from Goldstrike, Cortez, and South Arturo on a 60% basis, which reflects our equity share. |
| 4 | These sites were acquired as a result of the merger with Randgold on January 1, 2019, and therefore no 2018 figures are provided. |
| 5 | 2019 forecast cost of sales does not include the impact of the Randgold purchase price allocation. |
| 6 | Other sites for 2018 includes Lagunas Norte and Golden Sunlight. 2019 also includes Morila on a 40% basis, which was acquired as a result of the merger with Randgold on January 1, 2019. |
| 7 | Total gold cash costs and all-in sustaining costs per ounce include the impact of hedges and/or costs allocated to non-operating sites. |
| 8 | Operating unit guidance ranges reflect expectations at each individual operating unit, and may not add up to the company-wide guidance range total. The company-wide 2018 results and guidance ranges exclude Pierina which is mining incidental ounces as it enters closure. |
| 9 | Includes corporate administration costs. |
| BARRICK YEAR-END 2018 |
29 | MANAGEMENT’S DISCUSSION AND ANALYSIS |
Operating Unit, Consolidated Expense and Capital Guidance
Our 2018 gold and copper production, cost of sales, cash costs1, all-in sustaining costs1, consolidated expenses and capital expenditures and forecast gold and copper production, cost of sales, cash costs1, all-in sustaining costs1, consolidated expenses and capital expenditures for 2019 are as follows:
|
($ millions, except per ounce/pound data)
|
2018 Original Guidance
|
Q3 2018 Guidance
|
2018 Actual
|
2019 Guidance
|
||||||||||||
| Gold production and costs |
||||||||||||||||
| Production (millions of ounces) |
4.50 - 5.00 | 4.50 - 5.00 | 4.53 | 5.10 - 5.60 | ||||||||||||
| Gold unit production costs |
||||||||||||||||
| Cost of sales - gold ($ per oz)2 |
810 - 850 | 810 - 850 | 892 | 880 - 940 | ||||||||||||
| Cash costs ($ per oz)1 |
540 - 575 | 540 - 575 | 588 | 650 - 700 | ||||||||||||
| Depreciation ($ per oz)2 |
240 - 260 | 240 - 260 | 248 | 215 - 235 | ||||||||||||
| All-in sustaining costs ($ per oz)1 |
765 - 815 | 765 - 815 | 806 | 870 - 920 | ||||||||||||
| Copper production and costs |
||||||||||||||||
| Production (millions of pounds) |
385 - 450 | 345 - 410 | 383 | 375 - 430 | ||||||||||||
| Copper unit production costs |
||||||||||||||||
| Cost of sales - copper ($ per lb) |
1.80 - 2.10 | 2.00 - 2.30 | 2.40 | 2.30 - 2.70 | ||||||||||||
| C1 cash costs ($ per lb)1 |
1.55 - 1.75 | 1.80 - 2.00 | 1.97 | 1.70 - 2.00 | ||||||||||||
| Depreciation ($ per lb) |
0.40 - 0.50 | 0.40 - 0.50 | 0.65 | 0.60 - 0.70 | ||||||||||||
| Copper all-in sustaining costs ($ per lb)1 |
2.30 - 2.60 | 2.55 - 2.85 | 2.82 | 2.40 - 2.90 | ||||||||||||
| Exploration and project expenses |
325 - 405 | 325 - 405 | 383 | 280 – 340 | ||||||||||||
| Exploration and evaluation |
185 - 225 | 185 - 225 | 166 | 160 – 170 | ||||||||||||
| Project expenses |
140 - 180 | 140 - 180 | 217 | 120 - 150 | ||||||||||||
| General and administrative expenses |
~340 | ~300 | 265 | ~200 | ||||||||||||
| Corporate administration |
~275 | ~235 | 212 | ~140 | ||||||||||||
| Stock-based compensation3 |
~30 | ~30 | 27 | ~40 | ||||||||||||
| Acacia4 |
~35 | ~35 | 26 | ~20 | ||||||||||||
| Other expense (income) |
80 - 100 | 80 - 100 | 90 | 80 - 100 | ||||||||||||
| Finance costs, net5 |
500 - 550 | 500 - 550 | 545 | 500 - 550 | ||||||||||||
| Attributable capital expenditures: |
||||||||||||||||
| Attributable minesite sustaining |
950 - 1,100 | 950 - 1,100 | 946 | 1,100 - 1,300 | ||||||||||||
| Attributable project |
450 - 550 | 450 - 550 | 467 | 300 - 400 | ||||||||||||
| Total attributable capital expenditures6 |
1,400 - 1,600 | 1,400 - 1,600 | 1,413 | 1,400 - 1,700 | ||||||||||||
| 1 | Cash costs, all-in sustaining costs and C1 cash costs are non-GAAP financial performance measures with no standardized meaning under IFRS and therefore may not be comparable to similar measures of performance presented by other issuers. For further information and a detailed reconciliation of the non-GAAP measures used in this section of the MD&A to the most directly comparable IFRS measures, please see pages 61 to 76 of this MD&A. |
| 2 | 2019 guidance does not include the impact of the Randgold purchase price allocation. |
| 3 | 2018 actual based on US$13.54 and 2019 guidance based on a three month trailing average ending December 31, 2018 of US$12.40 per share and excludes Acacia. |
| 4 | Acacia general and administrative expenses is substantially comprised of stock-based compensation. |
| 5 | 2018 actual includes a net loss on debt extinguishment of $29 million. |
| 6 | Attributable capital expenditures are presented on the same basis as guidance, which includes our 60% share of Pueblo Viejo and South Arturo, our 80% share of Loulo-Gounkoto, our 89.7% share of Tongon, our 63.9% share of Acacia and our 50% share of Zaldívar and Jabal Sayid. |
| BARRICK YEAR-END 2018 |
30 | MANAGEMENT’S DISCUSSION AND ANALYSIS |
| BARRICK YEAR-END 2018 |
31 | MANAGEMENT’S DISCUSSION AND ANALYSIS |
Outlook Assumptions and Economic Sensitivity Analysis
| 2019 Guidance Assumption |
Hypothetical Change |
Impact on Revenue (millions) |
Impact on Cost of Sales (millions) |
Impact on
All-in Sustaining Costs1 | ||||||
| Gold revenue, net of royalties |
$1,250/oz | +/- $100/oz | +/- $535 | +/- $17 | +/- $3/oz | |||||
| Copper revenue, net of royalties |
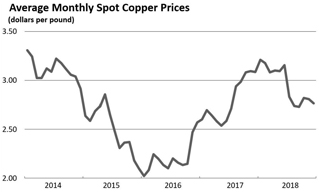
$2.75/lb | +/- $0.50/lb | +/- $201 | +/- $18 | +/- $0.04/lb | |||||
| 1 | All-in sustaining costs is a non-GAAP financial performance measure with no standardized definition under IFRS. For further information and a detailed reconciliation, please see pages 61 to 76 of this MD&A. |
| BARRICK YEAR-END 2018 |
32 | MANAGEMENT’S DISCUSSION AND ANALYSIS |
| BARRICK YEAR-END 2018 |
33 | MANAGEMENT’S DISCUSSION AND ANALYSIS |
| BARRICK YEAR-END 2018 |
34 | MANAGEMENT’S DISCUSSION AND ANALYSIS |
| BARRICK YEAR-END 2018 |
35 | MANAGEMENT’S DISCUSSION AND ANALYSIS |
REVIEW OF ANNUAL FINANCIAL RESULTS
| BARRICK YEAR-END 2018 |
36 | MANAGEMENT’S DISCUSSION AND ANALYSIS |
| BARRICK YEAR-END 2018 |
37 | MANAGEMENT’S DISCUSSION AND ANALYSIS |
| BARRICK YEAR-END 2018 |
38 | MANAGEMENT’S DISCUSSION AND ANALYSIS |
| BARRICK YEAR-END 2018 |
39 | MANAGEMENT’S DISCUSSION AND ANALYSIS |
| BARRICK YEAR-END 2018 |
40 | MANAGEMENT’S DISCUSSION AND ANALYSIS |
| BARRICK YEAR-END 2018 |
41 | MANAGEMENT’S DISCUSSION AND ANALYSIS |
FINANCIAL CONDITION REVIEW
| Summary Balance Sheet and Key Financial Ratios |
|
|||||||
| ($ millions, except ratios and share amounts) |
As at December 31, 2018 | As at December 31, 2017 | As at December 31, 2016 | |||||
| Total cash and equivalents |
$1,571 | $2,234 | $2,389 | |||||
|
Current assets |
2,407 | 2,450 | 2,485 | |||||
|
Non-current assets |
18,653 | 20,624 | 20,390 | |||||
| Total Assets |
$22,631 | $25,308 | $25,264 | |||||
| Current liabilities excluding short-term debt |
$1,625 | $1,688 | $1,676 | |||||
| Non-current liabilities excluding long-term debt1 |
5,883 | 6,130 | 5,344 | |||||
| Debt (current and long-term) |
5,738 | 6,423 | 7,931 | |||||
| Total Liabilities |
$13,246 | $14,241 | $14,951 | |||||
| Total shareholders’ equity |
$7,593 | $9,286 | $7,935 | |||||
|
Non-controlling interests |
1,792 | 1,781 | 2,378 | |||||
| Total Equity |
$9,385 | $11,067 | $10,313 | |||||
| Total common shares outstanding (millions of shares)2 |
1,168 | 1,167 | 1,166 | |||||
| Key Financial Ratios: |
||||||||
| Current ratio3 |
2.38:1 | 2.68:1 | 2.68:1 | |||||
|
Debt-to-equity4 |
0.61:1 | 0.58:1 | 0.77:1 | |||||
| 1 | Non-current financial liabilities as at December 31, 2018 were $6,201 million (2017: $6,844 million; 2016: $8,002 million). |
| 2 | Total common shares outstanding do not include 0.8 million stock options. |
| 3 | Represents current assets (excluding assets held-for-sale) divided by current liabilities (including short-term debt and excluding liabilities held-for-sale) as at December 31, 2018, December 31, 2017 and December 31, 2016. |
| 4 | Represents debt divided by total shareholders’ equity (including minority interest) as at December 31, 2018, December 31, 2017, and December 31, 2016. |
| BARRICK YEAR-END 2018 |
42 | MANAGEMENT’S DISCUSSION AND ANALYSIS |
| BARRICK YEAR-END 2018 |
43 | MANAGEMENT’S DISCUSSION AND ANALYSIS |
Summary of Financial Instruments1
|
As at December 31, 2018 |
||||||||||||
| Financial Instrument |
Principal/Notional Amount | Associated Risks | ||||||||||
| ● Interest rate
| ||||||||||||
| Cash and equivalents |
$1,571 | million | ● Credit | |||||||||
| ● Credit
| ||||||||||||
| Accounts receivable |
$248 | million | ● Market | |||||||||
| ● Market
| ||||||||||||
| Other investments |
$209 | million | ● Liquidity | |||||||||
| Accounts payable |
$1,101 | million | ● Liquidity | |||||||||
| Debt |
$5,767 | million | ● Interest rate | |||||||||
| Restricted share units |
$39 | million | ● Market | |||||||||
| Deferred share units |
$11 | million | ● Market | |||||||||
| Derivative instruments - currency contracts |
PGK | 23 | million | ● Market/liquidity | ||||||||
| Derivative instruments - interest rate contracts |
|
Receive float interest rate swaps |
|
$42 | million | ● Market/liquidity | ||||||
| 1 | Refer to note 25 to the Financial Statements for more information regarding financial instruments. |
OPERATING SEGMENTS PERFORMANCE
| BARRICK YEAR-END 2018 |
44 | MANAGEMENT’S DISCUSSION AND ANALYSIS |
Barrick Nevada1, Nevada USA
| Summary of Operating and Financial Data | For the years ended December 31 | |||||||||||||||
|
|
2018
|
|
|
2017
|
|
|
% Change
|
|
|
2016
|
| |||||
| Total tonnes mined (000s) |
181,534 | 211,090 | (14)% | 192,753 | ||||||||||||
| Open pit |
178,565 | 208,240 | (14)% | 189,941 | ||||||||||||
| Underground |
2,969 | 2,850 | 4 % | 2,812 | ||||||||||||
| Average grade (grams/tonne) |
||||||||||||||||
| Open pit mined |
2.96 | 2.73 | 8 % | 1.74 | ||||||||||||
| Underground mined |
9.98 | 10.58 | (6)% | 11.39 | ||||||||||||
| Processed |
3.20 | 3.50 | (9)% | 2.62 | ||||||||||||
| Ore tonnes processed (000s) |
25,076 | 23,894 | 5 % | 32,473 | ||||||||||||
| Oxide mill |
4,527 | 4,562 | (1)% | 4,197 | ||||||||||||
| Roaster |
5,104 | 4,902 | 4 % | 4,789 | ||||||||||||
| Autoclave |
4,734 | 4,258 | 11 % | 3,503 | ||||||||||||
| Heap leach |
10,711 | 10,172 | 5 % | 19,984 | ||||||||||||
| Gold produced (000s oz) |
2,100 | 2,312 | (9)% | 2,155 | ||||||||||||
| Oxide mill |
590 | 957 | (38)% | 569 | ||||||||||||
| Roaster |
1,120 | 929 | 21 % | 1,115 | ||||||||||||
| Autoclave |
229 | 248 | (8)% | 242 | ||||||||||||
| Heap leach |
161 | 178 | (10)% | 229 | ||||||||||||
| Gold sold (000s oz)
|
|
2,097
|
|
|
2,357
|
|
|
(11)%
|
|
|
2,162
|
| ||||
| Segment revenue ($ millions) |
$2,655 | $2,961 | (10)% | $2,703 | ||||||||||||
| Cost of sales ($ millions) |
1,715 | 1,869 | (8)% | 1,896 | ||||||||||||
| Segment income ($ millions) |
890 | 1,052 | (15)% | 771 | ||||||||||||
| Segment EBITDA ($ millions)2 |
1,539 | 1,845 | (17)% | 1,578 | ||||||||||||
| Capital expenditures ($ millions) |
564 | 584 | (3)% | 328 | ||||||||||||
| Minesite sustaining |
252 | 360 | (30)% | 217 | ||||||||||||
| Project |
312 | 224 | 39 % | 111 | ||||||||||||
| Cost of sales (per oz) |
818 | 792 | 3 % | 876 | ||||||||||||
| Cash costs (per oz)2 |
507 | 455 | 11 % | 502 | ||||||||||||
| All-in sustaining costs (per oz)2 |
649 | 624 | 4 % | 618 | ||||||||||||
| All-in costs (per oz)2 |
$801 | $722 | 11 % | $678 | ||||||||||||
| 1 | Includes Goldstrike, Cortez, and our 60% share of South Arturo. |
| 2 | These are non-GAAP financial performance measures with no standardized meaning under IFRS and therefore may not be comparable to similar measures presented by other issuers. For further information and a detailed reconciliation of each non-GAAP measure used in this section of the MD&A to the most directly comparable IFRS measure, please see pages 61 to 76 of this MD&A. |
Financial Results
| BARRICK YEAR-END 2018 |
45 | MANAGEMENT’S DISCUSSION AND ANALYSIS |
| BARRICK YEAR-END 2018 |
46 | MANAGEMENT’S DISCUSSION AND ANALYSIS |
Turquoise Ridge (75% basis), Nevada USA
| Summary of Operating and Financial Data |
For the years ended December 31 | |||||||||||
|
|
2018
|
|
|
2017
|
|
|
% Change
|
|
|
2016
|
| |||||
| Underground tonnes mined (000s) |
670 | 643 | 4 % | 598 | ||||||||||||
| Average grade (grams/tonne) |
||||||||||||||||
| Underground mined |
15.00 | 15.45 | (3)% | 16.85 | ||||||||||||
| Gold produced (000s oz) |
268 | 211 | 27 % | 266 | ||||||||||||
| Gold sold (000s oz)
|
|
262
|
|
|
222
|
|
|
18 %
|
|
|
257
|
| ||||
| Segment revenue ($ millions) |
$331 | $280 | 18 % | $322 | ||||||||||||
| Cost of sales ($ millions) |
206 | 159 | 30 % | 155 | ||||||||||||
| Segment income ($ millions) |
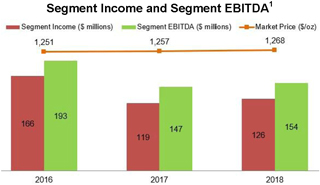
126 | 119 | 6 % | 166 | ||||||||||||
| Segment EBITDA ($ millions)1 |
154 | 147 | 5 % | 193 | ||||||||||||
| Capital expenditures ($ millions) |
62 | 36 | 72 % | 32 | ||||||||||||
| Minesite sustaining |
20 | 32 | (38)% | 32 | ||||||||||||
| Project |
42 | 4 | 950 % | — | ||||||||||||
| Cost of sales (per oz) |
783 | 715 | 10 % | 603 | ||||||||||||
| Cash costs (per oz)1 |
678 | 589 | 15 % | 498 | ||||||||||||
| All-in sustaining costs (per oz)1 |
756 | 733 | 3 % | 625 | ||||||||||||
| All-in costs (per oz)1
|
|
$916
|
|
|
$753
|
|
|
22 %
|
|
|
$625
|
| ||||
| 1 | These are non-GAAP financial performance measures with no standardized meaning under IFRS and therefore may not be comparable to similar measures presented by other issuers. For further information and a detailed reconciliation of each non-GAAP measure used in this section of the MD&A to the most directly comparable IFRS measure, please see pages 61 to 76 of this MD&A. |
| BARRICK YEAR-END 2018 |
47 | MANAGEMENT’S DISCUSSION AND ANALYSIS |
| BARRICK YEAR-END 2018 |
48 | MANAGEMENT’S DISCUSSION AND ANALYSIS |
Pueblo Viejo (60% basis)1, Dominican Republic
| Summary of Operating and Financial Data |
For the years ended December 31 |
|||||||||||||||
| 2018 | 2017 | % Change | 2016 | |||||||||||||
| Open pit tonnes mined (000s) |
24,063 | 23,430 | 3 % | 23,278 | ||||||||||||
| Average grade (grams/tonne) |
||||||||||||||||
| Open pit mined |
2.78 | 3.07 | (9)% | 3.13 | ||||||||||||
| Processed |
4.04 | 4.57 | (12)% | 5.29 | ||||||||||||
| Autoclave ore tonnes processed (000s) |
5,008 | 4,791 | 5 % | 4,527 | ||||||||||||
| Gold produced (000s oz) |
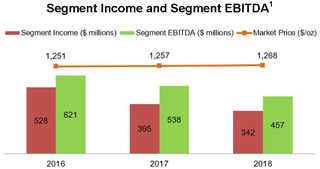
581 | 650 | (11)% | 700 | ||||||||||||
| Gold sold (000s oz) |
590 | 637 | (7)% | 700 | ||||||||||||
| Segment revenue ($ millions) |
$798 | $850 | (6)% | $925 | ||||||||||||
| Cost of sales ($ millions) |
443 | 445 | — % | 395 | ||||||||||||
| Segment income ($ millions) |
342 | 395 | (13)% | 528 | ||||||||||||
| Segment EBITDA ($ millions)2 |
457 | 538 | (15)% | 621 | ||||||||||||
| Capital expenditures ($ millions) |
87 | 69 | 26 % | 61 | ||||||||||||
| Minesite sustaining |
87 | 69 | 26 % | 61 | ||||||||||||
| Project |
— | — | — % | — | ||||||||||||
| Cost of sales (per oz) |
750 | 699 | 7 % | 564 | ||||||||||||
| Cash costs (per oz)2 |
465 | 405 | 15 % | 395 | ||||||||||||
| All-in sustaining costs (per oz)2 |
623 | 525 | 19 % | 490 | ||||||||||||
| All-in costs (per oz)2 |
$623 | $525 | 19 % | $490 | ||||||||||||
| 1 | Pueblo Viejo is accounted for as a subsidiary with a 40% non-controlling interest. The results in the table and the discussion that follows are based on our 60% share only. |
| 2 | These are non-GAAP financial performance measures with no standardized meaning under IFRS and therefore may not be comparable to similar measures presented by other issuers. For further information and a detailed reconciliation of each non-GAAP measure used in this section of the MD&A to the most directly comparable IFRS measure, please see pages 61 to 76 of this MD&A. |
| BARRICK YEAR-END 2018 |
49 | MANAGEMENT’S DISCUSSION AND ANALYSIS |
| BARRICK YEAR-END 2018 |
50 | MANAGEMENT’S DISCUSSION AND ANALYSIS |
Veladero1, Argentina
| Summary of Operating and Financial Data |
For the years ended December 31 | |||||||||||||||
| 2018 | 2017 | % Change | 2016 | |||||||||||||
| Open pit tonnes mined (000s) |
35,646 | 48,376 | (26)% | 62,227 | ||||||||||||
| Average grade (grams/tonne) |
||||||||||||||||
| Open pit mined |
0.78 | 1.00 | (22)% | 0.82 | ||||||||||||
| Processed |
0.85 | 1.02 | (17)% | 0.82 | ||||||||||||
| Heap leach ore tonnes processed (000s) |
13,547 | 21,190 | (36)% | 28,028 | ||||||||||||
| Gold produced (000s oz) |
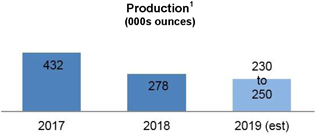
278 | 432 | (36)% | 544 | ||||||||||||
| Gold sold (000s oz) |
280 | 458 | (39)% | 532 | ||||||||||||
| Segment revenue ($ millions) |
$366 | $591 | (38)% | $685 | ||||||||||||
| Cost of sales ($ millions) |
310 | 410 | (24)% | 464 | ||||||||||||
| Segment income ($ millions) |
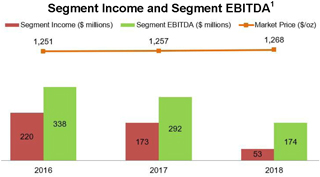
53 | 173 | (69)% | 220 | ||||||||||||
| Segment EBITDA ($ millions)2 |
174 | 292 | (40)% | 338 | ||||||||||||
| Capital expenditures ($ millions) |
143 | 173 | (17)% | 95 | ||||||||||||
| Minesite sustaining |
143 | 173 | (17)% | 95 | ||||||||||||
| Project |
— | — | — % | — | ||||||||||||
| Cost of sales (per oz) |
1,112 | 897 | 24 % | 872 | ||||||||||||
| Cash costs (per oz)2 |
629 | 598 | 5 % | 582 | ||||||||||||
| All-in sustaining costs (per oz)2 |
1,154 | 987 | 17 % | 769 | ||||||||||||
| All-in costs (per oz)2 |
$1,154 | $987 | 17 % | $769 | ||||||||||||
| 1 | We sold 50% of Veladero on June 30, 2017; therefore, these represent results on a 100% basis from January 1 to June 30, 2017 and on a 50% basis from July 1, 2017 onwards. |
| 2 | These are non-GAAP financial performance measures with no standardized meaning under IFRS and therefore may not be comparable to similar measures presented by other issuers. For further information and a detailed reconciliation of each non-GAAP measure used in this section of the MD&A to the most directly comparable IFRS measure, please see pages 61 to 76 of this MD&A. |
| BARRICK YEAR-END 2018 |
51 | MANAGEMENT’S DISCUSSION AND ANALYSIS |
| BARRICK YEAR-END 2018 |
52 | MANAGEMENT’S DISCUSSION AND ANALYSIS |
Lagunas Norte, Peru
| Summary of Operating and Financial Data |
For the years ended December 31 | |||||||||||||||
| 2018 | 2017 | % Change | 2016 | |||||||||||||
| Open pit tonnes mined (000s) |
31,357 | 32,859 | (5)% | 40,847 | ||||||||||||
| Average grade (grams/tonne) |
||||||||||||||||
| Open pit mined |
1.35 | 1.41 | (4)% | 1.18 | ||||||||||||
| Processed |
0.91 | 1.05 | (13)% | 1.12 | ||||||||||||
| Heap leach ore tonnes processed (000s) |
8,837 | 17,874 | (51)% | 17,253 | ||||||||||||
| Gold produced (000s oz) |
245 | 387 | (37)% | 435 | ||||||||||||
| Gold sold (000s oz) |
251 | 397 | (37)% | 425 | ||||||||||||
| Segment revenue ($ millions) |
$332 | $514 | (35)% | $548 | ||||||||||||
| Cost of sales ($ millions) |
337 | 245 | 38 % | 276 | ||||||||||||
| Segment income ($ millions) |
(13 | ) | 259 | (105)% | 260 | |||||||||||
| Segment EBITDA ($ millions)1 |
33 | 327 | (90)% | 356 | ||||||||||||
| Capital expenditures ($ millions) |
22 | 25 | (12)% | 56 | ||||||||||||
| Minesite sustaining |
20 | 20 | — % | 51 | ||||||||||||
| Project |
2 | 5 | (60)% | 5 | ||||||||||||
| Cost of sales (per oz) |
1,342 | 617 | 118 % | 651 | ||||||||||||
| Cash costs (per oz)1 |
448 | 405 | 11 % | 383 | ||||||||||||
| All-in sustaining costs (per oz)1 |
636 | 483 | 32 % | 529 | ||||||||||||
| All-in costs (per oz)1 |
$644 | $497 | 30 % | $540 | ||||||||||||
| 1 | These are non-GAAP financial performance measures with no standardized meaning under IFRS and therefore may not be comparable to similar measures presented by other issuers. For further information and a detailed reconciliation of each non-GAAP measure used in this section of the MD&A to the most directly comparable IFRS measure, please see pages 61 to 76 of this MD&A. |
| BARRICK YEAR-END 2018 |
53 | MANAGEMENT’S DISCUSSION AND ANALYSIS |
Acacia Mining plc (100% basis), Africa
| Summary of Operating and Financial Data | For the years ended December 31 | |||||||||||||||
| 2018 | 2017 | % Change | 2016 | |||||||||||||
| Total tonnes mined (000s) |
17,413 | 32,728 | (47)% | 39,540 | ||||||||||||
| Open pit |
16,214 | 30,667 | (47)% | 37,141 | ||||||||||||
| Underground |
1,199 | 2,061 | (42)% | 2,399 | ||||||||||||
| Average grade (grams/tonne) |
||||||||||||||||
| Open pit mined |
1.99 | 1.45 | 37% | 1.48 | ||||||||||||
| Underground mined |
7.80 | 8.32 | (6)% | 9.62 | ||||||||||||
| Processed1 |
2.00 | 3.00 | (33)% | 3.00 | ||||||||||||
| Ore tonnes processed (000s) |
9,272 | 8,719 | 6 % | 9,818 | ||||||||||||
| Gold produced (000s oz) |
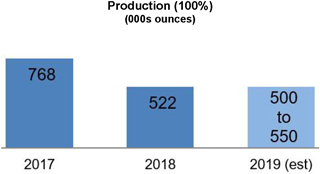
522 | 768 | (32)% | 830 | ||||||||||||
| Gold sold (000s oz) |
520 | 593 | (12)% | 817 | ||||||||||||
| Segment revenue ($ millions) |
$664 | $751 | (12)% | $1,045 | ||||||||||||
| Cost of sales ($ millions) |
456 | 469 | (3)% | 719 | ||||||||||||
| Segment income ($ millions) |
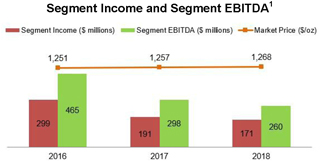
171 | 191 | (10)% | 299 | ||||||||||||
| Segment EBITDA ($ millions)2 |
260 | 298 | (13)% | 465 | ||||||||||||
| Capital expenditures ($ millions) |
93 | 148 | (37)% | 191 | ||||||||||||
| Minesite sustaining |
81 | 137 | (41)% | 190 | ||||||||||||
| Project |
12 | 11 | 9 % | 1 | ||||||||||||
| Cost of sales (per oz) |
876 | 791 | 11 % | 880 | ||||||||||||
| Cash costs (per oz)2 |
680 | 587 | 16 % | 640 | ||||||||||||
| All-in sustaining costs (per oz)2 |
905 | 875 | 3 % | 958 | ||||||||||||
| All-in costs (per oz)2 |
$929 | $894 | 4 % | $960 | ||||||||||||
| 1 | Includes processing of tailings retreatment. |
| 2 | These are non-GAAP financial performance measures with no standardized meaning under IFRS and therefore may not be comparable to similar measures presented by other issuers. For further information and a detailed reconciliation of each non-GAAP measure used in this section of the MD&A to the most directly comparable IFRS measure, please see pages 61 to 76 of this MD&A. |
| BARRICK YEAR-END 2018 |
54 | MANAGEMENT’S DISCUSSION AND ANALYSIS |
| BARRICK YEAR-END 2018 |
55 | MANAGEMENT’S DISCUSSION AND ANALYSIS |
| BARRICK YEAR-END 2018 |
56 | MANAGEMENT’S DISCUSSION AND ANALYSIS |
| BARRICK YEAR-END 2018 |
57 | MANAGEMENT’S DISCUSSION AND ANALYSIS |
COMMITMENTS AND CONTINGENCIES
Litigation and Claims
We are currently subject to various litigation proceedings as disclosed in note 36 to the Financial Statements, and we may be involved in disputes with other parties in the future that may result in litigation. If we are unable to resolve these disputes favorably, it may have a material adverse impact on our financial condition, cash flow and results of operations.
Contractual Obligations and Commitments
In the normal course of business, we enter into contracts that give rise to commitments for future minimum payments. The following table summarizes the remaining contractual maturities of our financial liabilities and operating and capital commitments shown on an undiscounted basis:
| Payments due | ||||||||||||||||||||||||||||
| ($ millions) | as at December 31, 20181 | |||||||||||||||||||||||||||
| 2024 | ||||||||||||||||||||||||||||
| and | ||||||||||||||||||||||||||||
| 2019
|
2020
|
2021
|
2022
|
2023
|
thereafter
|
Total
|
||||||||||||||||||||||
| Debt2 |
||||||||||||||||||||||||||||
| Repayment of principal |
$32 | $263 | $7 | $337 | $— | $5,108 | $5,747 | |||||||||||||||||||||
| Capital leases |
11 | 4 | 1 | 1 | 1 | 2 | 20 | |||||||||||||||||||||
| Interest |
333 | 324 | 318 | 311 | 304 | 4,738 | 6,328 | |||||||||||||||||||||
| Provisions for environmental rehabilitation3 |
112 | 109 | 183 | 157 | 166 | 2,352 | 3,079 | |||||||||||||||||||||
| Operating leases |
60 | 50 | 24 | 21 | 10 | 2 | 167 | |||||||||||||||||||||
| Restricted share units |
20 | 10 | 9 | — | — | — | 39 | |||||||||||||||||||||
| Pension benefits and other post-retirement benefits |
8 | 8 | 9 | 8 | 8 | 145 | 186 | |||||||||||||||||||||
| Derivative liabilities4 |
3 | — | — | — | — | — | 3 | |||||||||||||||||||||
| Purchase obligations for supplies and consumables5 |
517 | 328 | 232 | 141 | 121 | 633 | 1,972 | |||||||||||||||||||||
| Capital commitments6 |
69 | 6 | 4 | 3 | — | — | 82 | |||||||||||||||||||||
| Social development costs7
|
|
41
|
|
|
33
|
|
|
4
|
|
|
1
|
|
|
1
|
|
|
47
|
|
|
127
|
| |||||||
| Total |
$1,206 | $1,135 | $791 | $980 | $611 | $13,027 | $17,750 | |||||||||||||||||||||
| 1 | Excludes payments relating to Randgold as the merger was completed on January 1, 2019. |
| 2 | Debt and Interest - Our debt obligations do not include any subjective acceleration clauses or other clauses that enable the holder of the debt to call for early repayment, except in the event that we breach any of the terms and conditions of the debt or for other customary events of default. We are not required to post any collateral under any debt obligations. Projected interest payments on variable rate debt were based on interest rates in effect at December 31, 2018. Interest is calculated on our long-term debt obligations using both fixed and variable rates. |
| 3 | Provisions for environmental rehabilitation - Amounts presented in the table represent the undiscounted uninflated future payments for the expected cost of provisions for environmental rehabilitation. |
| 4 | Derivative liabilities - Amounts presented in the table relate to derivative contracts disclosed under note 25C to the Financial Statements. Payments related to derivative contracts may be subject to change given variable market conditions. |
| 5 | Purchase obligations for supplies and consumables - Includes commitments related to new purchase obligations to secure a supply of acid, tires and cyanide for our production process. |
| 6 | Capital commitments - Purchase obligations for capital expenditures include only those items where binding commitments have been entered into. |
| 7 | Social development costs – Includes a commitment of $69 million ($27.5 million in 2019, $27.5 million in 2020 and $14 million in 2024 and thereafter) related to the funding of a power transmission line in Argentina. |
| BARRICK YEAR-END 2018 |
58 | MANAGEMENT’S DISCUSSION AND ANALYSIS |
REVIEW OF QUARTERLY RESULTS
Quarterly Information1
| 2018
|
2017
|
|||||||||||||||||||||||||||||||
| ($ millions, except where indicated)
|
Q4
|
Q3
|
Q2
|
Q1
|
Q4
|
Q3
|
Q2
|
Q1
|
||||||||||||||||||||||||
| Revenues |
$1,904 | $1,837 | $1,712 | $1,790 | $2,228 | $1,993 | $2,160 | $1,993 | ||||||||||||||||||||||||
| Realized price per ounce – gold2 |
1,223 | 1,216 | 1,313 | 1,332 | 1,280 | 1,274 | 1,258 | 1,220 | ||||||||||||||||||||||||
| Realized price per pound – copper2 |
2.76 | 2.76 | 3.11 | 2.98 | 3.34 | 3.05 | 2.60 | 2.76 | ||||||||||||||||||||||||
| Cost of sales |
1,577 | 1,315 | 1,176 | 1,152 | 1,411 | 1,270 | 1,277 | 1,342 | ||||||||||||||||||||||||
| Net earnings (loss) |
(1,197 | ) | (412 | ) | (94 | ) | 158 | (314 | ) | (11 | ) | 1,084 | 679 | |||||||||||||||||||
| Per share (dollars)3 |
(1.02 | ) | (0.35 | ) | (0.08 | ) | 0.14 | (0.27 | ) | (0.01 | ) | 0.93 | 0.58 | |||||||||||||||||||
| Adjusted net earnings2 |
69 | 89 | 81 | 170 | 253 | 200 | 261 | 162 | ||||||||||||||||||||||||
| Per share (dollars)2,3 |
0.06 | 0.08 | 0.07 | 0.15 | 0.22 | 0.17 | 0.22 | 0.14 | ||||||||||||||||||||||||
| Operating cash flow |
411 | 706 | 141 | 507 | 590 | 532 | 448 | 495 | ||||||||||||||||||||||||
| Cash capital expenditures |
374 | 387 | 313 | 326 | 350 | 307 | 405 | 334 | ||||||||||||||||||||||||
| Free cash flow2
|
|
$37
|
|
|
$319
|
|
|
($172
|
)
|
|
$181
|
|
|
$240
|
|
|
$225
|
|
|
$43
|
|
|
$161
|
| ||||||||
| 1 | Sum of all the quarters may not add up to the annual total due to rounding. |
| 2 | Realized price, adjusted net earnings, adjusted net earnings per share and free cash flow are non-GAAP financial performance measures with no standardized meaning under IFRS and therefore may not be comparable to similar measures of performance presented by other issuers. For further information and a detailed reconciliation of each non-GAAP measure used in this section of the MD&A to the most directly comparable IFRS measure, please see pages 61 to 76 of this MD&A. |
| 3 | Calculated using weighted average number of shares outstanding under the basic method of earnings per share. |
| BARRICK YEAR-END 2018 |
59 | MANAGEMENT’S DISCUSSION AND ANALYSIS |
INTERNAL CONTROL OVER FINANCIAL REPORTING AND DISCLOSURE CONTROLS AND PROCEDURES
IFRS CRITICAL ACCOUNTING POLICIES AND ACCOUNTING ESTIMATES
| BARRICK YEAR-END 2018 |
60 | MANAGEMENT’S DISCUSSION AND ANALYSIS |
NON-GAAP FINANCIAL PERFORMANCE MEASURES
Adjusted Net Earnings and Adjusted Net Earnings per Share
| BARRICK YEAR-END 2018 |
61 | MANAGEMENT’S DISCUSSION AND ANALYSIS |
Reconciliation of Net Earnings to Net Earnings per Share, Adjusted Net Earnings and Adjusted Net Earnings per Share
| ($ millions, except per share amounts in dollars) | For the years ended December 31 |
For the three months ended December 31 |
||||||||||||||||||
| 2018 | 2017 | 2016 | 2018 | 2017 | ||||||||||||||||
| Net earnings (loss) attributable to equity holders of the Company |
($1,545 | ) | $1,438 | $655 | ($1,197 | ) | ($314 | ) | ||||||||||||
| Impairment charges (reversals) related to long-lived assets1 |
900 | (212 | ) | (250 | ) | 408 | 916 | |||||||||||||
| Acquisition/disposition (gains)/losses2 |
(68 | ) | (911 | ) | 42 | (19 | ) | (29 | ) | |||||||||||
| Foreign currency translation (gains)/losses |
136 | 72 | 199 | (16 | ) | 12 | ||||||||||||||
| Significant tax adjustments3 |
742 | 244 | 43 | 719 | 61 | |||||||||||||||
| Other expense adjustments4 |
366 | 178 | 114 | 261 | 17 | |||||||||||||||
| Unrealized gains/(losses) on non-hedge derivative instruments |
1 | (1 | ) | (32 | ) | 1 | 5 | |||||||||||||
| Tax effect and non-controlling interest5 |
(123 | ) | 68 | 47 | (88 | ) | (415 | ) | ||||||||||||
| Adjusted net earnings |
$409 | $876 | $818 | $69 | $253 | |||||||||||||||
| Net earnings (loss) per share6 |
(1.32 | ) | 1.23 | 0.56 | (1.02 | ) | (0.27 | ) | ||||||||||||
| Adjusted net earnings per share6 |
0.35 | 0.75 | 0.70 | 0.06 | 0.22 | |||||||||||||||
| 1 | Net impairment charges for the current year primarily relate to non-current asset impairments at Lagunas Norte during the third quarter of 2018, and non-current asset and goodwill impairments at Veladero during the fourth quarter of 2018. |
| 2 | Disposition gains for the current year primarily relate to the gain on the sale of a non-core royalty asset at Acacia. |
| 3 | Significant tax adjustments for the current year primarily relate to the de-recognition of our Canadian and Peruvian deferred tax assets. |
| 4 | Other expense adjustments for the current year primarily relate to the inventory impairment charge at Lagunas Norte, the write-off of a Western Australia long-term stamp duty receivable, costs associated with the merger with Randgold, debt extinguishment costs, and the settlement of a dispute regarding a historical supplier contract acquired as part of the Equinox acquisition in 2011. |
| 5 | Tax effect and non-controlling interest for the current year primarily relates to the impairment charges related to long-lived assets. |
| 6 | Calculated using weighted average number of shares outstanding under the basic method of earnings per share. |
Reconciliation of Net Cash Provided by Operating Activities to Free Cash Flow
| ($ millions) | For the years ended December 31 | For the three months ended December 31 | ||||||||||||||||||
| 2018 | 2017 | 2016 | 2018 | 2017 | ||||||||||||||||
| Net cash provided by operating activities |
$1,765 | $2,065 | $2,640 | $411 | $590 | |||||||||||||||
| Capital expenditures |
(1,400 | ) | (1,396 | ) | (1,126 | ) | (374 | ) | (350 | ) | ||||||||||
| Free cash flow |
$365 | $669 | $1,514 | $37 | $240 | |||||||||||||||
| BARRICK YEAR-END 2018 |
62 | MANAGEMENT’S DISCUSSION AND ANALYSIS |
Cash costs per ounce, All-in sustaining costs per ounce, All-in costs per ounce, C1 cash costs per pound and All-in sustaining costs per pound
| BARRICK YEAR-END 2018 |
63 | MANAGEMENT’S DISCUSSION AND ANALYSIS |
Reconciliation of Gold Cost of Sales to Cash costs, All-in sustaining costs and All-in costs, including on a per ounce basis
| ($ millions, except per ounce information in dollars) | For the years ended December 31 |
For the three months ended December 31 |
||||||||||||||||||||||
| Footnote | 2018 | 2017 | 2016 | 2018 | 2017 | |||||||||||||||||||
| Cost of sales applicable to gold production |
$4,621 | $4,836 | $4,980 | $1,353 | $1,292 | |||||||||||||||||||
| Depreciation |
(1,253 | ) | (1,529 | ) | (1,504 | ) | (346 | ) | (404 | ) | ||||||||||||||
| By-product credits |
1 | (131 | ) | (135 | ) | (184 | ) | (26 | ) | (30 | ) | |||||||||||||
| Realized (gains)/losses on hedge and non-hedge derivatives |
2 | 3 | 23 | 89 | 3 | 4 | ||||||||||||||||||
| Non-recurring items |
3 | (172 | ) | — | 24 | (155 | ) | — | ||||||||||||||||
| Other |
4 | (87 | ) | (106 | ) | (44 | ) | (27 | ) | (35 | ) | |||||||||||||
| Non-controlling interests (Pueblo Viejo and Acacia) |
5 | (313 | ) | (299 | ) | (358 | ) | (80 | ) | (81 | ) | |||||||||||||
| Cash costs |
$2,668 | $2,790 | $3,003 | $722 | $746 | |||||||||||||||||||
| General & administrative costs |
265 | 248 | 256 | 53 | 62 | |||||||||||||||||||
| Minesite exploration and evaluation costs |
6 | 45 | 47 | 44 | 14 | 8 | ||||||||||||||||||
| Minesite sustaining capital expenditures |
7 | 975 | 1,109 | 944 | 276 | 279 | ||||||||||||||||||
| Rehabilitation - accretion and amortization (operating sites) |
8 | 81 | 64 | 59 | 18 | 13 | ||||||||||||||||||
| Non-controlling interest, copper operations and other |
9 | (374 | ) | (273 | ) | (287 | ) | (118 | ) | (74 | ) | |||||||||||||
|
All-in sustaining costs |
$3,660 | $3,985 | $4,019 | $965 | $1,034 | |||||||||||||||||||
| Project exploration and evaluation and project costs |
6 | 338 | 307 | 193 | 110 | 90 | ||||||||||||||||||
| Community relations costs not related to current operations |
4 | 4 | 8 | 2 | 1 | |||||||||||||||||||
| Project capital expenditures |
7 | 459 | 273 | 175 | 127 | 81 | ||||||||||||||||||
| Rehabilitation - accretion and amortization (non-operating sites) |
8 | 33 | 20 | 11 | 8 | 4 | ||||||||||||||||||
| Non-controlling interest and copper operations |
9 | (21 | ) | (21 | ) | (42 | ) | (5 | ) | (9 | ) | |||||||||||||
|
All-in costs |
$4,473 | $4,568 | $4,364 | $1,207 | $1,201 | |||||||||||||||||||
| Ounces sold - equity basis (000s ounces) |
10 | 4,544 | 5,302 | 5,503 | 1,232 | 1,372 | ||||||||||||||||||
| Cost of sales per ounce |
11,12 | $892 | $794 | $798 | $980 | $801 | ||||||||||||||||||
| Cash costs per ounce |
12 | $588 | $526 | $546 | $588 | $545 | ||||||||||||||||||
| Cash costs per ounce (on a co-product basis) |
12,13 | $607 | $544 | $569 | $602 | $561 | ||||||||||||||||||
| All-in sustaining costs per ounce |
12 | $806 | $750 | $730 | $788 | $756 | ||||||||||||||||||
| All-in sustaining costs per ounce (on a co-product basis) |
12,13 | $825 | $768 | $753 | $802 | $772 | ||||||||||||||||||
| All-in costs per ounce |
12 | $985 | $860 | $792 | $985 | $882 | ||||||||||||||||||
| All-in costs per ounce (on a co-product basis) |
12,13 | $1,004 | $878 | $815 | $999 | $898 | ||||||||||||||||||
| 1 | By-product credits |
Revenues include the sale of by-products for our gold and copper mines for the three months ended December 31, 2018 of $26 million (2017: $30 million) and the year ended December 31, 2018 of $131 million (2017: $135 million; 2016: $151 million) and energy sales from the Monte Rio power plant at our Pueblo Viejo mine for the three months ended December 31, 2018 of $nil (2017: $nil) and the year ended December 31, 2018 of $nil (2017: $nil; 2016: $33 million) up until its disposition on August 18, 2016.
| 2 | Realized (gains)/losses on hedge and non-hedge derivatives |
Includes realized hedge losses of $2 million and $4 million for the three months and year ended December 31, 2018, respectively (2017: $5 million and $27 million, respectively; 2016: $73 million), and realized non-hedge losses of $1 million and gains of $1 million for the three months and year ended December 31, 2018, respectively (2017: gains of $1 million and $4 million, respectively; 2016: losses of $16 million). Refer to note 5 of the Financial Statements for further information.
| 3 | Non-recurring items |
These gains/costs are not indicative of our cost of production and have been excluded from the calculation of cash costs. Non-recurring items for the current year mainly relate to inventory impairment of $166 million at Lagunas Norte.
| 4 | Other |
Other adjustments include adding the net margins related to power sales at Pueblo Viejo of $nil and $nil, respectively, for the three months and year ended December 31, 2018 (2017: $nil and $nil, respectively; 2016: $5 million), adding the cost of treatment and refining charges of $nil and $nil, respectively, for the three months and year ended December 31, 2018 (2017: $nil and $1 million, respectively; 2016: $16 million), and the removal of cash costs associated with our Pierina mine, which is mining incidental ounces as it enters closure, of $27 million and $87 million for the three months and year ended December 31, 2018, respectively (2017: $35 million and $108 million, respectively; 2016: $66 million).
| BARRICK YEAR-END 2018 |
64 | MANAGEMENT’S DISCUSSION AND ANALYSIS |
| 5 | Non-controlling interests (Pueblo Viejo and Acacia) |
Non-controlling interests include non-controlling interests related to gold production of $114 million and $453 million, respectively, for the three months and year ended December 31, 2018 (2017: $137 million and $454 million, respectively; 2016: $508 million). Refer to note 5 of the Financial Statements for further information.
| 6 | Exploration and evaluation costs |
Exploration, evaluation and project expenses are presented as minesite if it supports current mine operations and project if it relates to future projects. Refer to page 38 of this MD&A.
| 7 | Capital expenditures |
Capital expenditures are related to our gold sites only and are presented on a 100% accrued basis. They are split between minesite sustaining and project capital expenditures. Project capital expenditures are distinct projects designed to increase the net present value of the mine and are not related to current production. Significant projects in the current year are Crossroads, the Cortez Range Front declines, Goldrush, and the Deep South Expansion at Barrick Nevada and construction of the third shaft at Turquoise Ridge. Refer to page 37 of this MD&A.
| 8 | Rehabilitation - accretion and amortization |
Includes depreciation on the assets related to rehabilitation provisions of our gold operations and accretion on the rehabilitation provisions of our gold operations, split between operating and non-operating sites.
| 9 | Non-controlling interest and copper operations |
Removes general & administrative costs related to non-controlling interests and copper based on a percentage allocation of revenue. Also removes exploration, evaluation and project costs, rehabilitation costs and capital expenditures incurred by our copper sites and the non-controlling interest of our Acacia and Pueblo Viejo operating segments and South Arturo at Barrick Nevada. Figures remove the impact of Pierina, which is mining incidental ounces as it enters closure. The impact is summarized as the following:
| ($ millions) | For the years ended December 31 | For the three months ended December 31 |
||||||||||||||||||
| Non-controlling interest, copper operations and other |
2018 | 2017 | 2016 | 2018 | 2017 | |||||||||||||||
| General & administrative costs |
($104 | ) | ($21 | ) | ($36 | ) | ($36 | ) | ($8 | ) | ||||||||||
| Minesite exploration and evaluation costs |
(3 | ) | (12 | ) | (9 | ) | (2 | ) | 1 | |||||||||||
| Rehabilitation - accretion and amortization (operating sites) |
(6 | ) | (10 | ) | (9 | ) | (2 | ) | (2 | ) | ||||||||||
| Minesite sustaining capital expenditures |
(261 | ) | (230 | ) | (233 | ) | (78 | ) | (65 | ) | ||||||||||
|
All-in sustaining costs total |
($374 | ) | ($273 | ) | ($287 | ) | ($118 | ) | ($74 | ) | ||||||||||
| Project exploration and evaluation and project costs |
(16 | ) | (17 | ) | (12 | ) | (3 | ) | (8 | ) | ||||||||||
| Project capital expenditures |
(5 | ) | (4 | ) | (30 | ) | (2 | ) | (1 | ) | ||||||||||
|
All-in costs total |
($21 | ) | ($21 | ) | ($42 | ) | ($5 | ) | ($9 | ) | ||||||||||
| 10 | Ounces sold - equity basis |
Figures remove the impact of Pierina, which is mining incidental ounces as it enters closure.
| 11 | Cost of sales per ounce |
Figures remove the cost of sales impact of Pierina of $32 million and $116 million, respectively, for the three months and year ended December 31, 2018 (2017: $55 million and $174 million, respectively; 2016: $82 million), which is mining incidental ounces as it enters closure. Cost of sales per ounce excludes non-controlling interest related to gold production. Cost of sales related to gold per ounce is calculated using cost of sales on an attributable basis (removing the non-controlling interest of 40% Pueblo Viejo, 36.1% Acacia and 40% South Arturo from cost of sales), divided by attributable gold ounces sold.
| 12 | Per ounce figures |
Cost of sales per ounce, cash costs per ounce, all-in sustaining costs per ounce and all-in costs per ounce may not calculate based on amounts presented in this table due to rounding.
| 13 | Co-product costs per ounce |
Cash costs per ounce, all-in sustaining costs per ounce and all-in costs per ounce presented on a co-product basis remove the impact of by-product credits of our gold production (net of non-controlling interest) calculated as:
| ($ millions) |
For the years ended December 31 |
For the three months ended December 31 |
||||||||||||||||||
| 2018 | 2017 | 2016 | 2018 | 2017 | ||||||||||||||||
| By-product credits |
$131 | $135 | $184 | $26 | $30 | |||||||||||||||
| Non-controlling interest |
(45 | ) | (30 | ) | (53 | ) | (10 | ) | (6 | ) | ||||||||||
| By-product credits (net of non-controlling interest) |
$86 | $105 | $131 | $16 | $24 | |||||||||||||||
| BARRICK YEAR-END 2018 |
65 | MANAGEMENT’S DISCUSSION AND ANALYSIS |
Reconciliation of Gold Cost of Sales to Cash costs, All-in sustaining costs and All-in costs, including on a per ounce basis, by operating segment
| ($ millions, except per ounce information in dollars) | For the three months ended December 31, 2018 | |||||||||||||||||||||||||||||||||||||||||
| Footnote | Barrick Nevada |
Turquoise Ridge |
Pueblo Viejo |
Veladero | Lagunas Norte |
Acacia | Hemlo | Golden Sunlight |
Porgera | Kalgoorlie | ||||||||||||||||||||||||||||||||
| Cost of sales applicable to gold production |
$472 | $54 | $192 | $98 | $208 | $114 | $52 | $14 | $54 | $64 | ||||||||||||||||||||||||||||||||
| Depreciation |
(186 | ) | (7 | ) | (53 | ) | (32 | ) | (10 | ) | (23 | ) | (7 | ) | — | (14 | ) | (10 | ) | |||||||||||||||||||||||
| By-product credits |
1 | — | — | (17 | ) | (2 | ) | (3 | ) | (1 | ) | — | — | — | (1 | ) | ||||||||||||||||||||||||||
| Non-recurring items |
2 | — | — | (2 | ) | (4 | ) | (166 | ) | — | — | — | 17 | — | ||||||||||||||||||||||||||||
| Other |
3 | — | — | 1 | — | — | — | — | — | — | — | |||||||||||||||||||||||||||||||
| Non-controlling interests |
— | — | (49 | ) | — | — | (33 | ) | — | — | — | — | ||||||||||||||||||||||||||||||
| Cash costs | $286 | $47 | $72 | $60 | $29 | $57 | $45 | $14 | $57 | $53 | ||||||||||||||||||||||||||||||||
| General & administrative costs |
— | — | — | — | — | 8 | — | — | — | — | ||||||||||||||||||||||||||||||||
| Minesite exploration and evaluation costs |
4 | 5 | — | — | 1 | 1 | — | — | — | — | 2 | |||||||||||||||||||||||||||||||
| Minesite sustaining capital expenditures |
5 | 57 | 7 | 35 | 59 | 7 | 16 | 17 | 1 | 17 | 9 | |||||||||||||||||||||||||||||||
| Rehabilitation - accretion and amortization (operating sites) |
6 | 9 | — | 3 | — | 2 | 1 | 1 | 1 | (1 | ) | 1 | ||||||||||||||||||||||||||||||
| Non-controlling interests |
(4 | ) | — | (15 | ) | — | — | (9 | ) | — | — | — | — | |||||||||||||||||||||||||||||
| All-in sustaining costs |
$353 | $54 | $95 | $120 | $39 | $73 | $63 | $16 | $73 | $65 | ||||||||||||||||||||||||||||||||
| Project exploration and evaluation and project costs |
4 | 3 | — | — | — | — | — | — | — | — | — | |||||||||||||||||||||||||||||||
| Project capital expenditures |
5 | 76 | 13 | — | — | — | 3 | — | — | — | — | |||||||||||||||||||||||||||||||
| Non-controlling interests |
— | — | — | — | — | (1 | ) | — | — | — | — | |||||||||||||||||||||||||||||||
| All-in costs | $432 | $67 | $95 | $120 | $39 | $75 | $63 | $16 | $73 | $65 | ||||||||||||||||||||||||||||||||
| Ounces sold - equity basis (000s ounces) |
595 | 66 | 170 | 74 | 50 | 86 | 48 | 10 | 72 | 61 | ||||||||||||||||||||||||||||||||
| Cost of sales per ounce |
7,8 | $792 | $802 | $686 | $1,352 | $4,186 | $852 | $1,083 | $1,423 | $733 | $1,022 | |||||||||||||||||||||||||||||||
| Cash costs per ounce |
8 | $479 | $701 | $425 | $823 | $607 | $651 | $932 | $1,430 | $786 | $857 | |||||||||||||||||||||||||||||||
| Cash costs per ounce (on a co-product basis) |
8,9 | $480 | $701 | $482 | $848 | $653 | $658 | $935 | $1,448 | $796 | $863 | |||||||||||||||||||||||||||||||
| All-in sustaining costs per ounce |
8 | $591 | $798 | $559 | $1,648 | $796 | $857 | $1,311 | $1,586 | $1,018 | $1,054 | |||||||||||||||||||||||||||||||
| All-in sustaining costs per ounce (on a co-product basis) |
8,9 | $592 | $798 | $616 | $1,673 | $842 | $864 | $1,314 | $1,604 | $1,028 | $1,060 | |||||||||||||||||||||||||||||||
| All-in costs per ounce |
8 | $723 | $993 | $560 | $1,648 | $800 | $878 | $1,311 | $1,586 | $1,018 | $1,054 | |||||||||||||||||||||||||||||||
| All-in costs per ounce (on a co-product basis) |
8,9 | $724 | $993 | $617 | $1,673 | $846 | $885 | $1,314 | $1,604 | $1,028 | $1,060 | |||||||||||||||||||||||||||||||
| BARRICK YEAR-END 2018 |
66 | MANAGEMENT’S DISCUSSION AND ANALYSIS |
| ($ millions, except per ounce information in dollars) | For the three months ended December 31, 2017 | |||||||||||||||||||||||||||||||||||||||||
| Footnote | Barrick Nevada |
Turquoise Ridge |
Pueblo Viejo |
Veladero | Lagunas Norte |
Acacia | Hemlo | Golden Sunlight |
Porgera | Kalgoorlie | ||||||||||||||||||||||||||||||||
| Cost of sales applicable to gold production |
$428 | $55 | $241 | $108 | $75 | $114 | $53 | $14 | $69 | $79 | ||||||||||||||||||||||||||||||||
| Depreciation |
(155 | ) | (10 | ) | (107 | ) | (33 | ) | (18 | ) | (25 | ) | (8 | ) | — | (12 | ) | (16 | ) | |||||||||||||||||||||||
| By-product credits |
1 | (1 | ) | — | (14 | ) | (5 | ) | (4 | ) | — | — | — | (1 | ) | — | ||||||||||||||||||||||||||
| Non-recurring items |
2 | — | — | — | — | — | — | — | — | — | — | |||||||||||||||||||||||||||||||
| Other |
3 | — | — | — | — | — | 1 | — | — | — | — | |||||||||||||||||||||||||||||||
| Non-controlling interests |
(1 | ) | — | (49 | ) | — | — | (31 | ) | — | — | — | — | |||||||||||||||||||||||||||||
| Cash costs |
$271 | $45 | $71 | $70 | $53 | $59 | $45 | $14 | $56 | $63 | ||||||||||||||||||||||||||||||||
| General & administrative costs |
— | — | — | — | — | 9 | — | — | — | — | ||||||||||||||||||||||||||||||||
| Minesite exploration and evaluation costs |
4 | 4 | — | — | — | — | — | — | — | 1 | 3 | |||||||||||||||||||||||||||||||
| Minesite sustaining capital expenditures |
5 | 94 | 8 | 30 | 39 | 8 | 18 | 10 | — | 16 | 8 | |||||||||||||||||||||||||||||||
| Rehabilitation - accretion and amortization (operating sites) |
6 | 4 | — | 3 | — | 1 | 1 | 1 | — | (1 | ) | — | ||||||||||||||||||||||||||||||
| Non-controlling interests |
— | — | (13 | ) | — | — | (12 | ) | — | — | — | — | ||||||||||||||||||||||||||||||
|
All-in sustaining costs |
$373 | $53 | $91 | $109 | $62 | $75 | $56 | $14 | $72 | $74 | ||||||||||||||||||||||||||||||||
| Project exploration and evaluation and project costs |
4 | 4 | — | — | — | — | — | — | — | — | — | |||||||||||||||||||||||||||||||
| Project capital expenditures |
5 | 63 | 4 | — | — | — | 3 | — | — | — | — | |||||||||||||||||||||||||||||||
| Non-controlling interests |
— | — | — | — | — | (1 | ) | — | — | — | — | |||||||||||||||||||||||||||||||
|
All-in costs |
$440 | $57 | $91 | $109 | $62 | $77 | $56 | $14 | $72 | $74 | ||||||||||||||||||||||||||||||||
| Ounces sold - equity basis (000s ounces) |
539 | 81 | 182 | 114 | 114 | 94 | 64 | 11 | 80 | 93 | ||||||||||||||||||||||||||||||||
| Cost of sales per ounce |
7,8 | $794 | $672 | $795 | $953 | $659 | $774 | $831 | $1,221 | $864 | $850 | |||||||||||||||||||||||||||||||
| Cash costs per ounce |
8 | $506 | $550 | $388 | $609 | $461 | $581 | $690 | $1,218 | $705 | $675 | |||||||||||||||||||||||||||||||
| Cash costs per ounce (on a co-product basis) |
8,9 | $507 | $550 | $490 | $618 | $508 | $587 | $695 | $1,228 | $715 | $680 | |||||||||||||||||||||||||||||||
| All-in sustaining costs per ounce |
8 | $696 | $638 | $498 | $950 | $547 | $779 | $864 | $1,262 | $897 | $796 | |||||||||||||||||||||||||||||||
| All-in sustaining costs per ounce (on a co-product basis) |
8,9 | $697 | $638 | $600 | $959 | $594 | $785 | $869 | $1,272 | $907 | $801 | |||||||||||||||||||||||||||||||
| All-in costs per ounce |
8 | $818 | $692 | $498 | $950 | $553 | $803 | $878 | $1,267 | $897 | $796 | |||||||||||||||||||||||||||||||
| All-in costs per ounce (on a co-product basis) |
8,9 | $819 | $692 | $600 | $959 | $600 | $809 | $883 | $1,277 | $907 | $801 | |||||||||||||||||||||||||||||||
| BARRICK YEAR-END 2018 |
67 | MANAGEMENT’S DISCUSSION AND ANALYSIS |
| ($ millions, except per ounce information in dollars) | For the year ended December 31, 2018 | |||||||||||||||||||||||||||||||||||||||||
| Footnote | Barrick Nevada |
Turquoise Ridge |
Pueblo Viejo |
Veladero | Lagunas Norte |
Acacia | Hemlo | Golden Sunlight |
Porgera | Kalgoorlie | ||||||||||||||||||||||||||||||||
| Cost of sales applicable to gold production |
$1,715 | $206 | $732 | $310 | $337 | $456 | $195 | $53 | $213 | $288 | ||||||||||||||||||||||||||||||||
| Depreciation |
(649 | ) | (28 | ) | (185 | ) | (121 | ) | (46 | ) | (89 | ) | (18 | ) | — | (42 | ) | (52 | ) | |||||||||||||||||||||||
| By-product credits |
1 | (2 | ) | — | (90 | ) | (8 | ) | (13 | ) | (4 | ) | (1 | ) | — | (2 | ) | (2 | ) | |||||||||||||||||||||||
| Non-recurring items |
2 | — | — | (2 | ) | (4 | ) | (166 | ) | — | — | — | — | — | ||||||||||||||||||||||||||||
| Other |
3 | — | — | 2 | — | — | — | — | — | — | — | |||||||||||||||||||||||||||||||
| Non-controlling interests |
— | — | (183 | ) | — | — | (131 | ) | — | — | — | — | ||||||||||||||||||||||||||||||
| Cash costs |
$1,064 | $178 | $274 | $177 | $112 | $232 | $176 | $53 | $169 | $234 | ||||||||||||||||||||||||||||||||
| General & administrative costs |
— | — | — | — | — | 26 | — | — | — | — | ||||||||||||||||||||||||||||||||
| Minesite exploration and evaluation costs |
4 | 19 | — | — | 2 | 2 | — | — | — | — | 10 | |||||||||||||||||||||||||||||||
| Minesite sustaining capital expenditures |
5 | 260 | 20 | 145 | 143 | 20 | 81 | 42 | 3 | 62 | 26 | |||||||||||||||||||||||||||||||
| Rehabilitation - accretion and amortization (operating sites) |
6 | 30 | 1 | 10 | 1 | 25 | 4 | 4 | 3 | (1 | ) | 4 | ||||||||||||||||||||||||||||||
| Non-controlling interests |
(10 | ) | — | (62 | ) | — | — | (40 | ) | — | — | — | — | |||||||||||||||||||||||||||||
| All-in sustaining costs |
$1,363 | $199 | $367 | $323 | $159 | $303 | $222 | $59 | $230 | $274 | ||||||||||||||||||||||||||||||||
| Project exploration and evaluation and project costs |
4 | 6 | — | — | — | — | — | — | — | — | — | |||||||||||||||||||||||||||||||
| Project capital expenditures |
5 | 312 | 42 | — | — | 2 | 12 | — | — | — | — | |||||||||||||||||||||||||||||||
| Non-controlling interests |
— | — | — | — | — | (4 | ) | — | — | — | — | |||||||||||||||||||||||||||||||
| All-in costs |
$1,681 | $241 | $367 | $323 | $161 | $311 | $222 | $59 | $230 | $274 | ||||||||||||||||||||||||||||||||
| Ounces sold - equity basis (000s ounces) |
2,097 | 262 | 590 | 280 | 251 | 333 | 168 | 30 | 213 | 320 | ||||||||||||||||||||||||||||||||
| Cost of sales per ounce |
7,8 | $818 | $783 | $750 | $1,112 | $1,342 | $876 | $1,157 | $1,755 | $996 | $899 | |||||||||||||||||||||||||||||||
| Cash costs per ounce |
8 | $507 | $678 | $465 | $629 | $448 | $680 | $1,046 | $1,762 | $796 | $732 | |||||||||||||||||||||||||||||||
| Cash costs per ounce (on a co-product basis) |
8,9 | $508 | $678 | $553 | $654 | $499 | $687 | $1,050 | $1,772 | $810 | $737 | |||||||||||||||||||||||||||||||
| All-in sustaining costs per ounce |
8 | $649 | $756 | $623 | $1,154 | $636 | $905 | $1,318 | $1,954 | $1,083 | $857 | |||||||||||||||||||||||||||||||
| All-in sustaining costs per ounce (on a co-product basis) |
8,9 | $650 | $756 | $711 | $1,179 | $687 | $912 | $1,322 | $1,964 | $1,097 | $862 | |||||||||||||||||||||||||||||||
| All-in costs per ounce |
8 | $801 | $916 | $623 | $1,154 | $644 | $929 | $1,320 | $1,954 | $1,083 | $857 | |||||||||||||||||||||||||||||||
| All-in costs per ounce (on a co-product basis) |
8,9 | $802 | $916 | $711 | $1,179 | $695 | $936 | $1,324 | $1,964 | $1,097 | $862 | |||||||||||||||||||||||||||||||
| BARRICK YEAR-END 2018 |
68 | MANAGEMENT’S DISCUSSION AND ANALYSIS |
| ($ millions, except per ounce information in dollars) | For the year ended December 31, 2017 | |||||||||||||||||||||||||||||||||||||||||
| Footnote | Barrick Nevada |
Turquoise Ridge |
Pueblo Viejo |
Veladero | Lagunas Norte |
Acacia | Hemlo | Golden Sunlight |
Porgera | Kalgoorlie | ||||||||||||||||||||||||||||||||
| Cost of sales applicable to gold production |
$1,869 | $159 | $730 | $410 | $245 | $469 | $193 | $55 | $239 | $292 | ||||||||||||||||||||||||||||||||
| Depreciation |
(793 | ) | (28 | ) | (229 | ) | (119 | ) | (68 | ) | (107 | ) | (27 | ) | (3 | ) | (39 | ) | (58 | ) | ||||||||||||||||||||||
| By-product credits |
1 | (3 | ) | — | (72 | ) | (17 | ) | (16 | ) | (7 | ) | (1 | ) | — | (3 | ) | (2 | ) | |||||||||||||||||||||||
| Non-recurring items |
2 | — | — | — | — | — | — | — | — | — | — | |||||||||||||||||||||||||||||||
| Other |
3 | — | — | — | — | — | 1 | — | — | — | — | |||||||||||||||||||||||||||||||
| Non-controlling interests |
(1 | ) | — | (171 | ) | — | — | (127 | ) | — | — | — | — | |||||||||||||||||||||||||||||
| Cash costs |
$1,072 | $131 | $258 | $274 | $161 | $229 | $165 | $52 | $197 | $232 | ||||||||||||||||||||||||||||||||
| General & administrative costs |
— | — | — | — | — | 21 | — | — | — | — | ||||||||||||||||||||||||||||||||
| Minesite exploration and evaluation costs |
4 | 16 | — | — | 3 | 4 | — | — | — | 1 | 9 | |||||||||||||||||||||||||||||||
| Minesite sustaining capital expenditures |
5 | 360 | 32 | 114 | 173 | 20 | 137 | 44 | — | 55 | 20 | |||||||||||||||||||||||||||||||
| Rehabilitation - accretion and amortization (operating sites) |
6 | 25 | 1 | 13 | 2 | 7 | 6 | 5 | 2 | (2 | ) | 3 | ||||||||||||||||||||||||||||||
| Non-controlling interests |
(3 | ) | — | (51 | ) | — | — | (61 | ) | — | — | — | — | |||||||||||||||||||||||||||||
|
All-in sustaining costs |
$1,470 | $164 | $334 | $452 | $192 | $332 | $214 | $54 | $251 | $264 | ||||||||||||||||||||||||||||||||
| Project exploration and evaluation and project costs |
4 | 8 | — | — | — | — | — | — | — | — | — | |||||||||||||||||||||||||||||||
| Project capital expenditures |
5 | 224 | 4 | — | — | 5 | 11 | 5 | 1 | — | — | |||||||||||||||||||||||||||||||
| Non-controlling interests |
— | — | — | — | — | (4 | ) | — | — | — | — | |||||||||||||||||||||||||||||||
|
All-in costs |
$1,702 | $168 | $334 | $452 | $197 | $339 | $219 | $55 | $251 | $264 | ||||||||||||||||||||||||||||||||
| Ounces sold - equity basis (000s ounces) |
2,357 | 222 | 637 | 458 | 397 | 379 | 196 | 41 | 253 | 362 | ||||||||||||||||||||||||||||||||
| Cost of sales per ounce |
7,8 | $792 | $715 | $699 | $897 | $617 | $791 | $986 | $1,334 | $944 | $806 | |||||||||||||||||||||||||||||||
| Cash costs per ounce |
8 | $455 | $589 | $405 | $598 | $405 | $587 | $841 | $1,265 | $781 | $642 | |||||||||||||||||||||||||||||||
| Cash costs per ounce (on a co-product basis) |
8,9 | $456 | $589 | $475 | $636 | $446 | $598 | $846 | $1,270 | $791 | $647 | |||||||||||||||||||||||||||||||
| All-in sustaining costs per ounce |
8 | $624 | $733 | $525 | $987 | $483 | $875 | $1,092 | $1,329 | $993 | $729 | |||||||||||||||||||||||||||||||
| All-in sustaining costs per ounce (on a co-product basis) |
8,9 | $625 | $733 | $595 | $1,025 | $524 | $886 | $1,097 | $1,334 | $1,003 | $734 | |||||||||||||||||||||||||||||||
| All-in costs per ounce |
8 | $722 | $753 | $525 | $987 | $497 | $894 | $1,119 | $1,349 | $993 | $729 | |||||||||||||||||||||||||||||||
| All-in costs per ounce (on a co-product basis) |
8,9 | $723 | $753 | $595 | $1,025 | $538 | $905 | $1,124 | $1,354 | $1,003 | $734 | |||||||||||||||||||||||||||||||
| BARRICK YEAR-END 2018 |
69 | MANAGEMENT’S DISCUSSION AND ANALYSIS |
| ($ millions, except per ounce information in dollars) | For the year ended December 31, 2016 | |||||||||||||||||||||||||||||||||||||||||
| Footnote | Barrick Nevada |
Turquoise Ridge |
Pueblo Viejo |
Veladero | Lagunas Norte |
Acacia | Hemlo | Golden Sunlight |
Porgera | Kalgoorlie | ||||||||||||||||||||||||||||||||
| Cost of sales applicable to gold production |
$1,896 | $155 | $644 | $464 | $276 | $719 | $188 | $54 | $203 | $289 | ||||||||||||||||||||||||||||||||
| Depreciation |
(807 | ) | (27 | ) | (147 | ) | (118 | ) | (96 | ) | (166 | ) | (26 | ) | (5 | ) | (34 | ) | (56 | ) | ||||||||||||||||||||||
| By-product credits |
1 | (2 | ) | — | (90 | ) | (27 | ) | (17 | ) | (39 | ) | (1 | ) | — | (2 | ) | (2 | ) | |||||||||||||||||||||||
| Non-recurring items |
2 | — | — | 34 | (10 | ) | — | — | — | — | — | — | ||||||||||||||||||||||||||||||
| Other |
3 | — | — | 5 | — | — | 8 | — | — | — | 7 | |||||||||||||||||||||||||||||||
| Non-controlling interests |
— | — | (170 | ) | — | — | (188 | ) | — | — | — | — | ||||||||||||||||||||||||||||||
| Cash costs |
$1,087 | $128 | $276 | $309 | $163 | $334 | $161 | $49 | $167 | $238 | ||||||||||||||||||||||||||||||||
| General & administrative costs |
— | — | — | — | — | 55 | — | — | — | — | ||||||||||||||||||||||||||||||||
| Minesite exploration and evaluation costs |
4 | 10 | — | — | 1 | 2 | 3 | — | — | 1 | 5 | |||||||||||||||||||||||||||||||
| Minesite sustaining capital expenditures |
5 | 217 | 32 | 101 | 95 | 51 | 190 | 37 | 2 | 43 | 21 | |||||||||||||||||||||||||||||||
| Rehabilitation - accretion and amortization (operating sites) |
6 | 26 | 1 | 10 | 4 | 8 | 6 | 1 | 2 | (2 | ) | 4 | ||||||||||||||||||||||||||||||
| Non-controlling interests |
(4 | ) | — | (44 | ) | — | — | (88 | ) | — | — | — | — | |||||||||||||||||||||||||||||
|
All-in sustaining costs |
$1,336 | $161 | $343 | $409 | $224 | $500 | $199 | $53 | $209 | $268 | ||||||||||||||||||||||||||||||||
| Project exploration and evaluation and project costs |
4 | 19 | — | — | — | — | — | — | — | — | — | |||||||||||||||||||||||||||||||
| Project capital expenditures |
5 | 141 | — | — | — | 5 | 1 | — | — | — | — | |||||||||||||||||||||||||||||||
| Non-controlling interests |
(30 | ) | — | — | — | — | — | — | — | — | — | |||||||||||||||||||||||||||||||
|
All-in costs |
$1,466 | $161 | $343 | $409 | $229 | $501 | $199 | $53 | $209 | $268 | ||||||||||||||||||||||||||||||||
| Ounces sold - equity basis (000s ounces) |
2,162 | 257 | 700 | 532 | 425 | 522 | 237 | 36 | 243 | 380 | ||||||||||||||||||||||||||||||||
| Cost of sales per ounce |
7,8 | $876 | $603 | $564 | $872 | $651 | $880 | $795 | $1,512 | $836 | $762 | |||||||||||||||||||||||||||||||
| Cash costs per ounce |
8 | $502 | $498 | $395 | $582 | $383 | $640 | $679 | $1,376 | $689 | $627 | |||||||||||||||||||||||||||||||
| Cash costs per ounce (on a co-product basis) |
8,9 | $503 | $498 | $473 | $632 | $423 | $677 | $683 | $1,385 | $697 | $615 | |||||||||||||||||||||||||||||||
| All-in sustaining costs per ounce |
8 | $618 | $625 | $490 | $769 | $529 | $958 | $839 | $1,493 | $858 | $706 | |||||||||||||||||||||||||||||||
| All-in sustaining costs per ounce (on a co-product basis) |
8,9 | $619 | $625 | $568 | $819 | $569 | $995 | $843 | $1,502 | $866 | $694 | |||||||||||||||||||||||||||||||
| All-in costs per ounce |
8 | $678 | $625 | $490 | $769 | $540 | $960 | $839 | $1,493 | $858 | $706 | |||||||||||||||||||||||||||||||
| All-in costs per ounce (on a co-product basis) |
8,9 | $679 | $625 | $568 | $819 | $580 | $997 | $843 | $1,502 | $866 | $694 | |||||||||||||||||||||||||||||||
| 1 | By-product credits |
Revenues include the sale of by-products for our gold mines and energy sales from the Monte Rio power plant at our Pueblo Viejo mine for the three months ended December 31, 2018 of $nil (2017: $nil) and the year ended December 31, 2018 of $nil (2017: $nil; 2016: $33 million) up until its disposition on August 18, 2016.
| 2 | Non-recurring items |
These gains/costs are not indicative of our cost of production and have been excluded from the calculation of cash costs. Non-recurring items for the current year mainly relate to inventory impairment of $166 million at Lagunas Norte.
| 3 | Other |
Other adjustments include adding the net margins related to power sales at Pueblo Viejo of $nil and $nil, respectively, for the three months and year ended December 31, 2018 (2017: $nil and $nil, respectively; 2016: $5 million) and adding the cost of treatment and refining charges of $nil and $nil, respectively, for the three months and year ended December 31, 2018 (2017: $1 million and $1 million, respectively; 2016: $9 million).
| 4 | Exploration and evaluation costs |
Exploration, evaluation and project expenses are presented as minesite if it supports current mine operations and project if it relates to future projects. Refer to page 38 of this MD&A.
| BARRICK YEAR-END 2018 |
70 | MANAGEMENT’S DISCUSSION AND ANALYSIS |
| 5 | Capital expenditures |
Capital expenditures are related to our gold sites only and are presented on a 100% accrued basis. They are split between minesite sustaining and project capital expenditures. Project capital expenditures are distinct projects designed to increase the net present value of the mine and are not related to current production. Significant projects in the current year are Crossroads, the Cortez Range Front declines, Goldrush, and the Deep South Expansion at Barrick Nevada and construction of the third shaft at Turquoise Ridge. Refer to page 37 of this MD&A.
| 6 | Rehabilitation - accretion and amortization |
Includes depreciation on the assets related to rehabilitation provisions of our gold operations and accretion on the rehabilitation provisions of our gold operations, split between operating and non-operating sites.
| 7 | Cost of sales per ounce |
Cost of sales related to gold per ounce is calculated using cost of sales on an attributable basis (removing the non-controlling interest of 40% Pueblo Viejo, 36.1% Acacia and 40% South Arturo from cost of sales), divided by attributable gold ounces sold.
| 8 | Per ounce figures |
Cost of sales per ounce, cash costs per ounce, all-in sustaining costs per ounce and all-in costs per ounce may not calculate based on amounts presented in this table due to rounding.
| 9 | Co-product costs per ounce |
Cash costs per ounce, all-in sustaining costs per ounce and all-in costs per ounce presented on a co-product basis remove the impact of by-product credits of our gold production (net of non-controlling interest) calculated as:
| ($ millions) | For the three months ended December 31, 2018 | |||||||||||||||||||||||||||||||||||||||
| Barrick | Turquoise | Pueblo | Lagunas | Golden | ||||||||||||||||||||||||||||||||||||
| Nevada | Ridge | Viejo | Veladero | Norte | Acacia | Hemlo | Sunlight | Porgera | Kalgoorlie | |||||||||||||||||||||||||||||||
| By-product credits | $ | — | $ | — | $ | 17 | $ | 2 | $ | 3 | $ | 1 | $ | — | $ | — | $ | — | $ | 1 | ||||||||||||||||||||
| Non-controlling interest | — | — | (7 | ) | — | — | — | — | — | — | — | |||||||||||||||||||||||||||||
| By-product credits (net of non-controlling interest) | $ | — | $ | — | $ | 10 | $ | 2 | $ | 3 | $ | 1 | $ | — | $ | — | $ | — | $ | 1 | ||||||||||||||||||||
| For the three months ended December 31, 2017 | ||||||||||||||||||||||||||||||||||||||||
| Barrick | Turquoise | Pueblo | Lagunas | Golden | ||||||||||||||||||||||||||||||||||||
| Nevada | Ridge | Viejo | Veladero | Norte | Acacia | Hemlo | Sunlight | Porgera | Kalgoorlie | |||||||||||||||||||||||||||||||
| By-product credits | $ | 1 | $ | — | $ | 14 | $ | 5 | $ | 4 | $ | — | $ | — | $ | — | $ | 1 | $ | — | ||||||||||||||||||||
| Non-controlling interest | — | — | (6 | ) | — | — | — | — | — | — | — | |||||||||||||||||||||||||||||
| By-product credits (net of non-controlling interest) | $ | 1 | $ | — | $ | 8 | $ | 5 | $ | 4 | $ | — | $ | — | $ | — | $ | 1 | $ | — | ||||||||||||||||||||
| For the year ended December 31, 2018 | ||||||||||||||||||||||||||||||||||||||||
| Barrick | Turquoise | Pueblo | Lagunas | Golden | ||||||||||||||||||||||||||||||||||||
| Nevada | Ridge | Viejo | Veladero | Norte | Acacia | Hemlo | Sunlight | Porgera | Kalgoorlie | |||||||||||||||||||||||||||||||
| By-product credits | $ | 2 | $ | — | $ | 90 | $ | 8 | $ | 13 | $ | 4 | $ | 1 | $ | — | $ | 2 | $ | 2 | ||||||||||||||||||||
| Non-controlling interest | — | — | (37 | ) | — | — | (1 | ) | — | — | — | — | ||||||||||||||||||||||||||||
| By-product credits (net of non-controlling interest) | $ | 2 | $ | — | $ | 53 | $ | 8 | $ | 13 | $ | 3 | $ | 1 | $ | — | $ | 2 | $ | 2 | ||||||||||||||||||||
| For the year ended December 31, 2017 | ||||||||||||||||||||||||||||||||||||||||
| Barrick | Turquoise | Pueblo | Lagunas | Golden | ||||||||||||||||||||||||||||||||||||
| Nevada | Ridge | Viejo | Veladero | Norte | Acacia | Hemlo | Sunlight | Porgera | Kalgoorlie | |||||||||||||||||||||||||||||||
| By-product credits | $ | 3 | $ | — | $ | 72 | $ | 17 | $ | 16 | $ | 7 | $ | 1 | $ | — | $ | 3 | $ | 2 | ||||||||||||||||||||
| Non-controlling interest | — | — | (28 | ) | — | — | (3 | ) | — | — | — | — | ||||||||||||||||||||||||||||
| By-product credits (net of non-controlling interest) | $ | 3 | $ | — | $ | 44 | $ | 17 | $ | 16 | $ | 4 | $ | 1 | $ | — | $ | 3 | $ | 2 | ||||||||||||||||||||
| For the year ended December 31, 2016 | ||||||||||||||||||||||||||||||||||||||||
| Barrick | Turquoise | Pueblo | Lagunas | Golden | ||||||||||||||||||||||||||||||||||||
| Nevada | Ridge | Viejo | Veladero | Norte | Acacia | Hemlo | Sunlight | Porgera | Kalgoorlie | |||||||||||||||||||||||||||||||
| By-product credits | $ | 2 | $ | — | $ | 90 | $ | 27 | $ | 17 | $ | 39 | $ | 1 | $ | — | $ | 2 | $ | 2 | ||||||||||||||||||||
| Non-controlling interest | — | — | (39 | ) | — | — | (14 | ) | — | — | — | — | ||||||||||||||||||||||||||||
| By-product credits (net of non-controlling interest) | $ | 2 | $ | — | $ | 51 | $ | 27 | $ | 17 | $ | 25 | $ | 1 | $ | — | $ | 2 | $ | 2 | ||||||||||||||||||||
| BARRICK YEAR-END 2018 |
71 | MANAGEMENT’S DISCUSSION AND ANALYSIS |
Reconciliation of Copper Cost of Sales to C1 cash costs and All-in sustaining costs, including on a per pound basis
| ($ millions, except per pound information in dollars) |
For the years ended December 31 |
For the three months ended December 31 |
||||||||||||||||||
| 2018 | 2017 | 2016 | 2018 | 2017 | ||||||||||||||||
| Cost of sales |
$558 | $399 | $319 | $210 | $107 | |||||||||||||||
| Depreciation/amortization |
(170 | ) | (83 | ) | (45 | ) | (84 | ) | (24 | ) | ||||||||||
| Treatment and refinement charges |
144 | 157 | 167 | 41 | 41 | |||||||||||||||
| Cash cost of sales applicable to equity method investments |
281 | 245 | 203 | 78 | 75 | |||||||||||||||
| Less: royalties and production taxes |
(44 | ) | (38 | ) | (41 | ) | (15 | ) | (11 | ) | ||||||||||
| By-product credits |
(6 | ) | (5 | ) | — | (2 | ) | (1 | ) | |||||||||||
| Other |
(11 | ) | — | — | (11 | ) | — | |||||||||||||
| C1 cash cost of sales |
$752 | $675 | $603 | $217 | $187 | |||||||||||||||
| General & administrative costs |
28 | 12 | 14 | 5 | 3 | |||||||||||||||
| Rehabilitation - accretion and amortization |
16 | 12 | 7 | 3 | 3 | |||||||||||||||
| Royalties and production taxes |
44 | 38 | 41 | 15 | 11 | |||||||||||||||
| Minesite exploration and evaluation costs |
4 | 6 | — | 2 | 1 | |||||||||||||||
| Minesite sustaining capital expenditures |
220 | 204 | 169 | 67 | 67 | |||||||||||||||
| Inventory write-downs |
11 | — | — | 11 | — | |||||||||||||||
|
All-in sustaining costs |
$1,075 | $947 | $834 | $320 | $272 | |||||||||||||||
| Pounds sold - consolidated basis (millions pounds) |
382 | 405 | 405 | 109 | 107 | |||||||||||||||
| Cost of sales per pound1,2 |
$2.40 | $1.77 | $1.41 | $2.85 | $1.79 | |||||||||||||||
| C1 cash cost per pound1 |
$1.97 | $1.66 | $1.49 | $1.98 | $1.72 | |||||||||||||||
| All-in sustaining costs per pound1 |
$2.82 | $2.34 | $2.05 | $2.95 | $2.51 | |||||||||||||||
| 1 | Cost of sales per pound, C1 cash costs per pound and all-in sustaining costs per pound may not calculate based on amounts presented in this table due to rounding. |
| 2 | Cost of sales per pound related to copper is calculated using cost of sales including our proportionate share of cost of sales attributable to equity method investments (Zaldívar and Jabal Sayid), divided by consolidated copper pounds sold (including our proportionate share of copper pounds sold from our equity method investments). |
| BARRICK YEAR-END 2018 |
72 | MANAGEMENT’S DISCUSSION AND ANALYSIS |
Reconciliation of Copper Cost of Sales to C1 cash costs and All-in sustaining costs, including on a per pound basis, by operating site
| ($ millions, except per pound information in dollars) | For the three months ended December 31 | |||||||||||||||||||||||
|
2018 |
2017 | |||||||||||||||||||||||
| Zaldívar | Lumwana | Jabal Sayid | Zaldívar | Lumwana | Jabal Sayid | |||||||||||||||||||
| Cost of sales |
$77 | $210 | $23 | $73 | $104 | $23 | ||||||||||||||||||
| Depreciation/amortization |
(19 | ) | (84 | ) | (3 | ) | (16 | ) | (24 | ) | (5 | ) | ||||||||||||
| Treatment and refinement charges |
— | 36 | 5 | — | 37 | 4 | ||||||||||||||||||
| Less: royalties and production taxes |
— | (11 | ) | (4 | ) | — | (11 | ) | — | |||||||||||||||
| By-product credits |
— | — | (2 | ) | — | — | — | |||||||||||||||||
| Other |
— | (11 | ) | — | — | — | — | |||||||||||||||||
| C1 cash cost of sales |
$58 | $140 | $19 | $57 | $106 | $22 | ||||||||||||||||||
| Rehabilitation - accretion and amortization |
— | 3 | — | — | 3 | — | ||||||||||||||||||
| Royalties and production taxes |
— | 11 | 4 | — | 11 | — | ||||||||||||||||||
| Minesite exploration and evaluation costs |
2 | — | — | 1 | — | — | ||||||||||||||||||
| Minesite sustaining capital expenditures |
16 | 47 | 4 | 21 | 43 | 3 | ||||||||||||||||||
| Inventory write-downs |
— | 11 | — | — | — | — | ||||||||||||||||||
| All-in sustaining costs |
$76 | $212 | $27 | $79 | $163 | $25 | ||||||||||||||||||
| Pounds sold - consolidated basis (millions pounds) |
30 | 65 | 14 | 32 | 65 | 10 | ||||||||||||||||||
| Cost of sales per pound1,2 |
$2.55 | $3.22 | $1.70 | $2.29 | $1.60 | $2.15 | ||||||||||||||||||
| C1 cash cost per pound1 |
$1.91 | $2.12 | $1.48 | $1.78 | $1.63 | $2.05 | ||||||||||||||||||
| All-in sustaining costs per pound1 |
$2.50 | $3.26 | $2.04 | $2.45 | $2.52 | $2.41 | ||||||||||||||||||
| ($ millions, except per pound information in dollars) | For the years ended December 31 | |||||||||||||||||||||||||||||||||||
| 2018 | 2017 | 2016 | ||||||||||||||||||||||||||||||||||
| Zaldívar | Lumwana | Jabal Sayid |
Zaldívar | Lumwana | Jabal Sayid |
||||||||||||||||||||||||||||
| Cost of sales |
$261 | $558 | $98 | $243 | $396 | $75 | $221 | $319 | $33 | |||||||||||||||||||||||||||
| Depreciation/amortization |
(59 | ) | (170 | ) | (19 | ) | (55 | ) | (83 | ) | (17 | ) | (44 | ) | (45 | ) | (6 | ) | ||||||||||||||||||
| Treatment and refinement charges |
— | 125 | 19 | — | 144 | 14 | — | 161 | 6 | |||||||||||||||||||||||||||
| Less: royalties and production taxes |
— | (39 | ) | (5 | ) | — | (38 | ) | — | — | (41 | ) | — | |||||||||||||||||||||||
| By-product credits |
— | — | (6 | ) | — | — | (5 | ) | — | — | — | |||||||||||||||||||||||||
| Other |
— | (11 | ) | — | — | — | — | — | — | — | ||||||||||||||||||||||||||
| C1 cash cost of sales |
$202 | $463 | $87 | $188 | $419 | $67 | $177 | $394 | $33 | |||||||||||||||||||||||||||
| Rehabilitation - accretion and amortization |
— | 16 | — | — | 12 | — | — | 7 | — | |||||||||||||||||||||||||||
| Royalties and production taxes |
— | 39 | 5 | — | 38 | — | — | 41 | — | |||||||||||||||||||||||||||
| Minesite exploration and evaluation costs |
2 | 2 | — | 4 | 2 | — | — | — | — | |||||||||||||||||||||||||||
| Minesite sustaining capital expenditures |
49 | 154 | 17 | 58 | 123 | 23 | 56 | 96 | 17 | |||||||||||||||||||||||||||
| Inventory write-downs |
— | 11 | — | — | — | — | — | — | — | |||||||||||||||||||||||||||
| All-in sustaining costs |
$253 | $685 | $109 | $250 | $594 | $90 | $233 | $538 | $50 | |||||||||||||||||||||||||||
| Pounds sold - consolidated basis (millions pounds) |
103 | 222 | 57 | 113 | 253 | 39 | 114 | 274 | 17 | |||||||||||||||||||||||||||
| Cost of sales per pound1,2 |
$2.55 | $2.51 | $1.73 | $2.15 | $1.57 | $1.90 | $1.93 | $1.16 | $1.98 | |||||||||||||||||||||||||||
| C1 cash cost per pound1 |
$1.97 | $2.08 | $1.53 | $1.66 | $1.66 | $1.70 | $1.55 | $1.44 | $1.97 | |||||||||||||||||||||||||||
| All-in sustaining costs per pound1 |
$2.47 | $3.08 | $1.92 | $2.21 | $2.35 | $2.30 | $2.05 | $1.97 | $2.98 | |||||||||||||||||||||||||||
| 1 | Cost of sales per pound, C1 cash costs per pound and all-in sustaining costs per pound may not calculate based on amounts presented in this table due to rounding. |
| 2 | Cost of sales per pound applicable to copper is calculated using cost of sales including our proportionate share of cost of sales attributable to equity method investments (Zaldívar and Jabal Sayid), divided by consolidated copper pounds sold (including our proportionate share of copper pounds sold from our equity method investments). |
| BARRICK YEAR-END 2018 |
73 | MANAGEMENT’S DISCUSSION AND ANALYSIS |
Reconciliation of Net Earnings to EBITDA and Adjusted EBITDA
| ($ millions) | For the years ended December 31 |
For the three months ended December 31 |
||||||||||||||||||
| 2018 | 2017 | 2016 | 2018 | 2017 | ||||||||||||||||
| Net earnings (loss) |
($1,435 | ) | $1,516 | $861 | ($1,165 | ) | ($467 | ) | ||||||||||||
| Income tax expense |
1,198 | 1,231 | 917 | 776 | 51 | |||||||||||||||
| Finance costs, net1 |
458 | 624 | 725 | 95 | 115 | |||||||||||||||
| Depreciation |
1,457 | 1,647 | 1,574 | 441 | 434 | |||||||||||||||
| EBITDA |
$1,678 | $5,018 | $4,077 | $147 | $133 | |||||||||||||||
| Impairment charges (reversals) of long-lived assets2 |
900 | (212 | ) | (250 | ) | 408 | 916 | |||||||||||||
| Acquisition/disposition (gains)/losses3 |
(68 | ) | (911 | ) | 42 | (19 | ) | (29 | ) | |||||||||||
| Foreign currency translation (gains)/losses |
136 | 72 | 199 | (16 | ) | 12 | ||||||||||||||
| Other expense adjustments4 |
336 | 51 | (15 | ) | 261 | 17 | ||||||||||||||
| Unrealized gains on non-hedge derivative instruments |
1 | (1 | ) | (32 | ) | 1 | 5 | |||||||||||||
| Income tax expense, net finance costs1, and depreciation from equity investees |
$97 | $98 | $63 | $24 | $29 | |||||||||||||||
| Adjusted EBITDA |
$3,080 | $4,115 | $4,084 | $806 | $1,083 | |||||||||||||||
| 1 | Finance costs exclude accretion. |
| 2 | Net impairment charges for the current year primarily relate to non-current asset impairments at Lagunas Norte during the third quarter of 2018, and non-current asset and goodwill impairments at Veladero during the fourth quarter of 2018. |
| 3 | Disposition gains for the current year primarily relate to the gain on the sale of a non-core royalty asset at Acacia. |
| 4 | Other expense adjustments for the current year primarily relate to the inventory impairment charge at Lagunas Norte, the write-off of a Western Australia long-term stamp duty receivable, costs associated with the merger with Randgold, and the settlement of a dispute regarding a historical supplier contract acquired as part of the Equinox acquisition in 2011. |
| BARRICK YEAR-END 2018 |
74 | MANAGEMENT’S DISCUSSION AND ANALYSIS |
Reconciliation of Segment Income to Segment EBITDA
| ($ millions) | For the year ended December 31, 2018 | |||||||||||||||
| Barrick Nevada | Turquoise Ridge | Pueblo Viejo (60%) |
Veladero | Lagunas Norte |
Acacia (100%) |
|||||||||||
| Segment Income |
$890 | $126 | $342 | $53 | ($13) | $171 | ||||||||||
| Depreciation |
649 | 28 | 115 | 121 | 46 | 89 | ||||||||||
| Segment EBITDA |
$1,539 | $154 | $457 | $174 | $33 | $260 | ||||||||||
| For the year ended December 31, 2017 | ||||||||||||||||
| Barrick Nevada | Turquoise Ridge | Pueblo Viejo (60%) |
Veladero | Lagunas Norte | Acacia (100%) | |||||||||||
| Segment Income |
$1,052 | $119 | $395 | $173 | $259 | $191 | ||||||||||
| Depreciation |
793 | 28 | 143 | 119 | 68 | 107 | ||||||||||
| Segment EBITDA |
$1,845 | $147 | $538 | $292 | $327 | $298 | ||||||||||
| For the year ended December 31, 2016 | ||||||||||||||||
| Barrick Nevada | Turquoise Ridge | Pueblo Viejo (60%) |
Veladero | Lagunas Norte | Acacia (100%) | |||||||||||
| Segment Income |
$771 | $166 | $528 | $220 | $260 | $299 | ||||||||||
| Depreciation |
807 | 27 | 93 | 118 | 96 | 166 | ||||||||||
| Segment EBITDA |
$1,578 | $193 | $621 | $338 | $356 | $465 | ||||||||||
| BARRICK YEAR-END 2018 |
75 | MANAGEMENT’S DISCUSSION AND ANALYSIS |
Reconciliation of Sales to Realized Price per ounce/pound
| For the years ended December 31 | ||||||||||||||||||||||||
| ($ millions, except per ounce/pound information in dollars) | Gold | Copper | ||||||||||||||||||||||
| 2018 | 2017 | 2016 | 2018 | 2017 | 2016 | |||||||||||||||||||
| Sales |
$6,600 | $7,631 | $7,908 | $512 | $608 | $466 | ||||||||||||||||||
| Sales applicable to non-controlling interests |
(734 | ) | (810 | ) | (948 | ) | — | — | — | |||||||||||||||
| Sales applicable to equity method investments1,2 |
— | — | — | 442 | 427 | 293 | ||||||||||||||||||
| Realized non-hedge gold/copper derivative (losses) gains |
2 | 3 | (2 | ) | — | — | — | |||||||||||||||||
| Sales applicable to Pierina3 |
(111 | ) | (153 | ) | (112 | ) | — | — | — | |||||||||||||||
| Treatment and refinement charges |
1 | 1 | 16 | 144 | 157 | 167 | ||||||||||||||||||
| Export duties |
(1 | ) | — | 2 | — | — | — | |||||||||||||||||
| Revenues - as adjusted |
$5,757 | $6,672 | $6,864 | $1,098 | $1,192 | $926 | ||||||||||||||||||
| Ounces/pounds sold (000s ounces/millions pounds)3 |
4,544 | 5,302 | 5,503 | 382 | 405 | 405 | ||||||||||||||||||
| Realized gold/copper price per ounce/pound4 |
$1,267 | $1,258 | $1,248 | $2.88 | $2.95 | $2.29 | ||||||||||||||||||
| 1 | Represents sales of $300 million for the year ended December 31, 2018 (2017: $325 million; 2016: $259 million) applicable to our 50% equity method investment in Zaldívar and $161 million (2017: $116 million; 2016: $40 million) applicable to our 50% equity method investment in Jabal Sayid. |
| 2 | Sales applicable to equity method investments are net of treatment and refinement charges. |
| 3 | Figures exclude Pierina from the calculation of realized price per ounce, which is mining incidental ounces as it enters closure. |
| 4 | Realized price per ounce/pound may not calculate based on amounts presented in this table due to rounding. |
| BARRICK YEAR-END 2018 |
76 | MANAGEMENT’S DISCUSSION AND ANALYSIS |
TECHNICAL INFORMATION
The scientific and technical information contained in this MD&A has been reviewed and approved by Rick Sims, Registered Member SME, Vice President, Reserves and Resources of Barrick; Geoffrey Locke, P. Eng., Manager, Metallurgy of Barrick; and Mike Tsafaras, P. Eng., Manager, Value Realization of Barrick who are each a “Qualified Person” as defined in National Instrument 43-101 – Standards of Disclosure for Mineral Projects. Following the completion of the merger with Randgold, the designation of Qualified Persons for the combined company will be reviewed and may be updated for future reporting.
ENDNOTES
| 1 | These are non-GAAP financial performance measures with no standardized meaning under IFRS and therefore may not be comparable to similar measures presented by other issuers. For further information and a detailed reconciliation of each non-GAAP measure to the most directly comparable IFRS measure, please see pages 61 to 76 of this MD&A. |
| 2 | Amount excludes capital leases and includes Acacia (100% basis). |
| 3 | Includes $146 million cash primarily held at Acacia, which may not be readily deployed. |
| 4 | Cost of sales applicable to gold per ounce is calculated using cost of sales applicable to gold on an attributable basis (removing the non-controlling interest of 40% Pueblo Viejo, 36.1% Acacia and 40% South Arturo from cost of sales), divided by attributable gold ounces sold. Cost of sales applicable to copper per pound is calculated using cost of sales applicable to copper including our proportionate share of cost of sales attributable to equity method investments (Zaldívar and Jabal Sayid), divided by consolidated copper pounds sold (including our proportionate share of copper pounds sold from our equity method investments). |
| 5 | Total reportable incident frequency rate (“TRIFR”) is a ratio calculated as follows: number of reportable injuries x 200,000 hours divided by the total number of hours worked. Reportable injuries include fatalities, lost time injuries, restricted duty injuries, and medically treated injuries. |
| 6 | Estimated in accordance with National Instrument 43-101 as required by Canadian securities regulatory authorities. Estimates are as of December 31, 2018, unless otherwise noted. Proven reserves of 344.6 million tonnes grading 2.15 g/t, representing 23.9 million ounces of gold, and 169.2 million tonnes grading 0.59%, representing 2.195 billion pounds of copper. Probable reserves of 0.9 billion tonnes grading 1.33 g/t, representing 38.4 million ounces of gold, and 452.7 million tonnes grading 0.55%, representing 5.454 billion pounds of copper. Measured resources of 405.3 million tonnes grading 0.93 g/t, representing 12.2 million ounces of gold, and 129.7 million tonnes grading 0.36%, representing 1.034 billion pounds of copper. Indicated resources of 1.6 billion tonnes grading 1.52 g/t, representing 76.7 million ounces of gold, and 585.9 million tonnes grading 0.49%, representing 6.367 billion pounds of copper. Inferred resources of 852.9 million tonnes grading 1.22 g/t, representing 33.5 million ounces of gold, and 141.3 million tonnes grading 0.42%, representing 1.323 billion pounds of copper. Pascua- Lama measured resources of 42.8 million tonnes grading 1.86 g/t representing 2.6 million ounces of gold, and indicated resources of 391.7 million tonnes grading 1.49 g/t, representing 18.8 million ounces of gold. Complete mineral reserve and mineral resource data for all mines and projects referenced in this MD&A, including tonnes, grades, and ounces, can be found on pages 80-85 of Barrick’s Fourth Quarter and Year-End 2018 Report. |
| 7 | Compared to the continued use of heavy fuel oil and based on an oil price assumption of $70 per barrel and a natural gas price assumption of $3.75/MMbtu. |
| 8 | A Tier One Gold Asset is a mine with a stated life in excess of 10 years with 2017 production of at least 500,000 ounces of gold and 2017 total cash cost per ounce within the bottom half of Wood Mackenzie’s cost curve tools (excluding state-owned and privately-owned mines). For purposes of determining Tier One Gold Assets, Total cash cost per ounce is based on data from Wood Mackenzie as of August 31, 2018. The Wood Mackenzie calculation of Total cash cost per ounce may not be identical to the manner in which Barrick calculates comparable measures. Total cash cost per ounce is a non-GAAP financial performance measure with no standardized meaning under IFRS and therefore may not be comparable to similar measures presented by other issuers. Total cash cost per ounce should not be considered by investors as an alternative to operating profit, net profit attributable to shareholders, or to other IFRS measures. Barrick believes that Total cash cost per ounce is a useful indicator for investors and management of a mining company’s performance as it provides an indication of a company’s profitability and efficiency, the trends in cash costs as the company’s operations mature, and a benchmark of performance to allow for comparison against other companies. Wood Mackenzie is an independent third party research and consultancy firm that provides data for, among others, the metals and mining industry. Wood Mackenzie does not have any affiliation to Barrick. |
| 9 | Estimated in accordance with National Instrument 43-101 as required by Canadian securities regulatory authorities. Estimates are as of December 31, 2017, unless otherwise noted. Proven reserves of 398.2 million tonnes grading 1.91 g/t, representing 24.4 million ounces of gold, and 170.7 million tonnes grading 0.556%, representing 2.095 billion pounds of copper. Probable reserves of 0.9 billion tonnes grading 1.39 g/t, representing 40.0 million ounces of gold, and 456.7 million tonnes grading 0.592%, representing 5.956 billion pounds of copper. Measured resources of 400.0 million tonnes grading 0.92 g/t, representing 11.8 million ounces of gold, and 90.9 million tonnes grading 0.401%, representing 803.1 million pounds of copper. Indicated resources of 1.6 billion tonnes grading 1.54 g/t, representing 76.8 million ounces of gold, and 581.2 million tonnes grading 0.506%, representing 6.484 billion pounds of copper. Inferred resources of 795.4 million tonnes grading 1.21 |
| BARRICK YEAR-END 2018 |
77 | MANAGEMENT’S DISCUSSION AND ANALYSIS |
| g/t, representing 30.8 million ounces of gold, and 125.4 million tonnes grading 0.482%, representing 1.331 billion pounds of copper. Pascua-Lama measured resources of 42.8 million tonnes grading 1.86 g/t representing 2.6 ounces of gold, and indicated resources of 391.7 tonnes grading 1.49 g/t, representing 18.8 ounces of gold. Complete 2017 mineral reserve and mineral resource data for all mines and projects referenced in this MD&A, including tonnes, grades, and ounces, can be found on pages 30-39 of Barrick’s Annual Information Form/Form 40-F for the year ended December 31, 2017 on file with Canadian provincial securities regulatory authorities and the U.S. Securities and Exchange Commission. |
| 10 | Assets, which in the opinion of Barrick, have the potential to deliver significant unrealized value in the future. |
| 11 | Currently consists of Barrick’s Lumwana mine and Zaldívar and Jabal Sayid copper joint ventures. |
| BARRICK YEAR-END 2018 |
78 | MANAGEMENT’S DISCUSSION AND ANALYSIS |
| BARRICK YEAR-END 2018 |
79 | MANAGEMENT’S DISCUSSION AND ANALYSIS |
Mineral Reserves and Mineral Resources
GOLD MINERAL RESERVES (1,2)
| As at December 31, 2018 | PROVEN | PROBABLE | TOTAL | |||||||||||||||||||||||||||||||||||||
|
Tonnes |
Grade | Contained ozs |
Tonnes | Grade | Contained ozs |
||||||||||||||||||||||||||||||||
|
Based on attributable ounces |
(000’s) | (gm/t) | (000’s) | (000’s) | (gm/t) | (000’s) | (000’s) | (gm/t) | (000’s) | |||||||||||||||||||||||||||||||
| NORTH AMERICA |
||||||||||||||||||||||||||||||||||||||||
| Goldstrike Open Pit |
50,281 | 2.85 | 4,609 | 8,706 | 3.78 | 1,058 | 58,987 | 2.99 | 5,667 | |||||||||||||||||||||||||||||||
| Goldstrike Underground |
5,233 | 11.32 | 1,904 | 3,675 | 8.07 | 954 | 8,908 | 9.98 | 2,858 | |||||||||||||||||||||||||||||||
| Goldstrike Property Total |
55,514 | 3.65 | 6,513 | 12,381 | 5.05 | 2,012 | 67,895 | 3.91 | 8,525 | |||||||||||||||||||||||||||||||
| Pueblo Viejo (60.00%) |
61,630 | 2.56 | 5,071 | 15,111 | 3.05 | 1,481 | 76,741 | 2.66 | 6,552 | |||||||||||||||||||||||||||||||
| Cortez |
17,642 | 2.01 | 1,138 | 127,412 | 1.86 | 7,599 | 145,054 | 1.87 | 8,737 | |||||||||||||||||||||||||||||||
| Goldrush |
— | — | — | 6,399 | 9.69 | 1,993 | 6,399 | 9.69 | 1,993 | |||||||||||||||||||||||||||||||
| Turquoise Ridge (75.00%) |
9,018 | 13.62 | 3,950 | 7,373 | 12.16 | 2,883 | 16,391 | 12.97 | 6,833 | |||||||||||||||||||||||||||||||
| South Arturo (60.00%) |
2,257 | 3.20 | 232 | 2,006 | 2.79 | 180 | 4,263 | 3.01 | 412 | |||||||||||||||||||||||||||||||
| Hemlo |
1,425 | 4.17 | 191 | 22,677 | 2.38 | 1,733 | 24,102 | 2.48 | 1,924 | |||||||||||||||||||||||||||||||
| Golden Sunlight |
263 | 1.06 | 9 | 103 | 3.32 | 11 | 366 | 1.70 | 20 | |||||||||||||||||||||||||||||||
| SOUTH AMERICA |
||||||||||||||||||||||||||||||||||||||||
| Norte Abierto (50.00%) (3) |
114,851 | 0.65 | 2,391 | 483,950 | 0.59 | 9,232 | 598,801 | 0.60 | 11,623 | |||||||||||||||||||||||||||||||
| Veladero (50.00%) (4) |
15,508 | 0.66 | 327 | 91,068 | 0.76 | 2,211 | 106,576 | 0.74 | 2,538 | |||||||||||||||||||||||||||||||
| Lagunas Norte |
23,630 | 2.50 | 1,896 | 21,256 | 3.01 | 2,056 | 44,886 | 2.74 | 3,952 | |||||||||||||||||||||||||||||||
| AUSTRALIA PACIFIC |
||||||||||||||||||||||||||||||||||||||||
| Porgera (47.50%) |
1,170 | 7.90 | 297 | 12,074 | 4.64 | 1,803 | 13,244 | 4.93 | 2,100 | |||||||||||||||||||||||||||||||
| Kalgoorlie (50.00%) |
20,825 | 1.23 | 825 | 75,563 | 1.16 | 2,826 | 96,388 | 1.18 | 3,651 | |||||||||||||||||||||||||||||||
| AFRICA |
||||||||||||||||||||||||||||||||||||||||
| Bulyanhulu (63.90%) |
1,542 | 11.01 | 546 | 5,063 | 7.38 | 1,201 | 6,605 | 8.23 | 1,747 | |||||||||||||||||||||||||||||||
| North Mara (63.90%) |
1,461 | 4.51 | 212 | 15,312 | 2.40 | 1,183 | 16,773 | 2.59 | 1,395 | |||||||||||||||||||||||||||||||
| Buzwagi (63.90%) |
6,817 | 0.90 | 197 | — | — | — | 6,817 | 0.90 | 197 | |||||||||||||||||||||||||||||||
| OTHER |
11,087 | 0.23 | 82 | 2,469 | 0.28 | 22 | 13,556 | 0.24 | 104 | |||||||||||||||||||||||||||||||
| TOTAL |
344,640 | 2.15 | 23,877 | 900,217 | 1.33 | 38,426 | 1,244,857 | 1.56 | 62,303 | |||||||||||||||||||||||||||||||
|
COPPER MINERAL RESERVES (1)
|
|
|||||||||||||||||||||||||||||||||||||||
| As at December 31, 2018 | PROVEN | PROBABLE | TOTAL | |||||||||||||||||||||||||||||||||||||
|
Tonnes |
Grade | Contained lbs |
Tonnes | Grade | Contained lbs |
||||||||||||||||||||||||||||||||
|
Based on attributable pounds |
(000’s) | (%) | (millions) | (000’s) | (%) | (millions) | (000’s) | (%) | (millions) | |||||||||||||||||||||||||||||||
| Zaldívar (50.00%) |
126,390 | 0.461 | 1,283.9 | 107,352 | 0.467 | 1,105.0 | 233,742 | 0.464 | 2,388.9 | |||||||||||||||||||||||||||||||
| Lumwana |
31,707 | 0.454 | 317.4 | 342,889 | 0.560 | 4,230.1 | 374,596 | 0.551 | 4,547.6 | |||||||||||||||||||||||||||||||
| Jabal Sayid (50.00%) |
11,087 | 2.428 | 593.5 | 2,469 | 2.178 | 118.6 | 13,556 | 2.383 | 712.1 | |||||||||||||||||||||||||||||||
| TOTAL |
169,184 | 0.588 | 2,194.8 | 452,710 | 0.546 | 5,453.7 | 621,894 | 0.558 | 7,648.6 | |||||||||||||||||||||||||||||||
| (1) | See accompanying endnote #1. |
| (2) | See accompanying endnote #2. |
| (3) | See accompanying endnote #3. |
| (4) | See accompanying endnote #4. |
| BARRICK YEAR-END 2018 |
80 | RESERVES AND RESOURCES |
GOLD MINERAL RESOURCES (1,2)
| As at December 31, 2018 | MEASURED (M) | INDICATED (I) | (M) + (I) | INFERRED | ||||||||||||||||||||||||||||||||||||||||||
|
Tonnes |
Grade | Contained ozs |
Tonnes | Grade | Contained ozs |
Contained ozs |
Tonnes | Grade | Contained ozs |
|||||||||||||||||||||||||||||||||||||
|
Based on attributable ounces |
(000’s) | (gm/t) | (000’s) | (000’s) | (gm/t) | (000’s) | (000’s) | (000’s) | (gm/t) | (000’s) | ||||||||||||||||||||||||||||||||||||
| NORTH AMERICA |
||||||||||||||||||||||||||||||||||||||||||||||
| Goldstrike Open Pit |
1,243 | 1.40 | 56 | 1,768 | 1.04 | 59 | 115 | 214 | 2.18 | 15 | ||||||||||||||||||||||||||||||||||||
| Goldstrike Underground |
2,329 | 9.60 | 719 | 2,824 | 8.79 | 798 | 1,517 | 1,603 | 8.91 | 459 | ||||||||||||||||||||||||||||||||||||
| Goldstrike Property Total |
3,572 | 6.75 | 775 | 4,592 | 5.80 | 857 | 1,632 | 1,817 | 8.11 | 474 | ||||||||||||||||||||||||||||||||||||
| Pueblo Viejo (60.00%) |
7,613 | 2.39 | 585 | 93,739 | 2.47 | 7,442 | 8,027 | 27,598 | 2.43 | 2,152 | ||||||||||||||||||||||||||||||||||||
| Cortez |
3,353 | 1.84 | 198 | 53,374 | 1.73 | 2,971 | 3,169 | 13,158 | 1.67 | 705 | ||||||||||||||||||||||||||||||||||||
| Goldrush (3) |
— | — | — | 30,942 | 9.40 | 9,353 | 9,353 | 11,867 | 9.31 | 3,552 | ||||||||||||||||||||||||||||||||||||
| Turquoise Ridge (75.00%) |
2,983 | 7.70 | 738 | 2,439 | 8.23 | 645 | 1,383 | 1,872 | 11.93 | 718 | ||||||||||||||||||||||||||||||||||||
| South Arturo (60.00%) |
3,596 | 1.06 | 122 | 10,229 | 1.04 | 342 | 464 | 1,140 | 1.31 | 48 | ||||||||||||||||||||||||||||||||||||
| Hemlo |
592 | 3.10 | 59 | 36,878 | 1.28 | 1,515 | 1,574 | 6,023 | 3.37 | 653 | ||||||||||||||||||||||||||||||||||||
| Golden Sunlight |
120 | 1.56 | 6 | 2,777 | 1.77 | 158 | 164 | 1,604 | 1.63 | 84 | ||||||||||||||||||||||||||||||||||||
| Donlin Gold (50.00%) |
3,865 | 2.52 | 313 | 266,803 | 2.24 | 19,190 | 19,503 | 46,108 | 2.02 | 2,997 | ||||||||||||||||||||||||||||||||||||
| SOUTH AMERICA |
||||||||||||||||||||||||||||||||||||||||||||||
| Norte Abierto (50.00%) (4) |
321,528 | 0.56 | 5,766 | 528,596 | 0.44 | 7,540 | 13,306 | 346,770 | 0.35 | 3,916 | ||||||||||||||||||||||||||||||||||||
| Pascua-Lama |
42,809 | 1.86 | 2,564 | 391,734 | 1.49 | 18,783 | 21,347 | 15,400 | 1.74 | 863 | ||||||||||||||||||||||||||||||||||||
| Veladero (50.00%) (5) |
3,361 | 0.50 | 54 | 67,611 | 0.58 | 1,263 | 1,317 | 35,872 | 0.48 | 555 | ||||||||||||||||||||||||||||||||||||
| Lagunas Norte |
1,136 | 1.07 | 39 | 15,814 | 1.13 | 576 | 615 | 1,546 | 1.35 | 67 | ||||||||||||||||||||||||||||||||||||
| Alturas |
— | — | — | — | — | — | — | 261,265 | 1.06 | 8,865 | ||||||||||||||||||||||||||||||||||||
| AUSTRALIA PACIFIC |
||||||||||||||||||||||||||||||||||||||||||||||
| Porgera (47.50%) |
50 | 4.98 | 8 | 11,667 | 4.73 | 1,773 | 1,781 | 11,329 | 3.99 | 1,455 | ||||||||||||||||||||||||||||||||||||
| Kalgoorlie (50.00%) |
5,343 | 1.42 | 244 | 25,455 | 1.51 | 1,235 | 1,479 | 9,402 | 2.33 | 704 | ||||||||||||||||||||||||||||||||||||
| AFRICA |
||||||||||||||||||||||||||||||||||||||||||||||
| Bulyanhulu (63.90%) |
362 | 13.49 | 157 | 4,720 | 7.97 | 1,210 | 1,367 | 9,587 | 11.76 | 3,625 | ||||||||||||||||||||||||||||||||||||
| North Mara (63.90%) |
1,247 | 2.29 | 92 | 6,901 | 2.59 | 574 | 666 | 2,835 | 4.87 | 444 | ||||||||||||||||||||||||||||||||||||
| Buzwagi (63.90%) |
— | — | — | 2,878 | — | 96 | 96 | 31,898 | 0.77 | 790 | ||||||||||||||||||||||||||||||||||||
| OTHER |
3,790 | 3.59 | 438 | 10,902 | 3.33 | 1,166 | 1,604 | 15,764 | 1.73 | 878 | ||||||||||||||||||||||||||||||||||||
| TOTAL |
405,320 | 0.93 | 12,158 | 1,568,051 | 1.52 | 76,689 | 88,847 | 852,855 | 1.22 | 33,545 | ||||||||||||||||||||||||||||||||||||
|
COPPER MINERAL RESOURCES (1,2)
|
||||||||||||||||||||||||||||||||||||||||||||||
| As at December 31, 2018 | MEASURED (M) | INDICATED (I) | (M) + (I) | INFERRED | ||||||||||||||||||||||||||||||||||||||||||
| Tonnes |
Grade |
Contained lbs |
Tonnes | Grade | Contained lbs |
Contained lbs |
Tonnes | Grade | Contained lbs |
|||||||||||||||||||||||||||||||||||||
| Based on attributable pounds
|
(000’s) | (%) | (millions) | (000’s) | (%) | (millions) | (millions) | (000’s) | (%) | (millions) | ||||||||||||||||||||||||||||||||||||
| Zaldívar (50.00%) |
101,841 | 0.342 | 767.2 | 51,856 | 0.333 | 380.3 | 1,147.4 | 21,875 | 0.255 | 122.9 | ||||||||||||||||||||||||||||||||||||
| Lumwana |
26,755 | 0.384 | 226.2 | 532,408 | 0.503 | 5,909.5 | 6,135.8 | 119,060 | 0.452 | 1,187.2 | ||||||||||||||||||||||||||||||||||||
| Jabal Sayid (50.00%) |
1,127 | 1.627 | 40.4 | 1,603 | 2.178 | 77.0 | 117.4 | 357 | 1.646 | 13.0 | ||||||||||||||||||||||||||||||||||||
| TOTAL |
129,723 | 0.361 | 1,033.8 | 585,867 | 0.493 | 6,366.7 | 7,400.6 | 141,292 | 0.425 | 1,323.1 | ||||||||||||||||||||||||||||||||||||
| (1) | Resources which are not reserves do not have demonstrated economic viability. |
| (2) | See accompanying endnote #1. |
| (3) | See accompanying endnote #5. |
| (4) | See accompanying endnote #3. |
| (5) | See accompanying endnote #4. |
| BARRICK YEAR-END 2018 |
81 | RESERVES AND RESOURCES |
SUMMARY GOLD MINERAL RESERVES AND MINERAL RESOURCES (1,2,3,4)
| For the years ended December 31 | 2018 | 2017 | ||||||||||||||||||||||||
| Based on attributable ounces | Tonnes (000’s) |
Grade (gm/t) |
Ounces (000’s) |
Tonnes (000’s) |
Grade (gm/t) |
Ounces (000’s) |
||||||||||||||||||||
| NORTH AMERICA |
||||||||||||||||||||||||||
| Goldstrike Open Pit |
(proven and probable) | 58,987 | 2.99 | 5,667 | 59,211 | 2.97 | 5,654 | |||||||||||||||||||
| (mineral resource) | 3,011 | 1.19 | 115 | 5,604 | 2.80 | 505 | ||||||||||||||||||||
| Goldstrike Underground |
(proven and probable) | 8,908 | 9.98 | 2,858 | 8,581 | 10.02 | 2,765 | |||||||||||||||||||
| (mineral resource) | 5,153 | 9.16 | 1,517 | 3,898 | 8.59 | 1,077 | ||||||||||||||||||||
| Goldstrike Property Total |
(proven and probable) | 67,895 | 3.91 | 8,525 | 67,792 | 3.86 | 8,419 | |||||||||||||||||||
| (mineral resource) | 8,164 | 6.22 | 1,632 | 9,502 | 5.18 | 1,582 | ||||||||||||||||||||
| Pueblo Viejo (60.00%) |
(proven and probable) | 76,741 | 2.66 | 6,552 | 81,359 | 2.76 | 7,224 | |||||||||||||||||||
| (mineral resource) | 101,352 | 2.46 | 8,027 | 101,686 | 2.46 | 8,054 | ||||||||||||||||||||
| Cortez |
(proven and probable) | 145,054 | 1.87 | 8,737 | 167,920 | 1.87 | 10,086 | |||||||||||||||||||
| (mineral resource) | 56,727 | 1.74 | 3,169 | 31,423 | 1.85 | 1,868 | ||||||||||||||||||||
| Goldrush |
(proven and probable) | 6,399 | 9.69 | 1,993 | 5,671 | 8.12 | 1,481 | |||||||||||||||||||
| (mineral resource) | 30,942 | 9.40 | 9,353 | 31,519 | 9.27 | 9,398 | ||||||||||||||||||||
| Turquoise Ridge (75.00%) |
(proven and probable) | 16,391 | 12.97 | 6,833 | 11,771 | 15.53 | 5,878 | |||||||||||||||||||
| (mineral resource) | 5,422 | 7.93 | 1,383 | 5,106 | 9.17 | 1,506 | ||||||||||||||||||||
| South Arturo (60.00%) |
(proven and probable) | 4,263 | 3.01 | 412 | 3,824 | 2.97 | 365 | |||||||||||||||||||
| (mineral resource) | 13,825 | 1.04 | 464 | 11,292 | 1.14 | 413 | ||||||||||||||||||||
| Hemlo |
(proven and probable) | 24,102 | 2.48 | 1,924 | 24,928 | 2.21 | 1,774 | |||||||||||||||||||
| (mineral resource) | 37,470 | 1.31 | 1,574 | 41,339 | 1.40 | 1,858 | ||||||||||||||||||||
| Golden Sunlight |
(proven and probable) | 366 | 1.70 | 20 | 452 | 2.06 | 30 | |||||||||||||||||||
| (mineral resource) | 2,897 | 1.76 | 164 | 3,134 | 1.78 | 179 | ||||||||||||||||||||
| Donlin Gold (50.00%) |
(proven and probable) | — | — | — | — | — | — | |||||||||||||||||||
| (mineral resource) | 270,668 | 2.24 | 19,503 | 270,668 | 2.24 | 19,503 | ||||||||||||||||||||
| SOUTH AMERICA |
||||||||||||||||||||||||||
| Norte Abierto (50.00%) (5) |
(proven and probable) | 598,801 | 0.60 | 11,623 | 598,801 | 0.60 | 11,623 | |||||||||||||||||||
| (mineral resource) | 850,124 | 0.49 | 13,306 | 850,124 | 0.49 | 13,306 | ||||||||||||||||||||
| Pascua-Lama |
(proven and probable) | — | — | — | — | — | — | |||||||||||||||||||
| (mineral resource) | 434,543 | 1.53 | 21,347 | 434,543 | 1.53 | 21,347 | ||||||||||||||||||||
| Veladero (50.00%) (6) |
(proven and probable) | 106,576 | 0.74 | 2,538 | 113,914 | 0.77 | 2,816 | |||||||||||||||||||
| (mineral resource) | 70,972 | 0.58 | 1,317 | 70,095 | 0.57 | 1,276 | ||||||||||||||||||||
| Lagunas Norte |
(proven and probable) | 44,886 | 2.74 | 3,952 | 55,430 | 2.25 | 4,005 | |||||||||||||||||||
| (mineral resource) | 16,950 | 1.13 | 615 | 30,942 | 0.95 | 950 | ||||||||||||||||||||
| AUSTRALIA PACIFIC |
||||||||||||||||||||||||||
| Porgera (47.50%) |
(proven and probable) | 13,244 | 4.93 | 2,100 | 13,255 | 4.78 | 2,038 | |||||||||||||||||||
| (mineral resource) | 11,717 | 4.73 | 1,781 | 12,465 | 4.62 | 1,853 | ||||||||||||||||||||
| Kalgoorlie (50.00%) |
(proven and probable) | 96,388 | 1.18 | 3,651 | 99,060 | 1.21 | 3,858 | |||||||||||||||||||
| (mineral resource) | 30,798 | 1.49 | 1,479 | 15,286 | 1.16 | 571 | ||||||||||||||||||||
| AFRICA |
||||||||||||||||||||||||||
| Bulyanhulu (63.90%) |
(proven and probable) | 6,605 | 8.23 | 1,747 | 12,580 | 7.42 | 3,001 | |||||||||||||||||||
| (mineral resource) | 5,082 | 8.37 | 1,367 | 9,208 | 9.04 | 2,676 | ||||||||||||||||||||
| North Mara (63.90%) |
(proven and probable) | 16,773 | 2.59 | 1,395 | 16,926 | 2.73 | 1,488 | |||||||||||||||||||
| (mineral resource) | 8,148 | 2.54 | 666 | 7,813 | 2.75 | 690 | ||||||||||||||||||||
| Buzwagi (63.90%) |
(proven and probable) | 6,817 | 0.90 | 197 | 9,108 | 0.92 | 269 | |||||||||||||||||||
| (mineral resource) | 2,878 | 1.04 | 96 | 2,891 | 1.04 | 97 | ||||||||||||||||||||
| OTHER |
(proven and probable) | 13,556 | 0.24 | 104 | 11,838 | 0.23 | 89 | |||||||||||||||||||
| (mineral resource) | 14,692 | 3.40 | 1,604 | 15,140 | 2.95 | 1,438 | ||||||||||||||||||||
| TOTAL |
(proven and probable) | 1,244,857 | 1.56 | 62,303 | 1,294,629 | 1.55 | 64,444 | |||||||||||||||||||
| (mineral resource) | 1,973,371 | 1.40 | 88,847 | 1,954,176 | 1.41 | 88,565 | ||||||||||||||||||||
(1) Resources which are not reserves do not have demonstrated economic viability.
(2) See accompanying endnote #1.
(3) Measured plus indicated resources.
(4) See accompanying endnote #2.
(5) See accompanying endnote #3.
(6) See accompanying endnote #4.
| BARRICK YEAR-END 2018 |
82 | RESERVES AND RESOURCES |
CONTAINED SILVER WITHIN REPORTED GOLD RESERVES (1)
| For the year ended Dec. 31, 2018 |
IN PROVEN GOLD RESERVES |
IN PROBABLE GOLD RESERVES |
TOTAL | |||||||||||||||||||||||||||||||||||||||||
| Contained | Contained | Contained | Process | |||||||||||||||||||||||||||||||||||||||||
| Tonnes | Grade | ozs | Tonnes | Grade | ozs | Tonnes | Grade | ozs | recovery % |
|||||||||||||||||||||||||||||||||||
| Based on attributable ounces |
(000s) | (gm/t) | (000s) | (000s) | (gm/t) | (000s) | (000s) | (gm/t) | (000s) | |||||||||||||||||||||||||||||||||||
| NORTH AMERICA |
||||||||||||||||||||||||||||||||||||||||||||
| Pueblo Viejo (60.00%) |
61,630 | 17.59 | 34,857 | 15,111 | 14.81 | 7,195 | 76,741 | 17.04 | 42,052 | 76.9 | % | |||||||||||||||||||||||||||||||||
| SOUTH AMERICA |
||||||||||||||||||||||||||||||||||||||||||||
| Norte Abierto (50.00%) (2) |
114,851 | 1.91 | 7,043 | 483,950 | 1.43 | 22,300 | 598,801 | 1.52 | 29,343 | 69.0 | % | |||||||||||||||||||||||||||||||||
| Lagunas Norte |
23,630 | 5.47 | 4,152 | 21,256 | 7.01 | 4,788 | 44,886 | 6.19 | 8,940 | 35.6 | % | |||||||||||||||||||||||||||||||||
| Veladero (50.00%) (3) |
9,175 | 12.79 | 3,774 | 91,068 | 14.05 | 41,131 | 100,243 | 13.93 | 44.905 | 9.4 | % | |||||||||||||||||||||||||||||||||
| AFRICA |
||||||||||||||||||||||||||||||||||||||||||||
| Bulyanhulu (63.90%) (4) |
1,542 | 8.90 | 441 | 3,336 | 6.19 | 664 | 4,878 | 7.05 | 1,105 | 65.0 | % | |||||||||||||||||||||||||||||||||
| TOTAL |
210,828 | 7.42 | 50,267 | 614,721 | 3.85 | 76,078 | 825,549 | 4.76 | 126,345 | 48.1 | % | |||||||||||||||||||||||||||||||||
(1) Silver is accounted for as a by-product credit against reported or projected gold production costs.
(2) See accompanying endnote #3.
(3) See accompanying endnote #4.
(4) See accompanying endnote #6.
CONTAINED COPPER WITHIN REPORTED GOLD RESERVES (1)
| For the year ended Dec. 31, 2018 |
IN PROVEN GOLD RESERVES |
IN PROBABLE GOLD RESERVES |
TOTAL | |||||||||||||||||||||||||||||||||||||||||
| Contained | Contained | Contained | Process | |||||||||||||||||||||||||||||||||||||||||
| Tonnes | Grade | lbs | Tonnes | Grade | lbs | Tonnes | Grade | lbs | recovery % |
|||||||||||||||||||||||||||||||||||
| Based on attributable pounds | (000s) | (%) | (millions) | (000s) | (%) | (millions) | (000s) | (%) | (millions) | |||||||||||||||||||||||||||||||||||
| SOUTH AMERICA |
||||||||||||||||||||||||||||||||||||||||||||
| Norte Abierto (50.00%) (2) |
114,851 | 0.190 | 480.9 | 483,950 | 0.226 | 2,408.8 | 598,801 | 0.219 | 2,889.7 | 87.4 | % | |||||||||||||||||||||||||||||||||
| AFRICA |
||||||||||||||||||||||||||||||||||||||||||||
| Bulyanhulu (63.90%) (3) |
1,542 | 0.528 | 17.9 | 3,336 | 0.555 | 40.8 | 4,878 | 0.547 | 58.8 | 90.0 | % | |||||||||||||||||||||||||||||||||
| Buzwagi (63.90%) |
— | — | — | — | — | — | — | — | — | — | % | |||||||||||||||||||||||||||||||||
| TOTAL |
116,393 | 0.194 | 498.8 | 487,286 | 0.228 | 2,449.7 | 603,679 | 0.222 | 2,948.5 | 87.5 | % | |||||||||||||||||||||||||||||||||
(1) Copper is accounted for as a by-product credit against reported or projected gold production costs.
(2) See accompanying endnote #3.
(3) See accompanying endnote #6.
| BARRICK YEAR-END 2018 |
83 | RESERVES AND RESOURCES |
CONTAINED SILVER WITHIN REPORTED GOLD RESOURCES (1)
| For the year ended Dec. 31, 2018 |
MEASURED (M) | INDICATED (I) | (M) + (I) | INFERRED | ||||||||||||||||||||||||||||||||||||||||||||||||
| Based on attributable ounces |
Tonnes
(000 ’s) |
Grade
(gm/t) |
Contained
(000 ’s) |
Tonnes
(000 ’s) |
Grade
(gm/t) |
Contained
(000 ’s) |
Ounces
(000 ’s) |
Tonnes
(000 ’s) |
Grade
(gm/t) |
Contained ozs
(000 ’s) |
||||||||||||||||||||||||||||||||||||||||||
| NORTH AMERICA |
||||||||||||||||||||||||||||||||||||||||||||||||||||
| Pueblo Viejo (60.00%) |
7,613 | 14.28 | 3,496 | 93,739 | 13.60 | 40,978 | 44,474 | 27,598 | 10.80 | 9,584 | ||||||||||||||||||||||||||||||||||||||||||
| SOUTH AMERICA |
||||||||||||||||||||||||||||||||||||||||||||||||||||
| Norte Abierto (50.00%) (2) |
321,528 | 1.20 | 12,417 | 528,596 | 1.17 | 19,804 | 32,221 | 346,770 | 1.00 | 11,162 | ||||||||||||||||||||||||||||||||||||||||||
| Pascua-Lama |
42,809 | 57.21 | 78,747 | 391,734 | 52.22 | 657,718 | 736,465 | 15,400 | 17.83 | 8,830 | ||||||||||||||||||||||||||||||||||||||||||
| Lagunas Norte |
1,136 | 2.82 | 103 | 15,814 | 2.70 | 1,371 | 1,474 | 1,546 | 5.23 | 260 | ||||||||||||||||||||||||||||||||||||||||||
| Veladero (50.00%) (3) |
3,361 | 8.90 | 962 | 67,611 | 11.92 | 25,918 | 26,880 | 35,872 | 11.64 | 13,427 | ||||||||||||||||||||||||||||||||||||||||||
| AFRICA |
||||||||||||||||||||||||||||||||||||||||||||||||||||
| Bulyanhulu (63.90%) |
362 | 10.40 | 121 | 4,720 | 5.38 | 816 | 937 | 9,587 | 9.01 | 2,778 | ||||||||||||||||||||||||||||||||||||||||||
| TOTAL |
376,809 | 7.91 | 95,846 | 1,102,214 | 21.07 | 746,605 | 842,451 | 436,773 | 3.28 | 46,041 | ||||||||||||||||||||||||||||||||||||||||||
(1) Resources which are not reserves do not have demonstrated economic viability.
(2) See accompanying endnote #3.
(3) See accompanying endnote #4.
CONTAINED COPPER WITHIN REPORTED GOLD RESOURCES (1,2)
| For the year ended Dec. 31, 2018 |
IN MEASURED (M) GOLD RESOURCES |
IN INDICATED (I) GOLD RESOURCES |
(M) + (I) | INFERRED |
||||||||||||||||||||||||||||||||||||||||||
| Based on attributable pounds |
Tonnes
(000 ’s) |
Grade
(%) |
Contained lbs
(millions) |
Tonnes
(000 ’s) |
Grade
(%) |
Contained lbs
(millions) |
Contained lbs
(millions) |
Tonnes
(000 ’s) |
Grade
(%) |
Contained lbs
(millions) |
||||||||||||||||||||||||||||||||||||
| SOUTH AMERICA |
||||||||||||||||||||||||||||||||||||||||||||||
| Norte Abierto (50.00%) (3) |
288,578 | 0.226 | 1,438.5 | 500,796 | 0.176 | 1,940.2 | 3,378.6 | 345,520 | 0.171 | 1,305.5 | ||||||||||||||||||||||||||||||||||||
| Pascua-Lama |
42,809 | 0.101 | 95.7 | 391,734 | 0.082 | 704.6 | 800.3 | 15,400 | 0.049 | 16.5 | ||||||||||||||||||||||||||||||||||||
| AFRICA |
||||||||||||||||||||||||||||||||||||||||||||||
| Bulyanhulu (63.90%) |
362 | 0.609 | 4.9 | 4,720 | 0.337 | 35.1 | 40.0 | 9,587 | 0.618 | 130.6 | ||||||||||||||||||||||||||||||||||||
| Buzwagi (63.90%) |
— | — | — | 2,878 | 0.109 | 6.9 | 6.9 | 31,898 | 0.081 | 56.9 | ||||||||||||||||||||||||||||||||||||
| TOTAL |
331,749 | 0.210 | 1,539.0 | 900,128 | 0.135 | 2,686.8 | 4,225.8 | 402,405 | 0.170 | 1,509.6 | ||||||||||||||||||||||||||||||||||||
(1) Resources which are not reserves do not have demonstrated economic viability.
(2) See accompanying endnote #7.
(3) See accompanying endnote #3.
NICKEL MINERAL RESOURCES (1)
| For the year ended Dec. 31, 2018 |
MEASURED (M) | INDICATED (I) | (M) + (I) | INFERRED |
||||||||||||||||||||||||||||||||||||||||||||||||
| Based on attributable pounds |
Tonnes
(000 ’s) |
Grade
(%) |
Contained lbs
(millions) |
Tonnes
(000 ’s) |
Grade
(%) |
Contained lbs
(millions) |
Contained lbs
(millions) |
Tonnes
(000 ’s) |
Grade
(%) |
Contained lbs
(millions) |
||||||||||||||||||||||||||||||||||||||||||
| AFRICA |
||||||||||||||||||||||||||||||||||||||||||||||||||||
| Kabanga (50.00%) |
6,905 | 2.490 | 379.0 | 11,705 | 2.720 | 702.0 | 1,081.0 | 10,500 | 2.596 | 601.0 | ||||||||||||||||||||||||||||||||||||||||||
(1) Resources which are not reserves do not have demonstrated economic viability.
| BARRICK YEAR-END 2018 |
84 | RESERVES AND RESOURCES |
Mineral Reserves and Resources Endnotes
| 1. | Mineral reserves (“reserves”) and mineral resources (“resources”) have been estimated as at December 31, 2018 in accordance with National Instrument 43-101 as required by Canadian securities regulatory authorities. For United States reporting purposes, Industry Guide 7 under the Securities and Exchange Act of 1934 (as interpreted by Staff of the SEC), applies different standards in order to classify mineralization as a reserve. In addition, while the terms “measured”, “indicated” and “inferred” mineral resources are required pursuant to National Instrument 43-101, the U.S. Securities and Exchange Commission does not currently recognize such terms. Canadian standards differ significantly from the current requirements of the U.S. Securities and Exchange Commission, and mineral resource information contained herein is not comparable to similar information regarding mineral reserves disclosed in accordance with the requirements of the U.S. Securities and Exchange Commission. However, the SEC has adopted amendments to its disclosure rules to modernize the mineral property disclosure requirements for issuers whose securities are registered with the SEC under the Securities and Exchange Act of 1934, as amended. These amendments will become effective February 25, 2019, and will replace the historical property disclosure requirements for mining registrants in SEC Industry Guide 7, which will be rescinded as of that date. As a result of the adoption of the SEC Modernization Rules, the SEC will recognize estimates of “measured”, “indicated” and “inferred” mineral resources. U.S. investors should understand that “inferred” mineral resources have a great amount of uncertainty as to their existence and great uncertainty as to their economic and legal feasibility. In addition, U.S. investors are cautioned not to assume that any part or all of Barrick’s mineral resources constitute or will be converted into reserves. Calculations have been prepared by employees of Barrick, its joint venture partners or its joint venture operating companies, as applicable, under the supervision of Rick Sims, Vice President, Resources and Reserves, of Barrick, Geoffrey Locke, Manager, Metallurgy, of Barrick and Mike Tsafaras, P. Eng., Manager, Value Realization of Barrick, of Barrick. Except as noted below, reserves have been estimated based on an assumed gold price of US$1,200 per ounce, an assumed silver price of US$16.50 per ounce, and an assumed copper price of US$2.75 per pound and long-term average exchange rates of 1.25 CAD/US$ and 0.75 US$/AUD. Reserves at Kalgoorlie assumed a gold price of AUD $1,600 and Bulyanhulu, North Mara and Buzwagi assumed a gold price of US$1,200. Reserve estimates incorporate current and/or expected mine plans and cost levels at each property. Varying cut-off grades have been used depending on the mine and type of ore contained in the reserves. Barrick’s normal data verification procedures have been employed in connection with the calculations. Verification procedures include industry-standard quality control practices. Resources as at December 31, 2018 have been estimated using varying cut-off grades, depending on both the type of mine or project, its maturity and ore types at each property. For a breakdown of reserves and resources by category and for a more detailed description of the key assumptions, parameters, and methods used in estimating Barrick’s reserves and resources, see Barrick’s most recent Annual Information Form/Form 40-F on file with Canadian provincial securities regulatory authorities and the U.S. Securities and Exchange Commission. |
| 2. | In confirming our annual reserves for each of our mineral properties, projects, and operations, we conduct a reserve test on December 31 of each year to verify that the future undiscounted cash flow from reserves is positive. The cash flow ignores all sunk costs and only considers future operating and closure expenses as well as any future capital costs. |
| 3. | On June 9, 2017, the Company sold 25% of its interest in Cerro Casale to Goldcorp Inc. (“Goldcorp”). Goldcorp concurrently purchased Kinross Gold Corporation’s 25% interest in Cerro Casale, resulting in Barrick and Goldcorp each holding a 50% interest in the joint operation. In connection with this transaction, Goldcorp also acquired the Caspiche Project from Exeter Resource Corporation, which was also contributed to the joint operation. Moving forward, the joint venture will be referred to as the Norte Abierto project, which includes the Cerro Casale, Caspiche and Luciano deposits. For additional information, see page 108 of Barrick’s Fourth Quarter and Year-End Report 2018. |
| 4. | On June 30, 2017, the Company sold 50 percent of its interest in the Veladero mine to Shandong Gold Group Co., Ltd. For additional information regarding this matter, see page 108 of Barrick’s Fourth Quarter and Year-End Report 2018. |
| 5. | Inferred resource contains approximately 1.2 million tonnes, containing approximately 0.7 million ounces at 18.58g/t, attributable to Fourmile. |
| 6. | Silver and copper probable reserve tonnage at the Bulyanhulu mine is less than the gold probable reserve tonnage because the gold reserve includes 1.7 million tonnes of tailings material which are being separately reprocessed for recovery of gold only. |
| 7. | Contained copper has been removed from Pueblo Viejo’s reserves and resources as at December 31, 2018, following a decision to suspend marginally economic copper production at the mine. The change is not expected to have any material impact on Pueblo Viejo’s cash flows. |
| For additional for information on the contained copper reported for Pueblo Viejo as at December 31, 2017, see pages 34-35 of Barrick’s Annual Information Form/Form 40-F for the year ended December 31, 2017, on file with Canadian provincial securities regulatory authorities and the U.S. Securities and Exchange Commission. |
| BARRICK YEAR-END 2018 |
85 | RESERVES AND RESOURCES |