Please wait
Management’s Discussion
and Analysis
(“MD&A”)
Management’s Discussion and Analysis (“MD&A”) is intended to help the reader understand Barrick Gold Corporation
(“Barrick”, “we”, “our”, the “Company” or the “Group”), our operations, financial performance and the present and future business environment. This MD&A, which has been prepared as of
February 17, 2021, should be read in conjunction with our audited consolidated financial statements (“Financial Statements”) for the year ended December 31, 2020. Unless otherwise indicated, all amounts are presented in US
dollars.
For the purposes of preparing our MD&A, we consider the materiality
of information. Information is considered material if: (i) such information results in, or would reasonably be expected to result in, a significant change in the market price or value of our shares; (ii) there is a substantial
likelihood that a reasonable investor would
consider it important in making an investment decision; or (iii) it would significantly alter the total mix of information available to
investors. We evaluate materiality with reference to all relevant circumstances, including potential market sensitivity.
Continuous disclosure materials, including our most recent Form 40-F/Annual Information Form, annual MD&A, audited consolidated
financial statements, and Notice of Annual Meeting of Shareholders and Proxy Circular will be available on our website at www.barrick.com, on SEDAR at www.sedar.com and on EDGAR at www.sec.gov. For an explanation of terminology unique to the mining
industry, readers should refer to the glossary on page
135.
Cautionary Statement on Forward-Looking Information
Certain
information contained or incorporated by reference in this MD&A, including any information as to our strategy, projects, plans or future financial or operating performance, constitutes “forward-looking statements”. All statements,
other than statements of historical fact, are forward-looking statements. The words “believe”, “expect”, “anticipate”, “vision”, “target”, “plan”, “opportunities”,
“objective”, “pursuit”, “assume”, “intend”, “intention”, “project”, “goal”, “continue”, “budget”, “estimate”,
“potential”, “strategy”, “prospective”, “following”, “future”, “aim”, “may”, “will”, “can”, “could”, “would” and
similar expressions identify forward-looking statements. In particular, this MD&A contains forward-looking statements including, without limitation, with respect to: Barrick’s goal to be the world’s most valued gold mining
business; Barrick’s forward-looking production guidance; estimates of future cost of sales per ounce for gold and per pound for copper, total cash costs per ounce and C1 cash costs per pound, and all-in sustaining costs per
ounce/pound; cash flow forecasts; projected capital, operating and exploration expenditures; mine life and production rates; Barrick’s engagement with local communities to manage the Covid-19 pandemic; potential
mineralization and metal or mineral recoveries; our ability to identify, invest in and develop potential Tier One, Tier Two and Strategic Assets; our strategies and plans with respect to environmental matters, including climate change,
greenhouse gas emissions reduction targets, and tailings storage facility management projects; our future plans, growth potential, financial strength, investments and overall strategy, including with respect to dispositions of non-core assets,
maximizing the long-term value of our strategic copper business, and our participation in future consolidation of the gold industry; the potential impact of proposed changes to Nevada’s Net Proceeds of Minerals tax on Nevada Gold Mines and
Barrick’s engagement with affected stakeholders to reach a solution that secures the long-term viability of the Nevada mining industry; our plans
and expected completion and benefits of our growth projects, including construction of twin exploration declines at Goldrush, the Turquoise Ridge
Third Shaft, Pueblo Viejo plant and tailings facility expansion, Bulyanhulu production ramp-up, Zaldívar chloride leach project, and Veladero power transmission project; our ability to convert resources into reserves; the proposed
return of capital distribution, including the timing and amount of the distribution; the partnership between Barrick and the Government of Tanzania (“GoT”) and the agreement to resolve all outstanding disputes between Acacia and the
GoT; Barrick and Barrick Niugini Limited’s response to the government of Papua New Guinea’s decision not to extend Porgera’s special mining lease and to the Internal Revenue Commission’s proposed tax adjustments; the
agreement in principle regarding arrangements for a new Porgera partnership with Papua New Guinea, and efforts to reach a binding memorandum of agreement; the duration of the temporary suspension of operations at Porgera; asset sales, joint
ventures and partnerships; our economic and social development priorities within our host communities, including local hiring, procurement, training and community development initiatives; our digital innovation initiatives; and
expectations regarding future price assumptions, financial performance and other outlook or guidance.
Forward-looking statements are necessarily based upon a number of estimates and assumptions including material estimates and assumptions related to
the factors set forth below that, while considered reasonable by the Company as at the date of this MD&A in light of management’s experience and perception of current conditions and expected developments, are inherently subject to
significant business, economic and competitive uncertainties and contingencies. Known and unknown factors could cause actual results to differ materially from those projected in the forward-looking statements and undue reliance should not be placed
on such statements
|
|
|
|
|
|
|
|
|
| BARRICK YEAR-END 2020 |
1 |
MANAGEMENT’S DISCUSSION AND
ANALYSIS |
and information. Such factors include, but are not limited to: fluctuations in the spot and forward price
of gold, copper or certain other commodities (such as silver, diesel fuel, natural gas and electricity); the speculative nature of mineral exploration and development; changes in mineral production performance, exploitation and exploration
successes; risks associated with projects in the early stages of evaluation and for which additional engineering and other analysis is required; disruption of supply routes which may cause delays in construction and mining activities at
Barrick’s more remote properties; diminishing quantities or grades of reserves; increased costs, delays, suspensions and technical challenges associated with the construction of capital projects; operating or technical difficulties
in connection with mining or development activities, including geotechnical challenges and disruptions in the maintenance or provision of required infrastructure and information technology systems; failure to comply with environmental and health
and safety laws and regulations; non-renewal of key licences by governmental authorities, including non-renewal of Porgera’s Special Mining Lease; changes in national and local government legislation, taxation, controls or regulations
and/or changes in the administration of laws, policies and practices; expropriation or nationalization of property and political or economic developments in Canada, the United States and other jurisdictions in which the Company or its
affiliates do or may carry on business in the future; timing of receipt of, or failure to comply with, necessary permits and approvals; uncertainty whether some or targeted investments and projects will meet the Company’s capital
allocation objectives and internal hurdle rate; the impact of global liquidity and credit availability on the timing of cash flows and the values of assets and liabilities based on projected future cash flows; adverse changes in our credit
ratings; the impact of inflation; fluctuations in the currency markets; changes in U.S. dollar interest rates; risks arising from holding derivative instruments; lack of certainty with respect to foreign legal systems, corruption
and other factors that are inconsistent with the rule of law; risks associated with illegal and artisanal mining; risks associated with new diseases, epidemics and pandemics, including the effects and potential effects of the global Covid-19
pandemic; damage to the Company’s reputation due to the actual or perceived occurrence of any number of events, including negative publicity with respect to the Company’s handling of environmental matters or dealings with community
groups, whether true or not; the possibility that future exploration results will not be consistent with the Company’s expectations; risks that exploration data may be incomplete and considerable additional work may be required to
complete further evaluation, including but not limited to drilling, engineering and socioeconomic studies and investment; risk of loss due to acts of war, terrorism, sabotage and civil disturbances; litigation; contests over title to
properties, particularly title to undeveloped properties, or over access to water, power and other required infrastructure; business opportunities that may be presented to, or pursued by, the Company; risks associated with the fact that
certain of the initiatives described in this MD&A are still in the early stages and may not materialize; whether benefits expected from recent transactions are realized; our ability to successfully integrate acquisitions or complete
divestitures; risks associated with working with partners in jointly controlled assets; employee relations
including loss of key employees; increased costs and physical risks, including extreme weather events and resource shortages, related to climate
change; and availability and increased costs associated with mining inputs and labor. Barrick also cautions that its 2021 guidance may be impacted by the unprecedented business and social disruption caused by the spread of Covid-19. In addition,
there are risks and hazards associated with the business of mineral exploration, development and mining, including environmental hazards, industrial accidents, unusual or unexpected formations, pressures, cave-ins, flooding and gold bullion, copper
cathode or gold or copper concentrate losses (and the risk of inadequate insurance, or inability to obtain insurance, to cover these risks).
Many of these uncertainties and contingencies can affect our actual results and could cause actual results to differ materially from those expressed
or implied in any forward-looking statements made by, or on behalf of, us. Readers are cautioned that forward-looking statements are not guarantees of future performance. All of the forward-looking statements made in this MD&A are qualified by
these cautionary statements. Specific reference is made to the most recent Form 40-F/Annual Information Form on file with the SEC and Canadian provincial securities regulatory authorities for a more detailed discussion of some of the factors
underlying forward-looking statements and the risks that may affect Barrick’s ability to achieve the expectations set forth in the forward-looking statements contained in this MD&A. We disclaim any intention or obligation to update or
revise any forward-looking statements whether as a result of new information, future events or otherwise, except as required by applicable
law.
Use of Non-GAAP Financial Performance Measures
We use the
following non-GAAP financial performance measures in our MD&A:
■“adjusted
net earnings”
■“free cash flow”
■“EBITDA”
■“adjusted EBITDA”
■“total
cash costs per ounce”
■“C1 cash costs per pound”
■“all-in
sustaining costs per ounce/pound”
■“all-in costs per ounce” and
■“realized
price”
For a detailed description of each of the non-GAAP
measures used in this MD&A and a detailed reconciliation to the most directly comparable measure under International Financial Reporting Standards (“IFRS”), please refer to the Non-GAAP Financial Performance Measures section of this
MD&A on pages 96 to 122. Each non-GAAP financial performance measure has been annotated with a reference to an endnote on page 123. The non-GAAP financial performance measures set out in this MD&A are intended to provide additional
information to investors and do not have any standardized meaning under IFRS, and therefore may not be comparable to other issuers, and should not be considered in isolation or as a substitute for measures of performance prepared in accordance with
IFRS.
|
|
|
|
|
|
|
|
|
| BARRICK YEAR-END 2020 |
2 |
MANAGEMENT’S DISCUSSION AND
ANALYSIS |
Index
|
|
|
|
|
|
|
|
|
|
|
|
|
|
Overview |
|
|
|
Our Vision |
|
|
|
Our Business |
|
|
|
Our Strategy |
|
|
|
Financial and Operating Highlights |
|
|
|
Environmental, Social and Governance |
|
|
|
Reserves and Resources |
|
|
|
Key Business Developments |
|
|
|
Outlook for 2021 |
|
|
|
Risks and Risk Management |
|
|
|
Market Overview |
|
|
|
Production and Cost Summary |
|
|
Operating Divisions Performance |
|
|
|
Nevada Gold Mines |
|
|
|
|
Carlin |
|
|
|
|
Cortez |
|
|
|
|
Turquoise Ridge |
|
|
|
|
Other Mines - Nevada Gold Mines |
|
|
|
|
|
|
|
Pueblo Viejo |
|
|
|
Loulo-Gounkoto |
|
|
|
Kibali |
|
|
|
Veladero |
|
|
|
Porgera |
|
|
|
North Mara |
|
|
|
Bulyanhulu |
|
|
|
Other Mines - Gold |
|
|
|
Other Mines - Copper |
|
|
Growth Project Updates |
|
|
Exploration and Mineral Resource
Management |
|
|
|
|
|
|
|
|
|
|
|
|
|
|
|
|
|
|
|
|
|
|
|
|
|
|
|
|
|
|
|
|
|
|
|
|
|
|
|
|
|
|
|
|
|
|
|
|
|
|
|
|
|
|
|
|
|
|
|
|
|
|
|
|
|
|
|
|
|
|
|
|
|
|
|
|
|
|
|
|
|
|
|
|
|
|
|
|
|
|
|
|
|
|
|
|
|
|
|
|
|
|
|
|
|
|
|
|
|
|
|
|
|
|
|
|
|
|
|
|
|
|
|
|
|
|
|
|
|
|
|
|
|
|
|
|
|
|
|
|
|
|
|
|
|
|
|
|
|
|
|
|
|
|
|
|
|
|
|
|
|
|
|
|
Review of
Financial Results |
|
|
Revenue |
|
|
Production Costs |
|
|
Capital
Expenditures |
|
|
General and Administrative
Expenses |
|
|
Exploration, Evaluation and
Project Costs |
|
|
Finance Costs,
Net |
|
|
Additional Significant Statement
of Income Items |
|
|
Income Tax
Expense |
|
Financial Condition
Review |
|
|
Balance Sheet
Review |
|
|
Shareholders’
Equity |
|
|
Financial Position and
Liquidity |
|
|
Summary of Cash Inflow
(Outflow) |
|
|
Summary of Financial
Instruments |
|
Commitments and
Contingencies |
|
Review of Quarterly
Results |
|
Internal Control over Financial
Reporting and Disclosure Controls and Procedures |
|
IFRS Critical Accounting Policies
and Accounting Estimates |
|
Non-GAAP Financial Performance
Measures |
|
Technical
Information |
|
Endnotes |
|
Glossary of Technical
Terms |
|
Mineral Reserves and Mineral
Resources Tables |
| 121 |
Management’s
Responsibility |
| 122 |
Management’s Report on
Internal Control Over Financial Reporting |
| 123 |
Independent Auditor’s
Report |
| 127 |
Financial
Statements |
| 132
|
Notes
to Consolidated Financial
Statements |
|
|
|
|
|
|
|
|
|
| BARRICK YEAR-END 2020 |
3 |
MANAGEMENT’S DISCUSSION AND
ANALYSIS |
Overview
Our Vision
We strive to be the world’s most valued gold mining business by finding, developing and owning the best assets, with the best people, to
deliver sustainable returns for our owners and partners.
Our Business
Barrick is one of the world’s leading gold mining companies with annual gold production and gold reserves that are among the largest in the
industry. We are principally engaged in the production and sale of gold and copper, as well as related activities such as exploration and mine development. We hold ownership interests in fourteen producing gold mines, including six Tier One Gold
Assets1 and a diversified asset portfolio positioned for growth in many of the world’s most prolific gold districts. These gold mines are
geographically diversified and are located in Argentina, Canada, Côte d’Ivoire, the Democratic Republic of Congo, the Dominican Republic, Mali, Tanzania and the United States. Our mine in Papua New Guinea was placed on care and
maintenance in April 2020. Our copper mines are located in Zambia, Chile and Saudi Arabia. We also have exploration and development projects located throughout the Americas and Africa. We sell our production in the world market through the following
distribution channels: gold bullion is sold in the gold spot market or to independent refineries; gold and copper concentrate is sold to independent smelting or trading companies; and copper cathode is sold to third-party purchasers or
on exchange. Barrick shares trade on the New York Stock Exchange under the symbol GOLD and the Toronto Stock Exchange under the symbol ABX.
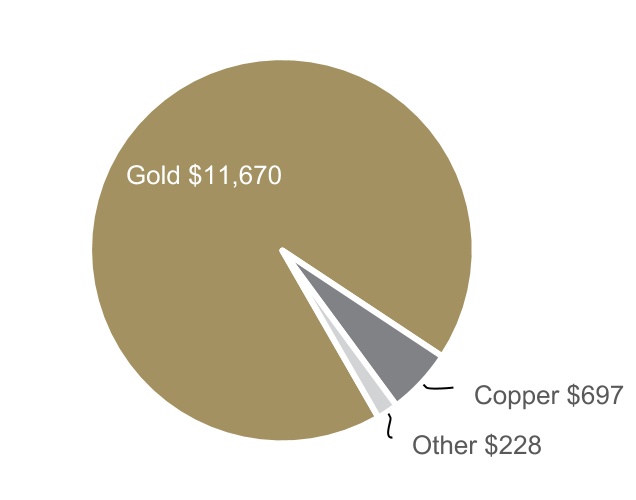
2020 REVENUE ($ millions)
Our Strategy
Our strategy is to operate as business owners by attracting and developing world-class people who understand and are involved in the value chain of
the business, act with integrity and are tireless in their pursuit of excellence. We are focused on returns to our stakeholders by optimizing free cash flow, managing risk to create long-term value for our shareholders and partnering with host
governments and our local communities to transform their country’s natural resources into sustainable benefits and mutual prosperity. We aim to achieve this through the following:1
Asset Quality
■Grow and
invest in a portfolio of Tier One Gold Assets, Tier Two Gold Assets and Strategic Assets2 with an emphasis on organic growth to leverage our existing footprint. We will focus our efforts on identifying, investing in and developing assets
that meet our investment criteria. The required internal rate of return (IRR) for Tier One Gold Assets and Tier Two Gold Assets is 15% and 20%, respectively, based on our long-term gold price assumption. A Tier One Gold Asset is an asset with a
reserve potential to deliver a minimum 10-year life, annual production of at least 500,000 ounces of gold and total cash costs per ounce4 over the mine life that are in the lower half of the industry cost curve. A Tier Two Gold Asset is an asset with a reserve potential to deliver a
minimum 10-year life, annual production of at least 250,000 ounces of gold and total cash costs per ounce4 over the mine life that are in the lower half of the industry cost curve.
■Invest in exploration across extensive land positions in many of the world’s most prolific gold
districts.
■Maximize the long-term value of our strategic Copper Business3.
■Sell
non-core assets over time in a disciplined manner.
Operational Excellence
■Strive
for zero harm workplaces.
■Operate a flat management structure with a strong ownership culture.
■Streamline management and operations, and hold management accountable for the businesses they manage.
■Leverage innovation and technology to drive industry-leading efficiencies.
■Build trust-based partnerships with host governments, business partners, and local communities to drive shared long-term
value.
Sustainable
Profitability
■Follow a disciplined approach to growth and proactively manage our impacts on the wider environment, emphasizing long-term value
for all stakeholders.
■Increase returns to shareholders, driven by a focus on return on capital, internal rate of return and free cash flow.
1 Numerical annotations throughout the text of this document refer to the endnotes found on page 123.
|
|
|
|
|
|
|
|
|
| BARRICK YEAR-END 2020 |
4 |
MANAGEMENT’S DISCUSSION AND
ANALYSIS |
Financial and Operating Highlights
|
|
|
|
|
|
|
|
|
|
|
|
|
|
|
|
|
|
|
|
|
|
|
|
|
|
|
|
|
|
|
For the three months ended |
|
For the years ended |
| |
12/31/20
|
9/30/20 |
Change |
|
12/31/20
|
12/31/19 |
Change |
|
12/31/18 |
Financial Results ($ millions) |
|
|
|
|
|
|
|
|
|
| Revenues |
3,279 |
|
3,540 |
|
(7)% |
|
12,595 |
|
9,717 |
|
30% |
|
7,243 |
|
| Cost of sales |
1,814 |
|
1,927 |
|
(6)% |
|
7,417 |
|
6,911 |
|
7% |
|
5,220 |
|
Net earnings (loss)a |
685 |
|
882 |
|
(22)% |
|
2,324 |
|
3,969 |
|
(41%) |
|
(1,545) |
|
Adjusted net earningsb |
616 |
|
726 |
|
(15)% |
|
2,042 |
|
902 |
|
126% |
|
409 |
|
Adjusted EBITDAb |
2,106 |
|
2,223 |
|
(5)% |
|
7,492 |
|
4,833 |
|
55% |
|
3,080 |
|
Adjusted EBITDA marginb,c |
64 |
% |
63 |
% |
2% |
|
59 |
% |
50 |
% |
18% |
|
43 |
% |
Total minesite sustaining capital expendituresd |
354 |
|
415 |
|
(15)% |
|
1,559 |
|
1,320 |
|
18% |
|
968 |
|
Total project capital expendituresd |
184 |
|
126 |
|
46% |
|
471 |
|
370 |
|
27% |
|
425 |
|
Total consolidated capital expendituresd,e |
546 |
|
548 |
|
0% |
|
2,054 |
|
1,701 |
|
21% |
|
1,400 |
|
| Net cash provided by operating activities |
1,638 |
|
1,859 |
|
(12)% |
|
5,417 |
|
2,833 |
|
91% |
|
1,765 |
|
Net cash provided by operating activities marginf |
50 |
% |
53 |
% |
(6)% |
|
43 |
% |
29 |
% |
48% |
|
24 |
% |
Free cash flowb |
1,092 |
|
1,311 |
|
(17)% |
|
3,363 |
|
1,132 |
|
197% |
|
365 |
|
| Net earnings (loss) per share (basic and diluted) |
0.39 |
|
0.50 |
|
(22)% |
|
1.31 |
|
2.26 |
|
(42%) |
|
(1.32) |
|
Adjusted net earnings (basic)b per share |
0.35 |
|
0.41 |
|
(15)% |
|
1.15 |
|
0.51 |
|
125% |
|
0.35 |
|
| Weighted average diluted common shares (millions of
shares) |
1,778 |
|
1,778 |
|
0% |
|
1,778 |
|
1,758 |
|
1% |
|
1,167 |
|
| Operating Results |
|
|
|
|
|
|
|
|
|
Gold production (thousands of ounces)g |
1,206 |
|
1,155 |
|
4% |
|
4,760 |
|
5,465 |
|
(13%) |
|
4,527 |
|
Gold sold (thousands of ounces)g |
1,186 |
|
1,249 |
|
(5)% |
|
4,879 |
|
5,467 |
|
(11%) |
|
4,544 |
|
| Market gold price ($/oz) |
1,874 |
|
1,909 |
|
(2)% |
|
1,770 |
|
1,393 |
|
27% |
|
1,268 |
|
Realized gold priceb,g ($/oz) |
1,871 |
|
1,926 |
|
(3)% |
|
1,778 |
|
1,396 |
|
27% |
|
1,270 |
|
Gold cost of sales (Barrick’s share)g,h ($/oz) |
1,065 |
|
1,065 |
|
0% |
|
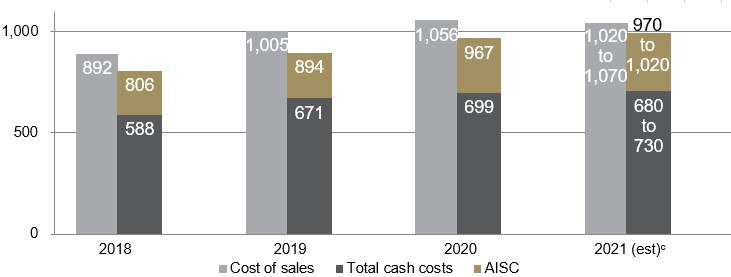
1,056 |
|
1,005 |
|
5% |
|
892 |
|
Gold total cash costsb,g ($/oz) |
692 |
|
696 |
|
(1)% |
|
699 |
|
671 |
|
4% |
|
588 |
|
Gold all-in sustaining costsb,g ($/oz) |
929 |
|
966 |
|
(4)% |
|
967 |
|
894 |
|
8% |
|
806 |
|
Copper production (millions of pounds)i |
119 |
|
103 |
|
16% |
|
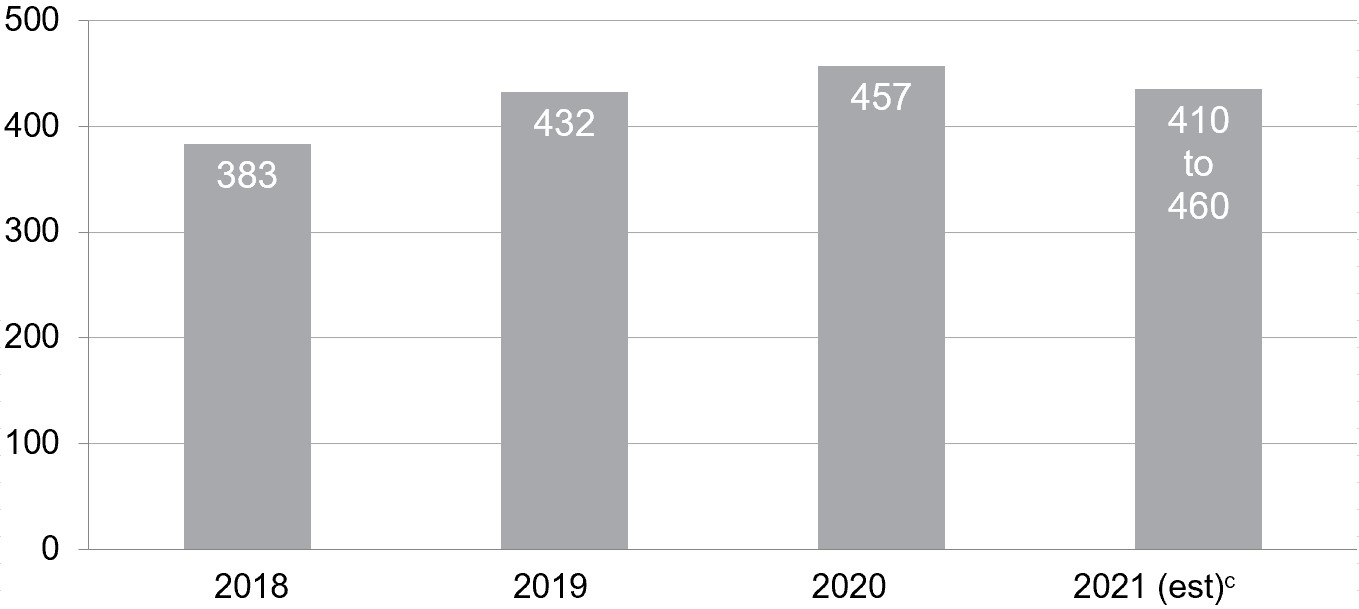
457 |
|
432 |
|
6% |
|
383 |
|
Copper sold (millions of pounds)i |
108 |
|
116 |
|
(7)% |
|
457 |
|
355 |
|
29% |
|
382 |
|
| Market copper price ($/lb) |
3.25 |
|
2.96 |
|
10% |
|
2.80 |
|
2.72 |
|
3% |
|
2.96 |
|
Realized copper priceb,i ($/lb) |
3.39 |
|
3.28 |
|
3% |
|
2.92 |
|
2.77 |
|
5% |
|
2.88 |
|
Copper cost of sales (Barrick’s share)i,j ($/lb) |
2.06 |
|
1.97 |
|
5% |
|
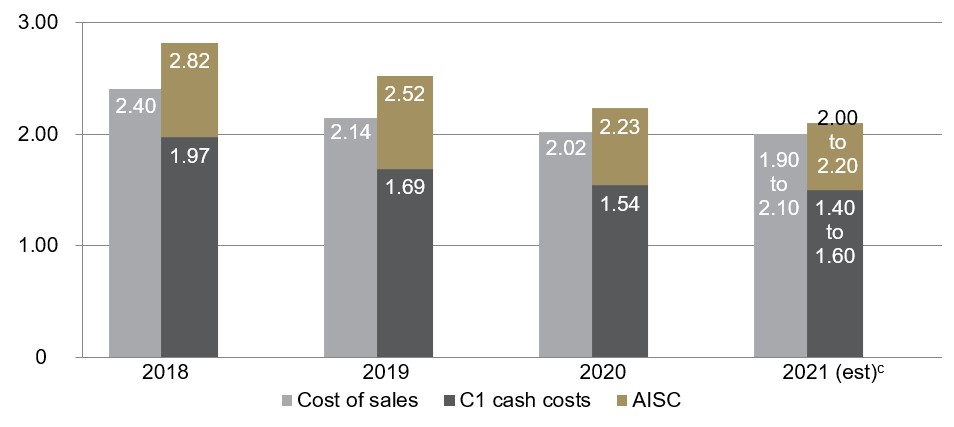
2.02 |
|
2.14 |
|
(6%) |
|
2.40 |
|
Copper C1 cash costsb,i ($/lb) |
1.61 |
|
1.45 |
|
11% |
|
1.54 |
|
1.69 |
|
(9%) |
|
1.97 |
|
Copper all-in sustaining costsb,i ($/lb) |
2.42 |
|
2.31 |
|
5% |
|
2.23 |
|
2.52 |
|
(12%) |
|
2.82 |
|
| |
As at
12/31/20 |
As at 9/30/20 |
Change |
|
As at
12/31/20 |
As at 12/31/19 |
Change |
|
As at
12/31/18 |
Financial Position ($ millions) |
|
|
|
|
|
|
|
|
|
| Debt (current and long-term) |
5,155 |
|
5,161 |
|
0% |
|
5,155 |
|
5,536 |
|
(7)% |
|
5,738 |
|
| Cash and equivalents |
5,188 |
|
4,744 |
|
9% |
|
5,188 |
|
3,314 |
|
57% |
|
1,571 |
|
| Debt, net of cash |
(33)
|
|
417 |
|
(108)% |
|
(33)
|
|
2,222 |
|
(101)% |
|
4,167
|
|
a.Net earnings (loss) represents net earnings (loss) attributable to the equity holders of the
Company.
b.
Adjusted net earnings, adjusted EBITDA, adjusted EBITDA margin, free cash flow, adjusted net earnings per share,
realized gold price, all-in sustaining costs, total cash costs, C1 cash costs and realized copper price are non-GAAP financial performance measures with no standardized meaning under IFRS and therefore may not be comparable to similar measures
presented by other issuers. For further information and a detailed reconciliation of each non-GAAP measure to the most directly comparable IFRS measure, please see pages 96 to 122 of this
MD&A.
c.
Represents adjusted EBITDA divided by
revenue.
d.
Amounts presented on a consolidated cash basis. Project capital expenditures are included in our calculation of
all-in costs, but not included in our calculation of all-in sustaining costs.
e.Total consolidated capital expenditures also includes capitalized
interest.
f.
Represents net cash provided by operating activities divided by
revenue.
g.
Includes North Mara, Bulyanhulu and Buzwagi on a 84% basis starting January 1, 2020 (and on a 63.9% basis from
January 1, 2018 to September 30, 2019; notwithstanding the completion of the Acacia transaction on September 17, 2019, we consolidated our interest in Acacia and recorded a non-controlling interest of 36.1% in the income statement for the
entirety of the third quarter of 2019 as a matter of convenience; and on a 100% basis from October 1, 2019 to December 31, 2019), Pueblo Viejo on a 60% basis, South Arturo on a 36.9% basis from July 1, 2019 onwards as a result of the
contribution to Nevada Gold Mines (and on a 60% basis from January 1, 2018 to June 30, 2019), and Veladero on a 50% basis, which reflects our equity share of production and sales. Commencing on January 1, 2019, the effective date of the merger with
Randgold Resources Limited (the “Merger”), also includes Loulo-Gounkoto on an 80% basis, Kibali on a 45% basis, Tongon on an 89.7% basis, and Morila on a 40% basis until the second quarter of 2019. Also removes the non-controlling
interest of 38.5% Nevada Gold Mines from July 1, 2019 onwards.
h.Gold cost of sales (Barrick’s share) is calculated as cost of sales - gold on an attributable basis (excluding sites in
care and maintenance) divided by ounces sold.
i.Amounts reflect production and sales from Jabal Sayid and Zaldívar on a 50% basis, which reflects our equity share of
production, and Lumwana.
j.Copper cost of sales (Barrick’s share) is calculated as cost of sales (copper) plus our equity share of cost of sales
attributable to Zaldívar and Jabal Sayid divided by pounds sold.
|
|
|
|
|
|
|
|
|
| BARRICK YEAR-END 2020 |
5 |
MANAGEMENT’S DISCUSSION AND
ANALYSIS |
|
|
|
|
|
|
OPERATING CASH FLOW AND FREE CASH FLOWa |
DEBT, NET OF CASH ($ billions) |
|
|
|
|
|
|
GOLD PRODUCTION (thousands of ounces) |
COPPER PRODUCTION (millions of pounds) |
|
|
|
|
|
|
GOLD COST OF SALESb, TOTAL CASH COSTSa, |
COPPER COST OF SALESb, C1 CASH COSTSa, |
AND ALL-IN SUSTAINING COSTSa ($ per ounce) |
AND ALL-IN SUSTAINING COSTSa ($ per pound) |
a.These are non-GAAP financial performance measures with no standardized meaning under IFRS and therefore may not be comparable to
similar measures presented by other issuers. For further information and a detailed reconciliation of each non-GAAP measure to the most directly comparable IFRS measure, please see pages 96 to 122 of this
MD&A.
b.Cost of sales applicable to gold per ounce is calculated using cost of sales applicable to gold on an attributable basis
(removing the non-controlling interest of 40% Pueblo Viejo, 16% North Mara, Bulyanhulu and Buzwagi starting January 1, 2020, the date the GoT’s 16% free carried interest was made effective (36.1% from January 1, 2018 to September 30, 2019;
notwithstanding the completion of the Acacia transaction on September 17, 2019, we consolidated our interest in Acacia and recorded a non-controlling interest of 36.1% in the income statement for the entirety of the third quarter of 2019 as a matter
of convenience); and 63.1% South Arturo from cost of sales from July 1, 2019 onwards as a result of its contribution to Nevada Gold Mines (and on a 40% basis from January 1, 2018 to June 30, 2019), divided by attributable gold ounces. Commencing January 1, 2019, the effective date of the Merger, the non-controlling interest of 20% Loulo-Gounkoto and 10.3% Tongon is also removed
from cost of sales and our proportionate share of cost of sales attributable to equity method investments (Kibali, and Morila until the second quarter of 2019) is included. Cost of sales applicable to gold per ounce also removes the non-controlling
interest of 38.5% Nevada Gold Mines from July 1, 2019 onwards. Cost of sales applicable to copper per pound is calculated using cost of
sales applicable to copper including our proportionate share of cost of sales attributable to equity method investments (Zaldívar and Jabal Sayid), divided by consolidated copper pounds (including our proportionate share of copper pounds from
our equity method investments).
c.Based on the midpoint of the guidance range.
|
|
|
|
|
|
|
|
|
| BARRICK YEAR-END 2020 |
6 |
MANAGEMENT’S DISCUSSION AND
ANALYSIS |
Factors affecting net earnings and adjusted net earnings4 - three months ended December 31, 2020 versus September 30, 2020
Net earnings attributable to equity holders of Barrick ("net earnings") for the three months ended December 31, 2020 were $685 million
compared to $882 million in the prior quarter. The decrease was primarily due to a lower realized gold price4 of $1,871 per ounce for the three months ended December 31, 2020, compared to $1,926 per ounce in the prior quarter.
After adjusting for items that are not indicative of future operating earnings,
adjusted net earnings4 of $616 million for the three months ended December 31, 2020 were $110 million lower than the prior quarter. The decrease in adjusted net
earnings4 was mainly due to a lower realized gold price4, as discussed above, and a decrease in gold and copper sales volumes.
The significant adjusting item in the three months ended December 31, 2020 was $118 million ($126 million before tax and non-controlling interest) in
acquisition/disposition gains, primarily resulting from the sale of Eskay Creek, Morila and Bullfrog.
Refer to page 97 for a full list of reconciling items between net earnings and adjusted net earnings4 for the current and previous periods.
Factors affecting net earnings and adjusted net earnings4 - year ended December 31, 2020 versus December 31, 2019
Net earnings for the year ended December 31, 2020 were $2,324 million compared to $3,969 million in the prior year. The significant decrease was
primarily due to items occurring in the prior year, including:
■a gain
of $1.9 billion ($1.5 billion net of taxes) relating to the remeasurement of Turquoise Ridge to fair value as a result of its contribution to Nevada Gold Mines;
■a gain
of $408 million (no tax impact) resulting from the sale of our 50% interest in Kalgoorlie;
■an
impairment reversal at Lumwana of $947 million ($663 million net of taxes) and at Pueblo Viejo of $865 million ($277 million net of taxes and non-controlling interest), partially offset by an impairment charge at Pascua-Lama of $296 million (no tax
impact);
■a gain of $628 million (no tax impact) on the de-recognition of the deferred revenue liability relating to our silver sale
agreement with Wheaton Precious Metals Corp. (“Wheaton”); and
■a gain
of $216 million on a settlement of customs duty and indirect taxes at Lumwana.
The decrease was partially offset by current year positive items consisting
of:
■a net impairment reversal of $91 million ($304 million before tax) resulting from the framework agreement with the Government of
Tanzania being signed and made effective in the first quarter of 2020;
■a gain
of $172 million ($180 million before tax and non-controlling interest) in acquisitions/dispositions, primarily resulting from the sales of Eskay Creek, Massawa, Morila and Bullfrog;
and
■a gain of $104 million (no tax impact) on the remeasurement of the residual cash liability relating to our silver sale agreement
with Wheaton.
After
adjusting for items that are not indicative of future operating earnings, adjusted net earnings4 of $2,042 million for the year ended December 31, 2020 were $1,140 million higher than the prior year. The increase in adjusted net
earnings4 was primarily due to a higher realized gold price4 of $1,778 per ounce in 2020 compared to $1,396 per ounce in the prior year, partially offset by higher gold cost of sales per ounce5.
Refer to page 97 for a full list of reconciling items between net earnings and adjusted net earnings4 for the current and previous periods.
Factors affecting Operating Cash Flow and Free Cash Flow4 - three months ended December 31, 2020 versus September 30, 2020
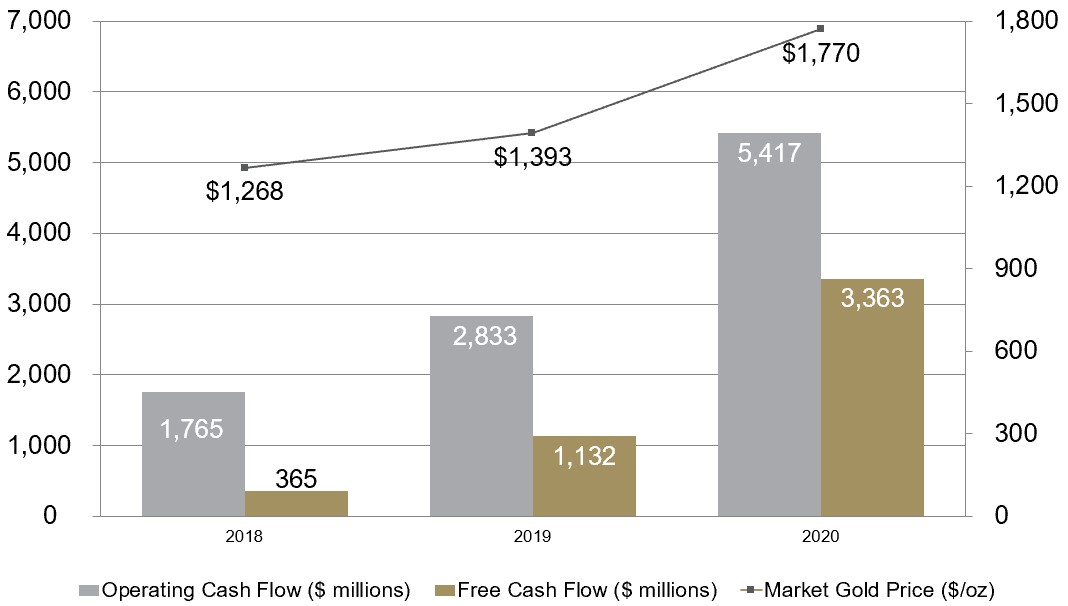
In the three months ended December 31, 2020, we generated $1,638 million in operating cash flow, compared to $1,859 million in the prior quarter. The
decrease of $221 million was primarily due to an increase in interest paid as a result of the timing of interest payments on our public market debt. This was combined with a lower realized gold price4 of $1,871 per ounce for the three months ended December 31, 2020, compared to $1,926 per ounce in the prior quarter.
Free cash flow4 for the three months ended December 31, 2020 was $1,092 million, compared to $1,311 million in the prior quarter, reflecting lower operating cash
flows, while capital expenditures remained consistent with the prior quarter. In the three months ended December 31, 2020, capital expenditures on a cash basis were $546 million compared to $548 million in the prior quarter as a decrease in minesite
sustaining capital expenditures was offset by higher project capital expenditures. The decrease in minesite sustaining capital expenditures is primarily due to Loulo-Gounkoto and was driven by lower capitalized stripping at the Gounkoto open pit and
a decrease in capital development at Loulo. This was combined with a decrease at Cortez as a result of fewer haul truck component replacements, the ramp-down of the Crossroads dewatering project until the next stages are reviewed and approved, and a
reduction in capitalized stripping as the mine transitions out from a mostly stripping phase at Crossroads Phase 4. The increase in project capital expenditures was primarily due to the plant and tailings expansion project at Pueblo Viejo and the
restart of underground mining and processing operations at Bulyanhulu.
Factors affecting
Operating Cash Flow and Free Cash Flow4 - year ended December 31, 2020 versus December 31, 2019
For the year ended December 31, 2020, we generated $5,417 million in operating cash flow, compared to $2,833 million in the prior year. The increase
of $2,584 million was primarily due to a higher realized gold price4 of $1,778 per ounce in 2020, compared to $1,396 per ounce in the prior year, partially offset by higher gold cost of sales per ounce5. The current year also included a full year contribution from Nevada Gold Mines, whereas the prior year included a contribution for only the six
month period from July 1, 2019.
For 2020, we generated free cash flow4 of $3,363 million compared to $1,132 million in the prior year. The increase primarily reflects higher operating cash flows, partially offset by
higher capital expenditures. In 2020, capital expenditures on a cash basis were $2,054 million compared to $1,701 million in the prior year, mainly as a result of the formation of Nevada Gold Mines. This was combined with higher minesite sustaining
capital expenditures as a result of increased capitalized stripping at Loulo-Gounkoto and our investment in the tailings storage facility and other water management initiatives at North
|
|
|
|
|
|
|
|
|
| BARRICK YEAR-END 2020 |
7 |
MANAGEMENT’S DISCUSSION AND
ANALYSIS |
Mara. This was further impacted by higher project capital expenditures related to the plant and tailings
expansion project at Pueblo Viejo and the restart of underground mining and processing operations at Bulyanhulu.
Environmental, Social and Governance ("ESG")
Sustainability is integral to Barrick and is entrenched in our DNA. This means that the day-to-day ownership of
sustainability-related risks and opportunities is in the hands of individual sites. As each site manages its geological, operational and technical capabilities to meet our business objectives, the site must also manage its own sustainability
performance.
Our commitment and responsibility for sustainability is driven at an
operational level, not set in a corporate office as part of a compliance exercise. Each site plays a role in identifying programs, metrics, and targets that measure real progress and deliver real impacts for the business and our stakeholders,
including our host countries and local communities. The Group Sustainability Executive, as a member of the Group’s Executive Committee, provides oversight and direction on this site-level ownership, ensuring alignment towards the strategic
priorities of the overall business.
Our sustainability strategy is built on four
main pillars: (1) Ensuring we respect human rights; (2) Protecting the health and safety of our people and local communities; (3) Sharing the benefits of our operations; and 4) Managing our impacts on the environment.
We are encouraged that analyzing ESG strategy as part of an investment thesis has
moved from the margins to the mainstream. However, we also recognize the challenges it presents with the ever-increasing number of disclosures, tools and metrics used to score a company’s performance.
Our 2019 Sustainability Report introduced an ESG scorecard to address this
challenge. The scorecard, which is a first for our industry, sets out what we believe are the sustainability issues most relevant both for our business and our industry, ranking us against our peers and internal metrics. It compares our performance
across our priority ESG areas: Health and Safety, Social and Economic Development, Human Rights, the Environment, as well as Governance. Our performance on these aspects is then aggregated into an overall score.
For 2020, our performance on the scorecard will account for 25% of the long-term
incentive for our executives. For 2019, we scored a B grade (on a scale where A represents high performance and E represents poor performance). We believe this accurately reflected the improvements in our sustainability performance during 2019, but
also acknowledge that areas remain where we need to improve.
The scorecard will be
updated and published in our 2020 Sustainability Report, which is expected to be released early in the second quarter of 2021, and will reflect the improvement in performance we have realized
year-on-year.
Safety
Our safety vision is “Every person going home safe and healthy every day.”
Barrick is committed to the safety, health and well-being of our people, their families and the communities in which we operate. Our safety
performance is reported as
part of our quarterly Environmental & Social Oversight Committee ("E&S Committee") meetings and to the Board's Corporate Governance
& Nominating Committee.
Our goal is for the safety management systems at all
operational mines to be certified to the internationally recognized ISO 45001 standard by the end of 2021, with three sites already accredited.
Across the Company, we have implemented our “Journey to Zero Harm” initiative. This initiative is focused
on:
■Engagement with our workforce through Visible Felt
Leadership;
■Aligning and improving our standards;
■Ensuring
accountability to our safety commitments;
and
■Ensuring our employees are fit for
duty.
Our relentless focus
on safety has helped drive performance improvements across much of the Group in 2020.
Our Group Lost Time Injury Frequency Rate ("LTIFR")6 decreased to 0.32 in the fourth quarter of 2020, down from 0.45 in the prior quarter. Our Total Reportable Injury Frequency Rate
(“TRIFR”)6 for the fourth quarter of 2020 was 1.43, a decrease from the prior quarter of 2.07.
For 2020, the Group recorded fewer Lost Time Injuries ("LTIs") and Total Recordable Injuries (“TRIs”) compared to last year, with
the related frequency rates also decreasing year-on-year.
Although we saw a
year-on-year improvement in terms of our safety record with fewer total recordable injuries, we unfortunately suffered a fatality at Kibali in the Democratic Republic of Congo in November 2020. Aurelien Mufungizi, an underground service truck
operator, was fatally injured underground when he became trapped between two heavy vehicles. A thorough investigation into the incident was completed, with lessons learned and corrective actions communicated to every site within the Group to ensure
that similar tragedies never happen again. Our deepest condolences go out to his family.
Environment
Strong environmental management is a crucial building block of our business. Environmental issues with the greatest potential impact on the health
and safety of local communities, such as how we use water, prevent incidents and manage tailings, are our highest priority.
Immediately after the Merger, we set a corporate goal for all sites to have their Environmental Management System (“EMS”) certified to
the ISO 14001:2015 standard by the end of 2020. At the start of 2020, only four mines (Jabal Sayid, Bulyanhulu, Buzwagi and North Mara) remained to be certified. In October, Jabal Sayid was recommended for its inaugural certification to the ISO
14001:2015 standard. Following this, Bulyanhulu and Buzwagi were certified in November and December, respectively. North Mara is scheduled to complete a certification audit by the end of the first quarter of
2021.
We maintained our strong track record of stewardship and did not record any
Class 17 environmental incidents during
2020.
|
|
|
|
|
|
|
|
|
| BARRICK YEAR-END 2020 |
8 |
MANAGEMENT’S DISCUSSION AND
ANALYSIS |
Climate
In early 2020, we reviewed and updated our climate change strategy.
Barrick’s climate change strategy has three pillars: (1) Identify, understand and mitigate the risks associated with climate change;
(2) Measure and reduce our impacts on climate change; and (3) Improve our disclosure on climate change. Action taken on each pillar is described
below.
Identify,
understand and mitigate the risks associated with climate change
We continue to take steps to
identify and manage risks and build resilience to climate change, as well as to position ourselves for new opportunities. Climate change-related factors continue to be incorporated into Barrick’s formal risk assessment process (for example,
consideration is given to the availability and access to water, together with the impact of increased precipitation, drought, or severe storms on operations as well as on local communities). We have identified several climate-related risks and
opportunities for our business including: physical impacts of climate change, such as an increase in extended duration extreme precipitation events; an increase in regulations that seek to address climate change; and an increase in
global investment in innovation and low-carbon technologies.
Measure and reduce the Group’s impact on climate change
Mining is an energy-intensive business, and we understand the important link between energy use and greenhouse gas (“GHG”) emissions. By
measuring and effectively managing our energy use, we can reduce our draw from local energy grids, reduce our GHG emissions, achieve more efficient production, and reduce our costs.
Improve our disclosure on
climate change
As part of our commitment to improve our disclosure on climate change, we complete
the annual CDP (formerly known as the Carbon Disclosure Project) emissions questionnaire, which makes investor-relevant climate data widely available. In 2020, Barrick received a C minus grade on the CDP Climate Change Questionnaire. This grade
places Barrick in the 'awareness' scoring band.
The Board’s Corporate
Governance & Nominating Committee meets quarterly and is responsible for overseeing Barrick’s policies, programs and performance relating to the environment, including climate change. The Audit & Risk Committee assists the Board in
overseeing the Group’s management of enterprise risks as well as the implementation of policies and standards for monitoring and mitigating such risks. Climate change is built into our formal risk management process, outputs of which were
reviewed by the Audit & Risk Committee throughout 2019 and 2020.
During 2020,
we also concluded an update of our global scenario analysis, and we are now advancing an individual site-by-site analysis to better understand the risk that climate change poses to each operation, with an initial focus on our Tier One Gold
Assets1. In addition, the Audit & Risk Committee reviewed the Group’s approach to climate change in the context of our public
disclosures.
As detailed in our 2019 Sustainability Report, Barrick has updated
its GHG emissions reduction target to achieve a reduction of at least 10% by 2030, while maintaining a steady ounce production profile. The basis of this reduction is against a 2018 baseline that combines
legacy Barrick and Randgold data as well as 2018 emissions from the assets over which we assumed operational control in 2019, including Nevada Gold
Mines and the Tanzanian mines.
Our emissions reduction target is grounded in
climate science and has a detailed and demonstrable pathway for achievement. This required the identification of several projects for implementation, including certain projects that are already contributing to emissions reduction:
■Our investment in battery technology at Kibali will further reduce the mine’s requirement for diesel generators.
■At Loulo-Gounkoto, we have installed a 20 MW solar power plant, which began injecting power into the
microgrid.
■In the Dominican Republic, we have switched the Quisqueya Power Plant from heavy fuel oil to cleaner burning natural gas.
Our target is not static
and will be updated as we continue to identify and implement new GHG reduction opportunities.
We expect our focus on climate change to continue through 2021 and beyond, with several projects that will further reduce GHG emissions. Those listed
below are more advanced in the project lifecycle with capital already committed.
■Nevada
Gold Mines – Conversion of the TS power plant from coal to natural gas. This is estimated to reduce GHG emissions by 563 kt CO2-e per annum.
■Nevada
Gold Mines – Construction of a 100 MW TS Solar Farm. This is estimated to reduce GHG emissions by 52 kt CO2-e per annum.
■Pueblo
Viejo – Implementing the Lime Kiln Fuel Switch Project (from diesel to liquified natural gas) which is estimated to reduce GHG emissions by 127 kt CO2-e per annum.
■Loulo-Gounkoto
– Doubling the capacity of the 20 MW Loulo Solar Power Plant for an incremental 27 kt CO2-e per annum reduction, which is at the feasibility
stage.
In our upcoming 2020
Sustainability Report, to be released early in the second quarter of 2021, we plan to provide details on an increase in our emissions reduction target to at least 30% by 2030 against the 2018 baseline of 7,541 kT CO2e per annum, while maintaining a steady production profile. We also expect to provide details on a new interim reduction target of 15%, which is
based on feasibility projects that have been identified and are currently being implemented. Ultimately, our vision is net zero GHG emissions achieved primarily through GHG reductions, with some offsets for hard-to-abate emissions. Site-level plans
to reduce energy and GHG emissions will also be strengthened, and we plan to supplement our corporate emissions reduction target with context-based site-specific emissions reduction targets.
We continue to align our disclosures with the Taskforce on Climate-related
Financial Disclosures ("TCFD") and will work to incorporate scenario analysis into our future disclosures. We have a strong foundation and Barrick continues to build further resilience to withstand the potential impacts of climate change and
leverage potential opportunities as the global economy transitions to a low-carbon
future.
|
|
|
|
|
|
|
|
|
| BARRICK YEAR-END 2020 |
9 |
MANAGEMENT’S DISCUSSION AND
ANALYSIS |
Water
Our aim is to deliver enough water for the effective operation of our mines, while at the same time protecting the quality and quantity of water
available to host communities and other users in our watersheds. Our commitment to responsible water use is codified in our Environmental Policy. This requires us to minimize our use of water, control and manage our impacts on water quality, and
engage with stakeholders, including local communities, to maintain sustainable management of water resources for the benefit of all users.
Each mine has its own site-specific water management plan, which considers: (1) the different water sources available; (2) the local climate
conditions; and (3) the needs of local users and the needs of the mine. This information is supplemented by a range of international frameworks and tools such as the WWF Water Risk Filter to evaluate water risks, particularly those linked to
water stress.
We include each mine’s water risks in its operational risk
register. These risks are then aggregated and incorporated into the corporate risk register. Our identified water-related risks include: (1) managing excess water in regions with high rainfall; (2) maintaining access to water in arid areas
and regions prone to water scarcity; and (3) regulatory risks related to permitting limits as well as municipal and national regulations for water use.
Our water recycling and reuse rate for 2020 is above our annual target of 75%. We will provide an update on our progress against this target in our
2020 Sustainability
Report.
Tailings
We are committed to ensuring our tailings storage facilities ("TSFs") meet global best practices for safety. Our TSFs are carefully
engineered and regularly inspected, particularly those in regions with high rainfall and seismic activities.
Barrick currently manages 63 TSFs, of which 21 (33%) are operating, 41 (65%) are closed, and one is inactive. A riverine tailings disposal system was
used at the Porgera Joint Venture in Papua New Guinea prior to entering care and maintenance on April 25, 2020. In 2020, independent reviews were conducted at our Pueblo Viejo, Phoenix, Carlin, Cortez, Hemlo, and Loulo-Gounkoto mines, as well as the
Giant Nickel and Nickel Plate closure sites.
Social
We regard our host communities and countries as important partners in our business. We understand we are guests and want the countries and
communities we operate in to benefit from our presence. We are committed to contributing to their social and economic development. Our sustainability policies also commit us to transparency in our relationships with host communities, government
authorities, the public and other key stakeholders. These policies also commit us to conducting our business with integrity through our absolute opposition to corruption, and requiring our suppliers to operate ethically and responsibly as a
condition of doing business with us.
Our approach to our relationships with our
Indigenous Partners is no different, and we create genuine partnerships that aim to build a long-term positive legacy within our host
communities.
Community and economic development
Our commitment to social and economic development is set out in our overarching Sustainable Development Policy and our Social Performance
Policy.
■Paying our fair share of taxes - The taxes, royalties and dividends we pay provide significant income for our host countries as well as help to fund vital services and
infrastructure. We have introduced a comprehensive tax policy covering governance, management of tax risks, principles of tax planning, compliance and relationship with tax authorities as well as transparency and disclosure. Furthermore, we report
all government and tax payments transparently, primarily through the reporting mechanism of the Canadian Extractive Sector Transparency Measures Act
(“ESTMA”).
■Prioritizing local hiring - The employment opportunities created by our presence is one of our largest social and economic contributions to our host communities and
countries. Our aim is to maximize this contribution. We work to identify and nurture local talent at every level of our business through a range of skills and formal training. We augment this by prioritizing the purchase of goods and services from
local communities and host countries. At the end of 2020, 97% of our workforce and 80% of senior management were nationals from our host countries.
■Prioritizing local buying - We want to maximize the amount of value that stays in our countries of operation. That is why our procurement processes prioritize local
companies, followed by those from the larger region or host country. Over the course of 2020, we procured over $4.4 billion of goods and services from suppliers based in our host countries on a 100% basis.
■Investing in community-led development initiatives - We believe that no one knows the needs of local communities better than the communities themselves. That is why we have been targeting the
establishment of community development committees (“CDCs”) at every operating site - a target that we achieved in 2020. The role of the CDC is to allocate the community investment budget to those projects and initiatives most needed and
desired by local stakeholders. Each CDC is elected and made up of a mix of local leaders, community members as well as representatives from local women and youth groups. In the fourth quarter of 2020, we invested over $13 million in sustainable
community development projects, over and above any Covid-19 initiatives.
Human rights
Respect for human rights is a central part of our sustainability vision. We have zero tolerance for human rights violations wherever we operate. We
avoid causing or contributing to human rights violations and we facilitate access to remedies. Our commitment to respect human rights is codified in our standalone Human Rights Policy and informed by the expectations of the UN Guiding Principles on
Business and Human Rights, the Voluntary Principles on Security and Human Rights, and the OECD Guidelines for Multinational Enterprises.
Our commitments to respect human rights is fulfilled on the ground via our Human Rights Program, the fundamental principles of which
include:
■Monitoring and reporting;
■Due
diligence;
|
|
|
|
|
|
|
|
|
| BARRICK YEAR-END 2020 |
10 |
MANAGEMENT’S DISCUSSION AND
ANALYSIS |
■Training; and
■Disciplinary
action and remedy.
We also
expect the same standards from our suppliers as our Supplier Code of Ethics incorporates human rights provisions.
Responsibility for the oversight and implementation of our human rights compliance program sits with our Group Sustainability Executive, with support
from our Senior Vice President Business Assurance and Risk, and our Human Resources Executive.
During the fourth quarter of 2020, we reviewed and revised several policies and programs related to human rights, most notably our Policy on the
Voluntary Principles for Security and Human Rights and have updated our training program to be more interactive.
Governance
The bedrock of our sustainability strategy is strong governance. Immediately after the Merger, Barrick established the E&S Committee to connect
site-level ownership of our sustainability strategy with the leadership of the Group. It is chaired by the President and Chief Executive Officer and includes: (1) regional Chief Operating Officers; (2) Mine General Managers; (3) Health,
Safety, Environment and Closure Leads; (4) the Group Sustainability Executive; and (5) an independent sustainability consultant in an advisory role. The E&S Committee meets to review our performance across a range of key performance
indicators, and to provide independent oversight and review of sustainability management at each of our Tier One Gold Assets1.
The President and Chief Executive Officer reviews the reports of the E&S Committee with the Board's Corporate Governance & Nominating
Committee on a quarterly basis to oversee the policies and performance of Barrick’s environmental, health and safety, corporate social responsibility, and human rights programs.
Further to the specific focus of the E&S Committee, weekly Executive Committee review meetings allow for the discussion of opportunities and
risks that may help or hinder the Group from achieving its objectives, including climate-related
risks.
Reserves and Resources8
For full details of our mineral reserves and mineral resources, refer to page 136 of the Q4 2020
Report.
Gold
Barrick’s 2020 reserves are estimated using a gold price assumption of $1,200 per ounce and are reported to a rounding standard of two
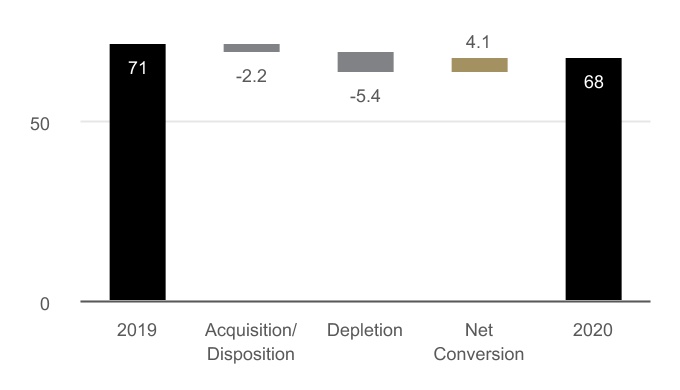
significant digits, both unchanged from 2019. As of December 31, 2020, Barrick’s proven and probable gold reserves were 68 million ounces8 at an average grade of 1.66 g/t, compared to 71 million ounces9 at an average grade of 1.68 g/t in 2019. This year-over-year change reflects the removal of 2.2 million ounces at 3.94 g/t Au from reserves,
due to the disposition of our interest in Massawa in 2020. When excluding the impact of Massawa, reserve replacement was 76% of depletion, with a consistent reserve grade maintained. Similarly, when adjusting for the disposition of Massawa, the net
reduction in reserves year-over-year is approximately 2%.
Reserve replenishment,
net of depletion, was achieved at three of Barrick’s Tier One Gold
Assets1 –
Kibali, Loulo-Gounkoto and Pueblo Viejo. Both Hemlo and North Mara also achieved this milestone, advancing Hemlo down the path to becoming a Tier Two
Gold Asset2, and moving the Bulyanhulu and North Mara mines closer to potential Tier One status as a combined complex. Strong conversion of mineral resources
was delivered, despite the 2020 focus of exploration programs at NGM on geological model updates to drive longer-term resource growth, as well as the impact of the Covid-19 pandemic on drilling activities at
Veladero.
During 2020, the Company converted 4.6 million attributable ounces of
mineral resources to proven and probable reserves, before depletion.
The Africa
& Middle East (“AME”) region converted 2.2 million ounces to attributable reserves, with contributions from Loulo-Gounkoto, Kibali, North Mara and Tongon. At Loulo-Gounkoto, this was principally from extensions at the Yalea, Gara and
Gounkoto underground mines. At Kibali, the KCD underground extensions of the 3000 and 5000 lodes, as well as the new Megi-Marakeke-Sayi open-pit and growth from the existing Sessenge and Pamao open-pits, contributed to this increase. Given the
year-over-year growth from the open-pits, the average grade of reserves at Kibali has decreased from 4.20 g/t Au to 3.84 g/t Au. However, this growth has extended the open-pit mine life at Kibali beyond 10 years, which improves mining
flexibility and provides a more balanced and sustainable blend of open-pit and underground ore over the entire mine life. We aim to achieve a similar optimized and balanced life of mine profile at North Mara, with conversions in 2020 driven by
extensions to the Gokona underground mine and the inclusion of the Gena open-pit pushback. At Tongon, conversion to mineral reserves was from the Djinni satellite pit as well as the pushback extensions to the Southern and Northern Zone pits.
The North America region converted 1.1 million ounces to attributable reserves,
primarily from Carlin, Cortez and Hemlo, before depletion. At Hemlo, the increase in reserves, net of depletion, was driven by conversion drilling at the C Zone and B Zone, which represents the main source of fresh ore feed for the mill. The focus
at Nevada Gold Mines continues to be on geological model updates, which we expect to drive mineral resource growth and potentially, mineral reserves. This strategy has paid dividends in AME, where a strong focus on geological understanding and
resource growth has allowed for continued and sustainable conversion of mineral resources to mineral reserves.
The Latin America & Asia Pacific region converted 1.3 million ounces to attributable reserves, including 1.1 million ounces from Pueblo Viejo.
This reflects only a small portion of a larger indicated resource base that could be potentially converted to mineral reserves following completion of the feasibility study on tailings expansion. For further information on the Pueblo Viejo Process
Plant and Tailings Expansion Project, please refer to the Growth Projects Updates section of this MD&A.
The company-wide conversion of 4.6 million attributable ounces of mineral resources to reserves in 2020 was marginally offset by a decrease following
a review and redesign of mining and modelling parameters at Turquoise Ridge and Bulyanhulu. This equates to a net conversion of 4.1 million ounces in 2020, compared to mining depletion of 5.4 million ounces of attributable reserves.
|
|
|
|
|
|
|
|
|
| BARRICK YEAR-END 2020 |
11 |
MANAGEMENT’S DISCUSSION AND
ANALYSIS |
ATTRIBUTABLE CONTAINED GOLD RESERVES9,10,a (Moz)
a Figures rounded to two significant
digits.
Gold
Resources
In 2020, all mineral resources were estimated using a gold price
assumption of $1,500 per ounce, unchanged from 2019. Barrick’s mineral resources for 2020 continue to be reported on an inclusive basis, incorporating all areas that form mineral reserves, reported at a resource cut-off grade and the assumed
commodity price. All open-pit mineral resources are contained within a Whittle shell, while all underground mineral resources are contained within optimized mining shapes. Excluding the impact of Massawa, Barrick’s total attributable mineral
resources grew in 2020, net of depletion. This growth in total mineral resources is a direct reflection of the Company’s increasing confidence in our geological models, which underpin all our operating business plans. In particular, this
includes both the open-pit and underground mines of the Gokona deposit of North Mara, the Deep West zone of Bulyanhulu and across our portfolio at Nevada Gold Mines. This momentum will be the driver of future improvements in depletion replacement
and mineral reserve conversion in the business.
Growth in total attributable
mineral resources for North America, net of depletion, is encouraging. At Carlin, optimized pit shells at both Gold Quarry and South Arturo delivered year-over-year total open-pit resource growth at consistent grades. Notably at Gold Quarry, the
geological model was further optimized based on process routing options only made possible with the formation of Nevada Gold Mines as the majority of ore is expected to be fed to the Goldstrike roaster. Within Leeville at Carlin, drilling at Rita K
Lower Zone also delivered total mineral resource growth, net of depletion, with further exploration upside to the northwest. At Cortez, total mineral resource growth was principally driven by the Robertson open-pit and to a lesser extent, updated
geological modelling at the Cortez Pits and Goldrush. A portion of inferred resources were upgraded to the indicated category at Robertson, and together with year-over-year total mineral resource growth, supports our plan for the deposit to
contribute meaningfully to Cortez’s production profile starting in 2025. At the Fourmile project, north of Goldrush, 0.47 million ounces was upgraded into the indicated resource category at 10.22 g/t Au, while inferred resources grew to
2.3 million ounces at a slightly higher year-over-year grade of 10.9 g/t Au. For further information on Goldrush and Fourmile, please refer to the Growth Projects Updates section of this
MD&A.
Challenging operating environments throughout Latin America due to the
Covid-19 pandemic impacted
drilling activities in 2020. However, we continued our focus on geological and metallurgical studies to grow our understanding of Veladero,
Pascua-Lama and Del Carmen-Alturas through the year.
Barrick’s resources
are reported to a rounding standard of two significant digits, unchanged from 2019. As of December 31, 2020, Barrick’s attributable measured and indicated resources were 160 million ounces8 at an average grade of 1.52 g/t Au. This compares to measured and indicated resources of 170 million ounces9 at an average grade of 1.55 g/t Au in 2019. Excluding the impact of Massawa, the year-over-year net change in raw attributable measured and
indicated resources is a decrease of 1.5 million ounces, with grades remaining consistent. As of December 31, 2020, Barrick’s attributable inferred resources were 43 million ounces8 at an average grade of 1.4 g/t Au. This compares to inferred resources in 2019 of 39 million ounces9 at an average grade of 1.3 g/t Au. When adjusting for the disposition of Massawa, raw attributable inferred resources increased by 3.9 million
ounces or 10% year-over-year, with grades improving by approximately 5.5% from 2019.
Copper
Copper mineral reserves for 2020 are estimated using a copper price of $2.75 per pound and mineral resources are estimated at $3.50 per pound, both
unchanged from 2019. Copper reserves and resources for 2020 are reported to a rounding standard of two significant digits, also unchanged from 2019.
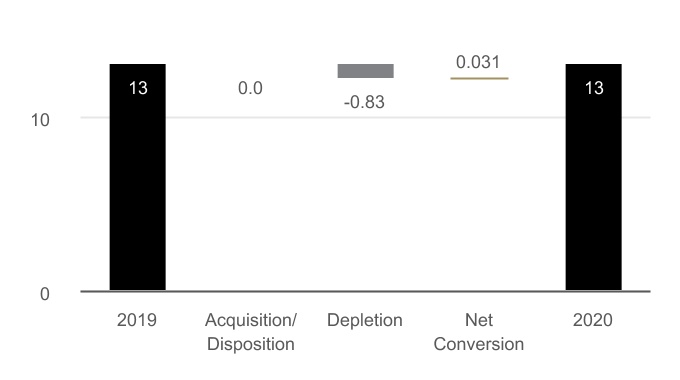
As of December 31, 2020, attributable proven and probable copper mineral reserves were 13 billion pounds8 at an average grade of 0.39%. This compares to 13 billion pounds9 at an average grade of 0.38% in the prior year.
Attributable measured and indicated copper mineral resources were 25 billion pounds8 at an average grade of 0.36%, and inferred copper mineral resources were 2.2 billion pounds8 at an average grade of 0.2% as of December 31, 2020. This compares to prior year attributable measured and indicated copper mineral resources of 26
billion pounds9 at an average grade of 0.38%, and inferred copper mineral resources of 2.2 billion pounds9 at an average grade of 0.2%.
2020 mineral reserves and mineral resources are estimated using the combined value of gold, copper and silver. Accordingly, mineral reserves and
mineral resources are reported for all assets where copper or silver is produced and sold as a primary product or a by-product.
ATTRIBUTABLE CONTAINED COPPER RESERVES9,10,a (Blb)
a Figures rounded to two significant
digits.
|
|
|
|
|
|
|
|
|
| BARRICK YEAR-END 2020 |
12 |
MANAGEMENT’S DISCUSSION AND
ANALYSIS |
Key Business Developments
2020 Highlights
■Captured
the benefit of higher gold prices through disciplined operational execution, driving strong operating cash flow and record free cash flow4;
■Decentralized
and agile management structure ensured that we delivered on our 2020 gold and copper production guidance despite the challenges of Covid-19;
■Strengthened
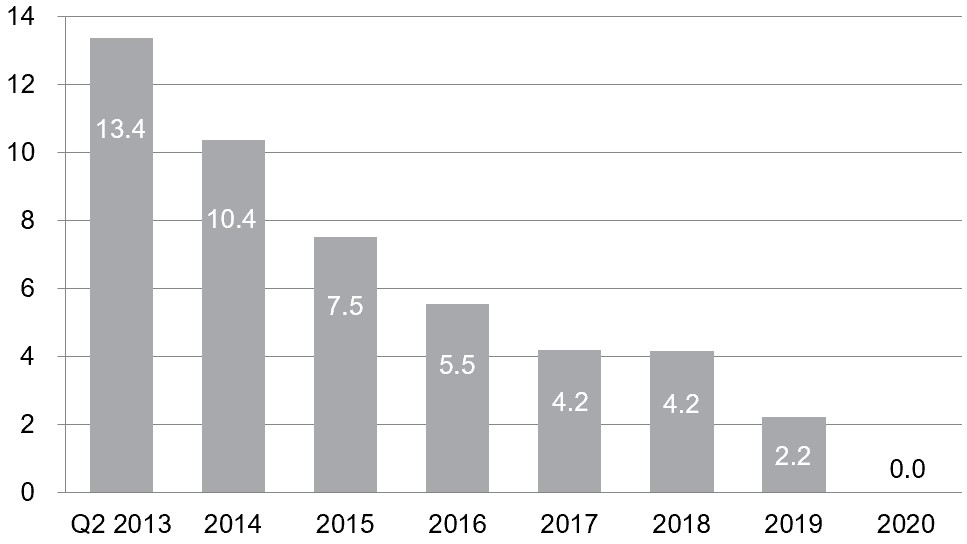
balance sheet, increasing cash by 57% since the prior year and reaching zero debt, net of cash, from a peak of $13.4 billion in 2013;
■Non-core
asset divestiture strategy has delivered in excess of $1.5 billion since it commenced in 2019;
■Increased
shareholder returns, having tripled the quarterly dividend per share since the announcement of the merger with Randgold and proposed a return of capital of $750 million to shareholders over the course of
2021;
■Introduced a 10-year production outlook, highlighting a stable asset base and ability to generate strong cash flow well into the
future;
■Integrated Exploration and Mineral Resource Management (“MRM”) team continued to delineate significant brownfields
expansion potential within and outside our 10-year production outlook, including high-grade resource growth at Fourmile;
■Introduced an
industry-leading sustainability scorecard, designed to ensure transparent ESG reporting that aligns key performance indicators against strategic priorities; and
■Strong
track record of stewardship maintained with zero Class 1 environmental
incidents7, and a significant year-over-year improvement in safety with LTIFR6 and TRIFR6 decreasing by 38% and 29%, respectively.
Covid-19 pandemic
Barrick continues to work closely with our local communities on managing the impacts of the Covid-19 pandemic on our people and our business. Barrick
has a strong culture of caring for the welfare of its employees and the communities. Our well-established prevention practices and procedures, and the experience we gained from dealing with two Ebola outbreaks around our African operations,
has assisted us as we face this new and unprecedented challenge. We have been actively working to support government responses to the Covid-19 pandemic, both financially and using our supply chain to secure key supplies for the benefit of the
communities in which we operate.
Our preference for employing nationals in
the countries where we operate, rather than expatriates, means that we are not dependent upon a workforce traveling to a site on a regular basis from other parts of the globe. We have adopted certain operating procedures to respond to Covid-19, and
to date, our operations have not been significantly impacted by the pandemic with the exception of Veladero, where the government of Argentina implemented a mandatory nationwide quarantine in March 2020. Although this was lifted in April, movement
and social distancing restrictions impacted the remobilization of employees and contractors back to Veladero.
Early and considered actions by management, including social distancing, screening and contact tracing measures have been implemented at all our
sites. This has allowed our sites to continue to produce and sell their production, while keeping our people and local communities safe at the same time. These actions have minimized the
impacts of the pandemic at our operations and facilitated the delivery of strong operating cash flow in 2020.
Our focus on strengthening our balance sheet in recent years has given us the
financial strength to endure any short-term impacts to our operations while supporting our strategy of participating in our industry’s inevitable consolidation. We have $5.2 billion in cash, an undrawn $3.0 billion credit facility and no
significant debt repayments due until 2033, providing us with sufficient liquidity to execute on our strategic goals.
We also recognize the situation remains dynamic; we continue to monitor developments around the world and believe we have positioned Barrick as
best we can to weather the storm and take advantage of any value opportunities should they present themselves.
Return of Capital
We have announced a proposal for a return of capital distribution for shareholder approval at the Annual and Special Meeting on May 4, 2021. This
distribution is derived from a portion of the proceeds from the divestiture of Kalgoorlie Consolidated Gold Mines in November 2019 and from other recent dispositions made by Barrick and its affiliates. It is proposed that the total distribution of
approximately $750 million will be effected in three equal tranches to shareholders of record on dates to be determined in May, August and November 2021.
The proposed return of capital distribution demonstrates Barrick’s commitment to return surplus funds to shareholders as outlined in the
strategy announced at the time of the Merger in September 2018. Since that time, the quarterly dividend has tripled, and this capital distribution further increases returns to
shareholders.
The Board continues to review further returns to shareholders, which
will be balanced and evaluated equally across other capital uses, including disciplined growth and debt management.
Sale of Lagunas Norte
On February 16, 2021, Barrick announced it had entered into an agreement to sell its 100% interest in the Lagunas Norte gold mine in Peru to Boroo
Pte Ltd for total consideration of up to $81 million, with $20 million of upfront cash consideration on closing. Completion of the sale is subject to closing conditions.
Porgera Special Mining Lease Extension
Porgera's Special Mining Lease (“SML”) terminated on August 16, 2019. The Company
applied for a 20-year extension of the SML in June 2017 and has been engaging with the Government of Papua New Guinea on this matter since then. On August 2, 2019, the National Court of Papua New Guinea ruled that the provisions of the
country’s 1992 Mining Act applied to the Porgera gold mine, thus allowing it to continue operating while the application to extend its SML was being considered. Also in 2019, in response to a request from Papua New Guinea Prime Minister
Marape, the Company proposed a benefit-sharing arrangement that would deliver more than half the economic benefits from the Porgera mine to Papua New Guinea stakeholders, including the Government, for the remainder of the life of mine, estimated at
20 years.
On April 24, 2020, Barrick Niugini Limited (“BNL”), the
majority owner and operator of the Porgera joint venture, received a communication from the Government of Papua New Guinea that the SML would not be extended.
|
|
|
|
|
|
|
|
|
| BARRICK YEAR-END 2020 |
13 |
MANAGEMENT’S DISCUSSION AND
ANALYSIS |
The Company believes the Government’s decision not to extend the SML is tantamount to nationalization
without due process and in violation of the Government’s legal obligations to BNL. The Company has been engaged in ongoing discussions with Prime Minister Marape and his Government in light of the potentially catastrophic impact of this
decision for the communities at Porgera and in Enga Province, and for the country as a whole. On October 15, 2020, BNL and Prime Minister Marape issued a joint press release indicating that they had productive discussions toward mutually acceptable
arrangements for a new Porgera partnership to reopen and operate the mine going forward. It further indicated that the parties had agreed in principle that Papua New Guinea will take a major share of equity under the new arrangements and BNL will
retain operatorship and there will be a fair sharing of the economic benefits. Efforts to reach a memorandum of agreement to make these concepts and additional points binding are underway. In the meantime, all legal proceedings continue as discussed
below.
BNL has been pursuing and will pursue all legal avenues to challenge the
Government’s decision and to recover any damages that BNL may suffer as a result of the Government’s decision. Based on the communication received from the Government of Papua New Guinea that the SML would not be extended, Porgera was
placed on temporary care and maintenance on April 25, 2020 to ensure the safety and security of our employees and communities. BNL remains in possession of the mine to conduct care and
maintenance.
On April 28, 2020, BNL filed a Judicial Review action against the
Government of Papua New Guinea in the Papua New Guinea National Court of Justice. Judicial Review is a proceeding that challenges the procedural and constitutional adequacy of government administrative actions. The Judicial Review action seeks to
quash the decision not to extend the SML on the grounds that the Government did not comply with the applicable legal standards and processes.
Trial was set to commence in the Judicial Review action on August 12, 2020. BNL sought leave to appeal two procedural rulings of the National Court
that would affect the trial to the Supreme Court of Papua New Guinea. The Government of Papua New Guinea then asked the National Court to dismiss the Judicial Review action on purely procedural grounds. On September 1, 2020, the Court granted the
Government’s request and dismissed the Judicial Review action. BNL appealed that decision to the Supreme Court on September 7, 2020.
On October 1 and 6, 2020, the Supreme Court reversed the National Court's decision and granted BNL’s appeals of the two procedural rulings. The
Supreme Court has not yet heard BNL’s appeal of the National Court’s dismissal of the Judicial Review action.
On August 25, 2020, the Government of Papua New Guinea purported to grant a new special mining lease covering the Porgera Mine to Kumul Mineral
Holdings Limited (“Kumul”), the state-owned mining company. BNL immediately took administrative steps seeking to force the Government of Papua New Guinea to delay or withdraw the issuance of the special mining lease to Kumul. These
administrative steps were not successful and on September 24, 2020, BNL commenced another Judicial Review action seeking to quash the decision to issue the special mining lease to Kumul. On January 26, 2021, the National Court granted BNL leave for
the Judicial Review. In its decision, the Court declared itself satisfied that there was an arguable case that warrants the grant of the leave.
On July 9, 2020, BNL initiated conciliation proceedings before the World Bank’s International Centre for Settlement of Investment Disputes
(“ICSID”). Through this conciliation, BNL seeks to reach an agreement for the extension of the SML on terms that will be mutually beneficial to the Company and to all Papua New Guinea stakeholders.
Simultaneously with BNL initiating the conciliation proceedings, Barrick (PD)
Australia Pty Limited (“Barrick PD”), the Company’s subsidiary and an investor in the Porgera mine, has given notice to the Government of Papua New Guinea that a dispute has arisen under the Bilateral Investment Treaty
(“BIT”) between Papua New Guinea and Australia, and has referred the dispute to arbitration before the ICSID. Barrick PD seeks to recover damages it has already suffered and damages it may suffer in the future by virtue of the
Government’s wrongful refusal to grant an extension of the SML. The dispute notice expressly invites the Government to engage in consultations and negotiations in an attempt to resolve the investment treaty
dispute.
Our priority remains the health and safety of all our employees and
community stakeholders. Due to the uncertainty related to the timing and scope of future developments on the mine’s operating outlook, we have not included Porgera in our full year 2021 guidance. As this is an evolving situation, we will
reassess on an ongoing basis and provide further updates in due course. Refer to notes 21 and 36 of the 2020 Annual Financial Statements for more information.
Silver sale agreement
Our silver sale agreement with Wheaton requires us to deliver 25% of the life of mine silver production from the Pascua-Lama project once it is
constructed and required delivery of 100% of our silver production from the Lagunas Norte, Pierina and Veladero mines until March 31, 2018. The completion date guarantee under the silver sale agreement for Pascua-Lama was originally December 31,
2015 but was subsequently extended to June 30, 2020. Per the terms of the amended silver sale agreement, if the requirements of the completion guarantee were not satisfied by June 30, 2020, then Wheaton had the right to terminate the agreement
within 90 days of that date, in which case, they would have been entitled to the return of the upfront consideration paid less credit for silver delivered up to the date of that event.
Given that, as of September 28, 2020, Wheaton had not exercised its termination right, a residual liability of $253 million remains due on September
1, 2039 (assuming no future deliveries are made). This residual cash liability was remeasured to $148 million as at September 30, 2020, being the present value of the liability due in 2039 discounted at a rate estimated for comparable liabilities,
including Barrick's outstanding debt. This remeasurement resulted in a gain of $104 million recorded in Other Income in the third quarter of 2020. The liability of $148 million was reclassified from other current liabilities to other non-current
liabilities in the third quarter of 2020 and will be measured at amortized cost in future periods. For further details of the silver sale agreement, refer to notes 3 and 29 of the 2020 Annual Financial
Statements.
|
|
|
|
|
|
|
|
|
| BARRICK YEAR-END 2020 |
14 |
MANAGEMENT’S DISCUSSION AND
ANALYSIS |
Sale of Eskay Creek
On August 4, 2020 Barrick entered into a definitive agreement with Skeena Resources Limited (“Skeena”) pursuant to which Skeena exercised
its option to acquire the Eskay Creek project in British Columbia and Barrick waived its back-in right on the Eskay Creek project. The consideration under the definitive agreement consisted of: (i) the issuance by Skeena of 22,500,000 units (the
“Units”), with each Unit comprising one common share of Skeena and one half of a warrant, with each whole warrant entitling Barrick to purchase one additional common share of Skeena at an exercise price of C$2.70 each until the second
anniversary of the closing date; (ii) the grant of a 1% net smelter return (“NSR”) royalty on the entire Eskay Creek land package; and (iii) a contingent payment of C$15 million payable during a 24-month period after
closing. The transaction closed on October 5, 2020 and we recognized a gain of $59 million for the year ended December 31, 2020. Refer to note 4 to the Financial Statements for more
information.
Sale of
Morila
On November 10, 2020, Barrick and AngloGold Ashanti Limited completed the sale of our
combined 80% interest in the Morila gold mine in Mali to Firefinch Limited (previously Mali Lithium Limited) for $28.8 million cash consideration. The State of Mali continues to hold the remaining 20% of the Morila gold mine. The consideration
received was allocated against the interests that AngloGold Ashanti and Barrick held in Morila, as well as intercompany loans that Barrick held against Morila, and the transaction resulted in a gain for Barrick of $27 million for the year ended
December 31, 2020. Refer to note 4 to the Financial Statements for more information.
Sale of Massawa
On March 4, 2020, Barrick and our Senegalese joint venture partner completed the sale of our aggregate 90% interest in the Massawa project
(“Massawa”) in Senegal to Teranga Gold Corporation (“Teranga”) for total consideration fair valued at $440 million on the date of closing. Barrick received 92.5% of the consideration for its interest in the Massawa project,
with the balance received by Barrick’s local Senegalese partner. Barrick received a net of $256 million in cash and 19,164,403 Teranga common shares (worth $104 million at the date of closing) plus a contingent payment of up to
$46.25 million based on the three-year average gold price, which was valued at $28 million at the date of closing. The cash consideration received was net of $25 million that Barrick provided through its participation in the
$225 million syndicated debt financing facility secured by Teranga in connection with the transaction. Subsequent to year-end, we received full repayment of the outstanding loan. The difference between the fair value of consideration received
and the carrying value of the assets on closing was $54 million and was recognized as a gain in the first quarter of 2020. Refer to note 4 to the Financial Statements for more
information.
Tanzania
On January 24, 2020, Barrick announced that the Company had ratified the creation of Twiga Minerals Corporation (“Twiga”) at a signing
ceremony with the President of Tanzania, formalizing the establishment of a joint venture between Barrick and the GoT and resolution of all outstanding disputes between Barrick and the GoT, including the lifting of the previous concentrate export
ban, effective immediately. Effective January 1, 2020, the GoT
received a free carried shareholding of 16% in each of our Tanzanian mines (Bulyanhulu, Buzwagi and North Mara), a 16% interest in the shareholder
loans owed by the operating companies and will receive half of the economic benefits from the Tanzanian operations in the form of taxes, royalties, clearing fees and participation in all cash distributions made by the mines and Twiga, after the
recoupment of capital investments.
The terms of the signed agreement are
consistent with those previously announced, including the payment of $300 million to settle all outstanding tax and other disputes (the “Settlement Payment”); the lifting of the concentrate export ban; the sharing of future
economic benefits from the mines on a 50/50 basis; and a dispute resolution mechanism that provides for binding international arbitration. The 50/50 division of economic benefits will be maintained through an annual true-up mechanism,
which is exclusive of the Settlement Payment.
Barrick and the GoT continue
efforts to fulfill their respective obligations to satisfy all conditions of the signed agreement, primarily with respect to the execution and delivery of formal termination documents for the settlement of all outstanding disputes between the two
parties. In the second quarter of 2020, exports of the concentrate stockpiled in Tanzania commenced and we began recognizing these sales in revenue and cost of sales. We subsequently completed the export of the remaining stockpiled concentrate
during the third quarter of 2020. As a result, we made a payment of $100 million to the GoT, representing the first installment of the Settlement Payment, in the second quarter of 2020, reducing the previously recorded Settlement Payment liability
of $300 million on the balance sheet.
Operating results for the Tanzanian mines
are included at 84% from January 1, 2020. We recognized a net impairment reversal of $91 million ($304 million before tax) resulting from the agreement with the GoT being made effective in the first quarter of 2020. Refer to note 21 to the
Financial Statements for more information.
Partial Monetization of
Investment in Shandong Gold
In June 2020, we sold 79,268,800 shares of Shandong Gold Mining Co.,
Ltd. (“Shandong Gold”), for gross proceeds of approximately $210 million. Barrick continues to hold 10,250,000 shares of Shandong Gold, representing a 2.05% interest in Shandong Gold’s Hong-Kong listed (H-class) shares,
re-affirming its commitment to the strong existing long-term strategic partnership between the two companies.
Debt Management
On January 31, 2020, Barrick paid $356 million, including $4 million of accrued and unpaid interest, to complete a make-whole repurchase of the $337
million of outstanding principal on our 3.85% Notes due April 2022. A loss on debt extinguishment of $15 million was recorded in the first quarter of 2020. The debt repayment is expected to result in an annualized interest saving of $13
million.
In October 2020, Moody’s Investors Service
(“Moody’s”) upgraded Barrick’s senior unsecured ratings to Baa1 from Baa2 while maintaining a stable
outlook.
|
|
|
|
|
|
|
|
|
| BARRICK YEAR-END 2020 |
15 |
MANAGEMENT’S DISCUSSION AND
ANALYSIS |
Outlook for 2021
Operating Division Guidance
Our 2020 actual gold and copper production, cost of sales, total cash costs4, all-in sustaining costs4 and 2021 forecast gold and copper production, cost of sales, total cash costs4 and all-in sustaining costs4 ranges by operating division are as follows:
|
|
|
|
|
|
|
|
|
|
|
|
|
|
|
|
|
|
|
|
|
|
|
|
|
|
|
| Operating Division |
2020 attributable production (000s ozs) |
2020 cost of salesa ($/oz) |
2020 total cash costsb
($/oz) |
2020 all-in sustaining
costsb
($/oz) |
2021 forecast attributable production (000s ozs) |
2021 forecast cost of salesa ($/oz) |
2021 forecast total cash
costsb ($/oz) |
2021 forecast all-in sustaining
costsb ($/oz) |
| Gold |
|
|
|
|
|
|
|
|
Carlin (61.5%)c |
1,024 |
976 |
790 |
1,041 |
940 - 1,000 |
920 - 970 |
740 - 790 |
1,050 - 1,100 |
| Cortez (61.5%) |
491 |
957 |
678 |
998 |
500 - 550 |
1,000 - 1,050 |
700 - 750 |
940 - 990 |
| Turquoise Ridge (61.5%) |
330 |
1,064 |
711 |
798 |
390 - 440 |
950 - 1,000 |
620 - 670 |
810 - 860 |
| Phoenix (61.5%) |
126 |
1,772 |
649 |
814 |
100 - 120 |
1,800 - 1,850 |
725 - 775 |
970 - 1,020 |
| Long Canyon (61.5%) |
160 |
869 |
236 |
405 |
140 - 160 |
800 - 850 |
180 - 230 |
240 - 290 |
| Nevada Gold Mines
(61.5%) |
2,131 |
1,029 |
702 |
941 |
2,100 - 2,250 |
980 - 1,030 |
660 - 710 |
910 - 960 |
| Hemlo |
223 |
1,256 |
1,056 |
1,423 |
200 - 220 |
1,200 - 1,250 |
950 - 1,000 |
1,280 - 1,330 |
| North America |
2,354 |
1,050 |
735 |
987 |
2,300 - 2,450 |
990 - 1,040 |
690 - 740 |
940 - 990 |
|
|
|
|
|
|
|
|
|
| Pueblo Viejo (60%) |
542 |
819 |
504 |
660 |
470 - 510 |
880 - 930 |
520 - 570 |
760 - 810 |
| Veladero (50%) |
226 |
1,151 |
748 |
1,308 |
130 - 150 |
1,510 - 1,560 |
820 - 870 |
1,720 - 1,770 |
Porgera (47.5%)d |
86 |
1,225 |
928 |
1,115 |
— |
— |
— |
— |
|
|
|
|
|
|
|
|
|
| Latin America & Asia
Pacific |
854 |
938 |
604 |
856 |
600 - 660 |
1,050 - 1,100 |
600 - 650 |
1,000 - 1,050 |
|
|
|
|
|
|
|
|
|
| Loulo-Gounkoto (80%) |
544 |
1,060 |
666 |
1,006 |
510 - 560 |
980 - 1,030 |
630 - 680 |
930 - 980 |
| Kibali (45%) |
364 |
1,091 |
608 |
778 |
350 - 380 |
990 - 1,040 |
590 - 640 |
800 - 850 |
| North Mara (84%) |
261 |
992 |
702 |
929 |
240 - 270 |
970 - 1,020 |
740 - 790 |
960 - 1,010 |
| Tongon (89.7%) |
255 |
1,334 |
747 |
791 |
180 - 200 |
1,470 - 1,520 |
1,000 - 1,050 |
1,140 - 1,190 |
| Bulyanhulu (84%) |
44 |
1,499 |
832 |
895 |
170 - 200 |
980 - 1,030 |
580 - 630 |
810 - 860 |
| Buzwagi (84%) |
84 |
1,021 |
859 |
871 |
30 - 40 |
1,360 - 1,410 |
1,250 - 1,300 |
1,230 - 1,280 |
| Africa & Middle East |
1,552 |
1,119 |
701 |
893 |
1,500 - 1,600 |
1,050 - 1,100 |
690 - 740 |
920 - 970 |
|
|
|
|
|
|
|
|
|
Total Attributable to
Barricke,f,g |
4,760 |
1,056 |
699 |
967 |
4,400 - 4,700 |
1,020 - 1,070 |
680 - 730 |
970 - 1,020 |
|
|
|
|
|
|
|
|
|
| |
2020 attributable production (M lbs) |
2020 cost of salesa ($/lb) |
2020 C1 cash costsb ($/lb) |
2020 all-in sustaining
costsb
($/lb) |
2021 forecast attributable production
(M lbs) |
2021 forecast cost of salesa ($/lb) |
2021 forecast C1 cash costsb ($/lb) |
2021 forecast all-in sustaining
costsb ($/lb) |
| Copper |
|
|
|
|
|
|
|
|
| Lumwana |
276 |
2.01 |
1.56 |
2.43 |
250 - 280 |
1.85 - 2.05 |
1.45 - 1.65 |
2.25 - 2.45 |
| Zaldívar (50%) |
106 |
2.46 |
1.79 |
2.25 |
90 - 110 |
2.30 - 2.50 |
1.65 - 1.85 |
1.90 - 2.10 |
| Jabal
Sayid (50%) |
75 |
1.42 |
1.11 |
1.24 |
70 - 80 |
1.40 - 1.60 |
1.10 - 1.30 |
1.30 - 1.50 |
Total
Copperg |
457
|
2.02
|
1.54
|
2.23
|
410
- 460 |
1.90 -
2.10 |
1.40 -
1.60 |
2.00 -
2.20 |
a.Cost of sales applicable to gold per ounce is calculated using cost of sales applicable to gold on an attributable basis
(removing the non-controlling interest of 38.5% of Nevada Gold Mines (including 63.1% of South Arturo), 40% of Pueblo Viejo, 20% of Loulo-Gounkoto, 10.3% of Tongon, and 16% of North Mara, Bulyanhulu and Buzwagi from cost of sales and including our
proportionate share of cost of sales attributable to our equity method investment in Kibali), divided by attributable gold ounces sold. Cost of sales applicable to copper per pound is calculated using cost of sales applicable to copper including our
proportionate share of cost of sales attributable to our equity method investments in Zaldívar and Jabal Sayid, divided by consolidated copper pounds sold (including our proportionate share of copper pounds sold from our equity method
investments).
b.Total cash costs, all-in sustaining costs and C1 cash costs are non-GAAP financial performance measures with no standardized
meaning under IFRS and therefore may not be comparable to similar measures of performance presented by other issuers. For further information and a detailed reconciliation of the non-GAAP measures used in this section of the MD&A to the most
directly comparable IFRS measures, please see pages 96 to 122 of this MD&A.
c.Includes
our 36.9% share of South Arturo.
d.Based on the communication we received from the Government of Papua New Guinea that the SML will not be extended, Porgera was
placed on temporary care and maintenance on April 25, 2020 to ensure the safety and security of our employees and communities. Due to the uncertainty related to the timing and scope of future developments on the mine’s operating outlook, 2021
guidance for Porgera has not been included.
e.Total cash costs and all-in sustaining costs per ounce include costs allocated to non-operating
sites.
f.Operating division guidance ranges reflect expectations at each individual operating division, and may not add up to the
company-wide guidance range total. The company-wide 2020 results and 2021 guidance ranges exclude Pierina, Lagunas Norte, and Golden Sunlight, which are mining incidental ounces as they enter
closure.
g.Includes corporate administration costs.
|
|
|
|
|
|
|
|
|
| BARRICK YEAR-END 2020 |
16 |
MANAGEMENT’S DISCUSSION AND
ANALYSIS |
Operating Division, Consolidated Expense and Capital Guidance
Our 2020 actual gold and copper production, cost of sales, total cash costs4, all-in sustaining costs4, consolidated expenses and capital expenditures and 2021 forecast gold and copper production, cost of sales, total cash costs4, all-in sustaining costs4, consolidated expenses and capital expenditures are as follows:
|
|
|
|
|
|
|
|
|
|
|
|
|
| ($ millions, except per ounce/pound
data) |
|
2020 Guidancea |
2020 Actual |
2021 Guidancea |
| Gold production |
|
|
|
|
| Production (millions of ounces) |
|
4.60 - 5.00 |
4,760 |
4.40 - 4.70 |
| Gold cost metrics |
|
|
|
|
| Cost of sales - gold ($ per oz) |
|
980 - 1,030 |
1,056 |
1,020 - 1,070 |
Total cash costs ($ per
oz)b |
|
650 - 700 |
699 |
680 - 730 |
| Depreciation ($ per oz) |
|
300 - 330 |
326 |
300 - 330 |
All-in sustaining costs ($ per
oz)b |
|
920 - 970 |
967 |
970 - 1,020 |
| Copper production |
|
|
|
|
| Production (millions of pounds) |
|
440 - 500 |
457 |
410 - 460 |
| Copper cost metrics |
|
|
|
|
| Cost of sales - copper ($ per lb) |
|
2.10 - 2.40 |
2.02 |
1.90 - 2.10 |
C1 cash costs ($ per
lb)b |
|
1.50 - 1.80 |
1.54 |
1.40 - 1.60 |
| Depreciation ($ per lb) |
|
0.60 - 0.70 |
0.67 |
0.60 - 0.70 |
All-in sustaining costs
($ per lb)b |
|
2.20 - 2.50 |
2.23 |
2.00 - 2.20 |
| Exploration and project
expenses |
|
280 - 320 |
295 |
280 - 320 |
| Exploration and evaluation |
|
210 - 230 |
222 |
230 - 250 |
| Project expenses |
|
70 - 90 |
73 |
50 - 70 |
| General and administrative expenses |
|
~170 |
185 |
~190 |
| Corporate administration |
|
~130 |
118 |
~130 |
Stock-based
compensationc |
|
~40 |
67 |
~60 |
|
|
|
|
|
| Other expense (income) |
|
80 - 100 |
(178) |
80 - 100 |
| Finance costs, net |
|
400 - 450 |
347 |
330 - 370 |
| Attributable capital expenditures: |
|
|
|
|
| Attributable minesite sustaining |
|
1,300 - 1,500 |
1,277 |
1,250 - 1,450 |
| Attributable project |
|
300 - 400 |
374 |
550 - 650 |
Total attributable capital
expendituresd |
|
1,600 - 1,900 |
1,651 |
1,800 -
2,100 |
a.Based on the
communication we received from the Government of Papua New Guinea that the SML will not be extended, Porgera was placed on temporary care and maintenance on April 25, 2020. Due to the uncertainty related to the timing and scope of future
developments on the mine’s operating outlook, full year 2020 guidance for Porgera was withdrawn, as detailed in Barrick’s Q1 2020 Report issued on May 6, 2020. Exclusively due to this development at Porgera, 2020 gold production for the
Company was adjusted to 4.6 to 5.0 million ounces (from 4.8 to 5.2 million ounces previously). All remaining guidance metrics for 2020 were unchanged. In addition, 2021 guidance excludes Porgera. Separately, 2020 guidance was based on a gold price
assumption of $1,350 per ounce. This compares to the $1,700 per ounce gold price assumption used for 2021, which results in a higher year-over-year expectation for royalty expenses and therefore, our per ounce cost metrics.
b.Total cash costs, all-in sustaining costs and C1 cash costs are non-GAAP financial performance measures with no standardized
meaning under IFRS and therefore may not be comparable to similar measures of performance presented by other issuers. For further information and a detailed reconciliation of the non-GAAP measures used in this section of the MD&A to the most
directly comparable IFRS measures, please see pages 96 to 122 of this
MD&A.
c.2020 actual results are based on a US$22.78 share price and 2021 guidance is based on a one-month trailing average ending
December 31, 2020 of US$23.27 per
share.
d.Attributable
capital expenditures are presented on the same basis as guidance, which includes our 61.5% share of Nevada Gold Mines, our 60% share of Pueblo Viejo, our 80% share of Loulo-Gounkoto, our 89.7% share of Tongon, our 84% share of North Mara,
Bulyanhulu and Buzwagi and our 50% share of Zaldívar and Jabal Sayid.
|
|
|
|
|
|
|
|
|
| BARRICK YEAR-END 2020 |
17 |
MANAGEMENT’S DISCUSSION AND
ANALYSIS |
2021 Guidance Analysis
Estimates of future production, cost of sales, and total cash costs4 presented in this MD&A are based on mine plans that reflect the expected method by which we will mine reserves at each
site. Actual gold and copper production and associated costs may vary from these estimates due to a number of operational and non-operational risk factors (see the “Cautionary Statement on Forward-Looking Information” on page 24 of this
MD&A for a description of certain risk factors that could cause actual results to differ materially from these estimates).
Gold Production
We expect 2021 gold production to be in the range of 4.4 to 4.7 million ounces, anchored by stable year-over-year performance from our North
America and Africa & Middle East regions. Five of our six Tier One Gold
Assets1 are located across these two regions, highlighting the importance of a world-class asset base in delivering consistent performance with the
potential for significant brownfields expansion and new discoveries.
Our 2021
gold production guidance currently excludes Porgera. This is due to the uncertainty related to the timing and scope of future operations at Porgera following the decision to place the mine on temporary care and maintenance on April 25, 2020 to
ensure the safety and security of our employees and communities. As this is an evolving situation, we will re-assess on an ongoing basis and provide further updates in due course. We remain in constructive discussions with the Government of Papua
New Guinea and are optimistic about finding a solution to allow operations at Porgera to resume in 2021.
As previously disclosed, the response to the Covid-19 pandemic in Argentina temporarily delayed the construction and commissioning of the Phase 6
leach pad at Veladero in 2020. As the operation now transitions to Phase 6, which is on-track for commissioning by the end of the first half of 2021, the focus at Veladero will be on ensuring the delivery of our optimized 10-year plan including the
start of the Cuatro Esquinas pit pushback and the acceleration of brownfields and infill drilling. We continue to expect stronger performance at Veladero in the second half of 2021 after commissioning of Phase 6, as heap leach processing operations
will be reduced during the transition phase.
In addition to this event at
Veladero, the Company’s gold production in the second half of 2021 is expected to be slightly higher than the first half. This is mainly driven by mine sequencing at Nevada Gold Mines as well as the ramp-up of underground mining and processing
operations at Bulyanhulu. This is partially offset by Buzwagi, which is expected to enter care and maintenance starting from the third quarter of 2021, in line with previous
disclosures.
Gold Cost of Sales per Ounce5
On a per ounce basis, cost of sales applicable to gold5, after removing the portion related to non-controlling interests, is expected to be in the range of $1,020 to $1,070 per ounce in 2021, compared to
the 2020 actual result of $1,056 per ounce.
The expected increase compared to the
2020 guidance range reflects higher royalty expenses due to the increase in our gold price assumption to $1,700 per ounce for 2021 (from $1,350 per ounce used for our 2020 guidance), as well as changes in the expected sales mix as
described further in the “Gold Total Cash Costs per Ounce4” section below.
Gold Total Cash Costs per Ounce4
Total cash costs per ounce4 are expected to be in the range of $680 to $730 per ounce, compared to the 2020 actual result of $699 per ounce.
The expected increase compared to the 2020 guidance range reflects higher royalty
expenses due to the increase in our gold price assumption to $1,700 per ounce for 2021 (from $1,350 per ounce used for our 2020 guidance), as well as changes in the expected sales mix.
In North America, our 2021 guidance for total cash costs per ounce4 for Nevada Gold Mines of $660 to $710 compares to the 2020 actual result of $702 per ounce. This expectation of lower costs is driven by the benefit
of continued performance improvement at Turquoise Ridge, which is a higher-grade operation and has a comparatively lower cost structure. At Hemlo, total cash costs per ounce4 are also expected to improve relative to 2020, largely driven by lower royalty expenses due to a change in sales mix (using our assumed gold price),
the ramp-up in underground performance and improved mining flexibility as a result of access from the new portal to the Upper C Zone in the third quarter of 2021.
In Latin America & Asia Pacific, total cash costs per ounce4 at Pueblo Viejo are expected to be higher in 2021 due to lower grades compared to the prior year. This is in line with the mine and stockpile
processing plan at Pueblo Viejo, as we advance development of the plant and tailings expansion project. At Veladero, the expected higher year-over-year total cash costs per ounce4 is mainly driven by the transition to Phase 6 described above.
In Africa & Middle East, total cash costs per ounce4 at both Loulo-Gounkoto and Kibali in 2021 are expected to be consistent with prior year performance, reflecting their status as Tier One Gold
Assets1. While total cash costs per ounce4 at Bulyanhulu are expected to improve year-over-year based on the ramp-up of underground mining and processing of fresh ore, we expect higher costs
at North Mara due to mill feed sequencing. As previously disclosed, we have extended the life of mine at Tongon with the prospect of further optionality from our exploration programs, resulting in a lower year-over-year production profile starting
from 2021 at a higher total cash costs per ounce4. At Buzwagi, the expected increase in total cash costs per ounce4 reflects the end of the life of this mine and the expectation that the mine will enter care and maintenance from the third quarter of 2021.
Gold All-In Sustaining Costs per Ounce4
All-in sustaining costs per ounce4 in 2021 are expected to be in the range of $970 to $1,020 per ounce, compared to the 2020 actual result of $967 per ounce. This is based on the
expectation that minesite sustaining capital expenditures on a per ounce basis will be higher (refer to Capital Expenditure commentary below for further detail).
The expected increase compared to the 2020 guidance range also reflects higher royalty expenses due to the increase in our gold price assumption to
$1,700 per ounce for 2021 (from $1,350 per ounce used for our 2020 guidance), as well as changes in the expected sales mix as described in the Gold Total Cash Costs per Ounce4
section.
|
|
|
|
|
|
|
|
|
| BARRICK YEAR-END 2020 |
18 |
MANAGEMENT’S DISCUSSION AND
ANALYSIS |
Copper Production and Costs
We expect 2021 copper production to be in the range of 410 to 460 million pounds, compared to actual production of 457 million pounds in 2020.
Production in the second half of 2021 is expected to be stronger than the first half, with higher grades expected from Lumwana and major maintenance at Zaldívar scheduled in the second quarter of 2021.
In 2021, cost of sales applicable to copper5 is expected to be in the range of $1.90 to $2.10 per pound, in line with the actual result of $2.02 per pound for 2020. C1 cash costs per
pound4 guidance of $1.40 to $1.60 per pound for 2021 is also in line with the 2020 actual result of $1.54 per pound. Copper all-in sustaining costs per
pound4 guidance of $2.00 to $2.20 for 2021 represents an improvement from the actual result of $2.23 in
2020.
Exploration and
Project Expenses
We expect to incur approximately $280 to $320 million of exploration and project
expenses in 2021. This is unchanged from our 2020 guidance range and compares to the 2020 actual result of $295 million.
Within this range, we expect our exploration and evaluation expenditures in 2021 to be approximately $230 to $250 million. This is marginally higher
than the 2020 actual result of $222 million based on the expectation of increased minesite exploration and evaluation expenditures with the aim of allowing us to improve our resource and reserve conversion over the coming
years.
We also expect to incur approximately $50 to $70 million of project
expenses in 2021, compared to $73 million in 2020. Project expenses are mainly related to the ongoing site costs at Pascua-Lama as well as project evaluation costs across our portfolio.
General and Administrative
Expenses
In 2021, we expect corporate administration costs to be approximately $130 million,
unchanged from our 2020 guidance, and an expected increase of $12 million compared to actual 2020 costs, as we expect travel and office expenses to return to pre-pandemic levels.
Separately, stock-based compensation expense in 2021 is expected to be approximately $60 million based on a share price assumption of
$23.27.
Finance Costs,
Net
In 2021, net finance costs of $330 to $370 million primarily represents interest expense on
long-term debt, non-cash interest expense relating to the gold and silver streaming agreements at Pueblo Viejo, and accretion, net of finance income. This guidance for 2021 is consistent with the actual 2020 result of $347
million.
Capital Expenditures
Total attributable gold and copper capital expenditures for 2021 are expected to be in the range of $1,800 to $2,100 million. As expected and
previously disclosed, this guidance for 2021 includes capital expenditures deferred from 2020 as a result of quarantine and movement restrictions in response to the Covid-19 pandemic.
We continue to focus on the delivery of our project capital pipeline and expect attributable project capital expenditures to be in the range of $550
to $650 million in 2021, compared to actual expenditures of $374 million in 2020. The expected increase is mainly driven by the ramp-up of construction activities for the plant and tailings expansion project at Pueblo Viejo and to a lesser
extent, the development of the Zaldívar Chloride Leach Project and the third underground mine at Loulo-Gounkoto. The remainder of expected project capital expenditures is mainly related to underground development and infrastructure at Goldrush,
the third shaft project at Turquoise Ridge, the ramp-up of underground mining and processing operations at Bulyanhulu and our investment in water management initiatives and a paste backfill plant at North
Mara.
Attributable minesite sustaining capital expenditures in 2021 are expected
to be in the range of $1,250 to $1,450 million, which is a slight reduction on the guidance range for 2020, and compares to the actual spend for 2020 of $1,277 million. The guidance range for 2021 partially reflects the deferral of capital
expenditures from 2020 due to the impact of the Covid-19 pandemic, including the Phase 6 leach pad expansion at Veladero, as described in the “Gold Production” section above. In addition to this, compared to the prior year, minesite
sustaining capital expenditures in 2021 are expected to increase at both Bulyanhulu and Turquoise Ridge due to underground development, at Carlin due to increased underground development and process facility improvements, at Tongon related to the
life of mine extension and at Kibali due to higher capitalized stripping.
Effective Income Tax Rate
Based on a gold price assumption of $1,700/oz, our expected effective tax rate range for 2021 is 28% to 34%. The rate is sensitive to the
relative proportion of sales in high versus low tax jurisdictions, realized gold and copper prices, the proportion of income from our equity accounted investments and the level of non-tax affected costs in countries where we generate net losses.
Outlook
Assumptions and Economic Sensitivity Analysis
|
|
|
|
|
|
|
|
|
|
|
|
|
|
|
|
| |
2021 Guidance
Assumption |
Hypothetical
Change |
Impact on EBITDAa (millions) |
|
Impact on TCC, C1 Cash Costs and AISCa |
| |
| Gold price sensitivity |
$1,700/oz |
+/- $100/oz |
‘
+/-$620 |
|
‘
+/-$4/oz |
| Copper price
sensitivity |
$2.75/lb |
‘
+/-$0.25/lb |
‘
+/- $60 |
|
‘
+/-$0.01/lb |
|
|
|
|
|
|
|
|
|
|
|
|
|
|
|
|
|
|
|
|
|
|
|
|
|
|
|
|
|
|
|
|
|
|
|
|
|
|
|
|
|
|
|
|
|
|
|
|
|
|
|
|
|
|
|
|
|
|
|
|
a.EBITDA, total cash costs, C1 cash costs and and all-in sustaining costs are non-GAAP financial performance measures with no
standardized definition under IFRS. For further information and a detailed reconciliation, please see pages 96 to 122 of this
MD&A.
|
|
|
|
|
|
|
|
|
| BARRICK YEAR-END 2020 |
19 |
MANAGEMENT’S DISCUSSION AND
ANALYSIS |
Risks and Risk
Management
Overview
The ability to deliver on our vision, strategic objectives and operating guidance depends on our ability to understand and appropriately respond to
the uncertainties or “risks” we face that may prevent us from achieving our objectives. In order to achieve this we:
■Maintain
a framework that permits us to manage risk effectively and in a manner that creates the greatest value;
■Integrate a
process for managing risk into all our important decision-making processes so that we reduce the effect of uncertainty on achieving our objectives;
■Actively
monitor key controls we rely on to achieve the Company’s objectives so that they remain in place and are effective at all times; and
■Provide
assurance to senior management and relevant committees of the Board on the effectiveness of key control activities.
Board and Committee Oversight
We maintain strong risk oversight practices, with responsibilities outlined in the mandates of the Board and related committees. The Board’s
mandate is clear on its responsibility for reviewing and discussing with management the processes used to assess and manage risk, including the identification by management of the principal risks of the business, and the implementation of
appropriate systems to deal with such risks.
The Audit & Risk Committee
assists the Board in overseeing the Company’s management of principal risks and the implementation of policies and standards for monitoring and modifying such risks, as well as monitoring and reviewing the Company’s financial position
and financial risk management programs. The Corporate Governance & Nominating Committee assists the Board in overseeing the Company’s policies and performance for its environmental, health and safety, corporate social responsibility and
human rights programs.
Management Oversight
Our weekly Executive Committee Review is the main forum for senior management to raise and discuss risks facing the operations and organization more
broadly. At regularly scheduled meetings, the Board and the Audit & Risk Committee are provided with updates on the key issues identified by management at these weekly
sessions.
Principal
Risks
The following subsections describe some of our key sources of uncertainty and most important
risk modification activities. The risks described below are not the only ones facing Barrick. Our business is subject to inherent risks in financial, regulatory, strategic and operational areas. For a more comprehensive discussion of those inherent
risks, see “Risk Factors” in our most recent Form 40-F/Annual Information Form on file with the SEC and Canadian provincial securities regulatory authorities. Also see the “Cautionary Statement on Forward-Looking
Information” on page 24 of this MD&A.
Financial position and liquidity
Our liquidity profile, level of indebtedness and credit ratings are all factors in our ability to meet short-and long-term financial demands.
Barrick’s outstanding debt balances
impact liquidity through scheduled interest and principal repayments and the results of leverage ratio calculations, which could influence our
investment grade credit ratings and ability to access capital markets. In addition, our ability to draw on our credit facility is subject to meeting its covenants. Our primary source of liquidity is our operating cash flow, which is dependent on the
ability of our operations to deliver projected future cash flows. The ability of our operations to deliver projected future cash flows, as well as future changes in gold and copper market prices, either favorable or unfavorable, will continue to
have a material impact on our cash flow and
liquidity.
Key risk modification
activities:
■Continued focus on generating positive free cash flow by improving the underlying cost structures of our operations in a
sustainable manner;
■Disciplined capital allocation criteria for all investments, to ensure a high degree of consistency and rigor is applied to all
capital allocation decisions based on a comprehensive understanding of risk and reward;
■Preparation
of budgets and forecasts to understand the impact of different price scenarios on liquidity, and formulate appropriate strategies;
■Review
of debt and net debt levels to ensure appropriate leverage and monitor the market for liability management opportunities; and
■Other
options available to the Company to enhance liquidity include drawing on our $3.0 billion undrawn credit facility, asset sales, joint ventures, or the issuance of debt or equity
securities.
Improving free cash flow4 and costs
Our ability to improve productivity, drive down operating costs and reduce working capital remains a focus in 2021 and is subject to several sources
of uncertainty. This includes our ability to achieve and maintain industry-leading margins by improving the productivity and efficiency of our operations through automation.
Key risk modification
activities:
■Maximizing the benefit of higher gold prices through agile management and operational execution;
■Weekly Executive Committee Review to identify, assess and respond to risks in a timely
manner;
■Enabling simplification and agile decision making through unification of business systems; and
■A flat, operationally focused, agile management structure with a tenet in ownership
culture.
Social license to operate
At Barrick, we are committed to building, operating, and closing our mines in a safe and responsible manner. To do this, we seek to build trust-based
partnerships with host governments and local communities to drive shared long-term value while working to minimize the social and environmental impacts of our activities. Geopolitical risks such as resource nationalism and incidents of corruption
are inherent in the business of a company operating globally. Past environmental incidents in the extractive industry highlight the hazards (e.g., water management, tailings storage facilities, etc.) and the potential consequences to the
environment, community health and safety. Our ability to maintain compliance with regulatory and community obligations in order to protect the
|
|
|
|
|
|
|
|
|
| BARRICK YEAR-END 2020 |
20 |
MANAGEMENT’S DISCUSSION AND
ANALYSIS |
environment and our host communities alike remains one of our top priorities. Barrick also recognizes climate
change as an area of risk requiring specific focus.
Key risk modification activities:
■Our
commitment to responsible mining is supported by a robust governance framework, including an overarching Sustainable Development Policy and related policies in the areas of Biodiversity, Social Performance, Occupational Health and Safety,
Environment and Human Rights;
■Implementation of an ESG scorecard to track our sustainability performance using key performance indicators aligned to priority
areas set out in our strategy;
■Mandatory training on our Code of Business Conduct and Ethics as well as supporting policies which set out the ethical behavior
expected of everyone working at, or with,
Barrick;
■We take a partnership approach with our host governments. This means we work to balance our own interests and priorities with
those of our government partners, working to ensure that everyone derives real value from our operations;
■We open
our social and environmental performance to third-party scrutiny, including through the ISO 14001 re-certification process, International Cyanide Management Code audits, and annual human rights impact assessments;
■Our climate change strategy has three pillars: Identify, understand and mitigate the risks associated with climate
change; Measure and reduce our impacts on climate change; and Improve our disclosure on climate change;
■We
established site-specific emergency response plans as well as regional crisis management plans to manage any manifestation of Covid-19 in or near our mines globally;
and
■We continuously review and update our closure plans and cost estimates to plan for environmentally responsible closure and
monitoring of
operations.
Resources and
reserves and production outlook
Like any mining company, we face the risk that we are unable to
discover or acquire new resources or that we do not convert resources into production. As we move into 2021 and beyond, our overriding objective of growing free cash flow per share continues to be underpinned by a strong pipeline of organic projects
and minesite expansion opportunities in our core regions. Uncertainty related to these and other opportunities exists (potentially both favorable and unfavorable) due to the speculative nature of mineral exploration and development as well as the
potential for increased costs, delays, suspensions and technical challenges associated with the construction of capital projects.
Key risk modification activities:
■Focus on
responsible mineral resource management, continuously improve ore body knowledge, and add to reserves and resources;
■Grow and
invest in a portfolio of Tier One Gold Assets1, Tier Two Gold Assets and Strategic Assets2 with an emphasis on organic growth to leverage our existing footprint;
and
■Invest in exploration across extensive land positions in many of the world’s most prolific gold
districts.
Market Overview
The market prices of gold and, to a lesser extent, copper are the primary drivers of our profitability and our ability to generate free cash
flow4 for our shareholders.
Gold
The price of gold is subject to volatile price movements over short periods of time and is affected by numerous industry and macroeconomic factors.
During 2020, the gold price ranged from $1,452 per ounce to an all-time high of $2,075 per ounce. The average market price for the year of $1,770 per ounce represented an increase of 27% versus 2019.
AVERAGE MONTHLY SPOT GOLD PRICES
(dollars per ounce)
The price of gold rose significantly during the middle part of the year, reaching an all-time high in August. During the year, the gold price rose as
a result of the financial impacts of Covid-19, including global economic uncertainty, the expected longer-term effects of fiscal and monetary stimulus measures, and a weakening of the trade-weighted US dollar, leading to an increase in investor
interest in gold as a safe haven.
Copper
During 2020, London Metal Exchange (“LME”) copper prices traded in a wide range of $1.98 to $3.64 per pound, averaged $2.80 per
pound, and closed the year at $3.51 per pound. Copper prices are significantly influenced by physical demand from emerging markets, especially China.
Copper prices fell to four-year lows in March due to initial concerns and near-term economic impacts from the spread of Covid-19, but subsequently
rose to seven-year highs in December due to the recovery in demand from China, a weakening US dollar, low global stockpile levels, and the expected impact of global financial stimulus measures.
AVERAGE MONTHLY SPOT COPPER PRICES
(dollars per pound)
|
|
|
|
|
|
|
|
|
| BARRICK YEAR-END 2020 |
21 |
MANAGEMENT’S DISCUSSION AND
ANALYSIS |
We have provisionally priced copper sales for which final price determination versus the relevant copper index
is outstanding at the balance sheet date. As at December 31, 2020, we recorded 49 million pounds of copper sales still subject to final price settlement at an average provisional price of $3.17 per pound. The impact to net income before taxation of
a 10% movement in the market price of copper would be approximately $16 million, holding all other variables constant.
Currency Exchange Rates
The results of our mining operations outside of the United States are affected by US dollar exchange rates. We have exposure to the Argentine peso
through operating costs at our Veladero mine, and peso denominated VAT receivable balances. In addition, we have exposure to the Canadian and Australian dollars, Chilean peso, Papua New Guinea kina, Peruvian sol, Zambian kwacha, Tanzanian shilling,
Dominican peso, West African CFA franc, Euro, South African rand, and British pound through mine operating and capital costs.
Fluctuations in the US dollar increase the volatility of our costs reported in US dollars. In 2020, the Australian dollar traded in a range of $0.55
to $0.73 against the US dollar, while the US dollar against the Canadian dollar, Argentine peso, and West African CFA franc ranged from $1.27 to $1.47, ARS 59.53 to ARS 84.16, and XOF 533 to XOF 617, respectively. Due to inflation pressures in
Argentina and government actions, there was a continued weakening of the Argentine peso during the year. During 2020, we did not have any currency hedge positions, and are unhedged against foreign exchange exposures as at December 31, 2020 beyond
spot
requirements.
Fuel
For 2020, the price of West Texas Intermediate (“WTI”) crude oil traded in a wide range between negative $40 and positive $66 per
barrel, with an average market price of $39 per barrel, and closed the year at $49 per barrel. Oil prices were significantly impacted by a sharp near-term reduction in global demand as a result of a decrease in economic activity caused by the spread
of Covid-19.
AVERAGE MONTHLY SPOT CRUDE OIL
PRICE (WTI)
(dollars per barrel)
During 2020, we did not have any fuel hedge positions, and are unhedged against fuel exposures as at December 31,
2020.
US Dollar Interest Rates
After four years of benchmark rate increases by the US Federal Reserve, the benchmark rate was lowered by 75 basis points over the course of 2019 to
a range of 1.50% to 1.75% in an effort to keep the economy stable during a period of slowing growth and global trade uncertainty. During March 2020, rates were lowered to a range of 0.00% to 0.25% as a result of the economic impacts of the spread of
Covid-19 and kept at that level through the remainder of the year. Further changes to short-term rates in 2021, if any, are expected to be dependent on economic data.
At present, our interest rate exposure mainly relates to interest income received on our cash balances ($5.2 billion at December 31, 2020); the
mark-to-market value of derivative instruments; the carrying value of certain long-lived assets and liabilities; and the interest payments on our variable-rate debt ($0.1 billion at December 31, 2020). Currently, the amount of interest
expense recorded in our consolidated statement of income is not materially impacted by changes in interest rates, because the majority of debt was issued at fixed interest rates. The relative amounts of variable-rate financial assets and liabilities
may change in the future, depending on the amount of operating cash flow we generate, as well as the level of capital expenditures and our ability to borrow on favorable terms using fixed rate debt instruments. Changes in interest rates affect the
accretion expense recorded on our provision for environmental rehabilitation and therefore would affect our net
earnings.
|
|
|
|
|
|
|
|
|
| BARRICK YEAR-END 2020 |
22 |
MANAGEMENT’S DISCUSSION AND
ANALYSIS |
Production and Cost Summary - Gold
|
|
|
|
|
|
|
|
|
|
|
|
|
|
|
|
|
|
|
|
|
|
|
|
|
|
|
|
|
|
|
For the three months ended |
|
For the years ended |
|
12/31/20
|
9/30/20 |
Change |
|
12/31/20
|
12/31/19 |
Change |
|
12/31/18 |
Nevada Gold Mines
(61.5%)a |
|
|
|
|
|
|
|
|
|
| Gold produced (000s oz) |
546 |
|
538 |
|
1% |
|
2,131 |
2,218 |
(4%) |
|
2,368 |
| Cost of sales ($/oz) |
1,007 |
|
1,060 |
|
(5%) |
|
1,029 |
924 |
11% |
|
814 |
Total cash costs
($/oz)b |
667 |
|
723 |
|
(8%) |
|
702 |
634 |
11% |
|
526 |
All-in sustaining costs
($/oz)b |
873 |
|
956 |
|
(9%) |
|
941 |
828 |
14% |
|
664 |
Carlin (61.5%)c |
|
|
|
|
|
|
|
|
|
| Gold produced (000s oz) |
260 |
|
276 |
|
(6%) |
|
1,024 |
968 |
6% |
|
835 |
| Cost of sales ($/oz) |
917 |
|
985 |
|
(7%) |
|
976 |
1,004 |
(3%) |
|
1,054 |
Total cash costs
($/oz)b |
740 |
|
800 |
|
(8%) |
|
790 |
746 |
6% |
|
740 |
All-in sustaining costs
($/oz)b |
1,005 |
|
1,036 |
|
(3%) |
|
1,041 |
984 |
6% |
|
983 |
Cortez (61.5%)d |
|
|
|
|
|
|
|
|
|
| Gold produced (000s oz) |
118 |
|
113 |
|
4% |
|
491 |
801 |
(39%) |
|
1,265 |
| Cost of sales ($/oz) |
1,043 |
|
1,060 |
|
(2%) |
|
957 |
762 |
26% |
|
659 |
Total cash costs
($/oz)b |
738 |
|
763 |
|
(3%) |
|
678 |
515 |
32% |
|
351 |
All-in sustaining costs
($/oz)b |
906 |
|
1,133 |
|
(20%) |
|
998 |
651 |
53% |
|
430 |
Turquoise Ridge (61.5%)e |
|
|
|
|
|
|
|
|
|
| Gold produced (000s oz) |
91 |
|
76 |
|
20% |
|
330 |
335 |
(2%) |
|
268 |
| Cost of sales ($/oz) |
1,064 |
|
1,097 |
|
(3%) |
|
1,064 |
846 |
26% |
|
783 |
Total cash costs
($/oz)b |
687 |
|
745 |
|
(8%) |
|
711 |
585 |
22% |
|
678 |
All-in sustaining costs
($/oz)b |
757 |
|
805 |
|
(6%) |
|
798 |
732 |
9% |
|
756 |
Phoenix (61.5%)f |
|
|
|
|
|
|
|
|
|
| Gold produced (000s oz) |
26 |
|
30 |
|
(13%) |
|
126 |
56 |
125% |
|
|
| Cost of sales ($/oz) |
2,054 |
|
1,773 |
|
16% |
|
1,772 |
2,093 |
(15%) |
|
|
Total cash costs
($/oz)b |
590 |
|
520 |
|
13% |
|
649 |
947 |
(31%) |
|
|
All-in sustaining costs
($/oz)b |
670 |
|
659 |
|
2% |
|
814 |
1,282 |
(37%) |
|
|
Long Canyon (61.5%)f |
|
|
|
|
|
|
|
|
|
| Gold produced (000s oz) |
51 |
|
43 |
|
19% |
|
160 |
58 |
176% |
|
|
| Cost of sales ($/oz) |
674 |
|
877 |
|
(23%) |
|
869 |
1,088 |
(20%) |
|
|
Total cash costs
($/oz)b |
145 |
|
212 |
(32%) |
|
236 |
333 |
(29%) |
|
|
All-in sustaining costs
($/oz)b |
324 |
|
384 |
|
(16%) |
|
405 |
681 |
(41%) |
|
|
| Pueblo Viejo (60%) |
|
|
|
|
|
|
|
|
|
| Gold produced (000s oz) |
159 |
|
129 |
|
23% |
|
542 |
590 |
(8%) |
|
581 |
| Cost of sales ($/oz) |
803 |
|
791 |
|
2% |
|
819 |
747 |
10% |
|
750 |
Total cash costs
($/oz)b |
493 |
|
450 |
|
9% |
|
504 |
471 |
7% |
|
465 |
All-in sustaining costs
($/oz)b |
689 |
|
609 |
|
13% |
|
660 |
592 |
12% |
|
623 |
Loulo-Gounkoto (80%)g |
|
|
|
|
|
|
|
|
|
| Gold produced (000s oz) |
123 |
|
139 |
|
(12%) |
|
544 |
572 |
(5%) |
|
|
| Cost of sales ($/oz) |
1,149 |
|
1,088 |
|
6% |
|
1,060 |
1,044 |
2% |
|
|
Total cash costs
($/oz)b |
734 |
|
682 |
|
8% |
|
666 |
634 |
5% |
|
|
All-in sustaining costs
($/oz)b |
923 |
|
1,161 |
|
(21%) |
|
1,006 |
886 |
14% |
|
|
Kibali (45%)g |
|
|
|
|
|
|
|
|
|
| Gold produced (000s oz) |
92 |
|
91 |
|
1% |
|
364 |
366 |
(1%) |
|
|
| Cost of sales ($/oz) |
1,163 |
|
1,088 |
|
7% |
|
1,091 |
1,111 |
(2%) |
|
|
Total cash costs
($/oz)b |
616 |
|
617 |
|
0% |
|
608 |
568 |
7% |
|
|
All-in sustaining costs
($/oz)b |
783 |
|
817 |
|
(4%) |
|
778 |
693 |
12% |
|
|
| Veladero (50%) |
|
|
|
|
|
|
|
|
|
| Gold produced (000s oz) |
58 |
|
44 |
|
32% |
|
226 |
274 |
|
(18%) |
|
278 |
| Cost of sales ($/oz) |
1,074 |
|
1,136 |
|
(5%) |
|
1,151 |
1,188 |
(3%) |
|
1,112 |
Total cash costs
($/oz)b |
698 |
|
708 |
|
(1%) |
|
748 |
734 |
2% |
|
629 |
All-in sustaining costs
($/oz)b |
1,428 |
|
1,159 |
|
23% |
|
1,308 |
1,105 |
18% |
|
1,154 |
Porgera (47.5%)h |
|
|
|
|
|
|
|
|
|
| Gold produced (000s oz) |
— |
— |
— |
|
86 |
284 |
(70%) |
|
204 |
| Cost of sales ($/oz) |
— |
— |
— |
|
1,225 |
994 |
23% |
|
996 |
Total cash costs
($/oz)b |
— |
— |
— |
|
928 |
838 |
11% |
|
796 |
All-in
sustaining costs ($/oz)b |
— |
— |
— |
|
1,115 |
1,003 |
11% |
|
1,083 |
|
|
|
|
|
|
|
|
|
|
|
|
|
|
|
|
|
|
|
|
|
|
|
|
|
|
|
|
|
|
|
|
|
|
|
|
|
|
|
|
|
|
|
|
|
|
|
|
|
|
|
|
|
|
|
|
|
|
|
|
|
|
|
|
|
|
|
|
|
|
|
|
|
|
|
|
|
|
|
|
|
|
|
|
|
|
|
|
|
|
|
|
|
|
|
|
|
|
|
|
|
|
|
|
|
|
|
|
|
|
|
|
|
|
|
|
|
|
|
|
|
|
|
|
|
|
|
|
|
|
|
|
|
|
|
|
|
|
|
|
|
|
|
|
|
|
|
|
|
|
|
|
|
|
|
|
|
|
|
|
|
|
|
|
|
|
|
|
|
|
|
|
|
|
|
|
|
|
|
|
|
|
|
|
|
|
|
|
|
|
|
|
|
|
|
|
|
|
|
|
|
|
|
|
|
|
|
|
|
|
|
|
|
|
|
|
|
|
|
|
|
|
|
|
|
|
|
|
|
|
|
|
|
|
|
|
|
|
|
|
|
|
|
|
|
|
|
|
|
|
|
|
|
|
|
|
|
|
|
|
|
|
|
|
|
|
|
|
|
|
|
|
|
|
|
|
|
|
|
|
|
|
|
|
|
|
|
|
|
|
|
|
|
|
|
|
|
|
|
|
|
|
|
|
|
|
|
|
|
|
|
|
|
|
|
|
|
|
|
|
|
|
|
|
|
|
|
|
|
|
|
|
|
|
|
|
|
|
|
|
|
|
|
|
|
|
|
|
|
|
|
|
|
|
|
|
|
|
|
|
|
|
|
|
|
|
|
|
|
|
|
|
|
|
|
|
|
|
|
|
|
|
|
|
|
|
|
|
|
|
|
|
|
|
|
|
|
|
|
|
|
|
|
|
|
|
|
|
|
|
|
|
|
|
|
|
|
|
|
|
|
|
|
|
|
|
|
|
|
|
|
|
|
|
|
|
|
|
|
|
|
|
|
|
|
|
|
|
|
|
|
|
|
|
|
|
|
|
|
|
|
|
|
|
|
|
|
|
|
|
|
|
|
|
|
|
|
|
|
|
|
|
|
|
|
|
|
|
|
|
|
|
|
|
|
|
|
|
|
|
|
|
|
|
|
|
|
|
|
| BARRICK YEAR-END 2020 |
23 |
MANAGEMENT’S DISCUSSION AND
ANALYSIS |
Production and Cost Summary - Gold
(continued)
|
|
|
|
|
|
|
|
|
|
|
|
|
|
|
|
|
|
|
|
|
|
|
|
|
|
|
|
|
|
|
For the three months ended |
|
For the years ended |
|
12/31/20
|
9/30/20 |
Change |
|
12/31/20
|
12/31/19 |
Change |
|
12/31/18 |
|
|
|
|
|
|
|
|
|
|
|
|
|
|
|
|
|
|
|
|
|
|
|
|
|
|
|
|
|
|
|
|
|
|
|
|
|
|
|
|
|
|
|
|
|
|
|
|
|
|
|
|
|
|
|
|
|
|
|
|
|
|
|
|
|
|
|
|
|
|
|
|
|
|
|
|
|
|
|
|
|
|
|
|
|
|
|
|
|
|
|
|
|
|
|
|
|
|
|
|
|
|
|
|
|
|
|
|
|
|
|
|
|
|
|
|
|
|
|
|
|
|
|
|
|
|
|
|
|
|
|
|
|
|
|
|
|
|
|
|
|
|
|
|
|
|
|
|
|
|
|
|
|
|
|
|
|
|
|
|
|
|
|
|
|
|
|
|
|
|
|
|
|
|
|
|
|
|
|
|
|
|
|
|
|
|
|
|
|
|
|
|
|
|
|
|
|
|
|
|
|
|
|
|
|
|
|
|
|
|
|
|
|
|
|
|
|
|
|
|
|
|
|
|
|
|
|
|
|
|
|
|
|
|
|
|
|
|
|
|
|
|
|
|
|
|
|
|
|
|
|
|
|
|
|
|
|
|
|
|
|
|
|
|
|
|
|
|
|
|
|
|
|
|
|
|
|
|
|
|
|
|
|
|
|
|
|
|
|
|
|
|
|
|
|
|
|
|
|
|
|
|
|
|
|
|
|
|
|
|
|
|
|
|
|
|
|
|
|
|
|
|
|
|
|
|
|
|
|
|
|
|
|
|
|
|
|
|
|
|
|
|
|
|
|
|
|
|
|
|
|
|
|
|
|
|
|
|
|
|
|
|
|
|
|
|
|
|
|
|
|
|
|
|
|
|
|
|
|
|
|
|
|
|
|
|
|
|
|
|
|
|
|
|
|
|
|
|
|
|
|
|
|
|
|
|
|
|
|
|
|
|
|
|
|
|
|
|
|
|
|
|
|
|
|
|
|
|
|
|
|
|
|
|
|
|
|
|
|
|
|
|
|
|
|
|
|
|
|
|
|
|
|
|
|
|
|
|
|
|
|
|
|
|
|
|
|
|
|
|
|
|
|
|
|
|
|
|
|
|
|
|
|
|
|
|
|
|
|
|
|
|
|
|
|
|
|
|
|
|
|
|
|
|
|
|
|
|
|
|
|
|
|
|
|
|
|
|
|
|
|
|
|
|
|
|
|
|
|
|
|
|
|
|
|
|
|
|
|
|
|
|
|
|
|
|
|
|
|
|
|
|
|
|
|
|
|
|
|
|
|
|
|
|
|
|
|
|
|
|
|
|
|
|
|
|
|
|
|
|
|
|
|
|
|
|
|
|
|
|
|
|
|
|
|
|
|
|
|
|
Tongon (89.7%)g |
|
|
|
|
|
|
|
|
|
| Gold produced (000s oz) |
66 |
|
64 |
|
3% |
|
255 |
245 |
4% |
|
|
| Cost of sales ($/oz) |
1,371 |
|
1,329 |
|
3% |
|
1,334 |
1,469 |
(9%) |
|
|
Total cash costs
($/oz)b |
810 |
|
731 |
|
11% |
|
747 |
787 |
(5%) |
|
|
All-in sustaining costs
($/oz)b |
853 |
|
777 |
|
10% |
|
791 |
844 |
(6%) |
|
|
Hemlo |
|
|
|
|
|
|
|
|
|
| Gold produced (000s oz) |
57 |
|
55 |
|
4% |
|
223 |
213 |
5% |
|
171 |
| Cost of sales ($/oz) |
1,379 |
|
1,257 |
|
10% |
|
1,256 |
1,137 |
10% |
|
1,157 |
Total cash costs
($/oz)b |
1,104 |
|
1,099 |
|
0% |
|
1,056 |
904 |
17% |
|
1,046 |
All-in sustaining costs
($/oz)b |
1,464 |
|
1,497 |
|
(2%) |
|
1,423 |
1,140 |
25% |
|
1,318 |
North Marai |
|
|
|
|
|
|
|
|
|
| Gold produced (000s oz) |
61 |
|
67 |
|
(9%) |
|
261 |
251 |
4% |
|
215 |
| Cost of sales ($/oz) |
1,073 |
|
903 |
|
19% |
|
992 |
953 |
4% |
|
795 |
Total cash costs
($/oz)b |
799 |
|
649 |
|
23% |
|
702 |
646 |
9% |
|
603 |
All-in sustaining costs
($/oz)b |
989 |
|
758 |
|
30% |
|
929 |
802 |
16% |
|
830 |
Buzwagii |
|
|
|
|
|
|
|
|
|
| Gold produced (000s oz) |
21 |
|
21 |
|
0% |
|
84 |
83 |
1% |
|
93 |
| Cost of sales ($/oz) |
1,314 |
|
907 |
|
45% |
|
1,021 |
1,240 |
(18%) |
|
939 |
Total cash costs
($/oz)b |
1,267 |
|
687 |
|
84% |
|
859 |
1,156 |
(26%) |
|
916 |
All-in sustaining costs
($/oz)b |
1,283 |
|
693 |
|
85% |
|
871 |
1,178 |
(26%) |
|
947 |
Bulyanhului |
|
|
|
|
|
|
|
|
|
| Gold produced (000s oz) |
23 |
|
7 |
|
229% |
|
44 |
27 |
63% |
|
26 |
| Cost of sales ($/oz) |
1,181 |
|
1,502 |
|
(21%) |
|
1,499 |
1,207 |
24% |
|
1,231 |
Total cash costs
($/oz)b |
610 |
|
874 |
|
(30%) |
|
832 |
676 |
23% |
|
650 |
All-in sustaining costs
($/oz)b |
664 |
|
913 |
|
(27%) |
|
895 |
773 |
16% |
|
754 |
Kalgoorlie (50%)j |
|
|
|
|
|
|
|
|
|
| Gold produced (000s oz) |
|
|
|
|
|
206 |
(100%) |
|
314 |
| Cost of sales ($/oz) |
|
|
|
|
|
1,062 |
(100%) |
|
899 |
Total cash costs
($/oz)b |
|
|
|
|
|
873 |
(100%) |
|
732 |
All-in sustaining costs
($/oz)b |
|
|
|
|
|
1,183 |
(100%) |
|
857 |
|
|
|
|
|
|
|
|
|
|
|
|
|
|
|
|
|
|
|
|
|
|
|
|
|
|
|
|
|
|
|
|
|
|
|
|
|
|
|
|
|
|
|
|
|
|
|
|
|
|
|
|
|
|
|
|
|
|
|
|
|
|
|
|
|
|
|
|
|
|
|
|
|
|
|
|
|
|
|
|
|
|
|
|
|
|
|
|
|
|
|
|
|
|
|
|
|
|
|
|
|
|
|
|
|
|
|
|
|
|
|
|
|
|
|
|
|
|
|
|
|
|
|
|
|
|
|
|
|
|
|
|
|
|
|
|
|
|
|
|
|
|
|
|
|
|
|
|
|
|
Total Attributable to
Barrickk |
|
|
|
|
|
|
|
|
|
| Gold produced (000s oz) |
1,206 |
|
1,155 |
|
4% |
|
4,760 |
5,465 |
(13%) |
|
4,527 |
Cost of sales ($/oz)l |
1,065 |
|
1,065 |
|
0% |
|
1,056 |
1,005 |
5% |
|
892 |
Total cash costs
($/oz)b |
692 |
|
696 |
|
(1%) |
|
699 |
671 |
4% |
|
588 |
All-in
sustaining costs ($/oz)b |
929 |
|
966 |
|
(4%) |
|
967 |
894 |
8% |
|
806 |
a.Represents the
combined results of Cortez, Goldstrike (including our 60% share of South Arturo) and our 75% interest in Turquoise Ridge until June 30, 2019. Commencing July 1, 2019, the date Nevada Gold Mines was
established, the results represent our 61.5% interest in Cortez, Carlin (including Goldstrike and 60% of South Arturo), Turquoise Ridge (including
Twin Creeks), Phoenix and Long Canyon.
b.These are non-GAAP financial performance measures with no standardized meaning under IFRS and therefore may not be comparable to
similar measures presented by other issuers. For further information and a detailed reconciliation of each non-GAAP measure used in this section of the MD&A to the most directly comparable IFRS measure, please see pages 96 to 122 of this
MD&A.
c.On July 1, 2019, Barrick's Goldstrike and Newmont's Carlin were contributed to Nevada Gold Mines and are now referred to as
Carlin. As a result, the amounts presented represent Goldstrike on a 100% basis (including our 60% share of South Arturo) up until June 30, 2019, and the combined results of Carlin and Goldstrike (including our 60% share of South Arturo) on a 61.5%
basis thereafter.
d.On July 1, 2019, Cortez was contributed to Nevada Gold Mines, a joint venture with Newmont. As a result, the amounts presented
are on a 100% basis up until June 30, 2019, and on a 61.5% basis thereafter.
e.Barrick owned
75% of Turquoise Ridge through to the end of the second quarter of 2019, with our joint venture partner, Newmont, owning the remaining 25%. Turquoise Ridge was proportionately consolidated on the basis that the joint venture partners that have joint
control have rights to the assets and obligations for the liabilities relating to the arrangement. The figures presented in this table are based on our 75% interest in
Turquoise Ridge until June 30, 2019. On July 1, 2019, Barrick's 75% interest in Turquoise Ridge and Newmont's Twin Creeks and 25% interest in
Turquoise Ridge were contributed to Nevada Gold Mines. Starting July 1, 2019, the results represent our 61.5% share of Turquoise Ridge and Twin Creeks, now referred to as Turquoise
Ridge.
f.A 61.5% interest in these sites was acquired as a result of the formation of Nevada Gold Mines on July 1,
2019.
g.These sites did not form a part of the Barrick consolidated results in 2018 as these sites were acquired as a result of the
Merger.
h.As Porgera was placed on care and maintenance on April 25, 2020, no operating data or per ounce data has been provided starting
the third quarter of 2020.
i.Formerly part of Acacia Mining plc. On September 17, 2019, Barrick acquired all of the shares of Acacia it did not own. Operating
results are included at 63.9% until September 30, 2019 (notwithstanding the completion of the Acacia transaction on September 17, 2019, we consolidated our interest in Acacia and recorded a non-controlling interest of 36.1% in the income statement
for the entirety of the third quarter of 2019 as a matter of convenience), on a 100% basis from October 1, 2019, to December 31, 2019, and on an 84% basis thereafter as the GoT’s 16% free-carried interest was made effective from January 1,
2020.
j.On November 28, 2019, we completed the sale of our 50% interest in Kalgoorlie in Western Australia to Saracen Mineral Holdings
Limited for total cash consideration of $750 million. Accordingly, the amounts presented represent our 50% interest until November 28, 2019.
k.Excludes
Pierina, Golden Sunlight starting in the third quarter of 2019, Morila (40%) starting in the third quarter of 2019 up until its divestiture in November 2020, and Lagunas Norte starting in the fourth quarter of 2019. These assets are producing
incidental ounces as they reach the end of their mine lives.
l.Cost of sales per ounce (Barrick’s share) is calculated as cost of sales - gold on an attributable basis (excluding sites in care and maintenance) divided by gold equity ounces
sold.
|
|
|
|
|
|
|
|
|
| BARRICK YEAR-END 2020 |
24 |
MANAGEMENT’S DISCUSSION AND
ANALYSIS |
Production and Cost Summary - Copper
|
|
|
|
|
|
|
|
|
|
|
|
|
|
|
|
|
|
|
|
|
|
|
|
|
|
|
|
|
|
|
For the three months ended |
|
For the years ended |
|
12/31/20
|
9/30/20 |
Change |
|
12/31/20
|
12/31/19 |
Change |
|
12/31/18 |
|
|
|
|
|
|
|
|
|
|
|
|
|
|
|
|
|
|
|
|
|
|
|
|
|
|
|
|
|
|
|
|
|
|
|
|
|
|
|
|
|
|
|
|
|
|
|
|
|
|
|
|
|
|
|
|
|
|
|
|
|
|
|
|
|
|
|
|
|
|
|
|
|
|
|
|
|
|
|
|
|
|
|
|
|
|
|
|
|
|
|
|
|
|
|
|
|
|
|
|
|
|
|
|
|
|
|
|
|
|
|
|
|
|
|
|
|
|
|
|
|
|
|
|
|
|
|
|
|
|
|
|
|
|
|
|
|
|
|
|
|
|
|
|
|
|
|
|
|
|
|
|
|
|
|
|
|
|
|
|
|
|
|
|
|
|
|
|
|
|
|
|
|
|
|
|
|
|
|
|
|
|
|
|
|
|
|
|
|
|
|
|
|
|
|
|
|
|
|
|
|
|
|
|
|
|
|
|
|
|
|
|
|
|
|
|
|
|
|
|
|
|
|
|
|
|
|
|
|
|
|
|
|
|
|
|
|
|
|
|
|
|
|
|
|
|
|
|
|
|
|
|
|
|
|
|
|
|
|
|
|
|
|
|
|
|
|
|
|
|
|
|
|
|
|
|
|
|
|
|
|
|
|
|
|
|
|
|
|
|
|
|
|
|
|
|
|
|
|
|
|
|
|
|
|
|
|
|
|
|
|
|
|
|
|
|
|
|
|
|
|
|
|
|
|
|
|
|
|
|
|
|
|
|
|
|
|
|
|
|
|
|
|
|
|
|
|
|
|
|
|
|
|
|
|
|
|
|
|
|
|
|
|
|
|
|
|
|
|
|
|
|
|
|
|
|
|
|
|
|
|
|
|
|
|
|
|
|
|
|
|
|
|
|
|
|
|
|
|
|
|
|
|
|
|
|
|
|
|
|
|
|
|
|
|
|
|
|
|
|
|
|
|
|
|
|
|
|
|
|
|
|
|
|
|
|
|
|
|
|
|
|
|
|
|
|
|
|
|
|
| Lumwana |
|
|
|
|
|
|
|
|
|
| Copper production (millions lbs) |
78 |
|
62 |
|
26% |
|
276 |
238 |
|
16% |
|
224 |
|
| Cost of sales ($/lb) |
1.96 |
|
2.06 |
|
(5%) |
|
2.01 |
2.13 |
|
(6%) |
|
2.51 |
|
C1 cash costs ($/lb)a |
1.58 |
|
1.49 |
|
6% |
|
1.56 |
1.79 |
|
(13%) |
|
2.08 |
|
All-in sustaining costs
($/lb)a |
2.60 |
|
2.58 |
|
1% |
|
2.43 |
3.04 |
|
(20%) |
|
3.08 |
|
Zaldívar (50%) |
|
|
|
|
|
|
|
|
|
| Copper production (millions lbs) |
23 |
|
24 |
|
(4%) |
|
106 |
128 |
|
(17%) |
|
104 |
|
| Cost of sales ($/lb) |
2.68 |
|
2.20 |
|
22% |
|
2.46 |
2.46 |
|
0% |
|
2.55 |
|
C1 cash costs ($/lb)a |
2.01 |
|
1.64 |
|
23% |
|
1.79 |
1.77 |
|
1% |
|
1.97 |
|
All-in sustaining costs
($/lb)a |
2.70 |
|
2.27 |
|
19% |
|
2.25 |
2.15 |
|
5% |
|
2.47 |
|
| Jabal Sayid (50%) |
|
|
|
|
|
|
|
|
|
| Copper production (millions lbs) |
18 |
|
17 |
|
6% |
|
75 |
66 |
|
14% |
|
55 |
|
| Cost of sales ($/lb) |
1.53 |
|
1.43 |
|
7% |
|
1.42 |
1.53 |
|
(7%) |
|
1.73 |
|
C1 cash costs ($/lb)a |
1.15 |
|
1.14 |
|
1% |
|
1.11 |
1.26 |
|
(12%) |
|
1.53 |
|
All-in sustaining costs
($/lb)a |
1.27 |
|
1.17 |
|
9% |
|
1.24 |
1.51 |
|
(18%) |
|
1.92 |
|
| Total Copper |
|
|
|
|
|
|
|
|
|
| Copper production (millions lbs) |
119 |
|
103 |
|
16% |
|
457 |
432 |
6% |
|
383 |
|
Cost of sales ($/lb)b |
2.06 |
|
1.97 |
|
5% |
|
2.02 |
2.14 |
(6%) |
|
2.40 |
|
C1 cash costs ($/lb)a |
1.61 |
|
1.45 |
|
11% |
|
1.54 |
1.69 |
(9%) |
|
1.97 |
|
All-in
sustaining costs ($/lb)a |
2.42 |
|
2.31 |
|
5% |
|
2.23 |
2.52 |
(12%) |
|
2.82 |
|
a.These are
non-GAAP financial performance measures with no standardized meaning under IFRS and therefore may not be comparable to similar measures presented by other issuers. For further information and a detailed reconciliation of each non-GAAP measure used
in this section of the MD&A to the most directly comparable IFRS measure, please see pages 96 to 122 of this MD&A.
b.Cost of sales
per pound (Barrick’s share) is calculated as cost of sales - copper plus our equity share of cost of sales attributable to Zaldívar and Jabal Sayid divided by copper pounds
sold.
Operating Divisions Performance
Review of Operating Divisions
Performance
Our presentation of our reportable operating segments consists of 10 gold mines (Carlin, Cortez, Turquoise Ridge, Pueblo Viejo, Loulo-Gounkoto,
Kibali, Veladero, Porgera, North Mara and Bulyanhulu). The remaining operating segments, including our copper mines, remaining gold mines and project, have been grouped into an “other” category and will not be reported on individually.
Segment
performance is evaluated based on a number of measures including operating income before tax, production levels and unit production costs. Certain
costs are managed on a consolidated basis and are therefore not reflected in segment income.
|
|
|
|
|
|
|
|
|
| BARRICK YEAR-END 2020 |
25 |
MANAGEMENT’S DISCUSSION AND
ANALYSIS |
Nevada Gold Mines (61.5% basis)a, Nevada USA
Summary of Operating and Financial Data
|
|
|
|
|
|
|
|
|
|
|
|
|
|
|
|
|
|
|
|
|
|
|
|
|
|
|
|
|
|
|
For the three months
ended |
|
For the
years ended |
| |
12/31/20
|
9/30/20 |
Change |
|
12/31/20
|
12/31/19 |
Change |
|
12/31/18 |
| Total tonnes mined (000s) |
57,603 |
|
56,896 |
|
1% |
|
223,148 |
|
189,456 |
|
18% |
|
182,204 |
|
| Open pit ore |
8,842 |
|
9,630 |
|
(8)% |
|
36,305 |
|
26,942 |
|
35% |
|
20,605 |
|
| Open pit waste |
47,472 |
|
45,974 |
|
3% |
|
181,675 |
|
157,868 |
|
15% |
|
157,960 |
|
| Underground |
1,289 |
|
1,292 |
|
0% |
|
5,168 |
|
4,646 |
|
11% |
|
3,639 |
|
| Average grade (grams/tonne) |
|
|
|
|
|
|
|
|
|
| Open pit mined |
1.02 |
|
1.39 |
|
(27)% |
|
1.14 |
|
0.93 |
|
23% |
|
2.96 |
|
| Underground mined |
9.39 |
|
9.65 |
|
(3)% |
|
9.67 |
|
10.52 |
|
(8)% |
|
10.96 |
|
| Processed |
2.05 |
|
2.13 |
|
(4)% |
|
2.02 |
|
2.29 |
|
(12)% |
|
3.47 |
|
| Ore tonnes processed (000s) |
10,717 |
|
10,818 |
|
(1)% |
|
43,174 |
|
36,724 |
|
18% |
|
25,680 |
|
| Oxide mill |
3,220 |
|
3,244 |
|
(1)% |
|
12,907 |
|
8,338 |
|
55% |
|
4,527 |
|
| Roaster |
1,468 |
|
1,340 |
|
10% |
|
5,222 |
|
5,377 |
|
(3)% |
|
5,104 |
|
| Autoclave |
1,207 |
|
1,314 |
|
(8)% |
|
5,418 |
|
5,656 |
|
(4)% |
|
5,338 |
|
| Heap leach |
4,822 |
|
4,920 |
|
(2)% |
|
19,627 |
|
17,353 |
|
13% |
|
10,711 |
|
Recovery rateb |
79 |
% |
79 |
% |
0% |
|
80 |
% |
82 |
% |
(2)% |
|
83 |
% |
Oxide
Millb |
73 |
% |
74 |
% |
(1)% |
|
73 |
% |
76 |
% |
(4)% |
|
83 |
% |
| Roaster |
86 |
% |
86 |
% |
0% |
|
86 |
% |
87 |
% |
(1)% |
|
89 |
% |
| Autoclave |
69 |
% |
68 |
% |
2% |
|
71 |
% |
74 |
% |
(4)% |
|
69 |
% |
| Gold produced (000s oz) |
546 |
|
538 |
|
1% |
|
2,131 |
|
2,218 |
|
(4)% |
|
2,368 |
|
| Oxide mill |
83 |
|
72 |
|
15% |
|
300 |
|
336 |
|
(11)% |
|
590 |
|
| Roaster |
270 |
|
288 |
|
(6)% |
|
1,070 |
|
1,070 |
|
0% |
|
1,120 |
|
| Autoclave |
111 |
|
107 |
|
3% |
|
468 |
|
547 |
|
(14)% |
|
497 |
|
| Heap leach |
82 |
|
71 |
|
15% |
|
293 |
|
265 |
|
11% |
|
161 |
|
| Gold sold (000s oz) |
542 |
|
542 |
|
0% |
|
2,134 |
|
2,223 |
|
(4)% |
|
2,359 |
|
| Revenue ($ millions) |
1,032 |
|
1,063 |
|
(3)% |
|
3,867 |
|
3,128 |
|
24% |
|
2,986 |
|
| Cost of sales ($ millions) |
542 |
|
571 |
|
(5)% |
|
2,186 |
|
2,035 |
|
7% |
|
1,921 |
|
| Income ($ millions) |
482 |
|
481 |
|
0% |
|
1,636 |
|
1,050 |
|
56% |
|
1,011 |
|
EBITDA ($ millions)c |
634 |
|
633 |
|
0% |
|
2,232 |
|
1,642 |
|
36% |
|
1,688 |
|
EBITDA margind |
61 |
% |
60 |
% |
2% |
|
58 |
% |
52 |
% |
10% |
|
57 |
% |
Capital expenditures ($ millions)e,f |
126 |
|
153 |
|
(18)% |
|
583 |
|
627 |
|
(7)% |
|
626 |
|
Minesite sustaininge |
95 |
|
118 |
|
(19)% |
|
459 |
|
380 |
|
21% |
|
272 |
|
Projecte |
31 |
|
35 |
|
(11)% |
|
124 |
|
247 |
|
(50)% |
|
354 |
|
| Cost of sales ($/oz) |
1,007 |
|
1,060 |
|
(5)% |
|
1,029 |
|
924 |
|
11% |
|
814 |
|
Total cash costs ($/oz)c |
667 |
|
723 |
|
(8)% |
|
702 |
|
634 |
|
11% |
|
526 |
|
All-in sustaining costs ($/oz)c |
873 |
|
956 |
|
(9)% |
|
941 |
|
828 |
|
14% |
|
664 |
|
All-in costs
($/oz)c |
925 |
|
1,025 |
|
(10)% |
|
998 |
|
938 |
|
6% |
|
814 |
|
a.Represents the combined results of Cortez, Goldstrike (including our 60% share of South Arturo) and our
75% interest in Turquoise Ridge until June 30, 2019. Commencing July 1, 2019, the date Nevada Gold Mines was established, the results represent our 61.5% interest in Cortez, Carlin (including Goldstrike and 60% of South Arturo), Turquoise Ridge
(including Twin Creeks), Phoenix and Long Canyon.
b.Excludes the Gold Quarry (Mill 5) concentrator.
c.These are non-GAAP financial performance measures with no standardized meaning under IFRS and therefore
may not be comparable to similar measures presented by other issuers. For further information and a detailed reconciliation of each non-GAAP measure used in this section of the MD&A to the most directly comparable IFRS measure, please see pages
96 to 122 of this MD&A.
d.Represents EBITDA divided by revenue.
e.Presented on a cash basis as a result of adopting IFRS 16 Leases starting in 2019. Capital expenditures for 2018 are presented on an accrued
basis.
f.Amounts presented exclude capitalized
interest.
On July 1, 2019, Nevada Gold Mines (“NGM”) was established, which includes Barrick's Cortez, Goldstrike, Turquoise Ridge and Goldrush
properties and Newmont Corporation’s (“Newmont”) Carlin, Twin Creeks, Phoenix, Long Canyon and Lone Tree properties. Barrick is the operator of the joint venture and owns 61.5%, with Newmont owning the remaining 38.5% of the joint
venture. Refer to the following pages for a detailed discussion of
Cortez, Carlin (including Goldstrike) and Turquoise Ridge (including Twin Creeks)
results.
Regulatory
Matters
In a Special Session of the Nevada Legislature, which commenced on July 8, 2020, a bill was
passed that temporarily requires the advance payment of the portion of the Net Proceeds of Minerals tax (“NPT”) that is distributed
|
|
|
|
|
|
|
|
|
| BARRICK YEAR-END 2020 |
26 |
MANAGEMENT’S DISCUSSION AND
ANALYSIS |
to the State General Fund. This advance payment will be based upon the estimated NPT liability for 2021 with
payment to be made on or before March 1, 2021, and will be in addition to the total payment related to 2020. This bill mirrors legislation introduced in 2009 following the Global Financial Crisis, and had been part of discussions between Nevada Gold
Mines and the Governor of Nevada in the first half of 2020 on measures to support the State through the Covid-19 pandemic.
In a subsequent Special Session, which commenced on July 31, 2020, three resolutions were passed proposing amendments to the Nevada Constitution to
modify provisions regarding the NPT. Two resolutions seek to eliminate the 5% cap on the NPT and replace it with a 7.75% rate on the gross proceeds from mining. The third resolution proposes to increase the cap on the NPT from 5% to 12%. All three
resolutions would significantly impact the long-term viability of the Nevada mining industry. These resolutions require further approvals, including a statewide vote to become law. If any of those resolutions were to ultimately result in an
amendment of the Nevada
Constitution, a potentially multi-year process, it could significantly increase the State taxes payable by NGM, which would negatively impact future
cash flows.
A number of the rural Nevada counties and NGM filed lawsuits in the
Nevada District Court, challenging the constitutionality of these resolutions. These lawsuits were subsequently consolidated into one. On January 27, 2021, the Nevada District Court granted a summary judgment in favor of the Nevada Legislature,
concluding that the matter is not yet ripe for adjudication. Nevada Gold Mines intends to appeal the decision to the Nevada Supreme Court and may renew its challenge following the upcoming legislative session should the resolutions pass a second
legislative approval. Separately, Nevada Gold Mines and the Nevada Mining Association are committed to and engaged in constructive discussions with the Governor, the Legislature and other affected stakeholders seeking to reach a solution that
secures the mining industry’s ability to continue supporting the rural counties and the State of Nevada for the long
term.
|
|
|
|
|
|
|
|
|
| BARRICK YEAR-END 2020 |
27 |
MANAGEMENT’S DISCUSSION AND
ANALYSIS |
Carlin (61.5% basis)a, Nevada USA
Summary of Operating and Financial Data
|
|
|
|
|
|
|
|
|
|
|
|
|
|
|
|
|
|
|
|
|
|
|
|
|
|
|
|
|
|
|
For the three months
ended |
|
For the years
ended |
| |
12/31/20
|
9/30/20 |
Change |
|
12/31/20
|
12/31/19 |
Change |
|
12/31/18 |
| Total tonnes mined (000s) |
19,761 |
|
20,147 |
|
(2)% |
|
72,820 |
|
49,343 |
|
48% |
|
59,605 |
|
| Open pit ore |
919 |
|
2,092 |
|
(56)% |
|
6,054 |
|
4,773 |
|
27% |
|
4,626 |
|
| Open pit waste |
18,038 |
|
17,234 |
|
5% |
|
63,579 |
|
41,978 |
|
51% |
|
53,387 |
|
| Underground |
804 |
|
821 |
|
(2)% |
|
3,187 |
|
2,592 |
|
23% |
|
1,592 |
|
| Average grade (grams/tonne) |
|
|
|
|
|
|
|
|
|
| Open pit mined |
1.42 |
|
2.62 |
|
(46)% |
|
2.08 |
|
2.08 |
|
0% |
|
3.75 |
|
| Underground mined |
8.78 |
|
9.65 |
|
(9)% |
|
9.36 |
|
9.09 |
|
3% |
|
9.39 |
|
| Processed |
3.82 |
|
3.93 |
|
(3)% |
|
3.69 |
|
3.80 |
|
(3)% |
|
4.32 |
|
| Ore tonnes processed (000s) |
3,053 |
|
3,078 |
|
(1)% |
|
12,195 |
|
10,467 |
|
17% |
|
8,075 |
|
| Oxide mill |
785 |
|
718 |
|
9% |
|
2,936 |
|
1,368 |
|
115% |
|
n/a |
| Roaster |
1,143 |
|
962 |
|
19% |
|
3,743 |
|
3,627 |
|
3% |
|
3,341 |
|
| Autoclave |
595 |
|
724 |
|
(18)% |
|
3,071 |
|
4,169 |
|
(26)% |
|
4,734 |
|
| Heap leach |
530 |
|
674 |
|
(21)% |
|
2,445 |
|
1,303 |
|
88% |
|
n/a |
Recovery rateb |
79 |
% |
78 |
% |
1% |
|
79 |
% |
75 |
% |
5% |
|
74 |
% |
| Roaster |
87 |
% |
86 |
% |
2% |
|
86 |
% |
86 |
% |
0% |
|
89 |
% |
| Autoclave |
48 |
% |
49 |
% |
(1)% |
|
57 |
% |
59 |
% |
(4)% |
|
53 |
% |
| Gold produced (000s oz) |
260 |
|
276 |
|
(6)% |
|
1,024 |
|
968 |
|
6% |
|
835 |
|
| Oxide mill |
9 |
|
12 |
|
(24)% |
|
38 |
|
25 |
|
52% |
|
n/a |
| Roaster |
214 |
|
219 |
|
(2)% |
|
784 |
|
694 |
|
13% |
|
606 |
|
| Autoclave |
27 |
|
36 |
|
(25)% |
|
161 |
|
225 |
|
(28)% |
|
229 |
|
| Heap leach |
10 |
|
9 |
|
11% |
|
41 |
|
24 |
|
71% |
|
n/a |
| Gold sold (000s oz) |
259 |
|
275 |
|
(6)% |
|
1,024 |
|
967 |
|
6% |
|
842 |
|
| Revenue ($ millions) |
479 |
|
524 |
|
(9)% |
|
1,812 |
|
1,355 |
|
34% |
|
1,066 |
|
| Cost of sales ($ millions) |
237 |
|
271 |
|
(13)% |
|
999 |
|
971 |
|
3% |
|
886 |
|
|
|
|
|
|
|
|
|
|
|
|
|
|
|
|
|
|
|
|
|
| Income ($ millions) |
244 |
|
247 |
|
(1)% |
|
795 |
|
370 |
|
115% |
|
166 |
|
EBITDA ($ millions)c |
289 |
|
297 |
|
(3)% |
|
983 |
|
609 |
|
61% |
|
428 |
|
EBITDA margind |
60 |
% |
57 |
% |
6% |
|
54 |
% |
45 |
% |
21% |
|
40 |
% |
Capital expenditures ($ millions)e,f |
57 |
|
59 |
|
(3)% |
|
231 |
|
211 |
|
9% |
|
186 |
|
Minesite sustaininge |
57 |
|
59 |
|
(3)% |
|
231 |
|
211 |
|
9% |
|
186 |
|
Projecte |
0 |
|
0 |
|
0% |
|
0 |
|
0 |
|
0% |
|
0 |
|
| Cost of sales ($/oz) |
917 |
|
985 |
|
(7)% |
|
976 |
|
1,004 |
|
(3)% |
|
1,054 |
|
Total cash costs ($/oz)c |
740 |
|
800 |
|
(8)% |
|
790 |
|
746 |
|
6% |
|
740 |
|
All-in sustaining costs ($/oz)c |
1,005 |
|
1,036 |
|
(3)% |
|
1,041 |
|
984 |
|
6% |
|
983 |
|
All-in costs
($/oz)c |
1,005 |
|
1,036 |
|
(3)% |
|
1,041 |
|
984 |
|
6% |
|
983 |
|
a.On July 1, 2019, Barrick's Goldstrike and Newmont's Carlin were contributed to Nevada Gold Mines and are now collectively
referred to as Carlin. As a result, the amounts presented represent Goldstrike on a 100% basis (including our 60% share of South Arturo) up until June 30, 2019, and the combined results of Carlin and Goldstrike (including NGM’s 60% share of
South Arturo) on a 61.5% basis thereafter.
b.Excludes the Gold Quarry (Mill 5) concentrator.
c.These are non-GAAP financial performance measures with no standardized meaning under IFRS and therefore may not be comparable to
similar measures presented by other issuers. For further information and a detailed reconciliation of each non-GAAP measure used in this section of the MD&A to the most directly comparable IFRS measure, please see pages 96 to 122 of this
MD&A.
d.Represents EBITDA divided by revenue.
e.Presented on a cash basis as a result of adopting IFRS 16 Leases starting in
2019. Capital expenditures for 2018 are presented on an accrued basis.
f.Amounts presented exclude capitalized interest.
On July 1, 2019, Barrick's Goldstrike operations and Newmont's Carlin operations were contributed to Nevada Gold Mines and are now collectively
referred to as Carlin. As a result, the amounts presented represent Goldstrike on a 100% basis (including our 60% share of South Arturo) up until June 30, 2019, and the combined results of Carlin and Goldstrike (including our 60% share of South
Arturo) on a 61.5% basis thereafter. As a result of this transaction, there is now a higher proportion of open pit ore mined and, consequently, the average grade processed is lower, which
also aligns with the inclusion of a heap leach facility contributed by
Newmont.
Safety and
Environment
There was one LTI recorded at
Carlin during the fourth quarter of 2020, which resulted in an LTIFR6 of 0.45 per million hours worked, compared to 2.06 in the prior quarter. There were ten LTIs recorded in 2020, which resulted in an LTIFR6 of 1.06 per million hours worked, compared to 1.51
|
|
|
|
|
|
|
|
|
| BARRICK YEAR-END 2020 |
28 |
MANAGEMENT’S DISCUSSION AND
ANALYSIS |
in 2019. No Class 17 environmental incidents occurred during 2020 or
2019.
Financial Results
Q4 2020 compared to Q3 2020
Carlin's income for the fourth quarter of 2020 decreased by 1% primarily due to a lower realized gold price4 and lower sales volumes resulting from lower grade ore mined and processed. These impacts were largely offset by a lower cost of sales per
ounce5.
Gold production in the fourth quarter of 2020 was 6% lower compared to the prior quarter driven by lower production from the autoclave, roasters, and
oxide mill. The largest impact was from the Goldstrike autoclave which completed processing of acidic ores at the end of the third quarter, and converted to the treatment of alkaline ores in the fourth quarter, resulting in lower throughput rates
and gold production. Open pit ore tonnes were impacted quarter-on-quarter as Goldstrike completed mining of the 4th NW layback of the Betze-Post pit, as well as from continued stripping of the 5th NW layback. Underground mined grade was down 9%
relative to the prior quarter due to mine sequencing.
Cost of sales per
ounce5 and total cash costs per ounce4 in the fourth quarter of 2020 were 7% and 8% lower, respectively, than the prior quarter mainly due to a higher proportion of lower cost stockpiled
ore in the feed mix. In the fourth quarter of 2020, all-in sustaining costs per ounce4 decreased by 3% compared to the prior quarter, primarily due to lower total cash costs per ounce4 partially offset by higher minesite sustaining capital expenditures on a per ounce
basis.
Capital expenditures in the fourth quarter of 2020
were in line with the prior quarter.
2020 compared to
2019
Carlin's income for 2020 and for the second half of 2019 reflects our 61.5% interest in Nevada
Gold Mines and is inclusive of income from Newmont’s former Carlin operations and the Goldstrike operations from July 1, 2019. Income for Carlin for the first six months of 2019 represents Barrick’s 100% interest in the Goldstrike
operations (including the 60% interest in South Arturo) prior to the formation of Nevada Gold Mines. In addition to this impact, the primary driver of the 115% increase in Carlin’s income compared to 2019 was the higher realized gold
price4.
INCOME AND EBITDA4,a
a The results represent Goldstrike on a 100% basis (including our 60% share of South Arturo) from January 1, 2018 to June 30, 2019 and on the combined
results of Carlin and Goldstrike (including our 60% share of South Arturo) on a 61.5% basis from July 1, 2019
onwards.
Gold production for 2020 was 6% higher compared to the prior year, primarily due to the inclusion of Newmont’s former Carlin operations
from July 1, 2019. This was partially offset by the reduction in Barrick's interest in Goldstrike (including the 60% interest in South Arturo) from 100% to 61.5% from July 1, 2019.
PRODUCTIONa (thousands of ounces)
a The results represent Goldstrike (including our 60% share of South Arturo) on a 100% basis from January 1, 2019 to June 30, 2019 and the combined
results of Carlin and Goldstrike (including our 60% share of South Arturo) on a 61.5% basis from July 1, 2019 onwards.
Cost of sales per ounce5 was 3% lower than the prior year due to lower depreciation, primarily driven by extended asset lives based on the latest life of mine plan, and
partially offset by higher total cash costs per ounce4. Total cash costs per ounce4 were 6% higher than the prior year mainly due to the change in the sales mix by processing facility as a result of the formation of Nevada Gold
Mines. This has resulted in an overall lower grade ore processed, partially offset by higher volumes through the addition of Newmont’s former Carlin operations to the Goldstrike operations. In addition, royalty expense was higher due to a
higher realized gold price4. All-in sustaining costs per ounce4 were 6% higher than the prior year, primarily due to the impact of higher total cash costs per ounce4 combined with higher minesite sustaining capital expenditures.
COST OF SALES5, TOTAL CASH COSTS4
AND ALL-IN SUSTAINING COSTS4 ($ per ounce)
Capital expenditures for 2020 increased by 9% from the prior year due to higher minesite sustaining capital expenditures. Higher minesite sustaining
capital expenditures are attributed to the inclusion of Newmont's former Carlin operations, partially offset by the reduction in Barrick's interest in Goldstrike (including the 60% interest in South Arturo) from 100% to 61.5% from July 1, 2019.
|
|
|
|
|
|
|
|
|
| BARRICK YEAR-END 2020 |
29 |
MANAGEMENT’S DISCUSSION AND
ANALYSIS |
2020 compared to Guidance
Gold production for 2020 of 1,024 thousand ounces was within the guidance range of 1,000 to 1,050 thousand ounces. Cost of sales per ounce5 of $976 was slightly higher than the guidance range of $920 to $970 per ounce. Cost of sales per ounce5 would have been within guidance after adjusting for the impact of the higher realized gold price4 on royalty expense as 2020 guidance was based on a gold price assumption of $1,350 per ounce. Total cash costs per ounce4 and all-in sustaining costs per ounce4 of $790 and $1,041, respectively, were within the guidance ranges of $760 to $810 per ounce, and $1,000 to $1,050 per ounce, respectively. These per
ounce costs would have been at the lower end of the guidance range after adjusting for the impact of the higher realized gold price4 on royalty expense as described
above.
|
|
|
|
|
|
|
|
|
| BARRICK YEAR-END 2020 |
30 |
MANAGEMENT’S DISCUSSION AND
ANALYSIS |
Cortez (61.5% basis)a, Nevada USA
Summary of Operating and Financial Data
|
|
|
|
|
|
|
|
|
|
|
|
|
|
|
|
|
|
|
|
|
|
|
|
|
|
|
|
|
|
|
For the three months
ended |
|
For the years
ended |
| |
12/31/20
|
9/30/20 |
Change |
|
12/31/20
|
12/31/19 |
Change |
|
12/31/18 |
| Total tonnes mined (000s) |
21,831 |
|
20,494 |
|
7% |
|
85,740 |
|
105,949 |
|
(19)% |
|
121,929 |
|
| Open pit ore |
2,278 |
|
2,755 |
|
(17)% |
|
11,392 |
|
14,640 |
|
(22)% |
|
15,979 |
|
| Open pit waste |
19,280 |
|
17,480 |
|
10% |
|
73,240 |
|
90,029 |
|
(19)% |
|
104,573 |
|
| Underground |
273 |
|
259 |
|
5% |
|
1,108 |
|
1,280 |
|
(13)% |
|
1,377 |
|
| Average grade (grams/tonne) |
|
|
|
|
|
|
|
|
|
| Open pit mined |
0.95 |
|
0.47 |
|
103% |
|
0.56 |
|
0.67 |
|
(17)% |
|
2.73 |
|
| Underground mined |
8.92 |
|
9.44 |
|
(5)% |
|
9.86 |
|
10.66 |
|
(7)% |
|
10.73 |
|
| Processed |
1.75 |
|
1.34 |
|
30% |
|
1.41 |
|
1.60 |
|
(12)% |
|
2.67 |
|
| Ore tonnes processed (000s) |
2,553 |
|
3,301 |
|
(23)% |
|
13,019 |
|
17,583 |
|
(26)% |
|
17,001 |
|
| Oxide mill |
558 |
|
590 |
|
(5)% |
|
2,432 |
|
3,462 |
|
(30)% |
|
4,527 |
|
| Roaster |
325 |
|
378 |
|
(14)% |
|
1,479 |
|
1,750 |
|
(15)% |
|
1,763 |
|
| Heap leach |
1,670 |
|
2,333 |
|
(28)% |
|
9,108 |
|
12,371 |
|
(26)% |
|
10,711 |
|
| Recovery rate |
81 |
% |
82 |
% |
(1)% |
|
83 |
% |
86 |
% |
(3)% |
|
87 |
% |
| Oxide Mill |
77 |
% |
73 |
% |
5% |
|
75 |
% |
78 |
% |
(4)% |
|
83 |
% |
| Roaster |
85 |
% |
86 |
% |
(1)% |
|
87 |
% |
87 |
% |
0% |
|
91 |
% |
|
|
|
|
|
|
|
|
|
|
| Gold produced (000s oz) |
118 |
|
113 |
|
4% |
|
491 |
|
801 |
|
(39)% |
|
1,265 |
|
| Oxide mill |
45 |
|
28 |
|
61% |
|
129 |
|
253 |
|
(49)% |
|
590 |
|
| Roaster |
56 |
|
69 |
|
(19)% |
|
286 |
|
376 |
|
(24)% |
|
514 |
|
|
|
|
|
|
|
|
|
|
|
| Heap leach |
17 |
|
16 |
|
4% |
|
76 |
|
172 |
|
(56)% |
|
161 |
|
| Gold sold (000s oz) |
116 |
|
115 |
|
1% |
|
491 |
|
798 |
|
(38)% |
|
1,255 |
|
| Revenue ($ millions) |
216 |
|
220 |
|
(2)% |
|
865 |
|
1,086 |
|
(20)% |
|
1,589 |
|
| Cost of sales ($ millions) |
121 |
|
122 |
|
(1)% |
|
470 |
|
608 |
|
(23)% |
|
828 |
|
|
|
|
|
|
|
|
|
|
|
|
|
|
|
|
|
|
|
|
|
| Income ($ millions) |
92 |
|
96 |
|
(4)% |
|
386 |
|
459 |
|
(16)% |
|
726 |
|
EBITDA ($ millions)b |
127 |
|
129 |
|
(2)% |
|
522 |
|
656 |
|
(20)% |
|
1,112 |
|
EBITDA marginc |
59 |
% |
59 |
% |
0% |
|
60 |
% |
60 |
% |
0% |
|
70 |
% |
Capital expenditures ($ millions)d,e |
23 |
|
52 |
|
(56)% |
|
177 |
|
255 |
|
(31)% |
|
340 |
|
Minesite sustainingd |
18 |
|
39 |
|
(54)% |
|
145 |
|
90 |
|
62% |
|
65 |
|
Projectd |
5 |
|
13 |
|
(62)% |
|
32 |
|
165 |
|
(81)% |
|
275 |
|
| Cost of sales ($/oz) |
1,043 |
|
1,060 |
|
(2)% |
|
957 |
|
762 |
|
26% |
|
659 |
|
Total cash costs ($/oz)b |
738 |
|
763 |
|
(3)% |
|
678 |
|
515 |
|
32% |
|
351 |
|
All-in sustaining costs ($/oz)b |
906 |
|
1,133 |
|
(20)% |
|
998 |
|
651 |
|
53% |
|
430 |
|
All-in costs
($/oz)b |
948 |
|
1,236 |
|
(23)% |
|
1,062 |
|
854 |
|
24% |
|
649 |
|
a.On July 1, 2019, Cortez was contributed to Nevada Gold Mines, a joint venture with Newmont. As a result, the amounts presented
are on a 100% basis up until June 30, 2019, and on a 61.5% basis thereafter.
b.
These are non-GAAP financial performance measures with no standardized meaning under IFRS and therefore may not be
comparable to similar measures presented by other issuers. For further information and a detailed reconciliation of each non-GAAP measure used in this section of the MD&A to the most directly comparable IFRS measure, please see pages 96 to 122
of this MD&A.
c.Represents EBITDA divided by
revenue.
d.Presented on a cash basis as a result of adopting IFRS 16 Leases starting in
2019. Capital expenditures for 2018 are presented on an accrued basis.
e.Amounts presented exclude capitalized interest.
On July 1, 2019, Barrick's Cortez operations were contributed to Nevada Gold Mines, a joint venture with Newmont. As a result, the amounts presented
represent Cortez on a 100% basis up until June 30, 2019 and on a 61.5% basis thereafter.
Safety and Environment
There were no LTIs recorded at Cortez during the fourth quarter of 2020, which resulted in an LTIFR6 of 0.00 per million hours worked, consistent with the prior quarter. There was one LTI recorded in 2020, which resulted in an LTIFR6 of 0.24 per million hours worked, compared to 0.47 in 2019. No Class 17 environmental incidents occurred during 2020 or
2019.
Financial Results
Q4 2020 compared to Q3 2020
Cortez’s income for the fourth quarter of 2020 was 4% lower than the prior quarter primarily due to a lower realized gold price4, partially offset by lower cost of sales per ounce5 and slightly higher sales volume resulting from higher gold production.
Gold production in the fourth quarter of 2020 was 4% higher compared to the prior quarter, primarily driven by an increase in oxide mill production
due to higher open pit grades, a higher proportion of underground ore processed and higher recoveries. This was partially offset by lower throughput across all processing facilities. Gold production from the roasters was lower due to a decrease in
trucking of open pit stockpiles to Carlin and marginally lower grades
|
|
|
|
|
|
|
|
|
| BARRICK YEAR-END 2020 |
31 |
MANAGEMENT’S DISCUSSION AND
ANALYSIS |
from Cortez Hills Underground (“CHUG”). Higher open pit waste mined quarter-on-quarter was a result
of re-sequencing due to a geotechnical event in the Pipeline pit at the end of the third quarter of 2020.
Cost of sales per ounce5 and total cash costs per ounce4 in the fourth quarter of 2020 were 2% and 3% lower, respectively, versus the prior quarter primarily due to a change in refractory ore routing and
the consequent impact on sales mix by processing facility. In the fourth quarter of 2020, all-in sustaining costs per ounce4 decreased by 20% compared to the prior quarter due to lower minesite sustaining capital expenditure together with lower total cash costs per
ounce4.
Capital expenditures in the fourth quarter of 2020 decreased by 56% compared to the prior quarter due to lower minesite sustaining capital
expenditures and lower project capital expenditures. Minesite sustaining capital expenditures were lower primarily due to fewer haul truck component replacements, the ramp-down of the Crossroads dewatering project until the next stages are reviewed
and approved, and a reduction in capitalized stripping as the mine transitions out from a mostly stripping phase at Crossroads Phase 4. The lower project capital expenditures relative to the third quarter of 2020 were due to the commissioning of the
CHUG Rangefront decline project in the current
quarter.
2020 compared to 2019
Cortez’s income for 2020 and the second half of 2019 reflects our 61.5% ownership interest
following the formation of Nevada Gold Mines as described above. Income from Cortez for the first half of 2019 represents Barrick's 100% share of the Cortez operations prior to the formation of Nevada Gold Mines. In addition to this impact, the 16%
decrease in Cortez's income was also due to a decrease in sales volume reflecting lower gold production and higher cost of sales per ounce5, partially offset by a higher realized gold price4.
INCOME AND EBITDA4,a
a The results are on a 100% basis from January 1, 2018 to June 30, 2019 and on a 61.5% basis from July 1, 2019
onwards.
Gold production for 2020 was 39%
lower, primarily due to the reduction in Barrick's interest in Cortez from July 1, 2019, combined with lower grades mined and processed from Cortez Hills Open Pit (“CHOP”) as mining was completed in the second quarter of 2019. This
impact has been partially offset by the ability to route underground ore and stockpiled open pit ore from Cortez through the Gold Quarry (Mill 6) roaster at Carlin, which was a synergy unlocked by the creation of Nevada Gold
Mines.
PRODUCTIONa (thousands of ounces)
a The results are on a 100% basis from January 1, 2019 to June 30, 2019 and on a 61.5% basis from July 1, 2019
onwards.
Cost of sales per ounce5 for 2020 increased by 26% due to higher total cash costs per ounce4, marginally offset by lower depreciation expense per ounce as CHOP had higher depreciation expense on a per ounce basis relative to other ore mined
at Cortez. Total cash costs per ounce4 was 32% higher than the prior year mainly due to the impact of lower grades as mining from the higher grade CHOP was completed in the second quarter
of 2019, combined with increased royalty expense and higher haulage costs associated with the tonnes routed to the Gold Quarry (Mill 6) roaster. Royalty expense has increased as production has shifted from CHOP to Crossroads, which carries a higher
royalty rate. In addition, the higher realized gold price4 has impacted royalty expense. For
2020, all-in sustaining costs per ounce4 increased by 53% compared to 2019, due to higher total cash costs per ounce4 and increased minesite sustaining capital expenditures from Crossroads capitalized stripping (treated as project capital expenditures in the prior
year period).
COST OF SALES5, TOTAL CASH COSTS4
AND ALL-IN SUSTAINING COSTS4 ($ per ounce)
Capital expenditures for 2020 were 31% lower than the prior year due to the reduction in Barrick's interest in Cortez from 100% to 61.5% from July 1,
2019. In addition, the lower project capital expenditures were due to the commissioning of the CHUG Rangefront decline project in the fourth quarter of 2020, as well as the ramp-down of Deep South and Crossroads dewatering project expenditures.
Sustaining capital increased over the prior year due to Crossroads capitalized stripping (whereas it was treated as project capital expenditures up to the third quarter of 2019), increased spending on water management and additional mining equipment
for CHOP buttress work.
|
|
|
|
|
|
|
|
|
| BARRICK YEAR-END 2020 |
32 |
MANAGEMENT’S DISCUSSION AND
ANALYSIS |
2020 compared to Guidance
Gold production for 2020 of 491 thousand ounces was above the guidance range of 450 to 480 thousand ounces, as higher grade ore from Cortez was
processed by the Carlin roasters, which displaced lower grade Carlin open pit ore in the feed mix. Cost of sales per ounce5 for 2020 was $957, which was below the guidance range of $980 to $1,030 per ounce. Total cash costs per ounce4 of $678 were within the guidance range of $640 to $690 per ounce, whereas all-in sustaining costs per ounce4 of $998 were higher than guidance of $910 to $960 per ounce due to the higher sustaining capital
expenditures.
|
|
|
|
|
|
|
|
|
| BARRICK YEAR-END 2020 |
33 |
MANAGEMENT’S DISCUSSION AND
ANALYSIS |
Turquoise Ridge (61.5%)a, Nevada USA
Summary of Operating and Financial Data
|
|
|
|
|
|
|
|
|
|
|
|
|
|
|
|
|
|
|
|
|
|
|
|
|
|
|
|
|
|
|
For the three months
ended |
|
For the years
ended |
|
12/31/20
|
9/30/20 |
Change |
|
12/31/20
|
12/31/19 |
Change |
|
12/31/18 |
| Total tonnes mined (000s) |
3,880 |
|
3,988 |
|
(3)% |
|
15,483 |
|
9,001 |
|
72% |
|
670 |
|
| Open pit ore |
1,447 |
|
1,601 |
|
(10)% |
|
5,150 |
|
1,340 |
|
284% |
|
n/a |
| Open pit waste |
2,221 |
|
2,175 |
|
2% |
|
9,460 |
|
6,887 |
|
37% |
|
n/a |
| Underground |
212 |
|
212 |
|
0% |
|
873 |
|
774 |
|
13% |
|
670 |
|
| Average grade (grams/tonne) |
|
|
|
|
|
|
|
|
|
| Open pit mined |
2.21 |
|
2.19 |
|
1% |
|
2.24 |
|
1.37 |
|
64% |
|
n/a |
| Underground mined |
11.94 |
|
9.89 |
|
21% |
|
10.44 |
|
14.44 |
|
(28)% |
|
15.00 |
|
| Processed |
3.47 |
|
3.29 |
|
5% |
|
3.42 |
|
5.62 |
|
(39)% |
|
14.79 |
|
| Ore tonnes processed (000s) |
964 |
|
968 |
|
0% |
|
3,613 |
|
2,201 |
|
64% |
|
604 |
|
| Oxide Mill |
120 |
|
111 |
|
8% |
|
458 |
|
221 |
|
107% |
|
n/a |
| Autoclave |
612 |
|
590 |
|
4% |
|
2,346 |
|
1,483 |
|
58% |
|
604 |
|
| Heap leach |
232 |
|
267 |
|
(13)% |
|
809 |
|
497 |
|
63% |
|
n/a |
| Recovery Rate |
82 |
% |
82 |
% |
0% |
|
83 |
% |
89 |
% |
(7)% |
|
93 |
% |
| Oxide Mill |
86 |
% |
92 |
% |
(7)% |
|
88 |
% |
87 |
% |
1% |
|
n/a |
| Autoclave |
82 |
% |
81 |
% |
1% |
|
83 |
% |
89 |
% |
(7)% |
|
93 |
% |
| Gold produced (000s oz) |
91 |
|
76 |
|
20% |
|
330 |
|
335 |
|
(2)% |
|
268 |
|
| Oxide Mill |
5 |
|
4 |
|
25% |
|
16 |
|
8 |
|
100% |
|
n/a |
| Autoclave |
84 |
|
71 |
|
19% |
|
306 |
|
321 |
|
(5)% |
|
268 |
|
| Heap leach |
2 |
|
1 |
|
100% |
|
8 |
|
6 |
|
31% |
|
n/a |
| Gold sold (000s oz) |
90 |
|
76 |
|
18% |
|
332 |
|
356 |
|
(7)% |
|
262 |
|
| Revenue ($ millions) |
168 |
|
148 |
|
14% |
|
589 |
|
504 |
|
17% |
|
331 |
|
| Cost of sales ($ millions) |
95 |
|
84 |
|
13% |
|
353 |
|
300 |
|
18% |
|
206 |
|
| Income ($ millions) |
72 |
|
62 |
|
16% |
|
229 |
|
201 |
|
14% |
|
126 |
|
EBITDA ($ millions)b |
104 |
|
87 |
|
20% |
|
342 |
|
293 |
|
17% |
|
154 |
|
EBITDA marginc |
62 |
% |
59 |
% |
5% |
|
58 |
% |
58 |
% |
0% |
|
47 |
% |
Capital expenditures ($ millions)d |
10 |
|
13 |
|
(23)% |
|
51 |
|
85 |
|
(40)% |
|
62 |
|
Minesite sustainingd |
6 |
|
4 |
|
50% |
|
24 |
|
50 |
|
(52)% |
|
20 |
|
Projectd |
4 |
|
9 |
|
(56)% |
|
27 |
|
35 |
|
(23)% |
|
42 |
|
| Cost of sales ($/oz) |
1,064 |
|
1,097 |
|
(3)% |
|
1,064 |
|
846 |
|
26% |
|
783 |
|
Total cash costs ($/oz)b |
687 |
|
745 |
|
(8)% |
|
711 |
|
585 |
|
22% |
|
678 |
|
All-in sustaining costs ($/oz)b |
757 |
|
805 |
|
(6)% |
|
798 |
|
732 |
|
9% |
|
756 |
|
All-in costs
($/oz)b |
799 |
|
929 |
|
(14)% |
|
879 |
|
834 |
|
5% |
|
916 |
|
a.Prior to July 1, 2019, Barrick owned 75% of Turquoise Ridge with our joint venture partner, Newmont, owning the remaining 25%.
Turquoise Ridge was proportionately consolidated on the basis that the joint venture partners that have joint control have rights to the assets and obligations for the liabilities relating to the arrangement. The figures presented in this table are
based on our 75% interest in Turquoise Ridge until June 30, 2019. On July 1, 2019, Barrick's 75% interest in Turquoise Ridge and Newmont's 100% interest in Twin Creeks and 25% interest in Turquoise Ridge were contributed to Nevada Gold Mines.
Starting July 1, 2019, the results represent our 61.5% share of Turquoise Ridge and Twin Creeks, now collectively referred to as Turquoise Ridge.
b.These are non-GAAP financial performance measures with no standardized meaning under IFRS and therefore may not be comparable to
similar measures presented by other issuers. For further information and a detailed reconciliation of each non-GAAP measure used in this section of the MD&A to the most directly comparable IFRS measure, please see pages 96 to 122 of this
MD&A.
c.
Represents EBITDA divided by revenue.
d.Presented on a cash basis as a result of adopting IFRS 16 Leases starting in
2019. Capital expenditures for 2018 are presented on an accrued
basis.
Barrick owned 75% of Turquoise Ridge through to the end of the second quarter of 2019, with our joint venture partner, Newmont, owning the remaining
25%. The figures presented in this table are based on our 75% interest in Turquoise Ridge until June 30, 2019. On July 1, 2019, Barrick's 75% interest in Turquoise Ridge and Newmont's Twin Creeks and 25% interest in Turquoise Ridge were contributed
to Nevada Gold Mines. Starting July 1, 2019, our results represent our 61.5% share of Turquoise Ridge and Twin Creeks, now referred to as Turquoise Ridge. As a result of this transaction, from July 1, 2019, Turquoise Ridge includes the Twin Creeks
open pit operations, resulting in considerably higher tonnes mined at a lower
average grade of ore processed. It also includes the Twin Creeks processing operations and heap leach facility contributed by
Newmont.
Safety and
Environment
There were four LTIs recorded at
Turquoise Ridge during the fourth quarter of 2020, which resulted in an
LTIFR6 of 5.54 per million hours worked, compared to 1.49 in the prior quarter. There were seven LTIs recorded in 2020, which resulted in an LTIFR6 of 2.51 per million hours worked, compared to 1.65 in 2019. No Class 17 environmental incidents occurred during 2020 or
2019.
|
|
|
|
|
|
|
|
|
| BARRICK YEAR-END 2020 |
34 |
MANAGEMENT’S DISCUSSION AND
ANALYSIS |
Financial Results
Q4 2020 compared to Q3 2020
Turquoise Ridge's income for the fourth quarter of 2020 increased by 16% mainly due to higher sales volumes reflecting higher production in
conjunction with lower cost of sales per ounce5. These impacts were partially offset by a lower realized gold price4.
Gold production in the fourth quarter of 2020 was 20% higher than the prior quarter, driven by the performance improvement at Turquoise Ridge underground from improved equipment availability and utilization. This improvement in the underground resulted in both
higher throughput and feed grades at the autoclave.
Cost of sales per ounce5 and total cash costs per ounce4 in the fourth quarter of 2020 were 3% and 8% lower, respectively, compared to the prior quarter mainly due to higher sales driven by higher
production. All-in sustaining costs per ounce4 decreased by 6% compared to the prior quarter, primarily reflecting lower total cash costs per ounce4 partially offset by higher minesite sustaining capital expenditures on a per ounce
basis.
Capital expenditures in the fourth quarter of 2020 decreased by 23%
compared to the prior quarter primarily due to lower project capital expenditure on the Third Shaft project.
2020 compared to 2019
Turquoise Ridge’s income for 2020 and the second half of 2019 reflects our 61.5% interest in Nevada Gold Mines and is inclusive of income from
Newmont’s former Twin Creeks operations and the Turquoise Ridge operations from July 1, 2019. Income for Turquoise Ridge for the first six months of 2019 represents Barrick’s 75% interest in the Turquoise Ridge operations prior to the
formation of Nevada Gold Mines. In addition to this impact, the Turquoise Ridge assets have been restated to fair market value as a consequence of the formation of NGM, which has resulted in a higher depreciation expense from July 1, 2019 onwards.
Notwithstanding this change in Barrick’s ownership interest and the higher depreciation expense, Turquoise Ridge’s income for 2020 was 14% higher than the prior year, driven by a higher realized gold price4.
INCOME AND EBITDA4,a
a The results represent Turquoise Ridge on a 75% basis from January 1, 2018 to June 30, 2019 and the combined results of Turquoise Ridge and Twin
Creeks on a 61.5% basis from July 1, 2019 onwards.
Gold production for 2020 was 2% lower compared to the prior year, primarily due to the reduction in Barrick’s ownership interest in Turquoise
Ridge partially offset by the inclusion of Newmont’s former Twin Creeks operations from July 1,
2019.
PRODUCTIONa (thousands of ounces)
a The results represent Turquoise Ridge on a 75% basis from January 1, 2019 to June 30, 2019 and the combined results of Turquoise Ridge and Twin
Creeks on a 61.5% basis from July 1, 2019 onwards.
Cost of sales per ounce5 in 2020 was 26% higher than the prior year mainly reflecting the higher total cash costs per ounce4 and the higher depreciation expense resulting from the remeasurement of assets to fair value upon the formation of Nevada Gold Mines as described
above. Total cash costs per ounce4 was 22% higher than the prior year, primarily due to the impact of lower grades processed and lower recovery. In 2020, all-in sustaining costs per
ounce4 increased by 9% compared to the prior year due to higher total cash costs per ounce4, partially offset by lower minesite sustaining capital expenditures.
COST OF
SALES5, TOTAL CASH COSTS4
AND ALL-IN SUSTAINING COSTS4 ($ per ounce)
In 2020, capital expenditures decreased by 40% compared to the prior year. The decrease was due to lower minesite sustaining capital as well as lower
project capital expenditure as work on the Third Shaft project is currently focused on shaft sinking activities with surface infrastructure now largely in place.
2020 compared to
Guidance
As expected and previously disclosed, gold production in 2020 of 330
thousand ounces was below the guidance range of 430 to 460 thousand ounces. This was mainly due to lower than planned underground equipment availability and utilization, as well as lower plant availability. Cost of sales per ounce5 and total cash costs per ounce4 of $1,064 and $711, respectively, were above the guidance ranges of $900 to $950 per ounce and $540 to $590 per ounce, respectively, mainly due to
the impact of lower sales volumes driven by lower production. All-in sustaining costs per ounce4 of $798 was above the guidance range of $690 to $740 per ounce for similar reasons.
|
|
|
|
|
|
|
|
|
| BARRICK YEAR-END 2020 |
35 |
MANAGEMENT’S DISCUSSION AND
ANALYSIS |
Other Mines - Nevada Gold Mines
Summary of Operating and Financial Data
|
|
|
|
|
|
|
|
|
|
|
|
|
|
|
|
|
|
|
|
|
|
|
|
|
|
|
|
|
|
|
|
|
|
|
|
|
For the three months
ended |
|
12/31/20
|
|
9/30/20 |
|
Gold produced (000s
oz) |
Cost of sales
($/oz) |
Total
cash costs
($/oz)a |
All-in sustaining
costs
($/oz)a |
Capital
Expend-ituresb |
|
Gold produced (000s
oz) |
Cost of sales
($/oz) |
Total
cash costs ($/oz)a |
All-in sustaining
costs ($/oz)a |
Capital
Expend-ituresb |
| Phoenix (61.5%) |
26 |
2,054 |
|
590 |
|
670 |
|
2 |
|
|
30 |
1,773 |
|
520 |
|
659 |
|
4 |
|
| Long Canyon (61.5%) |
51 |
674 |
|
145 |
|
324 |
|
7 |
|
|
43 |
877 |
|
212 |
|
384 |
|
6 |
|
a.These are non-GAAP financial performance measures with no standardized meaning under IFRS and therefore may not be comparable to
similar measures presented by other issuers. For further information and a detailed reconciliation of each non-GAAP measure used in this section of the MD&A to the most directly comparable IFRS measure, please see pages 96 to 122 of this
MD&A.
b.
Includes both minesite sustaining and project capital expenditures.
Phoenix (61.5%)
Gold production in the fourth quarter of 2020 for Phoenix was 13% lower compared to the prior quarter, primarily due to lower grades processed and
lower mill recoveries. Cost of sales per ounce5 in the fourth quarter of 2020 was 16% higher than the prior quarter, primarily due to lower grades and recoveries. In the fourth quarter of 2020,
all-in sustaining costs per ounce4 increased by 2% compared to the prior quarter primarily due to the drivers described above, although this was largely offset by higher copper
by-product credits and lower minesite sustaining capital expenditures. Minesite sustaining capital expenditures decreased in the fourth quarter of 2020 due to less capitalized stripping, partially offset by additional tailings dam construction.
Compared to our outlook, gold production of 126 thousand ounces in 2020 was
slightly higher than the guidance range of 100 to 120 thousand ounces. Cost of sales per ounce5 of $1,772 was below the guidance range of $1,850 to $1,900 per ounce. Total cash costs per ounce4 and all-in sustaining costs per ounce4 of $649 and $814, respectively, was also below the guidance ranges of $700 to $750 per ounce and $920 to $970 per ounce, respectively.
Long Canyon
(61.5%)
Gold production for Long Canyon in the fourth quarter of 2020 was 19% higher compared to
the third quarter of 2020, primarily due to a continued focus on leach cycle, carbon, and process solution management to draw down pad inventory. Cost of sales per ounce5 in the fourth quarter of 2020 was 23% lower than the prior quarter, mainly due to higher sales volumes driven by higher production as well as higher
capitalized stripping, in line with the mining sequence. All-in sustaining costs per ounce4 decreased by 16% compared to the prior quarter, primarily due to the same drivers described above, partially offset by increased capitalized
stripping. Minesite sustaining capital expenditures increased in the fourth quarter of 2020 due to an increase in capitalized waste mined from Cut 9 of the open pit.
Permitting activities for the mine life extension have been temporarily paused. A review seeking to optimize the project, including water management,
was initiated during the second quarter of 2020 and remains ongoing.
Gold
production in 2020 of 160 thousand ounces was above the guidance range of 130 to 150 thousand ounces. Cost of sales per ounce5 of $869 was below the guidance range of $910 to $960 per ounce. Total cash costs per ounce4 and all-in sustaining costs per ounce4 of $236 and $405, respectively, were also below the guidance ranges of $240 to $290 per ounce and $450 to $500 per ounce,
respectively.
|
|
|
|
|
|
|
|
|
| BARRICK YEAR-END 2020 |
36 |
MANAGEMENT’S DISCUSSION AND
ANALYSIS |
Pueblo Viejo (60% basis)a, Dominican Republic
Summary of Operating and Financial Data
|
|
|
|
|
|
|
|
|
|
|
|
|
|
|
|
|
|
|
|
|
|
|
|
|
|
|
|
|
|
|
For the three months
ended |
|
For the years
ended |
| |
12/31/20
|
9/30/20 |
Change |
|
12/31/20
|
12/31/19 |
Change |
|
12/31/18 |
| Open pit tonnes mined
(000s) |
6,248 |
|
5,328 |
|
17% |
|
20,262 |
|
24,732 |
|
(18)% |
|
24,063 |
|
| Open pit ore |
2,274 |
|
1,777 |
|
28% |
|
6,147 |
|
8,085 |
|
(24)% |
|
9,418 |
|
| Open pit waste |
3,974 |
|
3,551 |
|
12% |
|
14,115 |
|
16,647 |
|
(15)% |
|
14,645 |
|
| Average grade (grams/tonne) |
|
|
|
|
|
|
|
|
|
| Open pit mined |
2.68 |
|
2.61 |
|
3% |
|
2.57 |
|
2.76 |
|
(7)% |
|
2.78 |
|
| Processed |
3.91 |
|
3.60 |
|
9% |
|
3.61 |
|
3.91 |
|
(8)% |
|
4.04 |
|
| Autoclave ore tonnes processed (000s) |
1,456 |
|
1,281 |
|
14% |
|
5,297 |
|
5,164 |
|
3% |
|
5,008 |
|
| Recovery Rate |
87 |
% |
89 |
% |
(2)% |
|
89 |
% |
89 |
% |
0% |
|
89 |
% |
| Gold produced (000s oz) |
159 |
|
129 |
|
23% |
|
542 |
|
590 |
|
(8)% |
|
581 |
|
| Gold sold (000s oz) |
153 |
|
129 |
|
19% |
|
541 |
|
584 |
|
(7)% |
|
590 |
|
| Revenue ($ millions) |
291 |
|
246 |
|
18% |
|
954 |
|
843 |
|
13% |
|
798 |
|
| Cost of sales ($ millions) |
122 |
|
102 |
|
20% |
|
443 |
|
435 |
|
2% |
|
443 |
|
| Income ($ millions) |
167 |
|
147 |
|
14% |
|
508 |
|
402 |
|
26% |
|
342 |
|
EBITDA ($ millions)b |
204 |
|
181 |
|
13% |
|
644 |
|
522 |
|
23% |
|
457 |
|
EBITDA marginc |
70 |
% |
74 |
% |
(5)% |
|
68 |
% |
62 |
% |
9% |
|
57 |
% |
Capital expenditures ($ millions)d |
66 |
|
30 |
|
120% |
|
134 |
|
64 |
|
109% |
|
87 |
|
Minesite sustainingd |
27 |
|
20 |
|
35% |
|
79 |
|
64 |
|
23% |
|
87 |
|
Projectd |
39 |
|
10 |
|
290% |
|
55 |
|
0 |
|
100% |
|
0 |
|
| Cost of sales ($/oz) |
803 |
|
791 |
|
2% |
|
819 |
|
747 |
|
10% |
|
750 |
|
Total cash costs ($/oz)b |
493 |
|
450 |
|
9% |
|
504 |
|
471 |
|
7% |
|
465 |
|
All-in sustaining costs ($/oz)b |
689 |
|
609 |
|
13% |
|
660 |
|
592 |
|
12% |
|
623 |
|
All-in costs
($/oz)b |
941 |
|
697 |
|
35% |
|
761 |
|
600 |
|
27% |
|
623 |
|
a.Pueblo Viejo is accounted for as a subsidiary with a 40% non-controlling interest. The results in the table and the discussion
that follows are based on our 60% share only.
b.These are non-GAAP financial performance measures with no standardized meaning under IFRS and therefore may not be comparable to
similar measures presented by other issuers. For further information and a detailed reconciliation of each non-GAAP measure used in this section of the MD&A to the most directly comparable IFRS measure, please see pages 96 to 122 of this
MD&A.
c.Represents EBITDA divided by revenue.
d.Presented on a cash basis as a result of adopting IFRS 16 Leases starting in
2019. Capital expenditures for 2018 are presented on an accrued
basis.
Safety and Environment
There were no LTIs recorded at
Pueblo Viejo during the fourth quarter of 2020 which resulted in an
LTIFR6 of 0.00 per million hours worked, consistent with the prior quarter. There was one LTI recorded in 2020, which resulted in an LTIFR6 of 0.10 per million hours worked, compared to 0.67 in 2019. No Class 17 environmental incidents occurred during 2020 or 2019.
Financial
Results
Q4 2020 compared to Q3 2020
Pueblo Viejo’s income for the fourth quarter of 2020 was 14% higher than the third quarter of 2020 due to higher sales volume, partially offset
by a lower realized gold price4 and slightly higher cost of sales per ounce5.
Gold production for the fourth quarter of 2020 was 23% higher than the prior quarter mainly due to higher throughput driven by improved plant
availability as well as higher grade.
Cost of sales per ounce5 and total cash costs per ounce4 for the fourth quarter of 2020 were 2% and 9% higher, respectively, than the prior quarter primarily reflecting the impact of higher plant
maintenance costs and lower by-product credits related to external power sales from the Quisqueya power plant. The increase in cost of sales per ounce5 was partially offset by lower depreciation
on a per ounce basis resulting from the higher sales volumes. For the fourth quarter of 2020, all-in sustaining costs per ounce4 increased by 13% compared to the prior quarter, reflecting higher total cash costs per ounce4 and higher minesite sustaining capital expenditures.
Capital expenditures for the fourth quarter of 2020 increased by 120% compared to the prior quarter, primarily due to a ramp-up in project capital
expenditures on the plant and tailings expansion project during the quarter. This was combined with higher minesite sustaining capital expenditures driven by the purchase of a new fleet to self-perform ore rehandling
activities.
2020 compared to
2019
Pueblo Viejo’s income for 2020 was 26% higher than the prior year due to a higher
realized gold price4, partially offset by lower sales volume and a higher cost of sales per ounce5.
|
|
|
|
|
|
|
|
|
| BARRICK YEAR-END 2020 |
37 |
MANAGEMENT’S DISCUSSION AND
ANALYSIS |
INCOME AND EBITDA4
Gold production for 2020 was 8% lower than the prior year, mainly due to lower grades processed, partially offset by higher tonnes processed. We
achieved record throughput in 2020 due to improved maintenance practices, with throughput 3% higher than the previous record set in 2019.
PRODUCTION (thousands of
ounces)
Cost of sales per ounce5 and total cash costs per ounce4 for 2020 increased by 10% and 7%, respectively, compared to the prior year, primarily reflecting the impact of lower grade, higher royalties due to
the increase in the realized gold price4, and lower by-product credits related to external power sales from the Quisqueya power plant. For 2020, all-in sustaining costs per ounce4 increased by 12% compared to the prior year, mainly reflecting higher total cash costs per ounce4 and higher minesite sustaining capital expenditures.
COST OF SALES5, TOTAL CASH COSTS4
AND ALL-IN SUSTAINING COSTS4 ($ per ounce)
Capital expenditures for 2020 increased by 109% compared to the prior year, primarily due to a ramp-up in project capital expenditures on the plant
and tailings expansion project during the fourth quarter of 2020. This was combined with higher minesite sustaining capital expenditures related to the purchase of a new fleet for ore rehandling activities and higher capitalized stripping related to
the development of Phases 10 to 12 at the Moore
Pit.
2020 compared to
Guidance
Gold production in 2020 of 542 thousand ounces was within the guidance range of 530 to 580
thousand ounces. Cost of sales per ounce5 and total cash costs per ounce4 were $819 and $504, respectively, compared to the guidance ranges of $840 to $890 per ounce and $520 to $570 per ounce, respectively. All-in
sustaining costs per ounce4 was $660 compared to the guidance range of $720 to $770 per ounce. All per ounce cost metrics were below the 2020 guidance ranges reflecting the
positive impact of lower energy prices and cost reduction initiatives from improved maintenance practices, partially offset by higher royalties resulting from a higher realized gold price4.
|
|
|
|
|
|
|
|
|
| BARRICK YEAR-END 2020 |
38 |
MANAGEMENT’S DISCUSSION AND
ANALYSIS |
Loulo-Gounkoto (80% basis)a, Mali
Summary of Operating and Financial Data
|
|
|
|
|
|
|
|
|
|
|
|
|
|
|
|
|
|
|
|
|
|
|
|
|
|
|
|
|
|
|
|
|
For the three months ended |
|
|
|
For the years ended |
| |
12/31/20
|
9/30/20 |
Change |
|
|
|
12/31/20
|
12/31/19 |
Change |
|
12/31/18
b |
| Total tonnes mined (000s) |
8,582 |
|
8,145 |
|
5% |
|
|
|
33,036 |
|
32,192 |
|
3% |
|
30,926 |
|
| Open pit ore |
888 |
|
155 |
|
473% |
|
|
|
1,698 |
|
2,726 |
|
(38)% |
|
3,484 |
|
| Open pit waste |
7,111 |
|
7,416 |
|
(4)% |
|
|
|
29,078 |
|
27,183 |
|
7% |
|
25,278 |
|
| Underground |
583 |
|
574 |
|
2% |
|
|
|
2,260 |
|
2,283 |
|
(1)% |
|
2,164 |
|
|
|
|
|
|
|
|
|
|
|
|
|
|
|
|
|
|
|
|
|
|
|
|
|
| Average grade (grams/tonne) |
|
|
|
|
|
|
|
|
|
|
|
| Open pit mined |
5.01 |
|
2.07 |
|
142% |
|
|
|
5.50 |
|
4.83 |
|
14% |
|
3.10 |
|
| Underground mined |
4.55 |
|
4.48 |
|
1% |
|
|
|
4.36 |
|
4.67 |
|
(7)% |
|
5.10 |
|
| Processed |
4.41 |
|
4.74 |
|
(7)% |
|
|
|
4.76 |
|
4.90 |
|
(3)% |
|
4.31 |
|
| Ore tonnes processed (000s) |
959 |
|
1,004 |
|
(4)% |
|
|
|
3,916 |
|
3,945 |
|
(1)% |
|
4,123 |
|
| Recovery rate |
91 |
% |
90 |
% |
1% |
|
|
|
91 |
% |
92 |
% |
(1)% |
|
92 |
% |
| Gold produced (000s oz) |
123 |
|
139 |
|
(12)% |
|
|
|
544 |
|
572 |
|
(5)% |
|
528 |
|
| Gold sold (000s oz) |
126 |
|
136 |
|
(7)% |
|
|
|
542 |
|
575 |
|
(6)% |
|
534 |
|
| Revenue ($ millions) |
236 |
|
264 |
|
(11)% |
|
|
|
966 |
|
806 |
|
20% |
|
|
| Cost of sales ($ millions) |
146 |
|
149 |
|
(2)% |
|
|
|
576 |
|
601 |
|
(4)% |
|
|
|
|
|
|
|
|
|
|
|
|
|
|
|
|
|
|
|
|
|
|
|
|
|
|
| Income ($ millions) |
91 |
|
92 |
|
(1)% |
|
|
|
358 |
|
190 |
|
88% |
|
|
EBITDA ($ millions)c |
143 |
|
147 |
|
(3)% |
|
|
|
572 |
|
426 |
|
34% |
|
|
EBITDA margind |
61 |
% |
56 |
% |
8% |
|
|
|
59 |
% |
53 |
% |
12% |
|
|
| Capital expenditures ($ millions) |
27 |
|
71 |
|
(62)% |
|
|
|
185 |
|
136 |
|
36% |
|
|
| Minesite sustaining |
21 |
|
62 |
|
(66)% |
|
|
|
170 |
|
133 |
|
28% |
|
|
| Project |
6 |
|
9 |
|
(34)% |
|
|
|
15 |
|
3 |
|
400% |
|
|
| Cost of sales ($/oz) |
1,149 |
|
1,088 |
|
6% |
|
|
|
1,060 |
|
1,044 |
|
2% |
|
|
Total cash costs ($/oz)c |
734 |
|
682 |
|
8% |
|
|
|
666 |
|
634 |
|
5% |
|
|
All-in sustaining costs ($/oz)c |
923 |
|
1,161 |
|
(21)% |
|
|
|
1,006 |
|
886 |
|
14% |
|
|
All-in costs
($/oz)c |
970 |
|
1,229 |
|
(21)% |
|
|
|
1,034 |
|
891 |
|
16% |
|
|
a.Barrick owns 80% of Société des Mines de Loulo SA and Société des Mines de Gounkoto with the Republic of Mali
owning 20%. Loulo-Gounkoto is accounted for as a subsidiary with a 20% non-controlling interest on the basis that Barrick controls the asset. The results in the table and the discussion that follows are based on our 80% share, inclusive of the
impact of the purchase price allocation resulting from the Merger.
b.These results did not form a part of the Barrick consolidated results as this site was acquired as a result of the Merger. As a
result, operational statistics are presented for reference purposes only.
c.
These are non-GAAP financial performance measures with no standardized meaning under IFRS and therefore may not be
comparable to similar measures presented by other issuers. For further information and a detailed reconciliation of each non-GAAP measure used in this section of the MD&A to the most directly comparable IFRS measure, please see pages 96 to 122
of this MD&A.
d.Represents EBITDA divided by
revenue.
Safety
and Environment
There was one LTI recorded during the fourth quarter of 2020, which resulted in an
LTIFR6 of 0.25 per million hours worked compared to 0.00 in the prior quarter. There was one LTI recorded in 2020, which resulted in an LTIFR6 of 0.07 per million hours worked compared to 0.22 in 2019. No Class 17 environmental incidents occurred during 2020 or
2019.
Financial
Results
Q4 2020 compared to Q3 2020
Loulo-Gounkoto’s income for the fourth quarter of 2020 was 1% lower than the prior quarter, mainly due to lower sales volume reflecting lower
gold production, higher cost of sales per ounce5 and a lower realized gold price4.
Gold production for the fourth quarter of 2020 was 12% lower than the prior quarter, mainly due to lower grades processed and lower plant throughput
due to a girth gear replacement, partially offset by higher recovery.
Cost of
sales per ounce5 and total cash costs per ounce4 for the fourth quarter of 2020 were 6% and 8% higher, respectively, due to the impact of lower grade and
throughput as well as higher underground mining rates despite a lower strip ratio at the open pit. For the fourth quarter of 2020, all-in sustaining
costs per ounce4 decreased by 21% compared to the prior quarter, primarily reflecting lower minesite sustaining capital expenditures, partially offset by higher
total cash costs per ounce4.
Capital expenditures for the fourth quarter of 2020 decreased by 62% compared to the prior quarter, primarily due to lower minesite sustaining
capital expenditures driven by lower capitalized stripping at the Gounkoto open pit and a decrease in capital development at Loulo.
2020 compared to 2019
Loulo-Gounkoto’s income for 2020 was 88% higher than the prior year, primarily due to a higher realized gold price4, partially offset by lower sales volume and marginally higher cost of sales per ounce5.
|
|
|
|
|
|
|
|
|
| BARRICK YEAR-END 2020 |
39 |
MANAGEMENT’S DISCUSSION AND
ANALYSIS |
INCOME AND EBITDA4
Gold production in 2020 was 5% lower compared to the prior year, primarily due to lower grades processed combined with slightly lower throughput and
recovery.
PRODUCTION (thousands of ounces)
Cost of sales per ounce5 and total cash costs per ounce4 in 2020 were 2% and 5% higher, respectively, compared to the prior year, mainly due to the impact of lower grades combined with higher royalties as
a result of a higher realized gold price4 and higher operating costs. The increase in cost of sales per ounce5 was partially offset by lower depreciation. For 2020, all-in sustaining costs4 were 14% higher compared to the prior year reflecting higher total cash costs per ounce4 and increased minesite sustaining capital
expenditures.
COST OF SALES5, TOTAL CASH COSTS4
AND ALL-IN SUSTAINING COSTS4 ($ per ounce)
Capital expenditures in 2020 were 36% higher compared to the prior year, primarily due to higher minesite sustaining capital expenditures related to
higher capitalized stripping at the Gounkoto open pit, together with higher project capital expenditures from the development of the Gounkoto
underground.
2020 compared to Guidance
Gold production in 2020 of 544 thousand ounces was above the guidance range of 500 to 540 thousand ounces. Cost of sales per ounce5 of $1,060 was at the lower end of the guidance range of $1,050 to $1,100 per ounce. Total cash costs per ounce4 and all-in sustaining costs per ounce4 of $666 and $1,006, respectively, were also within the guidance ranges of $620 to $670 per ounce and $970 to $1,020 per ounce, respectively. Total
cash costs per ounce4 and all-in sustaining costs4 per ounce would have been at the lower end of their respective ranges after adjusting for the impact of the higher realized gold price4 on royalty expense as 2020 guidance was based on a gold price assumption of $1,350 per
ounce.
Regulatory
Matters
On September 27, 2019, Mali adopted an ordinance introducing a new
Mining Code of the Republic of Mali (the “2019 Mining Code”), which was ratified by the Malian National Assembly on April 28, 2020. The 2019 Mining Code cancels and replaces Law No. 2012-015 dated February 27, 2012 (the “2012
Mining Code”) and governs the mining industry going forward. The implementation decree to the 2019 Mining Code was adopted in November 2020.
Under the transitory provisions of the 2019 Mining Code, pre-existing mining titles and mining conventions in force remain
valid for their remaining term and their holders continue to benefit from the stability of the tax and customs regime set out therein.
In addition, each of Loulo and Gounkoto (which together form Loulo-Gounkoto) have separate legally binding establishment
conventions with the State of Mali, which guarantee the stability of the regime set out therein, govern applicable taxes and allow for international arbitration in the event of disputes. During the second quarter of 2020, an agreement was reached
for a 15-year extension of the convention governing Loulo at its expiration in 2023.
Refer to note 36 of the Financial Statements for more
information.
|
|
|
|
|
|
|
|
|
| BARRICK YEAR-END 2020 |
40 |
MANAGEMENT’S DISCUSSION AND
ANALYSIS |
Kibali (45% basis)a, Democratic Republic of Congo
Summary of Operating and Financial Data
|
|
|
|
|
|
|
|
|
|
|
|
|
|
|
|
|
|
|
|
|
|
|
|
|
|
|
|
|
|
|
|
|
For the three months
ended |
|
|
|
For the years
ended |
| |
12/31/20
|
9/30/20 |
Change |
|
|
|
12/31/20
|
12/31/19 |
Change |
|
12/31/18
b |
| Total tonnes mined (000s) |
3,474 |
|
3,405 |
|
2 |
% |
|
|
|
13,308 |
|
12,273 |
|
8 |
% |
|
14,790 |
|
| Open pit ore |
308 |
|
380 |
|
(19) |
% |
|
|
|
1,380 |
|
1,693 |
|
(18) |
% |
|
2,455 |
|
| Open pit waste |
2,682 |
|
2,569 |
|
4 |
% |
|
|
|
10,091 |
|
8,824 |
|
14 |
% |
|
10,709 |
|
| Underground |
484 |
|
456 |
|
6 |
% |
|
|
|
1,837 |
|
1,756 |
|
5 |
% |
|
1,626 |
|
|
|
|
|
|
|
|
|
|
|
|
|
|
|
|
|
|
|
|
|
|
|
|
|
| Average grade (grams/tonne) |
|
|
|
|
|
|
|
|
|
|
|
| Open pit mined |
2.39 |
|
2.40 |
|
0 |
% |
|
|
|
2.22 |
|
2.32 |
|
(4) |
% |
|
2.43 |
|
| Underground mined |
5.37 |
|
5.01 |
|
7 |
% |
|
|
|
5.20 |
|
5.12 |
|
2 |
% |
|
5.06 |
|
| Processed |
3.60 |
|
3.67 |
|
(2) |
% |
|
|
|
3.68 |
|
3.80 |
|
(3) |
% |
|
3.45 |
|
| Ore tonnes processed (000s) |
877 |
|
862 |
|
2 |
% |
|
|
|
3,434 |
|
3,381 |
|
2 |
% |
|
3,698 |
|
| Recovery rate |
90 |
% |
90 |
% |
0 |
% |
|
|
|
90 |
% |
89 |
% |
1 |
% |
|
89 |
% |
| Gold produced (000s oz) |
92 |
|
91 |
|
1 |
% |
|
|
|
364 |
|
366 |
|
(1) |
% |
|
363 |
|
| Gold sold (000s oz) |
89 |
|
91 |
|
(3) |
% |
|
|
|
364 |
|
363 |
|
0 |
% |
|
370 |
|
| Revenue ($ millions) |
168 |
|
176 |
|
(5) |
% |
|
|
|
648 |
|
505 |
|
28 |
% |
|
|
| Cost of sales ($ millions) |
104 |
|
99 |
|
5 |
% |
|
|
|
397 |
|
403 |
|
(1) |
% |
|
|
|
|
|
|
|
|
|
|
|
|
|
|
|
|
|
|
|
|
|
|
|
|
|
|
| Income ($ millions) |
58 |
|
74 |
|
(22) |
% |
|
|
|
244 |
|
108 |
|
126 |
% |
|
|
EBITDA ($ millions)c |
106 |
|
117 |
|
(9) |
% |
|
|
|
418 |
|
304 |
|
38 |
% |
|
|
EBITDA margind |
63 |
% |
66 |
% |
(5) |
% |
|
|
|
65 |
% |
60 |
% |
8 |
% |
|
|
| Capital expenditures ($ millions) |
12 |
|
14 |
|
(14) |
% |
|
|
|
51 |
|
43 |
|
18 |
% |
|
|
| Minesite sustaining |
11 |
|
14 |
|
(21) |
% |
|
|
|
49 |
|
41 |
|
20 |
% |
|
|
| Project |
1 |
|
0 |
|
0 |
% |
|
|
|
2 |
|
2 |
|
0 |
% |
|
|
| Cost of sales ($/oz) |
1,163 |
|
1,088 |
|
7 |
% |
|
|
|
1,091 |
|
1,111 |
|
(2) |
% |
|
|
Total cash costs ($/oz)c |
616 |
|
617 |
|
0 |
% |
|
|
|
608 |
|
568 |
|
7 |
% |
|
|
All-in sustaining costs ($/oz)c |
783 |
|
817 |
|
(4) |
% |
|
|
|
778 |
|
693 |
|
12 |
% |
|
|
All-in costs
($/oz)c |
787 |
|
823 |
|
(4) |
% |
|
|
|
782 |
|
701 |
|
12 |
% |
|
|
a.Barrick owns 45% of Kibali Goldmines SA (Kibali) with the Democratic Republic of Congo ("DRC") and our joint venture
partner, AngloGold Ashanti, owning 10% and 45%, respectively. Kibali is accounted for as an equity method investment on the basis that the joint venture partners that have joint control have rights to the net assets of the joint venture. The figures
presented in this table and the discussion that follows are based on our 45% effective interest in Kibali, inclusive of the impact of the purchase price allocation resulting from the
Merger.
b.
These results did not form a part of the Barrick consolidated results as this site was acquired as a result of the
Merger. As a result, operational statistics are presented for reference purposes only.
c.These are non-GAAP financial performance measures with no standardized meaning under IFRS and therefore may not be comparable to
similar measures presented by other issuers. For further information and a detailed reconciliation of each non-GAAP measure used in this section of the MD&A to the most directly comparable IFRS measure, please see pages 96 to 122 of this
MD&A.
d.Represents EBITDA divided by
revenue.
Safety
and Environment
Sadly, Kibali reported a fatality in the fourth quarter of 2020 at its underground
operations as detailed earlier in the ESG section of this MD&A.
There were no
LTIs recorded during the fourth quarter of 2020, which resulted in an
LTIFR6 of 0.00 per million hours worked compared to 0.33 in the prior quarter. There were two LTIs recorded in 2020, which resulted in an LTIFR6 of 0.15 per million hours worked compared to 0.15 in 2019. No Class 17 environmental incidents occurred during 2020 or
2019.
Financial
Results
Q4 2020 compared to Q3 2020
Kibali’s income for the fourth quarter of 2020 was 22% lower than the third quarter of 2020 due to a lower realized gold price4, lower sales volumes and increased cost of sales per ounce5.
Gold production for the fourth quarter of 2020 was 1% higher than the prior quarter, stemming from improved throughput due to a solid performance by
the gravity gold
circuit, partially offset by lower grades processed in line with the plan.
Cost of sales per ounce5 for the fourth quarter of 2020 was 7% higher compared to the prior quarter, mainly due to an increase in depreciation. Total cash costs per
ounce4 was in line with the prior quarter as lower grades and slightly higher site general and administrative expenses were offset by increased throughput,
lower processing costs and underground mining costs that benefited from a record amount of ore tonnes mined. For the fourth quarter of 2020, all-in sustaining costs per ounce4 decreased by 4% compared to the prior quarter, mainly due to lower minesite sustaining capital expenditures.
Capital expenditures for the fourth quarter of 2020 decreased by 14% compared to the prior quarter, due to lower minesite sustaining capital
expenditures driven by a reduction in capitalized drilling and underground
development.
|
|
|
|
|
|
|
|
|
| BARRICK YEAR-END 2020 |
41 |
MANAGEMENT’S DISCUSSION AND
ANALYSIS |
2020 compared to 2019
Kibali’s income for 2020 was 126% higher than the prior year due to a higher realized gold price4, lower cost of sales per ounce5 and slightly higher sales volume.
INCOME AND EBITDA4
Gold production in 2020 was 1% lower compared to the prior year due to lower grades processed, which was largely offset by improved throughput and
recoveries.
PRODUCTION (thousands of ounces)
Cost of sales per ounce5 in 2020 decreased by 2% compared to the prior year due to lower depreciation expense, partially offset by higher total cash costs4. Total cash costs per ounce4 was 7% higher, mainly due to
increased royalties resulting from the higher realized gold price4, as well as higher labor and logistics charges resulting from pandemic-related travel restrictions. This was partially offset by lower energy costs
driven by an improved hydro power blend in the first half of the year and lower fuel prices. For 2020, all-in sustaining costs per ounce4 were 12% higher compared to the prior year reflecting higher total cash costs per ounce4 and higher minesite sustaining capital
expenditures.
COST OF SALES5, TOTAL CASH COSTS4
AND ALL-IN SUSTAINING COSTS4 ($ per ounce)
Capital expenditures in 2020 were 18% higher compared to the prior year, due to higher minesite sustaining capital expenditures resulting from higher
capitalized stripping and drilling, although these were in line with plan.
2020 compared to Guidance
Gold production in 2020 of 364 thousand ounces was at the upper end of the guidance range of 340 to 370 thousand ounces. Cost of sales per
ounce5 of $1,091 was slightly higher than the guidance range of $1,030 to $1,080 per ounce. Total cash costs per ounce4 of $608 was at the low end of the guidance range of $600 to $650 per ounce, while all-in sustaining costs per ounce4 of $778 was below the guidance range of $790 to $840 per
ounce.
|
|
|
|
|
|
|
|
|
| BARRICK YEAR-END 2020 |
42 |
MANAGEMENT’S DISCUSSION AND
ANALYSIS |
Veladero (50% basis)a, Argentina
Summary of Operating and Financial Data
|
|
|
|
|
|
|
|
|
|
|
|
|
|
|
|
|
|
|
|
|
|
|
|
|
|
|
|
|
|
|
For the three months
ended |
|
For the
years ended |
| |
12/31/20
|
9/30/20 |
Change |
|
12/31/20
|
12/31/19 |
Change |
|
12/31/18 |
| Open pit tonnes mined
(000s) |
8,883 |
|
6,930 |
|
28 |
% |
|
29,108 |
|
36,758 |
|
(21) |
% |
|
35,646 |
|
| Open pit ore |
3,792 |
|
3,385 |
|
12 |
% |
|
13,678 |
|
16,048 |
|
(15) |
% |
|
15,718 |
|
| Open pit waste |
5,091 |
|
3,545 |
|
44 |
% |
|
15,430 |
|
20,710 |
|
(25) |
% |
|
19,928 |
|
| Average grade (grams/tonne) |
|
|
|
|
|
|
|
|
|
| Open pit mined |
0.76 |
|
0.76 |
|
0 |
% |
|
0.78 |
|
0.71 |
|
10 |
% |
|
0.78 |
|
| Processed |
0.87 |
|
0.79 |
|
10 |
% |
|
0.84 |
|
0.79 |
|
7 |
% |
|
0.85 |
|
| Heap leach ore tonnes processed (000s) |
2,976 |
|
3,189 |
|
(7) |
% |
|
12,017 |
|
13,587 |
|
(12) |
% |
|
13,547 |
|
| Gold produced (000s oz) |
58 |
|
44 |
|
32 |
% |
|
226 |
|
274 |
|
(18) |
% |
|
278 |
|
| Gold sold (000s oz) |
51 |
|
43 |
|
20 |
% |
|
186 |
|
271 |
|
(31) |
% |
|
280 |
|
| Revenue ($ millions) |
99 |
|
82 |
|
21 |
% |
|
333 |
|
386 |
|
(14) |
% |
|
366 |
|
| Cost of sales ($ millions) |
54 |
|
49 |
|
10 |
% |
|
213 |
|
323 |
|
(34) |
% |
|
310 |
|
| Income ($ millions) |
44 |
|
30 |
|
47 |
% |
|
114 |
|
57 |
|
100 |
% |
|
53 |
|
EBITDA ($ millions)b |
61 |
|
47 |
|
30 |
% |
|
183 |
|
172 |
|
6 |
% |
|
174 |
|
EBITDA marginc |
62 |
% |
57 |
% |
8 |
% |
|
55 |
% |
45 |
% |
23 |
% |
|
48 |
% |
Capital expenditures ($ millions)d |
35 |
|
18 |
|
94 |
% |
|
113 |
|
106 |
|
7 |
% |
|
143 |
|
Minesite sustainingd |
35 |
|
18 |
|
94 |
% |
|
98 |
|
91 |
|
8 |
% |
|
143 |
|
Projectd |
0 |
|
0 |
|
0 |
% |
|
15 |
|
15 |
|
(2) |
% |
|
0 |
|
| Cost of sales ($/oz) |
1,074 |
|
1,136 |
|
(5) |
% |
|
1,151 |
|
1,188 |
|
(3) |
% |
|
1,112 |
|
Total cash costs ($/oz)b |
698 |
|
708 |
|
(1) |
% |
|
748 |
|
734 |
|
2 |
% |
|
629 |
|
All-in sustaining costs ($/oz)b |
1,428 |
|
1,159 |
|
23 |
% |
|
1,308 |
|
1,105 |
|
18 |
% |
|
1,154 |
|
All-in costs
($/oz)b |
1,428 |
|
1,159 |
|
23 |
% |
|
1,390 |
|
1,162 |
|
20 |
% |
|
1,154 |
|
a.Barrick owns
50% of Veladero with our joint venture partner, Shandong Gold, owning the remaining 50%. Veladero is proportionately consolidated on the basis that the joint venture partners that have joint control have rights to the assets and obligations for the
liabilities relating to the arrangement. The figures presented in this table and the discussion that follows are based on our 50% interest in Veladero inclusive of the impact of remeasurement of our interest in Veladero following the disposal of a
50% interest on June 30, 2017.
b.These are non-GAAP financial performance measures with no standardized meaning under IFRS and therefore may not be comparable to
similar measures presented by other issuers. For further information and a detailed reconciliation of each non-GAAP measure used in this section of the MD&A to the most directly comparable IFRS measure, please see pages 96 to 122 of this
MD&A.
c.Represents EBITDA divided by revenue.
d.Presented on a cash basis as a result of adopting IFRS 16 Leases starting in 2019. Capital expenditures for 2018 are presented on an accrued
basis.
Safety and Environment
There were no LTIs recorded at Veladero during the fourth quarter of 2020, which resulted in an LTIFR6 of 0.00 per million hours worked, compared to 0.99 in the prior quarter. There were three LTIs recorded in 2020, which resulted in an LTIFR6 of 0.31 per million hours worked compared to 0.37 in 2019. No Class 17 environmental incidents occurred during 2020 or 2019.
Minera Andina del Sol SRL, the joint venture company that operates the Veladero mine, is the subject of various regulatory
proceedings related to operational incidents occurring in March 2017, September 2016 and September 2015. Refer to note 36 to the Financial Statements for more information regarding these and related
matters.
Financial
Results
Q4 2020 compared to Q3 2020
Veladero’s income for the fourth quarter of 2020 was 47% higher than the third quarter of 2020, primarily due to higher sales volume and lower
cost of sales per ounce5, partially offset by the lower realized gold price4.
Gold production in the fourth quarter of 2020 was 32% higher than the prior quarter, primarily due to an
improvement in the pregnant leach solution (“PLS”) grade from a successful change in leaching strategy to optimize irrigation activities
and ore placement.
Cost of sales per ounce5 and total cash costs per ounce4 in the fourth quarter of 2020 decreased by 5% and 1%, respectively, mainly due to the impact of higher sales volumes, partially offset by higher
direct mining costs. In the fourth quarter of 2020, all-in sustaining costs per ounce4 was 23% higher than the previous quarter, primarily attributable to higher minesite sustaining capital expenditures.
Capital expenditures in the fourth quarter of 2020 increased by 94% compared to
the prior quarter due to higher minesite sustaining capital expenditures that were previously deferred as a result of Covid-19 movement restrictions earlier in the year, as well as higher capitalized stripping.
2020 compared to
2019
Veladero’s income for 2020 was 100% higher than the prior year, primarily due to a
higher realized gold price4 and lower cost of sales per ounce5, partially offset by lower sales
volumes.
|
|
|
|
|
|
|
|
|
| BARRICK YEAR-END 2020 |
43 |
MANAGEMENT’S DISCUSSION AND
ANALYSIS |
INCOME AND EBITDA4
In 2020, gold production decreased by 18% compared to the prior year, primarily due to the impact of quarantine and movement restrictions on mining
operations and workforce mobilization in response to the Covid-19 pandemic, as well as the temporary cessation of irrigation on Phases 4B/5B for leach pad facility upgrades. This was partially offset by an improvement in PLS grade following a
successful change in leaching strategy in the fourth quarter of 2020 as described above.
PRODUCTION (thousands of
ounces)
In 2020, cost of sales per ounce5 decreased by 3% compared to the prior year due to lower depreciation expense partially offset by higher total cash costs per ounce4. Total cash costs per ounce4 increased by 2% compared to the prior year, mainly due to the impact of lower sales volume, partially offset by lower direct operating costs. All-in
sustaining costs per ounce4 in 2020 increased by 18% compared to the prior year, primarily due to the impact of higher minesite sustaining capital expenditures on a per ounce
basis.
COST OF SALES5, TOTAL CASH COSTS4
AND ALL-IN SUSTAINING COSTS4 ($ per ounce)
In 2020, capital expenditures
increased by 7% compared to the prior year, mainly due to higher minesite sustaining capital expenditures related to the Phase 6 leach pad expansion, Phases 4B/5B facility upgrades and higher capitalized stripping.
2020 compared to
Guidance
Gold production in 2020 of 226 thousand ounces was below the guidance range of 240 to 270
thousand ounces. We had previously disclosed that production at Veladero was trending below guidance for 2020 at higher per ounce costs mainly due to the impact of quarantine and movement restrictions on mining operations and workforce mobilization
in response to the Covid-19 pandemic.
Cost of sales per ounce5 was $1,151 compared to the guidance range of $1,220 to $1,270 per ounce due to lower depreciation. Total cash costs per ounce4 of $748 was higher than the guidance range of $670 to $720 per ounce, and all-in sustaining costs per ounce4 of $1,308 was slightly higher than the guidance range of $1,250 to $1,300 per
ounce.
Regulatory
matters
On December 23, 2019, the Argentine Congress enacted an emergency law reducing the rate for
mining export duties to 8% from 12%. This emergency law was not in force during the first quarter of 2020 and exports of doré from Veladero during this period were subject to the higher 12% rate. Following the issuance of a legal injunction in
favor of Veladero in March 2020, the reduced rate of 8% was applied to some doré shipments in the second quarter of 2020.
The Argentine Tax Authority appealed the March 2020 ruling and has continued to challenge the application of the reduced 8% rate. As a result, the
majority of Veladero’s shipments of doré during the third quarter of 2020 were subject to the higher 12% rate.
On October 2, 2020, the Argentine government issued a new decree that established the rate for mining export duties at 8% from October 3, 2020 until
December 31, 2021. Veladero has initiated legal actions to clarify that the lower 8% rate should apply to all doré shipments from December 23, 2019, when the emergency law was
enacted.
On September 1, 2019, the Argentine government issued Decree 609/2019
announcing currency restrictions in Argentina (the "Decree"). Subsequently, the Central Bank of Argentina issued Communication “A” 6770 complementing the Decree. As a result, all export proceeds are required to be converted into
Argentine pesos. Dividend distributions and payments to foreign suppliers now require specific authorizations from the Central Bank. These currency restrictions have had limited impact on mining operations to date but we continue to optimize the
timing of our gold sales to minimize our exposure to currency devaluation, while advancing constructive discussions with the Central Bank on our rights to repatriate
profits.
|
|
|
|
|
|
|
|
|
| BARRICK YEAR-END 2020 |
44 |
MANAGEMENT’S DISCUSSION AND
ANALYSIS |
Porgera (47.5% basis)a, Papua New Guinea
Summary of Operating and Financial Data
|
|
|
|
|
|
|
|
|
|
|
|
|
|
|
|
|
|
|
|
|
|
|
|
|
|
|
|
|
|
|
For the three months
ended |
|
For the
years ended |
| |
12/31/20
|
9/30/20 |
Change |
|
12/31/20
|
12/31/19 |
Change |
|
12/31/18 |
| Total tonnes mined (000s) |
— |
|
— |
|
0% |
|
3,457 |
|
13,156 |
|
(74)% |
|
9,862 |
|
| Open pit ore |
— |
|
— |
|
0% |
|
570 |
|
1,825 |
|
(69)% |
|
568 |
|
| Open pit waste |
— |
|
— |
|
0% |
|
2,622 |
|
10,406 |
|
(75)% |
|
8,529 |
|
| Underground |
— |
|
— |
|
0% |
|
265 |
|
925 |
|
(71)% |
|
765 |
|
| Average grade (grams/tonne) |
|
|
|
|
|
|
|
|
|
| Open pit mined |
— |
|
— |
|
0% |
|
1.72 |
|
1.92 |
|
(10)% |
|
2.06 |
|
| Underground mined |
— |
|
— |
|
0% |
|
5.72 |
|
6.67 |
|
(14)% |
|
6.93 |
|
| Processed |
— |
|
— |
|
0% |
|
3.01 |
|
3.44 |
|
(13)% |
|
3.46 |
|
| Autoclave ore tonnes processed (000s) |
— |
|
— |
|
0% |
|
936 |
|
2,640 |
|
(65)% |
|
2,138 |
|
| Recovery Rate |
— |
|
— |
|
0% |
|
90 |
% |
91 |
% |
(1)% |
|
86 |
% |
| Gold produced (000s oz) |
— |
|
— |
|
0% |
|
86 |
|
284 |
|
(70)% |
|
204 |
|
| Gold sold (000s oz) |
— |
|
— |
|
0% |
|
87 |
|
285 |
|
(69)% |
|
213 |
|
| Revenue ($ millions) |
— |
|
— |
|
0% |
|
140 |
|
403 |
|
(65)% |
|
269 |
|
| Cost of sales ($ millions) |
5 |
|
5 |
|
0% |
|
106 |
|
284 |
|
(63)% |
|
212 |
|
| Income ($ millions) |
(17) |
|
(17) |
|
0% |
|
(18) |
|
113 |
|
(116)% |
|
56 |
|
EBITDA ($ millions)b |
(12) |
|
(13) |
|
(8)% |
|
7 |
|
155 |
|
(95)% |
|
98 |
|
EBITDA marginc |
— |
|
— |
|
0% |
|
5 |
% |
38 |
% |
(87)% |
|
36 |
% |
Capital expenditures ($ millions)d |
— |
|
1 |
|
(100)% |
|
11 |
|
45 |
|
(75)% |
|
62 |
|
Minesite sustainingd |
— |
|
1 |
|
(100)% |
|
11 |
|
45 |
|
(75)% |
|
62 |
|
Projectd |
— |
|
— |
|
0% |
|
— |
|
— |
|
0% |
|
— |
|
| Cost of sales ($/oz) |
— |
|
— |
|
0% |
|
1,225 |
|
994 |
|
23% |
|
996 |
|
Total cash costs ($/oz)b |
— |
|
— |
|
0% |
|
928 |
|
838 |
|
11% |
|
796 |
|
All-in sustaining costs ($/oz)b |
— |
|
— |
|
0% |
|
1,115 |
|
1,003 |
|
11% |
|
1,083 |
|
All-in costs
($/oz)b |
— |
|
— |
|
0% |
|
1,116 |
|
1,003 |
|
11% |
|
1,083 |
|
a.Barrick owns
47.5% of Porgera with our joint venture partners, Zijin Mining and Mineral Resources Enga, owning the remaining 47.5% and 5%, respectively. Porgera is proportionately consolidated on the basis that the joint venture partners that have joint control
have rights to the assets and obligations for the liabilities relating to the arrangement. The figures presented in this table and the discussion that follows are based on our 47.5% interest in
Porgera.
b.These are non-GAAP financial performance measures with no standardized meaning under IFRS and therefore may not be comparable to
similar measures presented by other issuers. For further information and a detailed reconciliation of each non-GAAP measure used in this section of the MD&A to the most directly comparable IFRS measure, please see pages 96 to 122 of this
MD&A.
c.Represents EBITDA divided by revenue.
d.Presented on a
cash basis as a result of adopting IFRS 16 Leases starting in 2019. Capital expenditures for 2018 are presented on an accrued
basis.
Safety and Environment
There were no LTIs recorded at
Porgera during the fourth quarter of 2020, which resulted in an LTIFR6 of 0.00 per million hours worked, in line with the previous quarter. There was one LTI recorded in 2020, which resulted in an LTIFR6 of 0.17 per million hours worked, compared to 0.45 in 2019. No Class 17 environmental incidents occurred during 2020 or 2019.
Financial
Results
On April 25, 2020, Porgera was placed on care and maintenance after the Government of Papua
New Guinea communicated on April 24, 2020 that the SML would not be extended. Refer to the section below for further details. This has had a significant negative impact on Porgera's financial results for the fourth quarter of 2020 and year ended
December 31, 2020.
Q4 2020 compared to Q3 2020
As Porgera has been on care and maintenance since April 25, 2020, no analysis has been provided as it would not be meaningful. The loss of $17
million in the fourth quarter of 2020 mainly relates to care and maintenance costs as well as continued depreciation of certain assets.
2020 compared to 2019
In 2020, Porgera recorded a loss of $18 million compared to income of $113 million for the prior year, primarily due to the mine being placed on care
and maintenance on April 25, 2020.
|
|
|
|
|
|
|
|
|
| BARRICK YEAR-END 2020 |
45 |
MANAGEMENT’S DISCUSSION AND
ANALYSIS |
INCOME AND EBITDA4
In 2020, gold production was 70% lower compared to the prior year, primarily due to the mine being placed on care and maintenance on April 25,
2020.
PRODUCTION
(thousands of ounces)
a Due to the uncertainty related to the timing and scope of future developments on the mine’s operating outlook, the Company has not introduced
2021 guidance for Porgera.
In 2020, cost of
sales per ounce5 and total cash costs per ounce4 increased by 23% and 11%, respectively, mainly due to the cessation of all mining activity after April 24, 2020 and the mine being placed on care
and maintenance. Cost of sales per ounce5 increased compared to the same prior year period due to continued straight-line depreciation despite lower production. All-in sustaining costs per
ounce4 in 2020 increased by 11% compared to the prior year due to increased total cash costs per ounce4, partially offset by lower minesite sustaining capital expenditures.
COST OF SALES5, TOTAL CASH COSTS4
AND ALL-IN SUSTAINING COSTS4 ($ per ounce)
a Due to the uncertainty related to the timing and scope of future developments on the mine’s operating outlook, the Company has not introduced
2021 guidance for Porgera.
In 2020, capital expenditures decreased by 75% compared to the prior year as a result of the mine being placed on care and maintenance.
Porgera Special Mining Lease Extension
Porgera's SML terminated on August 16, 2019. The Company applied for a 20-year extension of the SML in June 2017 and has been engaging with the
Government of Papua New Guinea on this matter since then. On August 2, 2019, the National Court of Papua New Guinea ruled that the provisions of the country’s 1992 Mining Act applied to the Porgera gold mine, thus allowing it to continue
operating while the application to extend its SML was being considered. Also in 2019, in response to a request from Papua New Guinea Prime Minister Marape, the Company proposed a benefit-sharing arrangement that would deliver more than half the
economic benefits from the Porgera mine to Papua New Guinea stakeholders, including the Government, for the remainder of the life of mine, estimated at 20 years.
On April 24, 2020, BNL, the majority owner and operator of the Porgera joint venture, received a communication from the Government of Papua New
Guinea that the SML would not be extended. The Company believes the Government’s decision not to extend the SML is tantamount to nationalization without due process and in violation of the Government’s legal obligations to BNL. The
Company has been engaged in ongoing discussions with Prime Minister Marape and his Government in light of the potentially catastrophic impact of this decision for the communities at Porgera and in Enga Province, and for the country as a whole. On
October 15, 2020, BNL and Prime Minister Marape issued a joint press release indicating that they had productive discussions toward mutually acceptable arrangements for a new Porgera partnership to reopen and operate the mine going forward. It
further indicated that the parties had agreed in principle that Papua New Guinea will take a major share of equity under the new arrangements and BNL will retain operatorship and there will be a fair sharing of the economic benefits. Efforts to
reach a memorandum of agreement to make these concepts and additional points binding are underway. In the meantime, all legal proceedings continue as discussed below.
BNL has been pursuing and will pursue all legal avenues to challenge the Government’s decision and to recover any damages that BNL may suffer
as a result of the Government’s decision. Based on the communication received from the Government of Papua New Guinea that the SML would not be extended, Porgera was placed on temporary care and maintenance on April 25, 2020 to ensure the
safety and security of our employees and communities. BNL remains in possession of the mine to conduct care and maintenance.
On April 28, 2020, BNL filed a Judicial Review action against the Government of Papua New Guinea in the Papua New Guinea National Court of Justice.
Judicial Review is a proceeding that challenges the procedural and constitutional adequacy of government administrative actions. The Judicial Review action seeks to quash the decision not to extend the SML on the grounds that the Government did not
comply with the applicable legal standards and processes.
Trial was set to
commence in the Judicial Review action on August 12, 2020. BNL sought leave to appeal two procedural rulings of the National Court that would affect the trial to the Supreme Court of Papua New Guinea. The Government of Papua New Guinea then asked
the National Court to dismiss the Judicial Review action on purely
|
|
|
|
|
|
|
|
|
| BARRICK YEAR-END 2020 |
46 |
MANAGEMENT’S DISCUSSION AND
ANALYSIS |
procedural grounds. On September 1, 2020, the Court granted the Government’s request and dismissed the
Judicial Review action. BNL appealed that decision to the Supreme Court on September 7, 2020.
On October 1 and 6, 2020, the Supreme Court reversed the National Court's decision and granted BNL’s appeals of the two procedural rulings. The
Supreme Court has not yet heard BNL’s appeal of the National Court’s dismissal of the Judicial Review action.
On August 25, 2020, the Government of Papua New Guinea purported to grant a new special mining lease covering the Porgera Mine to Kumul, the
state-owned mining company. BNL immediately took administrative steps seeking to force the Government of Papua New Guinea to delay or withdraw the issuance of the special mining lease to Kumul. These administrative steps were not successful and on
September 24, 2020, BNL commenced another Judicial Review action seeking to quash the decision to issue the special mining lease to Kumul. On January 26, 2021, the National Court granted BNL leave for the Judicial Review. In its decision, the Court
declared itself satisfied that there was an arguable case that warrants the grant of the leave.
On July 9, 2020, BNL initiated conciliation proceedings before the World Bank’s ICSID. Through this conciliation, BNL seeks to reach an
agreement for the extension of the SML on terms that will be mutually beneficial to the Company and to all Papua New Guinea stakeholders.
Simultaneously with BNL initiating the conciliation proceedings, Barrick PD, the Company’s subsidiary and an investor in the Porgera mine, has
given notice to the Government of Papua New Guinea that a dispute has arisen under the BIT between Papua New Guinea and Australia, and has referred the dispute to arbitration before
the ICSID. Barrick PD seeks to recover damages it has already suffered and damages it may suffer in the future by virtue of the Government’s
wrongful refusal to grant an extension of the SML. The dispute notice expressly invites the Government to engage in consultations and negotiations in an attempt to resolve the investment treaty
dispute.
Porgera Tax
Audits
In April 2020, BNL received a position paper from the Internal Revenue Commission
("IRC") in Papua New Guinea asserting various proposed adjustments and other tax liabilities amounting to $131 million (not including penalties, based on the kina foreign exchange rate as at December 31, 2020) arising from tax audits of
BNL conducted for 2006 through 2015. BNL responded to the position paper on June 30, 2020. On October 2, 2020, BNL received amended assessments from the IRC which increased the amount of proposed adjustments and other taxes to $485 million
(including penalties, based on the kina foreign exchange rate as at December 31, 2020). The Company has reviewed the amended assessments and concluded that there is no merit to the IRC’s tax audit adjustments, except for certain immaterial
items for which a provision had already been made. BNL filed objections to the amended assessments on November 30, 2020 in accordance with the Papua New Guinea Income Tax Act.
The Company intends to defend its position vigorously and has not recorded any additional estimated amounts for the potential liability arising from
the amended assessments as the Company cannot reasonably predict the outcome.
|
|
|
|
|
|
|
|
|
| BARRICK YEAR-END 2020 |
47 |
MANAGEMENT’S DISCUSSION AND
ANALYSIS |
North Maraa, Tanzania
Summary of Operating and Financial Data
|
|
|
|
|
|
|
|
|
|
|
|
|
|
|
|
|
|
|
|
|
|
|
|
|
|
|
|
|
|
|
For the three months
ended |
|
For the
years ended |
| |
12/31/20
|
9/30/20 |
Change |
|
12/31/20
|
12/31/19 |
Change |
|
12/31/18 |
| Total tonnes mined (000s) |
296 |
|
247 |
|
20% |
|
3,758 |
|
10,388 |
|
(64)% |
|
10,821 |
|
| Open pit ore |
n/a |
n/a |
n/a |
|
1,484 |
|
3,987 |
|
(63)% |
|
1,837 |
|
| Open pit waste |
n/a |
n/a |
n/a |
|
1,197 |
|
5,532 |
|
(78)% |
|
8,218 |
|
| Underground |
296 |
|
247 |
|
20% |
|
1,077 |
|
869 |
|
24% |
|
766 |
|
| Average grade (grams/tonne) |
|
|
|
|
|
|
|
|
|
| Open pit mined |
n/a |
n/a |
n/a |
|
2.14 |
|
2.03 |
|
6% |
|
2.00 |
|
| Underground mined |
5.97 |
|
5.13 |
|
16% |
|
6.19 |
|
6.82 |
|
(9)% |
|
7.79 |
|
| Processed |
3.08 |
|
3.59 |
|
(14)% |
|
3.45 |
|
4.50 |
|
(23)% |
|
3.96 |
|
| Ore tonnes processed (000s) |
677 |
|
622 |
|
9% |
|
2,546 |
|
1,829 |
|
39% |
|
1,819 |
|
| Recovery rate |
91 |
% |
93 |
% |
(2)% |
|
92 |
% |
94 |
% |
(2)% |
|
93 |
% |
|
|
|
|
|
|
|
|
|
|
|
|
|
|
|
|
|
|
|
|
| Gold produced (000s oz) |
61 |
|
67 |
|
(9)% |
|
261 |
|
251 |
|
4% |
|
215 |
|
| Gold sold (000s oz) |
63 |
|
69 |
|
(9)% |
|
269 |
|
248 |
|
8% |
|
212 |
|
| Revenue ($ millions) |
120 |
|
132 |
|
(9)% |
|
480 |
|
350 |
|
37% |
|
270 |
|
| Cost of sales ($ millions) |
69 |
|
61 |
|
13% |
|
267 |
|
236 |
|
13% |
|
169 |
|
| Income ($ millions) |
49 |
|
72 |
|
(32)% |
|
214 |
|
112 |
|
91% |
|
94 |
|
EBITDA ($ millions)b |
66 |
|
89 |
|
(26)% |
|
290 |
|
187 |
|
55% |
|
134 |
|
EBITDA marginc |
55 |
% |
67 |
% |
(18)% |
|
60 |
% |
53 |
% |
13% |
|
49 |
% |
Capital expenditures ($ millions)d |
27 |
|
17 |
|
59% |
|
87 |
|
42 |
|
108% |
|
52 |
|
Minesite sustainingd |
11 |
|
6 |
|
83% |
|
57 |
|
36 |
|
59% |
|
47 |
|
Projectd |
16 |
|
11 |
|
45% |
|
30 |
|
6 |
|
400% |
|
5 |
|
| Cost of sales ($/oz) |
1,073 |
|
903 |
|
19% |
|
992 |
|
953 |
|
4% |
|
795 |
|
Total cash costs ($/oz)b |
799 |
|
649 |
|
23% |
|
702 |
|
646 |
|
9% |
|
603 |
|
All-in sustaining costs ($/oz)b |
989 |
|
758 |
|
30% |
|
929 |
|
802 |
|
16% |
|
830 |
|
All-in costs
($/oz)b |
1,232 |
|
912 |
|
35% |
|
1,039 |
|
824 |
|
26% |
|
855 |
|
a.Formerly part of Acacia Mining plc. On September 17, 2019, Barrick acquired all of the shares of Acacia it did not already own.
The results presented are on a 63.9% basis until September 30, 2019 (notwithstanding the completion of the Acacia transaction on September 17, 2019, we consolidated our interest in Acacia and recorded a non-controlling interest of 36.1% in the
income statement for the entirety of the third quarter of 2019 as a matter of convenience); on a 100% basis from October 1, 2019 to December 31, 2019; and on a 84% basis starting January 1, 2020, the date the GoT’s 16% free carried
interest was made effective.
b.
These are non-GAAP financial performance measures with no standardized meaning under IFRS and therefore may not be
comparable to similar measures presented by other issuers. For further information and a detailed reconciliation of each non-GAAP measure used in this section of the MD&A to the most directly comparable IFRS measure, please see pages 96 to 122
of this
MD&A.
c.Represents EBITDA divided by revenue.
d.Presented on a cash basis as a result of adopting IFRS 16 Leases starting in
2019. Capital expenditures for 2018 are presented on an accrued
basis.
On January 24, 2020, Barrick announced that the Company had ratified the creation of Twiga at a signing ceremony with the President of
Tanzania, formalizing the establishment of a joint venture between Barrick and the GoT and resolution of all outstanding disputes between Barrick and the GoT, including the lifting of the previous concentrate export ban, effective immediately.
Effective January 1, 2020, the GoT received a free carried shareholding of 16% in each of our Tanzanian mines (Bulyanhulu, Buzwagi and North Mara), a 16% interest in the shareholder loans owed by the operating companies and will receive half of the
economic benefits from the Tanzanian operations in the form of taxes, royalties, clearing fees and participation in all cash distributions made by the mines and Twiga, after the recoupment of capital investments.
Refer to note 36 to the Financial Statements for more information regarding this
matter.
Safety and Environment
There were no LTIs recorded at North Mara during the fourth quarter of 2020, which resulted in an LTIFR6 of 0.00 per million hours worked, versus 1.14 in the prior quarter. There were two LTIs recorded in 2020, resulting in an
LTIFR6 of 0.28 per million hours worked, compared to 0.40 in 2019. No Class
17 environmental incidents occurred during 2020 or 2019.
Financial Results
Q4 2020 compared to Q3 2020
North Mara’s income for the fourth quarter of 2020 was 32% lower than the third quarter of 2020, mainly due to a lower realized gold
price4, lower sales volumes and higher cost of sales per ounce5.
In the fourth quarter of 2020, gold production was 9% lower than the prior quarter, primarily due to lower grade processed from blending stockpiled
material to supplement underground fresh ore feed to ramp up throughput and establish a new baseline for the plant.
|
|
|
|
|
|
|
|
|
| BARRICK YEAR-END 2020 |
48 |
MANAGEMENT’S DISCUSSION AND
ANALYSIS |
Processing upgrades resulted in record throughput for the fourth quarter of 2020.
Cost of sales per ounce5 and total cash costs per ounce4 in the fourth quarter of 2020 were 19% and 23% higher, respectively, than the prior quarter, primarily due to the impact of lower grade and higher
processing costs resulting from throughput improvements. This was combined with higher costs mainly associated with the new water treatment facilities. Cost of sales per ounce5 and total cash costs per ounce4 were further impacted by an extensive maintenance program designed to improve the availability of underground equipment, which resulted in increased
underground tonnes mined. All-in sustaining costs per ounce4 in the fourth quarter of 2020 was 30% higher than the prior quarter as a result of higher total cash costs per ounce4 and higher minesite sustaining capital expenditures.
Capital expenditures in the fourth quarter of 2020 were 59% higher than the third quarter of 2020, driven by higher minesite sustaining capital
expenditures and higher project capital expenditures. This was predominantly related to the improvements in the processing plant and the underground mine to further improve efficiency, the completion of the new water treatment plants during the
quarter, and the commencement of the brine treatment facility.
2020 compared to 2019
North Mara’s income for 2020 was 91% higher than the prior year, primarily due to the change in our ownership interest from 63.9% until the end
of the third quarter of 2019 and 100% for the fourth quarter of 2019 to 84% in the current year. This was combined with a higher realized gold price4 and higher sales volumes, partially offset by higher cost of sales per ounce5.
INCOME AND EBITDA4,a
a The results are presented on a 63.9% basis from January 1, 2018 to September 30, 2019, on a 100% basis from October 1, 2019 to December 31, 2019
and on a 84% basis starting January 1, 2020, the date the GoT’s 16% free carried interest was made
effective.
In 2020, gold production was 4% higher than the prior year primarily due to the increase in our ownership interest. This was partially offset by
lower grades processed in the current period following mine plan resequencing to ensure a relatively consistent feed grade over the life of mine, compared to the variability of the previous mine plan.
PRODUCTIONa (thousands of ounces)
a The results are presented on a 63.9% basis from January 1, 2019 to September 30, 2019, on a 100% basis from October 1, 2019 to December 31, 2019
and on a 84% basis starting January 1, 2020, the date the GoT’s 16% free carried interest was made effective.
Cost of sales per ounce5 and total cash costs per ounce4 in 2020 were 4% and 9% higher, respectively, than the prior year, mainly due to increased royalty expense resulting from a higher realized gold
price4, combined with higher direct mining costs from the transition to an exclusively underground operation following the cessation of open pit mining in
the second quarter of 2020. All-in sustaining costs per ounce4 were 16% higher than the prior year due to an increase in minesite sustaining capital expenditures, combined with higher total cash costs per
ounce4.
COST OF SALES5, TOTAL CASH COSTS4
AND ALL-IN SUSTAINING COSTS4 ($ per ounce)
In 2020, capital expenditures increased by 108% compared to the prior year mainly due to the increase in our ownership interest and our
investment in the tailings storage facility and other water management initiatives. We expect this capital investment to reduce over time as these legacy issues inherited from Acacia’s operation of this asset are
addressed.
2020 compared to
Guidance
Gold production in 2020 of 261 thousand ounces was at the upper end of the guidance range
of 240 to 270 thousand ounces. All per ounce cost metrics were above the guidance ranges as a result of the temporary cessation of open pit mining in the second quarter of 2020, together with the impact of higher royalty expense due to a higher
realized gold price4. Cost of sales per ounce5 was $992 compared to the guidance range of $750 to $800 per ounce. Total cash costs per ounce4 was $702 compared to $570 to $620 per ounce, and all-in sustaining costs per ounce4 was $929, compared to $830 to $880 per ounce.
|
|
|
|
|
|
|
|
|
| BARRICK YEAR-END 2020 |
49 |
MANAGEMENT’S DISCUSSION AND
ANALYSIS |
Bulyanhulua, Tanzania
Summary of Operating and Financial Data
|
|
|
|
|
|
|
|
|
|
|
|
|
|
|
|
|
|
|
|
|
|
|
|
|
|
|
|
|
|
|
For the three months
ended |
|
For the
years ended |
| |
12/31/20
|
9/30/20 |
Change |
|
12/31/20
|
12/31/19 |
Change |
|
12/31/18 |
| Underground tonnes mined
(000s) |
73 |
|
10 |
|
630 |
% |
|
83 |
|
n/a |
n/a |
|
n/a |
|
|
|
|
|
|
|
|
|
|
|
|
|
|
|
|
|
|
|
|
|
|
|
|
|
|
|
|
|
|
| Average grade (grams/tonne) |
|
|
|
|
|
|
|
|
|
|
|
|
|
|
|
|
|
|
|
| Underground mined |
9.00 |
|
7.55 |
|
19 |
% |
|
8.81 |
|
n/a |
n/a |
|
n/a |
| Processed |
3.14 |
|
1.01 |
|
211 |
% |
|
1.35 |
|
1.09 |
|
24 |
% |
|
1.24 |
|
| Ore tonnes processed (000s) |
274 |
|
431 |
|
(36) |
% |
|
1,618 |
|
1,531 |
|
6 |
% |
|
1,214 |
|
| Recovery rate |
81 |
% |
50 |
% |
61 |
% |
|
62 |
% |
50 |
% |
24 |
% |
|
53 |
% |
|
|
|
|
|
|
|
|
|
|
|
|
|
|
|
|
|
|
|
|
| Gold produced (000s oz) |
23 |
|
7 |
|
229 |
% |
|
44 |
|
27 |
|
63 |
% |
|
26 |
|
| Gold sold (000s oz) |
20 |
|
46 |
|
(57) |
% |
|
103 |
|
27 |
|
281 |
% |
|
27 |
|
| Revenue ($ millions) |
36 |
|
98 |
|
(63) |
% |
|
202 |
|
39 |
|
418 |
% |
|
34 |
|
| Cost of sales ($ millions) |
23 |
|
69 |
|
(67) |
% |
|
154 |
|
33 |
|
367 |
% |
|
33 |
|
| Income ($ millions) |
13 |
|
25 |
|
(48) |
% |
|
27 |
|
(14) |
|
(293) |
% |
|
(18) |
|
EBITDA ($ millions)b |
23 |
|
48 |
|
(52) |
% |
|
87 |
|
0 |
|
100 |
% |
|
15 |
|
EBITDA marginc |
64 |
% |
49 |
% |
30 |
% |
|
43 |
% |
0 |
% |
100 |
% |
|
43 |
% |
Capital expenditures ($ millions)d |
37 |
|
17 |
|
118 |
% |
|
64 |
|
5 |
|
1,180 |
% |
|
3 |
|
Minesite sustainingd |
1 |
|
2 |
|
(50) |
% |
|
6 |
|
2 |
|
200 |
% |
|
1 |
|
Projectd |
36 |
|
15 |
|
140 |
% |
|
58 |
|
3 |
|
1,833 |
% |
|
2 |
|
| Cost of sales ($/oz) |
1,181 |
|
1,502 |
|
(21) |
% |
|
1,499 |
|
1,207 |
|
24 |
% |
|
1,231 |
|
Total cash costs ($/oz)b |
610 |
|
874 |
|
(30) |
% |
|
832 |
|
676 |
|
23 |
% |
|
650 |
|
All-in sustaining costs ($/oz)b |
664 |
|
913 |
|
(27) |
% |
|
895 |
|
773 |
|
16 |
% |
|
754 |
|
All-in costs
($/oz)b |
2,493 |
|
1,243 |
|
101 |
% |
|
1,459 |
|
850 |
|
72 |
% |
|
848 |
|
a.Formerly part of Acacia Mining plc. On September 17, 2019, Barrick acquired all of the shares of Acacia it did not already own.
The results presented are on a 63.9% basis until September 30, 2019 (notwithstanding the completion of the Acacia transaction on September 17, 2019, we consolidated our interest in Acacia and recorded a non-controlling interest of 36.1% in the
income statement for the entirety of the third quarter of 2019 as a matter of convenience); on a 100% basis from October 1, 2019 to December 31, 2019; and on a 84% basis starting January 1, 2020, the date the GoT’s 16% free carried
interest was made effective.
b.
These are non-GAAP financial performance measures with no standardized meaning under IFRS and therefore may not be
comparable to similar measures presented by other issuers. For further information and a detailed reconciliation of each non-GAAP measure used in this section of the MD&A to the most directly comparable IFRS measure, please see pages 96 to 122
of this
MD&A.
c.Represents EBITDA divided by revenue.
d.Presented on a cash basis as a result of adopting IFRS 16 Leases starting in
2019. Capital expenditures for 2018 are presented on an accrued
basis.
On January 24, 2020, Barrick announced that the Company had ratified the creation of Twiga at a signing ceremony with the President of
Tanzania, formalizing the establishment of a joint venture between Barrick and the GoT and resolution of all outstanding disputes between Barrick and the GoT, including the lifting of the previous concentrate export ban, effective immediately.
Effective January 1, 2020, the GoT received a free carried shareholding of 16% in each of our Tanzanian mines (Bulyanhulu, Buzwagi and North Mara), a 16% interest in the shareholder loans owed by the operating companies and will receive half of the
economic benefits from the Tanzanian operations in the form of taxes, royalties, clearing fees and participation in all cash distributions made by the mines and Twiga, after the recoupment of capital investments.
Refer to note 36 to the Financial Statements for more information regarding this
matter.
Safety and
Environment
There was one LTI recorded at Bulyanhulu during the fourth quarter of 2020, which
resulted in an LTIFR6 of 0.87 per million hours worked, versus 0.00 in the prior quarter. This was the only LTI recorded at Bulyanhulu in 2020, which resulted in an LTIFR6 of 0.32 per million hours worked
versus 0.00 in 2019. No Class
17 environmental incidents occurred during 2020 or 2019.
Financial
Results
Q4 2020 compared to Q3 2020
Bulyanhulu’s income for the fourth quarter of 2020 was 48% lower than the third quarter of 2020, mainly due to the lower realized gold
price4 and lower sales volumes following the sale of the remainder of the stockpiled concentrate in the third quarter of 2020, partially offset by lower
cost of sales per ounce5.
In the fourth quarter of 2020, gold production was 229% higher than the prior quarter. This increase was driven by the
restart of underground mining operations at the end of the third quarter of 2020, which was followed by the processing of fresh underground material upon commissioning of the refurbished process plant in the fourth quarter of 2020. Notably, the
current quarter represented the first time that fresh underground material was processed at the mill since Bulyanhulu was placed under care and maintenance in 2017.
Cost of sales per ounce5 and total cash costs per ounce4 in the fourth quarter of 2020 were 21% and 30% lower, respectively, than the prior quarter. Relative to the gold produced in
the current quarter, the remaining
|
|
|
|
|
|
|
|
|
| BARRICK YEAR-END 2020 |
50 |
MANAGEMENT’S DISCUSSION AND
ANALYSIS |
stockpiled concentrate sold in the prior quarter had a lower depreciation cost per
ounce and a higher total cash cost per ounce4. All-in sustaining costs per ounce4 in the fourth quarter of 2020 was 27% lower than the prior quarter mainly as a result of lower total cash costs per
ounce4.
Capital expenditures in the fourth quarter of 2020 were 118% higher than the third quarter of 2020, mainly due to higher
project capital expenditures relating to the restart of underground mining operations as well as refurbishing and upgrading the process plant prior to commissioning.
2020 compared to 2019
Bulyanhulu’s income for 2020 was 293% higher than the prior year, primarily due to higher sales volumes related to the
sale of the stockpiled concentrate and the re-start of underground mining and processing operations as described above. In addition to
this, the change in our ownership percentage from 63.9% until the end of the third quarter of 2019 and 100% for
the fourth quarter of 2019 to 84% in the current year also contributed to the higher income in the current year. This was combined with the higher realized gold price4 partially offset by higher cost of sales per ounce5.
INCOME AND EBITDA4,a
a The results are presented on a 63.9% basis from January 1, 2018 to September 30, 2019, on a 100% basis from October 1, 2019 to December 31, 2019
and on a 84% basis starting January 1, 2020, the date the GoT’s 16% free carried interest was made
effective.
In 2020, gold production was 63% higher than the prior year primarily due to the re-start of underground mining and processing operations, combined
with the increase in our ownership interest.
PRODUCTIONa (thousands of ounces)
a The results are presented on a 63.9% basis from January 1, 2019 to September 30, 2019, on a 100% basis from October 1, 2019 to December 31, 2019
and on a 84% basis starting January 1, 2020, the date the GoT’s 16% free carried interest was made
effective.
Cost of sales per ounce5 and total cash costs per ounce4 in 2020 were 24% and 23% higher, respectively, than the prior year, mainly due to the restart of underground mining and processing operations, as
well as the sale of the relatively higher-cost stockpiled concentrate as described above. All-in sustaining costs per ounce4 were 16% higher than the prior year due to higher total cash costs per ounce4, partially offset by lower minesite sustaining capital expenditures on a per ounce sold
basis.
COST OF SALES5, TOTAL CASH COSTS4
AND ALL-IN SUSTAINING COSTS4 ($ per ounce)
In 2020, capital expenditures increased by 1,180%, compared to the prior year mainly due to the restart of underground mining and processing
operations.
2020 compared to
Guidance
Gold production in 2020 of 44 thousand ounces was within the guidance range of 30 to 50
thousand ounces. Cost of sales per ounce5 of $1,499 was higher than the guidance range of $1,210 to $1,260 per ounce due to the impairment reversal recognized in the
year, which resulted in increased depreciation. Total cash costs per ounce4 of $832 was within the guidance range of $790 to $840 per ounce, while all-in sustaining costs per ounce4 of $895 was lower than the guidance range of $1,110 to $1,160 per ounce.
|
|
|
|
|
|
|
|
|
| BARRICK YEAR-END 2020 |
51 |
MANAGEMENT’S DISCUSSION AND
ANALYSIS |
Other Mines - Gold
|
|
|
|
|
|
|
|
|
|
|
|
|
|
|
|
|
|
|
|
|
|
|
|
|
|
|
|
|
|
|
|
|
|
| Summary of Operating and
Financial Data |
|
|
For the three months
ended |
|
12/31/20
|
|
9/30/20 |
|
Gold produced (000s
oz) |
Cost of sales
($/oz) |
Total
cash costs ($/oz)a |
All-in sustaining
costs ($/oz)a |
Capital
Expend-ituresb |
|
Gold produced (000s
oz) |
Cost of sales
($/oz) |
Total
cash costs ($/oz)a |
All-in sustaining
costs ($/oz)a |
Capital
Expend-ituresb |
|
|
|
|
|
|
|
|
|
|
|
|
| Tongon (89.7%) |
66 |
1,371 |
|
810 |
|
853 |
|
2 |
|
|
64 |
1,329 |
|
731 |
|
777 |
|
2 |
|
| Hemlo |
57 |
1,379 |
|
1,104 |
|
1,464 |
|
20 |
|
|
55 |
1,257 |
|
1,099 |
|
1,497 |
|
21 |
|
|
|
|
|
|
|
|
|
|
|
|
|
|
|
|
|
|
|
|
|
|
|
|
|
| Buzwagi (84%) |
21 |
1,314 |
|
1,267 |
|
1,283 |
|
0 |
|
|
21 |
907 |
|
687 |
|
693 |
|
0 |
|
|
|
|
|
|
|
|
|
|
|
|
|
|
|
|
|
|
|
|
|
|
|
|
|
|
|
|
|
|
|
|
|
|
|
|
|
|
|
|
|
|
|
|
|
|
|
|
|
a.These are non-GAAP financial performance measures with no standardized meaning under IFRS and therefore may not be comparable to
similar measures presented by other issuers. For further information and a detailed reconciliation of each non-GAAP measure used in this section of the MD&A to the most directly comparable IFRS measure, please see pages 96 to 122 of this
MD&A.
b.
Includes both minesite sustaining and project capital
expenditures.
Tongon (89.7% basis), Côte d'Ivoire
Gold production for Tongon in the fourth quarter of 2020 was 3% higher than the prior quarter. Cost of sales per ounce5 in the fourth quarter of 2020 was 3% higher than the prior quarter as a result of higher direct mining and processing costs, partially offset by
lower depreciation expense. All-in sustaining costs per ounce4 in the fourth quarter of 2020 was 10% higher than the prior quarter, mainly reflecting the increase in total cash costs per ounce4.
Gold production in 2020 of 255 thousand ounces was in the upper end of the guidance range of 240 to 260 thousand ounces. Cost of sales per
ounce5 of $1,334 was lower than the guidance range of $1,390 to $1,440 per ounce. Total cash costs per ounce4 and all-in sustaining costs per ounce4 of $747 and $791, respectively, were both slightly above the guidance range of $680 to $730 per ounce and $740 to $790 per ounce, respectively.
These per ounce costs would have been within the guidance range after adjusting for the impact of the higher realized gold price4 on royalty expense.
Hemlo, Ontario, Canada
Hemlo's gold production in the fourth quarter of 2020 was 4% higher than the prior quarter primarily due to higher grades. Cost of sales per
ounce5 in the fourth quarter of 2020 was 10% higher than the prior quarter due to higher depreciation following the closure of the open pit in November
2020. Total cash costs per ounce4 were in line with the prior quarter. All-in sustaining costs per ounce4 decreased by 2% compared to the prior quarter owing to lower minesite sustaining capital expenditures.
Gold production in 2020 of 223 thousand ounces was above the guidance range of
200 to 220 thousand ounces. Cost of sales per ounce5 of $1,256 and total cash costs per ounce4 of $1,056 were both above the guidance range of $960 to $1,010 per ounce and $800 to $850 per ounce, respectively. All-in sustaining costs per
ounce4 of $1,423 was also higher than the guidance range of $1,200 to $1,250 per ounce. As expected and previously disclosed, per ounce costs in 2020 were
above guidance due to a significant increase in royalty expense from the higher realized gold price4 and mining in underground zones that incurred a higher net profit interest royalty burden. This was combined with the impact of movement
restrictions in response to the Covid-19 pandemic, particularly on the ramp-up of underground development, which resulted in an increased proportion of higher-cost open pit stockpiled material processed at the mill.
As part of the Company’s efforts to elevate Hemlo to a Tier Two Gold
Asset2, a new portal is currently under
development to access the Upper C Zone, with mining expected to start in the third quarter of 2021. Improving flexibility with a third mining front
at Hemlo will allow underground throughput to ramp-up to a steady state of 1.9 million tonnes per annum from 2022 onwards. In addition, we have planned drilling programs to potentially add resources to extend the mine life past 2030.
Buzwagi (84% basis),
Tanzania
Gold production for Buzwagi in the fourth quarter of 2020 was in line with the third
quarter of 2020. Cost of sales per ounce5 and all-in sustaining costs per ounce4 in the fourth quarter of 2020 were 45% and 85% higher, respectively, than the prior quarter, following the sale of the remainder of the stockpiled
concentrate in the third quarter of 2020.
Gold production in 2020 of 84 thousand
ounces was within the guidance range of 80 to 100 thousand ounces. Cost of sales per ounce5 of $1,021 was higher than the guidance range of $850 to $900 per ounce, driven by higher depreciation expense following a
transition to owner-operator stockpile rehandling. Total cash costs per ounce4 and all-in sustaining costs per ounce4 of $859 and $871, respectively, were both within the guidance range of $820 to $870 per ounce and $850 to $900 per ounce,
respectively.
|
|
|
|
|
|
|
|
|
| BARRICK YEAR-END 2020 |
52 |
MANAGEMENT’S DISCUSSION AND
ANALYSIS |
Other Mines - Copper
|
|
|
|
|
|
|
|
|
|
|
|
|
|
|
|
|
|
|
|
|
|
|
|
|
|
|
|
|
|
|
|
|
|
| Summary of Operating and
Financial Data |
|
|
For the three months
ended |
|
12/31/20
|
|
9/30/20 |
|
Copper production (millions of
pounds) |
Cost of sales
($/lb) |
C1
cash costs ($/lb)a |
All-in sustaining
costs ($/lb)a |
Capital
Expend-ituresb |
|
Copper production (millions of
pounds) |
Cost of sales
($/lb) |
C1
cash costs
($/lb)a |
All-in sustaining
costs
($/lb)a |
Capital
Expend-ituresb |
| Lumwana |
78 |
1.96 |
|
1.58 |
|
2.60 |
|
48 |
|
|
62 |
2.06 |
|
1.49 |
|
2.58 |
|
63 |
|
Zaldívar (50%) |
23 |
2.68 |
|
2.01 |
|
2.70 |
|
29 |
|
|
24 |
2.20 |
|
1.64 |
|
2.27 |
|
17 |
|
| Jabal Sayid (50%) |
18 |
1.53 |
|
1.15 |
|
1.27 |
|
2 |
|
|
17 |
1.43 |
|
1.14 |
|
1.17 |
|
0 |
|
a.These are non-GAAP financial performance measures with no standardized meaning under IFRS and therefore may not be comparable to
similar measures presented by other issuers. For further information and a detailed reconciliation of each non-GAAP measure used in this section of the MD&A to the most directly comparable IFRS measure, please see pages 96 to 122 of this
MD&A.
b.
Includes both minesite sustaining and project capital expenditures.
Lumwana, Zambia
Copper production for Lumwana in the fourth quarter of 2020 was 26% higher compared to the prior quarter, resulting from a significant improvement in
throughput, as the prior quarter was affected by maintenance. Cost of sales per pound5 in the fourth quarter of 2020 was 5% lower than the prior quarter primarily due to lower depreciation expense. In the fourth quarter of 2020, all-in
sustaining costs per pound4 increased by 1% compared to the prior quarter, primarily due to higher C1 cash costs per pound4, partially offset by decreased minesite sustaining capital expenditures and the impact of lower sales
volumes.
Copper production in 2020 of 276 million pounds was near the top end of
the guidance range of 250 to 280 million pounds. Cost of sales per
pound5 of $2.01 was below the guidance range of $2.20 to $2.40 per pound, driven by the strong operating performance. C1 cash costs per pound4 of $1.56 and all-in sustaining costs4 of $2.43 per pound were both within the guidance ranges of $1.50 to $1.70 and $2.30 to $2.60 per pound, respectively.
Zaldívar (50% basis),
Chile
Copper production for Zaldívar in the fourth quarter of 2020 was 4% lower than the prior
quarter mainly due to lower grades. Cost of sales per pound5 in the fourth quarter of 2020 was 22% higher than the prior quarter, primarily due to additional costs recognized relating to the settlement of
labor contract negotiations. All-in sustaining costs per pound4 increased by 19% compared to the prior quarter, primarily due to the impact of higher C1 cash costs per pound4, as well as higher minesite sustaining capital expenditures that were previously deferred as a result of Covid-19 movement restrictions earlier in
the year.
Copper production in 2020 of 106 million pounds was below the bottom end
of the guidance range of 120 to 135 million pounds. Cost metrics per pound were within, or slightly below the guidance ranges benefiting from the impact of lower energy prices and a favorable exchange rate. Cost of sales per pound5 was $2.46 compared to guidance of $2.40 to $2.70 per pound. C1 cash costs per pound4 was $1.79, compared to guidance of $1.65 to $1.85 per pound, and all-in sustaining costs per pound4 was $2.25, compared to guidance of $2.30 to $2.60 per pound.
Following the completion of mining through a higher-grade zone for the last two years, we expect grades to decline in 2021. Major maintenance is
currently scheduled in the second quarter of 2021.
Jabal Sayid (50% basis), Saudi Arabia
Jabal Sayid's copper production in the fourth quarter of 2020 was 6% higher compared to the prior quarter, mainly due to an increase in throughput
following improvements to the milling circuit and higher plant availabilities. Cost of sales per pound5 in the fourth quarter of 2020 was 7% higher than the prior quarter as a result of increased depreciation and slightly higher C1 cash costs per
pound4. All-in sustaining costs per pound4 in the fourth quarter of 2020 increased by 9% when compared to the prior quarter, mainly due to increased minesite sustaining capital expenditures
on a per pound basis.
Copper production in 2020 of 75 million pounds exceeded the
guidance range of 60 to 70 million pounds, with the mine exceeding expectations on grade and tonnes, and the plant outperforming on both throughput and plant availabilities. All of the per pound cost metrics were significantly below the guidance
ranges, driven by increased production, lower fuel prices and higher gold by-product credits from copper concentrate sales. Cost of sales per pound5 was $1.42, compared to guidance of $1.75 to $2.00 per pound. C1 cash costs per pound4 was $1.11, compared to guidance of $1.40 to $1.60 per pound, and all-in sustaining costs per pound4 was $1.24, compared to guidance of $1.50 to $1.70 per pound.
|
|
|
|
|
|
|
|
|
| BARRICK YEAR-END 2020 |
53 |
MANAGEMENT’S DISCUSSION AND
ANALYSIS |
Growth Project Updates
Goldrush
Complex, Nevada, USA
At the Goldrush Complex, drilling operations continue at both Goldrush and
Fourmile (Fourmile is currently not included in the Nevada Gold Mines joint venture with Newmont, but may be contributed if certain criteria are met in the future). The main objectives of this drilling program remain orebody definition, testing of
orebody continuity, inferred resource growth and definition of exploration upside. Options for reducing the cost and timing of exploration drilling of Fourmile through underground access from Goldrush are currently being explored.
Contractor development of the twin exploration declines at Goldrush has now been
completed. The handover from contractor to owner development was completed in November 2020, according to plan. All equipment required for owner development arrived on site in the fourth quarter of 2020.
During 2021, underground development and exploration will continue at Goldrush.
First ore is expected to be exposed in the first half of 2021 as part of ongoing exploration and development activities, in line with previous guidance. Activities in 2021 will focus on verifying geological, geotechnical and geohydrological models
developed during the feasibility study until the Record of Decision ("ROD") is received. Following receipt of the ROD, construction of infrastructure to allow the ramp-up of production activities will
commence.
As at December 31, 2020, we have spent $221 million (including $22
million in the fourth quarter of 2020) on the Goldrush project, inclusive of the exploration declines (100% basis). The current capital estimate for the Goldrush project remains under review, subject to the completion of the final Goldrush
feasibility study. The study documentation is now expected to be completed in the second quarter of 2021.
Permitting activities continued to advance largely on-track. However, we now expect the receipt of a positive ROD in the first quarter of 2022
(previously the fourth quarter of 2021). This updated schedule does not impact the current mineplan at this time.
Mineral reserves at Goldrush are unchanged from 2019, and will be updated following the completion of the feasibility study currently underway. As of
December 31, 2020, attributable mineral resources total 26 million tonnes at 6.57 g/t Au for 5.5 million ounces in the indicated category (inclusive of reserves), and 12 million tonnes at 6.2 g/t Au for 2.5 million ounces in the inferred
category. Resource growth in 2020 is based on an optimized underground stoping design that anticipates increased use of bulk mining methods, allowing for greater mining flexibility and an associated reduction in cut-off grades. As such, the 2020
mineral resource base reflects higher tonnes and lower grades compared to 2019, as well as a reclassification of a portion of indicated resources to inferred based on a review of modelling parameters. The 2019 mineral resource base was 26 million
tonnes at 7.80 g/t Au for 6.6 million ounces in the indicated category (inclusive of reserves), and 4.8 million tonnes at 7.6 g/t Au for 1.2 million ounces in the inferred category.
We have also increased our geological confidence in Fourmile, which currently
sits outside of the Nevada Gold Mines joint venture. Fourmile has grown its total mineral resource year-over-year following an extensive exploration and MRM program, allowing us to now declare a portion in
the indicated resource category. As of December 31, 2020, Fourmile’s indicated resource is 1.4 million tonnes at 10.22 g/t Au containing
0.47 million ounces, with an inferred resource of 6.6 million tonnes at 10.9 g/t Au containing 2.3 million ounces.
Turquoise Ridge Third Shaft, Nevada, USA11
Construction of the Third Shaft at Turquoise Ridge, which has a hoisting capacity of 5,500 tonnes per day, continues to advance according to schedule
and within budget. We continue to expect commissioning in late 2022. Together with increased hoisting capacity, the Third Shaft is expected to provide additional ventilation for underground mining operations as well as shorter material haulage
distances.
Construction activities continued in the fourth quarter of 2020,
including the excavation and lining of the first loading pocket, ongoing shaft sinking activities as well as surface construction works focused on the permanent materials handling system. The excavation of the first loading pocket marks the first
connection to the mine workings at 695 meters below collar. Shaft sinking has continued below the loading pocket and has now advanced to a depth of approximately 740 meters below the collar as of December 31, 2020.
As of December 31, 2020, we have spent $166 million (including $11 million in the
fourth quarter of 2020) out of an estimated capital cost of approximately $300-$330 million (100% basis).
Pueblo Viejo Process Plant and Tailings Expansion, Dominican Republic12
Studies for the process plant and tailings expansion at the Pueblo Viejo mine remain supportive of an increase in throughput to 14 million tonnes per
annum, allowing the operation to maintain minimum average annual gold production of approximately 800,000 ounces after 2022 (100% basis).
The process plant expansion flowsheet includes an additional primary crusher, coarse ore stockpile and ore reclaim delivering to a new single stage
semi-autogenous (“SAG”) mill. A new flotation circuit will concentrate the bulk of the sulfide ore prior to oxidation. The concentrate will be blended with fresh milled ore to feed the modified autoclave circuit, which will have
additional oxygen supplied from a new 3,000-tonnes-per-day facility. The existing autoclaves will be upgraded to increase the sulfur processing capacity of each autoclave through additional high-pressure cooling water and recycle flash capability
using additional slurry pumping and thickening.
Engineering design of the process
plant expansion continued to progress during the final quarter of 2020, with basic engineering now complete. Overall engineering of the process plant expansion is now 50% complete. Bulk steel fabrication contracts and the first major construction
contract have been awarded. Procurement contracts and purchase orders are being placed in accordance with the schedule and costs are within budget.
Construction for the process plant expansion continued to ramp up during the fourth quarter of 2020 following approval of the Environmental Impact
Assessment in the prior quarter. Bulk earthworks for the accommodation, primary crusher, stockpile, oxygen plant and flotation areas of the process plant expansion were completed. Field investigations focused on geotechnical and groundwater
|
|
|
|
|
|
|
|
|
| BARRICK YEAR-END 2020 |
54 |
MANAGEMENT’S DISCUSSION AND
ANALYSIS |
conditions, while engineering design is progressing according to plan for the infrastructure and waste
stockpile extensions. Land acquisition has commenced for the freshwater pipeline relocation. We continue to expect completion of the process plant expansion by the end of 2022.
The social, environmental and technical studies for additional tailings capacity to support the expansion of the process plant continued to advance.
The Dominican Republic government and relevant national authorities are actively supporting the project. The efforts are now focused on community relations and baseline environmental monitoring.
As of December 31, 2020, we have spent $91 million (including $64 million in the
fourth quarter of 2020) out of an estimated capital cost of approximately $1,300 million (100% basis).
Bulyanhulu Re-Start Project and Feasibility Study
The Bulyanhulu underground ramp-up was on track in the fourth quarter of 2020, with production ahead of plan by 6% on the back of a successful
stoping campaign. The production ramp-up is scheduled to continue through the first half of 2021 and reach annualized steady-state production by 2022.
The updated geological model for Reef 1 was successfully validated with a campaign feed test at the mill and an infill grade-control drill program.
This model now forms the basis for the 2020 mineral resources and mineral reserves update. Further test work is currently underway to develop a geo-metallurgical model for optimization of the life-of-mine
plan.
The feasibility study for the optimized mine plan at Bulyanhulu continues to
progress and successfully define extensions to the underground mineral resource within the high-grade Deep West zone. Updated geotechnical numerical models were completed in the fourth quarter of 2020, which will be used in conjunction with planned
metallurgical test work to define the optimal mining sequence for the feasibility study. Further geological re-modeling of Reef 2 mineralization is planned for the first quarter of 2021 to advance the work already completed. We continue to expect
completion of the feasibility study in the second half of 2021.
Strong recoveries
of low carbonaceous ore from the gravity and carbon-in-leach (“CIL”) flowsheet during plant commissioning has led management to consider a flowsheet change to produce more gold in doré by leaching before sulphide flotation. This
would produce approximately 90% of gold on site in doré bullion, with a much smaller amount reporting to a flotation concentrate, which mostly contains copper. The forward leach (leaching before the flotation stage) would involve higher cyanide
consumption from partial copper dissolution, but the economics of this potential processing route are encouraging. The current ore feed is amenable to this flowsheet change, but the other ore types may still require a “flotation before
leach” approach to deal with more refractory (carbonaceous) material in those domains. The different process options require piping changes for each configuration, but with better understanding of the metallurgy, there may be other options on
processing routes and ore campaigning. Trade-off studies to assess this benefit on recovery against the
impact on planning and mining sequence will be completed, alongside additional drilling to define the different geometallurgical domains within the
overall orebody. The ability to beneficiate more gold into doré and minimize gold content in the sulphide flotation concentrate would be a major improvement for Bulyanhulu as we optimize the
mineplan.
Zaldívar Chloride Leach
Project, Chile
Zaldívar is jointly owned by Antofagasta and Barrick, and is operated by
Antofagasta.
In December 2019, the Board of Compañía Minera
Zaldívar approved the Chloride Leach Project. The capital cost of the project of $189 million (100% basis) consists of the cost of execution and commissioning. The project contemplates the construction of a chloride dosing system, an upgrade of
the solvent extraction plant and the construction of additional washing ponds.
In
the fourth quarter of 2020, the construction camp was completed and site construction work started. The excavation for foundations and initial concrete works were completed at the salt storage and brine preparation areas. The work at the solution
extraction area focused on the excavation and initial concrete works for channels, washing ponds and decanters. Inside the solution extraction area, the first of four streams was stopped for modifications, which are progressing according to
schedule.
Overall progress is at 42% completion. Project costs are trending in
line with the approved budget and completion is expected in the first half of
2022.
Upon commissioning, the project is expected to increase copper recoveries by
more than 10 percentage points through the addition of chlorides to the leach solution and with further potential upside in recoveries possible depending on the type of ore being processed. This process is based on a proprietary technology called
CuproChlor® that was developed by Antofagasta at its Michilla operation, which had similar ore types to those that are processed at Zaldívar. Once completed and in full operation, the project is expected to increase production at
Zaldívar by approximately 10 to 15 thousand tonnes per annum at lower operating costs over the remaining life of mine.
Veladero Power Transmission Project, Chile-Argentina
In 2019, we commenced construction of an extension to the existing Pascua-Lama power transmission line to connect to Veladero. Upon completion, the
power transmission line will allow Veladero to convert to grid power exported from Chile and cease operating the current high-cost diesel generation power plant located at site. A power purchase price agreement was executed during the fourth quarter
of 2019 to supply power from renewable energy that will significantly reduce Veladero’s carbon footprint. This is expected to save 32 million liters of fuel per year and reduce CO2 emissions by 83,000 tonnes per year upon commissioning.
We are engaging various contractors with the aim to re-mobilize in the first quarter of 2021 following quarantine and movement restrictions in
response to the Covid-19 pandemic in 2020, which delayed construction. We continue to expect completion of the Veladero power transmission project by the end of 2021.
|
|
|
|
|
|
|
|
|
| BARRICK YEAR-END 2020 |
55 |
MANAGEMENT’S DISCUSSION AND
ANALYSIS |
Exploration and Mineral Resource Management
The foundation of our exploration strategy starts with a deep organizational understanding that
exploration is a value driver for the business and an investment - not a process. Our strategy has multiple elements that all need to be in balance to deliver on the Group's business plan for growth and long-term
sustainability.
Firstly, we seek to deliver projects of a short-to medium-term
nature that will drive improvements in mine plans. Secondly, we seek to make new discoveries that add to Barrick's Tier One1 portfolio. Thirdly, we seek to optimize the value of major undeveloped projects. Finally, we seek to identify emerging opportunities early in their
value chain and secure them by an earn-in or outright acquisition, where appropriate.
Our exploration approach is to first understand the geological framework and ore controls. We then design exploration programs around that
understanding, instead of simply drilling for mineralized intervals. This has put us in good stead with robust results from multiple projects highlighted in the following
section.
North America
Current exploration efforts are focused on finding extensions of Tier One1 deposits, many of which are in operation. Earlier stage exploration is targeting value creating discoveries and continues to open up new frontiers
in Nevada, as well as around Hemlo. At the deposit scale, geological cross-sections were updated at all mines. Building on the sectional interpretation, models are being continuously upgraded with notable advances during the fourth quarter of 2020
at Turquoise Ridge, Leeville, Ren, Goldrush and Fourmile. Exploration and delineation activities are well aligned with the 2021 business and life of mine plans.
Carlin, Nevada, USA13, 14, 15, 16
North of Leeville, targeting is following up on high-grade mineralization along the Basin Bounding fault to realize the full potential of this
emerging growth target and add this to the mine plan. Five holes of a seven-hole program initiated in the third quarter of 2020 were completed, with the last two holes in progress at the end of the year. Together with previous intercepts, results of
32.9 meters at 16.9 g/t Au and 12.3 meters at 18.3 g/t Au confirm significant potential in the footwall of the Basin Bounding fault near the intersection of the north and south margins of a buried stock. Results from two scout holes drilled
along the eastern edge of the target area intersected thick intervals of variably altered favorable host rock, though ore grade mineralization was not identified. Closer to the mine, the search space has expanded westward by 30 to 100 meters as the
location of major faults, including the Basin Bounding fault, are better constrained by the additional core holes. Taking advantage of this, drilling from underground continues to extend the Turf orebody to the north and west. Results from a fan of
delineation holes at the northwest edge of the Turf resource highlight the growth potential and includes intercepts of 10.7 meters at 11.1 g/t Au and 12.2 meters at 10.6 g/t Au. Following strong results of 82 meters at 23.8 g/t Au in the
prior quarter, the best intercept in the fourth quarter of 2020 was 12.7 meters at 17.3 g/t Au, which follows the footwall contact of an ore bounding dike highlighting the importance of this secondary control. Drilling to add resources and
support reserve conversion continues from both surface and underground
platforms.
Across Little Boulder Basin to the west, drilling along the Post-Gen fault, an important district-scale ore controlling structure transecting the
north Carlin Trend, successfully followed up on mineralization recently intersected. A daughter hole was directionally drilled from a hole reported in the prior quarter and further delineates strong alteration along the down-plunge extension of the
Deep Post orebody. Three kilometers along strike to the south, drilling following up on the interpreted feeder of the Tristar deposit, an active open pit mine, intersected multiple significant intercepts including 3.7 meters at 14.7 g/t Au and
2.9 meters at 17.1 g/t Au. These results are higher grade than adjacent results and additional follow-up is planned.
Cortez, Nevada, USA17
At Cortez Hills, drilling from underground platforms continues to test extensions, with a focus on targeting feeder zones below the mine. Drilling
targeting a 160 meter down-dip offset of known mineralization along a potential feeder structure confirmed the presence of metasomatism and sulfidation. The drilling yielded two significant intervals, including 7.8 meters at 7.8 g/t Au,
extending previous mineralization adjacent to the mine, and a second 8.7 meters at 4.8 g/t Au, supporting the interpretation of a feeder structure along the Hanson Fault. These results, along with those reported in the second quarter of 2020,
are early stage but conceptually encouraging. Additional drill programs further testing the feeders and other ore controlling features are planned in the first quarter of 2021.
On the western side of the district, sectional interpretation is ongoing between the Carlin-type Pipeline and Crossroads deposits as well as the
intrusive-related mineralization at Robertson five kilometers to the north. The relationship between the deposits is unclear and understanding the geology and mineralization potential between them is a
priority.
Fourmile, Nevada, USA18
The Fourmile year-end resource has significantly increased from 2019 as highlighted in the Reserves and Resources section of this MD&A.
Significant exploration upside remains, which we aim to convert to resources over time. This drilling will need to be from the surface with regards to defining orebody occurrences and evaluating the potential of the entire project area. All
indications are that the evaluation of the orebodies themselves would best be done via underground drilling programs. Drilling activities have stopped given the winter season, and will resume in the first quarter of 2021. Exploration will then focus
on establishing a geological framework well beyond the existing resource, where the character of mineralization appears to be changing again.
Turquoise Ridge, Nevada, USA
During the fourth quarter of 2020, work continued to refine the Turquoise Ridge underground geological model. Focus has been placed on upgrading the
grade control model that encompasses the bulk of active headings to provide an improved foundation for mine design, planning, and reconciliation. These improvements will expand to the entire deposit with additional modeling milestones in the first
and second quarters of 2021. At the district scale, sectional interpretation continues across the sparsely drilled corridor between the Turquoise Ridge and Twin Creeks operations, identifying targets in the process for future testing.
|
|
|
|
|
|
|
|
|
| BARRICK YEAR-END 2020 |
56 |
MANAGEMENT’S DISCUSSION AND
ANALYSIS |
Hemlo, Canada
Land consolidation east of Hemlo has doubled the prospective search space across the camp following a property acquisition and the completion of two
option agreements. Knowledge from the Hemlo orebody will be leveraged as exploration activities ramp up at the new properties.
At the Blackfly target west of the mine, all seven holes of a 2,000-meter surface drill program to follow up on results from trenching, intersected
the same horizon that was mineralized in trenches. This highlights the potential to expand mineralization to the west.
Below the B Zone (also known as Main Zone), a recently completed hole, testing multiple concepts adjacent to the important Moose Lake porphyry
intersected a 15- to 20- meter-thick zone of feldspar-molybdenite-pyrite-barite alteration that resembles the Main Zone. The intercept is in a sparsely tested area, hundreds of meters below the deepest development, opening up a large area
down-plunge of the Main Zone for
follow-up.
Latin America & Asia
Pacific
Pueblo Viejo, Dominican
Republic
A second phase of the 3D induced polarization (“IP”) geophysics survey was
completed during the fourth quarter of 2020. A northwest trending resistivity and chargeability anomaly coincides with soil and rock chip sample anomalies. The anomalies are cut by projected late low angle structures, with a series of
partially-tested and untested zones at relatively shallow depths. At least one of these anomalies will require further investigation, with drilling expected in 2021.
A state-of-the-art structural model was completed at Pueblo Viejo during the third quarter of 2020. The model was projected over the entire property,
improving the understanding of mineralization controls in the district, and unlocking a new generation of brownfield targets. Follow-up mapping and sampling in one of those targets, Zambrana, has revealed significant mineralization in rock chips.
Detailed mapping and soil sampling continue.
A drill permit for Target Area 1 in
the Pueblo Grande Joint Venture was granted during November 2020. An initial exploration campaign of 2,500 meters commenced in late December 2020.
El Indio Belt, Argentina and Chile
At Pascua-Lama, a four-rig 5,400-meter geometallurgical drill campaign was initiated. The drilling is designed to test the geometallurgy assumptions
of the previously completed update to the “data-driven” 3D geological model. The objective of this campaign is to test the link between the underlying deposit geology, impact to ore type definition, processing options, recovery and
project valuation. At the Penelope deposit (a satellite of Lama), a smaller geometallurgical drill campaign resumed. This program aims to collect additional metallurgical data, with a specific focus on heap leach potential.
A new structural framework study completed for Del Carmen-Alturas in the third
quarter of 2020 was a significant component of drill planning for 2021. Detailed mapping in Chibolita and Rojo Grande North is in progress, where drilling is scheduled to start in the first quarter of 2021.
Fieldwork commenced at Bañitos within the El Indio mine camp in Argentina.
This target spans 16 km2, and 260 talus fines samples on a 200 meter by 200 meter
grid have been collected (27% of planned samples). Detailed mapping is ongoing.
Veladero,
Argentina
At the district level, fieldwork continued at two brownfield targets, slated for drill
testing in the first quarter of 2021. Field review of the Veladero Sur target found evidence of potential for a porphyry Au-Cu system. Further work will be conducted during the current field season to validate the
concept.
Work resumed in other targets in the district, such as Penelope, Lama
East and Cerro Pelado. At Cerro Pelado, detailed mapping recognized steam-heated and advanced argillic alteration in an area previously not identified, opening up the target to the southeast. Drilling commenced in January 2021.
Porgera, Papua New
Guinea
As discussed on page 36, Porgera has been placed on temporary care and maintenance and
consequently, all exploration activities have
ceased.
Lagunas Norte,
Peru
In the Lagunas Norte district, a new 3D model was completed, using compilation and analysis of
over 20 years of historic mapping. This included the construction of 21 east-west and three north-south traverse geological sections in the field, allowing for the verification of historical information and improvement of geological understanding.
This upgraded geological model reveals a district scale preservation control to mineralization and identifies new targets. Follow-up mapping in Las Ruecas has identified potential for a porphyry gold-copper system at the Gabriela
target.
Southern
Peru
An airborne magnetic survey was successfully completed over the Tumaruma project. Preliminary
data shows an area of low magnetic response related with the Tumaruma target that correlates with silica and advanced argillic alteration recognized during mapping, as well as a high magnetic anomaly in the southwest edge of the Austral target.
Assays received from bulk leach extractable gold (“BLEG”) and rock chip sampling confirms the potential for an intrusive-related mineralized
system.
Japan Gold
Strategic Alliance, Japan
The first phase of stream sediment and rock chip sampling over the Kitami
metallogenic province of Hokkaido was completed during the fourth quarter of 2020. Ground gravity surveys were completed over four projects of the Hokusatsu region in the Southern Kyushu epithermal gold
province.
A total of 650 BLEG and 1,100 rock chip samples were collected during
the fourth quarter of 2020. Samples were submitted for analysis and BLEG results for the Sanru, Aibetsu and Tenyru projects were received at quarter-end and are currently being reviewed.
The initial regional assessment program of the projects within the Strategic Alliance included BLEG stream sediment sampling and rock float
geochemical sampling. Geochemical sampling has been completed on 20 out of 30 Strategic Alliance projects throughout Japan. Sediment samples are being collected systematically across all project areas to define gold and pathfinder element anomalies
associated with gold bearing epithermal vein
|
|
|
|
|
|
|
|
|
| BARRICK YEAR-END 2020 |
57 |
MANAGEMENT’S DISCUSSION AND
ANALYSIS |
systems. Once anomalous catchments are identified, further investigation is carried out upstream along the
anomalous drainages to define the point of entry of precious metals.
Gravity data
has been used to assist in understanding structural controls that are favorable to gold mineralization at both the regional and project levels. Additional processing of the gravity data will enhance fault detection and support targeting of more
focused geophysical surveys, together with subsequent drilling. Gravity surveying has been completed on eight out of fifteen Strategic Alliance projects in Southern Kyushu.
As results of the geophysical and geochemical programs are received, we expect to identify new highly prospective areas in the major gold provinces
of Japan.
One new project was added to the Strategic Alliance during the quarter,
the Kowa Project adjoining the Mizobe-Onoyama Project in Southern Kyushu.
Reunion Gold Strategic Alliance, Guiana Shield
Auger sampling was completed on the Aremu project in Guyana, and results of the 2020 field program were under review at quarter-end.
A new project has been added to the Strategic Alliance, the NW Extension project
in Suriname. The project is located 60 kilometers southwest of the capital of Paramaribo, and covers the continuation of the greenstone belt under sand cover. An airborne magnetic survey is planned for early 2021.
Africa & Middle
East
Bambadji, Senegal19
At Bambadji, drilling resumed after the wet season hiatus with strong results returned from the follow-up program at Kabewest. In the central part of
the target, diamond drilling confirmed the extension of the hydrothermal breccia system 150 meters down-dip returning 10.5 meters at 4.24 g/t Au and 3.0 meters at 13.26 g/t Au. Step-out reverse circulation (“RC”) drilling
succeeded at extending the system 250 meters further to the northeast with a good intercept of 50 meters at 2.08 g/t Au hosted both in hydrothermal breccias and limestones. Currently, two northeast striking mineralized zones have been
delineated, with a more continuous zone in the east that extends over 500 meters and remains open to the north. Drilling is underway to continue developing this promising target.
A six-fence RC program is underway at Dakota to test a broad auger anomaly in the Faleme volcanics. First holes intersected multiple potential
mineralized zones hosted within an altered porphyritic diorite and volcaniclastics in an area coinciding with a chargeability anomaly defined from a gradient array induced polarization survey. Results are
pending.
Diamond drilling is underway at Gefa in the south of the Bambadji permit
to provide lithological and structural controls at the more than five-kilometer-long shear system previously defined through RC drilling. Once the five-hole program is complete and results are received, infill RC drilling will reduce drill spacing
along the strongest parts of the system. At Latifa, drilling confirmed the continuity of the system over 800 meters to the north of the target but did not succeed in delineating any high-grade shoots. Auger drilling is planned to resume in the first
quarter of 2021 to test the remaining prospective gaps of the Bambadji
permit.
Loulo-Gounkoto, Mali20, 21
At Loulo, framework drilling continued at the Yalea Transfer Zone South Extension, 660 meters south of the 2019 block model and 160 meters
down-plunge of the drill hole intercept reported in the third quarter of 2020 (43.8 meters at 5.35 g/t Au; true width of 21.8 meters). Initial observations confirm the extension of the system and suggests that thicker and higher-grade
mineralization can be expected down-dip. At Yalea Shear South, framework drilling continues ahead of wide-spaced step-out holes planned for the second quarter of 2021 to test the potential for concealed shoots south of the Transfer
Zone.
At Yalea Ridge North (“YRN”), final assay results were received
for the remaining two of four scout holes and include 7.2 meters at 4.93 g/t Au, 3.3 meters at 4.33 g/t Au, 5.5 meters at 3.91 g/t Au, and 7.9 meters at 1.92 g/t Au. The presence of hematite altered cataclasite and quartz-hematite
veining cutting the core axis support the original target model concept of east-northeast trending mineralized fracture zones. The overall program has also confirmed the presence of bedding parallel mineralized zones. The next step at YRN is to
design several optimally oriented RC drill fences to cut the trend obliquely and confirm the potential for open pit upside.
At Yalea Ridge Main (“YRM”), the initial two greenfields scout holes intersected strong zones of visible gold. YRDH010 returned assays
of: 5.0 meters at 18.09 g/t Au, 8.7 meters at 7.47 g/t Au, 3.9 meters at 12.30 g/t Au, and 4.7 meters at 6.66 g/t Au. As the first and northernmost holes drilled on a prospective 900-meter strike trend, the results are
encouraging, as is the abundant visible gold. The drill hole also confirms upside potential to the north of the currently defined YRM area of interest, with additional drilling required. The higher-grade zones that were intersected appear to confirm
the target model concept – with brittle structures generally at a right angle to the core axis. If the subsequent holes continue to confirm the target model concept, the next phase of drilling will be planned to optimally cut the host package
stratigraphy at an acute angle and confirm open pit upside.
Drilling at DB1 has
continued to be hampered by a combination of poor ground conditions and drill performance with four of six holes failing to reach the target depth. Of the holes that have been completed or partially completed, DB1RC029 returned assays of 2.00 meters
at 9.15 g/t Au from 268.0 meters, although the drill hole was abandoned in the mineralized zone. DB1RC027 drilled up-dip on the section and returned assays of 5.0 meters at 2.66 g/t Au from 67.0 meters, highlighting good overall upside in
the southern DB1 area. The plan in the first quarter of 2021 is to extend RC drill coverage to the north and south to define the strike extents and footprint of the system. Later in 2021, geological and resource models will be compiled followed by a
preliminary pit optimization to assess economics
Regional Exploration, Mali
In Mali South, integration of new field data with geophysics and geochemistry on the Diangoumerila and Mogoyafara permits highlighted prospective
areas of structural complexity with suppressive regolith. These areas will be tested with auger programs in the first quarter of 2021 before initiating follow-up air core and RC drilling. Elsewhere, generative work continues in the Kenieba-Kedougou
Inlier and in Mali
South.
|
|
|
|
|
|
|
|
|
| BARRICK YEAR-END 2020 |
58 |
MANAGEMENT’S DISCUSSION AND
ANALYSIS |
Tongon, Côte d'Ivoire22
The drill testing of targets continued with the aim of delivering potential satellite resources to extend Tongon's mine life. On the Stabilo trend,
eight kilometers north of the mill, three mineralized zones were identified by following up on saprolite anomalies defined through an auger drilling program. These zones, one located at Seydou North and two at Jubula, are between 200 and 400 meters
of strike length and remain open. At Seydou North, results include 13.0 meters at 1.38 g/t Au, 4.0 meters at 5.90 g/t Au and 4.0 meters at 7.69 g/t Au. At Jubula, highlight intercepts include 12.0 meters at 2.28 g/t Au, 9.0 meters at
4.14 g/t Au and 7.0 meters at 1.19 g/t Au. Infill and step-out RC drilling is planned in the first quarter of 2021.
At Zulu West, located 21 kilometers from the processing plant, RC drilling did not succeed at replicating the mineralization down-dip. However,
several shallow holes returned encouraging results. Large gaps along the structure, most notably a 600-meter section in the central part of the target with ancient artisanal workings will be tested in the first quarter of
2021.
Regional
Exploration, Côte d'Ivoire
Exploration at Boundiali in the fourth quarter of 2020 involved
data review with some additional fieldwork to prepare for drilling. The key objective of this work was to better define the style and potential controls on higher-grade mineralization. Work included trenching to the south of the Sani target to
confirm the extension of a high-grade shear. Results from this work are pending. At the centre of Sani, structural intersection lineations were interpreted between the main north-northeast trend and northeast cross-cutting structures. Trenching
across this area yielded good results. Extension and step-out trenching was also undertaken at Caribou to define strike continuity and advance the target to drill stage. Results are pending. Meanwhile, detailed mapping at Kassere defined
intersection lineation controls on high grades in the south of the prospect. Separately, the review of Fonondara will be conducted early in 2021. Drilling on priority targets at Boundiali is expected to continue through to mid-2021 to establish the
potential for satellite resources to Tongon.
On the Sissedougou permit, two
diamond holes tested Gbongogo North for an intrusive-related mineralized system similar to Gbongogo Main but with its preserved apex and potential mineralized carapace. Both holes intersected the targeted intrusive and although it is strongly albite
and tourmaline altered, only weak grade is expected. Two scissor RC holes tested the Yere North intrusive target previously delineated by a trench. The holes confirmed the presence of granodiorite and a feldspar porphyry expected to be mineralized
based on RC chip observations. Samples from the previous auger programs conducted at Kagon and ANV were submitted for multi-elements analysis to assist in delineating potential footprints of intrusive-related mineralization systems similar to
Gbongogo Main. This data is expected to help prioritize follow-up programs to be conducted in the first quarter of 2021.
In southeast Côte d’Ivoire, the stream sediment sampling program to cover the Ketesso Shear is planned in early 2021.
Kibali and Ngayu Belt,
Democratic Republic of
Congo23,24
At KCD, results for the deep hole DDD603 (completed in the third quarter of 2020) were received. This hole was drilled to test the down-plunge
continuity of the KCD system, 500 meters northeast of previous deep hole DDD602. DDD603 was designed to provide a geological
framework and look for evidence of continuity of the mineralizing system. The hole successfully confirmed the presence of KCD alteration
corresponding to the periphery of the 9000 lode and results were better than expected. Highlight intercepts include 5.9 meters at 1.37 g/t Au from 1,368.6 meters as well as 11.5 meters at 0.99 g/t Au from 1,397.5 meters, including 2.0 meters
at 2.45 g/t Au.
A drill program was initiated at Tete Bakangwe in an area
characterized by extensive alteration, favorable host rocks and a similar structural setting to KCD. The drill program will also test the Pakaka middle lens mineralization located below the Pakaka main mineralized
system.
At Ikamva East, an RC program was completed, testing mineralization on the
sheared upper and lower contacts of a folded banded iron formation (“BIF”). Overall, results support a discontinuous zone of mineralization related to the upper BIF contact, that pinches and swells down-plunge. The upper contact includes
northeast trending plunging shoots of higher grade, averaging 15 to 25 meters wide. Highlight intercepts include hole IVRC0276 returning 28.0 meters at 4.17 g/t Au, including 4.0 meters at 5.96 g/t Au and 5.0 meters at 14.03 g/t Au. Full
assessment of the potential is ongoing.
At Madungu, while results from the
recently completed RC program returned only anomalous values, the drilling has shown an extensive alteration system, which coupled with favorable lithologies and structural complexity, demonstrates this area deserves follow-up.
At Ngayu, drilling was completed at Mokepa with four wide-spaced holes testing a
sheared east-northeast trending BIF system over a two-kilometer strike length. Positive results returned for the two holes collared 600 meters apart in the central part of the system included 9.2 meters at 1.83 g/t Au in ADDD0001 as well as 18.4
meters at 2.64 g/t Au, including 11.9 meters at 3.04 g/t Au, in ADDD0002. Two additional holes seeking extensions returned only weak mineralization, indicating the system weakens or controlling structures are not oriented parallel to the
lithologies (the BIF/volcanic rocks contact).
North Mara, Bulyanhulu and Buzwagi,
Tanzania
All historic drilling at the North Mara district has been logged and sampled for
multi-element geochemistry. Results have identified prospective geology, alteration and pathfinder element enrichment beneath extensive phonolite cover to validate several new greenfields targets along the Gokona Trend, Mara Shear and associated
cross structures. Of these, Conjunction and Shakta have progressed through target-scale fieldwork that includes mapping and soil sampling and are drill-ready for the first quarter of 2021. Scout drilling at Kofia was completed and showed a decrease
in hydrothermal alteration intensity, changes to the host sequence with significantly less andesitic porphyry and wider intervals of mafic schist compared to Gokona, 800 meters to the east. Drilling intersected narrow zones of sub-economic
mineralization and the exploration focus has now moved further along strike to new greenfields targets. Field teams are exploring five greenfields areas of interest at North Mara, while a review and deposit-scale geologic model update commences at
Rama to identify near-mine upside opportunities in the first half of 2021.
At
Bulyanhulu, field mapping has validated three priority greenfields targets located two kilometers northeast of Reef 2, with a combined prospective strike length of six kilometers. Folding of a thick ash tuff unit flanked by basalt and mafic rocks to
the northeast and an intercalated
|
|
|
|
|
|
|
|
|
| BARRICK YEAR-END 2020 |
59 |
MANAGEMENT’S DISCUSSION AND
ANALYSIS |
sequence of gabbros and argillites to the southwest provides look-alike geologic settings to Reef 1 at the
Pacha target and Reef 2 at the Ndovu/Madini targets, respectively. Widespread cover of alluvium and Mbuga lacustrine sediments has also preserved exploration potential. Going forward, geochemical sampling and scout drilling are being motivated
to advance these targets in early 2021.
Jabal Sayid, Kingdom of Saudi Arabia
At Jabal Sayid, the drill program is on track to convert additional inferred resource into the life of mine plan. It continues to highlight extension
opportunities at the known lodes and to outline new potential at greenfields targets.
Building on the exploration success in the third quarter of 2020, surface and underground drilling has recommenced at Lode 1. The drill targets
include extensions to known mineralization as well as a conceptual feeder to the Lode 1 massive sulfide. Initial results from
metallurgical studies have been received, highlighting economic copper recoveries with final results expected in the first quarter of
2021.
At Lode 4 East, the program is infill drilling a 125-meter strike extension
to the high-grade Lode 4 feeder, in order to upgrade inferred ounces and bring them into the life of mine plan. Early indications for this zone support the development of new underground infrastructure. Underground drilling at Lodes 2 and 4
continues to extend mineralization and further develop the geological
model.
Promising Volcanogenic Massive Sulfide (“VMS”)-style alteration
and mineralization has been intersected in maiden drillholes at the South and East Gossan targets. Significant drill gaps have been identified along the target palaeosurface (chert) associated with the known lodes. A down-hole geophysical survey to
ascertain conductive responses to mineralization at these targets has been planned for the first quarter of 2021.
|
|
|
|
|
|
|
|
|
| BARRICK YEAR-END 2020 |
60 |
MANAGEMENT’S DISCUSSION AND
ANALYSIS |
REVIEW OF FINANCIAL
RESULTS
Revenue
|
|
|
|
|
|
|
|
|
|
|
|
|
|
|
|
|
|
| ($ millions, except per ounce/pound data in
dollars) |
For the three months ended |
For the years ended |
| |
12/31/20
|
9/30/20 |
12/31/20
|
12/31/19 |
12/31/18 |
| Gold |
|
|
|
|
|
000s oz solda |
1,186 |
|
1,249 |
|
4,879 |
|
5,467 |
|
4,544 |
|
000s oz produceda |
1,206 |
|
1,155 |
|
4,760 |
|
5,465 |
|
4,527 |
|
Market price
($/oz) |
1,874 |
|
1,909 |
|
1,770 |
|
1,393 |
|
1,268 |
|
Realized price ($/oz)b |
1,871 |
|
1,926 |
|
1,778 |
|
1,396 |
|
1,270 |
|
Revenue |
3,028 |
|
3,237 |
|
11,670 |
|
9,186 |
|
6,600 |
|
| Copper |
|
|
|
|
|
millions lbs solda |
108 |
|
116 |
|
457 |
|
355 |
|
382 |
|
millions lbs produceda |
119 |
|
103 |
|
457 |
|
432 |
|
383 |
|
Market price
($/lb) |
3.25 |
|
2.96 |
|
2.80 |
|
2.72 |
|
2.96 |
Realized price ($/lb)b |
3.39 |
|
3.28 |
|
2.92 |
|
2.77 |
|
2.88 |
Revenue |
195 |
|
219 |
|
697 |
|
393 |
|
512 |
|
| Other sales |
56 |
|
84 |
|
228 |
|
138 |
|
131 |
|
| Total revenue |
3,279 |
|
3,540 |
|
12,595 |
|
9,717 |
|
7,243 |
|
a.Includes North Mara, Bulyanhulu and Buzwagi on a 84% basis starting January 1, 2020 (and on a 63.9% basis from January 1, 2018
to September 30, 2019; notwithstanding the completion of the Acacia transaction on September 17, 2019, we consolidated our interest in Acacia and recorded a non-controlling interest of 36.1% in the income statement for the entirety of the third
quarter of 2019 as a matter of convenience; and on a 100% basis from October 1, 2019 to December 31, 2019), Pueblo Viejo on a 60% basis, South Arturo on a 36.9% basis from July 1, 2019 onwards as a result of the contribution to Nevada Gold Mines
(and on a 60% basis from January 1, 2018 to June 30, 2019), and Veladero on a 50% basis, which reflects our equity share of production and sales. Commencing on January 1, 2019, the effective date of the Merger, also includes Loulo-Gounkoto on an 80%
basis, Kibali on a 45% basis, Tongon on an 89.7% basis, and Morila on a 40% basis until the second quarter of 2019. Also removes the non-controlling interest of 38.5% Nevada Gold Mines from July 1, 2019 onwards. Copper pounds include our equity share of Zaldívar and Jabal Sayid.
b.Realized price is a non-GAAP financial performance measure with no standardized meaning under IFRS and therefore may not be
comparable to similar measures of performance presented by other issuers. For further information and a detailed reconciliation of each non-GAAP measure used in this section of the MD&A to the most directly comparable IFRS measure, please see
pages 96 to 122 of this MD&A.
Both 2020
gold and copper production of 4.8million ounces and 457 million pounds, respectively, were within the guidance ranges of 4.6 to 5.0 million ounces and 440 to 500 million pounds,
respectively.
Q4 2020 compared to Q3
2020
In the fourth quarter of 2020, gold revenues decreased by 6% compared to the third quarter of
2020 primarily due to a lower realized gold price4, combined with lower sales volume. The average market price for the three-month period ended December 31, 2020 was $1,874 per ounce versus $1,909
per ounce for the prior quarter. During the fourth quarter of 2020, the gold price ranged from $1,765 per ounce to $1,966 per ounce and closed the quarter at
$1,888 per ounce. Gold prices in the quarter continued to be volatile as a result of impacts relating to the Covid-19 pandemic, including the
progress of vaccine approvals and distribution, as well as the fiscal and monetary stimulus measures put in place by governments and central banks around the globe.
ATTRIBUTABLE GOLD PRODUCTION
VARIANCE (000s oz)
Q4 2020 compared to Q3 2020
In the fourth quarter of 2020, attributable gold production was 51 thousand ounces higher than the prior quarter, primarily due to a strong
performance from Pueblo Viejo, the ramp-up of mining operations at Bulyanhulu, ongoing improvement at Turquoise Ridge and an improved irrigation strategy at Veladero. Gold sales volume was lower than the prior quarter primarily due to the export of
the remaining stockpiled concentrate in Tanzania occurring in the prior
quarter.
Copper revenues in the fourth quarter of 2020 decreased by 11% compared
to the prior quarter, primarily due to lower copper sales volume, partially offset by a higher realized copper price4. The average market price in the fourth quarter of 2020 was $3.25 per pound versus $2.96 per pound in the prior quarter. In both the fourth quarter
of 2020 and the prior quarter, the realized copper price4 was higher than the market copper price as a result of the impact of positive provisional pricing adjustments recorded. During the fourth quarter of
2020, the copper price ranged from $2.84 per pound to $3.64 per pound and closed the quarter at $3.51 per pound. Copper prices in the fourth quarter of 2020 were positively influenced by economic optimism following the approval of Covid-19 vaccines,
the potential for further fiscal and monetary stimulus measures, a weakening US dollar and low copper stockpiles.
Attributable copper production in the fourth quarter of 2020 increased by 16 million pounds compared to the prior quarter, primarily driven by higher
production at Lumwana following completion of plant maintenance in the
|
|
|
|
|
|
|
|
|
| BARRICK YEAR-END 2020 |
61 |
MANAGEMENT’S DISCUSSION AND
ANALYSIS |
prior quarter. Copper sales were lower than the prior quarter, primarily due to the timing of shipments at
Lumwana.
2020 compared to 2019
In 2020, gold revenues increased by 27% compared to the prior year, primarily due to the impact of recording a full year of production from Nevada
Gold Mines, which was formed on July 1, 2019, and is consolidated and included in revenue at 100%. Excluding the impact of Nevada Gold Mines, gold revenues increased by 12% compared to the prior year resulting from a higher realized gold
price4, partially offset by lower sales volume. The average market gold price for 2020 was $1,770 per ounce versus $1,393 per ounce in the prior year.
In 2020, attributable gold production was 4,760 thousand ounces, or 705 thousand
ounces lower than the prior year. Excluding the impact of the formation of Nevada Gold Mines, gold production for the year decreased by 1,091 thousand ounces or 22%, mainly due to lower grades mined and processed at Cortez as mining from CHOP was
completed in the second quarter of 2019, Porgera entering care and maintenance on April 25, 2020, and the sale of our 50% interest in Kalgoorlie on November 28, 2019. Gold production was further impacted by the exclusion of Golden Sunlight and
Morila after the second quarter of 2019 and Lagunas Norte after the third quarter of 2019 from our production calculation upon entering care and maintenance, as well as the impact of the Covid-19 pandemic at Veladero, where movement and social
distancing restrictions slowed the remobilization of employees and contractors back to site after quarantine restrictions were lifted in April 2020. Gold sales were higher than gold production in 2020 following the re-commencement of exports of
concentrate stockpiled in Tanzania, which was completed in the third quarter of 2020.
ATTRIBUTABLE GOLD PRODUCTION
VARIANCE (000s oz)
Year ended December 31, 2020
Copper revenues for 2020 were up 77% compared to the prior year due to higher copper sales volume and a higher realized copper price4. In both 2020 and 2019, the realized
copper price4 was higher than the market copper price as a result of positive provisional pricing adjustments to copper sales that were subject to finalization in
2020.
Attributable copper production for 2020 was 25 million pounds higher than
the prior year, mainly due to Lumwana, as production in the prior year was impacted by repeated tears to the main crusher conveyor and the subsequent use of lower grade stockpile material to supplement mill feed.
Production Costs
|
|
|
|
|
|
|
|
|
|
|
|
|
|
|
|
|
|
|
| ($ millions, except per ounce/pound data in
dollars) |
For the three months ended |
For the years ended |
| |
12/31/20
|
9/30/20 |
12/31/20
|
12/31/19 |
12/31/18 |
| Gold |
|
|
|
|
|
Direct mining costsa |
1,069 |
|
1,151 |
|
4,421 |
|
4,274 |
|
3,130 |
| Depreciation |
495 |
|
508 |
|
1,975 |
|
1,902 |
|
1,253 |
| Royalty expense |
107 |
|
103 |
|
410 |
|
308 |
|
196 |
| Community relations |
10 |
|
6 |
|
26 |
|
30 |
|
42 |
| Cost of sales |
1,681 |
|
1,768 |
|
6,832 |
|
6,514 |
|
4,621 |
Cost of sales
($/oz)b |
1,065 |
|
1,065 |
|
1,056 |
|
1,005 |
|
892 |
Total cash costs
($/oz)c |
692 |
|
696 |
|
699 |
|
671 |
|
588 |
All-in sustaining costs
($/oz)c |
929 |
|
966 |
|
967 |
|
894 |
|
806 |
| Copper |
|
|
|
|
|
| Direct mining costs |
68 |
|
76 |
|
292 |
|
224 |
|
344 |
| Depreciation |
41 |
|
61 |
|
208 |
|
100 |
|
170 |
| Royalty expense |
16 |
|
16 |
|
54 |
|
34 |
|
39 |
| Community relations |
0 |
|
1 |
|
2 |
|
3 |
|
5 |
| Cost of sales |
125 |
|
154 |
|
556 |
|
361 |
|
558 |
Cost of sales
($/lb)b |
2.06 |
|
1.97 |
|
2.02 |
|
2.14 |
|
2.40 |
C1 cash costs ($/lb)c |
1.61 |
|
1.45 |
|
1.54 |
|
1.69 |
|
1.97 |
All-in
sustaining costs ($/lb)c |
2.42 |
|
2.31 |
|
2.23 |
|
2.52 |
|
2.82 |
a.Includes mining and processing costs.
b.Cost of sales applicable to gold per ounce is calculated using cost of sales applicable to gold on an attributable basis
(removing the non-controlling interest of 40% Pueblo Viejo, 16% North Mara, Bulyanhulu and Buzwagi starting January 1, 2020, the date the GoT’s 16% free carried interest was made effective (36.1% from January 1, 2018 to September 30, 2019;
notwithstanding the completion of the Acacia transaction on September 17, 2019, we consolidated our interest in Acacia and recorded a non-controlling interest of 36.1% in the income statement for the entirety of the third quarter of 2019 as a matter
of convenience); and 63.1% South Arturo from cost of sales from July 1, 2019 onwards as a result of its contribution to Nevada Gold Mines (and on a 40% basis from January 1, 2018 to June 30, 2019), divided by attributable gold ounces. Commencing January 1, 2019, the effective date of the Merger, the non-controlling interest of 20% Loulo-Gounkoto and 10.3% Tongon is also removed
from cost of sales and our proportionate share of cost of sales attributable to equity method investments (Kibali, and Morila until the second quarter of 2019) is included. Cost of sales applicable to gold per ounce also removes the non-controlling
interest of 38.5% Nevada Gold Mines from July 1, 2019
|
|
|
|
|
|
|
|
|
| BARRICK YEAR-END 2020 |
62 |
MANAGEMENT’S DISCUSSION AND
ANALYSIS |
onwards. Cost of sales applicable to copper per pound is calculated using cost of sales applicable to copper including our proportionate share of cost of
sales attributable to equity method investments (Zaldívar and Jabal Sayid), divided by consolidated copper pounds (including our proportionate share of copper pounds from our equity method
investments).
c.Total cash costs, C1 cash costs and all-in sustaining costs are non-GAAP financial performance measures with no standardized
meaning under IFRS and therefore may not be comparable to similar measures of performance presented by other issuers. For further information and a detailed reconciliation of each non-GAAP measure used in this section of the MD&A to the most
directly comparable IFRS measure, please see pages 96 to 122 of this MD&A.
Q4 2020 compared to Q3 2020
In the fourth quarter of 2020, cost of sales applicable to gold was 5% lower compared to the third quarter of 2020 as a result of lower sales volume.
Our 45% interest in Kibali and 40% interest in Morila are equity accounted for and we therefore do not include their cost of sales in our consolidated gold cost of sales. On a per ounce basis, cost of sales applicable to gold5, after including our proportionate share of cost of sales at our equity method investees, and total cash costs4 were in line with and 1% lower, respectively, than the prior quarter, primarily due to a higher proportion of lower-cost stockpiled ore in the feed
mix at Carlin, largely offset by lower grades at Loulo-Gounkoto and North Mara.
In the fourth quarter of 2020, gold all-in sustaining costs4 decreased by 4% on a per ounce basis compared to the prior quarter primarily due to lower minesite sustaining capital expenditures, combined with
slightly lower total cash costs per ounce4.
In the fourth quarter of 2020, cost of sales applicable to copper was 19% lower than the prior quarter primarily due to lower copper sales volume as
a result of the timing of shipments at Lumwana. Our 50% interests in Zaldívar and Jabal Sayid are equity accounted for and we therefore do not include their cost of sales in our consolidated copper cost of sales. On a per pound basis, cost of
sales applicable to copper5 and C1 cash costs4, after including our proportionate share of cost of sales at our equity method investees, increased by 5% and 11%, respectively, compared to the
prior quarter primarily due to additional costs recognized in relation to the settlement of labor contract negotiations at Zaldívar.
In the fourth quarter of 2020, copper all-in sustaining costs4, which have been adjusted to include our proportionate share of equity method investees, were 5% higher per pound than the prior quarter primarily
reflecting higher C1 cash costs4, partially offset by lower minesite sustaining capital expenditures.
2020 compared to 2019
In 2020, cost of sales applicable to gold was 5% higher than the prior year primarily due to the impact of a full year of operation at Nevada Gold
Mines, which was formed on July 1, 2019, and is consolidated and included in cost of sales at 100%. Excluding the impact of Nevada Gold Mines, cost of sales applicable to gold was 9% lower compared to the prior year, mainly due to decreased sales
volume. On a per ounce basis, cost of sales applicable to gold5, after including our proportionate share of cost of sales at our equity method investees, and total cash costs per ounce4 were 5% and 4% higher, respectively, than the prior year, primarily due to the lower average grade processed at Cortez and the sales mix changes
upon the formation of Nevada Gold Mines, which has resulted in a
higher proportion of gold sourced from lower-grade open pits.
In 2020, gold all-in sustaining costs per ounce4 increased by 8% compared to the prior year primarily due to higher total cash costs per ounce4, combined with higher minesite sustaining capital expenditures.
In 2020, cost of sales applicable to copper was 54% higher than the prior year, primarily due to higher sales volumes at Lumwana, as sales in the
prior year were negatively impacted by a major refurbishment at one of the third-party smelters that processes a portion of Lumwana’s concentrate. Our 50% interests in Zaldívar and Jabal Sayid are equity accounted for and therefore we do
not include their cost of sales in our consolidated copper cost of sales. On a per pound basis, cost of sales applicable to copper5 and C1 cash costs4, after including our proportionate share of cost of sales at our equity method investees, decreased by 6% and 9%, respectively, compared to the
prior year, primarily due to the improved feed grade, decreased mining costs as well as lower general and administrative expenses, and lower concentrate marketing costs at Lumwana.
Copper all-in sustaining costs per pound4 were 12% lower than the prior year primarily reflecting the lower total C1 cash costs per pound4, combined with lower minesite sustaining capital expenditures on a per pound
basis.
2020 compared to
Guidance
2020 cost of sales applicable to gold5 was $1,056 per ounce, slightly higher than our guidance range of $980 to $1,030 per ounce, mainly due to higher royalty expense resulting from the
impact of a higher realized gold price4 and higher depreciation expense following an impairment reversal recorded in the first quarter of
2020.
Gold total cash costs4 and all-in sustaining costs4 for 2020 were $699 and $967 per ounce, respectively, both within the guidance ranges of $650 to $700 and $920 to $970 per ounce, respectively. These
per ounce costs would have been at the lower end of the guidance range after adjusting for the impact of the higher realized gold price4 on royalty expense as 2020 guidance was based on a gold price assumption of $1,350 per
ounce.
2020 cost of sales applicable to copper5 was $2.02 per pound, below our guidance range of $2.10 to $2.40 per pound, mainly due to lower depreciation. C1 cash costs4 were $1.54 per pound, at the lower end of our guidance range of $1.50 to $1.80 per
pound.
2020 copper all-in sustaining costs4 were $2.23 per pound, at the lower end of our guidance range of $2.20 to $2.50 per
pound.
|
|
|
|
|
|
|
|
|
| BARRICK YEAR-END 2020 |
63 |
MANAGEMENT’S DISCUSSION AND
ANALYSIS |
Capital Expendituresa
|
|
|
|
|
|
|
|
|
|
|
|
|
|
|
|
|
|
| ($ millions) |
For the three months ended |
For the years ended |
| |
12/31/20
|
9/30/20 |
12/31/20
|
12/31/19 |
12/31/18 |
Minesite sustainingb |
354 |
|
415 |
|
1,559 |
1,320 |
|
968 |
|
Project capital expendituresc |
184 |
|
126 |
|
471 |
370 |
|
425 |
|
| Capitalized interest |
8 |
|
7 |
|
24 |
11 |
|
7 |
|
| Total consolidated capital
expenditures |
546 |
|
548 |
|
2,054 |
1,701 |
|
1,400 |
|
Attributable capital
expendituresd |
445 |
|
436 |
|
1,651 |
1,512 |
|
1,363 |
2020
Attributable capital expenditures guidanced |
|
|
$1,600
to
$1,900 |
|
|
a.These amounts
are presented on a 100% cash basis, except for attributable capital expenditures.
b.Includes both
minesite sustaining and mine development.
c.Project capital expenditures (on an accrued basis until December 31, 2018, and on a cash basis thereafter) are included in our
calculation of all-in costs, but not included in our calculation of all-in sustaining costs.
d.These amounts
are presented on the same basis as our guidance and include our 60% share of Pueblo Viejo, 60% share of South Arturo (36.9% of South Arturo from July 1, 2019 onwards as a result of its contribution to Nevada Gold Mines), our 84% share of North Mara,
Bulyanhulu and Buzwagi starting January 1, 2020, the date the GoT’s 16% free carried interest was made effective (63.9% share from January 1, 2018 until September 30, 2019; notwithstanding the completion of the Acacia transaction on
September 17, 2019, we consolidated our interest in Acacia and recorded a non-controlling interest of 36.1% in the income statement for the entirety of the third quarter of 2019 as a matter of convenience, and our 100% share from October 1, 2019 to
December 31, 2019) and our 50% share of Zaldívar and Jabal Sayid. Commencing January 1, 2019, the effective date of the Merger, also includes our 80% share of Loulo-Gounkoto, 89.7% share of Tongon, 45% share of Kibali and 40% share of Morila
until the second quarter of 2019. Starting July 1, 2019, it also includes our 61.5% share of Nevada Gold Mines.
Q4 2020 compared to Q3 2020
In the fourth quarter of 2020, total consolidated capital expenditures on a cash basis remained consistent with the third quarter of 2020, mainly due
to a decrease in minesite sustaining capital expenditures, offset by higher project capital expenditures. Minesite sustaining capital expenditures decreased by 15% compared to the prior quarter, primarily due to Loulo-Gounkoto and was driven by
lower capitalized stripping at the Gounkoto open pit and a decrease in capital development at Loulo. This was combined with a decrease at Cortez as a result of fewer haul truck component replacements, the ramp-down of the Crossroads dewatering
project until the next stages are reviewed and approved, and a reduction in capitalized stripping as the mine transitions out from a mostly stripping phase at Crossroads Phase 4. Project capital expenditures increased by 46% primarily due to the
plant and tailings expansion project at Pueblo Viejo and the restart of underground mining and processing operations at Bulyanhulu.
2020 compared to 2019
In 2020, total consolidated capital expenditures on a cash basis increased by 21% compared to the prior year, primarily due to the impact of the
sites acquired as part of
the formation of Nevada Gold Mines on July 1, 2019, which is consolidated and included at 100%. Excluding the impact of the formation of Nevada Gold
Mines, capital expenditures increased by 14%, mainly due to higher minesite sustaining capital expenditures as a result of increased capitalized stripping at Loulo-Gounkoto and our investment in the tailings storage facility and other water
management initiatives at North Mara. This was combined with higher project capital expenditures related to the plant and tailings expansion project at Pueblo Viejo and the restart of underground mining and processing operations at Bulyanhulu.
2020 compared to Guidance
Attributable capital expenditures for 2020 of $1,651 were at the lower end of the guidance range of $1,600 to $1,900 million with lower minesite
sustaining capital expenditures offset by higher project capital expenditures. Certain minesite sustaining capital expenditures previously expected to be incurred in 2020 were deferred until 2021 due to the impact of the Covid-19 pandemic.
General and Administrative
Expenses
|
|
|
|
|
|
|
|
|
|
|
|
|
|
|
|
|
|
| ($ millions) |
For the three months ended |
For the years ended |
|
|
12/31/20
|
9/30/20 |
12/31/20
|
12/31/19 |
12/31/18 |
Corporate administrationa |
32 |
|
22 |
|
118 |
148 |
|
212 |
|
Share-based compensationb |
(8) |
|
28 |
|
67 |
37 |
|
27 |
|
Tanzaniac |
0 |
|
0 |
|
0 |
27 |
|
26 |
|
| General &
administrative expenses |
24 |
|
50 |
|
185 |
212 |
|
265 |
|
| 2020 General & administrative expenses guidance |
|
|
~$170
|
|
|
a.For the three
months and year ended December 31, 2020, corporate administration costs include approximately $nil and $nil, respectively, of severance costs (September 30, 2020: $nil; 2019 $18 million; 2018: $63
million).
b.Based on US$22.78 share price as at December 31, 2020 (September 30, 2020: US$28.11; 2019: US$18.59; 2018:
$13.54) and excludes share-based compensation relating to Tanzania.
c.Formerly
known as Acacia Mining plc.
Q4 2020 compared to Q3
2020
In the fourth quarter of 2020, general and administrative expenses decreased by $26 million
compared to the third quarter of 2020 primarily due to lower share-based compensation. The remeasurement of our share-based compensation liability during the current quarter resulted in a gain due to the decrease in our share price from the prior
quarter.
2020 compared to
2019
General and administrative expenses decreased by $27 million compared to the prior year due to
lower corporate administration expenses attributed to business simplification, improved contract management as well as lower travel and office costs as a result of the Covid-19 pandemic. This was combined with lower expenses related to our Tanzania
assets following the closure of Acacia Mining Plc’s London and Johannesburg offices near the end of the third quarter of 2019. This was partially offset by
|
|
|
|
|
|
|
|
|
| BARRICK YEAR-END 2020 |
64 |
MANAGEMENT’S DISCUSSION AND
ANALYSIS |
higher share-based compensation expense as a result of our higher share price.
2020 compared to Guidance
General and administrative expenses were slightly higher than guidance of ~$170 million. Corporate administration expenses of $118 million were
below guidance of ~$130 million, highlighting the continued benefit of our cost reduction activities, while share-based compensation expense of $67 million was higher than guidance of ~$40 million, resulting from the increase in our share
price.
Exploration, Evaluation and Project Costs
|
|
|
|
|
|
|
|
|
|
|
|
|
|
|
|
|
|
| ($ millions) |
For the three months ended |
For the years ended |
|
|
12/31/20
|
9/30/20 |
12/31/20
|
12/31/19 |
12/31/18 |
| Global
exploration and evaluation |
31 |
|
34 |
|
143 |
143 |
|
121 |
|
| Project costs: |
|
|
|
|
|
| Pascua-Lama |
11 |
|
8 |
|
37 |
49 |
|
77 |
|
|
|
|
|
|
|
|
|
|
|
|
|
| Other |
10 |
|
8 |
|
27 |
20 |
|
36 |
| Corporate development |
0 |
|
3 |
|
9 |
51 |
|
60 |
|
| Business improvement and innovation |
0 |
|
0 |
|
0 |
10 |
|
44 |
|
| Global
exploration and evaluation and project expense |
52 |
|
53 |
|
216 |
273 |
|
338 |
|
| Minesite exploration and evaluation |
22 |
|
19 |
|
79 |
69 |
|
45 |
|
| Total
exploration, evaluation and project expenses |
74 |
|
72 |
|
295 |
342 |
|
383 |
|
| 2020 total E&E and project expenses guidance |
|
|
$280
to
$320 |
|
|
Q4 2020 compared to Q3 2020
Exploration, evaluation and project expenses for the fourth quarter of 2020 were in line
with the prior quarter.
2020 compared to
2019
Exploration, evaluation and project costs for 2020 decreased by $47 million compared to the
prior year, primarily due to lower corporate development costs as the prior year included transaction costs related to the formation of Nevada Gold Mines and the Acacia transaction. This was combined with lower business improvement and innovation
costs incurred at the corporate level and lower Pascua-Lama project costs, partially offset by higher minesite exploration and evaluation expenses.
2020 compared to Guidance
Exploration, evaluation and project expenses for 2020 of $295 million were below the midpoint of the guidance range of $280 to $320 million.
Finance Costs, Net
|
|
|
|
|
|
|
|
|
|
|
|
|
|
|
|
|
|
| ($ millions) |
For the three months ended |
For the years ended |
|
|
12/31/20
|
9/30/20 |
12/31/20
|
12/31/19 |
12/31/18 |
Interest expensea |
82 |
|
88 |
|
342 |
435 |
|
452 |
| Accretion |
8 |
|
9 |
|
41 |
75 |
|
87 |
| Loss on debt extinguishment |
0 |
|
0 |
|
15 |
3 |
|
29 |
| Interest capitalized |
(8) |
|
(7) |
|
(24) |
(14) |
|
(9) |
|
| Other finance costs |
4 |
|
(3) |
|
1 |
1 |
|
1 |
| Finance income |
(6) |
|
(6) |
|
(28) |
(31) |
|
(15) |
|
| Finance costs,
net |
80 |
|
81 |
|
347 |
469 |
|
545 |
| 2020 finance costs, net guidance |
|
|
$400
to
$450 |
|
|
a.For the three
months and year ended December 31, 2020, interest expense includes approximately $9 million and $34 million, respectively, of non-cash interest expense relating to the gold and silver streaming agreements with Wheaton and Royal Gold, Inc. (September
30, 2020: $8 million; 2019: $103 million; 2018: $98 million).
Q4 2020 compared
to Q3 2020
In the fourth quarter of 2020, finance costs, net were in line with the prior quarter.
2020 compared to 2019
In 2020, finance costs, net were 26% lower than the prior year, primarily due to a decrease in interest expense attributed to the absence of non-cash
interest expense on the silver streaming agreement at Pascua-Lama, following the de-recognition of the deferred revenue liability at the end of the fourth quarter of 2019. This was combined with lower accretion expense resulting from a decrease in
interest rates and was partially offset by a loss on debt extinguishment relating to the make-whole repurchase in January 2020 of the remaining $337 million of principal on our 3.85% notes due 2022.
2020 compared to Guidance
Finance costs, net for 2020 of $347 million were below the guidance range of $400 to $450 million, mainly due to lower accretion expense resulting
from a decrease in interest rates and higher interest capitalized.
|
|
|
|
|
|
|
|
|
| BARRICK YEAR-END 2020 |
65 |
MANAGEMENT’S DISCUSSION AND
ANALYSIS |
Additional Significant Statement of Income
Items
|
|
|
|
|
|
|
|
|
|
|
|
|
|
|
|
|
|
|
| ($ millions) |
For the three months ended |
For the years ended |
|
|
|
12/31/20
|
9/30/20 |
12/31/20
|
12/31/19 |
12/31/18 |
|
| Impairment
charges (reversals) |
40 |
|
4 |
|
(269) |
|
(1,423) |
|
900 |
|
|
| Loss on currency
translation |
16 |
|
16 |
|
50 |
|
109 |
|
136 |
|
|
| Other
expense (income) |
(138) |
|
(78) |
|
(178) |
|
(3,100) |
|
(90) |
|
|
Impairment Charges
(Reversals)
|
|
|
|
|
|
|
|
|
|
|
|
|
|
|
|
|
|
| ($ millions) |
For the three months ended |
For the years ended |
|
|
12/31/20
|
9/30/20 |
12/31/20
|
12/31/19 |
12/31/18 |
|
|
Post-tax
(our share) |
Post-tax
(our share) |
Post-tax
(our
share) |
Post-tax
(our share) |
Post-tax
(our share) |
| Asset impairments
(reversals) |
|
|
|
|
|
| Tanzania |
20 |
|
0 |
|
(91) |
|
0 |
|
0 |
| Nevada Gold
Mines |
6 |
|
0 |
|
6 |
|
48 |
|
11 |
| Pueblo
Viejo |
0 |
|
1 |
|
2 |
|
(277) |
|
0 |
| Pascua-Lama |
0 |
|
0 |
|
0 |
|
296 |
|
(7) |
| Lumwana |
0 |
|
0 |
|
0 |
|
(663) |
|
0 |
| Lagunas
Norte |
0 |
|
0 |
|
0 |
|
12 |
|
405 |
| Veladero |
0 |
|
0 |
|
0 |
|
2 |
|
160 |
| Equity method
investments |
0 |
|
0 |
|
0 |
|
0 |
|
30 |
| Acacia exploration
sites |
0 |
|
0 |
|
0 |
|
0 |
|
17 |
|
|
|
|
|
|
|
|
|
|
|
|
|
|
|
|
|
|
|
|
|
|
|
|
| Other |
0 |
|
1 |
|
15 |
|
14 |
|
29 |
| Total
asset impairment charges (reversals) |
26 |
|
2 |
|
(68) |
|
(568) |
|
645 |
| Goodwill
|
|
|
|
|
|
| Veladero |
0 |
|
0 |
|
0 |
|
0 |
|
154 |
|
|
|
|
|
|
|
|
|
|
|
|
|
|
|
|
|
|
|
|
|
|
|
|
| Total goodwill
impairment charges |
0 |
|
0 |
|
0 |
|
0 |
|
154 |
| Tax
effects and NCI |
14 |
|
2 |
|
(201) |
|
(855) |
|
101 |
| Total impairment charges (reversals) |
40
|
|
4
|
|
(269)
|
|
(1,423)
|
|
900
|
Impairment Charges
(Reversals)
Q4 2020 compared to Q3 2020
In the fourth quarter of 2020, net impairment charges were $26 million (net of tax and non-controlling interests) compared to $2 million (net of tax
and non-controlling interests) in the prior quarter. The net impairment charge in the fourth quarter of 2020 mainly relates to a $20 million (net of tax and non-controlling interests) impairment at Tanzania. We recorded no significant impairment
charges or reversals in the prior quarter.
2020 compared to 2019
In 2020, we recognized $68 million (net of tax and non-controlling interests) of net impairment reversals for non-current assets. This was mainly due
to a net impairment reversal at Tanzania of $91 million net of tax ($304 million pre-tax and non-controlling interest) resulting from the agreement with the GoT being made effective in the first quarter of 2020. This compares to net impairment
reversals of $568 million (net of tax and non-controlling interests) in 2019 mainly due to a net impairment reversal at Lumwana as a result of performance improvements reflected in the life of mine plan, and an increase in the long-term copper price
assumption, as well as at Pueblo Viejo reflecting progress on the process plant expansion and additional tailings facility in conjunction with the increase in the long-term gold price assumption, partially offset by an impairment charge at
Pascua-Lama as we concluded that we do not have a plan that meets our investment criteria under our current assumptions.
Refer to note 21 to the Financial Statements for a full description of impairment charges, including pre-tax amounts and sensitivity
analysis.
Loss on Currency
Translation
Q4 2020 compared to Q3 2020
Loss on currency translation in the fourth quarter of 2020 was in line with the prior quarter. In the current quarter, the losses mainly relate to
unrealized foreign currency translation losses from the depreciation of the Argentine peso. In the prior quarter, the losses related to unrealized foreign currency translation losses result from the depreciation of the Zambian kwacha. Fluctuations
in these currencies versus the US dollar revalue our peso and kwacha denominated value-added tax receivable balances.
2020 compared to 2019
Loss on currency translation for 2020 was $50 million compared to $109 million in the prior year. The losses in both years relate to unrealized
foreign currency losses from the Argentine peso and the Zambian kwacha. Fluctuations in these currencies versus the US dollar revalue our peso and kwacha denominated value-added tax receivable balances. The Argentine peso and Zambian kwacha each
weakened against the US dollar due in part to high inflation and economic uncertainty in both countries.
Other Expense (Income)
Q4 2020 compared to Q3 2020
In the fourth quarter of 2020, other income was $138 million compared to $78 million in the prior quarter. Other income in the fourth quarter of 2020
mainly relates to a gain on the sale of Eskay Creek of $59 million, a gain on the sale of Morila of $27 million, and a gain on the sale of Bullfrog of $22 million. Refer to note 4 to the Financial Statements for more information. In the third
quarter of 2020, other income primarily related to a gain of $104 million on the remeasurement of the residual cash liability relating to our silver sale agreement with Wheaton.
2020 compared to
2019
Other income was $178 million in 2020 compared to $3,100 million in the prior year. In 2020,
we recognized gains of $180 million, mainly relating to a gain on the sale of Eskay Creek of $59 million, a gain on the sale of Massawa of $54 million, a gain on the sale of Morila of $27 million, and a
|
|
|
|
|
|
|
|
|
| BARRICK YEAR-END 2020 |
66 |
MANAGEMENT’S DISCUSSION AND
ANALYSIS |
gain on the sale of Bullfrog of $22 million. Refer to note 4 to the Financial Statements for more information.
This was combined with a gain of $104 million on the remeasurement of the residual cash liability relating to our silver sale agreement with Wheaton. This was partially offset by care and maintenance expenses at Porgera of $51 million and donations
made to our host communities relating to the Covid-19 pandemic. In 2019, other income mainly relates to a gain of $1,886 million from the remeasurement of Barrick’s 75% interest in Turquoise Ridge to fair value as a result of its contribution
to Nevada Gold Mines, and a $628 million gain on the de-recognition of the deferred revenue liability relating to our silver sale agreement with Wheaton. This was further impacted by a gain of $408 million resulting from the sale of our 50% interest
in Kalgoorlie, and a gain of $216 million on a settlement of customs duty and indirect taxes at Lumwana.
For a further breakdown of other expense (income), refer to note 9 to the Financial
Statements.
Income Tax Expense
Income tax expense was $1,332 million in 2020. The unadjusted effective income tax rate for 2020 was 27% of the income before income
taxes.
The underlying effective income tax rate on ordinary income for 2020 was
27% after adjusting for the gain on sale of long-lived assets; the impact of the framework agreement for the resolution of all outstanding disputes with the GoT; the impact of impairment charges/reversals; the impact of the transfer
of a free carried shareholding of 16% in each of the Tanzania mines to the GoT; the impact of foreign currency translation losses on deferred tax balances; the impact of the recognition and de-recognition of deferred tax assets; the
impact of non-deductible foreign exchange losses; the impact of a reduced corporate tax rate in Argentina on deferred tax balances; the impact of Covid-19 donations; the impact of the Porgera mine being placed on care and
maintenance; the impact of the remeasurement of our residual cash liability on the silver sale agreement with Wheaton; and the impact of other expense adjustments.
We record deferred tax charges or credits if changes in facts or circumstances affect the estimated tax basis of assets and therefore the amount of
deferred tax assets or liabilities to reflect changing expectations in our ability to realize deferred tax assets. The interpretation of tax regulations and legislation and their application to our business is complex and subject to change. We have
significant amounts of deferred tax assets, including tax loss carry forwards, and also deferred tax liabilities. We also have significant amounts of unrecognized deferred tax assets (e.g. for tax losses in Canada). Potential changes in any of these
amounts, as well as our ability to realize deferred tax assets, could significantly affect net income or cash flow in future
periods.
|
|
|
|
|
|
|
|
|
| Reconciliation to Canadian Statutory Rate |
| For the years ended |
12/31/20
|
12/31/19 |
| At 26.5% statutory rate |
1,311 |
|
1,684 |
|
| Increase (decrease) due to: |
|
|
Allowances and special tax deductionsa |
(151) |
|
(129) |
|
Impact of foreign tax ratesb |
(32) |
|
(264) |
|
| Expenses not tax deductible |
154 |
|
78 |
|
|
|
|
| Impairment charges not recognized in deferred tax assets |
0 |
|
45 |
|
|
|
|
| Net currency translation (gains) losses on deferred tax
balances |
(19) |
|
43 |
|
| Tax impact from pass-through entities and equity accounted
investments |
(309) |
|
(140) |
|
| Current year tax (gains) losses not recognized |
(9) |
|
8 |
|
| Sale of 50% interest in Kalgoorlie |
0 |
|
12 |
|
| Recognition and de-recognition of deferred tax assets |
(61) |
|
4 |
|
|
|
|
|
|
|
| Adjustments in respect of prior years |
(53) |
|
(13) |
|
| Increase to income tax related contingent liabilities |
42 |
|
21 |
|
|
|
|
| Impact of tax rate changes |
1 |
|
(35) |
|
| Withholding taxes |
100 |
|
54 |
|
|
|
|
| Mining taxes |
383 |
|
412 |
|
| Tax impact of amounts recognized within accumulated OCI |
(21) |
|
0 |
|
| Other items |
(4) |
|
3 |
|
| Income
tax expense |
1,332
|
|
1,783
|
|
a.We are able
to claim certain allowances, incentives and tax deductions unique to extractive industries that result in a lower effective tax rate.
b.We operate in
multiple foreign tax jurisdictions that have tax rates different than the Canadian statutory rate.
The more significant items impacting income tax expense in 2020 and 2019 include the
following:
Currency
Translation
Deferred tax balances are subject to remeasurement for changes in currency exchange
rates each period. This is required in countries where tax is paid in local currency and accounts are prepared in local GAAP. The most significant balances are Argentine and Malian net deferred tax liabilities. In 2020 and 2019, a tax recovery of
$19 million and tax expense of $75 million, respectively, arose from translation losses and gains on tax balances due to the weakening of the Argentine peso and strengthening of the West African CFA franc, against the US dollar. These net
translation gains (losses) are included within deferred income tax recovery (expense).
Withholding Taxes
In 2020, we have recorded $87 million of dividend withholding taxes related to the distributed earnings of our subsidiaries in Cote d'Ivoire,
Tanzania and the United States.
Nevada Gold
Mines
Nevada Gold Mines is a limited liability company treated as a flow through partnership for US
tax purposes. The partnership is not subject to federal income tax directly, but each of its partners is liable for tax on its share of the profits of the partnership. As such, Barrick accounts for its current and deferred income tax associated with
the investment (61.5% share) following the principles in IAS 12. Nevada
|
|
|
|
|
|
|
|
|
| BARRICK YEAR-END 2020 |
67 |
MANAGEMENT’S DISCUSSION AND
ANALYSIS |
Gold Mines is also subject to Net Proceeds of Minerals tax in Nevada, which is included on a consolidated basis
in the Company's consolidated statements of
income.
Tanzania
On January 24, 2020, Barrick formalized the establishment of a joint venture between Barrick and the GoT and resolution of all outstanding disputes
between Barrick and the GoT, including the lifting of the previous concentrate export ban, effective immediately. Refer to note 21 to the Financial Statements for further
information.
A current tax expense and deferred tax recovery of $20 million and $43 million, respectively, was recorded in 2020, largely to reflect the terms of
the framework agreement with the GoT. Additionally, a $40 million deferred tax recovery was recorded due to the recognition of deferred tax assets at
Buzwagi.
|
|
|
|
|
|
|
|
|
|
|
|
| Financial Condition Review |
|
|
|
|
|
|
|
| Summary Balance Sheet and Key Financial Ratios |
|
|
| ($ millions, except ratios and share amounts) |
|
|
|
| As at December 31 |
2020 |
|
2019 |
|
2018 |
|
| Total cash and equivalents |
5,188 |
|
3,314 |
|
1,571 |
|
| Current assets |
2,955 |
|
3,573 |
|
2,407 |
|
| Non-current assets |
38,363 |
|
37,505 |
|
18,653 |
|
| Total Assets |
46,506 |
|
44,392 |
|
22,631 |
|
| Current liabilities excluding
short-term debt |
2,200 |
|
2,001 |
|
1,625 |
|
Non-current liabilities excluding long-term debta |
7,441 |
|
7,028 |
|
5,883 |
|
| Debt (current and long-term) |
5,155 |
|
5,536 |
|
5,738 |
|
| Total Liabilities |
14,796 |
|
14,565 |
|
13,246 |
|
| Total shareholders’
equity |
23,341 |
|
21,432 |
|
7,593 |
|
| Non-controlling interests |
8,369 |
|
8,395 |
|
1,792 |
|
| Total Equity |
31,710 |
|
29,827 |
|
9,385 |
|
Total common shares outstanding
(millions of shares)b |
1,778 |
|
1,778 |
|
1,168 |
|
| Key Financial Ratios: |
|
|
|
Current ratioc |
3.67:1 |
2.90:1 |
2.38:1 |
Debt-to-equityd |
0.16:1
|
0.19:1
|
0.61:1
|
a.Non-current financial liabilities as at December 31, 2020 were $5,486 million (2019: $5,559 million; 2018: $6,201
million).
b.Total common shares outstanding does not include 0.1 million stock
options.
c.Represents current assets (excluding assets held-for-sale) divided by current liabilities (including short-term debt and
excluding liabilities held-for-sale) as at December 31, 2020, December 31, 2019 and December 31, 2018.
d.Represents
debt divided by total shareholders’ equity (including minority interest) as at December 31, 2020, December 31, 2019, and December 31,
2018.
Balance Sheet Review
Total assets were $46.5 billion at December 31, 2020, approximately $2.1 billion higher than at December 31, 2019, primarily reflecting the strong
cash flow from operating activities and the non-current asset impairment reversal of $709 million of our Tanzanian assets resulting from the agreement with the GoT being signed and made effective in the first quarter of 2020.
Our asset base is primarily comprised of non-current assets such as property,
plant and equipment and goodwill, reflecting the capital-intensive nature of the mining business and our history of growth through acquisitions. Other significant assets include production inventories, indirect taxes recoverable and receivable,
concentrate sales receivables, other government transaction and joint venture related receivables, and cash and equivalents.
Total liabilities at December 31, 2020 were $14.8 billion, slightly higher than total liabilities at December 31, 2019. Our liabilities are primarily
comprised of debt, other non-current liabilities such as provisions and deferred income tax liabilities, and accounts payable.
Shareholders’ Equity
|
|
|
|
|
|
|
|
| February 9, 2021 |
Number of shares |
| Common shares |
1,778,189,894
|
|
| Stock options |
50,000 |
|
Financial Position and Liquidity
We believe we have sufficient financial resources to meet our business requirements for the foreseeable future, including capital expenditures,
working capital requirements, interest payments and dividends. To date, we have not experienced significant negative impacts to liquidity as a result of the Covid-19 pandemic. During 2020, our cash balance benefited from strong cash flow from
operating activities and cash now exceeds debt, such that we are in a net cash positive position as at December 31,
2020.
|
|
|
|
|
|
|
|
|
| BARRICK YEAR-END 2020 |
68 |
MANAGEMENT’S DISCUSSION AND
ANALYSIS |
Total cash and cash equivalents as at December 31, 2020 were $5.2 billion. Our capital
structure comprises a mix of debt, non-controlling interest (primarily at Nevada Gold Mines) and shareholders’ equity. As at December 31, 2020, our total debt was $5.2 billion (debt net of cash and equivalents was $(33.0) million) and our
debt-to-equity ratio was 0.16:1. This compares to debt as at December 31, 2019 of $5.5 billion (debt, net of cash and cash equivalents was $2.2 billion), and a debt-to-equity ratio of 0.19:1.
In 2021, we have capital commitments of $215 million and expect to incur
attributable sustaining and project capital expenditures of approximately $1,800 to $2,100 million in 2021 based on our guidance range on page 39. In 2021, we have $308 million in interest payments and other amounts as detailed in the table on page
94. In addition, we have contractual obligations and commitments of $554 million in purchase obligations for supplies and consumables. We expect to fund these commitments through operating cash flow, which is our primary source of liquidity, as well
as existing cash balances.
We have announced a proposal for a return of capital
distribution for shareholder approval at the Annual and Special Meeting on May 4, 2021. This distribution is derived from a portion of the proceeds from the divestiture of Kalgoorlie Consolidated Gold Mines in November 2019 and from other recent
dispositions made by Barrick and its affiliates. It is proposed that the total distribution of approximately $750 million will be effected in three equal tranches to shareholders of record on dates to be determined in May, August and November
2021.
Our operating cash flow is dependent on the ability of our operations to
deliver projected future cash flows. The market prices of gold, and to a lesser extent copper, are the primary drivers of our operating cash flow. Other options to enhance liquidity include further portfolio optimization and the creation of new
joint ventures and partnerships; issuance of equity securities in the public markets or to private investors, which could be undertaken for liquidity enhancement and/or in connection with establishing a strategic partnership; issuance of
long-term debt securities in the public markets or to private investors; and drawing on the $3.0 billion available under our undrawn Credit Facility (subject to compliance with covenants and the making of certain representations and warranties,
this facility is available for drawdown as a source of financing). Both Moody’s and S&P rate Barrick’s outstanding long-term debt as investment grade. In October 2020, Moody’s upgraded Barrick’s credit rating from Baa2 to
Baa1 and in the second quarter of 2020, S&P confirmed Barrick’s BBB rating and revised their outlook on Barrick’s credit rating to Positive from Stable. The key financial covenant in our undrawn credit facility requires Barrick to
maintain a net debt to total capitalization ratio of less than 0.60:1. Barrick’s net debt to total capitalization ratio was 0.00:1 as at December 31, 2020 (0.07:1 as at December 31,
2019).
|
|
|
|
|
|
|
|
|
|
|
|
|
|
|
|
|
|
Summary of Cash Inflow (Outflow) |
|
|
| ($ millions) |
For the three months ended |
For the years ended |
| |
12/31/20
|
9/30/20 |
12/31/20
|
12/31/19 |
12/31/18 |
| Net cash provided by operating
activities |
1,638
|
|
1,859 |
|
5,417 |
|
2,833 |
|
1,765 |
| Investing activities |
|
|
|
|
| Capital expenditures |
(546) |
|
(548) |
|
(2,054) |
|
(1,701) |
|
(1,400) |
|
| Investment sales |
12 |
|
2 |
|
220 |
|
0 |
|
0 |
|
| Cash acquired in Merger |
0 |
|
0 |
|
0 |
|
751 |
|
0 |
|
| Divestitures |
27 |
|
0 |
|
283 |
|
750 |
|
0 |
|
| Dividends received from equity method investments |
49 |
|
38 |
|
141 |
|
217 |
|
0 |
|
| Other |
53 |
|
54 |
124 |
|
33 |
(94) |
|
| Total investing inflows
(outflows) |
(405)
|
|
(454) |
|
(1,286) |
|
50 |
(1,494) |
|
| Financing activities |
|
|
|
|
Net change in debta |
(8) |
|
(8) |
|
(379) |
|
(309) |
|
(687) |
|
Dividendsb |
(160) |
|
(141) |
|
(547) |
|
(548) |
|
(125) |
|
| Net disbursements to non-controlling interests |
(664) |
|
(259) |
|
(1,356) |
|
(281) |
|
(84) |
|
| Other |
43 |
|
0 |
|
28 |
|
(1) |
|
(29) |
|
| Total financing inflows
(outflows) |
(789) |
|
(408) |
|
(2,254) |
|
(1,139) |
|
(925) |
|
| Effect of exchange rate |
0 |
|
4 |
|
(3) |
|
(1) |
|
(9) |
|
| Increase (decrease)
in cash and equivalents |
444
|
|
1,001
|
|
1,874
|
|
1,743
|
|
(663)
|
|
a.The
difference between the net change in debt on a cash basis and the net change on the balance sheet is due to changes in non-cash charges, specifically the unwinding of discounts and amortization of debt issue
costs.
b.For the three months and year ended December 31, 2020, we declared and paid dividends per share in US dollars totaling $0.09 and
$0.31, respectively (September 30, 2020: declared and paid $0.08; 2019: declared $0.13 and paid $0.20, and also paid $2.69 per share to Randgold shareholders; 2018: declared $0.19 and paid
$0.12).
Q4 2020 compared to Q3
2020
In the fourth quarter of 2020, we generated $1,638 million in operating cash flow, compared to
$1,859 million in the prior quarter. The decrease of $221 million was primarily due to an increase in interest paid as a result of the timing of payments on our long-term debt (generally paid semi-annually). This was combined with the lower realized
gold price4 and a decrease in gold and copper sales volumes.
Cash outflows from investing activities in the fourth quarter of 2020 were $405 million, compared to $454 million in the prior quarter. The decreased
outflow was primarily due to the offsetting nature of proceeds from the Morila disposition and an increase in dividends from our equity method investments.
|
|
|
|
|
|
|
|
|
| BARRICK YEAR-END 2020 |
69 |
MANAGEMENT’S DISCUSSION AND
ANALYSIS |
Net financing cash outflows for the fourth quarter of 2020 amounted to $789 million, compared
to $408 million in the prior quarter. The increase of $381 million is primarily due to an increase in disbursements to non-controlling interests.
2020 compared to 2019
In 2020, we generated $5,417 million in operating cash flow, compared to $2,833 million in the prior year. The increase of $2,584 million was
primarily due to a higher realized gold price4, partially offset by higher gold cost of sales per ounce5 and lower gold sales volumes.
Cash outflows from investing activities for 2020 were $1,286 million compared to an inflow of $50 million in
the prior year. The change of $1,336 million was primarily due to the difference in current year cash proceeds of $283 million from the sale of
Massawa as well as net investment sales of $220 million mainly from the sale of shares in Shandong Gold, compared to the cash acquired as a result of the Merger of $751 million and total cash consideration received of $750 million relating to the
sale of our 50% interest in Kalgoorlie in the prior year. This was further impacted by higher capital expenditures, mainly as a result of the formation of Nevada Gold Mines on July 1,
2019.
Net financing cash outflows for 2020 amounted to $2,254 million, compared to
$1,139 million in the prior year. The higher outflows are primarily due to an increase in disbursements to non-controlling interests.
|
|
|
|
|
|
|
|
|
|
|
|
|
|
|
Summary of Financial Instrumentsa |
|
|
|
|
| As at December 31, 2020 |
|
|
|
|
| Financial Instrument |
Principal/Notional Amount |
Associated
Risks |
|
|
|
|
|
n Interest
rate |
| Cash and equivalents |
|
$5,188 |
|
million |
n
Credit |
|
|
|
|
|
n
Credit |
| Accounts receivable |
|
$558 |
|
million |
n
Market |
|
|
|
|
|
n
Market |
| Other investments |
|
$428 |
|
million |
n
Liquidity |
| Accounts
payable |
|
$1,458 |
|
million |
n
Liquidity |
| Debt
|
|
$5,181 |
|
million |
n Interest
rate |
| Restricted
share units |
|
$39 |
|
million |
n
Market |
| Deferred
share units |
|
$13 |
|
million |
n
Market |
|
|
|
|
|
|
|
|
|
|
|
|
|
|
|
|
|
|
|
|
|
|
|
|
|
|
|
|
|
|
|
|
|
|
|
|
|
|
|
|
|
|
|
|
|
|
|
|
|
|
a.Refer to notes 25, 26 and 28 to the Financial Statements for more information regarding financial instruments, fair value
measurements and financial risk management,
respectively.
|
|
|
|
|
|
|
|
|
| BARRICK YEAR-END 2020 |
70 |
MANAGEMENT’S DISCUSSION AND
ANALYSIS |
Commitments and
Contingencies
Litigation and Claims
We are currently subject to various litigation proceedings as disclosed in note 36 to the Financial Statements, and we may be involved in disputes
with other parties in the future that may result in litigation. If we are unable to resolve these disputes favorably, it may have a material adverse impact on our financial condition, cash flow and results of
operations.
Contractual Obligations and Commitments
In the normal course of business, we enter into contracts that give rise to commitments for future minimum payments. The following table summarizes the remaining contractual maturities of our financial liabilities and operating and capital commitments shown on an undiscounted
basis:
|
|
|
|
|
|
|
|
|
|
|
|
|
|
|
|
|
|
|
|
|
|
|
|
| ($ millions) |
Payments due
as at December 31, 2020 |
| |
2021 |
2022 |
2023 |
2024 |
2025 |
2026 and thereafter |
Total |
Debta |
|
|
|
|
|
|
|
| Repayment of principal |
7 |
|
0 |
|
0 |
|
0 |
|
12 |
|
5,097 |
|
5,116 |
|
| Capital leases |
13 |
|
10 |
|
6 |
|
4 |
|
4 |
|
28 |
|
65 |
|
| Interest |
308 |
|
307 |
|
307 |
|
306 |
|
306 |
|
4,141 |
|
5,675 |
|
Provisions for environmental rehabilitationb |
236 |
|
176 |
|
144 |
|
160 |
|
163 |
|
2,030 |
|
2,909 |
|
|
|
|
|
|
|
|
|
| Restricted share units |
25 |
|
12 |
|
2 |
|
0 |
|
0 |
|
0 |
|
39 |
|
| Pension benefits and other post-retirement benefits |
5 |
|
4 |
|
4 |
|
4 |
|
4 |
|
37 |
|
58 |
|
Minimum royalty paymentsc |
15 |
|
1 |
|
1 |
|
1 |
|
1 |
|
1 |
|
20 |
|
|
|
|
|
|
|
|
|
Purchase obligations for supplies and consumablesd |
554 |
|
223 |
|
201 |
|
173 |
|
147 |
|
584 |
|
1,882 |
|
Capital commitmentse |
215 |
|
8 |
|
0 |
|
0 |
|
0 |
|
0 |
|
223 |
|
Social development costsf |
13 |
|
8 |
|
5 |
|
5 |
|
8 |
|
53 |
|
92 |
|
Other Obligationsg |
0 |
|
2 |
|
4 |
|
4 |
|
4 |
|
281 |
|
295 |
|
| Total
|
1,391
|
|
751
|
|
674
|
|
657
|
|
649
|
|
12,252
|
|
16,374
|
|
a.Debt and
Interest - Our debt obligations do not include any subjective acceleration clauses or other clauses that enable the holder of the debt to call for early repayment, except in the event that we breach any of the terms and conditions of the debt or for
other customary events of default. We are not required to post any collateral under any debt obligations. Projected interest payments on variable rate debt were based on interest rates in effect at December 31, 2020. Interest is calculated on our
long-term debt obligations using both fixed and variable
rates.
b.Provisions for environmental rehabilitation - Amounts presented in the table represent the undiscounted uninflated future
payments for the expected cost of provisions for environmental rehabilitation.
c.Minimum
royalty payments are related to continuing operations and are presented net of recoverable amounts.
d.Purchase
obligations for supplies and consumables - Includes commitments related to new purchase obligations to secure a supply of acid, tires and cyanide for our production
process.
e.Capital commitments - Purchase obligations for capital expenditures include only those items where binding commitments have been
entered into.
f.Social development costs – Includes a commitment of $14 million in 2026 and thereafter related to the funding of a power
transmission line in Argentina.
g.Other Obligations includes the Pueblo Viejo JV partner shareholder loan and the deposit on the Pascua-Lama silver sale agreement
with Wheaton.
|
|
|
|
|
|
|
|
|
| BARRICK YEAR-END 2020 |
71 |
MANAGEMENT’S DISCUSSION AND
ANALYSIS |
Review of Quarterly Results
Quarterly Informationa
|
|
|
|
|
|
|
|
|
|
|
|
|
|
|
|
|
|
|
|
|
|
|
|
|
|
|
|
|
|
| |
2020 |
|
2019 |
| ($ millions, except where indicated) |
Q4 |
Q3 |
Q2 |
Q1 |
|
Q4 |
Q3 |
Q2 |
Q1 |
| Revenues |
3,279 |
|
3,540 |
|
3,055 |
|
2,721 |
|
|
2,883 |
|
2,678 |
|
2,063 |
|
2,093 |
|
Realized price per ounce – goldb |
1,871 |
|
1,926 |
|
1,725 |
|
1,589 |
|
|
1,483 |
|
1,476 |
|
1,317 |
|
1,307 |
|
Realized price per pound – copperb |
3.39 |
|
3.28 |
|
2.79 |
|
2.23 |
|
|
2.76 |
|
2.55 |
|
2.62 |
|
3.07 |
|
| Cost of sales |
1,814 |
|
1,927 |
|
1,900 |
|
1,776 |
|
|
1,987 |
|
1,889 |
|
1,545 |
|
1,490 |
|
| Net earnings (loss) |
685 |
|
882 |
|
357 |
|
400 |
|
|
1,387 |
|
2,277 |
|
194 |
|
111 |
|
Per share (dollars)c |
0.39 |
|
0.50 |
|
0.20 |
|
0.22 |
|
|
0.78 |
|
1.30 |
|
0.11 |
|
0.06 |
|
Adjusted net earningsb |
616 |
|
726 |
|
415 |
|
285 |
|
|
300 |
|
264 |
|
154 |
|
184 |
|
Per share (dollars)b,c |
0.35 |
|
0.41 |
|
0.23 |
|
0.16 |
|
|
0.17 |
|
0.15 |
|
0.09 |
|
0.11 |
|
| Operating cash flow |
1,638 |
|
1,859 |
|
1,031 |
|
889 |
|
|
875 |
|
1,004 |
|
434 |
|
520 |
|
| Cash consolidated capital expenditures |
546 |
|
548 |
|
509 |
|
451 |
|
|
446 |
|
502 |
|
379 |
|
374 |
|
Free cash flowb |
1,092 |
|
1,311 |
|
522 |
|
438 |
|
|
429 |
|
502 |
|
55 |
|
146 |
|
a.Sum of all the quarters may not add up to the annual total due to
rounding.
b.Realized price, adjusted net earnings, adjusted net earnings per share and free cash flow are non-GAAP financial performance
measures with no standardized meaning under IFRS and therefore may not be comparable to similar measures of performance presented by other issuers. For further information and a detailed reconciliation of each non-GAAP measure used in this section
of the MD&A to the most directly comparable IFRS measure, please see pages 96 to 122 of this MD&A.
c.Calculated using weighted average number of shares outstanding under the basic method of earnings per
share.
Our
recent financial results reflect our emphasis on cost discipline, an agile management structure that empowers our site based leadership teams, and a portfolio of Tier One1 assets. This combined with rising gold prices has resulted in record operating cash flows in the current year. The strong free cash flow4 generated, together with the proceeds from various divestitures, have allowed us to continue to strengthen our balance sheet over the past two years
and to increase returns to shareholders.
These same fundamentals have also driven
the higher net earnings in recent quarters. Net earnings has also been impacted by the following items in each quarter which have been excluded from adjusted net earnings4. In the first quarter of 2020, we recorded a net impairment reversal of $115 million (net of tax effects), resulting from the agreement with the GoT
being made effective. In the fourth quarter of 2019, we recorded $22 million (net of tax and non-controlling interests) of net impairment charges,
mainly relating to a charge at Pascua-Lama of $296 million (no tax impact), partially offset by a net impairment reversal at Pueblo Viejo of $277
million (net of taxes and non-controlling interest). We also recorded a $628 million (no tax impact) gain on the de-recognition of the deferred revenue liability relating to our silver sale agreement with Wheaton, a gain of $408 million (no tax
impact) resulting from the sale of our 50% interest in Kalgoorlie, and a gain of $216 million (no tax impact) on a settlement of customs duty and indirect taxes at Lumwana. In the third quarter of 2019, net earnings and cash flows were impacted by
the formation of Nevada Gold Mines and the commencement of the contribution of its operations to Barrick's net earnings and cash flows. Net earnings in the third quarter of 2019 included a $1.5 billion (net of tax effects) gain on the remeasurement
of Turquoise Ridge as a result of its contribution to Nevada Gold Mines and a $663 million (net of tax effects) impairment reversal at Lumwana.
Internal Control Over Financial
Reporting and Disclosure Controls and Procedures
Management is responsible for establishing and maintaining adequate internal control over financial reporting and disclosure controls and
procedures. Internal control over financial reporting is a framework designed to provide reasonable assurance regarding the reliability of financial reporting and the preparation of financial statements for external purposes in accordance with IFRS.
The Company’s internal control over financial reporting framework includes those policies and procedures that (i) pertain to the maintenance of records that, in reasonable detail, accurately and fairly reflect the transactions and
dispositions of the assets of the Company; (ii) provide reasonable assurance that transactions are recorded as necessary to permit preparation of financial statements in accordance with IFRS, and that receipts and expenditures of the
Company are being made only in accordance with
authorizations of management and directors of the Company; and (iii) provide reasonable assurance regarding prevention or timely detection
of unauthorized acquisition, use or disposition of the Company’s assets that could have a material effect on the Company’s consolidated financial statements.
Disclosure controls and procedures form a broader framework designed to provide reasonable assurance that other financial information disclosed
publicly fairly presents in all material respects the financial condition, results of operations and cash flows of the Company for the periods presented in this MD&A and Barrick’s Annual Report. The Company’s disclosure controls and
procedures framework includes processes designed to ensure that material information relating to the Company, including its consolidated subsidiaries, is made known to management
|
|
|
|
|
|
|
|
|
| BARRICK YEAR-END 2020 |
72 |
MANAGEMENT’S DISCUSSION AND
ANALYSIS |
by others within those entities to allow timely decisions regarding required
disclosure.
Together, the internal control over financial reporting and disclosure
controls and procedures frameworks provide internal control over financial reporting and disclosure. Due to its inherent limitations, internal control over financial reporting and disclosure may not prevent or detect all misstatements. Further, the
effectiveness of internal control is subject to the risk that controls may become inadequate because of changes in conditions, or that the degree of compliance with policies or procedures may
change.
There were no changes in the Company’s internal control over
financial reporting during the year ended December 31, 2020 that have materially affected, or are reasonably likely to materially affect, the Company’s internal control over financial
reporting.
The management of Barrick, at the direction of our President and Chief Executive Officer and
Senior Executive Vice-President, Chief Financial Officer, evaluated the effectiveness of the design and operation of internal control over financial reporting as of the end of the period covered by this report based on the framework and criteria
established in Internal Control – Integrated Framework (2013) as issued by the Committee of Sponsoring Organizations of the Treadway Commission (COSO). Based on that evaluation, management concluded that the Company’s internal control
over financial reporting was effective as at December 31, 2020.
Barrick’s
annual management report on internal control over financial reporting and the integrated audit report of Barrick’s auditors for the year ended December 31, 2020 will be included in Barrick’s 2020 Annual Report and its 2020 Form
40-F/Annual Information Form on file with the US Securities and Exchange Commission and Canadian provincial securities regulatory
authorities.
IFRS Critical
Accounting Policies and Accounting Estimates
Management has discussed the development and selection of our critical accounting estimates with the Audit & Risk Committee of the Board of
Directors, and the Audit Committee has reviewed the disclosure relating to such estimates in conjunction with its review of this MD&A. The accounting policies and methods we utilize determine how we report our financial condition and results of
operations, and they may require Management to make estimates or rely on assumptions about matters that are inherently uncertain. The consolidated financial statements have been prepared in accordance with IFRS as issued by the International
Accounting Standards Board (“IASB”) under the historical cost convention, as modified by revaluation of certain financial assets, derivative contracts and post-retirement assets. Our significant accounting policies are disclosed in note
2 to the Financial Statements, including a summary of current and future changes in accounting
policies.
Critical Accounting Estimates and Judgments
Certain accounting estimates have been identified as being “critical” to the presentation of our financial condition and results of
operations because they require us to make subjective and/or complex judgments about matters that are inherently uncertain; or there is a reasonable likelihood that materially different amounts could be reported under different conditions or
using different assumptions and estimates. Our significant accounting judgments, estimates and assumptions are disclosed in note 3 to the accompanying Financial
Statements.
Non-GAAP Financial
Performance Measures
Adjusted Net Earnings and Adjusted Net Earnings per Share
Adjusted net earnings is a non-GAAP financial measure which excludes the following from net
earnings:
■Impairment charges (reversals) related to intangibles, goodwill, property, plant and equipment, and
investments;
■Acquisition/disposition
gains/losses;
■Foreign currency translation
gains/losses;
■Significant tax adjustments;
■Unrealized
gains/losses on non-hedge derivative instruments;
and
■Tax effect and non-controlling interest of the above items.
Management uses this measure internally to evaluate our underlying operating performance for the reporting periods presented and to assist with the
planning and forecasting of future operating results. Management believes that adjusted net earnings is a useful measure of our performance because impairment charges, acquisition/disposition gains/losses and significant tax adjustments do
not reflect the underlying operating performance of our core mining business and are not necessarily indicative of future operating results.
Furthermore, foreign currency translation gains/losses and unrealized gains/losses from non-hedge derivatives are not necessarily reflective of the underlying operating results for the reporting periods presented. The tax effect and
non-controlling interest of the adjusting items are also excluded to reconcile the amounts to Barrick’s share on a post-tax basis, consistent with net earnings.
As noted, we use this measure for internal purposes. Management’s internal budgets and forecasts and public guidance do not reflect the types
of items we adjust for. Consequently, the presentation of adjusted net earnings enables investors and analysts to better understand the underlying operating performance of our core mining business through the eyes of management. Management
periodically evaluates the components of adjusted net earnings based on an internal assessment of performance measures that are useful for evaluating the operating performance of our business segments and a
|
|
|
|
|
|
|
|
|
| BARRICK YEAR-END 2020 |
73 |
MANAGEMENT’S DISCUSSION AND
ANALYSIS |
review of the non-GAAP measures used by mining industry analysts and other mining
companies.
Adjusted net earnings is intended to provide additional information
only and does not have any standardized definition under IFRS and should not be considered in isolation or as a substitute for measures of
performance prepared in accordance with IFRS. The measures are not necessarily indicative of operating profit or cash flow from operations as
determined under IFRS. Other companies may calculate these measures differently. The following table reconciles these non-GAAP measures to the most directly comparable IFRS
measure.
Reconciliation of Net Earnings to Net Earnings per
Share, Adjusted Net Earnings and Adjusted Net Earnings per
Share
|
|
|
|
|
|
|
|
|
|
|
|
|
|
|
|
|
|
|
|
|
|
|
For the three months ended |
|
|
For the years ended |
| ($ millions, except per share amounts in
dollars) |
12/31/20
|
9/30/20 |
|
|
12/31/20
|
12/31/19 |
12/31/18 |
| Net earnings (loss)
attributable to equity holders of the Company |
685 |
|
882 |
|
|
|
2,324 |
|
3,969 |
|
(1,545) |
|
Impairment charges (reversals)
related to long-lived assetsa |
40 |
|
4 |
|
|
|
(269) |
|
(1,423) |
|
900 |
|
Acquisition/disposition (gains)
lossesb |
(126) |
|
(2) |
|
|
|
(180) |
|
(2,327) |
|
(68) |
|
| (Gain) loss on currency translation |
16 |
|
16 |
|
|
|
50 |
|
109 |
|
136 |
|
Significant tax adjustmentsc |
(2) |
|
(66) |
|
|
|
(119) |
|
34 |
|
742 |
|
Other (income) expense
adjustmentsd |
15 |
|
(90) |
|
|
|
71 |
|
(687) |
|
366 |
|
| Unrealized gains (losses) on non-hedge derivative
instruments |
0 |
|
0 |
|
|
|
0 |
|
0 |
|
1 |
|
Tax effect and non-controlling
intereste |
(12) |
|
(18) |
|
|
|
165 |
|
1,227 |
|
(123) |
|
| Adjusted net
earnings |
616 |
|
726 |
|
|
|
2,042 |
|
902 |
|
409 |
|
Net
earnings (loss) per sharef |
0.39 |
|
0.50 |
|
|
|
1.31 |
|
2.26 |
|
(1.32) |
|
Adjusted
net earnings per sharef |
0.35 |
|
0.41 |
|
|
|
1.15 |
|
0.51 |
|
0.35 |
|
a.Net impairment
reversals for the current year primarily relate to non-current asset reversals at our Tanzanian assets. Net impairment charges for 2019 primarily relate to non-current asset reversals at Lumwana and Pueblo Viejo, partially offset by impairment
charges at Pascua-Lama.
b.Acquisition/disposition gains for the current year primarily relate to the gain on the sale of Eskay Creek, Morila and
Bullfrog in the fourth quarter of 2020. This was further impacted by the sale of Massawa in the first quarter of 2020. Acquisition/disposition gains for 2019 primarily relate to the gain on the remeasurement of Turquoise Ridge to fair value as a
result of its contribution to Nevada Gold Mines and the gain on sale of our 50% interest in Kalgoorlie.
c.Significant
tax adjustments in the current year primarily relate to deferred tax recoveries as a result of tax reform measures in Argentina and adjustments made in recognition of the net settlement of all outstanding disputes with the GoT. Significant tax
adjustments for 2018 primarily relate to the de-recognition of our Canadian and Peruvian deferred tax assets.
d.Other expense
adjustments for the current year primarily relate to the impact of changes in the discount rate assumptions on our closed mine rehabilitation provision, care and maintenance expenses at Porgera and donations related to Covid-19, partially offset by
the gain on the remeasurement of the residual cash liability relating to our silver sale agreement with Wheaton. Other expense adjustments for 2019 primarily relate to the gain on the de-recognition of the deferred revenue liability relating to our
silver sale agreement with Wheaton and the gain on a settlement of customs duty and indirect taxes at Lumwana.
e.Tax effect and
non-controlling interest for the current year primarily relates to the impairment charges related to long-lived assets.
f.Calculated
using weighted average number of shares outstanding under the basic method of earnings per
share.
Free
Cash Flow
Free cash flow is a measure that deducts capital expenditures from net cash provided by operating activities. Management believes this to be a useful
indicator of our ability to operate without reliance on additional borrowing or usage of existing cash.
Free cash flow is intended to provide additional information only and does not have any standardized definition under IFRS, and should not be
considered in
isolation or as a substitute for measures of performance prepared in accordance with IFRS. The measure is not necessarily indicative of operating
profit or cash flow from operations as determined under IFRS. Other companies may calculate this measure differently. The following table reconciles this non-GAAP measure to the most directly comparable IFRS
measure.
Reconciliation of Net
Cash Provided by Operating Activities to Free Cash Flow
|
|
|
|
|
|
|
|
|
|
|
|
|
|
|
|
|
|
|
|
|
|
|
For the three months ended |
|
|
For the years ended |
| ($ millions) |
12/31/20
|
9/30/20 |
|
|
12/31/20
|
12/31/19 |
12/31/18 |
| Net cash provided by
operating activities |
1,638 |
|
1,859 |
|
|
|
5,417 |
|
2,833 |
|
1,765 |
|
| Capital expenditures |
(546) |
|
(548) |
|
|
|
(2,054) |
|
(1,701) |
|
(1,400) |
|
| Free cash flow |
1,092
|
|
1,311
|
|
|
|
3,363
|
|
1,132
|
|
365
|
|
|
|
|
|
|
|
|
|
|
| BARRICK YEAR-END 2020 |
74 |
MANAGEMENT’S DISCUSSION AND
ANALYSIS |
Total cash costs per ounce, All-in sustaining costs per ounce, All-in costs per ounce, C1 cash costs per pound and All-in sustaining costs per
pound
Total cash costs per ounce, all-in sustaining costs per ounce and all-in costs per ounce are non-GAAP financial measures which are calculated based
on the definition published by the World Gold Council (a market development organization for the gold industry comprised of and funded by gold mining companies from around the world, including Barrick, the “WGC”). The WGC is not a
regulatory organization. Management uses these measures to monitor the performance of our gold mining operations and its ability to generate positive cash flow, both on an individual site basis and an overall company
basis.
Total cash costs start with our cost of sales related to gold production
and removes depreciation, the non-controlling interest of cost of sales and includes by-product credits. All-in sustaining costs start with total cash costs and include sustaining capital expenditures, sustaining leases, general and administrative
costs, minesite exploration and evaluation costs and reclamation cost accretion and amortization. These additional costs reflect the expenditures made to maintain current production
levels.
All-in costs starts with all-in sustaining costs and adds additional costs
that reflect the varying costs of producing gold over the life-cycle of a mine, including: project capital expenditures (capital expenditures at new projects and discrete projects at existing operations intended to increase production capacity
and will not benefit production for at least 12 months) and other non-sustaining costs (primarily non-sustaining leases, exploration and evaluation costs, community relations costs and general and administrative costs that are not associated with
current operations). These definitions recognize that there are different costs associated with the life-cycle of a mine, and that it is therefore appropriate to distinguish between sustaining and non-sustaining
costs.
We believe that our use of total cash costs, all-in sustaining costs and
all-in costs will assist analysts, investors and other stakeholders of Barrick in understanding the costs associated with producing gold, understanding the economics of gold mining, assessing our operating performance and also our ability to
generate free cash flow from current operations and to generate free cash flow on an overall company basis. Due to the capital-intensive nature of the industry and the long useful lives over which these items are depreciated, there can be a
significant timing difference between net earnings calculated in accordance with IFRS and the amount of free
cash flow that is being generated by a mine and therefore we believe these measures are useful non-GAAP operating metrics and supplement our IFRS
disclosures. These measures are not representative of all of our cash expenditures as they do not include income tax payments, interest costs or dividend payments. These measures do not include depreciation or
amortization.
Total cash costs per ounce, all-in sustaining costs and all-in costs
are intended to provide additional information only and do not have standardized definitions under IFRS and should not be considered in isolation or as a substitute for measures of performance prepared in accordance with IFRS. These measures are not
equivalent to net income or cash flow from operations as determined under IFRS. Although the WGC has published a standardized definition, other companies may calculate these measures
differently.
In addition to presenting these metrics on a by-product basis, we
have calculated these metrics on a co-product basis. Our co-product metrics remove the impact of other metal sales that are produced as a by-product of our gold production from cost per ounce calculations but does not reflect a reduction in costs
for costs associated with other metal sales.
C1 cash costs per pound and all-in
sustaining costs per pound are non-GAAP financial measures related to our copper mine operations. We believe that C1 cash costs per pound enables investors to better understand the performance of our copper operations in comparison to other copper
producers who present results on a similar basis. C1 cash costs per pound excludes royalties and production taxes and non-routine charges as they are not direct production costs. All-in sustaining costs per pound is similar to the gold all-in
sustaining costs metric and management uses this to better evaluate the costs of copper production. We believe this measure enables investors to better understand the operating performance of our copper mines as this measure reflects all of the
sustaining expenditures incurred in order to produce copper. All-in sustaining costs per pound includes C1 cash costs, sustaining capital expenditures, sustaining leases, general and administrative costs, minesite exploration and evaluation costs,
royalties and production taxes, reclamation cost accretion and amortization and write-downs taken on inventory to net realizable
value.
|
|
|
|
|
|
|
|
|
| BARRICK YEAR-END 2020 |
75 |
MANAGEMENT’S DISCUSSION AND
ANALYSIS |
Reconciliation of Gold Cost of Sales to Total cash costs, All-in sustaining costs and All-in costs, including on a per ounce
basis
|
|
|
|
|
|
|
|
|
|
|
|
|
|
|
|
|
|
|
|
|
|
|
|
|
|
|
For the three months ended |
|
For the years ended |
| ($ millions, except per ounce
information in dollars) |
Footnote |
12/31/20
|
9/30/20 |
|
|
12/31/20
|
12/31/19 |
12/31/18 |
| Cost of sales applicable to gold
production |
|
1,681 |
|
1,768 |
|
|
|
6,832 |
|
6,514 |
|
4,621 |
|
| Depreciation |
|
(495) |
|
(508) |
|
|
|
(1,975) |
|
(1,902) |
|
(1,253) |
|
Cash cost of sales applicable
to equity method investments |
|
69 |
|
53 |
|
|
|
222 |
|
226 |
|
0 |
|
By-product
credits |
|
(56) |
|
(84) |
|
|
|
(228) |
|
(138) |
|
(131) |
|
Realized (gains) losses on
hedge and non-hedge derivatives |
a |
(1) |
|
0 |
|
|
|
0 |
|
1 |
|
3 |
|
Non-recurring
items |
b |
1 |
|
0 |
|
|
|
1 |
|
(55) |
|
(172) |
|
Other |
c |
(55) |
|
(24) |
|
|
|
(129) |
|
(102) |
|
(87) |
|
Non-controlling
interests |
d |
(323) |
|
(337) |
|
|
|
(1,312) |
|
(878) |
|
(313) |
|
Total
cash costs |
|
821 |
|
868 |
|
|
|
3,411 |
|
3,666 |
|
2,668 |
|
| General
& administrative costs |
|
24 |
|
50 |
|
|
|
185 |
|
212 |
|
265 |
|
Minesite exploration and
evaluation costs |
e |
22 |
|
19 |
|
|
|
79 |
|
69 |
|
45 |
|
Minesite sustaining capital
expenditures |
f |
354 |
|
415 |
|
|
|
1,559 |
|
1,320 |
|
975 |
|
Sustaining
leases |
|
12 |
|
9 |
|
|
|
31 |
|
27 |
|
0 |
|
Rehabilitation - accretion and
amortization (operating sites) |
g |
11 |
|
13 |
|
|
|
46 |
|
65 |
|
81 |
|
Non-controlling interest,
copper operations and other |
h |
(142) |
|
(166) |
|
|
|
(594) |
|
(470) |
|
(374) |
|
All-in sustaining costs |
|
1,102 |
|
1,208 |
|
|
|
4,717 |
|
4,889 |
|
3,660 |
|
Project
exploration and evaluation and project costs |
e |
52 |
|
53 |
|
|
|
216 |
|
273 |
|
338 |
|
Community relations costs not
related to current operations |
|
0 |
|
0 |
|
|
|
1 |
|
2 |
|
4 |
|
Project capital
expenditures |
f |
184 |
|
126 |
|
|
|
471 |
|
370 |
|
459 |
|
| Non-sustaining leases |
|
4 |
|
0 |
|
|
|
4 |
|
0 |
|
0 |
|
Rehabilitation - accretion and
amortization (non-operating sites) |
g |
4 |
|
3 |
|
|
|
10 |
|
22 |
|
33 |
|
Non-controlling interest and
copper operations and other |
h |
(61) |
|
(47) |
|
|
|
(157) |
|
(105) |
|
(21) |
|
| All-in costs |
|
1,285 |
|
1,343 |
|
|
|
5,262 |
|
5,451 |
|
4,473 |
|
| Ounces sold - equity basis (000s
ounces) |
i |
1,186 |
|
1,249 |
|
|
|
4,879 |
|
5,467 |
|
4,544 |
|
| Cost of sales per ounce |
j,k |
1,065 |
|
1,065 |
|
|
|
1,056 |
|
1,005 |
|
892 |
|
| Total cash costs per ounce |
k |
692 |
|
696 |
|
|
|
699 |
|
671 |
|
588 |
|
| Total cash costs per ounce (on a co-product basis) |
k,l |
718 |
|
742 |
|
|
|
727 |
|
689 |
|
607 |
|
| All-in sustaining costs per
ounce |
k |
929 |
|
966 |
|
|
|
967 |
|
894 |
|
806 |
|
| All-in sustaining costs per ounce (on a co-product
basis) |
k,l |
955 |
|
1,012 |
|
|
|
995 |
|
912 |
|
825 |
|
| All-in costs per ounce |
k |
1,083 |
|
1,076 |
|
|
|
1,079 |
|
996 |
|
985 |
|
| All-in costs per ounce (on a
co-product basis) |
k,l |
1,109 |
|
1,122 |
|
|
|
1,107 |
|
1,014 |
|
1,004 |
|
a.Realized (gains)
losses on hedge and non-hedge derivatives
Includes realized hedge losses of $nil
and $nil for the three months and year ended December 31, 2020, respectively (September 30, 2020: $nil; 2019: $nil; 2018: $4 million), and realized non-hedge gains of $1 million and $nil for the three months and year ended
December 31, 2020, respectively (September 30, 2020: $nil; 2019: losses of $1 million; 2018: gains of $1 million). Refer to note 5 to the Financial Statements for further
information.
b.Non-recurring
items
These costs are not indicative of our cost of production and have been
excluded from the calculation of total cash costs. Non-recurring items in 2019 relate to organizational restructuring. In 2018, non-recurring items mainly relate to inventory impairment of $166 million at Lagunas
Norte.
c.Other
Other adjustments for the three months and year ended December 31, 2020 include the removal
of total cash costs and by-product credits associated with Pierina, Golden Sunlight starting in the third quarter of 2019, Morila starting in the third quarter of 2019 up until its divestiture in November 2020, and Lagunas Norte starting in the
fourth quarter of 2019 of $26 million and $104 million, respectively (September 30, 2020: $27 million; 2019: $92 million; 2018: $87 million). These assets are producing incidental ounces as they reach the end of their mine
lives.
|
|
|
|
|
|
|
|
|
| BARRICK YEAR-END 2020 |
76 |
MANAGEMENT’S DISCUSSION AND
ANALYSIS |
d.Non-controlling
interests
Non-controlling interests include non-controlling interests related
to gold production of $490 million and $1,959 million, respectively, for the three months and year ended December 31, 2020 (September 30, 2020: $508 million; 2019: $1,306 million; 2018: $453 million). Non-controlling
interests include Pueblo Viejo; North Mara, Bulyanhulu and Buzwagi (until September 30, 2019, notwithstanding the completion of the Acacia transaction on September 17, 2019, we consolidated our interest in Acacia and recorded a non-controlling
interest of 36.1% in the income statement for the entirety of the third quarter of 2019 as a matter of convenience; and from January 1, 2020 onwards, the date the GoT’s 16% free carried interest was made effective). Commencing January 1,
2019, the effective date of the Merger, the non-controlling interests also include Loulo-Gounkoto and Tongon and starting July 1, 2019, it also includes Nevada Gold Mines. Refer to note 5 to the Financial Statements for further
information.
e.Exploration
and evaluation costs
Exploration, evaluation and project expenses are presented
as minesite if it supports current mine operations and project if it relates to future projects. Refer to page 88 of this
MD&A.
f.Capital
expenditures
Capital expenditures are related to our gold sites only and are presented on a 100% cash basis starting from January 1, 2019 and on a 100% accrued
basis for 2018. They are split between minesite sustaining and project capital expenditures. Project capital expenditures are distinct projects designed to increase the net present value of the mine and are not related to current
production. Significant projects in the current year are the expansion project at Pueblo Viejo, the Goldrush exploration declines, the restart of
mining activities at Bulyanhulu, and construction of the third shaft at Turquoise Ridge. Refer to page 87 of this
MD&A.
g.Rehabilitation -
accretion and amortization
Includes depreciation on the assets related to
rehabilitation provisions of our gold operations and accretion on the rehabilitation provisions of our gold operations, split between operating and non-operating
sites.
h.Non-controlling
interest and copper operations
Removes general & administrative costs
related to non-controlling interests and copper based on a percentage allocation of revenue. Also removes exploration, evaluation and project expenses, rehabilitation costs and capital expenditures incurred by our copper sites and the
non-controlling interest of North Mara, Bulyanhulu and Buzwagi (until September 30, 2019 notwithstanding the completion of the Acacia transaction on September 17, 2019, we consolidated our interest in Acacia and recorded a non-controlling interest
of 36.1% in the income statement for the entirety of the third quarter of 2019 as a matter of convenience; and from January 1, 2020 onwards, the date the GoT’s 16% free carried interest was made effective), Pueblo Viejo and South Arturo
(63.1% of South Arturo from July 1, 2019 onwards as a result of its contribution to Nevada Gold Mines). Commencing January 1, 2019, the effective date of the Merger, also removes the non-controlling interest of our Loulo-Gounkoto and Tongon. Also
removes Nevada Gold Mines starting July 1, 2019. It also includes capital expenditures applicable to equity method investments. Figures remove the impact of Pierina, Golden Sunlight starting the third quarter of 2019, Morila starting in the third
quarter of 2019 up until its divestiture in November 2020, and Lagunas Norte starting in the fourth quarter of 2019. The impact is summarized as the following:
|
|
|
|
|
|
|
|
|
|
|
|
|
|
|
|
|
|
|
($ millions) |
For the three months ended |
For the years ended |
| Non-controlling
interest, copper operations and other |
12/31/20
|
9/30/20 |
|
12/31/20
|
12/31/19 |
12/31/18 |
General
& administrative costs |
(5) |
|
(6) |
|
|
(25) |
|
(58) |
|
(104) |
|
Minesite exploration and evaluation
costs |
(9) |
|
(5) |
|
|
(25) |
|
(16) |
|
(3) |
|
Rehabilitation - accretion and
amortization (operating sites) |
(3) |
|
(3) |
|
|
(14) |
|
(13) |
|
(6) |
|
| Minesite sustaining capital expenditures |
(125) |
|
(152) |
|
|
(530) |
|
(383) |
|
(261) |
|
All-in
sustaining costs total |
(142) |
|
(166) |
|
|
(594) |
|
(470) |
|
(374) |
|
Project
exploration and evaluation and project costs |
(6) |
|
(9) |
|
|
(25) |
|
(54) |
|
(16) |
|
Project capital
expenditures |
(55) |
|
(38) |
|
|
(132) |
|
(51) |
|
(5) |
|
All-in
costs total |
(61)
|
|
(47)
|
|
|
(157)
|
|
(105)
|
|
(21)
|
|
i.Ounces
sold - equity basis
Figures remove the impact of Pierina, Golden Sunlight starting in the third
quarter of 2019, Morila starting in the third quarter of 2019 up until its divestiture in November 2020, and Lagunas Norte starting in the fourth quarter of 2019. These assets are producing incidental ounces as they reach the end of their mine
lives.
j.Cost of sales
per ounce
Figures remove the cost of sales impact of Pierina of $4 million and
$18 million, respectively, for the three months and year ended December 31, 2020 (September 30, 2020: $4 million; 2019: $113 million; 2018: $116 million); starting in the third quarter of 2019, Golden Sunlight of $nil and
$nil, respectively, for the three months and year ended December 31, 2020 (September 30, 2020: $nil; 2019: $1 million; 2018: $nil); starting in the third quarter of 2019 up until its divestiture in November 2020, Morila of $2
million and $22 million, respectively, for the three months and year ended December 31, 2020 (September 30, 2020: $7 million; 2019: $23 million; 2018: $nil); and starting in the fourth quarter of 2019, Lagunas Norte of $26
million and $92 million, respectively, for the three months and year ended December 31, 2020 (September 30, 2020: $22 million; 2019: $26 million; 2018: $nil). These assets are producing incidental ounces as they reach the end of
their mine lives. Cost of sales per ounce excludes non-controlling interest related to gold production. Cost of sales applicable to gold per ounce is calculated using cost of sales applicable to gold on an attributable basis (removing the
non-controlling interest of 40% Pueblo Viejo, 16% North Mara, Bulyanhulu and Buzwagi starting January 1, 2020, the date the GoT’s 16% free carried interest was made effective (36.1% from January 1, 2018 to September 30, 2019;
notwithstanding the completion of the Acacia transaction on September 17, 2019, we consolidated our interest in Acacia and recorded a non-controlling interest of 36.1% in the income statement for the entirety of the third quarter of 2019 as a matter
of convenience); and 63.1% South Arturo from cost of sales from July 1, 2019 onwards as a result of its contribution to Nevada Gold Mines (and on a 40% basis from January 1, 2018 to June 30, 2019), divided by attributable gold ounces. Commencing January 1, 2019, the effective date of the Merger, the non-controlling interest of 20% Loulo-Gounkoto and 10.3% Tongon is also removed
from cost of sales and our proportionate share of cost of sales attributable to equity method investments (Kibali, and Morila until the second quarter of 2019) is included. Cost of sales applicable to gold per ounce also removes the non-controlling
interest of 38.5% Nevada Gold Mines from July 1, 2019 onwards.
k.Per ounce
figures
Cost of sales per ounce, cash costs per ounce, all-in sustaining costs
per ounce and all-in costs per ounce may not calculate based on amounts presented in this table due to
rounding.
|
|
|
|
|
|
|
|
|
| BARRICK YEAR-END 2020 |
77 |
MANAGEMENT’S DISCUSSION AND
ANALYSIS |
l.Co-product
costs per ounce
Cash costs per ounce, all-in sustaining costs per ounce and
all-in costs per ounce presented on a co-product basis remove the impact of by-product credits of our gold production (net of non-controlling interest) calculated as:
|
|
|
|
|
|
|
|
|
|
|
|
|
|
|
|
|
|
|
($ millions) |
For the three months ended |
For the years ended |
|
12/31/20
|
9/30/20 |
|
12/31/20
|
12/31/19 |
12/31/18 |
By-product
credits |
56 |
|
84 |
|
|
228 |
|
138 |
|
131 |
|
Non-controlling interest |
(27) |
|
(29) |
|
|
(92) |
|
(48) |
|
(45) |
|
By-product
credits (net of non-controlling interest) |
29
|
|
55
|
|
|
136
|
|
90
|
|
86
|
|
Reconciliation of Gold Cost of Sales to
Total cash costs, All-in sustaining costs and All-in costs, including on a per ounce basis, by operating segment
|
|
|
|
|
|
|
|
|
|
|
|
|
|
|
|
|
|
|
|
|
|
|
|
|
|
|
|
|
|
| ($ millions, except per ounce information in
dollars) |
For the three months ended 12/31/20 |
| |
Footnote |
Carlin
a |
Cortez
b |
Turquoise
Ridgec |
Long
Canyond |
Phoenix
d |
Nevada
Gold Minese |
Hemlo |
North America |
| Cost of sales applicable to gold
production |
|
385 |
|
197 |
|
156 |
|
56 |
|
89 |
|
883 |
|
79 |
|
962 |
|
| Depreciation |
|
(74) |
|
(57) |
|
(52) |
|
(44) |
|
(21) |
|
(248) |
|
(16) |
|
(264) |
|
| By-product credits |
|
(1) |
|
(1) |
|
(3) |
|
0 |
|
(42) |
|
(47) |
|
0 |
|
(47) |
|
|
|
|
|
|
|
|
|
|
|
| Non-recurring items |
f |
0 |
|
0 |
|
0 |
|
0 |
|
0 |
|
0 |
|
0 |
|
0 |
|
| Other |
|
0 |
|
0 |
|
0 |
|
0 |
|
0 |
|
0 |
|
0 |
|
0 |
|
| Non-controlling interests |
|
(120) |
|
(54) |
|
(38) |
|
(5) |
|
(10) |
|
(227) |
|
0 |
|
(227) |
|
| Total cash costs |
|
190 |
|
85 |
|
63 |
|
7 |
|
16 |
|
361 |
|
63 |
|
424 |
|
| General &
administrative costs |
|
0 |
|
0 |
|
0 |
|
0 |
|
0 |
|
0 |
|
0 |
|
0 |
|
| Minesite exploration and evaluation costs |
g |
13 |
|
0 |
|
0 |
|
3 |
|
0 |
|
16 |
|
1 |
|
17 |
|
| Minesite sustaining capital expenditures |
h |
97 |
|
28 |
|
10 |
|
12 |
|
3 |
|
160 |
|
20 |
|
180 |
|
| Sustaining capital leases |
|
0 |
|
0 |
|
0 |
|
0 |
|
0 |
|
1 |
|
0 |
|
1 |
|
| Rehabilitation - accretion and amortization (operating
sites) |
i |
2 |
|
3 |
|
0 |
|
0 |
|
1 |
|
6 |
|
0 |
|
6 |
|
| Non-controlling interests |
|
(43) |
|
(12) |
|
(4) |
|
(6) |
|
(1) |
|
(70) |
|
0 |
|
(70) |
|
| All-in sustaining costs |
|
259 |
|
104 |
|
69 |
|
16 |
|
19 |
|
474 |
|
84 |
|
558 |
|
| Project exploration and
evaluation and project costs |
g |
0 |
|
0 |
|
0 |
|
0 |
|
0 |
|
0 |
|
0 |
|
0 |
|
|
|
|
|
|
|
|
|
|
|
| Project capital expenditures |
h |
0 |
|
8 |
|
6 |
|
0 |
|
0 |
|
48 |
|
0 |
|
48 |
|
|
|
|
|
|
|
|
|
|
|
|
|
|
|
|
|
|
|
|
|
| Non-controlling interests |
|
0 |
|
(3) |
|
(2) |
|
0 |
|
0 |
|
(17) |
|
0 |
|
(17) |
|
| All-in costs |
|
259 |
|
109 |
|
73 |
|
16 |
|
19 |
|
505 |
|
84 |
|
589 |
|
| Ounces sold - equity basis (000s
ounces) |
|
259 |
|
116 |
|
90 |
|
51 |
|
26 |
|
542 |
|
57 |
|
599 |
|
| Cost of sales per ounce |
j,k |
917 |
|
1,043 |
|
1,064 |
|
674 |
|
2,054 |
|
1,007 |
|
1,379 |
|
1,043 |
|
| Total cash costs per ounce |
k |
740 |
|
738 |
|
687 |
|
145 |
|
590 |
|
667 |
|
1,104 |
|
709 |
|
| Total cash costs per ounce (on a co-product basis) |
k,l |
742 |
|
741 |
|
710 |
|
146 |
|
1,557 |
|
720 |
|
1,109 |
|
757 |
|
| All-in sustaining costs per
ounce |
k |
1,005 |
|
906 |
|
757 |
|
324 |
|
670 |
|
873 |
|
1,464 |
|
930 |
|
| All-in sustaining costs per ounce (on a co-product
basis) |
k,l |
1,007 |
|
909 |
|
780 |
|
325 |
|
1,637 |
|
926 |
|
1,469 |
|
978 |
|
| All-in costs per ounce |
k |
1,005 |
|
948 |
|
799 |
|
324 |
|
670 |
|
925 |
|
1,464 |
|
977 |
|
| All-in costs per ounce (on a
co-product basis) |
k,l |
1,007 |
|
951 |
|
822 |
|
325 |
|
1,637 |
|
978 |
|
1,469 |
|
1,025 |
|
|
|
|
|
|
|
|
|
|
| BARRICK YEAR-END 2020 |
78 |
MANAGEMENT’S DISCUSSION AND
ANALYSIS |
|
|
|
|
|
|
|
|
|
|
|
|
|
|
|
|
| ($ millions, except per ounce information in dollars) |
For the three months ended 12/31/20 |
| |
Footnote |
Pueblo Viejo |
Veladero |
|
Latin America & Asia
Pacific |
| Cost of sales applicable to gold
production |
|
203 |
|
54 |
|
|
257 |
|
| Depreciation |
|
(61) |
|
(17) |
|
|
(78) |
|
| By-product credits |
|
(16) |
|
(2) |
|
|
(18) |
|
|
|
|
|
|
|
| Non-recurring items |
f |
0 |
|
0 |
|
|
0 |
|
| Other |
|
0 |
|
0 |
|
|
0 |
|
| Non-controlling interests |
|
(52) |
|
0 |
|
|
(52) |
|
| Total cash costs |
|
74 |
|
35 |
|
|
109 |
|
| General &
administrative costs |
|
0 |
|
0 |
|
|
0 |
|
| Minesite exploration and evaluation costs |
g |
3 |
|
0 |
|
|
3 |
|
| Minesite sustaining capital expenditures |
h |
45 |
|
35 |
|
|
80 |
|
| Sustaining capital leases |
|
0 |
|
1 |
|
|
1 |
|
| Rehabilitation - accretion and amortization (operating
sites) |
i |
2 |
|
1 |
|
|
3 |
|
| Non-controlling interests |
|
(20) |
|
0 |
|
|
(20) |
|
| All-in sustaining costs |
|
104 |
|
72 |
|
|
176 |
|
| Project exploration and
evaluation and project costs |
g |
0 |
|
0 |
|
|
0 |
|
|
|
|
|
|
|
| Project capital expenditures |
h |
64 |
|
0 |
|
|
64 |
|
|
|
|
|
|
|
|
|
|
|
|
|
| Non-controlling interests |
|
(25) |
|
0 |
|
|
(25) |
|
| All-in costs |
|
143 |
|
72 |
|
|
215 |
|
| Ounces sold - equity basis (000s
ounces) |
|
153 |
|
51 |
|
|
204 |
|
| Cost of sales per ounce |
j,k |
803 |
|
1,074 |
|
|
894 |
|
| Total cash costs per ounce |
k |
493 |
|
698 |
|
|
545 |
|
| Total cash costs per ounce (on a co-product basis) |
k,l |
560 |
|
734 |
|
|
604 |
|
| All-in sustaining costs per
ounce |
k |
689 |
|
1,428 |
|
|
878 |
|
| All-in sustaining costs per ounce (on a co-product
basis) |
k,l |
756 |
|
1,464 |
|
|
937 |
|
| All-in costs per ounce |
k |
941 |
|
1,428 |
|
|
1,066 |
|
| All-in costs per ounce (on a
co-product basis) |
k,l |
1,008 |
|
1,464 |
|
|
1,125 |
|
|
|
|
|
|
|
|
|
|
| BARRICK YEAR-END 2020 |
79 |
MANAGEMENT’S DISCUSSION AND
ANALYSIS |
|
|
|
|
|
|
|
|
|
|
|
|
|
|
|
|
|
|
|
|
|
|
|
|
|
|
|
| ($ millions, except per ounce information in
dollars) |
For the three months ended 12/31/20 |
| |
Footnote |
Loulo-Gounkoto |
Kibali |
North
Maram |
Tongon |
Bulyanhulu
m |
Buzwagi
m |
Africa & Middle
East |
| Cost of sales applicable to gold
production |
|
181 |
|
104 |
|
82 |
|
99 |
|
28 |
|
33 |
|
527 |
|
| Depreciation |
|
(65) |
|
(48) |
|
(21) |
|
(41) |
|
(13) |
|
(2) |
|
(190) |
|
| By-product credits |
|
0 |
|
0 |
|
(1) |
|
0 |
|
0 |
|
0 |
|
(1) |
|
|
|
|
|
|
|
|
|
|
| Non-recurring items |
f |
0 |
|
0 |
|
0 |
|
0 |
|
0 |
|
0 |
|
0 |
|
| Other |
|
0 |
|
0 |
|
0 |
|
0 |
|
0 |
|
0 |
|
0 |
|
| Non-controlling interests |
|
(23) |
|
0 |
|
(10) |
|
(6) |
|
(2) |
|
(5) |
|
(46) |
|
| Total cash costs |
|
93 |
|
56 |
|
50 |
|
52 |
|
13 |
|
26 |
|
290 |
|
| General &
administrative costs |
|
0 |
|
0 |
|
0 |
|
0 |
|
0 |
|
0 |
|
0 |
|
| Minesite exploration and evaluation costs |
g |
2 |
|
0 |
|
0 |
|
1 |
|
0 |
|
0 |
|
3 |
|
| Minesite sustaining capital expenditures |
h |
27 |
|
11 |
|
13 |
|
2 |
|
1 |
|
0 |
|
54 |
|
| Sustaining capital leases |
|
1 |
|
2 |
|
0 |
|
0 |
|
0 |
|
0 |
|
3 |
|
| Rehabilitation - accretion and amortization (operating
sites) |
i |
0 |
|
0 |
|
1 |
|
0 |
|
0 |
|
0 |
|
1 |
|
| Non-controlling interests |
|
(6) |
|
0 |
|
(2) |
|
0 |
|
0 |
|
0 |
|
(8) |
|
| All-in sustaining costs |
|
117 |
|
69 |
|
62 |
|
55 |
|
14 |
|
26 |
|
343 |
|
| Project exploration and
evaluation and project costs |
g |
0 |
|
0 |
|
0 |
|
0 |
|
0 |
|
0 |
|
0 |
|
|
|
|
|
|
|
|
|
|
| Project capital expenditures |
h |
7 |
|
1 |
|
18 |
|
0 |
|
43 |
|
0 |
|
69 |
|
|
|
|
|
|
|
|
|
|
|
|
|
|
|
|
|
|
|
| Non-controlling interests |
|
(1) |
|
0 |
|
(3) |
|
0 |
|
(7) |
|
0 |
|
(11) |
|
| All-in costs |
|
123 |
|
70 |
|
77 |
|
55 |
|
50 |
|
26 |
|
401 |
|
| Ounces sold - equity basis (000s
ounces) |
|
126 |
|
89 |
|
63 |
|
64 |
|
20 |
|
21 |
|
383 |
|
| Cost of sales per ounce |
j,k |
1,149 |
|
1,163 |
|
1,073 |
|
1,371 |
|
1,181 |
|
1,314 |
|
1,188 |
|
| Total cash costs per ounce |
k |
734 |
|
616 |
|
799 |
|
810 |
|
610 |
|
1,267 |
|
753 |
|
| Total cash costs per ounce (on a co-product basis) |
k,l |
734 |
|
621 |
|
806 |
|
811 |
|
621 |
|
1,242 |
|
753 |
|
| All-in sustaining costs per
ounce |
k |
923 |
|
783 |
|
989 |
|
853 |
|
664 |
|
1,283 |
|
896 |
|
| All-in sustaining costs per ounce (on a co-product
basis) |
k,l |
923 |
|
788 |
|
996 |
|
854 |
|
675 |
|
1,258 |
|
898 |
|
| All-in costs per ounce |
k |
970 |
|
787 |
|
1,232 |
|
853 |
|
2,493 |
|
1,283 |
|
1,046 |
|
| All-in costs per ounce (on a
co-product basis) |
k,l |
970 |
|
792 |
|
1,239 |
|
854 |
|
2,504 |
|
1,258 |
|
1,048 |
|
|
|
|
|
|
|
|
|
|
| BARRICK YEAR-END 2020 |
80 |
MANAGEMENT’S DISCUSSION AND
ANALYSIS |
|
|
|
|
|
|
|
|
|
|
|
|
|
|
|
|
|
|
|
|
|
|
|
|
|
|
|
|
|
|
| ($ millions, except per ounce information in
dollars) |
For the three months ended 9/30/20 |
| |
Footnote |
Carlin
a |
Cortez
b |
Turquoise
Ridgec |
Long
Canyond |
Phoenix
d |
Nevada
Gold Minese |
Hemlo |
North America |
| Cost of sales applicable to gold
production |
|
440 |
|
198 |
|
136 |
|
64 |
|
90 |
|
928 |
|
69 |
|
997 |
|
| Depreciation |
|
(82) |
|
(54) |
|
(41) |
|
(48) |
|
(23) |
|
(248) |
|
(8) |
|
(256) |
|
| By-product credits |
|
(1) |
|
(1) |
|
(2) |
|
0 |
|
(39) |
|
(43) |
|
(1) |
|
(44) |
|
|
|
|
|
|
|
|
|
|
|
| Non-recurring items |
f |
0 |
|
0 |
|
0 |
|
0 |
|
0 |
|
0 |
|
0 |
|
0 |
|
| Other |
|
0 |
|
0 |
|
0 |
|
0 |
|
0 |
|
0 |
|
0 |
|
0 |
|
| Non-controlling interests |
|
(137) |
|
(55) |
|
(36) |
|
(6) |
|
(10) |
|
(244) |
|
0 |
|
(244) |
|
| Total cash costs |
|
220 |
|
88 |
|
57 |
|
10 |
|
18 |
|
393 |
|
60 |
|
453 |
|
| General &
administrative costs |
|
0 |
|
0 |
|
0 |
|
0 |
|
0 |
|
0 |
|
0 |
|
0 |
|
| Minesite exploration and evaluation costs |
g |
7 |
|
1 |
|
2 |
|
1 |
|
0 |
|
11 |
|
0 |
|
11 |
|
| Minesite sustaining capital expenditures |
h |
97 |
|
64 |
|
6 |
|
10 |
|
6 |
|
189 |
|
21 |
|
210 |
|
| Sustaining capital leases |
|
0 |
|
0 |
|
0 |
|
0 |
|
0 |
|
0 |
|
0 |
|
0 |
|
| Rehabilitation - accretion and amortization (operating
sites) |
i |
2 |
|
3 |
|
0 |
|
0 |
|
1 |
|
6 |
|
0 |
|
6 |
|
| Non-controlling interests |
|
(41) |
|
(26) |
|
(3) |
|
(4) |
|
(2) |
|
(78) |
|
0 |
|
(78) |
|
| All-in sustaining costs |
|
285 |
|
130 |
|
62 |
|
17 |
|
23 |
|
521 |
|
81 |
|
602 |
|
| Project exploration and
evaluation and project costs |
g |
0 |
|
0 |
|
0 |
|
0 |
|
0 |
|
0 |
|
0 |
|
0 |
|
|
|
|
|
|
|
|
|
|
|
| Project capital expenditures |
h |
0 |
|
20 |
|
15 |
|
0 |
|
0 |
|
59 |
|
0 |
|
59 |
|
|
|
|
|
|
|
|
|
|
|
| Non-controlling interests |
|
0 |
|
(7) |
|
(6) |
|
0 |
|
0 |
|
(24) |
|
0 |
|
(24) |
|
|
|
|
|
|
|
|
|
|
|
| All-in costs |
|
285 |
|
143 |
|
71 |
|
17 |
|
23 |
|
556 |
|
81 |
|
637 |
|
| Ounces sold - equity basis (000s
ounces) |
|
275 |
|
115 |
|
76 |
|
45 |
|
31 |
|
542 |
|
55 |
|
597 |
|
| Cost of sales per ounce |
j,k |
985 |
|
1,060 |
|
1,097 |
|
877 |
|
1,773 |
|
1,060 |
|
1,257 |
|
1,078 |
|
| Total cash costs per ounce |
k |
800 |
|
763 |
|
745 |
|
212 |
|
520 |
|
723 |
|
1,099 |
|
758 |
|
| Total cash costs per ounce (on a co-product basis) |
k,l |
802 |
|
768 |
|
766 |
|
216 |
|
1,308 |
|
774 |
|
1,104 |
|
805 |
|
| All-in sustaining costs per
ounce |
k |
1,036 |
|
1,133 |
|
805 |
|
384 |
|
659 |
|
956 |
|
1,497 |
|
1,006 |
|
| All-in sustaining costs per ounce (on a co-product
basis) |
k,l |
1,038 |
|
1,138 |
|
826 |
|
388 |
|
1,447 |
|
1,007 |
|
1,502 |
|
1,053 |
|
| All-in costs per ounce |
k |
1,036 |
|
1,236 |
|
929 |
|
384 |
|
659 |
|
1,025 |
|
1,502 |
|
1,069 |
|
| All-in costs per ounce (on a
co-product basis) |
k,l |
1,038 |
|
1,241 |
|
950 |
|
388 |
|
1,447 |
|
1,076 |
|
1,507 |
|
1,116 |
|
|
|
|
|
|
|
|
|
|
| BARRICK YEAR-END 2020 |
81 |
MANAGEMENT’S DISCUSSION AND
ANALYSIS |
|
|
|
|
|
|
|
|
|
|
|
|
|
|
|
| ($ millions, except per ounce information in dollars) |
For the three months ended 9/30/20 |
| |
Footnote |
Pueblo Viejo |
Veladero |
Latin America & Asia
Pacific |
| Cost of sales applicable to gold
production |
|
169 |
|
49 |
|
218 |
|
| Depreciation |
|
(56) |
|
(17) |
|
(73) |
|
| By-product credits |
|
(17) |
|
(1) |
|
(18) |
|
|
|
|
|
|
| Non-recurring items |
f |
0 |
|
0 |
|
0 |
|
| Other |
|
0 |
|
0 |
|
0 |
|
| Non-controlling interests |
|
(38) |
|
0 |
|
(38) |
|
| Total cash costs |
|
58 |
|
31 |
|
89 |
|
| General &
administrative costs |
|
0 |
|
0 |
|
0 |
|
| Minesite exploration and evaluation costs |
g |
0 |
|
0 |
|
0 |
|
| Minesite sustaining capital expenditures |
h |
32 |
|
18 |
|
50 |
|
| Sustaining capital leases |
|
0 |
|
1 |
|
1 |
|
| Rehabilitation - accretion and amortization (operating
sites) |
i |
1 |
|
1 |
|
2 |
|
| Non-controlling interests |
|
(13) |
|
0 |
|
(13) |
|
| All-in sustaining costs |
|
78 |
|
51 |
|
129 |
|
| Project exploration and
evaluation and project costs |
g |
1 |
|
0 |
|
1 |
|
|
|
|
|
|
| Project capital expenditures |
h |
18 |
|
0 |
|
18 |
|
|
|
|
|
|
| Non-controlling interests |
|
(7) |
|
0 |
|
(7) |
|
|
|
|
|
|
| All-in costs |
|
90 |
|
51 |
|
141 |
|
| Ounces sold - equity basis (000s
ounces) |
|
129 |
|
43 |
|
172 |
|
| Cost of sales per ounce |
j,k |
791 |
|
1,136 |
|
877 |
|
| Total cash costs per ounce |
k |
450 |
|
708 |
|
515 |
|
| Total cash costs per ounce (on a co-product basis) |
k,l |
527 |
|
743 |
|
581 |
|
| All-in sustaining costs per
ounce |
k |
609 |
|
1,159 |
|
746 |
|
| All-in sustaining costs per ounce (on a co-product
basis) |
k,l |
686 |
|
1,194 |
|
812 |
|
| All-in costs per ounce |
k |
697 |
|
1,159 |
|
813 |
|
| All-in costs per ounce (on a
co-product basis) |
k,l |
774 |
|
1,194 |
|
879 |
|
|
|
|
|
|
|
|
|
|
| BARRICK YEAR-END 2020 |
82 |
MANAGEMENT’S DISCUSSION AND
ANALYSIS |
|
|
|
|
|
|
|
|
|
|
|
|
|
|
|
|
|
|
|
|
|
|
|
|
|
|
|
| ($ millions, except per ounce information in
dollars) |
For the three months ended 9/30/20 |
| |
Footnote |
Loulo-Gounkoto |
Kibali |
North
Maram |
Tongon |
Bulyanhulu
m |
Buzwagi
m |
Africa & Middle
East |
| Cost of sales applicable to gold
production |
|
185 |
|
99 |
|
73 |
|
96 |
|
82 |
|
79 |
|
614 |
|
| Depreciation |
|
(69) |
|
(43) |
|
(20) |
|
(43) |
|
(28) |
|
(4) |
|
(207) |
|
| By-product credits |
|
0 |
|
0 |
|
(1) |
|
0 |
|
(6) |
|
(14) |
|
(21) |
|
|
|
|
|
|
|
|
|
|
| Non-recurring items |
f |
0 |
|
0 |
|
0 |
|
0 |
|
0 |
|
0 |
|
0 |
|
| Other |
|
0 |
|
0 |
|
0 |
|
0 |
|
0 |
|
0 |
|
0 |
|
| Non-controlling interests |
|
(23) |
|
0 |
|
(8) |
|
(6) |
|
(8) |
|
(9) |
|
(54) |
|
| Total cash costs |
|
93 |
|
56 |
|
44 |
|
47 |
|
40 |
|
52 |
|
332 |
|
| General &
administrative costs |
|
0 |
|
0 |
|
0 |
|
0 |
|
0 |
|
0 |
|
0 |
|
| Minesite exploration and evaluation costs |
g |
3 |
|
0 |
|
0 |
|
0 |
|
0 |
|
0 |
|
3 |
|
| Minesite sustaining capital expenditures |
h |
77 |
|
14 |
|
7 |
|
2 |
|
2 |
|
0 |
|
102 |
|
| Sustaining capital leases |
|
0 |
|
5 |
|
0 |
|
0 |
|
0 |
|
0 |
|
5 |
|
| Rehabilitation - accretion and amortization (operating
sites) |
i |
2 |
|
0 |
|
1 |
|
0 |
|
1 |
|
0 |
|
4 |
|
| Non-controlling interests |
|
(16) |
|
0 |
|
(1) |
|
0 |
|
0 |
|
0 |
|
(17) |
|
| All-in sustaining costs |
|
159 |
|
75 |
|
51 |
|
49 |
|
43 |
|
52 |
|
429 |
|
| Project exploration and
evaluation and project costs |
g |
0 |
|
0 |
|
0 |
|
0 |
|
0 |
|
0 |
|
0 |
|
|
|
|
|
|
|
|
|
|
| Project capital expenditures |
h |
11 |
|
0 |
|
13 |
|
0 |
|
18 |
|
0 |
|
42 |
|
|
|
|
|
|
|
|
|
|
| Non-controlling interests |
|
(2) |
|
0 |
|
(2) |
|
0 |
|
(3) |
|
0 |
|
(7) |
|
|
|
|
|
|
|
|
|
|
| All-in costs |
|
168 |
|
75 |
|
62 |
|
49 |
|
58 |
|
52 |
|
464 |
|
| Ounces sold - equity basis (000s
ounces) |
|
136 |
|
91 |
|
69 |
|
65 |
|
46 |
|
73 |
|
480 |
|
| Cost of sales per ounce |
j,k |
1,088 |
|
1,088 |
|
903 |
|
1,329 |
|
1,502 |
|
907 |
|
1,106 |
|
| Total cash costs per ounce |
k |
682 |
|
617 |
|
649 |
|
731 |
|
874 |
|
687 |
|
691 |
|
| Total cash costs per ounce (on a co-product basis) |
k,l |
682 |
|
622 |
|
656 |
|
732 |
|
996 |
|
863 |
|
732 |
|
| All-in sustaining costs per
ounce |
k |
1,161 |
|
817 |
|
758 |
|
777 |
|
913 |
|
693 |
|
891 |
|
| All-in sustaining costs per ounce (on a co-product
basis) |
k,l |
1,161 |
|
822 |
|
765 |
|
778 |
|
1,035 |
|
869 |
|
932 |
|
| All-in costs per ounce |
k |
1,229 |
|
823 |
|
912 |
|
778 |
|
1,243 |
|
693 |
|
965 |
|
| All-in costs per ounce (on a
co-product basis) |
k,l |
1,229 |
|
828 |
|
919 |
|
779 |
|
1,365 |
|
869 |
|
1,006 |
|
|
|
|
|
|
|
|
|
|
| BARRICK YEAR-END 2020 |
83 |
MANAGEMENT’S DISCUSSION AND
ANALYSIS |
|
|
|
|
|
|
|
|
|
|
|
|
|
|
|
|
|
|
|
|
|
|
|
|
|
|
|
|
|
|
| ($ millions, except per ounce information in
dollars) |
For the year ended 12/31/2020 |
| |
Footnote |
Carlin
a |
Cortez
b |
Turquoise
Ridgec |
Long
Canyond |
Phoenix
d |
Nevada
Gold Minese |
Hemlo |
North America |
| Cost of sales applicable to gold
production |
|
1,624 |
|
764 |
|
575 |
|
227 |
|
365 |
|
3,555 |
|
281 |
|
3,836 |
|
| Depreciation |
|
(306) |
|
(221) |
|
(184) |
|
(165) |
|
(94) |
|
(970) |
|
(44) |
|
(1,014) |
|
| By-product credits |
|
(2) |
|
(2) |
|
(7) |
|
0 |
|
(137) |
|
(148) |
|
(1) |
|
(149) |
|
|
|
|
|
|
|
|
|
|
|
| Non-recurring items |
f |
0 |
|
0 |
|
0 |
|
0 |
|
0 |
|
0 |
|
0 |
|
0 |
|
| Other |
|
0 |
|
0 |
|
0 |
|
0 |
|
0 |
|
0 |
|
0 |
|
0 |
|
| Non-controlling interests |
|
(507) |
|
(208) |
|
(148) |
|
(24) |
|
(51) |
|
(938) |
|
0 |
|
(938) |
|
| Total cash costs |
|
809 |
|
333 |
|
236 |
|
38 |
|
83 |
|
1,499 |
|
236 |
|
1,735 |
|
| General &
administrative costs |
|
0 |
|
0 |
|
0 |
|
0 |
|
0 |
|
0 |
|
0 |
|
0 |
|
| Minesite exploration and evaluation costs |
g |
30 |
|
7 |
|
7 |
|
8 |
|
0 |
|
52 |
|
1 |
|
53 |
|
| Minesite sustaining capital expenditures |
h |
381 |
|
235 |
|
39 |
|
35 |
|
29 |
|
748 |
|
79 |
|
827 |
|
| Sustaining capital leases |
|
1 |
|
0 |
|
0 |
|
0 |
|
1 |
|
4 |
|
0 |
|
4 |
|
| Rehabilitation - accretion and amortization (operating
sites) |
i |
8 |
|
13 |
|
0 |
|
2 |
|
3 |
|
26 |
|
1 |
|
27 |
|
| Non-controlling interests |
|
(163) |
|
(98) |
|
(18) |
|
(17) |
|
(13) |
|
(321) |
|
0 |
|
(321) |
|
| All-in sustaining costs |
|
1,066 |
|
490 |
|
264 |
|
66 |
|
103 |
|
2,008 |
|
317 |
|
2,325 |
|
| Project exploration and
evaluation and project costs |
g |
0 |
|
0 |
|
0 |
|
0 |
|
0 |
|
0 |
|
0 |
|
0 |
|
|
|
|
|
|
|
|
|
|
|
| Project capital expenditures |
h |
0 |
|
51 |
|
44 |
|
0 |
|
0 |
|
200 |
|
0 |
|
200 |
|
|
|
|
|
|
|
|
|
|
|
| Non-controlling interests |
|
0 |
|
(19) |
|
(17) |
|
0 |
|
0 |
|
(76) |
|
0 |
|
(76) |
|
|
|
|
|
|
|
|
|
|
|
| All-in costs |
|
1,066 |
|
522 |
|
291 |
|
66 |
|
103 |
|
2,132 |
|
317 |
|
2,449 |
|
| Ounces sold - equity basis (000s
ounces) |
|
1,024 |
|
491 |
|
332 |
|
161 |
|
126 |
|
2,134 |
|
224 |
|
2,358 |
|
| Cost of sales per ounce |
j,k |
976 |
|
957 |
|
1,064 |
|
869 |
|
1,772 |
|
1,029 |
|
1,256 |
|
1,050 |
|
| Total cash costs per ounce |
k |
790 |
|
678 |
|
711 |
|
236 |
|
649 |
|
702 |
|
1,056 |
|
735 |
|
| Total cash costs per ounce (on a co-product basis) |
k,l |
791 |
|
680 |
|
723 |
|
238 |
|
1,315 |
|
745 |
|
1,060 |
|
774 |
|
| All-in sustaining costs per
ounce |
k |
1,041 |
|
998 |
|
798 |
|
405 |
|
814 |
|
941 |
|
1,423 |
|
987 |
|
| All-in sustaining costs per ounce (on a co-product
basis) |
k,l |
1,042 |
|
1,000 |
|
810 |
|
407 |
|
1,480 |
|
984 |
|
1,427 |
|
1,026 |
|
| All-in costs per ounce |
k |
1,041 |
|
1,062 |
|
879 |
|
405 |
|
814 |
|
998 |
|
1,424 |
|
1,039 |
|
| All-in costs per ounce (on a
co-product basis) |
k,l |
1,042 |
|
1,064 |
|
891 |
|
407 |
|
1,480 |
|
1,041 |
|
1,428 |
|
1,078 |
|
|
|
|
|
|
|
|
|
|
| BARRICK YEAR-END 2020 |
84 |
MANAGEMENT’S DISCUSSION AND
ANALYSIS |
|
|
|
|
|
|
|
|
|
|
|
|
|
|
|
|
|
|
| ($ millions, except per ounce information in
dollars) |
For the year ended 12/31/2020 |
| |
Footnote |
Pueblo Viejo |
Veladero |
Porgera
n |
Latin America & Asia
Pacific |
| Cost of sales applicable to gold
production |
|
735 |
|
213 |
|
106 |
|
1,054 |
|
| Depreciation |
|
(224) |
|
(69) |
|
(25) |
|
(318) |
|
| By-product credits |
|
(57) |
|
(5) |
|
(1) |
|
(63) |
|
|
|
|
|
|
|
| Non-recurring items |
|
0 |
|
0 |
|
0 |
|
0 |
|
| Other |
f |
0 |
|
0 |
|
0 |
|
0 |
|
| Non-controlling interests |
|
(182) |
|
0 |
|
0 |
|
(182) |
|
| Total cash costs |
|
272 |
|
139 |
|
80 |
|
491 |
|
| General &
administrative costs |
|
0 |
|
0 |
|
0 |
|
0 |
|
| Minesite exploration and evaluation costs |
g |
3 |
|
0 |
|
2 |
|
5 |
|
| Minesite sustaining capital expenditures |
h |
132 |
|
98 |
|
11 |
|
241 |
|
| Sustaining capital leases |
|
0 |
|
2 |
|
3 |
|
5 |
|
| Rehabilitation - accretion and amortization (operating
sites) |
i |
6 |
|
4 |
|
0 |
|
10 |
|
| Non-controlling interests |
|
(56) |
|
0 |
|
0 |
|
(56) |
|
| All-in sustaining costs |
|
357 |
|
243 |
|
96 |
|
696 |
|
| Project exploration and
evaluation and project costs |
g |
1 |
|
0 |
|
0 |
|
1 |
|
|
|
|
|
|
|
| Project capital expenditures |
h |
91 |
|
15 |
|
0 |
|
106 |
|
|
|
|
|
|
|
| Non-controlling interests |
|
(37) |
|
0 |
0 |
(37) |
|
|
|
|
|
|
|
| All-in costs |
|
412 |
|
258 |
|
96 |
|
766 |
|
| Ounces sold - equity basis (000s
ounces) |
|
541 |
|
186 |
|
87 |
|
814 |
|
| Cost of sales per ounce |
j,k |
819 |
|
1,151 |
|
1,225 |
|
938 |
|
| Total cash costs per ounce |
k |
504 |
|
748 |
|
928 |
|
604 |
|
| Total cash costs per ounce (on a co-product basis) |
k,l |
568 |
|
777 |
|
934 |
|
654 |
|
| All-in sustaining costs per
ounce |
k |
660 |
|
1,308 |
|
1,115 |
|
856 |
|
| All-in sustaining costs per ounce (on a co-product
basis) |
k,l |
724 |
|
1,337 |
|
1,121 |
|
906 |
|
| All-in costs per ounce |
k |
761 |
|
1,390 |
|
1,116 |
|
942 |
|
| All-in costs per ounce (on a
co-product basis) |
k,l |
825 |
|
1,419 |
|
1,122 |
|
992 |
|
|
|
|
|
|
|
|
|
|
| BARRICK YEAR-END 2020 |
85 |
MANAGEMENT’S DISCUSSION AND
ANALYSIS |
|
|
|
|
|
|
|
|
|
|
|
|
|
|
|
|
|
|
|
|
|
|
|
|
|
|
|
| ($ millions, except per ounce information in
dollars) |
For the year ended 12/31/2020 |
| |
Footnote |
Loulo-Gounkoto |
Kibali |
North
Maram |
Tongon |
Bulyanhulu
m |
Buzwagi
m |
Africa & Middle
East |
| Cost of sales applicable to gold
production |
|
719 |
|
397 |
|
318 |
|
380 |
|
184 |
|
211 |
|
2,209 |
|
| Depreciation |
|
(267) |
|
(174) |
|
(91) |
|
(167) |
|
(72) |
|
(11) |
|
(782) |
|
| By-product credits |
|
0 |
|
(1) |
|
(2) |
|
0 |
|
(10) |
|
(22) |
|
(35) |
|
|
|
|
|
|
|
|
|
|
| Non-recurring items |
f |
0 |
|
0 |
|
0 |
|
0 |
|
0 |
|
0 |
|
0 |
|
| Other |
|
0 |
|
0 |
|
0 |
|
0 |
|
0 |
|
0 |
|
0 |
|
| Non-controlling interests |
|
(90) |
|
0 |
|
(36) |
|
(22) |
|
(16) |
|
(28) |
|
(192) |
|
| Total cash costs |
|
362 |
|
222 |
|
189 |
|
191 |
|
86 |
|
150 |
|
1,200 |
|
| General &
administrative costs |
|
0 |
|
0 |
|
0 |
|
0 |
|
0 |
|
0 |
|
0 |
|
| Minesite exploration and evaluation costs |
g |
11 |
|
2 |
|
0 |
|
3 |
|
0 |
|
0 |
|
16 |
|
| Minesite sustaining capital expenditures |
h |
213 |
|
49 |
|
68 |
|
8 |
|
7 |
|
1 |
|
346 |
|
| Sustaining capital leases |
|
3 |
|
9 |
|
0 |
|
2 |
|
0 |
|
1 |
|
15 |
|
| Rehabilitation - accretion and amortization (operating
sites) |
i |
3 |
|
1 |
|
4 |
|
0 |
|
1 |
|
0 |
|
9 |
|
| Non-controlling interests |
|
(46) |
|
0 |
|
(12) |
|
(1) |
|
(1) |
|
0 |
|
(60) |
|
| All-in sustaining costs |
|
546 |
|
283 |
|
249 |
|
203 |
|
93 |
|
152 |
|
1,526 |
|
| Project exploration and
evaluation and project costs |
g |
0 |
|
0 |
|
0 |
|
0 |
|
0 |
|
0 |
|
0 |
|
|
|
|
|
|
|
|
|
|
| Project capital expenditures |
h |
19 |
|
2 |
|
35 |
|
0 |
|
69 |
|
0 |
|
125 |
|
|
|
|
|
|
|
|
|
|
| Non-controlling interests |
|
(4) |
|
0 |
|
(5) |
|
0 |
|
(11) |
|
0 |
|
(20) |
|
|
|
|
|
|
|
|
|
|
| All-in costs |
|
561 |
|
285 |
|
279 |
|
203 |
|
151 |
|
152 |
|
1,631 |
|
| Ounces sold - equity basis (000s
ounces) |
|
542 |
|
364 |
|
269 |
|
255 |
|
103 |
|
174 |
|
1,707 |
|
| Cost of sales per ounce |
j,k |
1,060 |
|
1,091 |
|
992 |
|
1,334 |
|
1,499 |
|
1,021 |
|
1,119 |
|
| Total cash costs per ounce |
k |
666 |
|
608 |
|
702 |
|
747 |
|
832 |
|
859 |
|
701 |
|
| Total cash costs per ounce (on a co-product basis) |
k,l |
666 |
|
612 |
|
709 |
|
748 |
|
913 |
|
968 |
|
719 |
|
| All-in sustaining costs per
ounce |
k |
1,006 |
|
778 |
|
929 |
|
791 |
|
895 |
|
871 |
|
893 |
|
| All-in sustaining costs per ounce (on a co-product
basis) |
k,l |
1,006 |
|
782 |
|
936 |
|
792 |
|
976 |
|
980 |
|
911 |
|
| All-in costs per ounce |
k |
1,034 |
|
782 |
|
1,039 |
|
791 |
|
1,459 |
|
871 |
|
954 |
|
| All-in costs per ounce (on a
co-product basis) |
k,l |
1,034 |
|
786 |
|
1,046 |
|
792 |
|
1,540 |
|
980 |
|
972 |
|
|
|
|
|
|
|
|
|
|
| BARRICK YEAR-END 2020 |
86 |
MANAGEMENT’S DISCUSSION AND
ANALYSIS |
|
|
|
|
|
|
|
|
|
|
|
|
|
|
|
|
|
|
|
|
|
|
|
|
|
|
|
|
|
|
| ($ millions, except per ounce information in
dollars) |
For the year ended 12/31/2019 |
| |
Footnote |
Carlin
a |
Cortez
b |
Turquoise
Ridgec |
Long
Canyond |
Phoenix
d |
Nevada
Gold Minese |
Hemlo |
North America |
| Cost of sales applicable to gold
production |
|
1,310 |
|
751 |
|
425 |
|
101 |
|
154 |
|
2,741 |
|
247 |
|
2,988 |
|
| Depreciation |
|
(312) |
|
(240) |
|
(140) |
|
(70) |
|
(36) |
|
(798) |
|
(27) |
|
(825) |
|
| By-product credits |
|
(1) |
|
(1) |
|
(2) |
|
0 |
|
(48) |
|
(52) |
|
(1) |
|
(53) |
|
|
|
|
|
|
|
|
|
|
|
| Non-recurring items |
f |
(10) |
|
0 |
|
0 |
|
0 |
|
0 |
|
(10) |
|
(23) |
|
(33) |
|
| Other |
|
0 |
|
0 |
|
0 |
|
0 |
|
0 |
|
0 |
|
0 |
|
0 |
|
| Non-controlling interests |
|
(266) |
|
(99) |
|
(75) |
|
(12) |
|
(27) |
|
(479) |
|
0 |
|
(479) |
|
| Total cash costs |
|
721 |
|
411 |
|
208 |
|
19 |
|
43 |
|
1,402 |
|
196 |
|
1,598 |
|
| General &
administrative costs |
|
0 |
|
0 |
|
0 |
|
0 |
|
0 |
|
0 |
|
0 |
|
0 |
|
| Minesite exploration and evaluation costs |
g |
17 |
|
8 |
|
4 |
|
6 |
|
1 |
|
36 |
|
1 |
|
37 |
|
| Minesite sustaining capital expenditures |
h |
307 |
|
129 |
|
70 |
|
26 |
|
22 |
|
554 |
|
47 |
|
601 |
|
| Sustaining capital leases |
|
0 |
|
0 |
|
1 |
|
0 |
|
0 |
|
1 |
|
1 |
|
2 |
|
| Rehabilitation - accretion and amortization (operating
sites) |
i |
10 |
|
16 |
|
2 |
|
0 |
|
2 |
|
30 |
|
2 |
|
32 |
|
| Non-controlling interests |
|
(102) |
|
(44) |
|
(21) |
|
(12) |
|
(10) |
|
(189) |
|
0 |
|
(189) |
|
| All-in sustaining costs |
|
953 |
|
520 |
|
264 |
|
39 |
|
58 |
|
1,834 |
|
247 |
|
2,081 |
|
| Project exploration and
evaluation and project costs |
g |
0 |
|
0 |
|
0 |
|
0 |
|
0 |
|
0 |
|
0 |
|
0 |
|
|
|
|
|
|
|
|
|
|
|
| Project capital expenditures |
h |
0 |
|
186 |
|
45 |
|
0 |
|
0 |
|
295 |
|
0 |
|
295 |
|
|
|
|
|
|
|
|
|
|
|
| Non-controlling interests |
|
0 |
|
(21) |
|
(10) |
|
0 |
|
0 |
|
(48) |
|
0 |
|
(48) |
|
|
|
|
|
|
|
|
|
|
|
| All-in costs |
|
953 |
|
685 |
|
299 |
|
39 |
|
58 |
|
2,081 |
|
247 |
|
2,328 |
|
| Ounces sold - equity basis (000s
ounces) |
|
967 |
|
798 |
|
356 |
|
57 |
|
45 |
|
2,223 |
|
217 |
|
2,440 |
|
| Cost of sales per ounce |
j,k |
1,004 |
|
762 |
|
846 |
|
1,088 |
|
2,093 |
|
924 |
|
1,137 |
|
943 |
|
| Total cash costs per ounce |
k |
746 |
|
515 |
|
585 |
|
333 |
|
947 |
|
634 |
|
904 |
|
655 |
|
| Total cash costs per ounce (on a co-product basis) |
k,l |
747 |
|
516 |
|
588 |
|
335 |
|
1,600 |
|
657 |
|
907 |
|
677 |
|
| All-in sustaining costs per
ounce |
k |
984 |
|
651 |
|
732 |
|
681 |
|
1,282 |
|
828 |
|
1,140 |
|
851 |
|
| All-in sustaining costs per ounce (on a co-product
basis) |
k,l |
985 |
|
652 |
|
735 |
|
683 |
|
1,935 |
|
851 |
|
1,143 |
|
873 |
|
| All-in costs per ounce |
k |
984 |
|
854 |
|
834 |
|
681 |
|
1,282 |
|
938 |
|
1,141 |
|
953 |
|
| All-in costs per ounce (on a
co-product basis) |
k,l |
985 |
|
855 |
|
837 |
|
683 |
|
1,935 |
|
961 |
|
1,144 |
|
975 |
|
|
|
|
|
|
|
|
|
|
| BARRICK YEAR-END 2020 |
87 |
MANAGEMENT’S DISCUSSION AND
ANALYSIS |
|
|
|
|
|
|
|
|
|
|
|
|
|
|
|
|
|
|
|
|
|
| ($ millions, except per ounce information in
dollars) |
For the year ended 12/31/2019 |
| |
Footnote |
Pueblo Viejo |
Veladero |
Porgera
n |
Kalgoorlie
o |
Latin America & Asia
Pacific |
| Cost of sales applicable to gold
production |
|
721 |
|
323 |
|
284 |
|
223 |
|
1,551 |
|
| Depreciation |
|
(196) |
|
(115) |
|
(42) |
|
(38) |
|
(391) |
|
| By-product credits |
|
(61) |
|
(8) |
|
(3) |
|
(1) |
|
(73) |
|
|
|
|
|
|
|
|
| Non-recurring items |
f |
(2) |
|
(1) |
|
0 |
|
0 |
|
(3) |
|
| Other |
|
0 |
|
0 |
|
0 |
|
0 |
|
0 |
|
| Non-controlling interests |
|
(187) |
|
0 |
|
0 |
|
0 |
|
(187) |
|
| Total cash costs |
|
275 |
|
199 |
|
239 |
|
184 |
|
897 |
|
| General &
administrative costs |
|
0 |
|
0 |
|
0 |
|
0 |
|
0 |
|
| Minesite exploration and evaluation costs |
g |
0 |
|
3 |
|
2 |
|
6 |
|
11 |
|
| Minesite sustaining capital expenditures |
h |
107 |
|
91 |
|
45 |
|
52 |
|
295 |
|
| Sustaining capital leases |
|
0 |
|
2 |
|
3 |
|
4 |
|
9 |
|
| Rehabilitation - accretion and amortization (operating
sites) |
i |
10 |
|
5 |
|
(2) |
|
3 |
|
16 |
|
| Non-controlling interests |
|
(47) |
|
0 |
|
0 |
|
0 |
|
(47) |
|
| All-in sustaining costs |
|
345 |
|
300 |
|
287 |
|
249 |
|
1,181 |
|
| Project exploration and
evaluation and project costs |
g |
8 |
|
0 |
|
0 |
|
0 |
|
8 |
|
|
|
|
|
|
|
|
| Project capital expenditures |
h |
0 |
|
15 |
|
0 |
|
0 |
|
15 |
|
|
|
|
|
|
|
|
| Non-controlling interests |
|
(3) |
|
0 |
|
0 |
|
0 |
|
(3) |
|
|
|
|
|
|
|
|
| All-in costs |
|
350 |
|
315 |
|
287 |
|
249 |
|
1,201 |
|
| Ounces sold - equity basis (000s
ounces) |
|
584 |
|
271 |
|
285 |
|
210 |
|
1,350 |
|
| Cost of sales per ounce |
j,k |
747 |
|
1,188 |
|
994 |
|
1,062 |
|
937 |
|
| Total cash costs per ounce |
k |
471 |
|
734 |
|
838 |
|
873 |
|
664 |
|
| Total cash costs per ounce (on a co-product basis) |
k,l |
536 |
|
759 |
|
848 |
|
876 |
|
716 |
|
| All-in sustaining costs per
ounce |
k |
592 |
|
1,105 |
|
1,003 |
|
1,183 |
|
874 |
|
| All-in sustaining costs per ounce (on a co-product
basis) |
k,l |
657 |
|
1,130 |
|
1,013 |
|
1,186 |
|
926 |
|
| All-in costs per ounce |
k |
600 |
|
1,162 |
|
1,003 |
|
1,183 |
|
885 |
|
| All-in costs per ounce (on a
co-product basis) |
k,l |
665 |
|
1,187 |
|
1,013 |
|
1,186 |
|
937 |
|
|
|
|
|
|
|
|
|
|
| BARRICK YEAR-END 2020 |
88 |
MANAGEMENT’S DISCUSSION AND
ANALYSIS |
|
|
|
|
|
|
|
|
|
|
|
|
|
|
|
|
|
|
|
|
|
|
|
|
|
|
|
| ($ millions, except per ounce information in
dollars) |
For the year ended 12/31/2019 |
| |
Footnote |
Loulo-Gounkoto |
Kibali |
North
Maram |
Tongon |
Bulyanhulu
m |
Buzwagi
m |
Africa & Middle
East |
| Cost of sales applicable to gold
production |
|
751 |
|
403 |
|
310 |
|
402 |
|
45 |
|
138 |
|
2,049 |
|
| Depreciation |
|
(295) |
|
(196) |
|
(97) |
|
(186) |
|
(19) |
|
(8) |
|
(801) |
|
| By-product credits |
|
0 |
|
(1) |
|
(2) |
|
(1) |
|
(1) |
|
(1) |
|
(6) |
|
|
|
|
|
|
|
|
|
|
| Non-recurring items |
f |
0 |
|
0 |
|
0 |
|
0 |
|
0 |
|
0 |
|
0 |
|
| Other |
|
0 |
|
0 |
|
0 |
|
0 |
|
0 |
|
0 |
|
0 |
|
| Non-controlling interests |
|
(91) |
|
0 |
|
(51) |
|
(23) |
|
(7) |
|
(36) |
|
(208) |
|
| Total cash costs |
|
365 |
|
206 |
|
160 |
|
192 |
|
18 |
|
93 |
|
1,034 |
|
| General &
administrative costs |
|
0 |
|
0 |
|
0 |
|
0 |
|
0 |
|
0 |
|
0 |
|
| Minesite exploration and evaluation costs |
g |
12 |
|
3 |
|
0 |
|
3 |
|
0 |
|
0 |
|
18 |
|
| Minesite sustaining capital expenditures |
h |
165 |
|
41 |
|
48 |
|
11 |
|
2 |
|
0 |
|
267 |
|
| Sustaining capital leases |
|
3 |
|
1 |
|
0 |
|
2 |
|
0 |
|
1 |
|
7 |
|
| Rehabilitation - accretion and amortization (operating
sites) |
i |
1 |
|
0 |
|
3 |
|
0 |
|
1 |
|
1 |
|
6 |
|
| Non-controlling interests |
|
(37) |
|
0 |
|
(13) |
|
(2) |
|
(1) |
|
0 |
|
(53) |
|
| All-in sustaining costs |
|
509 |
|
251 |
|
198 |
|
206 |
|
20 |
|
95 |
|
1,279 |
|
| Project exploration and
evaluation and project costs |
g |
0 |
|
0 |
|
0 |
|
0 |
|
0 |
|
0 |
|
0 |
|
|
|
|
|
|
|
|
|
|
| Project capital expenditures |
h |
4 |
|
2 |
|
9 |
|
0 |
|
3 |
|
0 |
|
18 |
|
|
|
|
|
|
|
|
|
|
| Non-controlling interests |
|
(1) |
|
0 |
|
(3) |
|
0 |
|
(1) |
|
0 |
|
(5) |
|
|
|
|
|
|
|
|
|
|
| All-in costs |
|
512 |
|
253 |
|
204 |
|
206 |
|
22 |
|
95 |
|
1,292 |
|
| Ounces sold - equity basis (000s
ounces) |
|
575 |
|
363 |
|
248 |
|
245 |
|
27 |
|
81 |
|
1,539 |
|
| Cost of sales per ounce |
j,k |
1,044 |
|
1,111 |
|
953 |
|
1,469 |
|
1,207 |
|
1,240 |
|
1,126 |
|
| Total cash costs per ounce |
k |
634 |
|
568 |
|
646 |
|
787 |
|
676 |
|
1,156 |
|
673 |
|
| Total cash costs per ounce (on a co-product basis) |
k,l |
634 |
|
571 |
|
654 |
|
789 |
|
709 |
|
1,166 |
|
677 |
|
| All-in sustaining costs per
ounce |
k |
886 |
|
693 |
|
802 |
|
844 |
|
773 |
|
1,178 |
|
834 |
|
| All-in sustaining costs per ounce (on a co-product
basis) |
k,l |
886 |
|
696 |
|
810 |
|
846 |
|
806 |
|
1,188 |
|
838 |
|
| All-in costs per ounce |
k |
891 |
|
701 |
|
824 |
|
846 |
|
840 |
|
1,178 |
|
842 |
|
| All-in costs per ounce (on a
co-product basis) |
k,l |
891 |
|
704 |
|
832 |
|
848 |
|
873 |
|
1,188 |
|
846 |
|
|
|
|
|
|
|
|
|
|
| BARRICK YEAR-END 2020 |
89 |
MANAGEMENT’S DISCUSSION AND
ANALYSIS |
|
|
|
|
|
|
|
|
|
|
|
|
|
|
|
|
|
|
|
|
|
|
|
|
|
|
|
|
|
|
| ($ millions, except per ounce information in
dollars) |
For the year ended 12/31/2018 |
| |
Footnote |
Carlin
a |
Cortez
b |
Turquoise
Ridgec |
Long
Canyond |
Phoenix
d |
Nevada
Gold Minese |
Hemlo |
Golden
Sunlightp |
| Cost of sales applicable to gold
production |
|
886 |
|
828 |
|
206 |
|
|
|
1,921 |
|
195 |
|
53 |
|
| Depreciation |
|
(262) |
|
(386) |
|
(28) |
|
|
|
(677) |
|
(18) |
|
0 |
|
| By-product credits |
|
(1) |
|
(1) |
|
0 |
|
|
|
(2) |
|
(1) |
|
0 |
|
|
|
|
|
|
|
|
|
|
|
| Non-recurring items |
f |
0 |
|
0 |
|
0 |
|
|
|
0 |
|
0 |
|
0 |
|
| Other |
|
0 |
|
0 |
|
0 |
|
|
|
0 |
|
0 |
|
0 |
|
| Non-controlling interests |
|
0 |
|
0 |
|
0 |
|
|
|
0 |
|
0 |
|
0 |
|
| Total cash costs |
|
623 |
|
441 |
|
178 |
|
|
|
1,242 |
|
176 |
|
53 |
|
| General &
administrative costs |
|
0 |
|
0 |
|
0 |
|
|
|
0 |
|
0 |
|
0 |
|
| Minesite exploration and evaluation costs |
g |
13 |
|
6 |
|
0 |
|
|
|
19 |
|
0 |
|
0 |
|
| Minesite sustaining capital expenditures |
h |
195 |
|
65 |
|
20 |
|
|
|
280 |
|
42 |
|
3 |
|
| Sustaining capital leases |
|
0 |
|
0 |
|
0 |
|
|
|
0 |
|
0 |
|
0 |
|
| Rehabilitation - accretion and amortization (operating
sites) |
i |
5 |
|
25 |
|
1 |
|
|
|
31 |
|
4 |
|
3 |
|
| Non-controlling interests |
|
(10) |
|
0 |
|
0 |
|
|
|
(10) |
|
0 |
|
0 |
|
| All-in sustaining costs |
|
826 |
|
537 |
|
199 |
|
|
|
1,562 |
|
222 |
|
59 |
|
| Project exploration and
evaluation and project costs |
g |
0 |
|
0 |
|
0 |
|
|
|
6 |
|
0 |
|
0 |
|
|
|
|
|
|
|
|
|
|
|
| Project capital expenditures |
h |
0 |
|
276 |
|
42 |
|
|
|
354 |
|
0 |
|
0 |
|
|
|
|
|
|
|
|
|
|
|
| Non-controlling interests |
|
0 |
|
0 |
|
0 |
|
|
|
0 |
|
0 |
|
0 |
|
|
|
|
|
|
|
|
|
|
|
| All-in costs |
|
826 |
|
813 |
|
241 |
|
|
|
1,922 |
|
222 |
|
59 |
|
| Ounces sold - equity basis (000s
ounces) |
|
842 |
|
1,255 |
|
262 |
|
|
|
2,359 |
|
168 |
|
30 |
|
| Cost of sales per ounce |
j,k |
1,054 |
|
659 |
|
783 |
|
|
|
814 |
|
1,157 |
|
1,755 |
|
| Total cash costs per ounce |
k |
740 |
|
351 |
|
678 |
|
|
|
526 |
|
1,046 |
|
1,762 |
|
| Total cash costs per ounce (on a co-product basis) |
k,l |
742 |
|
352 |
|
678 |
|
|
|
527 |
|
1,050 |
|
1,772 |
|
| All-in sustaining costs per
ounce |
k |
983 |
|
430 |
|
756 |
|
|
|
664 |
|
1,318 |
|
1,954 |
|
| All-in sustaining costs per ounce (on a co-product
basis) |
k,l |
985 |
|
431 |
|
756 |
|
|
|
665 |
|
1,322 |
|
1,964 |
|
| All-in costs per ounce |
k |
983 |
|
649 |
|
916 |
|
|
|
814 |
|
1,320 |
|
1,954 |
|
| All-in costs per ounce (on a
co-product basis) |
k,l |
985 |
|
650 |
|
916 |
|
|
|
815 |
|
1,324 |
|
1,964 |
|
|
|
|
|
|
|
|
|
|
| BARRICK YEAR-END 2020 |
90 |
MANAGEMENT’S DISCUSSION AND
ANALYSIS |
|
|
|
|
|
|
|
|
|
|
|
|
|
|
|
|
|
|
|
|
|
| ($ millions, except per ounce information in
dollars) |
For the year ended 12/31/2018 |
| |
Footnote |
Pueblo Viejo |
Lagunas Norte
p |
Veladero |
Porgera
n |
Kalgoorlie
o |
| Cost of sales applicable to gold
production |
|
732 |
|
337 |
|
310 |
|
213 |
|
288 |
|
| Depreciation |
|
(185) |
|
(46) |
|
(121) |
|
(42) |
|
(52) |
|
| By-product credits |
|
(90) |
|
(13) |
|
(8) |
|
(2) |
|
(2) |
|
|
|
|
|
|
|
|
| Non-recurring items |
f |
(2) |
|
(166) |
|
(4) |
|
0 |
|
0 |
|
| Other |
|
2 |
|
0 |
|
0 |
|
0 |
|
0 |
|
| Non-controlling interests |
|
(183) |
|
0 |
|
0 |
|
0 |
|
0 |
|
| Total cash costs |
|
274 |
|
112 |
|
177 |
|
169 |
|
234 |
|
| General &
administrative costs |
|
0 |
|
0 |
|
0 |
|
0 |
|
0 |
|
| Minesite exploration and evaluation costs |
g |
0 |
|
2 |
|
2 |
|
0 |
|
10 |
|
| Minesite sustaining capital expenditures |
h |
145 |
|
20 |
|
143 |
|
62 |
|
26 |
|
| Sustaining capital leases |
|
0 |
|
0 |
|
0 |
|
0 |
|
0 |
|
| Rehabilitation - accretion and amortization (operating
sites) |
i |
10 |
|
25 |
|
1 |
|
(1) |
|
4 |
|
| Non-controlling interests |
|
(62) |
|
0 |
|
0 |
|
0 |
|
0 |
|
| All-in sustaining costs |
|
367 |
|
159 |
|
323 |
|
230 |
|
274 |
|
| Project exploration and
evaluation and project costs |
g |
0 |
|
0 |
|
0 |
|
0 |
|
0 |
|
|
|
|
|
|
|
|
| Project capital expenditures |
h |
0 |
|
2 |
|
0 |
|
0 |
|
0 |
|
|
|
|
|
|
|
|
| Non-controlling interests |
|
0 |
|
0 |
|
0 |
|
0 |
|
0 |
|
|
|
|
|
|
|
|
| All-in costs |
|
367 |
|
161 |
|
323 |
|
230 |
|
274 |
|
| Ounces sold - equity basis (000s
ounces) |
|
590 |
|
251 |
|
280 |
|
213 |
|
320 |
|
| Cost of sales per ounce |
j,k |
750 |
|
1,342 |
|
1,112 |
|
996 |
|
899 |
|
| Total cash costs per ounce |
k |
465 |
|
448 |
|
629 |
|
796 |
|
732 |
|
| Total cash costs per ounce (on a co-product basis) |
k,l |
553 |
|
499 |
|
654 |
|
810 |
|
737 |
|
| All-in sustaining costs per
ounce |
k |
623 |
|
636 |
|
1,154 |
|
1,083 |
|
857 |
|
| All-in sustaining costs per ounce (on a co-product
basis) |
k,l |
711 |
|
687 |
|
1,179 |
|
1,097 |
|
862 |
|
| All-in costs per ounce |
k |
623 |
|
644 |
|
1,154 |
|
1,083 |
|
857 |
|
| All-in costs per ounce (on a
co-product basis) |
k,l |
711 |
|
695 |
|
1,179 |
|
1,097 |
|
862 |
|
|
|
|
|
|
|
|
|
|
| BARRICK YEAR-END 2020 |
91 |
MANAGEMENT’S DISCUSSION AND
ANALYSIS |
|
|
|
|
|
|
|
|
|
|
|
|
|
|
|
|
|
|
|
|
|
|
|
|
|
|
|
| ($ millions, except per ounce information in
dollars) |
For the year ended 12/31/2018 |
| |
Footnote |
Loulo-Gounkoto
q |
Kibali
q |
North
Maram |
Tongon
q |
Bulyanhulu
m |
Buzwagi
m |
Morila
p,q |
| Cost of sales applicable to gold
production |
|
|
|
264 |
|
|
53 |
|
139 |
|
|
| Depreciation |
|
|
|
(62) |
|
|
(24) |
|
(3) |
|
|
| By-product credits |
|
|
|
(2) |
|
|
(1) |
|
(1) |
|
|
|
|
|
|
|
|
|
|
|
| Non-recurring items |
f |
|
|
0 |
|
|
0 |
|
0 |
|
|
| Other |
|
|
|
0 |
|
|
0 |
|
0 |
|
|
| Non-controlling interests |
|
|
|
(72) |
|
|
(10) |
|
(49) |
|
|
| Total cash costs |
|
|
|
128 |
|
|
18 |
|
86 |
|
|
| General &
administrative costs |
|
|
|
0 |
|
|
0 |
|
0 |
|
|
| Minesite exploration and evaluation costs |
g |
|
|
0 |
|
|
0 |
|
0 |
|
|
| Minesite sustaining capital expenditures |
h |
|
|
74 |
|
|
3 |
|
4 |
|
|
| Sustaining capital leases |
|
|
|
0 |
|
|
0 |
|
0 |
|
|
| Rehabilitation - accretion and amortization (operating
sites) |
i |
|
|
2 |
|
|
1 |
|
1 |
|
|
| Non-controlling interests |
|
|
|
(27) |
|
|
(1) |
|
(2) |
|
|
| All-in sustaining costs |
|
|
|
177 |
|
|
21 |
|
89 |
|
|
| Project exploration and
evaluation and project costs |
g |
|
|
0 |
|
|
0 |
|
0 |
|
|
|
|
|
|
|
|
|
|
|
| Project capital expenditures |
h |
|
|
8 |
|
|
4 |
|
0 |
|
|
|
|
|
|
|
|
|
|
|
| Non-controlling interests |
|
|
|
(3) |
|
|
(1) |
|
0 |
|
|
|
|
|
|
|
|
|
|
|
| All-in costs |
|
|
|
182 |
|
|
24 |
|
89 |
|
|
| Ounces sold - equity basis (000s
ounces) |
|
|
|
212 |
|
|
27 |
|
94 |
|
|
| Cost of sales per ounce |
j,k |
|
|
795 |
|
|
1,231 |
|
939 |
|
|
| Total cash costs per ounce |
k |
|
|
603 |
|
|
650 |
|
916 |
|
|
| Total cash costs per ounce (on a co-product basis) |
k,l |
|
|
609 |
|
|
674 |
|
922 |
|
|
| All-in sustaining costs per
ounce |
k |
|
|
830 |
|
|
754 |
|
947 |
|
|
| All-in sustaining costs per ounce (on a co-product
basis) |
k,l |
|
|
836 |
|
|
778 |
|
953 |
|
|
| All-in costs per ounce |
k |
|
|
855 |
|
|
848 |
|
947 |
|
|
| All-in costs per ounce (on a
co-product basis) |
k,l |
|
|
861 |
|
|
872 |
|
953 |
|
|
a.On July 1,
2019, Barrick's Goldstrike and Newmont's Carlin were contributed to Nevada Gold Mines and are now referred to as Carlin. As a result, the amounts presented represent Goldstrike on a 100% basis (including our 60% share of South Arturo) up until June
30, 2019, and the combined results of Carlin and Goldstrike (including our 60% share of South Arturo) on a 61.5% basis thereafter.
b.
On July 1, 2019, Cortez was contributed to Nevada Gold Mines, a joint venture with Newmont. As a result, the amounts
presented are on a 100% basis up until June 30, 2019, and on a 61.5% basis thereafter.
c.Barrick owned
75% of Turquoise Ridge through to the end of the second quarter of 2019, with our joint venture partner, Newmont, owning the remaining 25%. Turquoise Ridge was proportionately consolidated on the basis that the joint venture partners that have joint
control have rights to the assets and obligations for the liabilities relating to the arrangement. The figures presented in this table are based on our 75% interest in Turquoise Ridge until June 30, 2019. On July 1, 2019, Barrick's 75% interest in
Turquoise Ridge and Newmont's Twin Creeks and 25% interest in Turquoise Ridge were contributed to Nevada Gold Mines. Starting July 1, 2019, the results represent our 61.5% share of Turquoise Ridge and Twin Creeks, now referred to as Turquoise
Ridge.
d.A 61.5%
interest in these sites was acquired as a result of the formation of Nevada Gold Mines on July 1, 2019. The results for 2018 did not form a part of the Barrick consolidated results as these sites were acquired as a result of the formation of Nevada Gold
Mines. Therefore, no comparative figures are provided.
e.Represents
the combined results of Cortez, Goldstrike (including our 60% share of South Arturo) and our 75% interest in Turquoise Ridge until June 30, 2019. Commencing July 1, 2019, the date Nevada Gold Mines was established, the results represent our 61.5%
interest in Cortez, Carlin (including Goldstrike and 60% of South Arturo), Turquoise Ridge (including Twin Creeks), Phoenix and Long Canyon.
f.
Non-recurring items
Non-recurring items in 2019 relate to organizational restructuring. These costs are not indicative of our cost of production and have been excluded
from the calculation of total cash costs.
g.Exploration
and evaluation costs
Exploration, evaluation and project expenses are presented
as minesite sustaining if it supports current mine operations and project if it relates to future projects. Refer to page 88 of this
MD&A.
|
|
|
|
|
|
|
|
|
| BARRICK YEAR-END 2020 |
92 |
MANAGEMENT’S DISCUSSION AND
ANALYSIS |
h.Capital
expenditures
Capital expenditures are related to our gold sites only
and are presented on a 100% cash basis starting from January 1, 2019 and on a 100% accrued basis for 2018. They are split between minesite sustaining and project capital expenditures. Project capital expenditures are distinct projects designed to
increase the net present value of the mine and are not related to current production. Significant projects in the current year are the expansion project at Pueblo Viejo, the Goldrush exploration declines, the restart of mining activities at
Bulyanhulu, and construction of the third shaft at Turquoise Ridge. Refer to page 87 of this MD&A.
i.Rehabilitation -
accretion and amortization
Includes depreciation on the assets related to rehabilitation provisions of our gold operations and accretion on the rehabilitation provision of our
gold operations, split between operating and non-operating sites.
j.Cost of sales
per ounce
Cost of sales applicable to gold per ounce is calculated using cost of sales applicable to
gold on an attributable basis (removing the non-controlling interest of 40% Pueblo Viejo, 16% North Mara, Bulyanhulu and Buzwagi starting January 1, 2020, the date the GoT’s 16% free carried interest was made effective (36.1% from January 1,
2018 to September 30, 2019; notwithstanding the completion of the Acacia transaction on September 17, 2019, we consolidated our interest in Acacia and recorded a non-controlling interest of 36.1% in the income statement for the entirety of the
third quarter of 2019 as a matter of convenience); and 63.1% South Arturo from cost of sales from July 1, 2019 onwards as a result of its contribution to Nevada Gold Mines (and on a 40% basis from January 1, 2018 to June 30, 2019), divided by
attributable gold ounces. Commencing January 1, 2019, the effective date of the Merger, the non-controlling interest of 20%
Loulo-Gounkoto and 10.3% Tongon is also removed from cost of sales and our proportionate share of cost of sales attributable to equity method investments (Kibali, and Morila until the second quarter of 2019) is included. Cost of sales applicable to
gold per ounce also removes the non-controlling interest of 38.5% Nevada Gold Mines from July 1, 2019 onwards.
k.Per ounce
figures
Cost of sales per ounce, total cash costs per ounce, all-in sustaining costs per ounce and all-in costs per ounce may not calculate based on amounts
presented in this table due to rounding.
l.Co-product
costs per ounce
Total cash costs per ounce, all-in sustaining
costs per ounce and all-in costs per ounce presented on a co-product basis removes the impact of by-product credits of our gold production (net of non-controlling interest) calculated
as:
|
|
|
|
|
|
|
|
|
|
|
|
|
|
|
|
|
|
|
|
|
|
|
|
|
|
|
|
|
|
| ($ millions) |
|
|
|
|
For the three months ended 12/31/20 |
| |
Carlin
a |
Cortez
b |
Turquoise
Ridgec |
Long
Canyond |
Phoenix
d |
Nevada
Gold Minese |
Hemlo |
Pueblo Viejo |
Veladero |
| By-product credits |
1 |
|
1 |
|
3 |
|
0 |
|
42 |
|
47 |
|
0 |
|
16 |
|
2 |
|
| Non-controlling interest |
0 |
|
0 |
|
(1) |
|
0 |
|
(16) |
|
(18) |
|
0 |
|
(6) |
|
0 |
|
| By-product credits (net of
non-controlling interest) |
1 |
|
1 |
|
2 |
|
0 |
|
26 |
|
29 |
|
0 |
|
10 |
|
2 |
|
|
|
|
|
|
|
|
|
|
|
| ($ millions) |
|
|
|
|
For the three months ended 12/31/20 |
| |
Loulo-Gounkoto |
Kibali |
North
Maram |
Tongon |
Bulyanhulu
m |
Buzwagi
m |
|
|
|
| By-product credits |
0 |
0 |
|
1 |
|
0 |
|
0 |
|
0 |
|
|
|
|
| Non-controlling interest |
0 |
0 |
|
0 |
|
0 |
|
0 |
|
0 |
|
|
|
|
| By-product credits (net of
non-controlling interest) |
0 |
0 |
|
1 |
|
0 |
|
0 |
|
0 |
|
|
|
|
|
|
|
|
|
|
|
|
|
|
| ($ millions) |
|
|
|
|
For the three months ended 9/30/20 |
| |
Carlin
a |
Cortez
b |
Turquoise
Ridgec |
Long
Canyond |
Phoenix
d |
Nevada
Gold Minese |
Hemlo |
Pueblo Viejo |
Veladero |
| By-product credits |
1 |
|
1 |
|
2 |
|
0 |
|
39 |
|
43 |
|
1 |
|
17 |
|
1 |
|
| Non-controlling interest |
(1) |
|
0 |
|
(1) |
|
0 |
|
(14) |
|
(16) |
|
0 |
|
(8) |
|
0 |
|
| By-product credits (net of
non-controlling interest) |
0 |
|
1 |
|
1 |
|
0 |
|
25 |
|
27 |
|
1 |
|
9 |
|
1 |
|
|
|
|
|
|
|
|
|
|
|
| ($ millions) |
|
|
|
|
For the three months ended 9/30/20 |
| |
Loulo-Gounkoto |
Kibali |
North
Maram |
Tongon |
Bulyanhulu
m |
Buzwagi
m |
|
|
|
| By-product credits |
0 |
|
0 |
|
1 |
|
0 |
|
6 |
|
14 |
|
|
|
|
| Non-controlling interest |
0 |
|
0 |
|
0 |
|
0 |
|
(1) |
|
(3) |
|
|
|
|
| By-product
credits (net of non-controlling interest) |
0
|
|
0
|
|
1
|
|
0
|
|
5
|
|
11
|
|
|
|
|
|
|
|
|
|
|
|
|
|
|
|
|
|
|
|
|
|
|
|
|
|
|
|
|
|
|
|
|
|
|
|
|
|
|
|
|
|
|
|
|
|
|
|
|
|
|
|
|
|
|
|
|
|
|
|
|
|
|
|
|
|
|
|
|
|
|
|
|
|
|
|
|
|
|
|
|
|
|
|
|
|
|
|
|
|
|
|
|
|
|
|
|
|
|
|
|
|
|
|
|
|
|
|
|
|
|
|
|
|
|
|
|
|
|
|
|
|
|
|
|
|
| BARRICK YEAR-END 2020 |
93 |
MANAGEMENT’S DISCUSSION AND
ANALYSIS |
|
|
|
|
|
|
|
|
|
|
|
|
|
|
|
|
|
|
|
|
|
|
|
|
|
|
|
|
|
|
| |
|
|
|
|
|
For the year ended 12/31/20 |
| |
Carlin
a |
Cortez
b |
Turquoise
Ridgec |
Long
Canyond |
Phoenix
d |
Nevada
Gold Minese |
Hemlo
|
Pueblo
Viejo |
Veladero
|
By-product
credits |
2 |
|
2 |
|
7 |
|
0 |
|
137 |
|
148 |
|
1 |
|
57 |
|
5 |
|
Non-controlling interest |
(1) |
|
(1) |
|
(3) |
|
0 |
|
(53) |
|
(57) |
|
0 |
|
(23) |
|
0 |
|
By-product credits (net of
non-controlling interest) |
1 |
|
1 |
|
4 |
|
0 |
|
84 |
|
91 |
|
1 |
|
34 |
|
5 |
|
|
|
|
|
|
|
|
|
|
|
| |
|
|
|
|
|
For the year ended 12/31/20 |
| |
Porgera
n |
Kibali |
Loulo-Gounkoto
|
North
Maram |
Tongon |
Bulyanhulu
m |
Buzwagi
m |
|
|
| By-product credits |
1 |
|
1 |
|
0 |
|
2 |
|
0 |
|
10 |
|
22 |
|
|
|
| Non-controlling interest |
0 |
|
0 |
|
0 |
|
0 |
|
0 |
|
(2) |
|
(4) |
|
|
|
| By-product credits (net of
non-controlling interest) |
1 |
|
1 |
|
0 |
|
2 |
|
0 |
|
8 |
|
18 |
|
|
|
|
|
|
|
|
|
|
|
|
|
| |
|
|
|
For the year ended 12/31/19 |
| |
Carlin
a |
Cortez
b |
Turquoise
Ridgec |
Long
Canyond |
Phoenix
d |
Nevada
Gold Minese |
Hemlo |
Pueblo Viejo |
Veladero |
| By-product credits |
1 |
|
1 |
|
2 |
|
0 |
|
48 |
|
52 |
|
1 |
|
61 |
|
8 |
|
| Non-controlling interest |
0 |
|
0 |
|
(1) |
|
0 |
|
(18) |
|
(19) |
|
0 |
|
(24) |
|
0 |
|
| By-product credits (net of
non-controlling interest) |
1 |
|
1 |
|
1 |
|
0 |
|
30 |
|
33 |
|
1 |
|
37 |
|
8 |
|
|
|
|
|
|
|
|
|
|
|
| |
|
|
|
For the year ended 12/31/19 |
| |
Porgera
n |
Kalgoorlie
o |
Loulo-Gounkoto |
Kibali |
North
Maram |
Tongon |
Bulyanhulu
m |
Buzwagi
m |
|
| By-product credits |
3 |
|
1 |
|
0 |
|
1 |
|
2 |
|
1 |
|
1 |
|
1 |
|
|
| Non-controlling interest |
0 |
|
0 |
|
0 |
|
0 |
|
0 |
|
0 |
|
0 |
|
0 |
|
|
| By-product
credits (net of non-controlling interest) |
3
|
|
1
|
|
0
|
|
1
|
|
2
|
|
1
|
|
1
|
|
1
|
|
|
|
|
|
|
|
|
|
|
|
|
|
|
|
|
|
|
|
|
|
|
|
|
|
|
|
|
|
|
|
|
|
|
|
|
|
|
|
|
|
|
|
|
|
|
|
|
|
|
|
|
|
|
|
|
|
|
|
|
|
|
|
|
|
|
|
|
|
|
|
|
|
|
|
|
|
|
|
|
|
|
|
|
|
|
|
|
|
|
|
|
|
|
|
|
|
|
|
|
|
|
|
|
|
|
|
|
|
|
|
|
|
|
|
|
|
|
|
|
|
|
|
|
|
|
|
|
|
|
|
|
|
|
|
|
|
|
|
|
|
|
|
|
|
|
|
|
|
|
|
|
|
|
|
|
|
|
|
|
|
|
|
|
|
|
|
|
|
|
|
|
|
|
|
|
|
|
|
|
|
|
|
|
|
|
|
|
|
|
|
|
|
|
|
|
|
|
|
|
|
|
|
|
|
|
|
|
|
|
|
|
|
|
|
|
|
|
|
|
|
|
|
|
|
|
|
|
| |
|
|
|
For the year ended
12/31/18 |
| |
Carlin
a |
Cortez
b |
Turquoise
Ridgec |
Long
Canyond |
Phoenix
d |
Nevada
Gold Minese |
Hemlo |
Golden
Sunlightp |
Pueblo Viejo |
Veladero |
| By-product credits |
1 |
|
1 |
|
0 |
|
|
|
2 |
|
1 |
|
0 |
|
90 |
|
8 |
|
| Non-controlling interest |
0 |
|
0 |
|
0 |
|
|
|
0 |
|
0 |
|
0 |
|
(37) |
|
0 |
|
| By-product credits (net of
non-controlling interest) |
1 |
|
1 |
|
0 |
|
|
|
2 |
|
1 |
|
0 |
|
53 |
|
8 |
|
|
|
|
|
|
|
|
|
|
|
|
| |
|
|
|
For the year ended
12/31/18 |
| |
Porgera
n |
Kalgoorlie
o |
Lagunas Norte
p |
Loulo-Gounkoto
q |
Kibali
q |
North
Maram |
Tongon
q |
Bulyanhulu
m |
Buzwagi
m |
Morila
p,q |
| By-product credits |
2 |
|
2 |
|
13 |
|
|
|
2 |
|
|
1 |
|
1 |
|
|
| Non-controlling interest |
0 |
|
0 |
|
0 |
|
|
|
(1) |
|
|
0 |
|
0 |
|
|
| By-product
credits (net of non-controlling interest) |
2
|
|
2
|
|
13
|
|
|
|
1
|
|
|
1
|
|
1
|
|
|
m.Formerly part
of Acacia Mining plc. On September 17, 2019, Barrick acquired all of the shares of Acacia it did not already own. The results presented are on a 63.9% basis until September 30, 2019 (notwithstanding the completion of the Acacia transaction on
September 17, 2019, we consolidated our interest in Acacia and recorded a non-controlling interest of 36.1% in the income statement for the entirety of the third quarter of 2019 as a matter of convenience); on a 100% basis from October 1, 2019
to December 31, 2019; and on a 84% basis starting January 1, 2020, the date the GoT’s 16% free carried interest was made
effective.
n.
As Porgera was placed on care and maintenance on April 25, 2020, no operating data or per ounce data was provided
for the three month periods ended December 31, 2020 and September 30, 2020.
o.On November
28, 2019, we completed the sale of our 50% interest in Kalgoorlie in Western Australia to Saracen Mineral Holdings Limited for total cash consideration of $750 million. The transaction resulted in a gain of $408 million for the year ended December
31, 2019. The operating results reported for Kalgoorlie reflect the Company’s attributable share of Kalgoorlie’s results until the date of divestiture.
p.With the end
of mining at Lagunas Norte in the third quarter of 2019 and at Golden Sunlight and Morila in the second quarter of 2019 as previously reported, we have ceased to include production or non-GAAP cost metrics for these sites from October 1, 2019 and
July 1, 2019, respectively, onwards.
|
|
|
|
|
|
|
|
|
| BARRICK YEAR-END 2020 |
94 |
MANAGEMENT’S DISCUSSION AND
ANALYSIS |
q.The results for 2018 did not form a part of the Barrick consolidated results as these sites were acquired as a result of the
Merger. Therefore, no comparative figures are provided.
Reconciliation of Copper Cost of Sales to C1 cash costs and All-in sustaining costs, including on a per pound
basis
|
|
|
|
|
|
|
|
|
|
|
|
|
|
|
|
|
|
|
|
|
|
|
For the three months ended |
|
For the years ended |
| ($ millions, except per pound
information in dollars) |
12/31/20
|
9/30/20 |
|
|
12/31/20
|
12/31/19 |
12/31/18 |
| Cost of sales |
125 |
|
154 |
|
|
|
556 |
|
361 |
|
558 |
|
|
Depreciation/amortization |
(41) |
|
(61) |
|
|
|
(208) |
|
(100) |
|
(170) |
|
| Treatment and refinement charges |
39 |
|
39 |
|
|
|
157 |
|
99 |
|
144 |
|
| Cash cost of sales applicable to equity method
investments |
72 |
|
57 |
|
|
|
267 |
|
288 |
|
281 |
|
Less: royalties and production taxesa |
(16) |
|
(16) |
|
|
|
(54) |
|
(35) |
|
(44) |
|
| By-product
credits |
(5) |
|
(4) |
|
|
|
(15) |
|
(9) |
|
(6) |
|
| Other |
0 |
|
0 |
|
|
|
0 |
|
(5) |
|
(11) |
|
C1 cash cost of sales |
174 |
|
169 |
|
|
|
703 |
|
599 |
|
752 |
|
| General &
administrative costs |
5 |
|
4 |
|
|
|
18 |
|
19 |
|
28 |
|
| Rehabilitation - accretion and amortization |
1 |
|
2 |
|
|
|
8 |
|
15 |
|
16 |
|
| Royalties and
production taxes |
16 |
|
16 |
|
|
|
54 |
|
35 |
|
44 |
|
| Minesite
exploration and evaluation costs |
1 |
|
2 |
|
|
|
5 |
|
6 |
|
4 |
|
| Minesite
sustaining capital expenditures |
65 |
|
74 |
|
|
|
223 |
|
215 |
|
220 |
|
| Sustaining leases |
2 |
|
2 |
|
|
|
9 |
|
5 |
|
0 |
|
| Inventory write-downs |
0 |
|
0 |
|
|
|
0 |
|
0 |
|
11 |
|
All-in sustaining costs |
264 |
|
269 |
|
|
|
1,020 |
|
894 |
|
1,075 |
|
| Pounds sold - consolidated
basis (millions pounds) |
108 |
|
116 |
|
|
|
457 |
|
355 |
|
382 |
|
Cost of sales per poundb,c |
2.06 |
|
1.97 |
|
|
|
2.02 |
|
2.14 |
|
2.40 |
|
C1 cash costs per
poundb |
1.61 |
|
1.45 |
|
|
|
1.54 |
|
1.69 |
|
1.97 |
|
All-in
sustaining costs per poundb |
2.42
|
|
2.31
|
|
|
|
2.23
|
|
2.52
|
|
2.82
|
|
a.For the three months and year ended December 31, 2020, royalties and production taxes include royalties of $16 million and $54
million, respectively (September 30, 2020: $16 million, 2019: $34 million and 2018: $39 million).
b.Cost of sales per pound, C1 cash costs per pound and all-in sustaining costs per pound may not calculate based on amounts
presented in this table due to rounding.
c.Cost of sales per pound related to copper is calculated using cost of sales including our proportionate share of cost of sales
attributable to equity method investments (Zaldívar and Jabal Sayid), divided by consolidated copper pounds sold (including our proportionate share of copper pounds sold from our equity method
investments).
|
|
|
|
|
|
|
|
|
| BARRICK YEAR-END 2020 |
95 |
MANAGEMENT’S DISCUSSION AND
ANALYSIS |
Reconciliation of Copper Cost of Sales to C1 cash costs and All-in sustaining costs, including on a per pound basis, by operating
site
|
|
|
|
|
|
|
|
|
|
|
|
|
|
|
|
|
|
|
|
|
|
|
|
|
For the three
months ended |
| ($ millions, except per pound information in dollars) |
12/31/20
|
|
9/30/20 |
| |
Zaldívar |
Lumwana |
Jabal Sayid |
|
Zaldívar |
Lumwana |
Jabal Sayid |
| Cost of sales |
68 |
|
125 |
|
28 |
|
|
46 |
|
154 |
|
30 |
|
| Depreciation/amortization |
(17) |
|
(41) |
|
(7) |
|
|
(12) |
|
(61) |
|
(7) |
|
| Treatment and refinement charges |
1 |
|
33 |
|
5 |
|
|
0 |
|
34 |
|
5 |
|
Less: royalties and production
taxesa |
0 |
|
(16) |
|
0 |
|
|
0 |
|
(16) |
|
0 |
|
| By-product credits |
0 |
|
0 |
|
(5) |
|
|
0 |
|
0 |
|
(4) |
|
| Other |
0 |
|
0 |
|
0 |
|
|
0 |
|
0 |
|
0 |
|
C1 cash cost of
sales |
52 |
|
101 |
|
21 |
|
|
34 |
|
111 |
|
24 |
|
| Rehabilitation - accretion
and amortization |
0 |
|
1 |
|
0 |
|
|
0 |
|
2 |
|
0 |
|
| Royalties and production taxes |
0 |
|
16 |
|
0 |
|
|
0 |
|
16 |
|
0 |
|
| Minesite exploration and evaluation costs |
1 |
|
0 |
|
0 |
|
|
1 |
|
0 |
|
1 |
|
| Minesite sustaining capital expenditures |
15 |
|
48 |
|
2 |
|
|
11 |
|
63 |
|
0 |
|
| Capital lease payments |
1 |
|
1 |
|
0 |
|
|
1 |
|
1 |
|
0 |
|
| Inventory write-downs |
0 |
|
0 |
|
0 |
|
|
0 |
|
0 |
|
0 |
|
All-in sustaining
costs |
69 |
|
167 |
|
23 |
|
|
47 |
|
193 |
|
25 |
|
| Pounds sold - consolidated basis
(millions pounds) |
25 |
|
65 |
|
18 |
|
|
21 |
|
74 |
|
21 |
|
Cost of sales per poundb,c |
2.68 |
|
1.96 |
|
1.53 |
|
|
2.20 |
|
2.06 |
|
1.43 |
|
C1 cash costs per poundb |
2.01 |
|
1.58 |
|
1.15 |
|
|
1.64 |
|
1.49 |
|
1.14 |
|
All-in
sustaining costs per poundb |
2.70
|
|
2.60
|
|
1.27
|
|
|
2.27
|
|
2.58
|
|
1.17
|
|
|
|
|
|
|
|
|
|
|
|
|
|
|
|
|
|
|
|
|
|
|
|
|
|
|
|
|
|
|
|
|
|
|
|
|
|
| ($ millions, except per pound
information in dollars) |
|
|
For the years
ended December 31 |
|
12/31/20
|
|
12/31/19 |
|
12/31/18 |
| |
Zaldívar |
Lumwana |
Jabal Sayid |
|
Zaldívar |
Lumwana |
Jabal Sayid |
|
Zaldívar |
Lumwana |
Jabal Sayid |
| Cost of sales |
262 |
|
556 |
|
104 |
|
|
307 |
|
361 |
|
93 |
|
|
261 |
|
558 |
|
98 |
|
| Depreciation/amortization |
(72) |
|
(208) |
|
(27) |
|
|
(86) |
|
(100) |
|
(27) |
|
|
(59) |
|
(170) |
|
(19) |
|
| Treatment and refinement charges |
1 |
|
137 |
|
19 |
|
|
0 |
|
80 |
|
19 |
|
|
0 |
|
125 |
|
19 |
|
Less: royalties and production
taxesa |
0 |
|
(54) |
|
0 |
|
|
0 |
|
(35) |
|
0 |
|
|
0 |
|
(39) |
|
(5) |
|
| By-product credits |
0 |
|
0 |
|
(15) |
|
|
0 |
|
0 |
|
(9) |
|
|
0 |
|
0 |
|
(6) |
|
| Other |
0 |
|
0 |
|
0 |
|
|
0 |
|
(5) |
|
0 |
|
|
0 |
|
(11) |
|
0 |
|
| C1 cash cost of sales |
191 |
|
431 |
|
81 |
|
|
221 |
|
301 |
|
76 |
|
|
202 |
|
463 |
|
87 |
|
| Rehabilitation - accretion
and amortization |
0 |
|
8 |
|
0 |
|
|
5 |
|
10 |
|
0 |
|
|
0 |
|
16 |
|
0 |
|
Royalties and production
taxesa |
0 |
|
54 |
|
0 |
|
|
0 |
|
35 |
|
0 |
|
|
0 |
|
39 |
|
5 |
|
| Minesite exploration and evaluation costs |
4 |
|
0 |
|
1 |
|
|
6 |
|
0 |
|
0 |
|
|
2 |
|
2 |
|
0 |
|
| Minesite sustaining capital expenditures |
39 |
|
175 |
|
9 |
|
|
34 |
|
166 |
|
15 |
|
|
49 |
|
154 |
|
17 |
|
| Sustaining leases |
5 |
|
4 |
|
0 |
|
|
3 |
|
2 |
|
0 |
|
|
0 |
|
0 |
|
0 |
|
| Inventory write-downs |
0 |
|
0 |
|
0 |
|
|
0 |
|
0 |
|
0 |
|
|
0 |
|
11 |
|
0 |
|
| All-in sustaining costs |
239 |
|
672 |
|
91 |
|
|
269 |
|
514 |
|
91 |
|
|
253 |
|
685 |
|
109 |
|
| Pounds sold - consolidated basis
(millions pounds) |
106 |
|
277 |
|
74 |
|
|
125 |
|
169 |
|
61 |
|
|
103 |
|
222 |
|
57 |
|
Cost of sales per poundb,c |
2.46 |
|
2.01 |
|
1.42 |
|
|
2.46 |
|
2.13 |
|
1.53 |
|
|
2.55 |
|
2.51 |
|
1.73 |
|
C1 cash costs per poundb |
1.79 |
|
1.56 |
|
1.11 |
|
|
1.77 |
|
1.79 |
|
1.26 |
|
|
1.97 |
|
2.08 |
|
1.53 |
|
All-in
sustaining costs per poundb |
2.25
|
|
2.43
|
|
1.24
|
|
|
2.15
|
|
3.04
|
|
1.51
|
|
|
2.47
|
|
3.08
|
|
1.92
|
|
a.For the three months and year ended December 31, 2020, royalties and production taxes include royalties of $16 million and $54
million, respectively (September 30, 2020: $16 million, 2019: $34 million and 2018: $39 million).
b.Cost of sales per pound, C1 cash costs per pound and all-in sustaining costs per pound may not calculate based on amounts
presented in this table due to rounding.
c.Cost of sales per pound applicable to copper is calculated using cost of sales including our proportionate share of cost of
sales attributable to equity method investments (Zaldívar and Jabal Sayid), divided by consolidated copper pounds sold (including our proportionate share of copper pounds sold from our equity method
investments).
|
|
|
|
|
|
|
|
|
| BARRICK YEAR-END 2020 |
96 |
MANAGEMENT’S DISCUSSION AND
ANALYSIS |
EBITDA and Adjusted
EBITDA
EBITDA
is a non-GAAP financial measure, which excludes the following from net earnings:
■Income
tax expense;
■Finance costs;
■Finance
income; and
■Depreciation.
Management believes that EBITDA is a valuable indicator of our ability to generate liquidity by producing operating cash flow to fund working
capital needs, service debt obligations, and fund capital expenditures. Management uses EBITDA for this purpose. EBITDA is also frequently used by investors and analysts for valuation purposes whereby EBITDA is multiplied by a factor or
“EBITDA multiple” that is based on an observed or inferred relationship between EBITDA and market values to determine the approximate total enterprise value of a company.
Adjusted EBITDA removes the effect of impairment charges; acquisition/disposition gains/losses; foreign currency translation
gains/losses; other expense adjustments; and unrealized gains on non-hedge derivative instruments. We also remove the impact of the income tax expense, finance costs, finance income and depreciation incurred in our equity method
accounted investments. We believe these items provide a greater level of consistency
with the adjusting items included in our adjusted net earnings reconciliation, with the exception that these amounts are adjusted to remove any
impact on finance costs/income, income tax expense and/or depreciation as they do not affect EBITDA. We believe this additional information will assist analysts, investors and other stakeholders of Barrick in better understanding our ability
to generate liquidity from our full business, including equity method investments, by excluding these amounts from the calculation as they are not indicative of the performance of our core mining business and not necessarily reflective of the
underlying operating results for the periods presented.
EBITDA and adjusted EBITDA
are intended to provide additional information to investors and analysts and do not have any standardized definition under IFRS, and should not be considered in isolation or as a substitute for measures of performance prepared in accordance with
IFRS. EBITDA and adjusted EBITDA exclude the impact of cash costs of financing activities and taxes, and the effects of changes in operating working capital balances, and therefore are not necessarily indicative of operating profit or cash flow from
operations as determined under IFRS. Other companies may calculate EBITDA and adjusted EBITDA
differently.
Reconciliation of Net Earnings to EBITDA and Adjusted EBITDA
|
|
|
|
|
|
|
|
|
|
|
|
|
|
|
|
|
|
|
|
|
|
|
For the three months ended |
|
For the years ended |
| ($ millions) |
12/31/20
|
9/30/20 |
|
|
12/31/20
|
12/31/19 |
12/31/18 |
| Net earnings (loss) |
1,058 |
|
1,271 |
|
|
|
3,614 |
|
4,574 |
|
(1,435) |
|
| Income tax expense |
404 |
|
284 |
|
|
|
1,332 |
|
1,783 |
|
1,198 |
|
Finance costs, neta |
72 |
|
72 |
|
|
|
306 |
|
394 |
|
458 |
|
| Depreciation |
544 |
|
574 |
|
|
|
2,208 |
|
2,032 |
|
1,457 |
|
| EBITDA |
2,078 |
|
2,201 |
|
|
|
7,460 |
|
8,783 |
|
1,678 |
|
Impairment charges (reversals) of long-lived assetsb |
40 |
|
4 |
|
|
|
(269) |
|
(1,423) |
|
900 |
|
Acquisition/disposition (gains)/lossesc |
(126) |
|
(2) |
|
|
|
(180) |
|
(2,327) |
|
(68) |
|
| Foreign currency translation (gains)/losses |
16 |
|
16 |
|
|
|
50 |
|
109 |
|
136 |
|
Other (income) expense adjustmentsd |
15 |
|
(90) |
|
|
|
71 |
|
(687) |
|
336 |
|
| Unrealized gains on non-hedge derivative instruments |
0 |
|
0 |
|
|
|
0 |
|
0 |
|
1 |
|
Income tax expense, net finance costsa, and depreciation from equity investees |
83 |
|
94 |
|
|
|
360 |
|
378 |
|
97 |
|
| Adjusted
EBITDA |
2,106
|
|
2,223
|
|
|
|
7,492
|
|
4,833
|
|
3,080
|
|
a.Finance costs
exclude accretion.
b.Net impairment reversals for the current year primarily relate to non-current asset reversals at our Tanzanian assets. Net
impairment charges for 2019 primarily relate to non-current asset reversals at Lumwana and Pueblo Viejo, partially offset by impairment charges at Pascua-Lama.
c.Acquisition/disposition
gains for the current year primarily relate to the gain on the sale of Eskay Creek, Morila and Bullfrog in the fourth quarter of 2020. This was further impacted by the sale of Massawa in the first quarter of 2020. Acquisition/disposition gains
for 2019 primarily relate to the gain on the remeasurement of Turquoise Ridge to fair value as a result of its contribution to Nevada Gold Mines and the gain on sale of our 50% interest in Kalgoorlie.
d.Other expense adjustments for the current year primarily relate to the impact of changes in the discount rate assumptions on our
closed mine rehabilitation provision, care and maintenance expenses at Porgera and donations related to Covid-19, partially offset by the gain on the remeasurement of the residual cash liability relating to our silver sale agreement with Wheaton.
Other expense adjustments for 2019 primarily relate to the gain on the de-recognition of the deferred revenue liability relating to our silver sale agreement with Wheaton and the gain on a settlement of customs duty and indirect taxes at Lumwana.
|
|
|
|
|
|
|
|
|
| BARRICK YEAR-END 2020 |
97 |
MANAGEMENT’S DISCUSSION AND
ANALYSIS |
Reconciliation of Segment Income to Segment EBITDA
|
|
|
|
|
|
|
|
|
|
|
|
|
|
|
|
|
|
|
|
|
|
|
|
|
|
|
|
|
|
|
|
|
|
|
|
| ($ millions) |
For the three months ended 12/31/20 |
| |
Carlin
a (61.5%) |
Cortez
b (61.5%) |
Turquoise
Ridgec (61.5%) |
Nevada
Gold Minesd (61.5%) |
Pueblo Viejo (60%) |
Loulo-Gounkoto (80%) |
Kibali (45%) |
Veladero (50%) |
Porgera (47.5%) |
North
Marae (84%) |
Bulyanhulu
e (84%) |
| Income |
244 |
|
92 |
|
72 |
|
482 |
|
167 |
|
91 |
|
58 |
|
44 |
|
(17) |
|
49 |
|
13 |
|
| Depreciation |
45 |
|
35 |
|
32 |
|
152 |
|
37 |
|
52 |
|
48 |
|
17 |
|
5 |
|
17 |
|
10 |
|
| EBITDA |
289 |
|
127 |
|
104 |
|
634 |
|
204 |
|
143 |
|
106 |
|
61 |
|
(12) |
|
66 |
|
23 |
|
|
|
|
|
|
|
|
|
|
|
|
|
|
For the three months ended 9/30/20 |
| |
Carlin
a (61.5%) |
Cortez
b (61.5%) |
Turquoise
Ridgec (61.5%) |
Nevada
Gold Minesd (61.5%) |
Pueblo Viejo (60%) |
Loulo-Gounkoto (80%) |
Kibali (45%) |
Veladero (50%) |
Porgera (47.5%) |
North
Marae (84%) |
Bulyanhulu
e (84%) |
| Income |
247 |
|
96 |
|
62 |
|
481 |
|
147 |
|
92 |
|
74 |
|
30 |
|
(17) |
|
72 |
|
25 |
|
| Depreciation |
50 |
|
33 |
|
25 |
|
152 |
|
34 |
|
55 |
|
43 |
|
17 |
|
4 |
|
17 |
|
23 |
|
| EBITDA |
297 |
|
129 |
|
87 |
|
633 |
|
181 |
|
147 |
|
117 |
|
47 |
|
(13) |
|
89 |
|
48 |
|
|
|
|
|
|
|
|
|
|
|
|
|
|
For the year ended 12/31/20 |
| |
Carlin
a (61.5%) |
Cortez
b (61.5%) |
Turquoise
Ridgec (61.5%) |
Nevada
Gold Minesd (61.5%) |
Pueblo Viejo (60%) |
Loulo-Gounkoto (80%) |
Kibali (45%) |
Veladero (50%) |
Porgera (47.5%) |
North
Marae (84%) |
Bulyanhulu
e (84%) |
| Income |
795 |
|
386 |
|
229 |
|
1,636 |
|
508 |
|
358 |
|
244 |
|
114 |
|
(18) |
|
214 |
|
27 |
|
| Depreciation |
188 |
|
136 |
|
113 |
|
596 |
|
136 |
|
214 |
|
174 |
|
69 |
|
25 |
|
76 |
|
60 |
|
| EBITDA |
983 |
|
522 |
|
342 |
|
2,232 |
|
644 |
|
572 |
|
418 |
|
183 |
|
7 |
|
290 |
87 |
|
|
|
|
|
|
|
|
|
|
|
|
| |
For the year ended 12/31/19 |
| |
Carlin
a (61.5%) |
Cortez
b (61.5%) |
Turquoise
Ridgec (61.5%) |
Nevada
Gold Minesd (61.5%) |
Pueblo Viejo (60%) |
Loulo-Gounkoto (80%) |
Kibali (45%) |
Veladero (50%) |
Porgera (47.5%) |
North
Marae (84%) |
Bulyanhulu
e (84%) |
| Income |
370 |
|
459 |
|
201 |
|
1,050 |
|
402 |
|
190 |
|
108 |
57 |
|
113 |
|
112 |
|
(14) |
|
| Depreciation |
239 |
|
197 |
|
92 |
|
592 |
|
120 |
|
236 |
|
196 |
115 |
|
42 |
|
75 |
|
14 |
|
| EBITDA |
609 |
|
656 |
|
293 |
|
1,642 |
|
522 |
|
426 |
|
304 |
172 |
|
155 |
|
187 |
|
0 |
|
|
|
|
|
|
|
|
|
|
|
|
|
|
For the year ended 12/31/18 |
| |
Carlin
a (61.5%) |
Cortez
b (61.5%) |
Turquoise
Ridgec (61.5%) |
Nevada
Gold Minesd (61.5%) |
Pueblo Viejo (60%) |
Loulo-Gounkoto
f (80%) |
Kibali
f (45%) |
Veladero (50%) |
Porgera (47.5%) |
North
Marae (84%) |
Bulyanhulu
e (84%) |
| Income |
166 |
|
726 |
|
126 |
|
1,011 |
|
342 |
|
|
|
53 |
|
56 |
|
94 |
|
(18) |
|
| Depreciation |
262 |
|
386 |
|
28 |
|
677 |
|
115 |
|
|
|
121 |
|
42 |
|
40 |
|
33 |
|
| EBITDA
|
428
|
|
1,112
|
|
154
|
|
1,688
|
|
457
|
|
|
|
174
|
|
98
|
|
134
|
|
15
|
|
a.On July 1,
2019, Barrick's Goldstrike and Newmont's Carlin were contributed to Nevada Gold Mines and are now referred to as Carlin. As a result, the amounts presented represent Goldstrike on a 100% basis (including our 60% share of South Arturo) up until June
30, 2019, and the combined results of Carlin and Goldstrike (including our 60% share of South Arturo) on a 61.5% basis thereafter.
b.On July 1,
2019, Cortez was contributed to Nevada Gold Mines, a joint venture with Newmont. As a result, the amounts presented are on a 100% basis up until June 30, 2019, and on a 61.5% basis thereafter.
c.Barrick owned 75% of Turquoise Ridge through to the end of the second quarter of 2019, with our joint venture partner, Newmont,
owning the remaining 25%. Turquoise Ridge was proportionately consolidated on the basis that the joint venture partners that have joint control have rights to the assets and obligations for the liabilities relating to the arrangement. The figures
presented in this table are based on our 75% interest in Turquoise Ridge until June 30, 2019. On July 1, 2019, Barrick's 75% interest in Turquoise Ridge and Newmont's Twin Creeks and 25% interest in Turquoise Ridge were contributed to Nevada Gold
Mines. Starting July 1, 2019, the results represent our 61.5% share of Turquoise Ridge and Twin Creeks, now referred to as Turquoise Ridge.
d.Represents the
combined results of Cortez, Goldstrike (including our 60% share of South Arturo) and our 75% interest in Turquoise Ridge until June 30, 2019. Commencing July 1, 2019, the date Nevada Gold Mines was established, the results represent our 61.5%
interest in Cortez, Carlin (including Goldstrike and 60% of South Arturo), Turquoise Ridge (including Twin Creeks), Phoenix and Long Canyon.
e.Formerly part
of Acacia Mining plc. On September 17, 2019, Barrick acquired all of the shares of Acacia it did not own. Operating results are included at 63.9% until September 30, 2019 (notwithstanding the completion of the Acacia transaction on September 17,
2019, we consolidated our interest in Acacia and recorded a non-controlling interest of 36.1% in the income statement for the entirety of the third quarter of 2019 as a matter of convenience), on a 100% basis from October 1, 2019, to December 31,
2019, and on an 84% basis thereafter as the GoT’s 16% free-carried interest was made effective from January 1, 2020.
f.The results
for 2018 did not form a part of the Barrick consolidated results as these sites were acquired as a result of the Merger. Therefore, no comparative figures are provided.
|
|
|
|
|
|
|
|
|
| BARRICK YEAR-END 2020 |
98 |
MANAGEMENT’S DISCUSSION AND
ANALYSIS |
Realized
Price
Realized
price is a non-GAAP financial measure which excludes from sales:
■Unrealized
gains and losses on non-hedge derivative
contracts;
■Unrealized mark-to-market gains and losses on provisional pricing from copper and gold sales
contracts;
■Sales attributable to ore purchase
arrangements;
■Treatment and refining charges; and
■Cumulative
catch-up adjustment to revenue relating to our streaming arrangements.
This measure is intended to enable Management to better understand the price realized in each reporting period for gold and copper sales because
unrealized mark-to-market values of non-hedge gold and copper derivatives are subject to change each period due to changes in market factors such as market and forward gold and copper prices, so that prices ultimately realized may differ from those
recorded. The exclusion of such unrealized mark-to-market gains and losses from the presentation of this performance measure enables investors to understand performance based on the realized proceeds of selling gold and copper
production.
The gains and losses on non-hedge derivatives and receivable balances relate to instruments/balances that mature in future periods, at which time
the gains and losses will become realized. The amounts of these gains and losses reflect fair values based on market valuation assumptions at the end of each period and do not necessarily represent the amounts that will become realized on maturity.
We believe this provides investors and analysts with a more accurate measure with which to compare to market gold prices and to assess our gold sales performance. For those reasons, management believes that this measure provides a more accurate
reflection of our Company’s past performance and is a better indicator of its expected performance in future periods.
The realized price measure is intended to provide additional information, and does not have any standardized definition under IFRS and should not be
considered in isolation or as a substitute for measures of performance prepared in accordance with IFRS. The measure is not necessarily indicative of sales as determined under IFRS. Other companies may calculate this measure differently. The
following table reconciles realized prices to the most directly comparable IFRS measure.
Reconciliation of Sales to Realized Price per ounce/pound
|
|
|
|
|
|
|
|
|
|
|
|
|
|
|
|
|
|
|
|
|
|
|
|
|
|
|
|
|
|
|
|
|
|
For the three
months ended |
For the years
ended |
| ($ millions, except per
ounce/pound information in dollars) |
Gold |
Copper |
Gold |
Copper |
| |
12/31/20
|
9/30/20 |
12/31/20
|
9/30/20 |
12/31/20
|
12/31/19 |
12/31/18
|
12/31/20
|
12/31/19
|
12/31/18
|
| Sales |
3,028 |
|
3,237 |
|
195 |
|
219 |
|
11,670 |
|
9,186 |
|
6,600
|
|
697
|
|
393
|
|
512
|
|
| Sales applicable to non-controlling interests |
(934) |
|
(967) |
|
0 |
|
0 |
|
(3,494) |
|
(1,981) |
|
(734) |
|
0 |
|
0 |
|
0 |
|
Sales applicable to equity method investmentsa,b |
168 |
|
183 |
|
135 |
|
121 |
|
648 |
|
543 |
|
0 |
|
483 |
|
492 |
|
442 |
|
| Realized non-hedge gold/copper derivative (losses)
gains |
0 |
|
0 |
|
0 |
|
0 |
|
0 |
|
1 |
|
2 |
|
0 |
|
0 |
|
0 |
|
Sales applicable to sites in care and maintenancec |
(41) |
|
(53) |
|
0 |
|
0 |
|
(170) |
|
(140) |
|
(111) |
|
0 |
|
0 |
|
0 |
|
| Treatment and refinement charges |
1 |
|
4 |
|
39 |
|
39 |
|
7 |
|
0 |
|
1 |
|
157 |
|
99 |
|
144 |
|
| Export duties |
0 |
|
0 |
|
0 |
|
0 |
|
0 |
|
0 |
|
(1) |
|
0 |
|
0 |
|
0 |
|
Otherd |
(1) |
|
0 |
|
0 |
|
0 |
|
13 |
|
22 |
|
12 |
|
0 |
|
0 |
|
0 |
|
| Revenues – as
adjusted |
2,221 |
|
2,404 |
|
369 |
|
379 |
|
8,674 |
|
7,631 |
|
5,769
|
|
1,337
|
|
984
|
|
1,098
|
|
Ounces/pounds sold (000s
ounces/millions pounds)c |
1,186 |
|
1,249 |
|
108 |
|
116 |
|
4,879 |
|
5,467 |
|
4,544
|
|
457
|
|
355
|
|
382
|
|
Realized
gold/copper price per ounce/pounde |
1,871
|
|
1,926
|
|
3.39
|
|
3.28
|
|
1,778
|
|
1.396
|
|
1,270 |
|
2.92 |
|
2.77 |
|
2.88 |
|
a.Represents sales of $168 million and $648 million, respectively, for the three months and year ended December 31, 2020 (September
30, 2020: $176 million; 2019: $505 million; 2018: $nil) applicable to our 45% equity method investment in Kibali and $nil and $nil, respectively (September 30, 2020: $nil; 2019: $39 million; 2018: $nil)
applicable to our 40% equity method investment in Morila for gold. Represents sales of $82 million and $298 million, respectively, for the three months and year ended December 31, 2020 (September 30, 2020: $66 million; 2019:
$343 million; 2018: $300 million) applicable to our 50% equity method investment in Zaldívar and $59 million and $204 million, respectively (September 30, 2020: $59 million; 2019: $168 million; 2018: $161
million) applicable to our 50% equity method investment in Jabal Sayid.
b.Sales applicable to equity method investments are net of treatment and refinement charges.
c.
Figures exclude Pierina, Golden Sunlight starting in the third quarter of 2019, Morila starting in the third quarter of
2019 up until its divestiture in November 2020, and Lagunas Norte starting in the fourth quarter of 2019 from the calculation of realized price per ounce. These assets are producing incidental ounces as they reach the end of their mine
lives.
d.
Represents cumulative catch-up adjustment to revenue relating to our streaming arrangements. Refer to note 2f to the
Financial Statements for more information.
e.Realized price per ounce/pound may not calculate based on amounts presented in this table due to
rounding.
|
|
|
|
|
|
|
|
|
| BARRICK YEAR-END 2020 |
99 |
MANAGEMENT’S DISCUSSION AND
ANALYSIS |
The scientific and technical information contained in this MD&A has been reviewed and approved by Steven Yopps, MMSA, Manager of Growth
Projects, Nevada Gold Mines; Craig Fiddes, SME-RM, Manager – Resource Modeling, Nevada Gold Mines; Chad Yuhasz, P.Geo, Mineral Resource Manager, Latin America & Asia Pacific; Simon Bottoms, CGeol, MGeol, FGS, FAusIMM, Mineral
Resources Manager: Africa & Middle East; Rodney Quick, MSc, Pr. Sci.Nat, Mineral Resource Management and Evaluation Executive; John Steele, CIM, Metallurgy, Engineering and Capital Projects Executive; and Rob Krcmarov, FAusIMM,
Executive Vice President, Exploration and Growth – each a “Qualified Person” as defined in National Instrument 43-101 – Standards of Disclosure for Mineral Projects.
All mineral reserve and mineral resource estimates are estimated in accordance with National Instrument 43-101 – Standards of Disclosure for Mineral Projects. Unless otherwise noted, such mineral reserve and mineral resource estimates are as of December 31,
2020.
1A Tier One
Gold Asset is an asset with a reserve potential to deliver a minimum 10-year life, annual production of at least 500,000 ounces of gold and total cash costs per ounce over the mine life that are in the lower half of the industry cost
curve.
2A Tier Two Gold Asset is an asset with a reserve potential to deliver a minimum 10-year life, annual production of at least 250,000
ounces of gold and total cash costs per ounce over the mine life that are in the lower half of the industry cost curve. A Strategic Asset is an asset which in the opinion of Barrick, has the potential to deliver significant unrealized value in the
future.
3Currently consists of Barrick’s Lumwana mine and Zaldívar and Jabal Sayid copper joint
ventures.
4These are non-GAAP financial performance measures with no standardized meaning under IFRS and therefore may not be comparable to
similar measures presented by other issuers. For further information and a detailed reconciliation of each non-GAAP measure to the most directly comparable IFRS measure, please see pages 96 to 122 of this
MD&A.
5Cost of sales applicable to gold per ounce is calculated using cost of sales applicable to gold on an attributable basis
(removing the non-controlling interest of 40% Pueblo Viejo, 16% North Mara, Bulyanhulu and Buzwagi starting January 1, 2020, the date the GoT’s 16% free carried interest was made effective (36.1% from January 1, 2018 to September 30, 2019;
notwithstanding the completion of the Acacia transaction on September 17, 2019, we consolidated our interest in Acacia and recorded a non-controlling interest of 36.1% in the income statement for the entirety of the third quarter of 2019 as a matter
of convenience); and 63.1% South Arturo from cost of sales from July 1, 2019 onwards as a result of its contribution to Nevada Gold Mines (and on a 40% basis from January 1, 2018 to June 30, 2019), divided by attributable gold ounces.
Commencing January 1, 2019, the effective date of the Merger, the non-controlling interest of 20% Loulo-Gounkoto and 10.3% Tongon is also
removed from cost of sales and our proportionate share of cost of sales attributable to equity method investments (Kibali, and Morila until the second quarter of 2019) is included. Cost of sales applicable to gold per ounce also removes the
non-controlling interest of 38.5% Nevada Gold Mines from July 1, 2019 onwards. Cost of sales applicable to copper per pound is calculated using cost of sales applicable to copper including our proportionate share of cost of sales attributable to
equity method investments (Zaldívar and Jabal Sayid), divided by consolidated copper pounds (including our proportionate share of copper pounds from our equity method investments).
6Total reportable incident frequency rate (“TRIFR”) is a ratio calculated as follows: number of reportable injuries
x 1,000,000 hours divided by the total number of hours worked. Reportable injuries include fatalities, lost time injuries, restricted duty injuries, and medically treated injuries. Lost time injury frequency rate (“LTIFR”) is a ratio
calculated as follows: number of lost time injuries x 1,000,000 hours divided by the total number of hours worked.
7Class 1 - High
Significance is defined as an incident that causes significant negative impacts on human health or the environment or an incident that extends onto publicly accessible land and has the potential to cause significant adverse impact to surrounding
communities, livestock or wildlife.
8All mineral
resource and mineral reserve estimates of tonnes, Au oz, Ag oz and Cu lb are reported to the second significant digit. All measured and indicated mineral resource estimates of grade and all proven and probable mineral reserve estimates of grade for
Au g/t, Ag g/t and Cu % are reported to two decimal places. All inferred mineral resource estimates of grade for Au g/t, Ag g/t and Cu % are reported to one decimal place. 2020 polymetallic mineral resources
|
|
|
|
|
|
|
|
|
| BARRICK YEAR-END 2020 |
100 |
MANAGEMENT’S DISCUSSION AND
ANALYSIS |
and mineral reserves are estimated using the combined value
of gold, copper & silver and accordingly are reported as Gold, Copper & Silver mineral resources and mineral reserves.
9Estimated in
accordance with National Instrument 43-101 - Standards of Disclosure for Mineral Projects as required by Canadian securities regulatory authorities. Estimates are as of December 31, 2020, unless otherwise noted. Proven reserves of 280
million tonnes grading 2.37 g/t, representing 21 million ounces of gold, and 350 million tonnes grading 0.39%, representing 3,000 million pounds of copper. Probable reserves of 990 million tonnes grading 1.46 g/t, representing 47 million
ounces of gold, and 1,100 million tonnes grading 0.39%, representing 9,700 million pounds of copper. Measured resources of 530 million tonnes grading 2.11 g/t, representing 36 million ounces of gold, and 600 million tonnes grading 0.36%,
representing 4,800 million pounds of copper. Indicated resources of 2,800 million tonnes grading 1.41 g/t, representing 130 million ounces of gold, and 2,500 million tonnes grading 0.36%, representing 20,000 million pounds of copper. Inferred
resources of 980 million tonnes grading 1.4 g/t, representing 43 million ounces of gold, and 440 million tonnes grading 0.2%, representing 2,200 million pounds of copper. Complete mineral reserve and mineral resource data for all mines and
projects referenced in this MD&A, including tonnes, grades, and ounces, can be found on pages 136-143 of Barrick’s Fourth Quarter and Year-End 2020
Report.
10Estimated in accordance with National Instrument 43-101 - Standards of Disclosure for Mineral Projects as required by Canadian securities regulatory authorities. Estimates are as of December 31, 2019, unless otherwise noted. Proven reserves of 280
million tonnes grading 2.42 g/t, representing 22 million ounces of gold, and 420 million tonnes grading 0.4%, representing 3,700 million
pounds of copper. Probable reserves of 1,000 million tonnes grading 1.48 g/t, representing 49 million ounces of gold, and 1,200 million tonnes grading 0.38%, representing 9,800 million pounds of copper. Measured resources of 530 million tonnes
grading 2.21 g/t, representing 37 million ounces of gold, and 660 million tonnes grading 0.38%, representing 5,500 million pounds of copper. Indicated resources of 2,800 million tonnes grading 1.43 g/t, representing 130 million ounces of
gold, and 2,400 million tonnes grading 0.38%, representing 21,000 million pounds of copper. Inferred resources of 940 million tonnes grading 1.3 g/t, representing 39 million ounces of gold, and 430 million tonnes grading 0.2%, representing 2,200
million pounds of copper. Complete 2019 mineral reserve and mineral resource data for all mines and projects referenced in this MD&A, including tonnes, grades, and ounces, can be found on pages 33-44 of Barrick’s Annual Information
Form/Form 40-F for the year ended December 31, 2019 on file with Canadian provincial securities regulatory authorities and the U.S. Securities and Exchange
Commission.
11See the Technical Report on the Turquoise Ridge mine, dated March 19, 2019, and filed on SEDAR at www.sedar.com and EDGAR at
www.sec.gov on March 23,
2019.
12See the Technical Report on the Pueblo Viejo mine, Sanchez Ramirez Province, Dominican Republic, dated March 19, 2018, and filed on
SEDAR at www.sedar.com and EDGAR at www.sec.gov on March 23, 2018.
13Carlin
Trend Significant
Interceptsa
|
|
|
|
|
|
|
|
|
|
|
|
|
|
|
|
|
|
| Drill Results from Q4 2020 |
Drill
Holeb |
Azimuth |
Dip |
Interval (m) |
Width
(m)c |
Au (g/t) |
|
|
|
58.5 - 63.7 |
5.2 |
7.10 |
| LUC-03265 |
244 |
(60) |
176.2 - 188.4 |
12.2 |
10.60 |
| LUC-03268 |
298 |
(59) |
103.0 - 113.7 |
10.67 |
11.09 |
|
|
|
175.7 - 188.4 |
12.65 |
17.29 |
|
|
|
210.0 - 213.0 |
3 |
8.91 |
| LUC-03269A |
343 |
(60) |
336.5 - 345.3 |
8.84 |
6.16 |
a.All intercepts calculated using a 3.4 g/t Au cutoff and are uncapped; minimum intercept width is 3.0 m; internal
dilution is less than 20% total width.
b.Carlin Trend drill hole nomenclature: Project area (LUC - Leeville Underground Core) followed by a 5-digit hole
number.
c.True widths of intercepts are uncertain at this
stage.
The drilling results for the Carlin
Trend contained in this MD&A have been prepared in accordance with National Instrument 43-101 – Standards of
Disclosure for Mineral Projects. All drill hole assay information has been manually reviewed and approved by staff geologists and
re-checked by the project manager. Sample preparation and analyses are conducted by an independent laboratory, ALS Minerals. Procedures are employed to ensure security of samples during their delivery from the drill rig to the laboratory. The
quality assurance procedures, data verification and assay protocols used in connection with drilling and sampling on the Carlin Trend conform to industry accepted quality control
methods.
|
|
|
|
|
|
|
|
|
| BARRICK YEAR-END 2020 |
101 |
MANAGEMENT’S DISCUSSION AND
ANALYSIS |
14 Carlin
Trend Significant Interceptsa
|
|
|
|
|
|
|
|
|
|
|
|
|
|
|
|
|
|
| Drill Results from Q4 2020 |
Drill
Holeb |
Azimuth |
Dip |
Interval (m) |
Width
(m)c |
Au (g/t) |
| NVX-20001
|
207 |
(69) |
269.1 - 271.9 |
2.7 |
8.6 |
|
|
|
482.9 - 486.6 |
3.7 |
14.7 |
|
|
|
489.8 - 492.7 |
2.9 |
17.1 |
| PGX-20005 |
256 |
(52) |
503.2 - 504.6 |
1.4 |
6.6 |
|
|
|
|
|
|
|
|
|
|
|
|
|
|
|
|
|
|
a.All intercepts calculated using a 5 g/t Au cutoff and are uncapped; minimum intercept width is 0.8 m; internal
dilution is less than 20% total width.
b.Carlin Trend drill hole nomenclature: Project area (PGX - Post-Gen, NVX - Nova) followed by the year (20 for 2020) then hole
number.
c.True widths of intercepts are uncertain at this
stage.
The drilling results for the Carlin
Trend contained in this MD&A have been prepared in accordance with National Instrument 43-101 – Standards of
Disclosure for Mineral Projects. All drill hole assay information has been manually reviewed and approved by staff geologists and
re-checked by the project manager. Sample preparation and analyses are conducted by an independent laboratory, ALS Minerals. Procedures are employed to ensure security of samples during their delivery from the drill rig to the laboratory. The
quality assurance procedures, data verification and assay protocols used in connection with drilling and sampling on the Carlin Trend conform to industry accepted quality control
methods.
15 North Leeville
Significant Interceptsa
|
|
|
|
|
|
|
|
|
|
|
|
|
|
|
|
|
|
| Drill Results from Q4 2020 |
Drill
Holeb |
Azimuth |
Dip |
Interval (m) |
Width
(m)c |
Au (g/t) |
| CGX-20077
|
105 |
(67) |
813.5 - 816.6 |
3.1 |
7.1 |
CGX-20078d |
106 |
(67) |
756.5 - 789.4 |
32.9 |
16.9 |
CGX-20079d |
280 |
(80) |
813.5 - 825.8 |
12.3 |
18.3 |
CGX-20081d,e |
0 |
(90) |
899.7 - 931.1 |
31.4 |
1.0 |
|
|
|
|
|
|
|
|
|
|
|
|
|
|
|
|
|
|
a.All intercepts calculated using a 3.4 g/t Au cutoff and are uncapped; minimum intercept width is 3.0 m; internal
dilution is less than 20% total width.
b.Carlin Trend drill hole nomenclature: Project area (CGX - Leeville) followed by the year (20 for 2020) then hole number.
c.True widths of intercepts are uncertain at this
stage.
d.Partial results received; additional results expected in Q1
2021.
e.No significant >3.4 g/t intercept; low-grade intercept calculated using 0.5 g/t Au cutoff and uncapped;
internal dilution is less than 20% total
width.
The drilling results for North Leeville
contained in this MD&A have been prepared in accordance with National Instrument 43-101 – Standards of
Disclosure for Mineral Projects. All drill hole assay information has been manually reviewed and approved by staff geologists and
re-checked by the project manager. Sample preparation and analyses are conducted by an independent laboratory, ALS Minerals. Procedures are employed to ensure security of samples during their delivery from the drill rig to the laboratory. The
quality assurance procedures, data verification and assay protocols used in connection with drilling and sampling on North Leeville conform to industry accepted quality control
methods.
|
|
|
|
|
|
|
|
|
| BARRICK YEAR-END 2020 |
102 |
MANAGEMENT’S DISCUSSION AND
ANALYSIS |
16 Leeville
Significant Interceptsa
|
|
|
|
|
|
|
|
|
|
|
|
|
|
|
|
|
|
| Drill Results from Q3 2020 |
Drill
Holeb |
Azimuth |
Dip |
Interval (m) |
Width
(m)c |
Au (g/t) |
|
|
|
115.5 - 118.5 |
3 |
8.1 |
|
|
|
145.7 - 156.7 |
11 |
6.4 |
|
|
|
158.8 - 163.4 |
4.6 |
10.9 |
| LUC-03220 |
(347) |
(61) |
174.3 - 178.3 |
4 |
7.8 |
|
|
|
110.9 - 134.9 |
24 |
11.1 |
|
|
|
141.4 - 149.0 |
7.6 |
6.9 |
| LUC-03221 |
360 |
(54) |
156.8 - 189.0 |
32.2 |
14.9 |
|
|
|
89.9 - 94.5 |
4.6 |
14.4 |
|
|
|
129.5 - 146.3 |
16.8 |
7.3 |
| LUC-03222 |
7 |
(62) |
152.4 - 161.5 |
9.1 |
14.0 |
|
|
|
80.5 - 85.2 |
4.7 |
9.2 |
|
|
|
105.3 - 187.3 |
82 |
23.8 |
LUC-03223d |
25 |
(60) |
202.7 - 205.7 |
3 |
10.6 |
|
|
|
119.0 - 127.7 |
8.7 |
11.3 |
| LUC-03238 |
340 |
(53) |
130.0 - 141.4 |
11.4 |
16.2 |
|
|
|
135.0 - 141.4 |
6.4 |
11.6 |
|
|
|
152.4 - 167.9 |
15.5 |
6.2 |
| LUC-03239 |
40 |
(55) |
170.7 - 176.2 |
5.5 |
5.6 |
|
|
|
202.1 - 205.1 |
3 |
6.3 |
| LUC-03240 |
50 |
(50) |
215.8 - 224.0 |
8.2 |
8.4 |
a.All intercepts calculated using a 3.4 g/t Au cutoff and are uncapped; minimum intercept width is 3.0 m; internal
dilution is less than 20% total width.
b.Carlin Trend drill hole nomenclature: Project area (LUC - Leeville underground core) followed by a 5-digit hole number.
c.True widths of intercepts are uncertain at this
stage.
d.LUC-03223 intercept runs sub-parallel to the mineralized
structure
The drilling results for Leeville
contained in this MD&A have been prepared in accordance with National Instrument 43-101 – Standards of
Disclosure for Mineral Projects. All drill hole assay information has been manually reviewed and approved by staff geologists and
re-checked by the project manager. Sample preparation and analyses are conducted by an independent laboratory, ALS Minerals. Procedures are employed to ensure security of samples during their delivery from the drill rig to the laboratory. The
quality assurance procedures, data verification and assay protocols used in connection with drilling and sampling on Leeville conform to industry accepted quality control
methods.
17 CHUG
Significant Interceptsa
|
|
|
|
|
|
|
|
|
|
|
|
|
|
|
|
|
|
| Drill Results from 2020 |
Drill
Holeb |
Azimuth |
Dip |
Interval (m) |
Width
(m)c |
Au (g/t) |
|
|
|
316.7 - 324.5 |
7.8 |
7.8 |
| CHMX-068 |
242.9 |
(57.1) |
387.5 - 396.2 |
8.7 |
4.8 |
|
|
|
|
|
|
|
|
|
|
|
|
a.All intercepts calculated using a 3.43 g/t Au cutoff and are uncapped; minimum intercept width is 3.0 m; maximum
dilution is 6.1m.
b.Cortez Hills Underground drill hole nomenclature: CHMX (Cortex Hills Minex) with no designation of the
year.
c.True widths of intercepts are uncertain at this
stage.
The drilling results for the Cortez
property contained in this MD&A have been prepared in accordance with National Instrument 43-101 – Standards
of Disclosure for Mineral Projects. All drill hole assay information has been manually reviewed and approved by staff geologists and
re-checked by the project manager. Sample preparation and analyses are conducted by an independent laboratory, ALS Minerals. Procedures are employed to ensure security of samples during their delivery from the drill rig to the laboratory. The
quality assurance procedures, data verification and assay protocols used in connection with drilling and sampling on the Cortez property conform to industry accepted quality control
methods.
|
|
|
|
|
|
|
|
|
| BARRICK YEAR-END 2020 |
103 |
MANAGEMENT’S DISCUSSION AND
ANALYSIS |
18 Fourmile
Significant Interceptsa
|
|
|
|
|
|
|
|
|
|
|
|
|
|
|
|
|
|
| Drill Results from Q4 2020 |
Drill
Holeb |
Azimuth |
Dip |
Interval (m) |
Width
(m)c |
Au (g/t) |
FM20-159Dd |
23 |
(76) |
295.6 - 297.3 |
1.7 |
8.0 |
FM20-171De |
67 |
(68) |
1378.7 - 1382.4 |
3.7 |
15.0 |
FM20-172De |
110 |
(65) |
|
|
no intercepts > 5
g/t |
FM20-173D
e |
112
|
(70)
|
328.9
- 330.1 |
1.2
|
9.9
|
a.All intercepts calculated using a 5 g/t Au cutoff and are uncapped; minimum intercept width is 0.8 m; internal
dilution is less than 20% total width.
b.Fourmile drill hole nomenclature: FM (Fourmile) followed by the year (20 for
2020).
c.True widths of intercepts are uncertain at this
stage.
d.Partial results reported in Q2 2020, all results are final
now.
e.Partial results.
The drilling results for the Fourmile property contained in this MD&A have been prepared in accordance with National Instrument 43-101 –
Standards of Disclosure for Mineral Projects. All drill hole assay information has been manually reviewed and approved by staff geologists and re-checked by the project manager. Sample
preparation and analyses are conducted by ALS Minerals. Procedures are employed to ensure security of samples during their delivery from the drill rig to the laboratory. The quality assurance procedures, data verification and assay protocols used in
connection with drilling and sampling on the Fourmile property conform to industry accepted quality control
methods.
19 Bambadji
Significant
Interceptsa
|
|
|
|
|
|
|
|
|
|
|
|
|
|
|
|
|
|
| Drill Results from Q4 2020 |
Drill
Holeb |
Azimuth |
Dip |
Interval (m) |
Width
(m)c |
Au (g/t) |
| KBWDH003 |
135 |
(55) |
130.30 - 149.00 |
18.70 |
1.15 |
| KBWDH004 |
135 |
(55) |
168.70 - 178.70 |
10.00 |
0.51 |
| KBWDH005 |
135 |
(55) |
138.80 - 149.30 |
10.50 |
4.24 |
| KBWDH005 |
135 |
(55) |
160.30 - 163.30 |
3.00 |
13.26 |
| KBWRC018 |
135 |
(55) |
90.00 - 140.00 |
50.00 |
2.08 |
| LFDH002 |
90 |
(50) |
151.00 - 170.00 |
19.00 |
0.67 |
| LFDH003 |
90 |
(50) |
117.80 - 142.5 |
24.70 |
0.52 |
| LFRC004 |
90 |
(50) |
117.00 - 126.00 |
9.00 |
0.55 |
| LFRC004 |
90 |
(50) |
131.00 - 134.00 |
3.00 |
0.67 |
| LFRC007 |
90 |
(50) |
8.00 - 22.00 |
14.00 |
1.26 |
| LFRC007 |
90 |
(50) |
28.00 - 34.00 |
6.00 |
0.74 |
| LFRC007 |
90 |
(50) |
51.00 - 66.00 |
15.00 |
0.55 |
| LFRC010 |
90 |
(50) |
55.00 - 58.00 |
3.00 |
1.03 |
| LFRC012 |
90 |
(50) |
61.00 - 69.00 |
8.00 |
1.18 |
| LFRC013 |
90 |
(50) |
36.00 - 42.00 |
6.00 |
1.59 |
| LFRC014
|
90
|
(50)
|
41.00
- 51.00 |
10.00
|
1.54
|
|
|
|
|
|
|
|
|
|
|
|
|
a.All intercepts calculated using a 0.5 g/t Au cutoff and are uncapped; minimum intercept width is 2 m; internal
dilution is less than 2 m total width.
b.Drill hole nomenclature: KBW (Kabewest), LF (Latifa) followed by type of drilling RC (Reverse Circulation) and DH (Diamond
Drilling).
c.True widths uncertain at this
stage.
The drilling results for the Bambadji
property contained in this MD&A have been prepared in accordance with National Instrument 43-101 – Standards
of Disclosure for Mineral Projects. All drill hole assay information has been manually reviewed and approved by staff geologists and
re-checked by the project manager. Sample preparation and analyses are conducted by SGS, an independent laboratory. Industry accepted best practices for preparation and fire assaying procedures are utilized to determine gold content. Procedures are
employed to ensure security of samples during their delivery from the drill rig to the laboratory. The quality assurance procedures, data verification and assay protocols used in connection with drilling and sampling on the Bambadji property conform
to industry accepted quality control
methods.
|
|
|
|
|
|
|
|
|
| BARRICK YEAR-END 2020 |
104 |
MANAGEMENT’S DISCUSSION AND
ANALYSIS |
20
Loulo-Gounkoto Significant Interceptsa
|
|
|
|
|
|
|
|
|
|
|
|
|
|
|
|
|
|
| Drill Results from Q4 2020 |
Drill
Holeb |
Azimuth |
Dip |
Interval (m) |
Width
(m)c |
Au (g/t) |
| DB1RC022 |
230.83 |
(52) |
155.00 - 157.00 |
2.00 |
1.20 |
|
50.83 |
(58) |
115.00 - 117.00 |
2.00 |
1.66 |
|
50.83 |
(58) |
150.00 - 154.00 |
4.00 |
2.20 |
| DB1RC024 |
50.83 |
(58) |
159.00 - 164.00 |
5.00 |
1.75 |
| DB1RC025 |
50.83 |
(66) |
32.00 - 35.00 |
3.00 |
0.62 |
|
232.83 |
(53) |
58.00 - 60.00 |
2.00 |
0.89 |
|
232.83 |
(53) |
67.00 - 72.00 |
5.00 |
2.66 |
|
232.83 |
(53) |
81.00 - 84.00 |
3.00 |
1.68 |
| DB1RC027 |
232.83 |
(53) |
105.00 - 107.00 |
2.00 |
0.91 |
|
232.83 |
(55) |
263.00 - 265.00 |
2.00 |
0.78 |
| DB1RC029 |
232.83 |
(55) |
268.00 - 270.00 |
2.00 |
9.15 |
|
242.51 |
(51.73) |
248.00 - 252.00 |
4.00 |
2.91 |
| DB1RCDH020 |
242.51 |
(51.73) |
255.00 - 260.00 |
5.00 |
0.67 |
|
37.95 |
(81.02) |
1259.40 - 1263.50 |
4.10 |
0.60 |
| YDH300 |
37.95 |
(81.02) |
1364.30 - 1380.65 |
16.35 |
3.37 |
|
176.83 |
(55) |
16.40 - 19.00 |
2.60 |
0.91 |
|
176.83 |
(55) |
146.60 - 151.80 |
5.20 |
1.07 |
|
176.83 |
(55) |
152.60 - 157.60 |
5.00 |
18.09 |
|
176.83 |
(55) |
161.00 - 163.65 |
2.65 |
1.19 |
|
176.83 |
(55) |
167.70 - 170.98 |
3.28 |
0.73 |
|
176.83 |
(55) |
173.50 - 182.20 |
8.70 |
7.47 |
|
176.83 |
(55) |
185.40 - 189.30 |
3.90 |
12.30 |
|
176.83 |
(55) |
193.05 - 197.70 |
4.65 |
6.66 |
|
176.83 |
(55) |
201.50 - 203.50 |
2.00 |
1.48 |
|
176.83 |
(55) |
205.70 - 208.60 |
2.90 |
1.44 |
|
176.83 |
(55) |
219.10 - 221.30 |
2.20 |
0.83 |
|
176.83 |
(55) |
228.40 - 231.45 |
3.05 |
0.71 |
| YRDH010 |
176.83 |
(55) |
242.55 - 245.00 |
2.45 |
0.96 |
|
154.83 |
(51) |
12.20 - 19.40 |
7.20 |
4.93 |
|
154.83 |
(51) |
20.30 - 23.55 |
3.25 |
4.33 |
|
154.83 |
(51) |
57.40 - 64.20 |
6.80 |
0.98 |
|
154.83 |
(51) |
68.55 - 74.00 |
5.45 |
3.91 |
| YRDH011 |
154.83 |
(51) |
141.60 - 145.30 |
3.70 |
0.70 |
|
156.5 |
(52.9) |
4.25 - 6.30 |
2.05 |
1.53 |
|
156.5 |
(52.9) |
54.57 - 57.70 |
3.13 |
2.54 |
|
156.5 |
(52.9) |
93.60 - 96.15 |
2.55 |
3.95 |
|
156.5 |
(52.9) |
110.60 - 112.60 |
2.00 |
1.04 |
|
156.5 |
(52.9) |
122.60 - 130.50 |
7.90 |
1.92 |
|
156.5 |
(52.9) |
187.20 - 191.55 |
4.35 |
1.95 |
|
156.5 |
(52.9) |
193.45 - 195.50 |
2.05 |
3.07 |
| YRDH012 |
156.5 |
(52.9) |
199.28 - 203.23 |
3.95 |
1.14 |
|
164.66 |
(50.82) |
0.00 - 2.00 |
2.00 |
1.34 |
|
164.66 |
(50.82) |
7.00 - 14.00 |
7.00 |
2.67 |
|
164.66 |
(50.82) |
15.00 - 22.00 |
7.00 |
0.73 |
|
164.66 |
(50.82) |
29.00 - 34.00 |
5.00 |
1.14 |
|
164.66 |
(50.82) |
57.00 - 60.00 |
3.00 |
0.97 |
|
164.66 |
(50.82) |
70.00 - 76.00 |
6.00 |
1.52 |
|
164.66 |
(50.82) |
120.00 - 130.00 |
10.00 |
2.26 |
|
164.66 |
(50.82) |
132.00 - 134.00 |
2.00 |
0.52 |
|
164.66 |
(50.82) |
153.00 - 156.00 |
3.00 |
1.11 |
|
164.66 |
(50.82) |
157.15 - 161.45 |
4.30 |
1.56 |
|
|
|
|
|
|
|
|
|
| BARRICK YEAR-END 2020 |
105 |
MANAGEMENT’S DISCUSSION AND
ANALYSIS |
|
|
|
|
|
|
|
|
|
|
|
|
|
|
|
|
|
|
|
164.66 |
(50.82) |
207.15 - 213.30 |
6.15 |
1.31 |
|
164.66 |
(50.82) |
224.50 - 229.30 |
4.80 |
1.58 |
|
164.66 |
(50.82) |
251.15 - 255.55 |
4.40 |
9.01 |
|
164.66 |
(50.82) |
279.10 - 282.05 |
2.95 |
0.83 |
|
164.66 |
(50.82) |
303.20 - 310.00 |
6.80 |
0.91 |
|
164.66 |
(50.82) |
337.00 - 340.30 |
3.30 |
0.59 |
|
164.66 |
(50.82) |
352.20 - 355.00 |
2.80 |
0.53 |
| YRRCDH001 |
164.66 |
(50.82) |
357.20 - 365.95 |
8.75 |
1.12 |
|
164.8 |
(52.8) |
62.00 - 67.00 |
5.00 |
1.38 |
|
164.8 |
(52.8) |
79.00 - 81.00 |
2.00 |
0.63 |
|
164.8 |
(52.8) |
139.00 - 141.00 |
2.00 |
4.57 |
|
164.8 |
(52.8) |
227.10 - 231.10 |
4.00 |
1.23 |
|
164.8 |
(52.8) |
235.05 - 239.40 |
4.35 |
1.32 |
|
164.8 |
(52.8) |
254.30 - 256.30 |
2.00 |
2.18 |
| YRRCDH002 |
164.8 |
(52.8) |
286.20 - 289.20 |
3.00 |
1.00 |
|
|
|
|
|
|
|
|
|
|
|
|
|
|
|
|
|
|
|
|
|
|
|
|
|
|
|
|
|
|
|
|
|
|
|
|
|
|
|
|
|
|
|
|
|
|
|
|
|
a.All intercepts calculated using a 0.5 g/t Au cutoff and are uncapped; minimum intercept width is 2 m; internal
dilution is less than 2 m total width.
b.Loulo-Gounkoto drill hole nomenclature: Y/YA (Yalea), YR (Yalea Ridge), L3 (Loulo 3), GK (Gounkoto), GKUG (Gounkoto
Undergroud), DB1 (Domain Boundary 1) followed by type of drilling RC (Reverse Circulation), DH (Diamond Drilling) and RCDH (RC/Diamond Tail).
c.True widths
of intercepts are uncertain at this stage.
The
drilling results for the Loulo-Gounkoto property contained in this MD&A have been prepared in accordance with National Instrument 43-101 – Standards of Disclosure for Mineral Projects. All drill hole assay information has been manually reviewed and approved by staff geologists and re-checked by the project manager. Sample
preparation and analyses are conducted by SGS, an independent laboratory. Industry accepted best practices for preparation and fire assaying procedures are utilized to determine gold content. Procedures are employed to ensure security of samples
during their delivery from the drill rig to the laboratory. The quality assurance procedures, data verification and assay protocols used in connection with drilling and sampling on the Loulo property conform to industry accepted quality control
methods.
21 Loulo-Gounkoto
Significant
Interceptsa
|
|
|
|
|
|
|
|
|
|
|
|
|
|
|
|
|
|
| Drill Results from Q3 2020 |
Drill
Holeb |
Azimuth |
Dip |
Interval (m) |
Width
(m)c |
Au (g/t) |
| DB1RC020 |
228.00 |
(51.00) |
247.00 - 258.00 |
11.00 |
1.31 |
| DB1RC022 |
226.33 |
(52.00) |
155.00 - 157.00 |
2.00 |
1.20 |
| DB1RC025 |
46.00 |
(66.00) |
32.00 - 35.00 |
3.00 |
0.62 |
|
|
|
417.25 - 419.25 |
2.00 |
6.24 |
| L3DH255 |
220.02 |
(58.91) |
423.65 - 428.20 |
4.55 |
1.46 |
|
|
|
312.70 - 316.75 |
4.05 |
3.34 |
|
|
|
329.00 - 331.75 |
2.75 |
8.36 |
| L3DH256 |
237.71 |
(56.57) |
333.80 - 336.60 |
2.80 |
2.57 |
|
|
|
377.05 - 379.55 |
2.50 |
0.92 |
|
|
|
382.25 - 385.20 |
2.95 |
7.02 |
|
|
|
394.15 - 401.10 |
6.95 |
3.23 |
| L3DH257 |
224.10 |
(78.82) |
408.90 - 416.10 |
7.20 |
1.75 |
|
|
|
490.20 - 503.90 |
13.70 |
6.41 |
| L3DH258 |
215.16 |
(59.27) |
506.90 - 510.90 |
4.00 |
22.11 |
|
|
|
510.00 - 519.55 |
9.55 |
8.99 |
|
|
|
523.15 - 528.00 |
4.85 |
2.82 |
|
|
|
530.45 - 536.60 |
6.15 |
0.96 |
| L3DH259 |
226.00 |
(69.00) |
540.35 - 547.00 |
6.65 |
1.18 |
|
|
|
633.30 - 644.15 |
10.85 |
2.86 |
|
|
|
645.20 - 648.10 |
2.90 |
0.87 |
| L3DH261 |
210.00 |
(60.00) |
649.20 - 655.00 |
5.80 |
1.52 |
|
|
|
644.40 - 646.55 |
2.15 |
2.96 |
|
|
|
653.20 - 657.85 |
4.65 |
0.78 |
|
|
|
|
|
|
|
|
|
| BARRICK YEAR-END 2020 |
106 |
MANAGEMENT’S DISCUSSION AND
ANALYSIS |
|
|
|
|
|
|
|
|
|
|
|
|
|
|
|
|
|
|
| L3DH262 |
205.40 |
(66.76) |
660.40 - 668.85 |
8.45 |
3.22 |
|
|
|
582.75 - 593.85 |
11.10 |
8.77 |
|
|
|
602.00 - 605.75 |
3.75 |
4.72 |
| L3DH263 |
210.96 |
(55.13) |
609.80 - 613.20 |
3.40 |
1.85 |
|
|
|
681.80 - 695.35 |
13.55 |
2.08 |
| L3DH264 |
208.45 |
(62.13) |
703.25 - 707.35 |
4.10 |
1.67 |
|
|
|
446.65 - 448.65 |
2.00 |
0.58 |
| L3DH266 |
221.28 |
(61.00) |
461.20 - 464.75 |
3.55 |
2.17 |
| YADH147 |
68.98 |
(61.78) |
902.60 - 907.30 |
4.70 |
1.98 |
|
|
|
1,039.50 - 1,054.85
|
15.35 |
3.33 |
| YADH149 |
69.92 |
(65.67) |
1,055.65 - 1,069.60 |
13.95 |
4.85 |
|
|
|
1,114.00 - 1,116.00
|
2.00 |
3.68 |
|
|
|
1,122.80 - 1,143.00 |
20.20 |
4.77 |
|
|
|
1,153.00 - 1,156.00 |
3.00 |
2.06 |
|
|
|
1,167.50 - 1,169.50 |
2.00 |
8.42 |
|
|
|
1,171.80 - 1,178.00 |
6.20 |
2.20 |
|
|
|
1,181.00 - 1,185.85 |
4.85 |
1.68 |
| YADH162 |
62.00 |
(64.00) |
1,189.75 - 1,195.05 |
5.30 |
6.79 |
| YADH165 |
70.00 |
(68.00) |
982.15 - 1,000.70
|
18.55 |
2.35 |
|
|
|
986.00 - 990.00 |
4.00 |
0.69 |
|
|
|
996.50 - 1,001.80 |
5.30 |
1.17 |
| YADH166 |
58.40 |
(68.02) |
1,006.00 - 1,010.80 |
4.80 |
4.20 |
|
|
|
1,077.00 - 1,084.00
|
7.00 |
3.20 |
| YADH167 |
67.05 |
(64.06) |
1,088.90 - 1,099.15 |
10.25 |
5.52 |
|
|
|
833.00 - 837.00 |
4.00 |
5.35 |
|
|
|
877.00 - 879.00 |
2.00 |
0.69 |
|
|
|
885.20 - 888.80 |
3.60 |
2.25 |
|
|
|
894.00 - 896.00 |
2.00 |
0.78 |
| YADH168 |
67.00 |
(63.00) |
1,000.75 - 1,009.00 |
8.25 |
6.58 |
|
|
|
979.70 - 982.70 |
3.00 |
0.53 |
|
|
|
1,015.90 - 1,018.00 |
2.10 |
1.79 |
| YADH169 |
70.52 |
(60.17) |
1,038.40 - 1,045.90 |
7.50 |
2.35 |
|
|
|
1,135.20 - 1,146.00
|
10.80 |
1.37 |
|
|
|
1,153.90 - 1,159.20 |
5.30 |
0.56 |
|
|
|
1,160.00 - 1,162.00 |
2.00 |
1.07 |
|
|
|
1,168.90 - 1,171.00 |
2.10 |
1.16 |
|
|
|
1,174.00 - 1,180.00 |
6.00 |
1.41 |
| YADH170 |
67.00 |
(63.00) |
1,196.00 - 1,200.00 |
4.00 |
1.27 |
|
|
|
1,123.25 - 1,137.00
|
13.75 |
4.34 |
| YADH171 |
63.31 |
(65.94) |
1,144.00 - 1,160.00 |
16.00 |
2.33 |
|
|
|
1,220.00 - 1,229.65
|
9.65 |
2.43 |
|
|
|
1,232.10 - 1,239.00 |
6.90 |
1.47 |
|
|
|
1,241.80 - 1,255.00 |
13.20 |
3.14 |
| YADH66 |
60.00 |
(65.00) |
1,261.00 - 1,264.00 |
3.00 |
1.01 |
|
|
|
1,020.00 - 1,029.00
|
9.00 |
1.68 |
|
|
|
1,031.00 - 1,038.20 |
7.20 |
0.91 |
|
|
|
1,040.20 - 1,042.40 |
2.20 |
0.87 |
|
|
|
1,053.00 - 1,059.00 |
6.00 |
0.77 |
| YADH67 |
60.00 |
(69.00) |
1,061.70 - 1,064.40 |
2.70 |
0.71 |
|
|
|
1,212.00 - 1,220.00
|
8.00 |
1.07 |
|
|
|
1,223.00 - 1,225.00 |
2.00 |
0.85 |
|
|
|
1,241.70 - 1,285.50 |
43.80 |
5.35 |
|
|
|
1,286.30 - 1,314.45 |
28.15 |
10.21 |
|
|
|
1,321.00 - 1,324.05 |
3.05 |
0.91 |
| YDH298W1 |
59.20 |
(76.30) |
1,327.10 - 1,343.00
|
15.90 |
3.69 |
|
|
|
|
|
|
|
|
|
| BARRICK YEAR-END 2020 |
107 |
MANAGEMENT’S DISCUSSION AND
ANALYSIS |
|
|
|
|
|
|
|
|
|
|
|
|
|
|
|
|
|
|
|
|
|
1,108.60 - 1,114.65
|
6.05 |
1.27 |
| YDH298W2 |
59.28 |
(75.44) |
1,138.60 - 1,153.90 |
15.30 |
2.23 |
|
|
|
48.00 - 50.00 |
2.00 |
1.45 |
|
|
|
57.00 - 63.00 |
6.00 |
3.00 |
|
|
|
65.00 - 79.00 |
14.00 |
2.06 |
|
|
|
83.00 - 85.00 |
2.00 |
0.65 |
|
|
|
89.00 - 92.00 |
3.00 |
0.88 |
|
|
|
116.00 - 128.00 |
12.00 |
3.02 |
|
|
|
135.00 - 140.00 |
5.00 |
0.52 |
|
|
|
146.00 - 153.00 |
7.00 |
0.77 |
| YRRC005 |
150.00 |
(51.00) |
161.00 - 167.00 |
6.00 |
0.91 |
|
|
|
61.00 - 66.00 |
5.00 |
0.99 |
|
|
|
69.00 - 71.00 |
2.00 |
1.53 |
|
|
|
75.00 - 82.00 |
7.00 |
1.57 |
|
|
|
93.00 - 106.00 |
13.00 |
1.56 |
|
|
|
116.00 - 122.00 |
6.00 |
1.40 |
| YRRC006 |
150.36 |
(50.46) |
140.00 - 144.00 |
4.00 |
2.00 |
|
|
|
0.00 - 2.00 |
2.00 |
1.34 |
|
|
|
7.00 - 14.00 |
7.00 |
2.67 |
|
|
|
15.00 - 22.00 |
7.00 |
0.73 |
|
|
|
29.00 - 34.00 |
5.00 |
1.14 |
|
|
|
57.00 - 60.00 |
3.00 |
0.97 |
|
|
|
70.00 - 76.00 |
6.00 |
1.52 |
|
|
|
120.00 - 130.00 |
10.00 |
2.26 |
| YRRCDH001 |
164.66 |
(50.82) |
132.00 - 134.00
|
2.00 |
0.52 |
a.All intercepts calculated using a 0.5 g/t Au cutoff and are uncapped; minimum intercept width is 2 m; internal
dilution is equal to or less than 2 m total width.
b.Loulo – Gounkoto drill hole nomenclature: prospect initial Y/YA (Yalea), L3 (Loulo 3), GK (Gounkoto), GKUG
(Gounkoto Underground), DB1 (Domain Boundary 1) followed by type of drilling RC (Reverse Circulation), DH (Diamond Drilling) RCDH (RC/Diamond Tail)
c.True widths
uncertain at this stage.
The drilling results
for the Loulo-Gounkoto property contained in this MD&A have been prepared in accordance with National Instrument 43-101 – Standards of Disclosure for Mineral Projects. All drill hole assay information has been manually reviewed and approved by staff geologists and re-checked by the project manager. Sample
preparation and analyses are conducted by SGS Laboratories, an independent laboratory. Industry accepted best practices for preparation and fire assaying procedures are utilized to determine gold content. Procedures are employed to ensure security
of samples during their delivery from the drill rig to the laboratory. The quality assurance procedures, data verification and assay protocols used in connection with drilling and sampling on the Loulo property conform to industry accepted quality
control methods.
|
|
|
|
|
|
|
|
|
| BARRICK YEAR-END 2020 |
108 |
MANAGEMENT’S DISCUSSION AND
ANALYSIS |
22 Nielle
Significant
Interceptsa
|
|
|
|
|
|
|
|
|
|
|
|
|
|
|
|
|
|
| Drill Results from Q4 2020 |
Drill
Holeb |
Azimuth |
Dip |
Interval (m) |
Width
(m)c |
Au (g/t) |
| JBRC001 |
120 |
(50) |
57.00 - 69.00 |
12.00 |
2.28 |
|
|
|
12.00 - 15.00 |
3.00 |
0.57 |
| JBAC006 |
120 |
(50) |
27.00 - 30.00 |
3.00 |
0.87 |
|
|
|
8.00 - 15.00 |
7.00 |
1.19 |
| JBAC010 |
120 |
(50) |
33.00 - 37.00 |
4.00 |
1.05 |
| JBAC013 |
120 |
(50) |
10.00 - 19.00 |
9.00 |
4.14 |
| JBAC021 |
120 |
(50) |
39.00 - 42.00 |
3.00 |
1.78 |
|
|
|
57.00 - 61.00 |
4.00 |
1.28 |
|
|
|
75.00 - 77.00 |
2.00 |
1.56 |
| SNRC015 |
120 |
(50) |
85.00 - 87.00 |
2.00 |
0.92 |
|
|
|
47.00 - 52.00 |
5.00 |
1.01 |
| SNRC016 |
120 |
(50) |
89.00 - 91.00 |
2.00 |
1.10 |
| SNRC017 |
120 |
(50) |
60.00 - 73.00 |
13.00 |
1.38 |
|
|
|
17.00 - 21.00 |
4.00 |
5.90 |
| SNAC015 |
120 |
(50) |
38.00 - 42.00 |
4.00 |
7.69 |
|
|
|
21.00 - 25.00 |
4.00 |
4.11 |
| SNAC016 |
120 |
(50) |
32.00 - 36.00 |
4.00 |
1.25 |
|
|
|
|
|
|
a.All intercepts calculated using a 0.5 g/t Au cutoff and are uncapped; minimum intercept width is 2 m; 2 m for
maximum internal dilution.
b.Nielle drill hole nomenclature: prospect initial JB (Jubula), SN (Seydou North) followed by type of drilling RC (Reverse
Circulation), AC (Air core).
c.True widths are uncertain at this
stage.
The drilling results for the Nielle
property contained in this MD&A have been prepared in accordance with National Instrument 43-101 – Standards
of Disclosure for Mineral Projects. All drill hole assay information has been manually reviewed and approved by staff geologists and
re-checked by the project manager. Sample preparation and analyses are conducted by SGS, an independent laboratory. Industry accepted best practices for preparation and fire assaying procedures are utilized to determine gold content. Procedures are
employed to ensure security of samples during their delivery from the drill rig to the laboratory. The quality assurance procedures, data verification and assay protocols used in connection with drilling and sampling on the Nielle property conform
to industry accepted quality control
methods.
|
|
|
|
|
|
|
|
|
| BARRICK YEAR-END 2020 |
109 |
MANAGEMENT’S DISCUSSION AND
ANALYSIS |
23 Kibali
Significant
Interceptsa
|
|
|
|
|
|
|
|
|
|
|
|
|
|
|
|
|
|
|
|
|
|
|
|
|
|
|
| Drill Results from Q4
2020 |
|
|
|
|
|
|
Including
d |
Drill
Holeb |
Azimuth |
Dip |
Interval (m) |
Width
(m)c |
Au (g/t) |
Interval (m) |
Width (m) |
Au (g/t) |
| IVRC0272 |
0 |
(90) |
148.00 - 154.00 |
6.00 |
8.66 |
152 - 154 |
2.00 |
20.05 |
|
|
|
9.00 - 13.00 |
4.00 |
1.67 |
|
|
|
| IVRC0273 |
0 |
(90) |
41.00 - 43.00 |
2.00 |
0.82 |
|
|
|
|
|
|
151.00 - 153.00 |
2.00 |
1.74 |
|
|
|
| IVRC0274 |
0 |
(90) |
228.00 - 230.00 |
2.00 |
1.20 |
|
|
|
| IVRC0275 |
0 |
(90) |
54.00 - 62.00 |
8.00 |
1.03 |
|
|
|
|
|
|
18.00 - 46.00 |
28.00 |
4.17 |
18 - 22 |
4.00 |
5.96 |
|
|
|
18.00 - 46.00 |
28.00 |
4.17 |
31 - 36 |
5.00 |
14.03 |
| IVRC0276 |
0 |
(90) |
80.00 - 84.00 |
4.00 |
0.68 |
|
|
|
|
|
|
146.00 - 150.00 |
4.00 |
2.63 |
146 - 147 |
1.00 |
4.00 |
| IVRC0277 |
0 |
(90) |
228.00 - 232.00 |
4.00 |
0.68 |
|
|
|
|
|
|
4.00 - 8.00 |
4.00 |
1.00 |
|
|
|
| IVRC0279 |
0 |
(90) |
16.00 - 20.00 |
4.00 |
2.69 |
18 - 20 |
2.00 |
4.24 |
|
|
|
26.00 - 28.00 |
2.00 |
2.00 |
|
|
|
| IVRC0280 |
0 |
(90) |
48.00 - 50.00 |
2.00 |
0.52 |
|
|
|
|
|
|
26.80 - 34.00 |
7.20 |
1.06 |
|
|
|
|
|
|
1368.60 - 1374.50 |
5.90 |
1.37 |
|
|
|
| DDD603 |
125 |
(75) |
1397.50 - 1409.00 |
11.50 |
0.99 |
1404 - 1406 |
2.00 |
2.45 |
a.All intercepts calculated using a 0.5 g/t Au cutoff and are uncapped; minimum intercept width is 2 m; internal
dilution is equal to or less than 2 m total width.
b.Kibali drill hole nomenclature: prospect initial IV (Ikamva) followed by type of drilling RC (Reverse Circulation). KCD
diamond holes use the DDD initial.
c.True widths uncertain at this stage.
d.All including
intercepts, calculated using a 0.5 g/t Au cutoff and are uncapped, minimum intercept width is 1m, no internal dilution, with grade significantly above (>40%) the overall intercept
grade.
The drilling results for the Kibali
property contained in this MD&A have been prepared in accordance with National Instrument 43-101 – Standards
of Disclosure for Mineral Projects. All drill hole assay information has been manually reviewed and approved by staff geologists and
re-checked by the project manager. Sample preparation and analyses are conducted by SGS, an independent laboratory. Industry accepted best practices for preparation and fire assaying procedures are utilized to determine gold content. Procedures are
employed to ensure security of samples during their delivery from the drill rig to the laboratory. The quality assurance procedures, data verification and assay protocols used in connection with drilling and sampling on the Kibali property conform
to industry accepted quality control methods.
24 Ngayu
Significant
Interceptsa
|
|
|
|
|
|
|
|
|
|
|
|
|
|
|
|
|
|
|
|
|
|
|
|
|
|
|
| Drill Results from Q4
2020 |
|
|
|
|
|
|
Including
d |
Drill
Holeb |
Azimuth |
Dip |
Interval (m) |
Width
(m)c |
Au (g/t) |
Interval (m) |
Width (m) |
Au (g/t) |
|
140 |
(45) |
39.80 - 48.90 |
9.10 |
3.75 |
41.0 - 42.0 |
1.0 |
8.48 |
| ITDD0003 |
140 |
(45) |
39.80 - 48.90 |
9.10 |
3.75 |
45.0 - 46.2 |
1.2 |
9.30 |
|
157 |
(50) |
34.00 - 36.00 |
2.00 |
2.74 |
|
|
|
|
157 |
(50) |
44.00 - 47.20 |
3.20 |
0.71 |
|
|
|
| ADDD0001 |
157 |
(50) |
51.80 - 61.00 |
9.20 |
1.83 |
56.7 - 57.9 |
1.2 |
9.94 |
|
139 |
(50) |
11.40 - 13.70 |
2.30 |
1.36 |
|
|
|
|
139 |
(50) |
26.30 - 31.00 |
4.70 |
0.78 |
|
|
|
|
139 |
(50) |
34.10 - 52.50 |
18.40 |
2.64 |
34.1 - 46.0 |
11.9 |
3.04 |
|
139 |
(50) |
34.10 - 52.50 |
18.40 |
2.64 |
49.3 - 52.5 |
3.2 |
3.14 |
| ADDD0002 |
139 |
(50) |
69.20 - 72.00 |
2.80 |
1.86 |
|
|
|
|
|
|
|
|
|
|
|
|
a.All intercepts calculated using a 0.5 g/t Au cutoff and are uncapped; minimum intercept width is 2 m; internal
dilution is equal to or less than 2 m total width.
|
|
|
|
|
|
|
|
|
| BARRICK YEAR-END 2020 |
110 |
MANAGEMENT’S DISCUSSION AND
ANALYSIS |
b.Ngayu
drill hole nomenclature: prospect initial IT (Itali-Medere), AD (Andagbowa-Mokepa) followed by type of drilling DD (Diamond Drilling).
c.True widths
uncertain at this stage.
d.Includings calculated using a 3.0 g/t Au cutoff and are uncapped; minimum intercept width is 2m; internal dilution
is equal to or less than 25% total width.
The
drilling results for the Ngayu property contained in this MD&A have been prepared in accordance with National Instrument 43-101 – Standards of Disclosure for Mineral Projects. All drill hole assay information has been manually reviewed and approved by staff geologists and re-checked by the project manager. Sample
preparation and analyses are conducted by SGS, an independent laboratory. Industry accepted best practices for preparation and fire assaying procedures are utilized to determine gold content. Procedures are employed to ensure security of samples
during their delivery from the drill rig to the laboratory. The quality assurance procedures, data verification and assay protocols used in connection with drilling and sampling on the Ngayu property conform to industry accepted quality control
methods.
|
|
|
|
|
|
|
|
|
| BARRICK YEAR-END 2020 |
111 |
MANAGEMENT’S DISCUSSION AND
ANALYSIS |
Glossary of Technical Terms
ALL-IN
SUSTAINING COSTS: A non-GAAP measure of cost per ounce/pound for gold/copper. Refer to page 99 of this MD&A for further
information and a reconciliation of the measure.
AUTOCLAVE: Oxidation process in which high temperatures and pressures are applied to convert refractory sulfide mineralization into amenable oxide
ore.
BY-PRODUCT: A secondary metal or mineral product recovered in the milling process such as silver.
C1 CASH COSTS: A non-GAAP
measure of cost per pound for copper. Refer to page 118 of this MD&A for further information and a reconciliation of the measure.
CONCENTRATE: A very fine,
powder-like product containing the valuable ore mineral from which most of the waste mineral has been eliminated.
CONTAINED OUNCES: Represents
ounces in the ground before loss of ounces not able to be recovered by the applicable metallurgical process.
DEVELOPMENT: Work carried out
for the purpose of gaining access to an ore body. In an underground mine, this includes shaft sinking, crosscutting, drifting and raising. In an open pit mine, development includes the removal of overburden (more commonly referred to as stripping in
an open pit).
DILUTION: The effect of waste or low-grade ore which is unavoidably included in the mined ore, lowering the recovered
grade.
DORÉ: Unrefined gold and silver bullion bars usually consisting of approximately 90 percent precious metals that will be further refined to almost
pure
metal.
DRILLING:
Core: drilling
with a hollow bit with a diamond cutting rim to produce a cylindrical core that is used for geological study and assays.
Reverse circulation: drilling that uses a rotating cutting bit within a double-walled drill pipe and produces rock chips rather than core. Air or water is circulated
down to the bit between the inner and outer wall of the drill pipe. The chips are forced to the surface through the center of the drill pipe and are collected, examined and assayed.
In-fill:
drilling closer spaced holes in between existing holes, used to provide greater geological detail and to help establish reserve estimates.
Step-out:
drilling to intersect a mineralized horizon or structure along strike or
down-dip.
EXPLORATION: Prospecting, sampling, mapping, drilling and other work involved in searching for ore.
FREE CASH FLOW: A non-GAAP
measure that reflects our ability to generate cash flow. Refer to page 97 of this MD&A for a definition.
GRADE: The amount of metal in
each tonne of ore, expressed as grams per tonne (g/t) for precious metals and as a percentage for most other metals.
Cut-off grade:
the minimum metal grade at which an ore body can be economically mined (used in the calculation of ore reserves).
Mill-head
grade: metal content per tonne of ore going into a mill for processing.
Reserve grade:
estimated metal content of an ore body, based on reserve calculations.
HEAP
LEACHING: A process whereby gold/copper is extracted by “heaping” broken ore on sloping impermeable pads and
continually applying to the heaps a weak cyanide solution/sulfuric acid which dissolves the contained gold/copper. The gold/copper-laden solution is then collected for gold/copper
recovery.
HEAP LEACH PAD: A large impermeable foundation or pad used as a base for stacking ore for the purpose of heap
leaching.
MILL: A processing facility where ore is finely ground and thereafter undergoes physical or chemical treatment to extract the valuable
metals.
MINERAL RESERVE: See pages 136 to 143 – Summary Gold/Copper Mineral Reserves and Mineral
Resources.
MINERAL RESOURCE: See pages 136 to 143 – Summary Gold/Copper Mineral Reserves and Mineral
Resources.
OPEN PIT: A mine where the minerals are mined entirely from the surface.
ORE: Rock, generally containing
metallic or non-metallic minerals, which can be mined and processed at a
profit.
ORE BODY: A sufficiently large amount of ore that can be mined economically.
OUNCES: Troy ounce is a unit of
measure used for weighing gold at 999.9 parts per thousand purity and is equivalent to 31.1035g.
RECLAMATION: The process by
which lands disturbed as a result of mining activity are modified to support future beneficial land use. Reclamation activity may include the removal of buildings, equipment, machinery and other physical remnants of mining, closure of tailings
storage facilities, leach pads and other mine features, and contouring, covering and re-vegetation of waste rock dumps and other disturbed areas.
RECOVERY RATE: A term used in
process metallurgy to indicate the proportion of valuable material physically recovered in the processing of ore. It is generally stated as a percentage of the valuable material recovered compared to the total material originally contained in the
ore.
REFINING: The final stage of metal production in which impurities are removed from the molten
metal.
ROASTING: The treatment of sulfide ore by heat and air, or oxygen enriched air, in order to oxidize sulfides and remove other elements (carbon, antimony or
arsenic).
STRIPPING: Removal of overburden or waste rock overlying an ore body in preparation for mining by open pit methods.
TAILINGS: The material that remains after all economically and technically recoverable precious metals have been removed from the ore during
processing.
TOTAL CASH COSTS: A non-GAAP measure of cost per ounce for gold. Refer to page 99 of this MD&A for further information and a reconciliation of the
measure.
|
|
|
|
|
|
|
|
|
| BARRICK YEAR-END 2020 |
112 |
MANAGEMENT’S DISCUSSION AND
ANALYSIS |
Mineral Reserves and Mineral Resources
|
|
|
|
|
|
|
|
|
|
|
|
|
|
|
|
|
|
|
|
|
|
|
|
|
|
|
|
|
|
|
|
|
|
|
|
|
|
|
Gold Mineral Reserves1,2,3 |
|
|
|
|
|
|
|
| As at December 31, 2020 |
PROVEN |
|
PROBABLE |
|
TOTAL |
|
|
Tonnes |
Grade |
Contained ozs |
|
Tonnes |
Grade |
Contained ozs |
|
Tonnes |
Grade |
Contained ozs |
| Based on attributable ounces |
|
(Mt) |
(g/t) |
(Moz) |
|
(Mt) |
(g/t) |
(Moz) |
|
(Mt) |
(g/t) |
(Moz) |
AFRICA AND MIDDLE
EAST |
|
|
|
|
|
|
|
|
|
|
|
|
|
|
|
|
|
|
|
|
|
|
|
|
|
| Bulyanhulu underground (84.00%) |
|
— |
— |
— |
|
6.9 |
|
8.92 |
|
2.0 |
|
6.9 |
|
8.92 |
2.0 |
|
| Buzwagi surface (84.00%) |
|
1.7 |
|
0.76 |
|
0.042 |
|
|
— |
|
— |
— |
|
1.7 |
|
0.76 |
0.042 |
|
| Jabal Sayid surface |
|
0.12 |
0.29 |
|
0.0012 |
|
|
— |
|
— |
— |
|
0.12 |
|
0.29 |
0.0012 |
|
| Jabal Sayid underground |
|
5.0 |
0.19 |
|
0.030 |
|
|
7.2 |
|
0.25 |
0.059 |
|
12 |
|
0.23 |
0.089 |
|
| Jabal Sayid (50.00%) total |
|
5.1 |
|
0.19 |
|
0.031 |
|
|
7.2 |
|
0.25 |
|
0.059 |
|
12 |
|
0.23 |
0.090 |
|
| Kibali surface |
|
3.4 |
|
2.68 |
|
0.29 |
|
|
11 |
|
2.40 |
|
0.84 |
|
14 |
|
2.47 |
1.1 |
|
| Kibali underground |
|
5.7 |
|
5.32 |
|
0.98 |
|
|
14 |
|
4.61 |
|
2.1 |
|
20 |
|
4.81 |
3.1 |
|
| Kibali (45.00%) total |
|
9.1 |
|
4.34 |
|
1.3 |
|
|
25 |
|
3.66 |
3.0 |
|
34 |
|
3.84 |
4.2 |
|
| Loulo-Gounkoto surface |
|
8.3 |
|
2.88 |
|
0.77 |
|
|
8.4 |
|
3.54 |
|
0.95 |
|
17 |
|
3.21 |
1.7 |
|
| Loulo-Gounkoto underground |
|
9.8 |
|
4.49 |
|
1.4 |
|
|
21 |
|
5.12 |
|
3.5 |
|
31 |
|
4.93 |
5.0 |
|
| Loulo-Gounkoto (80.00%) total |
|
18 |
|
3.75 |
|
2.2 |
|
|
30 |
|
4.68 |
|
4.5 |
|
48 |
|
4.33 |
6.7 |
|
| North Mara surface |
|
0.10 |
|
8.43 |
|
0.028 |
|
|
18 |
|
1.40 |
|
0.83 |
|
18 |
|
1.44 |
|
0.85 |
|
| North Mara underground |
|
2.1 |
|
6.94 |
|
0.46 |
|
|
5.3 |
|
4.25 |
|
0.72 |
|
7.3 |
|
5.01 |
|
1.2 |
|
| North Mara (84.00%) total |
|
2.2 |
|
7.01 |
|
0.49 |
|
|
24 |
|
2.04 |
|
1.5 |
|
26 |
|
2.46 |
|
2.0 |
|
| Tongon surface (89.70%) |
|
4.1 |
|
1.62 |
|
0.21 |
|
|
5.2 |
|
2.15 |
|
0.36 |
|
9.3 |
|
1.92 |
0.57 |
|
AFRICA AND MIDDLE EAST
TOTAL |
|
40
|
|
3.27 |
|
4.2 |
|
|
98 |
|
3.62 |
|
11 |
|
140 |
|
3.52 |
|
16 |
|
LATIN AMERICA AND ASIA
PACIFIC |
|
|
|
|
|
|
|
|
|
|
| Norte Abierto surface (50.00%) |
|
110 |
|
0.65 |
|
2.4 |
|
480 |
|
0.59 |
|
9.2 |
|
600 |
|
0.60 |
|
12 |
Porgera surface4 |
|
— |
— |
— |
|
9.2 |
|
3.66 |
|
1.1 |
|
9.2 |
|
3.66 |
|
1.1 |
Porgera underground4 |
|
1.1 |
|
6.79 |
|
0.24 |
|
5.1 |
|
6.25 |
|
1.0 |
|
6.3 |
|
6.34 |
|
1.3 |
Porgera (47.50%) total4 |
|
1.1 |
|
6.79 |
|
0.24 |
|
14 |
|
4.59 |
|
2.1 |
|
15 |
|
4.75 |
|
2.4 |
| Pueblo Viejo surface (60.00%) |
|
14 |
|
2.41 |
|
1.1 |
|
69 |
|
2.29 |
|
5.1 |
|
83 |
|
2.31 |
|
6.2 |
| Veladero surface (50.00%) |
|
11 |
|
0.45 |
|
0.15 |
|
97 |
|
0.78 |
|
2.4 |
|
110 |
|
0.75 |
|
2.6 |
LATIN AMERICA AND ASIA PACIFIC
TOTAL |
140 |
|
0.86 |
|
3.9 |
|
660 |
|
0.88 |
|
19 |
|
810 |
|
0.88 |
|
23 |
NORTH AMERICA |
|
|
|
|
|
|
|
|
|
|
|
|
| Carlin surface |
|
41 |
|
2.62 |
|
3.4 |
|
|
51 |
|
1.89 |
|
3.1 |
|
91 |
|
2.21 |
|
6.5 |
| Carlin underground |
|
12 |
|
9.49 |
|
3.8 |
|
|
6.9 |
|
8.58 |
|
1.9 |
|
19 |
|
9.17 |
|
5.6 |
Carlin (61.50%) total5 |
|
53 |
|
4.22 |
|
7.2 |
|
|
57 |
|
2.69 |
|
5.0 |
|
110 |
|
3.42 |
|
12 |
| Cortez surface |
|
3.6 |
|
1.89 |
|
0.22 |
|
|
49 |
|
1.50 |
|
2.3 |
|
52 |
|
1.52 |
|
2.6 |
Cortez underground6 |
|
0.98 |
|
8.62 |
|
0.27 |
|
|
10 |
|
9.46 |
|
3.1 |
|
11 |
|
9.38 |
|
3.4 |
| Cortez (61.50%) total |
|
4.6 |
|
3.34 |
|
0.49 |
|
|
59 |
|
2.89 |
|
5.5 |
|
64 |
|
2.92 |
|
6.0 |
| Hemlo surface |
|
0.57 |
|
0.77 |
|
0.014 |
|
|
— |
|
— |
|
— |
|
0.57 |
|
0.77 |
|
0.014 |
| Hemlo underground |
|
0.75 |
|
4.97 |
|
0.12 |
|
|
8.3 |
|
5.09 |
|
1.3 |
|
9.0 |
|
5.08 |
|
1.5 |
| Hemlo (100%) total |
|
1.3 |
|
3.15 |
|
0.13 |
|
|
8.3 |
|
5.09 |
|
1.3 |
|
9.6 |
|
4.82 |
|
1.5 |
| Long Canyon surface (61.50%) |
|
0.53 |
|
2.04 |
|
0.035 |
|
|
2.6 |
|
2.24 |
|
0.19 |
|
3.1 |
2.21 |
|
0.22 |
| Phoenix surface (61.50%) |
|
9.5 |
|
0.65 |
|
0.20 |
|
|
86 |
|
0.58 |
|
1.6 |
|
95 |
|
0.58 |
|
1.8 |
| Turquoise Ridge surface |
|
16 |
|
2.15 |
|
1.1 |
|
|
9.9 |
|
1.85 |
|
0.59 |
|
26 |
|
2.03 |
|
1.7 |
| Turquoise Ridge underground |
|
11 |
|
10.85 |
|
3.8 |
|
|
6.1 |
|
11.05 |
|
2.2 |
|
17 |
|
10.92 |
|
6.0 |
| Turquoise Ridge (61.50%) total |
|
27 |
|
5.72 |
|
4.9 |
|
|
16 |
|
5.34 |
|
2.7 |
|
43 |
|
5.58 |
|
7.7 |
NORTH AMERICA
TOTAL |
|
96 |
|
4.22 |
|
13 |
|
|
230 |
|
2.21 |
|
16 |
|
320 |
|
2.80 |
|
29 |
|
|
|
|
|
|
|
|
|
|
|
|
|
TOTAL |
|
280
|
|
2.37
|
|
21
|
|
|
990
|
|
1.46
|
|
47
|
|
1,300
|
|
1.66
|
|
68
|
|
| See “Mineral Reserves and Resources
Endnotes”. |
|
|
|
|
|
|
|
|
|
|
|
|
|
|
|
|
|
|
|
|
|
|
|
|
|
|
|
|
|
|
|
|
|
|
|
|
|
|
|
|
|
|
|
|
|
|
|
|
|
|
|
|
|
|
|
|
|
|
|
|
|
|
|
|
|
|
|
|
|
|
|
|
|
|
|
|
|
|
|
|
|
|
|
|
|
|
|
|
|
|
|
|
|
|
|
|
|
|
|
|
|
|
|
|
|
|
|
|
|
|
|
|
|
|
|
|
|
|
|
|
|
|
|
|
|
|
|
|
|
|
|
|
|
|
|
|
|
|
|
|
|
|
|
|
|
|
|
|
|
|
|
|
|
|
|
| BARRICK YEAR-END 2020 |
113 |
RESERVES AND
RESOURCES |
|
|
|
|
|
|
|
|
|
|
|
|
|
|
|
|
|
|
|
|
|
|
|
|
|
|
|
|
|
|
|
|
|
|
|
|
|
|
|
|
|
|
|
|
|
|
|
|
|
|
|
|
|
|
|
|
|
|
|
|
|
|
|
|
|
|
|
|
|
|
|
|
|
|
|
|
|
|
|
|
|
|
|
|
|
|
|
|
|
|
|
|
|
|
|
|
|
|
|
|
|
|
|
|
|
|
|
|
|
|
|
|
|
|
|
|
|
|
|
|
|
|
|
|
|
|
|
|
|
|
|
|
|
|
|
|
|
|
|
|
|
|
|
|
|
|
|
|
|
|
|
|
|
|
|
|
|
|
|
|
|
|
|
|
|
|
|
|
|
|
|
|
|
|
|
|
|
|
|
|
|
|
|
|
|
|
|
|
|
|
|
|
|
|
|
|
|
|
|
|
|
|
|
|
|
|
|
|
|
|
|
|
|
|
|
|
|
|
|
|
|
|
|
|
|
|
|
|
|
|
|
|
|
|
|
|
|
|
|
|
|
|
|
|
|
|
|
|
|
|
|
|
|
|
|
|
|
|
|
|
|
|
|
|
|
|
|
|
|
|
|
|
|
|
|
|
|
|
|
|
|
|
|
|
|
|
|
|
|
|
|
|
|
|
|
|
|
|
|
|
|
|
|
|
|
|
|
|
|
|
|
|
|
|
|
|
|
|
|
|
|
|
|
|
|
|
|
|
|
Copper Mineral Reserves1,2,3,7 |
|
|
|
|
|
|
|
| As at December 31, 2020 |
PROVEN |
|
PROBABLE |
|
TOTAL |
|
|
Tonnes |
Cu Grade |
Contained Cu |
|
Tonnes |
Cu Grade |
Contained Cu |
|
Tonnes |
Cu Grade |
Contained Cu |
| Based on attributable pounds |
|
(Mt) |
(%) |
(Mlb) |
|
(Mt) |
(%) |
(Mlb) |
|
(Mt) |
(%) |
(Mlb) |
AFRICA AND MIDDLE
EAST |
|
|
|
|
|
|
|
|
|
|
|
|
| Bulyanhulu underground (84.00%) |
|
— |
|
— |
|
— |
|
|
6.9 |
0.51 |
78 |
|
6.9 |
0.51 |
78 |
| Jabal Sayid surface |
|
0.12 |
2.70 |
7.3 |
|
— |
|
— |
|
— |
|
|
0.12 |
2.70 |
7.3 |
| Jabal Sayid underground |
|
5.0 |
2.41 |
260 |
|
7.2 |
2.17 |
350 |
|
12 |
2.26 |
610 |
| Jabal Sayid (50.00%) total |
|
5.1 |
2.42 |
270 |
|
7.2 |
2.17 |
350 |
|
12 |
2.27 |
620 |
| Lumwana surface (100%) |
|
39 |
0.49 |
430 |
|
460 |
0.57 |
5,900 |
|
500 |
0.57 |
6,300 |
AFRICA AND MIDDLE EAST
TOTAL |
|
44
|
0.71 |
700 |
|
480 |
0.60 |
6,300 |
|
520 |
0.61 |
7,000 |
LATIN AMERICA AND ASIA
PACIFIC |
|
|
|
|
|
|
|
|
|
|
| Norte Abierto surface (50.00%) |
|
110 |
0.19 |
480 |
|
480 |
0.23 |
2,400 |
|
600 |
0.22 |
2,900 |
| Zaldívar surface (50.00%) |
|
170 |
0.46 |
1,700 |
|
62 |
0.41 |
560 |
|
230 |
0.45 |
2,300 |
LATIN AMERICA AND ASIA PACIFIC
TOTAL |
|
290 |
0.35 |
2,200 |
|
550 |
0.25 |
3,000 |
|
830 |
0.28 |
5,200 |
NORTH AMERICA |
|
|
|
|
|
|
|
|
|
|
|
|
| Phoenix surface (61.50%) |
|
22 |
0.20 |
97 |
|
110 |
0.17 |
420 |
|
130 |
0.18 |
520 |
NORTH AMERICA
TOTAL |
|
22 |
0.20 |
97 |
|
110 |
0.17 |
420 |
|
130 |
0.18 |
520 |
|
|
|
|
|
|
|
|
|
|
|
|
|
|
|
|
|
|
|
|
|
|
|
|
|
|
TOTAL |
|
350 |
0.39 |
3,000 |
|
|
1,100 |
0.39 |
9,700 |
|
1,500 |
0.39 |
13,000 |
|
|
|
|
|
|
|
|
|
|
|
|
|
| See “Mineral Reserves and Resources
Endnotes”. |
|
|
|
|
|
|
|
|
|
|
|
|
|
|
|
|
|
|
|
|
|
|
|
|
|
|
|
|
|
|
|
|
|
|
|
|
|
|
|
|
|
|
|
|
|
|
|
|
|
|
|
|
|
|
|
|
|
|
|
|
|
|
|
|
|
|
|
|
|
|
|
|
|
|
|
|
|
|
|
|
|
|
|
|
|
|
|
|
|
|
|
|
|
|
|
|
|
|
|
|
|
|
|
|
|
|
|
|
|
Silver Mineral Reserves1,2,3,7 |
|
|
|
|
|
|
|
| As at December 31, 2020 |
PROVEN |
|
PROBABLE |
|
TOTAL |
|
|
Tonnes |
Ag Grade |
Contained Ag |
|
Tonnes |
Ag Grade |
Contained Ag |
|
Tonnes |
Ag Grade |
Contained Ag |
| Based on attributable ounces |
|
(Mt) |
(g/t) |
(Moz) |
|
(Mt) |
(g/t) |
(Moz) |
|
(Mt) |
(g/t) |
(Moz) |
AFRICA AND MIDDLE
EAST |
|
|
|
|
|
|
|
|
|
|
|
|
| Bulyanhulu underground (84.00%) |
|
— |
|
— |
|
— |
|
|
6.9 |
6.27 |
1.4 |
|
6.9 |
6.27 |
1.4 |
AFRICA AND MIDDLE EAST
TOTAL |
|
— |
|
— |
|
— |
|
|
6.9 |
6.27 |
1.4 |
|
6.9 |
6.27 |
1.4 |
|
|
|
|
|
|
|
|
|
|
|
|
|
|
|
|
|
|
|
|
|
|
|
|
|
|
|
|
|
|
|
|
|
|
|
|
|
|
|
LATIN AMERICA AND ASIA PACIFIC |
|
|
|
|
|
|
|
|
|
|
|
|
| Norte Abierto surface (50.00%) |
|
110 |
1.91 |
7.0 |
|
480 |
1.43 |
22 |
|
600 |
1.52 |
29 |
| Pueblo Viejo surface (60.00%) |
|
14 |
12.01 |
5.5 |
|
69 |
15.81 |
35 |
|
83 |
15.16 |
40 |
| Veladero surface (50.00%) |
|
11 |
12.56 |
4.3 |
|
97 |
14.46 |
45 |
|
110 |
14.27 |
50 |
LATIN AMERICA AND ASIA PACIFIC
TOTAL |
|
140 |
3.75 |
17 |
|
650 |
4.91 |
100 |
|
790 |
4.70 |
120 |
NORTH AMERICA |
|
|
|
|
|
|
|
|
|
|
|
|
| Phoenix surface (61.50%) |
|
9.5 |
7.83 |
2.4 |
|
86 |
6.90 |
19 |
|
95 |
6.99 |
21 |
NORTH AMERICA
TOTAL |
|
9.5 |
7.83 |
2.4 |
|
86 |
6.90 |
19 |
|
95 |
6.99 |
21 |
|
|
|
|
|
|
|
|
|
|
|
|
|
TOTAL |
|
150 |
4.01 |
19 |
|
740 |
5.15 |
120 |
|
890 |
4.96 |
140 |
|
|
|
|
|
|
|
|
|
|
|
|
|
| See “Mineral Reserves and Resources
Endnotes”. |
|
|
|
|
|
|
|
|
|
|
|
|
|
|
|
|
|
|
|
|
|
|
|
|
|
|
|
|
|
|
|
|
|
|
|
|
|
|
|
|
|
|
|
|
|
|
|
|
|
|
|
|
|
|
|
|
|
|
|
|
|
|
|
| BARRICK YEAR-END 2020 |
114 |
RESERVES AND
RESOURCES |
|
|
|
|
|
|
|
|
|
|
|
|
|
|
|
|
|
|
|
|
|
|
|
|
|
|
|
|
|
|
|
|
|
|
|
|
|
|
|
|
|
|
|
|
Gold Mineral Resources1,2,3,8,9 |
|
|
|
|
|
|
|
|
|
|
|
| As at December 31, 2020 |
MEASURED
(M)10 |
|
INDICATED
(I)10 |
|
|
(M) +
(I)10 |
|
INFERRED
11 |
|
|
Tonnes |
Grade |
Contained ozs |
|
Tonnes |
Grade |
Contained ozs |
|
|
Contained ozs |
|
Tonnes |
Grade |
Contained ozs |
|
| Based on attributable ounces |
(Mt) |
(g/t) |
(Moz) |
|
(Mt) |
(g/t) |
(Moz) |
|
|
(Moz) |
|
(Mt) |
(g/t) |
(Moz) |
|
AFRICA AND MIDDLE
EAST |
|
|
|
|
|
|
|
|
|
|
|
|
|
|
|
| Bulyanhulu underground (84.00%) |
— |
|
— |
|
— |
|
|
11 |
9.75 |
3.6 |
|
|
3.6 |
|
28 |
7.8 |
7.0 |
|
| Buzwagi surface (84.00%) |
1.7 |
0.76 |
0.042 |
|
3.4 |
1.25 |
0.14 |
|
|
0.18 |
|
— |
|
— |
|
— |
|
|
| Jabal Sayid surface |
0.12 |
0.29 |
0.0012 |
|
— |
|
— |
|
— |
|
|
|
0.0012 |
|
— |
|
— |
|
— |
|
|
| Jabal Sayid underground |
4.6 |
0.21 |
0.031 |
|
9.8 |
0.36 |
0.11 |
|
|
0.14 |
|
2.3 |
0.4 |
0.028 |
|
| Jabal Sayid (50.00%) total |
4.7 |
0.21 |
0.032 |
|
9.8 |
0.36 |
0.11 |
|
|
0.14 |
|
2.3 |
0.4 |
0.028 |
|
| Kibali surface |
5.3 |
2.61 |
0.44 |
|
19 |
2.25 |
1.4 |
|
|
1.8 |
|
2.4 |
2.3 |
0.18 |
|
| Kibali underground |
13 |
4.85 |
2.0 |
|
25 |
4.00 |
3.2 |
|
|
5.1 |
|
5.1 |
3.0 |
0.50 |
|
| Kibali (45.00%) total |
18 |
4.19 |
2.4 |
|
44 |
3.23 |
4.6 |
|
|
7.0 |
|
7.5 |
2.8 |
0.67 |
|
| Loulo-Gounkoto surface |
9.8 |
2.83 |
0.89 |
|
12 |
3.22 |
1.3 |
|
|
2.1 |
|
3.1 |
2.3 |
0.23 |
|
| Loulo-Gounkoto underground |
17 |
4.50 |
2.5 |
|
25 |
5.32 |
4.3 |
|
|
6.9 |
|
16 |
3.4 |
1.7 |
|
| Loulo-Gounkoto (80.00%) total |
27 |
3.90 |
3.4 |
|
38 |
4.64 |
5.6 |
|
|
9.0 |
|
19 |
3.2 |
2.0 |
|
| North Mara surface |
21 |
2.00 |
1.3 |
|
28 |
1.58 |
1.4 |
|
|
2.7 |
|
11 |
1.3 |
0.48 |
|
| North Mara underground |
1.2 |
5.42 |
0.20 |
|
9.0 |
3.41 |
0.99 |
|
|
1.2 |
|
8.3 |
4.4 |
1.2 |
|
| North Mara (84.00%) total |
22 |
2.18 |
1.5 |
|
37 |
2.03 |
2.4 |
|
|
3.9 |
|
20 |
2.6 |
1.6 |
|
| Tongon surface (89.70%) |
4.6 |
1.80 |
0.27 |
|
6.9 |
2.36 |
0.52 |
|
|
0.79 |
|
2.5 |
2.6 |
0.21 |
|
AFRICA AND MIDDLE EAST
TOTAL |
78 |
|
3.07 |
7.7 |
|
|
150 |
3.51 |
17 |
|
|
25 |
|
79 |
4.5 |
11 |
|
LATIN AMERICA AND ASIA
PACIFIC |
|
|
|
|
|
|
|
|
|
|
|
|
|
|
|
| Alturas surface (100%) |
— |
|
— |
|
— |
|
|
— |
|
— |
|
— |
|
|
|
— |
|
|
260 |
1.1 |
8.9 |
|
| Lagunas Norte surface (100%) |
1.4 |
0.94 |
0.043 |
|
57 |
2.31 |
4.2 |
|
|
4.3 |
|
1.4 |
1.1 |
0.050 |
|
| Norte Abierto surface (50.00%) |
190 |
0.63 |
3.9 |
|
1,100 |
0.53 |
19 |
|
|
22 |
|
370 |
0.4 |
4.4 |
|
| Pascua Lama surface (100%) |
43 |
1.86 |
2.6 |
|
390 |
1.49 |
19 |
|
|
21 |
|
15 |
1.7 |
0.86 |
|
Porgera surface4 |
— |
|
— |
|
— |
|
|
20 |
3.21 |
2.0 |
|
|
2.0 |
|
7.6 |
2.5 |
0.60 |
|
Porgera underground4 |
1.2 |
6.66 |
0.27 |
|
8.1 |
6.20 |
1.6 |
|
|
1.9 |
|
2.6 |
6.5 |
0.55 |
|
Porgera (47.50%) total4 |
1.2 |
6.66 |
0.27 |
|
28 |
4.09 |
3.6 |
|
|
3.9 |
|
10 |
3.5 |
1.1 |
|
| Pueblo Viejo surface (60.00%) |
67 |
2.10 |
4.5 |
|
150 |
2.07 |
10 |
|
|
15 |
|
41 |
1.8 |
2.4 |
|
| Veladero surface (50.00%) |
12 |
0.43 |
0.17 |
|
130 |
0.68 |
2.9 |
|
|
3.1 |
|
32 |
0.6 |
0.58 |
|
LATIN AMERICA AND ASIA PACIFIC
TOTAL |
320 |
1.12 |
11 |
|
1,800 |
0.98 |
58 |
|
|
70 |
|
730 |
0.8 |
18 |
|
|
|
|
|
|
|
|
|
|
|
|
|
|
|
|
|
See “Mineral
Reserves and Resources Endnotes”. |
|
|
|
|
|
|
|
|
|
|
|
|
|
|
|
|
|
|
|
|
|
|
|
|
|
|
|
|
|
|
|
|
|
|
|
|
|
|
|
|
|
|
|
|
|
|
|
|
|
|
|
|
|
|
|
|
|
|
|
|
|
|
|
|
|
|
|
|
|
|
|
|
|
|
|
|
|
|
|
|
|
|
|
|
|
|
|
|
|
|
|
|
|
|
|
|
|
|
|
|
|
|
|
|
|
|
|
|
|
|
|
|
|
|
|
|
|
|
|
|
|
|
|
|
|
|
|
|
|
|
|
|
|
|
|
|
|
|
|
|
|
|
|
|
|
|
|
|
|
|
|
|
|
|
|
|
|
|
|
|
|
|
|
|
|
|
|
|
|
|
|
|
|
|
|
|
|
|
|
|
|
|
|
|
|
|
|
|
|
|
|
|
|
|
|
|
|
|
|
|
|
|
|
|
|
|
|
|
|
|
|
|
|
|
|
|
|
|
| BARRICK YEAR-END 2020 |
115 |
RESERVES AND
RESOURCES |
|
|
|
|
|
|
|
|
|
|
|
|
|
|
|
|
|
|
|
|
|
|
|
|
|
|
|
|
|
|
|
|
|
|
|
|
|
|
|
|
|
|
|
|
Gold Mineral Resources1,2,3,8,9 |
|
|
|
|
|
|
|
|
|
|
|
| As at December 31, 2020 |
MEASURED
(M)10 |
|
INDICATED
(I)10 |
|
|
(M) +
(I)10 |
|
INFERRED
11 |
|
|
Tonnes |
Grade |
Contained ozs |
|
Tonnes |
Grade |
Contained ozs |
|
|
Contained ozs |
|
Tonnes |
Grade |
Contained ozs |
|
| Based on attributable ounces |
(Mt) |
(g/t) |
(Moz) |
|
(Mt) |
(g/t) |
(Moz) |
|
|
(Moz) |
|
(Mt) |
(g/t) |
(Moz) |
|
NORTH AMERICA |
|
|
|
|
|
|
|
|
|
|
|
|
|
|
|
| Carlin surface |
49 |
2.45 |
3.9 |
|
140 |
1.50 |
6.8 |
|
|
11 |
|
12 |
1.1 |
0.42 |
|
| Carlin underground |
20 |
8.22 |
5.2 |
|
11 |
7.72 |
2.7 |
|
|
7.9 |
|
5.1 |
7.3 |
1.2 |
|
Carlin (61.50%) total5 |
69 |
4.09 |
9.0 |
|
150 |
1.94 |
9.5 |
|
|
19 |
|
17 |
3.0 |
1.6 |
|
| Cortez surface |
4.2 |
1.88 |
0.25 |
|
94 |
1.23 |
3.7 |
|
|
4.0 |
|
46 |
0.5 |
0.75 |
|
Cortez underground6 |
1.3 |
8.11 |
0.34 |
|
35 |
7.11 |
7.9 |
|
|
8.2 |
|
13 |
6.3 |
2.7 |
|
| Cortez (61.50%) total |
5.5 |
3.36 |
0.59 |
|
130 |
2.82 |
12 |
|
|
12 |
|
59 |
1.8 |
3.4 |
|
| Donlin surface (50.00%) |
3.9 |
2.52 |
0.31 |
|
270 |
2.24 |
19 |
|
|
20 |
|
46 |
2.0 |
3.0 |
|
| Fourmile underground (100%) |
— |
|
— |
|
— |
|
|
1.4 |
10.22 |
0.47 |
|
|
0.47 |
|
6.6 |
10.9 |
2.3 |
|
| Hemlo surface |
0.57 |
|
0.77 |
|
0.014 |
|
|
27 |
0.90 |
0.77 |
|
|
0.79 |
|
5.4 |
0.9 |
0.15 |
|
| Hemlo underground |
1.2 |
4.72 |
0.18 |
|
14 |
5.10 |
2.4 |
|
|
2.5 |
|
4.0 |
5.7 |
0.74 |
|
| Hemlo (100%) total |
1.7 |
3.42 |
0.19 |
|
41 |
2.37 |
3.1 |
|
|
3.3 |
|
9.4 |
3.0 |
0.90 |
|
| Long Canyon surface |
0.94 |
2.45 |
0.074 |
|
9.5 |
2.52 |
0.77 |
|
|
0.84 |
|
2.9 |
1.5 |
0.14 |
|
| Long Canyon underground |
0.083 |
11.84 |
0.032 |
|
|
0.99 |
9.76 |
0.31 |
|
|
0.34 |
|
0.13 |
7.4 |
0.031 |
|
| Long Canyon (61.50%) total |
1.0 |
3.21 |
0.11 |
|
10 |
3.21 |
1.1 |
|
|
1.2 |
|
3.0 |
1.7 |
0.17 |
|
| Phoenix surface (61.50%) |
17 |
0.56 |
0.30 |
|
180 |
0.50 |
3.0 |
|
|
3.3 |
|
14 |
0.4 |
0.21 |
|
| Turquoise Ridge surface |
27 |
2.13 |
1.8 |
|
24 |
1.97 |
1.5 |
|
|
3.4 |
|
10 |
1.8 |
0.60 |
|
| Turquoise Ridge underground |
13 |
10.92 |
4.5 |
|
7.3 |
10.95 |
2.6 |
|
|
7.1 |
|
1.8 |
10.1 |
0.58 |
|
| Turquoise Ridge (61.50%) total |
39 |
4.98 |
6.3 |
|
32 |
4.05 |
4.1 |
|
|
10 |
|
12 |
3.0 |
1.2 |
|
NORTH AMERICA
TOTAL |
140 |
3.83 |
17 |
|
820 |
1.99 |
52 |
|
|
69 |
|
170 |
2.4 |
13 |
|
|
|
|
|
|
|
|
|
|
|
|
|
|
|
|
|
|
|
|
|
|
|
|
|
|
|
|
|
|
|
|
|
|
|
|
|
|
|
|
|
|
|
|
|
|
|
|
|
|
|
|
|
|
|
|
|
|
|
|
|
|
|
|
|
|
|
|
|
|
|
|
|
|
|
|
|
|
|
|
|
|
|
|
|
|
|
|
|
|
|
|
|
|
|
|
|
|
|
|
|
|
|
|
|
|
|
|
|
|
|
|
|
TOTAL |
530 |
2.11 |
36 |
|
2,800 |
1.41 |
130 |
|
|
160 |
|
980 |
1.4 |
43 |
|
|
|
|
|
|
|
|
|
|
|
|
|
|
|
|
|
|
|
See “Mineral
Reserves and Resources Endnotes”. |
|
|
|
|
|
|
|
|
|
|
|
|
|
|
|
|
|
|
|
|
|
|
|
|
|
|
|
|
|
|
|
|
|
|
|
|
|
|
|
|
|
|
|
|
|
|
|
|
|
|
|
|
|
|
|
|
|
|
|
|
|
|
|
|
|
|
|
|
|
|
|
|
|
|
|
|
|
|
|
|
|
|
|
|
|
|
|
|
|
|
|
|
|
|
|
|
|
|
|
|
|
|
|
|
|
|
|
|
|
|
|
|
|
|
|
|
|
|
|
|
|
|
|
|
|
|
|
|
|
|
|
| BARRICK YEAR-END 2020 |
116 |
RESERVES AND
RESOURCES |
|
|
|
|
|
|
|
|
|
|
|
|
|
|
|
|
|
|
|
|
|
|
|
|
|
|
|
|
|
|
|
|
|
|
|
|
|
|
|
|
|
|
|
|
|
Copper Mineral Resources1,3,7,8,9 |
|
|
|
|
|
|
|
|
|
| As at December 31, 2020 |
MEASURED
(M)10 |
|
INDICATED
(I)10 |
|
(M) +
(I)10 |
|
INFERRED
11 |
|
|
Tonnes |
Grade |
Contained lbs |
|
Tonnes |
Grade |
Contained lbs |
|
Contained lbs |
|
Tonnes |
Grade |
Contained lbs |
| Based on attributable pounds |
|
(Mt) |
(%) |
(Mlb) |
|
(Mt) |
(%) |
(Mlb) |
|
(Mlb) |
|
(Mt) |
(%) |
(Mlb) |
AFRICA AND MIDDLE
EAST |
|
|
|
|
|
|
|
|
|
|
|
|
|
|
| Bulyanhulu underground (84.00%) |
|
— |
|
— |
|
— |
|
|
11 |
0.49 |
120 |
|
120 |
|
28 |
0.5 |
280 |
| Jabal Sayid surface |
|
0.12 |
2.70 |
7.3 |
|
— |
|
— |
|
— |
|
|
7.3 |
|
— |
|
— |
|
— |
|
| Jabal Sayid underground |
|
4.6 |
2.73 |
280 |
|
9.8 |
2.35 |
510 |
|
790 |
|
2.3 |
1.6 |
79 |
| Jabal Sayid (50.00%) total |
|
4.7 |
2.73 |
280 |
|
9.8 |
2.35 |
510 |
|
790 |
|
2.3 |
1.6 |
79 |
| Lumwana surface (100%) |
|
56 |
0.50 |
620 |
|
970 |
0.54 |
11,000 |
|
12,000 |
|
1.5 |
0.4 |
12 |
AFRICA AND MIDDLE EAST
TOTAL |
|
61 |
0.67 |
900 |
|
990 |
0.55 |
12,000 |
|
13,000 |
|
32 |
0.5 |
370 |
LATIN AMERICA AND ASIA
PACIFIC |
|
|
|
|
|
|
|
|
|
|
|
|
|
|
| Norte Abierto surface (50.00%) |
|
170 |
0.21 |
790 |
|
1,000 |
0.21 |
4,700 |
|
5,500 |
|
360 |
0.2 |
1,400 |
| Zaldívar surface (50.00%) |
|
330 |
0.40 |
2,900 |
|
270 |
0.38 |
2,300 |
|
5,200 |
|
31 |
0.4 |
270 |
LATIN AMERICA AND ASIA PACIFIC
TOTAL |
|
500 |
0.33 |
3,700 |
|
1,300 |
0.24 |
7,000 |
|
11,000 |
|
390 |
0.2 |
1,700 |
NORTH AMERICA |
|
|
|
|
|
|
|
|
|
|
|
|
|
|
| Phoenix surface (61.50%) |
|
40 |
0.18 |
160 |
|
240 |
0.15 |
820 |
|
970 |
|
21 |
0.1 |
68 |
NORTH AMERICA
TOTAL |
|
40 |
0.18 |
160 |
|
240 |
0.15 |
820 |
|
970 |
|
21 |
0.1 |
68 |
|
|
|
|
|
|
|
|
|
|
|
|
|
|
|
TOTAL |
|
600 |
0.36 |
4,800 |
|
2,500 |
0.36 |
20,000 |
|
25,000 |
|
440 |
0.2 |
2,200 |
|
|
|
|
|
|
|
|
|
|
|
|
|
|
|
|
See “Mineral
Reserves and Resources Endnotes”. |
|
|
|
|
|
|
|
|
|
|
|
|
|
|
|
|
|
|
|
|
|
|
|
|
|
|
|
|
|
|
|
|
|
|
|
|
|
|
|
|
|
|
|
|
|
|
|
|
|
|
|
|
|
|
|
|
|
|
|
|
|
|
|
|
| BARRICK YEAR-END 2020 |
117 |
RESERVES AND
RESOURCES |
|
|
|
|
|
|
|
|
|
|
|
|
|
|
|
|
|
|
|
|
|
|
|
|
|
|
|
|
|
|
|
|
|
|
|
|
|
|
|
|
|
|
|
|
|
Silver Mineral Resources1,3,7,8,9 |
|
|
|
|
|
|
|
|
|
| As at December 31, 2020 |
MEASURED
(M)10 |
|
INDICATED
(I)10 |
|
(M) +
(I)10 |
|
INFERRED
11 |
|
|
Tonnes |
Ag Grade |
Contained Ag |
|
Tonnes |
Ag Grade |
Contained Ag |
|
Contained Ag |
|
Tonnes |
Ag Grade |
Contained Ag |
| Based on attributable ounces |
|
(Mt) |
(g/t) |
(Moz) |
|
(Mt) |
(g/t) |
(Moz) |
|
(Moz) |
|
(Mt) |
(g/t) |
(Moz) |
AFRICA AND MIDDLE
EAST |
|
|
|
|
|
|
|
|
|
|
|
|
|
|
| Bulyanhulu underground (84.00%) |
|
— |
|
— |
|
— |
|
|
11 |
7.45 |
2.7 |
|
2.7 |
|
28 |
7.1 |
6.3 |
AFRICA AND MIDDLE EAST
TOTAL |
|
— |
|
— |
|
— |
|
|
11 |
|
7.45 |
2.7 |
|
|
2.7 |
|
|
28 |
|
7.1 |
6.3 |
|
LATIN AMERICA AND ASIA
PACIFIC |
|
|
|
|
|
|
|
|
|
|
|
|
|
|
| Lagunas Norte surface (100%) |
|
1.4 |
2.69 |
0.12 |
|
57 |
5.40 |
9.9 |
|
10 |
|
1.4 |
3.5 |
0.16 |
| Norte Abierto surface (50.00%) |
|
190 |
1.62 |
10 |
|
1,100 |
1.23 |
43 |
|
53 |
|
370 |
1.0 |
11 |
| Pascua-Lama surface (100%) |
|
43 |
57.21 |
79 |
|
390 |
52.22 |
660 |
|
740 |
|
15 |
17.8 |
8.8 |
| Pueblo Viejo surface (60.00%) |
|
67 |
10.62 |
23 |
|
150 |
11.96 |
59 |
|
82 |
|
41 |
7.8 |
10 |
| Veladero surface (50.00%) |
|
12 |
12.05 |
4.8 |
|
130 |
13.90 |
60 |
|
65 |
|
32 |
14.2 |
15 |
LATIN AMERICA AND ASIA PACIFIC
TOTAL |
|
320 |
11.49 |
120 |
|
1,800 |
|
14.20 |
830 |
|
950 |
|
460 |
3.1 |
45 |
NORTH AMERICA |
|
|
|
|
|
|
|
|
|
|
|
|
|
|
| Phoenix surface (61.50%) |
|
16 |
7.01 |
3.7 |
|
180 |
6.28 |
37 |
|
41 |
|
14 |
5.9 |
2.6 |
NORTH AMERICA
TOTAL |
|
16 |
7.01 |
3.7 |
|
180 |
|
6.28 |
37 |
|
41 |
|
14 |
5.9 |
2.6 |
|
|
|
|
|
|
|
|
|
|
|
|
|
|
|
|
|
|
|
|
|
|
|
|
|
|
|
|
|
|
TOTAL |
|
330 |
11.27 |
120 |
|
2,000 |
|
13.44 |
870 |
|
990 |
|
500 |
3.4 |
54 |
|
|
|
|
|
|
|
|
|
|
|
|
|
|
|
|
See “Mineral
Reserves and Resources Endnotes”. |
|
|
|
|
|
|
|
|
|
|
|
|
|
|
|
|
|
|
|
|
|
|
|
|
|
|
|
|
|
|
|
|
|
|
|
|
|
|
|
|
|
|
|
|
|
|
|
|
|
|
|
|
|
|
|
|
|
|
|
|
|
|
| BARRICK YEAR-END 2020 |
118 |
RESERVES AND
RESOURCES |
|
|
|
|
|
|
|
|
|
|
|
|
|
|
|
|
|
|
|
|
|
|
|
|
|
|
|
Summary Gold Mineral
Reserves1,2,3 |
| For the years ended December
31 |
2020 |
2019 |
|
Ownership |
Tonnes |
Grade |
Ounces |
Ownership |
Tonnes |
Grade |
Ounces |
| Based on attributable ounces |
% |
(Mt) |
(g/t) |
(Moz) |
% |
(Mt) |
(g/t) |
(Moz) |
AFRICA AND MIDDLE
EAST |
|
|
|
|
|
|
|
|
Bulyanhulu surface12 |
84.00% |
— |
|
— |
— |
|
84.00% |
1.1 |
|
1.19 |
0.041 |
|
|
|
|
|
|
|
|
Bulyanhulu underground12 |
84.00% |
6.9 |
|
8.92 |
2.0 |
|
84.00% |
6.4 |
|
10.70 |
2.2 |
|
|
|
|
|
|
|
|
Bulyanhulu Total12 |
84.00% |
6.9 |
|
8.92 |
2.0 |
|
84.00% |
7.5 |
|
9.34 |
2.2 |
|
Buzwagi surface12 |
84.00% |
1.7 |
|
0.76 |
0.042 |
|
84.00% |
5.1 |
|
0.84 |
0.14 |
|
|
|
|
|
|
|
|
|
|
|
|
|
|
|
|
|
|
|
| Jabal Sayid surface |
50.00% |
12 |
|
0.23 |
0.090 |
|
50.00% |
13 |
|
0.24 |
0.097 |
|
| Kibali surface |
45.00% |
14 |
|
2.47 |
1.1 |
|
45.00% |
11 |
|
2.92 |
0.99 |
|
|
|
|
|
|
|
|
| Kibali underground |
45.00% |
20 |
|
4.81 |
3.1 |
|
45.00% |
20 |
|
4.87 |
3.2 |
|
|
|
|
|
|
|
|
Kibali Total |
45.00% |
34 |
|
3.84 |
4.2 |
|
45.00% |
31 |
|
4.20 |
4.2 |
|
Loulo-Gounkoto surface |
80.00% |
17 |
|
3.21 |
1.7 |
|
80.00% |
18 |
|
3.28 |
1.9 |
|
|
|
|
|
|
|
|
| Loulo-Gounkoto underground |
80.00% |
31 |
|
4.93 |
5.0 |
|
80.00% |
27 |
|
5.16 |
4.5 |
|
|
|
|
|
|
|
|
| Loulo-Gounkoto Total |
80.00% |
48 |
|
4.33 |
6.7 |
|
80.00% |
45 |
|
4.41 |
6.4 |
|
North Mara surface12 |
84.00% |
18 |
|
1.44 |
0.85 |
|
84.00% |
15 |
|
1.49 |
0.73 |
|
|
|
|
|
|
|
|
North Mara underground12 |
84.00% |
7.3 |
|
5.01 |
1.2 |
|
84.00% |
5.8 |
|
5.40 |
1.0 |
|
|
|
|
|
|
|
|
North Mara Total12 |
84.00% |
26 |
|
2.46 |
2.0 |
|
84.00% |
21 |
|
2.57 |
1.7 |
|
| Tongon surface |
89.70% |
9.3 |
|
1.92 |
0.57 |
|
89.70% |
8.9 |
|
2.14 |
0.61 |
|
|
|
|
|
|
|
|
Massawa surface13 |
|
|
|
|
83.25% |
17 |
|
3.94 |
2.2 |
|
AFRICA AND MIDDLE EAST
TOTAL |
|
140 |
3.52 |
16 |
|
|
150 |
|
3.69 |
18 |
|
LATIN AMERICA AND ASIA
PACIFIC |
|
|
|
|
|
|
|
|
| Lagunas Norte |
100% |
— |
|
— |
|
— |
|
100% |
— |
|
— |
|
— |
|
| Norte Abierto surface |
50.00% |
600 |
|
0.60 |
|
12 |
50.00% |
600 |
|
0.60 |
|
12.0 |
Porgera surface4 |
47.50% |
9.2 |
|
3.66 |
|
1.1 |
47.50% |
8.5 |
|
3.63 |
|
0.99 |
Porgera underground4 |
47.50% |
6.3 |
|
6.34 |
|
1.3 |
47.50% |
6.6 |
|
6.33 |
|
1.3 |
Porgera Total4 |
47.50% |
15 |
|
4.75 |
|
2.4 |
47.50% |
15 |
|
4.81 |
|
2.3 |
| Pueblo Viejo surface |
60.00% |
83 |
|
2.31 |
|
6.2 |
60.00% |
71 |
|
2.49 |
|
5.7 |
| Veladero surface |
50.00% |
110 |
|
0.75 |
|
2.6 |
50.00% |
120 |
|
0.73 |
|
2.8 |
LATIN AMERICA AND ASIA PACIFIC
TOTAL |
|
810 |
|
0.88 |
|
23 |
|
810 |
|
0.87 |
|
22 |
NORTH AMERICA |
|
|
|
|
|
|
|
|
Carlin surface5 |
61.50% |
91 |
|
2.21 |
|
6.5 |
|
61.50% |
100 |
|
2.15 |
|
7.1 |
Carlin Underground5 |
61.50% |
19 |
|
9.17 |
|
5.6 |
|
61.50% |
19 |
|
9.59 |
|
5.9 |
Carlin Total5 |
61.50% |
110 |
|
3.42 |
|
12 |
|
61.50% |
120 |
|
3.32 |
|
13.0 |
| Cortez surface |
61.50% |
52 |
|
1.52 |
|
2.6 |
|
61.50% |
57 |
|
1.35 |
|
2.5 |
Cortez Underground6 |
61.50% |
11 |
|
9.38 |
|
3.4 |
|
61.50% |
11 |
|
9.91 |
|
3.6 |
| Cortez Total |
61.50% |
64 |
|
2.92 |
|
6.0 |
|
61.50% |
69 |
|
2.77 |
|
6.1 |
| Hemlo surface |
100% |
0.57 |
|
0.77 |
|
0.014 |
|
100% |
1.6 |
|
1.28 |
|
0.066 |
| Hemlo underground |
100% |
9.0 |
|
5.08 |
|
1.5 |
|
100% |
9.0 |
|
4.37 |
|
1.3 |
| Hemlo Total |
100% |
9.6 |
|
4.82 |
|
1.5 |
|
100% |
11 |
|
3.90 |
|
1.3 |
| Long Canyon surface |
61.50% |
3.1 |
|
2.21 |
|
0.22 |
|
61.50% |
4.9 |
|
2.48 |
|
0.39 |
| Phoenix surface |
61.50% |
95 |
|
0.58 |
|
1.8 |
|
61.50% |
100 |
|
0.59 |
|
2.0 |
| Turquoise Ridge surface |
61.50% |
26 |
|
2.03 |
|
1.7 |
|
61.50% |
34 |
|
1.95 |
|
2.1 |
| Turquoise Ridge underground |
61.50% |
17 |
|
10.92 |
|
6.0 |
|
61.50% |
18 |
|
10.90 |
|
6.2 |
| Turquoise Ridge Total |
61.50% |
43 |
|
5.58 |
|
7.7 |
|
61.50% |
51 |
|
5.02 |
|
8.3 |
NORTH AMERICA
TOTAL |
|
320 |
|
2.80 |
|
29 |
|
|
360 |
|
2.68 |
|
31 |
|
|
|
|
|
|
|
|
|
TOTAL |
|
1,300 |
|
1.66 |
68 |
|
|
1,300 |
|
1.68 |
|
71 |
|
|
|
|
|
|
|
|
|
See “Mineral Reserves and Resources
Endnotes”. |
|
|
|
|
|
|
|
|
|
|
|
|
|
|
| BARRICK YEAR-END 2020 |
119 |
RESERVES AND
RESOURCES |
Mineral Reserves and Resources Endnotes
1.Mineral
reserves (“reserves”) and mineral resources (“resources”) have been estimated as at December 31, 2020 (unless otherwise noted) in accordance with National Instrument 43-101 - Standards of Disclosure for Mineral
Projects (“NI 43-101”) as required by Canadian securities regulatory authorities. For United States reporting purposes, the SEC has adopted amendments to its disclosure rules to modernize the mineral property disclosure requirements for
issuers whose securities are registered with the SEC under the Securities and Exchange Act of 1934, as amended (the “Exchange Act”). These amendments became effective February 25, 2019 (the “SEC Modernization Rules”) with
compliance required for the first fiscal year beginning on or after January 1, 2021. The SEC Modernization Rules replace the historical property disclosure requirements for mining registrants that were included in SEC Industry Guide 7, which will be
rescinded from and after the required compliance date of the SEC Modernization Rules. As a result of the adoption of the SEC Modernization Rules, the SEC now recognizes estimates of “measured”, “indicated” and
“inferred” mineral resources. In addition, the SEC has amended its definitions of “proven mineral reserves” and “probable mineral reserves” to be substantially similar to the corresponding Canadian Institute of
Mining, Metallurgy and Petroleum definitions, as required by NI 43-101. U.S. investors should understand that “inferred” mineral resources have a great amount of uncertainty as to their existence and great uncertainty as to their
economic and legal feasibility. In addition, U.S. investors are cautioned not to assume that any part or all of Barrick’s mineral resources constitute or will be converted into reserves. Mineral resource and mineral reserve estimations have
been prepared by employees of Barrick, its joint venture partners or its joint venture operating companies, as applicable, under the supervision of regional Mineral Resource Managers Simon Bottoms, Africa & Middle East Mineral Resource Manager
and Chad Yuhasz, Latin America & Australia Pacific Mineral Resource Manager, Craig Fiddes, North America Resource Modeling Manager and reviewed by Rodney Quick, Barrick Executive Mineral Resource Management and Evaluation.
Reserves have been estimated based on an assumed gold price of US$1,200 per ounce, an assumed silver price of US$16.50 per ounce, and an assumed copper price of US$2.75 per pound and long-term average exchange rates of 1.30 CAD/US$. Reserve
estimates incorporate current and/or expected mine plans and cost levels at each property. Varying cut-off grades have been used depending on the mine and type of ore contained in the reserves. Barrick’s normal data verification
procedures have been employed in connection with the calculations. Verification procedures include industry-standard quality control practices. Resources as at December 31, 2020 have been estimated using varying cut-off grades, depending
on both the type of mine or project, its maturity and ore types at each property.
2.In confirming
our annual reserves for each of our mineral properties, projects, and operations, we conduct a reserve test on December 31 of each year to verify that the future undiscounted cash flow from reserves is positive. The cash flow ignores all sunk
costs and only considers future operating and closure expenses as well as any future capital costs.
3.All mineral
resource and mineral reserve estimates of tonnes, Au oz, Ag oz and Cu lb are reported to the second significant digit.
4.Porgera
mineral reserves and mineral resources are reported on a 47.5% interest basis, reflecting Barrick’s undisputed ownership position prior to April 24, 2020, and the ownership position Barrick is asserting in its legal proceedings in Papua New
Guinea court. On August 16, 2019, the special mining lease (the “SML”) at Porgera was terminated and on April 24, 2020, the Government of Papua New Guinea indicated that the SML would not be extended. On October 15, 2020, Barrick Niugini
Limited and Prime Minister Marape issued a joint press release indicating that they had productive discussions toward mutually acceptable arrangements for a new Porgera partnership to reopen and operate the mine going forward. It further indicated
that the parties had agreed in principle that Papua New Guinea will take a major share of equity under the new arrangements, BNL will retain operatorship, and there will be a fair sharing of the economic benefits. Efforts to reach a memorandum of
agreement to make these concepts and additional points binding are ongoing and, at this time, it is not certain when a binding memorandum of agreement will be reached by the parties or what the final terms will be (including Barrick’s
percentage ownership interest in the Porgera mine). BNL remains in possession of the mine to conduct care and maintenance. For additional information, see page 36 of Barrick’s Fourth Quarter and Year End Report
2020.
5.Includes South Arturo on a 36.9% basis.
6.Cortez underground includes 3.9 million tonnes at 9.69 g/t for 1.2 million ounces of probable reserves, 26 million tonnes at
6.57 g/t for 5.5 million ounces of indicated resources and 12 million tonnes at 6.2 g/t for 2.5 million ounces of inferred resources related to Goldrush. As noted in endnote #8, mineral resources are reported on an inclusive
basis.
7.2020 polymetallic mineral resources and mineral reserves are estimated using the combined value of gold, copper & silver and
accordingly are reported as Gold, Copper & Silver mineral resources and mineral reserves.
8.Mineral
resources which are not mineral reserves do not have demonstrated economic viability.
9.Mineral
resources are reported inclusive of mineral reserves.
10.All measured
and indicated mineral resource estimates of grade and all proven and probable mineral reserve estimates of grade for Au g/t, Ag g/t and Cu % are reported to two decimal
places.
11.All inferred mineral resource estimates of grade for Au g/t, Ag g/t and Cu % are reported to one decimal
place.
12.Formerly known as Acacia Mining plc. On September 17, 2019, Barrick acquired all of the shares of Acacia it did not already own,
bringing its ownership of Bulyanhulu, North Mara, and Buzwagi up from 63.9% to 100%. On January 24, 2020, Barrick announced the signing of an agreement with the Government of Tanzania (“GoT”), through which, among other things, the GoT
acquired a 16% free-carried interest in these sites, made effective January 1, 2020. For convenience, Barrick is reporting the 2019 mineral reserves and resources at 84% ownership interest.
13.On March 4, 2020, Barrick sold its interest in Massawa to Teranga Gold Corporation. For additional information, see page 36 of
Barrick’s Fourth Quarter and Year End Report 2020.
|
|
|
|
|
|
|
|
|
| BARRICK YEAR-END 2020 |
120 |
RESERVES AND
RESOURCES |