BARRICK MINING CORPORATION
ANNUAL INFORMATION FORM
TABLE OF CONTENTS
| GLOSSARY OF TECHNICAL AND BUSINESS TERMS | 4 | |||
| REPORTING CURRENCY, FINANCIAL AND RESERVE INFORMATION | 10 | |||
| FORWARD-LOOKING INFORMATION | 12 | |||
| SCIENTIFIC AND TECHNICAL INFORMATION | 14 | |||
| GENERAL INFORMATION | 15 | |||
| Organizational Structure |
15 | |||
| Subsidiaries |
16 | |||
| Areas of Interest |
18 | |||
| General Development of the Business |
18 | |||
| History |
18 | |||
| Strategy |
18 | |||
| Results of Operations in 2025 |
21 | |||
| NARRATIVE DESCRIPTION OF THE BUSINESS | 25 | |||
| Production and Guidance |
25 | |||
| Reportable Operating Segments |
25 | |||
| Nevada Gold Mines (61.5% basis) |
26 | |||
| Carlin |
26 | |||
| Cortez |
27 | |||
| Turquoise Ridge |
27 | |||
| Other Mines - Nevada Gold Mines |
28 | |||
| Pueblo Viejo (60% basis) |
28 | |||
| Loulo-Gounkoto (80% basis) |
29 | |||
| Kibali (45% basis) |
29 | |||
| North Mara (84% basis) |
30 | |||
| Bulyanhulu (84% basis) |
30 | |||
| Other Mines (Gold) |
30 | |||
| Lumwana |
31 | |||
| Other Mines (Copper) |
31 | |||
| Mineral Reserves and Mineral Resources |
32 | |||
| Marketing and Distribution |
47 | |||
| Employees and Labor Relations |
48 | |||
| Competition |
48 | |||
| Sustainability |
49 | |||
| Operations in Emerging Markets: Corporate Governance and Internal Controls |
53 | |||
- i -
| Board and Management Experience and Oversight |
54 | |||
| Local Presence |
54 | |||
| Internal Controls and Cash Management Practices |
55 | |||
| MATERIAL PROPERTIES | 56 | |||
| Cortez Property |
56 | |||
| Carlin Complex |
62 | |||
| Turquoise Ridge Complex |
70 | |||
| Pueblo Viejo Mine |
76 | |||
| Kibali Mine |
84 | |||
| Reko Diq Project |
92 | |||
| Lumwana |
100 | |||
| LEGAL MATTERS | 108 | |||
| Legal Proceedings and Regulatory Actions |
108 | |||
| RISK FACTORS | 111 | |||
| MANAGEMENT’S DISCUSSION AND ANALYSIS OF FINANCIAL CONDITION AND RESULTS OF OPERATIONS |
135 | |||
| CONSOLIDATED FINANCIAL STATEMENTS | 135 | |||
| CAPITAL STRUCTURE | 135 | |||
| RATINGS | 136 | |||
| MARKET FOR SECURITIES | 137 | |||
| MATERIAL CONTRACTS | 137 | |||
| TRANSFER AGENTS AND REGISTRARS | 140 | |||
| DIVIDEND POLICY | 140 | |||
| SHARE BUYBACK PROGRAM | 140 | |||
| DIRECTORS AND OFFICERS OF THE COMPANY | 141 | |||
| AUDIT & RISK COMMITTEE | 148 | |||
| Audit & Risk Committee Mandate |
148 | |||
| Composition of the Audit & Risk Committee |
148 | |||
| Relevant Education and Experience |
149 | |||
| Participation on Other Audit Committees |
150 | |||
- ii -
| Audit & Risk Committee Pre-Approval Policies and Procedures |
150 | |||
| External Auditor Service Fees |
150 | |||
| INTERNAL CONTROL OVER FINANCIAL REPORTING AND DISCLOSURE CONTROLS AND PROCEDURES | 150 | |||
| NON-GAAP FINANCIAL MEASURES | 151 | |||
| INTERESTS OF EXPERTS | 156 | |||
| ADDITIONAL INFORMATION | 156 | |||
| SCHEDULE “A” AUDIT & RISK COMMITTEE MANDATE | A-1 | |||
- iii -
GLOSSARY OF TECHNICAL AND BUSINESS TERMS
Assay
A chemical analysis to determine the amount or proportion of the element of interest contained within a sample, typically base metals or precious metals.
Autoclave
Oxidation process in which high temperatures and oxygen are applied within a highly pressurized closed vessel to convert refractory sulfide mineralization into amenable oxide ore.
By-product
A secondary metal or mineral product recovered in the milling process such as silver.
Carbonaceous
Naturally occurring carbon present in the ore from the decay of organic material which can result in an inadvertent loss of precious metals during the cyanidation process.
Carbon-in-Column (“CIC”)
A gold recovery process whereby a pregnant solution is passed though columns filled with carbon to adsorb gold.
Carbon-in-leach (“CIL”)
A recovery process in which precious metals are dissolved from finely ground ore during cyanidation and simultaneously adsorbed on relatively coarse activated carbon (burnt coconut shell) granules. The loaded carbon particles are separated from the slurry and recycled in the process following precious metal removal and reactivation through chemical and thermal means.
Carbon-in-pulp (“CIP”)
A pump-cell process whereby a series of stirred tanks are used to mix gold-containing slurry with activated carbon so the gold can adsorb to the carbon. The gold is first dissolved in a cyanide solution and as the slurry moves from one pump-cell to the next, the dissolved gold is gradually adsorbed onto the carbon. This type of system makes it easier to control how long the slurry stays in the tanks (residence time), how much carbon is used, and how the slurry flows, which is commonly used in large gold processing plants.
Class 1 - High Significance Environmental Incident
An incident that causes significant negative impacts on human health or the environment, or an incident that extends onto publicly accessible land and has the potential to cause significant adverse impact to surrounding communities, livestock or wildlife.
Class 2 - Medium Significance Environmental Incident
An incident that has the potential to cause negative impacts on human health or the environment but is reasonably anticipated to result in only localized and short-term environmental or community impact requiring minor remediation.
Concentrate
A very fine, powder-like product containing the valuable ore mineral from which most of the waste mineral has been eliminated.
Contained ounces
A measure of in-situ or contained metal based on an estimate of tonnage and grade (used in the calculation of ore reserves).
- 4 -
Crushing
A unit operation that reduces the size of material delivered as run of mine ore for further processing.
Cut-off grade
A calculated minimum metal grade at which material can be mined and processed at break-even cost.
Development
Work carried out for the purpose of gaining access to an ore body. In an underground mine, this includes shaft sinking, crosscutting, drifting and raising. In an open-pit mine, development includes the removal of overburden (more commonly referred to as stripping in an open pit).
Dilution
The effect of waste or low-grade ore which is unavoidably extracted and comingled with the ore mined thereby lowering the recovered grade from what was planned to be mined.
Doré
Unrefined gold and silver bullion bars usually consisting of approximately 90 percent precious metals that will be further refined to almost pure metal.
Drift
A horizontal tunnel generally driven within or alongside an orebody and aligned parallel to the long dimension of the ore.
Drift-and-fill
A method of underground mining used for flat-lying mineralization or where ground conditions are less competent.
Drilling
Core: drilling with a hollow bit with a diamond cutting rim to produce a cylindrical core that is used for geological study and assays.
Reverse circulation: drilling that uses a rotating cutting bit within a double-walled drill pipe and produces rock chips rather than core. Air or water is circulated down to the bit between the inner and outer wall of the drill pipe. The chips are forced to the surface through the center of the drill pipe and are collected, examined and assayed.
Conventional rotary: a drilling method that produces rock chips similar to reverse circulation except that the sample is collected using a single-walled drill pipe. Air or water circulates down through the center of the drill pipe and returns chips to the surface around the outside of the pipe.
In-fill: drilling closer spaced holes in between existing holes, used to provide greater geological detail and to help upgrade resource estimates to reserve estimates.
Step-out: drilling to intersect a mineralized horizon or structure along strike or down-dip.
Exploration
Prospecting, sampling, mapping, drilling and other work involved in searching for minerals.
Flotation
A process that concentrates minerals by taking advantage of specific surface properties and applying chemicals such as collectors, depressants, modifiers and frothers in the presence of water and finely dispersed air bubbles.
- 5 -
Grade
The concentration of an element of interest expressed as relative mass units (percentage, parts per million, ounces per ton, grams per tonne, etc.).
Grinding (Milling)
Involves the size reduction of material fed to a process plant though abrasion or attrition to liberate valuable minerals for further metallurgical processing.
Heap leaching
A process whereby gold/copper is extracted by “heaping” broken ore on sloping impermeable pads and continually applying to the heaps a weak cyanide solution/sulfuric acid which dissolves the contained gold/copper. The gold/copper-laden solution is then collected for gold/copper recovery.
Lode
A mineral deposit, consisting of a zone of veins, veinlets or disseminations, in consolidated rock as opposed to a placer deposit.
Long-hole open stoping
A method of underground mining involving the drilling of holes up to 30 meters or longer into an ore bearing zone and then blasting a slice of rock which falls into an open space. The broken rock is extracted and the resulting open chamber may or may not be back filled with supporting material.
Lost Time Injury Frequency Rate (“LTIFR”)
LTIFR is a ratio calculated as follows: number of lost time injuries x 1,000,000 hours divided by the total number of hours worked.
Ma
Mega-annums (each mega-annum, equals one million years).
Metric conversion
| Troy ounces |
× |
31.10348 |
= |
Grams | ||||
| Troy ounces per short ton |
× |
34.28600 |
= |
Grams per tonne | ||||
| Pounds |
× |
0.00045 |
= |
Tonnes | ||||
| Tons |
× |
0.90718 |
= |
Tonnes | ||||
| Feet |
× |
0.30480 |
= |
Meters | ||||
| Miles |
× |
1.60930 |
= |
Kilometers | ||||
| Acres |
× |
0.40468 |
= |
Hectares | ||||
| Fahrenheit |
(°F-32) × 5 ÷ 9 |
= |
Celsius | |||||
Mill
A processing facility where ore is finely ground and thereafter undergoes physical or chemical treatment to extract the valuable metals.
Mineral reserve (“Reserve”)
The economically mineable portion of a measured or indicated mineral resource demonstrated by at least a preliminary feasibility study. This study must include adequate information on mining, processing, metallurgical, economic and other relevant factors that demonstrate, at the time of reporting, that economic extraction can be justified. A mineral reserve includes diluting materials and allowances for losses that may occur when the material is mined. Mineral reserves are sub-divided in order of increasing confidence into probable mineral reserves and proven mineral reserves.
- 6 -
Probable mineral reserve: the economically mineable portion of an indicated and, in some circumstances, a measured mineral resource demonstrated by at least a preliminary feasibility study. This study must include adequate information on mining, processing, metallurgical, economic and other relevant factors that demonstrate, at the time of reporting, that economic extraction can be justified.
Proven mineral reserve: the economically mineable part of a measured mineral resource demonstrated by at least a preliminary feasibility study. This study must include adequate information on mining, processing, metallurgical, economic and other relevant factors that demonstrate, at the time of reporting, that economic extraction is justified.
Mineral resource (“Resource”)
A concentration or occurrence of diamonds, natural solid inorganic material, or natural solid fossilized organic material including base and precious metals, coal, and industrial minerals in or on the earth’s crust in such form and quantity and of such a grade or quality that it has reasonable prospects for economic extraction. The location, quantity, grade, geological characteristics and continuity of a mineral resource are known, estimated or interpreted from specific geological evidence and knowledge. Mineral resources are sub-divided, in order of increasing geological confidence, into inferred, indicated and measured categories.
Inferred mineral resource: that part of a mineral resource for which quantity and grade or quality can be estimated on the basis of geological evidence, limited sampling and reasonably assumed, but not verified, geological and grade continuity. The estimate is based on limited information and sampling gathered through appropriate techniques from locations such as outcrops, trenches, pits, workings and drill holes.
Indicated mineral resource: that part of a mineral resource for which quantity, grade or quality, densities, shape and physical characteristics can be estimated with a level of confidence sufficient to allow the appropriate application of technical and economic parameters to support mine planning and evaluation of the economic viability of the deposit. The estimate is based on detailed and reliable exploration and testing information gathered through appropriate techniques from locations such as outcrops, trenches, pits, workings and drill holes that are spaced closely enough for geological and grade continuity to be reasonably assumed.
Measured mineral resource: that part of a mineral resource for which quantity, grade or quality, densities, shape and physical characteristics are so well-established that they can be estimated with confidence sufficient to allow the appropriate application of technical and economic parameters to support production planning and evaluation of the economic viability of the deposit. The estimate is based on detailed and reliable exploration, sampling and testing information gathered through appropriate techniques from locations such as outcrops, trenches, pits, workings and drill holes that are spaced closely enough to confirm both geological and grade continuity.
Mineralization
The presence of a target mineral in a mass of host rock.
Mining claim
A footprint of land that a party has staked or marked out in accordance with applicable mining laws to acquire the right to explore for and, in most instances, exploit the minerals under the surface.
Net profits interest royalty
A royalty based on the profit remaining after recapture of certain operating, capital and other costs.
Net smelter return royalty
- 7 -
A royalty based on a percentage of valuable minerals produced with settlement made either in kind or in currency based on the sale proceeds received less all of the offsite smelting, refining and transportation costs associated with the purification of the economic metals.
Open pit mine
A mine where materials are mined entirely from the surface.
Ore
Material containing metallic or non-metallic minerals that can be mined and processed at a profit.
Orebody
A sufficiently large amount of ore that is contiguous and can be mined economically.
Oxide ore
Mineralized rock in which some of the host rock or original mineralization has been exposed to oxygen and mineralization is thus more amenable to extraction.
Qualified Person
See “Scientific and Technical Information”.
Reclamation
The process by which lands disturbed as a result of mining activity are modified to support beneficial land use. Reclamation activity may include the removal of buildings, equipment, machinery and other physical remnants of mining, closure of tailings storage facilities, leach pads and other mine features, and contouring, covering and re-vegetation of waste rock and other disturbed areas.
Reclamation and closure costs
The cost of reclamation plus other costs, including without limitation certain personnel costs, insurance, property holding costs such as taxes, rental and claim fees, and community programs associated with closing an operating mine.
Recovery rate
A term used in process metallurgy to indicate the proportion of valuable material physically recovered in the processing of ore. It is generally stated as a percentage of the material recovered compared to the total material originally contained in the ore.
Refining
The final stage of metal production in which impurities are removed from a molten metal.
Refractory material
Mineralized material from which metal is not amenable to recovery by conventional cyanide methods without any pre-treatment. The refractory nature can be due to either silica or sulfide encapsulation of the metal or the presence of naturally occurring carbon or other constituents that reduce gold recovery.
Roasting
The treatment of sulfide ore by heat and air, or oxygen enriched air, in order to oxidize sulfides and remove other elements (carbon, antimony or arsenic).
Safe Closure
A closed tailings facility that does not pose ongoing material risks to people or the environment which has been confirmed by an Independent Tailings Review Board or senior independent technical reviewer and signed off by an Accountable Executive as defined by the Global Industry Standard on Tailings Management.
- 8 -
Shaft
A vertical passageway to an underground mine for ventilation, moving personnel, equipment, supplies and material including ore and waste rock.
Strategic Asset
An asset which, in the opinion of Barrick, has the potential to deliver significant unrealized value in the future.
Stripping
Removal of overburden or waste rock overlying an ore body in preparation for mining by open-pit methods.
Tailings
The material that remains after economically and technically recoverable metals have been removed from ore during processing.
Tailings storage facility (“TSF”)
An area constructed for long term storage of material that remains after processing.
Tier One Copper Asset/Project
An asset with a $3.00 per pound reserve with potential for five million tonnes or more of contained copper in support of at least 20 years life, annual production of at least 200,000 tonnes per annum, with costs per pound in the lower half of the industry cost curve. Tier One Assets must be located in a world class geological district with potential for organic reserve growth and long-term geologically driven addition.
Tier One Gold Asset
An asset with a $1,400 per ounce reserve with potential to deliver a minimum 10-year life, annual production of at least 500,000 ounces of gold and with costs per ounce in the lower half of the industry cost curve. Tier One Assets must be located in a world class geological district with potential for organic reserve growth and long-term geologically driven addition.
Tier Two Gold Asset
An asset with a reserve with potential to deliver a minimum 10-year life, annual production of at least 250,000 ounces of gold and total cash costs per ounce over the mine life that are in the lower half of the industry cost curve.
Tons
Short tons (2,000 pounds or approximately 907 kilograms).
Tonnes
Metric tonnes (1,000 kilograms or approximately 2,205 pounds).
Total Recordable Injury Frequency Rate (“TRIFR”)
TRIFR is a ratio calculated as follows: number of reportable injuries x 1,000,000 hours divided by the total number of hours worked. Reportable injuries include fatalities, lost time injuries, restricted duty injuries, and medically treated injuries.
Underhand drift-and-fill
A drift-and-fill method of underground mining that works downward, with cemented fill placed above the working area; best suited where ground conditions are less competent.
- 9 -
REPORTING CURRENCY, FINANCIAL AND RESERVE INFORMATION
All currency amounts in this Annual Information Form are expressed in United States dollars, unless otherwise indicated. References to “C$” are to Canadian dollars. References to “ARS” are to Argentine pesos. For Canadian dollars to U.S. dollars, the average exchange rate for 2025 and the exchange rate as at December 31, 2025 were one Canadian dollar per 0.72 and 0.73 U.S. dollars, respectively. For Argentine pesos to U.S. dollars, the average exchange rate for 2025 and the exchange rate as at December 31, 2025 were one U.S. dollar per 1,246.50 and 1,451.62 Argentine pesos, respectively.
For the year ended December 31, 2025 and for the comparative prior periods identified in this Annual Information Form, Barrick Mining Corporation (“Barrick” or the “Company”) prepared its financial statements in accordance with IFRS Accounting Standards as issued by the International Accounting Standards Board (“IFRS”). The audited consolidated financial statements of the Company for the year ended December 31, 2025 (the “Consolidated Financial Statements”) are available electronically from the Canadian System for Electronic Document Analysis and Retrieval (“SEDAR+”) at www.sedarplus.ca and from the U.S. Securities and Exchange Commission’s (the “SEC”) Electronic Document Gathering and Retrieval System (“EDGAR”) at www.sec.gov.
Mineral reserves and mineral resources presented in this Annual Information Form have been estimated as at December 31, 2025 (unless otherwise noted) in accordance with National Instrument 43-101 – Standards of Disclosure for Mineral Projects (“National Instrument 43-101”), as required by Canadian securities regulatory authorities. Barrick’s resources are reported on an inclusive basis and include all areas that form reserves. For United States reporting purposes, Barrick is permitted to use its Canadian disclosures under the SEC’s multi-jurisdictional disclosure system (“MJDS”). This includes reporting its reserve and resource disclosures pursuant to National Instrument 43-101, to satisfy certain United States periodic reporting obligations. As a result, Barrick does not report its reserves and resources under the SEC disclosure rules, and as such, Barrick’s mineral reserve and mineral resource disclosure may not be directly comparable to the disclosures made by domestic United States issuers or non-domestic United States issuers that do not rely on MJDS. However, as a result of the SEC’s adoption of modernized mineral property disclosure rules in 2019, the SEC requirements and definitions are substantially similar to those under NI 43-101 and of the Canadian Institute of Mining, Metallurgy and Petroleum (“CIM”), including in respect of “measured”, “indicated” and “inferred” mineral resources, and “proven” and “probable” mineral reserves. For more information, see Note 1 of “Notes to the Barrick Mineral Reserves and Resources Tables” in “Narrative Description of the Business – Mineral Reserves and Mineral Resources”.
Investors are also cautioned that while National Instrument 43-101 and subpart 1300 of SEC Regulation S-K recognize “measured mineral resources”, “indicated mineral resources” and “inferred mineral resources”, investors should not assume that any part or all of the mineral deposits in these categories will ever be converted into a higher category of mineral resources or into mineral reserves. These terms have a great amount of uncertainty as to their economic and legal feasibility. Accordingly, investors are cautioned not to assume that any “measured mineral resources”, “indicated mineral resources”, or “inferred mineral resources” of Barrick are or will be economically or legally mineable. Further, “inferred mineral resources” have a great amount of uncertainty as to their existence and as to whether they can be mined legally or economically. In accordance with Canadian rules, estimates of “inferred mineral resources” cannot form the basis of feasibility or other economic studies, except in limited circumstances where permitted under National Instrument 43-101.
Barrick uses certain non-GAAP financial performance measures in its financial reports, including total cash costs per ounce, all-in sustaining costs per ounce, all-in costs per ounce, C1 cash costs per pound and all-in sustaining costs per pound. For a description and reconciliation of each of these measures, please see pages 57 to 74 of Barrick’s Management’s Discussion and Analysis of Financial and Operating Results for the year ended December 31, 2025 (the “MD&A”), available electronically from SEDAR+ and
- 10 -
EDGAR. See also “Non-GAAP Financial Measures” at pages 151 to 155 below for a detailed discussion of each of the non-GAAP measures used in this Annual Information Form.
- 11 -
FORWARD-LOOKING INFORMATION
Certain information contained in this Annual Information Form, including any information as to Barrick’s strategy, projects, plans or future financial or operating performance, constitutes “forward-looking statements”. All statements, other than statements of historical fact, are forward-looking statements. The words “believe”, “expect”, “anticipate”, “contemplate”, “vision”, “target”, “plan”, “opportunities”, “objective”, “pursuit”, “assume”, “goal”, “aim”, “intend”, “intention”, “project”, “continue”, “budget”, “ongoing”, “estimate”, “potential”, “strategy”, “prospective”, “following”, “future”, “commitment”, “ramp-up”, “guidance”, “outlook”, “forecast”, “may”, “will”, “can”, “could”, “should”, “schedule”, “would” and similar expressions identify forward-looking statements. Forward-looking statements are necessarily based upon a number of estimates and assumptions related to the factors set forth below that, while considered reasonable by Barrick as at the date of this Annual Information Form in light of management’s experience and perception of current conditions and expected developments, are inherently subject to significant business, economic and competitive uncertainties and contingencies. Known and unknown factors could cause actual results to differ materially from those projected in the forward-looking statements and undue reliance should not be placed on such statements and information. Such factors include, but are not limited to:
| • | fluctuations in the spot and forward price of gold, copper or certain other commodities (such as silver, diesel fuel, natural gas and electricity); |
| • | risks associated with projects in the early stages of evaluation and for which additional engineering and other analysis is required; |
| • | risks related to the possibility that future exploration results will not be consistent with the Company’s expectations, that quantities or grades of reserves will be diminished, and that resources may not be converted to reserves; |
| • | risks associated with the fact that certain of the initiatives described in this Annual Information Form are still in the early stages and may not materialize; |
| • | risks associated with the proposed initial public offering of a Barrick entity and any corporate reorganization associated therewith; |
| • | changes in mineral production performance, exploitation and exploration successes; |
| • | risks that exploration data may be incomplete and considerable additional work may be required to complete further evaluation, including but not limited to drilling, engineering and socioeconomic studies and investment; |
| • | the speculative nature of mineral exploration and development; |
| • | lack of certainty with respect to foreign legal systems, corruption and other factors that are inconsistent with the rule of law; |
| • | changes in national and local government legislation, taxation, controls or regulations and/or changes in the administration of laws, policies, and practices, including changes in U.S. trade, tariff and other controls on imports and exports, tax, immigration or other policies that may impact relations with other countries, result in retaliatory policies, lead to increased costs and/or limited availability for raw materials, components and equipment, or impact Barrick’s existing operations and growth projects; |
| • | expropriation or nationalization of property and political or economic developments in Canada, the United States, Argentina, Chile, the Dominican Republic, the Democratic Republic of the Congo (the “DRC”), Ecuador, Jamaica, Mali, Pakistan, Papua New Guinea, Peru, Saudi Arabia, Senegal, Tanzania, or Zambia or other countries in which Barrick does or may carry on business in the future; |
| • | risks relating to political instability in certain of the jurisdictions in which Barrick operates; |
| • | timing of receipt of, or failure to comply with, necessary permits and approvals; |
| • | non-renewal of key licenses by governmental authorities; |
| • | failure to comply with environmental and health and safety laws and regulations; |
- 12 -
| • | increased costs and physical and transition risks related to climate change, including extreme weather events, resource shortages, emerging policies and increased regulations relating to greenhouse gas (“GHG”) emissions levels, energy efficiency and reporting of risks related to climate change; |
| • | the Company’s ability to achieve its sustainability goals, including its climate-related goals and GHG emissions reduction targets, in particular its ability to achieve its Scope 3 emissions targets which requires reliance on entities within Barrick’s value chain, but outside of the Company’s direct control, to achieve such targets within the specified time frames; |
| • | contests over title to properties, particularly title to undeveloped properties, or over access to water, power and other required infrastructure; |
| • | the liability associated with risks and hazards in the mining industry, and the ability to maintain insurance to cover such losses; |
| • | damage to Barrick’s reputation due to the actual or perceived occurrence of any number of events, including negative publicity with respect to Barrick’s handling of environmental matters or dealings with individuals or community groups, whether true or not; |
| • | risks relating to operations near communities that may regard Barrick’s operations as being detrimental to them; |
| • | litigation and legal and administrative proceedings; |
| • | operating or technical difficulties in connection with mining or development activities, including geotechnical challenges, tailings dam and storage facilities failures, and disruptions in the maintenance or provision of required infrastructure and information technology systems; |
| • | increased costs, delays, suspensions and technical challenges associated with the construction of capital projects; |
| • | risks associated with working with partners in jointly controlled assets; |
| • | risks relating to disruption of supply routes which may cause delays in construction and mining activities, including disruptions in the supply of key mining inputs due to the invasion of Ukraine by Russia and conflicts in the Middle East, and sanctions imposed on individuals and entities as a result thereof; |
| • | risk of loss due to acts of war, terrorism, sabotage and civil disturbances; |
| • | risks associated with artisanal and illegal mining; |
| • | risks associated with Barrick infrastructure, information technology systems and the implementation of Barrick’s technological initiatives, including risks related to cybersecurity incidents, including those caused by computer viruses, malware, ransomware and other cyberattacks, or similar information technology system failures, delays and/or disruptions; |
| • | the impact of global liquidity and credit availability on the timing of cash flows and the values of assets and liabilities based on projected future cash flows; |
| • | the impact of inflation, including global inflationary pressures driven by ongoing global supply chain disruptions and global energy cost increases following the invasion of Ukraine by Russia and country-specific political and economic factors in Argentina; |
| • | adverse changes in the Company’s credit ratings; |
| • | risks related to exchange and capital controls; |
| • | fluctuations in the currency markets (such as Canadian and Australian dollars, Chilean, Argentine and Dominican pesos, British pound, Peruvian sol, Zambian kwacha, South African rand, Tanzanian shilling, West African CFA, Congolese franc, Papua New Guinean kina and Pakistani rupee versus the U.S. dollar); |
| • | changes in U.S. dollar interest rates that could impact the mark-to-market value of outstanding derivative instruments and variable rate debt obligations; |
| • | risks arising from holding derivative instruments (such as credit risk, market liquidity risk and mark-to-market risk); |
- 13 -
| • | risks related to the demands placed on the Company’s management, the ability of management to implement its business strategy and enhanced political risk in certain jurisdictions; |
| • | uncertainty as to whether some or all of Barrick’s targeted investments and projects will meet the Company’s capital allocation objectives and internal hurdle rate; |
| • | whether benefits expected from recent transactions are realized; |
| • | business opportunities that may be presented to, or pursued by, the Company; |
| • | the Company’s ability to successfully integrate acquisitions or complete divestitures; |
| • | risks related to competition in the mining industry; |
| • | employee relations, including loss of key employees; |
| • | availability and increased costs associated with mining inputs and labor; |
| • | risks associated with diseases, epidemics and pandemics; |
| • | risks related to the failure of internal controls; and |
| • | risks related to the impairment of the Company’s goodwill and assets. |
In addition, there are risks and hazards associated with the business of mineral exploration, development and mining, including environmental hazards, industrial accidents, unusual or unexpected formations, pressures, cave-ins, flooding and gold bullion, copper cathode or gold or copper concentrate losses (and the risk of inadequate insurance, or inability to obtain insurance, to cover these risks). Many of these uncertainties and contingencies can affect the Company’s actual results and could cause actual results to differ materially from those expressed or implied in any forward-looking statements made by, or on behalf of, the Company. Readers are cautioned that forward-looking statements are not guarantees of future performance. All of the forward-looking statements made in this Annual Information Form are qualified by these cautionary statements. Specific reference is made to “Narrative Description of the Business – Mineral Reserves and Mineral Resources” and “Risk Factors” and to the MD&A (which is available on SEDAR+ at www.sedarplus.ca and on EDGAR at www.sec.gov as an exhibit to Barrick’s Form 40-F) for a discussion of some of the factors underlying forward-looking statements and the risks that may affect Barrick’s ability to achieve the expectations set forth in the forward-looking statements contained in this Annual Information Form.
The Company may, from time to time, make oral forward-looking statements. The Company advises that the above paragraph and the risk factors described in this Annual Information Form and in the Company’s other documents filed with the Canadian securities regulatory authorities and the SEC should be read for a description of certain factors that could cause the actual results of the Company to materially differ from those in the oral forward-looking statements. The Company disclaims any intention or obligation to update or revise any oral or written forward-looking statements whether as a result of new information, future events or otherwise, except as required by applicable law.
SCIENTIFIC AND TECHNICAL INFORMATION
Unless otherwise indicated, scientific or technical information in this Annual Information Form relating to mineral reserves or mineral resources is based on information prepared by employees of Barrick, its joint venture partners or its joint venture operating companies, as applicable, in each case under the supervision of, or following review by: Tricia Evans, BSc, SMERM, Head of Mineral Resource Management, North America; Mark Roux, BSc (Hons), P. Grad. Cert. (Geostatistics), Pr. Sci. Nat, Evaluations Manager, Resource Geology, North America; Richard Peattie, FAusIMM, Senior Vice President, Technical, Africa and Middle East; Peter Jones, MAIG, Manager Resource Geology, South America and Asia Pacific; and Joel Holliday, FAusIMM, Executive Vice-President, Exploration.
Scientific or technical information in this Annual Information Form relating to the geology of particular properties and exploration programs is based on information prepared by employees of Barrick, its joint
- 14 -
venture partners or its joint venture operating companies, as applicable, in each case under the supervision of Joel Holliday, FAusIMM, Executive Vice-President, Exploration.
Each of Messrs. Roux, Peattie, Jones and Holliday and Ms. Evans is a “Qualified Person” as defined in National Instrument 43-101. A “Qualified Person” is an individual who is an engineer or geoscientist with at least five years of experience in mineral exploration, mine development or operation or mineral project assessment, or any combination of these, has experience relevant to the subject matter of the mineral project, and is a member in good standing of a professional association.
Each of Messrs. Roux, Peattie, Jones and Holliday and Ms. Evans is an officer or employee of Barrick and/or an officer, director or employee of one or more of its associates or affiliates. No such person has received or will receive a direct or indirect interest in any property of Barrick or any of its associates or affiliates. As of the date hereof, each such person owns beneficially, directly or indirectly, less than 1% of any outstanding class of securities of Barrick and less than 1% of any outstanding class of securities of Barrick’s associates or affiliates.
GENERAL INFORMATION
Organizational Structure
Barrick is a company governed by the Business Corporations Act (British Columbia) (“BCBCA”). Barrick resulted from the amalgamation, effective July 14, 1984, of Camflo Mines Limited, Bob-Clare Investments Limited and the former Barrick Resources Corporation pursuant to the Business Corporations Act (Ontario) (the “OBCA”). By articles of amendment effective December 9, 1985, the Company changed its name to American Barrick Resources Corporation. Effective January 1, 1995, as a result of an amalgamation with a wholly-owned subsidiary, the Company changed its name from American Barrick Resources Corporation to Barrick Gold Corporation. On December 7, 2001, in connection with its acquisition of Homestake Mining Company, the Company amended its articles to create a special voting share designed to permit holders of Barrick Gold Inc. (formerly Homestake Canada Inc.) (“BGI”) exchangeable shares to vote as a single class with the holders of Barrick common shares. In March 2009, in connection with Barrick’s redemption of all of the outstanding BGI exchangeable shares, the single outstanding special voting share was redeemed and cancelled. In connection with its acquisition of Placer Dome Inc. (“Placer Dome”), Barrick amalgamated with Placer Dome pursuant to articles of amalgamation dated May 9, 2006. In connection with the acquisition of Arizona Star Resource Corp. (“Arizona Star”), Barrick amalgamated with Arizona Star pursuant to articles of amalgamation dated January 1, 2009. On November 27, 2018, pursuant to a continuation application, Barrick continued from the Province of Ontario under the OBCA into the Province of British Columbia under the BCBCA. The notice of articles and articles of Barrick under the BCBCA are substantially similar to Barrick’s previous articles and by-laws. Key changes include a bifurcated approach to amendments to the articles where a special resolution is required for certain matters and an ordinary resolution is required for other matters; authorizing only one class of an unlimited number of common shares (preferred share classes are no longer authorized); and a reduction of the notice period to hold shareholder meetings following the fixing of record dates. On May 6, 2025, following receipt of shareholder approval, the Company changed its name to Barrick Mining Corporation. Barrick’s registered office is located at 1600 - 925 West Georgia Street, Vancouver, British Columbia V6C 3L2. Barrick’s principal corporate offices are located at Brookfield Place, TD Canada Trust Tower, 161 Bay Street, Suite 3700, Toronto, Ontario M5J 2S1, and 310 South Main Street, Suite 1150, Salt Lake City, Utah 84101.
Barrick’s business is organized into operating segments for financial reporting purposes, comprising fourteen individual minesites. For the year ended December 31, 2025, Barrick’s reportable operating segments were comprised of eight gold mines, Carlin, Cortez, Turquoise Ridge, Pueblo Viejo, Loulo-Gounkoto, Kibali, North Mara and Bulyanhulu, and one copper mine, Lumwana. For financial reporting purposes, the Company’s remaining operating segments that are not reportable operating segments are grouped into an “other” category and are not reported on individually. Barrick’s material properties
- 15 -
presented in this Annual Information Form are: Cortez, Carlin, Turquoise Ridge, Pueblo Viejo, Kibali, the Reko Diq Project and Lumwana. See “Narrative Description of the Business – Reportable Operating Segments” and “Material Properties”.
Subsidiaries
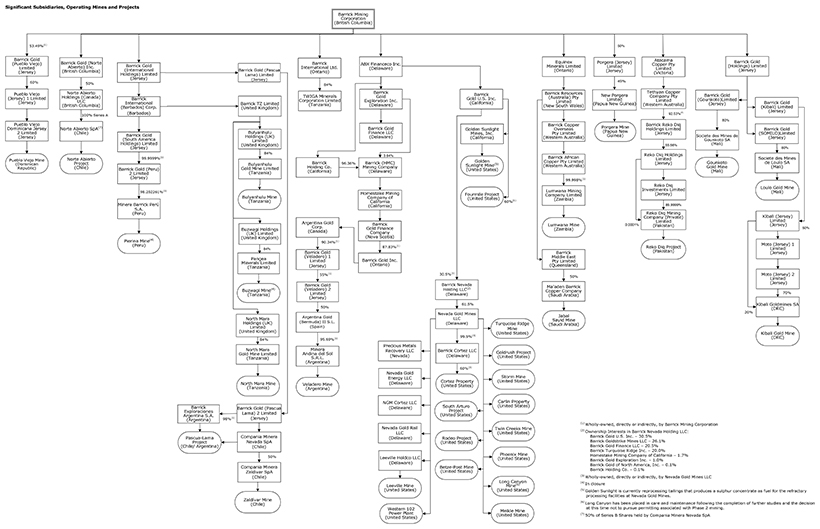
A significant portion of Barrick’s business is carried on through its subsidiaries. A chart showing Barrick’s mines, projects, related operating subsidiaries, other significant subsidiaries and certain associated subsidiaries as at February 23, 2026 and their respective locations or jurisdictions of incorporation, as applicable, is set out below. All subsidiaries, mines and projects referred to in the chart are 100% owned, unless otherwise noted.
- 16 -
- 17 -
Areas of Interest
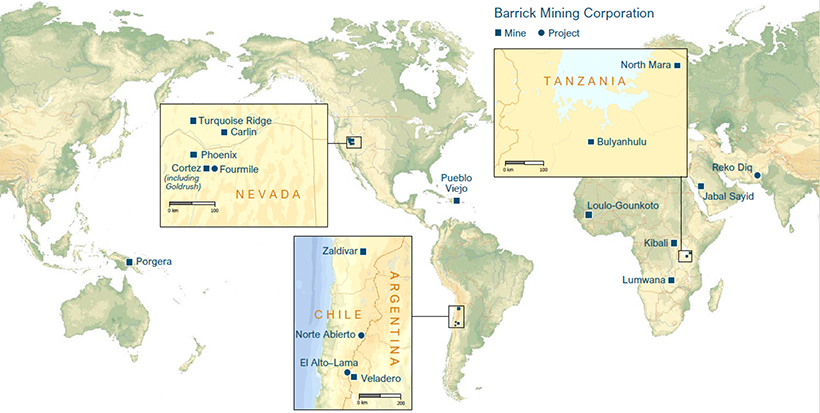
A map showing Barrick’s mining operations and projects as at February 23, 2026 is set out at the end of this “General Information” section.
General Development of the Business
History
Barrick entered the gold mining business in 1983 and is a leading international gold company with operations on five continents. The Company has interests in operating mines, projects or exploration projects in Canada, the United States, Argentina, Chile, the Dominican Republic, the DRC, Ecuador, Jamaica, Mali, Pakistan, Papua New Guinea, Peru, Saudi Arabia, Senegal, Tanzania and Zambia. The Company’s principal products and sources of earnings are gold and copper.
Strategy
Barrick’s vision is to be the world’s most valued gold and copper mining business by finding, developing and owning the best assets, with the best people, to deliver the best returns and benefits to all its stakeholders. The Company’s strategy is to operate as business owners by attracting and developing world-class people who understand and are involved in the value chain of the business, act with integrity and are tireless in their pursuit of excellence. Barrick is focused on returns to its stakeholders by optimizing free cash flow, managing risk to create long-term value and generate returns for the Company’s shareholders and partnering with host governments and communities to transform their country’s natural resources into sustainable benefits and mutual prosperity. The Company aims to achieve this through continuously improving asset quality, pursuing operational excellence and maintaining a focus on sustainable profitability.
Asset Quality
Barrick aims to deliver on its vision by growing and investing in a portfolio of Tier One Gold Assets, Tier One Copper Assets/Projects, Tier Two Gold Assets, and Strategic Assets, with an emphasis on organic growth to leverage the Company’s existing footprint in world class geological districts. In 2025, over 50% of Barrick’s gold production came from North America. The Company is focusing its efforts on identifying, investing in and developing assets that meet Barrick’s investment criteria. The required internal rate of return (“IRR”) on Tier One capital investments is 15%, adjusting to 10% return on long-life (20+ year) investments with exposure to multiple commodity cycles. The required IRR on investment for Tier Two Gold Assets is 20%. All projects are evaluated against Barrick’s investment filters, which incorporate a broad range of technical, financial, environmental, safety, partnership and social license to operate criteria. In addition, all major projects undergo a peer review process culminating in review by the Executive Committee to confirm that the project is broadly supported across the organization, with identified gaps substantially addressed, and that there is appropriate confidence for a development decision.
Near-term portfolio priorities include advancing key growth projects at Nevada Gold Mines, Fourmile, the development of the new Naranjo TSF at Pueblo Viejo as part of the mine life expansion project, and the commencement of construction on the Lumwana Super Pit Expansion Project.
Barrick also aims to deliver returns to its stakeholders by maximizing the long-term value of the Company’s strategic copper business, which currently consists of Lumwana, Reko Diq, Jabal Sayid, Zaldívar and Norte Abierto. Barrick’s exploration programs strike a balance between high-quality brownfield projects, greenfield exploration and emerging discoveries that have the potential to pass Barrick’s investment filters. In line with Barrick’s focus on growing its exploration portfolio, the Company is expanding its extensive land position in many of the world’s most prolific gold districts, while also exploring and growing Barrick’s strategic copper business.
- 18 -
The Company’s brownfields exploration focus has delivered significant value in 2025, driven by strong results from exploration at Nevada Gold Mines (Greater Leeville, Robertson, Cortez Hills underground and Turquoise Ridge), Fourmile, Pueblo Viejo, the Veladero district and Kibali. Barrick has also identified exploration upside potential around all of these projects and further upside at Kibali, North Mara, Bulyanhulu, Lumwana and Reko Diq. At the same time, Barrick is continually evaluating prospective third-party projects with the potential to become profitable mines under Barrick’s stewardship.
Barrick’s portfolio also contains a number of undeveloped greenfield gold and copper deposits, providing further optionality and leverage to gold and copper prices. These include Norte Abierto and El Alto-Lama (formerly, Pascua-Lama).
For additional information regarding Barrick’s growth projects, exploration programs and new discoveries, see “Material Properties – Cortez Property”; “Material Properties – Carlin Complex”; “Material Properties – Turquoise Ridge Complex”; “Material Properties – Pueblo Viejo Mine”; “Material Properties – Kibali Mine”; “Material Properties – Reko Diq Project”; and “Material Properties – Lumwana”.
In addition, the Company is continually focused on portfolio optimization, which includes selling non-core assets over time in a disciplined manner. In 2025, the Company completed the sale of various non-core assets for gross proceeds and value of approximately $2.6 billion which have reinforced Barrick’s strategy of maintaining a concentrated Tier One Asset portfolio. For additional information regarding these transactions, see “Operational Excellence and Sustainable Profitability” below. Barrick will continue to pursue sales of non-core assets that are not aligned with the Company’s strategic investment filters. Barrick will only proceed with transactions that make sense for the business, on terms management considers favorable to Barrick’s shareholders.
Operational Excellence and Sustainable Profitability
Barrick has implemented a flat management structure with a strong ownership culture by streamlining management and operations and holding management accountable for the businesses they manage. The Company aims to leverage innovation and technology to drive industry-leading efficiencies, and is striving to achieve a zero harm workplace.
The Company is focused on building trust-based partnerships with host governments, business partners, and local communities to drive shared long-term value. Barrick is taking a disciplined approach to growth, emphasizing long-term value for all stakeholders. In so doing, the Company aims to increase returns to shareholders, driven by a focus on return on capital, IRR and free cash flow.
The Company seeks to maintain a robust balance sheet. Barrick has reduced its total debt in recent years to a balance of $4.7 billion and a net debt to total capitalization ratio of (0.06):1 as at December 31, 2025. Barrick’s focus on strengthening its balance sheet has given the Company the financial strength to fund its organic growth options. As at December 31, 2025, Barrick had approximately $6.7 billion in cash, an undrawn $3.0 billion credit facility and no significant debt repayments due until 2033, providing the Company with sufficient liquidity to execute on its strategic goals.
Driving an ownership culture across the Company is another key element of Barrick’s strategy. The Company maintains a Share Purchase Plan to provide a simple and accessible way for those who work at Barrick to purchase Barrick common shares, fostering a culture of ownership across the organization.
Barrick carried out the following initiatives in 2023, 2024, 2025 and 2026 to date to optimize its portfolio, strengthen its balance sheet and deliver value to all of its stakeholders:
| • | Following the reconstitution of the Reko Diq Project in December 2022, the Reko Diq feasibility study was completed in late 2024. For more information, see “Material Properties – Reko Diq Project”. |
- 19 -
| • | On December 22, 2023, following the granting of the new Special Mining Lease (“SML”) to New Porgera Limited, Barrick formally completed the Porgera Project Commencement Agreement (the “Commencement Agreement”), pursuant to which the Independent State of Papua New Guinea (“PNG”) and Barrick Niugini Limited (“BNL”), the 95% owner and operator of the former Porgera joint venture, agreed on a partnership for the future ownership and operation of the mine. Barrick now holds a 24.5% ownership interest in the Porgera joint venture and a 23.5% interest in the economic benefits of the mine under the economic benefit sharing arrangement agreed with the PNG government. Mining and processing restarted at Porgera in January and February 2024, respectively. |
| • | In 2023, approximately $43 million of the $850 million principal amount 5.950% notes due 2039 issued by Barrick (PD) Australia Finance Pty Ltd. (the “BPDAF 2039 Notes”) were repaid pursuant to open market repurchases. In 2025, approximately $2 million of the BPDAF 2039 Notes were repaid pursuant to open market repurchases. For more details, see “Material Contracts”. |
| • | Barrick’s Board of Directors has authorized an annual share buyback program for each of 2023, 2024 and 2025 for the repurchase of up to $1 billion of Barrick’s outstanding common shares over the relevant 12 month period (each, a “Repurchase Program”). Barrick did not repurchase any shares under the 2023 Repurchase Program, repurchased $498 million of shares under the 2024 Repurchase Program and repurchased $1.5 billion of shares under the 2025 Repurchase Program following an increase of the original limit to $1.5 billion by the Board of Directors in November 2025. For more information, see “Share Buyback Program”. |
| • | On May 6, 2025, Barrick’s shareholders approved the change of the Company’s corporate name from Barrick Gold Corporation to Barrick Mining Corporation, which was made effective on that date. In addition, as of May 9, 2025, Barrick’s ticker on the New York Stock Exchange changed to “B” from “GOLD”. |
| • | On June 3, 2025, Barrick completed the divestiture of its 50% interest in the Donlin Gold Project in Alaska to affiliates of Paulson Advisers LLC and NOVAGOLD Resources Inc. for $1 billion in cash. |
| • | On November 7, 2025, Barrick completed the divestiture of the Alturas Project in Chile to Boroo Pte. Ltd (Singapore) (“Boroo”) for an up-front cash payment of $50 million. Barrick was also granted a 0.5% net smelter return royalty on gold and silver produced from the Alturas Project, which will terminate once 2 million ounces of gold and gold-equivalent have been produced. Boroo may repurchase the royalty within four years from closing for $10 million. |
| • | At its November 7, 2025 meeting, the Board of Directors approved a 25% increase in the quarterly base dividend to $0.125 per share, and at its February 4, 2026 meeting, the Board of Directors approved a $0.42 per share dividend in respect of performance for the fourth quarter of 2025 and a new dividend policy. See “Dividend Policy” for details. |
| • | On November 24, 2025, Barrick announced that an agreement had been entered into with Government of Mali to put an end to all disputes regarding the Loulo-Gounkoto complex. Under the agreement, criminal charges against Société des Mines de Loulo SA (“Somilo”), Société des Mines de Gounkoto SA (“Gounkoto”), their affiliates and employees were withdrawn. The agreement led to the release of the four detained employees, the renewal of the Somilo Exploitation Permit for a 10-year period, and the withdrawal of the International Centre for the Settlement of Investment Disputes (“ICSID”) claims. Operational control was handed back to Somilo and Gounkoto’s management on December 16, 2025, the gold stock attached in January 2025 was returned to Somilo and Gounkoto on December 18, 2025, and the Loulo-Gounkoto complex returned to producing gold. See “Legal Proceedings and Regulatory Actions — Loulo-Gounkoto Mining Conventions Dispute” for details. |
- 20 -
| • | On November 26, 2025, Barrick completed the divestiture of the Hemlo Gold Mine in Canada to Carcetti Capital Corp., renamed Hemlo Mining Corp. (“HMC”), for a total consideration of up to $1.09 billion, inclusive of $875 million in cash received on closing, $50 million in HMC shares received on closing, and a production and tiered gold price-linked cash payment structure of up to $165 million starting in January 2027 for a five-year term. |
| • | On December 1, 2025, Barrick announced that the Board of Directors had unanimously authorized Barrick’s management team to explore the initial public offering (the “IPO”) of a Barrick entity (“IPOCo”) that will hold Barrick’s premier North American gold assets. On February 4, 2026, following a rigorous financial and operational analysis by Barrick’s management and its advisors, the Board authorized Barrick’s management to initiate preparations for the IPO of IPOCo and expects the IPO to be completed by late 2026, subject to market conditions and other customary conditions, including any required regulatory approvals and final approval of the IPO by Barrick’s Board of Directors. IPOCo will hold Barrick’s joint venture interests in Nevada Gold Mines and Pueblo Viejo, as well as Barrick’s wholly owned Fourmile gold discovery in Nevada. Barrick intends to retain a significant controlling interest in IPOCo following the IPO and continue to benefit financially through its majority ownership of IPOCo. |
| • | On December 2, 2025, Barrick completed the divestiture of its interests in the Tongon gold mine and certain of its exploration properties in Côte d’lvoire to the Atlantic Group for total consideration of up to $305 million, comprised of cash consideration of $192 million, inclusive of a $23 million shareholder loan repayment within six months of closing, and contingent cash payments totaling up to $113 million payable based on the price of gold over two-and-a-half years and resource conversions over five years. |
| • | In addition to the divestitures referred to above, over the course of the last three years, Barrick completed the sale of various non-core minority equity interests for proceeds of approximately $150 million. Barrick has also entered into several agreements to sell its interests in certain royalty portfolios and exploration projects for a combination of cash proceeds, shares and/or future royalties. |
Results of Operations in 2025
Total revenues in 2025 were $17.0 billion, a $4.0 billion, or 31%, increase compared to 2024, primarily due to a higher realized gold price, partially offset by a decrease in sales volumes. In 2025, gold and copper revenues totaled $15.1 billion and $1,475 million, respectively, with gold revenues up $3.3 billion, compared to the prior year mainly due to a higher realized gold price, partially offset by a decrease in sales volumes, and copper revenues up $620 million compared to the prior year mainly due to a higher copper sales volumes and a higher realized copper price. Realized gold prices of $3,501 per ounce in 2025 were higher than the prior year due to higher market prices. Realized copper prices for 2025 were $4.72 per pound, higher than the prior year. For an explanation of realized price, see “Non-GAAP Financial Measures – Realized Prices”. In 2025, Barrick reported net earnings attributable to equity holders of $4,993 million, compared to $2,144 million in 2024. The increase was primarily due to higher realized gold and copper prices and lower copper cost of sales per pound, partially offset by lower gold sales volumes and an increase in gold cost of sales per ounce. Significant adjustments used to derive adjusted net earnings of $4,139 million in 2025 include acquisition and disposition gains of $1,107 million, mainly relating to the sale of the Company’s 50% interest in the Donlin Gold project, the Hemlo gold mine, its interest in the Tongon gold mine and the Alturas project, partially offset by other expense adjustments of $823 million which mainly related to the settlement payment to the Government of Mali in November 2025, the fair value increment on inventory resulting from the purchase price allocation when, from an accounting perspective operational control of Loulo-Gounkoto was handed back to Barrick, and reduced operations costs at Loulo-Gounkoto. This compares to adjusted net earnings of $2,213 million in 2024 (for an explanation of adjusted net earnings, see “Non-GAAP Financial Measures – Adjusted Net Earnings and Adjusted Net Earnings per Share”).
- 21 -
In 2025, Barrick’s gold production was 3.26 million ounces, 656 thousand ounces lower than 2024 gold production, with costs of sales applicable to gold of $1,697 per ounce, all-in sustaining costs of $1,637 per ounce and total cash costs of $1,199 per ounce. Barrick’s copper production in 2025 was 220 thousand tonnes of copper, 25 thousand tonnes higher than 2024 copper production, with cost of sales applicable to copper of $2.91 per pound, all-in sustaining costs of $3.20 per pound and C1 cash costs of $2.14 per pound. In 2024, Barrick produced 3.91 million ounces of gold, with costs of sales applicable to gold of $1,442 per ounce, all-in sustaining costs of $1,484 per ounce and total cash costs of $1,065 per ounce, and 195 thousand tonnes of copper, with cost of sales applicable to copper of $2.99 per pound, all-in sustaining costs of $3.45 per pound and C1 cash costs of $2.26 per pound. “All-in sustaining costs” and “total cash costs” per ounce and “All-in sustaining costs” and “C1 cash costs” per pound are non-GAAP financial performance measures. For an explanation of these non-GAAP measures, refer to “Non-GAAP Financial Measures – Total cash costs per ounce, All-in sustaining costs per ounce, C1 cash costs per pound and All-in sustaining costs per pound” at pages 151 to 152 of this Annual Information Form.
The following table summarizes Barrick’s interest in its producing mines and its share of gold production from these mines for the periods indicated:
| (000s ozs, attributable share) | ||||
| Twelve months ended December 311 | 2025 | 2024 | ||
| Carlin (61.5%) |
687 | 775 | ||
| Cortez (61.5%) |
454 | 444 | ||
| Turquoise Ridge (61.5%) |
341 | 304 | ||
| Phoenix (61.5%) |
109 | 127 | ||
| Nevada Gold Mines (61.5%)2 |
1,591 | 1,650 | ||
| Pueblo Viejo (60%) |
379 | 352 | ||
| Loulo-Gounkoto (80%)3 |
29 | 578 | ||
| Kibali (45%) |
303 | 309 | ||
| Tongon (89.7%)4 |
106 | 148 | ||
| North Mara (84%) |
249 | 265 | ||
| Veladero (50%) |
230 | 252 | ||
| Hemlo5 |
123 | 143 | ||
| Bulyanhulu (84%) |
153 | 168 | ||
| Porgera (24.5%) |
92 | 46 | ||
| Total Attributable Gold6 |
3,255 | 3,911 | ||
| 1 | Barrick’s interest is subject to royalty obligations at certain mines. |
| 2 | These amounts represent Barrick’s 61.5% interest in Carlin, Cortez, Turquoise Ridge and Phoenix. |
| 3 | As a result of a temporary suspension of operations at Loulo-Gounkoto starting January 14, 2025, and subsequent loss of control on June 16, 2025, no operating data or per ounce data was provided for the first to third quarters of 2025. On November 24, 2025, Barrick announced that an agreement had been entered into with the Government of the Republic of Mali to put an end to all disputes regarding the Loulo and Gounkoto mines. The provisional administration of the Loulo-Gounkoto complex was terminated on December 16, 2025, at which point, from an accounting perspective, operational control was handed back to Barrick. |
| 4 | On October 6, 2025, Barrick reached an agreement to sell its interest in the Tongon gold mine and certain of its exploration properties to the Atlantic Group for total consideration of up to $305 million. The transaction closed on December 1, 2025. Accordingly, operating and financial results provided are up to the closing date. |
| 5 | On September 10, 2025, Barrick reached an agreement to sell the Hemlo gold mine to Carcetti Capital Corp. for gross proceeds of up to $1.09 billion. The transaction closed on November 26, 2025. Accordingly, operating and financial results provided are up to the closing date. |
| 6 | 2025 and 2024 exclude Long Canyon which is producing residual ounces from the leach pad while on care and maintenance. |
The following table summarizes Barrick’s interest in its principal producing copper mines and its share of copper production from these mines for the periods indicated:
- 22 -
| (000s of tonnes, attributable share) | ||||
| Twelve months ended December 311 | 2025 | 2024 | ||
| Zaldívar (50%) |
37 | 40 | ||
| Lumwana |
151 | 123 | ||
| Jabal Sayid (50%) |
32 | 32 | ||
| Total Attributable Copper |
220 | 195 | ||
| 1 | Barrick’s interest is subject to royalty obligations at certain mines. |
See “Narrative Description of the Business” in this Annual Information Form, Note 5 “Segment Information” to the Consolidated Financial Statements and the MD&A for further information on the Company’s operating segments. See “Narrative Description of the Business – Mineral Reserves and Mineral Resources” for information on the Company’s mineral reserves and resources.
- 23 -
- 24 -
NARRATIVE DESCRIPTION OF THE BUSINESS
Barrick is engaged in the responsible production and sale of gold, as well as related activities such as exploration and mine development. Barrick also produces significant amounts of copper, principally from its Zaldívar joint venture, Jabal Sayid joint venture and its Lumwana mine and holds other interests. Unless otherwise specified, the description of Barrick’s business, including products, principal markets, distribution methods, employees and labor relations contained in this Annual Information Form, applies to each of its operating segments and Barrick as a whole.
Production and Guidance
For the year ended December 31, 2025, Barrick produced 3.26 million ounces of gold at cost of sales applicable to gold of $1,697 per ounce, all-in sustaining costs of $1,637 per ounce and total cash costs of $1,199 per ounce. Barrick’s 2026 gold production is currently targeted at 2.90 to 3.25 million ounces, and Barrick expects cost of sales applicable to gold of $1,870 to $2,070 per ounce in 2026, all-in sustaining costs of $1,760 to $1,950 per ounce and total cash costs of $1,330 to $1,470 per ounce, assuming a market gold price of $4,500 per ounce. See “Forward-Looking Information”. In the fourth quarter of 2025, Barrick divested its interests in Hemlo and Tongon and when those two assets are excluded, 2025 production was 3.0 million ounces. The most significant driver of the change in production in 2026 across the continuing assets is the additional production from Loulo-Gounkoto following the return of control in the late fourth quarter of 2025. Across the remainder of the portfolio, Pueblo Viejo is expected to deliver a slightly higher year-over-year performance with offsetting decreases at Veladero and North Mara. Production at Carlin in 2026 is expected to be slightly lower than 2025, driven by open pit mine sequencing although this is expected to be partially offset by higher deliveries of Cortez material processed through the Carlin roasters. Turquoise Ridge is expected to have lower underground grades as per the planned mining sequence. Stable delivery is expected for the other assets.
Across the four quarters of 2026, the Company’s gold production is expected to be the lowest in the first quarter (between 640 to 680 thousand ounces) and highest in the third and fourth quarters due to the ramp-up of Loulo-Gounkoto, the timing of shutdowns, the Goldrush ramp-up and mine sequencing across the Nevada Gold Mines sites. This is expected to result in an approximately 45% / 55% split of the Company’s total gold production between the first half and second half of the year, respectively. “All-in sustaining costs” and “total cash costs” per ounce are non-GAAP financial performance measures. For an explanation of all-in sustaining costs and total cash costs per ounce, refer to “Non-GAAP Financial Measures – Total cash costs per ounce, All-in sustaining costs per ounce, C1 cash costs per pound and All-in sustaining costs per pound” at pages 151 to 152 of this Annual Information Form.
For the year ended December 31, 2025, Barrick produced 220 thousand tonnes of copper at cost of sales applicable to copper of $2.91 per pound, all-in sustaining costs of $3.20 per pound and C1 cash costs of $2.14 per pound. Barrick’s 2026 copper production is targeted at approximately 190 - 220 thousand tonnes and Barrick expects cost of sales applicable to copper of $3.05 to $3.35 per pound, all-in sustaining costs of $3.45 to $3.75 per pound and C1 cash costs of $2.20 to $2.45 per pound. See “Forward-Looking Information”. “All-in sustaining costs” and “C1 cash costs” per pound are non-GAAP financial performance measures. For an explanation of all-in sustaining costs and C1 cash costs per pound, refer to “Non-GAAP Financial Measures – Total cash costs per ounce, All-in sustaining costs per ounce, C1 cash costs per pound and All-in sustaining costs per pound” at pages 151 to 152 of this Annual Information Form.
Reportable Operating Segments
During 2025, Barrick’s business was organized into fourteen minesites. Barrick’s Chief Operating Decision Maker, (Mark Bristow, President and Chief Executive Officer until September 29, 2025 and Mark Hill, President and Chief Executive Officer thereafter), reviews the operating results, assesses performance and makes capital allocation decisions at the minesite level. For the year ended December
- 25 -
31, 2025, Barrick’s reportable operating segments consisted of eight individual gold mines, Carlin, Cortez, Turquoise Ridge, Pueblo Viejo, Loulo-Gounkoto, Kibali, North Mara and Bulyanhulu, and one individual copper mine, Lumwana. Each mine and project receives direction from Barrick’s Executive Committee, but has responsibility for certain aspects of its business, such as sustainability of mining operations, including exploration, production and closure.
For details regarding 2025 production for all operating segments, see “General Information – General Development of the Business”. For additional details regarding the reserves and resources held in each operating segment, see “Mineral Reserves and Mineral Resources”. See also Note 5 “Segment Information” to the Consolidated Financial Statements and the MD&A for further financial and other information on the Company’s operating segments. Barrick’s ability to deliver on its vision, strategic objectives and operating guidance depends on the Company’s ability to understand and appropriately respond to uncertainties and risks. For a description of certain of those sources of uncertainty, relevant risk modification activities and oversight by the Company’s Board of Directors and executive officers, see pages 21 to 22 of the MD&A. For a discussion of material risks relevant to investors, see “Risk Factors”.
Nevada Gold Mines (61.5% basis)
In connection with the establishment of Nevada Gold Mines on July 1, 2019, Barrick’s Cortez, Goldstrike, Turquoise Ridge and Goldrush properties, and Newmont Corporation’s (“Newmont”) Carlin, Twin Creeks, Phoenix, Long Canyon (which transitioned to care and maintenance at the end of 2023) and Lone Tree (which was divested in 2021 as part of an asset exchange agreement with i-80 Gold Corp., as previously disclosed) properties were contributed to the joint venture. Nevada Gold Mines produced 1,591 thousand ounces of gold at cost of sales attributable to gold of $1,647 per ounce, all-in sustaining costs of $1,620 per ounce and total cash costs of $1,229 per ounce in 2025, compared to 1,650 thousand ounces of gold at cost of sales attributable to gold of $1,478 per ounce, all-in sustaining costs of $1,561 per ounce and total cash costs of $1,126 per ounce in 2024. This represents Barrick’s 61.5% interest in Cortez, Carlin (including Goldstrike and South Arturo), Turquoise Ridge (including Twin Creeks) and Phoenix. “All-in sustaining costs” and “total cash costs” per ounce are non-GAAP financial performance measures. For an explanation of all-in sustaining costs and total cash costs per ounce, refer to “Non-GAAP Financial Measures – Total cash costs per ounce, All-in sustaining costs per ounce, C1 cash costs per pound and All-in sustaining costs per pound” at pages 151 to 152 of this Annual Information Form.
Carlin
Barrick’s 61.5% interest in Carlin (a material property for the purposes of this Annual Information Form, see “Material Properties – Carlin Complex”) produced 687 thousand ounces of gold at cost of sales attributable to gold of $1,676 per ounce, all-in sustaining costs of $1,906 per ounce and total cash costs of $1,340 per ounce in 2025, compared to 775 thousand ounces of gold at cost of sales attributable to gold of $1,429 per ounce, all-in sustaining costs of $1,730 per ounce and total cash costs of $1,187 per ounce in 2024. Barrick is the operator of the Nevada Gold Mines joint venture, including the Carlin Complex. In 2025, gold production was below the guidance range, impacted primarily by a slower than planned ramp-up of the Gold Quarry roaster and delayed access to higher grade underground zones due to poor ground conditions. This was further impacted by an increase in higher grade ore shipped from Cortez and processed at the Carlin roasters, to the overall benefit of Nevada Gold Mines. Cost of sales per ounce and total cash costs per ounce were both above the guidance ranges mainly due to the impact of lower production, combined with increased sulfuric acid consumption and pricing, and higher consumable prices partially driven by the impact of tariffs. All-in sustaining costs per ounce were also higher than guidance, mainly driven by higher total cash costs per ounce. All cost metrics were also impacted by higher royalties from the higher realized gold price (guidance was based on a gold price assumption of $2,400 per ounce).
- 26 -
The amounts presented represent Barrick’s 61.5% interest in Carlin (including Nevada Gold Mines’ 100% interest in South Arturo).
At Carlin, the Company expects its equity share of 2026 gold production to be in the range of 600 - 670 thousand ounces, slightly lower than 2025 production levels. In 2026, Barrick expects cost of sales attributable to gold to be in the range of $1,770 to $1,960 per ounce, higher than 2025. All-in sustaining costs are expected to be $1,900 to $2,100 per ounce, in line with 2025. Total cash costs are expected to be in the range of $1,340 to $1,490 per ounce, in line with 2025. “All-in sustaining costs” and “total cash costs” per ounce are non-GAAP financial performance measures. For an explanation of all-in sustaining costs and total cash costs per ounce, refer to “Non-GAAP Financial Measures – Total cash costs per ounce, All-in sustaining costs per ounce, C1 cash costs per pound and All-in sustaining costs per pound” at pages 151 to 152 of this Annual Information Form.
Cortez
Barrick’s 61.5% interest in Cortez (a material property for the purposes of this Annual Information Form, see “Material Properties – Cortez Property”) produced 454 thousand ounces of gold at cost of sales attributable to gold of $1,609 per ounce, all-in sustaining costs of $1,513 per ounce and total cash costs of $1,234 per ounce in 2025, compared to 444 thousand ounces of gold at cost of sales attributable to gold of $1,402 per ounce, all-in sustaining costs of $1,441 per ounce and total cash costs of $1,046 per ounce in 2024. Barrick is the operator of the Nevada Gold Mines joint venture, including the Cortez property. In 2025, gold production was in the top half of the guidance range, primarily due to higher than planned refractory ore shipped and processed at the Carlin roasters and the Goldstrike autoclave, to the overall benefit of Nevada Gold Mines. Cost of sales per ounce and total cash costs per ounce were above the guidance range reflecting a higher than planned proportion of higher cost refractory ounces processed at the Carlin roasters in the sales mix combined with higher sulfur and other consumable prices, partially driven by tariffs. All cost metrics were also impacted by higher royalties from the higher realized gold price. All-in sustaining costs were also above the guidance range primarily due to higher royalties, as described above, as the higher total cash costs per ounce were partially offset by lower than planned capitalized waste stripping at Crossroads following the reclassification of waste material to low grade ore.
At Cortez, the Company expects its equity share of 2026 gold production to be in the range of 430 - 480 thousand ounces, in line with 2025 production levels. In 2026, Barrick expects cost of sales attributable to gold to be in the range of $1,980 to $2,190 per ounce, total cash costs are expected to be in the range of $1,390 to $1,540 per ounce, and all-in sustaining costs are expected to be $1,690 to $1,870 per ounce. All measures are expected to be higher than 2025. “All-in sustaining costs” and “total cash costs” per ounce are non-GAAP financial performance measures. For an explanation of all-in sustaining costs and total cash costs per ounce, refer to “Non-GAAP Financial Measures – Total cash costs per ounce, All-in sustaining costs per ounce, C1 cash costs per pound and All-in sustaining costs per pound” at pages 151 to 152 of this Annual Information Form.
Turquoise Ridge
Barrick’s 61.5% interest in Turquoise Ridge (a material property for the purposes of this Annual Information Form, see “Material Properties – Turquoise Ridge Complex”) produced 341 thousand ounces of gold at cost of sales attributable to gold of $1,545 per ounce, all-in sustaining costs of $1,358 per ounce and total cash costs of $1,178 per ounce in 2025, compared to 304 thousand ounces of gold at cost of sales attributable to gold of $1,615 per ounce, all-in sustaining costs of $1,466 per ounce, and total cash costs of $1,238 per ounce in 2024. Barrick is the operator of the Nevada Gold Mines joint venture, including the Turquoise Ridge Complex. In 2025, gold production was at the top end of the guidance range as the improvements in stabilizing the processing plant and improving mining efficiencies resulted in a strong performance in the second half of 2025. Cost of sales per ounce and total cash costs per ounce were higher than the original guidance mainly due to a change in the mine plan which involved higher operating development costs combined with higher input prices relating to reagents and
- 27 -
consumables, partially driven by tariffs, and higher than planned maintenance costs. All-in sustaining costs per ounce were within guidance as the impact of the change in the mine plan was not a driver (higher operating costs were offset by lower minesite sustaining capital expenditures). All cost metrics were also impacted by higher royalties from the higher realized gold price.
At Turquoise Ridge, the Company expects its equity share of 2026 gold production to be in the range of 300 - 330 thousand ounces, lower than 2025 production levels. In 2026, Barrick expects cost of sales attributable to gold to be in the range of $1,610 to $1,790 per ounce, total cash costs are expected to be in the range of $1,220 to $1,360 per ounce and all-in sustaining costs are expected to be $1,490 to $1,650 per ounce. All three measures are expected to be higher than 2025. “All-in sustaining costs” and “total cash costs” per ounce are non-GAAP financial performance measures. For an explanation of all-in sustaining costs and total cash costs per ounce, refer to “Non-GAAP Financial Measures – Total cash costs per ounce, All-in sustaining costs per ounce, C1 cash costs per pound and All-in sustaining costs per pound” at pages 151 to 152 of this Annual Information Form.
Other Mines - Nevada Gold Mines
Barrick’s 61.5% interest in Phoenix produced 109 thousand ounces of gold at cost of sales attributable to gold of $1,921 per ounce, all-in sustaining costs of $920 per ounce and total cash costs of $653 per ounce in 2025.
At Phoenix, the Company expects its equity share of 2026 gold production to be in the range of 80 - 100 thousand ounces, lower than 2025 production levels. In 2026, Barrick expects cost of sales attributable to gold to be in the range of $2,440 to $2,710 per ounce, all-in sustaining costs are expected to be $1,180 to $1,310 per ounce, and total cash costs are expected to be in the range of $900 to $1,000 per ounce. All three measures are expected to be higher than 2025.
Barrick is the operator of the Nevada Gold Mines joint venture. “All-in sustaining costs” and “total cash costs” per ounce are non-GAAP financial performance measures. For an explanation of all-in sustaining costs and total cash costs per ounce, refer to “Non-GAAP Financial Measures – Total cash costs per ounce, All-in sustaining costs per ounce, C1 cash costs per pound and All-in sustaining costs per pound” at pages 151 to 152 of this Annual Information Form.
Pueblo Viejo (60% basis)
Barrick’s 60% interest in the Pueblo Viejo mine (a material property for the purposes of this Annual Information Form, see “Material Properties – Pueblo Viejo Mine”) produced 379 thousand ounces of gold at cost of sales attributable to gold of $1,608 per ounce, all-in sustaining costs of $1,412 per ounce and total cash costs of $1,034 per ounce in 2025, compared to 352 thousand ounces of gold at cost of sales attributable to gold of $1,576 per ounce, all-in sustaining costs of $1,323 per ounce and total cash costs of $1,005 per ounce in 2024. Barrick is the operator of the joint venture. In 2025, gold production was in the lower half of the guidance range mainly due to lower CIL recovery resulting from higher than planned copper and preg-robbing ores in the feed blend, partially offset by higher grades processed. Cost of sales per ounce was within the guidance range as the increase in total cash costs per ounce was partially offset by a lower depreciation expense. Total cash costs per ounce were higher than the guidance range mainly due to higher processing maintenance costs. All cost metrics were also impacted by higher royalties from the higher realized gold price.
At Pueblo Viejo, the Company expects its equity share of 2026 gold production to be in the range of 350 - 400 thousand ounces, in line with 2025 production levels. In 2026, Barrick expects cost of sales attributable to gold to be in the range of $1,720 to $1,910 per ounce, all-in sustaining costs are expected to be $1,590 to $1,760 per ounce, and total cash costs are expected to be in the range of $1,160 to $1,290 per ounce, all higher than 2025. “All-in sustaining costs” and “total cash costs” per ounce are non-GAAP financial performance measures. For an explanation of all-in sustaining costs and total cash costs
- 28 -
per ounce, refer to “Non-GAAP Financial Measures – Total cash costs per ounce, All-in sustaining costs per ounce, C1 cash costs per pound and All-in sustaining costs per pound” at pages 151 to 152 of this Annual Information Form.
Loulo-Gounkoto (80% basis)
Barrick’s 80% interest in Loulo-Gounkoto produced 18 thousand ounces of gold in early January before operations were suspended and 11 thousand ounces of gold in December after the provisional administration was terminated and operations were restarted by Somilo and Gounkoto’s management. This brings full year production to 29 thousand ounces of gold and full year sales to 91 thousand ounces (this includes the sale of the gold that was produced in late 2024 that was subject to an attachment order issued on January 2, 2025 and returned to the mine following the end of the provisional administration period). Cost of sales attributable to gold of $4,271 per ounce, as it includes the impact of the fair value increment on inventory resulting from the purchase price allocation when such gold inventory was returned to Somilo and Gounkoto. All-in sustaining costs were $1,603 per ounce and total cash costs were $1,449 per ounce in 2025, both of which excludes the impact of the fair value increment of $2,486 per ounce, compared to 578 thousand ounces of gold at cost of sales attributable to gold of $1,218 per ounce, all-in sustaining costs of $1,304 per ounce and total cash costs of $828 per ounce in 2024. As a result of the temporary suspension of operations at Loulo-Gounkoto, Barrick had excluded Loulo-Gounkoto from its 2025 production guidance. See “Legal Proceedings and Regulatory Actions — Loulo-Gounkoto Mining Conventions Dispute” for details.
At Loulo-Gounkoto, the Company expects its equity share of 2026 gold production to be in the range of 260 - 290 thousand ounces. In 2026, Barrick expects cost of sales attributable to gold to be in the range of $2,860 to $3,140 per ounce, all-in sustaining costs are expected to be $2,640 to $2,900 per ounce, and total cash costs are expected to be in the range of $2,180 to $2,390 per ounce. “All-in sustaining costs” and “total cash costs” per ounce are non-GAAP financial performance measures. For an explanation of all-in sustaining costs and total cash costs per ounce, refer to “Non-GAAP Financial Measures – Total cash costs per ounce, All-in sustaining costs per ounce, C1 cash costs per pound and All-in sustaining costs per pound” at pages 151 to 152 of this Annual Information Form.
Kibali (45% basis)
Barrick’s 45% interest in Kibali (a material property for the purposes of this Annual Information Form, see “Material Properties – Kibali Mine”) produced 303 thousand ounces of gold at cost of sales attributable to gold of $1,568 per ounce, all-in sustaining costs of $1,337 per ounce and total cash costs of $1,099 per ounce in 2025, compared to 309 thousand ounces of gold at cost of sales attributable to gold of $1,344 per ounce, all-in sustaining costs of $1,123 per ounce and total cash costs of $905 per ounce in 2024. In 2025, gold production was marginally below the guidance range, primarily driven by lower grades processed than planned. All cost metrics were above the guidance ranges primarily as a result of the lower than planned production and higher royalties from the higher realized gold price.
At Kibali, the Company expects its equity share of 2026 gold production to be in the range of 270 - 310 thousand ounces, in line with 2025 production levels. In 2026, Barrick expects cost of sales attributable to gold to be in the range of $1,520 to $1,680 per ounce, in line with 2025 levels. All-in sustaining costs are expected to be in the range of $1,330 to $1,470 per ounce, also in line with 2025 levels. Total cash costs are expected to be in the range of $1,130 to $1,250 per ounce, higher than 2025 levels. “All-in sustaining costs” and “total cash costs” per ounce are non-GAAP financial performance measures. For an explanation of all-in sustaining costs and total cash costs per ounce, refer to “Non-GAAP Financial Measures – Total cash costs per ounce, All-in sustaining costs per ounce, C1 cash costs per pound and All-in sustaining costs per pound” at pages 151 to 152 of this Annual Information Form.
- 29 -
North Mara (84% basis)
Barrick’s 84% interest in North Mara produced 249 thousand ounces of gold at cost of sales attributable to gold of $1,449 per ounce, all-in sustaining costs of $1,333 per ounce and total cash costs of $1,085 per ounce in 2025, compared to 265 thousand ounces of gold at cost of sales attributable to gold of $1,266 per ounce, all-in sustaining costs of $1,274 per ounce and total cash costs of $989 per ounce in 2024. In 2025, gold production ended in the upper half of the guidance range reflecting the successful delivery of the mine plan committed at the start of the year. All cost metrics were within the guidance ranges, notwithstanding being impacted by higher royalties from the higher realized gold price.
At North Mara, the Company expects its equity share of 2026 gold production to be in the range of 200 - 230 thousand ounces, slightly lower than 2025 production levels. In 2026, Barrick expects cost of sales attributable to gold to be in the range of $1,700 to $1,880 per ounce and total cash costs are expected to be in the range of $1,300 to $1,430 per ounce, both higher than 2024 levels. Barrick expects all-in sustaining costs to be $1,520 to $1,680 per ounce, also higher than 2024 levels. “All-in sustaining costs” and “total cash costs” per ounce are non-GAAP financial performance measures. For an explanation of all-in sustaining costs and total cash costs per ounce, refer to “Non-GAAP Financial Measures – Total cash costs per ounce, All-in sustaining costs per ounce, C1 cash costs per pound and All-in sustaining costs per pound” at pages 151 to 152 of this Annual Information Form.
Bulyanhulu (84% basis)
Barrick’s 84% interest in Bulyanhulu produced 153 thousand ounces of gold at cost of sales attributable to gold of $1,789 per ounce, all-in sustaining costs of $1,795 per ounce and total cash costs of $1,253 per ounce in 2025, compared to 168 thousand ounces of gold at cost of sales attributable to gold of $1,509 per ounce, all-in sustaining costs of $1,420 per ounce and total cash costs of $1,070 per ounce in 2024. In 2025, gold production ended within the guidance range. All cost metrics ended above the cost guidance mainly driven by higher royalties from the higher realized gold prices and lower grades mined and processed.
At Bulyanhulu, the Company expects its equity share of 2026 gold production to be in the range of 140 - 160 thousand ounces, in line with 2025 production levels. In 2026, Barrick expects cost of sales attributable to gold to be in the range of $1,750 to $1,940 per ounce and total cash costs are expected to be in the range of $1,230 to $1,360 per ounce, both in line with 2025 levels. All-in sustaining costs are expected to be $1,870 to $2,070 per ounce, higher than 2025 levels. “All-in sustaining costs” and “total cash costs” per ounce are non-GAAP financial performance measures. For an explanation of all-in sustaining costs and total cash costs per ounce, refer to “Non-GAAP Financial Measures – Total cash costs per ounce, All-in sustaining costs per ounce, C1 cash costs per pound and All-in sustaining costs per pound” at pages 151 to 152 of this Annual Information Form.
Other Mines (Gold)
Barrick’s 50% interest in the Veladero mine produced 230 thousand ounces of gold at cost of sales attributable to gold of $1,286 per ounce, all-in sustaining costs of $1,450 per ounce and total cash costs of $785 per ounce in 2025, compared to 252 thousand ounces of gold at cost of sales attributable to gold of $1,254 per ounce, all-in sustaining costs of $1,334 per ounce and total cash costs of $905 per ounce in 2024. Gold production for 2025 was above the guidance range driven by additional recoverable ounces placed. All cost metrics were below the guidance ranges as a result of the higher production, notwithstanding the impact of higher royalties from the higher realized gold price.
The governance, ownership and joint operation of the Veladero joint venture is governed by the terms of a shareholders’ agreement between Barrick and Shandong.
- 30 -
Minera Andina del Sol SRL (“MAS”) (formerly, Minera Argentina Gold SRL) is the subject of a legal proceeding in respect of operational incidents that occurred in March 2017, September 2016 and September 2015 involving the release of gold-bearing process solution. For more information about these matters, see “Legal Matters – Legal Proceedings and Regulatory Actions – Veladero – Operational Incidents and Associated Proceedings”.
At Veladero, the Company expects attributable 2026 production to be in the range of 180 - 200 thousand ounces, lower than 2025 production levels. Barrick expects cost of sales attributable to gold to be in the range of $2,000 to $2,210 per ounce and all-in sustaining costs are expected to be $1,460 to $1,620 per ounce, both higher than 2025 levels. Total cash costs are expected to be in the range of $1,160 to $1,280 per ounce in 2026, also higher than 2025 levels. Operating costs at Veladero are also highly sensitive to local inflation and fluctuations in foreign exchange rates. The Company has assumed an average Argentine peso exchange rate of ARS 1,513:$1 for 2026.
Tongon produced 106 thousand ounces of gold at cost of sales attributable to gold of $2,200 per ounce, all-in sustaining costs of $2,203 per ounce and total cash costs of $2,049 per ounce in 2025. Barrick’s interest in the Tongon mine was divested on December 1, 2025.
Hemlo produced 123 thousand ounces of gold at cost of sales attributable to gold of $1,854 per ounce, all-in sustaining costs of $1,936 per ounce and total cash costs of $1,618 per ounce in 2025. Barrick’s interest in the Hemlo mine was divested on November 26, 2025.
Porgera produced 92 thousand ounces of gold at cost of sales attributable to gold of $1,553 per ounce, all-in sustaining costs of $1,630 per ounce and total cash costs of $1,184 per ounce in 2025.
At Porgera, the Company expects 2026 gold production to be in the range of 80 - 100 thousand ounces, in line with 2025 levels. In 2026, Barrick expects cost of sales attributable to gold to be in the range of $1,610 to $1,790 per ounce and total cash costs are expected to be in the range of $1,190 to $1,320 per ounce, higher than 2025 levels. All-in sustaining costs are expected to be in the range of $1,610 to $1,780 per ounce, in line with 2025 levels.
“All-in sustaining costs” and “total cash costs” per ounce are non-GAAP financial performance measures. For an explanation of all-in sustaining costs and total cash costs per ounce, refer to “Non-GAAP Financial Measures – Total cash costs per ounce, All-in sustaining costs per ounce, C1 cash costs per pound and All-in sustaining costs per pound” at pages 151 to 152 of this Annual Information Form.
Lumwana
Lumwana (a material property for the purposes of this Annual Information Form, see “Material Properties – Lumwana”) produced 151 thousand tonnes of copper at cost of sales attributable to copper of $2.54 per pound, all-in sustaining costs of $3.05 per pound and C1 cash costs of $1.86 per pound in 2025.
At Lumwana, the Company expects 2026 copper production to be in the range of 130 - 150 thousand tonnes, slightly lower than 2025 production levels. In 2026, Barrick expects cost of sales attributable to copper to be in the range of $2.85 to $3.15 per pound and C1 cash costs are expected to be in the range of $2.05 to $2.30 per pound, both higher than 2025 levels. All-in sustaining costs are expected to be in the range of $3.40 to $3.75 per pound, also higher than 2025 levels. “All-in sustaining costs” and “total cash costs” per ounce are non-GAAP financial performance measures. For an explanation of all-in sustaining costs and total cash costs per ounce, refer to “Non-GAAP Financial Measures – Total cash costs per ounce, All-in sustaining costs per ounce, C1 cash costs per pound and All-in sustaining costs per pound” at pages 151 to 152 of this Annual Information Form.
Other Mines (Copper)
- 31 -
Barrick’s 50% non-operating interest in Zaldívar produced 37 thousand tonnes of copper at cost of sales attributable to copper of $5.14 per pound, all-in sustaining costs of $4.75 per pound and C1 cash costs of $3.98 per pound in 2025.
At Zaldívar, the Company expects its equity share of 2026 copper production to be in the range of 30 - 35 thousand tonnes, slightly lower than 2025 production levels. In 2026, Barrick expects cost of sales attributable to copper to be in the range of $4.80 to $5.10 per pound and C1 cash costs are expected to be in the range of $3.70 to $3.90 per pound, both lower than 2025 levels. All-in sustaining costs are expected to be $5.40 to $5.70 per pound, higher than 2025 levels.
Barrick’s 50% interest in Jabal Sayid produced 32 thousand tonnes of copper at cost of sales attributable to copper of $2.09 per pound, all-in sustaining costs of $1.46 per pound and C1 cash costs of $1.28 per pound in 2025.
At Jabal Sayid, the Company expects its equity share of 2026 copper production to be in the range of 25 - 30 thousand tonnes, lower than 2025 production levels. In 2026, Barrick expects cost of sales attributable to copper to be in the range of $2.10 to $2.30 per pound, slightly higher than in 2025. C1 cash costs are expected to be in the range of $1.25 to $1.45 per pound and all-in sustaining costs are expected to be in the range of $1.45 to $1.65 per pound, both in line with 2025.
“All-in sustaining costs” and “C1 cash costs” per pound are non-GAAP financial performance measures. For an explanation of all-in sustaining costs and C1 cash costs per pound, refer to “Non-GAAP Financial Measures – Total cash costs per ounce, All-in sustaining costs per ounce, C1 cash costs per pound and All-in sustaining costs per pound” at pages 151 to 152 of this Annual Information Form.
Mineral Reserves and Mineral Resources
Gold Reserves
As at December 31, 2025, Barrick’s total proven and probable gold reserves were 85 million ounces at an average grade of 0.98 g/t estimated using a gold price assumption of $1,500 per ounce. This is a decrease compared to 89 million ounces at an average grade of 0.99 g/t estimated using a gold price assumption of $1,400 per ounce at the end of 2024, except at Tongon and at Hemlo open pit, where mineral reserves for 2024 were based upon a gold price assumption of $1,650 per ounce.
Year-over-year, attributable reserves have decreased by 4.1 million ounces before 2025 depletion of 3.7 million ounces. The year-over-year change was a result of the Tongon and Hemlo divestitures, which accounted for a reduction of 2.2 million ounces, partially offset by 1.8 million ounces of additions associated with commodity price change and exploration additions. Although depletion was higher than net conversion by 1.9 million ounces for 2025, the three-year rolling average gold mineral reserve replacement stands close to 190% adding more than 24 million ounces to gold mineral reserves (excluding both acquisitions and divestments), primarily supported by 17 million ounces of net change in the prior year. Furthermore three year average gold-equivalent net replacement is in excess of 500% supported by the Reko Diq and Lumwana feasibility studies in the prior year.
Gold mineral reserves in the Africa and Middle East region, after annual depletion, were 19 million ounces at 3.37 g/t in 2025 from 19 million ounces at 3.35 g/t in 2024, remaining flat year on year with ongoing growth programs in the region offsetting depletion and the loss of ounces from the disposal of Tongon. Ounce additions came from Kibali and Tanzania, which added a combined 1.3 million ounces of attributable proven and probable reserves. These additions were predominantly driven by additions to the emerging Rhino, Agbarabo and Kombokolo (“ARK”) deposits at Kibali and expansion of the open pits at North Mara due to optimization of the pits post in-fill drilling.
- 32 -
In North America, after annual depletion gold mineral reserves were 40 million ounces at 2.46 g/t. This includes the disposal of the Hemlo asset, as well as net additions of 1.5 million ounces from growth drilling largely at Turquoise Ridge Underground and routing assumptions at Phoenix. In addition, the Pueblo Viejo mineral reserves and resources are reported as part of the North American region for 2025 and were previously reported as part of the South America and Asia Pacific region (previously referred to as the “Latin America and Asia Pacific” region) in 2024.
In 2025, reserves in the South America and Asia Pacific region decreased by 4%, after removal of Pueblo Viejo from the region, mainly driven by depletion of 0.36 million ounces and an additional reduction of one million ounces as a result of the combined effect of a model revision at Porgera and a study update at Norte Abierto.
Gold Resources
As of December 31, 2025, Barrick’s attributable measured and indicated gold resources were 150 million ounces at an average grade of 1.01 g/t. This is below Barrick’s measured and indicated gold resources of 180 million ounces at an average grade of 1.06 g/t as at December 31, 2024. Measured and indicated mineral resources reduced by 20 million ounces as a result of the divestiture of the Donlin Gold project and a further 2.2 million ounces as a result of the divestiture of the Alturas project. As of December 31, 2025, Barrick’s attributable inferred gold resources were 43 million ounces at an average grade of 1.0 g/t, compared to 41 million ounces at an average grade of 0.9 g/t, as at December 31, 2024. The increase in inferred mineral resources was primarily attributed to the growth of Fourmile’s mineral resources to 13 million ounces at 16.9 g/t in 2025, from 6.4 million ounces at 14.1 g/t in 2024. Additionally, inferred gold mineral resources within the Africa & Middle East region grew to 5.8 million ounces at 2.8 g/t in 2025 from 5.2 million ounces at 3.1 g/t in 2024. The substantial increases in gold mineral resources at Fourmile supports the possibility for potential future conversions. Overall divestitures in 2025 accounted for a reduction of 26 million ounces of measured and indicated mineral resources and 7.3 million ounces of inferred mineral resources respectively.
Copper
As of December 31, 2025, attributable proven and probable copper mineral reserves remained at 18 million tonnes of copper at 0.46%, compared to 18 million tonnes of copper at 0.45% in the prior year. Attributable measured and indicated copper mineral resources were 24 million tonnes at an average grade of 0.39%, with a further 4.2 million tonnes at an average grade of 0.3% of inferred resources as of December 31, 2025, reflecting increases related to the change in commodity pricing. This compares to prior year attributable measured and indicated copper mineral resources of 24 million tonnes at an average grade of 0.39%, and inferred copper mineral resources of 3.9 million tonnes at an average grade of 0.3%.
Assumptions and Methodology
In 2025, all mineral reserves were estimated using an assumed gold price of $1,500 per ounce, an assumed silver price of $21.00 per ounce and an assumed copper price of $3.25 per pound and long-term average exchange rates of C$1.30:$1, except: at Zaldívar, where mineral reserves for 2025 were calculated using Antofagasta guidance and an updated assumed copper price of $4.15 per pound; and at Norte Abierto where mineral reserves are reported by Newmont using $1,700 per ounce for gold, $3.50 per pound for copper and $20.00 per ounce for silver pit design.
The price assumptions used to calculate reserves in 2025 are consistent with those used by Barrick for the assessment of mine and project economics. In confirming its annual reserves for each of its mineral properties, projects, and operations, Barrick conducts a reserve test on December 31 of each year to verify that the future undiscounted cash flow from reserves is positive. The cash flow excludes all sunk costs and only considers future operating and closure expenses as well as any future capital costs.
- 33 -
In 2025, all mineral resources were calculated using an assumed gold price of $2,000 per ounce, an assumed silver price of $25.00 per ounce and an assumed copper price of $4.50 per pound, except: at Zaldívar, where mineral resources for 2025 were estimated using Antofagasta guidance and an assumed copper price of $4.75 per pound; and at Norte Abierto, where mineral resources are reported by Newmont using $2,000 per ounce for gold, $4.00 per pound for copper and $23.00 per ounce for silver pit shell. Barrick’s mineral resources for 2025 continue to be reported on an inclusive basis, incorporating all areas that form mineral reserves. All open pit mineral resources are contained within a Whittle shell, while all underground mineral resources are contained within optimized mineable shapes.
The 2025 mineral reserves and mineral resources are estimated using the combined value of gold, copper and silver. Accordingly, mineral reserves and mineral resources are reported for all assets where copper or silver is produced and sold as a primary product or a by-product. Barrick’s mineral resource and mineral reserve estimates of tonnes, ounces of gold and silver and pounds of copper are reported to the second significant digit. All mineral resources are reported on an inclusive basis and include all areas that form mineral reserves, reported at a mineral resource cut-off and associated commodity price. All measured and indicated mineral resource estimates of grade and all proven and probable mineral reserve estimates of grade for gold (g/t), silver (g/t) and copper (%) are reported to two decimal places, while all inferred mineral resource estimates of grade for gold (g/t), silver (g/t) and copper (%) are reported to one decimal place.
Barrick’s reserves and resources have been estimated as at December 31, 2025, in accordance with definitions and best practice guidelines adopted by the CIM and incorporated into National Instrument 43-101 (see “Glossary of Technical and Business Terms”). Varying cut-off grades have been used depending on the mine, methods of extraction and type of ore contained in the reserves. Mineral resource metal grades and material densities have been estimated using industry-standard methods appropriate for each mineral project with support of various commercially available mining software packages. For the cut-off grades used in the estimation of reserves, see “Notes to the Barrick Mineral Reserves and Resources Tables” below. Barrick’s normal data verification procedures have been employed in connection with the estimations. Sampling, analytical and test data underlying the stated mineral resources and reserves have been verified by employees of Barrick, its joint venture partners or its joint venture operating companies, as applicable, under the supervision of Qualified Persons, and/or independent Qualified Persons (see “Scientific and Technical Information”). Verification procedures include industry-standard quality control practices. Drill samples collected for use in geologic modeling and mineral resource estimation are under the direct supervision of the geology department at each of the Company’s properties and projects. All drill hole collar, survey and assay information used in modeling and resource estimation are manually verified and approved by the staff geologists prior to entry into the mine-wide database. Sample preparation and analyses are conducted by either independent laboratories or the laboratory onsite, in which case independent laboratories are used to verify results. Procedures are employed to ensure security of samples during their delivery from the drill rig to the laboratory. The quality assurance procedures, data verification and assay protocols used in connection with drilling and sampling at each property and project conform to industry-accepted quality control methods. Regular internal auditing of the mineral reserve and mineral resource estimation processes and procedures are conducted.
Barrick reports its reserves in accordance with National Instrument 43-101, as required by Canadian securities regulatory authorities. Canadian disclosure standards may differ from the disclosure requirements in the United States under the U.S. Securities Exchange Act of 1934, as amended (the “Exchange Act”). For further information, see “Reporting Currency, Financial and Reserve Information”.
Although the Company has carefully prepared and verified the mineral reserve figures presented below and elsewhere in this Annual Information Form, such figures are estimates, which are, in part, based on forward-looking information and certain assumptions, and no assurance can be given that the indicated level of mineral will be produced. Barrick’s estimates of proven and probable reserves may have to be recalculated based on actual production experience. Market price fluctuations of gold, copper and
- 34 -
silver, as well as increased production costs or reduced recovery rates and other factors, may render the present proven and probable reserves unprofitable to develop at a particular site or sites. See “Risk Factors” and “Forward-Looking Information” for additional details concerning factors and risks that could cause actual results to differ from those set out below.
See “Glossary of Technical and Business Terms” for definitions of the terms “mineral resource”, “inferred mineral resource”, “indicated mineral resource”, “measured mineral resource”, “mineral reserve”, “probable mineral reserve” and “proven mineral reserve”.
- 35 -
| Gold Mineral Reserves1,2,3,5,14,16,17,18 | ||||||||||||||||||||||||||||||||||||||||
| As at December 31, 2025 | PROVEN9 | PROBABLE9 | TOTAL9 | |||||||||||||||||||||||||||||||||||||
| Based on attributable ounces | Tonnes
(Mt) |
Grade
(g/t) |
Contained ozs
(Moz) |
Tonnes
(Mt) |
Grade
(g/t) |
Contained ozs
(Moz) |
Tonnes
(Mt) |
Grade
(g/t) |
Contained ozs
(Moz) |
|||||||||||||||||||||||||||||||
| AFRICA AND MIDDLE EAST |
||||||||||||||||||||||||||||||||||||||||
| Bulyanhulu surface |
0.0038 | 4.20 | 0.00052 | — | — | — | 0.0038 | 4.20 | 0.00052 | |||||||||||||||||||||||||||||||
| Bulyanhulu underground |
0.71 | 5.95 | 0.14 | 16 | 7.03 | 3.7 | 17 | 6.98 | 3.8 | |||||||||||||||||||||||||||||||
| Bulyanhulu (84.00%) total |
0.71 | 5.95 | 0.14 | 16 | 7.03 | 3.7 | 17 | 6.98 | 3.8 | |||||||||||||||||||||||||||||||
| Jabal Sayid surface |
0.14 | 0.46 | 0.0021 | — | — | — | 0.14 | 0.46 | 0.0021 | |||||||||||||||||||||||||||||||
| Jabal Sayid underground |
8.4 | 0.30 | 0.080 | 3.2 | 0.49 | 0.051 | 12 | 0.35 | 0.13 | |||||||||||||||||||||||||||||||
| Jabal Sayid (50.00%) total |
8.5 | 0.30 | 0.082 | 3.2 | 0.49 | 0.051 | 12 | 0.35 | 0.13 | |||||||||||||||||||||||||||||||
| Kibali surface |
7.0 | 2.17 | 0.49 | 21 | 2.28 | 1.5 | 28 | 2.25 | 2.0 | |||||||||||||||||||||||||||||||
| Kibali underground |
6.4 | 4.19 | 0.87 | 16 | 3.74 | 1.9 | 23 | 3.86 | 2.8 | |||||||||||||||||||||||||||||||
| Kibali (45.00%) total |
13 | 3.13 | 1.4 | 37 | 2.92 | 3.5 | 50 | 2.97 | 4.8 | |||||||||||||||||||||||||||||||
| Loulo-Gounkoto surface4 |
8.7 | 2.56 | 0.71 | 15 | 3.34 | 1.7 | 24 | 3.06 | 2.4 | |||||||||||||||||||||||||||||||
| Loulo-Gounkoto underground4 |
6.4 | 5.40 | 1.1 | 21 | 5.04 | 3.4 | 27 | 5.13 | 4.5 | |||||||||||||||||||||||||||||||
| Loulo-Gounkoto (80.00%) total4 |
15 | 3.77 | 1.8 | 36 | 4.32 | 5.0 | 51 | 4.16 | 6.9 | |||||||||||||||||||||||||||||||
| North Mara surface |
5.4 | 3.22 | 0.55 | 30 | 1.66 | 1.6 | 35 | 1.90 | 2.2 | |||||||||||||||||||||||||||||||
| North Mara underground |
1.8 | 3.18 | 0.18 | 6.2 | 4.47 | 0.89 | 7.9 | 4.18 | 1.1 | |||||||||||||||||||||||||||||||
| North Mara (84.00%) total |
7.1 | 3.21 | 0.73 | 36 | 2.14 | 2.5 | 43 | 2.32 | 3.2 | |||||||||||||||||||||||||||||||
| AFRICA AND MIDDLE EAST TOTAL |
45 | 2.87 | 4.1 | 130 | 3.55 | 15 | 170 | 3.37 | 19 | |||||||||||||||||||||||||||||||
| SOUTH AMERICA AND ASIA PACIFIC |
||||||||||||||||||||||||||||||||||||||||
| Norte Abierto surface (50.00%) |
240 | 0.69 | 5.4 | 280 | 0.61 | 5.4 | 520 | 0.65 | 11 | |||||||||||||||||||||||||||||||
| Porgera surface |
1.8 | 2.88 | 0.16 | 8.4 | 2.28 | 0.61 | 10 | 2.38 | 0.78 | |||||||||||||||||||||||||||||||
| Porgera underground |
1.2 | 5.85 | 0.23 | 2.5 | 4.97 | 0.40 | 3.7 | 5.26 | 0.63 | |||||||||||||||||||||||||||||||
| Porgera (24.50%) total |
3.0 | 4.10 | 0.40 | 11 | 2.89 | 1.0 | 14 | 3.15 | 1.4 | |||||||||||||||||||||||||||||||
| Reko Diq surface (50.00%) |
— | — | — | 1,400 | 0.28 | 13 | 1,400 | 0.28 | 13 | |||||||||||||||||||||||||||||||
| Veladero surface (50.00%) |
25 | 0.67 | 0.53 | 38 | 0.70 | 0.85 | 62 | 0.69 | 1.4 | |||||||||||||||||||||||||||||||
| SOUTH AMERICA AND ASIA PACIFIC TOTAL |
270 | 0.73 | 6.3 | 1,800 | 0.36 | 20 | 2,000 | 0.41 | 26 | |||||||||||||||||||||||||||||||
| NORTH AMERICA |
||||||||||||||||||||||||||||||||||||||||
| Carlin surface |
5.0 | 1.56 | 0.25 | 52 | 2.32 | 3.9 | 57 | 2.25 | 4.1 | |||||||||||||||||||||||||||||||
| Carlin underground |
— | — | — | 18 | 8.15 | 4.7 | 18 | 8.15 | 4.7 | |||||||||||||||||||||||||||||||
| Carlin (61.50%) total |
5.0 | 1.56 | 0.25 | 70 | 3.81 | 8.6 | 75 | 3.66 | 8.8 | |||||||||||||||||||||||||||||||
| Cortez surface |
1.6 | 1.96 | 0.099 | 60 | 0.92 | 1.8 | 62 | 0.95 | 1.9 | |||||||||||||||||||||||||||||||
| Cortez underground |
— | — | — | 28 | 6.67 | 6.0 | 28 | 6.67 | 6.0 | |||||||||||||||||||||||||||||||
| Cortez (61.50%) total |
1.6 | 1.96 | 0.099 | 88 | 2.76 | 7.8 | 90 | 2.75 | 7.9 | |||||||||||||||||||||||||||||||
| Phoenix surface (61.50%) |
4.2 | 0.71 | 0.097 | 110 | 0.57 | 1.9 | 110 | 0.58 | 2.0 | |||||||||||||||||||||||||||||||
| Pueblo Viejo surface (60.00%)13 |
54 | 2.22 | 3.8 | 130 | 1.99 | 8.5 | 190 | 2.06 | 12 | |||||||||||||||||||||||||||||||
| Turquoise Ridge surface |
— | — | — | 25 | 2.20 | 1.7 | 25 | 2.20 | 1.7 | |||||||||||||||||||||||||||||||
| Turquoise Ridge underground |
6.6 | 11.67 | 2.5 | 14 | 10.09 | 4.7 | 21 | 10.59 | 7.2 | |||||||||||||||||||||||||||||||
| Turquoise Ridge (61.50%) total |
6.6 | 11.67 | 2.5 | 39 | 5.12 | 6.4 | 46 | 6.07 | 8.9 | |||||||||||||||||||||||||||||||
| NORTH AMERICA TOTAL |
71 | 2.96 | 6.8 | 440 | 2.37 | 33 | 510 | 2.46 | 40 | |||||||||||||||||||||||||||||||
|
|
||||||||||||||||||||||||||||||||||||||||
| TOTAL |
390 | 1.38 | 17 | 2,300 | 0.91 | 68 | 2,700 | 0.98 | 85 | |||||||||||||||||||||||||||||||
See “Notes to the Barrick Mineral Reserves and Resources Tables”.
- 36 -
| Copper Mineral Reserves1,2,3,5,14,15,17,18,19 | ||||||||||||||||||||||||||||||||||||||||
| As at December 31, 2025 | PROVEN9 | PROBABLE9 | TOTAL9 | |||||||||||||||||||||||||||||||||||||
| Based on attributable tonnes | Tonnes
(Mt) |
Cu
(%) |
Contained
(Mt) |
Tonnes
(Mt) |
Cu
(%) |
Contained
(Mt) |
Tonnes
(Mt) |
Cu
(%) |
Contained Cu
(Mt) |
|||||||||||||||||||||||||||||||
| AFRICA AND MIDDLE EAST |
||||||||||||||||||||||||||||||||||||||||
| Bulyanhulu surface |
0.0038 | 0.33 | 0.000013 | — | — | — | 0.0038 | 0.33 | 0.000013 | |||||||||||||||||||||||||||||||
| Bulyanhulu underground |
0.71 | 0.32 | 0.0023 | 16 | 0.36 | 0.059 | 17 | 0.36 | 0.061 | |||||||||||||||||||||||||||||||
| Bulyanhulu (84.00%) total |
0.71 | 0.32 | 0.0023 | 16 | 0.36 | 0.059 | 17 | 0.36 | 0.061 | |||||||||||||||||||||||||||||||
| Jabal Sayid surface |
0.14 | 2.65 | 0.0038 | — | — | — | 0.14 | 2.65 | 0.0038 | |||||||||||||||||||||||||||||||
| Jabal Sayid underground |
8.4 | 2.07 | 0.17 | 3.2 | 2.32 | 0.075 | 12 | 2.14 | 0.25 | |||||||||||||||||||||||||||||||
| Jabal Sayid (50.00%) total |
8.5 | 2.08 | 0.18 | 3.2 | 2.32 | 0.075 | 12 | 2.15 | 0.25 | |||||||||||||||||||||||||||||||
| Lumwana surface (100%) |
150 | 0.47 | 0.69 | 1,400 | 0.52 | 7.4 | 1,600 | 0.52 | 8.1 | |||||||||||||||||||||||||||||||
| AFRICA AND MIDDLE EAST TOTAL |
160 | 0.56 | 0.87 | 1,400 | 0.53 | 7.5 | 1,600 | 0.53 | 8.4 | |||||||||||||||||||||||||||||||
| SOUTH AMERICA AND ASIA PACIFIC |
||||||||||||||||||||||||||||||||||||||||
| Norte Abierto surface (50.00%) |
240 | 0.25 | 0.60 | 280 | 0.23 | 0.64 | 520 | 0.24 | 1.2 | |||||||||||||||||||||||||||||||
| Reko Diq surface (50.00%) |
— | — | — | 1,500 | 0.48 | 7.3 | 1,500 | 0.48 | 7.3 | |||||||||||||||||||||||||||||||
| Zaldívar surface (50.00%) |
120 | 0.41 | 0.47 | 62 | 0.38 | 0.24 | 180 | 0.40 | 0.71 | |||||||||||||||||||||||||||||||
| SOUTH AMERICA AND ASIA PACIFIC TOTAL |
360 | 0.30 | 1.1 | 1,800 | 0.44 | 8.2 | 2,200 | 0.42 | 9.2 | |||||||||||||||||||||||||||||||
| NORTH AMERICA |
||||||||||||||||||||||||||||||||||||||||
| Phoenix surface (61.50%) |
6.0 | 0.15 | 0.0092 | 120 | 0.18 | 0.22 | 130 | 0.18 | 0.23 | |||||||||||||||||||||||||||||||
| NORTH AMERICA TOTAL |
6.0 | 0.15 | 0.0092 | 120 | 0.18 | 0.22 | 130 | 0.18 | 0.23 | |||||||||||||||||||||||||||||||
|
|
||||||||||||||||||||||||||||||||||||||||
| TOTAL |
520 | 0.38 | 2.0 | 3,400 | 0.47 | 16 | 3,900 | 0.46 | 18 | |||||||||||||||||||||||||||||||
See “Notes to the Barrick Mineral Reserves and Resources Tables”.
- 37 -
| Silver Mineral Reserves1,2,3,5,14,18 | ||||||||||||||||||||||||||||||||||||||||
| As at December 31, 2025 | PROVEN9 | PROBABLE9 | TOTAL9 | |||||||||||||||||||||||||||||||||||||
| Based on attributable ounces | Tonnes
(Mt) |
Ag
(g/t) |
Contained Ag
(Moz) |
Tonnes
(Mt) |
Ag
(g/t) |
Contained Ag
(Moz) |
Tonnes
(Mt) |
Ag
(g/t) |
Contained Ag
(Moz) |
|||||||||||||||||||||||||||||||
| AFRICA AND MIDDLE EAST |
||||||||||||||||||||||||||||||||||||||||
| Bulyanhulu surface |
0.0038 | 5.10 | 0.00063 | — | — | — | 0.0038 | 5.10 | 0.00063 | |||||||||||||||||||||||||||||||
| Bulyanhulu underground |
0.71 | 5.46 | 0.12 | 16 | 5.32 | 2.8 | 17 | 5.32 | 2.9 | |||||||||||||||||||||||||||||||
| Bulyanhulu (84.00%) total |
0.71 | 5.45 | 0.12 | 16 | 5.32 | 2.8 | 17 | 5.32 | 2.9 | |||||||||||||||||||||||||||||||
| AFRICA AND MIDDLE EAST TOTAL |
0.71 | 5.45 | 0.12 | 16 | 5.32 | 2.8 | 17 | 5.32 | 2.9 | |||||||||||||||||||||||||||||||
| SOUTH AMERICA AND ASIA PACIFIC |
||||||||||||||||||||||||||||||||||||||||
| Norte Abierto surface (50.00%) |
240 | 1.88 | 15.0 | 280 | 1.38 | 12 | 520 | 1.61 | 27 | |||||||||||||||||||||||||||||||
| Veladero surface (50.00%) |
25 | 12.17 | 9.7 | 38 | 13.97 | 17 | 62 | 13.25 | 27 | |||||||||||||||||||||||||||||||
| SOUTH AMERICA AND ASIA PACIFIC TOTAL |
270 | 2.83 | 24 | 310 | 2.88 | 29 | 580 | 2.86 | 54 | |||||||||||||||||||||||||||||||
| NORTH AMERICA |
||||||||||||||||||||||||||||||||||||||||
| Phoenix surface (61.50%) |
4.2 | 7.89 | 1.1 | 110 | 6.54 | 22 | 110 | 6.59 | 23 | |||||||||||||||||||||||||||||||
| Pueblo Viejo surface (60.00%)13 |
54 | 12.01 | 21 | 130 | 12.42 | 53 | 190 | 12.30 | 74 | |||||||||||||||||||||||||||||||
| NORTH AMERICA TOTAL |
58 | 11.70 | 22 | 240 | 9.81 | 75 | 300 | 10.18 | 97 | |||||||||||||||||||||||||||||||
|
|
||||||||||||||||||||||||||||||||||||||||
| TOTAL |
330 | 4.40 | 46 | 570 | 5.85 | 110 | 900 | 5.32 | 150 | |||||||||||||||||||||||||||||||
See “Notes to the Barrick Mineral Reserves and Resources Tables”.
- 38 -
| Gold Mineral Resources1,3,5,6,7,8,14,15,18 | ||||||||||||||||||||||||||||||||||||||||||||||||||||
| As at December 31, 2025 | MEASURED (M)9 | INDICATED (I)9 | (M) + (I)9 | INFERRED10 | ||||||||||||||||||||||||||||||||||||||||||||||||
| Based on attributable ounces | Tonnes
(Mt) |
Grade
(g/t) |
Contained
(Moz) |
Tonnes
(Mt) |
Grade
(g/t) |
Contained ozs
(Moz) |
Contained
(Moz) |
Tonnes
(Mt) |
Grade
(g/t) |
Contained ozs
(Moz) |
||||||||||||||||||||||||||||||||||||||||||
| AFRICA AND MIDDLE EAST |
||||||||||||||||||||||||||||||||||||||||||||||||||||
| Bulyanhulu surface |
0.0038 | 4.20 | 0.00052 | — | — | — | 0.00052 | — | — | — | ||||||||||||||||||||||||||||||||||||||||||
| Bulyanhulu underground |
2.4 | 8.16 | 0.63 | 27 | 7.56 | 6.7 | 7.3 | 9.4 | 7.3 | 2.2 | ||||||||||||||||||||||||||||||||||||||||||
| Bulyanhulu (84.00%) total |
2.4 | 8.16 | 0.63 | 27 | 7.56 | 6.7 | 7.3 | 9.4 | 7.3 | 2.2 | ||||||||||||||||||||||||||||||||||||||||||
| Jabal Sayid surface |
0.14 | 0.46 | 0.0021 | — | — | — | 0.0021 | — | — | — | ||||||||||||||||||||||||||||||||||||||||||
| Jabal Sayid underground |
9.3 | 0.37 | 0.11 | 5.4 | 0.54 | 0.094 | 0.20 | 1.2 | 0.6 | 0.022 | ||||||||||||||||||||||||||||||||||||||||||
| Jabal Sayid (50.00%) total |
9.4 | 0.37 | 0.11 | 5.4 | 0.54 | 0.094 | 0.21 | 1.2 | 0.6 | 0.022 | ||||||||||||||||||||||||||||||||||||||||||
| Kibali surface |
11 | 2.04 | 0.70 | 38 | 2.17 | 2.6 | 3.3 | 18 | 2.0 | 1.1 | ||||||||||||||||||||||||||||||||||||||||||
| Kibali underground |
10 | 4.09 | 1.3 | 32 | 3.35 | 3.4 | 4.8 | 4.5 | 2.4 | 0.35 | ||||||||||||||||||||||||||||||||||||||||||
| Kibali (45.00%) total |
21 | 3.04 | 2.0 | 70 | 2.71 | 6.1 | 8.1 | 22 | 2.1 | 1.5 | ||||||||||||||||||||||||||||||||||||||||||
| Loulo-Gounkoto surface4 |
11 | 2.54 | 0.89 | 19 | 3.34 | 2.1 | 3.0 | 2.8 | 2.4 | 0.22 | ||||||||||||||||||||||||||||||||||||||||||
| Loulo-Gounkoto underground4 |
18 | 4.16 | 2.4 | 38 | 4.22 | 5.1 | 7.5 | 12 | 2.0 | 0.81 | ||||||||||||||||||||||||||||||||||||||||||
| Loulo-Gounkoto (80.00%) total4 |
29 | 3.55 | 3.3 | 57 | 3.93 | 7.2 | 10 | 15 | 2.1 | 1.0 | ||||||||||||||||||||||||||||||||||||||||||
| North Mara surface |
9.9 | 2.68 | 0.85 | 48 | 1.64 | 2.5 | 3.4 | 12 | 1.7 | 0.64 | ||||||||||||||||||||||||||||||||||||||||||
| North Mara underground |
5.3 | 2.09 | 0.36 | 26 | 2.45 | 2.0 | 2.4 | 5.2 | 2.2 | 0.36 | ||||||||||||||||||||||||||||||||||||||||||
| North Mara (84.00%) total |
15 | 2.47 | 1.2 | 74 | 1.92 | 4.6 | 5.8 | 17 | 1.9 | 1.0 | ||||||||||||||||||||||||||||||||||||||||||
| AFRICA AND MIDDLE EAST TOTAL |
76 | 2.95 | 7.3 | 230 | 3.28 | 25 | 32 | 65 | 2.8 | 5.8 | ||||||||||||||||||||||||||||||||||||||||||
| SOUTH AMERICA AND ASIA PACIFIC |
||||||||||||||||||||||||||||||||||||||||||||||||||||
| Norte Abierto surface (50.00%) |
320 | 0.67 | 6.9 | 800 | 0.54 | 14 | 21 | 380 | 0.4 | 5.3 | ||||||||||||||||||||||||||||||||||||||||||
| Pascua-Lama surface (100%) |
43 | 1.86 | 2.6 | 390 | 1.49 | 19 | 21 | 15 | 1.7 | 0.86 | ||||||||||||||||||||||||||||||||||||||||||
| Porgera surface |
6.1 | 2.94 | 0.58 | 19 | 2.18 | 1.3 | 1.9 | 14 | 1.6 | 0.72 | ||||||||||||||||||||||||||||||||||||||||||
| Porgera underground |
2.6 | 5.24 | 0.44 | 5.2 | 4.52 | 0.75 | 1.2 | 1.9 | 3.8 | 0.23 | ||||||||||||||||||||||||||||||||||||||||||
| Porgera (24.50%) total |
8.7 | 3.63 | 1.0 | 24 | 2.68 | 2.1 | 3.1 | 16 | 1.9 | 0.95 | ||||||||||||||||||||||||||||||||||||||||||
| Reko Diq surface (50.00%) |
— | — | — | 1,800 | 0.25 | 15 | 15 | 660 | 0.2 | 4.1 | ||||||||||||||||||||||||||||||||||||||||||
| Veladero surface (50.00%) |
27 | 0.66 | 0.58 | 73 | 0.64 | 1.5 | 2.1 | 14 | 0.6 | 0.26 | ||||||||||||||||||||||||||||||||||||||||||
| SOUTH AMERICA AND ASIA PACIFIC TOTAL |
400 | 0.86 | 11 | 3,100 | 0.51 | 51 | 62 | 1,100 | 0.3 | 11 | ||||||||||||||||||||||||||||||||||||||||||
See “Notes to the Barrick Mineral Reserves and Resources Tables”.
- 39 -
| Gold Mineral Resources1,3,5,6,7,8,14,15,18 | ||||||||||||||||||||||||||||||||||||||||||||||||||||
| As at December 31, 2025 | MEASURED (M)9 | INDICATED (I)9 | (M) + (I)9 | INFERRED10 | ||||||||||||||||||||||||||||||||||||||||||||||||
| Based on attributable ounces | Tonnes
(Mt) |
Grade
(g/t) |
Contained
(Moz) |
Tonnes
(Mt) |
Grade
(g/t) |
Contained
(Moz) |
Contained
(Moz) |
Tonnes
(Mt) |
Grade
(g/t) |
Contained
(Moz) |
||||||||||||||||||||||||||||||||||||||||||
| NORTH AMERICA |
||||||||||||||||||||||||||||||||||||||||||||||||||||
| Carlin surface |
9.6 | 1.31 | 0.41 | 87 | 1.95 | 5.5 | 5.9 | 40 | 0.9 | 1.2 | ||||||||||||||||||||||||||||||||||||||||||
| Carlin underground |
— | — | — | 36 | 7.86 | 9.1 | 9.1 | 20 | 7.3 | 4.6 | ||||||||||||||||||||||||||||||||||||||||||
| Carlin (61.50%) total |
9.6 | 1.31 | 0.41 | 120 | 3.67 | 15 | 15 | 59 | 3.0 | 5.8 | ||||||||||||||||||||||||||||||||||||||||||
| Cortez surface |
1.6 | 1.96 | 0.099 | 97 | 0.89 | 2.8 | 2.9 | 31 | 0.6 | 0.60 | ||||||||||||||||||||||||||||||||||||||||||
| Cortez underground |
— | — | — | 39 | 6.23 | 7.8 | 7.8 | 16 | 5.7 | 3.0 | ||||||||||||||||||||||||||||||||||||||||||
| Cortez (61.50%) total |
1.6 | 1.96 | 0.099 | 140 | 2.42 | 11 | 11 | 47 | 2.4 | 3.6 | ||||||||||||||||||||||||||||||||||||||||||
| Fourmile underground (100%) |
— | — | — | 4.6 | 17.59 | 2.6 | 2.6 | 25 | 16.9 | 13 | ||||||||||||||||||||||||||||||||||||||||||
| Phoenix surface (61.50%) |
4.2 | 0.71 | 0.097 | 300 | 0.45 | 4.3 | 4.4 | 16 | 0.4 | 0.23 | ||||||||||||||||||||||||||||||||||||||||||
| Pueblo Viejo surface (60.00%)13 |
65 | 2.07 | 4.3 | 180 | 1.82 | 11 | 15 | 9.4 | 1.5 | 0.46 | ||||||||||||||||||||||||||||||||||||||||||
| Turquoise Ridge surface |
9.0 | 10.99 | 3.2 | 43 | 1.88 | 2.6 | 2.6 | 14 | 1.1 | 0.50 | ||||||||||||||||||||||||||||||||||||||||||
| Turquoise Ridge underground |
— | — | — | 20 | 9.59 | 6.1 | 9.3 | 4.8 | 9.5 | 1.5 | ||||||||||||||||||||||||||||||||||||||||||
| Turquoise Ridge (61.50%) total |
9.0 | 10.99 | 3.2 | 63 | 4.30 | 8.7 | 12 | 19 | 3.2 | 2.0 | ||||||||||||||||||||||||||||||||||||||||||
| NORTH AMERICA TOTAL |
89 | 2.82 | 8.1 | 810 | 1.98 | 51 | 59 | 180 | 4.5 | 25 | ||||||||||||||||||||||||||||||||||||||||||
|
|
||||||||||||||||||||||||||||||||||||||||||||||||||||
| TOTAL |
570 | 1.45 | 26 | 4,200 | 0.95 | 130 | 150 | 1,300 | 1.0 | 43 | ||||||||||||||||||||||||||||||||||||||||||
See “Notes to the Barrick Mineral Reserves and Resources Tables”.
- 40 -
| Copper Mineral Resources1,3,5,6,7,8,14,15,18 | ||||||||||||||||||||||||||||||||||||||||||||||||||||
| As at December 31, 2025 | MEASURED (M)9 | INDICATED (I)9 | (M) + (I)9 | INFERRED10 | ||||||||||||||||||||||||||||||||||||||||||||||||
| Based on attributable pounds | Tonnes
(Mt) |
Grade
(%) |
Contained
(Mt) |
Tonnes
(Mt) |
Grade
(%) |
Contained
(Mt) |
Contained
(Mt) |
Tonnes
(Mt) |
Grade
(%) |
Contained
(Mt) |
||||||||||||||||||||||||||||||||||||||||||
| AFRICA AND MIDDLE EAST |
||||||||||||||||||||||||||||||||||||||||||||||||||||
| Bulyanhulu surface |
0.0038 | 0.33 | 0.000013 | — | — | — | 0.000013 | — | — | — | ||||||||||||||||||||||||||||||||||||||||||
| Bulyanhulu underground |
2.4 | 0.38 | 0.0093 | 27 | 0.38 | 0.11 | 0.11 | 9.4 | 0.3 | 0.032 | ||||||||||||||||||||||||||||||||||||||||||
| Bulyanhulu (84.00%) total |
2.4 | 0.38 | 0.0093 | 27 | 0.38 | 0.11 | 0.11 | 9.4 | 0.3 | 0.032 | ||||||||||||||||||||||||||||||||||||||||||
| Jabal Sayid surface |
0.14 | 2.65 | 0.0038 | — | — | — | 0.0038 | — | — | — | ||||||||||||||||||||||||||||||||||||||||||
| Jabal Sayid underground |
9.3 | 2.43 | 0.23 | 5.4 | 2.25 | 0.12 | 0.35 | 1.2 | 0.4 | 0.0049 | ||||||||||||||||||||||||||||||||||||||||||
| Jabal Sayid (50.00%) total |
9.4 | 2.44 | 0.23 | 5.4 | 2.25 | 0.12 | 0.35 | 1.2 | 0.4 | 0.0049 | ||||||||||||||||||||||||||||||||||||||||||
| Lumwana surface (100%) |
190 | 0.43 | 0.83 | 1,900 | 0.49 | 9.3 | 10 | 250 | 0.4 | 0.91 | ||||||||||||||||||||||||||||||||||||||||||
| AFRICA AND MIDDLE EAST TOTAL |
210 | 0.52 | 1.1 | 1,900 | 0.49 | 9.5 | 11 | 260 | 0.4 | 0.95 | ||||||||||||||||||||||||||||||||||||||||||
| SOUTH AMERICA AND ASIA PACIFIC |
||||||||||||||||||||||||||||||||||||||||||||||||||||
| Norte Abierto surface (50.00%) |
300 | 0.24 | 0.74 | 760 | 0.21 | 1.6 | 2.3 | 370 | 0.2 | 0.79 | ||||||||||||||||||||||||||||||||||||||||||
| Reko Diq surface (50.00%) |
— | — | — | 2,000 | 0.43 | 8.5 | 8.5 | 720 | 0.3 | 2.4 | ||||||||||||||||||||||||||||||||||||||||||
| Zaldívar surface (50.00%) |
230 | 0.38 | 0.86 | 280 | 0.35 | 0.99 | 1.9 | 14 | 0.3 | 0.046 | ||||||||||||||||||||||||||||||||||||||||||
| SOUTH AMERICA AND ASIA PACIFIC TOTAL |
530 | 0.30 | 1.6 | 3,000 | 0.37 | 11 | 13 | 1,100 | 0.3 | 3.2 | ||||||||||||||||||||||||||||||||||||||||||
| NORTH AMERICA |
||||||||||||||||||||||||||||||||||||||||||||||||||||
| Phoenix surface (61.50%) |
6.0 | 0.15 | 0.0092 | 330 | 0.16 | 0.54 | 0.55 | 19 | 0.1 | 0.023 | ||||||||||||||||||||||||||||||||||||||||||
| NORTH AMERICA TOTAL |
6.0 | 0.15 | 0.0092 | 330 | 0.16 | 0.54 | 0.55 | 19 | 0.1 | 0.023 | ||||||||||||||||||||||||||||||||||||||||||
|
|
||||||||||||||||||||||||||||||||||||||||||||||||||||
| TOTAL |
740 | 0.36 | 2.7 | 5,300 | 0.40 | 21 | 24 | 1,400 | 0.3 | 4.2 | ||||||||||||||||||||||||||||||||||||||||||
See “Notes to the Barrick Mineral Reserves and Resources Tables”.
- 41 -
| Silver Mineral Resources1,3,5,6,7,8,14,15,18 | ||||||||||||||||||||||||||||||||||||||||||||||||||||
| As at December 31, 2025 | MEASURED (M)9 | INDICATED (I)9 | (M) + (I)9 | INFERRED10 | ||||||||||||||||||||||||||||||||||||||||||||||||
| Based on attributable ounces | Tonnes
(Mt) |
Ag
(g/t) |
Contained
(Moz) |
Tonnes
(Mt) |
Ag
(g/t) |
Contained
(Moz) |
Contained
(Moz) |
Tonnes
(Mt) |
Ag
(g/t) |
Contained
(Moz) |
||||||||||||||||||||||||||||||||||||||||||
| AFRICA AND MIDDLE EAST |
||||||||||||||||||||||||||||||||||||||||||||||||||||
| Bulyanhulu surface |
0.0038 | 5.10 | 0.00063 | — | — | — | 0.00063 | — | — | — | ||||||||||||||||||||||||||||||||||||||||||
| Bulyanhulu underground |
2.4 | 6.94 | 0.54 | 27 | 5.70 | 5.0 | 5.6 | 9.4 | 5.8 | 1.8 | ||||||||||||||||||||||||||||||||||||||||||
| Bulyanhulu (84.00%) total |
2.4 | 6.94 | 0.54 | 27 | 5.70 | 5.0 | 5.6 | 9.4 | 5.8 | 1.8 | ||||||||||||||||||||||||||||||||||||||||||
| AFRICA AND MIDDLE EAST TOTAL |
2.4 | 6.94 | 0.54 | 27 | 5.70 | 5.0 | 5.6 | 9.4 | 5.8 | 1.8 | ||||||||||||||||||||||||||||||||||||||||||
| SOUTH AMERICA AND ASIA PACIFIC |
||||||||||||||||||||||||||||||||||||||||||||||||||||
| Norte Abierto surface (50.00%) |
320 | 1.72 | 18 | 800 | 1.18 | 30 | 48 | 380 | 1.0 | 13 | ||||||||||||||||||||||||||||||||||||||||||
| Pascua-Lama surface (100%) |
43 | 57.21 | 79 | 390 | 52.22 | 660 | 740 | 15 | 17.8 | 8.8 | ||||||||||||||||||||||||||||||||||||||||||
| Veladero surface (50.00%) |
27 | 12.50 | 11 | 73 | 13.56 | 32 | 43 | 14 | 13.8 | 6.3 | ||||||||||||||||||||||||||||||||||||||||||
| SOUTH AMERICA AND ASIA PACIFIC TOTAL |
390 | 8.54 | 110 | 1,300 | 17.67 | 720 | 830 | 410 | 2.1 | 28 | ||||||||||||||||||||||||||||||||||||||||||
| NORTH AMERICA |
||||||||||||||||||||||||||||||||||||||||||||||||||||
| Phoenix surface (61.50%) |
4.2 | 7.89 | 1.1 | 300 | 5.68 | 55 | 56 | 16 | 5.4 | 2.8 | ||||||||||||||||||||||||||||||||||||||||||
| Pueblo Viejo surface (60.00%)13 |
65 | 11.15 | 23 | 180 | 11.16 | 65 | 88 | 9.4 | 8.3 | 2.5 | ||||||||||||||||||||||||||||||||||||||||||
| NORTH AMERICA TOTAL |
69 | 10.95 | 24 | 480 | 7.75 | 120 | 140 | 26 | 6.5 | 5.3 | ||||||||||||||||||||||||||||||||||||||||||
|
|
||||||||||||||||||||||||||||||||||||||||||||||||||||
| TOTAL |
460 | 8.89 | 130 | 1,800 | 14.80 | 840 | 980 | 450 | 2.4 | 35 | ||||||||||||||||||||||||||||||||||||||||||
See “Notes to the Barrick Mineral Reserves and Resources Tables”.
- 42 -
GLOBAL PROVEN & PROBABLE MINERAL RESERVE RECONCILIATION (gold, Moz) 1,2,3,5,6,8,9,14,15,16,17,18
| Global Attributable Contained Metal |
2024 Barrick Mineral Reserve |
Acquisition /Disposal |
Depletion (As of Year End) |
Net Conversion |
2025 Barrick Total P&P Mineral Reserve |
|||||||||||||||
| Bulyanhulu (84%) |
3.8 | — | (0.16 | ) | 0.19 | 3.8 | ||||||||||||||
| Carlin (61.5%) |
9.5 | — | (0.79 | ) | 0.14 | 8.8 | ||||||||||||||
| Cortez (61.5%) |
8.3 | — | (0.50 | ) | 0.15 | 7.9 | ||||||||||||||
| Hemlo (100%)12 |
1.6 | (1.6 | ) | — | — | — | ||||||||||||||
| Jabal Sayid (50%) |
0.16 | — | (0.022 | ) | 0.0029 | 0.13 | ||||||||||||||
| Kibali (45%) |
4.6 | — | (0.34 | ) | 0.58 | 4.8 | ||||||||||||||
| Loulo Gounkoto (80%)4 |
7.3 | — | (0.12 | ) | (0.35 | ) | 6.9 | |||||||||||||
| Norte Abierto (50%) |
12 | — | — | (0.79 | ) | 11 | ||||||||||||||
| North Mara (84%) |
2.9 | — | (0.28 | ) | 0.58 | 3.2 | ||||||||||||||
| Phoenix (61.5%) |
1.9 | — | (0.14 | ) | 0.29 | 2.0 | ||||||||||||||
| Porgera (24.5%) |
1.5 | — | (0.087 | ) | 0.014 | 1.4 | ||||||||||||||
| Pueblo Viejo (60%) |
12 | — | (0.56 | ) | 0.58 | 12 | ||||||||||||||
| Reko Diq (50%) |
13 | — | — | — | 13 | |||||||||||||||
| Tongon (89.7%)11 |
0.62 | (0.54 | ) | (0.076 | ) | — | — | |||||||||||||
| Turquoise Ridge (61.5%) |
8.9 | — | (0.33 | ) | 0.31 | 8.9 | ||||||||||||||
| Veladero (50%) |
1.6 | — | (0.27 | ) | 0.063 | 1.4 | ||||||||||||||
| Grand Total |
89 | (2.2 | ) | (3.7 | ) | 1.8 | 85 | |||||||||||||
See “Notes to the Barrick Mineral Reserves and Resources Tables”.
GLOBAL PROVEN & PROBABLE MINERAL RESERVE RECONCILIATION (copper, Mt) 1,2,3,5,7,8,9,15,17,18,19
| Global Attributable Contained Metal |
2024 Barrick Total P&P Mineral Reserve |
Acquisition /Disposal |
Depletion (As of Year End) |
Net Conversion |
2025 Barrick Total P&P Mineral Reserve |
|||||||||||||||
| Bulyanhulu (84%) |
0.06 | — | (0.0026 | ) | 0.004 | 0.061 | ||||||||||||||
| Jabal Sayid (50%) |
0.28 | — | (0.038 | ) | 0.0056 | 0.25 | ||||||||||||||
| Lumwana (100%) |
8.3 | — | (0.17 | ) | (0.075 | ) | 8.1 | |||||||||||||
| Norte Abierto (50%) |
1.3 | — | — | (0.07 | ) | 1.2 | ||||||||||||||
| Phoenix (61.5%) |
0.21 | — | 0.014 | 0.028 | 0.23 | |||||||||||||||
| Reko Diq (50%) |
7.3 | — | — | — | 7.3 | |||||||||||||||
| Zaldívar (50%) |
0.75 | — | (0.095 | ) | (0.048 | ) | 0.71 | |||||||||||||
| Grand Total |
18 | — | (0.32 | ) | (0.06 | ) | 18 | |||||||||||||
See “Notes to the Barrick Mineral Reserves and Resources Tables”.
- 43 -
Notes to the Barrick Mineral Reserves and Resources Tables
| 1. | Mineral reserves and mineral resources have been estimated as at December 31, 2025 (unless otherwise noted) in accordance with National Instrument 43-101 as required by Canadian securities regulatory authorities. For United States reporting purposes, the SEC has adopted amendments to its disclosure rules to modernize the mineral property disclosure requirements for issuers whose securities are registered with the SEC under the Exchange Act (the “SEC Modernization Rules”) which became effective February 25, 2019 with compliance required for the first fiscal year beginning on or after January 1, 2021. The SEC Modernization Rules replace the historical property disclosure requirements for mining registrants that were included in SEC Industry Guide 7 (“Guide 7”), which was rescinded from and after the required compliance date of the SEC Modernization Rules. As a result of the adoption of the SEC Modernization Rules, the SEC now recognizes estimates of “measured”, “indicated” and “inferred” mineral resources. In addition, the SEC has amended its definitions of “proven mineral reserves” and “probable mineral reserves” to be substantially similar to the corresponding CIM definitions, as required by National Instrument 43-101. Under the MJDS, Barrick is permitted to use its Canadian disclosures, including its reserve and resource disclosures pursuant to National Instrument 43-101, to satisfy certain United States periodic reporting obligations. As a result, Barrick does not report its reserves and resources under the SEC Modernization Rules, and as such, Barrick’s mineral reserve and mineral resource disclosure may not be directly comparable to the disclosures made by domestic United States issuers or non-domestic United States issuers that do not rely on MJDS. U.S. investors should understand that “inferred” mineral resources have a great amount of uncertainty as to their existence and great uncertainty as to their economic and legal feasibility. In addition, U.S. investors are cautioned not to assume that any part or all of Barrick’s mineral resources constitute or will be converted into reserves. Mineral resource and mineral reserve estimations have been prepared by employees of Barrick, its joint venture partners or its joint venture operating companies, as applicable, under the supervision of Tricia Evans, BSc, SMERM, Head of Mineral Resource Management, North America; Mark Roux, BSc (Hons), P. Grad. Cert. (Geostatistics), Pr. Sci. Nat, Evaluations Manager, Resource Geology, North America; Richard Peattie, MPhil, FAusIMM, Senior Vice President, Technical, Africa and Middle East; Peter Jones, MAIG, Manager Resource Geology, South America and Asia Pacific; and Joel Holliday, FAusIMM, Executive Vice-President, Exploration – each a “Qualified Person” as defined in National Instrument 43-101 – Standards of Disclosure for Mineral Projects. For 2025, reserves have been estimated based on an assumed gold price of US$1,500 per ounce, an assumed silver price of US$21.00 per ounce, and an assumed copper price of US$3.25 per pound and long-term average exchange rates of 1.30 CAD/US$, except at Zaldívar, where mineral reserves for 2025 were calculated using Antofagasta guidance and an updated assumed copper price of US$4.15 per pound; and at Norte Abierto where mineral reserves are reported by Newmont using $1,700 per ounce for gold, $3.50 per pound for copper and $20 per ounce for silver pit design. For 2024, reserves were estimated based on an assumed gold price of US$1,400 per ounce, an assumed silver price of US$20.00 per ounce, and an assumed copper price of US$3.00 per pound and long-term average exchange rates of 1.30 CAD/US$, except at Tongon and Hemlo open pit, where mineral reserves for 2024 were calculated using US$1,650 per ounce, at Zaldívar, where mineral reserves for 2024 were calculated using Antofagasta guidance and an updated assumed copper price of US$3.80 per pound and at Norte Abierto where mineral reserves are reported by Newmont using US$1,200 per ounce for gold, US$2.75 per pound for copper and US$22 per ounce for silver pit design, before application of updated 2023 project economics using escalated operating and capital costs resulting in Newmont guidance of US$1,600 per ounce for gold, US$4.00 per pound for copper and US$23 per ounce for silver for assumed mineral reserve commodity prices. Reserve estimates incorporate current and/or expected mine plans and cost levels at each property. Varying cut-off grades have been used depending on the mine and type of ore contained in the reserves. Barrick’s normal data verification procedures have been employed in connection with the calculations. Verification procedures include industry-standard quality control practices. Resources as at December 31, 2025 have been estimated using varying cut-off grades, depending on both the type of mine or project, its maturity and ore types at each property. All figures are presented on an attributable basis to Barrick. |
| 2. | In confirming the annual reserves for each of the Company’s mineral properties, projects, and operations, Barrick conducts a reserve test on December 31 of each year to verify that the future undiscounted cash flow from reserves is positive. The cash flow ignores all sunk costs and only considers future operating and closure expenses as well as any future capital costs. |
| 3. | All mineral resource and mineral reserve estimates of tonnes, ounces of gold and silver and tonnes of copper are reported to the second significant digit. |
| 4. | The estimated mineral resources and mineral reserves for the Loulo-Gounkoto Complex, which were done under the 1991 Malian Mining Code and the Loulo and Gounkoto Mining Conventions under which the Complex has operated until November 24, 2025, have been tested under the 2023 Mining Code and no material impact was found. |
| 5. | 2025 polymetallic mineral resources and mineral reserves are estimated using the combined value of gold, copper and silver and accordingly are reported as gold, copper and silver mineral resources and mineral reserves. |
| 6. | For 2025, mineral resources have been estimated based on an assumed gold price of US$2,000 per ounce, an assumed silver price of US$25.00 per ounce, and an assumed copper price of US$4.50 per pound and long-term average exchange rates of 1.30 CAD/US$, except Zaldívar, where mineral resources for 2025 were estimated using Antofagasta guidance and an assumed copper price of US$4.75 per pound, and Norte Abierto, where mineral resources are reported by Newmont using $2,000 per ounce for gold, $4.00 per pound for copper and $23.00 per ounce for silver pit shell. For 2024, mineral resources were estimated based on an assumed gold price of US$1,900 per ounce, an assumed silver price of US$24.00 per ounce, and an assumed copper price of US$4.00 per pound and long-term average exchange rates of 1.30 CAD/US$, except at Zaldívar, where mineral resources for 2024 were calculated using Antofagasta guidance and an assumed copper price of US$4.40 per pound, and at Norte Abierto, where mineral resources are reported by Newmont using $1,400 per ounce for gold, $3.25 per pound for copper and $20.00 per ounce for silver pit shell, before application of updated 2023 project economics using escalated operating and capital costs resulting in Newmont guidance of $1,600 per ounce for gold, $4.00 per pound for copper and $23.00 per ounce for silver for assumed mineral resource commodity price. |
| 7. | Mineral resources are reported on an inclusive basis and include all areas that form mineral reserves, reported at a mineral resource cut-off and associated commodity price. |
| 8. | Mineral resources which are not mineral reserves do not have demonstrated economic viability. |
| 9. | All measured and indicated mineral resource estimates of grade and all proven and probable mineral reserve estimates of grade for gold, silver and copper are reported to two decimal places. |
| 10. | All inferred mineral resource estimates of grade for gold, silver, and copper are reported to one decimal place. |
| 11. | On December 1, 2025, Barrick sold its interest in the Tongon gold mine to the Atlantic Group. For additional information, see “General Development of the Business — Strategy.” |
| 12. | On November 26, 2025, Barrick sold the Hemlo gold mine to Carcetti Capital Corp. For additional information, see “General Development of the Business — Strategy.” |
- 44 -
| 13. | For 2025 Mineral Resources and Mineral Reserves, Pueblo Viejo is reported as part of the North America Region and sub-totals. For 2024 Mineral Resources and Mineral Reserves, Pueblo Viejo was reported as part of the South America and Asia Pacific region (previously referred to as the “Latin America and Asia Pacific region”) and sub-totals. |
| 14. | Grade represents an average, weighted by reference to tonnes of mineralization where several recovery processes apply. |
| 15. | Ounces or tonnes, as applicable, estimated to be present in the tonnes of mineralization which would be mined and processed. |
| 16. | Gold mineral reserves as at December 31, 2025 include stockpile material totaling approximately 125 million tonnes, containing approximately 7.4 million ounces. Properties at which stockpile material exceeds 30,000 ounces or represents more than 5% of the reported gold reserves are as follows: |
| Stockpiles 1,2 | |||||||||||||||
| Property |
Tonnes 3 (Mt) |
Grade 9 (g/t) |
Contained Ounces 3 (Moz) | ||||||||||||
| Kibali (45%) |
1.7 | 1.07 | 0.057 | ||||||||||||
| Loulo Gounkoto (80%)4 |
4.7 | 1.69 | 0.26 | ||||||||||||
| North Mara (84%) 14 |
13 | 1.01 | 0.42 | ||||||||||||
| Phoenix (61.5%) 5 |
4.2 | 0.71 | 0.097 | ||||||||||||
| Carlin (61.5%) |
24 | 2.15 | 1.7 | ||||||||||||
| Cortez (61.5%) |
1.7 | 2.01 | 0.11 | ||||||||||||
| Turquoise Ridge (61.5%) |
14 | 2.41 | 1.1 | ||||||||||||
| Pueblo Viejo (60%) 13 |
55 | 2.04 | 3.6 | ||||||||||||
| Veladero (50%) 5 |
6.4 | 0.38 | 0.078 | ||||||||||||
| 17. | The metallurgical recovery applicable at each property and the cut-off grades used to determine mineral reserves as at December 31, 2025 are as follows: |
| Gold Mine | Metallurgical Recovery (%) |
Cut-off Grade (COG) (g/t) | ||
| Kibali (45%) |
75.5 to 91.0 | 0.76 to 2.06 | ||
| Loulo Gounkoto (80%) 4 |
78.0 to 93.0 | 0.76 to 2.78 | ||
| Bulyanhulu (84%) |
87.0 to 94.5 | Revenue COG based on all three metals (Au, Ag and Cu) | ||
| North Mara (84%) |
85.3 to 92.5 | 0.68 to 2.49 | ||
| Phoenix (61.5%) |
67.9 to 78.0 Au | Revenue COG based on all three metals (Au, Ag and Cu) | ||
| Carlin (61.5%) |
50.8 to 89.5 | 0.15 to 7.97 | ||
| Cortez (61.5%) |
35.0 to 90.5 | 0.20 to 5.38 | ||
| Turquoise Ridge (61.5%) |
53 to 87.5 | 0.15 to 8.04 | ||
| Norte Abierto (50%) |
85.0 | Revenue COG based on all three metals (Au, Ag and Cu) | ||
| Pueblo Viejo (60%) 13 |
74.5 to 85.7 | Revenue COG based on all three metals (Au, Ag and Cu) | ||
| Veladero (50%) |
49.0 to 85.0 | 0.23 to 0.73 | ||
| Porgera (24.5%) |
90.0 | 1.0 to 2.82 | ||
| Reko Diq (50%) |
44.5 to 80.2 Au | Revenue COG based on Cu and Au | ||
| Copper Mine | Metallurgical Recovery (%) |
Cut-off Grade (COG) (%) | ||
| Lumwana (100%) |
81.3 to 96.5 | 0.15% to 0.25% | ||
| Reko Diq (50%) |
86.7 to 91.0 | Revenue COG based on Cu and Au | ||
| Jabal Sayid (50%) |
79.3 to 93.7 | Revenue COG based on all three metals (Au, Ag and Cu) | ||
| Phoenix (61.5%) |
49 to 71.0 | Revenue COG based on all three metals (Au, Ag and Cu) | ||
| Zaldívar (50%) |
12.1 to 83.1 | 0.23% to 0.30% | ||
| 18. | Totals may not sum due to rounding. |
| 19. | Copper mineral reserves as at December 31, 2025 include stockpile material totaling approximately 49 million tonnes containing approximately 0.14 million tonnes of copper. Properties at which stockpile material exceeds 4,500 tonnes of copper or represents more than 5% of the reported copper reserves are as follows: |
- 45 -
| Stockpiles 1,2 | |||||||||||||||
| Property | Tonnes3 (Mt) |
Cu Grade 9 (%) |
Contained Copper3 (Mt) | ||||||||||||
| Lumwana (100%) | 27 | 0.31 | 0.082 | ||||||||||||
| Zaldívar (50%) | 16 | 0.35 | 0.057 | ||||||||||||
| Phoenix (61.5%) | 6 | 0.15 | 0.0092 | ||||||||||||
- 46 -
Marketing and Distribution
Gold
Gold can be readily sold on numerous markets throughout the world and it is not difficult to ascertain its market price at any particular time. Benchmark prices are generally based on the London gold market quotations. Gold bullion is held as an asset class for a variety of reasons, including as a store of value and a safeguard against the collapse of paper assets such as stocks, bonds and other financial instruments that are traded in fiat currencies not exchangeable into gold (at a fixed rate) under a “gold standard”, as a hedge against future inflation and for portfolio diversification. Governments, central banks and other official institutions hold significant quantities of gold as a component of exchange reserves. Since there are a large number of available gold purchasers, Barrick is not dependent upon the sale of gold to any one customer.
During 2025, the gold price ranged from $2,615 per ounce to an all-time high of $4,550 per ounce. The average market price for the year of $3,432 per ounce represented an all-time annual high and a 44% increase compared to the 2024 annual average of $2,386 per ounce. During the year, the gold price rose strongly and reached all-time high nominal and average prices, as inflation pressures eased and benchmark interest rates were cut, while the global economic outlook remained uncertain, the trade-weighted U.S. dollar weakened and geopolitical conflicts persisted, underscoring gold’s role as a safe haven investment and store of value. Subsequent to year end, gold has traded at an average price greater than 2025’s record annual average price of $3,432 per ounce, due in part to continued economic uncertainty and a weakening in the trade-weighted U.S. dollar. For additional information, see “Risk Factors – Inflation”, “Risk Factors – The Company may be affected by global supply chain disruptions”, “Risk Factors – Global financial conditions” and “Risk Factors – Potential impact of tariffs on the Company’s business”.
Barrick’s gold is refined to market delivery standards by several refiners throughout the world. The gold is sold to various gold bullion dealers or to refiners at market prices. Certain of Barrick’s operations also produce gold concentrate, which is sold to various smelters. The Company believes that, because of the availability of alternative smelters or refiners, no material adverse effect would result if the Company lost the services of any of its current smelters or refiners.
During the third quarter of 2025, Barrick entered into 25,000 ounces of zero cost gold collars that mature every month between September 2025 and August 2028 for a total of 900,000 ounces. These contracts contain purchased put and sold call options with strike prices of $3,100 per ounce and $4,310 per ounce, respectively. These contracts are designated as cash flow hedges, with the effective portion of the hedge recognized in other comprehensive income and the ineffective portion recognized as loss (gain) on non-hedge derivatives. The realized loss (gain) related to these positions was $nil for 2025. As at December 31, 2025, the fair value of the remaining derivatives is a loss of $386 million, with $89 million recorded as other current liabilities and $297 million recorded as other non-current liabilities.
Product fabrication and bullion investment are two principal sources of gold demand. The introduction of more readily accessible and liquid gold investment vehicles has further facilitated investment in gold. Within the fabrication category, there are a wide variety of end uses, the largest of which is the manufacture of jewelry. Other fabrication purposes include official coins, electronics, miscellaneous industrial and decorative uses, dentistry, medals and medallions.
Copper
Copper is a metal with inherent characteristics of excellent electrical conductivity, heat transfer, and resistance to corrosion. Copper is used principally in telecommunications, power infrastructure, automobiles, construction and consumer durables. Copper is primarily traded on the London Metal Exchange (“LME”), the New York Commodity Exchange and the Shanghai Futures Exchange. The price
- 47 -
of copper as reported on these exchanges is influenced by numerous factors, including: (i) the worldwide balance of copper demand and supply; (ii) rates of global economic growth, including in China, which has become the largest consumer of refined copper in the world; (iii) speculative investment positions in copper and copper futures; (iv) the availability and cost of substitute materials; and (v) currency exchange fluctuations, including the relative strength of the U.S. dollar.
The copper market is volatile and cyclical. Over the last 15 years, LME prices per pound have ranged from a low of $1.96 to a high of $5.88, reached in December 2025. During 2025, LME copper prices traded in a range of $3.68 per pound to an all-time high of $5.88 per pound, averaged an all-time average annual high of $4.51 per pound, up 9% from the average of $4.15 per pound in 2024, and closed the year at $5.67 per pound. Copper prices are significantly influenced by physical demand from emerging markets, especially China. Copper prices in 2025 were impacted by reductions in benchmark interest rates made possible by a moderation of inflation pressures along with continued supply disruptions, a decrease in the trade-weighted U.S. dollar, and tariff concerns. Subsequent to year end, copper prices have continued to trade above the 2025 average price as a result of a continuation of these trends and a weakening in the trade-weighted U.S. dollar. For additional information, see “Risk Factors – Inflation”, “Risk Factors – The Company may be affected by global supply chain disruptions”, “Risk Factors – Global financial conditions” and “Risk Factors – Potential impact of tariffs on the Company’s business”.
As at December 31, 2025, the Company had no copper derivative contracts in place. As a result, all of Barrick’s copper production is currently subject to market prices.
At the Zaldívar mine, copper cathode is sold to copper product manufacturers and copper traders, while concentrate is sold to a local smelter in Chile. At the Lumwana mine, copper concentrate is sold to Zambian smelters. At the Jabal Sayid mine, copper concentrate is sold to third party smelters and copper traders. Since there are a large number of available copper cathode and copper concentrate purchasers, Barrick is not dependent upon the sale of copper to any one customer.
Employees and Labor Relations
As at December 31, 2025, excluding contractors, Barrick employed approximately 27,000 employees worldwide, including employees at operations jointly owned and operated by Barrick, substantially all of whom are employed in Canada, the United States, Argentina, Chile, the Dominican Republic, the DRC, Mali, Pakistan, Papua New Guinea, Peru, Saudi Arabia, Tanzania, Zambia and the United Arab Emirates, and approximately 32,300 contractors. The number of employees represented by a labor union or covered by collective bargaining agreements at the Company’s operations is approximately 13,000. Employment figures for Barrick’s Mali-based operations, which are included in the totals above, are current as of June 30, 2025.
Specialized knowledge and experience are required of employees in the mining industry. Barrick has the necessary skilled employees and/or contractors to conduct its operations. Certain Barrick mines may be adversely impacted if increased demands from its employees lead to work stoppages or the Company is unable to retain a sufficient number of qualified employees for such operations (see “Employee relations” and “Competition” in “Risk Factors”).
Competition
The Company competes with other mining and exploration companies in connection with the acquisition of mining claims and leases and in connection with the recruitment and retention of highly skilled and experienced employees (see “Employees and Labor Relations” above).
There is significant competition for mining claims and leases and, as a result, the Company may be unable to acquire attractive assets on terms it considers acceptable.
- 48 -
Sustainability
Barrick’s sustainability strategy is its business plan. Although the Company takes an integrated and holistic approach to its sustainability management, Barrick discusses its sustainability strategy within four overarching pillars: (1) respecting human rights; (2) protecting the health and safety of its people and local communities; (3) sharing the benefits of its operations; and (4) managing its impacts on the environment.
The bedrock of Barrick’s sustainability strategy is strong governance. The Company’s most senior management-level body dedicated to sustainability is the Environmental and Social Oversight Committee (“E&S Committee”), which connects site-level ownership of the sustainability strategy with the leadership of the Group. The E&S Committee is chaired by the President and Chief Executive Officer and includes: (1) regional Chief Operating Officers; (2) minesite General Managers; (3) Health, Safety, Environment and Closure Leads; (4) the Group Sustainability Executive; (5) in-house legal counsel; and (6) an independent sustainability consultant in an advisory role. The E&S Committee meets quarterly to review the Company’s performance across a range of key performance indicators, and to provide independent oversight and review of sustainability management. The quarterly E&S Committee meetings are supplemented by weekly meetings between the Regional Sustainability Leads and the Group Sustainability Executive to examine sustainability-related risks and opportunities impacting the Company in real-time.
The President and Chief Executive Officer reviews the reports of the E&S Committee at every quarterly meeting of the Board’s Environmental, Social, Governance & Nominating Committee (“ESG & Nominating Committee”) to ensure the implementation of the Company’s sustainability policies and to drive performance of its environmental, health and safety, community relations and development, and human rights programs. The ESG & Nominating Committee is responsible for overseeing Barrick’s policies, programs and performance relating to sustainability and the environment, including climate change. The Audit & Risk Committee also assists the Board in overseeing the Group’s management of enterprise risks as well as the implementation of policies and standards for monitoring and mitigating such risks, including climate change.
Incentive payments for senior leaders under Barrick’s Partnership Plan are tied to sustainability performance. In addition, the Company’s undrawn $3.0 billion revolving credit facility includes certain sustainability-linked metrics, such as Scope 1 and Scope 2 GHG intensity, water use efficiency, and TRIFR. Barrick may incur positive or negative pricing adjustments on drawn credit spreads and standby fees based on its sustainability performance versus the targets that have been set.
As a member of the International Council on Mining and Metals (“ICMM”) and World Gold Council (“WGC”), Barrick has endorsed and implemented the ICMM’s Mining Principles and WGC’s Responsible Gold Mining Principles (the “RGMPs”). Barrick’s conformance with these frameworks, collectively referred to by Barrick as the RGMPs+, is self-assessed and subject to independent third party assurance annually. Barrick is a member of the Industry Advisory Group of the Consolidated Mining Standards Initiative and welcomes the work being undertaken to consolidate the global standards landscape.
Each year, Barrick publishes a Sustainability Report that outlines its environmental, health and safety and social responsibility performance for the year. The Sustainability Report includes Barrick’s Sustainability Scorecard, which ranks Barrick against its peers and internal metrics across what Barrick believes are the sustainability issues most relevant to Barrick’s business and the industry. Barrick’s performance in these areas is then aggregated by pillar before providing an overall score. For 2025, an ‘A’ grade was assessed and maintained, following an ‘A’ grade in 2024 (on a scale where ‘A’ represents top performance and ‘E’ represents bottom performance). Despite notable progress towards achieving its sustainability vision, the Company did not meet its safety goal to eliminate fatal incidents in 2025. Barrick has zero tolerance for fatalities and is saddened by the four fatalities recorded for the year: one at Nevada Gold Mines, one at Bulyanhulu and two at Kibali. The Company acknowledges it still has work to do to achieve its goal of a zero harm workplace.
- 49 -
Each pillar of Barrick’s sustainability strategy is described below. More details on Barrick’s sustainability strategy, related initiatives and performance will be available in the Company’s 2025 Sustainability Report that is expected to be published on its website in the first half of 2026. The contents of the 2025 Sustainability Report are not incorporated by reference into this Annual Information Form.
Respecting Human Rights
Barrick has zero tolerance for human rights violations wherever it operates. Barrick’s commitment to respect human rights is codified in the Company’s Human Rights Policy and informed by the expectations of the UN Guiding Principles on Business and Human Rights, the Organization for Economic Co-operation and Development (“OECD”) Guidelines for Multinational Enterprises and the Voluntary Principles on Security and Human Rights (“VPSHR”). Barrick’s commitment to respect human rights is fulfilled on the ground via the Company’s Human Rights Program, the fundamental principles of which include: due diligence; risk identification and management; monitoring and reporting; training; and, where appropriate, disciplinary action and remedy. Barrick also expects the same standards from its suppliers, and the Company’s Supplier Code of Ethics incorporates human rights provisions.
In 2025, Barrick continued to implement its Human Rights Program, which includes periodically conducting independent human rights assessments at Barrick’s operations and projects, with higher risk sites subject to heightened due diligence and more frequent assessment. Barrick continues to submit and publish its annual reports to the Voluntary Principles Initiative, which are available on the Company’s website. Barrick also submits annual modern slavery disclosures in Canada and Australia.
Health & Safety
Barrick is committed to the safety, health and well-being of its people, their families and the communities in which it operates to achieve the Company’s safety vision for “Everyone to go home safe and healthy every day.” With the exception of Porgera, Barrick’s operational sites are certified to ISO 45001 standards and its approach to health and safety is set out in a series of standards, policy guidelines, operating procedures and systems that are regularly reviewed and assured. The Company’s “Journey to Zero” roadmap was developed in 2022 and continues to be rolled out. Barrick appreciates that more work is required to achieve its goal of zero harm, including prioritizing safe operating expectations as part of onboarding and ongoing interaction, not just with the Company’s own operated sites, but also with its contractors and business partners.
Barrick reports its safety performance weekly to the Executive Committee and quarterly to both the E&S Committee and the Board’s ESG & Nominating Committee. The Company’s frequency rates were at an all-time low in 2025. Statistics for 2025 show a 24% improvement in the TRIFR (0.71) compared to 2024. The Company’s LTIFR was 0.09 and dropped by 31% compared to 2024.
Notwithstanding these positive improvements on lagging indicators, it is with regret that these advancements in 2025 were overshadowed by the four fatalities described above. The Company’s focus remains on implementing the Fatal Risk Management program, entailing Fatal Risk standards, operational standards and critical controls. The Critical Control Verifications roll out and adoption has been successful in the field, with Barrick’s focus now shifting to quality of interactions.
The Company is committed to ensuring all Barrick-operated or controlled TSFs meet global best practices for safety and are subject to the Company’s Tailings Management Standard (the “Standard”), which requires that Barrick locate, design, build, operate and close its TSFs in compliance with all applicable laws and regulations and in conformance with the Global Industry Standard on Tailings Management (“GISTM”), which Barrick was actively involved in developing. The Company’s TSFs are carefully engineered and regularly inspected, particularly those in regions with high rainfall and seismic activities. The Standard also establishes minimum geotechnical, hydrological, hydrogeological and
- 50 -
environmental criteria for Barrick’s TSFs. Barrick-operated joint venture and affiliated companies also follow the Standard.
As of August 2025, the Company has disclosed its conformance with the GISTM for all of Barrick TSFs. Copies of the TSF disclosures are available on Barrick’s website. Barrick has also worked diligently toward bringing inactive TSFs into Safe Closure on a priority basis. These reports are not incorporated by reference into this Annual Information Form.
Sharing the Benefits
Barrick’s overarching Sustainable Development Policy and Social Performance Policy set out its commitment to social and economic development. Barrick recognizes that the taxes, royalties and dividends it pays provide significant income for the Company’s host countries, as well as help to fund vital services and infrastructure. The Company’s comprehensive tax policy covers governance, tax risk management, tax planning principles, compliance and relations with tax authorities, as well as transparency and disclosure. Barrick reports all government and tax payments transparently, primarily by reporting under Canada’s Extractive Sector Transparency Measures Act. The Company also publishes annual tax contribution reports detailing its economic contributions to host governments.
Among other initiatives, Barrick prioritizes local hiring, which is one of the Company’s largest social and economic contributions to its host countries and local communities. At the end of 2025, approximately 96% of Barrick’s workforce and 69% of senior management were nationals from the Company’s host countries. (As explained under “Employees and Labor Relations” above, employment figures as of December 31, 2025 include headcount for Barrick’s Mali operations as of June 30, 2025.) This is augmented by prioritizing the purchase of goods and services from local communities and host countries. In addition, Barrick invests in community-led development initiatives and has established community development committees (“CDCs”) at every operating site. Each CDC is comprised of elected local leaders and community members who allocate a community investment budget to projects needed and desired by local stakeholders. In 2025, Barrick invested more than $60 million in local community development projects.
Environment
The Company’s mining, exploration and development activities are subject to various levels of federal, provincial or state, and local laws and regulations relating to the protection of the environment, including requirements for closure and reclamation of mining properties.
Being responsible stewards of the environment by applying the highest standards of environmental management can deliver significant cost savings to its business, reduce future liabilities and help build stronger stakeholder relationships. Barrick has a policy of conducting environmental and closure reviews of its business activities on a regular and scheduled basis to evaluate compliance with applicable laws and regulations, permit and license requirements, company policies and management standards including guidelines and procedures, and adopted codes of practice.
Barrick’s investment in environmental management systems (“EMS”) is aimed at identifying and implementing controls appropriate to environmental risks identified at each site. The EMS at each site is reviewed annually, and the site general manager and environmental managers are responsible for the implementation and execution of the EMS. Water use, incident prevention and management, tailings management, climate change and biodiversity are key areas of focus. The Company’s operating facilities have been designed to avoid, prevent and then mitigate environmental impacts and Barrick staff work to continually improve its environmental management programs.
Barrick’s policies and standards conform to international and industry standards. All operational sites are certified to the ISO 14001:2015 standards. The Company had zero Class 1 - High Significance Incidents for the seventh consecutive year.
- 51 -
All Barrick mines have closure plans, which are regularly reviewed. The Company has estimated future site reclamation and closure obligations, which it believes will meet current regulatory requirements. See Notes 2r and 27 of the Notes to the Consolidated Financial Statements for further information on Barrick’s reclamation and closure obligations as at December 31, 2025. In addition, see the disclosure under “Material Properties” below for details about specific environmental matters applicable to Barrick’s material properties, including estimated future reclamation and closure costs.
Climate Resilience
Barrick’s climate change strategy has three pillars: (1) identify, understand and mitigate the risks associated with climate change; (2) measure and reduce the Company’s GHG emissions across its operations and value chain; and (3) improve the Company’s disclosure on climate change.
The Company continues to take steps to identify and manage risks and build resilience to climate change, as well as to position itself for new opportunities. In 2025, climate change related risk factors continued to be incorporated into Barrick’s formal risk assessment process. Barrick has a scientifically-based emissions-reduction roadmap, which targets at least a 30% reduction in GHG intensity emissions by 2030 against the 2018 baseline of 0.47 tonnes carbon dioxide equivalent per tonne of ore processed. Ultimately, Barrick’s vision is net zero GHG emissions by 2050 achieved primarily through GHG emissions reductions, with some offsets for hard-to-abate emissions. Barrick is also implementing a Scope 3 (indirect value chain) emissions roadmap, which includes both quantitative and qualitative targets focused on high-emission areas in its value chain. Barrick’s GHG targets are not static and the Company is always working to identify opportunities for further reductions.
Preliminary GHG emissions (Scope 1 (direct) and Scope 2 (indirect): Location-Based) in 2025, which are subject to change following completion of third-party assurance and Market-Based determinations, were 7,722 kilotonnes carbon dioxide equivalent at operations and projects operated by Barrick (on a 100% basis). GHG emissions were approximately 3% above 2024 (Location-Based) levels. Increased emissions from 2025 were predominantly due to higher limestone use for neutralization at Pueblo Viejo and increased production at Porgera. The Company completes the annual CDP questionnaires, which make investor-relevant climate data widely available. In 2025, Barrick achieved an ‘A-’ grade (best practice class) for both Climate Change and Water Security.
The Company will report its 2025 GHG emissions in its 2025 Sustainability Report. For more information, see “Risk Factors – Climate change risks”. The Company also discloses its material climate-related risks and opportunities in its annual CDP questionnaire, which can be found on the CDP website.
Water
Managing and using water responsibly is a critical part of Barrick’s sustainability strategy. Barrick’s aim is to deliver enough water for the effective operation of the Company’s mines, while at the same time protecting the quality and quantity of water available to host communities and other users in its watersheds. This commitment to responsible water use is codified in Barrick’s Environmental Policy and standalone Water Policy, which together require the Company to minimize its use of water, control and manage its impacts on water quality, and engage with stakeholders, including local communities, to maintain sustainable management of water resources for the benefit of all users.
Each mine has its own site-specific water management plan and water risks are included in each mine’s operational risk register, which are then aggregated and incorporated into the Group risk register. The Company also has various programs to re-use and conserve water and, for 2025, Barrick’s overall water recycling and reuse rate was 81%; above its annual target of 80%.
As many of the Company’s gold operating properties use cyanide, the Company became a signatory to the International Cyanide Management Code (the “ICM Code”) in September 2005, which establishes
- 52 -
operating standards for manufacturers, transporters and mines and provides for third-party certification of facilities’ compliance with the ICM Code. All of Barrick’s operational mines are ICM Code certified, with the exception of Kibali, which has completed its ICM Code audit and is awaiting certification.
See also “Risk Factors – Environmental, health and safety regulations” and “Risk Factors – Water supply, management and availability challenges could impact operations” for more information.
Biodiversity
Barrick works to proactively manage its impact on biodiversity and strives to protect the ecosystems in which it operates. Wherever possible, Barrick aims to achieve a net-neutral biodiversity impact, particularly for ecologically sensitive environments.
The Company has developed Biodiversity Action Plans for all operational sites and has made progress in developing conservation and offset projects, including in Nevada, the Dominican Republic, Zambia and the DRC.
Operations in Emerging Markets: Corporate Governance and Internal Controls
Barrick conducts or participates in mining, exploration and other activities through subsidiaries and/or joint ventures in many countries, including the United States and Canada, and in emerging markets such as Argentina, Chile, the DRC, Ecuador, Jamaica, the Dominican Republic, Mali, Pakistan, PNG, Peru, Saudi Arabia, Senegal, Tanzania and Zambia. Barrick has a long history of successfully developing and operating mines in emerging markets and has organizational and governance structures and protocols in place to manage the regulatory, legal, linguistic and cultural challenges and risks associated with having operations in these jurisdictions. For a detailed discussion of the risks associated with operating in emerging markets, see “Risk Factors – Foreign investments and operations” on pages 115 to 118 of this Annual Information Form.
Barrick holds its properties and projects in emerging markets indirectly through subsidiaries and/or joint venture entities which are locally incorporated or established for the purposes of compliance with local law. These operating subsidiaries or joint venture entities are in turn held through holding companies incorporated in jurisdictions with well-developed and reliable legal and taxation systems. Such holding companies may: (i) facilitate internal company reorganizations of group companies; (ii) facilitate project financing and commercial transactions, such as the creation of joint ventures; and (iii) in some cases, facilitate dispute resolution processes. Barrick has designed a system of corporate governance, internal controls over financial reporting and disclosure controls and procedures that apply to Barrick and its consolidated subsidiaries and joint ventures. These systems, which are coordinated by the Company’s senior management and overseen by its Board of Directors, are designed to monitor the activities at, and receive timely reports from, Barrick’s operating subsidiaries and joint ventures. In particular, Barrick’s operating structure is composed of three geographic regions – South America and Asia Pacific, Africa and Middle East, and North America – each of which is managed by a different regional Chief Operating Officer who reports to the Company’s President and Chief Executive Officer.
The Company has extensive operating experience in several of the emerging markets in which a material property is located: the Dominican Republic, the DRC and Zambia. Operating in emerging markets exposes the Company to risks and uncertainties that do not exist or are significantly less likely to occur in other jurisdictions such as the United States or Canada. The Company manages and mitigates these risks through a variety of corporate governance mechanisms. For additional information, see “Risk Factors – Foreign investments and operations”.
- 53 -
Board and Management Experience and Oversight
The Company’s Board includes international business leaders and mining industry professionals with expertise and experience working or running businesses in emerging markets, including in the resource, banking, legal and business sectors in various jurisdictions in Africa and South America. Through their collective professional expertise, the Board has considerable knowledge of the mining sector globally and international business more broadly. Several Board members are also fluent in multiple languages. See “Directors and Officers of the Company – Directors of the Company” for more information.
Members of Barrick’s Board of Directors and senior officers regularly visit the Company’s operations in both developed and emerging markets. These visits provide Barrick’s directors and officers with the opportunity to familiarize themselves first-hand with Barrick’s global operations, the management teams responsible for overseeing Barrick’s projects, and the specific risks and challenges associated with administering these projects in emerging markets. In particular, the Company’s President and Chief Executive Officer and other members of Barrick’s senior management team, frequently visit Barrick’s operations in developed and emerging markets and, accordingly, have extensive knowledge of the operations at each of Barrick’s project sites. In 2025, Barrick’s senior management team utilized a mix of both physical site visits and virtual alternatives to engage with local site teams and conduct team effectiveness and strategy sessions. In recent years, the Company’s independent directors have travelled to at least one mine site to monitor operational progress and risks. For example, in September 2025, three of the Company’s independent directors visited the Nevada Gold Mines, and in November 2025, four of the Company’s independent directors visited the Pueblo Viejo Mine in the Dominican Republic.
The Board of Directors, through its corporate governance practices, regularly receives management and technical updates, risk assessments and progress reports in connection with its operations in emerging markets, and in so doing, maintains effective oversight of its business and operations. Through these updates, assessments and reports, together with focused director education sessions, the Board of Directors gains familiarity with the operations, laws and risks associated with operations in those jurisdictions. Further, the Board of Directors has access to senior management who work directly with local management and who in turn are familiar with the local laws, business culture and standard practices, have local language proficiency, are experienced in working in the applicable emerging jurisdiction and in dealing with the respective government authorities and have experience and knowledge of the local banking systems and treasury requirements.
Local Presence
It is a cardinal principle of Barrick that the countries and communities in which it operates should share equitably in the benefits created by its operations. Barrick contributes to the social and economic development of the emerging markets in which it operates by, among other things, hiring local employees and investing in community health, education and economic development programs. Working with local employees helps to build trust and develop relationships with local leaders and governments. Barrick is committed to developing the skills required to integrate its business activities into the communities in which it operates, and draws on the experience and expertise of its local employees and professional advisors (including local legal counsel) to help navigate the regulatory, cultural and legal landscape. In addition, management at each of the mine sites and projects is fluent in the primary language of the jurisdictions in which they operate, and are also proficient in English, enabling them to communicate with local employees, regulators and governments in the local language, and to report to senior management in English.
Barrick’s preference for employing nationals in the countries where it operates, rather than expatriates, means that Barrick is less dependent upon a workforce traveling to a site on a regular basis from other parts of the globe. Barrick strives to deliver long-term benefits to its host countries and communities through open and ongoing stakeholder engagement and a commitment to genuine partnership. For additional details, see “Narrative Description of the Business – Sustainability” and Barrick’s 2025 Sustainability Report, to be published in the first half of 2026.
- 54 -
Internal Controls and Cash Management Practices
The Company maintains internal controls over financial reporting with respect to its operations in emerging markets by taking various measures and consistently applying them across its operations. Pursuant to the requirements of National Instrument 52-109 and the U.S. Sarbanes-Oxley Act of 2002, the Company assesses the design and operation of key internal controls over financial reporting on an annual basis at a minimum, following a risk-based approach. The working papers of the tests performed at each of the Company’s locations are reviewed at the corporate office. The control standards utilized in emerging markets do not materially differ from those employed at the Company’s other operations.
Differences in banking systems and controls between Canada and each emerging market in which Barrick operates are addressed by having stringent controls over cash kept in the jurisdiction, especially with respect to access to cash and cash disbursements, establishing appropriate authorization levels, segregating duties in respect of the payments process, and performing and reviewing bank reconciliations on at least a monthly basis.
The Company also has established (or, where the Company is not the operator, has required its partner to establish) practices, protocols and routines for the management and eventual distribution of its excess cash to its foreign owners, which remain subject to local laws and exchange controls.
For additional details, including regarding Board oversight, see “Internal Control Over Financial Reporting and Disclosure Controls and Procedures”.
- 55 -
MATERIAL PROPERTIES
For the purposes of this Annual Information Form, Barrick has identified its Cortez, Carlin, Turquoise Ridge, Pueblo Viejo, Kibali, the Reko Diq Project and Lumwana mines and complexes, as material properties. The following is a description of Barrick’s material properties.
Cortez Property
General Information
Project Description
The Cortez property is located 100 kilometers southwest of the town of Elko, Nevada in the Lander and Eureka Counties at elevations ranging from 1,370 meters to 1,675 meters. As of December 31, 2025, Cortez employs approximately 1,650 employees and averages approximately 300 contractors.
As of December 31, 2025, the boundaries of the Cortez operational areas, which include the Cortez Hills, Pipeline/Crossroads, Cortez, Gold Acres and Robertson complexes, encompassed approximately 31,889 hectares. Current mining activity is primarily focused on the Cortez Hills and Pipeline/Crossroads complexes, located approximately 26 kilometers south and 18 kilometers southwest of the town of Crescent Valley, Nevada, respectively. The property is accessible year-round by paved road from Elko, Nevada.
The property rights controlled by Cortez, either from outright ownership or by lease, consist of 30,006 hectares of unpatented mining claims held subject to the paramount title of the United States of America and 1,893 hectares of patented mining claims and fee mineral and surface land, owned or controlled through various patents issued by the United States of America. These property rights encompass the entire Cortez boundary, not just the operational areas. All unpatented mining claims are renewed on an annual basis and all necessary fees are paid prior to August 31 of each year. All mining leases and subleases are reviewed on a monthly basis and all payments and commitments are paid as required by the specific agreements.
Sufficient surface rights have been obtained for current operations at the property.
History
In 1964, a joint venture was formed to explore the Cortez area. In 1969, the original Cortez mine went into production. From 1969 to 1997, gold ore was sourced from open pits at Cortez, Gold Acres, Horse Canyon and Crescent. In 1991, the Pipeline and South Pipeline deposits were discovered, with development approval received in 1996. In 1998, the Cortez Pediment deposit was discovered, with the Cortez Hills discovery announced in April 2003. The Cortez Hills development was approved by Placer Dome and Kennecott, then joint venturers, in September 2005 and confirmed by Barrick in 2006. Barrick obtained an interest in the Cortez property through its acquisition of Placer Dome in 2006. Barrick consolidated its 100% interest in the property following its purchase of the Kennecott interest in 2008. On July 1, 2019, Barrick’s interest in Cortez was contributed to Nevada Gold Mines, a joint venture with Newmont in which Barrick has a 61.5% interest and is the operator.
Geology
Geological Setting
The Cortez property is situated along the Cortez/Battle Mountain trend. The principal gold deposits and mining operations are located in the southern portion of Crescent Valley, which was formed by basin and range extensional tectonism.
- 56 -
Mineralization
Mineralization is sedimentary rock-hosted and consists of submicron to micrometer-sized gold particles and gold in solid solution in pyrite. Mineralization is disseminated throughout the host rock matrix in zones of silicified, decarbonatized, and/or argillized, silty calcareous rocks. The deposits range in length between 2,000 and 3,350 meters and range in width between 1,000 and 1,200 meters. Mineralization thickness can change significantly, up to 400 meters. Exploration from projects at Robertson and Goldrush suggest that the deposits can be in excess of 5,000 meters in length and 900 meters in width.
Mining Operations
Production and Mine Life
Deposits within the Pipeline/Crossroads complex and Cortez Pits are being mined by conventional open pit methods. At the underground operations, two different underground mining methods are used: long-hole open stoping and drift-and-fill.
Based on existing reserves and production capacity, including the Goldrush project discussed in further detail below, the Cortez open pit operation is expected to continue until 2030 and the underground operation until 2044.
Processing
The gold-recovery process used at Cortez is determined by considering the grade and metallurgical character of the particular ore: lower grade run-of-mine oxide ore is heap leached at existing facilities; higher-grade non-refractory ore is treated in a conventional mill using cyanidation and the CIC and CIL processes; and refractory ore is stockpiled on site in designated areas and trucked to the nearby Carlin Complex for processing (see “Carlin Complex”). Gold recovered from the ore is processed into doré on site and shipped to outside refineries for processing into gold bullion.
There are two active heap leach facilities at the Carlin Complex. One is located at the Pipeline complex, the other near Cortez Hills with mainly residual leaching. Milling activities at Cortez are conducted at the Pipeline complex, which includes crushing and grinding facilities, CIC and CIL circuits, reagent storage areas and a recovery/refining circuit. Plant throughput can reach up to 13,607 tonnes per day (15,000 tons per day) depending on the hardness of the ore being processed.
Consumptive water use for mining (open pit and underground) and processing is supplied by the mine dewatering wells. Potable water is sourced from bottled water or existing water supply wells in accordance with applicable Nevada Bureau of Safe Drinking Water standards.
Infrastructure, Permitting and Compliance
Electrical power for the Cortez Complex is obtained from the grid and generated from the Western 102 and TS power plant (which is owned and operated by Nevada Gold Mines) with transmission by NV Energy. Power is purchased on a wholesale basis using dedicated buyers. The load is predicted on an hourly basis and the Western 102 and TS supply is used to balance the load. The Western 102 and TS plant delivers power to Nevada Gold Mines operations at Cortez, Carlin, and Turquoise Ridge.
The current load for the Cortez property has a peak of 47 megawatts. The current transmission line has the capacity for 56 megawatts, and with the addition of capacitors and switching station, the capacity of the line could be increased to 78 megawatts. Additional transmission capacity will be required for any further expansion.
- 57 -
Certain of Barrick’s mineral reserves and operations at Nevada Gold Mines occur on unpatented lode mining claims and mill sites that are on federal lands subject to U.S. federal mining and other U.S. federal and state laws. Changes in such laws, or regulations promulgated under such laws, could affect mine development, expansion, and closure projects. Such changes are frequent and are currently being discussed or at issue before executive and administrative agencies of the U.S. federal government, cases pending in the U.S. federal court system and in proposed legislation in the U.S. Congress. Additionally, Nevada Gold Mines operations are subject to certain land use restrictions administered by state and federal agencies, including the Bureau of Land Management (“BLM”). The BLM manages Greater Sage-Grouse under the existing 2025 Resource Management Plans (“RMPs”). BLM’s and other state and federal agencies’ existing sage grouse management requirements, including the 2025 RMPs, restrict land use activity on certain public lands, including locations where Barrick currently operates or could operate in the future. Barrick continues to monitor the situation and is engaged with the relevant authorities on this matter.
All material permits and rights to conduct existing operations at the Cortez property have been obtained and are in good standing.
Environment
Vegetation is dominated by grass and shrubs. The climate is relatively arid and has little impact on mine operations. Operations are conducted throughout the year.
Current dewatering operations focus on bedrock water management within the Cortez Hills underground and bedrock and alluvial water management within the Pipeline/Crossroads pit area. A portion of the dewatering water is utilized for mining and milling, and a portion is utilized at a local ranch on a seasonal basis for irrigation purposes. The majority is returned to the basin through the rapid infiltration basins located within Crescent Valley, Pine Valley, and Grass Valley.
In 2025, all activities at the Cortez property were, and continue to be, in compliance in all material respects with applicable corporate standards and environmental regulations.
As at December 31, 2025, the recorded amount of estimated future reclamation and closure costs for Cortez that was recorded under IFRS as defined by IAS 37, and that have been updated each reporting period, was $150 million (100% basis) (as described in Note 2r to the Consolidated Financial Statements). Nevada Gold Mines has provided the financial security required by governmental authorities in connection with the reclamation of the mine area.
Exploration and Drilling
In 2025, growth drilling activities across the Cortez district totaled more than 25,000 meters, excluding the 100% Barrick-owned Fourmile project which is not currently included in the Nevada Gold Mines joint venture with Newmont (Barrick anticipates Fourmile will be incorporated into the Nevada Gold Mines joint venture, at fair market value, if certain criteria are met).
At Cortez Hills, underground drilling continues to test extensions, focusing on feeder zones below the mine. Surface drilling continues to test the Hanson target defined by a broad zone of mineralization hosted in a series of fault-stacked zones below the current infrastructure. With additional drill results and improved geologic understanding, economic evaluation is in progress for a small dewatered portion of mineralization to deliver incremental near-term value.
Goldrush Project
A Record of Decision was issued to Nevada Gold Mines for the Goldrush project on December 8, 2023. Earthworks began at year end 2023 and continued throughout 2024 to establish access roadways
- 58 -
in Horse Canyon and construct dewatering infrastructure. Dewatering wells and conveyance pipelines are currently under construction. The first intake ventilation shaft was constructed and underground fan infrastructure was commissioned to increase ventilation capacity in the mine.
During 2025, underground development, infrastructure, production mining, and other exploration continued at Goldrush. The mining method is longhole open stoping (with cemented backfill), with processing at either the Gold Quarry and/or Goldstrike roaster facilities located at Nevada Gold Mines’ nearby Carlin Complex. Major development fronts included developing levels out to the south, advancing the Red Hill ramp, and continuing upper level drill platforms. Activities in 2026 will focus on verifying geological, geotechnical and hydrogeological models developed during the feasibility study.
Also at the Goldrush project, drilling operations continue from underground. The main objectives of this drilling program remain grade control, orebody definition, orebody characterization, geotechnical analysis, inferred resource growth and definition of exploration upside.
As at December 31, 2025, Barrick has spent $490 million in capital on the Goldrush project, inclusive of the exploration declines (100% basis). The capital spent to date, together with the remaining expected pre-production capital (until commercial production begins in 2026), is projected to be $1.0 billion over the life of mine (on a 100% basis).
Royalties and Taxes
All production from the Pipeline/Crossroads complex is subject to a gross smelter return royalty of approximately 1.3%. In addition, production from certain portions of the Pipeline/Crossroads complex is subject to a gross smelter return royalty (graduating from 0.4% to 5.0% based on the price of gold) and a net value royalty totaling 5%. A portion of that net value royalty, 3.75%, also applies to gold sales from the South Pipeline deposit.
All other production by Cortez, including Cortez Hills, is subject to a gross smelter return royalty of approximately 1.3%.
In addition, 40% of production at Cortez is subject to a royalty graduating from 0% to 3%, depending on the gold price, on the gross value of gold delivered, minus certain deductions for pre-existing royalties. This royalty was granted in 2008 but the obligation to pay was triggered in September 2022, when the total amount of gold produced by Cortez since January 1, 2008 exceeded 15 million ounces.
In connection with the formation of Nevada Gold Mines, each of Barrick and Newmont was granted a 1.5% net smelter return royalty over the respective properties they contributed (including the Cortez property). Each of these “retained royalties” is only payable once the aggregate production from the properties subject to the royalty exceeds the publicly reported reserves and resources as of December 31, 2018.
The State of Nevada imposes a 5% Net Proceeds of Minerals tax (“NPT”) on the value of all minerals severed in the State. This tax is calculated and paid based on a prescribed net income formula which is different from book income.
Effective July 1, 2021, the State of Nevada also imposes a mining excise tax applied to gross proceeds. This is a tiered tax, with a highest rate of 1.1% and the revenue it generates is directed towards education.
Mining and Processing Information
The following table summarizes certain mining and processing information for the Cortez property for the periods indicated:
- 59 -
| Year ended December 31, 20251 |
|
Year ended December 31, 20241 |
| |||||
| Tonnes mined (000s) |
56,200 | 67,928 | ||||||
| Tonnes of ore processed (000s) |
8,326 | 6,613 | ||||||
| Average grade processed (grams per tonne) |
2.10 | 2.30 | ||||||
| Ounces of gold produced (000s) |
454 | 444 | ||||||
| 1 | Amounts represent Barrick’s 61.5% share. |
For certain additional financial information, see “Narrative Description of the Business – Reportable Operating Segments – Nevada Gold Mines (61.5% basis)”.
The most recent technical report on the Cortez property is the technical report entitled “Technical Report on the Cortez Operations, Lander and Eureka Counties, State of Nevada, U.S.A.” dated March 18, 2022 and authored by Nevada Gold Mines. This technical report has been filed on SEDAR+ in accordance with National Instrument 43-101.
The diagram on the following page shows the design and layout of the Cortez property.
- 60 -
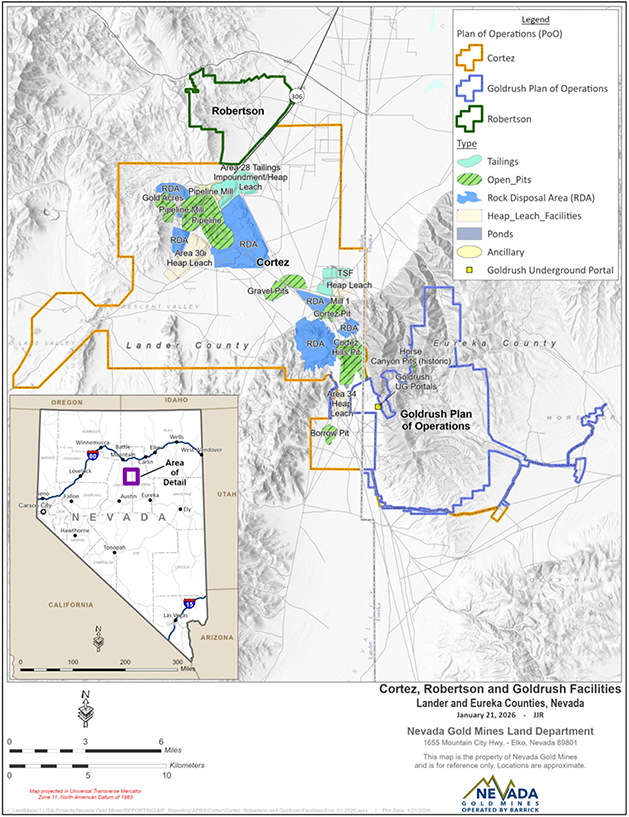
- 61 -
Carlin Complex
General Information
Project Description
The Carlin Complex consists of several open pit and underground operations. The major operations and advanced projects include Goldstrike Betze-Post open pit, Goldstrike underground (inclusive of the Ren underground expansion) South Arturo open pit, and El Nino underground, which were contributed to Nevada Gold Mines by Barrick (collectively, “Goldstrike”). The Carlin Complex also includes the Carlin North Area (consisting of multiple open pit mines known as Genesis/Tri-Star), Leeville underground (inclusive of the North Leeville expansion), Carlin Portal mines, Gold Quarry (open pit mine), Rain/Emigrant (open pit mine) and satellite open pit deposits (Perry and Green Lantern) (collectively, the “Newmont-Contributed Mines”) which were contributed to Nevada Gold Mines by Newmont. The Carlin Complex also consists of various processing facilities, which process the ore from across the Carlin Complex, as well as from Nevada Gold Mines’ other sites and toll ore.
Some of the disclosure in this section references Barrick’s operation of Goldstrike and Newmont’s operation of the Newmont-Contributed Mines (rather than the Carlin Complex in its entirety), either for historical purposes or because the mines are operated differently following the formation of the Nevada Gold Mines joint venture.
The Carlin Complex is in Eureka and Elko Counties, near the towns of Carlin and Elko, Nevada within the high desert of the Basin and Range physiographic providence. The Carlin Complex is located within the Carlin Trend, a 61-kilometer concentration of multiple gold deposits. The mines are spread over the entirety of this 61-kilometer trend, at an elevation range of 1,585 to 2,072 meters above sea level.
As of December 31, 2025, the Carlin Complex employs approximately 3,500 employees and averages approximately 1,100 contractors.
As of December 31, 2025, the plan boundaries of the Carlin Complex encompassed more than 21,100 hectares, which include about 12,080 hectares of private land (surface and minerals) owned or controlled by Nevada Gold Mines, and approximately 8,058 hectares owned by the United States government that are administered by the BLM. These rights are owned or controlled through ownership of various forms of patents issued by the United States federal government and by ownership of unpatented mining and mill-site claims held subject to the paramount title of the United States federal government.
The open pits, the underground mines and the beneficiation and processing facilities at the Carlin Complex property are predominantly situated on land owned by Nevada Gold Mines. Primary access to the Carlin Complex is from Elko, Nevada, 46 kilometers west on Interstate I-80 to Carlin, Nevada, which is the closest town to the minesites and is located just off the Interstate. In addition, various alternate access routes use Nevada State Route 766 as well as Elko and Eureka County roads.
The Carlin Complex includes a total of 1,790 unpatented Iode mining claims and mill-site claims and 475 owned patented claims to control the public acreage. Unpatented mining claims are maintained on an annual basis. All mining leases and subleases are reviewed on a monthly basis and all payments and commitments are paid as required by the specific agreements.
Sufficient surface rights have been obtained for current operations at the property.
History
Initial prospecting for the Carlin Complex began in the South Area around Gold Quarry in 1870. By 1935, several small underground and surface mines had produced a few hundred tons of copper, lead,
- 62 -
and barite. In 1925, a gold deposit was developed about 19 kilometers southeast of the Carlin deposit and is known as the Maggie Creek claims. The earliest gold mining activity in the northern part of the Carlin Trend occurred at the Bootstrap and Blue Star mines, prior to the discovery of gold at Goldstrike. At Bootstrap, just northwest of Goldstrike, antimony was discovered in 1918, followed by gold in 1946. Gold was produced at Bootstrap from 1957 to 1960. At Blue Star, immediately south of Goldstrike, gold was identified in 1957 in areas that had been mined for turquoise.
The first discovery of gold at Goldstrike was in 1962 by Atlas Minerals. PanCana Minerals Ltd. (“PanCana”) first mined the property for gold in 1976. In 1978, Western States Minerals Corporation (“WSMC”) became the operator in a 50/50 joint venture with PanCana. Barrick acquired a 50% interest and assumed management of the Goldstrike property on December 31, 1986 with the acquisition of WSMC’s 50% interest in the property. Barrick completed the acquisition of 100% ownership of the property pursuant to a plan of arrangement entered into with PanCana in January 1987.
Continued exploration by soil samples and drilling discovered low-grade gold mineralization at shallow depth until the first deep hole was drilled in 1986 at Post, discovering the Deep Post deposit. Exploration drilling from 1987 to 1988 led to the discovery of a number of other deposits similar to Deep Post. These included Betze and Screamer which, together with Deep Post, comprise the Betze-Post deposit. Other discoveries in 1987 and 1988 included Deep Star, Rodeo, Meikle (previously named Purple Vein), South Meikle and Griffin.
Newmont commenced exploration on the Carlin Trend in 1961, investigating the Blue Star mine and Maggie Creek claims. However, as negotiations to acquire the deposits were not successful, Newmont focused on exploring jasperoid outcrops located 4.5 kilometers southeast of Blue Star, subsequently delineating the North Carlin deposit. Mining commenced with an open pit at Carlin in 1965. During the late 1980s, higher grade refractory mineralization was discovered in the north Carlin area. The south area mines, the Gold Quarry and Rain deposits, were discovered in 1980, and an additional 10 deposits were identified by 1988.
On July 1, 2019, Barrick’s interest in Goldstrike and the Newmont-Contributed Mines were contributed to Nevada Gold Mines, a joint venture in which Barrick has a 61.5% interest and is the operator. Goldstrike, together with the Newmont-Contributed Mines, is now the Carlin Complex.
Geology
Geological Setting
Gold deposits at the Carlin Complex are hosted by lower Paleozoic sedimentary rocks that are subdivided into three major packages: an autochthonous shelf to outer shelf carbonate and clastic sequence (eastern assemblage rocks); an allochthonous, predominantly eugeoclinal sequence (western assemblage rocks); and a late Mississippian overlap assemblage.
Early phase contractional thrusts and anticlines form important structural traps across the Carlin Trend. The orientation of mineralized stratigraphy and structures across the entire Carlin Trend correlate with orientations generated by earlier deformational events. These orogenic and tectonic events formed broad amplitude, north-northwest-trending, northerly-plunging anticlines within autochthonous carbonate assemblage rocks that are now preserved in uplifted tectonic windows. All Carlin Complex deposits discovered have been within or adjacent to these windows. Structures on the Carlin Complex record a complex history of contractional and extensional tectonics and later reactivation during successive periods of deformation.
- 63 -
Mineralization
Gold mineralization was emplaced approximately 39 million years ago along favorable stratigraphy and structural features such as faults and folds, and along contacts between sedimentary rocks and the intrusive rocks. Faulting provided major conduits for mineralizing fluids and may also have produced clay alteration that may have acted as a barrier to mineralizing fluids. Also, lithology and alteration contacts act as permeability barriers to fluids causing mineralization to pond along them, particularly where feeder structures intersect these contacts.
Mineralization consists primarily of micrometer-sized gold and sulfides disseminated in zones of siliciclastic and decarbonated calcareous rocks and commonly associated with jasperoids. Mineralization is predominantly oxides, sulfides, or sulfide minerals in carbonaceous rocks, and the ore type determines how it is processed.
Mining Operations
Production and Mine Life
The Carlin Complex facilities are a major process plant for the entire Nevada Gold Mines operations and therefore are expected to operate past the current Carlin Complex life-of-mine plan. Open pit mining of reserves is scheduled through 2036, and underground reserve mining is scheduled through 2038. Processing of reserve stockpiles is expected to continue through 2049.
Open Pit
The Carlin Complex has four major open pit operations including Goldstrike, Gold Quarry, Goldstar (part of the Genesis/Tri-Star pits), and South Arturo (which returned to production in December 2022). All of these are truck and shovel operations. Blasting is required and blast patterns are laid out according to material type, using rock type designations of hard, average, soft or a combination of the three. The pit design varies between 6.1-meter to 12.2-meter (20 to 40 foot) benches. Slopes vary based on location.
The mine equipment fleet will be used throughout the mine life and is shared with the other mines at the Carlin Complex. The number of loading and hauling units allocated to each deposit varies depending on the operational needs from the mine plans. The equipment list also includes the auxiliary equipment needed to support mining and the re-handling of the ore from the stockpile pad into the mill feeders.
Underground
The Carlin Complex has three major operating underground mines including Goldstrike underground, Leeville, and the Carlin Portal Mines (including Pete Bajo, Exodus, El Nino, and Rita K). All mines utilize drift-and-fill and/or long-hole stoping and are accessed by shaft and/or portals. Ground conditions vary greatly in the different mining areas, from fair to very poor. Poor conditions in some areas are due to increased brecciation and/or alteration of original structures. Oxidation affects rock strengths in some areas and requires corrosion-resistant ground support. Generally low-strength rock conditions and ore geometry are the key factors in method selection and mine design. Once ore is mined, openings are filled with either cemented rock fill, uncemented run of mine waste, or cemented paste fill. Mines are ventilated using ventilation fans located both on surface and underground and mechanical cooling is deployed in Goldstrike underground to manage higher ambient rock temperatures.
Secondary egress is provided through a series of escape raises and declines. In addition, there are refuge chambers strategically located throughout the mine in accordance with Nevada Gold Mine’s refuge policies. The current underground production mobile equipment fleet across the Carlin Complex consists of load-haul-dump units, haul trucks, jumbo drills, longhole drills, and rock bolters. Additionally, there are many function-specific utility vehicles to support the movement of personnel and materials to support
- 64 -
mining. The underground mining fleet can be shared across the different Nevada Gold Mine operations as needed, per the integrated mine plan.
Processing
The Carlin Complex includes a series of integrated facilities to process ore from multiple open pit and underground sources within the Carlin Complex, as well as ore from other Nevada Gold Mines operations. Plant facilities have the flexibility to treat the mineralization that is typical of the various Carlin-style deposits. Ores are classified based on gold grade, level of oxidation, refractory characteristics (e.g., presence of preg-robbing components in ore) and proximity to processing facilities. An integrated process production plan is used.
The processing operations contained in the Carlin Complex include roasters, autoclaves, oxide CIL, and heap leach pads and include: Gold Quarry Concentrator (formerly Mill 5, currently inactive), Gold Quarry Roaster (formerly Mill 6), South Area Leach, North Area Leach, Goldstrike Roaster and Goldstrike Autoclave. The autoclaves can be bypassed for the treatment of oxide ores.
Infrastructure, Permitting and Compliance
Infrastructure at the Carlin Complex has been constructed on an as-needed basis since the 1960s. A considerable amount of infrastructure has been built, including process plants, workshops, tailings, leach and waste facilities; offices, roads and rail connections; power, process and potable water facilities; and communication facilities.
Electrical power is transmitted to the Carlin North Area, Leeville underground, Carlin Portal mines and Goldstrike by NV Energy. Electrical facilities include multiple main substations (Mill, South Block, and Bazza), several smaller substations throughout the property, and transmission lines. Power to the Gold Quarry and Emigrant mines is provided by transmission line on the Wells Rural Electric Power Company Grid. In October 2005, Barrick commissioned the Western 102 power plant that is located approximately 24 kilometers east of Reno, Nevada. It has the capacity to supply 115 megawatts of electricity to Goldstrike using 14 reciprocating gas-fired engines, and has an additional one-megawatt solar plant. The power plant provides Goldstrike with the flexibility to generate its own power or buy cheaper power from other producers, with the goals of minimizing the cost of power consumed and enhancing the reliability of electricity availability at its mine. In mid-2008, the TS power plant was constructed, which now provides power for the Carlin North Area and other Carlin Complex sites, via NV Energy transmission lines. In 2024, the TS solar photovoltaic power plant (the “TS Solar Plant”) commenced commercial operation. Located adjacent to the TS power plant, the TS Solar Plant can deliver up to 200 megawatts of electricity to mine sites through the same transmission lines operated by NV Energy as those used for the TS power plant. In February 2020, Barrick announced the planned conversion of the TS power plant to a dual fuel process, allowing the facility to generate power from natural gas. Capacity upgrades were completed at the interstate pipeline and construction of the TS natural gas pipeline interconnection station was completed in the fourth quarter of 2025.
Process water at the Carlin Complex is provided through existing well fields. In the Carlin North Area, Leeville underground and Carlin Portal mines, these well fields have been used historically to provide all of the process water for the mills and heap leach facilities. At Gold Quarry, process water is supplied from the pit dewatering system. At the current dewatering pumping rates, water is diverted to the various processes when needed and any excess dewatering water is discharged to Maggie Creek via a permitted water discharge facility. During irrigation season, some of the discharge water is utilized by the Nevada Gold Mines-owned Hadley Ranch. At the Carlin North Area, Leeville underground, Carlin Portal mines and Goldstrike, potable water is provided by permitted water wells and supporting treatment and infrastructure facilities. Potable water at Gold Quarry is provided by three permitted water wells and the related infrastructure. Emigrant has no potable water sources or water treatment facilities.
- 65 -
Water management operations at Goldstrike include a system of dewatering wells, piezometers, water collection and conveyance facilities, water storage, water use, and various management options for discharge of excess water. Barrick is authorized by a discharge permit issued by the Nevada Division of Environmental Protection to discharge water produced by its groundwater pumping operations to groundwater via percolation, infiltration and irrigation.
Certain of Barrick’s mineral reserves and operations at Nevada Gold Mines occur on unpatented lode mining claims and mill sites that are on federal lands subject to U.S. federal mining and other U.S. federal and state laws. See “Cortez Property – Infrastructure, Permitting and Compliance” for additional information.
All material permits and rights to conduct existing operations at the Carlin Complex have been obtained and are in good standing.
Environment
The Carlin Complex is situated in the high desert region of the Basin and Range physiographic province. Precipitation averages 23 to 33 centimeters per year across the Carlin Complex, primarily derived from snow and summer thunderstorms. There are warm summers and generally mild winters; however, overnight freezing conditions are common during winter. The effect of climate on the operations is minimal and operations are possible at the property year-round.
Estimated future reclamation and closure costs at Carlin are reported in Barrick’s financial statements as part of the amounts that were recorded under IFRS, as defined by IAS 37. As at December 31, 2025, the recorded amount of estimated future reclamation and closure costs for Carlin that were recorded under IFRS, as defined by IAS 37, and that have been updated each reporting period was $341 million (100% basis) (as described in Note 2r to the Consolidated Financial Statements). Nevada Gold Mines has provided the financial security required by governmental authorities in connection with the reclamation of the mine area.
In 2025, all activities at the Carlin Complex were, and continue to be, in compliance in all material respects with applicable corporate standards and environmental permits and regulations.
Exploration and Drilling
The Carlin Complex is endowed with several gold deposits and presents opportunities for both resource expansion and new discoveries. Barrick continues to hold its land position and evaluates new opportunities as warranted. At the Greater Leeville complex, drilling for resource and reserve replacement has been successfully executed across the Fallon, Miramar, Horsham and Fence deposits. This has led to an improved understanding of key mineral controls, with the B-series faults defined through the Miramar area and subsequent targeted drilling extending the resource footprint. Drilling to the north of Leeville has tested the extents of the system and defined the platform margin. Early-stage drilling at the Goldstrike complex focused on the GAP target, successfully identifying ore grade intercepts down-plunge of the Extension deposit. North along the Post-Gen fault corridor, drilling and modelling at the Ren deposit has significantly improved the understanding of the main mineral controls and refined the geometry of ore domains. At Arturo, infill drilling has improved definition of the high grade breccias, defined new thrust controls and identified upside outside of the current mine designs.
A total of 12,544 meters of reverse circulation (“RC”) and 62,342 meters of core were drilled across the Carlin Trend in 2025 for mineral resource management exploration and growth drilling. Surface geological mapping and prospecting continues peripheral to operations across the Carlin Complex.
- 66 -
Royalties and Taxes
There are numerous royalties that pertain to the active mines within the Carlin Complex. Royalty payments vary each year depending upon actual tonnages mined, and the amount of gold recovered from that mined material. The Goldstrike area has various royalty holders with a maximum overriding net smelter royalty of 4% and net profit interest royalties of between 2.4% and 6% over various parts of the property. With respect to various other Carlin deposits, Nevada Gold Mines pays third-party royalties that vary from 1% to 9% of production.
In connection with the formation of Nevada Gold Mines, each of Barrick and Newmont was granted a 1.5% net smelter return royalty over the respective properties they contributed (including Goldstrike and the Newmont-Contributed Mines). Each of these “retained royalties” is only payable once the aggregate production from the properties subject to the royalty exceeds the publicly reported reserves and resources as of December 31, 2018.
The State of Nevada imposes a 5% NPT on the value of all minerals severed in the State. This tax is calculated and paid based on a prescribed net income formula which is different from book income.
Effective July 1, 2021, the State of Nevada also imposes a mining excise tax applied to gross proceeds. This is a tiered tax, with a highest rate of 1.1% and the revenue it generates is directed towards education.
Mining and Processing Information
The following table summarizes certain mining and processing information for the Carlin Complex for the periods indicated:
| Year ended December 31, 20251 |
Year ended December 31, 20241 | |||||
| Tonnes mined (000s) | 60,148 | 61,273 | ||||
| Tonnes of ore processed (000s) | 5,793 | 6,657 | ||||
| Average grade processed (grams per tonne) | 4.54 | 4.30 | ||||
| Ounces of gold produced (000s) | 687 | 775 | ||||
| 1 | Amounts represent Barrick’s 61.5% share. |
The most recent technical report on the Carlin Complex is the technical report entitled “Technical Report on the Carlin Complex Mines, Eureka and Elko County, Nevada, USA” dated March 14, 2025 and authored by Nevada Gold Mines. This technical report has been filed on SEDAR+ in accordance with National Instrument 43-101.
The diagrams on the following pages show the design and layout of the Carlin Complex.
- 67 -
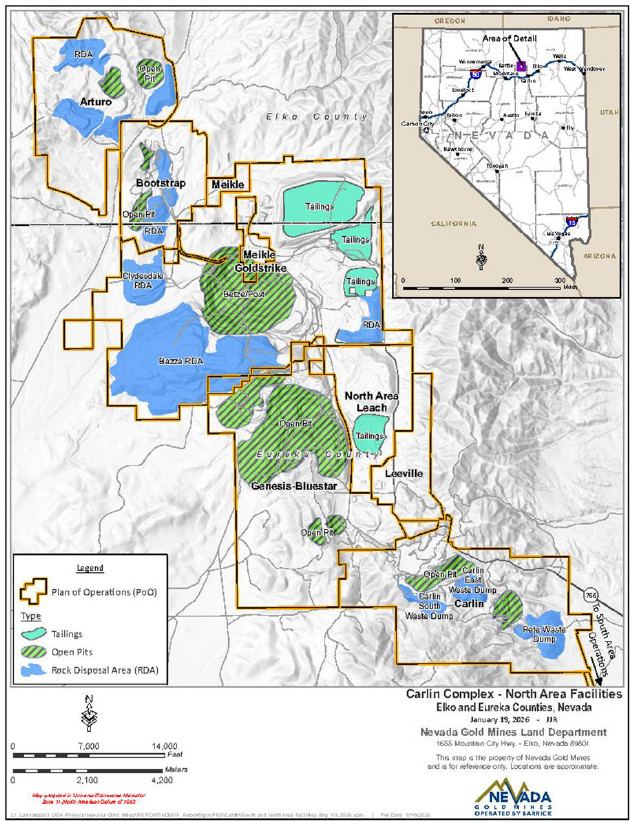
- 68 -
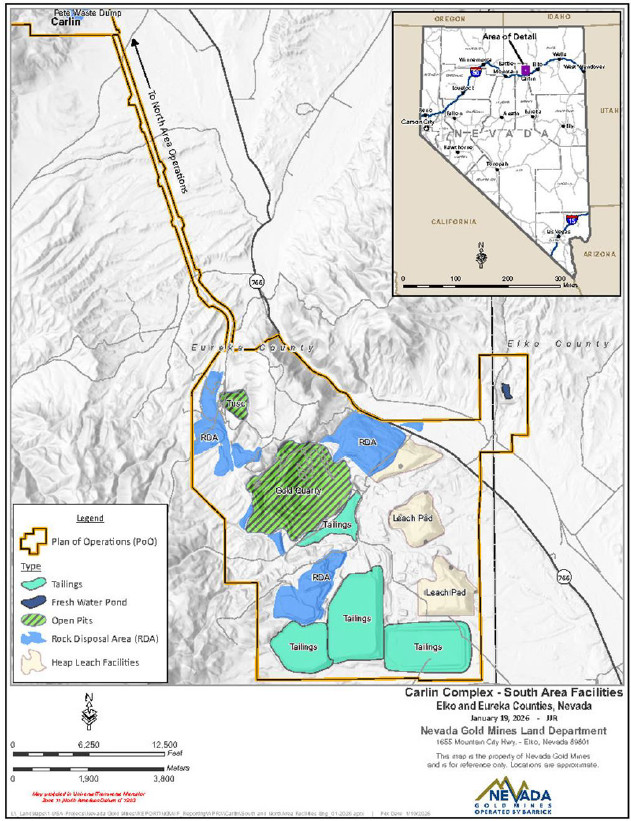
- 69 -
Turquoise Ridge Complex
General Information
Project Description
Nevada Gold Mines operates the Turquoise Ridge Complex, located in Humboldt County, Nevada. In connection with the formation of Nevada Gold Mines, Barrick’s 75%-owned Turquoise Ridge Mine (25% Newmont) and Newmont’s Twin Creeks Complex were combined as a single operation, now known as the Turquoise Ridge Complex. The combined mining operation is comprised of the Turquoise Ridge Underground, Vista Underground, and Turquoise Ridge Surface (comprised of the Mega and Vista open pits).
The Turquoise Ridge Complex is located in the Potosi Mining District, approximately 40 kilometers northeast of the village of Golconda, Nevada and approximately 64 kilometers northeast of Winnemucca, Nevada. The property is accessible from Golconda by a paved road, followed by an improved gravel road to the mine gates. Turquoise Ridge Underground covers an aggregate area of 2,402 hectares, which consists of 1,145 hectares of unpatented mining and mill-site claims and 1,257 hectares of patented/fee land. Turquoise Ridge Surface covers a total area of 7,925 hectares, of which 4,118 hectares are unpatented mining claims and 3,808 hectares are patented/fee lands. The Fiberline Project area (100% Newmont-owned property) is excluded from the Nevada Gold Mines’ joint venture area and does not encroach on the mineral reserve or mineral resource pit designs. As of December 31, 2025, the Turquoise Ridge Complex had approximately 900 employees and averages approximately 300 contractors.
Turquoise Ridge Underground produces high-grade refractory (carbonaceous/sulphide) gold ore from a long-life underground operation. Turquoise Ridge Underground is currently hoisting 3,100 tonnes of ore per day on average. Vista Underground was a portal and ramp accessed vein-style stoping mine at which existing mineral reserves are exhausted. A 2025 review of Vista Underground determined it has the potential for small ounce delivery in 2026 and 2027. Turquoise Ridge Surface has currently paused mining in the open pits, while ore from stockpiles is processed.
Turquoise Ridge Surface produces oxide heap leach, oxide mill and sulphide ore. Processing operations at the Turquoise Ridge Complex consist of the Sage Autoclave, Juniper Oxide CIL plant and heap leach pads.
Sufficient surface rights have been obtained for current operations at the Turquoise Ridge property.
History
Mining for copper, lead, and silver first began on the Turquoise Ridge Underground property in 1883. Tungsten was discovered in 1916 and mined sporadically until 1957. Gold was discovered at the present day Getchell minesite in 1933, with Getchell Mine Inc. operating the property from 1934 to 1945. From 1960 to 2009, there was sporadic production at the Getchell mine including underground mining, open pit mining and heap leaching of the dumps.
A deep drilling program began in 1993 in the Turquoise Ridge area. Planning and engineering for a new underground mine was completed in 1995. By mid-1998, a production shaft was completed at a depth of 555 meters below the surface. In February 2000, mining was suspended at the Getchell Main underground mine. Drilling continued on the Turquoise Ridge and North Zone deposits, but due to depressed gold prices, the entire property was shut down in February 2002. Production resumed in February 2003. Getchell Underground was placed on care and maintenance in April 2008. Full closure of the Getchell Underground mine occurred in the summer of 2009.
- 70 -
Turquoise Ridge Surface (the former Twin Creeks property) was formed in 1993 by the consolidation of the Rabbit Creek Mine and the Chimney Creek Mine. The Chimney Creek orebody was discovered in 1985 by Gold Fields Mining Corporation, while the Rabbit Creek property was discovered by Santa Fe Pacific Gold Corporation in 1987. In May 1997, a predecessor company of Newmont acquired Twin Creeks, which remained wholly-owned by Newmont until the formation of Nevada Gold Mines in 2019. The former Rabbit Creek is located in the south end of the property, including what is now known as Mega Pit.
On July 1, 2019, Barrick’s 75% interest in Turquoise Ridge, together with Newmont’s 25% interest in Turquoise Ridge and its interest in Twin Creeks, were contributed to Nevada Gold Mines. Due to their proximity, as well as geological, operating and processing synergies, the Turquoise Ridge mine and the Twin Creeks mine and processing facilities have been combined for planning and management purposes into a single complex known as the Turquoise Ridge Complex. Barrick is the operator of Nevada Gold Mines.
Geology
Geological Setting
The Turquoise Ridge Complex is situated within the Basin and Range province, near the northeast end of the Osgood Mountains. The Osgood Range is underlain by Cambrian Osgood Mountain Quartzite, Cambrian Preble Formation, Ordovician “Comus” Formation and the “upper plate” Valmy Formation. These units are unconformably overlain by the Permian Etchart Formation (Antler Peak Equivalent) of the Roberts Mountains overlap assemblage, and by the Triassic Golconda allochthon. These uppermost units form a belt of outcrops flanking the western and northern sides of the Osgood Range. All of these units are intruded upon by two generations of felsic intrusive rocks – a set of 114 Ma dacite dikes and sills at Turquoise Ridge Underground and Turquoise Ridge Surface and the 92 Ma Osgood Stock and temporally related dikes and sills. To date, no Eocene intrusive rocks have been identified at the Getchell, Turquoise Ridge Surface or Pinson camps.
Mineralization
Mineralization of the Turquoise Ridge Underground deposit generally consists of disseminated, micron-sized gold occurring in arsenic-rich rims forming on pyrite, chiefly within decalcified, carbonaceous rocks. All gold bearing zones at Turquoise Ridge Underground are located in proximity to granodiorite dykes that splay from the Osgood stock. Mining and exploration activities at Turquoise Ridge Underground are centered on limestone and mudstone horizons adjacent to these dykes.
Mineralization at Turquoise Ridge Surface is localized in decalcified carbonates, but can occur less frequently in argillized and sulphidized basalt. Silicification is common in Comus Formation sediments immediately adjacent to basaltic contacts with generally lower gold grades. At Vista Underground, mineralization is largely confined to the Trench Fault shear zone within a basalt host.
Mining Operations
Production and Mine Life
Turquoise Ridge Underground is accessed via three shafts and a system of internal ramps and utilizes underhand drift-and-fill and longhole stoping mining methods with cemented aggregate backfill. Vista Underground consists of two portals and a system of underground ramps accessing a steeply dipping mineralized zone where narrow-vein longitudinal stoping takes place. Vista Underground has been developed to access the vein in multiple horizons with two main barrier pillars to be mined on retreat. Turquoise Ridge Surface operates the Vista and Mega open pits, as well as
- 71 -
providing ore rehandle and surface project work at Turquoise Ridge Underground. Turquoise Ridge Surface uses conventional open pit mining methods including drilling, blasting, loading, and hauling.
Nevada Gold Mines has prepared a life of mine production schedule based on processing facilities and current mineral reserves for the two operations (Turquoise Ridge Underground and Turquoise Ridge Surface) with production planned into 2050. The current planned minimum production rates for Turquoise Ridge Underground are approximately 3,000 tonnes of ore per day on average, and approximately 52,000 tonnes mined per day for the period of 2027 to 2032 at Turquoise Ridge Surface.
Processing
In the current life of mine plan, refractory ore from the Turquoise Ridge Complex is processed at the Sage autoclave while non-refractory ore is processed at the Juniper oxide mill or stacked on heap leach pads. All processing facilities are located at Turquoise Ridge Surface on the legacy Twin Creeks property. The previous toll milling agreement in place between Barrick and Newmont was terminated in connection with the formation of Nevada Gold Mines in 2019.
Infrastructure, Permitting and Compliance
Material existing infrastructure at Turquoise Ridge Underground includes a tailings facility, a mobile equipment mining fleet, an underground dewatering facility, a 120-kilovolt electrical power line connection to the grid and a water treatment plant.
Material existing infrastructure at Turquoise Ridge Surface includes three active waste dumps, tailings facilities, one oxide mill (Juniper), one refractory mill (Sage) with two autoclaves, one active leach pad (Izzenhood) and a refinery. The Vista Underground uses the existing infrastructure of the Turquoise Ridge Surface.
Power requirements for Turquoise Ridge Underground are purchased outside the local provider system under open-access provisions whereby power is purchased on the open market or from the Western 102 power plant (which is owned and operated by Nevada Gold Mines). Power requirements for Turquoise Ridge Surface, Vista Underground, and the process facilities located at the legacy Twin Creeks property, in addition to the supporting infrastructure, are satisfied by both the TS power plant owned by Nevada Gold Mines (originally built by Newmont and placed into operation in 2008) and grid power from NV Energy.
Certain of Barrick’s mineral reserves and operations at Nevada Gold Mines occur on unpatented lode mining claims and mill sites that are on federal lands subject to U.S. federal mining and other U.S. federal and state laws. See “Cortez Property – Infrastructure, Permitting and Compliance” for additional information.
All material permits and rights to conduct existing operations at the Turquoise Ridge mine have been obtained and are in good standing or were in the process of renewal.
Third Shaft
Production from the Third Shaft, with nameplate hoisting capacity of 5,000 tonnes per day, started in the fourth quarter of 2022 and is included in the current life of mine plan. Together with increased hoisting capacity, the Third Shaft provides additional ventilation for underground mining operations as well as shorter haulage distances. Site preparation for the Third Shaft started in 2017, and shaft sinking to its final depth of 989 meters below the collar was completed between 2019 and 2021. First production skipping from the 2280 level began in the third quarter of 2022 and the Third Shaft was commissioned and substantially completed in the fourth quarter of 2022. In 2023, minor finishing work
- 72 -
for stage 6 and the completion of stage 7 change house were completed, with minor finishing work completed in 2023 and 2024.
Environment
The climate in the area of the Turquoise Ridge Complex is a semi-arid, steppe climate characterized by dry, hot summers and cold winters. The Turquoise Ridge Complex operates on a year-round basis and is not regularly affected by climatic conditions.
The Turquoise Ridge Complex maintains several permits for the operation, and tracks permits carefully to ensure ongoing compliance. Nevada Gold Mines environmental staff carry out sampling, monitoring and record keeping, and are involved in permit applications and renewals as required. In 2025, all activities at the Turquoise Ridge Complex were, and continue to be, in compliance in all material respects with applicable corporate standards and environmental permits and regulations.
As at December 31, 2025, the recorded amount of estimated future reclamation and closure costs that were recorded under IFRS, as defined by IAS 37, and that have been updated each reporting period, was $83 million (100% basis) (as described in Note 2r to the Consolidated Financial Statements). Nevada Gold Mines has provided the financial security required by governmental authorities in connection with the reclamation of the mine area.
Exploration and Drilling
At Turquoise Ridge, Nevada Gold Mines is pursuing the considerable growth potential both near and between the mines. The Turquoise Ridge Complex has two deposits at both ends of an eight-kilometer trend. These two deposits (the legacy Turquoise Ridge and Twin Creeks properties) have a complex geological history with sparsely tested prospective ground between them. Significant work has been done on these deposits since the formation of Nevada Gold Mines, and multiple new targets in what was thought to be a maturing district have started to emerge.
Growth and exploration for 2025 focused on building Nevada Gold Mines’ understanding of the upside potential, while testing updated mineral controls. At Turquoise Ridge Underground, a total of 22,394 meters was drilled across reserve conversion, resource addition, and step-out programs. Results expanded mineralization potential along the Divide fault and advanced targeting opportunities to the east along the Turquoise Ridge fault; continuity of mineralized structural controls was confirmed to the north. Drilling in 2026 will follow-up results down plunge to the north-northeast and along intersection lineations east of the active mine, as well as along Getchell parallel structures to the west.
At the Mega open pit, reserve conversion drilling of 10,644 meters was completed targeting expansion of the existing reserve pit shell. Results to date have supported continuity and confirmed inferred mineralization. Drilling intercepted unmodeled, local structures, folding, and inflections in mafic sills, which are controls on the mineralization.
Royalties and Taxes
In connection with the formation of Nevada Gold Mines, each of Barrick and Newmont was granted a 1.5% net smelter return royalty over the respective properties they contributed (including Barrick’s 75% interest in the Turquoise Ridge mine and Newmont’s 25% interest in the Turquoise Ridge mine and its interest in Twin Creeks). Each of these “retained royalties” is only payable once the aggregate production from the properties subject to the royalty exceeds the publicly reported reserves and resources as of December 31, 2018. In addition, certain areas within Turquoise Ridge Surface are subject to 2% gross proceeds royalties payable to Royal Gold. Vista Underground and Turquoise Ridge Underground are not subject to any royalties (other than as described above).
- 73 -
The State of Nevada imposes a 5% NPT on the value of all minerals severed in the State. This tax is calculated and paid based on a prescribed net income formula which is different from book income.
Effective July 1, 2021, the State of Nevada also imposes a mining excise tax applied to gross proceeds. This is a tiered tax, with a highest rate of 1.1% and the revenue it generates is directed towards education.
Mining and Processing Information
The following table summarizes certain mining and processing information for the Turquoise Ridge Complex for the period indicated:
| Year ended December 31, 20251 |
Year ended December 31, 20241 |
| ||||||
| Tonnes mined (000s) | 1,179 | 2,339 | ||||||
| Tonnes of ore processed (000s) | 2,474 | 2,268 | ||||||
| Average grade processed (grams per tonne) | 4.88 | 4.86 | ||||||
| Ounces of gold produced (000s) | 341 | 304 | ||||||
| 1 | Amounts represent Barrick’s 61.5% share. |
The most recent technical report on the Turquoise Ridge mine is the technical report entitled “NI 43-101 Technical Report on the Turquoise Ridge Complex, Humboldt County, Nevada, USA.” dated March 15, 2024 and authored by Nevada Gold Mines. This technical report has been filed on SEDAR+ in accordance with National Instrument 43-101.
The diagram on the following page sets out the design and layout of the Turquoise Ridge Complex.
- 74 -
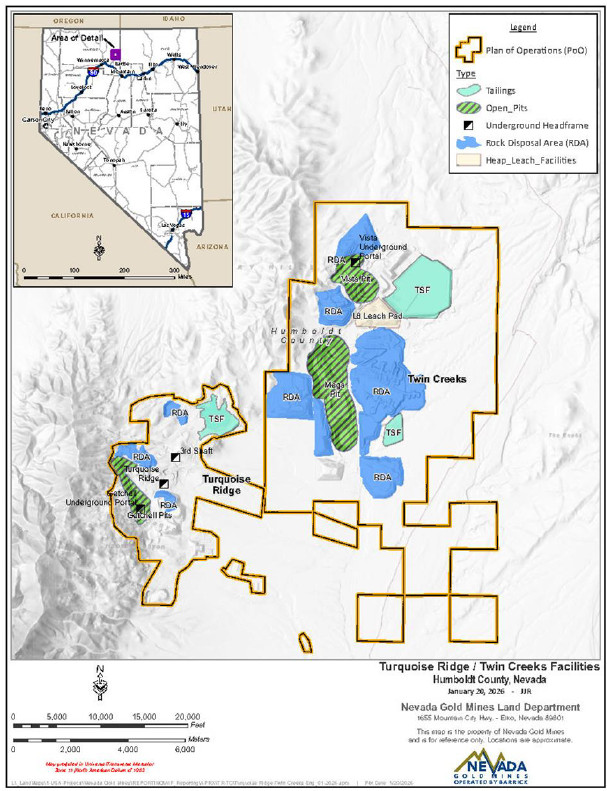
- 75 -
Pueblo Viejo Mine
General Information
Project Description
The Pueblo Viejo mine is an open pit, conventional truck and shovel mining operation located in the municipality of Cotui, province of Sánchez Ramírez in the central part of the Dominican Republic, on the Caribbean island of Hispaniola. The mine is approximately 55 kilometers north-northwest of the national capital of Santo Domingo. As of December 31, 2025, Pueblo Viejo employs approximately 3,000 employees and 3,800 contractors.
The Pueblo Viejo mine is situated on the Montenegro Fiscal Reserve (the “MFR”), an area specially designated by Presidential Decree for the leasing of minerals and mine development, which covers an area of approximately 7,995 hectares at the head of the Arroyo Margajita Valley in the eastern portion of the Cordillera Central. This includes all of the areas previously included in the Pueblo Viejo and Pueblo Viejo II concession areas, which were previously owned by Rosario Dominicana S.A. (Rosario) until 2002, as well as the El Llagal and new Naranjo TSF areas, the latter of which was approved to be included in the MFR in 2022. A special lease agreement (“SLA”) between the Dominican government and Pueblo Viejo Dominicana Jersey 2 Limited (formerly Pueblo Viejo Dominicana Corporation, (“PVD”)) governs the development and operation of the Pueblo Viejo mine. The SLA provides PVD with the right to operate the Pueblo Viejo mine for a 25-year period that commenced on February 26, 2008, the date on which PVD delivered the Project Notice under the SLA, as defined therein, with one extension by right for 25 years and a second 25-year extension by mutual agreement of the parties, allowing a possible total term of 75 years.
The Pueblo Viejo deposits are located in two major areas, the Monte Negro and Moore pits, as well as other smaller satellite pits. The property is accessible year-round by paved road from Santo Domingo.
Sufficient surface rights have been obtained for current operations at the property. Under the current SLA and Decree No. 270-22, PVD holds the rights necessary to operate the mine and build the proposed Naranjo TSF expansion. The new Naranjo TSF requires PVD to obtain surface rights in the planned facility location and will require completion of a resettlement program. PVD is in the process of obtaining such rights and resettling affected persons.
History
Early mining activity at the site dates back to the 1500s. Subsequent to that early mining activity, Rosario Resources commenced mining operations on the property in 1975. In 1979, the Central Bank of the Dominican Republic purchased all foreign-held shares in Rosario Resources and the Dominican Government continued operations as Rosario Dominicana S.A. Gold and silver production from oxide, transitional, and sulfide ores occurred from 1975 to 1999. The mine ceased operations in 1999. In 2000, the Dominican Republic invited international bids for the leasing and mineral exploitation of the Pueblo Viejo minesite. In July 2001, PVD (then known as Placer Dome Dominicana Corporation), an affiliate of Placer Dome, was awarded the bid. PVD and the Dominican Republic subsequently negotiated the SLA for the MFR, which was ratified by the Dominican National Congress and became effective on July 29, 2003. In March 2006, Barrick acquired Placer Dome and, in May 2006, the companies were amalgamated. At the same time, Barrick sold a 40% stake in the Pueblo Viejo project to Goldcorp (acquired by Newmont in 2019). On February 26, 2008, pursuant to the SLA, PVD delivered the Project Notice and Pueblo Viejo Feasibility Study to the Government of the Dominican Republic. In 2009, the Dominican Republic and PVD agreed to amend the terms of the SLA. The amendment became effective on November 13, 2009, following its ratification by the Dominican National Congress. The Pueblo Viejo mine achieved first production in 2012. A second amendment to the SLA became effective on October 5, 2013, and resulted in additional and accelerated tax revenues to the Government of the Dominican Republic (see “Royalties and Taxes” below).
- 76 -
Geology
Geological Setting
The Pueblo Viejo deposit consists of high sulfidation or acid sulfate epithermal gold, silver, copper and zinc mineralization that was formed during the Cretaceous Age island arc volcanism. The key areas of mineralization are the Moore and Monte Negro pits with smaller surrounding satellite pits (Cumba, Mejita and ARD1). Exploration work continues to identify additional potential inside the MFR. Pueblo Viejo is situated in the Los Ranchos Formation, a series of volcanic and volcaniclastic rocks that extend across the eastern half of the Dominican Republic, generally striking northwest and dipping southwest.
Mineralization
The Moore deposit is located at the eastern margin of the Pueblo Viejo member sedimentary basin. Stratigraphy consists of finely bedded carbonaceous siltstone and mudstone (PV sediments) overlying mainly quartz bearing facies (volcaniclastic and pyroclastic flow), which are underlain by horizons of andesitic facies (basaltic-andesite flows) and intrusive and pyroclastic flow. The Monte Negro deposit is located at the northwestern margin of the sedimentary basin. Stratigraphy consists of interbedded carbonaceous sediments ranging from siltstone to conglomerate that are interlayered with volcaniclastic flows. Metallic mineralization in the deposit areas is primarily pyrite with lesser amounts of sphalerite and enargite. Pyrite mineralization occurs as disseminations, layers, replacements and veins. Sphalerite and enargite mineralization are primarily in veins with pyrite, but disseminated sphalerite has also been noted in core. The mineralization extends for 2,800 meters north-south and 2,000 meters east-west and extends from the surface to 500 meters in depth.
Mining Operations
Production and Mine Life
The Pueblo Viejo mine is an open pit, conventional truck-and-shovel mining operation. It achieved first production in 2012 and completed its ramp-up to full design capacity in 2014. Current mining operations will supplement fresh ore from the Monte Negro and Moore pits with stockpiled ore to deliver the increased throughput rates contemplated in the process plant expansion.
Based on existing reserves and additional tailings capacity from the new Naranjo TSF, open pit mining operations are expected to continue through 2048 with limestone re-handling and processing continuing through 2049. Tailings from the recently expanded process plant will continue to be deposited in the existing El Llagal TSF until the end of life of that facility in 2030. From approximately mid-2030 until the end of mineral processing, tailings will then be deposited into the Naranjo TSF.
Pueblo Viejo produced 379,014 ounces of gold in 2025 (Barrick’s 60% share). Production in 2025 was impacted by several operational challenges. Processed tonnes were lower than expected, with significant drops during the third and fourth quarters due to unplanned breakdowns. Additionally, production was affected by low gold recovery, which was linked to increased organic carbon causing a high preg-robbing effect and other deleterious mineralogy.
Processing
Gold and silver are recovered through pressure oxidation (autoclave) of whole ore followed by hot cure and hot lime boil, prior to cyanidation of gold and silver in a CIL circuit.
Following completion of the plant expansion, the process plant is now designed to process approximately 35,000 tonnes per day of run-of-mine refractory ore. The primary unit operations are crushing, grinding, flotation, high-pressure oxidation, washing, neutralization and CIL circuits. The flotation
- 77 -
circuit is used to increase sulfide grade from 6.4% to 10.7%, and the design basis for the oxygen plant is to provide the oxygen required to oxidize approximately 128 tonnes per hour of sulfides. This is equivalent to 1,200 tonnes per hour of autoclave feed containing 10.7% sulfide sulfur, assuming a design factor of 2.2 tonnes of oxygen per tonne of sulfides. Lower sulfide ores are often fed to the plant resulting in higher tonnage, often well over 30,000 tonnes per day.
Copper was previously a by-product from the processing plant which was produced as a copper sulfide concentrate through the injection of hydrogen sulfide gas into a solution containing copper ion. For the current process plant, copper is no longer recovered and there are no plans to resume copper recovery.
Infrastructure, Permitting and Compliance
The current tailings storage facility is located in the El Llagal valley, approximately four kilometers south of the plant site. The El Llagal TSF consists of one main dam and three saddle dams. The El Llagal TSF will receive process tailings until approximately 2030, at which point the tailings placement will transition to the new Naranjo TSF. In addition to tailings, the Naranjo TSF will receive the potentially acid generating (PAG) material mined and currently stored in temporary waste rock dumps near the pits. The tailings facility is sized to provide storage for an operating pond and for extreme precipitation events. The mine is situated in a seismically active area. The design of the dams at the site was based on the maximum credible earthquake criteria.
The process plant expansion and mine life extension projects were designed to increase and extend the life of mine beyond 2045 with the incorporation of the new Naranjo TSF. PVD completed a pre-feasibility study for the new Naranjo TSF, adding 6.5 million ounces of attributable proven and probable reserves, net of depletion in 2023.
The process plant expansion flowsheet now includes an additional primary crusher, coarse ore stockpile and ore reclaim delivering to a new single stage semi-autogenous (“SAG”) mill, and a new flotation circuit that concentrates the bulk of the sulfide ore prior to oxidation. The concentrate is blended with fresh milled ore to feed the modified autoclave circuit, which has additional oxygen supplied from a new 3,000 tonnes-per-day facility. The existing autoclaves were upgraded to increase the sulfur processing capacity of each autoclave through additional high-pressure cooling water and recycle flash capability using additional slurry pumping and thickening.
Phase 1 of the expansion project, which is related to the process plant expansion, has been completed and achieved commercial production in the third quarter of 2024. Phase 2, which focuses on the new Naranjo TSF, continues to progress. The Environmental and Social Impact Assessment (“ESIA”) was approved by the Dominican Government during the second quarter of 2023. The Naranjo TSF updated feasibility study is expected to be completed in the first half of 2026 and will be submitted to the government for permitting. The estimated capital cost of the new Naranjo TSF will be updated following the completion of the feasibility study. Contracting and procurement for long lead items and major construction works began in 2024, with early works construction taking place throughout 2025 and 2026 to enable Starter Dam construction in mid-2027. The development of a new town and housing complex to resettle families displaced by the new Naranjo TSF is well underway with 550 houses now complete and less than 100 houses under construction. The construction of the potable water system, sewage system, primary school and community centers were also completed in 2025.
The key permits for 2026 infrastructure are on track with haul road permits obtained in late 2025, and temporary water management structures permits expected in the first half of 2026.
As at December 31, 2025, $1,229 million has been spent on the plant expansion and mine life extension project (100% basis). The estimated capital cost of the plant expansion and mine life extension project is approximately $2.6 billion (100% basis), which includes the new Naranjo TSF.
- 78 -
The Hatillo and Hondo Reservoirs supply fresh water for the process plant. Reclaimed water from the El Llagal tailings containment pond is used as a supplementary water supply.
Operational power requirements vary, but are generally less than 200 megawatts at 26,000 tonnes per day. In 2013, PVD commissioned a 218 megawatt Wartsila combined cycle reciprocating-engine power plant, together with an approximately 72-kilometer transmission line connecting the plant to the minesite. The power plant is located near the port city of San Pedro de Macoris on the south coast and will provide the long-term power supply for the Pueblo Viejo mine. The plant is dual fuel and was converted to natural gas from heavy fuel oil in 2020. In 2019, PVD signed a 10-year natural gas supply contract with AES Andres DR, S.A. (“AES”) in the Dominican Republic. AES also completed a new gas pipeline to the facility. The power plant began supplying power to the mine using natural gas in the first quarter of 2020. Additional power will come from the grid or from a solar plant that is currently in the planning stage.
All material permits and rights to conduct existing operations at the Pueblo Viejo mine and power plant facilities have been obtained and are in good standing. Certain permits related to the construction of the Naranjo TSF are in the process of being prepared for submission to the relevant government authorities.
Environment
Elevation at the minesite ranges from 565 meters at Loma Cuaba to approximately 65 meters at the Hatillo Reservoir. The site is characterized by rugged and hilly terrain covered with subtropical wet forest and scrub cover. The region has a tropical climate with little fluctuation in seasonal temperatures. The heaviest rainfall occurs between May and October.
The Pueblo Viejo minesite is affected by several significant legacy environmental issues resulting from the conduct of operations at the site prior to Barrick’s involvement in the mine. Under the terms of the SLA, the Dominican government is obligated, at its sole cost and expense, to remediate and rehabilitate, or otherwise mitigate all historic environmental matters. Subject to the verification of certain conditions, PVD has agreed to act as an agent of the Dominican government to remediate the historical environmental liabilities of the government. PVD has agreed to cover the capital costs related to such remediation up to $75 million. In addition, upon PVD giving the Dominican government a Project Notice, which was issued by PVD in 2008 under the SLA, PVD assumed the responsibilities for all historic environmental matters within the boundaries of the “Development Areas”, except for hazardous substances at the Rosario’s plant site which remain the responsibility of the Dominican government. Furthermore, the Dominican government is required under the SLA, in compliance with the applicable Environmental and Social Guidelines and Policies and at its sole cost and expense, to relocate and pay all indemnification and other compensation due to certain persons with valid claims to land within the MFR. Under the SLA, PVD and the Dominican government were required to come into compliance with the historic environmental mitigation and remediation matters, for which they are responsible under that agreement, by November 2014. PVD achieved compliance by that deadline. In the second half of 2016, PVD was contracted to act as an agent of the Dominican government to carry out activities for which the Dominican government is responsible under the SLA pursuant to the Environmental Management Plan of the government.
The requisite environmental permits were received in November 2016 to carry out the first stage of the closure plan, which focuses on dewatering, buttressing, and improving the stability of the old Mejita TSF. Dewatering of the old Mejita TSF was completed in 2018, as well as the geotechnical investigation program. In 2020, the Environmental Management Plan of the government achieved progress for the Mejita tailings cover component, with work occurring mainly at the north and central ponds. Progress was also made on the buttress excavation and Phase 1A was completed in 2021. In 2024, the first risk analysis of workshop for the Mejita TSF was completed. Two additional workshops remain pending and will be conducted once the seismic design has been finalized.
- 79 -
In 2025, PVD’s activities at the Pueblo Viejo mine were, and continue to be, in compliance in all material respects with applicable corporate standards and environmental regulations.
As at December 31, 2025, the recorded amount of estimated future reclamation and closure costs that were recorded under IFRS, as defined by IAS 37, and that have been updated each reporting period, was $126 million (100% basis) (as described in Note 2r to the Consolidated Financial Statements). In addition, an environmental reserve fund has been established in an offshore escrow account, as required by the SLA, and funded by PVD during operations until the funds are adequate to discharge PVD’s closure reclamation obligations.
Exploration and Drilling
As of December 31, 2025, the Pueblo Viejo drill hole database comprises 38,338 drill holes, totaling approximately 2,155 kilometers of drilling. Diamond drilling contributes approximately 406 kilometers (18%) of the total drilled meters, providing key geological and structural control, while RC drilling, predominantly completed for grade control, accounts for approximately 76% of the total drilled meters and 86% of the drill hole count. This high-density drilling database underpins geological interpretation, grade estimate, Mineral Resource classification, and mine planning for the Pueblo Viejo property.
Drill hole spacing is program-dependent, ranging from approximately 10 to 30 m for grade control drilling and 50 to 100 m for exploration resource definition, and condemnation drilling. These drilling densities are considered appropriate to support the scale of the deposit, geological continuity, and Mineral Resource confidence levels.
During 2025, brownfield exploration drilling campaigns were focused on the MFR, at the Anastasia and Mojito targets in the Zambrana area. The drill campaign consisted of 459 meters in two diamond drill holes in Mojito, and 199.75 meters in one drill hole in Anastasia, for 658.75 meters, which intercepted no economic mineralization. A second drill campaign was executed in the Mejita Tails target with completion of 2,238 meters distributed in ten diamond core drill holes. No economic mineralization was intercepted, and results vectorize to the southwest. Follow-up exploration works of geophysical surveys will be performed in 2026, to evaluate the potential for concealed mineralization. Additionally, the culmination of Phases 2 and 3 of the integrated district-scale geological model were completed during 2025, delivering additional targets to be evaluated during 2026.
Also in 2025, several growth drilling and reserve definition projects were advanced, with a total of 19,334 meters drilled. The first program was located around ARD1, with 155 meters completed. Results indicate open favorable alteration toward the west underlying the limestone deposit. The Cumba North-West project with 302 meters is still in progress. Additional drilling for quarry development was executed for both diorite and limestone with 8,524 meters. In addition to the growth and development drilling projects described above, 10,351 meters for reserves infill drilling campaign within the five-year mining plan across Moore and Monte Negro pits was also completed.
Royalties and Taxes
Under the SLA, PVD is obligated to make the following payments to the Dominican Republic: a net smelter return royalty of 3.2% based on gross revenues less some deductible costs (royalties do not apply to copper or zinc); a net profits interest of 28.75% based on an adjusted taxable cash flow; a corporate income tax of 25% based on adjusted net income; a withholding tax on interest paid on loans and on payments abroad; and other general tax obligations. The SLA tax regime includes a stability clause.
A second amendment to the SLA became effective on October 5, 2013, resulting in additional and accelerated tax revenues to the Dominican Government. The second amendment to the SLA includes the establishment of a graduated minimum tax, which is adjusted up or down every three years based on a
- 80 -
financial model prepared by PVD and subject to government approval. Based on provisions of the SLA, PVD has submitted the 2026-2028 financial model for the determination of applicable minimum tax rates. Discussions with the Dominican government, through the representative body of the Ministry of Energy and Mines, have commenced, and the model is currently under review. This process is expected to conclude with the formal issuance of the approval and the establishment of applicable minimum tax rates, which is expected to occur no later than mid-April 2026.
Streaming Transaction
On September 29, 2015, Barrick closed a gold and silver streaming transaction with Royal Gold for production linked to Barrick’s 60% interest in the Pueblo Viejo mine. Royal Gold made an upfront cash payment of $610 million and will continue to make cash payments for gold and silver delivered under the agreement. The $610 million upfront payment is not repayable and Barrick is obligated to deliver gold and silver based on Pueblo Viejo’s production. Barrick has accounted for the upfront payment as deferred revenue and recognizes it in earnings, along with the ongoing cash payments, as the gold and silver is delivered to Royal Gold. Barrick will also be recording accretion expense on the deferred revenue balance as the time value of the upfront deposit represents a significant component of the transaction.
Under the terms of the agreement, Barrick sells gold and silver to Royal Gold equivalent to: (i) 7.5% of Barrick’s interest in the gold produced at Pueblo Viejo until 990,000 ounces of gold have been delivered, and 3.75% thereafter; and (ii) 75% of Barrick’s interest in the silver produced at Pueblo Viejo until 50 million ounces have been delivered, and 37.5% thereafter. Silver is delivered based on a fixed recovery rate of 70%. Silver above this recovery rate is not subject to the stream. As at December 31, 2025, approximately 397,000 ounces of gold and 14 million ounces of silver have been delivered to Royal Gold. There is no obligation to deliver gold or silver under the agreement if there is no production from Pueblo Viejo.
Barrick receives ongoing cash payments from Royal Gold equivalent to 30% of the prevailing spot prices for the first 550,000 ounces of gold and 23.1 million ounces of silver delivered. Thereafter, payments will double to 60% of prevailing spot prices for each subsequent ounce of gold and silver delivered. Ongoing cash payments to Barrick are tied to prevailing spot prices rather than fixed in advance, maintaining exposure to higher gold and silver prices in the future.
Mining and Processing Information
The following table summarizes certain mining and processing information for the Pueblo Viejo mine for the period indicated:
| Year ended December 31, 20251 |
Year ended December 31, 20241 |
| ||||||
| Tonnes mined (000s) | 17,818 | 10,885 | ||||||
| Tonnes of ore processed (000s) | 6,429 | 5,730 | ||||||
| Average grade processed (grams per tonne) | 2.44 | 2.46 | ||||||
| Ounces of gold produced (000s) | 379 | 352 | ||||||
| 1 | Barrick’s 60% share. |
The most recent technical report on the Pueblo Viejo mine is the technical report entitled “NI 43-101 Technical Report on the Pueblo Viejo Mine, Dominican Republic” dated February 27, 2026 and authored by Patrick Lee, Peter Jones, Jeffrey Winterton, Bassam El-Husseini, and Brendon Douglas. This technical report has been filed on SEDAR+ in accordance with National Instrument 43-101.
The Company has extensive operating experience in the Dominican Republic. Nevertheless, operating in emerging markets, such as the Dominican Republic, exposes the Company to risks and
- 81 -
uncertainties that do not exist or are significantly less likely to occur in other jurisdictions such as the United States or Canada, such as the SLA negotiations described above. For additional details, see “Foreign investments and operations”, “Permitting and government relations”, “Inflation”, “Joint ventures”, “Security and human rights”, “Community relations and license to operate”, “Government regulation and changes in legislation” and “U.S. Foreign Corrupt Practices Act and similar worldwide anti-bribery laws” in “Risk Factors”.
While all risks cannot be mitigated or eliminated, the Company manages and mitigates controllable risks at its Pueblo Viejo operation through the consistent application of a variety of corporate governance structures and processes that are materially the same as those applied at its other operations located in developed markets. For additional details, see “Narrative Description of the Business – Operations in Emerging Markets: Corporate Governance and Internal Controls”.
The diagram on the following page sets out the design and layout of the Pueblo Viejo mine.
- 82 -
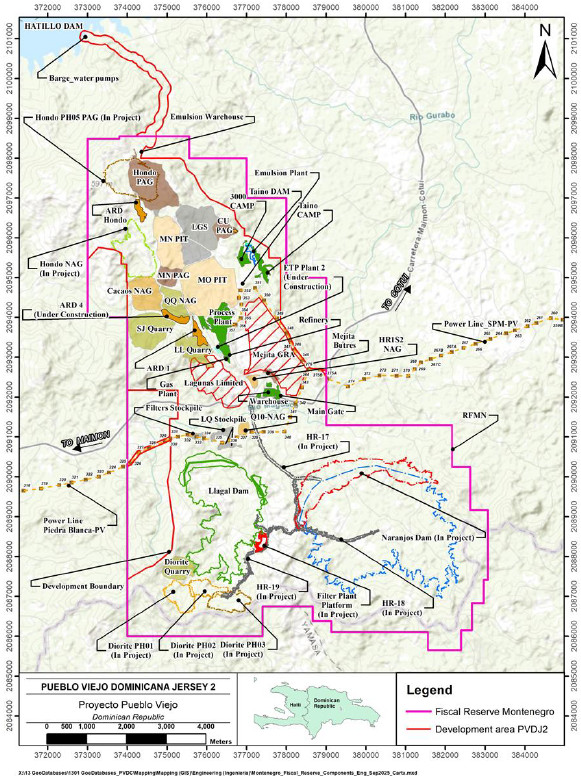
- 83 -
Kibali Mine
General Information
Project Description
The Kibali gold mine (“Kibali”) is located in the northeast of the DRC in the Haut Uélé Province approximately 1,800 kilometers northeast of the capital city of Kinshasa, approximately 560 kilometers northeast of the capital of the Orientale Province, Kisangani, 1,800 kilometers from the Kenyan port of Mombasa, 1,950 kilometers from the Tanzanian port of Dar es Salaam, and 150 kilometers west of the Ugandan border town of Arua, near the international borders of Uganda and Sudan. Personnel access to Kibali is commonly through charter flight directly to site from Entebbe, Uganda which runs every weekday. The main access points for equipment and supplies are the ports of Mombasa and Dar es Salaam via Kampala, Uganda (650 kilometers away).
As at December 31, 2025, Kibali has approximately 2,700 employees and 4,600 contractors.
Kibali consists of multiple gold deposits, including: KCD, Sessenge, Sessenge SW, Gorumbwa, Pakaka, Kombokolo, Pamao Main & Pamao South, Makoke, Mengu Hill, Mengu Village, Megi-Marakeke-Sayi, Kalimva, Ikamva, Aerodrome, Agabarabo-Rhino, Ndala and Oere. Kibali is covered by ten Exploitation (Mining) Permits for a total area of approximately 1,836 square kilometers.
Kibali Goldmines SA (“Kibali Goldmines”), a joint venture company between Barrick, AngloGold Ashanti Limited (“AngloGold”), and Société Minière de Kilo-Moto SARL (formerly Offices des Mines d’Or de Kilo-Moto) (“SOKIMO”), has been granted ten Exploitation (Mining) Permits under the DRC Mining Code (2002), seven of which are valid until 2029 and three of which are valid until 2030. The current life of mine plan for Kibali’s mineral reserves extends beyond these dates.
Pursuant to the DRC Mining Code (2002), to keep mining concessions in good standing, concession holders are required to pay certain permit fees and annual surface rights fees. All of the Exploitation (Mining) Permits are in good standing. Sufficient surface rights have been obtained for current operations at the property.
History
Moto Goldmines Limited (“Moto”), the previous operator of the Kibali project, acquired a 70% interest in the Kibali project in 2004 from SOKIMO. Moto completed a pre-feasibility study in 2006, a feasibility study in 2007, and an optimized feasibility study in 2009.
In 2009, Randgold Resources Limited (“Randgold”) and AngloGold entered into a 50/50 joint venture, which acquired all of the issued share capital of Moto and, as a result, Moto’s 70% interest in the Kibali project. Later in 2009, the joint venture acquired an additional 20% interest in the Kibali project from SOKIMO, giving Randgold a 45% interest in Kibali. On January 1, 2019, Barrick acquired Randgold’s 45% interest in Kibali by virtue of the merger of Barrick and Randgold. Barrick is the operator of Kibali.
Geology
Geological Setting
Kibali is situated in the Neoarchean Moto Greenstone Belt (otherwise referred to as Moto granite-greenstone terrane), bounded to the north by the West Nile Gneiss Complex and to the south by plutonic rocks of the Watsa Igneous Complex. The Neoarchean Moto Greenstone Belt is oriented west-northwest-east-southeast and contains Archean aged volcano-sedimentary conglomerates, carbonaceous shales, siltstones, banded iron formations (“BIF”), sub aerial basalts, mafic intermediate intrusions (dykes and sills), and is crosscut by several intrusive phases ranging from granodiorite to gabbroic in composition.
- 84 -
The Kibali gold deposits are predominantly hosted along, or within proximity to, a curvilinear structure 60 kilometers in length and up to one kilometer in width, known as the “KZ Trend”. The KZ Trend is situated in the central part of the Neoarchean Moto Greenstone Belt, forming a structural boundary between older eastern and younger western lithological domains. Deposits along the KZ Trend are further sub-divided into three areas: KZ North Trend, KZ Central Area, and KZ South Trend.
The structural architecture of the Kibali district is the product of at least seven phases of deformation (D1-D7), the most critical of which are the D1 to D3 events which created the favorable structural architecture for later ore shoot formation. These events are associated with recumbent, isoclinal folding with axial planes dipping approximately 25 degrees to 30 degrees north-northeast and fold axes that plunge approximately 25 degrees northeast. Gold is generally concentrated in gently northeast to north-northeast-plunging mineralized shoots, having formed between the D4 and D5 events.
Mineralization
Gold deposits are hosted primarily within siliciclastic rocks, BIFs, and chert. There are broad halos of quartz-carbonate-sericite alteration surrounding the mineralized systems, whereas gold mineralization is typically associated with areas where this alteration has been overprinted by siderite quartz, magnetite alteration, especially when hosted within or proximal to BIF sequences.
The KCD deposit is the principal mineralized occurrence at Kibali. It consists of a number of semi-vertically stacked lodes that have formed along the hinges and limbs of tightly folded host rock, with folds plunging approximately 20 degrees northeast. The lodes are dominantly BIF-hosted, extend more than 2.5 kilometers down plunge, and remain open at depth. Structurally, KCD can be separated into two stratigraphic blocks separated by a shear zone, the Carbonaceous Shale Domain and the main KCD Domain.
The Gorumbwa deposit is located approximately one kilometer west of the KCD deposit with similar alteration and structural characteristics but is significantly smaller in size. Mineralization occurs as a series of stacked, lensoidal lodes within a northeast-trending corridor, plunging gently to moderately northeast. Mineralization is hosted almost exclusively within a sandstone unit and the dominant mineralization style is moderate to strong silicification and sericitization with minimal pyrite.
The ARK deposits are located one to two kilometers northwest of the KCD deposit. They form a single mineralized system, are positioned within folds with a north-eastward plunge and represent the largest gold deposit at Kibali outside of KCD. Mineralization is hosted within a folded siliciclastic sequence comprising polymictic conglomerates, sandstones, carbonaceous argillite, volcanogenic sediments, and BIF horizons.
The Sessenge deposit outcrops approximately one kilometer to the southwest of the KCD deposit and represents the up-plunge continuation of the KCD domain. Mineralization is concentrated in a main lode composed of several shoots which extend from KCD into the Sessenge open pit. Like KCD, mineralization at Sessenge is hosted primarily in folded BIF, and to a lesser extent in clastic sedimentary units, and the primary control on mineralization is the northeast-plunging folded BIF units.
The Mengu Hill deposit lies on the KZ North structure, to the northwest of Pakaka and to the south of Mofu-Oere. The mineralized lens is cigar-like in shape and plunges shallowly to the north-northeast. Mineralization remains open down plunge.
The Aerodrome, Pakaka, Pamao and Makoke deposits are located along the KZ North Trend, in the gently north-northeast- to east-dipping shear zone. The presence of significant arsenopyrite at Pakaka distinguishes it from other northern Kibali deposits.
- 85 -
The Mengu Village and Megi-Marakeke-Sayi deposits are similar to and form a continuation of mineralization northwest of Makoke and Pamao but controlled by the KZ North Trend which dips 30 degrees to 35 degrees northeast in this area. At Mengu Village, mineralization is tabular in form, trending northwest and dipping shallowly to the northeast, and is hosted by conglomerates with thin intercalations of BIF and carbonaceous shale.
The Megi-Marakeke-Sayi deposit comprises three closely spaced mineral deposits separated by lower grade zones. The Megi-Marakeke-Sayi deposit occurs as multiple tabular lenses that trend northwest and dip gently to the northeast.
The Kalimva, Ikamva, Oere and Mofu deposits are located north of Mengu Hill where the KZ North Trend rotates to the north-northeast. These deposits are all characterized by an intense shear deformation associated with widespread carbonate-chlorite-quartz altered rocks. Mineralization is tabular, controlled by steep east-dipping shear zones and plunges gently north-northeast.
Mining Operations
Production and Mine Life
Open pit mining takes place in several satellite pits over approximately 20 kilometers. Most of the pits are being mined in phases. Mining has been completed at the Mofu, Rhino Phase 1, Mengu Hill Phase 1, Pakaka Phase 1, Kombokolo Phase 1, KCD Phase 1, 2 and 3, Sessenge Phase 1 and 2, Gorumbwa Phase 1 and 2 and most recently, Pamao Phase 1 and 2 pits.
As of December 31, 2025, the operational pits were Pamao Phase 3 and 4, Pamao South, Gorumbwa Phase 3, Ndala, Kalimva Hill, Ikamva East, Ikamva Phase 1, Rhino Phase 2 and Upper Rhino Phase 1. Open pit mining is mainly conducted by the contractor Kibali Mining Services, a local DRC company. Pits requiring smaller equipment due to their ramp size are being operated by local contractors.
From 2026 onwards, open pit production will come from active open pits at Gorumbwa, Pamao Main, Pamao South, Kalimva, Ikamva, Ndala, and Rhino (which will eventually encompass Agbarabo), and partially depleted open pits with planned pushbacks at Aerodrome, Pakaka, Sessenge, Mengu Hill, Kombokolo, and KCD. There are also three planned open pits at Megi-Marakeke-Sayi, Sessenge SW, and Oere. As all of the pits are characterized by the presence of a near-surface groundwater table with the potential for high groundwater inflows into the pits, a system of pumping and dewatering bore holes is established prior to the commencement of mining in each of the pits.
The upper levels of the open pits are usually in free dig weathered material mined in five meter benches. Fresh rock is mined in 10 meter benches and requires drilling and blasting. Blasting uses emulsion explosives that are supplied as a down-the-hole service. In between the oxide and fresh ore, there is a transitional zone being mined on five meter bench height that requires light drilling and blasting before mining.
The underground mining operation at Kibali has been producing for 10 years and mines the KCD deposit. It is owner-operated and produces approximately 3.4 million tonnes of ore per year. The orebody is accessed through twin declines and a vertical shaft system. Ore is mined using long hole open stoping in 35 meter high stopes with cemented paste fill. Where orebody geometry is favorable, these can be taken in multiple lifts, and where it is not, transverse stopes or smaller stope shapes are mined. Stoping is sequenced to maintain geotechnical stability and to optimize production rates, with paste backfill allowing for maximum extraction of ore while ensuring stability and controlling dilution. Mining is supported by mechanized equipment fleets for both development and production. Deeper ore is handled into eight ore passes, from which it is loaded by autonomous loaders into two crusher bins from where it is hoisted out. Shallower ore is trucked out.
- 86 -
Most of the ore comes from five main mineralized zones, with a further five contributing smaller amounts. Some zones require the stope geometry to be adapted into smaller stopes.
A significant portion of the capital and access development for the mine is in place. To date 52,700 meters of capital and access development has been completed. The current life of mine plan contains a further 35,300 meters of capital lateral development based on mineral reserves.
There have been no significant geotechnical failures in the active underground mining area and the rock mass model has been classified as good ground. In addition, the life of mine deformation and stability assessment forecast shows minor to moderate localized damage, reflecting mostly good mining conditions in general.
Based on current reserves, Kibali’s underground operations are expected to continue until 2043, with open pit operations ending in 2041. The addition of future open pit mineral reserves from additional exploration sites, particularly from the ARK deposits, has the potential to extend open pit mining beyond 2041. The addition of future underground mineral reserves from resource conversion, such as at the 5,000 down plunge extension, have the potential to extend underground mining beyond 2043.
Kibali produced a total of 673,520 ounces of gold in 2025, of which Barrick’s share was 303,084 ounces of gold.
Processing
The Kibali gold processing plant comprises two largely independent processing circuits, each designed to accommodate distinct ore types based on mineralogical and metallurgical characteristics. The Oxide and Free-Milling Circuit is designed to process oxide, transition, and free-milling ore. It includes standard crushing, ball milling, gravity recovery via Knelson concentrators, and a CIL circuit. The Sulphide Refractory Circuit is purpose-built for the treatment of sulphide refractory ore. The flowsheet consists of primary crushing, milling, flash and conventional flotation, ultrafine grinding, and cyanidation via a Pumpcell CIP circuit. A cyanide recovery plant has been added to the circuit to deal with the quantity of cyanide going out of the plant.
The processing plant rated throughput is designed for 3.6 million tonnes per annum for the oxide circuit and 3.6 million tonnes per annum for the parallel Sulphide Refractory Circuit. When the plant eventually processes sulphide only, the design capacity is 7.2 million tonnes per annum. Current throughput is exceeding design, with 8.32 million tonnes treated in 2025. Overall, the actual process plant gold recovery in 2025 met design standards at an average rate of 90.31%.
Infrastructure, Permitting and Compliance
Raw water collected from rainfall, spring water, pit dewatering, and the Kibali River is stored in the raw water dam, which has a capacity of 9,500 cubic meters. The processing plant requires approximately 35,000 cubic meters of water per day. Of this demand, approximately 75% is fulfilled with recycled water from Kibali’s two TSFs, while the remaining 25% comes from the raw water dam. Recent improvements to the freshwater reticulation system have reduced reliance on the Kibali River, lowering abstraction from 15% to around 11% of total demand.
There is no power grid in the region and Kibali operates on a hybrid power supply system designed to provide reliable and sustainable energy in a remote location. Most power is provided by three off-site hydropower stations, with a total peak hydropower capacity of 42.8 megawatts. A separate, pre-existing hydropower facility, is of low capacity (i.e., less than one megawatt).
To ensure continuity of power supply during periods of peak demand and seasonal hydropower shortages, a bank of high-speed diesel generators is used with a total capacity of 32 megawatts. A battery
- 87 -
energy storage system (“BESS”) with a capacity of seven megawatts was integrated into the system in 2020 to smooth the impact of the winder load on the power grid. This has allowed the reduction of the spinning reserve from nine diesel generators to four.
In 2025, the commissioning of a 16 megawatt solar plant, integrated with a new 15 megawatt BESS, marked a significant milestone in Kibali’s energy transition strategy. With the integration of the solar plant and BESS, renewable energy now accounts for approximately 85% of the site’s total energy consumption. Notably, Kibali is now capable of operating on 100% renewable energy for up to six months each year.
All material permits and rights to conduct existing operations at the Kibali operations have been obtained and are in good standing.
Environment
Kibali is working towards certification to the ICM Code and has an environmental management plan in place which conforms to ISO 14001:2015. The site is also audited against the requirements of the ICM Code and has been fully compliant with GISTM standards since 2023.
There are two types of TSF in operation: the Cyanide TSF (“CTSF”) for storage of cyanide tailings; and the Flotation TSF (“FTSF”) for the tailings from the Sulphide Refractory Circuit. The CTSF contains some cyanide and the FTSF does not. Approximately 25% of the tailings generated by the Sulphide Refractory Circuit is used for underground backfill. Waste rock is stored adjacent to the open pits and underground shaft and has been characterized as non-acid-generating. The waste rock is reused on site where appropriate, including platforms for infrastructure, TSF construction and buttressing, or stope backfill.
Commissioning of a cyanide recovery plant (“CRP”) for the cyanide tailings stream commenced in 2023. The CRP has been fully operational since October 2024. Following optimization of the CRP, the Kibali processing plant completed an ICM Code certification audit in 2025. Pending approval, Kibali will achieve ICM Code certification.
In 2025, all of Kibali’s activities were, and continue to be, in compliance in all material respects with applicable corporate standards and environmental regulations.
As at December 31, 2025, the recorded amount of estimated future reclamation and closure costs that were recorded under IFRS, as defined by IAS 37, and that have been updated each reporting period, was $25.8 million (Barrick’s 45% attributable share was $11.6 million) (as described in Note 2r to the Consolidated Financial Statements).
Exploration and Drilling
The strategic focus of exploration at Kibali is to prioritize near surface opportunities close to the plant, particularly with down-plunge extension drilling at depth, thereby increasing years of production (with complementary underground and open pit sources) and maintaining a gold production profile target of 700 thousand ounces beyond 2030.
During 2025, new indicated mineral resources were added at KCD, Gorumbwa and most importantly at the ARK deposits. The majority of drilling for resource and reserves was focused on the ARK system to better define the extents of mineralization. Exploration drilling also advanced the understanding of potential satellite and system extensions at KZ North and KZ South, while sterilization drilling was conducted around Megi-Marakeke-Sayi, Mandungu-Memekazi-Renzi and the ARK area. A total of 135,701 meters of diamond drill core in 834 holes and 158,013 meters of RC in 2,733 holes were drilled from surface exploration and grade control drilling programs in 2025.
- 88 -
Exploration in 2026 will be focused on understanding the extents of the ARK system from an open pit perspective, further exploration to test the potential for underground possibilities at ARK, testing open-ended mineralization at KCD, drill tests at Ngyoba and Sessenge Lower to test mineral continuity, drill tests in the KZ North area to test for system continuity down-plunge and greenfield exploration throughout the Kibali tenement. Greenfield exploration will focus on the KZ North and KZ South trends to delineate new targets, the Ikamva northwest trend, the Dembu area and finally the KCD southeast area, an emerging mineralized corridor that has lacked robust testing. These areas will have field mapping and trenching with potential framework and scout drilling to delineate targets.
In all, a total of approximately 160,890 meters of diamond drilling and 218,300 meters of exploration and grade control RC drilling is planned at Kibali in 2026.
Royalties and Taxes
The DRC Mining Code (2002) and associated regulations have been amended with an updated Mining Code which came into force on March 9, 2018 (the “DRC Mining Code (2018)”) and the related amended mining regulations which came into force on June 8, 2018.
Further, in December 2024 a new Finance Law (the “2025 Finance Law”) was promulgated. The 2025 Finance Law brings a series of changes to the tax and customs regime set out under the current DRC mining legislative framework.
The key changes introduced by the 2025 Finance Law are: (i) gold export charges were increased by an additional 2%, but Kibali has been exempted from this increase, resulting in the total applicable royalties and other export charges remaining at 5.7% and (ii) various increases in, and removal of exemption from, import and other duties with these changes not anticipated to materially alter the life of mine profitability. A super profit tax was also introduced in the DRC Mining Code (2018) and applies if the average annual gold price is 25% above $1,600 per ounce, being the price stated in the feasibility study submitted at the time of approval for the construction of the Kibali project.
Full payment has been made on all taxes due to the Government to date.
Mining and Processing Information
The following table summarizes certain mining and processing information for Kibali for the period indicated (Barrick’s 45% share):
| Year ended December 31, 2025 |
Year ended December 31, 2024 |
|||||||
| Tonnes mined (000s) | 23,596 | 19,398 | ||||||
| Tonnes of ore processed (000s) | 3,745 | 3,827 | ||||||
| Average grade processed (grams per tonne) | 2.79 | 2.82 | ||||||
| Ounces of gold produced (000s) | 303 | 309 | ||||||
The most recent technical report on the Kibali gold mine is the technical report entitled “Technical Report on the Kibali Gold Mine, Democratic Republic of the Congo”, with an effective date of December 31, 2025 and an issue date of February 27, 2026, authored by Richard Peattie, Christopher Hobbs, Mathias Vandelle, Derek Holm, Graham E. Trusler and Marius Swanepoel. This technical report has been filed on SEDAR+ in accordance with National Instrument 43-101.
The Company has extensive operating experience in the DRC. Nevertheless, operating in emerging markets, such as the DRC, exposes the Company to risks and uncertainties that do not exist or are
- 89 -
significantly less likely to occur in other jurisdictions such as the United States or Canada. For additional details, see “Foreign investments and operations”, “Permitting and government relations”, “Inflation”, “Joint ventures”, “Security and human rights”, “Artisanal and illegal mining”, “Community relations and license to operate”, “Government regulation and changes in legislation” and “U.S. Foreign Corrupt Practices Act and similar worldwide anti-bribery laws” in “Risk Factors”.
While all risks cannot be mitigated or eliminated, the Company expects to manage and mitigate controllable risks at its DRC operation through the consistent application of a variety of corporate governance structures and processes that are materially the same as those applied at its other operations located in developed markets. For additional details, see “Narrative Description of the Business – Operations in Emerging Markets: Corporate Governance and Internal Controls”.
The diagram on the following page sets out the design and layout of the Kibali gold mine.
- 90 -
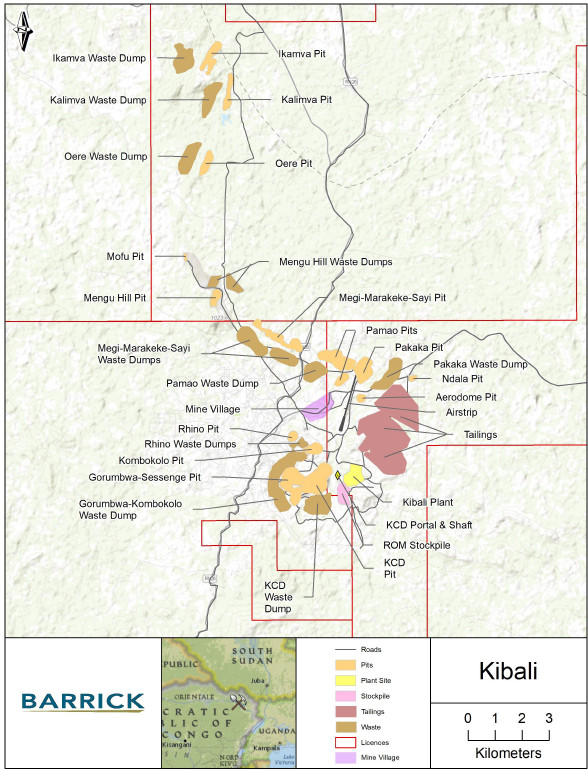
- 91 -
Reko Diq Project
General Information
In light of the recent escalation of security risks and increase in the number of security incidents in the Province of Balochistan, on February 5, 2026, Barrick announced that it is undertaking a review of all aspects of the Reko Diq Project, including with respect to the project’s security arrangements, development timetable and capital budget. This review is now underway.
Project Description
The Reko Diq Project (“Reko Diq”) is situated in the north-west corner of the Balochistan Province of Pakistan, which borders Iran to the west, Afghanistan to the north, the Punjab and Sindh Provinces of Pakistan to the east, and the Arabian Sea to the south. The region is sparsely populated with the nearest settlement being Humai, located approximately 19 kilometers away. Nok Kundi, located approximately 75 kilometers away, is the closest major regional center. From Nok Kundi, Reko Diq is accessed by a regional gravel road which, while adequate for exploration and drilling requirements, will be upgraded to support construction and operational needs. Reko Diq is accessed from other major regional centers via the national highway N40 (approximately 40 kilometers away), which runs from Quetta, the capital city of Balochistan, to Pakistan’s border with Iran.
In 2024, Barrick completed an update of Reko Diq’s 2010 feasibility and 2011 feasibility studies. Once complete, Reko Diq will comprise two open pit mines and a processing plant, together with other associated mine operation and regional infrastructure. Mining is planned to occur in two phases (Phase 1 and Phase 2). Reko Diq will produce copper concentrate which includes gold for smelting by third-party operated smelters. Concentrate will be delivered by the existing road and rail network route (for which upgrades to meet project requirements will be required) from the mine to Port Qasim for export to international markets.
The mineral titles held by Reko Diq Mining Company (Private) Limited (“RDMC”), a Pakistani corporation, were issued pursuant to an amendment to the Regulation of Mines and Oilfields and Mineral Development (Government Control) Act, 1948, which permits the granting of mineral title through private negotiations. The various mineral titles held by RDMC were customized for Reko Diq as part of the Reconstitution (defined in “History” below) and are not generally subject to the Balochistan Mines and Minerals Act, 2025 or, the Balochistan Mineral Rules, 2002. The key mineral titles granted to RDMC are two mining leases, an exploration license and a surface rights lease. Among other things, the mining leases are subject to annual rental fees and a one-time security deposit. RDMC’s mining leases are valid until 2052 (with automatic renewals for incremental periods of up to 30 years), and its exploration license is valid until the third anniversary of commercial production (subject to renewal for two additional three-year terms). RDMC’s surface rights lease has an initial term until 2052 (subject to renewal).
The surface rights secured for Reko Diq cover approximately 1,053 square kilometers and are sufficient to allow for the development and operation of both phases of the project, including mining-related infrastructure such as the open pits, process plant, workshops, offices, tailings storage facility, and waste rock storage facilities.
As at December 31, 2025, Reko Diq has approximately 700 employees and 3,500 contractors. During construction, approximately 11,500 jobs are anticipated to be created with more than 3,500 required during the operational phases.
History
Several companies have held interests in Reko Diq since 1996, with approximately 380 kilometers of drilling being undertaken within the exploration license by December 31, 2025. Exploration commenced in
-92-
1996 with several campaigns of drilling being completed, culminating with the latest drilling to support the mineral resource being completed in 2009. The project was put on hold in 2010 after disputes arose with the Government of Balochistan (the “GoB”) and the Government of Pakistan (the “GoP”).
In November 2011, Tethyan Copper Company Pty. Limited (“TCC”, which is now known as RDMC) filed for arbitration against the GoP and the GoB in respect of contractual and treaty investment claims relating to Reko Diq. By July 2019, arbitration tribunals ruled in favor of TCC and, among other things, rendered a multi-billion-dollar damages award against the GoP (the “Award”). Barrick, Antofagasta, the GoB, and the GoP subsequently engaged in discussions regarding alternatives for the resolution of the Award that satisfied the objectives of each party and all related stakeholders. Ultimately, these negotiations resulted in the reconstitution of the project.
Reko Diq was formally reconstituted on December 15, 2022 (the “Reconstitution”). The completion of the Reconstitution involved, among other things, the resolution of the Award and execution of all of the definitive agreements, including the Joint Venture Agreement and Mineral Agreement which respectively form the basis for the governance of the project and the applicable royalty and tax regime, including fiscal stabilization, as well as the grant the mining leases, an exploration license, and surface rights lease as discussed in “Project Description” above. The Reconstitution was approved by the GoB, the GoP and the Supreme Court, which issued a favorable opinion in respect of the legality of the agreements concluded as part of the Reconstitution under Pakistan law. Pursuant to the agreements entered into as part of the reconstitution, if Barrick decides not to proceed with the development of Phase 1 by April 4, 2026 (being 12 months following the date on which the updated feasibility study was formally approved by the joint venture board governing Reko Diq), subject to force majeure, the GoP will have the option to purchase Barrick’s interest in Reko Diq for a purchase price of $900 million plus Barrick’s share of capital expenditures since the reconstitution.
The reconstituted project is owned by RDMC, which is indirectly held 50% by Barrick and 50% by Pakistani stakeholders, comprising a 10% free-carried, non-contributing share held by the GoB, an additional 15% held by a special purpose company owned by the GoB and 25% owned by other federal Pakistani state-owned enterprises. Barrick is the operator of Reko Diq.
Geology
Geological Setting
The Reko Diq deposits lie on the Tethyan copper-gold metallogenic belt regionally extending from central Europe to Pakistan and locally within the Chagai Belt. The deposits are hosted within Oligocene and Miocene aged units. The Dalbandin formation is a volcanogenic sedimentary unit of sand and siltstone Dalbandin which is overlain by the Reko Diq formation which is characterized by sub-aerial volcanic units of andesite and breccias. The deposits are centered around Miocene aged porphyry intrusion that lie between the Tozgi and Drana Koh fault systems that are parallel to the Makran subduction zone.
Mineralization
Reko Diq hosts one of the world’s largest undeveloped open pit copper-gold porphyry deposits. Copper, gold and molybdenum mineralization is interpreted to be associated with a regional scale porphyry system primarily contained within a series of diorite to quartz-diorite bodies that have intruded the Dalbandin and Reko Diq Formations. These intrusions are fine to medium-grained displaying porphyritic textures with alteration halos radiating outwards. Mineralization is primarily within the intrusives; however, it also occurs in the adjacent altered wall rock. The intrusions occur as stocks, dykes, sills, and dyke swarms, with bodies typically ranging in size, but have diameters less than three kilometers.
- 93 -
The Western Porphyries display a minor (less than 50 meter) leach cap with primary mineralization occurring at surface. The limited leach cap formed when the system was uplifted quickly during deformation resulting in the minor development of a supergene system. Mineralization at the Western Porphyries is primary hypogene with chalcopyrite dominant near surface with bornite abundance increasing at depth. Extensive pyrite has been identified (generally less than 4%) with minimal oxide mineralization identified.
The porphyry units that host the main mineralization are broken into several units identified by texture, changes in mineral content, and distribution. In the Western Porphyries, the host rocks are diorite porphyries with dominantly feldspar and biotite assemblages. These have been named PFB1 to PFB3 (Feldspar-Biotite Porphyry). PFB1 is the oldest and most fertile, while PFB3 is the least fertile based on current drilling. PFB1 and PFB2 are volumetrically similar and consist of the main mineralization in the core of the system around H14 and H15. Two older and less mineralized feldspar-hornfels and feldspar-quartz (PFH and PFQ) porphyries occur at the north end of H15 and in H79.
Tanjeel is a supergene system with mineralization occurring as a moderately well developed, sub-horizontal, copper enrichment blanket. The system is relatively small compared to Western Porphyries (representing approximately 6% of the total recovered copper for the life of Reko Diq) and contains an upper pyrite-chalcocite system with a pyrite-chalcopyrite hypogene underlying system. Copper oxide is common and occurs as malachite, copper wad, and chalcanthite where exposed chalcocite has oxidized. The pyrite content can reach 12% accounting for the required generation of sulphur to mobilize copper in the supergene system.
The porphyry units at Tanjeel are older than the Western Porphyries and are feldspar-quartz or quartz-feldspar diorites (PFQ and PQF). These intrusions are sub-horizontal compared to the sub-vertical PFB units in Western Porphyries. A key differentiation is the supergene enrichment zone at Tanjeel, with some hypogene mineralization at depth. The main intrusive feeder for the system appears to be found at depth to the south-east of Tanjeel.
Mining Operations
Production and Mine Life
Reko Diq will comprise two open pit mines: the main open pit at Western Porphyries; and a satellite pit at Tanjeel. Mining will be carried out year-round, 24 hours per day using conventional drill, blast, load and haul methods.
Based on existing reserves, the total mine life is expected to be approximately 37 years from commissioning of the plant followed by three years of processing of stockpiles. Reko Diq is estimated to produce a total of 13.1 million tonnes of copper and 17.9 million ounces of gold (100% basis).
Processing
Ore will be processed at the Reko Diq processing plant. A phased approach to process plant development will be undertaken. Phase 1 will comprise design, construction and commissioning of the first stage process plant, with a nominal capacity of 45 million tonnes per annum, to treat the first five years of mined ore. Phase 2 will comprise duplication of the Phase 1 processing facilities, with the development of a parallel plant to achieve a total capacity of 90 million tonnes per annum. The two plants will operate largely independently but with common support facilities, services and concentrate and tails handling.
The process flowsheet is based on industry standard proven technology that will comprise feed preparation using two-stage crushing and high-pressure grinding rolls followed by a closed-circuit ball milling circuit. Product from the comminution circuit will feed a bulk sulphide rougher flotation circuit with
- 94 -
rougher concentrate reground and upgraded to final concentrate grade in a two-stage cleaner circuit. The final concentrate handling circuit will consist of concentrate thickening and filtration, with filter cake stored on-site before being transported to the port via rail. A processing testwork program was completed from 2023 to 2024, which built upon previous work conducted between 2007 and 2009.
The expected average recovery rate is 89.9% for copper and 69.9% for gold, based on the current life-of-mine plan and testwork completed as of December 31, 2025. Copper recovery in the first 10 years is forecasted at 90.1%. Changes in the feed material characteristics may impact the actual achieved recovery.
Infrastructure, Permitting and Compliance
Reko Diq is located approximately 915 meters above sea level, with a hyper-arid climate and in the Sistan Desert ecological region. The climatic conditions are typically hot and dry, with high sunshine exposure throughout the year, and average rainfall of less than 35 millimeters per annum, which occurs predominately in the early part of the year. As there are limited surface water resources, groundwater is planned as the primary water supply for Reko Diq. Water will be supplied from boreholes located north of the mine and will be supplied via a pipeline of approximately 70 kilometers. Water demand has been calculated and based on expected water usage for both construction and operations. Water distribution will be via dedicated service lines at the required pressures and flows, to all required facilities and buildings on site.
Power will be supplied by an on-site hybrid microgrid power solution comprised of low sulphur fuel oil power generating sets, diesel generating sets, a 150 megawatt solar photovoltaic array, and a 50 megawatt/100 megawatt hour battery energy storage system (including an on-site transmission line). The base case assumes the power supply will be sourced from the national grid from year 15 of mining, with the low sulphur fuel oil generating sets remaining on standby. RDMC has advanced this strategy with Pakistan’s National Transmission and Dispatch Company to ensure it aligns with the strategic direction for the country’s power connectivity. Additional studies are also being undertaken to assess the feasibility of other power sources to increase the percentage of power delivered from the national grid or by renewable energy sources and reduce the dependence on low sulphur fuel oil.
Site infrastructure will include a water treatment plant for potable water, security facilities, airstrip, roads, accommodation village, maintenance facilities, stockpiles, and other auxiliary buildings. The site common purpose infrastructure will be initially developed to support Phase 1 with allowance for expansion where appropriate to support Phase 2.
Reko Diq is also planned to have a TSF to store rougher and cleaner tailings. The TSF has been designed using conventional deposition method and will accommodate approximately 2,816 million tonnes of rougher tailings (split between two facilities) and 320 million tonnes of cleaner tailings (split between three facilities). GISTM (along with other international and Barrick principles, standards and guidelines) was utilized to direct the assessment of tailings placement, technology, and overall management of Reko Diq’s tailings handling and storage facilities.
Based on the current mine plan, no resettlement is anticipated for the development of Reko Diq.
The Mineral Agreement sets out a list of permits and approvals from various governmental authorities that are expected to be required in connection with the construction, development and operation of Reko Diq. The processes to obtain and renew the required permits are well understood by RDMC and similar permits have been granted in the past. RDMC expects to obtain the required permits and approvals in the normal course.
- 95 -
Security
The foundations of the Reko Diq security strategy were agreed between Barrick, the GoB and the GoP as part of the Reconstitution.
The strategy takes a three-tiered approach: a private security force (at and within the mine site); the Balochistan provincial security force, the Balochistan Levies; and Pakistan’s regional security force, the Frontier Corps. Among other things, the project’s security strategy includes the development and implementation of strict security protocols for all employees, contractors and visitors, as well as the formation of a security committee to ensure effective operational communication between the security service providers. The security strategy and implementation arrangements for Reko Diq are based on international best practice and include, among other things, commitments for all security personnel to be trained on Barrick’s Human Rights Policy and to uphold international human rights standards, such as the VPSHR. See “Respecting Human Rights” under “Sustainability”.
An early works program for security has been implemented. This program includes establishing a perimeter boundary fence, gatehouse and surveillance systems. The gatehouse will employ full personnel and vehicle screening throughout the operation. The plant and accommodation village and other infrastructure areas will have fencing surrounding major areas with details to be developed during the execution phase.
As noted above, Barrick announced that it is undertaking a review of all aspects of the Reko Diq project, including with respect to the project’s security arrangements. This review is now underway.
For additional details regarding risks and uncertainties associated with the security situation in Pakistan, refer to “Foreign investments and operations” and “Security and human rights” in “Risk Factors”.
Environment
Climatic conditions do not materially impact exploration, development or mining operations.
As part of the ESIA submitted in late 2024, an Environmental and Social Management and Monitoring Plan for Reko Diq was developed. RDMC received environmental approvals from the Balochistan Environmental Protection Authority for development of the Reko Diq mine in March 2025. RDMC received environmental approval from the Sindh Environmental Protection Authority for development of concentrate handling infrastructure at Pakistan International Bulk Terminal at Port Qasim in February 2025. An Environmental and Social Monitoring System is being implemented to ensure compliance with applicable national, provincial, and international legislation, standards, guidelines and practices.
In 2025, all activities at Reko Diq were, and continue to be, in compliance in all material respects with applicable corporate standards and environmental regulations.
As at December 31, 2025, the recorded amount of estimated future reclamation and closure costs for Reko Diq that were recorded under IFRS, as defined by IAS 37 was $1 million as described in Note 2r to the Consolidated Financial Statements. Future reclamation and closure costs at Reko Diq will increase over time as the project is developed and operated. RDMC is required to establish and contribute to a closure fund account in the final ten years of Reko Diq’s mine life.
Exploration and Drilling
Exploration at Reko Diq has focused on the Western Porphyries and Tanjeel areas, with works recommencing by RDMC in 2023 to support ongoing design and construction studies. As noted above, RDMC holds an exploration license which encompasses the Western Porphyries and Tanjeel.
- 96 -
Since the Reconstitution in 2022, RDMC has been actively adding to the existing exploration knowledge in an effort to expand the mineral resource base of Reko Diq. RDMC has identified several key targets that demonstrate the potential to add further copper and gold resources to the project from nearby porphyry surface expressions within the broader district.
As part of the ongoing studies, drilling was recommenced in August 2023. A total of 18,968 meters of geotechnical and 2,973 meters of metallurgical holes, both using diamond drilling, were completed in 2023 and 2024 (combined). In 2024, a site-based exploration team worked on re-logging historic drill holes, re-interpreting legacy datasets and modeling historic and newly generated targets. The team has also completed a large mapping and rock chip survey containing more than three thousand samples and covering an area of 300 square kilometers.
During 2025, a high-priority target was identified within the Reko Diq Mining Lease area. This target, referred to as ‘Bukit Pasir’, was tested through an initial drilling program totaling 10,606 meters of drilling across eleven drill holes. Early drilling returned positive, economically significant intercepts, with the discovery formally confirmed in March 2025. Results confirm Bukit Pasir as a material contributor to the long-term growth potential of the Reko Diq Project.
Geological and structural mapping at multiple scales continued throughout 2025, alongside, with infill geochemical and geophysical surveys being conducted in parallel. In 2025, a further 20,957 meters of exploration drilling was completed, as well as 40,127 meters of resource definition drilling, 1,108 meters of resource growth drilling, and 55,215 meters of grade control/sulphide sampling completed in the Western Porphyries.
Royalties and Taxes
The Reconstitution included an agreed fiscal regime and 30-year stabilization period for the project (i.e., until December 15, 2052).
The key fiscal terms for Reko Diq include a 5% net smelter return royalty payable to the GoB, a 1% net smelter return final tax regime payable to the GoP (subject to a 15-year exemption following commercial production), and a 0.5% net smelter return royalty export processing zone surcharge.
To ensure that Balochistan is receiving benefits during the development and construction phases, advance royalty payments to the GoB were made in year 1 ($5 million), year 2 ($7.5 million) and year 3 ($10 million) and will continue until commercial production ($10 million per year), for a maximum total amount of advance payments of $50 million. In 2026, Barrick is expected to pay the $10 million advance royalty to the GoB in two equal payments in June and December. The lesser of 25% or $12.5 million of the total amount advanced will be credited against the GoB royalty payments owed during each of the first four years of commercial production.
The agreed tax regime includes set rates for the life of Reko Diq, with several taxes subject to holidays that provide relief until commercial production is reached.
Economic Analysis
A financial analysis was carried out using a discounted cash flow approach to support the declaration of mineral reserves in the most recent technical report on Reko Diq. The model projected yearly cash inflows, or revenues, and subtracted yearly cash outflows, such as operating costs, capital costs, and taxes.
The resulting net annual cash flows are discounted back to the date of valuation and totaled to determine the net present value of Reko Diq.
- 97 -
The economic modelling in the most recent technical report showed that Reko Diq was economically viable, having a positive after-tax net present value. Using the three-year trailing average copper price of $4.03 per pound, the economic analysis indicated a total free cash flow of $70.2 billion, a net present value of $13 billion at a discount rate of 8%, and an after-tax internal rate of return of 21%. The payback period is the time calculated from the start of production until all project capital expenditures have been recovered. The payback period was estimated to be approximately six years. Using Barrick’s copper price assumption of $3.00 per pound to estimate reserves as of December 31, 2024, the economic analysis indicated a total free cash flow of $34 billion, a net present value of $4 billion at a discount rate of 8%, an internal rate of return of 13%, and an estimated payback period of approximately eight and a half years.
Capital expenditures commenced in the second quarter of 2024, with total capitalized spend to date of $849 million (including $213 million in the fourth quarter of 2025) (100% basis). Capitalized spend in 2025 was $721 million (100% basis). The previously disclosed total estimated capital cost of Phase 1 was between $5.6 and 6 billion (100% basis, exclusive of capitalization of financing costs) and of Phase 2 was between $3.3 and 3.6 billion (100% basis, exclusive of capitalization of financing costs). The economic analysis is subject to change following the ongoing security review which includes all aspects of the project including the development timeline and capital budget.
Mining and Processing Information
As Reko Diq is a development project, there is no mining and processing information available for the years ended December 31, 2025, and December 31, 2024. Such information will be reported by the Company once mining commences.
The most recent technical report on Reko Diq is the technical report entitled “NI 43-101 Technical Report on the Reko Diq Project, Balochistan, Pakistan”, with an effective date of December 31, 2024, and an issue date of February 19, 2025, prepared by Simon Bottoms, Peter Jones, Mike Saarelainen, Daniel Nel, David Morgan and Ashley Price. This technical report has been filed on SEDAR+ in accordance with National Instrument 43-101.
The Company has extensive operating experience in emerging markets. Nevertheless, operating in emerging markets, such as Pakistan, exposes the Company to risks and uncertainties that do not exist or are significantly less likely to occur in other jurisdictions such as the United States or Canada. For additional details, see “Foreign investments and operations”, “Permitting and government relations”, “Inflation”, “Joint ventures”, “Security and human rights”, “Community relations and license to operate”, “Government regulation and changes in legislation” and “U.S. Foreign Corrupt Practices Act and similar worldwide anti-bribery laws” in “Risk Factors”.
While all risks cannot be mitigated or eliminated, the Company expects to manage and mitigate controllable risks at its Pakistan operation through the consistent application of a variety of corporate governance structures and processes that are materially the same as those applied at its other operations located in developed markets. For additional details, see “Narrative Description of the Business – Operations in Emerging Markets: Corporate Governance and Internal Controls”.
The diagram on the following page sets out the proposed design and layout of Reko Diq.
- 98 -
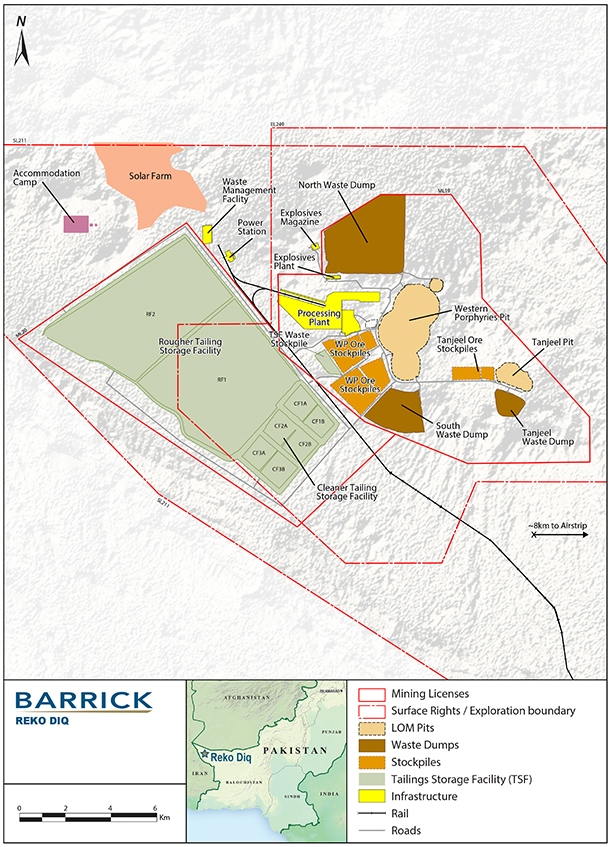
- 99 -
Lumwana
General Information
Project Description
The Lumwana Mine (“Lumwana”) is an operating open-pit copper mine with two open pits, Chimiwungo and Malundwe, a conventional sulphide flotation processing plant, and associated site infrastructure. Lumwana is located in the North-Western Province of Zambia, approximately 90 kilometers west of the provincial capital of Solwezi and 600 kilometers northwest of Lusaka. As of December 31, 2025, Lumwana employs approximately 3,260 employees and 6,400 contractors.
The property is accessed via a 10 kilometer road branching off the paved two-lane “T5” highway linking Lumwana and Solwezi to the copper belt and other parts of the North-Western Province. The construction of a new two kilometer airstrip at the mine commenced in 2025 and is scheduled for completion in 2026, which will facilitate flights directly to Lumwana from Lusaka.
In Zambia, mining rights and surface rights are distinct concepts administered under separate legal frameworks. Lumwana is covered by six large-scale mining licenses with a total area of 1,192 square kilometers, granted under the Mineral Regulation Commission Act No 14 of 2024 (formerly the Mines Act of Zambia Act No.11 of 2015) to Lumwana Mining Company Limited (“LMC”), which provide for the mining of copper, cobalt, gold, silver, uranium, and sulphur (the “Mining Licenses”). In 2005, LMC was granted the right to exercise its mining rights within the Mining Licenses. The Mining Licenses also permit exploration and mineral processing without the requirement to apply for separate exploration or mineral processing licenses. All of Lumwana’s Mining Licenses are valid until 2029, and are currently in good standing. There are no significant risks that could result in the loss of ownership of the deposits or loss of the Mining Licenses, in part or in whole, or that the Mining Licenses will not be renewed in the future.
In 2009, LMC secured the surface rights to an additional area of land measuring 35,000 hectares for a period of 99 years (or until 2108) (the “Lumwana Surface Rights”). LMC owns the Lumwana Surface Rights in the form of a 99-year lease covering the current operations and a majority of the planned infrastructure of the Lumwana Super Pit Expansion Project (the “Super Pit Expansion Project”), including the proposed TSF and expanded processing plant, as well as the Chimiwungo, Malundwe and Kababisa open pits.
In 2024, Barrick completed a feasibility study for the Super Pit Expansion Project, which entails an expansion of the current mining operations at Chimiwungo and Malundwe, the opening of two new open pits at Kamisengo and Kababisa, the expansion of the current processing plant, tailings and water supply infrastructure, and an upgrade of existing site infrastructure.
The Lumwana Surface Rights area includes 28,500 hectares of the National Forest (as defined below) that was previously degazetted by the President of Zambia in 2009. For the Super Pit Expansion Project, the Kamisengo Inflow Control Dam and the Kamisengo open pit are situated in an area which is within the Acres National Forest 105 (the “National Forest”). LMC will enter into a lease agreement with the Zambian government which will grant LMC access to operate in approximately 5,800 additional hectares of the National Forest. The lease agreement will grant exclusive rights to LMC to take possession, occupy and establish and conduct mining activities within the designated area of the National Forest. The term of the lease agreement will be 30 years from the effective date of the lease, which will be aligned with Lumwana’s life of mine (see “Production and Mine Life”).
- 100 -
History
Copper mineralization was initially discovered in the 1930s with exploration and mining studies completed between the 1950s and 1990s by previous owners, including Roan Selection Trust Limited, Azienda General Italiana Petroli, and Phelps Dodge Corporation. Lumwana was brought into production in 2008 by Equinox Copper Ventures, which was acquired by Barrick in 2011.
The first commercial copper production was achieved in 2009 and total production to 2025 is 1,995 thousand tonnes of copper.
Significant drilling, including 466,747 meters of DD and 719,644 meters of RC drilling has been completed between 2022 and 2025 to further define the extent, continuity, and structural controls on mineralization at each of the four main deposits, as further described in “Exploration and Drilling” below.
Lumwana is owned by LMC, a Zambian registered exploration and mining company and wholly owned subsidiary of Barrick.
Geology
Geological Setting
The copper deposits at Lumwana are large, tabular bodies of disseminated mineralization, which are often referred to as basement hosted copper deposits. They are hosted within the Mwombezhi Dome, which is part of the Domes Region of the Lufilian Arc. The Domes Region is part of the Central African Copperbelt, which is a metallogenic province in the border region of Zambia and the Democratic Republic of Congo. The deposits are characterized by pyrite, chalcopyrite, and occasional bornite, which is typically associated with higher copper grades. The mineralization is hosted within either biotite or muscovite dominant schists.
Copper mineralization at Lumwana is hosted in the basement Lufubu Schist and is located in the Domes Region of the Lufilian Arc. Within the Domes Region, the Kabompo and Mwombezhi Domes are the most significant with respect to mineralization. The mineralization at Lumwana is associated with the Mwombezhi Dome.
Mineralization
There are four main copper deposits (with subordinate uranium) at Lumwana. The principal deposit is Chimiwungo, with additional deposits Malundwe (6 kilometers northwest of Chimiwungo), Kamisengo (14 kilometers north-northeast of Chimiwungo), and Kababisa (10 kilometers north-northwest of Chimiwungo). The deposits generally comprise a hanging wall gneiss, a mineralized schist containing barren gneiss, and a footwall gneiss, with Kamisengo being more geometrically complex than the other three deposits. All have relatively shallow dips between 5 degrees and 25 degrees and extend from surface to maximum depths of between 250 meters and 950 meters.
Mining Operations
Production and Mine Life
Lumwana is an open pit, conventional truck-and-shovel mining operation. Current operations involve open pit mining of two deposits, Chimiwungo, (which comprises three individual open pits: Chimiwungo West, Chimiwungo East, and Chimiwungo South), and Malundwe. As part of the Super Pit Expansion Project, both Chimiwungo and Malundwe will be expanded, resulting in the three open pits at Chimiwungo being merged into a single, large ‘Super Pit’. Additionally, two new satellite open pits, Kababisa and Kamisengo, will be developed in 2035 and 2036, respectively. There will be no major changes to the
- 101 -
mining methodology for the Super Pit Expansion Project, although new pit crushers are planned for both Chimiwungo (in 2027 and 2031) and Kamisengo (in 2036) to allow increased volumes to be crushed, while reducing ore haulage distances and associated costs. The current mining rate of Lumwana is 150 million tonnes per annum. With the Super Pit Expansion Project, mining production is expected to ramp-up to 350 million tonnes per annum. Annual copper output is expected to range between 200 kilotonnes to 300 kilotonnes for most of Lumwana’s life, with a life-of-mine average of 240 kilotonnes per annum.
Based on existing reserves, the total mine life is expected to be extended from the current 16 years to approximately 33 years as a result of the Super Pit Expansion Project ending in 2057, with the final two years allocated only to stockpile processing. Overall, 1.56 billion tonnes of ore is planned to be mined over the life-of-mine.
Lumwana produced 150,871 tonnes of copper in 2025.
Processing
The Lumwana processing plant has been operational since 2009, and consists of two primary crushing facilities, one at Malundwe and one at Chimiwungo, each delivering crushed ore via overland conveyors to a single crushed ore stockpile. Primary crushed ore is drawn from the stockpile and fed to a SAG-ball grinding circuit.
To meet the increased production needs resulting from the Super Pit Expansion Project, processing rates at the plant will be increased from the current 27 million tonnes per annum to 52 million tonnes per annum, with peak design capacity of 54 million tonnes per annum, through the construction of a parallel processing plant. The new plant will use a similar flow sheet to the current plant and will involve the installation of two new primary crushing and overland conveying systems in 2027, with a further in-pit crusher to be installed in 2035.
For the Super Pit Expansion Project feasibility study, metallurgical test work was completed on samples that reflect the ore supply proportions. The test work determined plant parameters required to produce a saleable copper concentrate from the new Kamisengo and Kababisa open pits, as well as the extensions to the existing Chimiwungo and Malundwe open pits. No material difference is expected in recovery and concentrate grades between currently processed mineralization and expected mineralization to be processed from the Super Pit Expansion Project.
The expected average fresh recovery is 92.7% copper, based on the current life-of-mine plan and test work completed to date. Changes in the feed material characteristics may impact the actual achieved recovery. Operating data between 2021 and 2025 indicates that the plant has been able to consistently achieve reasonable recoveries, with an average of 91.15%, across both fresh ore and transitional material, and produced saleable copper concentrates over the past four years of operation. This is in line with expectations based on the plant operation since commissioning in 2009.
Elements with deleterious impact include insoluble material, carbonaceous material, pyrrhotite, and uranium. Almost all of these elements exist in small quantities and are not expected to generate smelter penalties over the life-of-mine. Uranium head grades are higher than life-of-mine average for the Malundwe ore; however, this ore will be blended with Chimiwungo ore, which has a lower uranium content, to ensure no-net smelter penalty over the-life-of-mine or negative impacts on outflow water quality.
Infrastructure, Permitting and Compliance
Lumwana has well-developed infrastructure to support current operations and detailed plans for additional infrastructure to support the Super Pit Expansion Project. The most significant changes to
- 102 -
infrastructure will be increases in power supply and power infrastructure, a significant increase in the capacity of the TSF, and significant changes to the water storage facility.
Power is supplied to the mine by Zambia’s state-owned power company, Zambia Electricity Supply Company (“ZESCO”) and further supplemented through wheeling agreements with private companies due to the ongoing power shortage, and distributed across the site from the main 33 kilovolt consumer substation located adjacent to the processing plant. The main 33 kilovolt consumer substation will be upgraded and expanded through the ongoing construction for the Super Pit Expansion Project. This primary power supply is supplemented by an on-site diesel-fired power station with a previous capacity of 23.5 megawatts, to mitigate any grid outages, which was increased to 34.5 megawatts as part of the Super Pit Expansion Project. As a result of the Super Pit Expansion Project, Lumwana’s power demand will increase from the current 60 megavolt-amperes to 177 megavolt-amperes. An agreement with ZESCO has been executed, which approved the increase in peak supply from 65 megavolt-amperes to 180 megavolt-amperes.
In the short-term, the strategy focuses on upgrading ZESCO’s network infrastructure by introducing static synchronous compensators (STATCOM) in the Northwestern power corridor, in close proximity to Lumwana, and constructing an additional 330 kilovolt overhead line from Kalumbila to Lumwana. These measures will increase the available power to Lumwana without increasing national power generation requirements. The additional available power will be sufficient for the Super Pit Expansion Project requirements.
In the medium and long-term, the focus shifts to securing generating capacity through a sustainable, long-term power supply solution. Lumwana is collaborating with various independent power producers, key Zambian grid utility partners, and financiers to identify opportunities of additional power supply options in the East African region. LMC has also completed wheeling agreements with alternative suppliers, in case of a supply shortage in the national grid.
Current Lumwana operations include an extensive system of water management infrastructure designed to manage open pit water, collect stormwater from operational areas, divert flows from undisturbed catchments around Lumwana, and accommodate the TSF. The Lumwana East River, which along with its main tributaries are the primary fresh watercourse in the mine area, has been diverted to facilitate mining of the Malundwe deposit and the construction of the TSF. This diversion consists of approximately 20 kilometers of channels and two main diversion dams. The diversion channels ultimately report back into the Lumwana East River downstream of the Malundwe pit.
Construction of the current TSF commenced in 2006. The facility is situated in a natural waterway within the former Lumwana East River valley, which runs from the northeast to the southwest. The original design capacity was 360 million tonnes, which was reached in mid-2025. A feasibility study was conducted in 2024 for the expansion of the TSF capacity to approximately 2 billion tonnes. The detailed design is expected to be completed in the first quarter of 2026. During 2024, the existing tailings storage facility stormwater diversion channel was realigned, widened, regraded, and a flood bund was constructed along the entire channel. The upgraded diversion channel allows for stormwater management in accordance with GISTM and the Barrick Tailings Management Standards. It also provides the TSF with an additional storage capacity of 40 million tonnes, bringing the total capacity of the existing stage to 400 million tonnes.
The existing water storage facility will be dewatered and filled with tailings as part of the tailings storage facility expansion from 2029. A new water storage facility (Kamisengo Inflow Control Dam) will be constructed in 2026 upstream of Kamisengo, which will divert outflow through a new diversion channel into the Malundwe Stream. The ultimate water storage capacity will be reduced from 65 million cubic meters (in the current water storage facility) to 40 million cubic meters in the new Kamisengo Inflow Control Dam, minimizing the affected footprint while maintaining the ability to supply water to the operations throughout the life-of-mine.
- 103 -
All material permits and rights to conduct existing operations at Lumwana have been obtained and are in good standing. Approximately 50 licenses are renewed annually as part of ongoing operations. The resettlement action plan for the Super Pit Expansion Project was approved in 2025, with execution underway and completion expected in mid-2026. The land tenure acquisition process, described above in “Project Description”, has also commenced and is expected to be concluded during the first quarter of 2026.
Environment
The property is characterized by gently rolling hills with elevations ranging from approximately 1,270 meters to approximately 1,410 meters above sea level within the general vicinity of operations. Vegetation consists of woodlands, and wetlands are common along watercourses. Lumwana is located in an area with a monsoon-influenced humid tropical climate characterized by relatively high temperatures.
The region has distinct dry (May to October) and wet (November to April) seasons. Operations take place at Lumwana year round, although dig rates are reduced during the wet season due to adverse impacts to ground conditions. The impacts of heavy rainfall are addressed through a stockpiling strategy that provides feedstock to the processing plant when open pit ore is not accessible. The impact that the wet season will have on construction timing for the Super Pit Expansion Project has been considered and factored into the execution schedule.
An updated ESIA process to identify and quantify the environmental and social impacts which could arise from the Super Pit Expansion Project was commissioned and subsequently approved by the Zambia Environmental Management Agency in November 2024. Ongoing management of environmental and social impacts is completed through Lumwana’s environmental management system, which includes management plans, monitoring programs, internal and external auditing and the implementation of a Reducing Emissions from the Deforestation and Forest Degradation in Developing Countries (REDD+) Project.
In 2025, all activities at Lumwana were, and continue to be, in compliance in all material respects with applicable corporate standards and environmental regulations.
As at December 31, 2025, the recorded amount of estimated future reclamation and closure costs that were recorded under IFRS, as defined by IAS 37, and that have been updated each reporting period, was $54 million (as described in Note 2r to the Consolidated Financial Statements). Future reclamation and closure costs at Lumwana will increase over time as the Super Pit Expansion Project is developed and operated.
The Super Pit Expansion Project requires a significant increase in the footprint of the mine. As noted above, a resettlement action plan has been developed and approved by the Zambian Environmental Management Agency for the resettlement of 281 households in Kamisengo. Each household has signed their resettlement agreement and the resettlement is now in the execution phase.
Exploration and Drilling
Significant exploration work has been undertaken over the life of Lumwana, including geological mapping, soil geochemistry, ground, and airborne geophysics. Exploration drilling targeting near surface mineralization has led to the discovery of the four main deposits at Lumwana, as well as other exploration prospects.
Exploration completed since 2022 has focused on delineating mineralization in areas where significant infrastructure is planned for the Super Pit Expansion Project. Sufficient exploration has now been conducted to ensure that potential mineralization will not be impacted by planned infrastructure.
- 104 -
Drilling at Lumwana is completed regularly as part of mining operations. Diamond drilling is used for exploration, mineral resource definition, and infill drilling. RC drilling is used for grade control. Drill spacing varies across the deposits. RC drilling is the closest spaced at 12.5 meters by 25 meters. The diamond drilling completed for infill drilling is spaced at 50 meters to 100 meters, and diamond drilling completed for mineral resource definition is spaced at 100 meters to 100 meters.
Since 1961, the following sampling has been undertaken for a total of 3,165,169 meters: (i) diamond drilling of 3,891 holes for 1,054,819 meters; (ii) RC drilling of 50,687 drill holes for 2,091,576 meters; and (iii) RAB, air core and tri-cone drilling of 290 holes for 18,774 meters (all occurring prior to Barrick’s acquisition of Lumwana).
Future exploration at Lumwana will focus on understanding the geology and structural controls at the Greater Odile prospect, which is located approximately three kilometers west of Malundwe.
Royalties and Taxes
Lumwana is subject to income tax at a rate of 30%, as well as the Zambian Mineral Royalty Tax. In 2022, the Zambian government amended the taxation of mineral royalties, with effect from January 1, 2023, to implement a sliding scale that taxes only the incremental value in each price range when the mineral price crosses the applicable price threshold, rather than an increasing royalty rate applicable to all revenue, as under the previous regime. In 2022, the government also reinstated customs and excise duties on petrol and diesel. As at December 31, 2025, the applicable rates are as follows:
| Price Range ($ per tonne Cu) | Rate (%) | Taxable Amount (per tonne) | ||
| Less than $4,000 |
4 | The first $4,000 | ||
| Between $4,001 and $5,000 |
6.5 | The next $1,000 | ||
| Between $5,001 and $7,000 |
8.5 | The next $2,000 | ||
| $7,001 or more |
10 | Balance | ||
These rates may be subject to change in the future. As of January 1, 2022, commodity royalties are tax deductive for corporate income purposes pursuant to the Income Tax Amendment Act 43 of 2021.
Economic Analysis
A financial analysis was carried out using a discounted cash flow approach to support the declaration of mineral reserves in the most recent technical report on Lumwana. The model projected yearly cash inflows, or revenues, and subtracted yearly cash outflows, such as operating costs, capital costs, and taxes.
The resulting net annual cash flows are discounted back to the date of valuation and totaled to determine the net present value of Lumwana.
The economic modelling shows that Lumwana (including the Super Pit Expansion Project and closure allowances) is economically viable, having a positive after-tax net present value. Using the three-year trailing average copper price of $4.03 per pound, the economic analysis indicates a total after-tax net cash flow of $15.2 billion, a net present value of $3.9 billion at a discount rate of 8%, and an after-tax internal rate of return of 49%. The payback period is the time calculated from the start of production until all project capital expenditures have been recovered. The payback period is estimated to be approximately two years. Using Barrick’s copper price assumption of $3.00 per pound to estimate reserves as of December 31, 2024, the economic analysis indicates a total after-tax net cash flow of $4.4 billion, a net present value of $2.0 billion at a discount rate of 8%, an internal rate of return of 10%, and an estimated payback period of approximately eight years.
- 105 -
As at December 31, 2025, the total spend for the Super Pit Expansion Project was $254 million. During 2026, the Company expects to incur approximately $0.75 to $0.85 billion in capital expenditures.
The Company’s total capital cost to develop the Super Pit Expansion Project is estimated to be approximately $2 billion, incurred between 2025 and 2028.
Mining and Processing Information
The following table summarizes certain mining and processing information for Lumwana for the periods indicated:
| Year ended December 31, 2025 |
Year ended December 31, 2024 | |||
| Tonnes mined (000s) |
141,674 | 140,866 | ||
| Tonnes of ore processed (000s) |
25,740 | 25,783 | ||
| Average grade processed (grams per tonne) |
0.64% | 0.53% | ||
| Tonnes of copper produced (000s) |
151 | 123 | ||
The most recent technical report on Lumwana is the technical report entitled “NI 43-101 Technical Report on the Lumwana Mine Expansion, Republic of Zambia”, with an effective date of December 31, 2024, and an issue date of February 19, 2025, and authored by Simon P. Bottoms, Richard Peattie, Derek Holm, Marius Swanepoel and Graham E. Trusler. This technical report has been filed on SEDAR+ in accordance with National Instrument 43-101.
The Company has extensive operating experience in Zambia. Nevertheless, operating in emerging markets, such as Zambia, exposes the Company to risks and uncertainties that do not exist or are significantly less likely to occur in other jurisdictions such as the United States or Canada. For additional details, see “Foreign investments and operations”, “Permitting and government relations”, “Inflation”, “Security and human rights”, “Community relations and license to operate”, “Government regulation and changes in legislation” and “U.S. Foreign Corrupt Practices Act and similar worldwide anti-bribery laws” in “Risk Factors”.
While all risks cannot be mitigated or eliminated, the Company expects to manage and mitigate controllable risks at its Zambia operation through the consistent application of a variety of corporate governance structures and processes that are materially the same as those applied at its other operations located in developed markets. For additional details, see “Narrative Description of the Business – Operations in Emerging Markets: Corporate Governance and Internal Controls”.
The diagram on the following page sets out the design and layout of Lumwana, including the proposed layout of the Super Pit Expansion Project.
- 106 -
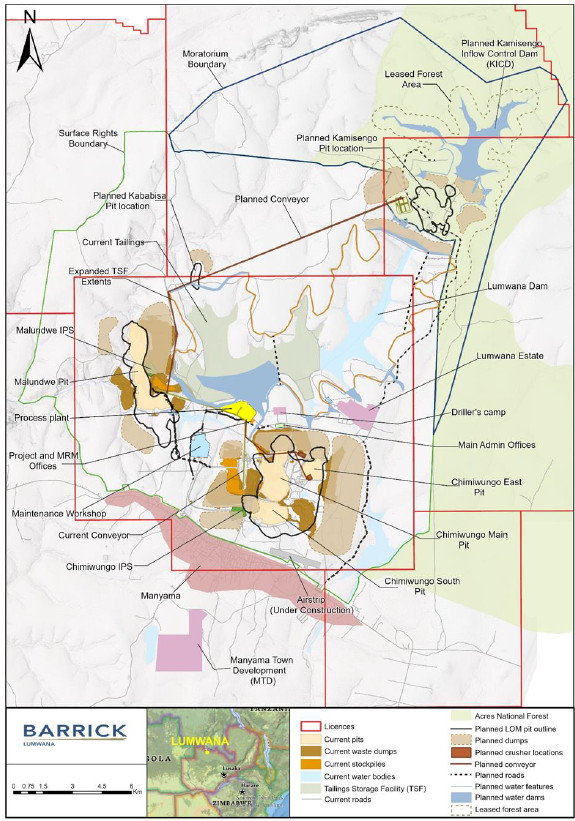
- 107 -
LEGAL MATTERS
Legal Proceedings and Regulatory Actions
Other than as described herein, Barrick is not currently, and was not during the year ended December 31, 2025, a party to or the subject of any legal proceedings, nor are any such proceedings known to be contemplated, which are required to be disclosed in this Annual Information Form in accordance with applicable securities legislation. In addition, there have been no penalties or sanctions imposed against Barrick by a court relating to securities legislation or by a securities regulatory authority during the year ended December 31, 2025, or any other time which are required to be disclosed in this Annual Information Form in accordance with applicable securities legislation. Barrick has not entered into any settlement agreements with a court relating to securities legislation or with a securities regulatory authority during the year ended December 31, 2025.
Proposed Canadian Securities Class Actions (Pascua-Lama)
In 2014, proposed secondary market liability securities class actions were initiated in Ontario and Quebec against the Company and certain of its former senior executives relating to public disclosures concerning what was then known as Barrick’s Pascua-Lama Project. The Ontario case focuses on disclosures regarding capital cost and schedule estimates for Pascua-Lama and environmental compliance matters in Chile between February 2012 and June 2013; the Quebec action pertains only to disclosure regarding environmental matters in Chile between July 2012 and October 2013. In the Ontario proceedings, plaintiffs are seeking damages exceeding $3 billion. Alleged damages in the Quebec case have yet to be quantified.
In Quebec, the plaintiffs filed their Originating Application with the Superior Court of Quebec in February 2024 and Barrick responded formally in March 2024. Barrick filed its Statement of Defence on February 12, 2025. No trial date has been set. In the Ontario proceeding, the plaintiffs’ motion for class certification was heard in the Ontario Superior Court of Justice in January 2026. The Court has reserved judgment.
The Company intends to vigorously defend these actions.
Veladero – Operational Incidents and Associated Proceedings
MAS, the joint venture company that operates the Veladero mine, is the subject of regulatory proceedings related to operational incidents at the Veladero Valley Leach Facility (“VLF”) occurring in March 2017 (the “March 2017 Incident”), September 2016 and September 2015.
Following the March 2017 Incident, an “amparo” protection action (the “Provincial Amparo Action”) was filed against MAS in the Jachal First Instance Court, San Juan Province, Argentina (the “Jachal Court”) by individuals who claimed to be living in Jachal, seeking the cessation of all activities at the Veladero mine or a suspension of the mine’s leaching process. The matter before the Jachal Court remains pending.
In 2017, the National Minister of Environment of Argentina filed an amparo action in the Federal Court in connection with the same March 2017 Incident (the “Federal Amparo Action”) seeking an order requiring the cessation and/or suspension of activities at the Veladero mine.
On June 28, 2024, the Federal Court rejected the National Minister’s request for, among other things, an interim injunction requiring the cessation and/or suspension of activities at the Veladero mine. The National Minister sought to appeal this decision twice in 2024, most recently seeking leave to the Federal Supreme Court on October 16, 2024. The Federal Amparo Action will continue before the Federal Court while the Federal Supreme Court considers whether to hear the appeal for an interim injunction.
- 108 -
The Company continues to believe that the Provincial and Federal Amparo Actions are without merit and intends to continue to vigorously defend its position.
Civil Action
In 2016, MAS was served notice of a civil action filed before the San Juan Provincial Court by certain persons allegedly living in Jachal, San Juan Province, claiming to be affected by the Veladero mine and, in particular, the VLF. The plaintiffs requested a court order that MAS cease leaching metals with cyanide solutions, mercury and other similar substances at the mine and replace that process with one that is free of hazardous substances, implement a closure and remediation plan for the VLF and surrounding areas, and create a committee to monitor this process. These claims were supplemented by new allegations that the risk of environmental damage had increased as a result of the March 2017 Incident.
MAS replied to the lawsuit in February 2017, responded to the supplemental claim and intends to continue defending this matter vigorously.
Perilla Complaint
In 2009, Barrick Gold Inc. and Placer Dome Inc. (“Placer Dome”), which was acquired by the Company in 2006, were purportedly served in Ontario with a complaint filed in November 2008 in the Regional Trial Court of Boac, on the Philippine island of Marinduque. The complaint alleged injury to the economy and the ecology of Marinduque as a result of the discharge of mine tailings from the Marcopper mine into Calancan Bay, the Boac River, and the Mogpog River. Placer Dome was previously a minority indirect shareholder of Marcopper Mining Corporation (“Marcopper”). The plaintiffs claimed for abatement of a public nuisance and nominal damages for an alleged violation of their constitutional right to a balanced and healthful ecology. By Order dated November 9, 2011, the Court granted the plaintiffs’ motion to suspend the proceedings. On April 28, 2025, the Regional Trial Court of Boac dismissed the proceeding with prejudice.
Writ of Kalikasan
On February 25, 2011, a Petition for the Issuance of a Writ of Kalikasan with Prayer for Temporary Environmental Protection Order was filed in the Supreme Court of the Republic of the Philippines by three named Petitioners against Placer Dome and the Company (the “Petition”). The Petition alleged that Placer Dome violated the Petitioners’ constitutional right to a balanced and healthful ecology as a result of, among other things, the discharge of tailings into Calancan Bay, a dam breach in 1993, and a tailings spill in 1996. The Petitioners sought orders requiring Barrick to environmentally remediate the areas in and around the mine site that were alleged to have sustained environmental impacts.
On January 21, 2021, the Court of Appeals granted an Intervention Motion introduced by the Province of Marinduque (the “Province”) and admitted the Province’s Petition-in-Intervention. In the Petition-in-Intervention, the Province sought to expand the scope of relief sought within the Writ of Kalikasan to include claims seeking rehabilitation and remediation of alleged maintenance and structural integrity issues supposedly associated with Marcopper mine infrastructure.
On April 4, 2025, Barrick and the Provincial Government of Marinduque signed agreements to settle, without admission of liability, all proceedings and claims related to alleged environmental issues associated with the Marcopper mine, subject to various conditions precedent, including approval of the settlement by the Court of Appeals and certain confirmations by the Department of Environment and Natural Resources. Once all conditions are satisfied, Barrick will pay a settlement amount of $100 million to the Province over a period of three years. This amount was recorded in the first quarter of 2025. On October 3, 2025, the Court of Appeals in the Philippines approved the settlement agreement and dismissed the Writ of Kalikasan proceedings against Barrick and Placer Dome with prejudice. Certain additional conditions precedent remain outstanding, including the issuance of confirmations by the Department of Environment and Natural Resources.
- 109 -
North Mara – Ontario Litigation
On November 23, 2022, an action was commenced against the Company in the Ontario Superior Court of Justice in respect of alleged security-related incidents in the vicinity of the North Mara Gold Mine in Tanzania. The named plaintiffs purport to have been injured, or to be the dependents of individuals who were allegedly killed, by members of the Tanzanian Police Force. The Statement of Claim asserts that Barrick is legally responsible for the actions of the Tanzanian Police Force, and that the Company is liable for an unspecified amount of damages.
In February 2024, an additional action was commenced against the Company in the Ontario Superior Court of Justice on behalf of different named plaintiffs in respect of alleged security-related incidents said to have occurred in the vicinity of the North Mara Gold Mine. The Statement of Claim in the second action is substantially similar to the Statement of Claim issued in November 2022. The Company believes the allegations in both claims are without merit, including because the Tanzanian Police Force is a sovereign police force that operates under its own chain of command.
On November 26, 2024, the court granted Barrick’s motion to dismiss both actions on the grounds that the Ontario Superior Court of Justice lacks jurisdiction and that Tanzania is a more appropriate forum in which to litigate this matter. On December 27, 2024, the plaintiffs appealed this decision to the Ontario Court of Appeal. The appeal was heard on November 27, 2025. The Court of Appeal reserved judgment and a decision remains pending.
Loulo-Gounkoto Mining Conventions Dispute
In 2023, the Government of Mali initiated a review of existing establishment conventions, including the Mining Conventions of Somilo and Gounkoto for the Loulo-Gounkoto complex (the “Conventions”). As part of this process, the Government of Mali demanded that the Loulo and Gounkoto mines become subject to the Malian 2023 Mining Code, in direct violation of the stability rights contained in the Conventions.
Beginning in 2023, the Government of Mali initiated several fiscal and customs proceedings against Somilo and Gounkoto, demanding payment of various charges, taxes, duties, and other amounts from which they were exempt. Barrick regularly engaged with the Government of Mali to find a global settlement and in October 2024, Barrick made a payment of FCFA 50 billion ($84 million) to advance those negotiations. Despite the Company’s efforts, in November 2024, Somilo and Gounkoto were restricted from exporting gold from Mali, also in violation of the Conventions. At the same time, the Government of Mali initiated meritless criminal proceedings against the Company, its Malian subsidiaries, and their officers, directors and several employees, alleging violations of exchange control regulations and threatening substantial fines and imprisonment. These proceedings resulted in the incarceration of four employees on November 25, 2024.
On December 18, 2024, after multiple good faith attempts to resolve the dispute, Somilo and Gounkoto submitted a request for arbitration to the ICSID in accordance with the provisions of their respective Conventions.
On January 2, 2025, an interim attachment order was issued by the Senior Investigating Judges of the Pôle National Économique et Financier (“Pôle Économique”) against the existing gold stock on the site of the Loulo-Gounkoto Complex. On January 11, 2025, the gold was removed from the site to a custodial bank. On January 14, 2025, due to the restrictions imposed by the Government of Mali on gold shipments, the Company announced that the Loulo-Gounkoto complex would temporarily suspend operations. On June 16, 2025, the Bamako Commercial Tribunal placed the Loulo-Gounkoto complex under six months of provisional administration and the Provisional Administrator assumed day to day management of operations at the complex on June 23, 2025.
- 110 -
On November 24, 2025, Barrick announced that an agreement with the Government of Mali had been entered into to put an end to all disputes regarding the Loulo-Gounkoto complex, including the termination of the provisional administration, the dropping of all charges against Barrick, its affiliates and employees and the release of the four detained employees, the renewal of the Somilo Exploitation Permit for a 10 year period, and the withdrawal of the ICSID claims. A settlement payment of approximately FCFA 143 billion ($253 million) was made to the Government of Mali on November 28, 2025, which was part of the global settlement amount. Operational control was handed back to Somilo and Gounkoto’s management on December 16, 2025, and the Loulo-Gounkoto complex is now producing gold. The parties sought withdrawal of the ICSID arbitration on December 15, 2025 and the gold stock attached in January 2025 was returned to Somilo and Gounkoto on December 18, 2025.
RISK FACTORS
Barrick’s performance and its future operations are and may be affected by a wide range of risks. The risks described below are not the only ones facing Barrick. Additional risks not currently known to Barrick, or that Barrick currently deems immaterial, may also impair Barrick’s operations or projects.
Metal price volatility
Barrick’s business is strongly affected by the world market price of gold and copper. If the world market price of gold or copper was to drop and the prices realized by Barrick on gold or copper sales were to decrease significantly and remain at such a level for any substantial period, Barrick’s profitability and cash flow would be negatively affected.
Gold and copper prices have fluctuated widely in recent years. These fluctuations can be material and can occur over short periods of time and are affected by numerous factors, all of which are beyond Barrick’s control. Future production from Barrick’s mining properties is dependent on gold and copper prices that are adequate to make these properties economically viable. During 2025, the gold price ranged from $2,615 per ounce to an all-time high of $4,550 per ounce. The average market price of gold in 2025 was $3,432 per ounce, an all-time average annual high and an increase of 44% compared to the 2024 annual average. Based on current estimates of Barrick’s 2026 gold production and sales, a $100 per ounce increase or decrease from the $4,500 per ounce gold price assumption used to determine guidance will result in an approximately $650 million increase or decrease, as applicable, in the Company’s EBITDA. EBITDA is a non-GAAP financial performance measure with no standardized definition under IFRS. For further information, see “Non-GAAP Financial Measures” at pages 151 to 155 for a detailed discussion of each of the non-GAAP measures used in this Annual Information Form. Factors tending to affect the price of gold include:
| • | industrial and jewelry demand; |
| • | the level of demand for gold as an investment; |
| • | central bank lending, sales and purchases of gold; |
| • | the volume of recycled material available in the market; |
| • | speculative trading; and |
| • | costs and levels of global gold production by producers of gold. |
Gold prices may also be affected by macroeconomic factors, including:
| • | expectations of the future rate of inflation; |
| • | the strength of, and confidence in, the U.S. dollar, the currency in which the price of gold is generally quoted, and other currencies; |
| • | the value of alternative investments, including global equity prices; |
| • | interest rates; and |
- 111 -
| • | global or regional, political or economic uncertainties, including changes in U.S. trade, tariff and other controls on imports and exports, tax, immigration or other policies that may impact relations with foreign countries or result in retaliatory policies. |
Based on current estimates of Barrick’s 2026 copper production and sales, a $0.25 per pound increase or decrease from the $5.50 per pound copper price assumption used to determine guidance will result in an approximately $110 million increase or decrease, as applicable, in the Company’s EBITDA. EBITDA is a non-GAAP financial performance measure with no standardized definition under IFRS. For further information, see “Non-GAAP Financial Measures” at pages 151 to 155 for a detailed discussion of each of the non-GAAP measures used in this Annual Information Form. Factors tending to affect the price of copper include:
| • | the worldwide balance of copper demand and supply; |
| • | rates of global economic growth, trends in industrial production and conditions in the housing and automotive industries, all of which correlate with demand for copper; |
| • | the rate of electrification and, in particular, the growth of the production of electric vehicles, which are more copper-intensive than vehicles with internal combustion engines, and the related demand for copper that will be required to build the electrical grids required to support the growth in usage of electric vehicles and other electrification goals; |
| • | economic growth and political conditions in China, which has become the largest consumer of refined copper in the world, and other major developing economies; |
| • | speculative investment positions in copper and copper futures; |
| • | the availability of secondary material for smelting; |
| • | expectations of the future rate of inflation; |
| • | the price of input costs, including fuel, and potential increases in those prices resulting from the imposition of tariffs; |
| • | the availability and cost of substitute materials; and |
| • | currency exchange fluctuations, including the relative strength of the U.S. dollar. |
Barrick’s gold production is sold into the spot market or to refiners at market prices. The sales price for Barrick’s copper production is determined provisionally at the date of sale with the final price determined based on market copper prices at a future date set by the customer, generally one to three months after the initial date of sale. Market prices for copper may fluctuate during this extended settlement period. The prices of Barrick’s copper sales are marked-to-market at the balance sheet date based on the forward copper price for the relevant quotational period. All such mark-to-market adjustments are recorded in copper sale revenues. If the market price for copper declines, the final sale price realized by the Company at settlement may be lower than the provisional sale price initially recognized by the Company, requiring negative adjustments to Barrick’s average realized copper price for the relevant period.
In addition, certain of Barrick’s mineral projects include other minerals (principally silver), each of which is subject to price volatility based on factors beyond Barrick’s control.
Depending on the market price of the relevant metal, Barrick may determine that it is not economically feasible to continue commercial production at some or all of its operations or the development of some or all of its current projects, as applicable, which could have an adverse impact on Barrick’s financial performance and results of operations. In such a circumstance, Barrick may also curtail or suspend some or all of its exploration activities, with the result that depleted reserves are not replaced. In addition, the market value of Barrick’s gold or copper inventory may be reduced and existing reserves may be reduced to the extent that ore cannot be mined and processed economically at the prevailing prices.
- 112 -
Projects
Barrick’s ability to sustain or increase its present levels of gold and copper production is dependent in part on the success of its projects. There are many risks and unknowns inherent in all projects. For example, the economic feasibility of projects is based upon many factors, including:
| • | the accuracy of reserve estimates; |
| • | metallurgical recoveries with respect to gold, copper and by-products; |
| • | capital and operating costs of such projects; |
| • | the timetables for the construction, commissioning and ramp-up of such projects and any delays or interruptions; |
| • | the reliability of construction designs and accuracy of engineering; |
| • | changes in scope; |
| • | the ability to manage large-scale construction; |
| • | the future prices of the relevant minerals; |
| • | the ability to secure appropriate financing to develop such projects; and |
| • | in the case of Reko Diq, the ability to secure non-recourse project financing to mitigate geo-political risk. |
The stability of the legal and financial terms that apply to the development and exploitation of any given project, as well as the Company’s ability to maintain its license to operate, in the jurisdictions in which Barrick has projects is also important to the success of those projects (see “Community relations and license to operate”).
Projects also require the successful completion of feasibility studies, agreement on fiscal (including royalties) and customs matters, as well as other terms applicable to the development and exploitation of the project, and the resolution of any matter arising in this respect, the issuance of, and compliance with, necessary governmental permits and the acquisition of satisfactory surface or other land rights. In some of the jurisdictions in which Barrick has projects, there may be little clarity on those agreements. It may also be necessary for Barrick to, among other things, find or generate suitable sources of water and power for a project, ensure that appropriate community infrastructure is developed by third parties to support the project and to secure appropriate financing to fund these expenditures (see “Global financial conditions” and “Liquidity and level of indebtedness”). As orebodies become more remote, the complexity and cost of infrastructure for mining projects is increasing and key infrastructure, as well as suitable sources of water and power, may not always be readily available. It is also not unusual in the mining industry for new mining operations to experience unexpected problems during the start-up phase, resulting in delays and requiring the investment of more capital than anticipated.
Projects have no operating history upon which to base estimates of future financial and operating performance, including future cash flow. The capital expenditures and time required to develop new mines or other projects are considerable and changes in costs or construction schedules can affect project economics. As such, it is possible that actual costs may increase significantly and economic returns may differ materially from Barrick’s estimates or that metal prices may decrease significantly or that Barrick could fail to obtain the satisfactory resolution of fiscal and tax matters or the governmental approvals necessary for the operation of a project or obtain project financing on acceptable terms and conditions or at all, in which case, the project may not proceed either on its original timing or at all. There are risks associated with projects in the early stages of evaluation, such as Reko Diq and the Super Pit Expansion Project at Lumwana, including, among other things, the ability to secure appropriate project financing in the case of Reko Diq, that capital costs increase significantly from Barrick’s estimates and that considerable additional work beyond that which Barrick has planned may be required to complete further
- 113 -
evaluation. As described above, such circumstances would have the potential to significantly impact costs, timing or even the feasibility for the project to progress to the next stage of development.
If Barrick declines or is unable to advance a project on a particular timetable or at all, the rights associated with the project and the estimated revenues and profits could be negatively affected.
Proposed North America Initial Public Offering
From time to time, Barrick examines opportunities for strategic transactions. For example, as announced on December 1, 2025, the Board of Directors authorized Barrick’s management team to explore an IPO of an entity that will hold Barrick’s North American gold assets (IPOCo). As announced on February 5, 2026, following a rigorous financial and operational analysis by Barrick’s management and its advisors, the Board authorized Barrick’s management to begin preparations for such an IPO, which is expected to be completed by late 2026, subject to market conditions and other customary conditions, including any required regulatory approvals and final approval by the Board. Barrick announced that IPOCo will hold Barrick’s joint venture interests in Nevada Gold Mines and Pueblo Viejo, as well as Barrick’s wholly-owned Fourmile gold discovery in Nevada, and that Barrick intends to retain a significant controlling interest in IPOCo following the IPO.
The pursuit of such strategic transactions, including the potential IPO, would be accompanied by significant risks to Barrick’s operations and financial results, whether or not such transaction is ultimately consummated. Such risks could include: diversion of management’s time and attention away from Barrick’s business and operations; changes to Barrick’s business strategy; significant transaction costs, including taxes and dyssynergy costs, which may be incurred even if such strategic transaction fails to close or is otherwise unsuccessful and may be greater than anticipated; failure to complete such strategic transaction on expected terms and timeframes, or at all; loss of key management personnel or employees, or the deterioration of Barrick’s relationships with its employees; disruption to Barrick’s relationships with contract counterparties, joint venture partners, regulators or other stakeholders; negative publicity or harm to Barrick’s reputation; and legal proceedings and substantial costs associated with litigation. or other claims challenging such transaction.
There can be no assurance regarding the ultimate timing of any contemplated strategic transaction, including the IPO, or that such strategic transaction will be completed on terms and conditions previously announced, or at all. Any one or more of these factors or other risks could cause Barrick not to realize the anticipated benefits of a strategic transaction, including the IPO, and may materially and adversely affect its operations and financial results.
Mineral reserves and resources
Barrick’s mineral reserves and mineral resources are estimates, and no assurance can be given that the estimated reserves and resources are accurate or that the indicated level of gold, copper or any other mineral will be produced. Such estimates are, in large part, based on interpretations of geological data obtained from drill holes and other sampling techniques. Actual mineralization or formations may be different from those predicted. Further, it may take many years from the initial phase of drilling before production is possible, and during that time the economic feasibility of exploiting a discovery may change.
Because Barrick prepares this Annual Information Form in accordance with the disclosure requirements of Canadian securities laws, it contains resource estimates, which are required by National Instrument 43-101. Mineral resource estimates for properties that have not commenced production are based, in many instances, on limited and widely spaced drill hole information, which is not necessarily indicative of the conditions between and around drill holes. Accordingly, such mineral resource estimates may require revision as more drilling information becomes available, as actual production experience is gained or as the Company’s mining methods are changed. No assurance can be given that any part or all of Barrick’s mineral resources constitute or will be converted into reserves.
- 114 -
Market price fluctuations of gold, copper, silver and certain other metals, as well as increased production and capital costs or reduced recovery rates, may render Barrick’s proven and probable reserves uneconomic to develop at a particular site or sites for periods of time or may render mineral reserves containing relatively lower grade mineralization uneconomic. Moreover, short-term operating factors relating to the mineral reserves, such as the need for the orderly development of ore bodies, the processing of new or different ore grades, the technical complexity of ore bodies, unusual or unexpected ore body formations, ore dilution or varying metallurgical and other ore characteristics may cause mineral reserves (or ore reserves) to be reduced or Barrick to be unprofitable in any particular accounting period. Estimated reserves may have to be recalculated based on actual production experience, fluctuations in the price of metals, or changes in other assumptions on which they are based. Any of these factors may require Barrick to reduce its mineral reserves (or ore reserves) and resources, which could have a negative impact on Barrick’s financial results.
Failure to obtain or maintain necessary permits or government approvals, or changes to applicable tax and customs regimes or applicable legislation, could also cause Barrick to reduce its reserves. In addition, changes to mine plans due to capital allocation decisions could cause Barrick to reduce its reserves. There is also no assurance that Barrick will achieve indicated levels of gold or copper recovery or obtain the prices assumed in determining such reserves.
Replacement of depleted reserves
Barrick’s mineral reserves must be replaced to maintain production levels over the long-term. Reserves can be replaced by expanding known ore bodies, locating new deposits or making acquisitions. Exploration is highly speculative in nature and identifying new ore bodies is becoming increasingly difficult. Barrick’s exploration projects involve many risks and are frequently unsuccessful. Once a site with mineralization is discovered, it may take several years from the initial phases of drilling until production is possible, during which time the economic feasibility of production may change. Substantial expenditures are required to establish proven and probable reserves and to construct mining and processing facilities. As a result, there is no assurance that current or future exploration programs will be successful or that new commercial mining operations will be developed. Depletion of reserves may not be offset by discoveries or acquisitions and divestitures of assets could lead to a lower reserve base. Barrick may continue to dispose of additional assets in 2026 or future years as part of its ongoing focus on Tier One Gold Assets, Tier Two Gold Assets, Tier One Copper Assets/Projects, Strategic Assets and other strategic initiatives, which may further deplete Barrick’s reserves. Reserves estimated in accordance with National Instrument 43-101 may also decrease due to economic factors such as the use of a lower metal price assumption. However, such a decline would not be a reduction in the actual mineral base of the Company, as the ounces or pounds removed from Barrick’s reserves due to the use of a lower gold or copper price assumption would be transferred to resources, preserving the option to access them in the future at higher gold or copper prices. The mineral base of Barrick will decline if reserves are mined without adequate replacement and Barrick may not be able to sustain production to or beyond the currently contemplated mine lives, based on current production rates.
Foreign investments and operations
Barrick conducts or participates in mining, development and exploration and other activities through subsidiaries and/or joint ventures in many foreign countries, including the United States, Argentina, Chile, the Dominican Republic, the DRC, Ecuador, Jamaica, Mali, Pakistan, Papua New Guinea, Peru, Saudi Arabia, Senegal, Tanzania and Zambia. Mining investments are subject to the risks normally associated with any conduct of business in foreign countries including:
| • | renegotiation, cancellation or forced modification of existing contracts; |
| • | expropriation or nationalization of property; |
| • | changes in laws or policies or increasing legal and regulatory requirements of particular countries, including those relating to taxation, tariffs, royalties, imports, exports, duties, currency, in-country |
- 115 -
| beneficiation or other claims by government entities, including retroactive claims and/or changes in the administration of laws, policies and practices; |
| • | uncertain political and economic environments, war, terrorism, sabotage and civil disturbances; |
| • | lack of certainty with respect to foreign legal systems, corruption and other factors that are inconsistent with the rule of law; |
| • | international sanctions and trade restrictions; |
| • | delays in obtaining or the inability to obtain or maintain necessary governmental permits or to operate in accordance with such permits or regulatory requirements; |
| • | currency fluctuations; |
| • | restrictions on the ability of local operating companies to sell gold, copper or other minerals offshore for U.S. dollars, and on the ability of such companies to hold U.S. dollars or other foreign currencies in offshore bank accounts; |
| • | import and export regulations, including restrictions on the export of gold, copper or other minerals; |
| • | limitations on the repatriation of earnings; |
| • | reliance on advisors and consultants in foreign jurisdictions in connection with regulatory, permitting or other governmental requirements; |
| • | increased financing costs; and |
| • | risk of loss due to disease, such as malaria or the zika virus, and other potential medical endemic or pandemic issues, such as Ebola or Covid-19, as a result of the potential related impact to employees, disruption to operations, supply chain delays and impact on economic activity in affected countries or regions. |
Operating in emerging markets can increase the risk that contractual and/or mineral rights may be disregarded or unilaterally altered, including in respect of stability. For example, in Mali, Barrick’s subsidiaries operated Loulo-Gounkoto under Mining Conventions entered into with the Government of Mali. These Mining Conventions contained stabilization provisions to protect Barrick’s Malian subsidiaries from adverse amendments to the applicable tax regime or the Mali legislation. In August 2023, Mali adopted the 2023 Mining Code and initiated a review process of existing mining conventions, including the Mining Conventions of the Loulo-Gounkoto complex. As part of this process, the Government of Mali demanded that the mines become subject to the 2023 Mining Code, in direct violation of the stability rights contained in the Mining Conventions. To exert pressure on Barrick’s Malian subsidiaries, Mali initiated a number of actions, including the restrictions imposed in November 2024 on the export of gold produced by the Loulo-Gounkoto complex and the attachment order issued in January 2025 against existing gold inventories, leading to the temporary suspension of operations at Loulo-Gounkoto. In addition, in June 2025, the Loulo-Gounkoto complex was placed under six months of provisional administration and the Provisional Administrator assumed day-to-day management of operations at the mines. Other actions, such as the institution of criminal proceedings against Barrick’s Malian subsidiaries, their employees and executives, resulted in the detention of four employees. On November 24, 2025, Barrick announced that an agreement had been entered into with the Government of Mali to put an end to all disputes regarding the Loulo-Gounkoto complex, including the withdrawal of criminal proceedings and the release of the detained employees. The provisional administration of the Loulo-Gounkoto Complex was terminated on December 16, 2025, at which point operational control was handed back to Somilo and Gounkoto’s management. For further information, see “Legal Proceedings and Regulatory Actions — Loulo-Gounkoto Mining Conventions Dispute”.
In certain jurisdictions in which the Company operates, there is an increased focus by governments on securing greater economic benefit and increased financial and social benefits from extractive industries. Barrick has operations, conducts business, and is subject to taxation, in a number of emerging market jurisdictions. These taxation laws are complex, subject to varying interpretations and applications by the relevant tax authorities and subject to changes and revisions in the ordinary course. In addition, the
- 116 -
mining legislation to which the Company is subject or the stability or other investments agreements to which the Company is a party may be subject to review or renegotiation by the relevant governments. Other laws, regulations or policies regarding such matters and their implementation and interpretation can be uncertain.
For example, in the DRC, the DRC Mining Code (2002) and associated regulations have been amended with an updated DRC Mining Code (2018) and related regulations. The updated law and regulations include potentially adverse changes with respect to, among others, fiscal stability protection, increased royalty rates, income taxes, import and other duties, value-added and other taxes, foreign exchange controls, indirect capital gains taxes and local content.
On December 15, 2022, Barrick completed the reconstitution of the Reko Diq project in Pakistan’s Balochistan province. The completion of this transaction involved, among other things, the execution of all of the definitive agreements including the mineral agreement stabilizing the fiscal regime applicable to the project, as well as the grant of mining leases, an exploration license, and surface rights. The reconstituted project is held 50% by Barrick and 50% by Pakistani stakeholders, comprising a 10% free-carried, non-contributing share held by the GoB, an additional 15% held by a special purpose company owned by the GoB and 25% owned by other federal state-owned enterprises. The GoP will also have the option to purchase Barrick’s interest in Reko Diq if, subject to force majeure, a positive decision is not made to proceed with the development of Phase 1 by April 4, 2026. See “Material Properties – Reko Diq Project” for details. Failure of either Barrick or the GoP or GoB to adhere to the terms of the definitive agreements, including failure to develop the project in accordance with the terms of such agreements, or the imposition of other measures by the GoP or GoB may have a material adverse impact on Barrick’s cash flows, earnings, results of operations, mineral reserve and mineral resource statements and financial position.
Over the past few years, the Company experienced other similar disputes in Tanzania and Papua New Guinea. In October 2019, Barrick reached an agreement with the Government of Tanzania (“GoT”) to settle all disputes between the GoT and the mining companies formerly operated by Acacia, including in respect of an export ban and tax reassessments for approximately $190 billion. In connection with the settlement and resolution of all outstanding disputes, the GoT received a free carried shareholding of 16% in each of the former Acacia mines (Bulyanhulu, Buzwagi and North Mara) as part of the Twiga joint venture. In Papua New Guinea (“PNG”), the Porgera mine was placed on temporary care and maintenance from April 25, 2020 until December 22, 2023, following the Government of PNG’s decision not to extend Porgera’s SML and several tax disputes. These disputes, and legal proceedings initiated in respect of such disputes, were ultimately resolved through the negotiation and satisfaction of the conditions of the Commencement Agreement. This included the granting of the new SML to New Porgera Limited and ultimately increased the ownership interest of PNG stakeholders in Porgera to 51%. Although the above-noted disputes have been resolved, there can be no assurance that the GoT or Government of PNG will not impose other measures that may negatively impact Barrick’s performance or operations or that additional disputes will not arise in the future.
In certain jurisdictions, general inflationary pressures may have a more acute effect on Barrick’s labor, commodity and other input costs at operations, which could have a materially adverse effect on Barrick’s financial condition, results of operations and capital expenditures for the development of its projects.
There can be a greater level of political, social and economic risk in the emerging markets in which Barrick operates. Operations or projects in emerging markets may be subject to more frequent civil disturbances and criminal activities such as trespass, illegal mining, sabotage, theft, vandalism and terrorism. These disturbances and criminal activities have the potential to cause disruptions at certain of Barrick’s operations, projects or joint ventures. In particular, there has been criminal activities and violence in the vicinity of the Porgera mine, trespassing at the North Mara mine, and terrorist activity and regional conflict in the vicinity of Pakistan’s Balochistan province, which is where the Company’s Reko Diq project is located. As previously disclosed, in light of the recent escalation of security risks and the increase in the number of security incidents in the province of Balochistan, Barrick is undertaking a review
- 117 -
of all aspects of the Reko Diq project, including the project’s security arrangements, development timetable and capital budget.
Similarly, different economic and social issues exist in emerging markets which may affect Barrick’s operating and financial results. For example, infectious diseases (including malaria, HIV/AIDS, tuberculosis and the Ebola virus) are major health care issues in African countries. Workforce training and health programs to maximize prevention awareness and minimize the impact of infectious diseases, including HIV/AIDS and malaria in the DRC, Mali, Tanzania, Zambia and other jurisdictions in Africa may prove insufficient to adequately address these serious issues.
The foregoing risks may limit or disrupt operating mines or projects, restrict the movement of funds, cause Barrick to have to expend more funds than previously expected, or result in the deprivation of contract rights or the taking of property by nationalization or expropriation without fair compensation, and may materially adversely affect Barrick’s financial position or results of operations. Certain of these risks have increased in recent years. Furthermore, in the event of disputes arising from Barrick’s activities in Argentina, Chile, the DRC, the Dominican Republic, Ecuador, Jamaica, Mali, Pakistan, Papua New Guinea, Peru, Saudi Arabia, Senegal, Tanzania and Zambia, or from Barrick’s past activities in other emerging markets, Barrick has been and may continue to be subject to the jurisdiction of courts outside North America, which could adversely affect the outcome of the dispute.
Foreign subsidiaries
A significant portion of Barrick’s business is carried on through subsidiaries, including foreign subsidiaries. Accordingly, any limitation on the transfer of cash or other assets between the parent corporation and such entities, or among such entities, could restrict Barrick’s ability to fund its operations and projects efficiently. Any such limitations, or the perception that such limitations may exist now or in the future, could have an adverse impact on Barrick’s valuation and stock price.
Production and cost estimates
Barrick prepares estimates of future production, total cash costs and capital costs of production for particular operations. No assurance can be given that such estimates will be achieved. Failure to achieve production or cost estimates or material increases in costs could have an adverse impact on Barrick’s future cash flows, profitability, results of operations and financial condition.
Barrick’s actual production and costs may vary from estimates for a variety of reasons, including: actual ore mined varying from estimates of grade, tonnage, dilution and metallurgical and other characteristics; short-term operating factors relating to mineral or ore reserves, such as the need for sequential development of ore bodies and the processing of new or different ore grades; revisions to mine plans; unusual or unexpected ore body formations; risks and hazards associated with mining; natural phenomena, such as inclement weather conditions, increased incidence of extreme weather events, water availability, floods, and earthquakes; and unexpected labor shortages or strikes. Costs of production may also be affected by a variety of factors, including: changing waste-to-ore ratios, ore grade metallurgy, labor costs, the cost of commodities, general inflationary pressures and currency exchange rates.
Government regulation and changes in legislation
The Company’s business is subject to various levels of government controls and regulations, which are supplemented and revised from time to time. Barrick is unable to predict what legislation or revisions may be proposed that might affect its business or when any such proposals, if enacted, might become effective. Such changes, however, could require increased capital and operating expenditures and could prevent or delay certain operations by the Company. To the extent that Barrick fails to or is alleged to fail to comply with any applicable regulation, whether in the future or in the past, the Company may be unable
- 118 -
to continue to operate successfully at a particular location. For example, operations at the Loulo-Gounkoto Complex in Mali were temporarily suspended in 2025, pending the resolution of ongoing disputes with the Government of Mali related to unilateral changes in the application of certain laws and revisions of contractual terms, among other things. On November 24, 2025, Barrick announced that an agreement with the Government of Mali had been entered into to put an end to all disputes regarding the Loulo-Gounkoto complex. As part of the global settlement with the Government of Mali, Somilo and Gounkoto agreed to be subject to the terms of the Mining Code adopted by Mali in 2023. See “Legal Proceedings and Regulatory Actions – Loulo-Gounkoto Mining Conventions Dispute”. Barrick’s business is also subject to extensive tax laws and regulations in the various jurisdictions in which the Company operates. Changes in tax laws, regulations, or administrative practices, including shifts in tax policy, tax base, or tax rates, could materially affect Barrick’s financial position and results of operations.
Permitting and government relations
Barrick’s mining and processing operations and development and exploration activities are subject to extensive permitting requirements. Failure to obtain required permits and/or to maintain compliance with permits once obtained could result in injunctions, fines, suspension or revocation of permits and other penalties. While Barrick strives to obtain and comply with all of its required permits, there can be no assurance that Barrick will obtain all such permits and/or achieve or maintain full compliance with such permits at all times. Activities required to obtain and/or achieve or maintain full compliance with such permits can be costly and involve extended timelines. Previously issued permits may be suspended or revoked, or not renewed, for a variety of reasons, including through government or court action. Failure to obtain and/or comply with required permits, government approvals or changes to applicable legislation can have serious consequences, including: damage to Barrick’s reputation; stopping Barrick from proceeding with the development of, or the cancellation or expropriation of, a project; negatively impacting the operation or further development of a mine; or increasing the costs of development or production and litigation or regulatory action against Barrick including the imposition of fines and other administrative or judicial action. Accordingly, it may materially adversely affect Barrick’s business, results of operations or financial condition.
Barrick’s ability to successfully obtain and maintain key permits and approvals will be impacted by its ability to develop, operate and close mines in a manner that is compliant with applicable laws and consistent with the creation of social and economic benefits in the surrounding communities and may be adversely impacted by real or perceived detrimental events associated with Barrick’s activities or those of other mining companies affecting the environment, human health and safety of the surrounding communities. Barrick has made, and expects to make in the future, significant expenditures to comply with permitting requirements and, to the extent reasonably practicable, create social and economic benefit in the surrounding communities.
Environmental, health and safety regulations
Barrick’s mining and processing operations and development and exploration activities are subject to extensive laws and regulations governing the protection of the environment, waste disposal, worker safety, mine development, water management and protection of endangered and other special status species. While Barrick strives to achieve full compliance with all such laws and regulations and with its environmental and health and safety permits, there can be no assurance that Barrick will at all times be in full compliance with such requirements. Failure to comply with applicable environmental and health and safety laws and regulations could result in injunctions, fines, suspension or revocation of permits, penalties or other judicial or administrative action, which may materially adversely affect Barrick’s business, results of operations or financial condition.
Future changes in applicable environmental and health and safety laws and regulations could substantially increase costs and burdens to achieve compliance or otherwise have an adverse impact on Barrick’s business, results of operations or financial condition (see “Government regulation and changes in legislation”).
- 119 -
Barrick may also be held responsible for the costs of addressing contamination at the site of current or former activities or at third party sites. Barrick could also be held liable to third parties for exposure to hazardous substances. The costs associated with such responsibilities and liabilities may be significant. While Barrick has implemented extensive health and safety initiatives at its sites to protect the health and safety of its employees, contractors and members of the communities affected by its operations and projects, there is no guarantee that such measures will eliminate the occurrence of accidents or other incidents which may result in personal injuries, fatalities or damage to property, and in certain instances such occurrences could give rise to regulatory fines and/or civil liability. For example, Barrick had four tragic fatalities in 2025, one at Nevada Gold Mines, one at Bulyanhulu and two at Kibali. Following each of these tragic incidents, Barrick investigated the underlying causes and implemented Fatality Prevention Criteria and gap assessments across the Company, with a view towards enhancing Barrick’s safety protocols and procedures and preventing similar tragedies from occurring in the future. Barrick resolutely believes that, with the right controls and appropriate training in place, incidents can be prevented, and that one fatality is one too many.
In certain of the countries in which Barrick has operations or projects, it is required to submit, for government approval, a reclamation plan for each of its mining sites that establishes Barrick’s obligation to reclaim property after minerals have been mined from the site. In some jurisdictions, bonds or other forms of financial assurances are required as security for these reclamation activities. Barrick may incur significant costs in connection with these reclamation activities, which may materially exceed the provisions Barrick has made for such reclamation. In addition, the unknown nature of possible future additional regulatory requirements and the potential for additional reclamation activities create further uncertainties related to future reclamation costs, which may have a material adverse effect on Barrick’s financial condition, liquidity or results of operations. Barrick is involved in various investigative and remedial actions. There can be no assurance that the costs of such actions will not be material. When a previously unrecognized reclamation liability becomes known or a previously estimated cost is increased, the amount of that liability or additional cost is expensed, which may materially reduce net income in that period.
In addition, Barrick’s activities, ownership interests or operations, past or present, could expose the Company to strict and joint and several liability for contamination under federal, state, provincial or local laws of certain of the jurisdictions in which the Company has or had activities, ownership interests or operations. For example, in the United States under the Comprehensive Environmental Response, Compensation, and Liability Act of 1980 (CERCLA) and its state law equivalents, present or past owners of a property may be held strictly and jointly and severally liable for cleanup costs or forced to undertake remedial actions in response to unpermitted releases of hazardous substances at such property, in addition to, among other potential consequences, potential liability to governmental entities for the cost of damages to natural resources, which may be substantial.
Climate change risks
Barrick recognizes that climate change is a global challenge that will affect its business in a range of possible ways. Barrick’s mining and processing operations are energy intensive, resulting in a carbon footprint either directly or through the purchase of fossil-fuel based electricity. As a result, Barrick is impacted by current and emerging policies and regulations relating to GHG emission levels, energy efficiency and reporting of climate-change related risks. While some of the costs associated with reducing emissions may be offset by increased energy efficiency and technological innovation, the current regulatory trend may result in additional transition costs at some of Barrick’s operations and projects. For example, policy and regulatory risks related to actual and proposed changes in climate and water-related laws, regulations and taxes developed to facilitate and regulate the transition to a low-carbon economy may result in increased costs for the Company’s operations and projects. These may include increased energy, equipment, environmental monitoring and reporting and other costs to comply with such regulations. The timeframe within which these transition risks may materialize for Barrick will vary and is, in part, dependent on how quickly the global transition to a low-carbon economy occurs. In addition, the
- 120 -
physical risks of climate change may also have an adverse effect at some of Barrick’s operations and projects. These may include increased incidence of extreme weather events, resource shortages, changes in rainfall and storm patterns and intensities, water shortages, excess water flows, changing sea levels and changing temperatures. Associated with these physical risks is an increasing risk of climate-related litigation (including class actions) and the associated costs.
Certain stakeholders are seeking enhanced disclosure on the material risks, opportunities, financial impacts and governance processes related to climate change. Negative publicity or climate-related litigation could have an adverse effect on Barrick’s reputation or financial condition. In addition, a failure or perceived failure to meet climate strategy commitments, Barrick’s Scope 1, 2 and 3 emissions reduction targets, and/or societal or investor expectations, including in respect of achieving or accurately reporting on such commitments and targets, could also result in damage to the Company’s reputation, decreased investor confidence and challenges in maintaining strong community relations. These impacts can pose additional obstacles to Barrick’s ability to conduct its operations and develop its projects, which may result in a material adverse impact on its business, financial position, results of operations and future growth prospects. Barrick’s ability to achieve its climate commitments and targets is also subject to numerous risks and uncertainties and relies on, among other things, the Company’s ability to deploy capital to fund emissions reduction projects, the Company’s ability to implement operational changes and the availability of technology necessary to efficiently and effectively achieve expected emissions reductions. In addition, the Company’s ability to achieve its Scope 3 emissions targets is subject to the actions of entities not within Barrick’s direct control. There is also a risk that some or all of the expected benefits of achieving such commitments and targets may fail to materialize within the Company’s anticipated time periods or at all.
Water supply, management and availability challenges could impact operations
The Company acknowledges the right to clean, safe water and recognizes that access to a reliable water supply is critical to the hygiene, livelihood and environmental health of Barrick’s host communities. A failure to meet the Company’s water targets and/or societal or investor expectations could result in damage to the Company’s reputation, decreased investor confidence and challenges in maintaining strong community relations, as well as legal action, including injunctions and fees.
Water is a critical input to Barrick’s mining operations, and the increasing pressure on water resources around the globe requires the Company to consider current and future conditions in its management of water resources. The Company has operations and projects in regions where water stress is an inherent risk and rainfall can vary greatly from year to year. Barrick defines water stress as both water scarcity and excess water. Barrick’s operations face challenges related to limited supply, increased demand, increased severity of weather events, including changes in temperatures that alter downstream flow and water availability, and impacted water in various forms. These changes to water flow and availability, and the resulting environmental and social consequences, can result in operational difficulties and careful management is required to address these potential water-related stresses and issues. Current and long-term risks include those that arise as a result of Barrick’s operations (e.g., the use of cyanide in process solution and risk of Acid Rock Drainage Metal Leaching) and events that are out of the Company’s control, such as extreme weather and other physical risks associated with climate change including changes in rainfall and water availability (see “Risk Factors – Climate change risks”).
Water shortages as a result of environmental and climate events that are out of the Company’s control and ability to manage (for example, inadequate rainfall or the occurrence of drought) may stop operations, which could impact production. Conversely, as discussed above, excessive rainfall or flooding may also result in operational difficulties, including geotechnical instability (see “Risk Factors – Geotechnical challenges could impact profitability”), increased dewatering demands, and additional water management requirements.
- 121 -
The Company cannot predict the potential outcome of pending or future permit applications, legal proceedings or negotiations related to water rights, claims, contracts and uses, which may impact Barrick’s operations or projects. The loss of water rights for any of Barrick’s operations or projects, in whole or in part, including through the non-renewal or non-issuance of water permits, or shortages of water to which Barrick has established rights, could impact existing operations or prevent future exploration. In addition, laws and regulations may be introduced in the jurisdictions in which the Company operates which could limit Barrick’s access to sufficient water resources (see “Risk Factors – Government regulation and changes in legislation”). All of these events could result in increased costs or disruptions that may impact Barrick’s production, which in turn could adversely affect the Company’s results of operations and financial position.
Title to properties
The validity of mining claims, which constitute most of Barrick’s property holdings, can be uncertain, may be contested, and title insurance is not available. Each sovereign state or local government is generally the sole authority able to grant mineral rights. The ability to ensure that Barrick has obtained secure title to mineral properties or mining concessions may be severely constrained. Although Barrick has attempted to acquire satisfactory title to its properties, these properties may be subject to prior unregistered agreements, transfers or claims, including claims made by Indigenous communities and other title holders, and title may be affected by, among other things, undetected defects (particularly title to undeveloped properties). Any disputes about Barrick’s property holdings or title may have a material adverse impact on Barrick’s cash flows, earnings, results of operations and financial position.
Mining risks and insurance risks
The mining industry is subject to significant risks and hazards, including environmental hazards, industrial accidents, catastrophic equipment failures, unusual or unexpected geological conditions, labor force disruptions, civil strife, unavailability of materials and equipment, weather conditions, pit wall failures, tailings dam failures, rock bursts, cave-ins, flooding, seismic activity and water conditions, most of which are beyond Barrick’s control. Barrick is also exposed to theft, loss, attachment or confiscation of gold bullion, copper cathode or gold/copper concentrate. These risks and hazards could result in: damage to, or destruction of, mineral properties or producing facilities; personal injury or death; environmental damage; delays in mining; and monetary losses and possible legal liability. As a result, production may fall below historic or estimated levels and Barrick may incur significant costs or experience significant delays that could have a material adverse effect on Barrick’s financial performance, liquidity and results of operations.
Barrick maintains insurance to cover some of these risks and hazards. The insurance is maintained in amounts that are believed to be reasonable depending on the circumstances surrounding the identified risk. No assurance can be given that such insurance will continue to be available, or that it will be available at economically feasible premiums, or that Barrick will obtain or maintain such insurance. Barrick’s property, liability and other insurance may not provide sufficient coverage for losses related to these or other risks or hazards. In addition, Barrick does not have coverage for certain environmental losses and other risks, as such coverage may not be available at all or at a commercially reasonable cost. The lack or insufficiency of insurance coverage could adversely affect Barrick’s cash flow and overall profitability.
Security and human rights
Barrick’s and/or its affiliates’ operations and development and exploration activities extend to jurisdictions which may be considered to have an increased degree of security risk, and related human rights risk. Such security risks include, for example, criminal, insurgent and separatist action, and political activity. For example, Mali continues to experience a number of security-related challenges, including attacks by insurgent militants and there has also been a significant rise in terrorist activity and regional
- 122 -
conflict within and in the vicinity of Pakistan’s Balochistan province. In addition, the DRC has experienced instability in certain provinces in the vicinity of the Kibali mine caused by militia groups, while Tanzania recently experienced post-election unrest that resulted in restricted movement and short-term curfews. The impacts of these and similar risks in other jurisdictions could impede the exploration, development and operation of Barrick’s mines and projects, as well as the supply chains necessary to deliver inputs, in these and other high risk countries.
In addition, civil disturbances and criminal activities, such as trespass, illegal mining, sabotage, theft and vandalism, have caused disruptions at some of Barrick’s operations, including the Porgera mine in Papua New Guinea operated by BNL, the Pueblo Viejo mine in the Dominican Republic, the Pierina mine (now in closure) in Peru, the Kibali mine in the DRC, and certain of Barrick’s operations in Tanzania, occasionally resulting in the suspension of operations. For example, the North Mara mine in Tanzania has been the subject of repeated armed incursions over the years, often by large numbers of trespassers intent on stealing or damaging valuable assets and property. Affected sites have taken certain measures to protect their employees, property and production facilities from these risks. These measures include the retention and recruitment of security personnel and the installation of perimeter fencing, walls and cameras in sensitive areas.
Several sites have entered into arrangements with public security in relation to the protection of health, safety and security at or in the areas surrounding their minesite. Incidents of criminal activity, trespass, illegal mining, theft and vandalism have occasionally led to conflict with security personnel and/or police, which in some cases resulted in injuries and/or fatalities. The measures that have been implemented by the Company cannot guarantee that such incidents will not continue to occur and such incidents may halt or delay production, increase operating costs, result in harm to employees or trespassers, decrease operational efficiency, increase community tensions, negatively impact Barrick’s reputation or result in criminal and/or civil liability for the Company or its employees and/or financial damages or penalties.
The manner in which the Company’s personnel respond to civil disturbances and criminal activities can give rise to additional risks in circumstances where those responses are not conducted in a manner that is consistent with international standards relating to the use of force and respect for human rights (see “Narrative Description of the Business – Sustainability – Respecting Human Rights”). Barrick has implemented a number of measures and safeguards which are designed to assist its personnel, security contractors and others in understanding and upholding these standards. The implementation of these measures will not guarantee that the Company’s personnel or public security forces will uphold these standards in every instance. The failure to conduct security operations in accordance with these standards can result in harm to employees or community members, increased community tensions, reputational harm to Barrick and its partners or result in litigation, criminal and/or civil liability for the Company or its employees and/or financial damages or penalties.
Illegal mining, which involves trespass onto mine sites, is both a security and safety issue at the Porgera, Kibali, Loulo-Gounkoto and North Mara mines, among others. From time to time, illegal miners have clashed with mine security staff and law enforcement personnel who have attempted to prevent their incursions and/or move them away from the facilities and off of mine sites. The presence of illegal miners, given the nature of the mines’ operations, creates a safety issue for the illegal miners as well as employees of Barrick or its affiliates and can cause disruptions to mine operations.
It is not possible to determine with certainty the future costs that Barrick or its affiliates may incur in dealing with the issues described above at its operations and projects. However, if the number of incidents increases, costs associated with security, in the case of civil disturbances and illegal mining, may also increase, affecting profitability.
- 123 -
Community relations and license to operate
The Company’s relationships with the communities in which it operates are critical to the continued success of its existing operations and the construction and development of its projects. There is an ongoing and potentially increasing public concern relating to the perceived effect of mining activities on the environment and on communities impacted by such activities. Certain non-governmental organizations (“NGOs”) and activists, some of which oppose globalization and resource development, are often vocal critics of the mining industry and its practices (including the use of cyanide and other hazardous substances in processing activities) and initiatives involving the communities such as land acquisitions and resettlements. Adverse publicity generated by such NGOs, activists or others, including through the use of social media, related to extractive industries generally, or Barrick’s operations specifically, could have an adverse effect on the Company’s reputation or financial condition and may impact its relationship with the communities in which it operates. While Barrick is committed to operating in a socially responsible and transparent manner, there is no guarantee that the Company’s efforts in this respect will mitigate this potential risk.
Barrick’s ability to successfully obtain key permits and approvals to explore for, develop and operate mines and to successfully operate in communities around the world will likely depend on Barrick’s ability to develop, operate and close mines in a manner that is consistent with the creation of social and economic benefits in the surrounding communities, which may or may not be required by law. Mining operations should be designed to minimize the negative impact on such communities and the environment, for example, by modifying mining plans and operations or by relocating those affected to an agreed location. The cost of these measures could increase capital and operating costs and therefore could have an adverse impact upon Barrick’s financial condition and operations. Barrick seeks to promote improvements in health and safety, human rights, environmental performance and community relations. However, Barrick’s ability to operate could be adversely impacted by accidents or events detrimental (or perceived to be detrimental) to the health, safety and well-being of Barrick’s employees, human rights, the environment or the communities in which Barrick operates.
Reputational risk
As a result of the increased usage and the speed and global reach of social media and other web-based tools used to generate, publish and discuss user-generated content and to connect with other users, companies such as Barrick are today at much greater risk of losing control over how they are perceived in the marketplace. Damage to Barrick’s reputation can be the result of the actual or perceived occurrence of any number of events, and could include any negative publicity (for example, with respect to Barrick’s handling of environmental matters or the Company’s dealings with community groups), whether true or not. Barrick places a great emphasis on protecting its image and reputation, but the Company does not ultimately have direct control over how it is perceived by others. Reputation loss may lead to increased challenges in developing and maintaining host government as well as community relations, decreased investor confidence and an impediment to Barrick’s overall ability to advance its projects, thereby having a material adverse impact on financial performance, cash flows and growth prospects.
U.S. Foreign Corrupt Practices Act and similar worldwide anti-bribery laws
The Foreign Corrupt Practices Act (United States) and the Corruption of Foreign Public Officials Act (Canada) and anti-bribery laws in other jurisdictions generally prohibit companies and their intermediaries from making improper payments for the purpose of obtaining or retaining business or other commercial advantage. Barrick’s policies mandate compliance with applicable anti-bribery laws, which often carry substantial penalties. Barrick operates in jurisdictions that have experienced governmental and private sector corruption to some degree and, in certain circumstances, strict compliance with anti-bribery laws may conflict with certain local customs and practices. There can be no assurance that Barrick’s internal control policies and procedures will always protect it from reckless or other inappropriate acts committed
- 124 -
by the Company’s affiliates, employees, agents, partners or companies acquired by or merged with Barrick. Violations of these laws, or allegations of such violations, could have a material adverse effect on Barrick’s reputation, as well as business, financial position and results of operations and could cause the market value of Barrick’s common shares to decline. Investigations by governmental authorities could also have a material adverse effect on the business, consolidated results of operations, and consolidated financial condition of Barrick.
Litigation
Barrick is currently subject to litigation and may be involved in disputes with other parties in the future which may result in litigation. The results of litigation cannot be predicted with certainty. The costs of defending or settling such litigation can be significant. If Barrick is unable to resolve these disputes favorably, it may have a material adverse impact on Barrick’s financial performance, cash flow and results of operations. See “Legal Matters – Legal Proceedings and Regulatory Actions”.
Geotechnical challenges could impact profitability
Barrick and the mining industry are facing continued geotechnical challenges associated with the aging of certain mines and the need to mine deeper pits and more complex deposits. This leads to higher pit walls, more complex underground operations and increased exposure to geotechnical instability. As Barrick’s operations mature, the open pit and underground operations at certain sites are getting deeper. Barrick has experienced geotechnical failures at some open pit operations and seismic events at some underground operations. Seismic events may also affect mining operations in other ways. For example, on February 26, 2018, a 7.5 magnitude earthquake struck Papua New Guinea, causing significant damage to the Hides natural gas power plant that supplies electricity to the Porgera mine. In addition, in the first quarter of 2024, Barrick experienced a pit wall failure at Gold Quarry at Nevada Gold Mines, resulting in lower tonnes mined and a slower mining rate at the Gold Quarry pit and South Arturo in 2024. A redesign of the open pit was required to address geotechnical issues. No assurances can be given that unanticipated adverse geotechnical conditions, such as pit wall failures, underground cave-ins and other ground-related instability, will not occur in the future or that such events will be detected in advance. Geotechnical instabilities can be difficult to predict and are often affected by risks beyond Barrick’s control, such as severe weather, higher than average rainfall and seismic events. In addition, Barrick has numerous operational and closed TSFs and heap leach facilities in a variety of climatic and topographic settings. As of December 31, 2025, Barrick manages 60 TSFs, of which 19 are operating and 41 are closed. In addition, a riverine tailings disposal system is used at the Porgera mine in Papua New Guinea. The failure of tailings storage facilities, and other impoundments at Barrick’s minesites, could cause severe and potentially catastrophic damage to property, the environment, persons and Barrick’s reputation. For example, in early 2019, the extractive industry experienced a large-scale tailings dam failure at an unaffiliated mine, which resulted in numerous fatalities and caused extensive property, environmental and reputational damage. The Company regularly reviews and inspects all Barrick-owned or controlled TSFs for compliance with applicable legal requirements and global best practices(see “Narrative Description of the Business – Sustainability – Health & Safety”). Despite such efforts, there can be no assurance that these events will not occur in the future. Geotechnical, TSF or heap leach facility failures can result in limited access to minesites, suspension of operations, production delays, government investigations, civil and criminal liability, increased costs, as well as injuries and deaths in the most extreme cases. All of these could adversely impact Barrick’s results of operations and financial position.
Joint ventures
Barrick holds an indirect interest in a number of joint ventures and properties, including Nevada Gold Mines in Nevada (61.5%), the Veladero mine in Argentina (50%), the Zaldívar copper mine in Chile (50%), the Pueblo Viejo mine in the Dominican Republic (60%), the Porgera mine in Papua New Guinea (24.5%), the Tanzanian mines (84%), the Jabal Sayid copper mine in Saudi Arabia (50%), the Kibali mine
- 125 -
in the DRC (45%), the Loulo-Gounkoto Complex in Mali (80%), the Norte Abierto project in Chile (50%), and the Reko Diq project in Pakistan (50%), the remaining interests in which are held by third parties, including states or state-affiliated entities. See also “Proposed North America Initial Public Offering”. Barrick’s interests in these properties are subject to the risks customarily associated with the conduct of joint ventures, including: (i) disagreement with joint venture partners on how to develop and operate the mine efficiently or, in the case of exploration projects, on the exploration plan and related expenditures; (ii) inability to exert influence over certain strategic decisions; (iii) inability of joint venture partners to meet their obligations; and (iv) litigation regarding joint venture matters. For example, in February 2026, Newmont sent Barrick a notice of default under the Nevada Gold Mines joint venture agreement relating to an alleged misuse of assets as well as operational and accounting issues. While Barrick disputes these allegations and is seeking to work cooperatively with Newmont to address their concerns, if the parties are unable to reach a resolution there is a risk this matter could escalate to litigation. Each of these risks could have a material adverse impact on Barrick’s profitability or the viability of its interests held through joint ventures, which could have a material adverse impact on Barrick’s future cash flows, earnings, results of operations and financial condition. In addition, Barrick is not always the operator of its joint venture projects. To the extent Barrick is not the operator, the success of any operations will be dependent on third party operators and Barrick may be unable to have any significant influence on the direction or control of the activities of the operators. Barrick will be subject to the decisions made by the operators of the joint venture properties and will rely on the operators for accurate information about the properties.
Availability and increased cost of critical parts, equipment and skilled labor
An increase in worldwide demand for critical resources such as input commodities, drilling equipment, tires and skilled labor may cause unanticipated cost increases and delays in delivery times, thereby impacting the Company’s operating costs, capital expenditures and construction and production schedules.
The Company may be affected by global supply chain disruptions
Prolonged disruptions to the procurement of equipment, or the flow of materials, supplies and services to Barrick could have an adverse impact on its operating costs, capital expenditures and construction and production schedules. These disruptions may be the result of macroeconomic matters outside of the Company’s control or ability to mitigate, such as from natural disasters, transportation disruptions, economic instability, global pandemics, international sanctions, including those imposed on certain Russian individuals or entities, and geopolitical concerns, such as the conflicts in the Middle East, the ongoing conflict in Ukraine, and uncertainty related to Venezuela, among others. Supply chain impacts may also manifest as rising costs or shortages of certain commodities and labor. See also “Availability and increased cost of critical parts, equipment and skilled labor” and “Diseases and epidemics may adversely impact Barrick’s business”.
Price volatility and availability of other commodities
The profitability of Barrick’s business is affected by the cost and availability of commodities and critical parts and equipment which are consumed or otherwise used in connection with Barrick’s operations and projects, including, but not limited to, diesel fuel, natural gas, electricity, acid, steel, concrete and cyanide. Prices of such commodities can be subject to volatility, which can be material and can occur over short periods of time, and are affected by factors that are beyond Barrick’s control. An increase in the cost, or decrease in the availability, of construction materials such as steel and concrete may affect the timing and cost of Barrick’s projects. If Barrick’s proceeds from the sale of by-products were to decrease significantly, or the costs of certain commodities consumed or otherwise used in connection with Barrick’s operations and projects were to increase, or their availability to decrease, significantly, and remain at such levels for a substantial period of time, Barrick may determine that it is not economically feasible to continue commercial production at some or all of Barrick’s operations, or the
- 126 -
development of some or all of Barrick’s current projects, which could have an adverse impact on Barrick as described under “Metal price volatility” above.
Artisanal and illegal mining
Artisanal and illegal miners are active on, or adjacent to, many of Barrick’s properties in emerging market jurisdictions, including the Company’s African and Asia Pacific minesites, such as North Mara and Bulyanhulu, Kibali, Loulo-Gounkoto and Porgera. At some of these sites, engagement with local and/or national authorities may be required in order to peacefully clear illegal miners. Artisanal and illegal mining may, but not always, involve trespass into the development or operating area of an existing mine. The methods used to extract minerals by artisanal and illegal miners may also be against the social and environmental laws of the relevant jurisdiction or otherwise be detrimental to the environment.
Artisanal and illegal mining is associated with a number of negative impacts which present risk to humans and property, including environmental degradation, human rights abuse, child labor, forced labor, personal injury or death, security concerns, destruction of property and funding of conflict. The presence of artisanal and illegal miners can also lead to disputes and delays related to project development or operation of commercial gold deposits, and potentially lost gold production as a result of delays or theft. Additionally, effective local government administration is often lacking in the locations where artisanal and illegal miners operate where rapid population growth and the lack of functioning structures can create a complex social and unstable environment. The presence of artisanal and illegal miners could cause damage to Barrick’s properties or result in use of force or injury which may result in legal action directed against Barrick or its subsidiaries.
Barrick does not purchase any gold from artisanal or illegal miners. There is a misconception that artisanally-mined gold is channeled through large-scale mining operators, even though artisanal and illegal miners typically rely on their own supply chains distinct from those utilized by large-scale miners like Barrick. Such misconceptions may have a negative impact on the reputation of the mining industry.
Infrastructure
Barrick’s mining, processing, development and exploration activities depend on adequate infrastructure. Reliable power sources, water supply, roads and other infrastructure are important for Barrick’s operations and development projects. Water shortages, power outages, sabotage, community, government or other interference in the maintenance or provision of such infrastructure could adversely affect Barrick’s business, financial condition and results of operations. For example, frequent power outages in Zambia due to infrastructure limitations have the potential to adversely impact the operations at Lumwana and the Super Pit Expansion Project.
Information Technology Systems
Barrick depends upon information technology systems, which refers to the computer systems, hardware, software, and networks of the Company and of its third party vendors and service providers, to conduct its operations. For example, the Company continues to incorporate more advanced technology into its operations, including autonomous haulage and automated process controls. Adoption of new and emerging digital technologies, including the use of artificial intelligence (“AI”) systems, may result in savings or efficiency improvements, but may also expose the Company’s information technology systems to risk. Barrick could be adversely affected by disruptions of such systems caused by a variety of sources, including, without limitation, cybersecurity incidents - including those caused by computer viruses, malware, ransomware and other cyber-attacks (including those that exploit zero-day vulnerabilities) - as well as natural disasters and defects in design. Any of these or other events could result in information technology system failures, delays and/or increases in capital expenditures. Barrick’s operations also depend on the regular maintenance, upgrade and replacement of equipment and information technology systems, as well as pre-emptive expenses to mitigate the risk of failure. There can be no assurance that Barrick will not incur losses related to cybersecurity incidents, other network or system disruptions, or
- 127 -
from corruption and manipulation of data in the future, including as a result of legal action directed at the Company in relation to a cybersecurity incident. As the nature and methods of cybersecurity incidents continue to evolve and increase in sophistication, including as a result of the rapid development and use of AI systems, the Company may be required to expend additional resources to continue to modify or enhance protective measures, or to investigate and remediate issues, related to cybersecurity incidents and other information technology system vulnerabilities. Such efforts may require continuous monitoring and reliance on third party vendors and service providers (including information technology service providers), and are not guaranteed to be successful in preventing or mitigating the potential impacts of cybersecurity incidents. In addition, such service providers may themselves be victims of cybersecurity incidents and breaches. Barrick and its third party vendors and service providers have experienced, and Barrick believes may experience in the future, cybersecurity incidents and cybersecurity breaches. Given the unpredictability of the timing, nature and scope of disruptions to information technology systems, Barrick could potentially be subject to production downtimes, operational delays, cybersecurity incidents, the compromising of confidential or otherwise protected information, reputational impacts, legal liability, or destruction or corruption of data, any of which could have a material adverse effect on the Company’s cash flows, competitive position, financial condition or results of operations, as well as on the Company’s ability to continue to operate its health and safety-related systems.
From time to time, Barrick pursues investments and initiatives to improve the productivity and efficiency of existing systems and operations, including through investments in digital technologies. There can be no certainty that some or any of such investments and initiatives will meet the Company’s capital allocation objectives. In addition, certain of such investments and initiatives are still in the early stages of evaluation, and additional engineering and other analysis is required to fully assess their impact. Further, there can be no certainty as to the time required for Barrick to extract value from these investments or initiatives, or that Barrick will achieve any anticipated savings or efficiency improvements.
Global financial conditions
Following the onset of the credit crisis in 2008, global financial conditions were characterized by extreme volatility and several major financial institutions either went into bankruptcy or were rescued by governmental authorities. While global financial conditions subsequently stabilized, there remains considerable risk in the system given the extraordinary measures adopted by government authorities to achieve that stability. Global financial conditions could suddenly and rapidly destabilize in response to future economic shocks, as government authorities may have limited resources to respond to future crises. Future economic shocks may be precipitated by a number of causes, including a rise in the price of oil, geopolitical instability, natural disasters and outbreaks of medical endemic or pandemic issues, such as Covid-19. Any sudden or rapid destabilization of global economic conditions could impact Barrick’s ability to obtain equity or debt financing in the future on terms favorable to Barrick. Additionally, any such occurrence could cause decreases in asset values that are deemed to be other than temporary, which may result in impairment losses. Further, in such an event, Barrick’s operations and financial condition could be adversely impacted.
Inflation
General inflationary pressures may also affect Barrick’s labor, commodity and other input costs, which could have a materially adverse effect on Barrick’s financial condition, results of operations and capital expenditures for the development of its projects. Over the course of 2025, global inflationary pressures eased and benchmark interest rates were cut, while the global economic outlook remained uncertain and geopolitical conflicts persisted. Global energy costs have also increased amidst ongoing uncertainty in Venezuela. Country-specific political and economic factors in Argentina have also resulted in a hyperinflationary environment in that country. The Company has been impacted by these inflationary pressures in the form of higher costs for key inputs required for its operations, most notably higher energy costs. The Company has made assumptions around the expected costs of these key inputs, and Barrick’s actual costs in an inflationary environment may differ materially from those assumptions. These
- 128 -
inflationary impacts may be felt directly through purchases of diesel and natural gas, as well as through higher transportation costs, and indirectly through higher costs of products which rely on energy as an input cost. In particular, costs incurred at Barrick’s Veladero mine and projects in Argentina are at higher risk for inflationary pressures due to country-specific political and economic factors. See “Metal price volatility”, “Projects”, “Price volatility and availability of other commodities”, “Production and cost estimates” and “Availability and increased cost of critical parts, equipment and skilled labor”.
Potential impact of tariffs on the Company’s business
Barrick’s business operations are subject to risks associated with international trade policies. The U.S. Government has implemented comprehensive tariffs on imports from various countries around the world, which could affect Barrick’s business. Changes to these and other tariffs, which can be announced with little to no advance notice, adversely affect the Company’s business planning and may lead to increased costs for raw materials, components and equipment, and could impact existing operations and material growth projects. See “Projects”.
Liquidity and level of indebtedness
As of December 31, 2025, Barrick had cash and cash equivalents of approximately $6.7 billion and capital leases and total debt of approximately $4.7 billion. Although Barrick has been successful in repaying debt in the past and issuing new debt securities in capital markets transactions, there can be no assurance that it can continue to do so. In addition, Barrick may assume additional debt in future periods or reduce its holdings of cash and cash equivalents in connection with funding future acquisitions, existing operations, capital expenditures, dividends or in pursuing other business opportunities. Barrick’s level of indebtedness could have important consequences for its operations, including:
| • | Barrick may need to use a large portion of its cash flow to repay principal and pay interest on its debt, which will reduce the amount of funds available to finance its operations and other business activities; and |
| • | Barrick’s debt level may limit its ability to pursue other business opportunities, borrow money for operations or capital expenditures in the future or implement its business strategy. |
As of December 31, 2025, Barrick had approximately $47 million in debt maturing by the end of 2026. This amount excludes $9 million in capital lease payments expected in 2026. Currently, the Company’s undrawn $3.0 billion revolving credit facility terminates in May 2030.
In addition to future cash flow from operations, potential divestment and the creation of new joint ventures and partnerships, Barrick’s other potential sources of liquidity for the payment of its expenses and principal and interest payable on its debt in 2026 include issuing additional equity or unsecured debt and borrowing under the Company’s $3.0 billion revolving credit facility (subject to compliance with covenants and the making of certain representations and warranties). The key financial covenant in Barrick’s $3.0 billion revolving credit facility requires Barrick to maintain a net debt to total capitalization ratio that does not exceed 0.60:1 (as of December 31, 2025, this ratio was approximately (0.06):1). Barrick’s ability to reduce its indebtedness and meet its payment obligations will depend on its future financial performance, which will be impacted by financial, business, economic and other factors. Barrick will not be able to control many of these factors, such as economic conditions in the markets in which it operates. Barrick cannot be certain that its existing capital resources and future cash flow from operations will be sufficient to allow it to pay principal and interest on Barrick’s debt and meet its other obligations. If these amounts are insufficient or if there is a contravention of its debt covenants, Barrick may be required to refinance all or part of its existing debt, sell assets, borrow more money or issue additional equity. The ability of Barrick to access the bank, public debt or equity capital markets on an efficient basis may be constrained by a dislocation in the credit markets and/or capital and/or liquidity constraints in the banking, debt and/or equity markets at the time of issuance. See “Global financial conditions”. If Barrick is unable
- 129 -
to maintain its indebtedness and financial ratios at levels acceptable to its credit rating agencies, or should Barrick’s business prospects deteriorate, the ratings currently assigned to Barrick by Moody’s Investor Services, Standard & Poor’s Ratings Services or DBRS Morningstar could be downgraded, which could adversely affect the value of Barrick’s outstanding securities and existing debt and its ability to obtain new financing on favorable terms, and increase Barrick’s borrowing costs.
Barrick is also exposed to liquidity and various counterparty risks including, but not limited to: (i) Barrick’s lenders and other banking counterparties; (ii) Barrick’s insurance providers; (iii) financial institutions that hold Barrick’s cash; (iv) companies that have payables to Barrick, including concentrate customers and financial institutions; and (v) companies that have received deposits from Barrick for the future delivery of equipment.
Market price of Barrick’s shares
Securities of mining companies have experienced volatility in the past, at times unrelated to the financial performance or prospects of the companies involved. These factors include macroeconomic developments in North America and internationally, currency fluctuations and market perceptions of the attractiveness of particular industries. The price of Barrick’s common shares is also likely to be affected by short-term changes in gold and copper prices. As a result of these changes, the market price of Barrick’s common shares at any given point in time may not accurately reflect Barrick’s long-term value. Securities class action litigation is also prevalent and is often brought against companies following periods of volatility in the market price of their securities. In addition to current ongoing litigation, such as the securities class actions related to Barrick’s El Alto-Lama project (see “Legal Proceedings and Regulatory Actions - Proposed Canadian Securities Class Actions (Pascua-Lama)”), Barrick may in the future be the target of similar litigation which could result in substantial defense costs and divert management’s attention and resources.
Exchange and capital controls
Several of the emerging market countries in which the Company operates or has interests have adopted measures to restrict the availability of the local currency, the conversion of local currency into hard currency or the repatriation of capital across borders. These measures are sometimes imposed by governments and/or central banks during times of local economic instability to prevent the removal of capital or the sudden devaluation of local currencies or to maintain in-country foreign currency reserves. In addition, many emerging markets require supplementary consents or reporting processes before local currency earnings can be converted into U.S. dollars or other currencies and/or such earnings can be repatriated or otherwise transferred outside of the operating jurisdiction. Furthermore, some jurisdictions regulate the amount or proportion of earnings that can be repatriated or otherwise transferred outside of the operating jurisdiction or that can be maintained by operating entities in off-shore bank accounts or in U.S. dollar or other currency accounts and require additional earnings to be held by banks located in the country of operation and/or in local currency.
These measures can have a number of negative effects on the Company’s operations. For example, exchange and capital controls reduce the quantum of immediately available capital that the Company could otherwise deploy for investment opportunities or the payment of expenses. As a result, the Company may be required to use other sources of funds for these objectives which may result in increased financing costs. In addition, measures that restrict the availability of the local currency or impose a requirement to operate in the local currency may create practical difficulties for the Company. For example, the cash and cash equivalents held at Kibali and Veladero are subject to various steps before they can be used to repay external debt, including shareholders loans. Non-compliance with a country’s exchange and capital controls rules can also lead to civil or criminal prosecution, the imposition of significant penalties or imprisonment.
- 130 -
Currency fluctuations
Currency fluctuations may affect the costs Barrick incurs at its operations and may also affect the value of Barrick’s assets and liabilities denominated in a foreign currency. As a result, currency fluctuations may affect Barrick’s operating results and cash flows. Gold and copper are each sold throughout the world based principally on the U.S. dollar price, but a portion of Barrick’s operating expenses are incurred in local currencies, such as the Australian dollar, Canadian dollar, Chilean peso, Argentine peso, Dominican peso, Peruvian sol, Pakistani rupee, Papua New Guinea kina, Tanzanian shilling, Zambian kwacha, West African CFA franc and the Congolese franc. Likewise, certain of Barrick’s assets and liabilities are denominated in these same local currencies, such as VAT receivable balances. Appreciation of certain non-U.S. dollar currencies against the U.S. dollar would increase the costs of production at Barrick’s mines, making such mines less profitable. Conversely, depreciation of these local currencies against the U.S. dollar would reduce the value of these local-currency denominated assets and liabilities in U.S. dollar terms. From time to time, Barrick enters into currency hedging contracts to mitigate the impact on operating costs of the appreciation of certain non-U.S. dollar currencies against the U.S. dollar. Barrick may incur an opportunity loss if the U.S. dollar appreciates in value relative to non-U.S. dollar currencies. As of December 31, 2025, Barrick had no foreign currency derivative contracts beyond spot requirements. There can be no assurance that Barrick will enter into foreign currency hedging activities in the future. See “Use of derivatives”.
Interest rates
A significant, prolonged decrease in interest rates could have a material adverse impact on the interest earned on Barrick’s cash balances ($6.7 billion at December 31, 2025). The Company’s interest rate exposure mainly relates to the carrying value of certain long lived assets and liabilities and to the interest payments on its variable-rate debt ($0.05 billion at December 31, 2025). There can be no assurance that Barrick will engage in any hedging activities in the future. See “Use of derivatives”.
Use of derivatives
From time to time, Barrick may use certain derivative products to manage the risks associated with gold, copper and silver price volatility, changes in other commodity input prices, interest rates, foreign currency exchange rates and energy prices. For example, during the third quarter of 2025, Barrick entered into 25,000 ounces of zero cost gold collars maturing every month between September 2025 and August 2028 for a total of 900,000 ounces. These contracts are designated as cash flow hedges and contain purchased put and sold call options with set strike prices. There were 800,000 ounces of contracts remaining as of the end of December 2025. For more information see “Marketing and Distribution - Gold”. The use of derivative instruments involves certain inherent risks including: (i) credit risk – the risk that the creditworthiness of a counterparty may adversely affect its ability to perform its payment and other obligations under its agreement with Barrick or adversely affect the financial and other terms the counterparty is able to offer Barrick; (ii) market liquidity risk – the risk that Barrick has entered into a derivative position that cannot be closed out quickly, by either liquidating such derivative instrument or by establishing an offsetting position; and (iii) unrealized mark-to-market risk – the risk that, in respect of certain derivative products, an adverse change in market prices for commodities, currencies or interest rates will result in Barrick incurring an unrealized mark-to-market loss in respect of such derivative products. In addition, the cost to close out an established derivative position prior to maturity may be significant.
For a summary of the derivative instruments used in the Company’s currency, interest rate and commodity hedge programs, see Note 25 to the Consolidated Financial Statements. See also “Global financial conditions”.
- 131 -
Barrick’s management team may not be successful in implementing its business strategy
There can be no assurance that Barrick’s management team will be successful in implementing its strategy (including as set out in this Annual Information Form) or that past results will be reproduced going forward. The management team may experience difficulties in effecting key strategic goals such as the growth and investment in Tier One Assets, Tier Two Assets and Strategic Assets, the sale of non-core assets or the development of exploration projects. The performance of Barrick’s operations could be adversely affected if Barrick’s management team cannot implement the stated business strategy effectively.
Acquisitions and integration
From time to time, Barrick examines opportunities to acquire additional mining assets and businesses. Any acquisition that Barrick may choose to complete may be of a significant size, may change the scale of Barrick’s business and operations, and may expose Barrick to new or greater geographic, political, operating, financial, legal and geological risks. Barrick’s success in its acquisition activities depends on its ability to identify suitable acquisition candidates, negotiate acceptable terms for any such acquisition and integrate the acquired operations successfully with those of Barrick. Any acquisitions and any potential acquisitions would be accompanied by risks. For example, there may be a significant change in commodity prices after Barrick has committed to complete the transaction and established the purchase price or exchange ratio; a material ore body may prove to be below expectations; Barrick may have difficulty integrating and assimilating the operations and personnel of any acquired companies (which may be compounded by geographical separation, unanticipated costs, and the loss of key employees), realizing anticipated synergies and maximizing the financial and strategic position of the combined enterprise, and maintaining uniform standards, policies and controls across the organization; the integration of the acquired business or assets may divert the attention of management or disrupt Barrick’s ongoing business and its relationships with employees, customers, suppliers and contractors; and the acquired business or assets may have unknown liabilities which may be significant.
In the event that Barrick chooses to raise debt capital to finance any such acquisition, Barrick’s leverage will be increased. If Barrick chooses to use equity as consideration for any such acquisition, existing shareholders may suffer dilution. In addition, many companies in the mining industry have recently seen substantial downward pressure on their equity values after announcing significant acquisitions. There is a risk that if Barrick was to announce a significant acquisition, the value of Barrick’s common shares could decrease over the short-, medium- and/or long-term. Barrick cannot assure that it can complete any acquisition or business arrangement that it pursues, or is pursuing, on favorable terms, or that any acquisitions or business arrangements completed will ultimately benefit Barrick’s business. There can be no assurance that Barrick would be successful in overcoming the risks noted above or any other problems encountered in connection with such acquisitions.
Divestitures
Barrick has recently sold or reduced its interest in certain assets and may continue to do so in the future. For example, see “General Development of the Business - Strategy - Operational Excellence and Sustainable Profitability”. In connection with these dispositions, Barrick has given (and may in the future give) representations and warranties and indemnities customary for transactions of this type and may have also, in certain cases, agreed (or may in the future agree) to retain responsibility for certain liabilities related to the period prior to the sale. As a result, Barrick may incur liability in the future associated with assets it no longer owns or in which it has a reduced interest. In addition, companies in the mining industry have seen substantial downward pressure on their equity values after announcing a significant divestment. There is a risk that if Barrick was to announce a significant divestment, the value of Barrick’s common shares could decrease in the short-, medium- and/or long-term. Barrick cannot assure that it can complete any divestment that it pursues, or is pursuing, on favorable terms, or that any divestment completed will ultimately benefit Barrick’s business. There can be no assurance that Barrick would be
- 132 -
successful in overcoming the risks noted above or any other problems encountered in connection with such divestments.
Competition
Barrick competes with other mining companies and individuals for mining claims and leases on exploration properties, the acquisition of mining assets and access to water, power and other required infrastructure. This competition may increase Barrick’s cost of acquiring suitable claims, properties and assets, should they become available to Barrick. Barrick also competes with other mining companies to attract and retain key executives and employees. There can be no assurance that Barrick will continue to be able to compete successfully with its competitors in acquiring properties, assets or access to infrastructure or in attracting and retaining skilled and experienced employees.
Barrick depends on its key personnel
Barrick’s success depends significantly on the continued individual and collective contributions of its senior, regional and local management teams. The loss of the services of members of these management teams or the inability to hire and retain experienced replacement management personnel could have a material adverse effect on Barrick’s business, results of operations and financial condition. In addition, to implement and manage Barrick’s business and operating strategies effectively, Barrick must maintain a high level of efficiency and performance, continue to enhance its operational and management systems and continue to successfully attract, train, motivate and manage its employees. If Barrick is not successful in these efforts, this may have a material adverse effect on its business, results of operations and financial condition. Any departures of key personnel could also be viewed in a negative light by investors and research analysts, which could cause the price of Barrick’s shares to decline.
Employee relations
Barrick’s ability to achieve its future goals and objectives is dependent, in part, on maintaining good relations with its employees and minimizing employee turnover. Work stoppages or other industrial relations events at Barrick’s major capital projects could lead to project delays or increased costs. These risks are more acute in jurisdictions in which Barrick’s workforce is highly unionized, including in Africa and South America. A prolonged labor disruption at any of Barrick’s material properties could have a material adverse impact on its operations as a whole.
Diseases and epidemics may adversely impact Barrick’s business
The Company faces risks related to diseases and epidemics, which could significantly disrupt operations and may materially and adversely affect its operations and financial results. For example, in March 2020, a novel strain of coronavirus known as Covid-19 was declared a worldwide pandemic by the World Health Organization, and significantly impacted the global economy. While Barrick’s operations were not significantly affected, the impact of the Covid-19 pandemic included extreme volatility in financial markets and commodity prices, a slowdown in economic activity, and raised the prospect of an extended global recession. Efforts to slow the spread of any disease, epidemic or pandemic could severely impact the operation and development of Barrick’s mines and projects, including through the imposition of government-declared states of emergency and restrictive measures such as travel bans, quarantine and self-isolation. The timing and duration of such government measures when responding to pandemics is uncertain and may vary across the jurisdictions in which Barrick operates. If the operation or development of one or more Barrick mines is disrupted or suspended in the future as a result of these or other similar measures, it may have a material adverse impact on Barrick’s profitability, results of operations, financial condition and stock price.
In addition, to the extent that any disease, epidemic or pandemic adversely affects Barrick’s business and financial results, it may also have the effect of heightening many of the other risks described in this
- 133 -
Annual Information Form. For example, the Chinese market is a significant source of global demand for commodities, including copper. A sustained slowdown in China’s growth or demand, or a significant slowdown in other markets, could have an adverse effect on the price and/or demand for copper produced at Barrick’s mines. Efforts to contain diseases like Covid-19 may have a significant effect on Chinese commodity prices and demand, and potentially broader impacts on the Company’s supply chain or the global economy, which could have a material adverse effect on Barrick’s cash flows, earnings, results of operations and financial position. For example, the plant expansion and mine life extension project at Pueblo Viejo experienced logistical challenges and related delays primarily due to the impact of Covid-19 on the global supply chain.
Finally, the actual and threatened spread of any disease globally, including business and social disruptions, could adversely affect global economies and financial markets resulting in a prolonged economic downturn and volatility in the value of Barrick’s stock price. The extent to which any disease, epidemic or pandemic impacts business activity or financial results, and the duration of any such negative impact, will depend on future developments, which are highly uncertain and cannot be predicted by Barrick, including new information which may emerge concerning such disease, epidemic or pandemic, the possibility of a recurrence or waves of outbreaks, or any existing or future variants of any disease, and the actions required to contain or treat its impact, among others.
Internal control environment
Internal control over financial reporting is a process designed to provide reasonable assurance regarding the reliability of financial reporting and the preparation of financial statements for external purposes in accordance with generally accepted accounting principles. Disclosure controls and procedures are designed to ensure that information required to be disclosed by a company in reports filed with securities regulatory agencies is recorded, processed, summarized and reported on a timely basis and is accumulated and communicated to management, including its President and Chief Executive Officer and its Senior Executive Vice President, Chief Financial Officer, as appropriate, to allow timely decisions regarding required disclosure. Barrick has invested resources to document and analyze its system of disclosure controls and its internal control over financial reporting. A control system, no matter how well designed and operated, can provide only reasonable, not absolute, assurance with respect to the reliability of financial reporting and financial statement preparation. See “Internal Control Over Financial Reporting and Disclosure Controls and Procedures”.
Ability to support the carrying value of goodwill and non-current assets
As of December 31, 2025, the carrying value of Barrick’s goodwill was approximately $3.0 billion or 6% of Barrick’s total assets. Goodwill is allocated to each cash generating unit (“CGU”), where CGUs generally represent individual mineral properties. Goodwill is tested annually for impairment in the fourth quarter. In addition, at each reporting period, Barrick assesses whether there is an indication that goodwill is impaired and, if there is such an indication, Barrick tests for goodwill impairment at that time. The test for goodwill impairment involves a comparison of the recoverable amount of a CGU to its carrying value. A goodwill impairment charge is recognized for any excess of the carrying amount of the CGU over its recoverable amount.
Non-current assets are tested for impairment when events or changes in circumstances suggest that the carrying amount of these assets may not be recoverable. The impairment test is carried out using the same approach that is used for goodwill.
The assessment for goodwill and non-current asset impairment is subjective and requires management to make estimates and assumptions for a number of factors that market participants would make about the recoverable amount of the CGU, including estimates of production levels, operating costs and capital expenditures and permitting assumptions reflected in Barrick’s life of mine plans, as well as economic factors beyond management’s control, such as gold and copper prices, discount rates and
- 134 -
observable net asset value multiples. Should management’s estimate of the future not reflect actual events, further goodwill or non-current asset impairment charges may materialize.
MANAGEMENT’S DISCUSSION AND ANALYSIS OF FINANCIAL CONDITION AND RESULTS OF OPERATIONS
Reference is made to the Management’s Discussion and Analysis of Financial and Operating Results of the Company (IFRS) for the year ended December 31, 2025, which is available on SEDAR+ at www.sedarplus.ca and on EDGAR at www.sec.gov as an exhibit to Barrick’s Form 40-F.
CONSOLIDATED FINANCIAL STATEMENTS
Reference is made to the Company’s Consolidated Financial Statements as at and for the year ended December 31, 2025 (IFRS), which are available on SEDAR+ at www.sedarplus.ca and on EDGAR at www.sec.gov as an exhibit to Barrick’s Form 40-F.
CAPITAL STRUCTURE
Set forth below is a description of Barrick’s share capital. The following statements are brief summaries of, and are subject to the provisions of, the notice of articles and articles of Barrick and the relevant provisions of the BCBCA.
General
Barrick’s authorized share capital consists of an unlimited number of common shares.
Common Shares
The holders of Barrick common shares are entitled to one vote for each share on all matters submitted to a vote of shareholders and do not have cumulative voting rights. The holders of Barrick common shares are entitled to receive dividends if, as and when declared by the Board of Directors of Barrick in respect of the Barrick common shares. The holders of Barrick common shares are entitled to share rateably in any distribution of the assets of Barrick upon liquidation, dissolution or winding-up, after satisfaction of all debts and other liabilities. As of February 23, 2026, there were 1,675,360,395 Barrick common shares issued and outstanding.
The rights, preferences and privileges of holders of Barrick common shares are subject to the rights of the holders of shares of any class ranking senior to the Barrick common shares that Barrick may issue in the future.
There are no limitations contained in the notice of articles or articles of Barrick or in the BCBCA on the ability of a person who is not a Canadian resident to hold Barrick common shares or exercise the voting rights associated with Barrick common shares. The Barrick common shares are not subject to any exchange, conversion, exercise, redemption, retraction, surrender or similar rights or restrictions.
- 135 -
RATINGS
The following table sets out the ratings of Barrick’s corporate debt by the rating agencies indicated as at the dates set out below:
| Rating Agency | ||||||
| Moody’s Investors Service | Standard & Poor’s Ratings Services | DBRS Morningstar | ||||
| Senior Unsecured Debt |
A3 | BBB+ | BBB | |||
The Moody’s credit rating is current to January 16, 2026, the S&P credit rating is current to October 22, 2025 and the DBRS Morningstar credit rating is current to February 28, 2025.
Moody’s Investors Service (“Moody’s”) credit ratings for long-term debt are on a rating scale that ranges from Aaa to C, which represents the range from highest to lowest quality of such securities rated. Moody’s appends numerical modifiers 1, 2 and 3 to each generic rating classification from Aa through Caa in its corporate bond rating system. The modifier 1 indicates that the obligation ranks in the higher end of its generic rating category; the modifier 2 indicates a mid-range ranking; and the modifier 3 indicates a ranking in the lower end of that generic rating category. A Moody’s rating outlook is an opinion regarding the likely rating direction over the medium-term. Ratings outlooks fall into four categories: positive, negative, stable, and developing. A stable outlook indicates a low likelihood of a rating change over the medium term. A negative, positive or developing outlook indicates a higher likelihood of a rating change over the medium term. According to the Moody’s rating system, a rating of A is the third highest of nine major categories, and long-term obligations rated A are considered upper-medium grade and are subject to low credit risk.
Standard & Poor’s Ratings Services (“S&P”) credit ratings for long-term debt are on a rating scale that ranges from AAA to D, which represents the range from highest to lowest quality of such securities rated. The BBB rating is the fourth highest of ten major categories. The ratings from AA to CCC may be modified by the addition of a plus (+) or minus (-) sign to show relative standing within the major rating categories. If S&P anticipates that a credit rating may change in the next six to 24 months, it may issue an updated ratings outlook indicating whether the possible change is likely to be “positive”, “negative”, “stable” or “developing”.
DBRS Morningstar uses a long-term debt rating scale that ranges from AAA to D, which represents the range from highest to lowest quality of such securities rated, and, with the exception of the AAA and D categories, also contains the subcategories “high” and “low”. The absence of either a “high” or “low” designation indicates the rating is in the “middle” of the category. According to DBRS Morningstar, a rating of BBB is in the fourth highest of ten major categories and is of adequate credit quality. The capacity for the payment of financial obligations is considered acceptable. Entities in this category are considered to be vulnerable to future events, but qualifying negative factors are considered manageable.
Barrick understands that the ratings are based on, among other things, information furnished to the above ratings agencies by Barrick and information obtained by the ratings agencies from publicly available sources. The credit ratings given to Barrick’s debt instruments by the rating agencies are not recommendations to buy, hold or sell such debt instruments since such ratings do not comment as to market price or suitability for a particular investor. There is no assurance that any rating will remain in effect for any given period of time or that any rating will not be revised or withdrawn entirely by a rating agency in the future if, in its judgment, circumstances so warrant. Credit ratings are intended to provide investors with: (i) an independent measure of the credit quality of an issue of securities; (ii) an indication of the likelihood of repayment for an issue of securities; and (iii) an indication of the capacity and willingness of the issuer to meet its financial obligations in accordance with the terms of those securities. Credit ratings accorded to Barrick’s debt instruments may not reflect the potential impact of all risks on the
- 136 -
value of such instruments, including risks related to market or other factors discussed in this Annual Information Form (see also “Risk Factors”).
Barrick has paid each of Moody’s and S&P its customary fees in connection with the provision of the above credit ratings. The Company has not made any payments to DBRS Morningstar and no payments have been made to Moody’s and S&P unrelated to the provision of their rating services for the last two years.
MARKET FOR SECURITIES
Barrick’s common shares are listed and posted for trading on the Toronto Stock Exchange under the symbol ABX and the New York Stock Exchange under the symbol B. The following table outlines the closing share price trading range and volume of shares traded by month in 2025, and for the period from January 1, 2026 to February 23, 2026, based on trading information published by each exchange.
| Toronto Stock Exchange | New York Stock Exchange | |||||||||||||||||
| Share Price Trading Range |
Share Volume | Share Price Trading Range |
Share Volume | |||||||||||||||
| High | Low | High | Low | |||||||||||||||
| 2025 | (C$ per share) | (millions) | ($ per share) | (millions) | ||||||||||||||
| January | 24.47 | 22.02 | 62 | 16.86 | 15.31 | 383 | ||||||||||||
| February | 27.19 | 23.89 | 73 | 19.19 | 16.33 | 542 | ||||||||||||
| March | 28.44 | 25.32 | 78 | 19.89 | 17.48 | 459 | ||||||||||||
| April | 29.39 | 24.28 | 87 | 21.11 | 17.00 | 561 | ||||||||||||
| May | 27.10 | 24.29 | 82 | 19.59 | 17.41 | 367 | ||||||||||||
| June | 29.50 | 26.60 | 82 | 21.70 | 19.43 | 339 | ||||||||||||
| July | 29.98 | 28.13 | 68 | 21.95 | 20.52 | 223 | ||||||||||||
| August | 37.07 | 29.16 | 112 | 26.83 | 21.13 | 332 | ||||||||||||
| September | 49.92 | 36.67 | 145 | 36.10 | 26.55 | 589 | ||||||||||||
| October | 51.09 | 42.62 | 118 | 36.40 | 30.35 | 437 | ||||||||||||
| November | 58.58 | 44.57 | 127 | 41.72 | 31.61 | 358 | ||||||||||||
| December | 63.85 | 55.45 | 118 | 46.45 | 40.02 | 269 | ||||||||||||
| 2026 | ||||||||||||||||||
| January | 74.00 | 58.56 | 100 | 54.69 | 42.64 | 326 | ||||||||||||
| February 1 to 23 | 68.28 | 59.95 | 122 | 49.96 | 43.75 | 269 | ||||||||||||
MATERIAL CONTRACTS
Set out below is a description of Barrick’s material contracts as at December 31, 2025.
On March 6, 2003, Placer Dome entered into an Indenture (the “2003 Indenture”) with Deutsche Bank Trust Company Americas in connection with the issuance of senior debt securities.
On March 6, 2003, Placer Dome entered into a First Supplemental Indenture with Deutsche Bank Trust Company Americas in connection with the issuance and sale by Placer Dome of $200 million principal amount of 6.375% debentures on March 6, 2003. This First Supplemental Indenture, together with the original 2003 Indenture, sets out the terms and conditions pertaining to the $200 million principal amount 6.375% debentures.
- 137 -
On October 10, 2003, Placer Dome entered into a Second Supplemental Indenture with Deutsche Bank Trust Company Americas in connection with the issuance and sale by Placer Dome of $300 million principal amount of 6.45% debentures on October 10, 2003. This Second Supplemental Indenture, together with the original 2003 Indenture, sets out the terms and conditions pertaining to the $300 million principal amount 6.45% debentures.
On November 12, 2004, Barrick entered into an Indenture with BGI, Barrick Gold Finance Company and JPMorgan Chase Bank (the “2004 Indenture”). Pursuant to the 2004 Indenture, (a) Barrick issued $200 million principal amount of 5.80% notes due 2034 (the “Barrick 2034 Notes”), (b) Barrick Gold Finance Company issued $200 million principal amount of 5.80% notes due 2034 (the “BGFC 2034 Notes”), and (c) Barrick Gold Finance Company issued $350 million principal amount of 4.875% notes due 2014 (the “BGFC 2014 Notes”), all on November 12, 2004. On December 16, 2013, the entire balance of the BGFC 2014 Notes was repaid in full. The 2004 Indenture sets out the terms and conditions pertaining to the Barrick 2034 Notes and the BGFC 2034 Notes. The BGFC 2034 Notes are unconditionally guaranteed by Barrick.
On October 12, 2006, Barrick International (Barbados) Corp., formerly Barrick International Bank Corp. (“BIBC”), issued an aggregate of $1 billion of notes (the “BIBC Notes”) comprised of $400 million of 5.75% notes due 2016 and $600 million of 6.35% notes due 2036 pursuant to an Indenture dated as of the same date among BIBC, as issuer, Barrick (HMC) Mining Company (“Barrick (HMC)”), as initial joint obligor, Barrick, as parent guarantor, and The Bank of New York, as trustee (the “2006 Indenture”). The 2006 Indenture sets out the terms and conditions pertaining to the BIBC Notes, which include an unconditional guarantee by Barrick.
On the same date, and as part of the same transaction, ABX Financing Company (“ABXFC”), a company incorporated for the purpose of acquiring the BIBC Notes, issued an aggregate of $1 billion of notes (the “ABXFC Notes”) comprised of $400 million of 5.75% notes due 2016 and $600 million of 6.35% notes due 2036 pursuant to an Indenture dated as of the same date among ABXFC, as issuer, BIBC, Barrick (HMC) and Barrick, as guarantors, and The Bank of New York, as trustee (the “ABXFC Indenture”). On October 15, 2015, the outstanding principal amount of the 5.75% notes due 2016 was repaid in full. The ABXFC Indenture sets out the terms and conditions pertaining to the ABXFC Notes, which include an unconditional guarantee by Barrick, BIBC and Barrick (HMC).
On September 11, 2008, Barrick entered into an Indenture with Barrick Gold Financeco LLC, Barrick North America Finance LLC and The Bank of New York Mellon (“2008 Indenture”). Pursuant to the 2008 Indenture, (i) Barrick Gold Financeco LLC issued $500 million principal amount 6.125% notes due 2013 (the “BGFC 2013 Notes”), and (ii) Barrick North America Finance LLC issued $500 million principal amount 6.80% notes due 2018 (the “BNAF 2018 Notes”) and $250 million principal amount 7.50% notes due 2038 (the “BNAF 2038 Notes”), all on September 11, 2008. On March 19, 2009, Barrick issued an aggregate of $750 million principal amount 6.95% notes due 2019 (the “BGC 2019 Notes”) pursuant to the 2008 Indenture. During 2013, upon maturity, the outstanding principal amount of the BGFC 2013 Notes was repaid in full. On October 28, 2015, pursuant to a cash tender offer, $275 million of the principal amount of the BGC 2019 Notes was repaid. On March 21, 2016, pursuant to a cash tender offer, approximately $227 million of the principal amount of the BNAF 2018 Notes and approximately $196 million of the principal amount of the BGC 2019 Notes was repaid. On September 26, 2016, the outstanding principal amount of the BNAF 2018 Notes was repaid in full. On June 20, 2017, the outstanding principal amount of the BGC 2019 Notes was repaid in full. The 2008 Indenture sets out the terms and conditions pertaining to the BNAF 2038 Notes. The BNAF 2038 Notes are unconditionally guaranteed by Barrick.
On October 16, 2009, Barrick entered into an Indenture with Barrick (PD) Australia Finance Pty Ltd. and the Bank of New York Mellon (the “2009 Indenture”). Pursuant to the 2009 Indenture, Barrick (PD) Australia Finance Pty Ltd. issued $400 million principal amount 4.950% notes due 2020 (the “BPDAF 2020 Notes”) and the BPDAF 2039 Notes, all on October 16, 2009. On March 21, 2016, pursuant to a
- 138 -
cash tender offer, approximately $152 million of the principal amount of the BPDAF 2020 Notes was repaid. On July 15, 2019, the outstanding principal amount of approximately $248 million of the BPDAF 2020 Notes was repaid in full. The 2009 Indenture sets out the terms and conditions pertaining to the BPDAF 2039 Notes. The BPDAF 2039 Notes are unconditionally guaranteed by Barrick. In 2023, approximately $43 million of the principal amount of the BPDAF 2039 Notes was repaid pursuant to open market repurchases. In 2025, approximately $2 million of the BPDAF 2039 Notes were repaid pursuant to open market repurchases.
On June 1, 2011, Barrick entered into an Indenture with Barrick North America Finance LLC (“BNAF”), Citibank N.A. and Wilmington Trust Company (the “2011 Indenture”). Pursuant to the 2011 Indenture, Barrick and BNAF issued an aggregate of $4.0 billion in debt securities comprised of: $700 million of 1.75% notes due 2014 (the “Barrick 2014 Notes”) and $1.1 billion of 2.90% notes due 2016 (the “Barrick 2016 Notes”), each issued by Barrick, as well as $1.35 billion of 4.40% notes due 2021 (the “BNAF 2021 Notes”) and $850 million of 5.70% notes due 2041 (the “BNAF 2041 Notes”), each issued by BNAF. On December 16, 2013, the outstanding principal amount of the Barrick 2014 Notes was repaid in full. On September 9, 2015, the outstanding principal amount of the Barrick 2016 Notes was repaid in full. In 2016, approximately $721 million of the principal amount of the BNAF 2021 Notes was repaid pursuant to cash tender offers. On July 17, 2018, the outstanding principal amount of approximately $629 million of BNAF 2021 Notes was repaid in full. The BNAF 2041 Notes are unconditionally guaranteed by Barrick.
On April 3, 2012, Barrick issued an aggregate of $2 billion in debt securities pursuant to the 2011 Indenture, comprised of $1.25 billion of 3.85% notes due 2022 (the “BGC 2022 Notes”) and $750 million of 5.25% notes due 2042. In 2015, approximately $913 million of the principal amount of the 3.85% notes due 2022 was repaid pursuant to cash tender offers. On January 31, 2020, the outstanding principal amount of approximately $337 million of BGC 2022 Notes was repaid in full. In 2022, approximately $375 million of the principal amount of the 5.25% notes due 2042 was repaid pursuant to open market repurchases and cash tender offers.
On May 2, 2013, Barrick and BNAF issued an aggregate of $3 billion in debt securities pursuant to the 2011 Indenture, comprised of $650 million of 2.50% notes due 2018 and $1.5 billion of 4.10% notes due 2023 issued by Barrick as well as $850 million of 5.75% notes due 2043 issued by BNAF (collectively, the “BNAF Notes”). The BNAF Notes are unconditionally guaranteed by Barrick. On December 3, 2013, pursuant to a cash tender offer, approximately $398 million of the principal amount of the 2.50% notes due 2018 was repaid. In 2015, approximately $129 million of the principal amount of the 2.50% notes due 2018 and approximately $769 million of the principal amount of the 4.10% notes due 2023 was repaid pursuant to cash tender offers. On March 21, 2016, pursuant to a cash tender offer, approximately $18 million of the principal amount of the 2.50% notes due 2018 was repaid. On June 24, 2016, the outstanding principal amount of the 2.50% notes due 2018 was repaid in full. On September 21, 2017, the outstanding principal amount of the 4.10% notes due 2023 was repaid in full.
On July 1, 2019, Barrick and Newmont, among others, entered into an amended and restated limited liability company agreement which sets out the rights and obligations between them in respect of Nevada Gold Mines (the “JV Agreement”). Pursuant to the JV Agreement, the management and control of Nevada Gold Mines is vested in its board of managers, which currently consists of five members (and five alternates), three of which were appointed by Barrick and two of which were appointed by Newmont. The JV Agreement also establishes advisory committees, including a technical committee, finance committee and exploration committee, with equal representation from Barrick and Newmont. Pursuant to the JV Agreement, Barrick was appointed as the initial operator with overall management responsibility, subject to the supervision and direction of the board.
- 139 -
TRANSFER AGENTS AND REGISTRARS
Barrick’s transfer agent and registrar for its common shares is TSX Trust Company in Canada at its principal office in Toronto, Ontario and Equiniti Trust Company, LLC in the United States at its principal office in Brooklyn, New York.
DIVIDEND POLICY
At its February 15, 2022 meeting, the Board of Directors approved a performance dividend policy that enhanced the return to shareholders when the Company’s liquidity was strong. In addition to Barrick’s base dividend, the amount of the performance dividend on a quarterly basis was based on the amount of cash, net of debt, on Barrick’s consolidated balance sheet at the end of each quarter. At its November 7, 2025 meeting, the Board of Directors approved an increase in the base quarterly dividend to $0.125 per share and at its February 4, 2026 meeting, the Board of Directors approved the declaration of a $0.42 per share dividend in respect of performance for the fourth quarter of 2025 and announced a new dividend policy.
In 2023, Barrick paid a quarterly dividend of $0.10 per share in respect of the first, second, third and fourth quarters of 2023 (paid in mid-June 2023, mid-September 2023, mid-December 2023 and mid-March 2024, respectively), for a total annualized dividend of $0.40 per share in respect of 2023.
In 2024, Barrick paid a quarterly dividend of $0.10 per share in respect of the first, second, third and fourth quarters of 2024 (paid in mid-June 2024, mid-September 2024, mid-December 2024 and mid-March 2025, respectively), for a total annualized dividend of $0.40 per share in respect of 2024.
In 2025, Barrick paid a quarterly dividend of $0.10 per share in respect of the first quarter (paid in mid-June) and $0.15 per share, including a $0.05 per share performance dividend, in respect of the second quarter of 2025 (paid in mid-September). On November 7, 2025, the Board of Directors approved an increase in the base dividend to $0.125 per share, resulting in a dividend of $0.175 per share, including a $0.05 per share performance divided, in respect of the third quarter of 2025 (paid in mid-December). On February 5, 2026, Barrick announced the declaration of a $0.42 per share dividend in respect of performance for the fourth quarter of 2025, for a total annualized dividend of $0.845 per share in respect of 2025, and announced a new dividend policy.
From the fourth quarter of 2025 onward, the Company’s new dividend policy targets a total payout of 50% of attributable free cash flow on an annualized basis, comprised of a fixed base quarterly dividend of $0.175 per share and a performance top-up component at each year-end based on Barrick’s attributable free cash flow during the year. The dividend paid in any given year may be higher or lower than the 50% target based on the strength of Barrick’s cash flow, capital needs, balance sheet considerations, and other factors.
The declaration and payment of dividends is at the discretion of the Board of Directors, and will depend on the Company’s financial results, cash requirements, future prospects, the number of outstanding common shares and other factors deemed relevant by the Board.
SHARE BUYBACK PROGRAM
At its February 14, 2023 meeting, the Board of Directors authorized the 2023 Repurchase Program for the purchase of up to $1.0 billion of Barrick’s outstanding common shares over the next 12 months. Barrick did not purchase any shares under the 2023 Repurchase Program.
At its February 13, 2024 meeting, the Board of Directors authorized the 2024 Share Repurchase Program for the repurchase of up to $1 billion of Barrick’s outstanding common shares over the next 12 months. Barrick’s 2023 Repurchase Program was terminated in connection with the new program. Barrick
- 140 -
repurchased 28.675 million common shares in 2024 for approximately $498 million under the 2024 Share Repurchase Program.
At its February 11, 2025 meeting, the Board of Directors authorized the 2025 Share Repurchase Program for the repurchase of up to $1 billion of Barrick’s outstanding common shares over the next 12 months. Barrick’s 2024 Repurchase Program was terminated in connection with the new program. At its November 7, 2025 meeting, the Board of Directors authorized an increase in the 2025 Share Repurchase Program of up to an additional $500 million of Barrick’s outstanding common shares before the program expired in February 2026. Barrick repurchased approximately 51.90 million common shares in 2025 for approximately $1.5 billion under the 2025 Share Repurchase Program.
DIRECTORS AND OFFICERS OF THE COMPANY
As of February 23, 2026, directors and executive officers of Barrick as a group beneficially own, directly or indirectly, or exercise control or direction over 4,253,457 common shares representing approximately 0.25% of the outstanding common shares of Barrick.
Leadership Transitions
On September 29, 2025, Mark Hill was appointed Group Chief Operating Officer and Interim President and Chief Executive Officer, following the departure of Mark Bristow. Mr. Hill, who was previously responsible for Barrick’s Latin America and Asia Pacific regions, is a seasoned mining executive with 30 years of experience. He joined Barrick in 2006 and has experience in strategy, corporate development and leading major projects across the world, and was also integral in the initial decision to undertake exploration at the Fourmile gold project in Nevada. Mr. Bristow stepped down as President and CEO after nearly seven years having joined Barrick following Barrick’s merger with Randgold in 2019. Mr. Bristow led the successful integration of the two companies, and during his tenure made significant investments in Barrick’s world-class assets to better position Barrick to maintain profitable gold and copper growth.
On January 19, 2026, the Company announced the appointment of Helen Cai as Senior Executive Vice President, Chief Financial Officer effective March 1, 2026, following the departure of Graham Shuttleworth. Ms. Cai has served on Barrick’s Board of Directors since November 2021 and brings more than two decades of experience in equity research, corporate finance, strategic planning, capital markets, and M&A across the mining, industrial, and technology sectors. See “Directors of the Company” below for details.
On February 4, 2026, Mark Hill was appointed President and Chief Executive Officer of Barrick.
On February 24, 2026, Barrick announced that James J. McGuire was appointed Chief Legal and Policy Officer and Woo Lee was appointed Chief Global Affairs Officer. In addition, Poupak Bahamin will become Barrick’s General Counsel and Chief Compliance Officer. The appointments of Messrs. McGuire and Lee will take effect on March 9 and March 1, respectively.
Directors of the Company
The present term of each director will expire at the next annual meeting of shareholders or upon such director’s successor being elected or appointed.
The following ten individuals are the directors of the Company as at February 23, 2026.
- 141 -
| Name (age) and municipality of residence |
Principal occupations during past 5 years | |
| Helen Cai (52) Hong Kong, China |
Ms. Cai was appointed Senior Executive Vice President and Chief Financial Officer of Barrick, effective March 1, 2026. She has served on the Board of Directors since November 2021 and brings more than two decades of experience in equity research, corporate finance, strategic planning, capital markets, and M&A across the mining, industrial, and technology sectors, primarily with Goldman Sachs and China International Capital Corporation (CICC). Ms. Cai was consistently top ranked as a research analyst by StarMine, Institutional Investor and Asiamoney, and the transactions she led as an investment banker received multiple deal awards from Asiamoney and The Asset. She holds both the Chartered Financial Analyst (CFA) and Chartered Alternative Investment Analyst (CAIA) designations and was educated at the Massachusetts Institute of Technology and Tsinghua University.
Barrick Board Details: • Director since November 2021
| |
| Isela Costantini (54) Buenos Aires, Argentina |
Ms. Costantini is a strategic board advisor at Grupo ST, a privately held holding company conducting business in finance, insurance, agriculture, and oil exploration. She has over 30 years of experience in international business, including as CEO of Grupo Financiero ST, President and Chief Executive Officer of Argentina’s national airline, Aerolíneas Argentinas, and President and general director, Argentina, Paraguay and Uruguay, for General Motors. Ms. Costantini is also a past President of ADEFA, the Automotive Manufacturers’ Association in Argentina. She was included in the list of the 500 most influential leaders in Latin America by Bloomberg Línea and has been named by Fortune magazine as one of the 50 most powerful women in business outside the United States. She has published Un Líder en Vos, a best-selling book about leadership, and sits on the board of CIPPEC (Centro de Implementación de Políticas Públicas para la Equidad y el Crecimiento), a think tank in Argentina, and is a member of the strategic council of Universidad Austral. She holds a bachelor’s degree in social communications and advertising from the Pontificia Universidade Católica do Paraná in Brazil and an MBA in marketing and international business from the Quinlan School of Business at Loyola University in Chicago. Ms. Costantini is also a member of Barrick’s International Advisory Board.
Barrick Board Details: • Director since November 2022
|
- 142 -
| Name (age) and municipality of residence |
Principal occupations during past 5 years | |
| Brian L. Greenspun (79) Las Vegas, Nevada USA |
Mr. Greenspun is the Publisher and Editor of the Las Vegas Sun. He is also Chairman and Chief Executive Officer of Greenspun Media Group. Mr. Greenspun has been appointed to two U.S. Presidential Commissions. In the early 1990s, he was appointed by President Bill Clinton to the White House Commission on Small Business. In December 2014, he was appointed by President Barack Obama to the Commission for the Preservation of America’s Heritage Abroad. He is a Trustee of the University of Nevada Las Vegas Foundation. He is active in numerous civic and charitable organizations in the Las Vegas community. Mr. Greenspun holds a law degree and an undergraduate degree from Georgetown University.
Barrick Board Details: • Director since July 2014
| |
| J. Brett Harvey (75) Mesquite, Nevada USA |
Mr. Harvey is Chairman of the board of Warrior Met Coal Inc., a leading producer and exporter of metallurgical coal for the global steel industry, a position he has held since January 1, 2023. Mr. Harvey was Chairman Emeritus of CONSOL Energy Inc., a coal, gas, and energy services company from May 2016 to May 2017. He was CONSOL Energy Inc.’s Chairman from January 2015 to May 2016, Executive Chairman from May 2014 to January 2015, Chairman and Chief Executive Officer from June 2010 to May 2014, and Chief Executive Officer from January 1998 to June 2010. From January 2009 to May 2014, he was also the Chairman and Chief Executive Officer of CNX Gas Corporation, a subsidiary of CONSOL Energy Inc. Mr. Harvey brings extensive management experience to the Board of Directors as well as experience with internal controls and procedures for financial reporting. He began his business career in mining, joining the Kaiser Steel Company in 1979 at the Sunnyside Mine in Utah, and, in 1984, he was appointed as Vice President and General Manager of Kaiser Coal of New Mexico. Mr. Harvey also served as Vice President, Mining for PacifiCorp. In 2016, he received the Charles F. Rand Memorial Gold Medal, awarded by the Society for Mining, Metallurgy and Exploration for distinguished achievement in mining administration. Mr. Harvey is the former chair of the National Mining Association and of the Coal Industry Advisory Board to the International Energy Agency. He is a former member of the National Executive Board of the Boy Scouts of America and a past chairman of the Laurel Highlands Council of the Boy Scouts. Mr. Harvey holds an undergraduate degree in mining engineering from the University of Utah.
Barrick Board Details: • Director since December 2005
| |
| Mark Hill (61) Punta Cana, La Altagracia Dominican Republic |
Mr. Hill was appointed President and Chief Executive Officer of Barrick in February 2026, following his appointment as Group Chief Operating Officer and Interim President and Chief Executive Officer in September 2025. He was previously the executive responsible for Barrick’s Latin America and Asia Pacific region, a role he assumed in January 2019. Mr. Hill is a seasoned mining executive with 30 years of experience. He joined Barrick in 2006 and has experience in strategy, corporate development and leading major projects across the world. He was also integral in the initial decision to undertake exploration at the Fourmile gold project in Nevada. Mr. Hill holds an undergraduate degree in mining engineering from Ballarat University and a graduate diploma in mineral economics from Macquarie University.
Barrick Board Details: • Director since February 2026
|
- 143 -
| Name (age) and municipality of residence |
Principal occupations during past 5 years | |
| Anne N. Kabagambe (69) Washington, DC, USA |
Ms. Kabagambe formerly served on the board of the World Bank Group where, between 2016 and 2020, she represented the interests of 22 Sub-Saharan African countries, including Tanzania and Zambia, two jurisdictions where Barrick has operations. While at the World Bank, she served as a member of the Budget Committee, the Pension Benefits Administration, and the Development Effectiveness Committee. Ms. Kabagambe co-chaired the World Bank Board’s Gender Working Group and was a strong advocate for the advancement of women and a champion of diversity and inclusion. She has 35 years of experience spanning a diverse range of senior leadership positions in international institutions, including as Chief of Staff for the African Development Bank (AfDB) and has also served on the boards of the Africa American Institute (AAI) and Junior Achievement (JA) Africa. Ms. Kabagambe holds an undergraduate degree from the University of California at San Diego (UCSD), master’s degrees in Public Policy from Columbia University’s School of International and Public Affairs and George Washington University, and has also obtained post-graduate diplomas from Harvard University’s Business School & John F. Kennedy School of Government as well as the Cranfield School of Management.
Barrick Board Details: • Director since November 2020
| |
| Robert Samek (63) Toronto, ON, Canada |
Mr. Samek, a Canadian national and former Senior Partner of McKinsey & Company, brings significant global experience in energy and materials. Over his thirty-one-year career at McKinsey, he held many senior leadership positions. From 2015 to 2018, he was Managing Partner of the Americas Mining and Metals / Basic Materials practice. From 2010 to 2023, he led the Public Sector practice in Canada, with a focus on natural resources, infrastructure and industrials. He also created and led major new global practice areas for McKinsey: one in AI for energy and mining (2016 to 2023); and another in Capital Projects (2009 to 2015). He was President of McKinsey & Company Canada from 2014 to 2023. Mr. Samek’s tenure at McKinsey allowed him to develop a breadth of financial expertise across industries.
Barrick Board Details: • Director since February 2026
|
- 144 -
| Name (age) and municipality of residence |
Principal occupations during past 5 years | |
| Loreto Silva (61) Santiago, Chile |
Ms. Silva is a partner at the Chilean law firm Escobar Silva Yanine Facuse Abogados. She has held important positions during a career spanning both the public and private sectors. Over the last two decades, she has led policies and debates on public-private partnerships for the advancement of Chile’s infrastructure and the enhancement of water utilities services. At the end of 2012, Ms. Silva was the first woman in Chile to be appointed as Minister of Public Works. During her tenure, she spearheaded pivotal infrastructural projects and, in collaboration with private and public entities, formulated a comprehensive strategy for the management of water resources. Beyond her governmental role, Ms. Silva served as the Chair of the board of Chile’s national oil and gas company and contributed as a board member to several Chilean listed and privately held companies in Chile. Through her extensive career in both public and private sectors, she has demonstrated significant financial and audit experience with a robust understanding of financial management and audit processes. Her expertise is highly regarded, as evidenced by her membership in prestigious industry think tanks and her role as an arbitrator for the Santiago Arbitration and Mediation Centre, where she specializes in infrastructure and construction disputes. Her professional achievements have been recognized with the esteemed “Chile’s 100 Leading Women Leaders” award. Ms. Silva holds a law degree from the University of Chile.
Barrick Board Details: • Director since August 2019
|
- 145 -
| Name (age) and municipality of residence |
Principal occupations during past 5 years | |
| John L. Thornton (72) Palm Beach, Florida USA |
Mr. Thornton was appointed Chairman on February 13, 2024. From April 30, 2014 to February 12, 2024, Mr. Thornton was Executive Chairman of Barrick. From June 5, 2012 to April 29, 2014, Mr. Thornton was Co-Chairman of Barrick. He is also Chairman of RedBird Capital Partners, a private investment firm. He is also a director of Paramount Skydance Corporation and lead director of Ford Motor Company, Lenovo Group Limited, and Avathon, Inc., a leading industrial artificial intelligence company. He is a Professor of the Tsinghua University School of Economics and Management and serves as the Director of its Global Leadership Program. In addition, he is an Advisory Board member of Tsinghua’s School of Economics and Management and its School of Public Policy and Management. He is also Chairman Emeritus of the Brookings Institution in Washington, D.C. He retired in 2003 as President and a member of the board of The Goldman Sachs Group, Inc. Mr. Thornton is Co-Chair of the Asia Society, and is on the advisory boards or board of trustees of the China Investment Corporation (CIC), China Securities Regulatory Commission, King Abdullah University of Science and Technology, McKinsey Advisory Council, Schwarzman Scholars, and the African Leadership Academy. He is also the former Vice Chairman of the Morehouse College Board of Trustees. Mr. Thornton holds an undergraduate degree from Harvard College, a degree in jurisprudence from Oxford University, and a master’s degree from the Yale School of Management.
Barrick Board Details: • Chairman since 2024, Executive Chairman from 2014 to 2024 and Director since February 2012
| |
| Pekka J. Vauramo (68) Helsinki, Uusimaa Finland |
Mr. Vauramo is a corporate executive with over two decades of experience leading global companies. Between 2018 and 2024, Mr. Vauramo was President and Chief Executive Officer of Metso Corporation, a global supplier of sustainable technologies, end-to-end solutions and services for the minerals processing and aggregates industries. Between 2013 and 2018, he was President and Chief Executive Officer of Finnair plc, Finland’s largest airline. Mr. Vauramo has also held leadership positions at Cargotec Corporation, Sandvik AB, and Tamrock Corporation. He is currently the Chairman of the boards of Huhtamaki Oyj and Valmet Oyj, both Finnish-listed companies. Mr. Vauramo brings decades of leadership experience to the Board of Directors and a detailed knowledge of both financial reporting and internal controls. Mr. Vauramo holds a Master’s of Science degree (technology) in mining engineering, from Helsinki University of Technology.
Barrick Board Details: • Director since May 2025
|
Corporate Governance and Committees of the Board
Barrick’s current corporate governance policies and practices are consistent with the requirements of Canadian securities laws. Barrick’s policies and practices also take into account the rules of the Toronto
- 146 -
Stock Exchange and the corporate governance standards adopted by the New York Stock Exchange (the “NYSE Standards”), even though the majority of the NYSE Standards do not directly apply to Barrick as a Canadian company. The one significant difference between Barrick’s corporate governance practices and the NYSE Standards which are applicable to U.S. companies is summarized below:
Section 303A.08 of the NYSE Standards requires shareholder approval of all “equity compensation plans” and material revisions. The definition of equity compensation plans under the NYSE Standards covers plans that provide for the delivery of newly issued securities, as well as plans that rely on securities reacquired on the market by the issuing company for the purpose of redistribution to employees and directors. In comparison, the Toronto Stock Exchange rules require shareholder approval of security-based compensation arrangements only in respect of arrangements which involve the delivery of newly issued securities or specified amendments thereto. Therefore, Barrick does not seek shareholder approval for equity compensation plans and amendments unless they involve newly issued securities or constitute specified amendments under the Toronto Stock Exchange rules.
ESG & Nominating Committee
The ESG & Nominating Committee is comprised of Brian L. Greenspun (Chair), J. Brett Harvey, Anne N. Kabagambe and Loreto Silva.
Audit & Risk Committee
The Audit & Risk Committee is comprised of Loreto Silva (Chair), J. Brett Harvey, Anne N. Kabagambe, Robert A.P. Samek and Pekka J. Vauramo.
Compensation Committee
The Compensation Committee is comprised of Isela Costantini (Chair), Brian L. Greenspun, J. Brett Harvey, Robert A.P. Samek and Pekka J. Vauramo.
International Advisory Board
The members of the Board of Directors that also sit on the International Advisory Board are John L. Thornton and Isela Costantini.
Executive Officers of the Company
The following are the executive officers of the Company as at February 23, 2026.
| Name (age) and municipality of residence |
Office | Principal occupations during past 5 years | ||
| Poupak Bahamin (55) Bethesda, Maryland USA |
Chief Legal Officer | Chief Legal Officer; prior to November 2025, General Counsel; prior to April 2022, Deputy General Counsel; prior to February 2020, partner at Norton Rose Fulbright | ||
| Mark Hill (61) Punta Cana, La Altagracia Dominican Republic |
President and Chief Executive Officer | President and Chief Executive Officer; prior to February 2026, Group Chief Operating Officer and Interim President and Chief Executive Officer; prior to September 2025, Chief Operating Officer, Latin America and Asia Pacific | ||
- 147 -
| Name (age) and municipality of residence |
Office | Principal occupations during past 5 years | ||
| George Joannou (51) Toronto, Ontario Canada |
Chief Development Officer | Chief Development Officer; prior to November 2025, Senior Vice President, Strategic Matters | ||
| Darian Rich (65) Henderson, Nevada USA |
Chief Human Resources Officer | Chief Human Resources Officer; prior to November 2025, Human Resources Executive | ||
| Graham Shuttleworth (57) Grouville, Jersey Channel Islands |
Senior Executive Vice President, Chief Financial Officer | Senior Executive Vice President, Chief Financial Officer | ||
AUDIT & RISK COMMITTEE
Audit & Risk Committee Mandate
A copy of the Audit & Risk Committee’s mandate is attached hereto as Schedule “A”.
Composition of the Audit & Risk Committee
The Audit & Risk Committee is comprised entirely of independent directors (Mses. Silva (Chair) and Kabagambe and Messrs. Harvey, Samek and Vauramo). There were four meetings of the Audit & Risk Committee in 2025. All of the members of the Committee attended all of the meetings held in 2025. Mr. Samek became a member of the Audit & Risk Committee on February 5, 2026.
- 148 -
Relevant Education and Experience
All of the members of the Audit & Risk Committee are financially literate and at least one member has accounting or related financial management expertise. Barrick’s Board of Directors has determined that Mr. Harvey is an “audit committee financial expert” as defined by SEC rules and is independent, as that term is defined by the New York Stock Exchange’s corporate governance standards applicable to Barrick.
The rules adopted by the SEC indicate that the designation of Mr. Harvey as an audit committee financial expert will not deem him to be an “expert” for any purpose or impose any duties, obligations or liability on him that are greater than those imposed on members of the Audit & Risk Committee and Barrick’s Board of Directors who do not carry this designation.
A description of the education and experience of each Audit & Risk Committee member that is relevant to the performance of his or her responsibilities in that capacity is set out under “Directors and Officers of the Company – Directors of the Company”.
- 149 -
Participation on Other Audit Committees
Members of the Audit & Risk Committee may not serve on more than two other public company audit committees without approval of the Board of Directors. No member of the Audit & Risk Committee currently serves on the audit committee of more than three publicly-traded companies, including Barrick.
Audit & Risk Committee Pre-Approval Policies and Procedures
Barrick’s Audit & Risk Committee has adopted a Policy on Pre-Approval of Audit, Audit-Related and Non-Audit Services (the “Pre-Approval Policy”) for the pre-approval of services performed by Barrick’s auditors. The objective of the Pre-Approval Policy is to specify the scope of services permitted to be performed by the Company’s auditor and to ensure that the independence of the Company’s auditor is not compromised through their engagement for other services. All services provided by the Company’s auditor are pre-approved by the Audit & Risk Committee as they arise or through an annual pre-approval of services and related fees for specific services. All services performed by Barrick’s auditor comply with the Pre-Approval Policy, and professional standards and securities regulations governing auditor independence.
External Auditor Service Fees
PricewaterhouseCoopers LLP are the auditors of Barrick’s Consolidated Financial Statements. The following PricewaterhouseCoopers LLP fees were incurred by Barrick in each of the years ended December 31, 2025 and 2024 for professional services rendered to Barrick:
| Fees1 (amount in millions) |
2025 | 2024 | ||
| Audit Fees2 | $10.3 | $9.7 | ||
| Audit-related Fees3 | $0.4 | $0.2 | ||
| Tax Fees4 | $0.2 | $0.2 | ||
| All Other Fees | $0.0 | $0.0 | ||
| Total | $10.9 | $10.1 | ||
| 1 | The classification of fees is based on applicable Canadian securities laws and SEC definitions. |
| 2 | Audit fees include fees for services rendered by the external auditor in relation to the audit and review of Barrick’s financial statements (inclusive of disbursements billed in 2025 and 2024, respectively), the financial statements of its subsidiaries, and in connection with the Company’s statutory and regulatory filings. |
| 3 | In 2025 and 2024, audit-related fees primarily related to compliance with regulatory filing requirements in local markets and translation services. |
| 4 | Tax fees mainly related to tax planning, compliance services and audit support for various jurisdictions. |
INTERNAL CONTROL OVER FINANCIAL REPORTING AND DISCLOSURE CONTROLS AND PROCEDURES
Management is responsible for establishing and maintaining adequate internal control over financial reporting and disclosure controls and procedures. Internal control over financial reporting is a framework designed to provide reasonable assurance regarding the reliability of financial reporting and the preparation of financial statements for external purposes in accordance with International Financial Reporting Standards as issued by the International Accounting Standards Board. The Company’s internal control over financial reporting framework includes those policies and procedures that pertain to the preparation of financial information, including information contained in Barrick’s 2025 Annual Report and this Annual Information Form.
Disclosure controls and procedures form a broader framework designed to provide reasonable assurance that other financial and non-financial information disclosed publicly fairly presents in all
- 150 -
material respects the financial condition, results of operations and cash flows of the Company for the periods presented in the MD&A and Barrick’s 2025 Annual Report. Barrick’s disclosure controls and procedures framework includes processes designed to ensure that material information relating to Barrick, and its consolidated subsidiaries, is made known to management, including Barrick’s President and Chief Executive Officer and its Senior Executive Vice-President, Chief Financial Officer, by others within those entities to allow timely decisions regarding required disclosure. Disclosure controls and procedures apply to various disclosures, including reports filed with securities regulatory agencies.
Together, the internal control over financial reporting and disclosure controls and procedures frameworks provide internal control over financial reporting and disclosure. A control system, no matter how well designed and operated, can provide only reasonable, not absolute, assurance with respect to the reliability of financial statement preparation and financial reporting. Accordingly, Barrick’s management, including Barrick’s President and Chief Executive Officer and its Senior Executive Vice-President, Chief Financial Officer, does not expect that Barrick’s internal control over financial reporting and disclosure will prevent or detect all misstatements or fraud. Further, projections of any evaluation of the effectiveness of internal control to future periods is subject to the risk that controls may become inadequate because of changes in conditions, or that the degree of compliance with policies or procedures may change.
The management of Barrick, at the direction of the Company’s President and Chief Executive Officer and its Senior Executive Vice-President, Chief Financial Officer, have evaluated the effectiveness of the design and operation of the Company’s internal control over financial reporting (as defined in rules adopted by the SEC) and disclosure controls and procedures as at December 31, 2025, based on the framework and criteria established in Internal Control – Integrated Framework (2013) as issued by the Committee of Sponsoring Organizations of the Treadway Commission. Based on management’s evaluation, Barrick’s President and Chief Executive Officer and its Senior Executive Vice-President, Chief Financial Officer concluded that the Company’s internal control over financial reporting and disclosure controls and procedures were effective as at December 31, 2025. Barrick will continue to monitor the effectiveness of its internal control over financial reporting and disclosure and may make modifications from time to time as considered necessary or desirable.
Barrick’s annual management report on internal control over financial reporting and the report of the independent registered public accounting firm for the year ended December 31, 2025 are included in Barrick’s 2025 Annual Report and its 2025 Form 40-F/Annual Information Form on file with the SEC and Canadian provincial securities regulatory authorities.
NON-GAAP FINANCIAL MEASURES
Total cash costs per ounce, All-in sustaining costs per ounce, C1 cash costs per pound and All-in sustaining costs per pound
Total cash costs per ounce and all-in sustaining costs per ounce are non-GAAP financial measures which are calculated based on the definition published by the WGC (a market development organization for the gold industry comprised of and funded by gold mining companies from around the world, including Barrick). The WGC is not a regulatory organization. Management uses these measures to monitor the performance of Barrick’s gold mining operations and its ability to generate positive cash flow, both on an individual site basis and an overall gold operations basis.
Total cash costs start with Barrick’s cost of sales related to gold production and removes depreciation, the non-controlling interest of cost of sales and costs allocated to by-products. All-in sustaining costs start with total cash costs and includes sustaining capital expenditures, sustaining leases, general and administrative costs, minesite exploration and evaluation costs related to the current mine plan and reclamation cost accretion and amortization. These additional costs reflect the expenditures made to maintain current production levels.
- 151 -
The Company believes that its use of total cash costs and all-in sustaining costs will assist analysts, investors and other stakeholders of Barrick in understanding the costs associated with producing gold, understanding the economics of gold mining, assessing Barrick’s operating performance and also its ability to generate free cash flow from the gold operations portion of the Company’s business. Due to the capital-intensive nature of the industry and the long useful lives over which these items are depreciated, there can be a significant timing difference between net earnings calculated in accordance with IFRS and the amount of free cash flow that is generated by a mine and therefore the Company believes these measures are useful non-GAAP operating metrics and supplement its IFRS disclosures. These measures are not representative of all of Barrick’s cash expenditures as they do not include income tax payments, interest costs or dividend payments. These measures do not include depreciation or amortization.
Total cash costs per ounce and all-in sustaining costs are intended to provide additional information only and do not have standardized definitions under IFRS and should not be considered in isolation or as a substitute for measures of performance prepared in accordance with IFRS. These measures are not equivalent to net income or cash flow from operations as determined under IFRS. Although the WGC has published a standardized definition, other companies may calculate these measures differently.
C1 cash costs per pound and all-in sustaining costs per pound are non-GAAP financial measures related to Barrick’s copper mine operations. The Company believes that C1 cash costs per pound enables investors to better understand the performance of Barrick’s copper operations in comparison to other copper producers who present results on a similar basis. C1 cash costs per pound excludes royalties and production taxes and non-routine charges as they are not direct production costs. All-in sustaining costs per pound is similar to the gold all-in sustaining costs metric and management uses this to better evaluate the costs of copper production. The Company believes this measure enables investors to better understand the operating performance of the copper portion of the Company’s business as this measure reflects all of the sustaining expenditures incurred in order to produce copper. All-in sustaining costs per pound includes C1 cash costs, sustaining capital expenditures, sustaining leases, general and administrative costs, minesite exploration and evaluation costs, royalties and production taxes, reclamation cost accretion and amortization and write-downs taken on inventory to net realizable value.
Further details including a detailed reconciliation of these non-GAAP financial measures to their most directly comparable GAAP measure are incorporated by reference and provided on pages 59-67 of the MD&A filed on SEDAR+ at www.sedarplus.ca and on EDGAR at www.sec.gov.
Realized Prices
Realized price is a non-GAAP financial measure which excludes from sales:
| • | treatment and refining charges; and |
| • | cumulative catch-up adjustment to revenue relating to Barrick’s streaming arrangements. |
Barrick believes this provides investors and analysts with a more accurate measure with which to compare to market gold prices and to assess the Company’s gold sales performance. For those reasons, management believes that this measure provides a more accurate reflection of the Company’s past performance and is a better indicator of its expected performance in future periods.
The realized price measure is intended to provide additional information, and does not have any standardized definition under IFRS and should not be considered in isolation or as a substitute for measures of performance prepared in accordance with IFRS. The measure is not necessarily indicative of sales as determined under IFRS. Other companies may calculate this measure differently.
Further details including a detailed reconciliation of this non-GAAP financial measure to its most directly comparable GAAP measure are incorporated by reference and provided on page 69 of the MD&A filed on SEDAR+ at www.sedarplus.ca and on EDGAR at www.sec.gov.
- 152 -
Adjusted Net Earnings and Adjusted Net Earnings per Share
Adjusted net earnings is a non-GAAP financial measure which excludes the following from net earnings:
| • | impairment charges (reversals) related to intangibles, goodwill, property, plant and equipment, and investments; |
| • | acquisition/disposition gains/losses; |
| • | foreign currency translation gains/losses; |
| • | significant tax adjustments; |
| • | other items that are not indicative of the underlying operating performance of Barrick’s core mining business; and |
| • | tax effect and non-controlling interest of the above items. |
Management uses this measure internally to evaluate the Company’s underlying operating performance for the reporting periods presented and to assist with the planning and forecasting of future operating results. Management believes that adjusted net earnings is a useful measure of the Company’s performance because impairment charges, acquisition/disposition gains/losses and significant tax adjustments do not reflect the underlying operating performance of its core mining business and are not necessarily indicative of future operating results. Furthermore, foreign currency translation gains/losses are not necessarily reflective of the underlying operating results for the reporting periods presented. The tax effect and non-controlling interest of the adjusting items are also excluded to reconcile the amounts to Barrick’s share on a post-tax basis, consistent with net earnings.
As noted, Barrick uses this measure for internal purposes. Management’s internal budgets and forecasts and public guidance do not reflect the types of items that the Company adjusts for. Consequently, the presentation of adjusted net earnings enables investors and analysts to better understand the underlying operating performance of Barrick’s core mining business through the eyes of management. Management periodically evaluates the components of adjusted net earnings based on an internal assessment of performance measures that are useful for evaluating the operating performance of Barrick’s business segments and a review of the non-GAAP financial measures used by mining industry analysts and other mining companies.
Adjusted net earnings is intended to provide additional information only and does not have any standardized definition under IFRS and should not be considered in isolation or as a substitute for measures of performance prepared in accordance with IFRS. The measures are not necessarily indicative of operating profit or cash flow from operations as determined under IFRS. Other companies may calculate these measures differently.
Further details including a detailed reconciliation of this non-GAAP financial measure to its most directly comparable GAAP measure are incorporated by reference and provided on pages 57-58 of the MD&A filed on SEDAR+ at www.sedarplus.ca and on EDGAR at www.sec.gov.
Free Cash Flow and Attributable Free Cash Flow
Free cash flow is a non-GAAP financial measure that deducts capital expenditures from net cash provided by operating activities. Attributable free cash flow starts with free cash flow and adds Barrick’s attributable share of free cash flow from the Company’s equity investees and subtracts the free cash flow attributable to the non-controlling interests. Management believes these to be useful indicators of Barrick’s ability to operate without reliance on additional borrowing or usage of existing cash.
- 153 -
Free cash flow and attributable free cash flow are intended to provide additional information only and do not have any standardized definition under IFRS, and should not be considered in isolation or as a substitute for measures of performance prepared in accordance with IFRS. These measures are not necessarily indicative of operating profit or cash flow from operations as determined under IFRS. Other companies may calculate these measures differently.
Further details including a detailed reconciliation of these non-GAAP financial measures to their most directly comparable GAAP measures are incorporated by reference and provided on page 58 of the MD&A filed on SEDAR+ at www.sedarplus.ca and on EDGAR at www.sec.gov.
Capital Expenditures
Capital expenditures are classified into minesite sustaining capital expenditures or project capital expenditures depending on the nature of the expenditure. Minesite sustaining capital expenditures is the capital spending required to support delivery of the current mine plan. Project capital expenditures represent the capital spending at new projects and major, discrete projects at existing operations intended to increase net present value through higher production or longer mine life. Management believes this to be a useful indicator of the purpose of capital expenditures and this distinction is an input into the calculation of all-in sustaining costs per ounce.
Classifying capital expenditures is intended to provide additional information only and does not have any standardized definition under IFRS, and should not be considered in isolation or as a substitute for measures of performance prepared in accordance with IFRS. Other companies may calculate these measures differently.
Further details including a detailed reconciliation of this non-GAAP financial measure to its most directly comparable GAAP measure are incorporated by reference and provided on page 59 of the MD&A filed on SEDAR+ at www.sedarplus.ca and on EDGAR at www.sec.gov.
EBITDA, Adjusted EBITDA, Attributable EBITDA, Attributable EBITDA Margin and Net Leverage
EBITDA is a non-GAAP financial measure, which excludes the following from net earnings:
| • | income tax expense; |
| • | finance costs; |
| • | finance income; and |
| • | depreciation. |
Management believes that EBITDA is a valuable indicator of the Company’s ability to generate liquidity by producing operating cash flow to fund working capital needs, service debt obligations, and fund capital expenditures. Management uses EBITDA for this purpose. EBITDA is also frequently used by investors and analysts for valuation purposes whereby EBITDA is multiplied by a factor or “EBITDA multiple” that is based on an observed or inferred relationship between EBITDA and market values to determine the approximate total enterprise value of a company.
Adjusted EBITDA removes the effect of impairment charges; acquisition/disposition gains/losses; foreign currency translation gains/losses; and other expense adjustments. Barrick also removes the impact of the income tax expense, finance costs, finance income and depreciation incurred in its equity method accounted investments. Attributable EBITDA further removes the non-controlling interest portion. The Company believes these items provide a greater level of consistency with the adjusting items included in its adjusted net earnings reconciliation, with the exception that these amounts are adjusted to remove any impact on finance costs/income, income tax expense and/or depreciation as they do not
- 154 -
affect EBITDA. The Company believes this additional information will assist analysts, investors and other stakeholders of Barrick in better understanding its ability to generate liquidity from its attributable business, including equity method investments, by excluding these amounts from the calculation as they are not indicative of the performance of Barrick’s core mining business and do not necessarily reflect the underlying operating results for the periods presented. Additionally, it is aligned with how the Company presents its forward-looking guidance on gold ounces and copper pounds produced.
Attributable EBITDA margin is calculated as attributable EBITDA divided by revenues - as adjusted. The Company believes this ratio will assist analysts, investors and other stakeholders of Barrick to better understand the relationship between revenues and EBITDA or operating profit.
Net leverage is calculated as debt, net of cash divided by the sum of adjusted EBITDA of the last four consecutive quarters. Barrick believes this ratio will assist analysts, investors and other stakeholders of Barrick in monitoring the Company’s leverage and evaluating its balance sheet.
EBITDA, adjusted EBITDA, attributable EBITDA, attributable EBITDA margin and net leverage are intended to provide additional information to investors and analysts and do not have any standardized definition under IFRS, and should not be considered in isolation or as a substitute for measures of performance prepared in accordance with IFRS. EBITDA, adjusted EBITDA and attributable EBITDA exclude the impact of cash costs of financing activities and taxes, and the effects of changes in operating working capital balances, and therefore are not necessarily indicative of operating profit or cash flow from operations as determined under IFRS. Other companies may calculate EBITDA, adjusted EBITDA, attributable EBITDA, attributable EBITDA margin and net leverage differently.
Further details including a detailed reconciliation of this non-GAAP financial measure to its most directly comparable GAAP measure are incorporated by reference and provided on pages 67-68 of the MD&A filed on SEDAR+ at www.sedarplus.ca and on EDGAR at www.sec.gov.
- 155 -
INTERESTS OF EXPERTS
The Company’s independent auditors are PricewaterhouseCoopers LLP, Chartered Professional Accountants, who have issued a report of independent registered public accounting firm dated February 4, 2026, in respect of the Company’s Consolidated Financial Statements as at December 31, 2025 and December 31, 2024 and for each of the years then ended and on the effectiveness of the Company’s internal control over financial reporting as at December 31, 2025. PricewaterhouseCoopers LLP has advised that they are independent with respect to the Company within the meaning of the relevant rules and related interpretations prescribed by the relevant professional bodies in Canada and any applicable legislation or regulations, as well as the rules of the Public Company Accounting Oversight Board (PCAOB) on auditor independence.
ADDITIONAL INFORMATION
Additional information, including directors’ and officers’ remuneration and indebtedness, principal holders of the Company’s securities and securities authorized for issuance under equity compensation plans will be contained in the Company’s Management Information Circular and Proxy Statement expected to be dated March 27, 2026. As well, additional financial information is provided in the Company’s 2025 Annual Report, in the Company’s Consolidated Financial Statements (as prepared under IFRS) and Management’s Discussion and Analysis of Financial and Operating Results for the year ended December 31, 2025 (as prepared under IFRS), each of which is available electronically from SEDAR+ (www.sedarplus.ca) and from EDGAR (www.sec.gov). Additional information relating to Barrick is available on SEDAR+ at www.sedarplus.ca and on EDGAR at www.sec.gov.
- 156 -
SCHEDULE “A” AUDIT & RISK COMMITTEE MANDATE
Purpose
| 1. | The purpose of the Audit & Risk Committee (the “Committee”) of the Board of Directors (the “Board”) is to assist the Board in its oversight of: (a) the financial reporting process and the quality, transparency and integrity of the Company’s financial statements and other related public disclosures; (b) the Company’s internal controls over financial reporting; (c) the Company’s compliance with legal and regulatory requirements relevant to the financial statements and financial reporting; (d) the external auditor’s qualifications and independence; (e) the performance of the internal audit function and the external auditor; (f) the Company’s management of enterprise risks as well as the implementation of policies and standards for monitoring and mitigating such risks; and (g) the Company’s financial structure and investment and financial risk management programs generally. |
| 2. | The function of the Committee is oversight. The members of the Committee are not full-time employees of the Company. The Company’s management is responsible for the preparation of the Company’s financial statements in accordance with applicable accounting standards and applicable laws and regulations. The Company’s external auditor is responsible for the audit or review, as applicable, of the Company’s financial statements in accordance with applicable auditing standards and laws and regulations. |
Committee Responsibilities
| 3. | The Committee’s responsibilities include: |
External Auditor
| (a) | retaining and terminating, and/or making recommendations to the Board and the shareholders with respect to the retention or termination of an external auditing firm to conduct review engagements on a quarterly basis and an annual audit of the Company’s financial statements; |
| (b) | communicating to the external auditor that it is ultimately accountable to the Board and the Committee as representatives of the shareholders; |
| (c) | obtaining and reviewing an annual report prepared by the external auditor describing: the firm’s internal quality control procedures; any material issues raised by the most recent internal quality control review, or peer review, of the firm, or by any inquiry or investigation by governmental or professional authorities, within the preceding five years, respecting one or more independent audits carried out by the firm, and any steps taken to deal with any such issues; |
| (d) | evaluating the independence of the external auditor and any potential conflicts of interest and (to assess the auditor’s independence) all relationships between the external auditor and the Company, including obtaining and reviewing an annual report prepared by the external auditor describing all relationships between the external auditor and the Company; |
| (e) | approving, or recommending to the Board for approval, all audit engagement fees and terms, as well as all non-audit engagements of the external auditor prior to the commencement of the engagement; |
| (f) | reviewing with the external auditor the plan and scope of the quarterly review and annual audit engagements; |
- A-1 -
| (g) | setting hiring policies with respect to the employment of current or former employees of the external auditor; |
Financial Reporting
| (h) | reviewing, discussing and recommending to the Board for approval the annual audited financial statements and related management’s discussion and analysis of financial and operating results prior to filing with securities regulatory authorities and delivery to shareholders; |
| (i) | reviewing and discussing with the external auditor the results of its reviews and audit, any issues arising and management’s response, including any restrictions on the scope of the external auditor’s activities or requested information and any significant disagreements with management, and resolving any disputes; |
| (j) | reviewing, discussing and approving, or recommending to the Board for approval, the quarterly financial statements and quarterly management’s discussion and analysis of financial and operating results prior to filing with securities regulatory authorities and delivery to shareholders; |
| (k) | reviewing and discussing with management and the external auditor the Company’s critical accounting policies and practices, material alternative accounting treatments, significant accounting and reporting judgments, material written communications between the external auditor and management (including management representation letters and any schedule of unadjusted differences) and significant adjustments resulting from the audit or review; |
| (l) | reviewing and discussing with management the Company’s earnings press releases, as well as types of financial information and earnings guidance (if any) provided to analysts and ratings agencies; |
| (m) | reviewing and discussing such other relevant public disclosures containing financial information as the Committee may consider necessary or appropriate; |
| (n) | reviewing and discussing with management the disclosure controls relating to the Company’s public disclosure of financial information, including information extracted or derived from the financial statements, and periodically assessing the adequacy of such procedures; |
Internal Controls Over Financial Reporting
| (o) | reviewing and discussing with management, the external auditor and the head of internal audit the effectiveness of the Company’s internal controls over financial reporting, including reviewing and discussing any significant deficiencies in the design or operation of internal controls, and any fraud, whether or not material, that involves management or other employees who have a significant role in the Company’s internal controls over financial reporting; |
| (p) | discussing the Company’s process with respect to risk assessment (including fraud risk), risk management and the Company’s major financial risks and financial reporting exposures, all as they relate to internal controls over financial reporting, and the steps management has taken to monitor and control such risks; |
- A-2 -
| (q) | reviewing and discussing with management the Company’s Code of Business Conduct and Ethics and anti-fraud program and the actions taken to monitor and enforce compliance; |
| (r) | establishing procedures for: |
| (i) | the receipt, retention and treatment of complaints regarding accounting, internal controls or auditing matters; and |
| (ii) | the confidential, anonymous submission by employees of the Company of concerns regarding questionable accounting, internal controls or auditing matters; |
Internal Audit
| (s) | reviewing and discussing with management, the external auditor and the head of internal audit the responsibilities and effectiveness of the Company’s internal audit function, including reviewing the internal audit mandate, independence, organizational structure, internal audit plans and adequacy of resources, receiving periodic internal audit reports and meeting privately with the head of internal audit on a periodic basis; |
| (t) | approving in advance the retention and dismissal of the head of internal audit; |
Enterprise Risks
| (u) | reviewing: |
| 1. | the Company’s processes relating to enterprise risk management; |
| 2. | the Company’s overall strategy relating to enterprise risks, including financial, regulatory, strategic and operational risks; |
| 3. | the Company’s risk tolerance and its alignment with the Company’s strategic plans; and |
| 4. | the design and implementation of policies and standards that provide for the monitoring of, and promote compliance with, legal and regulatory requirements; |
| (v) | at the request of the Board, reviewing and advising on the risk impact of any strategic decision or exposures to countries and key markets where the Company carries on business to ensure that they are in keeping with overall Company risk tolerances; |
| (w) | reviewing the Company’s material publicly filed disclosure relating to risk and risk management; |
| (x) | meeting as required with representatives of the Company’s various departments and/or external advisors to discuss the risks faced by the Company and the Company’s risk management activities; |
Financial Matters
| (y) | reviewing the policies underlying the financial plan of the Company to ensure its adequacy and soundness in providing for the Company’s operational and capital plans; |
- A-3 -
| (z) | reviewing the Company’s debt and equity structure; |
| (aa) | reviewing proposed major financing activities; |
| (bb) | reviewing the method for financing proposed major acquisitions by the Company; |
| (cc) | reviewing the prepayment, redemption, acquisition or defeasance of any material issue of debt or equity; |
| (dd) | authorizing policies or procedures for entering into investments and reviewing investment strategies for the Company’s cash balances; and |
| (ee) | reviewing the Company’s financial risk management program, including any significant commodity, currency or interest rate hedging programs; |
Other
| (ff) | meeting separately, periodically, with each of management, the head of internal audit and the external auditor; |
| (gg) | reporting regularly to the Board and, where appropriate, making recommendations to management of the Company and/or to the Board; |
| (hh) | liaising with the Compensation Committee and the Environmental, Social, Governance & Nominating Committee of the Board, as appropriate, on matters relevant to the Company’s management of enterprise risks; |
| (ii) | reviewing and assessing its mandate and recommending any proposed changes to the Environmental, Social, Governance & Nominating Committee of the Board on an annual basis; and |
| (jj) | evaluating the functioning of the Committee on an annual basis, including with reference to the discharge of its mandate. |
Responsibilities of the Committee Chair
4. The fundamental responsibility of the Committee Chair is to be responsible for the management and effective performance of the Committee and provide leadership to the Committee in fulfilling its mandate and any other matters delegated to it by the Board. To that end, the Committee Chair’s responsibilities include:
| (a) | working with the Chairman and the Secretary to establish the frequency of Committee meetings and the agendas for meetings; |
| (b) | providing leadership to the Committee and presiding over Committee meetings; |
| (c) | facilitating the flow of information to and from the Committee and fostering an environment in which Committee members may ask questions and express their viewpoints; |
| (d) | reporting to the Board with respect to the significant activities of the Committee and any recommendations of the Committee; |
- A-4 -
| (e) | liaising with the Chairs of the Compensation Committee and the Environmental, Social, Governance & Nominating Committee of the Board, as appropriate, on matters relevant to the Company’s management of enterprise risks; |
| (f) | leading the Committee in annually reviewing and assessing the adequacy of its mandate and evaluating its effectiveness in fulfilling its mandate; and |
| (g) | taking such other steps as are reasonably required to ensure that the Committee carries out its mandate. |
Powers
5. The Committee shall have the authority, including approval of fees and other retention terms, to obtain advice and assistance from outside legal, accounting or other advisors in its sole discretion, at the expense of the Company, which shall provide adequate funding for such purposes. The Company shall also provide the Committee with adequate funding for the ordinary administrative expenses of the Committee. The Committee shall have unrestricted access to information, management, the external auditor and the head of internal audit, including private meetings, as it considers necessary or appropriate to discharge its duties and responsibilities. The Committee may, in its discretion, delegate all or a portion of its duties and responsibilities to a subcommittee of the Committee.
Composition
6. The Committee shall be appointed by the Board annually and shall be comprised of a minimum of three directors. If an appointment of members of the Committee is not made as prescribed, the members shall continue as such until their successors are appointed.
7. All of the members of the Committee shall be directors whom the Board has determined are independent, taking into account the applicable rules and regulations of securities regulatory authorities and/or stock exchanges.
8. Each member of the Committee shall be “financially literate” and at least one member of the Committee shall have “accounting or related financial management expertise”.(1) At least one member of the Committee shall be an “audit committee financial expert”, as defined in the applicable rules and regulations of securities regulatory authorities and/or stock exchanges.
9. If a Committee member simultaneously serves on the audit committee of more than two other public companies, the Board shall make a determination as to whether such service impairs the ability of such member to serve effectively on the Committee and disclose such determination in the Company’s annual proxy statement.
Meetings
10. The Committee shall have a minimum of four meetings per year, to coincide with the Company’s financial reporting cycle. Additional meetings will be scheduled as considered necessary or appropriate, including to consider specific matters at the request of the external auditor or the head of internal audit.
11. The time and place of the meetings of the Committee, the calling of meetings and the procedure at such meetings shall be determined by the Chair of the Committee unless otherwise determined by the articles of the Company or by resolution of the Board, provided that all matters put forward for approval by the Committee shall be determined by majority vote.
- A-5 -
(1) For purposes of this mandate, “financially literate” means the ability to read and understand a balance sheet, an income statement, a cash flow statement and the related notes that present a breadth and level of complexity of accounting issues that are generally comparable to the breadth and complexity of issues that can reasonably be expected to be raised by the Company’s financial statements, and “accounting or related financial management expertise” means the ability to analyze and interpret a full set of financial statements, including the related notes that present a breadth and level of complexity of accounting issues that are generally comparable to the breadth and complexity of issues that can reasonably be expected to be raised by the Company’s financial statements.
- A-6 -