Please wait
.4
Management’s Discussion and Analysis
(“MD&A”)
Fourth Quarter and Full Year
2025
Management’s
Discussion and Analysis (“MD&A”) is intended to help the reader understand Barrick Mining Corporation (formerly Barrick Gold Corporation) (“Barrick”, “we”, “our”, the “Company” or the
“Group”), our operations, financial performance and the present and future business environment. This MD&A, which has been prepared as of February 4, 2026, should be read in conjunction with our audited consolidated financial
statements (“Financial Statements”) for the year ended December 31, 2025. Unless otherwise indicated, all amounts are presented in U.S. dollars.
For the purposes of preparing our MD&A, we consider the materiality of information. Information is considered material if: (i) such
information results in, or would reasonably be expected to result in, a significant change in the market
price or value of our shares; (ii) there is a substantial likelihood that a reasonable investor would consider it important in making an
investment decision; or (iii) it would significantly alter the total mix of information available to investors. We evaluate materiality with reference to all relevant circumstances, including potential market
sensitivity.
Continuous disclosure materials, including our most recent
Form 40-F/Annual Information Form, annual MD&A, audited consolidated financial statements, and Notice of Annual Meeting of Shareholders and Proxy Circular will be available on our website at www.barrick.com, on SEDAR+ at
www.sedarplus.ca and on EDGAR at www.sec.gov. For an explanation of terminology unique to the mining industry, readers should refer to the glossary on page
74.
Abbreviations
|
|
|
|
|
|
|
|
| AISC |
All-in Sustaining Costs |
| ARK |
Agbarabo-Rhino-Kombokolo |
|
|
|
|
|
|
|
|
| BNL |
Barrick Niugini Limited |
|
|
|
|
| CDCs |
Community Development Committees |
|
|
|
|
| CIL |
Carbon-in-leach |
| Commencement Agreement |
Detailed Porgera Project Commencement Agreement between PNG and
BNL |
|
|
|
|
|
|
|
|
|
|
|
|
| DRC |
Democratic Republic of the Congo |
| E&S Committee |
Environmental and Social Oversight Committee |
|
|
|
|
|
|
|
|
|
|
| EPCM |
Engineering, Procurement, and Construction
Management |
| ESG & Nominating
Committee |
Environmental, Social, Governance & Nominating
Committee |
|
|
|
|
|
|
|
|
|
|
|
|
| GHG |
Greenhouse Gas |
| GISTM |
Global Industry Standard for Tailings Management |
| GoT |
Government of Tanzania |
|
|
|
|
| ICMM |
International Council on Mining and Metals |
| ICSID |
International Centre for the Settlement of Investment
Disputes |
| IFRS |
IFRS Accounting Standards as issued by the International
Accounting Standards Board |
|
|
|
|
|
|
|
|
|
|
|
|
|
|
| IPO |
Initial Public Offering |
| KCD |
Karagba, Chauffeur and Durba |
|
|
|
|
|
|
|
|
|
|
| Ktpa
|
Thousand tonnes per
annum |
|
|
|
|
|
|
| Lb |
Pound |
| LTI |
Lost Time Injury |
| LTIFR |
Lost Time Injury Frequency Rate |
| LOM |
Life of Mine |
|
|
|
|
|
|
|
|
| Mtpa |
Million tonnes per annum |
| MVA |
Megavolt-amperes |
| MW |
Megawatt |
|
|
| NGM |
Nevada Gold Mines |
|
|
| OECD |
Organisation for Economic Co-operation and
Development |
|
|
|
|
| Oz |
Ounce |
| PJL |
Porgera Jersey Limited |
| PNG |
Papua New Guinea |
|
|
| Randgold |
Randgold Resources Limited |
|
|
|
|
|
|
|
|
|
|
|
|
|
|
| SDG |
Sustainable Development Goals |
|
|
| TCC |
Total Cash Costs |
| TCFD |
Task Force for Climate-related Financial
Disclosures |
| TRIFR |
Total Recordable Injury Frequency Rate |
| TSF |
Tailings Storage Facilities |
| TW |
True Width |
|
|
|
|
|
|
|
|
|
|
| TWMS |
Temporary Water Management Structures |
| VAT |
Value-Added Tax |
|
|
| WGC |
World Gold Council |
| WTI
|
West Texas
Intermediate |
|
|
|
|
|
|
|
|
|
BARRICK YEAR-END 2025 |
1 |
MANAGEMENT’S DISCUSSION AND
ANALYSIS |
Cautionary Statement on Forward-Looking
Information
Certain
information contained or incorporated by reference in this MD&A, including any information as to our strategy, projects, plans or future financial or operating performance, constitutes “forward-looking statements”. All statements,
other than statements of historical fact, are forward-looking statements. The words “believe”, “expect”, “anticipated”, “aim”, “strategy”, “ramp up”, “target”,
“plan”, “opportunities”, “guidance”, “forecast”, “outlook”, “project”, “develop”, “progress”, “continue”, “temporary”,
“committed”, “estimate”, “potential”, “prospective”, “future”, “focus”, “ongoing”, “following”, “subject to”, “scheduled”,
“may”, “will”, “can”, “could”, “would”, “should” and similar expressions identify forward-looking statements. In particular, this MD&A contains forward-looking statements
including, without limitation, with respect to: Barrick’s forward-looking production and cost guidance, including our three-year gold and copper production outlook; anticipated production growth from Barrick’s organic project
pipeline and reserve replacement; estimates of future cost of sales per ounce for gold and per pound for copper, total cash costs per ounce and C1 cash costs per pound, and all-in sustaining costs per ounce/pound; cash flow
forecasts; projected capital, operating and exploration expenditures; the share buyback program and performance dividend policy; mine life and production rates; contingent consideration from the sale of the Hemlo gold mine and the
Tongon gold mine; anticipated timing for development of the Goldrush Project; our plans, timelines, and expected completion and benefits of our growth projects, including the Goldrush Project, Fourmile, Ren, Pueblo Viejo plant expansion and
mine life extension project, Veladero Phase 8 Leach Pad, Reko Diq, solar power project at Kibali, and the Lumwana Super Pit Expansion; anticipated production at Goldrush, Ren, Reko Diq and Lumwana; the doubling of mineral resources at
Fourmile; capital expenditures related to upgrades and ongoing management initiatives; Barrick’s global exploration strategy and planned exploration activities; Barrick’s strategic copper business; our pipeline of high
confidence projects at or near existing operations; the resumption of operations at Loulo-Gounkoto following the resolution of disputes with the Government of Mali, including adoption of the 2023 Mining Code; the incorporation of Fourmile
into the NGM joint venture at fair market value; potential mineralization and metal or mineral recoveries; Barrick’s intention to explore and potential benefits and expected timing of an initial public offering of its North American
gold assets; our ability to convert resources into reserves and future reserve replacement; asset sales, joint ventures and partnerships; Barrick’s strategy, plans, targets and goals in respect of sustainability issues, including
climate change, greenhouse gas (“GHG”) emissions reduction targets, human rights, safety performance, community development and resettlement, and responsible water use; Barrick’s search for a permanent President and Chief
Executive Officer; and expectations regarding future price assumptions, financial performance and other outlook or guidance.
Forward-looking statements are necessarily based upon a number of estimates and assumptions including material estimates and assumptions related to
the factors set forth below that, while considered reasonable by the Company as at the date of this MD&A in light of management’s experience and perception of current conditions and expected developments, are inherently subject to
significant business, economic and competitive
uncertainties and contingencies. Known and unknown factors could cause actual results to differ materially from those projected in the
forward-looking statements and undue reliance should not be placed on such statements and information. Such factors include, but are not limited to: fluctuations in the spot and forward price of gold, copper or certain other commodities (such as
silver, diesel fuel, natural gas and electricity); risks associated with projects in the early stages of evaluation and for which additional engineering and other analysis is required; risks related to the possibility that future exploration
results will not be consistent with the Company’s expectations, that quantities or grades of reserves will be diminished, and that resources may not be converted to reserves; risks associated with the fact that certain of the initiatives
described in this MD&A are still in the early stages and may not materialize; changes in mineral production performance, exploitation and exploration successes; risks that exploration data may be incomplete and considerable additional
work may be required to complete further evaluation, including but not limited to drilling, engineering and socioeconomic studies and investment; the speculative nature of mineral exploration and development; lack of certainty with respect
to foreign legal systems, corruption and other factors that are inconsistent with the rule of law; changes in national and local government legislation, taxation, controls or regulations and/or changes in the administration of laws, policies
and practices, including the expropriation or nationalization of property and political or economic developments in Canada, the United States or other countries in which Barrick does or may carry on business in the future; risks relating to
political instability in certain of the jurisdictions in which Barrick operates; timing of receipt of, or failure to comply with, necessary permits and approvals; non-renewal of key licenses by governmental authorities; failure to comply
with environmental and health and safety laws and regulations; increased costs and physical and transition risks related to climate change, including extreme weather events, resource shortages, emerging policies and increased regulations related
to GHG emission levels, energy efficiency and reporting of risks; the Company's ability to achieve its sustainability goals, including its climate-related goals and GHG emissions reduction targets, in particular its ability to achieve its Scope
3 emissions targets which require reliance on entities within Barrick's value chain, but outside of the Company's direct control, to achieve such targets within the specified time frames; contests over title to properties, particularly title to
undeveloped properties, or over access to water, power and other required infrastructure; the liability associated with risks and hazards in the mining industry, and the ability to maintain insurance to cover such losses; damage to the
Company’s reputation due to the actual or perceived occurrence of any number of events, including negative publicity with respect to the Company’s handling of environmental matters or dealings with community groups, whether true or
not; risks related to operations near communities that may regard Barrick’s operations as being detrimental to them; litigation and legal and administrative proceedings; operating or technical difficulties in connection with mining
or development activities, including geotechnical challenges, tailings dam and storage facilities failures, and disruptions in the maintenance or provision of required infrastructure and information technology systems; increased costs, delays,
suspensions and technical
|
|
|
|
|
|
|
|
|
BARRICK YEAR-END 2025 |
2 |
MANAGEMENT’S DISCUSSION AND
ANALYSIS |
challenges associated with the construction of capital projects; risks associated with working with
partners in jointly controlled assets; risks related to disruption of supply routes which may cause delays in construction and mining activities, including disruptions in the supply of key mining inputs due to the invasion of Ukraine by Russia
and conflicts in the Middle East; risk of loss due to acts of war, terrorism, sabotage and civil disturbances; risks associated with artisanal and illegal mining; risks associated with Barrick’s infrastructure, information
technology systems and the implementation of Barrick’s technological initiatives, including risks related to cybersecurity incidents, including those caused by computer viruses, malware, ransomware and other cyberattacks, or similar
information technology system failures, delays and/or disruptions; the impact of global liquidity and credit availability on the timing of cash flows and the values of assets and liabilities based on projected future cash flows; the
impact of inflation, including global inflationary pressures driven by ongoing global supply chain disruptions, global energy cost increases following the invasion of Ukraine by Russia and country-specific political, economic factors in Argentina
and uncertainty related to Venezuela; adverse changes in our credit ratings; fluctuations in the currency markets; changes in U.S. dollar interest rates; changes in U.S. trade, tariff and other controls on imports and exports, tax,
immigration or other policies that may impact relations with foreign countries, result in retaliatory policies, lead to increased costs for raw materials and components, or impact Barrick’s existing operations and material growth projects;
risks arising from holding derivative instruments (such as credit risk, market liquidity risk and mark-to-market risk); risks related to the demands placed on the Company’s management, the ability of management to implement its business
strategy and enhanced political risk in certain jurisdictions; uncertainty whether some or all of Barrick’s targeted investments and projects will meet the Company’s
capital allocation objectives and internal hurdle rate; whether benefits expected from recent transactions are realized; business
opportunities that may be presented to, or pursued by, the Company; our ability to successfully integrate acquisitions or complete divestitures; risks related to competition in the mining industry; employee relations including loss of
key employees; availability and increased costs associated with mining inputs and labor; risks associated with diseases, epidemics and pandemics; risks related to the failure of internal controls; and risks related to the impairment
of the Company’s goodwill and assets. In addition, there are risks and hazards associated with the business of mineral exploration, development and mining, including environmental hazards, industrial accidents, unusual or unexpected
formations, pressures, cave-ins, flooding and gold bullion, copper cathode or gold or copper concentrate losses (and the risk of inadequate insurance, or inability to obtain insurance, to cover these
risks).
Many of these uncertainties and contingencies can affect our actual
results and could cause actual results to differ materially from those expressed or implied in any forward-looking statements made by, or on behalf of, us. Readers are cautioned that forward-looking statements are not guarantees of future
performance. All of the forward-looking statements made in this MD&A are qualified by these cautionary statements. Specific reference is made to the most recent Form 40-F/Annual Information Form on file with the SEC and Canadian provincial
securities regulatory authorities for a more detailed discussion of some of the factors underlying forward-looking statements and the risks that may affect Barrick’s ability to achieve the expectations set forth in the forward-looking
statements contained in this MD&A. We disclaim any intention or obligation to update or revise any forward-looking statements whether as a result of new information, future events or otherwise, except as required by applicable
law.
Use
of Non-GAAP Financial Measures
We use the following non-GAAP financial measures and ratios in our
MD&A:
■“adjusted net earnings”
■“free
cash flow”
■“attributable free cash flow”
■“EBITDA”
■“adjusted EBITDA”
■“attributable
EBITDA”
■“attributable EBITDA margin”
■“net
leverage”
■“minesite sustaining capital
expenditures”
■“project capital expenditures”
■“TCC/oz”
■“C1 cash costs/lb”
■“AISC
per oz/lb” and
■“realized price per
oz/lb”
For a detailed description of each of the non-GAAP financial measures used in this MD&A and a detailed
reconciliation to the most directly comparable measure under IFRS, please refer to the Non-GAAP Financial Measures section of this MD&A on pages 57 to 69. Each non-GAAP financial measure has been annotated with a reference to an endnote on page
70. The non-GAAP financial measures set out in this MD&A are intended to provide additional information to investors and do not have any standardized meaning under IFRS, and therefore may not be comparable to other issuers, and should not be
considered in isolation or as a substitute for measures of performance prepared in accordance with
IFRS.
|
|
|
|
|
|
|
|
|
BARRICK YEAR-END 2025 |
3 |
MANAGEMENT’S DISCUSSION AND
ANALYSIS |
Index
|
|
|
|
|
|
|
|
|
|
|
|
|
| 5
|
Overview
|
|
|
5 |
Our Vision |
|
|
5 |
Our
Business |
|
|
5 |
Our
Strategy |
|
|
6 |
Financial and Operating
Highlights |
|
|
9 |
Key Business
Developments |
|
|
12 |
Outlook for
2026 |
|
|
15 |
Sustainability |
|
|
18 |
Market
Overview |
|
|
19 |
Reserves and
Resources |
|
|
21 |
Risks and Risk
Management |
|
|
|
|
|
| 23
|
Operating
Performance |
|
|
23 |
Nevada Gold
Mines |
|
|
|
24 |
Carlin |
|
|
|
26 |
Cortez |
|
|
|
28 |
Turquoise
Ridge |
|
|
|
|
|
|
|
|
|
|
|
30 |
Pueblo
Viejo |
|
|
|
|
|
|
32 |
Kibali |
|
|
|
|
|
|
34 |
North Mara |
|
|
36 |
Bulyanhulu |
|
|
38 |
Other Mines -
Gold |
|
|
40 |
Lumwana |
|
|
42 |
Other Mines - Copper |
|
| 43
|
Future Growth
|
|
|
|
|
|
|
|
|
|
|
|
|
|
|
|
|
|
|
|
|
|
|
|
|
|
|
|
|
|
|
|
|
|
|
|
|
|
|
|
|
|
|
|
|
|
|
|
|
|
|
|
|
|
|
|
|
|
|
|
|
|
|
|
|
|
|
|
|
|
|
|
|
|
|
|
|
|
|
|
|
|
|
|
|
|
|
|
|
|
|
|
|
|
|
|
|
|
|
|
|
|
|
|
|
|
|
|
|
|
|
|
|
|
|
|
|
|
|
|
|
|
|
|
|
|
|
|
|
|
|
|
|
|
|
|
|
|
|
|
|
|
|
|
|
|
|
|
|
|
|
|
|
|
|
|
|
|
|
|
|
|
|
|
|
|
|
|
|
|
|
|
| 46
|
Review
of Financial Results |
|
46 |
Revenue |
|
47 |
Production
Costs |
|
|
|
|
48 |
General and Administrative
Expenses |
|
49 |
Exploration, Evaluation and
Project Costs |
|
49 |
Finance Costs,
Net |
|
49 |
Additional Significant
Statement of Income Items |
|
50 |
Income Tax Expense |
| 52
|
Financial
Condition Review |
|
52 |
Balance Sheet
Review |
|
|
|
|
52 |
Financial Position and
Liquidity |
|
53 |
Summary of Cash Inflow
(Outflow) |
|
54 |
Summary of Financial Instruments |
| 55
|
Commitments and Contingencies |
| 56
|
Review of Quarterly Results |
| 56
|
Internal Control Over Financial Reporting and Disclosure Controls and Procedures |
| 57
|
IFRS Critical Accounting Policies and Accounting Estimates |
| 57
|
Non-GAAP Financial Measures |
| 70
|
Technical Information |
| 70
|
Endnotes |
| 74
|
Glossary of Technical Terms |
| 75
|
Mineral Reserves and Mineral Resources Tables |
| 85
|
Management’s Responsibility |
| 85
|
Management’s Report on Internal Control Over Financial Reporting |
| 86
|
Independent Auditor’s Report |
| 90
|
Financial Statements |
| 95 |
Notes to Consolidated Financial
Statements |
|
|
|
|
|
|
|
|
|
BARRICK YEAR-END 2025 |
4 |
MANAGEMENT’S DISCUSSION AND
ANALYSIS |
Overview
Our Vision
We strive to be the world’s most valued gold and copper company by owning the best assets, managed by the best people, to deliver the best
returns and benefits for all our stakeholders.
Our Business
Barrick is a sector-leading gold and copper producer with annual gold production and gold reserves that are among the highest in the industry. We are
principally engaged in the responsible production and sale of gold and copper, as well as related activities such as exploration and mine development. We hold ownership interests in eleven producing gold mines and three producing copper mines. These
include five Tier One Gold Assets1, two Tier One Copper Assets/Projects3 and a diversified exploration portfolio positioned for growth in many of the world’s most prolific gold districts. Over 50% of our gold
production comes from North America. Our eleven producing gold mines are geographically diversified spanning the United States, the Dominican Republic, Tanzania, the Democratic Republic of the Congo, Mali, Argentina and Papua New Guinea. Our three
producing copper mines are located in Zambia, Chile and Saudi Arabia, with a greenfield project in Pakistan. Our exploration and other development projects are located throughout the world, including the Americas, Asia and Africa. We sell our
production globally through the following distribution channels: gold bullion is sold in the gold spot market or to independent refineries; gold and copper concentrate is sold to independent smelting or trading companies; and copper
cathode is sold to third-party purchasers or on an exchange. Barrick shares trade on the New York Stock Exchange under the symbol B (formerly GOLD) and the Toronto Stock Exchange under the symbol
ABX.
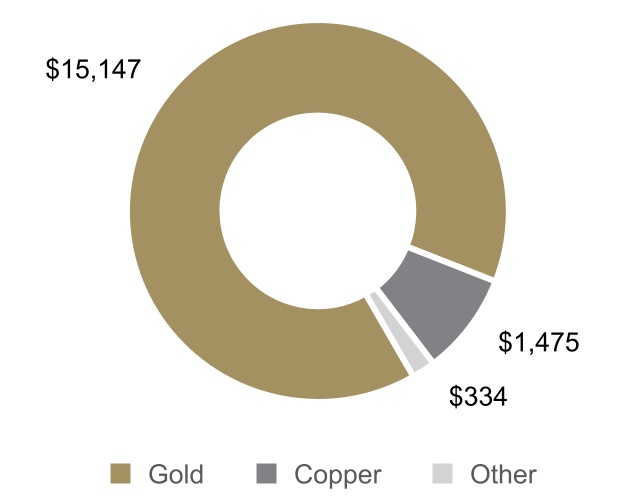
2025 REVENUE ($ millions)
Our Strategy
We apply a business ownership model to our operations, attracting and developing world-class people who understand and are involved in the value
chain of the business, act with integrity and are tireless in their pursuit of excellence and safety. We seek to deliver for all our stakeholders by optimizing free cash flow and managing risk to create long-term value for our shareholders while
partnering with host governments and local communities to transform their country’s natural resources into sustainable benefits with mutual prosperity. We aim to achieve this through the following:1
Asset Quality
■Grow and
invest in a portfolio of Tier One Gold Assets1, Tier Two Gold Assets2, Tier One Copper Assets/Projects3 and Strategic Assets4 with an emphasis on organic growth, leveraging our footprint in world-class geological districts. We focus our efforts on identifying and developing
assets that meet our investment criteria. Our required return on Tier
One1,3 capital investments is 15%, adjusting to 10% return on long-life (20+ year) investments with exposure to multiple commodity cycles. Our required
return on investment for Tier Two Gold Assets2 is 20%.
■Invest
in exploration across extensive land positions in many of the world’s most prolific gold and copper districts.
■Maximize
the long-term value of our strategic Copper Business5.
■Sell
non-core assets over time in a disciplined manner.
Operational Excellence
■Strive
for zero harm workplaces.
■Operate a decentralized management structure with a strong ownership culture.
■Streamline management and operations, and hold management accountable for the businesses they manage.
■Leverage innovation and technology to drive industry-leading efficiencies.
■Build trust-based partnerships with our host governments, business partners, and local communities to drive shared long-term
value.
Sustainable
Profitability
■Follow a disciplined approach to growth and proactively manage our impacts on the wider environment, emphasizing long-term value
for all stakeholders.
■Focus on increasing returns to shareholders, driven by return on capital, internal rate of return and free cash flow6
generation.
1 Numerical annotations throughout the text of this document refer to the endnotes found on page 70.
|
|
|
|
|
|
|
|
|
BARRICK YEAR-END 2025 |
5 |
MANAGEMENT’S DISCUSSION AND
ANALYSIS |
Financial and Operating Highlights
|
|
|
|
|
|
|
|
|
|
|
|
|
|
|
|
|
|
|
|
|
|
|
|
|
|
|
|
|
|
|
For the three months ended |
|
For the years ended |
| |
12/31/25
|
9/30/25 |
% Change |
|
12/31/25
|
12/31/24 |
% Change |
|
12/31/23 |
Financial
Results ($ millions) |
|
|
|
|
|
|
|
|
|
| Revenues |
5,997 |
|
4,148 |
|
45% |
|
16,956 |
|
12,922 |
|
31% |
|
11,397 |
|
| Cost of sales |
2,712 |
|
1,890 |
|
43% |
|
8,265 |
|
7,961 |
|
4% |
|
7,932 |
|
Net earningsa |
2,406 |
|
1,302 |
|
85% |
|
4,993 |
|
2,144 |
|
133% |
|
1,272 |
|
Adjusted net earningsb |
1,754 |
|
982 |
|
79% |
|
4,139 |
|
2,213 |
|
87% |
|
1,467 |
|
Attributable EBITDAb |
3,084 |
|
2,022 |
|
53% |
|
8,157 |
|
5,185 |
|
57% |
|
3,987 |
|
Attributable EBITDA marginb |
64 |
% |
59 |
% |
8% |
|
58 |
% |
48 |
% |
21% |
|
42 |
% |
Minesite sustaining capital
expendituresb,c |
458 |
|
395 |
|
16% |
|
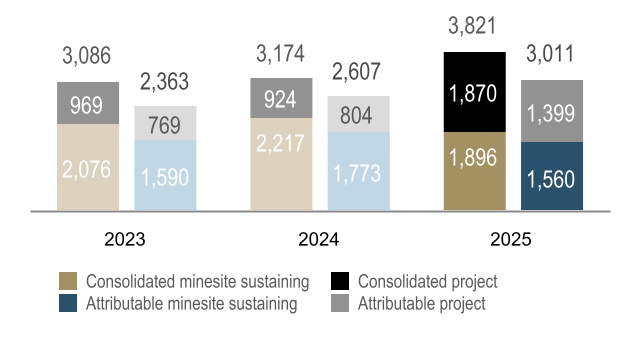
1,896 |
|
2,217 |
|
(14)% |
|
2,076 |
|
Project capital expendituresb,c |
630 |
|
532 |
|
18% |
|
1,870 |
|
924 |
|
102% |
|
969 |
|
Total consolidated capital
expendituresc,d |
1,107 |
|
943 |
|
17% |
|
3,821 |
|
3,174 |
|
20% |
|
3,086 |
|
Total attributable capital
expenditurese |
906 |
|
757 |
|
20% |
|
3,011 |
|
2,607 |
|
15% |
|
2,363 |
|
| Net cash provided by operating
activities |
2,726 |
|
2,422 |
|
13% |
|
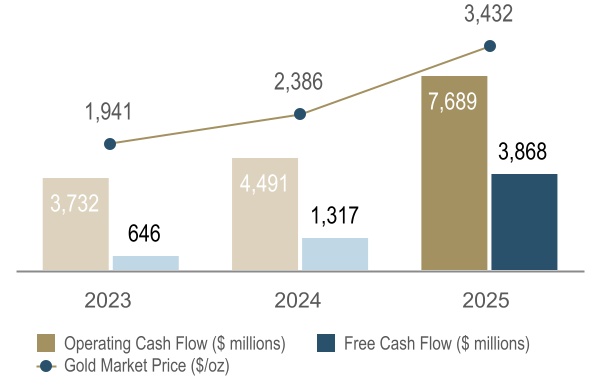
7,689 |
|
4,491 |
|
71% |
|
3,732 |
|
Net cash provided by operating
activities marginf |
45 |
% |
58 |
% |
(22)% |
|
45 |
% |
35 |
% |
29% |
|
33 |
% |
Free cash flowb |
1,619 |
|
1,479 |
|
9% |
|
3,868 |
|
1,317 |
|
194% |
|
646 |
|
Attributable free cash flowb |
1,060 |
|
1,154 |
|
(8)% |
|
2,837 |
|
1,091 |
|
160% |
|
399 |
|
| Net earnings per share (basic and
diluted) |
1.43 |
|
0.76 |
|
88% |
|
2.93 |
|
1.22 |
|
140% |
|
0.72 |
|
Adjusted net earnings
(basic)b per share |
1.04 |
|
0.58 |
|
79% |
|
2.42 |
|
1.26 |
|
92% |
|
0.84 |
|
| Weighted average diluted common shares
(millions of shares) |
1,684 |
|
1,703 |
|
(1)% |
|
1,707 |
|
1,751 |
|
(3)% |
|
1,755 |
|
| Operating
Results |
|
|
|
|
|
|
|
|
|
Gold production (thousands of
ounces)g |
871 |
|
829 |
|
5% |
|
3,255 |
|
3,911 |
|
(17)% |
|
4,054 |
|
Gold sold (thousands of
ounces)g |
960 |
|
837 |
|
15% |
|
3,318 |
|
3,798 |
|
(13)% |
|
4,024 |
|
| Market gold price ($/oz) |
4,135 |
|
3,457 |
|
20% |
|
3,432 |
|
2,386 |
|
44% |
|
1,941 |
|
Realized gold priceb,g ($/oz) |
4,177 |
|
3,457 |
|
21% |
|
3,501 |
|
2,397 |
|
46% |
|
1,948 |
|
Gold COS (Barrick’s
share)g,h ($/oz) |
1,904 |
|
1,562 |
|
22% |
|
1,697 |
|
1,442 |
|
18% |
|
1,334 |
|
Gold TCCb,g ($/oz) |
1,205 |
|
1,137 |
|
6% |
|
1,199 |
|
1,065 |
|
13% |
|
960 |
|
Gold AISCb,g ($/oz) |
1,581 |
|
1,538 |
|
3% |
|
1,637 |
|
1,484 |
|
10% |
|
1,335 |
|
Copper production (thousands of
tonnes)g |
62 |
|
55 |
|
13% |
|
220 |
|
195 |
|
13% |
|
191 |
|
Copper sold (thousands of
tonnes)g |
67 |
|
52 |
|
29% |
|
224 |
|
177 |
|
27% |
|
185 |
|
| Market copper price ($/lb) |
5.03 |
|
4.44 |
|
13% |
|
4.51 |
|
4.15 |
|
9% |
|
3.85 |
|
Realized copper priceb,g ($/lb) |
5.42 |
|
4.39 |
|
23% |
|
4.72 |
|
4.15 |
|
14% |
|
3.85 |
|
Copper COS (Barrick’s
share)g,i ($/lb) |
3.37 |
|
2.68 |
|
26% |
|
2.91 |
|
2.99 |
|
(3)% |
|
2.90 |
|
Copper C1 cash costsb,g ($/lb) |
2.45 |
|
1.96 |
|
25% |
|
2.14 |
|
2.26 |
|
(5)% |
|
2.28 |
|
Copper AISCb,g ($/lb) |
3.61 |
|
3.14 |
|
15% |
|
3.20 |
|
3.45 |
|
(7)% |
|
3.21 |
|
|
|
As at
12/31/25 |
As at
9/30/25 |
%
Change |
|
As at
12/31/25 |
As at
12/31/24 |
%
Change |
|
As at
12/31/23 |
Financial
Position ($ millions) |
|
|
|
|
|
|
|
|
|
| Debt (current and long-term) |
4,703 |
|
4,714 |
|
0% |
|
4,703 |
|
4,729 |
|
(1)% |
|
4,726 |
|
| Cash and equivalents |
6,706 |
|
5,037 |
|
33% |
|
6,706 |
|
4,074 |
|
65% |
|
4,148 |
|
| Debt, net
of cash |
(2,003)
|
|
(323)
|
|
520%
|
|
(2,003)
|
|
655
|
|
(406)%
|
|
578
|
|
a.Net earnings represents net earnings attributable to the equity holders of the
Company.
b.
Further information on these non-GAAP financial measures, including detailed reconciliations, is included on pages
57 to 69 of this MD&A.
c.Amounts presented on a consolidated cash basis. Project capital expenditures are not included in our calculation of
AISC.
d.
Total consolidated capital expenditures also includes capitalized interest of $19 million and $55 million, respectively,
for Q4 2025 and 2025 (Q3 2025: $16 million; 2024: $33 million; 2023: $41 million).
e.These amounts are presented on the same basis as our
guidance.
f.
Represents net cash provided by operating activities divided by
revenue.
g.
On an attributable basis.
h.Gold COS/oz is calculated as cost of sales across our gold operations (excluding sites in closure or care and maintenance)
divided by ounces sold (both on an attributable basis using Barrick’s ownership share).
i.Copper COS/lb is calculated as cost of sales across our copper operations divided by pounds sold (both on an attributable
basis using Barrick’s ownership share).
|
|
|
|
|
|
|
|
|
BARRICK YEAR-END 2025 |
6 |
MANAGEMENT’S DISCUSSION AND
ANALYSIS |
|
|
|
|
|
|
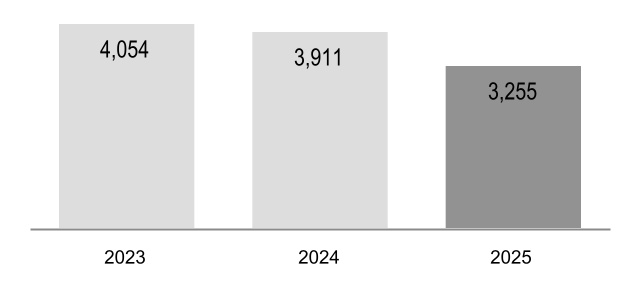
GOLD PRODUCTIONa (thousands of
ounces) |
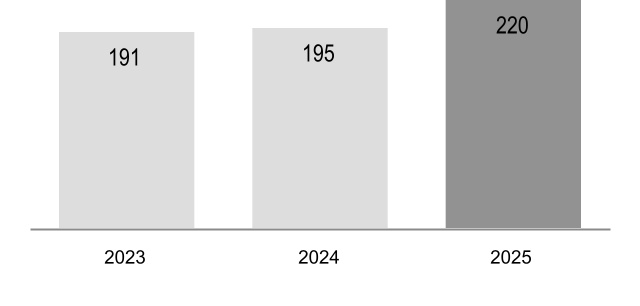
COPPER PRODUCTIONa (thousands of
tonnes) |
|
|
|
|
|
|
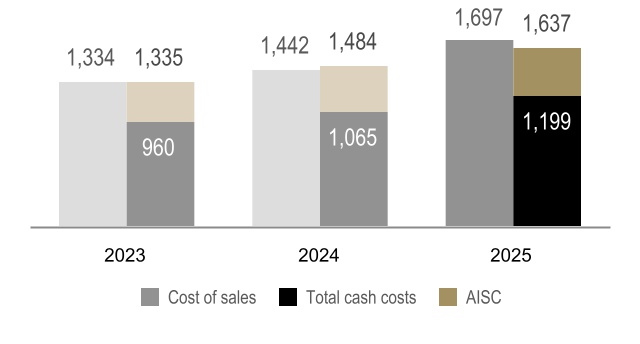
GOLD COST OF SALESb, TOTAL CASH COSTSc, |
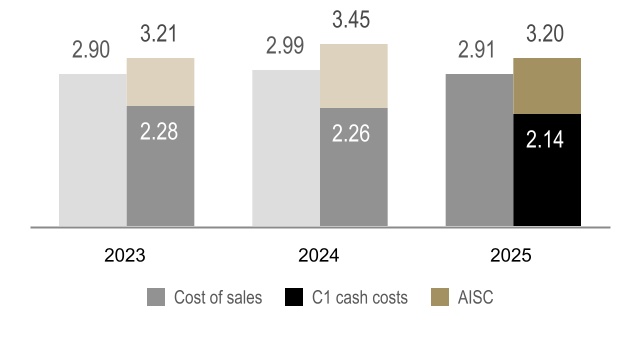
COPPER COST OF SALESb, C1 CASH COSTSc |
AND ALL-IN SUSTAINING COSTSc ($ per ounce) |
AND ALL-IN SUSTAINING COSTSc ($ per
pound) |
|
|
|
|
|
|
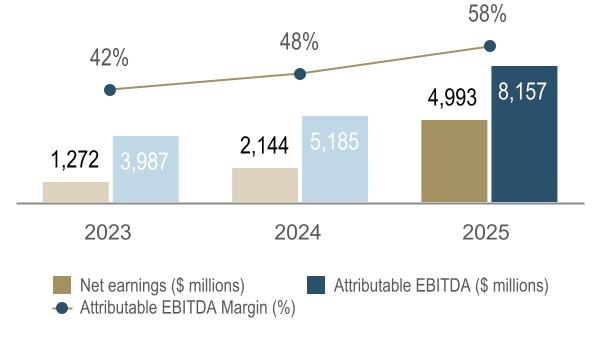
NET EARNINGS, ATTRIBUTABLE EBITDAc AND ATTRIBUTABLE EBITDA
MARGINc |
CAPITAL EXPENDITURESc,d ($
millions) |
|
|
|
|
|
|
OPERATING CASH
FLOW AND FREE CASH FLOWc |
RETURNS TO SHAREHOLDERSe ($
millions) |
a.On an attributable basis.
b.Gold COS/oz is calculated as cost of sales across our gold operations (excluding sites in closure or care and maintenance)
divided by ounces sold (both on an attributable basis using Barrick’s ownership share). Copper COS/lb is calculated as cost of sales across our copper operations divided by pounds sold (both on an attributable basis using Barrick’s
ownership share).
c.Further information on these non-GAAP financial measures, including detailed reconciliations, is included on pages 57 to 69 of this
MD&A.
d.Capital expenditures also includes capitalized
interest.
e.Dividends declared are inclusive of the performance
dividend.
|
|
|
|
|
|
|
|
|
BARRICK YEAR-END 2025 |
7 |
MANAGEMENT’S DISCUSSION AND
ANALYSIS |
Factors affecting net earnings and adjusted
net earnings6 - Q4 2025 versus Q3 2025
Net earnings for Q4 2025 were $2,406 million compared to $1,302 million in Q3 2025. The increase was primarily due to the following
items:
■acquisition/disposition gains of $1,146 million, mainly relating to the sale of our Hemlo gold mine, our interest in the
Tongon gold mine and the Alturas project, combined with the accounting impact of regaining control of the Loulo-Gounkoto complex on December 16, 2025; partially offset by
■other expense adjustments of $559 million in Q4 2025 which mainly related to the settlement payment to the Government of Mali in
November 2025 and the fair value increment on inventory resulting from the purchase price allocation when we regained control of Loulo-Gounkoto.
After adjusting for items that are not indicative of future operating earnings, adjusted net earnings6 of $1,754 million for Q4 2025 was $772 million higher than Q3 2025 mainly due to the higher realized gold price6, and higher gold sales volumes. These impacts were partially offset by an increase in gold COS/oz7. The Q4 2025 realized gold price6 was 21% higher when compared to Q3 2025. The increase in gold sales volumes was primarily due to a stronger performance at NGM, mainly at Carlin due
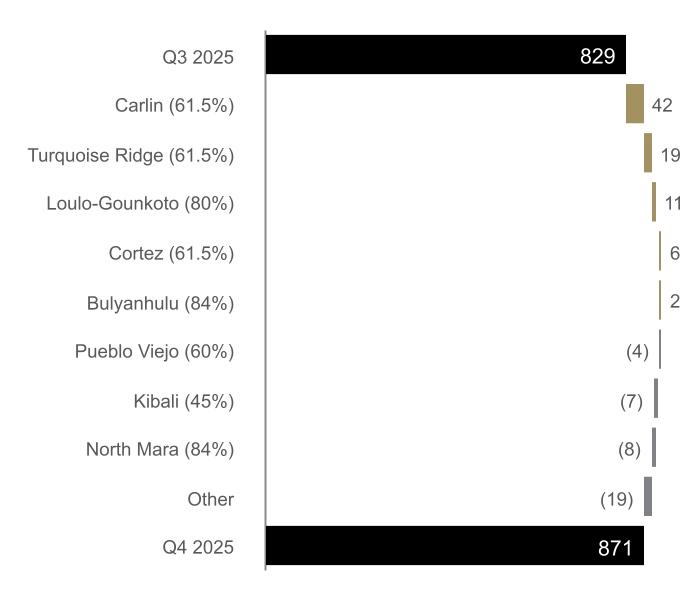
to higher throughput and grades processed at both the roasters and the autoclave; and at Turquoise Ridge due to higher grades from the undergrounds; combined with the sale of the reacquired gold and restart of production at Loulo-Gounkoto
after regaining control of the mine. These impacts were partially offset by lower production at Tongon and Hemlo as a result of the divestitures in Q4 2025. The increase in gold COS/oz7 was primarily a result of the impact of the fair value increment on inventory resulting from the purchase price allocation when we regained control
of Loulo-Gounkoto, combined with higher royalties due to an increase in the realized gold price6 (impact approximately $45/oz). This was combined with increased sulfuric acid consumption and prices at Carlin.
Refer to page 57 for a full list of reconciling items between net earnings and
adjusted net earnings6 for the current and previous
periods.
Factors affecting
net earnings and adjusted net earnings6 - 2025 versus 2024
Net earnings for the year ended December 31, 2025 were $4,993 million compared to $2,144 million in 2024. The primary drivers of the increase were
higher realized gold and copper prices6, and lower copper COS/oz7. These impacts were partially offset by lower gold sales volumes and an increase in gold COS/oz7.
After adjusting for items that are not indicative of future operating earnings, adjusted net earnings6 of $4,139 million for the year ended December 31, 2025 was $1,926 million higher than 2024. This result for 2025 was the highest adjusted net
earnings6 since 2011. 2025 realized gold and copper prices6 were 46% and 14% higher, respectively when compared to 2024. Copper COS/oz7 was lower primarily due to higher grades processed and higher capitalized waste stripping at Lumwana. Gold sales volumes were lower largely driven
by the temporary suspension of operations at Loulo-Gounkoto on January 14, 2025. Control was subsequently regained on December 15,
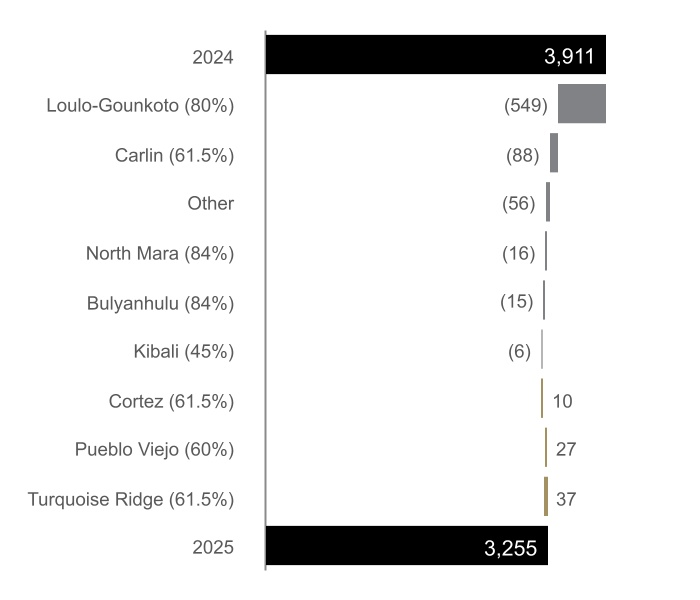
2025. In addition to this, lower underground grades were mined at Carlin although this was partially offset by Cortez with more of the higher grade
Cortez refractory ore being processed at the Carlin roasters. A further driver of the decrease was the divestitures of Tongon and Hemlo in Q4 2025. These unfavorable impacts were offset by increased production at Turquoise Ridge due to higher
underground tonnes mined and higher tonnes processed. The increase in gold COS/oz7 was primarily due to the fair value increment on inventory resulting from the purchase price allocation when we regained control of Loulo-Gounkoto,
lower production across the portfolio (resulting in reduced fixed cost dilution), lower grades processed at a number of operations, higher share-based compensation and higher royalties (impact approximately $55/oz) associated with the increase
in the realized gold price6.
Significant adjusting items for 2025 include:
■acquisition/disposition
gains of $1,107 million, mainly relating to the sale of our 50% interest in the Donlin Gold project, our Hemlo gold mine, our interest in the Tongon gold mine and the Alturas project; partially offset by
■other expense adjustments of $823 million in Q4 2025 which mainly related to the settlement payment to the Government of Mali in
November 2025, the fair value increment on inventory resulting from the purchase price allocation when we regained control of Loulo-Gounkoto, and reduced operations costs at Loulo-Gounkoto.
Refer to page 57 for a full list of
reconciling items between net earnings and adjusted net earnings6 for the current and previous periods.
Factors affecting operating cash flow and free cash flow6 - Q4 2025 versus Q3 2025
In Q4 2025, we generated $2,726 million in operating cash flow, compared to $2,422 million in Q3 2025. The increase of $304 million was primarily due
to the the higher realized gold price6, combined with increased gold sales volumes. These impacts were slightly offset by an increase in gold TCC/oz6. Operating cash flow was also negatively impacted by an increase in cash taxes paid and higher interest paid as a result of the timing of
semi-annual interest payments on our bonds, which primarily occur in the second and fourth quarters. These results were further impacted by an unfavorable working capital movement, mainly in accounts receivable, partially offset by a favorable
movement in inventory.
Free cash flow6 for Q4 2025 was $1,619 million, compared to $1,479 million in Q3 2025, reflecting higher operating cash flows, partially offset by higher capital
expenditures. In Q4 2025, capital expenditures on a cash basis were $1,107 million compared to $943 million in Q3 2025, primarily due to higher project capital expenditures6 relating to the Lumwana Super Pit Expansion project, combined with higher minesite sustaining capital expenditures6 at Pueblo Viejo as a result of restoring fleet reliability and increased activities at the Llagal
TSF.
Factors affecting operating cash flow
and free cash flow6 - 2025 versus 2024
|
|
|
|
|
|
|
|
|
BARRICK YEAR-END 2025 |
8 |
MANAGEMENT’S DISCUSSION AND
ANALYSIS |
For the year ended December 31, 2025, we generated $7,689 million in operating cash flow, compared to $4,491
million in 2024. The increase of $3,198 million was primarily due to higher realized gold and copper prices6, combined with lower copper C1 cash costs/lb6. These impacts were partially offset by lower gold sales volumes and an increase in gold TCC/oz6. Operating cash flow was further impacted by a favorable movement in working capital, mainly in inventory, VAT receivable and other current
liabilities, partially offset by an unfavorable movement in other current assets and accounts payable. These favourable impacts were partially offset by higher cash taxes paid.
For 2025, we generated free cash flow6 of $3,868 million compared to $1,317 million in 2024. The increase primarily reflects higher operating cash flows, partially offset by higher
capital expenditures. In 2025, capital expenditures on a cash basis were $3,821 million compared to $3,174 million in 2024, mainly due to higher project capital expenditures6 mainly related to costs being capitalized at Reko Diq as the feasibility study was completed in Q4 2024 and at Lumwana on the Super Pit Expansion
project, partially offset by lower minesite sustaining capital
expenditures6 mainly at Loulo-Gounkoto as operations were temporarily suspended and the mine was subsequently placed under a temporary provisional administration
until December 16, 2025.
Key Business
Developments
2025 Highlights
■Gold
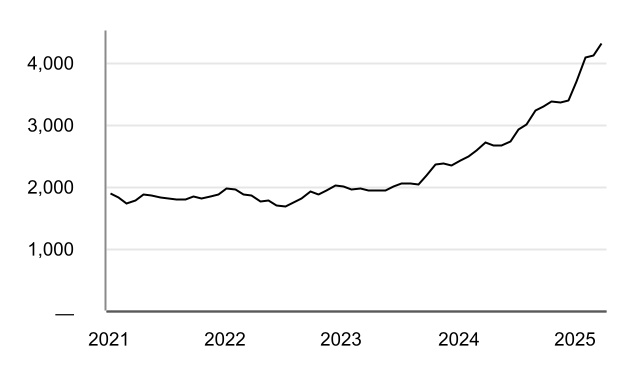
prices averaged $3,432 per ounce in 2025, a 44% increase over 2024 and an all-time annual high, and closed the year at $4,368 per ounce;
■Annual
net earnings of $5.0 billion, earnings per share of $2.93, adjusted net earnings of $4.1 billion and adjusted earnings per share of $2.42 were all records in 2025;
■Record
annual operating cash flow of $7.7 billion and free cash flow6 of $3.9 billion in 2025;
■Year-end
cash balance of $6.7 billion is an all-time
high;
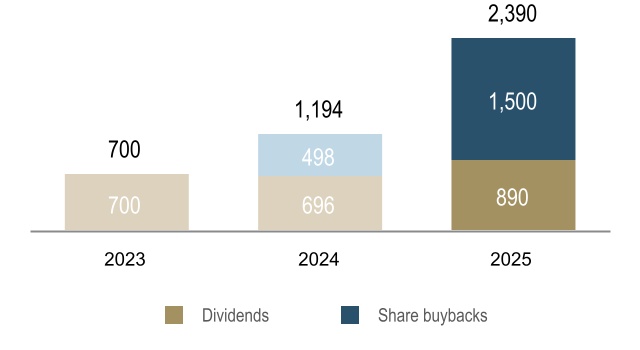
■Returned $2.4 billion to shareholders in 2025, including $0.9 billion of dividends and $1.5 billion of share buybacks, also
all-time records for the company;
■New dividend policy announced linked to attributable free cash
flow;
■Resolved disputes in Mali, securing employees’ release and regaining control of the Loulo-Gounkoto
mine;
■Portfolio optimization led to the disposition of the Hemlo and Tongon mines, as well as the Donlin and Alturas projects for cash
proceeds totalling over $2.1 billion in 2025;
and
■Accelerated drilling over 2025 confirms Fourmile as one of the most significant discoveries this
century.
Leadership transition
On February 4, 2026, Mark Hill was appointed as Group President and Chief Executive Officer, following his appointment as Group Chief Operating
Officer and Interim President and Chief Executive Officer on September 29,
2025.
Mark Hill has delivered strong performance since his interim appointment and
the Board of Directors determined he is the ideal person to lead Barrick through its next phase as President and Chief Executive Officer. Accordingly, the Board’s Search Committee has paused its search for this position. Mr. Hill, who was
previously responsible for Barrick’s LATAM and Asia Pacific region, is
a seasoned mining executive with 30 years of experience. He joined Barrick in 2006 and has experience in strategy, corporate development and leading
major projects across the world, and was also integral in the initial decision to undertake exploration at the Fourmile gold project in Nevada.
On September 29, 2925, Mark Bristow stepped down as President and CEO after nearly seven years, having joined Barrick following Barrick’s
merger with Randgold in 2019. Mark Bristow led the successful integration of the two companies, and during his tenure made significant investments in Barrick’s world-class assets to better position Barrick to maintain profitable gold and
copper growth.
On January 19, 2026, we announced the appointment of Helen Cai as
Senior Executive Vice President and Chief Financial Officer. Ms. Cai will become Chief Financial Officer on March 1, 2026, following the departure of Graham Shuttleworth, who will be leaving Barrick. Ms. Cai has served on the Barrick Board of
Directors since November 2021 and brings more than two decades of experience in equity research, corporate finance, strategic planning, capital markets, and M&A across the mining, industrial, and technology sectors, primarily with Goldman Sachs
and China International Capital Corporation.
North America IPO
As announced on December 1, 2025, the Board authorized Barrick’s management team to explore
the IPO of an entity that will hold Barrick’s premier North American gold assets (“NewCo”). Following a rigorous financial and operational analysis by Barrick’s management and its advisors, the Board has concluded that the
IPO of NewCo represents the best path for maximizing value for Barrick’s shareholders. The Board has authorized Barrick’s management to begin preparations for the IPO of NewCo and expects the IPO to be completed by late
2026.
NewCo will hold Barrick’s joint venture interests in Nevada Gold Mines
and Pueblo Viejo, as well as Barrick’s wholly owned Fourmile gold discovery in Nevada. Barrick intends to retain a significant controlling interest in NewCo following the IPO and continue to benefit financially through its majority ownership
of NewCo. Barrick will continue to own and drive value in the Company’s other world-class gold and copper assets. Barrick expects to provide further details of the IPO in the coming
months.
The completion of the IPO will be subject to market conditions and other
customary conditions, including any required regulatory approvals and final approval of the IPO by the Barrick Board of Directors.
For this reason, we have also restructured the regional teams within Barrick so that the Pueblo Viejo mine is now included in our North America
region. The remaining assets within the newly named South America & Asia Pacific region are Veladero, Porgera and Zaldívar.
Fourmile
In September 2025, we presented an update on the 100% owned Fourmile project in Nevada, further establishing its status as one of the most
significant discoveries this century. Refer to page # for more information.
Hemlo sale
On September 11, 2025, Barrick announced that it reached
|
|
|
|
|
|
|
|
|
BARRICK YEAR-END 2025 |
9 |
MANAGEMENT’S DISCUSSION AND
ANALYSIS |
an agreement to sell the Hemlo Gold Mine (“Hemlo”) in Canada to Carcetti Capital Corp., which was
renamed to Hemlo Mining Corp. (“HMC”). The sale agreement provides for gross proceeds of up to $1.09 billion, consisting of $875 million of cash proceeds due on closing, HMC shares with an aggregate value of $50 million,
and a production and tiered gold price-linked cash payment structure of up to $165 million starting in January 2027 for a five-year term. The transaction closed on November 26, 2025 and we recognized a gain on sale of $545 million and
contingent consideration of $22 million in Q4 2025.
Tongon
sale
On October 6, 2025, Barrick announced that it reached an agreement to sell its interests in
the Tongon gold mine (“Tongon”) and certain of its exploration properties in Côte d’lvoire to the Atlantic Group for total consideration of up to $305 million. The consideration is composed of cash consideration of
$192 million, inclusive of a $23 million shareholder loan repayment within six months of closing, and contingent cash payments totaling up to $113 million payable based on the price of gold over 2.5 years and resource conversions over
5 years. The transaction closed on December 1, 2025 and we recognized a gain on sale of $134 million and contingent consideration of $113 in Q4 2025.
Loulo-Gounkoto Mining Conventions Dispute
The Company and the Government of Mali had engaged in a dispute in connection with the existing mining conventions of Société des Mines de
Loulo SA (“Somilo”) and Société des Mines de Gounkoto (“Gounkoto”) (together, the “Conventions”).
On December 18, 2024, after multiple good faith attempts to resolve the dispute, Somilo and Gounkoto submitted a request for arbitration to ICSID in
accordance with the provisions of their respective Convention. On January 14, 2025, due to the restrictions imposed by the Government of Mali on gold shipments, the Company announced that the Loulo-Gounkoto complex would temporarily suspend
operations.
On June 16, 2025, the Bamako Commercial Tribunal placed Loulo-Gounkoto
under a temporary provisional administration. While Barrick retained its 80% legal ownership of the mining complex, operational control was transferred to an external administrator. As a result of this loss of control event, the assets, liabilities
and non-controlling interest of Loulo-Gounkoto were deconsolidated and derecognized and a retained investment was recognized at fair value in Q2 2025.
On November 24, 2025, Barrick announced that an agreement had been entered into with the Government of the Republic of Mali to put an end to all
disputes regarding the Loulo and Gounkoto mines. The provisional administration of the Loulo-Gounkoto complex was terminated on December 16, 2025, at which point operational control was handed back to Somilo and Gounkoto's management. This was
accounted for as a business acquisition in Q4 2025 where the investment was derecognized and the assets, liabilities and non-controlling interest of Loulo-Gounkoto were consolidated from this date again.
For more information, refer to notes 4, 35 and 36 of the Financial Statements.
Donlin Sale
On April 22, 2025, Barrick announced it had entered into an agreement to sell its 50% interest in the Donlin Gold project located in Alaska, USA to
affiliates of Paulson Advisers LLC and NOVAGOLD Resources Inc. (“NOVAGOLD”) for total cash consideration of $1 billion. In addition, Barrick has granted NOVAGOLD an option to purchase the outstanding debt owed to Barrick (value of
$164 million as at September 30, 2025 and presented in Other Assets) in connection with the Donlin Gold project for $90 million if purchased prior to closing (which was not exercised), or for $100 million if purchased within 18 months from
closing, when the option expires. If that option is not exercised, the debt will remain outstanding, substantially in accordance with its existing terms which would largely defer repayment to the commencement of production.
The transaction closed on June 3, 2025 and we recognized a gain on sale of $745
million in Q2 2025. In addition, NOVAGOLD retains the option to purchase the outstanding debt for $100 million within 18 months from
closing.
Alturas
Sale
On August 8, 2025, Barrick announced that it has reached an agreement to sell the Alturas
Project in Chile to a subsidiary of Boroo Pte Ltd (Singapore) (“Boroo”) for an up-front cash payment of $50 million. In addition, Barrick will be granted a 0.5% net smelter return royalty on gold and silver produced from the Project,
which will terminate once 2 million ounces of gold and gold-equivalent have been produced. Boroo may repurchase the royalty within four years from closing for $10 million. The transaction closed on November 7, 2025 and we recognized a gain on sale
of $53 million in Q4 2025.
Name and
Ticker Change
At the Company’s Annual and Special Meeting of Shareholders on May 6, 2025,
Barrick's shareholders approved the change of the Company's corporate name from Barrick Gold Corporation to Barrick Mining Corporation, which was made effective on that date. In addition, as of May 9, 2025, Barrick’s ticker on the New York
Stock Exchange changed to “B” from “GOLD”, better reflecting Barrick’s current business and our mission to achieve sustainable and profitable gold and copper growth. Barrick’s ticker on the TSX remains unchanged.
Board of Directors
Changes
Also at the Company’s Annual and Special Meeting of Shareholders on May 6, 2025, two
new independent directors were elected to the Board of Directors: Ben van Beurden and Pekka Vauramo. They replaced Christopher Coleman and Andrew Quinn who retired from the Board.
At the August 8, 2025 meeting, the Board of Directors appointed Ben van Beurden as Lead Director, succeeding Brett Harvey who continues to serve on
the Board as an independent director.
On November 26, 2025, it was announced that
Ben van Beurden had stepped down as a Director of the Board and Lead Independent Director. Loreto Silva has succeeded Ben van Beurden as Lead Independent Director.
At the February 4, 2026 meeting Robert Samek was appointed to the Board of Directors and will join the Audit & Risk and Compensation Committees.
In addition, Mark Hill, President and Chief Executive Officer, will join the
|
|
|
|
|
|
|
|
|
BARRICK YEAR-END 2025 |
10 |
MANAGEMENT’S DISCUSSION AND
ANALYSIS |
Company’s Board of Directors as a Non-Independent
Director.
New Dividend
Policy
On February 4, 2026, the Board of Directors announced the declaration of a $0.42 per share
dividend in respect of performance for the fourth quarter of 2025, representing an increase of 140% over the third quarter, and announced a new dividend policy.
In Q4 2025 and going forward, the Company’s new dividend policy targets a total payout of 50% of attributable free cash flow on an annualized
basis, comprised of a fixed base quarterly dividend of $0.175 per share and a performance top-up component at each year end based on the attributable free cash flow during the year. The dividend paid in any given year may be higher or lower than the
50% target based on the strength of cash flow, capital needs, balance sheet considerations, and other factors.
Share Buyback Program
At the February 11, 2025 meeting, the Board of Directors authorized a share buyback program for the repurchase of up to $1.0 billion of the
Company’s outstanding common shares over the next 12 months. At the November 7, 2025 meeting, on the back of the strong financial performance of the Company, the Board of Directors authorized an increase in the share buyback program for the
repurchase of up to an additional $500 million, raising the total to $1.5 billion. Barrick repurchased $500 million of shares in Q4 2025, bringing the 2025 total to $1.5 billion purchased under this share buyback program.
|
|
|
|
|
|
|
|
|
BARRICK YEAR-END 2025 |
11 |
MANAGEMENT’S DISCUSSION AND
ANALYSIS |
Outlook for 2026
Operating Division Guidance
Our 2025 actual gold and copper production, cost of sales, TCC6, AISC6 and 2026 forecast gold and copper production, cost of sales, TCC6 and AISC6 ranges by operating division are as follows:
|
|
|
|
|
|
|
|
|
|
|
|
|
|
|
|
|
|
|
|
|
|
|
|
|
|
|
| Operating Division |
2025 attributable production (000s ozs) |
2025 cost of salesa ($/oz) |
2025 TCCb
($/oz) |
2025 AISCb
($/oz) |
2026 forecast attributable production (000s ozs) |
2026 forecast cost of salesa ($/oz) |
2026 forecast TCCb ($/oz) |
2026 forecast AISCb ($/oz) |
| Gold |
|
|
|
|
|
|
|
|
| Carlin
(61.5%) |
687 |
1,676 |
1,340 |
1,906 |
600 - 670 |
1,770 - 1,960 |
1,340 - 1,490 |
1,900 - 2,100 |
Cortez
(61.5%)c |
454 |
1,609 |
1,234 |
1,513 |
430 - 480 |
1,980 - 2,190 |
1,390 - 1,540 |
1,690 - 1,870 |
| Turquoise Ridge
(61.5%) |
341 |
1,545 |
1,178 |
1,358 |
300 - 330 |
1,610 - 1,790 |
1,220 - 1,360 |
1,490 - 1,650 |
| Phoenix
(61.5%) |
109 |
1,921 |
653 |
920 |
80 - 100 |
2,440 - 2,710 |
900 - 1,000 |
1,180 - 1,310 |
|
|
|
|
|
|
|
|
|
| Nevada
Gold Mines (61.5%) |
1,591
|
1,647
|
1,229
|
1,620
|
1,420 -
1,580 |
1,850 -
2,050 |
1,300 -
1,440 |
1,720 -
1,900 |
| Pueblo Viejo (60%) |
379 |
1,608 |
1,034 |
1,412 |
350 - 400 |
1,720 - 1,910 |
1,160 - 1,290 |
1,590 - 1,760 |
North Americad |
1,970
|
1,639
|
1,191
|
1,580
|
1,770 -
1,980 |
1,820 -
2,010 |
1,270 -
1,410 |
1,690 -
1,870 |
|
|
|
|
|
|
|
|
|
| Veladero (50%) |
230 |
1,286 |
785 |
1,450 |
180 - 200 |
2,000 - 2,210 |
1,160 - 1,280 |
1,460 - 1,620 |
| Porgera (24.5%) |
92 |
1,553 |
1,184 |
1,630 |
80 - 100 |
1,610 - 1,790 |
1,190 - 1,320 |
1,610 - 1,780 |
|
|
|
|
|
|
|
|
|
| South
America & Asia Pacific |
322
|
1,363
|
901
|
1,502
|
260 -
300 |
1,870 -
2,070 |
1,170 -
1,300 |
1,500 -
1,660 |
|
|
|
|
|
|
|
|
|
Loulo-Gounkoto
(80%)e |
29 |
4,271 |
1,449 |
1,603 |
260 - 290 |
2,860 - 3,140 |
2,180 - 2,390 |
2,640 - 2,900 |
| Kibali
(45%) |
303 |
1,568 |
1,099 |
1,337 |
270 - 310 |
1,520 - 1,680 |
1,130 - 1,250 |
1,330 - 1,470 |
| North Mara
(84%) |
249 |
1,449 |
1,085 |
1,333 |
200 - 230 |
1,700 - 1,880 |
1,300 - 1,430 |
1,520 - 1,680 |
| Bulyanhulu
(84%) |
153 |
1,789 |
1,253 |
1,795 |
140 - 160 |
1,750 - 1,940 |
1,230 - 1,360 |
1,870 - 2,070 |
|
|
|
|
|
|
|
|
|
Africa and Middle Eastf |
734
|
1,680
|
1,140
|
1,442
|
870 -
970 |
1,990 -
2,200 |
1,490 -
1,640 |
1,840 -
2,040 |
|
|
|
|
|
|
|
|
|
| Divested
Sites |
|
|
|
|
|
|
|
|
| Hemlo (100%) |
123 |
1,854 |
1,618 |
1,936 |
— |
— |
— |
— |
| Tongon (89.7%) |
106 |
2,200 |
2,049 |
2,203 |
— |
— |
— |
— |
|
|
|
|
|
|
|
|
|
Total Golde,g,h,i |
3,255
|
1,697
|
1,199
|
1,637
|
2,900 -
3,250 |
1,870 -
2,070 |
1,330 -
1,470 |
1,760 -
1,950 |
|
|
|
|
|
|
|
|
|
| |
2025 attributable production (000s tonnes) |
2025 cost of salesa ($/lb) |
2025 C1 cash costsb
($/lb) |
2025 AISCb ($/lb) |
2026 forecast attributable production
(000s tonnes)
|
2026 forecast cost of salesa ($/lb) |
2026 forecast C1 cash costsb ($/lb) |
2026 forecast AISCb ($/lb) |
| Copper |
|
|
|
|
|
|
|
|
| Lumwana |
151 |
2.54 |
1.86 |
3.05 |
130 - 150 |
2.85 - 3.15 |
2.05 - 2.30 |
3.40 - 3.75 |
| Zaldívar
(50%) |
37 |
5.14 |
3.98 |
4.75 |
30 - 35 |
4.80 -5.10 |
3.70 - 3.90 |
5.40 - 5.70 |
| Jabal Sayid (50%) |
32 |
2.09 |
1.28 |
1.46 |
25 - 30 |
2.10 - 2.30 |
1.25 - 1.45 |
1.45 - 1.65 |
Total Copperh,i |
220 |
2.91 |
2.14 |
3.20 |
190 - 220 |
3.05 - 3.35 |
2.20 - 2.45 |
3.45 - 3.75 |
a.Gold
COS/oz is calculated as cost of sales across our gold operations (excluding sites in closure or care and maintenance) divided by ounces sold (both on an attributable basis using Barrick’s ownership share). Copper COS/lb is calculated
as cost of sales across our copper operations divided by pounds sold (both on an attributable basis using Barrick’s ownership share).
b.Further
information on these non-GAAP financial measures, including detailed reconciliations, is included on pages 57 to 69 of this MD&A.
c. Includes Goldrush.
d.Excludes Hemlo
as it was divested on November 26, 2025.
e.2026 forecast cost of sales does not include the impact of the Loulo-Gounkoto purchase price allocation. Refer to note 4 to the
Financial Statements for further information.
f.Excludes our share of Tongon as it was divested on December 1, 2025.
g.TCC/oz and
AISC/oz include costs allocated to non-operating sites.
h.Operating division guidance ranges reflect expectations at each individual operating division, and may not add up to the
company-wide guidance range total.
i.Includes corporate administration
costs.
|
|
|
|
|
|
|
|
|
BARRICK YEAR-END 2025 |
12 |
MANAGEMENT’S DISCUSSION AND
ANALYSIS |
Operating Division, Consolidated Expense and Capital Guidance
Our 2025 actual gold and copper production, cost of sales, TCC6, AISC6, consolidated expenses and capital expenditures and 2026 forecast gold and copper production, cost of sales, TCC6, AISC6, consolidated expenses and capital expenditures are as follows:
|
|
|
|
|
|
|
|
|
|
|
|
|
|
| ($ millions, except per ounce/pound
data) |
|
2025 Guidancea |
2025 Actual |
2026 Guidancea |
|
| Gold
Metrics |
|
|
|
|
|
| Production (millions of
ounces) |
|
3.15 - 3.50 |
3.26 |
2.90 - 3.25 |
|
| Cost of sales ($ per
oz) |
|
1,460 - 1,560 |
1,697 |
1,870 - 2,070 |
|
TCC
($ per oz)b |
|
1,050 - 1,130 |
1,199 |
1,330 - 1,470 |
|
| Depreciation ($ per
oz) |
|
370 - 400 |
373 |
470 - 520 |
|
AISC
($ per oz)b |
|
1,460 - 1,560 |
1,637 |
1,760 - 1,950 |
|
Attributable
minesite sustainingb,d |
|
1,100 - 1,300 |
1,204 |
1,100 - 1,250 |
|
Attributable
projectb,d |
|
|
631 |
900 - 1,000 |
|
Total
gold attributable capital expendituresb,d |
|
|
1,851 |
2,000 - 2,250 |
|
| Copper Metrics |
|
|
|
|
|
|
|
|
|
|
|
| Production (thousands of
tonnes) |
|
200 - 230 |
220 |
190 - 220 |
|
| Cost of sales ($ per
lb) |
|
2.50 - 2.80 |
2.91 |
3.05 - 3.35 |
|
C1
cash costs ($ per lb)b |
|
1.80 - 2.10 |
2.14 |
2.20 - 2.45 |
|
| Depreciation ($ per
lb) |
|
0.75 - 0.85 |
0.83 |
0.90 - 1.00 |
|
AISC
($ per lb)b |
|
2.80 - 3.10 |
3.20 |
3.45 - 3.75 |
|
Attributable
minesite sustainingb,d |
|
300 - 350 |
356 |
400 - 450 |
|
Attributable
projectb,d |
|
|
768 |
1,600 - 1,750 |
|
Total
copper attributable capital expendituresb,d |
|
|
1,160 |
2,000 - 2,200 |
|
| Group Financial Metrics |
|
|
|
|
|
| Exploration and project
expenses |
|
330 - 370 |
367 |
450 - 500 |
|
| Exploration and
evaluation |
|
220 - 240 |
247 |
320 - 350 |
|
| Project expenses |
|
110 - 130 |
120 |
130 - 150 |
|
| General and administrative
expenses |
|
~160 |
222 |
~180 |
|
| Corporate administration
|
|
~120 |
103 |
~120 |
|
Stock-based compensationc |
|
~40 |
119 |
~60 |
|
|
|
|
|
|
|
| Other expense
(income) |
|
70 - 90 |
(509) |
70 - 90 |
|
| Finance costs, net |
|
270 - 310 |
227 |
230 - 250 |
|
Total attributable capital expendituresd |
|
3,100 -
3,600 |
3,011
|
4,000 -
4,450 |
|
a.Guidance ranges exclude Long Canyon which is producing incidental ounces from the leach pad while in closure.
b.Further information on these non-GAAP financial measures, including detailed reconciliations, is included on pages 57 to 69 of
this MD&A.
c.2025 actual results are based on a US$45.76 share price and 2026 guidance is based on the same share
price.
d.Attributable capital expenditures are presented on the same basis as guidance, which includes our 61.5% share of NGM, our 60%
share of Pueblo Viejo, our 89.7% share of Tongon up until its divestiture on December 1, 2025, our 84% share of North Mara and Bulyanhulu, our 45% share of Kibali, our 50% share of Zaldívar and Jabal Sayid, and our 24.5% share of Porgera. Total
attributable capital expenditures for 2025 actual results also includes capitalized interest of $52 million.
2026 Guidance Analysis
Estimates of future production, COS/oz7, TCC/oz6 and AISC/oz6 presented in this MD&A are based on mine plans that reflect the expected method by which we will mine reserves at each site. Actual gold and
copper production and associated costs may vary from these estimates due to a number of operational and non-operational risk factors (see the “Cautionary Statement on Forward-Looking Information” on page 2 of this MD&A for a
description of certain risk factors that could cause actual results to differ materially from these estimates).
Gold Production
We expect 2026 gold production to be in the range of 2.90 to 3.25 million ounces, compared to our actual 2025 gold production of 3.26 million
ounces. In Q4 2025, we divested our interests in Hemlo and Tongon and when those two assets are excluded, our 2025 production was 3.0 million ounces. The most significant driver of the increase for 2026 across the continuing assets is the additional
production
from Loulo-Gounkoto following the return of control in late Q4. Across the remainder of the portfolio, we expect Pueblo Viejo to deliver a slightly
higher year-over-year performance with offsetting decreases at Veladero and North Mara. At Carlin, we expect 2026 production to be slightly lower than 2025 driven by open pit mine sequencing although this is expected to be partially offset by higher
deliveries of Cortez material processed through the Carlin roasters. At Turquoise Ridge, we expect lower underground grades as per the planned mining sequence. We expect stable delivery for the other assets.
Across the four quarters of 2025, the Company’s gold production is expected
to be the lowest in Q1 (between 640 to 680koz) and highest in Q3 and Q4 due to the ramp-up of Loulo-Gounkoto, the timing of shutdowns, the Goldrush ramp-up and mine sequencing across the NGM sites. This is expected to result in an approximately 45%
/ 55% split of the Company’s total gold production between the first half and second half of the year,
respectively.
|
|
|
|
|
|
|
|
|
BARRICK YEAR-END 2025 |
13 |
MANAGEMENT’S DISCUSSION AND
ANALYSIS |
Gold Cost of Sales per Ounce7
On a per ounce basis, cost of sales applicable to gold7, after removing the portion related to non-controlling interests, is expected to be in the range of $1,870/oz to $2,070/oz in 2026, compared
to the 2025 actual result of $1,697/oz.
The drivers of the increase are higher
depreciation and for the reasons described in the Gold TCC/oz6 section immediately below. The higher depreciation on a per ounce basis is mainly driven by Loulo-Gounkoto and NGM. At the former, it relates to the
provisional purchase price allocation following the return of control. At NGM, it relates to ore mined from South Arturo (within Carlin) and Crossroads (within Cortez) where capitalized stripping was incurred in prior periods and as the ore is mined
in 2026, it carries a higher depreciation charge on a per ounce basis relative to the other feed at these two sites. In addition to this, across the other assets, reinvestment in the business is also contributing to higher depreciation as we incur a
full 12 months of depreciation on the newly installed assets.
Gold Total Cash Costs per Ounce6
TCC/oz6 in 2026 is expected to be in the range of $1,330/oz to $1,470/oz, compared to the 2025 actual result of $1,199/oz.
Our 2026 cost guidance for TCC/oz6 is based on a gold price assumption of $4,500/oz whereas the average gold price realized for 2025 was $3,501/oz. This difference of
$999/oz represents around $60/oz of the increase in TCC/oz6. Furthermore, the average royalty rate for our Loulo-Gounkoto mine is now 18% as a result of the royalties and duties applicable under the 2023
Mining Code. This has increased the overall sensitivity of the costs incurred at our mines to the gold price and has amplified the impact of the gold price increase because the Loulo-Gounkoto mine is expected to produce 260 to 290koz in 2026
compared to the 29koz in 2025.
In our North America region (which also includes
our Pueblo Viejo mine from 2026), our 2026 guidance for TCC/oz6 for NGM of $1,300/oz to $1,440/oz compares to the 2025 actual result of $1,229/oz. The higher gold price assumption represents
~$35/oz of the increase. We are also expecting lower grades mined from the open pits driven by the mine plans and more material hauled from Cortez to the Carlin roasters (which adds to the cost profile). In addition, for 2026 we expect that
the price of key consumables will remain at higher levels driven by increased tariffs whereas in 2025, this was more muted until Q4.
For our Africa & Middle East region, TCC/oz6 is expected to be in the range of $1,490/oz to $1,640/oz, which is an increase compared to 2025 mainly driven by the higher production from
Loulo Gounkoto at a higher cost base as we focus on ramping up the mine following the return of control in mid December 2025 and at North Mara where lower grades are planned to be fed during 2026 compounded by a higher strip ratio year on year. The
higher gold price assumption also represents ~$30/oz of the increase in 2026 relative to 2025 based on our $4,500/oz gold price
assumption.
Gold All-In
Sustaining Costs per
Ounce6
AISC/oz6 in 2026 is expected to be in the range of $1,760/oz to $1,950/oz, compared to the 2025 actual result of $1,637/oz. ~$60/oz of
this increase is driven by the higher gold price assumption of $4,500/oz used for our 2026
guidance. The remainder of the increase is based on the expectation that minesite sustaining capital expenditures6 on a per ounce basis will be slightly higher than 2025 (refer to Capital Expenditures commentary below for further
detail).
Copper Production
and Costs
We expect 2026 copper production to be in the range of 190 to 220 thousand tonnes,
compared to actual production of 220 thousand tonnes in 2025. Production is expected to be highest in Q2 and Q3 with Q1 being the lowest quarter of the year mainly driven by grade at Lumwana as per the mine
plan.
In 2026, cost of sales applicable to copper7 is expected to be in the range of $3.05/lb to $3.35/lb, which compares to the actual result of $2.91/lb for 2025. Our 2026 cost guidance
for cost of sales/lb6 is based on a copper price assumption of $5.50/lb whereas the average realized copper price for 2025 was $4.72/lb. This difference of
$0.78/lb represents around $0.05/lb of the increase. In addition, higher maintenance costs at Lumwana driven by an optimized planned change out schedule to improve availabilities and deliverability of the mine plan. C1 cash
costs/lb6 guidance of $2.20/lb to $2.45/lb for 2026 compares to the 2025 actual result of $2.14/lb, mainly driven by the higher costs at Lumwana
as referred to above. Copper AISC/lb6 guidance of $3.45/lb to $3.75/lb for 2026 compares to the actual result of $3.20/lb in 2025 with higher costs expected at Zaldívar
and Lumwana.
Exploration
and Project Expenses
We expect to incur approximately $450 to $500 million of exploration and
project expenses in 2026. This is higher than our 2025 guidance range, and compares to the 2025 actual result of $367 million. The drivers of the higher spend are detailed below.
Within this range, we expect our exploration and evaluation expenditures in 2026 to be approximately $320 to $350 million. This is higher than the
2025 actual result of $247 million driven by an increase in spending at Barrick’s 100% owned Fourmile project where we expect our drilling spend to increase to $150 to $160 million. This is partially offset by a lower spend across the rest of the portfolio. This spend on exploration and evaluation expenditures will continue to
support our resource and reserve conversion over the coming years continuing our record of replacing the reserves we mine.
We also expect to incur approximately $130 to $150 million of project expenses in 2026, compared to $120 million in 2025. The driver of this increase
is that we expect to incur costs of $20 million on studies work for Barrick’s 100% owned Fourmile project. The remainder of the expected spend for 2026 relates to corporate development
activities, Pascua-Lama and project costs at NGM.
General and Administrative Expenses
In 2026, we expect corporate administration costs to be approximately $120 million given our track record over the last seven years of consistently
delivering costs below the guidance.
Separately, stock-based compensation expense
in 2026 is expected to be approximately $60 million based on a share price assumption of $37.60 noting that the actual outcome will be impacted by the share price movements over the course of the 2026
year.
|
|
|
|
|
|
|
|
|
BARRICK YEAR-END 2025 |
14 |
MANAGEMENT’S DISCUSSION AND
ANALYSIS |
Finance Costs, Net
In 2026, our guidance range for net finance costs of $230 to $250 million primarily represents interest expense on long-term debt, non-cash interest
expense relating to the gold and silver streaming agreements at Pueblo Viejo, and accretion, net of finance income. This guidance for 2026 is slightly higher than the actual result for 2025 of $227 million, and reflects our expectation that market
interest rates will on average be lower relative to 2025, translating to lower interest income earned on our cash balance. Interest expense incurred on our bonds is at a fixed rate and consequently does not change with market interest
rates.
Capital
Expenditures
Total attributable gold and copper capital expenditures for 2026 are expected to be in
the range of $4,000 to $4,450 million. This is higher than the actual spend for the 2025 year of $3,011 million driven by the advancement of both the Lumwana Super Pit Expansion project and the Reko Diq project. At Lumwana, the capital spend on the
growth project is expected to be $750 to $850 million and at Reko Diq the capital expenditure is expected to be $600 - $700 million (Barrick’s 50% share). Inclusive of these two major projects, we expect attributable project capital
expenditures6 to be in the range of $2,500 to $2,750 million in 2026, which is higher than our actual expenditures of $1,399 million in 2025. Across the
Company’s gold assets,
the material growth projects relate to Barrick’s 100% owned Fourmile project in Nevada, the new Naranjo tailings facility at Pueblo Viejo, the
Goldrush ramp-up at Cortez and the Ren project at Carlin.
Attributable minesite
sustaining capital expenditures6 for 2026 are expected to be in the range of $1,500 to $1,700 million, which compares to the actual spend for 2025 of $1,560 million. The guidance
range for 2026 is split between our gold assets ($1,100 to $1,250 million) and copper assets ($400 to $450 million). Compared to the prior year, minesite sustaining capital expenditures6 in 2026 are expected to be only slightly higher than 2025 across the Company’s gold assets, with higher expenditure at Loulo-Gounkoto and
Pueblo Viejo offset by a lower spend at Veladero (plus the divestiture of Hemlo and Tongon). For the copper assets, minesite sustaining capital expenditures6 in 2026 are expected to be around $100 million higher than 2025 with a higher spend expected at Zaldívar and to a lesser extent
Lumwana.
Effective Income
Tax Rate
Based on a gold price assumption of $4,500/oz, our expected effective tax rate range
for 2026 is 24% to 28%. The rate is sensitive to the relative proportion of sales in high versus low tax jurisdictions, realized gold and copper prices, the proportion of income from our equity accounted investments and the level of non-tax affected
costs in countries where we generate net losses.
Outlook Assumptions and
Economic Sensitivity Analysis
|
|
|
|
|
|
|
|
|
|
|
|
|
|
|
|
|
|
| |
2026 Guidance
Assumption |
Hypothetical
Change |
Consolidated impact on EBITDAa (millions) |
Attributable impact on EBITDAa (millions) |
Attributable impact on TCC and AISCa |
| |
| Gold price sensitivity |
$4,500/oz |
+/- $100/oz |
‘
+/-$650 |
‘
+/-$300 |
‘
+/-$5/oz |
| Copper
price sensitivity |
$5.50/lb
|
+/-$0.25/lb
|
‘+/-
$110 |
‘+/-
$110 |
‘+/-$0.02/lb
|
|
|
|
|
|
|
|
|
|
|
|
|
|
|
|
|
|
|
|
|
|
|
|
|
|
|
|
|
|
|
|
|
|
|
|
|
|
|
|
|
|
|
|
|
|
|
|
|
|
|
|
|
|
|
|
|
|
|
|
|
a.Further information on these non-GAAP financial measures, including detailed reconciliations, is included on pages 57 to 69 of this
MD&A.
Three Year (2026-2028) Production Outlook
We expect Cortez, Loulo-Gounkoto, Kibali, North Mara and Phoenix to deliver higher year-over-year performances in 2027 relative to 2026, together
with stable delivery across the rest of the portfolio. In 2028, the increase in gold production is driven by NGM and for copper by Lumwana. Our gold and copper production outlook over the next three years are as
follows:
|
|
|
|
|
|
|
|
|
|
|
|
|
|
|
2026 Guidance |
2027 Outlook |
2028 Outlook |
| Gold production (millions of
ounces) |
|
2.90 - 3.25 |
3.30 - 3.65 |
3.40 - 3.75 |
| Copper
production (thousands of tonnes) |
|
190 -
220 |
195 -
225 |
255 -
285 |
Sustainability
Barrick’s vision for sustainability is underpinned by the knowledge that sustainability aspects are interconnected and must be tackled in
conjunction with, and reference to, each other. We call this approach Holistic and Integrated Sustainability Management. We must tackle all sustainability aspects holistically and concurrently to make meaningful progress in any single aspect.
Although we integrate our sustainability management, we discuss our sustainability strategy within four overarching pillars: (1) respecting human rights; (2) protecting the health and safety of our people and local communities; (3)
sharing the benefits of our operations; and (4) managing our impacts on the environment.
We implement this strategy by blending top-down accountability with bottom-up responsibility. This means we
place the day-to-day ownership of sustainability, and the associated risks and opportunities, in the hands of individual sites. In the same way that
each site must manage its geological, operational and technical capabilities to meet business objectives, it must also manage its environment and people. This is achieved through identification of programs, metrics, and targets that measure progress
and deliver value for the business and our stakeholders, including our host countries and local communities.
The Group Sustainability Executive, supported by regional sustainability leads, provides oversight and direction over this site-level ownership, to
ensure alignment with the strategic priorities of the overall
business.
|
|
|
|
|
|
|
|
|
BARRICK YEAR-END 2025 |
15 |
MANAGEMENT’S DISCUSSION AND
ANALYSIS |
Governance
The bedrock of our sustainability strategy is strong governance. Our most senior management-level body dedicated to sustainability is the E&S
Committee, which connects site-level ownership of our sustainability strategy with the leadership of the Group. It is chaired by the Group Chief Operating Officer and Interim President and Chief Executive Officer and includes: (1) regional Chief
Operating Officers; (2) minesite General Managers; (3) Health, Safety, Environment and Closure Leads; (4) the Group Sustainability Executive; (5) in-house legal counsel; and (6) an independent sustainability consultant in an
advisory role. The E&S Committee meets on a quarterly basis to review our performance across a range of key performance indicators, and to provide independent oversight and review of sustainability
management.
The Group Chief Operating Officer and Interim President and Chief
Executive Officer reviews the reports of the E&S Committee at every quarterly meeting of the Board's ESG & Nominating Committee. The reports are reviewed to ensure the implementation of our sustainability policies and to drive performance of
our environmental, health and safety, community relations and development and human rights programs.
This is supplemented by weekly meetings, at a minimum, between the Regional Sustainability Leads and the Group Sustainability Executive. These
meetings examine the sustainability-related risks and opportunities facing the business, as well as the progress and issues integrated into weekly Executive Committee review meetings.
Incentive payments for senior leaders under Barrick’s Partnership Plan are tied to Sustainability performance. For 2025, this comprised a 20%
weighting under the annual incentive program based on our annual safety and environment performance, and a 20% weighting under our Long-Term Company Scorecard linked to the assessment of our industry-first Sustainability Scorecard. The
Sustainability Scorecard targets and metrics are updated annually to ensure continuous improvement. The results of the 2025 Sustainability Scorecard will be published in the Annual Report and Sustainability Report during the first half of 2026. The
E&S Committee tracks our progress against all scorecard metrics on a quarterly basis.
Human
rights
Our commitment to respect human rights is codified in our standalone Human Rights Policy and
informed by the expectations of the United Nations Guiding Principles on Business and Human Rights, the OECD Guidelines for Multinational Enterprises, and the Voluntary Principles on Security and Human Rights. This commitment is fulfilled on the
ground via our Human Rights Program, the fundamental principles of which include: due diligence, risk identification and management, monitoring and reporting, training, and where appropriate disciplinary action and
remedy.
We continue to assess and manage security and human rights risks at all
our operations and provide security and human rights training to private and public security forces across our sites. During 2025, independent human rights assessments were undertaken at the following sites: North Mara in Tanzania; Veladero
in Argentina; and Porgera in Papua New Guinea.
Safety
We are committed to the safety, health and well-being of our people, their families and the communities in which we
operate to achieve our safety vision for “Everyone to go home safe and healthy every day.”
Our Management-Level Safety Committee continues to drive the implementation of
the “Journey to Zero” initiative. The current priority is the development of operational standards, improving the quality of safety leadership interactions and critical control verifications through extensive training programs.
We report our safety performance quarterly as part of both our E&S Committee
meetings and our reports to the ESG & Nominating Committee. Our safety performance is the first item on our weekly Executive Committee review meeting.
As part of our Journey to Zero, we have identified four key elements in developing a culture that fosters a strong and effective focus on safety:
(1) Leadership and Culture, (2) Zero Fatalities, (3) Risk Management and hazard identification, and (4) Prevention of Injuries.
Overall, the Group saw an improvement in their LTIFR and TRIFR performance over the prior year - the latter of which was one of the best among the
ICMM peers in 2024. The TRIFR8 of 0.71 improved by 24% compared to 2024 and the severity of injuries has been reduced significantly, as evidenced by a 31% decrease in LTIFR8 from the prior year to 0.09.
Notwithstanding these positive improvements on lagging indicators, it is with regret that these advancements were overshadowed by four fatalities
that occurred during 2025; one at NGM, one at Bulyanhulu and two at Kibali. All four incidents occurred underground, two of which related to individuals operating mobile equipment near open stopes and holes, and the remaining two incidents
associated with individuals placing themselves in the line of fire of mobile equipment. Our focus remains on the Fatal Risk Management program, entailing Fatal Risk standards, operational standards and critical controls. The Critical Control
Verifications roll out and adoption has been successful in the field, with focus now shifting to quality of interactions.
Social
We regard our host communities and countries as important partners in our business. Our sustainability policies commit us to transparency in our
relationships with host communities, government authorities, the public and other key stakeholders. Through these policies, we commit to conducting our business with integrity and with absolute opposition to corruption. We require our suppliers to
operate ethically and responsibly as a condition of doing business with
us.
Community and economic
development
Our commitment to social and economic development is set out in our overarching
Sustainable Development and Social Performance policies. Mining has been identified as vital for the achievement of the United Nations SDGs, not only for its role in providing the minerals needed to enable the transition to a lower carbon intensive
economy, but more importantly because of its ability to drive socio-economic development and build resilience. Creating long-term value and sharing economic benefits is at the heart of our approach to sustainability, as well as community
development. This approach is encapsulated in three concepts:
The primacy of partnership: this means that we invest in real partnerships with mutual responsibility. Partnerships include local communities, suppliers,
|
|
|
|
|
|
|
|
|
BARRICK YEAR-END 2025 |
16 |
MANAGEMENT’S DISCUSSION AND
ANALYSIS |
governments and organizations, and this approach is epitomized through our CDCs with development initiatives
and investments.
Sharing the benefits: We hire and buy local wherever possible as this injects money into and keeps it in our local communities and host countries. By doing this, we build
capacity, community resilience and create opportunity. We also invest in community development through our CDCs. Sharing the benefits also means paying our fair share of taxes, royalties and dividends and doing so transparently, primarily through
the reporting mechanism of the Canadian Extractive Sector Transparency Measures Act. Our annual Tax Contribution Report, most recently published in May 2025, sets out, in detail, our economic contributions to host governments.
Engaging and listening to stakeholders: We develop tailored stakeholder engagement plans for every operation and the business as a whole. These plans guide and document how often we engage
with various stakeholder groups and allow us to proactively deal with issues before they escalate into significant risks.
Our community development spend for 2025 totaled nearly $61 million.
Environment
We know the environment in which we work and our host communities are inextricably linked, and we apply a holistic and integrated approach to
sustainability management. We can deliver significant cost savings to our business, reduce future liabilities and help build stronger stakeholder relationships by being responsible stewards of the environment. This includes applying the highest
standards of environmental management, using natural resources and energy efficiently, recycling and reducing waste, as well as working to protect biodiversity. Environmental matters such as how we use water, prevent incidents, manage tailings,
respond to changing climate and protect biodiversity are key areas of focus.
We
maintained our strong track record of stewardship and did not record any Class
19 environmental incidents in 2025.
Climate Change
The Board’s ESG & Nominating Committee is responsible for overseeing Barrick’s policies, programs and performance relating to
sustainability and the environment, including climate change. The Audit & Risk Committee assists the Board in overseeing the Group’s management of enterprise risks as well as the implementation of policies and standards for monitoring and
mitigating such risks. Climate change is built into our formal risk management process, outputs of which are regularly reviewed by the Audit & Risk Committee.
Barrick’s climate change strategy has three pillars: (1) identify, understand and mitigate the risks associated with climate change;
(2) measure and reduce our GHG emissions across our operations and value chain; and (3) improve our disclosure on climate change. The three pillars of our climate change strategy do not focus solely on the development of emissions reduction
targets, rather, we integrate and consider aspects of biodiversity protection, water management and community resilience in our approach.
We are acutely aware of the impacts that climate change and extreme weather events have on our host communities and countries, particularly
developing nations which are often the most vulnerable. As a responsible
business, we have focused our efforts on building resilience in our host communities and countries, just as we do for our business. Our climate
disclosure is based on the recommendations of the TCFD.
Identify, understand and mitigate the risks associated with climate change
We identify and manage risks, build resilience to a changing climate and extreme weather events, as well as position ourselves for new opportunities.
These factors continue to be incorporated into our formal risk assessment process. We have identified several risks and opportunities for our business including: physical impacts of extreme weather events; an increase in regulations that
seek to address climate change; and an increase in global investment in innovation and low-carbon technologies.
The risk assessment process includes climate scenario analysis to assess site-specific climate-related risks and opportunities. The key findings and
a summary of material physical and transitional risk assessment were disclosed as part of our CDP (formerly known as the Carbon Disclosure Project) questionnaire, submitted to CDP in September 2025. CDP scored Barrick’s stewardship and
transparency an A- (best practice class) for both climate change and
water.
Measure and reduce the Group’s impact on climate
change
Mining is an energy-intensive business, and we understand the important link between energy
use and GHG emissions. By measuring and effectively managing our energy use, we can reduce our GHG emissions, achieve more efficient production and reduce our costs.
We have climate champions at each site who are tasked with identifying roadmaps and assessing feasibility for our GHG emissions reductions and carbon
offsets for hard-to-abate emissions. Any carbon offsets that we pursue must have appropriate socioeconomic and/or biodiversity benefits. We have published an achievable emissions reduction roadmap and continue to assess further reduction
opportunities across our operations. The detailed roadmap was first published in our 2021 Sustainability Report and includes committed capital projects and projects under investigation that rely on technological advances, with a progress summary
contained in the 2024 Sustainability Report.
We continue to progress our
extensive work across our value chain in understanding our Scope 310 (indirect emissions associated with the value chain) emissions and implementing our engagement roadmap to enable our key suppliers to set meaningful
and measurable reduction targets, in line with the commitments made through the ICMM Climate Position Paper.
Improve our disclosure on climate change
Our disclosure on climate change, including in our Sustainability Report and on our website, is developed in line with the TCFD recommendations.
Barrick continues to monitor the various regulatory climate disclosure standards being developed around the world, including the International Sustainability Standards Board’s S2 Climate-related Disclosures standard. In addition, we complete the annual CDP Climate Change and Water Security questionnaire. This ensures our investor-relevant water use,
emissions and climate data is widely available.
|
|
|
|
|
|
|
|
|
BARRICK YEAR-END 2025 |
17 |
MANAGEMENT’S DISCUSSION AND
ANALYSIS |
Emissions
Barrick’s interim GHG emissions reduction target was established in 2018 based on a steady state production profile. As Barrick’s
production is forecast to increase towards the end of the decade, with major projects expected to be commissioned, such as Goldrush, Reko Diq, the Lumwana Super Pit expansion and the Pueblo Viejo expansion, the Group’s GHG reduction targets
were updated and published in the 2024 Sustainability Report. The updated reduction target is for a minimum 30% intensity reduction by 2030 against our 2018 baseline. The basis of this reduction is against a 2018 baseline of 7,541 kt CO2-e and intensity of 0.47 t CO2-e per tonne of ore processed.
Ultimately, our vision is net zero GHG emissions by 2050, achieved primarily through GHG reductions, with some offsets for hard-to-abate emissions.
Site-level plans to improve energy efficiency, integrate clean and renewable energy sources and reduce GHG emissions will also be strengthened.
During the fourth quarter of 2025, the Group's total Scope 1 and 210 (location-based) GHG emissions were 1,928 kt CO2-e. The preliminary 2025 annual Scope 1 and 2 emissions are 7,722 kt CO2-e11 (location-based). Increased emissions from 2024 are due predominantly to higher limestone use for neutralization at Pueblo Viejo, and increased
production at Porgera.
Water
Water is a vital and increasingly scarce global resource. Managing and using water responsibly is one of the most critical parts of our
sustainability strategy. Our commitment to responsible water use is codified in our Environmental Policy and standalone Water Policy. Steady, reliable access to water is critical to the effective operation of our mines. Access to water is also a
fundamental human right.
Understanding the water stress in the regions in which
we operate enables us to better understand the risks and manage our water resources through site-specific water balances, based on the ICMM Water Accounting Framework, aimed at minimizing our water withdrawal and maximizing water reuse and recycling
within our operations.
We include each mine’s water risks in its operational
risk register. These risks are then aggregated and incorporated into the Group risk register. Our identified water-related risks include: (1) managing excess water in regions with high rainfall; (2) maintaining access to water in arid areas
and regions prone to water scarcity; and (3) regulatory risks related to permitting limits as well as municipal and national regulations for water use.
We set an annual water recycling and reuse target of 80%. Our water recycling and reuse rate for Q4 2025 and the year achieved this target, with
performance at 82% and 81%, respectively.
Tailings
We are committed to having our TSFs meet global best practices for safety. Our TSFs are carefully engineered and regularly inspected, particularly
those in regions with high rainfall and seismic events.
We disclosed our
conformance to the GISTM for all Extreme and Very High consequence facilities on the Barrick website in August 2023, within the GISTM disclosure timeframe. All of our sites that are classified as Very High or Extreme consequence are in conformance
with the GISTM. We disclosed our conformance to the GISTM for all remaining tailings facilities in August
2025.
Biodiversity
Biodiversity underpins many of the ecosystem services on which our mines and their surrounding communities depend. If improperly managed, mining and
exploration activities have the potential to negatively affect biodiversity and ecosystem services. Protecting biodiversity and preventing nature loss is also critical and inextricably linked to the fight against climate change. We work to
proactively manage our impact on biodiversity and strive to protect the ecosystems in which we operate. Wherever possible, we aim to achieve a net neutral biodiversity impact, particularly for ecologically sensitive environments.
We continue to work to implement our BAPs. The BAPs outline our strategy to
achieve no-net loss for all key biodiversity features and their associated management plans.
Market Overview
The market prices of gold and, to a lesser extent, copper are the primary drivers of our profitability and our ability to generate free cash
flow6 for our shareholders.
Gold
The price of gold is subject to volatile price movements over short periods of time and is affected by numerous industry and macroeconomic factors.
During 2025, the gold price ranged from $2,615 per ounce to an all-time high of $4,550 per ounce. The average market price for the year of $3,432 per ounce also represented an all-time annual high, and a 44% increase from the 2024 average of $2,386
per ounce.
During the year, the gold price rose strongly, reaching all-time high
nominal and average prices, as inflation pressures eased, benchmark interest rates were cut, and the trade-weighted US dollar weakened while the global economic outlook remained uncertain and geopolitical conflicts persisted, underscoring
gold’s role as a safe haven investment and store of value.
AVERAGE MONTHLY SPOT GOLD PRICES
(dollars per ounce)
Copper
During 2025, London Metal Exchange copper prices traded in a range of $3.68 per pound to an all-time high of $5.88 per pound, averaged $4.51 per
pound, and closed the year at $5.67 per pound. Copper prices are heavily influenced by physical demand from emerging markets, especially China.
Copper prices in 2025 were impacted by tariff concerns, supply disruptions, reductions in benchmark interest rates, and a decrease in the
trade-weighted US dollar.
|
|
|
|
|
|
|
|
|
BARRICK YEAR-END 2025 |
18 |
MANAGEMENT’S DISCUSSION AND
ANALYSIS |
AVERAGE MONTHLY SPOT COPPER PRICES
(dollars per pound)
We have provisionally priced copper sales for which final price determination versus the relevant copper index is outstanding at the balance sheet
date. As at December 31, 2025, we recorded 56 million pounds of copper sales still subject to final price settlement at an average provisional price of $5.34 per pound. The impact to net income before taxation of a 10% movement in the market price
of copper would be approximately $30 million, holding all other variables constant.
Currency Exchange Rates
The results of our mining operations outside of the United States are affected by fluctuations in exchange rates. We have exposure to the Argentine
peso through operating costs at our Veladero mine, and peso denominated VAT receivable balances. We also have exposure to the Canadian and Australian dollars, Chilean peso, Papua New Guinea kina, Zambian kwacha, Tanzanian shilling, Dominican peso,
West African CFA franc, euro, South African rand, and British pound through mine operating and capital costs. In addition, we also have exposure to the Pakistani rupee through project costs and capital costs on Reko
Diq.
Fluctuations in these exchange rates increase the volatility of our costs
reported in US dollars. In 2025, the Australian dollar traded in a range of $0.59 to $0.67 against the US dollar, while the US dollar against the Canadian dollar and West African CFA franc ranged from $1.35 to $1.48 and XOF 550 to XOF 647,
respectively. Due to inflationary pressures in Argentina and the actions of the government, there was a continued weakening of the Argentine peso during the year and it ranged from ARS 1,031 to ARS 1,492.
Fuel
For 2025, the price of WTI crude oil traded in a range between $55 and $81 per barrel, with the market price averaging $65 per barrel, and
closing the year at $57 per barrel. Oil prices were impacted by concerns about global economic growth, managed supply, and geopolitical concerns, including the ongoing invasion of Ukraine by Russia, conflicts in the Middle East and uncertainty
related to Venezuela.
AVERAGE MONTHLY SPOT CRUDE OIL PRICE (WTI)
(dollars per barrel)
US Dollar Interest Rates
During 2025, as inflationary pressures continued to ease, benchmark interest rates were cut by a total of 75 bps to a range of 3.50% to 3.75% by the
end of the year. Changes to monetary policy in 2026 will be dependent on economic data to be observed during the year.
At present, our interest rate exposure mainly relates to interest income received on our cash balances ($6.7 billion at December 31, 2025); the
carrying value of certain non-current assets and liabilities; and the interest payments on our variable-rate debt (less than $0.05 billion at December 31, 2025). Currently, the amount of interest expense recorded in our consolidated statement of
income is not materially impacted by changes in interest rates, because the majority of our debt was issued at fixed interest rates. The relative amounts of variable-rate financial assets and liabilities may change in the future, depending on the
amount of operating cash flow we generate, as well as the level of capital expenditures and our ability to borrow on favorable terms using fixed rate debt instruments. Changes in interest rates affect the accretion expense recorded on our provision
for environmental rehabilitation and therefore would affect our net earnings.
Reserves and Resources12
For full details of our mineral reserves and mineral resources, refer to page 74 of the Fourth Quarter 2025
Report.
Gold Reserves and
Resources
Barrick’s 2025 gold mineral reserves and resources are estimated using a gold price
assumption of $1,500 and $2,000 per ounce, increased from $1,400 and $1,900 in 2024 respectively. Both are reported to a rounding standard of two significant digits for tonnes and metal content, with grades reported to two decimal places.
As of December 31, 2025, Barrick’s proven and probable gold mineral
reserves were 85 million ounces13 at an average grade of 0.98 g/t, from 89 million ounces14 at an average grade of 0.99 g/t in 2024. This represents a year-over-year, attributable mineral reserves decrease of 4.1 million ounces, which
was a result of the Tongon and Hemlo divestitures which accounted for a reduction of 2.2 million ounces alongside 3.7 million ounces of 2025 annual depletion partially offset by 1.8 million ounces of additions associated with commodity price change
and exploration additions. Although depletion was higher than net conversion by 1.9 million ounces for 2025, the three-year rolling average gold mineral reserve replacement stands
|
|
|
|
|
|
|
|
|
BARRICK YEAR-END 2025 |
19 |
MANAGEMENT’S DISCUSSION AND
ANALYSIS |
close to 190% adding more than 24 million ounces to gold mineral reserves (excluding both acquisitions and
divestments), primarily supported by 17 million ounces15 of net change in the prior year. Furthermore three year average gold-equivalent net replacement is in excess of 500% supported by the Reko Diq and
Lumwana feasibility studies in the prior
year.
ATTRIBUTABLE CONTAINED GOLD RESERVES13,14,a
(Moz)
a Figures rounded to two significant digits.
Barrick attributable measured and indicated gold resources for 2025 stand at 150 million ounces13 at 1.01 g/t, with a further 43 million ounces13 at 1.0 g/t of inferred resources. Measured and indicated mineral resources reduced by 20 million ounces as a result of the divestiture of Donlin
and a further 2.2 million ounces as a result of the divestiture of Alturas. Overall divestitures in 2025 accounted for a reduction of 26 million ounces of measured and indicated mineral resources and 7.3 million ounces of inferred mineral resources
respectively. Aside from the divestitures, we delivered net additions across the rest of the portfolio of more than 14 million ounces of mineral resources as detailed further below13,14.
Mineral resources are reported inclusive of mineral reserves and both tonnes and metal content are reported to a rounding standard of two significant
digits for tonnes and metal content. Measured and indicated mineral resource grades are reported to two decimal places, whilst inferred mineral resource grades are reported to one decimal place.
In North America, the ongoing growth drilling at Fourmile grew inferred mineral resources to 13 million ounces13 at 16.9 g/t in 2025, from 6.4 million ounces14 at 14.1 g/t in 2024. Similarly, closer spaced conversion drilling at Fourmile also more than doubled indicated mineral resources to 2.6 million
ounces13 at 17.59 g/t from 1.4 million ounces14 at 11.76 g/t. The substantial increases in gold mineral resources at Fourmile supports the possibility for potential future
conversions.
The Pueblo Viejo mineral reserves and resources are reported as part
of the North American region for 2025 and were previously reported as part of the South America & Asia Pacific region in 2024.
Overall gold mineral measured and indicated resources in the Africa & Middle East region, after annual depletion, grew to 32 million
ounces13 at 3.20 g/t in 2025 from 31 million ounces14 at 3.26 g/t in 2024. This was predominantly driven by both Kibali and North Mara, with extensions of the ARK, Gea and Rama open pit orebodies
respectively. Similarly inferred gold mineral resources within the Africa & Middle East region grew to 5.8 million
ounces13 at 2.8 g/t in 2025 from 5.2 million ounces14 at 3.1 g/t in 2024.
Copper Reserves and Resources
For Barrick-operated assets, copper mineral reserves for 2025 are estimated using a copper price assumption of $3.25 per pound, increased from $3.00
per pound in 2024. Copper mineral resources for 2025 are estimated using a price of $4.50 per pound also increased from $4.00 per pound in 2024. Both are reported to a rounding standard of two significant digits, for tonnes and metal content, with
grades reported to two decimal places.
Attributable proven and probable copper
mineral reserves remained at 18 million tonnes of copper13 at 0.46% in 2025 on an attributable basis, from 18 million tonnes of copper14 at 0.45% in 2024.
ATTRIBUTABLE CONTAINED COPPER RESERVES13,14,a
(M
tonnes)
a Figures rounded to two significant digits.
Barrick’s attributable measured and indicated resources for 2025 stands at 24 million tonnes of copper13 at 0.39%, with a further 4.2 million tonnes of copper13 at 0.3% of inferred resources, reflecting increases related to the change in commodity pricing. Mineral resources are reported inclusive of mineral
reserves and both tonnes and metal content are reported to a rounding standard of two significant digits for tonnes and metal content. Measured and indicated mineral resource grades are reported to two decimal places, whilst inferred mineral
resource grades are reported to one decimal place.
2025 mineral reserves and
mineral resources are estimated using the combined value of gold, copper and silver. Accordingly, mineral reserves and mineral resources are reported for all assets where copper or silver is produced and sold as a primary product or a by-product.
|
|
|
|
|
|
|
|
|
BARRICK YEAR-END 2025 |
20 |
MANAGEMENT’S DISCUSSION AND
ANALYSIS |
Risks and Risk
Management
Overview
The ability to deliver on our vision, strategic objectives and operating guidance depends on our ability to understand and appropriately respond to
the uncertainties or “risks” we face that may prevent us from achieving our objectives. To achieve this, we:
■maintain
a framework that permits us to manage risk effectively and in a manner that creates the greatest value;
■integrate a
process for managing risk into all our important decision-making processes so that we reduce the effect of uncertainty on achieving our objectives;
■actively
monitor key controls we rely on to achieve the Company’s objectives so they remain in place and are effective at all times; and
■provide
assurance to senior management and relevant committees of the Board on the effectiveness of key control activities.
Board and Committee Oversight
We maintain strong risk oversight practices, with responsibilities outlined in the mandates of the Board and related committees. The Board’s
mandate is clear on its responsibility for reviewing and discussing with management the processes used to assess and manage risk, including the identification by management of the principal risks of the business, and the implementation of
appropriate systems to deal with such risks.
The Audit & Risk Committee
assists the Board in overseeing the Company’s management of principal risks and the implementation of policies and standards for monitoring and modifying such risks, as well as monitoring and reviewing the Company’s financial position
and
financial risk management programs. The ESG & Nominating Committee assists the Board in overseeing the Company’s policies and performance
for its environmental, health and safety, corporate social responsibility and human rights programs. The Compensation Committee assists the Board in ensuring that executive compensation is appropriately linked to our sustainability performance,
including with respect to climate change and water.
Management
Oversight
Our weekly Executive Committee Review is the main forum for senior management to raise
and discuss risks facing the operations and organization more broadly. Additionally, our most senior management-level body dedicated to sustainability is the E&S Committee which meets on a quarterly basis to review sustainability performance and
key performance indicators across our operations. At every quarterly meeting, the ESG & Nominating Committee and the Audit & Risk Committee are provided with updates on the key issues identified by management at these regular
sessions.
Principal
Risks
The following subsections describe some of our key sources of uncertainty and critical risk
mitigation activities. The risks described below are not the only ones facing Barrick. Our business is subject to inherent risks in financial, regulatory, strategic and operational areas. For a more comprehensive discussion of those inherent risks,
see “Risk Factors” in our most recent Form 40-F/Annual Information Form on file with the SEC and Canadian provincial securities regulatory authorities. Also see the “Cautionary Statement on Forward-Looking Information” on
page 2 of this MD&A.
|
|
|
|
|
|
| Risk
Factor |
Risk Mitigation Strategy |
|
|
|
|
Free cash flow6 and costs |
|
Our ability to improve productivity, control operating costs and optimize working capital remains a focus in 2026 and is subject to several sources
of uncertainty. This includes our ability to achieve and maintain industry-leading margins by improving the productivity and efficiency of our operations. |
■Maximizing
the benefit of higher gold prices through agile management and operational execution; ■Weekly
Executive Committee Review to identify, assess and respond to risks in a timely manner; ■Enabling
simplification and agile decision making through optimization of business systems; ■Supply
Chain is decentralized to the operations with a centralized Strategic Sourcing Group and is focused on mitigating the risks of rising costs and supply chain disruption;
■Disciplined capital allocation criteria for all investments, to ensure a high degree of consistency and rigor is applied to all
capital allocation decisions based on a comprehensive understanding of risk and reward; ■Continued enhancement
and testing of controls to prevent, detect and respond to potential cyber-attacks; and ■A flat,
operationally focused, agile management structure with an ownership culture. |
|
|
|
|
|
|
|
|
|
|
|
BARRICK YEAR-END 2025 |
21 |
MANAGEMENT’S DISCUSSION AND
ANALYSIS |
|
|
|
|
|
|
| Risk
Factor |
Risk Mitigation Strategy |
| Social license to operate |
|
| At
Barrick, we are committed to building, operating and closing our mines in a safe and responsible manner. To do this, we seek to build trust-based partnerships with host governments and local communities to drive shared long-term value while working
to minimize the social and environmental impacts of our activities. Geopolitical risks such as resource nationalism and incidents of corruption are inherent in the business of a company operating globally. Past environmental incidents in the
extractive industry highlight the hazards (e.g., water management, tailings storage facilities, etc.) and the potential consequences to the environment, community health and safety. Our ability to maintain compliance with regulatory and community
obligations in order to protect the environment and our host communities alike remains one of our top priorities. Barrick also recognizes climate change as an area of risk requiring specific focus and that reducing GHG emissions to counter the
causes of climate change requires strong collective action by the mining industry. |
■Our
commitment to responsible mining is supported by a robust governance framework, including an overarching Sustainable Development Policy and related policies in the areas of Biodiversity, Conflict-Free Gold, Social Performance, Occupational Health
and Safety, Environment and Human Rights; ■Use of our Sustainability Scorecard to track sustainability performance using key performance indicators aligned to priority
areas set out in our strategy; ■Mandatory training on our Code of Business Conduct and Ethics as well as supporting policies which set out the ethical behavior
expected of everyone working at, or with,
Barrick; ■We take a partnership approach with our host governments. This means we work to balance our own interests and priorities with
those of our government partners, working to ensure that everyone derives real value from our operations; ■Standalone,
independent Human Rights Assessment Program whereby each site is assessed on a periodic cycle of two to three years, depending on the risk level and the number and level of identified risks to the
rightsholder; ■Established CDCs at all our operating mines to identify community needs and priorities and to allocate funds to those
initiatives most needed and desired by local
stakeholders; ■We open our social and environmental performance to third-party scrutiny, including through the ISO 14001 re-certification
process, International Cyanide Management Code audits and annual human rights impact assessments; ■We
published further site-level TSF disclosures, in accordance with Principle 15 of the GISTM, and have worked diligently toward bringing inactive TSFs into Safe Closure on a priority basis;
■Our climate change strategy has three pillars: (1) identify, understand and mitigate the risks associated with climate
change; (2) measure and reduce our impacts on climate change; and (3) improve our disclosure on climate change; ■We
continuously monitor developments around the world and work closely with our local communities on managing the impacts of health issues, such as Ebola or Mpox outbreaks, on our people and business;
and ■We continuously review and update our closure plans and cost estimates to plan for environmentally responsible closure and
monitoring of operations. |
| Resources and reserves and production outlook |
|
Like any mining company, we face the risk that we are unable to discover or acquire new resources or that we do not convert resources into
production. As we move into 2026 and beyond, our overriding objective of growing free cash flow6 continues to be underpinned by a strong pipeline of organic projects and minesite expansion opportunities in our core regions. Uncertainty related
to these and other opportunities exists (potentially both favorable and unfavorable) due to the speculative nature of mineral exploration and development, as well as the potential for increased costs, delays, suspensions and technical challenges
associated with the construction of capital projects. |
■Focus on
responsible mineral resource management, continuously improve ore body knowledge and add to reserves and resources; ■Consolidate
and secure dominant land positions in favored operating districts and emerging new prospective geological domains; ■Focus on
economically feasible discoveries with potential Tier One1,3 status; ■Optimize
the value of underdeveloped projects; ■Establish and develop motivated and highly agile discovery-driven teams;
■Identify emerging opportunities and secure them through earn-in agreements or acquisition;
and ■Regular review and management of capital projects at executive committee level. |
| Financial position and liquidity |
|
| Our liquidity profile, level of indebtedness and credit ratings are all factors in our ability to meet short- and long-term financial demands.
Barrick’s outstanding debt balances impact liquidity through scheduled interest and principal repayments and the results of leverage ratio calculations, which could influence our investment grade credit ratings and ability to access capital
markets. In addition, our ability to draw on our credit facility is subject to meeting its covenants. Our primary source of liquidity is our operating cash flow, which is dependent on the ability of our operations to deliver projected future cash
flows. The ability of our operations to deliver projected future cash flows, as well as future changes in gold and copper market prices, either favorable or unfavorable, will continue to have a material impact on our cash flow and
liquidity. |
■Continued
focus on generating positive free cash flow6 by improving the underlying cost structures of our operations in a sustainable
manner; ■Preparation of budgets and forecasts to understand the impact of different price scenarios on liquidity, including our capacity
to provide cash returns to shareholders, repurchase outstanding debt and shares, and formulate appropriate strategies; ■Review
of debt and net debt levels to ensure appropriate leverage and monitor the market for liability management opportunities; and ■Other
options available to the Company to enhance liquidity include drawing on our $3.0 billion undrawn Credit Facility, asset sales, joint ventures or the issuance of debt or equity
securities. |
|
|
|
|
|
|
|
|
|
BARRICK YEAR-END 2025 |
22 |
MANAGEMENT’S DISCUSSION AND
ANALYSIS |
Operating Performance
Our presentation
of reportable operating segments consists of eight gold mines (Carlin, Cortez, Turquoise Ridge, Pueblo Viejo, Loulo-Gounkoto, Kibali, North Mara and Bulyanhulu) and one copper mine (Lumwana). Starting with the Q2 2025 MD&A, the discussion on
Loulo-Gounkoto is presented in the “Other Mines - Gold” section as no operating data or per ounce data was provided for Q1 2025 to Q3 2025 as a result of the temporary suspension of operations starting January 14, 2025, and subsequent
loss of control on June 16, 2025. On November 24, 2025, Barrick announced that an agreement had been entered into with the Government of the Republic of Mali to put an end to all disputes regarding the Loulo and Gounkoto mines. The provisional
administration of the Loulo-Gounkoto complex was terminated on December 16, 2025, at which point operational control was handed back to Somilo and Gounkoto's management. The remaining operating segments, including our remaining gold and copper
mines, have been grouped into an “Other Mines” category and will not be reported on individually. Segment performance is evaluated based on a number of measures including operating income before tax, production levels and unit production
costs. Certain costs are managed on a consolidated basis and are therefore not reflected in segment income.
Nevada Gold Mines (61.5% basis)a, Nevada USA
Summary of Operating and Financial Data
|
|
|
|
|
|
|
|
|
|
|
|
|
|
|
|
|
|
|
|
|
|
|
|
|
|
|
|
|
|
|
For the three months
ended |
|
For the
years ended |
| |
12/31/25
|
9/30/25 |
Change |
|
12/31/25
|
12/31/24 |
Change |
|
12/31/23 |
| Total tonnes mined (000s) |
33,330 |
|
34,963 |
|
(5)% |
|
142,558 |
|
155,626 |
|
(8)% |
|
167,641 |
|
| Open pit
ore |
7,299 |
|
5,080 |
|
44% |
|
20,341 |
|
19,541 |
|
4% |
|
29,797 |
|
| Open pit waste |
24,390 |
|
28,239 |
|
(14)% |
|
115,887 |
|
130,049 |
|
(11)% |
|
132,323 |
|
|
Underground |
1,641 |
|
1,644 |
|
0% |
|
6,330 |
|
6,036 |
|
5% |
|
5,521 |
|
| Average grade (grams/tonne) |
|
|
|
|
|
|
|
|
|
| Open pit
mined |
1.24 |
|
0.96 |
|
29% |
|
1.17 |
|
1.11 |
|
5% |
|
1.03 |
|
| Underground mined |
8.80 |
|
8.46 |
|
4% |
|
8.29 |
|
8.47 |
|
(2)% |
|
8.99 |
|
|
Processed |
2.79 |
|
2.75 |
|
1% |
|
2.76 |
|
2.84 |
|
(3)% |
|
1.98 |
|
| Ore tonnes processed (000s) |
7,535 |
|
6,247 |
|
21% |
|
25,866 |
|
23,959 |
|
8% |
|
35,590 |
|
| Oxide
mill |
2,042 |
|
1,906 |
|
7% |
|
7,675 |
|
8,266 |
|
(7)% |
|
9,624 |
|
| Roaster |
1,442 |
|
1,329 |
|
9% |
|
5,259 |
|
5,293 |
|
(1)% |
|
4,993 |
|
|
Autoclave |
1,087 |
|
1,126 |
|
(3)% |
|
4,240 |
|
4,235 |
|
0% |
|
3,636 |
|
| Heap leach |
2,964 |
|
1,886 |
|
57% |
|
8,692 |
|
6,165 |
|
41% |
|
17,337 |
|
Recovery rateb |
83 |
% |
83 |
% |
0% |
|
83 |
% |
82 |
% |
1% |
|
83 |
% |
Oxide
Millb |
73 |
% |
82 |
% |
(11)% |
|
78 |
% |
79 |
% |
(1)% |
|
79 |
% |
|
Roaster |
85 |
% |
86 |
% |
(1)% |
|
86 |
% |
85 |
% |
1% |
|
86 |
% |
| Autoclave |
83 |
% |
78 |
% |
6% |
|
80 |
% |
79 |
% |
1% |
|
82 |
% |
| Gold produced (000s oz) |
466 |
|
402 |
|
16% |
|
1,591 |
|
1,650 |
|
(4)% |
|
1,865 |
|
| Oxide mill |
67 |
|
71 |
|
(6)% |
|
287 |
|
331 |
|
(13)% |
|
411 |
|
|
Roaster |
258 |
|
222 |
|
16% |
|
864 |
|
850 |
|
2% |
|
891 |
|
| Autoclave |
131 |
|
100 |
|
31% |
|
399 |
|
373 |
|
7% |
|
386 |
|
| Heap
leach |
10 |
|
9 |
|
11% |
|
41 |
|
96 |
|
(57)% |
|
177 |
|
| Gold sold (000s oz) |
475 |
|
406 |
|
17% |
|
1,602 |
|
1,646 |
|
(3)% |
|
1,860 |
|
| Revenue ($
millions) |
2,073
|
|
1,467
|
|
41%
|
|
5,842
|
|
4,069
|
|
44%
|
|
3,721
|
|
| Cost of sales ($ millions) |
813 |
|
633 |
|
28% |
|
2,653 |
|
2,459 |
|
8% |
|
2,528 |
|
| Income ($ millions) |
1,236 |
|
828 |
|
49% |
|
3,141 |
|
1,567 |
|
100% |
|
1,145 |
|
EBITDA ($ millions)c,d |
1,439 |
|
962 |
|
50% |
|
3,709 |
|
2,070 |
|
79% |
|
1,736 |
|
EBITDA margine |
69 |
% |
66 |
% |
5% |
|
63 |
% |
51 |
% |
24% |
|
47 |
% |
Capital expendituresf ($ millions) |
183 |
|
168 |
|
9% |
|
809 |
|
820 |
|
(1)% |
|
864 |
|
Minesite
sustainingc |
118 |
|
107 |
|
10% |
|
585 |
|
670 |
|
(13)% |
|
654 |
|
Projectc,g |
64 |
|
60 |
|
7% |
|
220 |
|
146 |
|
51% |
|
206 |
|
| COS ($/oz) |
1,695 |
|
1,557 |
|
9% |
|
1,647 |
|
1,478 |
|
11% |
|
1,351 |
|
TCC ($/oz)c |
1,191 |
|
1,156 |
|
3% |
|
1,229 |
|
1,126 |
|
9% |
|
989 |
|
AISC ($/oz)
c |
1,461
|
|
1,448
|
|
1%
|
|
1,620
|
|
1,561
|
|
4%
|
|
1,366
|
|
|
|
|
|
|
|
|
|
|
|
a.Barrick is the operator of NGM and owns 61.5%, with Newmont Corporation owning the remaining 38.5%. NGM
is accounted for as a subsidiary with a 38.5% non-controlling interest. These results represent our 61.5% interest in Carlin, Cortez, Turquoise Ridge, Phoenix and Long Canyon until it transitioned to care and maintenance at the end of 2023, as
previously reported.
b.Excludes the Gold Quarry (Mill 5) concentrator (decommissioned at the end of Q1 2023).
c.Further information on these non-GAAP financial measures, including detailed reconciliations, is included on pages 57 to 69 of this
MD&A.
d.EBITDA represents income less depreciation. Depreciation expense is $203 million and $568 million for Q4
2025 and 2025, respectively (Q3 2025: $134 million, 2024: $503 million, 2023: $591 million).
e.Represents EBITDA divided by revenue.
f.Includes capitalized interest.
g.Includes amounts spent on the NGM TS Solar
project.
NGM includes
Carlin, Cortez, Turquoise Ridge, Phoenix and non-mine site related activity such as the TS Solar Project. Barrick is the operator of the joint venture and owns 61.5%, with Newmont owning the remaining 38.5%. Refer to pages # to 29 and # for a
detailed discussion of each minesite’s results.
|
|
|
|
|
|
|
|
|
BARRICK YEAR-END 2025 |
23 |
MANAGEMENT’S DISCUSSION AND
ANALYSIS |
Carlin (61.5% basis), Nevada USA
Summary of Operating and Financial Data
|
|
|
|
|
|
|
|
|
|
|
|
|
|
|
|
|
|
|
|
|
|
|
|
|
|
|
|
|
|
|
For the three months
ended |
|
For the years
ended |
| |
12/31/25
|
9/30/25 |
Change |
|
12/31/25
|
12/31/24 |
Change |
|
12/31/23 |
| Total tonnes mined (000s) |
12,704 |
|
14,692 |
|
(14)% |
|
60,148 |
|
61,273 |
|
(2)% |
|
71,059 |
|
| Open pit ore |
1,822 |
|
1,062 |
|
72% |
|
3,390 |
|
2,867 |
|
18% |
|
4,067 |
|
| Open pit waste |
10,018 |
|
12,760 |
|
(21)% |
|
53,378 |
|
54,960 |
|
(3)% |
|
63,836 |
|
| Underground |
864 |
|
870 |
|
(1)% |
|
3,380 |
|
3,446 |
|
(2)% |
|
3,156 |
|
| Average grade (grams/tonne) |
|
|
|
|
|
|
|
|
|
| Open pit mined |
2.45 |
|
2.21 |
|
11% |
|
2.21 |
|
1.69 |
|
31% |
|
2.38 |
|
| Underground mined |
7.30 |
|
7.29 |
|
0% |
|
7.29 |
|
7.65 |
|
(5)% |
|
7.97 |
|
| Processed |
5.20 |
|
4.41 |
|
18% |
|
4.54 |
|
4.30 |
|
6% |
|
4.51 |
|
| Ore tonnes processed (000s) |
1,554 |
|
1,430 |
|
9% |
|
5,793 |
|
6,657 |
|
(13)% |
|
7,256 |
|
| Oxide mill |
0 |
|
0 |
|
0% |
|
0 |
|
0 |
|
0% |
|
377 |
|
| Roaster |
963 |
|
926 |
|
4% |
|
3,798 |
|
4,401 |
|
(14)% |
|
4,350 |
|
| Autoclave |
569 |
|
504 |
|
13% |
|
1,877 |
|
2,256 |
|
(17)% |
|
1,385 |
|
| Heap leach |
22 |
|
0 |
|
100% |
|
118 |
|
0 |
|
100% |
|
1,144 |
|
Recovery ratea |
82 |
% |
80 |
% |
2% |
|
81 |
% |
81 |
% |
0% |
|
83 |
% |
| Roaster |
85 |
% |
85 |
% |
0% |
|
85 |
% |
84 |
% |
1% |
|
85 |
% |
| Autoclave |
70 |
% |
54 |
% |
30% |
|
61 |
% |
64 |
% |
(5)% |
|
72 |
% |
| Gold produced (000s oz) |
207 |
|
165 |
|
25% |
|
687 |
|
775 |
|
(11)% |
|
868 |
|
| Oxide mill |
0 |
|
0 |
|
0% |
|
0 |
|
0 |
|
0% |
|
4 |
|
| Roaster |
173 |
|
149 |
|
16% |
|
604 |
|
669 |
|
(10)% |
|
745 |
|
| Autoclave |
31 |
|
13 |
|
138% |
|
70 |
|
86 |
|
(19)% |
|
87 |
|
| Heap leach |
3 |
|
3 |
|
0% |
|
13 |
|
20 |
|
(35)% |
|
32 |
|
| Gold sold (000s oz) |
211 |
|
170 |
|
24% |
|
689 |
|
777 |
|
(11)% |
|
865 |
|
| Revenue ($ millions) |
904 |
|
602 |
|
50% |
|
2,475 |
|
1,870 |
|
32% |
|
1,697 |
|
| Cost of sales ($ millions) |
395 |
|
254 |
|
56% |
|
1,159 |
|
1,125 |
|
3% |
|
1,100 |
|
|
|
|
|
|
|
|
|
|
|
|
|
|
|
|
|
|
|
|
|
| Income ($ millions) |
504 |
|
345 |
|
46% |
|
1,302 |
|
730 |
|
78% |
|
577 |
|
EBITDA ($ millions)b,c |
605 |
|
394 |
|
54% |
|
1,532 |
|
919 |
|
67% |
|
770 |
|
EBITDA margind |
67 |
% |
65 |
% |
3% |
|
62 |
% |
49 |
% |
27% |
|
45 |
% |
Capital expenditures ($
millions)e |
91 |
|
90 |
|
1% |
|
453 |
|
449 |
|
1% |
|
375 |
|
Minesite sustainingb |
70 |
|
71 |
|
(1)% |
|
375 |
|
408 |
|
(8)% |
|
373 |
|
Projectb |
20 |
|
18 |
|
11% |
|
74 |
|
41 |
|
80% |
|
2 |
|
| COS ($/oz) |
1,863 |
|
1,493 |
|
25% |
|
1,676 |
|
1,429 |
|
17% |
|
1,254 |
|
TCC ($/oz)b |
1,380 |
|
1,201 |
|
15% |
|
1,340 |
|
1,187 |
|
13% |
|
1,033 |
|
AISC ($/oz)b |
1,732 |
|
1,643 |
|
5% |
|
1,906 |
|
1,730 |
|
10% |
|
1,486 |
|
|
|
|
|
|
|
|
|
|
|
a.Excludes the Gold Quarry (Mill 5) concentrator (decommissioned at the end of Q1 2023).
b.Further information on these non-GAAP financial measures, including detailed reconciliations, is included on pages 57 to 69 of this
MD&A.
c.EBITDA represents income less depreciation. Depreciation expense is $101 million and $230 million for Q4
2025 and 2025, respectively (Q3 2025: $49 million, 2024: $189 million, 2023: $193 million).
d.Represents EBITDA divided by revenue.
e.Includes capitalized
interest.
Safety and Environment
|
|
|
|
|
|
|
|
|
|
|
|
|
|
|
| For the three months
ended |
For the year ended |
|
12/31/25
|
9/30/25 |
12/31/25
|
12/31/24 |
| LTI |
1 |
0 |
1 |
3 |
LTIFR8 |
0.42 |
0.00 |
0.1 |
0.30 |
TRIFR8 |
2.10 |
2.11 |
1.66 |
2.33 |
Class
19 environmental incidents |
0
|
0
|
0
|
0
|
Financial Results
Q4 2025 compared to Q3 2025
Gold production in Q4 2025 was 25% higher compared to Q3 2025 primarily due to higher throughput and grades processed at both the roasters and the
autoclave. Higher
grades processed were driven by access opening up to mine higher grade ore in the South Arturo pit, in line with the mine plan. Autoclave throughput
increased following the completion of the shutdown during Q3 2025 and both roasters performed better on throughput and runtime in Q4 2025 driven by reliability improvements.
COS/oz7 and TCC/oz6 in Q4 2025 were 25% and 15% higher, respectively, compared to Q3 2025 due to increased sulfuric acid consumption due to changes in ore feed
composition. This was compounded by sulfur and sulfuric acid pricing pressures, the impacts of tariffs on other key consumables as well as higher royalties from the higher realized gold price6. COS/oz7 was further impacted by higher depreciation expense which relates to ore sourced from South Arturo. In Q4 2025, AISC/oz6 was 5% higher compared to Q3 2025, mainly due to higher
TCC/
|
|
|
|
|
|
|
|
|
BARRICK YEAR-END 2025 |
24 |
MANAGEMENT’S DISCUSSION AND
ANALYSIS |
oz6, partially offset by lower minesite sustaining capital expenditures6 on a per ounce basis.
Capital expenditures in Q4 2025 were in line with Q3 2025, as higher capitalized stripping was offset by lower underground development, in line with
the mine plan.
2025 compared to
2024
Gold production in 2025 was 11% lower compared to 2024, mainly due to lower underground grades
mined. A secondary impact of this was more of the higher grade Cortez refractory ore was processed at the Carlin roasters compared to 2024. This displacement of lower grade Carlin feed ensured that overall production for NGM was maximized. Heap
leach production was also lower for 2025 owing to the leach cycle with minimal tonnes placed on leach pads in 2024 and 2025. Leach placement is expected to increase once the Gold Quarry pit is back mining in ore (expected in 2027).
COS/oz7 and TCC/oz6 for 2025 were 17% and 13% higher, respectively, than 2024, primarily due to the lower production (resulting in lower fixed cost dilution), combined
with higher royalties from the higher realized gold price6. In addition, processing costs were higher, driven by higher sulfur pricing in 2025, combined with higher consumable prices as the impact of tariffs
started to be realized in Q4 2025, specifically on steel products. For 2025, AISC/oz6 was 10% higher than 2024, due to the impact of higher TCC/oz6, and slightly higher minesite sustaining capital expenditures6 on a per ounce basis.
Capital expenditures in 2025 were in line with 2024 as higher project capital expenditures6 (related to the ramp-up of the Ren project in 2025), were offset by lower minesite sustaining capital expenditures6 following the completion of the Komatsu-930 truck fleet replacement project in 2024.
2025 compared to Guidance
|
|
|
|
|
|
|
|
|
|
2025 Actual |
2025 Guidance |
| Gold produced (000s oz) |
687 |
705 -785 |
Cost of sales7 ($/oz) |
1,676 |
1,470 - 1,570 |
Total cash costs6 ($/oz) |
1,340 |
|
1,140 - 1,220 |
All-in
sustaining costs6 ($/oz) |
1,906
|
|
1,630
- 1,730 |
Gold production
for 2025 was below the guidance range, as previously disclosed, primarily due to a slower than planned ramp-up of the Gold Quarry roaster and delayed access to higher grade underground zones due to poor ground conditions. This was further impacted
by an increase in higher grade ore shipped from Cortez and processed at the Carlin roasters, to the overall benefit of NGM. COS/oz7 and TCC/oz6 were both above the guidance ranges mainly due to the impact of lower production, combined with increased sulfuric acid consumption and pricing, and
higher consumable prices partially driven by the impact of tariffs.
AISC/oz6 was also higher than guidance, mainly driven by higher TCC/oz6. All cost metrics were also impacted by higher royalties from the higher realized gold price6. Our cost guidance for 2025 was based on a gold price assumption of $2,400/oz. Given the actual realized gold price6 was considerably higher at $3,501/oz, the cost guidance ranges for Carlin need to be increased by $40/oz to provide a more meaningful
comparison. After adjusting for the realized gold price6, the guidance ranges are as follows: COS/oz7 of $1,510 to $1,610, TCC/oz6 of $1,180 to $1,260 and AISC/oz6 of $1,670 to $1,770. The actual cost metrics for 2025 were higher than the price adjusted ranges due to the lower than planned production as
explained above.
|
|
|
|
|
|
|
|
|
BARRICK YEAR-END 2025 |
25 |
MANAGEMENT’S DISCUSSION AND
ANALYSIS |
Cortez (61.5% basis), Nevada USA
Summary of Operating and Financial Data
|
|
|
|
|
|
|
|
|
|
|
|
|
|
|
|
|
|
|
|
|
|
|
|
|
|
|
|
|
|
|
For the three months
ended |
|
For the years
ended |
| |
12/31/25
|
9/30/25 |
Change |
|
12/31/25
|
12/31/24 |
Change |
|
12/31/23 |
| Total tonnes mined (000s) |
13,465 |
|
13,699 |
|
(2)% |
|
56,200 |
|
67,928 |
|
(17)% |
|
70,570 |
|
| Open pit
ore |
3,147 |
|
1,777 |
|
77% |
|
7,407 |
|
5,499 |
|
35% |
|
14,991 |
|
| Open pit
waste |
9,770 |
|
11,372 |
|
(14)% |
|
46,711 |
|
60,666 |
|
(23)% |
|
54,133 |
|
|
Underground |
548 |
|
550 |
|
0% |
|
2,082 |
|
1,763 |
|
18% |
|
1,446 |
|
| Average grade (grams/tonne) |
|
|
|
|
|
|
|
|
|
| Open pit
mined |
0.73 |
|
1.16 |
|
(37)% |
|
0.95 |
|
1.31 |
|
(27)% |
|
0.78 |
|
| Underground
mined |
8.65 |
|
8.06 |
|
7% |
|
7.83 |
|
7.86 |
|
0% |
|
9.54 |
|
|
Processed |
1.82 |
|
2.26 |
|
(19)% |
|
2.10 |
|
2.30 |
|
(9)% |
|
1.37 |
|
| Ore tonnes processed (000s) |
2,963 |
|
2,028 |
|
46% |
|
8,326 |
|
6,613 |
|
26% |
|
15,741 |
|
| Oxide
mill |
540 |
|
538 |
|
0% |
|
2,059 |
|
2,433 |
|
(15)% |
|
2,504 |
|
| Roaster |
475 |
|
403 |
|
18% |
|
1,457 |
|
892 |
|
63% |
|
643 |
|
|
Autoclave |
2 |
|
44 |
|
(95)% |
|
187 |
|
n/a |
n/a |
|
n/a |
| Heap
leach |
1,946 |
|
1,043 |
|
87% |
|
4,623 |
|
3,288 |
|
41% |
|
12,594 |
|
| Recovery rate |
83 |
% |
83 |
% |
0% |
|
83 |
% |
83 |
% |
0% |
|
84 |
% |
| Oxide
Mill |
78 |
% |
79 |
% |
(1)% |
|
80 |
% |
80 |
% |
0% |
|
82 |
% |
| Roaster |
86 |
% |
88 |
% |
(2)% |
|
87 |
% |
87 |
% |
0% |
|
88 |
% |
|
Autoclave |
24 |
% |
45 |
% |
(47)% |
|
46 |
% |
n/a |
n/a |
|
n/a |
| Gold produced (000s oz) |
130 |
|
124 |
|
5% |
|
454 |
|
444 |
|
2% |
|
549 |
|
| Oxide
mill |
40 |
|
40 |
|
0% |
|
162 |
|
193 |
|
(16)% |
|
273 |
|
| Roaster |
84 |
|
73 |
|
15% |
|
258 |
|
178 |
|
45% |
|
143 |
|
|
Autoclave |
0 |
|
5 |
|
(100)% |
|
7 |
|
n/a |
n/a |
|
n/a |
| Heap
leach |
6 |
|
6 |
|
0% |
|
27 |
|
73 |
|
(63)% |
|
133 |
|
| Gold sold (000s oz) |
136 |
|
123 |
|
11% |
|
462 |
|
441 |
|
5% |
|
548 |
|
| Revenue
($ millions) |
577
|
|
438
|
|
32%
|
|
1,652
|
|
1,061
|
|
56%
|
|
1,068
|
|
| Cost of sales ($ millions) |
218 |
|
198 |
|
10% |
|
745 |
|
619 |
|
20% |
|
722 |
|
|
|
|
|
|
|
|
|
|
|
|
|
|
|
|
|
|
|
|
|
| Income ($ millions) |
357 |
|
238 |
|
50% |
|
899 |
|
433 |
|
108% |
|
333 |
|
EBITDA ($ millions)a,b |
410 |
|
283 |
|
45% |
|
1,070 |
|
589 |
|
82% |
|
557 |
|
EBITDA marginc |
71 |
% |
65 |
% |
9% |
|
65 |
% |
56 |
% |
16% |
|
52 |
% |
| Capital expenditures ($
millions) |
64 |
|
56 |
|
14% |
|
255 |
|
249 |
|
2% |
|
260 |
|
Minesite
sustaininga |
22 |
|
15 |
|
47% |
|
114 |
|
159 |
|
(28)% |
|
191 |
|
Projecta |
42 |
|
41 |
|
2% |
|
141 |
|
90 |
|
57% |
|
69 |
|
| COS ($/oz) |
1,592 |
|
1,612 |
|
(1)% |
|
1,609 |
|
1,402 |
|
15% |
|
1,318 |
|
TCC ($/oz)a |
1,196 |
|
1,242 |
|
(4)% |
|
1,234 |
|
1,046 |
|
18% |
|
906 |
|
AISC ($/oz)
a |
1,384
|
|
1,407
|
|
(2)%
|
|
1,513
|
|
1,441
|
|
5%
|
|
1,282
|
|
|
|
|
|
|
|
|
|
|
|
a.Further information on these non-GAAP financial measures, including detailed reconciliations, is included on pages 57 to 69 of
this MD&A.
b.EBITDA represents income less depreciation. Depreciation expense is $53 million and $171 million for Q4
2025 and 2025, respectively (Q3 2025: $45 million, 2024: $156 million, 2023: $224 million).
c.Represents EBITDA divided by
revenue.
Safety and Environment
|
|
|
|
|
|
|
|
|
|
|
|
|
|
|
| For the three months
ended |
For the year
ended |
|
12/31/25
|
9/30/25 |
12/31/25
|
12/31/24 |
| LTI |
1 |
0 |
1 |
1 |
LTIFR8 |
0.88 |
0.00 |
0.22 |
0.23 |
TRIFR8 |
2.63 |
5.29 |
2.21 |
1.6 |
Class
19 environmental incidents |
0
|
0
|
0
|
0
|
Financial
Results
Q4 2025 compared to Q3 2025
Gold production in Q4 2025 was 5% higher compared to Q3 2025. This was mainly driven by higher ore tonnes from both Cortez Pits and Goldrush
transported and processed at the Carlin roasters, combined with higher grades from
Cortez Hills underground, partially offset by lower grades from the open pits.
COS/oz7 and TCC/oz6 in Q4 2025 were 1% and 4% lower, respectively, than Q3 2025, driven by the increased production and favorable leach tonne placement driven by higher
open pit ore tonnes, partially offset by higher royalties from the higher realized gold price6. In Q4 2025, AISC/oz6 were 2% lower than Q3 2025, mainly due to lower TCC/oz6, partially offset by higher minesite sustaining capital expenditures6.
Capital expenditures in Q4 2025 were 14% higher compared to Q3 2025, mainly due to higher minesite sustaining capital expenditures6 driven by increased capitalized waste stripping and fleet replacements in both the open pit and underground
operations.
|
|
|
|
|
|
|
|
|
BARRICK YEAR-END 2025 |
26 |
MANAGEMENT’S DISCUSSION AND
ANALYSIS |
2025 compared to 2024
Gold production in 2025 was 2% higher than 2024 primarily due to higher refractory ore shipped and
processed at the Carlin roasters driven by productivity improvements in the Cortez Hills underground, the ramp-up of Goldrush and higher proportions of refractory ore mined from Cortez Pits. The other consequence of higher refractory material
sourced from the open pits was lower oxide ore tonnes and grades through the oxide mill which were the main drivers of the lower oxide mill production. Finally, leach ounces were lower compared to the prior year. Although ore stacked was higher,
given close to half of the tonnes were placed in Q4 and with the longer processing cycle time, the gold will be realized across 2025 and 2026.
COS/oz7 and TCC/oz6 in 2025 were 15% and 18% higher, respectively, than 2024, reflecting a higher proportion of higher cost refractory ounces processed at the Carlin
roasters in the sales mix and higher royalties from the higher realized gold
price6. For 2025, AISC/oz6 increased by 5% compared to 2024, driven by higher TCC/oz6, partially offset by lower minesite sustaining capital expenditures6.
Capital expenditures in 2025 increased by 2% compared to 2024, due to increased project capital expenditures6 resulting from higher development and infrastructure spend at Goldrush and the successful initiation of the autonomous haul project during the year.
This was partially offset by lower minesite sustaining capital
expenditures6 following the investment in the Komatsu 930-E truck fleet which spanned both 2023 and 2024 and lower capitalized waste stripping at Crossroads
following the completion of Crossroads Phase 6 stripping in Q2 2025.
2025 compared to Guidance
|
|
|
|
|
|
|
|
|
|
2025 Actual |
2025 Guidance |
| Gold produced (000s oz) |
454 |
420 - 470 |
Cost of sales7 ($/oz) |
1,609 |
|
1,420 - 1,520 |
Total cash costs6 ($/oz) |
1,234 |
1,050 - 1,130 |
All-in
sustaining costs6 ($/oz) |
1,513
|
|
1,370
- 1,470 |
Gold production
for 2025 was in the top half of the guidance range, primarily due to higher than planned refractory ore shipped and processed at the Carlin roasters and the Goldstrike autoclave, to the overall benefit of NGM. COS/oz7 and TCC/oz6 were above the original guidance range reflecting a higher than planned proportion of higher cost refractory ounces processed at the Carlin roasters
in the sales mix combined with higher sulfur and other consumable prices, partially driven by tariffs. All cost metrics were also impacted by higher royalties from the higher realized gold price6. Our cost guidance for 2025 was based on a gold price assumption of $2,400/oz. Given the actual realized gold price6 was considerably higher at $3,501/oz, the cost guidance ranges for Cortez need to be increased by $55/oz to provide a more meaningful
comparison. After adjusting for the realized gold price6, the guidance ranges are as follows: COS/oz7 of $1,475 to $1,575, TCC/oz6 of $1,105 to $1,185 and AISC/oz6 of $1,425 to $1,525. AISC/oz6 was within the price adjusted guidance range as the higher TCC/oz6 was partially offset by lower than planned capitalized waste stripping at Crossroads following the reclassification of waste material to low grade
ore.
|
|
|
|
|
|
|
|
|
BARRICK YEAR-END 2025 |
27 |
MANAGEMENT’S DISCUSSION AND
ANALYSIS |
Turquoise Ridge (61.5%), Nevada USA
Summary of Operating and Financial Data
|
|
|
|
|
|
|
|
|
|
|
|
|
|
|
|
|
|
|
|
|
|
|
|
|
|
|
|
|
|
|
For the three months
ended |
|
For the years
ended |
|
12/31/25
|
9/30/25 |
Change |
|
12/31/25
|
12/31/24 |
Change |
|
12/31/23 |
| Total tonnes mined (000s) |
327 |
|
430 |
|
(24)% |
|
1,179 |
|
2,339 |
|
(50)% |
|
919 |
|
| Open pit ore |
43 |
|
54 |
|
(20)% |
|
97 |
|
132 |
|
(27)% |
|
0 |
|
| Open pit waste |
55 |
|
152 |
|
(64)% |
|
214 |
|
1,380 |
|
(84)% |
|
0 |
|
| Underground |
229 |
|
224 |
|
2% |
|
868 |
|
827 |
|
5% |
|
919 |
|
| Average grade (grams/tonne) |
|
|
|
|
|
|
|
|
|
| Open pit mined |
1.47 |
|
1.51 |
|
(3)% |
|
1.50 |
|
1.25 |
20% |
|
n/a |
| Underground mined |
14.06 |
|
13.02 |
|
8% |
|
12.48 |
|
12.50 |
|
0% |
|
11.28 |
|
| Processed |
6.20 |
|
4.61 |
|
34% |
|
4.88 |
|
4.86 |
|
0% |
|
4.34 |
|
| Ore tonnes processed (000s) |
599 |
|
650 |
|
(8)% |
|
2,474 |
|
2,268 |
|
9% |
|
2,608 |
|
| Oxide Mill |
79 |
|
72 |
|
10% |
|
294 |
|
289 |
|
2% |
|
357 |
|
| Autoclave |
516 |
|
578 |
|
(11)% |
|
2,176 |
|
1,979 |
|
10% |
|
2,251 |
|
| Roaster |
4 |
|
0 |
|
100% |
|
4 |
|
0 |
|
100% |
|
0 |
|
| Recovery Rate |
88 |
% |
87 |
% |
1% |
|
87 |
% |
85 |
% |
2% |
|
86 |
% |
| Oxide Mill |
83 |
% |
86 |
% |
(3)% |
|
85 |
% |
84 |
% |
1% |
|
85 |
% |
| Autoclave |
88 |
% |
87 |
% |
1% |
|
87 |
% |
85 |
% |
2% |
|
86 |
% |
| Roaster |
85 |
% |
n/a |
n/a |
|
85 |
% |
n/a |
n/a |
|
n/a |
| Gold produced (000s oz) |
105 |
|
86 |
|
22% |
|
341 |
|
304 |
|
12% |
|
316 |
|
| Oxide Mill |
4 |
|
4 |
|
0% |
|
18 |
|
14 |
|
29% |
|
14 |
|
| Autoclave |
100 |
|
82 |
|
22% |
|
322 |
|
287 |
|
12% |
|
299 |
|
| Heap leach |
1 |
|
0 |
|
100% |
|
1 |
|
3 |
|
(67)% |
|
3 |
|
| Gold sold (000s oz) |
104 |
|
85 |
|
22% |
|
342 |
|
298 |
|
15% |
|
318 |
|
| Revenue ($
millions) |
443
|
|
301
|
|
47%
|
|
1,220
|
|
724
|
|
69%
|
|
620
|
|
| Cost of sales ($ millions) |
149 |
|
123 |
|
21% |
|
530 |
|
481 |
|
10% |
|
444 |
|
| Income ($ millions) |
294 |
|
180 |
|
63% |
|
695 |
|
238 |
|
192% |
|
172 |
|
EBITDA ($ millions)a,b |
333 |
|
209 |
|
59% |
|
819 |
|
348 |
|
135% |
|
288 |
|
EBITDA marginc |
75 |
% |
69 |
% |
9% |
|
67 |
% |
48 |
% |
40% |
|
46 |
% |
| Capital expenditures ($
millions) |
19 |
|
14 |
|
36% |
|
63 |
|
63 |
|
0% |
|
67 |
|
Minesite
sustaininga |
17 |
|
13 |
|
31% |
|
59 |
|
62 |
|
(5)% |
|
61 |
|
Projecta |
2 |
|
1 |
|
100% |
|
4 |
|
1 |
|
300% |
|
6 |
|
| COS ($/oz) |
1,422 |
|
1,452 |
|
(2)% |
|
1,545 |
|
1,615 |
|
(4)% |
|
1,399 |
|
TCC ($/oz)a |
1,050 |
|
1,099 |
|
(4)% |
|
1,178 |
|
1,238 |
|
(5)% |
|
1,026 |
|
AISC ($/oz)
a |
1,225
|
|
1,244
|
|
(2)%
|
|
1,358
|
|
1,466
|
|
(7)%
|
|
1,234
|
|
|
|
|
|
|
|
|
|
|
|
a.Further information on these non-GAAP financial measures, including detailed reconciliations, is included on pages 57 to 69 of
this MD&A.
b.EBITDA represents income less depreciation. Depreciation expense is $39 million and $124 million for Q4
2025 and 2025, respectively (Q3 2025: $29 million, 2024: $110 million, 2023: $116 million).
c.Represents EBITDA divided by revenue.
Safety and Environment
|
|
|
|
|
|
|
|
|
|
|
|
|
|
|
| For the three months
ended |
For the year
ended |
|
12/31/25
|
9/30/25 |
12/31/25
|
12/31/24 |
| LTI |
0 |
0 |
1 |
3 |
LTIFR8 |
0.00 |
0.00 |
0.37 |
1.05 |
TRIFR8 |
0 |
1.55 |
1.12 |
3.5 |
Class
19 environmental incidents |
0
|
0
|
0
|
0
|
Financial
Results
Q4 2025 compared to Q3 2025
Gold production in Q4 2025 was 22% higher than Q3 2025, mainly due to higher grades from the undergrounds as per the mine plan resulting in 34%
higher processed grades combined with 2% higher underground tonnes mined owing to improved mining efficiencies.
COS/oz7 and TCC/oz6 in Q4 2025 were 2% and 4% lower, respectively, than Q3 2025, primarily due to higher throughput and grades, partially offset by higher
maintenance costs due to a major planned shutdown at the autoclave occurring in the quarter. AISC/oz6 was 2% lower than Q3 2025, mainly reflecting lower TCC/oz6, partially offset by higher minesite sustaining capital expenditures6.
Capital expenditures in Q4 2025 were 36% higher than Q3 2025 mainly due to the boiler replacement and other capital works during the planned
shutdown, combined with higher TSF spend with the commencement of phase 1 of the Sage TSF expansion during 2025.
2025 compared to 2024
Gold production in 2025 was 12% higher compared to 2024, primarily due to 5% higher underground tonnes mined owing to improved mining efficiencies
and 10% higher tonnes processed through the autoclave following the reinvestment in the facility over the last two years to increase overall reliability and throughput.
COS/oz7 and TCC/oz6 in 2025 were 4% and 5% lower, respectively, than 2024, mainly due to higher
|
|
|
|
|
|
|
|
|
BARRICK YEAR-END 2025 |
28 |
MANAGEMENT’S DISCUSSION AND
ANALYSIS |
production and lower unit rates in both the underground and the autoclave driven by improved efficiencies and
an overall reduction in contractor spend and unplanned maintenance events. This was partially offset by higher royalties from the higher realized gold price6. AISC/oz6 decreased by 7% compared to 2024 due to lower TCC/oz6, combined with lower minesite sustaining capital expenditures6 driven by lower plant remedial costs required following the investment in
2024.
2025
compared to Guidance
|
|
|
|
|
|
|
|
|
|
2025 Actual |
2025 Guidance |
| Gold produced (000s oz) |
341 |
310 - 345 |
Cost of sales7 ($/oz) |
1,545 |
|
1,370 - 1,470 |
Total cash costs6 ($/oz) |
1,178 |
1,000 - 1,080 |
All-in
sustaining costs6 ($/oz) |
1,358
|
|
1,260
-
1,360 |
Gold production in 2025
was at the top end of the guidance range as the improvements in stabilizing the processing plant and improved mining efficiencies resulted in a strong H2 performance. COS/oz7 and TCC/oz6 were higher than the original guidance mainly due to a change in the mine plan which involved higher operating development costs combined with higher
input prices relating to reagents and consumables, partially driven by tariffs, and higher than planned maintenance costs. AISC/oz6 was within guidance as the impact of the change in the mine plan was not a driver (higher operating costs were offset by lower minesite sustaining
capital expenditures6). All cost metrics were also impacted by higher royalties from the higher realized gold price6. Our cost guidance for 2025 was based on a gold price assumption of $2,400/oz. Given the actual realized gold price6 was considerably higher at $3,501/oz, the cost guidance ranges for Turquoise Ridge need to be increased by $15/oz to provide a more
meaningful comparison. After adjusting for the realized gold price6, the guidance ranges are as follows: COS/oz7 of $1,385 to $1,485, TCC/oz6 of $1,015 to $1,095 and AISC/oz6 of $1,275 to
$1,375.
|
|
|
|
|
|
|
|
|
BARRICK YEAR-END 2025 |
29 |
MANAGEMENT’S DISCUSSION AND
ANALYSIS |
Pueblo Viejo (60% basis)a, Dominican Republic
Summary of Operating and Financial Data
|
|
|
|
|
|
|
|
|
|
|
|
|
|
|
|
|
|
|
|
|
|
|
|
|
|
|
|
|
|
|
For the three months
ended |
|
For the years
ended |
| |
12/31/25
|
9/30/25 |
Change |
|
12/31/25
|
12/31/24 |
Change |
|
12/31/23 |
| Open pit tonnes mined
(000s) |
6,257 |
|
6,303 |
|
(1)% |
|
17,818 |
|
10,885 |
|
64% |
|
18,074 |
|
| Open pit ore |
1,905 |
|
1,682 |
|
13% |
|
4,349 |
|
5,879 |
|
(26)% |
|
7,794 |
|
| Open pit waste |
4,352 |
|
4,621 |
|
(6)% |
|
13,469 |
|
5,006 |
|
169% |
|
10,280 |
|
| Average grade (grams/tonne) |
|
|
|
|
|
|
|
|
|
| Open pit mined |
2.29 |
|
2.12 |
|
8% |
|
2.21 |
|
2.12 |
|
4% |
|
2.05 |
|
| Processed |
2.59 |
|
2.59 |
|
0% |
|
2.44 |
|
2.46 |
|
(1)% |
|
2.39 |
|
| Autoclave ore tonnes processed (000s) |
1,807 |
|
1,717 |
|
5% |
|
6,429 |
|
5,730 |
|
12% |
|
5,332 |
|
| Recovery rate |
69 |
% |
77 |
% |
(10)% |
|
75 |
% |
79 |
% |
(5)% |
|
81 |
% |
| Gold produced (000s oz) |
103 |
|
107 |
|
(4)% |
|
379 |
|
352 |
|
8% |
|
335 |
|
| Gold sold (000s oz) |
106 |
|
108 |
|
(2)% |
|
383 |
|
351 |
|
9% |
|
335 |
|
| Revenue ($ millions) |
476 |
|
378 |
|
26% |
|
1,388 |
|
851 |
|
63% |
|
670 |
|
| Cost of sales ($ millions) |
157 |
|
157 |
|
0% |
|
615 |
|
553 |
|
11% |
|
475 |
|
| Income ($ millions) |
313 |
|
216 |
|
45% |
|
755 |
|
286 |
|
164% |
|
187 |
|
EBITDA ($ millions)b,c |
361 |
|
263 |
|
37% |
|
940 |
|
462 |
|
103% |
|
341 |
|
EBITDA margind |
76 |
% |
70 |
% |
9% |
|
68 |
% |
54 |
% |
26% |
|
51 |
% |
Capital expenditures ($
millions)e |
72 |
|
47 |
|
53% |
|
221 |
|
195 |
|
13% |
|
236 |
|
Minesite sustainingb |
41 |
|
27 |
|
52% |
|
141 |
|
108 |
|
31% |
|
117 |
|
Projectb |
29 |
|
18 |
|
61% |
|
71 |
|
62 |
|
15% |
|
119 |
|
| COS ($/oz) |
1,492 |
|
1,451 |
|
3% |
|
1,608 |
|
1,576 |
|
2% |
|
1,418 |
|
TCC ($/oz)b |
930 |
|
929 |
|
0% |
|
1,034 |
|
1,005 |
|
3% |
|
889 |
|
AISC ($/oz)b |
1,322 |
|
1,198 |
|
10% |
|
1,412 |
|
1,323 |
|
7% |
|
1,249 |
|
|
|
|
|
|
|
|
|
|
|
a.Barrick is the operator of Pueblo Viejo and owns 60% with Newmont Corporation owning the remaining 40%. Pueblo Viejo is accounted
for as a subsidiary with a 40% non-controlling interest. The results in the table and the discussion that follows are based on our 60% share only.
b.Further information on these non-GAAP financial measures, including detailed reconciliations, is included on pages 57 to 69 of this
MD&A.
c.EBITDA represents income less depreciation. Depreciation expense is $48 million and $185 million for Q4
2025 and 2025, respectively (Q3 2025: $47 million, 2024: $176 million, 2023: $154 million).
d.Represents EBITDA divided by revenue.
e.Starting in the first quarter of 2024, this amount includes capitalized interest.
Safety and Environment
|
|
|
|
|
|
|
|
|
|
|
|
|
|
|
| For the three months
ended |
For the year
ended |
|
12/31/25
|
9/30/25 |
12/31/25
|
12/31/24 |
| LTI |
0 |
0 |
0 |
0 |
LTIFR8 |
0.00 |
0.00 |
0.06 |
0.07 |
TRIFR8 |
0.26 |
0.44 |
0.29 |
0.54 |
Class
19 environmental incidents |
0
|
0
|
0
|
0
|
Financial
Results
Q4 2025 compared to Q3 2025
Gold production for Q4 2025 was 4% lower than Q3 2025 due to lower recoveries stemming from lagging recovery performance of historically stockpiled
material in the flotation-, autoclave- and CIL circuits. Lower recoveries were partially offset by higher throughput quarter-on-quarter.
COS/oz7 for Q4 2025 was 3% higher than Q3 2025 mainly due to higher depreciation expense, while TCC/oz6 remained consistent with Q3 2025 as lower fixed plant maintenance costs were offset by higher royalties from the higher realized gold price6. For Q4 2025, AISC/oz6 was 10% higher than Q3 2025, mainly reflecting higher minesite sustaining capital expenditures6.
Capital expenditures for Q4 2025 increased by 53% compared to Q3 2025 due to higher minesite sustaining capital expenditures6 associated with restoring
fleet reliability and increased activities at the Llagal TSF, and higher project capital expenditures on the Naranjo
TSF.
2025 compared to
2024
Gold production for 2025 was 8% higher than 2024, mainly due to higher throughput resulting
from the plant expansion (+12% year on year), partially offset by lower recoveries due to increased utilization of the expansion flotation circuit and lower recoveries from stockpile material, resulting in higher ounce production.
COS/oz7 and TCC/oz6 for 2025 increased by 2% and 3%, respectively, compared to 2024, primarily due to higher diesel and electricity consumption, higher plant
maintenance costs and higher royalties from the higher realized gold
price6. This was partially offset by the benefit of greater fixed cost dilution with the increase in throughput and lower mining costs. For 2025,
AISC/oz6 increased by 7% compared to 2024, mainly reflecting both higher minesite sustaining capital expenditures6 and TCC/oz6.
Capital expenditures for 2025 increased by 13% compared to 2024, mainly due to higher minesite sustaining capital expenditures6 relating to plant and mining fleet component replacements, as well as increased project capital expenditures6 relating to the mine life extension project. Refer to the Future Growth section on page 44 for more
details.
|
|
|
|
|
|
|
|
|
BARRICK YEAR-END 2025 |
30 |
MANAGEMENT’S DISCUSSION AND
ANALYSIS |
2025 compared to
Guidance
|
|
|
|
|
|
|
|
|
|
2025 Actual |
2025 Guidance |
| Gold produced (000s oz) |
379 |
370 - 410 |
Cost of sales7 ($/oz) |
1,608 |
|
1,540 - 1,640 |
Total cash costs6 ($/oz) |
1,034 |
910 - 990 |
All-in
sustaining costs6 ($/oz) |
1,412
|
|
1,280
- 1,380 |
Gold production in
2025 was in the lower half of the guidance range mainly due to lower CIL recovery resulting from higher than planned copper and preg-robbing ores in the feed blend, partially offset by higher grades processed. COS/oz7 was within the guidance range as the increase in TCC/oz6 was partially offset by lower depreciation expense. TCC/oz6 was higher than the guidance range mainly due to higher processing maintenance costs. All cost metrics were also impacted by higher royalties from
the higher realized gold price6. Our cost guidance for 2025 was based on a gold price assumption of $2,400/oz. Given the actual realized gold price6 was considerably higher at $3,501/oz, the cost guidance ranges for Pueblo Viejo need to be increased by $40/oz to provide a more meaningful
comparison. After adjusting for the realized gold price6, the guidance ranges are as follows: COS/oz7 of $1,580 to $1,680, TCC/oz6 of $950 to $1,030 and AISC/oz6 of $1,320 to $1,420. After adjusting for the gold price, AISC/oz6 was within the guidance
range.
|
|
|
|
|
|
|
|
|
BARRICK YEAR-END 2025 |
31 |
MANAGEMENT’S DISCUSSION AND
ANALYSIS |
Kibali (45% basis)a, Democratic Republic of the Congo
Summary of Operating and Financial Data
|
|
|
|
|
|
|
|
|
|
|
|
|
|
|
|
|
|
|
|
|
|
|
|
|
|
|
|
|
|
|
|
|
For the three months
ended |
|
|
|
For the years
ended |
| |
12/31/25
|
9/30/25 |
Change |
|
|
|
12/31/25
|
12/31/24 |
Change |
|
12/31/23 |
| Total tonnes mined (000s) |
6,840 |
|
6,089 |
|
12% |
|
|
|
23,597 |
|
19,398 |
|
22% |
|
17,837 |
|
| Open pit
ore |
884 |
|
959 |
|
(8)% |
|
|
|
2,859 |
|
2,045 |
|
40% |
|
2,721 |
|
| Open pit waste |
5,607 |
|
4,723 |
|
19% |
|
|
|
19,195 |
|
15,539 |
|
24% |
|
13,288 |
|
|
Underground |
349 |
|
407 |
|
(14)% |
|
|
|
1,542 |
|
1,814 |
|
(15)% |
|
1,828 |
|
|
|
|
|
|
|
|
|
|
|
|
|
|
|
|
|
|
|
|
|
|
|
|
|
| Average grade (grams/tonne) |
|
|
|
|
|
|
|
|
|
|
|
| Open pit
mined |
1.59 |
|
1.49 |
|
7% |
|
|
|
1.51 |
|
1.43 |
|
6% |
|
1.60 |
|
| Underground mined |
5.38 |
|
4.96 |
|
8% |
|
|
|
5.17 |
|
5.21 |
|
(1)% |
|
5.11 |
|
|
Processed |
2.91 |
|
3.15 |
|
(8)% |
|
|
|
2.79 |
|
2.82 |
|
(1)% |
|
3.21 |
|
| Ore tonnes processed (000s) |
933 |
|
935 |
|
0% |
|
|
|
3,745 |
|
3,827 |
|
(2)% |
|
3,700 |
|
| Recovery rate |
91 |
% |
90 |
% |
1% |
|
|
|
90 |
% |
89 |
% |
1% |
|
90 |
% |
| Gold produced (000s oz) |
79 |
|
86 |
|
(8)% |
|
|
|
303 |
|
309 |
|
(2)% |
|
343 |
|
| Gold sold (000s oz) |
78 |
|
84 |
|
(7)% |
|
|
|
298 |
|
309 |
|
(4)% |
|
343 |
|
| Revenue ($ millions) |
328 |
|
294 |
|
12% |
|
|
|
1,040 |
|
743 |
|
40% |
|
670 |
|
| Cost of sales ($ millions) |
123 |
|
124 |
|
(1)% |
|
|
|
468 |
|
415 |
|
13% |
|
419 |
|
|
|
|
|
|
|
|
|
|
|
|
|
|
|
|
|
|
|
|
|
|
|
|
|
| Income ($ millions) |
205 |
|
161 |
|
27% |
|
|
|
527 |
|
316 |
|
67% |
|
243 |
|
EBITDA ($ millions)b,c |
241 |
|
199 |
|
21% |
|
|
|
665 |
|
450 |
|
48% |
|
390 |
|
EBITDA margind |
73 |
% |
68 |
% |
7% |
|
|
|
64 |
% |
61 |
% |
5% |
|
58 |
% |
| Capital expenditures ($
millions) |
39 |
|
39 |
|
0% |
|
|
|
140 |
|
116 |
|
21% |
|
73 |
|
Minesite sustainingb |
19 |
|
19 |
|
0% |
|
|
|
60 |
|
58 |
|
3% |
|
35 |
|
Projectb |
20 |
|
20 |
|
0% |
|
|
|
80 |
|
58 |
|
38% |
|
38 |
|
| COS ($/oz) |
1,557 |
|
1,482 |
|
5% |
|
|
|
1,568 |
|
1,344 |
|
17% |
|
1,221 |
|
TCC ($/oz)b |
1,093 |
|
1,019 |
|
7% |
|
|
|
1,099 |
|
905 |
|
21% |
|
789 |
|
AISC ($/oz)b |
1,374 |
|
1,286 |
|
7% |
|
|
|
1,337 |
|
1,123 |
|
19% |
|
918 |
|
|
|
|
|
|
|
|
|
|
|
|
|
a.Barrick owns 45% of Kibali Goldmines SA with the Government of Democratic Republic of the Congo and our joint venture partner,
AngloGold Ashanti, owning 10% and 45%, respectively. The figures presented in this table and the discussion that follows are based on our 45% effective interest in Kibali Goldmines SA held through our 50% interest in Kibali (Jersey) Limited and its
other subsidiaries (collectively "Kibali"), inclusive of the impact of the purchase price allocation resulting from the merger with Randgold. Kibali is accounted for as an equity method investment on the basis that the joint venture partners
that have joint control have rights to the net assets of the joint venture.
b.Further information on these non-GAAP financial measures, including detailed reconciliations, is included on pages 57 to 69 of this
MD&A.
c.EBITDA represents income less depreciation. Depreciation expense is $36 million
and $138 million for Q4 2025 and 2025, respectively (Q3 2025: $38 million,
2024: $134 million, 2023: $147
million).
d.
Represents EBITDA divided by
revenue.
Safety and Environment
|
|
|
|
|
|
|
|
|
|
|
|
|
|
|
| For the three months
ended |
For the year
ended |
|
12/31/25
|
9/30/25 |
12/31/25
|
12/31/24 |
| LTI |
0 |
2 |
4 |
3 |
LTIFR8 |
0.00 |
0.37 |
0.19 |
0.17 |
TRIFR8 |
0.35 |
0.75 |
0.8 |
1.2 |
Class
19 environmental incidents |
0
|
0
|
0
|
0
|
On December 15, 2025, a tragic
incident at the Kibali underground operations resulted in the fatality of an employee. Please refer to page 16 for further details.
Financial Results
Q4 2025 compared to Q3 2025
Gold production for Q4 2025 was 8% lower than Q3 2025, primarily due to lower grades processed linked to lower tonnes mined from the underground.
Lower underground tonnes to surface was linked to unplanned shaft maintenance and an extended stoppage due to the tragic fatality.
COS/oz7 and TCC/oz6 for Q4 2025 were 5% and 7% higher, respectively, than Q3 2025 mainly due to lower grades processed, higher mining unit costs and higher
royalties from the higher realized gold price6. AISC/oz6 for Q4 2025 was 7% higher than in Q3 2025 resulting from both higher TCC/oz6 and minesite capital expenditures6 on a per ounce basis.
Capital expenditures in Q4 2025 remained flat compared to Q3 2025 as higher capitalized waste stripping was offset by the late arrival of underground
infrastructure components and a delay in the river diversion construction at the Kalimva open pit.
2025 compared to 2024
Gold production in 2025 was 2% lower compared to 2024, mainly due to lower throughput and slightly lower grades processed.
COS/oz7 and TCC/oz6 in 2025 increased by 17% and 21%, respectively, compared to 2024, mainly due to lower grades processed as well as higher royalties driven by the
higher realized gold price6. For 2025, AISC/oz6 was 19% higher compared to 2024, reflecting both higher TCC/oz6 and minesite sustaining capital expenditures6.
Capital expenditures in 2025 were 21% higher compared to 2024 due to higher project capital expenditures6 linked to the Pamao in-pit TSF and additional drilling on the ARK project. Higher minesite sustaining capital expenditures6 were driven by higher capitalized
|
|
|
|
|
|
|
|
|
BARRICK YEAR-END 2025 |
32 |
MANAGEMENT’S DISCUSSION AND
ANALYSIS |
waste stripping and additional spend on underground
equipment.
2025 compared to
Guidance
|
|
|
|
|
|
|
|
|
|
2025 Actual |
2025 Guidance |
| Gold produced (000s oz) |
303 |
310 - 340 |
Cost of sales7 ($/oz) |
1,568 |
|
1,280 - 1,380 |
Total cash costs6 ($/oz) |
1,099 |
|
940 - 1,020 |
All-in
sustaining costs6 ($/oz) |
1,337
|
|
1,130
- 1,230 |
Gold production in
2025 ended marginally below the guidance range, primarily driven by lower grades processed than planned. All cost metrics were above the guidance ranges primarily as a result of the lower than planned production and were also impacted by higher
royalties from the higher realized gold price6. Our cost guidance for 2025 was based on a gold price assumption of $2,400/oz. Given the actual realized gold price6 was considerably higher at $3,501/oz, the cost guidance ranges for Kibali need to be increased by $65/oz to provide a more meaningful
comparison. After adjusting for the realized gold price6, the guidance ranges are as follows: COS/oz7 of $1,345 to $1,445, TCC/oz6 of $1,005 to $1,085 and AISC/oz6 of $1,195 to
$1,295.
|
|
|
|
|
|
|
|
|
BARRICK YEAR-END 2025 |
33 |
MANAGEMENT’S DISCUSSION AND
ANALYSIS |
North Mara (84% basis)a, Tanzania
Summary of Operating and Financial Data
|
|
|
|
|
|
|
|
|
|
|
|
|
|
|
|
|
|
|
|
|
|
|
|
|
|
|
|
|
|
|
For the three months
ended |
|
For the
years ended |
| |
12/31/25
|
9/30/25 |
Change |
|
12/31/25
|
12/31/24 |
Change |
|
12/31/23 |
| Total tonnes mined (000s) |
4,297 |
|
4,189 |
|
3% |
|
15,600 |
|
17,183 |
|
(9)% |
|
16,547 |
|
| Open pit
ore |
17 |
|
0 |
|
100% |
|
1,562 |
|
3,282 |
|
(52)% |
|
1,400 |
|
| Open pit waste |
3,845 |
|
3,721 |
|
3% |
|
12,362 |
|
12,319 |
|
0% |
|
13,610 |
|
|
Underground |
435 |
|
468 |
|
(7)% |
|
1,676 |
|
1,582 |
|
6% |
|
1,537 |
|
| Average grade (grams/tonne) |
|
|
|
|
|
|
|
|
|
| Open pit
mined |
1.01 |
|
n/a |
n/a |
|
1.98 |
|
1.96 |
|
1% |
|
1.83 |
|
| Underground mined |
3.74 |
|
4.09 |
|
(9)% |
|
3.83 |
|
4.07 |
|
(6)% |
|
3.22 |
|
| Processed |
2.87 |
|
2.99 |
|
(4)% |
|
3.14 |
|
3.31 |
|
(5)% |
|
3.02 |
|
| Ore tonnes processed (000s) |
683 |
|
729 |
|
(6)% |
|
2,781 |
|
2,772 |
|
0% |
|
2,848 |
|
| Recovery rate |
90 |
% |
89 |
% |
1% |
|
89 |
% |
90 |
% |
(1)% |
|
92 |
% |
|
|
|
|
|
|
|
|
|
|
|
|
|
|
|
|
|
|
|
|
| Gold produced (000s oz) |
56 |
|
64 |
|
(13)% |
|
249 |
|
265 |
|
(6)% |
|
253 |
|
| Gold sold (000s oz) |
56 |
|
72 |
|
(22)% |
|
246 |
|
263 |
|
(6)% |
|
254 |
|
| Revenue ($ millions) |
234 |
|
260 |
|
(10)% |
|
860 |
|
647 |
|
33% |
|
497 |
|
| Cost of sales ($ millions) |
91 |
|
108 |
|
(16)% |
|
356 |
|
332 |
|
7% |
|
306 |
|
| Income ($ millions) |
129 |
|
149 |
|
(13)% |
|
475 |
|
267 |
|
78% |
|
139 |
|
EBITDA ($ millions)b,c |
150 |
|
178 |
|
(16)% |
|
559 |
|
337 |
|
66% |
|
203 |
|
EBITDA margind |
64 |
% |
68 |
% |
(6)% |
|
65 |
% |
52 |
% |
25% |
|
41 |
% |
| Capital expenditures ($
millions) |
56 |
|
41 |
|
37% |
|
174 |
|
136 |
|
28% |
|
176 |
|
Minesite sustainingb |
17 |
|
13 |
|
31% |
|
57 |
|
71 |
|
(20)% |
|
95 |
|
Projectb |
39 |
|
28 |
|
39% |
|
117 |
|
65 |
|
80% |
|
81 |
|
| COS ($/oz) |
1,640 |
|
1,497 |
|
10% |
|
1,449 |
|
1,266 |
|
14% |
|
1,206 |
|
TCC ($/oz)b |
1,237 |
|
1,069 |
|
16% |
|
1,085 |
|
989 |
|
10% |
|
944 |
|
AISC ($/oz)b |
1,546 |
|
1,268 |
|
22% |
|
1,333 |
|
1,274 |
|
5% |
|
1,335 |
|
|
|
|
|
|
|
|
|
|
|
a.Barrick owns 84% of North Mara, with the GoT owning 16%. North Mara is accounted for as a subsidiary with a 16% non-controlling
interest on the basis that Barrick controls the asset. The results in the table and the discussion that follows are based on our 84% share.
b.Further information on these non-GAAP financial measures, including detailed reconciliations, is included on pages 57 to 69 of this
MD&A.
c.EBITDA represents income less depreciation. Depreciation expense is $21 million
and $84 million for Q4 2025 and 2025, respectively (Q3 2025: $29 million,
2024: $70 million, 2023: $64
million).
d.
Represents EBITDA divided by
revenue.
Safety and Environment
|
|
|
|
|
|
|
|
|
|
|
|
|
|
|
| For the three months
ended |
For the year
ended |
|
12/31/25
|
9/30/25 |
12/31/25
|
12/31/24 |
| LTI |
0 |
0 |
0 |
0 |
LTIFR8 |
0.00 |
0.00 |
0.00 |
0.00 |
TRIFR8 |
0.32 |
0.00 |
0.32 |
0.35 |
Class
19 environmental incidents |
0
|
0
|
0
|
0
|
Financial
Results
Q4 2025 compared to Q3 2025
In Q4 2025, gold production was 13% lower than Q3 2025 mainly due to lower throughput and lower grades, slightly offset by higher recovery.
COS/oz7 and TCC/oz6 in Q4 2025 were 10% and 16% higher, respectively, than Q3 2025, resulting from lower grades processed, higher underground mining costs, and increased
royalties from the higher realized gold price6. AISC/oz6 in Q4 2025 was 22% higher than Q3 2025, reflecting both higher TCC/oz6 and minesite sustaining capital expenditures6.
Capital expenditures in Q4 2025 increased by 37% compared to Q3 2025, driven by higher project capital expenditures6 mainly related to the new underground decline. This was combined with higher minesite sustaining
capital expenditures6 due to higher spend on the purchase of underground loaders in line with our fleet replacement schedule, and a new Battery Energy Storage System to
further optimize the power supply and cost base.
2025 compared to
2024
In 2025, gold production was 6% lower than 2024 due to lower grades processed from the
underground and slightly lower recovery, as per the mine plan.
COS/oz7 and TCC/oz6 in 2025 were 14% and 10% higher, respectively, than 2024, mainly reflecting higher royalties from the higher realized gold price6 and the impact of lower grades processed. AISC/oz6 was 5% higher than 2024, primarily due to higher TCC/oz6, partially offset by lower minesite sustaining capital expenditures6.
In 2025, capital expenditures increased by 28% compared to 2024 driven by higher project capital expenditures6 mainly due to the completion of the paste plant and Gokona pre-stripping cutback, partially offset by lower minesite sustaining capital
expenditures6, reflecting lower capitalized waste
stripping.
|
|
|
|
|
|
|
|
|
BARRICK YEAR-END 2025 |
34 |
MANAGEMENT’S DISCUSSION AND
ANALYSIS |
2025 compared to
Guidance
|
|
|
|
|
|
|
|
|
|
2025 Actual |
2025 Guidance |
| Gold produced (000s oz) |
249 |
230 - 260 |
Cost of sales7 ($/oz) |
1,449 |
|
1,370 - 1,470 |
Total cash costs6 ($/oz) |
1,085 |
|
1,020 - 1,100 |
All-in
sustaining costs6 ($/oz) |
1,333
|
|
1,400
- 1,500 |
Gold production in
2025 ended in the upper half of the guidance range, reflecting the successful delivery of the mine plan committed to at the start of the year. All cost metrics were within the original guidance ranges, notwithstanding being impacted by higher
royalties from the higher realized gold price6. Our cost guidance for 2025 was based on a gold price assumption of $2,400/oz. Given the actual realized gold price6 was considerably higher at $3,501/oz, the cost guidance ranges for North Mara need to be increased by $85/oz to provide a more meaningful
comparison. After adjusting for the realized gold price6, the guidance ranges are as follows: COS/oz7 of $1,455 to $1,555, TCC/oz6 of $1,105 to $1,185 and AISC/oz6 of $1,485 to $1,585. On this basis, North Mara delivered lower costs than
guidance.
|
|
|
|
|
|
|
|
|
BARRICK YEAR-END 2025 |
35 |
MANAGEMENT’S DISCUSSION AND
ANALYSIS |
Bulyanhulu (84% basis)a, Tanzania
Summary of Operating and Financial Data
|
|
|
|
|
|
|
|
|
|
|
|
|
|
|
|
|
|
|
|
|
|
|
|
|
|
|
|
|
|
|
For the three months
ended |
|
For the
years ended |
| |
12/31/25
|
9/30/25 |
Change |
|
12/31/25
|
12/31/24 |
Change |
|
12/31/23 |
| Underground tonnes mined
(000s) |
356 |
|
416 |
|
(14) |
% |
|
1,453 |
|
1,252 |
|
16 |
% |
|
1,217 |
|
|
|
|
|
|
|
|
|
|
|
|
|
|
|
|
|
|
|
|
|
|
|
|
|
|
|
|
|
|
|
| Average grade (grams/tonne) |
|
|
|
|
|
|
|
|
|
|
|
|
|
|
|
|
|
|
|
| Underground mined |
5.44 |
|
4.95 |
|
10 |
% |
|
5.23 |
|
5.79 |
|
(10) |
% |
|
6.56 |
|
| Processed |
5.71 |
|
4.87 |
|
17 |
% |
|
5.29 |
|
5.69 |
|
(7) |
% |
|
6.64 |
|
| Ore tonnes processed (000s) |
224 |
|
255 |
|
(12) |
% |
|
947 |
|
983 |
|
(4) |
% |
|
880 |
|
| Recovery rate |
97 |
% |
94 |
% |
3 |
% |
|
95 |
% |
93 |
% |
2 |
% |
|
96 |
% |
|
|
|
|
|
|
|
|
|
|
|
|
|
|
|
|
|
|
|
|
| Gold produced (000s oz) |
40 |
|
38 |
|
5 |
% |
|
153 |
|
168 |
|
(9) |
% |
|
180 |
|
| Gold sold (000s oz) |
39 |
|
40 |
|
(3) |
% |
|
148 |
|
165 |
|
(10) |
% |
|
180 |
|
| Revenue ($ millions) |
175 |
|
144 |
|
22 |
% |
|
554 |
|
416 |
|
33 |
% |
|
371 |
|
| Cost of sales ($ millions) |
74 |
|
73 |
|
1 |
% |
|
265 |
|
250 |
|
6 |
% |
|
237 |
|
| Income ($ millions) |
98 |
|
69 |
|
42 |
% |
|
281 |
|
162 |
|
73 |
% |
|
123 |
|
EBITDA ($ millions)b,c |
113 |
|
84 |
|
35 |
% |
|
336 |
|
215 |
|
56 |
% |
|
175 |
|
EBITDA margind |
65 |
% |
58 |
% |
12 |
% |
|
61 |
% |
52 |
% |
17 |
% |
|
47 |
% |
| Capital expenditures ($
millions) |
41 |
|
32 |
|
28 |
% |
|
144 |
|
114 |
|
26 |
% |
|
89 |
|
Minesite sustainingb |
17 |
|
18 |
|
(6) |
% |
|
80 |
|
57 |
|
40 |
% |
|
55 |
|
Projectb |
24 |
|
14 |
|
71 |
% |
|
64 |
|
57 |
|
12 |
% |
|
34 |
|
| COS ($/oz) |
1,885 |
|
1,817 |
|
4 |
% |
|
1,789 |
|
1,509 |
|
19 |
% |
|
1,312 |
|
TCC ($/oz)b |
1,262 |
|
1,334 |
|
(5) |
% |
|
1,253 |
|
1,070 |
|
17 |
% |
|
920 |
|
AISC ($/oz)b |
1,694 |
|
1,790 |
|
(5) |
% |
|
1,795 |
|
1,420 |
|
26 |
% |
|
1,231 |
|
|
|
|
|
|
|
|
|
|
|
a.Barrick owns 84% of Bulyanhulu, with the GoT owning 16%. Bulyanhulu is accounted for as a subsidiary with a 16% non-controlling
interest on the basis that Barrick controls the asset. The results in the table and the discussion that follows are based on our 84% share.
b.Further information on these non-GAAP financial measures, including detailed reconciliations, is included on pages 57 to 69 of this
MD&A.
c.EBITDA represents income less depreciation. Depreciation expense is $15 million
and $55 million for Q4 2025 and 2025, respectively (Q3 2025: $15 million,
2024: $53 million, 2023: $52
million).
d.
Represents EBITDA divided by
revenue.
Safety and Environment
|
|
|
|
|
|
|
|
|
|
|
|
|
|
|
| For the three months
ended |
For the year
ended |
|
12/31/25
|
9/30/25 |
12/31/25
|
12/31/24 |
| LTI |
1 |
0 |
1 |
0 |
LTIFR8 |
0.48 |
0.00 |
0.12 |
0.00 |
TRIFR8 |
2.88 |
0.48 |
1.34 |
1.76 |
Class
19 environmental incidents |
0
|
0
|
0
|
0
|
On October 21, 2025, a fatal
incident occurred in the underground operations resulting in the loss of an employee. Please refer to page 15 for further details.
Financial Results
Q4 2025 compared to Q3 2025
In Q4 2025, gold production was 5% higher than Q3 2025, primarily reflecting higher grades processed and higher recovery, slightly offset by lower
throughput.
COS/oz7 in Q4 2025 increased by 4%, due to higher depreciation expense, partially offset by lower TCC/oz6. TCC/oz6 was 5% lower primarily due to higher grades processed, slightly offset by higher royalties from the higher realized gold price6. AISC/oz6 in Q4 2025 was 5% lower than Q3 2025, mainly as a result of lower TCC/oz6 and lower minesite sustaining capital expenditures6.
Capital expenditures in Q4 2025 were 28% higher than Q3 2025, mainly due to higher project capital expenditures6 relating to the Upper West decline.
2025 compared to 2024
In 2025, gold production was 9% lower than 2024 as we mined in lower grade areas of the mine and continued to prioritize underground development in
higher grade zones, partially offset by higher recovery.
COS/oz7 and TCC/oz6 in 2025 were 19% and 17% higher, respectively, than 2024, reflecting higher royalties from the higher realized gold price6, combined with lower grades processed and higher mining costs driven by higher labour and power costs as we go deeper in the mine.
AISC/oz6 was 26% higher than 2024 due to both increased TCC/oz6 and minesite sustaining capital expenditures6.
In 2025, capital expenditures increased by 26% compared to 2024, reflecting higher minesite sustaining capital expenditures6 related to a significant step up in underground development, combined with increased project capital expenditures6 mainly due to the Upper West decline.
2025 compared to Guidance
|
|
|
|
|
|
|
|
|
|
2025 Actual |
2025 Guidance |
| Gold produced (000s oz) |
153 |
150 - 180 |
Cost of sales7 ($/oz) |
1,789 |
|
1,470 - 1,570 |
Total cash costs6 ($/oz) |
1,253 |
1,010 - 1,090 |
All-in
sustaining costs6 ($/oz) |
1,795
|
|
1,540
- 1,640 |
Gold production in
2025 ended within the guidance range, albeit closer to the low end of the range. All cost metrics ended above the cost guidance mainly driven by higher royalties from the higher realized gold price6 and lower
|
|
|
|
|
|
|
|
|
BARRICK YEAR-END 2025 |
36 |
MANAGEMENT’S DISCUSSION AND
ANALYSIS |
grades mined and processed. Our cost guidance for 2025 was based on a gold price assumption of $2,400/oz.
Given the actual realized gold price6 was considerably higher at $3,501/oz, the cost guidance ranges for Bulyanhulu need to be increased by $85/oz to provide a more meaningful
comparison. After adjusting for the realized gold price6, the guidance ranges are as follows: COS/oz7 of $1,555 to $1,655, TCC/oz6 of $1,095 to $1,175 and AISC/oz6 of $1,625 to $1,725. The actual cost metrics for 2025 were higher than the price adjusted ranges due to the lower than planned production as
explained above.
|
|
|
|
|
|
|
|
|
BARRICK YEAR-END 2025 |
37 |
MANAGEMENT’S DISCUSSION AND
ANALYSIS |
Other Mines - Gold
|
|
|
|
|
|
|
|
|
|
|
|
|
|
|
|
|
|
|
|
|
|
|
|
|
|
|
|
|
|
|
|
|
|
| Summary of Operating and
Financial Data |
|
|
For the three months
ended |
|
12/31/25
|
|
9/30/25 |
|
Gold produced (000s
oz) |
COS
($/oz) |
TCC
($/oz)a |
AISC
($/oz)a |
Capital
Expend-ituresb |
|
Gold produced (000s
oz) |
COS
($/oz) |
TCC
($/oz)a |
AISC
($/oz)a |
Capital
Expend-ituresb |
| Phoenix (61.5%) |
24 |
1,972 |
|
127 |
|
279 |
|
3 |
|
|
27 |
2,010 |
|
664 |
|
935 |
|
6 |
|
| Veladero (50%) |
48 |
1,526 |
|
886 |
|
1,915 |
|
56 |
|
|
49 |
1,352 |
|
787 |
|
1,498 |
|
35 |
|
Tongon (89.7%)c |
18 |
2,648 |
|
2,659 |
|
2,844 |
|
4 |
|
|
32 |
1,787 |
|
1,605 |
|
1,692 |
|
9 |
|
Hemlod |
26 |
1,738 |
|
1,707 |
|
1,976 |
|
8 |
|
|
27 |
2,145 |
|
1,874 |
|
2,417 |
|
14 |
|
|
|
|
|
|
|
|
|
|
|
|
|
|
|
|
|
|
|
|
|
|
|
|
|
|
|
|
|
|
|
|
|
|
|
|
|
| Porgera (24.5%) |
24 |
1,608 |
|
1,180 |
|
1,865 |
|
17 |
|
|
24 |
1,599 |
|
1,200 |
|
1,594 |
|
9 |
|
Loulo-Gounkoto
e |
11
|
4,151
|
|
1,448
|
|
1,448
|
|
—
|
|
|
—
|
—
|
|
—
|
|
—
|
|
—
|
|
|
|
|
|
|
|
|
|
|
|
|
|
|
|
|
|
|
|
|
|
|
|
|
|
|
|
|
|
|
|
|
|
|
|
|
|
|
|
|
|
|
|
|
|
|
|
|
|
|
|
|
|
|
|
|
|
|
|
|
|
|
|
|
|
|
|
|
|
|
|
|
|
|
For the years
ended |
|
12/31/25
|
|
12/31/24 |
|
Gold produced (000s
oz) |
COS
($/oz) |
TCC
($/oz)a |
AISC
($/oz)a |
Capital
Expend-ituresb |
|
Gold produced (000s
oz) |
COS
($/oz) |
TCC
($/oz)a |
AISC
($/oz)a |
Capital
Expend-ituresb |
| Phoenix (61.5%) |
109 |
1,921 |
|
653 |
|
920 |
|
23 |
|
|
127 |
1,687 |
|
765 |
|
1,031 |
|
26 |
|
| Veladero (50%) |
230 |
1,286 |
|
785 |
|
1,450 |
|
180 |
|
|
252 |
1,254 |
|
905 |
|
1,334 |
|
139 |
|
Tongon (89.7%)c |
106 |
2,200 |
|
2,049 |
|
2,203 |
|
20 |
|
|
148 |
1,903 |
|
1,670 |
|
1,867 |
|
20 |
|
Hemlod |
123 |
1,854 |
|
1,618 |
|
1,936 |
|
39 |
|
|
143 |
1,754 |
|
1,483 |
|
1,769 |
|
38 |
|
|
|
|
|
|
|
|
|
|
|
|
|
|
|
|
|
|
|
|
|
|
|
|
|
|
|
|
|
|
|
|
|
|
|
|
|
| Porgera (24.5%) |
92 |
1,553 |
|
1,184 |
|
1,630 |
|
44 |
|
|
46 |
1,423 |
|
1,073 |
|
1,666 |
|
72 |
|
Loulo-Gounkoto
e |
29
|
4,271
|
|
1,449
|
|
1,603
|
|
18
|
|
|
578
|
1,218
|
|
828
|
|
1,304
|
|
307
|
|
|
|
|
|
|
|
|
|
|
|
|
|
|
|
|
|
|
|
|
|
|
|
|
|
|
|
|
|
|
|
|
|
|
|
|
|
a.Further information on these non-GAAP financial measures, including detailed reconciliations, is included on pages 57 to 69 of
this MD&A.
b.Includes both minesite sustaining and project capital expenditures. Further information on these non-GAAP financial measures,
including detailed reconciliations, is included on pages 57 to 69 of this
MD&A.
c.On October 6, 2025, we reached an agreement to sell our interest in the Tongon gold mine and certain of its exploration
properties to the Atlantic Group for total consideration of up to $305 million. The transaction closed on December 1, 2025. Accordingly, operating and financial results provided are up to the closing date, and no commentary for Q4 2025 was provided.
d.On September 10, 2025, we reached an agreement to sell the Hemlo gold mine to Carcetti Capital Corp. for gross proceeds of up to
$1.09 billion. The transaction closed on November 26, 2025. Accordingly, operating and financial results provided are up to the closing date, and no commentary for Q4 2025 was
provided.
e.As a result of temporary suspension of operations at Loulo-Gounkoto starting January 14, 2025, and subsequent loss of control on
June 16, 2025, no operating data or per ounce data was provided for Q1 2025 to Q3 2025. On November 24, 2025, Barrick announced that an agreement had been entered into with the Government of the Republic of Mali to put an end to all disputes
regarding the Loulo and Gounkoto mines. The provisional administration of the Loulo-Gounkoto complex was terminated on December 16, 2025, at which point operational control was handed back to Somilo and Gounkoto's
management.
Phoenix (61.5%)
Gold production for Phoenix in Q4 2025 was 11% lower than Q3 2025 owing to lower recoveries related to geochemistry following the increased material
mined from Fortitude during Q4 2025.
COS/oz7 and TCC/oz6 in Q4 2025 were 2% and 81% lower, respectively, than Q3 2025. The improvement in COS/oz7 was mainly due to improved mining efficiencies. In addition to this, TCC/oz6 was significantly impacted by higher copper and silver by-product cost allocations. In Q4 2025, AISC/oz6 decreased by 70% compared to Q3 2025, due to lower TCC/oz6 and lower minesite sustaining capital expenditures6.
|
|
|
|
|
|
|
|
|
|
2025 Actual |
2025 Guidance |
| Gold produced (000s oz) |
109 |
85 - 105 |
Cost of sales7 ($/oz) |
1,921 |
|
2,070 - 2,170 |
Total cash costs6 ($/oz) |
653 |
890 - 970 |
All-in
sustaining costs6 ($/oz) |
920
|
|
1,240
-
1,340 |
Compared
to our 2025 outlook, gold production exceeded guidance, driven by improved grades and recovery. COS/oz7, TCC/oz6 and AISC/oz6 were below the guidance ranges driven mainly by higher than expected by-product cost allocations.
Veladero (50%), Argentina
Gold production for Veladero in Q4 2025 was 2% lower than Q3 2025 driven by a decrease in recoverable ounces placed on the leach pad due to the
planned mine sequence. COS/oz7 and TCC/oz6 in Q4 2025 were both 13% higher, mainly due to higher shovel maintenance costs and the impact of higher royalties from the higher realized gold
price6. In Q4 2025, AISC/oz6 increased by 28% compared to Q3 2025, due to both higher minesite sustaining capital expenditures6 and TCC/oz6.
|
|
|
|
|
|
|
|
|
|
2025 Actual |
2025 Guidance |
| Gold produced (000s oz) |
230 |
190 - 220 |
Cost of sales7 ($/oz) |
1,286 |
|
1,390 - 1,490 |
Total cash costs6 ($/oz) |
785 |
|
890 - 970 |
All-in
sustaining costs6 ($/oz) |
1,450
|
|
1,570
- 1,670 |
Gold production for the full year 2025 was above the guidance range driven by additional recoverable ounces placed and higher ounces contributed by
phase 1-5 of the leach facility. All cost metrics were below the guidance ranges as a result of the higher production, notwithstanding the impact of higher royalties from the higher realized gold price6.
|
|
|
|
|
|
|
|
|
BARRICK YEAR-END 2025 |
38 |
MANAGEMENT’S DISCUSSION AND
ANALYSIS |
Porgera (24.5%), Papua New Guinea
Gold production in Q4 2025 was in line with Q3 2025. COS/oz7 was 1% higher than Q3 2025 due to increased depreciation, partially offset by lower TCC/oz6. TCC/oz6 was 2% lower due to lower processing and underground mining cost. AISC/oz6 increased by 17% compared to Q3 2025 reflecting higher minesite sustaining capital expenditures6, slightly offset by lower TCC/oz6.
|
|
|
|
|
|
|
|
|
|
2025 Actual |
2025 Guidance |
| Gold produced (000s oz) |
92 |
70 - 95 |
Cost of sales7 ($/oz) |
1,553 |
|
1,510 - 1,610 |
Total cash costs6 ($/oz) |
1,184 |
|
1,210 - 1,290 |
All-in
sustaining costs6 ($/oz) |
1,630
|
|
1,770
- 1,870 |
Gold production in 2025
was at the higher end of the guidance range. COS/oz7 was within the guidance range. TCC/oz6 and AISC/oz6 were lower than the guidance ranges mainly driven by the higher production, notwithstanding the impact of higher royalties from the higher realized
gold price6.
Loulo-Gounkoto (80%), Mali
On January 14, 2025, Loulo-Gounkoto temporarily suspended operations following an ongoing dispute over the existing mining Conventions. On June 16,
2025 the Bamako Commercial Tribunal placed Loulo-Gounkoto under a temporary provisional administration. While Barrick retained its 80% legal ownership of the mine, operational control was transferred to an external administrator. As a result of this
loss of control event, in Q2 2025 the assets, liabilities and non-controlling interest of Loulo-Gounkoto were deconsolidated and derecognized and an investment recognized at fair value. On November 24, 2025, Barrick announced that an agreement had
been entered into with the Government of the Republic of Mali to put an end to all disputes regarding the Loulo and Gounkoto mines. The provisional administration of the Loulo-Gounkoto complex was terminated on December 16, 2025, at which point
operational control was handed back to Somilo and Gounkoto's management. This was accounted for as a business acquisition in Q4 2025 where the investment was derecognized and the assets, liabilities and non-controlling interest of Loulo-Gounkoto
were consolidated from this date again. Refer to notes 4, 35 and 36 of the Financial Statements for further information.
During 2025, Loulo-Gounkoto produced 18 thousand ounces of gold in early January before operations were suspended and 11 thousand ounces of gold in
December after the provisional administration was terminated and operations restarted under Barrick control. This brings full year production to 29 thousand ounces and full year sales to 91 thousand ounces (this includes the sale of the gold that
was produced in late 2024 that was subject to an attachment order issued on January 2, 2025 and returned to the mine following the end of the provisional administration period). COS/oz7 for Q4 2025 and 2025 were $4,151 and $4,271, respectively, as it includes the impact of the fair value increment on inventory resulting from the
purchase price allocation when we regained control of the mine.
TCC/oz6 and AISC/oz6, which excludes the impact of the fair value increment of $2,486/oz, were both $1,448 for Q4 2025 and $1,449 and $1,603 for 2025,
respectively.
|
|
|
|
|
|
|
|
|
BARRICK YEAR-END 2025 |
39 |
MANAGEMENT’S DISCUSSION AND
ANALYSIS |
Lumwana (100%), Zambia
Summary of Operating and Financial Data
|
|
|
|
|
|
|
|
|
|
|
|
|
|
|
|
|
|
|
|
|
|
|
|
|
|
|
|
|
|
|
For the three months
ended |
|
For the
years ended |
| |
12/31/25
|
9/30/25 |
Change |
|
12/31/25
|
12/31/24 |
Change |
|
12/31/23 |
| Open pit
tonnes mined (000s) |
32,205
|
|
41,678
|
|
(23)
|
% |
|
141,674
|
|
140,866
|
|
1
|
% |
|
113,633
|
|
| Open pit
ore |
8,343 |
|
10,505 |
|
(21) |
% |
|
32,519 |
|
26,064 |
|
25 |
% |
|
26,030 |
|
| Open pit
waste |
23,862 |
|
31,173 |
|
(23) |
% |
|
109,155 |
|
114,802 |
|
(5) |
% |
|
87,603 |
|
| Average grade (grams/tonne) |
|
|
|
|
|
|
|
|
|
| Open pit mined |
0.56 |
% |
0.58 |
% |
(3) |
% |
|
0.59 |
% |
0.55 |
% |
7 |
% |
|
0.51 |
% |
| Processed |
0.65 |
% |
0.66 |
% |
(2) |
% |
|
0.64 |
% |
0.53 |
% |
21 |
% |
|
0.49 |
% |
| Tonnes processed (000s) |
7,029 |
|
6,392 |
|
10 |
% |
|
25,740 |
|
25,783 |
|
0 |
% |
|
26,797 |
|
| Recovery rate |
91 |
% |
92 |
% |
(1) |
% |
|
92 |
% |
90 |
% |
2 |
% |
|
89 |
% |
| Copper produced (kt) |
42 |
|
38 |
|
11 |
% |
|
151 |
|
123 |
|
23 |
% |
|
118 |
|
| Copper sold (kt) |
47 |
|
37 |
|
27 |
% |
|
157 |
|
109 |
|
44 |
% |
|
113 |
|
| Revenue ($
millions) |
520
|
|
322
|
|
61
|
% |
|
1,487
|
|
855
|
|
74
|
% |
|
795
|
|
| Cost of sales ($ millions) |
282 |
|
193 |
|
46 |
% |
|
877 |
|
704 |
|
25 |
% |
|
723 |
|
| Income ($ millions) |
233 |
|
124 |
|
88 |
% |
|
596 |
|
135 |
|
341 |
% |
|
37 |
|
EBITDA ($ millions)a,b |
322 |
|
192 |
|
68 |
% |
|
882 |
|
379 |
|
133 |
% |
|
294 |
|
EBITDA marginc |
62 |
% |
60 |
% |
3 |
% |
|
59 |
% |
44 |
% |
34 |
% |
|
37 |
% |
Capital expenditures ($
millions)d |
268 |
|
200 |
|
34 |
% |
|
689 |
|
469 |
|
47 |
% |
|
306 |
|
Minesite
sustaininga |
92 |
|
78 |
|
18 |
% |
|
298 |
|
312 |
|
(4) |
% |
|
223 |
|
Projecta |
173 |
|
119 |
|
45 |
% |
|
384 |
|
157 |
|
145 |
% |
|
83 |
|
| COS ($/lb) |
2.76 |
|
2.32 |
|
19 |
% |
|
2.54 |
|
2.94 |
|
(14) |
% |
|
2.91 |
|
C1 cash costs ($/lb)a |
1.97 |
|
1.68 |
|
17 |
% |
|
1.86 |
|
2.23 |
|
(17) |
% |
|
2.29 |
|
AISC ($/lb)
a |
3.24
|
|
2.93
|
|
11
|
% |
|
3.05
|
|
3.85
|
|
(21)
|
% |
|
3.48
|
|
|
|
|
|
|
|
|
|
|
|
a.Further information on these non-GAAP financial measures, including detailed reconciliations, is included on pages 57 to 69 of this
MD&A.
b.EBITDA represents income less depreciation. Depreciation expense is $89 million
and $286 million for Q4 2025 and 2025, respectively (Q3 2025: $68 million,
2024: $244 million, 2023: $257
million).
c.Represents EBITDA divided by revenue.
d.Includes capitalized
interest.
Safety and Environment
|
|
|
|
|
|
|
|
|
|
|
|
|
|
|
| For the three months
ended |
For the year
ended |
|
12/31/25
|
9/30/25 |
12/31/25
|
12/31/24 |
| LTI |
0 |
1 |
2 |
3 |
LTIFR8 |
0.00 |
0.19 |
0.10 |
0.19 |
TRIFR8 |
0.82 |
0.56 |
0.44 |
0.37 |
Class
19 environmental incidents |
0
|
0
|
0
|
0
|
Financial
Results
Q4 2025 compared to Q3 2025
Copper production in Q4 2025 was 11% higher than Q3 2025 primarily due to higher throughput, partially offset by slightly lower grades processed and
recoveries.
COS/lb7 and C1 cash costs/lb6 were 19% and 17% higher, respectively, than Q3 2025 primarily due to higher mining maintenance costs due to lower fleet availabilities from
premature failures as well as higher power costs. In Q4 2025,
AISC/lb6 increased by 11% compared to Q3 2025, primarily driven by the higher C1 cash costs/lb6 mentioned above, as well as higher minesite sustaining capital expenditures6, partially offset by the increase in sales volumes.
Capital expenditures were 34% higher compared to Q3 2025 due to an increase in both project and minesite capital expenditures6. Project capital expenditures6 increased by 45% primarily reflecting down payments on the mobile fleet as well as payments on awarded civil
engineering and procurement packages for the Lumwana Super Pit Expansion project. The increase in minesite sustaining capital expenditures6 of 18% was primarily related to
rebuilds.
2025
compared to 2024
In 2025, copper production increased by 23% compared to 2024, primarily due to
higher grades processed and higher recoveries. Production of 151kt represents Lumwana’s highest ever annual production in the mine’s history.
In 2025, COS/lb7 and C1 cash costs/lb6 were 14% and 17% lower, respectively, than 2024 due to higher grades processed and higher capitalized waste stripping. AISC/lb6 in 2025 decreased by 21% compared to 2024, mainly due to both lower minesite sustaining capital expenditures6 and C1 cash costs/lb6.
In 2025, capital expenditures increased by 47% compared to 2024 due to higher project capital expenditures6 on the Super Pit Expansion project, as it entered into its first full year of execution. This is expected to further increase as we advance through
2026 with higher anticipated spend as more packages are executed and the fleet readiness continues to grow. Refer to the Future Growth section on page # for more
details.
|
|
|
|
|
|
|
|
|
BARRICK YEAR-END 2025 |
40 |
MANAGEMENT’S DISCUSSION AND
ANALYSIS |
2025 compared to
Guidance
|
|
|
|
|
|
|
|
|
|
2025 Actual |
2025 Guidance |
| Copper produced (M lbs) |
151 |
125 - 155 |
Cost of sales7 ($/lb) |
2.54 |
2.30 - 2.60 |
C1 cash costs6 ($/lb) |
1.86 |
1.60 - 1.90 |
All-in
sustaining costs6 ($/lb) |
3.05
|
|
2.80
- 3.10 |
Copper production
in 2025 ended at the top end of the guidance range. All cost metrics were also within guidance ranges despite higher power costs as the mine continues to drive cost-effective delivery of its mine plan.
|
|
|
|
|
|
|
|
|
BARRICK YEAR-END 2025 |
41 |
MANAGEMENT’S DISCUSSION AND
ANALYSIS |
Other Mines - Copper
|
|
|
|
|
|
|
|
|
|
|
|
|
|
|
|
|
|
|
|
|
|
|
|
|
|
|
|
|
|
|
|
|
|
| Summary of Operating and
Financial Data |
|
|
For the three months
ended |
|
12/31/25
|
|
9/30/25 |
|
Copper production
(kt) |
COS
($/lb) |
C1
cash costs ($/lb)a |
AISC
($/lb)a |
Capital
Expend-ituresb |
|
Copper production
(kt) |
COS
($/lb) |
C1
cash costs ($/lb)a |
AISC
($/lb)a |
Capital
Expend-ituresb |
|
|
|
|
|
|
|
|
|
|
|
|
Zald
ívar
(50%) |
12
|
6.33
|
|
5.17
|
|
6.03
|
|
25
|
|
|
9 |
5.02
|
|
3.80
|
|
4.82
|
|
16
|
|
| Jabal Sayid (50%) |
8 |
2.21 |
|
0.94 |
|
1.20 |
|
7 |
|
|
8 |
2.08 |
|
1.47 |
|
1.65 |
|
6 |
|
|
|
|
|
|
|
|
|
|
|
|
|
|
|
|
|
|
|
|
|
|
|
|
|
|
|
|
|
|
|
|
|
|
|
|
|
|
For the years
ended |
|
12/31/25
|
|
12/31/24 |
|
Copper production
(kt) |
COS
($/lb) |
C1
cash costs ($/lb)a |
AISC
($/lb)a |
Capital
Expend-ituresb |
|
Copper production
(kt) |
COS
($/lb) |
C1
cash costs ($/lb)a |
AISC
($/lb)a |
Capital
Expend-ituresb |
|
|
|
|
|
|
|
|
|
|
|
|
Zald
ívar
(50%) |
37
|
5.14
|
|
3.98
|
|
4.75
|
|
61
|
|
|
40
|
4.09
|
|
3.04
|
|
3.58
|
|
42
|
|
| Jabal Sayid (50%) |
32 |
2.09 |
|
1.28 |
|
1.46 |
|
21 |
|
|
32 |
1.77 |
|
1.37 |
|
1.56 |
|
19 |
|
a.
Further information on these non-GAAP financial measures, including detailed reconciliations, is included on pages 57 to 69 of this
MD&A.
b.Includes both minesite sustaining and project capital expenditures6. Further information on these non-GAAP financial measures, including detailed reconciliations, is included on pages 57 to 69 of this MD&A.
Zaldívar (50% basis), Chile
Copper production for Zaldívar in Q4 2025 was 33% higher than Q3 2025 driven by higher grades processed. COS/lb7 and C1 cash costs/lb6 in Q4 2025 were 26% and 36% higher, respectively, than Q3 2025 driven by an inventory write-down in Q4. AISC/lb6 was in line with Q3 2025.
|
|
|
|
|
|
|
|
|
|
2025 Actual |
2025 Guidance |
| Copper produced (kt) |
37 |
40 - 45 |
Cost of sales7 ($/lb) |
5.14 |
|
3.60 - 3.90 |
C1 cash costs6 ($/lb) |
3.98 |
|
2.70 - 3.00 |
All-in
sustaining costs6 ($/lb) |
4.75
|
|
3.50
- 3.80 |
Copper production in 2025 was lower than the guidance range driven by lower throughput and recovery resulting from unplanned maintenance and less
soluble ore than expected. All cost metrics were above the guidance ranges driven by the lower production and higher processing costs.
Our investment in this asset, of which we are not the operator, continues to be a non-core part of our
portfolio.
Jabal Sayid (50% basis), Saudi Arabia
Jabal Sayid's copper production in Q4 2025 was in line with Q3 2025. COS/lb7 in Q4 2025 was 6% higher than Q3 2025 mainly due to higher depreciation expense, partially offset by lower C1 cash costs/lb6. C1 cash costs/lb6 were 36% lower mainly due to the impact of increased gold by-product cost allocations as well as decreased treatment and refining costs due to
negotiating lower rates. AISC/lb6 was 27% lower than Q3 2025, mainly due to lower C1 cash costs/lb6, slightly offset by marginally higher minesite sustaining capital expenditures6.
|
|
|
|
|
|
|
|
|
|
2025 Actual |
2025 Guidance |
| Copper produced (kt) |
32 |
25 - 35 |
Cost of sales7 ($/lb) |
2.09 |
|
2.00 - 2.30 |
C1 cash costs6 ($/lb) |
1.28 |
1.60 - 1.90 |
All-in
sustaining costs6 ($/lb) |
1.46
|
|
1.80
-
2.10 |
Copper
production in 2025 was in the upper half of the guidance range.
COS/lb7 was at the low end of the guidance range, while C1 cash costs/lb6 and AISC/lb6 were below the guidance ranges due to higher gold by-product cost allocations as well as decreased treatment and refining costs resulting from
negotiating lower
rates.
|
|
|
|
|
|
|
|
|
BARRICK YEAR-END 2025 |
42 |
MANAGEMENT’S DISCUSSION AND
ANALYSIS |
Future Growth
Fourmile, Nevada, USA16
Fourmile is a 100% owned Barrick asset in Nevada, located adjacent to Goldrush, that has the potential to be a standalone Tier One Gold Asset1. Ongoing PFS studies point to the potential for significant resource growth. For the second consecutive year, Fourmile has successfully doubled its declared mineral resource ounces to 2.6 million ounces indicated (4.6Mt at
17.59g/t) and 13 million ounces inferred (25Mt at 16.9g/t). This reflects the ongoing commitment to aggressively grow Fourmile in support of a PFS expected to be completed in
2028.
The resource update reflects a successful year of
drilling where a fleet of up to 16 deep diamond core drill rigs achieved 71.4km of drilling across the Fourmile asset. The drilling combined resource definition drilling, extensional step outs and satellite exploration targeting to support growth in
the overall known mineralization while also building the resource conversion pipeline. Of particular note are drill holes including FM25-291D which intersected 3.7 meters at 34.47 g/t, 8.3 meters at 20.56 g/t and 3.5 meters at 15.24 g/t
which extended the known ore zone of Dorothy by 150 meters from prior drill intercepts. A further intersection 200 meters to the north of Dorothy in FM25-300D intersected 16.0 meters at 38.35 g/t unlocking the potential for mineralization along
a 1 kilometer corridor below the Mill Canyon stock to the north. Additionally, deep holes targeting the Lower Rose Stem area (now dubbed Charlie) including FM25-321D, 26.9 meters at 33.71 g/t and 10.7 meters at 5.15 g/t as well as FM25-314D,
21.4 meters at 12.74 g/t were able to confirm mineralization more than 300m further down dip than prior intercepts.
In previous years, drilling at Fourmile has paused over the winter months with drilling recommencing in the spring once snow
has been cleared and access regained. However, in 2025 considerable efforts have been made to establish additional drill pads in the lower elevation areas, and develop other substantive controls to enable safe drilling operations through the winter
months.
Fourmile continues to progress the planning of
the dedicated decline access from twin surface portals located in Crescent Valley. Key infrastructure items such as workshop, offices and change house facilities will be located on previously disturbed land within the Cortez footprint simplifying
permitting and creating flexibility in construction timelines. Development is on track to begin in late 2026.
As previously disclosed, Barrick anticipates Fourmile will be incorporated into the NGM joint venture, at fair market value,
if certain criteria are met following the completion of drilling and the requisite independent feasibility. Across drilling and studies activities, we spent $91 million in 2025
(including $31 million in Q4 2025).
2026 is expected to be a critical year for Fourmile with an anticipated drilling spend of $150 to $160 million together with
$20 million of spend on studies work (both expensed) and $70 million on construction and decline commencement (capital). This phase
of the project has been approved with an estimated total cost of $330 to $430 million extending through mid-2029.
Goldrush Project, Nevada, USA17,18
Goldrush, which is included within Cortez, is expected to be a long-life underground mine with anticipated annual
production in excess of 400,000 ounces of gold per year (100% basis) once in full production by
2028.
In Q4 2025, execution planning continued for key infrastructure projects.
Construction contracts for the second surface ventilation raise are in progress and site earthworks were completed to prepare for mobilization of the shaft sinking contractor in Q1 2026. Ventilation modeling was finalized to confirm immediate
ventilation requirements, including fan selection and layout for the second ventilation raise. Preliminary engineering for the paste plant advanced to define plant layout and configuration. Laboratory material testing is nearing completion to define
paste backfill makeup and cement content necessary to satisfy backfill requirements. The paste plant preliminary design report will be finalized in Q1 2026 and a contract for detailed engineering will be
awarded.
Surface dewatering continued in Horse Canyon as the third of three wells
planned in 2025 was commissioned. Mine dewatering is on track, with the next wells planned for 2027. The surface shotcrete plant equipment was received at site and foundation construction began. Remaining plant erection and commissioning will occur
in Q1 2026.
As of December 31, 2025, project spend was
$490 million on a 100% basis (including $17 million in Q4 2025) inclusive of the exploration declines. This capital spent to date, together with the remaining expected pre-production capital, is still anticipated to be near the approximate $1
billion initial capital estimate for the Goldrush project (100% basis).
Along the
northeastern edge of Goldrush in the southern KB area, new results from surface drilling returned 60 meters at 23.12 g/t, including 21 meters at 40.55 g/t in a breccia (GRC-25001A). A follow up hole (GRC-25002) returned 11 meters at 17.44
g/t of disseminated mineralization and 6.1 meters at 37.25 g/t, 4.6 meters at 29.2 g/t and 4.6 meters at 23 g/t in a silicified breccia. The latter is consistent with the Fourmile high-grade breccia located 1.5 km to the north.
Previous wide spaced drilling confirms continuity between the two deposits but the area below the northern third of the Goldrush deposit is largely untested. Applying the lessons learned at Fourmile, both surface and underground exploration drilling
will ramp up in 2026 to evaluate this new opportunity.
Ren, Nevada, USA19
Ren is a new ore deposit at Goldstrike Underground and a key expansion project at Carlin. Located north of Goldstrike Underground’s Meikle and
Banshee deposits, Ren is anticipated to produce an average of 140,000 ounces per year (contained ounces, 100% basis) once in full production in 2027.
To develop the deposit, the existing exploration drift has been duplicated, allowing for increased ventilation and secondary egress into the working
area. Additional exploration drilling platforms have been constructed from the duplicate drift to support further drilling for both existing resource conversion and further deposit growth.
To support production mining of the deposit, an additional set of twin declines
will be driven from the Betze-Post West Barrel open pit layback, extending to the north with the intent to provide life of mine ventilation and a direct
|
|
|
|
|
|
|
|
|
BARRICK YEAR-END 2025 |
43 |
MANAGEMENT’S DISCUSSION AND
ANALYSIS |
path for material to be hauled and hoisted out via the existing Meikle Headframe. To complete the project, a
seven-meter finished diameter ventilation shaft will be sunk 550 meters to serve as an exhaust raise and utility conduit for mining the orebody.
During Q4 2025, rehabilitation of the existing exploration drift to support ventilation and utilities continued albeit at a slower rate as a result
of less favorable ground conditions. Rehabilitation is expected to finish early in Q1 2026. Work at the West Barrel declines is continuing with completion of key surface infrastructure to support decline development beginning in Q1 2026. Mechanical
completion was achieved for the shotcrete plant and building erection is in progress for the equipment maintenance shop. The Ren ventilation shaft pre-sinking work scope is advancing on plan to facilitate transition to production sinking in late Q1
2026. Shaft excavation is nearly complete to pre-sink target depth while site sinking facility construction and galloway erection is nearing completion.
As of December 31, 2025, project spend was $167 million (including $29 million in Q4 2025) out of an estimated capital cost of $410 to $470 million
(100% basis).
Pueblo Viejo Expansion,
Dominican Republic20
The Pueblo Viejo life of mine expansion continues to focus on housing, resettlement, and the Naranjo TSF. Detailed engineering for the TWMS is now
complete, with permits expected in H1 of 2026 while the permitting package for the starter dam will be submitted within Q1 2026. Critical water projects are advancing well with the new effluent treatment plant engineering at 85% complete and the
construction contract awarded, while engineering for the Reverse Osmosis Plant and the new water supply to Dos Palmas community has been tendered, with plans to award in Q1 2026. The dam access road is now in use and the TWMS enabling works underway
with pad construction and additional roads. The Diorite Crushing pad is on track to allow the new construction contractor to begin foundation works in Q1 2026 and the Metso Crusher components have now begun to
ship.
The housing project at Pueblo Viejo continues with over 600 homes
constructed and more than 300 families now resettled. All focus is on completing the remaining 80 houses along with advancing the church and polytechnical school design. 70% of resettlement packages have now been accepted, with the public utility
decree issued and full support from authorities to work with all individuals and avoid delays to the project.
As at December 31, 2025, total project spend was $1,229 million (including $43 million in Q4 2025) on a 100% basis. The estimated capital cost of the
plant expansion and mine life extension project remains approximately $2.6 billion (100% basis).
Veladero Phase 8 Leach Pad, Argentina
The construction of the Phase 8 leach pad will be executed in three phases which are named 8A, 8B and 8C. Phase 8A has been completed. Phase 8B was
approved in Q3 2025, with activities and related spend progressing as planned. The phased execution of the project provides flexibility to align future stages with economic conditions and the applicable regulatory framework. Construction of the
project includes cutting, filling, sub-drainage and monitoring, leak collection and recirculation, impermeabilization, as well as pregnant leaching solution collection.
Overall, the total Phase 8 leach pad project spend at December 31, 2025 was $90 million ($22 million in Q4 2025) out of an estimated capital cost of $250-$260 million (100% basis).
Reko Diq Project, Pakistan21
At the end of 2024, Barrick completed an updated feasibility study for the project and added 7.3
million tonnes of copper and 13 million ounces of attributable gold in probable reserves as at December 31, 202422. Once fully commissioned, the Reko Diq project is projected to deliver 240,000 tonnes of copper production and 297,000 ounces of gold per year
during Phase 1 increasing to 460,000 tonnes of copper and 520,000 ounces of gold during the first ten years of Phase 2 (100% basis). These forward-looking estimates are based on an increased 45Mtpa process plant throughput in Phase 1 (from the
original 40Mtpa) and 90Mtpa (from the original 80Mtpa) in Phase 2, following the grind size optimization work undertaken as part of the feasibility study.
In light of the recent escalation of security risks and increase in the number of security incidents in the Province of Balochistan, the Company is
undertaking a review of all aspects of the Reko Diq project, including with respect to the project’s security arrangements, development timetable and capital budget. This review will begin immediately and an update will be provided when the
review has been completed.
Capital expenditures commenced in Q2 2024, with total
capitalized spend to date of $849 million (including $213 million in Q4 2025) (100% basis). Capitalized spend in 2025 was $721 million.
Kibali Solar Project, DRC
This project entails the design, supply and installation of a 16 MW photovoltaic solar farm with a 15 MW battery energy storage system to complement
the existing hydroelectric power stations raising the renewable component of the mine’s energy mix from 81% to 85%. The completion of this project is projected to deliver a 53% reduction in fuel consumption in the power plant. During Q4 2025,
we completed the power management system integration which enabled the solar photovoltaic field to inject 7,715MWh into the Kibali grid. Power management system optimization is still ongoing to ensure that the supply and system integration remains
stable and the full utilization of the benefits provided by the solar project is realized. As at December 31, 2025, project spend was $45 million (including $1 million in Q4 2025) out of an estimated capital cost of $55 million (100%
basis).
Lumwana Super Pit
Expansion, Zambia23
The Lumwana Super Pit Expansion is projected to deliver 240,000 tonnes of copper production per annum, from a 52Mtpa process plant expansion, with a
mine life of more than 30 years.
The project is tracking slightly ahead of
schedule with the target of first copper production during Q1 2028. The main critical path for the process plant expansion is the mill building, where good progress was made during Q4 2025 with the completion of the raft foundation of the mill
building and commencement of the reinforcing steel and shutter installation for the first civil plinths. The primary crusher soil remediation has been completed and we expect the civil construction to commence on schedule in
|
|
|
|
|
|
|
|
|
BARRICK YEAR-END 2025 |
44 |
MANAGEMENT’S DISCUSSION AND
ANALYSIS |
Q1 2026. Long-lead equipment manufacturing is continuing to make progress and procurement of future packages is
tracking on schedule with the award of key packages during Q4 2025, including the structural steel packages for both the wet and dry plant areas. The first crates of the mill components have been shipped and are en route to site. The building of the
third phase of accommodation is ongoing and made steady progress during Q4 2025. The TSF design and reviews have been completed and the construction of the first diversion channel for the expanded facility is currently in progress. All orders for
the 2026 mining fleet expansion have been completed and deliveries commenced during Q4 2025, with the PC7000 excavator completed to 90% assembly progress.
Continued progress on the detailed engineering, procurement and construction ensured that the total project remains slightly ahead of schedule. We
maintained the focus on delivery of critical milestones in line with the execution schedule. As at Q4 2025, we have spent $254 million, (including $106 million in Q4 2025). As at December 31, 2025, the total spend on the expansion project was $416
million with 2026 expected to be $750 to $850 million. The total project capital cost (exclusive of capitalized stripping) is expected to be $2 billion based on the approved feasibility study.
Exploration
The foundation of our exploration strategy is a deep organizational understanding that discovery through exploration
is a long-term investment and the main value driver for the business. Our exploration strategy has multiple elements that all need to be in balance to deliver on Barrick's business plan for growth and long-term
sustainability.
First, we seek to deliver projects of a
short- to medium-term nature that will drive improvements in mine plans. Second, we seek to make new discoveries that add to Barrick's Tier One Gold Asset1 portfolio. Third, we work to optimize the value of our major undeveloped projects and finally, we seek to identify emerging
third-party opportunities early in their value chain and secure them, where
appropriate.
During Q4 2025, Barrick’s exploration teams have been active around all our operations, with strong results returned from drilling across NGM
in Nevada, as detailed above under Fourmile and Goldrush of this section.
On
other advanced projects, drilling at the ARK target in Kibali during the quarter has extended the system a further 300 meters downplunge, while in Reko Diq, the team have identified additional, new porphyry
systems.
In early-stage work, framework drilling continues at the Norris property
in Canada while we have also made material progress this quarter at our projects in Peru, Saudi Arabia and in the Copper Belt in Zambia and
DRC.
|
|
|
|
|
|
|
|
|
BARRICK YEAR-END 2025 |
45 |
MANAGEMENT’S DISCUSSION AND
ANALYSIS |
REVIEW OF FINANCIAL
RESULTS
Revenue
|
|
|
|
|
|
|
|
|
|
|
|
|
|
|
|
|
|
| ($ millions, except per ounce/pound data in
dollars) |
For the three months ended |
For the years ended |
| |
12/31/25
|
9/30/25 |
12/31/25
|
12/31/24 |
12/31/23 |
| Gold |
|
|
|
|
|
000s oz
solda |
960 |
|
837 |
|
3,318 |
|
3,798 |
|
4,024 |
|
000s oz produceda |
871 |
|
829 |
|
3,255 |
|
3,911 |
|
4,054 |
|
Market
price ($/oz) |
4,135 |
|
3,457 |
|
3,432 |
|
2,386 |
|
1,941 |
|
Realized price ($/oz)b |
4,177 |
|
3,457 |
|
3,501 |
|
2,397 |
|
1,948 |
|
Revenue
|
5,353 |
|
3,748 |
|
15,147 |
|
11,820 |
|
10,350 |
|
| Copper |
|
|
|
|
|
000s
tonnes solda |
67 |
|
52 |
|
224 |
|
177 |
|
185 |
|
000s tonnes produceda |
62 |
|
55 |
|
220 |
|
195 |
|
191 |
|
Market
price ($/lb) |
5.03 |
|
4.44 |
|
4.51 |
|
4.15 |
|
3.85 |
|
Realized price ($/lb)b |
5.42 |
|
4.39 |
|
4.72 |
|
4.15 |
|
3.85 |
|
Revenue
|
514 |
|
320 |
|
1,475 |
|
855 |
|
795 |
|
| Other sales |
130 |
|
80 |
|
334 |
|
247 |
|
252 |
|
| Total
revenue |
5,997
|
|
4,148
|
|
16,956
|
|
12,922
|
|
11,397
|
|
a.On an
attributable basis.
b.Further information on these non-GAAP financial measures, including detailed reconciliations, is included on pages 57 to 69 of this
MD&A.
Our 2025 gold production of 3.26
million ounces was within the guidance range of 3.15 to 3.50 million ounces. As previously disclosed, this was towards the lower end of the range mainly due to lower than planned production at Carlin as production was impacted by a slower than
planned ramp-up of the Gold Quarry roaster and delayed access to higher grade underground zones due to poor ground conditions, together with an increase in higher grade ore shipped from Cortez and processed at the Carlin roasters, to the overall
benefit of NGM. Gold production was further impacted by lower grades processed than planned at Kibali and the divestiture of both Hemlo and Tongon during Q4 2025. Copper production of 220 thousand tonnes for 2025 was at the higher end of the
guidance range of 200 to 230 thousand tonnes.
Q4 2025 compared to Q3
2025
In Q4 2025, gold revenues increased by 43% compared to Q3 2025 primarily due to a higher
realized gold price6, combined with higher sales volume. The average realized price for Q4 2025 was $4,177 per ounce versus $3,457 per ounce for Q3 2025. During Q4 2025,
the gold price ranged from $3,820 per ounce to an all-time nominal high of $4,550 per ounce and closed the quarter at $4,368 per ounce. Gold prices in Q4 2025 continued to rise as a result of reductions in benchmark interest rates, geopolitical
tensions, tariff uncertainty and global economic concerns.
ATTRIBUTABLE GOLD PRODUCTION VARIANCE (000s oz)
Q4 2025 compared to Q3 2025
In Q4 2025, attributable gold production was 42 thousand ounces higher than Q3 2025, primarily driven by a stronger performance at NGM, mainly at
Carlin due to higher throughput and grades processed at both the roasters and the autoclave; and at Turquoise Ridge due to higher grades from the undergrounds; combined with the restart of production at Loulo-Gounkoto after regaining control
of the mine. These impacts were partially offset by lower production at Tongon and Hemlo (included in the “Other” category above) as a result of the divestitures in Q4 2025. Attributable gold sales were higher than attributable gold
production due to the sale of the reacquired gold from Loulo-Gounkoto.
Copper
revenues in Q4 2025 increased by 61% compared to Q3 2025, primarily due to higher copper sales volume, combined with a higher realized copper price6. The average market price in Q4 2025 was $5.03 per pound versus $4.44 per pound in Q3 2025. In Q4 2025, the realized copper price6 was higher than the market copper price due to the impact of positive provisional pricing adjustments, whereas a negative provisional pricing
adjustment was recorded in Q3 2025. During Q4 2025, the copper price ranged from $4.66 per pound to an all-time nominal high of $5.88 per pound and closed the quarter at $5.67 per pound. Copper prices in Q4 2025 were influenced by a decline in the
trade-weighted US dollar, supply disruptions and tariff uncertainty.
Attributable
copper production in Q4 2025 was 13% higher compared to Q3 2025 driven by higher throughput at Lumwana.
2025 compared to 2024
In 2025, gold revenues increased by 28% compared to 2024, primarily due to a higher realized gold price6, partially offset by a decrease in sales volumes. The average market gold price for 2025 was $3,432 per ounce compared to $2,386 per ounce in 2024.
|
|
|
|
|
|
|
|
|
BARRICK YEAR-END 2025 |
46 |
MANAGEMENT’S DISCUSSION AND
ANALYSIS |
In 2025, attributable gold production was 3,255 thousand ounces, or 656 thousand ounces lower
than 2024, largely driven by the temporary suspension of operations at Loulo-Gounkoto on January 14, 2025. Control was subsequently regained on December 15, 2025. In addition to this, lower underground grades were mined at Carlin although this was
partially offset by Cortez with more of the higher grade Cortez refractory ore being processed at the Carlin roasters. A further driver of the decrease was the divestitures of Tongon and Hemlo (included in the “Other” category) in Q4
2025. These unfavorable impacts were offset by increased production at Turquoise Ridge due to higher underground tonnes mined and higher tonnes
processed.
ATTRIBUTABLE GOLD PRODUCTION
VARIANCE (000s oz)
Year ended December 31, 2025
Copper revenues for 2025 were 73% higher compared to 2024 due to higher copper sales volume, combined with a higher realized copper
price6. For 2025, the realized copper price6 was higher than the market copper price due to the impact of positive provisional pricing adjustments, whereas the realized copper price6 was in line with the market copper price in 2024.
Attributable copper production for 2025 was 25 thousand tonnes higher than 2024, mainly due to higher grades processed and higher recoveries at
Lumwana.
Production
Costs
|
|
|
|
|
|
|
|
|
|
|
|
|
|
|
|
|
|
|
| ($ millions, except per ounce/pound data in
dollars) |
For the three months ended |
For the years ended |
| |
12/31/25
|
9/30/25 |
12/31/25
|
12/31/24 |
12/31/23 |
| Gold |
|
|
|
|
|
| Site operating
costs |
1,623 |
|
1,157 |
|
5,056 |
|
5,068 |
|
4,917 |
| Depreciation |
503 |
|
384 |
|
1,588 |
|
1,641 |
|
1,756 |
| Royalty expense |
229 |
|
113 |
|
540 |
|
405 |
|
371 |
| Mining and production
taxes |
55 |
|
29 |
|
132 |
|
78 |
|
98 |
| Community relations |
13 |
|
7 |
|
41 |
|
34 |
|
36 |
| Cost
of sales |
2,423
|
|
1,690
|
|
7,357
|
|
7,226
|
|
7,178
|
COS ($/oz)a |
1,904
|
|
1,562
|
|
1,697
|
|
1,442
|
|
1,334
|
TCC
($/oz)b |
1,205 |
|
1,137 |
|
1,199 |
|
1,065 |
|
960 |
AISC
($/oz)b |
1,581 |
|
1,538 |
|
1,637 |
|
1,484 |
|
1,335 |
| Copper |
|
|
|
|
|
| Site operating
costs |
154 |
|
98 |
|
477 |
|
389 |
|
401 |
| Depreciation |
88 |
|
69 |
|
285 |
|
245 |
|
259 |
| Royalty expense |
37 |
|
25 |
|
108 |
|
67 |
|
62 |
| Community relations |
2 |
|
1 |
|
5 |
|
5 |
|
4 |
| Cost
of sales |
281
|
|
193
|
|
875
|
|
706
|
|
726
|
COS ($/lb)a |
3.37
|
|
2.68
|
|
2.91
|
|
2.99
|
|
2.90
|
C1 cash
costs ($/lb)b |
2.45 |
|
1.96 |
|
2.14 |
|
2.26 |
|
2.28 |
AISC
($/lb)b |
3.61 |
|
3.14 |
|
3.20 |
|
3.45 |
|
3.21 |
|
a.Gold
COS/oz is calculated as cost of sales across our gold operations (excluding sites in closure or care and maintenance) divided by ounces sold (both on an attributable basis using Barrick’s ownership share). Copper COS/lb is calculated
as cost of sales across our copper operations divided by pounds sold (both on an attributable basis using Barrick’s ownership share).
b.Further information on these non-GAAP financial measures, including detailed reconciliations, is included on pages 57 to 69 of this
MD&A.
Q4 2025 compared to Q3
2025
In Q4 2025, gold COS on a consolidated basis was 43% higher compared to Q3 2025, primarily as
a result of higher sales volumes, combined with higher depreciation expense and increased royalty expense as a result of a higher realized gold price6. Our 45% interest in Kibali and 24.5% interest in Porgera are equity accounted and therefore each mine’s COS is excluded from our consolidated
gold COS. Our per ounce metrics, gold COS/oz7 and TCC/oz6, includes our proportionate share of cost of sales at our equity method investees, and were 22% and 6% higher, respectively, than Q3 2025 primarily
due to the inclusion of higher cost Loulo-Gounkoto ounces and increased sulfuric acid consumption and prices at Carlin. This was combined with higher royalties due to an increase in the realized gold price6 (impact approximately $45/oz). COS/oz7 was further impacted as it includes the impact of the fair value increment on inventory resulting from the purchase price allocation when we
regained control of Loulo-Gounkoto.
In Q4 2025, gold AISC/oz6 increased by 3% compared to Q3 2025, primarily due to higher TCC/oz6 as described above, partially offset by lower general and administrative expenses, while minesite sustaining capital
|
|
|
|
|
|
|
|
|
BARRICK YEAR-END 2025 |
47 |
MANAGEMENT’S DISCUSSION AND
ANALYSIS |
expenditures6 on a per ounce basis remained relatively consistent with the prior quarter.
In Q4 2025, copper COS on a consolidated basis was 46% higher than Q3 2025, primarily due to the impact of higher copper sales volumes. Our 50%
interests in Zaldívar and Jabal Sayid are equity accounted and therefore we do not include their COS in our consolidated copper COS. Our per pound metrics, copper COS/lb7 and C1 cash costs/lb6 increased by 26% and 25%, respectively, compared to Q3 2025 primarily due to higher costs at Zaldívar and higher mining maintenance costs due
to lower fleet availabilities from premature failures as well as higher power costs at Lumwana.
In Q4 2025, copper AISC/lb6, which also includes our proportionate share of equity method investees, was 15% higher than Q3 2025, primarily reflecting higher C1 cash
costs/lb6, partially offset by lower minesite sustaining capital expenditures6 on a per pound basis.
2025 compared to 2024
In 2025, gold COS on a consolidated basis was 2% higher than 2024 primarily due to increased royalties as a result of a higher realized gold
price6, partially offset by the impact of lower sales volume. Our per ounce metrics, gold COS/oz7 and TCC/oz6, after including our proportionate share of COS at our equity method investees (refer to explanation above), were 18% and 13% higher, respectively,
than 2024, primarily due to lower production across the portfolio (resulting in reduced fixed cost dilution), lower grades processed at a number of operations, higher share-based compensation and higher royalties (impact approximately $55/oz)
associated with the increase in the realized gold price6.
In 2025, gold AISC/oz6 increased by 10% compared to 2024 primarily due to higher TCC/oz6, partially offset by lower minesite sustaining capital expenditures6.
In 2025, copper COS on a consolidated basis was 24% higher than 2024, primarily due to higher sales volumes. Our 50% interests in Zaldívar and
Jabal Sayid are equity accounted and therefore we do not include their COS in our consolidated copper COS. Copper COS/lb7 and C1 cash costs/lb6 were 3% and 5% lower, respectively, compared to 2024, primarily due to higher grades processed and higher capitalized waste stripping at Lumwana,
partially offset by higher costs at Zaldívar.
Copper AISC/lb6 was 7% lower than 2024, primarily due to a lower C1 cash costs/lb6, as discussed above, combined with lower minesite sustaining capital expenditures6.
2025 compared to Guidance
2025 gold COS/oz7 and TCC/oz6 were $1,697 and $1,199 respectively, which were both higher than our guidance ranges of $1,460 to $1,560 per ounce and $1,050 to $1,130 per ounce,
respectively. Gold AISC/oz6 for 2025 of $1,637 was also higher than the guidance range of $1,460 to $1,560 per ounce. All gold cost metrics were higher than the guidance ranges
mainly due to higher royalties from the higher realized gold price6. Our cost guidance for 2025 was based on a gold price assumption of $2,400/oz. Given the actual realized gold price6 was considerably higher at $3,501/oz, the cost guidance ranges need to be increased by $55/oz to provide a more meaningful comparison. After
adjusting for the realized gold price6, the guidance ranges are as follows: COS/oz7 of $1,515 to $1,615, TCC/oz6 of
$1,105 to $1,185 and AISC/oz6 of $1,515 to $1,615. After adjusting for the gold price, COS/oz7 was higher than the guidance range due to the impact of the fair value increment on inventory resulting from the purchase price allocation when we
regained control of Loulo-Gounkoto. TCC/oz6 and AISC/oz6 were slightly higher than the adjusted guidance ranges mainly due to higher consumable prices at many sites including NGM that was partially driven
by the impact of tariffs.
2025 copper COS/lb7 and AISC/lb6 were $2.91 and $3.20, respectively, which were both slightly higher than our guidance ranges of $2.50 to $2.80 per pound and $2.80 to $3.10 per
pound, respectively, as a result of higher royalties due to a higher realized copper price6. Our cost guidance for 2025 was based on a copper price assumption of $4.00/lb. After adjusting for the impact of higher copper prices, our
actual COS/lb7 and AISC/lb6 were above the guidance ranges mainly due to a year end inventory writedown at Zaldívar. 2025 C1 cash costs6 of $2.14 per pound was also slightly above our guidance range of $1.80 to $2.10 per pound.
General and Administrative
Expenses
|
|
|
|
|
|
|
|
|
|
|
|
|
|
|
|
|
|
| ($ millions) |
For the three months ended |
For the years ended |
|
|
12/31/25
|
9/30/25 |
12/31/25
|
12/31/24 |
12/31/23 |
| Corporate
administration |
25 |
|
25 |
|
103 |
95 |
|
101 |
|
Share-based compensationa |
39 |
|
52 |
|
119 |
20 |
|
25 |
|
|
|
|
|
|
|
| General &
administrative expenses |
64 |
|
77 |
|
222
|
115 |
|
126 |
|
| 2025 Guidance |
|
|
|
| Corporate administration |
~120 |
|
| Share-based
compensation |
~40 |
|
| General & administrative expenses |
~160 |
|
a.Based on
US$45.76 share price as at December 31, 2025 (September 30, 2025: US$34.12; 2024: US$15.71; 2023: US$18.09).
Q4 2025 compared to Q3 2025
In Q4 2025, general and administrative expenses decreased by $13 million compared to Q3 2025, primarily due to lower share-based compensation as a
result of a smaller increase in our share price during Q4 2025 compared to Q3 2025.
2025 compared to 2024
General and administrative expenses in 2025 increased by $107 million compared to 2024 due to higher share-based compensation due to a significant
increase in our share price.
2025 compared
to Guidance
General and administrative expenses in 2025 of $222 million were higher than guidance
of ~$160 million. Corporate administration expenses of $103 million were below our guidance of ~$120 million, highlighting the continued benefit of our cost discipline, while share-based compensation expenses of $119 million were higher
than our guidance of ~$40 million due to a significant increase in our share price during the current year whereas our guidance was based on a share price assumption of $16.39 as previously disclosed.
|
|
|
|
|
|
|
|
|
BARRICK YEAR-END 2025 |
48 |
MANAGEMENT’S DISCUSSION AND
ANALYSIS |
Exploration, Evaluation and Project
Costs
|
|
|
|
|
|
|
|
|
|
|
|
|
|
|
|
|
|
| ($ millions) |
For the three months ended |
For the years ended |
|
|
12/31/25
|
9/30/25 |
12/31/25
|
12/31/24 |
12/31/23 |
| Global
exploration and evaluation |
82 |
|
58 |
|
220 |
153 |
|
143 |
|
| Project
costs: |
|
|
|
|
|
| Reko
Diq |
4 |
|
4 |
|
11 |
126 |
|
60 |
|
|
|
|
|
|
|
|
|
|
|
|
|
|
|
|
|
|
|
|
|
|
|
|
|
| Other
|
45 |
|
23 |
|
109 |
76 |
|
118 |
|
|
|
|
|
|
|
|
|
|
|
|
|
| Global exploration and evaluation and project expense |
131
|
|
85
|
|
340 |
355
|
|
321
|
|
| Minesite exploration and
evaluation |
8 |
|
7 |
|
27 |
37 |
|
40 |
|
| Total
exploration, evaluation and project expenses |
139
|
|
92
|
|
367 |
392
|
|
361
|
|
|
|
|
|
|
|
|
|
2025 Actuals |
2025 Guidance
|
| E&E
|
247 |
220 -
240 |
| Project
expenses |
120 |
|
110 -
130 |
| Total E&E and project expenses |
367 |
|
330 - 370 |
Q4 2025 compared to Q3 2025
Exploration, evaluation and project expenses for Q4 2025 increased by $47 million compared to Q3 2025. This was primarily due to higher global
exploration and evaluation costs and higher project costs across various projects. The increase in project costs was also driven by legal and consulting costs related to the Hemlo and Tongon divestitures (included in “Other”).
2025 compared to
2024
Exploration, evaluation and project costs for 2025 decreased by $25 million compared to 2024,
primarily due to lower project costs at Reko Diq as the feasibility study was completed at the end of 2024, which resulted in the conversion of resources to mineral reserves and consequently project development costs are now capitalized. This was
partially offset by higher global exploration and evaluation costs at Fourmile from the ramp-up of drilling activities and higher other project costs relating to the divestitures of Hemlo and Tongon and various other
projects.
2025 compared to Guidance
Exploration, evaluation and project expenses for 2025 of $367 million were at the upper end of the guidance range. Exploration and evaluation costs
of $247 million were slightly higher than the guidance range, mainly relating to the ramp-up of drilling activity at Fourmile, while project expenses of $120 million were at the midpoint of the guidance
range.
Finance Costs, Net
|
|
|
|
|
|
|
|
|
|
|
|
|
|
|
|
|
|
| ($ millions) |
For the three months ended |
For the years ended |
|
|
12/31/25
|
9/30/25 |
12/31/25
|
12/31/24 |
12/31/23 |
Interest expensea |
119 |
|
93 |
|
409 |
|
452 |
|
387 |
|
| Accretion |
22 |
|
22 |
|
89 |
|
89 |
|
87 |
|
| Interest capitalized |
(19) |
|
(16) |
|
(55) |
|
(33) |
|
(42) |
|
|
|
|
|
|
|
|
|
|
|
|
|
| Other finance costs |
0 |
|
4 |
|
5 |
|
5 |
|
7 |
|
| Finance income |
(58) |
|
(60) |
|
(221) |
|
(281) |
|
(269) |
|
| Finance costs, net |
64
|
|
43 |
|
227 |
|
232
|
|
170
|
|
| 2025 Guidance |
|
270 -
310 |
|
|
a.For Q4 2025
and 2025, interest expense includes approximately $nil and $24 million, respectively, of non-cash interest expense relating to the streaming agreement with Royal Gold Inc. (Q3 2025: $8 million; 2024: $33 million; 2023: $32
million). Interest expense also includes approximately $1 million and $11 million for Q4 2025 and 2025, respectively, relating to finance costs in Argentina (Q3 2025: $1 million; 2024: $78 million; 2023: $nil)
Q4 2025 compared to Q3
2025
In Q4 2025, finance costs, net increased by 49% compared to Q3 2025, primarily driven by
higher interest expense resulting from the discounting of the resettlement reimbursement receivable at Pueblo Viejo.
2025 compared to 2024
In 2025, finance costs, net were 2% lower than 2024, primarily due to lower interest expense due to decreased finance costs in Argentina associated
with cash repatriation, partially offset by lower finance income.
2025 compared to Guidance
Finance costs, net for 2025 of $227 million were lower than the guidance range of $270 to $310 million, mainly due to higher than expected finance
income earned on our cash balance resulting from our strong cash flow generation.
Additional Significant Statement of Income Items
|
|
|
|
|
|
|
|
|
|
|
|
|
|
|
|
|
|
|
|
| ($ millions) |
For the three months ended |
For the years ended |
|
|
|
|
12/31/25
|
9/30/25 |
12/31/25
|
12/31/24 |
12/31/23 |
|
|
| Impairment
charges (reversals) |
5 |
|
3 |
|
12 |
|
(457) |
|
312 |
|
|
|
| Loss
(gain) on currency translation |
6 |
|
(3) |
|
3 |
|
39 |
|
93 |
|
|
|
| Closed mine
rehabilitation |
(7) |
|
4 |
|
8 |
|
59 |
|
16 |
|
|
|
| Other (income) expense |
(839)
|
|
(193)
|
|
(509)
|
|
214
|
|
(195)
|
|
|
|
|
|
|
|
|
|
|
|
|
BARRICK YEAR-END 2025 |
49 |
MANAGEMENT’S DISCUSSION AND
ANALYSIS |
Impairment Charges
(Reversals)
|
|
|
|
|
|
|
|
|
|
|
|
|
|
|
|
|
|
| ($ millions) |
For the three months ended |
For the years ended |
|
|
12/31/25
|
9/30/25 |
12/31/25
|
12/31/24 |
12/31/23 |
|
|
|
|
|
|
| Asset
impairments (reversals) |
| Carlin
|
2 |
|
1 |
|
6 |
|
82 |
|
4 |
|
| Cortez
|
3 |
|
1 |
|
4 |
|
0 |
|
0 |
|
| Pueblo
Viejo |
0 |
|
0 |
|
1 |
|
0 |
|
0 |
|
| Hemlo
|
0 |
|
1 |
|
1 |
|
0 |
|
0 |
|
| Lumwana
|
0 |
|
0 |
|
0 |
|
(655) |
|
0 |
|
| Veladero
|
0 |
|
0 |
|
0 |
|
(437) |
|
0 |
|
|
|
|
|
|
|
| Long
Canyon |
0 |
|
0 |
|
0 |
|
49 |
|
280 |
|
|
|
|
|
|
|
|
|
|
|
|
|
| Tanzania
|
0 |
|
0 |
|
0 |
|
0 |
|
22 |
|
|
|
|
|
|
|
|
|
|
|
|
|
|
|
|
|
|
|
|
|
|
|
|
|
|
|
|
|
|
|
|
|
|
|
|
|
|
|
|
|
|
|
|
|
|
|
|
|
|
|
|
|
|
|
|
|
|
|
|
|
|
|
|
|
|
|
|
|
|
|
|
|
| Other
|
0 |
|
0 |
|
0 |
|
20 |
|
6 |
|
| Total asset impairment charges (reversals) |
5 |
|
3 |
|
12 |
|
(941) |
|
312 |
|
| Goodwill |
|
|
|
|
|
|
| Loulo-Gounkoto
|
0 |
|
0 |
|
0 |
|
484 |
|
0 |
|
|
|
|
|
|
|
|
|
|
|
|
|
|
|
|
|
|
|
| Total goodwill impairment charges |
0
|
|
0
|
|
0
|
|
484
|
|
0
|
|
|
|
|
|
|
|
| Total impairment charges (reversals) |
5 |
|
3 |
|
12 |
|
(457) |
|
312 |
|
In Q4 2025 and the full year 2025, we recognized $5 million and $12 million, respectively, of net impairment charges, with no significant impairment
charges or reversals in these periods. This compares to net impairment reversals of $941 million in 2024, mainly due to non-current asset impairment reversals of $655 million at Lumwana as a result of the inclusion of the Super Pit Expansion in the
LOM plan and higher copper prices at Lumwana, and of $437 million at Veladero, reflecting higher gold prices, extended mine life and lower country risk. In addition, we recognized a goodwill impairment of $484 million at Loulo-Gounkoto in 2024.
Refer to note 21 to the Financial Statements for a full description of impairment
charges, including pre-tax amounts and sensitivity analysis.
Loss on Currency Translation
Loss on currency translation for 2025 decreased by $36 million compared to 2024. The loss of $3 million in 2025 was mainly due to unrealized foreign
currency losses relating to the Zambian kwacha and Argentine peso, largely offset by gains relating to the West African CFA franc and Chilean peso. The loss of $39 million in 2024 was primarily due to realized foreign currency losses relating to the
Chilean peso, which were hedged and a corresponding gain on non-hedge derivatives was recorded in other income. This was combined with unrealized foreign currency losses relating to the Argentine peso and West African CFA
franc.
Currency fluctuations result in a revaluation of our local currency
denominated VAT receivables and local currency denominated payable balances.
Closed mine rehabilitation
Closed mine rehabilitation expense in 2025 was $8 million compared to $59 million in 2024, as the prior year included higher closure cost estimates
at various closure sites.
Other (Income) Expense
In Q4 2025, other income was $839 million, while the full year 2025 was $509 million. Other income in Q4 2025 mainly relates to the gain on the sale
of non-current assets totaling $732 million, comprised of our Hemlo gold mine ($545 million), our interest in the Tongon gold mine ($134 million) and the Alturas project ($53 million). This was combined with the accounting impact of
regaining control of the Loulo-Gounkoto complex on December 16, 2025, partially offset by the settlement payment of $253 million to the Government of Mali in November 2025. In Q3 2025, other income of $193 million primarily related to the $250
million revaluation of our 80% equity investment in Loulo-Gounkoto, as it was deconsolidated in Q2 2025 and recognized as an investment at fair value following the change of control after it was placed under a temporary provisional administration on
June 16, 2025. The full year 2025 was further impacted by the gain on sale of our 50% interest in the Donlin Gold project of $745 million, partially offset by the net loss on the deconsolidation and recognition of our 80% equity investment in
Loulo-Gounkoto in Q2 2025 (refer to notes 4 and 35 for further details). Other expense of $214 million in 2024 mainly relates to a payment to the Government of Mali to advance negotiations, the customs and royalty settlement at Tongon, and interest
and penalties recognized following the settlement of the Zaldívar Tax Assessment in Chile.
For a further breakdown of other (income) expense, refer to note 9 to the Financial
Statements.
Income Tax Expense
Income tax expense was $1,651 million in 2025. The unadjusted effective income tax rate for 2025 was 19% of the income before income
taxes.
The underlying effective income tax rate on ordinary income for 2025 was
25% after adjusting for the impact of the resolution of uncertain tax positions; the impact of foreign currency translation losses on current and deferred tax balances; the impact of the recognition and de-recognition of deferred tax
assets; the impact of the sale of non-current assets; the impact of Loulo-Gounkoto; and the impact of other expense adjustments.
We record deferred tax charges or credits if changes in facts or circumstances affect the estimated tax basis of assets and, therefore, the
expectations in our ability to realize deferred tax assets. The interpretation of tax regulations and legislation as well as their application to our business is complex and subject to change.
We have significant amounts of deferred tax assets, including tax loss
carryforwards, and also deferred tax liabilities. In 2025, the sale of our Hemlo mine resulted in a taxable gain that provided sufficient Canadian taxable profit to utilize a portion of previously unrecognized deferred tax assets from loss
carryforwards. Outside of this transaction, it remains not probable that sufficient future taxable profits will be available in Canada, and no additional tax loss carryforwards are expected to be utilized in the foreseeable future. Potential changes
in any of these amounts, as well as our ability to realize deferred tax assets in Canada or elsewhere, could significantly affect net
|
|
|
|
|
|
|
|
|
BARRICK YEAR-END 2025 |
50 |
MANAGEMENT’S DISCUSSION AND
ANALYSIS |
income or cash flow in future periods. For further details on income tax expense, refer to note 12 to the
Financial Statements.
|
|
|
|
|
|
|
|
|
| Reconciliation to Canadian Statutory Rate |
| For the years ended |
12/31/25
|
12/31/24 |
| At 26.5%
statutory rate |
2,334
|
|
1,221
|
|
| Increase (decrease) due to: |
|
|
Allowances and special tax
deductionsa |
(226) |
|
(211) |
|
Impact of foreign tax ratesb |
(314) |
|
18 |
|
| Non-deductible expenses / (non-taxable
income) |
130 |
|
111 |
|
| Loulo-Gounkoto (note 35) |
(324) |
|
0 |
|
|
|
|
| Goodwill impairment charges not tax
deductible |
0 |
|
145 |
|
| Impact of non-current assets disposals
|
(258) |
|
2 |
|
| Net currency translation losses on current
and deferred tax balances |
41 |
|
52 |
|
| Tax impact from pass-through entities and
equity accounted investments |
(535) |
|
(263) |
|
| Current year tax results sheltered by
previously unrecognized deferred tax assets |
76 |
|
(5) |
|
|
|
|
| Recognition and derecognition of deferred
tax assets |
27 |
|
(26) |
|
|
|
|
|
|
|
| Settlements and adjustments in respect of
prior years |
2 |
|
116 |
|
| Increase to income tax related contingent
liabilities |
(33) |
|
1 |
|
|
|
|
|
|
|
| Withholding taxes |
160 |
|
70 |
|
|
|
|
| Mining taxes |
584 |
|
290 |
|
| Tax impact of amounts recognized within
accumulated OCI |
(8) |
|
0 |
|
| Other items |
(5) |
|
(1) |
|
| Income tax expense |
1,651 |
|
1,520 |
|
a.We are
able to claim certain allowances, incentives and tax deductions unique to extractive industries that result in a lower effective tax rate.
b.We operate in
multiple foreign tax jurisdictions that have tax rates different than the Canadian statutory rate.
The more significant items impacting income tax expense in 2025 and 2024 include the
following:
Currency
Translation
Current and deferred tax balances are subject to remeasurement for changes in foreign
currency exchange rates each period. This is required in countries where tax is paid in local currency and the subsidiary has a different functional currency (typically US dollars). The most significant relate to Argentine and Malian tax
balances.
In 2025, a tax recovery of $26 million arose from net translation
gains on deferred tax balances in Mali (prior to their deconsolidation) and Argentina due to the strengthening of the West African CFA, partially offset by the weakening of the Argentine peso against the US dollar. In 2024, a tax expense of $52
million arose from translation losses on tax balances, mainly due to the weakening of the Argentine peso and the West African CFA against the US dollar. These net translation losses are included within income tax
expense.
Withholding Taxes
In 2025, we have recorded $6 million (2024: $3 million related to Saudi Arabia) of dividend withholding taxes related to the
undistributed earnings of our subsidiaries in Saudi Arabia. We have also recorded $139 million (2024: $45 million, related to Saudi Arabia, Peru and the United States) of dividend withholding taxes related to the distributed earnings
of our subsidiaries in Argentina, Côte d’lvoire, Saudi Arabia, Tanzania and the United States.
Accounting for Joint Ventures and Associates
NGM is a limited liability company treated as a flow through partnership for US tax purposes. The partnership is not subject to federal income tax
directly, but each of its partners is liable for tax on its share of the profits of the partnership. As such, Barrick accounts for its current and deferred income tax associated with the investment (61.5% share) following the principles in IAS
12.
Mining Taxes
NGM is subject to a Net Proceeds of Minerals tax in Nevada at a rate of 5% and the
tax expense recorded in 2025 was $282 million (2024: $145 million). The other significant mining tax is the Dominican
Republic’s Net Profits Interest tax, which is determined based on cash flows as defined by the Pueblo
Viejo Special Lease Agreement. A tax expense of $283 million (2024: $134 million) was recorded for this in 2025. Both taxes are included on a consolidated basis in the
Company's consolidated statements of income.
United States Tax
Reform
Under the Inflation Reduction Act signed in August 2022, the United States implemented a 15%
corporate alternative minimum tax (“CAMT”) on applicable financial statement income, effective for tax years beginning after December 31, 2022, with CAMT credit carryforwards having an indefinite life. Barrick is subject to CAMT as it
meets the requisite income thresholds for a foreign-parented multi-national
group.
While final regulations are still awaited, since its introduction, Barrick
has recognized a deferred tax asset from the CAMT credit carryforwards anticipating recovery against future US Federal Income Tax liabilities.
Organisation for Economic Co-operation and
Development (“OECD”) Pillar Two model rules
We applied the exception under the amendments to IAS 12 and are not recognizing or disclosing deferred tax assets and liabilities related to Pillar
Two income taxes.
Our review of Pillar Two for the current year, based on the
OECD’s Transitional Safe Harbour rules implemented in the Global Minimum Tax Act in Canada, has not identified any material amounts to be accrued for 2025, and we do not expect the new safe harbors to result in a material incremental tax cost.
As the law is evolving in Canada and elsewhere, we will continue to monitor the impact of this
legislation.
|
|
|
|
|
|
|
|
|
BARRICK YEAR-END 2025 |
51 |
MANAGEMENT’S DISCUSSION AND
ANALYSIS |
|
|
|
|
|
|
|
|
|
|
|
|
| Financial Condition Review |
|
|
|
|
|
|
|
| Summary Balance Sheet and Key Financial Ratios |
|
|
| ($ millions, except ratios and share amounts) |
|
|
|
| As at December 31 |
2025 |
|
2024 |
|
2023 |
|
| Total cash and
equivalents |
6,706 |
|
4,074 |
|
4,148 |
|
| Current assets |
3,511 |
|
3,558 |
|
3,290 |
|
| Non-current assets |
41,360 |
|
39,994 |
|
38,373 |
|
| Total
Assets |
51,577
|
|
47,626
|
|
45,811
|
|
| Current
liabilities excluding short-term debt |
3,441
|
|
2,618
|
|
2,345
|
|
Non-current liabilities excluding
long-term debta |
7,517 |
|
7,023 |
|
6,738 |
|
| Debt (current and long-term) |
4,703 |
|
4,729 |
|
4,726 |
|
| Total
Liabilities |
15,661
|
|
14,370
|
|
13,809
|
|
| Total
shareholders’ equity |
26,557
|
|
24,290
|
|
23,341
|
|
| Non-controlling interests |
9,359 |
|
8,966 |
|
8,661 |
|
| Total
Equity |
35,916
|
|
33,256
|
|
32,002
|
|
Total common
shares outstanding (millions of shares)b |
1,675
|
|
1,727
|
|
1,756
|
|
| Debt, net of
cash |
(2,003)
|
|
655
|
|
578
|
|
| Key Financial
Ratios: |
|
|
|
Current ratioc |
2.92:1
|
2.89:1
|
3.16:1
|
Debt-to-equity
d |
0.13:1 |
0.14:1 |
0.15:1 |
Net leveragee |
-0.2:1
|
0.1:1
|
0.1:1
|
a.Non-current financial liabilities as at December 31, 2025 were $5,684 million (2024: $5,215 million; 2023: $5,221
million).
b.As of January 27, 2026, the number of common shares outstanding is 1,675,360,395.
c.Represents current assets divided by current liabilities (including short-term debt) as at December 31, 2025, December 31, 2024
and December 31, 2023.
d.Represents debt divided by total shareholders’ equity (including minority interest) as at December 31, 2025, December 31,
2024, and December 31, 2023.
e.Further information on these non-GAAP financial measures, including detailed reconciliations, is included on pages 57 to 69 of this
MD&A.
Balance Sheet Review
Total assets were $51.6 billion at December 31, 2025, higher than total assets at December 31, 2024, driven by our strong cash flow generation and
the cash proceeds received from the sale of certain non-core assets, even after providing increased returns to shareholders and investing in our future through project capital expenditures.
Our asset base is primarily comprised of non-current assets such as property,
plant and equipment and equity method investments, reflecting the capital-intensive nature of the mining business and our history of growth through acquisitions and creation of joint ventures with other mining companies. Other significant assets
include production inventories, indirect taxes recoverable and receivable, concentrate sales receivables, other government transaction and joint venture related receivables, as well as cash and equivalents.
Total liabilities at December 31, 2025 were $15.7 billion, higher than total
liabilities at December 31, 2024. Our liabilities are primarily comprised of debt, other current and non-current liabilities (such as provisions, derivative liabilities and deferred income tax liabilities), and accounts payable.
Financial Position and Liquidity
We believe we have sufficient financial resources to meet our business requirements for the foreseeable future, including capital expenditures,
working capital requirements, interest payments, environmental rehabilitation, derivative settlements, securities buybacks and dividends.
Total cash and cash equivalents as at December 31, 2025 were $6.7 billion. Our capital structure comprises a mix of debt, non-controlling interest
(primarily at NGM)
and shareholders’ equity. As at December 31, 2025, our total debt was $4.7 billion (debt, net of cash and equivalents was negative $2,003
million) and our debt-to-equity ratio was 0.13:1. This compares to debt as at December 31, 2024 of $4.7 billion (debt, net of cash and cash equivalents was $655 million), and a debt-to-equity ratio of 0.14:1.
In 2026, we have capital commitments of $828 million and expect to incur
attributable sustaining and project capital expenditures6 of approximately $4,000 to $4,450 million based on our guidance range on page 12. In 2026, we have contractual obligations and commitments of $1,157
million associated with purchase obligations for supplies and consumables. In addition, we have $283 million in interest payments and other amounts as detailed in the table on page 55. We expect to fund these commitments through operating cash flow,
which is our primary source of liquidity, as well as existing cash balances as necessary. As previously disclosed, we authorized a 2025 share buyback program, where we may purchase up to $1.5 billion of Barrick’s shares. We purchased the
maximum $1.5 billion of shares under this program, including $500 million during Q4 2025. A share buyback program has not been authorized for 2026.
On February 4, 2026, the Board of Directors announced the declaration of a $0.42 per share dividend in respect of performance for the fourth quarter
of 2025, representing an increase of 140% over the third quarter, and announced a new dividend policy.
In Q4 2025 and going forward, the Company’s new dividend policy targets a total payout of 50% of attributable free cash flow on an annualized
basis, comprised of a fixed base quarterly dividend of $0.175 per share and a performance top-up component at each year end based on the attributable free cash flow during the year. The dividend paid in any given year may be higher or
|
|
|
|
|
|
|
|
|
BARRICK YEAR-END 2025 |
52 |
MANAGEMENT’S DISCUSSION AND
ANALYSIS |
lower than the 50% target based on the strength of cash flow, capital needs, balance sheet considerations, and
other factors.
The declaration and payment of dividends is at the discretion of
the Board of Directors, and will depend on the Company’s financial results, cash requirements, future prospects, the number of outstanding common shares, and other factors deemed relevant by the
Board.
Our operating cash flow is dependent on the ability of our operations to
deliver projected future cash flows. The market prices of gold and to a lesser extent, copper, are the primary drivers of our operating cash flow. Other options to enhance liquidity include portfolio optimization; issuance of equity or long-term
debt securities in the public markets or to private investors (Moody’s and S&P currently rate Barrick’s outstanding long-term debt as investment grade, with ratings of A3 and BBB+, respectively); and drawing on the $3.0 billion
available under our undrawn Credit Facility (subject to compliance with covenants and the making of certain representations and warranties, this facility is available for drawdown as a source of financing). In May 2025, we completed an update to our
undrawn $3.0 billion revolving Credit Facility, including an extension of the termination date by one year to May 2030. The revolving Credit Facility incorporates sustainability-linked metrics which are made up of annual environmental and social
performance targets directly influenced by Barrick's actions, rather than based on external ratings. The performance targets include Scope 1 and Scope 2 GHG emissions intensity, water use efficiency (reuse and recycling rates), and TRIFR8. Barrick may incur positive or negative pricing adjustments on drawn credit spreads and standby fees based on its sustainability performance versus
the targets that have been set. The Credit Facility was undrawn as at December 31, 2025. The key financial covenant in our undrawn Credit Facility requires Barrick to maintain a net debt to total capitalization ratio of less than 0.60:1.
Barrick’s net debt to total capitalization ratio was (0.06):1 as at December 31, 2025 (0.02:1 as at December 31,
2024).
|
|
|
|
|
|
|
|
|
|
|
|
|
|
|
|
|
|
| Summary of Cash Inflow (Outflow) |
|
|
| ($ millions) |
For the three months ended |
For the years ended |
| |
12/31/25
|
9/30/25 |
12/31/25
|
12/31/24 |
12/31/23 |
| Net
cash provided by operating activities |
2,726 |
|
2,422 |
|
7,689 |
|
4,491 |
|
3,732 |
|
| Investing activities |
|
|
|
|
| Capital expenditures |
(1,107) |
|
(943) |
|
(3,821) |
|
(3,174) |
|
(3,086) |
|
| Divestitures |
1,163 |
|
0 |
|
2,162 |
|
0 |
|
0 |
|
| Income taxes paid on
divestitures |
(44) |
|
(44) |
|
(175) |
|
0 |
|
0 |
|
| Funding of equity method
investments |
0 |
|
(1) |
|
(1) |
|
(59) |
|
0 |
|
| Dividends received from equity method
investments |
100 |
|
63 |
|
254 |
|
198 |
|
273 |
|
| Shareholder loan repayments from equity
method investments |
121 |
|
64 |
|
298 |
|
155 |
|
7 |
|
| Investment (purchases) sales |
43 |
|
0 |
|
43 |
|
97 |
|
(23) |
|
| Other |
2 |
|
0 |
|
4 |
|
19 |
|
13 |
|
| Total investing inflows (outflows) |
278 |
|
(861)
|
|
(1,236)
|
|
(2,764)
|
|
(2,816)
|
|
| Financing activities |
|
|
|
|
Net change in debta |
(4) |
|
(3) |
|
(26) |
|
(14) |
|
(56) |
|
Dividendsb |
(294) |
|
(254) |
|
(890) |
|
(696) |
|
(700) |
|
|
|
|
|
|
|
| Net disbursements to non-controlling
interests |
(570) |
|
(423) |
|
(1,398) |
|
(639) |
|
(514) |
|
| Share buyback program |
(500) |
|
(589) |
|
(1,500) |
|
(498) |
|
0 |
|
|
|
|
|
|
|
| Other |
0 |
|
(26) |
|
(9) |
|
52 |
|
65 |
|
| Total
financing outflows |
(1,368)
|
|
(1,295)
|
|
(3,823)
|
|
(1,795)
|
|
(1,205)
|
|
| Effect of
exchange rate |
1
|
|
1
|
|
2
|
|
(6)
|
|
(3)
|
|
| Increase (decrease) in cash and equivalents |
1,637 |
|
267 |
|
2,632 |
|
(74) |
|
(292) |
|
a.The
difference between the net change in debt on a cash basis and the net change on the balance sheet is due to changes in non-cash charges, specifically the unwinding of discounts and amortization of debt issue
costs.
b.For the three months and year ended December 31, 2025, we declared and paid dividends per share in US dollars totaling $0.175
and $0.525, respectively (September 30, 2025: declared and paid $0.15; 2024: declared and paid $0.40; 2023: declared and paid $0.40).
Q4 2025 compared to Q3 2025
In Q4 2025, we generated $2,726 million in operating cash flow, compared to $2,422 million in Q3 2025. The increase of $304 million was primarily due
to the higher realized gold price6, combined with increased gold sales volumes. These impacts were slightly offset by an increase in gold TCC/oz6. Operating cash flow was also negatively impacted by an increase in cash taxes paid and higher interest paid as a result of the timing of
semi-annual interest payments on our bonds, which primarily occur in the second and fourth
|
|
|
|
|
|
|
|
|
BARRICK YEAR-END 2025 |
53 |
MANAGEMENT’S DISCUSSION AND
ANALYSIS |
quarters. These results were further impacted by an unfavorable working capital movement, mainly in accounts
receivable, partially offset by a favorable movement in inventory.
Cash inflows
from investing activities in Q4 2025 were $278 million, compared to outflows of $861 million in Q3 2025. The increased inflow of $1,139 million was primarily due to proceeds from the sale of non-current assets of $1,163 million, which includes our
Hemlo gold mine, our interest in the Tongon gold mine and the Alturas project. This was partially offset by an increase in capital expenditures primarily due to higher project capital expenditures6 relating to the Lumwana Super Pit Expansion project, combined with higher minesite sustaining capital expenditures6 at Pueblo Viejo as a result of restoring fleet reliability and increased activities at the Llagal
TSF.
Net financing cash outflows for Q4 2025 amounted to $1,368 million, compared
to $1,295 million in Q3 2025. The increased outflow of $73 million was primarily due to higher net disbursements to non-controlling interests, primarily to Newmont in relation to their interests in NGM and Pueblo Viejo, and higher dividends paid as
the Board increased the quarterly base dividend by 25% to $0.125 per share in Q4 2025. This was partially offset by lower repurchases of shares under our share buyback program compared to Q3 2025.
2025 compared to 2024
In 2025, we generated $7,689 million in operating cash flow, compared to $4,491 million in 2024. The increase of $3,198 million was primarily due to
higher realized gold and copper prices6, combined with lower copper C1 cash costs/lb6. These impacts were partially offset by lower gold sales volumes and an increase in gold TCC/oz6. Operating cash
flow was further impacted by a favorable movement in working capital, mainly in inventory, VAT receivable and other current liabilities, partially
offset by an unfavorable movement in other current assets and accounts payable. These favourable impacts were partially offset by higher cash taxes paid.
Cash outflows from investing activities for 2025 were $1,236 million compared to $2,764 million in 2024. The decreased outflow of $1,528 million was
primarily due to proceeds from the sale of non-current assets of $2,162 million, which includes our interest in the Donlin project, our Hemlo gold mine, our interest in the Tongon gold mine and the Alturas project. This was partially offset by
increased capital expenditures as a result of higher project capital
expenditures6 mainly related to costs being capitalized at Reko Diq as the feasibility study was completed in Q4 2024 and at Lumwana on the Super Pit Expansion
project, partially offset by lower minesite sustaining capital
expenditures6 mainly at Loulo-Gounkoto as operations were temporarily suspended and the mine was subsequently placed under a temporary provisional administration
until December 16, 2025.
Net financing cash outflows for 2025 amounted to $3,823
million, compared to $1,795 million in 2024. The higher outflow of $2,028 million is primarily due to increased repurchases of shares under our share buyback program in 2025, combined with higher net disbursements to non-controlling interests,
primarily to Newmont in relation to their interests in NGM and Pueblo Viejo. The increase in net financing cash flows was further impacted by higher dividends paid as Q3 and Q4 2025 included a $0.05 performance dividend, reflecting our increased
cash position, and the Board increased the quarterly base dividend by 25% to $0.125 per share in Q4 2025.
|
|
|
|
|
|
|
|
|
|
|
|
|
|
|
Summary of Financial Instrumentsa |
|
|
|
|
| As at December 31, 2025 |
|
|
|
|
|
|
|
|
| Financial Instrument |
Principal/Notional
Amount |
Associated Risks |
|
|
|
|
n Interest
rate |
| Cash and equivalents |
|
$6,706 |
|
million |
n
Credit |
|
|
|
|
|
n
Credit |
| Accounts receivable |
|
$791 |
|
million |
n
Market |
|
|
|
|
n Interest
rate |
| Notes receivable |
|
$247 |
|
million |
n
Credit |
|
|
|
|
n Interest
rate |
| Kibali joint venture
receivable |
|
$333 |
|
million |
n
Credit |
|
|
|
|
n Interest
rate |
| Norte Abierto joint venture partner
receivable |
|
$77 |
|
million |
n
Credit |
|
|
|
|
n Interest
rate |
| Restricted cash |
|
$101 |
|
million |
n
Credit |
|
|
|
|
n
Liquidity |
| Contingent
consideration |
|
$169 |
|
million |
n
Market |
| Other
assets |
|
$218 |
|
million |
n
Liquidity |
| Other
investments |
|
$131 |
|
million |
n
Liquidity |
| Accounts
payable |
|
$1,859 |
|
million |
n
Liquidity |
| Debt
|
|
$4,724 |
|
million |
n Interest
rate |
|
|
|
|
n
Liquidity |
| Derivative
liabilities |
|
$386 |
|
million |
n
Market |
| Other
liabilities |
|
$803 |
|
million |
n
Liquidity |
| Restricted
share units |
|
$119 |
|
million |
n
Market |
| Deferred share units |
|
$28 |
|
million
|
n
Market |
|
|
|
|
|
|
|
|
|
|
|
|
|
|
|
|
|
|
|
|
|
|
|
|
|
|
|
|
|
|
|
|
|
|
|
|
|
|
|
|
|
|
|
|
|
|
|
|
|
|
a.Refer to notes 25, 26 and 28 to the Financial Statements for more information regarding financial instruments, fair value
measurements and financial risk management, respectively.
|
|
|
|
|
|
|
|
|
BARRICK YEAR-END 2025 |
54 |
MANAGEMENT’S DISCUSSION AND
ANALYSIS |
Commitments and
Contingencies
Litigation and Claims
We are currently subject to various litigation proceedings as disclosed in note 36 to the Financial Statements, and we may be involved in disputes
with other parties in the future that may result in litigation. If we are unable to resolve these disputes favorably, it may have a material adverse impact on our financial condition, cash flow and results of
operations.
Contractual Obligations and Commitments
In the normal course of business, we enter into contracts that give rise to commitments for future minimum payments. The following table summarizes the remaining contractual maturities of our financial liabilities and operating and capital commitments shown on an undiscounted
basis:
|
|
|
|
|
|
|
|
|
|
|
|
|
|
|
|
|
|
|
|
|
|
|
|
| ($ millions) |
Payments due as at December 31, 2025 |
| |
2026 |
2027 |
2028 |
2029 |
2030 |
2031 and thereafter |
Total |
Debta |
|
|
|
|
|
|
|
| Repayment of principal |
47 |
|
0 |
|
0 |
|
0 |
|
0 |
|
4,630 |
|
4,677 |
|
| Capital leases |
9 |
|
9 |
|
5 |
|
4 |
|
3 |
|
17 |
|
47 |
|
| Interest |
283 |
|
280 |
|
279 |
|
279 |
|
279 |
|
2,394 |
|
3,794 |
|
Provisions for environmental rehabilitationb |
166 |
|
121 |
|
87 |
|
83 |
|
68 |
|
1,915 |
|
2,440 |
|
|
|
|
|
|
|
|
|
| Restricted share units |
93 |
|
26 |
|
0 |
|
0 |
|
0 |
|
0 |
|
119 |
|
| Pension benefits and other post-retirement benefits |
5 |
|
5 |
|
5 |
|
4 |
|
4 |
|
72 |
|
95 |
|
|
|
|
|
|
|
|
|
|
|
|
|
|
|
|
|
Purchase obligations for supplies
and consumablesc |
1,157 |
|
302 |
|
199 |
|
151 |
|
143 |
|
1,885 |
|
3,837 |
|
Capital commitmentsd |
828 |
|
947 |
|
301 |
|
208 |
|
45 |
|
0 |
|
2,329 |
|
Social development costse |
62 |
|
22 |
|
24 |
|
16 |
|
8 |
|
54 |
|
186 |
|
Other obligationsf |
68 |
|
65 |
|
63 |
|
59 |
|
60 |
|
491 |
|
806 |
|
| Total |
2,718 |
|
1,777 |
|
963 |
|
804 |
|
610 |
|
11,458 |
|
18,330 |
|
a.Debt and
Interest: Our debt obligations do not include any subjective acceleration clauses or other clauses that enable the holder of the debt to call for early repayment, except in the event that we breach any of the terms and conditions of the debt or
for other customary events of default. We are not required to post any collateral under any debt obligations. Projected interest payments on variable rate debt were based on interest rates in effect at December 31, 2025. Interest is calculated on
our long-term debt obligations using both fixed and variable rates.
b.Provisions for
environmental rehabilitation: Amounts presented in the table represent the undiscounted uninflated future payments for the expected cost of provisions for environmental
rehabilitation.
c.Purchase obligations for supplies and consumables: Includes commitments related to new purchase obligations to secure
supplies of consumables such as LNG, acid, tires and cyanide for our production process and spares for heavy mining equipment.
d.Capital
commitments: Purchase obligations for capital expenditures include only those items where binding commitments have been entered into.
e.Social
development costs: Includes a commitment of $14 million in 2031 and thereafter related to the funding of a power transmission line in Argentina.
f.Other
obligations includes the Pueblo Viejo joint venture partner shareholder loan, the deposit on the Pascua-Lama silver sale agreement with Wheaton Precious Metals Corp. due in 2039, and minimum royalty payments.
|
|
|
|
|
|
|
|
|
BARRICK YEAR-END 2025 |
55 |
MANAGEMENT’S DISCUSSION AND
ANALYSIS |
Review of Quarterly Results
Quarterly Informationa
|
|
|
|
|
|
|
|
|
|
|
|
|
|
|
|
|
|
|
|
|
|
|
|
|
|
|
|
|
|
| |
2025 |
|
2024 |
| ($ millions, except where indicated) |
Q4 |
Q3 |
Q2 |
Q1 |
|
Q4 |
Q3 |
Q2 |
Q1 |
| Revenues |
5,997 |
|
4,148 |
|
3,681 |
|
3,130 |
|
|
3,645 |
|
3,368 |
|
3,162 |
|
2,747 |
|
Realized price per ounce –
goldb |
4,177 |
|
3,457 |
|
3,295 |
|
2,898 |
|
|
2,657 |
|
2,494 |
|
2,344 |
|
2,075 |
|
Realized price per pound – copperb |
5.42 |
|
4.39 |
|
4.36 |
|
4.51 |
|
|
3.96 |
|
4.27 |
|
4.53 |
|
3.86 |
|
| Cost of sales |
2,712 |
|
1,890 |
|
1,878 |
|
1,785 |
|
|
1,995 |
|
2,051 |
|
1,979 |
|
1,936 |
|
| Net earnings |
2,406 |
|
1,302 |
|
811 |
|
474 |
|
|
996 |
|
483 |
|
370 |
|
295 |
|
Per
share (dollars)c |
1.43 |
|
0.76 |
|
0.47 |
|
0.27 |
|
|
0.57 |
|
0.28 |
|
0.21 |
|
0.17 |
|
Adjusted net earningsb |
1,754 |
|
982 |
|
800 |
|
603 |
|
|
794 |
|
529 |
|
557 |
|
333 |
|
Per
share (dollars)b,c |
1.04 |
|
0.58 |
|
0.47 |
|
0.35 |
|
|
0.46 |
|
0.30 |
|
0.32 |
|
0.19 |
|
| Operating cash flow |
2,726 |
|
2,422 |
|
1,329 |
|
1,212 |
|
|
1,392 |
|
1,180 |
|
1,159 |
|
760 |
|
Consolidated capital
expendituresd |
1,107 |
|
943 |
|
934 |
|
837 |
|
|
891 |
|
736 |
|
819 |
|
728 |
|
Free cash flowb |
1,619 |
|
1,479 |
|
395 |
|
375 |
|
|
501 |
|
444 |
|
340 |
|
32 |
|
Attributable
free cash flowb |
1,060
|
|
1,154
|
|
212
|
|
411
|
|
|
505
|
|
304
|
|
285
|
|
(3)
|
|
a.Sum of all the quarters may not add up to the annual total due to
rounding.
b.Further information on these non-GAAP financial measures, including detailed reconciliations, is included on pages 57 to 69 of this
MD&A.
c.Calculated using weighted average number of shares outstanding under the basic method of earnings per
share.
d.
Amounts presented on a consolidated cash
basis.
Our
recent financial results reflect our emphasis on cost discipline, an agile management structure that empowers our site-based leadership teams and a portfolio of Tier One Gold Assets1. This, combined with a significant increase in the gold price and ongoing strength in the copper price, has resulted in strong operating cash flows
over the past several quarters and record high free cash flow6 for 2025. The positive operating cash flow generated has allowed us to continue to reinvest in our business including our key growth projects,
maintain a strong balance sheet and materially increase returns to shareholders through share buybacks and a rising dividend.
In addition to the strength in metal prices, net earnings has also been impacted by the following items in each quarter, which have been excluded
from adjusted net earnings6. In 2025, we recorded a net loss of $625 million on the deconsolidation of Loulo-Gounkoto following the change of control after it was placed under
a temporary
provisional administration on June 16, 2025 and subsequent accounting impact of regaining control on December 16, 2025 (refer to note 35 of the
Financial Statements for further details), which impacted Q2, Q3 and Q4 of 2025. In addition, in Q4 2025, we recorded a gain on the sale of non-current assets of our Hemlo gold mine ($545 million), our interest in the Tongon gold mine ($134
million) and the Alturas project ($53 million). In Q2 2025, we recorded a gain of $745 million on the sale of our 50% interest in the Donlin Gold project. In Q4 2024, we recorded non-current asset impairment reversals of $655 million at Lumwana
and of $437 million at Veladero. In addition, we recorded a goodwill impairment of $484 million related to Loulo-Gounkoto. In Q2 2024, we recorded a provision following the proposed settlement of the Zaldívar Tax Assessments in Chile (refer to
note 36 of the Financial Statements).
Internal Control Over Financial Reporting and Disclosure Controls and Procedures
Management is responsible for establishing and maintaining adequate internal control over financial reporting and disclosure controls and
procedures. Internal control over financial reporting is a framework designed to provide reasonable assurance regarding the reliability of financial reporting and the preparation of financial statements for external purposes in accordance with IFRS.
The Company’s internal control over financial reporting framework includes those policies and procedures that: (i) pertain to the maintenance of records that, in reasonable detail, accurately and fairly reflect the transactions and
dispositions of the assets of the Company; (ii) provide reasonable assurance that transactions are recorded as necessary to permit preparation of financial statements in accordance with IFRS, and that receipts and expenditures of the
Company are being made only in accordance with authorizations of management and directors of the
Company; and (iii) provide reasonable assurance regarding prevention or timely detection of unauthorized acquisition, use or disposition of
the Company’s assets that could have a material effect on the Company’s consolidated financial statements.
Disclosure controls and procedures form a broader framework designed to provide reasonable assurance that other financial information disclosed
publicly fairly presents in all material respects the financial condition, results of operations and cash flows of the Company for the periods presented in this MD&A and Barrick’s Annual Report. The Company’s disclosure controls and
procedures framework includes processes designed to ensure that material information relating to the Company, including its consolidated subsidiaries, is made known to management by others within those entities to allow timely decisions regarding
required disclosure.
|
|
|
|
|
|
|
|
|
BARRICK YEAR-END 2025 |
56 |
MANAGEMENT’S DISCUSSION AND
ANALYSIS |
Together, the internal control over financial reporting and disclosure controls and procedures
frameworks provide internal control over financial reporting and disclosure. Due to its inherent limitations, internal control over financial reporting and disclosure may not prevent or detect all misstatements. Further, the effectiveness of
internal control is subject to the risk that controls may become inadequate because of changes in conditions, or that the degree of compliance with policies or procedures may change.
There were no changes in the Company’s internal control over financial reporting during the year ended December 31, 2025 that have materially
affected, or are reasonably likely to materially affect, the Company’s internal control over financial reporting.
The management of Barrick, at the direction of our Group Chief Operating Officer and Interim President and Chief Executive Officer, and Senior
Executive Vice-
President and Chief Financial Officer, evaluated the effectiveness of the design and operation of internal control over financial reporting as of the
end of the period covered by this report based on the framework and criteria established in Internal Control – Integrated Framework (2013) as issued by the Committee of Sponsoring Organizations of the Treadway Commission. Based on that
evaluation, management concluded that the Company’s internal control over financial reporting was effective as at December 31, 2025.
Barrick’s annual management report on internal control over financial reporting and the integrated audit report of Barrick’s auditors for
the year ended December 31, 2025 will be included in Barrick’s 2025 Annual Report and its 2025 Form 40-F/Annual Information Form to be filed with the US Securities and Exchange Commission and Canadian provincial securities regulatory
authorities.
IFRS Critical Accounting Policies and Accounting Estimates
Management has discussed the development and selection of our critical accounting estimates with the Audit & Risk Committee of the Board of
Directors, and the Audit & Risk Committee has reviewed the disclosure relating to such estimates in conjunction with its review of this MD&A. The accounting policies and methods we utilize determine how we report our financial condition and
results of operations, and they may require management to make estimates or rely on assumptions about matters that are inherently uncertain. The consolidated financial statements have been prepared in accordance with IFRS. Our material accounting
policies are disclosed in note 2 to the Financial Statements, including a summary of current and future changes in accounting
policies.
Critical Accounting Estimates and Judgments
Certain accounting estimates have been identified as being “critical” to the presentation of our financial condition and results of
operations because they require us to make subjective and/or complex judgments about matters that are inherently uncertain; or there is a reasonable likelihood that materially different amounts could be reported under different conditions or
using different assumptions and estimates. Our significant accounting judgments, estimates and assumptions are disclosed in note 3 to the accompanying Financial
Statements.
Non-GAAP Financial
Measures
Adjusted Net Earnings and Adjusted Net Earnings per Share
Adjusted net earnings is a non-GAAP financial measure which excludes the following from net
earnings:
■Impairment charges (reversals) related to intangibles, goodwill, property, plant and equipment, and
investments;
■Acquisition/disposition
gains/losses;
■Foreign currency translation
gains/losses;
■Significant tax adjustments;
■Other
items that are not indicative of the underlying operating performance of our core mining business; and
■Tax
effect and non-controlling interest of the above items.
Management uses this measure internally to
evaluate our underlying operating performance for the reporting periods presented and to assist with the planning and forecasting of future operating results. Management believes that adjusted net earnings is a useful measure of our performance
because impairment charges, acquisition/disposition gains/losses and significant tax adjustments do not reflect the underlying operating performance of our core mining business and are not necessarily indicative of future operating results.
Furthermore, foreign currency translation gains/losses are not necessarily reflective of the underlying operating results for the reporting periods presented. The
tax effect and non-controlling interest of the adjusting items are also excluded to reconcile the amounts to Barrick’s share on a post-tax
basis, consistent with net earnings.
As noted, we use this measure for internal
purposes. Management’s internal budgets and forecasts and public guidance do not reflect the types of items we adjust for. Consequently, the presentation of adjusted net earnings enables investors and analysts to better understand the
underlying operating performance of our core mining business through the eyes of management. Management periodically evaluates the components of adjusted net earnings based on an internal assessment of performance measures that are useful for
evaluating the operating performance of our business segments and a review of the non-GAAP financial measures used by mining industry analysts and other mining companies.
Adjusted net earnings is intended to provide additional information only and does not have any standardized definition under IFRS and should not be
considered in isolation or as a substitute for measures of performance prepared in accordance with IFRS. The measures are not necessarily indicative of operating profit or cash flow from operations as determined under IFRS. Other companies may
calculate these measures differently. The following table reconciles these non-GAAP financial measures to the most directly comparable IFRS
measure.
|
|
|
|
|
|
|
|
|
BARRICK YEAR-END 2025 |
57 |
MANAGEMENT’S DISCUSSION AND
ANALYSIS |
Reconciliation of Net Earnings to Net Earnings per Share, Adjusted Net Earnings and Adjusted Net Earnings per
Share
|
|
|
|
|
|
|
|
|
|
|
|
|
|
|
|
|
|
|
|
|
|
|
For the three months ended |
|
|
For the years ended |
| ($ millions, except per share amounts in
dollars) |
12/31/25
|
9/30/25 |
|
|
12/31/25
|
12/31/24 |
12/31/23 |
| Net earnings
attributable to equity holders of the Company |
2,406 |
|
1,302 |
|
|
|
4,993 |
|
2,144 |
|
1,272 |
|
Impairment
(reversals) charges related to non-current assetsa |
5 |
|
3 |
|
|
|
12 |
|
(457) |
|
312 |
|
Acquisition/disposition
gainsb |
(1,146) |
|
(250) |
|
|
|
(1,107) |
|
(24) |
|
(364) |
|
| Loss on currency
translation |
6 |
|
(3) |
|
|
|
3 |
|
39 |
|
93 |
|
Significant tax
adjustmentsc |
80 |
|
(119) |
|
|
|
(89) |
|
137 |
|
220 |
|
Other
expense adjustmentsd |
559 |
|
47 |
|
|
|
823 |
|
249 |
|
96 |
|
Non-controlling intereste |
(101) |
|
0 |
|
|
|
(116) |
|
(170) |
|
(98) |
|
Tax
effecte |
(55) |
|
2 |
|
|
|
(380) |
|
295 |
|
(64) |
|
| Adjusted net
earnings |
1,754 |
|
982 |
|
|
|
4,139 |
|
2,213 |
|
1,467 |
|
Net earnings per sharef |
1.43
|
|
0.76
|
|
|
|
2.93
|
|
1.22
|
|
0.72
|
|
Adjusted
net earnings per sharef |
1.04 |
|
0.58 |
|
|
|
2.42 |
|
1.26 |
|
0.84 |
|
a.There were no
significant impairment charges or reversals in 2025. Net impairment reversals for 2024 mainly relate to long-lived asset impairment reversals at Lumwana and Veladero, partially offset by a goodwill impairment at
Loulo-Gounkoto.
b.Acquisition/disposition gains for 2025 relate to gain on sale of our 50% interest in the Donlin Gold project in Q2 2025, and
sale of our Hemlo gold mine, our interest in the Tongon gold mine and the Alturas project, all occurring in Q4 2025. Q4 2025 was further impacted by the accounting impact of regaining control of the Loulo-Gounkoto complex on December 16, 2025, which
largely offset the losses recognized earlier in 2025 relating to the deconsolidation and recognition of an investment at fair value following the change of control after it was placed under a temporary provisional administration on June 16, 2025.
The acquisition/disposition gains in Q3 2025 mainly related to the revaluation of our 80% equity investment in Loulo-Gounkoto, as it was deconsolidated and an investment at fair value was recognized in Q2 2025, as described above.
c.Significant tax adjustments in Q4 2025 include the resolution of uncertain tax positions, the impact of prior year adjustments
and the recognition of deferred tax assets. Significant tax adjustments in 2025 primarily relate to the foreign currency remeasurement of tax balances, the resolution of uncertain tax positions and the recognition of deferred tax assets. For Q3
2025, significant tax adjustments include the foreign currency remeasurement of deferred tax balances and the recognition of deferred tax assets. Significant tax adjustments for 2024 primarily relate to the resolution of uncertain tax positions;
the impact of prior year adjustments; the impact of nondeductible foreign exchange losses; and the recognition and derecognition of deferred tax assets.
d.Other expense
adjustments for Q4 2025 and 2025 mainly relate to the settlement payment to the Government of Mali in November 2025 and the fair value increment on inventory resulting from the purchase price allocation when we regained control of Loulo-Gounkoto.
2025 was further impacted by reduced operations costs at Loulo-Gounkoto. Other expense adjustments for 2024 mainly relate to a payment to the Government of Mali to advance negotiations, a customs and royalty settlement at Tongon, interest and
penalties recognized following the settlement of the Zaldívar Tax Assessments in Chile, a provision made relating to a legacy mine site operated by Homestake Mining Company that was closed prior to the 2001 acquisition by Barrick, and an
accrual relating to the road construction in Tanzania per our community investment obligations under the Twiga partnership.
e.Non-controlling interest
for 2025 primarily relates to other expense adjustments and tax effect for 2025 primarily relates to acquisition/disposition gains.
f.Calculated
using weighted average number of shares outstanding under the basic method of earnings per
share.
Free Cash Flow and Attributable Free Cash
Flow
Free
cash flow is a non-GAAP financial measure that deducts capital expenditures from net cash provided by operating activities. Attributable free cash flow starts with free cash flow and adds our attributable share of free cash flow from our equity
investees and subtracts the free cash flow attributable to the non-controlling interests. Management believes these to be useful indicators of our ability to operate without reliance on additional borrowing or usage of existing
cash.
Free cash flow and attributable free cash flow are intended to provide
additional information only and do not
have any standardized definition under IFRS, and should not be considered in isolation or as a substitute for measures of performance prepared in
accordance with IFRS. These measures are not necessarily indicative of operating profit or cash flow from operations as determined under IFRS. Other companies may calculate these measures differently. The following table reconciles this non-GAAP
financial measure to the most directly comparable IFRS measure.
Reconciliation of Net Cash Provided by Operating Activities to Free Cash Flow and Attributable Free Cash Flow
|
|
|
|
|
|
|
|
|
|
|
|
|
|
|
|
|
|
|
|
|
|
|
For the three months ended |
|
|
For the years ended |
| ($ millions) |
12/31/25
|
9/30/25 |
|
|
12/31/25
|
12/31/24 |
12/31/23 |
| Net cash provided by
operating activities |
2,726 |
|
2,422 |
|
|
|
7,689 |
|
4,491 |
|
3,732 |
|
| Capital
expenditures |
(1,107) |
|
(943) |
|
|
|
(3,821) |
|
(3,174) |
|
(3,086) |
|
| Consolidated free cash
flow |
1,619 |
|
1,479 |
|
|
|
3,868 |
|
1,317 |
|
646 |
|
| Free
cash flow applicable to equity investees |
172
|
|
191
|
|
|
|
585
|
|
553
|
|
465
|
|
| Non-controlling
interests |
(731) |
|
(516) |
|
|
|
(1,616) |
|
(779) |
|
(712) |
|
| Attributable free cash flow |
1,060 |
|
1,154 |
|
|
|
2,837 |
|
1,091 |
|
399 |
|
|
|
|
|
|
|
|
|
|
BARRICK YEAR-END 2025 |
58 |
MANAGEMENT’S DISCUSSION AND
ANALYSIS |
Capital
Expenditures
Capital expenditures are classified into minesite sustaining capital expenditures or project capital expenditures depending on the nature of the
expenditure. Minesite sustaining capital expenditures is the capital spending required to support current production levels. Project capital expenditures represent the capital spending at new projects and major, discrete projects at existing
operations intended to increase net present value through higher production or longer mine life. Management believes this to be a useful indicator of the purpose of capital expenditures
and this distinction is an input into the calculation of all-in sustaining costs per
ounce/pound.
Classifying capital expenditures is intended to provide
additional information only and does not have any standardized definition under IFRS, and should not be considered in isolation or as a substitute for measures of performance prepared in accordance with IFRS. Other companies may calculate these
measures differently. The following table reconciles these non-GAAP financial measures to the most directly comparable IFRS measure.
Reconciliation of the Classification of Capital Expenditures
|
|
|
|
|
|
|
|
|
|
|
|
|
|
|
|
|
|
|
|
|
|
|
For the three months ended |
|
|
For the years ended |
| ($ millions) |
12/31/25
|
9/30/25 |
|
|
12/31/25
|
12/31/24 |
12/31/23 |
| Minesite sustaining
capital expenditures |
458 |
|
395 |
|
|
|
1,896 |
|
2,217 |
|
2,076 |
|
| Project capital
expenditures |
630 |
|
532 |
|
|
|
1,870 |
|
924 |
|
969 |
|
| Capitalized interest |
19 |
|
16 |
|
|
|
55 |
|
33 |
|
41 |
|
| Total consolidated capital expenditures |
1,107 |
|
943 |
|
|
|
3,821 |
|
3,174 |
|
3,086 |
|
Total cash costs per ounce, All-in sustaining costs per ounce, C1 cash costs per pound and All-in
sustaining costs per pound
TCC/oz and AISC/oz are non-GAAP financial measures which are calculated based on the definition published by the WGC (a market development
organization for the gold industry comprised of and funded by gold mining companies from around the world, including Barrick). The WGC is not a regulatory organization. Management uses these measures to monitor the performance of our gold mining
operations and its ability to generate positive cash flow, both on an individual site basis and an overall gold operations basis.
TCC/oz start with our cost of sales related to gold production and removes depreciation, the non-controlling interest of cost of sales and costs
allocated to by-products. AISC/oz start with TCC/oz and includes sustaining capital expenditures, sustaining leases, general and administrative costs, minesite exploration and evaluation costs related to the current mine plan and reclamation
cost accretion and amortization. These additional costs reflect the expenditures made to maintain current production levels.
We believe that our use of TCC/oz and AISC/oz will assist analysts, investors and other stakeholders of Barrick in understanding the costs
associated with producing gold, understanding the economics of gold mining, assessing our operating performance and also our ability to generate free cash flow from the gold operations portion of our business. Due to the capital-intensive nature of
the industry and the long useful lives over which these items are depreciated, there can be a significant timing difference between net earnings calculated in accordance with IFRS and the amount of free cash flow that is generated by a mine and
therefore we believe these measures are useful non-GAAP operating metrics and supplement our IFRS disclosures. These measures are not
representative of all of our cash expenditures as they do not include income tax payments, interest costs or dividend payments. These measures do not
include depreciation or amortization.
TCC/oz and AISC/oz are intended to
provide additional information only and do not have standardized definitions under IFRS and should not be considered in isolation or as a substitute for measures of performance prepared in accordance with IFRS. These measures are not equivalent to
net income or cash flow from operations as determined under IFRS. Although the WGC has published a standardized definition, other companies may calculate these measures differently.
C1 cash costs/lb and AISC/lb are non-GAAP financial measures related to our copper mine operations. We believe that C1 cash costs/lb
enables investors to better understand the performance of our copper operations in comparison to other copper producers who present results on a similar basis. C1 cash costs/lb excludes royalties and production taxes and non-routine charges as
they are not direct production costs. AISC/lb is similar to the gold AISC metric and management uses this to better evaluate the costs of copper production. We believe this measure enables investors to better understand the operating performance
of the copper portion of our business as this measure reflects all of the sustaining expenditures incurred in order to produce copper. AISC/lb includes C1 cash costs, sustaining capital expenditures, sustaining leases, general and administrative
costs, minesite exploration and evaluation costs, royalties and production taxes, reclamation cost accretion and amortization and write-downs taken on inventory to net realizable
value.
|
|
|
|
|
|
|
|
|
BARRICK YEAR-END 2025 |
59 |
MANAGEMENT’S DISCUSSION AND
ANALYSIS |
Reconciliation of Gold Cost of Sales to Total cash costs and All-in sustaining costs, including on a per ounce
basis
|
|
|
|
|
|
|
|
|
|
|
|
|
|
|
|
|
|
|
|
|
|
|
|
|
|
|
For the three months ended |
|
For the years ended |
| ($ millions, except per ounce
information in dollars) |
Footnote |
12/31/25
|
9/30/25 |
|
|
12/31/25
|
12/31/24 |
12/31/23 |
| Cost of sales applicable to gold
production |
|
2,423 |
|
1,690 |
|
|
|
7,357 |
|
7,226 |
|
7,178 |
|
| Depreciation |
|
(503) |
|
(384) |
|
|
|
(1,588) |
|
(1,641) |
|
(1,756) |
|
| Total cash cost applicable to equity method
investments |
|
111 |
|
114 |
|
|
|
435 |
|
316 |
|
260 |
|
| Costs allocated to
by-products |
|
(130) |
|
(80) |
|
|
|
(334) |
|
(247) |
|
(252) |
|
|
|
|
|
|
|
|
|
|
|
|
|
|
|
|
|
|
|
| Other |
a |
(258) |
|
5 |
|
|
|
(237) |
|
14 |
|
18 |
|
| Non-controlling
interests |
b |
(487) |
|
(393) |
|
|
|
(1,655) |
|
(1,623) |
|
(1,578) |
|
| Total cash costs |
|
1,156 |
|
952 |
|
|
|
3,978 |
|
4,045 |
|
3,870 |
|
| General &
administrative costs |
|
64 |
|
77 |
|
|
|
222 |
|
115 |
|
126 |
|
| Minesite exploration and evaluation costs |
c |
8 |
|
7 |
|
|
|
27 |
|
37 |
|
40 |
|
| Minesite sustaining capital
expenditures |
d |
458 |
|
395 |
|
|
|
1,896 |
|
2,217 |
|
2,076 |
|
| Sustaining leases |
|
4 |
|
7 |
|
|
|
26 |
|
30 |
|
30 |
|
| Rehabilitation - accretion
and amortization (operating sites) |
e |
16 |
|
17 |
|
|
|
66 |
|
66 |
|
63 |
|
| Non-controlling interest, copper operations and
other |
f |
(191) |
|
(171) |
|
|
|
(787) |
|
(874) |
|
(824) |
|
| All-in
sustaining costs |
|
1,515
|
|
1,284
|
|
|
|
5,428
|
|
5,636
|
|
5,381
|
|
|
|
|
|
|
|
|
|
|
|
|
|
|
|
|
|
|
|
|
|
|
|
|
|
|
|
|
|
|
|
|
|
|
|
|
|
|
|
|
|
|
|
|
|
|
|
|
|
|
|
|
|
|
|
|
|
|
|
|
|
|
|
|
| Ounces sold - attributable basis
(koz) |
g |
960 |
|
837 |
|
|
|
3,318 |
|
3,798 |
|
4,024 |
|
| COS/oz
|
h,i
|
1,904
|
|
1,562
|
|
|
|
1,697
|
|
1,442
|
|
1,334
|
|
| TCC/oz |
i |
1,205 |
|
1,137 |
|
|
|
1,199 |
|
1,065 |
|
960 |
|
|
|
|
|
|
|
|
|
|
| AISC/oz
|
i
|
1,581
|
|
1,538
|
|
|
|
1,637
|
|
1,484
|
|
1,335
|
|
|
|
|
|
|
|
|
|
|
|
|
|
|
|
|
|
|
|
|
|
|
|
|
|
|
|
|
a.Other -
Other adjustments for Q4 2025 and 2025 include the removal of the fair value increment on inventory resulting from the purchase price
allocation when we regained control of Loulo-Gounkoto of $283 million and $283 million, respectively (Q3 2025: $nil; 2024: $nil; 2023:
$nil).
b.Non-controlling
interests - Non-controlling interests include non-controlling interests related to gold production of $741 million and $2,308
million, respectively, for Q4 2025 and 2025; (Q3 2025: $540 million; 2024: $2,189 million; 2023: $2,192 million). Non-controlling interests include NGM, Pueblo Viejo, Loulo-Gounkoto, Tongon up until its sale on December
1, 2025, North Mara and Bulyanhulu. Refer to note 5 to the Financial Statements for further information.
c.Exploration
and evaluation costs - Exploration, evaluation and project expenses are presented as minesite sustaining if it supports current mine
operations and project if it relates to future projects. Refer to page 49 of this MD&A.
d.Capital
expenditures - Capital expenditures are related to our gold sites only and are split between minesite sustaining and project capital
expenditures.
e.Rehabilitation -
accretion and amortization - Includes depreciation on the assets related to rehabilitation provisions of our gold operations and
accretion on the rehabilitation provisions of our gold operations, split between operating and non-operating
sites.
f.Non-controlling
interest and copper operations - Removes general & administrative costs related to non-controlling interests and copper based
on a percentage allocation of revenue. Also removes exploration, evaluation and project expenses, rehabilitation costs and capital expenditures incurred by our copper sites and the non-controlling interests of NGM, Pueblo Viejo, Loulo-Gounkoto,
Tongon up until its sale on December 1, 2025, North Mara and Bulyanhulu operating segments. It also includes capital expenditures applicable to our equity method investments in Kibali and Porgera. Figures remove the impact of Pierina up until
December 31, 2023. The impact is summarized as the following:
|
|
|
|
|
|
|
|
|
|
|
|
|
|
|
|
|
|
|
($ millions) |
For the three months ended |
For the years ended |
| Non-controlling
interest, copper operations and other |
12/31/25
|
9/30/25 |
|
12/31/25
|
12/31/24 |
12/31/23 |
General & administrative costs |
(10) |
|
(13) |
|
|
(35) |
|
(14) |
|
(9) |
|
Minesite
exploration and evaluation costs |
(3) |
|
(1) |
|
|
(7) |
|
(10) |
|
(14) |
|
Rehabilitation - accretion and
amortization (operating sites) |
(5) |
|
(5) |
|
|
(21) |
|
(21) |
|
(21) |
|
| Minesite sustaining capital
expenditures |
(173) |
|
(152) |
|
|
(724) |
|
(829) |
|
(780) |
|
All-in sustaining costs total |
(191) |
|
(171) |
|
|
(787) |
|
(874) |
|
(824) |
|
|
|
|
|
|
|
|
|
|
|
|
|
|
|
|
|
|
|
|
|
|
g.Ounces sold -
attributable basis - Excludes Pierina, which was producing incidental ounces until December 31, 2023 while in closure. It also excludes
Long Canyon which is producing residual ounces from the leach pad while in care and maintenance.
h.COS/oz -
Gold COS/oz is calculated as cost of sales across our gold operations (excluding sites in closure or care and maintenance) divided
by ounces sold (both on an attributable basis using Barrick’s ownership share).
i.Per ounce
figures - COS/oz, TCC/oz and AISC/oz may not calculate based on amounts presented in this table due to
rounding.
|
|
|
|
|
|
|
|
|
BARRICK YEAR-END 2025 |
60 |
MANAGEMENT’S DISCUSSION AND
ANALYSIS |
Reconciliation of Gold Cost of Sales to Total cash costs and All-in sustaining costs, including on a per ounce basis, by operating
segment
|
|
|
|
|
|
|
|
|
|
|
|
|
|
|
|
|
|
|
|
|
|
|
|
|
|
|
|
|
| ($ millions, except per ounce information in
dollars) |
|
For the three months ended 12/31/25 |
| |
Footnote |
Carlin |
Cortez |
Turquoise Ridge |
|
Phoenix |
Nevada
Gold Minesa |
Hemlo
b |
|
Pueblo Viejo |
| Cost of sales applicable to gold
production |
|
642 |
|
355 |
|
241 |
|
|
79 |
|
1,318 |
|
44 |
|
|
264 |
|
| Depreciation |
|
(164) |
|
(86) |
|
(62) |
|
|
(15) |
|
(327) |
|
(1) |
|
|
(82) |
|
| Costs allocated to
by-products |
|
(2) |
|
(1) |
|
(1) |
|
|
(68) |
|
(72) |
|
0 |
|
|
(17) |
|
|
|
|
|
|
|
|
|
|
|
|
|
|
|
|
|
|
|
|
|
|
|
| Other |
c |
(2) |
|
(4) |
|
0 |
|
|
9 |
|
3 |
|
0 |
|
|
0 |
|
| Non-controlling
interests |
|
(182) |
|
(103) |
|
(69) |
|
|
(2) |
|
(356) |
|
0 |
|
|
(67) |
|
| Total cash
costs |
|
292
|
|
161
|
|
109
|
|
|
3
|
|
566
|
|
43
|
|
|
98
|
|
| General &
administrative costs |
|
0
|
|
0
|
|
0
|
|
|
0
|
|
0
|
|
0
|
|
|
0
|
|
| Minesite exploration and
evaluation costs |
d |
5 |
|
2 |
|
0 |
|
|
0 |
|
8 |
|
0 |
|
|
0 |
|
| Minesite sustaining capital
expenditures |
e |
113 |
|
36 |
|
28 |
|
|
4 |
|
190 |
|
7 |
|
|
67 |
|
| Sustaining capital
leases |
|
0 |
|
0 |
|
0 |
|
|
1 |
|
1 |
|
1 |
|
|
(1) |
|
| Rehabilitation - accretion and
amortization (operating sites) |
f |
3 |
|
5 |
|
1 |
|
|
1 |
|
10 |
|
0 |
|
|
2 |
|
| Non-controlling
interests |
|
(47) |
|
(17) |
|
(11) |
|
|
(2) |
|
(81) |
|
0 |
|
|
(27) |
|
| All-in
sustaining costs |
|
366
|
|
187
|
|
127
|
|
|
7
|
|
694
|
|
51
|
|
|
139
|
|
|
|
|
|
|
|
|
|
|
|
|
|
|
|
|
|
|
|
|
|
|
|
|
|
|
|
|
|
|
|
|
|
|
|
|
|
|
|
|
|
|
|
|
|
|
|
|
|
|
|
|
|
|
|
|
|
|
|
|
|
|
|
|
|
|
|
|
|
|
|
|
|
|
|
|
|
|
| Ounces
sold - attributable basis (000s ounces) |
|
211
|
|
136
|
|
104
|
|
|
24
|
|
475
|
|
27
|
|
|
106
|
|
| COS/oz
|
g,h
|
1,863
|
|
1,592
|
|
1,422
|
|
|
1,972
|
|
1,695
|
|
1,738
|
|
|
1,492
|
|
| TCC/oz |
h |
1,380 |
|
1,196 |
|
1,050 |
|
|
127 |
|
1,191 |
|
1,707 |
|
|
930 |
|
|
|
|
|
|
|
|
|
|
|
|
| AISC/oz
|
h
|
1,732
|
|
1,384
|
|
1,225
|
|
|
279
|
|
1,461
|
|
1,976
|
|
|
1,322
|
|
|
|
|
|
|
|
|
|
|
|
|
|
|
|
|
|
|
|
|
|
|
|
|
|
|
|
|
|
|
|
|
|
|
|
|
|
|
|
|
|
|
|
|
|
|
|
|
|
|
|
|
|
|
|
|
|
|
|
|
|
|
|
| ($ millions, except per ounce information in
dollars) |
|
|
|
For the three months ended 12/31/25 |
| |
Footnote |
Veladero |
Porgera
i |
Loulo-Gounkoto
j |
Kibali |
North Mara |
Tongon
k |
Bulyanhulu |
|
|
| Cost of sales applicable to gold
production |
|
67 |
|
35 |
|
472 |
|
123 |
|
108 |
|
56 |
|
86 |
|
|
|
| Depreciation |
|
(25) |
|
(9) |
|
(24) |
|
(36) |
|
(25) |
|
1 |
|
(17) |
|
|
|
| Costs allocated to
by-products |
|
(3) |
|
0 |
|
0 |
|
(2) |
|
(2) |
|
0 |
|
(12) |
|
|
|
|
|
|
|
|
|
|
|
|
|
|
|
|
|
|
|
|
|
|
|
|
|
| Other |
c |
0 |
|
0 |
|
(283) |
|
0 |
|
0 |
|
0 |
|
1 |
|
|
|
| Non-controlling
interests |
|
0 |
|
0 |
|
(33) |
|
0 |
|
(12) |
|
(6) |
|
(9) |
|
|
|
| Total cash
costs |
|
39
|
|
26
|
|
132
|
|
85
|
|
69
|
|
51
|
|
49
|
|
|
|
| General &
administrative costs |
|
0
|
|
0
|
|
0
|
|
0
|
|
0
|
|
0
|
|
0
|
|
|
|
| Minesite exploration and
evaluation costs |
d |
0 |
|
0 |
|
0 |
|
0 |
|
0 |
|
0 |
|
0 |
|
|
|
| Minesite sustaining capital
expenditures |
e |
43 |
|
15 |
|
0 |
|
19 |
|
20 |
|
3 |
|
20 |
|
|
|
| Sustaining capital
leases |
|
1 |
|
0 |
|
0 |
|
3 |
|
1 |
|
1 |
|
0 |
|
|
|
| Rehabilitation - accretion and
amortization (operating sites) |
f |
1 |
|
0 |
|
0 |
|
0 |
|
(1) |
|
0 |
|
0 |
|
|
|
| Non-controlling
interests |
|
0 |
|
0 |
|
0 |
|
0 |
|
(3) |
|
(1) |
|
(3) |
|
|
|
| All-in
sustaining costs |
|
84
|
|
41
|
|
132
|
|
107
|
|
86
|
|
54
|
|
66
|
|
|
|
|
|
|
|
|
|
|
|
|
|
|
|
|
|
|
|
|
|
|
|
|
|
|
|
|
|
|
|
|
|
|
|
|
|
|
|
|
|
|
|
|
|
|
|
|
|
|
|
|
|
|
|
|
|
|
|
|
|
|
|
|
|
|
|
|
|
|
|
|
|
|
|
|
|
|
|
|
| Ounces
sold - attributable basis (000s ounces) |
|
47
|
|
22
|
|
91
|
|
78
|
|
56
|
|
19
|
|
39
|
|
|
|
| COS/oz
|
g,h
|
1,526
|
|
1,608
|
|
4,151
|
|
1,557
|
|
1,640
|
|
2,648
|
|
1,885
|
|
|
|
| TCC/oz |
h |
886 |
|
1,180 |
|
1,448 |
|
1,093 |
|
1,237 |
|
2,659 |
|
1,262 |
|
|
|
|
|
|
|
|
|
|
|
|
|
|
| AISC/oz
|
h
|
1,915
|
|
1,865
|
|
1,448
|
|
1,374
|
|
1,546
|
|
2,844
|
|
1,694
|
|
|
|
|
|
|
|
|
|
|
|
|
|
|
|
|
|
|
|
|
|
|
|
|
|
|
|
|
|
|
|
|
|
|
|
|
|
|
|
|
|
|
|
|
|
BARRICK YEAR-END 2025 |
61 |
MANAGEMENT’S DISCUSSION AND
ANALYSIS |
|
|
|
|
|
|
|
|
|
|
|
|
|
|
|
|
|
|
|
|
|
|
|
|
|
|
|
|
|
| ($ millions, except per ounce information in
dollars) |
|
For the three months ended 9/30/25 |
| |
Footnote |
Carlin |
Cortez |
Turquoise Ridge |
|
Phoenix |
Nevada
Gold Minesa |
Hemlo
b |
Pueblo Viejo |
|
| Cost of sales applicable to gold
production |
|
413 |
|
322 |
|
201 |
|
|
91 |
|
1,029 |
|
63 |
|
260 |
|
|
| Depreciation |
|
(80) |
|
(73) |
|
(48) |
|
|
(18) |
|
(220) |
|
(7) |
|
(77) |
|
|
| Costs allocated to
by-products |
|
(1) |
|
(1) |
|
(1) |
|
|
(49) |
|
(52) |
|
(1) |
|
(16) |
|
|
|
|
|
|
|
|
|
|
|
|
|
|
|
|
|
|
|
|
|
|
|
|
| Other |
c |
0 |
|
0 |
|
0 |
|
|
6 |
|
6 |
|
0 |
|
0 |
|
|
| Non-controlling
interests |
|
(129) |
|
(95) |
|
(58) |
|
|
(12) |
|
(294) |
|
0 |
|
(66) |
|
|
| Total cash
costs |
|
203
|
|
153
|
|
94
|
|
|
18
|
|
469
|
|
55
|
|
101
|
|
|
| General &
administrative costs |
|
0
|
|
0
|
|
0
|
|
|
0
|
|
0
|
|
0
|
|
0
|
|
|
| Minesite exploration and
evaluation costs |
d |
3 |
|
1 |
|
0 |
|
|
1 |
|
5 |
|
0 |
|
0 |
|
|
| Minesite sustaining capital
expenditures |
e |
116 |
|
26 |
|
20 |
|
|
10 |
|
176 |
|
14 |
|
47 |
|
|
| Sustaining capital
leases |
|
0 |
|
0 |
|
0 |
|
|
1 |
|
1 |
|
0 |
|
0 |
|
|
| Rehabilitation - accretion and
amortization (operating sites) |
f |
3 |
|
5 |
|
1 |
|
|
1 |
|
10 |
|
0 |
|
2 |
|
|
| Non-controlling
interests |
|
(46) |
|
(12) |
|
(9) |
|
|
(5) |
|
(74) |
|
0 |
|
(21) |
|
|
| All-in
sustaining costs |
|
279
|
|
173
|
|
106
|
|
|
26
|
|
587
|
|
69
|
|
129
|
|
|
|
|
|
|
|
|
|
|
|
|
|
|
|
|
|
|
|
|
|
|
|
|
|
|
|
|
|
|
|
|
|
|
|
|
|
|
|
|
|
|
|
|
|
|
|
|
|
|
|
|
|
|
|
|
|
|
|
|
|
|
|
|
|
|
|
|
|
|
|
|
|
|
|
|
|
|
|
| Ounces
sold - attributable basis (000s ounces) |
|
170
|
|
123
|
|
85
|
|
|
28
|
|
406
|
|
29
|
|
108
|
|
|
| COS/oz
|
g,h
|
1,493
|
|
1,612
|
|
1,452
|
|
|
2,010
|
|
1,557
|
|
2,145
|
|
1,451
|
|
|
| TCC/oz |
h |
1,201 |
|
1,242 |
|
1,099 |
|
|
664 |
|
1,156 |
|
1,874 |
|
929 |
|
|
|
|
|
|
|
|
|
|
|
|
|
| AISC/oz
|
h
|
1,643
|
|
1,407
|
|
1,244
|
|
|
935
|
|
1,448
|
|
2,417
|
|
1,198
|
|
|
|
|
|
|
|
|
|
|
|
|
|
|
|
|
|
|
|
|
|
|
|
|
|
|
|
|
|
|
|
|
|
|
|
|
|
|
|
|
|
|
|
|
|
|
|
|
|
|
|
|
|
|
|
|
|
|
|
|
|
|
|
|
| ($ millions, except per ounce information in
dollars) |
For the three months ended 9/30/25 |
| |
Footnote |
Veladero |
Porgera
i |
Loulo-Gounkoto
j |
Kibali |
North Mara |
Tongon
k |
Bulyanhulu |
|
|
| Cost of sales applicable to gold
production |
|
60 |
|
38 |
|
— |
|
124 |
|
130 |
|
60 |
|
87 |
|
|
|
| Depreciation |
|
(23) |
|
(9) |
|
— |
|
(38) |
|
(35) |
|
(6) |
|
(18) |
|
|
|
| Costs allocated to
by-products |
|
(2) |
|
(1) |
|
— |
|
0 |
|
(2) |
|
0 |
|
(6) |
|
|
|
|
|
|
|
|
|
|
|
|
|
|
|
|
|
|
|
|
|
|
|
|
|
| Other |
c |
0 |
|
0 |
|
— |
|
0 |
|
0 |
|
0 |
|
0 |
|
|
|
| Non-controlling
interests |
|
0 |
|
0 |
|
— |
|
0 |
|
(16) |
|
(5) |
|
(10) |
|
|
|
| Total cash
costs |
|
35
|
|
28
|
|
—
|
|
86
|
|
77
|
|
49
|
|
53
|
|
|
|
| General &
administrative costs |
|
0
|
|
0
|
|
—
|
|
0
|
|
0
|
|
0
|
|
0
|
|
|
|
| Minesite exploration and
evaluation costs |
d |
0 |
|
0 |
|
— |
|
0 |
|
0 |
|
0 |
|
0 |
|
|
|
| Minesite sustaining capital
expenditures |
e |
30 |
|
8 |
|
— |
|
19 |
|
16 |
|
1 |
|
21 |
|
|
|
| Sustaining capital
leases |
|
0 |
|
1 |
|
— |
|
2 |
|
0 |
|
1 |
|
0 |
|
|
|
| Rehabilitation - accretion and
amortization (operating sites) |
f |
1 |
|
0 |
|
— |
|
1 |
|
2 |
|
1 |
|
0 |
|
|
|
| Non-controlling
interests |
|
0 |
|
0 |
|
— |
|
0 |
|
(3) |
|
0 |
|
(3) |
|
|
|
| All-in
sustaining costs |
|
66
|
|
37
|
|
—
|
|
108
|
|
92
|
|
52
|
|
71
|
|
|
|
|
|
|
|
|
|
|
|
|
|
|
|
|
|
|
|
|
|
|
|
|
|
|
|
|
|
|
|
|
|
|
|
|
|
|
|
|
|
|
|
|
|
|
|
|
|
|
|
|
|
|
|
|
|
|
|
|
|
|
|
|
|
|
|
|
|
|
|
|
|
|
|
|
|
|
|
|
| Ounces
sold - attributable basis (000s ounces) |
|
44
|
|
24
|
|
—
|
|
84
|
|
72
|
|
30
|
|
40
|
|
|
|
| COS/oz
|
g,h
|
1,352
|
|
1,599
|
|
—
|
|
1,482
|
|
1,497
|
|
1,787
|
|
1,817
|
|
|
|
| TCC/oz |
h |
787 |
|
1,200 |
|
— |
|
1,019 |
|
1,069 |
|
1,605 |
|
1,334 |
|
|
|
|
|
|
|
|
|
|
|
|
|
|
| AISC/oz
|
h
|
1,498
|
|
1,594
|
|
—
|
|
1,286
|
|
1,268
|
|
1,692
|
|
1,790
|
|
|
|
|
|
|
|
|
|
|
|
|
|
|
|
|
|
|
|
|
|
|
|
|
|
|
|
|
|
|
|
|
|
|
|
|
|
|
|
|
|
|
|
|
|
BARRICK YEAR-END 2025 |
62 |
MANAGEMENT’S DISCUSSION AND
ANALYSIS |
|
|
|
|
|
|
|
|
|
|
|
|
|
|
|
|
|
|
|
|
|
|
|
|
|
|
|
|
|
| ($ millions, except per ounce information in
dollars) |
|
For the year ended 12/31/2025 |
| |
Footnote |
Carlin |
Cortez |
Turquoise Ridge |
|
Phoenix |
Nevada
Gold Minesa |
Hemlo
b |
Pueblo Viejo |
|
| Cost of sales applicable to gold
production |
|
1,885 |
|
1,212 |
|
861 |
|
|
341 |
|
4,303 |
|
232 |
|
1,028 |
|
|
| Depreciation |
|
(374) |
|
(278) |
|
(201) |
|
|
(68) |
|
(922) |
|
(28) |
|
(311) |
|
|
| Costs allocated to
by-products |
|
(6) |
|
(4) |
|
(4) |
|
|
(184) |
|
(198) |
|
(1) |
|
(56) |
|
|
|
|
|
|
|
|
|
|
|
|
|
|
|
|
|
|
|
|
|
|
|
|
| Other |
c |
(2) |
|
(4) |
|
0 |
|
|
27 |
|
21 |
|
0 |
|
0 |
|
|
| Non-controlling
interests |
|
(579) |
|
(357) |
|
(253) |
|
|
(45) |
|
(1,235) |
|
0 |
|
(265) |
|
|
| Total cash
costs |
|
924
|
|
569
|
|
403
|
|
|
71
|
|
1,969
|
|
203
|
|
396
|
|
|
| General &
administrative costs |
|
0
|
|
0
|
|
0
|
|
|
0
|
|
0
|
|
0
|
|
0
|
|
|
| Minesite exploration and
evaluation costs |
d |
13 |
|
6 |
|
0 |
|
|
2 |
|
23 |
|
0 |
|
0 |
|
|
| Minesite sustaining capital
expenditures |
e |
610 |
|
186 |
|
96 |
|
|
37 |
|
952 |
|
36 |
|
234 |
|
|
| Sustaining capital
leases |
|
0 |
|
0 |
|
0 |
|
|
2 |
|
3 |
|
3 |
|
(1) |
|
|
| Rehabilitation - accretion and
amortization (operating sites) |
f |
11 |
|
18 |
|
4 |
|
|
6 |
|
39 |
|
1 |
|
7 |
|
|
| Non-controlling
interests |
|
(244) |
|
(81) |
|
(38) |
|
|
(18) |
|
(391) |
|
0 |
|
(96) |
|
|
| All-in
sustaining costs |
|
1,314
|
|
698
|
|
465
|
|
|
100
|
|
2,595
|
|
243
|
|
540
|
|
|
|
|
|
|
|
|
|
|
|
|
|
|
|
|
|
|
|
|
|
|
|
|
|
|
|
|
|
|
|
|
|
|
|
|
|
|
|
|
|
|
|
|
|
|
|
|
|
|
|
|
|
|
|
|
|
|
|
|
|
|
|
|
|
|
|
|
|
|
|
|
|
|
|
|
|
|
|
| Ounces
sold - attributable basis (000s ounces) |
|
689
|
|
462
|
|
342
|
|
|
109
|
|
1,602
|
|
127
|
|
383
|
|
|
| COS/oz
|
g,h
|
1,676
|
|
1,609
|
|
1,545
|
|
|
1,921
|
|
1,647
|
|
1,854
|
|
1,608
|
|
|
| TCC/oz |
h |
1,340 |
|
1,234 |
|
1,178 |
|
|
653 |
|
1,229 |
|
1,618 |
|
1,034 |
|
|
|
|
|
|
|
|
|
|
|
|
|
| AISC/oz
|
h
|
1,906
|
|
1,513
|
|
1,358
|
|
|
920
|
|
1,620
|
|
1,936
|
|
1,412
|
|
|
|
|
|
|
|
|
|
|
|
|
|
|
|
|
|
|
|
|
|
|
|
|
|
|
|
|
|
|
|
|
|
|
|
|
|
|
|
|
|
|
|
|
|
|
|
|
|
|
|
|
|
|
|
|
|
|
|
|
|
|
|
|
| ($ millions, except per ounce information in
dollars) |
For the year ended 12/31/2025 |
| |
Footnote |
Veladero |
Porgera
i |
Loulo-Gounkoto
j |
Kibali |
North Mara |
Tongon
k |
Bulyanhulu |
|
|
| Cost of sales applicable to gold
production |
|
288 |
|
141 |
|
486 |
|
468 |
|
424 |
|
260 |
|
314 |
|
|
|
| Depreciation |
|
(104) |
|
(32) |
|
(38) |
|
(138) |
|
(100) |
|
(17) |
|
(65) |
|
|
|
| Costs allocated to
by-products |
|
(8) |
|
(1) |
|
0 |
|
(3) |
|
(7) |
|
0 |
|
(32) |
|
|
|
|
|
|
|
|
|
|
|
|
|
|
|
|
|
|
|
|
|
|
|
|
|
| Other |
c |
0 |
|
0 |
|
(283) |
|
0 |
|
0 |
|
0 |
|
3 |
|
|
|
| Non-controlling
interests |
|
0 |
|
0 |
|
(33) |
|
0 |
|
(50) |
|
(25) |
|
(35) |
|
|
|
| Total cash
costs |
|
176
|
|
108
|
|
132
|
|
327
|
|
267
|
|
218
|
|
185
|
|
|
|
| General &
administrative costs |
|
0
|
|
0
|
|
0
|
|
0
|
|
0
|
|
0
|
|
0
|
|
|
|
| Minesite exploration and
evaluation costs |
d |
3 |
|
1 |
|
0 |
|
0 |
|
0 |
|
0 |
|
0 |
|
|
|
| Minesite sustaining capital
expenditures |
e |
140 |
|
37 |
|
16 |
|
60 |
|
68 |
|
11 |
|
94 |
|
|
|
| Sustaining capital
leases |
|
2 |
|
1 |
|
3 |
|
10 |
|
1 |
|
2 |
|
0 |
|
|
|
| Rehabilitation - accretion and
amortization (operating sites) |
f |
3 |
|
1 |
|
(1) |
|
1 |
|
3 |
|
5 |
|
1 |
|
|
|
| Non-controlling
interests |
|
0 |
|
0 |
|
(4) |
|
0 |
|
(11) |
|
(2) |
|
(15) |
|
|
|
| All-in
sustaining costs |
|
324
|
|
148
|
|
146
|
|
398
|
|
328
|
|
234
|
|
265
|
|
|
|
|
|
|
|
|
|
|
|
|
|
|
|
|
|
|
|
|
|
|
|
|
|
|
|
|
|
|
|
|
|
|
|
|
|
|
|
|
|
|
|
|
|
|
|
|
|
|
|
|
|
|
|
|
|
|
|
|
|
|
|
|
|
|
|
|
|
|
|
|
|
|
|
|
|
|
|
|
| Ounces
sold - attributable basis (000s ounces) |
|
226
|
|
91
|
|
91
|
|
298
|
|
246
|
|
106
|
|
148
|
|
|
|
| COS/oz
|
g,h
|
1,286
|
|
1,553
|
|
4,271
|
|
1,568
|
|
1,449
|
|
2,200
|
|
1,789
|
|
|
|
| TCC/oz |
h |
785 |
|
1,184 |
|
1,449 |
|
1,099 |
|
1,085 |
|
2,049 |
|
1,253 |
|
|
|
|
|
|
|
|
|
|
|
|
|
|
| AISC/oz
|
h
|
1,450
|
|
1,630
|
|
1,603
|
|
1,337
|
|
1,333
|
|
2,203
|
|
1,795
|
|
|
|
|
|
|
|
|
|
|
|
|
|
|
|
|
|
|
|
|
|
|
|
|
|
|
|
|
|
|
|
|
|
|
|
|
|
|
|
|
|
|
|
|
|
BARRICK YEAR-END 2025 |
63 |
MANAGEMENT’S DISCUSSION AND
ANALYSIS |
|
|
|
|
|
|
|
|
|
|
|
|
|
|
|
|
|
|
|
|
|
|
|
|
|
|
|
|
|
| ($ millions, except per ounce information in
dollars) |
|
For the year ended 12/31/2024 |
| |
Footnote |
Carlin |
Cortez |
Turquoise Ridge |
|
Phoenix |
Nevada
Gold Minesa |
Hemlo
b |
Pueblo Viejo |
|
| Cost of sales applicable to gold
production |
|
1,829 |
|
1,005 |
|
782 |
|
|
356 |
|
3,977 |
|
250 |
|
924 |
|
|
| Depreciation |
|
(307) |
|
(253) |
|
(179) |
|
|
(69) |
|
(810) |
|
(38) |
|
(295) |
|
|
| Costs allocated to
by-products |
|
(3) |
|
(3) |
|
(3) |
|
|
(152) |
|
(161) |
|
0 |
|
(40) |
|
|
|
|
|
|
|
|
|
|
|
|
|
|
|
|
|
|
|
|
|
|
|
|
| Other |
c |
(18) |
|
0 |
|
0 |
|
|
26 |
|
8 |
|
0 |
|
0 |
|
|
| Non-controlling
interests |
|
(578) |
|
(288) |
|
(231) |
|
|
(62) |
|
(1,160) |
|
0 |
|
(236) |
|
|
| Total cash
costs |
|
923
|
|
461
|
|
369
|
|
|
99
|
|
1,854
|
|
212
|
|
353
|
|
|
| General &
administrative costs |
|
0
|
|
0
|
|
0
|
|
|
0
|
|
0
|
|
0
|
|
0
|
|
|
| Minesite exploration and
evaluation costs |
d |
12 |
|
8 |
|
6 |
|
|
5 |
|
33 |
|
0 |
|
0 |
|
|
| Minesite sustaining capital
expenditures |
e |
664 |
|
259 |
|
101 |
|
|
43 |
|
1,092 |
|
37 |
|
180 |
|
|
| Sustaining capital
leases |
|
0 |
|
0 |
|
0 |
|
|
1 |
|
2 |
|
4 |
|
0 |
|
|
| Rehabilitation - accretion and
amortization (operating sites) |
f |
12 |
|
17 |
|
4 |
|
|
7 |
|
40 |
|
0 |
|
6 |
|
|
| Non-controlling
interests |
|
(266) |
|
(110) |
|
(43) |
|
|
(21) |
|
(451) |
|
0 |
|
(74) |
|
|
| All-in
sustaining costs |
|
1,345
|
|
635
|
|
437
|
|
|
134
|
|
2,570
|
|
253
|
|
465
|
|
|
|
|
|
|
|
|
|
|
|
|
|
|
|
|
|
|
|
|
|
|
|
|
|
|
|
|
|
|
|
|
|
|
|
|
|
|
|
|
|
|
|
|
|
|
|
|
|
|
|
|
|
|
|
|
|
|
|
|
|
|
|
|
|
|
|
|
|
|
|
|
|
|
|
|
|
|
|
| Ounces
sold - attributable basis (000s ounces) |
|
777
|
|
441
|
|
298
|
|
|
130
|
|
1,646
|
|
143
|
|
351
|
|
|
| COS/oz
|
g,h
|
1,429
|
|
1,402
|
|
1,615
|
|
|
1,687
|
|
1,478
|
|
1,754
|
|
1,576
|
|
|
| TCC/oz |
h |
1,187 |
|
1,046 |
|
1,238 |
|
|
765 |
|
1,126 |
|
1,483 |
|
1,005 |
|
|
|
|
|
|
|
|
|
|
|
|
|
| AISC/oz
|
h
|
1,730
|
|
1,441
|
|
1,466
|
|
|
1,031
|
|
1,561
|
|
1,769
|
|
1,323
|
|
|
|
|
|
|
|
|
|
|
|
|
|
|
|
|
|
|
|
|
|
|
|
|
|
|
|
|
|
|
|
|
|
|
|
|
|
|
|
|
|
|
|
|
|
|
|
|
|
|
|
|
|
|
|
|
|
|
|
|
|
|
|
|
| ($ millions, except per ounce information in
dollars) |
For the year ended 12/31/2024 |
| |
Footnote |
Veladero |
Porgera
i |
Loulo-Gounkoto
j |
Kibali |
North Mara |
Tongon
k |
Bulyanhulu |
|
|
| Cost of sales applicable to gold
production |
|
342 |
|
62 |
|
698 |
|
415 |
|
395 |
|
315 |
|
297 |
|
|
|
| Depreciation |
|
(85) |
|
(15) |
|
(223) |
|
(134) |
|
(83) |
|
(38) |
|
(63) |
|
|
|
| Costs allocated to
by-products |
|
(10) |
|
(1) |
|
0 |
|
(2) |
|
(3) |
|
0 |
|
(26) |
|
|
|
|
|
|
|
|
|
|
|
|
|
|
|
|
|
|
|
|
|
|
|
|
|
| Other |
c |
0 |
|
0 |
|
0 |
|
0 |
|
0 |
|
0 |
|
3 |
|
|
|
| Non-controlling
interests |
|
0 |
|
0 |
|
(95) |
|
0 |
|
(49) |
|
(29) |
|
(34) |
|
|
|
| Total cash
costs |
|
247
|
|
46
|
|
380
|
|
279
|
|
260
|
|
248
|
|
177
|
|
|
|
| General &
administrative costs |
|
0
|
|
0
|
|
0
|
|
0
|
|
0
|
|
0
|
|
0
|
|
|
|
| Minesite exploration and
evaluation costs |
d |
4 |
|
2 |
|
0 |
|
0 |
|
0 |
|
0 |
|
0 |
|
|
|
| Minesite sustaining capital
expenditures |
e |
111 |
|
21 |
|
267 |
|
58 |
|
84 |
|
23 |
|
68 |
|
|
|
| Sustaining capital
leases |
|
1 |
|
2 |
|
3 |
|
8 |
|
0 |
|
1 |
|
0 |
|
|
|
| Rehabilitation - accretion and
amortization (operating sites) |
f |
1 |
|
1 |
|
2 |
|
1 |
|
5 |
|
9 |
|
1 |
|
|
|
| Non-controlling
interests |
|
0 |
|
0 |
|
(54) |
|
0 |
|
(14) |
|
(4) |
|
(11) |
|
|
|
| All-in
sustaining costs |
|
364
|
|
72
|
|
598
|
|
346
|
|
335
|
|
277
|
|
235
|
|
|
|
|
|
|
|
|
|
|
|
|
|
|
|
|
|
|
|
|
|
|
|
|
|
|
|
|
|
|
|
|
|
|
|
|
|
|
|
|
|
|
|
|
|
|
|
|
|
|
|
|
|
|
|
|
|
|
|
|
|
|
|
|
|
|
|
|
|
|
|
|
|
|
|
|
|
|
|
|
| Ounces
sold - attributable basis (000s ounces) |
|
270
|
|
43
|
|
459
|
|
309
|
|
263
|
|
149
|
|
165
|
|
|
|
| COS/oz
|
g,h
|
1,254
|
|
1,423
|
|
1,218
|
|
1,344
|
|
1,266
|
|
1,903
|
|
1,509
|
|
|
|
| TCC/oz |
h |
905 |
|
1,073 |
|
828 |
|
905 |
|
989 |
|
1,670 |
|
1,070 |
|
|
|
|
|
|
|
|
|
|
|
|
|
|
| AISC/oz
|
h
|
1,334
|
|
1,666
|
|
1,304
|
|
1,123
|
|
1,274
|
|
1,867
|
|
1,420
|
|
|
|
|
|
|
|
|
|
|
|
|
|
|
|
|
|
|
|
|
|
|
|
|
|
|
|
|
|
|
|
|
|
|
|
|
|
|
|
|
|
|
|
|
|
BARRICK YEAR-END 2025 |
64 |
MANAGEMENT’S DISCUSSION AND
ANALYSIS |
|
|
|
|
|
|
|
|
|
|
|
|
|
|
|
|
|
|
|
|
|
|
|
|
|
|
|
|
|
|
|
| ($ millions, except per ounce information in
dollars) |
For the year ended 12/31/2023 |
| |
Footnote |
Carlin |
Cortez |
Turquoise Ridge |
Long
Canyonl |
Phoenix |
Nevada
Gold Minesa |
Hemlo
b |
Pueblo Viejo |
|
| Cost of sales applicable to gold
production |
|
1,789 |
|
1,174 |
|
722 |
|
26 |
|
393 |
|
4,109 |
|
221 |
|
791 |
|
|
| Depreciation |
|
(314) |
|
(364) |
|
(189) |
|
(16) |
|
(76) |
|
(961) |
|
(28) |
|
(255) |
|
|
| Costs allocated to
by-products |
|
(2) |
|
(3) |
|
(4) |
|
0 |
|
(157) |
|
(166) |
|
(1) |
|
(37) |
|
|
|
|
|
|
|
|
|
|
|
|
|
|
|
|
|
|
|
|
|
|
|
|
| Other |
c |
(19) |
|
0 |
|
0 |
|
0 |
|
28 |
|
9 |
|
0 |
|
0 |
|
|
| Non-controlling
interests |
|
(561) |
|
(311) |
|
(203) |
|
(3) |
|
(72) |
|
(1,151) |
|
0 |
|
(201) |
|
|
| Total cash
costs |
|
893
|
|
496
|
|
326
|
|
7
|
|
116
|
|
1,840
|
|
192
|
|
298
|
|
|
| General &
administrative costs |
|
0
|
|
0
|
|
0
|
|
0
|
|
0
|
|
0
|
|
0
|
|
0
|
|
|
| Minesite exploration and
evaluation costs |
d |
23 |
|
5 |
|
5 |
|
0 |
|
1 |
|
36 |
|
0 |
|
0 |
|
|
| Minesite sustaining capital
expenditures |
e |
605 |
|
310 |
|
100 |
|
0 |
|
31 |
|
1,063 |
|
37 |
|
195 |
|
|
| Sustaining capital
leases |
|
0 |
|
0 |
|
0 |
|
0 |
|
2 |
|
3 |
|
2 |
|
0 |
|
|
| Rehabilitation - accretion and
amortization (operating sites) |
f |
12 |
|
19 |
|
2 |
|
0 |
|
5 |
|
38 |
|
1 |
|
6 |
|
|
| Non-controlling
interests |
|
(248) |
|
(128) |
|
(41) |
|
0 |
|
(15) |
|
(440) |
|
0 |
|
(80) |
|
|
| All-in
sustaining costs |
|
1,285
|
|
702
|
|
392
|
|
7
|
|
140
|
|
2,540
|
|
232
|
|
419
|
|
|
|
|
|
|
|
|
|
|
|
|
|
|
|
|
|
|
|
|
|
|
|
|
|
|
|
|
|
|
|
|
|
|
|
|
|
|
|
|
|
|
|
|
|
|
|
|
|
|
|
|
|
|
|
|
|
|
|
|
|
|
|
|
|
|
|
|
|
|
|
|
|
|
|
|
|
|
|
| Ounces
sold - attributable basis (000s ounces) |
|
865
|
|
548
|
|
318
|
|
9
|
|
120
|
|
1,860
|
|
139
|
|
335
|
|
|
| COS/oz
|
g,h
|
1,254
|
|
1,318
|
|
1,399
|
|
1,789
|
|
2,011
|
|
1,351
|
|
1,589
|
|
1,418
|
|
|
| TCC/oz |
h |
1,033 |
|
906 |
|
1,026 |
|
724 |
|
961 |
|
989 |
|
1,382 |
|
889 |
|
|
|
|
|
|
|
|
|
|
|
|
|
| AISC/oz
|
h
|
1,486
|
|
1,282
|
|
1,234
|
|
779
|
|
1,162
|
|
1,366
|
|
1,672
|
|
1,249
|
|
|
|
|
|
|
|
|
|
|
|
|
|
|
|
|
|
|
|
|
|
|
|
|
|
|
|
|
|
|
|
|
|
|
|
|
|
|
|
|
|
|
|
|
|
|
|
|
|
|
|
|
|
|
|
|
|
|
|
|
|
|
|
|
| ($ millions, except per ounce information in
dollars) |
For the year ended 12/31/2023 |
| |
Footnote |
Veladero |
Porgera
i |
Loulo-Gounkoto
j |
Kibali |
North Mara |
Tongon
k |
Bulyanhulu |
|
|
| Cost of sales applicable to gold
production |
|
263 |
|
— |
|
817 |
|
419 |
|
365 |
|
303 |
|
282 |
|
|
|
| Depreciation |
|
(69) |
|
— |
|
(247) |
|
(147) |
|
(77) |
|
(46) |
|
(62) |
|
|
|
| Costs allocated to
by-products |
|
(9) |
|
— |
|
0 |
|
(2) |
|
(3) |
|
(1) |
|
(23) |
|
|
|
|
|
|
|
|
|
|
|
|
|
|
|
|
|
|
|
|
|
|
|
|
|
| Other |
c |
0 |
|
— |
|
0 |
|
0 |
|
0 |
|
0 |
|
0 |
|
|
|
| Non-controlling
interests |
|
0 |
|
— |
|
(114) |
|
0 |
|
(45) |
|
(27) |
|
(31) |
|
|
|
| Total cash
costs |
|
185
|
|
—
|
|
456
|
|
270
|
|
240
|
|
229
|
|
166
|
|
|
|
| General &
administrative costs |
|
0
|
|
—
|
|
0
|
|
0
|
|
0
|
|
0
|
|
0
|
|
|
|
| Minesite exploration and
evaluation costs |
d |
5 |
|
— |
|
0 |
|
0 |
|
0 |
|
0 |
|
0 |
|
|
|
| Minesite sustaining capital
expenditures |
e |
85 |
|
— |
|
221 |
|
35 |
|
113 |
|
30 |
|
65 |
|
|
|
| Sustaining capital
leases |
|
1 |
|
— |
|
1 |
|
7 |
|
0 |
|
1 |
|
0 |
|
|
|
| Rehabilitation - accretion and
amortization (operating sites) |
f |
1 |
|
— |
|
3 |
|
2 |
|
5 |
|
4 |
|
1 |
|
|
|
| Non-controlling
interests |
|
0 |
|
— |
|
(45) |
|
0 |
|
(19) |
|
(4) |
|
(10) |
|
|
|
| All-in
sustaining costs |
|
277
|
|
—
|
|
636
|
|
314
|
|
339
|
|
260
|
|
222
|
|
|
|
|
|
|
|
|
|
|
|
|
|
|
|
|
|
|
|
|
|
|
|
|
|
|
|
|
|
|
|
|
|
|
|
|
|
|
|
|
|
|
|
|
|
|
|
|
|
|
|
|
|
|
|
|
|
|
|
|
|
|
|
|
|
|
|
|
|
|
|
|
|
|
|
|
|
|
|
|
| Ounces
sold - attributable basis (000s ounces) |
|
182
|
|
—
|
|
546
|
|
343
|
|
254
|
|
185
|
|
180
|
|
|
|
| COS/oz
|
g,h
|
1,440
|
|
—
|
|
1,198
|
|
1,221
|
|
1,206
|
|
1,469
|
|
1,312
|
|
|
|
| TCC/oz |
h |
1,011 |
|
— |
|
835 |
|
789 |
|
944 |
|
1,240 |
|
920 |
|
|
|
|
|
|
|
|
|
|
|
|
|
|
| AISC/oz
|
h
|
1,516
|
|
—
|
|
1,166
|
|
918
|
|
1,335
|
|
1,408
|
|
1,231
|
|
|
|
|
|
|
|
|
|
|
|
|
|
|
|
|
|
|
|
|
|
|
|
|
|
|
|
|
|
|
|
|
|
|
|
|
a.These
results represent our 61.5% interest in Carlin, Cortez, Turquoise Ridge, Phoenix and Long Canyon until it transitioned to care and maintenance at the end of 2023, as previously reported.
b.
On September 10, 2025, we reached an agreement to sell the Hemlo gold mine to Carcetti Capital Corp. for gross proceeds
of up to $1.09 billion. The transaction closed on November 26, 2025. Accordingly, operating and financial results provided are up to the
closing date.
c.Other -
Other adjustments at Loulo-Gounkoto include the removal of the fair value increment on inventory resulting from the purchase price
allocation when we regained control. Other adjustments at Carlin include the removal of TCC and costs to produce by-products associated with Emigrant, which is producing incidental
ounces.
d.Exploration
and evaluation costs - Exploration, evaluation and project expenses are presented as minesite sustaining if it supports current mine
operations and project if it relates to future projects. Refer to page 49 of this MD&A.
e.Capital
expenditures - Capital expenditures are related to our gold sites only and are split between minesite sustaining and project
capital expenditures.
f.Rehabilitation -
accretion and amortization - Includes depreciation on the assets related to rehabilitation provisions of our gold operations and
accretion on the rehabilitation provision of our gold operations, split between operating and non-operating
sites.
g.
COS/oz - Gold COS/oz is calculated as cost of sales across our gold operations (excluding sites in closure or care and maintenance) divided by ounces sold
(both on an attributable basis using Barrick’s ownership share).
h.Per ounce
figures - COS/oz, TCC/oz and AISC/oz may not calculate based on amounts presented in this table due to
rounding.
i.As Porgera
was placed on care and maintenance from April 25, 2020 until December 22, 2023, no operating data or per ounce data has been provided from Q3 2020 to Q4 2023. On December 22, 2023, we completed the Commencement Agreement, pursuant to which the PNG
government and BNL, the 95% owner and operator of the Porgera joint venture, agreed on a partnership for the future ownership and operation of the mine. Ownership of Porgera is held in a joint venture owned 51% by PNG
|
|
|
|
|
|
|
|
|
BARRICK YEAR-END 2025 |
65 |
MANAGEMENT’S DISCUSSION AND
ANALYSIS |
stakeholders and 49% by a Barrick affiliate, PJL. PJL is jointly owned on a 50/50 basis by Barrick and Zijin Mining Group and therefore Barrick
now holds a 24.5% ownership interest in the Porgera joint venture. Barrick holds a 23.5% interest in the economic benefits of the mine under the economic benefit sharing arrangement agreed with the PNG government whereby Barrick and Zijin Mining
Group together share 47% of the overall economic benefits derived from the mine accumulated over time, and the PNG stakeholders share the remaining 53%.
j.
As a result of temporary suspension of operations at Loulo-Gounkoto starting January 14, 2025, and subsequent loss of
control on June 16, 2025, no operating data or per ounce data was provided for Q1 2025 to Q3 2025. On November 24, 2025, Barrick announced that an agreement had been entered into with the Government of the Republic of Mali to put an end to all
disputes regarding the Loulo and Gounkoto mines. The provisional administration of the Loulo-Gounkoto complex was terminated on December 16, 2025, at which point operational control was handed back to Somilo and Gounkoto's
management.
k.On October 6, 2025, we reached an agreement to sell our interest in the Tongon gold mine and certain of its exploration
properties to the Atlantic Group for total consideration of up to $305 million. The transaction closed on December 1, 2025. Accordingly, operating and financial results provided are up to the closing
date.
l.Starting Q1 2024, we have ceased to include production or non-GAAP cost metrics for Long Canyon as it was placed on care and
maintenance at the end of 2023, as previously reported.
Reconciliation of Copper Cost of Sales to C1 cash costs and All-in sustaining costs, including on a per pound
basis
|
|
|
|
|
|
|
|
|
|
|
|
|
|
|
|
|
|
|
|
|
|
|
For the three months ended |
|
For the years ended |
| ($ millions, except per pound
information in dollars) |
12/31/25
|
9/30/25 |
|
|
12/31/25
|
12/31/24 |
12/31/23 |
| Cost of sales |
281 |
|
193 |
|
|
|
875 |
|
706 |
|
726 |
|
|
Depreciation/amortization |
(88) |
|
(69) |
|
|
|
(285) |
|
(245) |
|
(259) |
|
| Treatment and refinement
charges |
53 |
|
44 |
|
|
|
179 |
|
162 |
|
191 |
|
| Cash cost of sales applicable
to equity method investments |
174 |
|
91 |
|
|
|
439 |
|
352 |
|
356 |
|
| Less: royalties |
(37) |
|
(25) |
|
|
|
(108) |
|
(67) |
|
(62) |
|
| Costs allocated to
by-products |
(22) |
|
(7) |
|
|
|
(46) |
|
(25) |
|
(19) |
|
|
|
|
|
|
|
|
|
C1 cash cost of sales |
361
|
|
227
|
|
|
|
1,054
|
|
883
|
|
933
|
|
|
General & administrative costs |
11
|
|
12
|
|
|
|
39
|
|
17
|
|
22
|
|
| Rehabilitation - accretion and
amortization |
1 |
|
1 |
|
|
|
6 |
|
9 |
|
9 |
|
|
Royalties |
37 |
|
25 |
|
|
|
108 |
|
67 |
|
62 |
|
|
Minesite exploration and evaluation costs |
3 |
|
1 |
|
|
|
7 |
|
4 |
|
7 |
|
|
Minesite sustaining capital expenditures |
116 |
|
93 |
|
|
|
356 |
|
356 |
|
266 |
|
|
Sustaining leases |
2 |
|
2 |
|
|
|
9 |
|
11 |
|
12 |
|
|
|
|
|
|
|
|
|
All-in sustaining costs |
531
|
|
361
|
|
|
|
1,579
|
|
1,347
|
|
1,311
|
|
|
Tonnes sold - attributable basis (thousands of tonnes) |
67
|
|
52
|
|
|
|
224
|
|
177
|
|
185
|
|
|
Pounds sold - attributable basis (millions pounds) |
147
|
|
116
|
|
|
|
494
|
|
391
|
|
408
|
|
COS/lba,b |
3.37
|
|
2.68
|
|
|
|
2.91
|
|
2.99
|
|
2.90
|
|
C1
cash costs per pounda |
2.45
|
|
1.96
|
|
|
|
2.14
|
|
2.26
|
|
2.28
|
|
AISC/lba |
3.61 |
|
3.14 |
|
|
|
3.20 |
|
3.45 |
|
3.21 |
|
a.COS/lb, C1 cash costs/lb and AISC/lb may not calculate based on amounts presented in this table due to
rounding.
b.Copper COS/lb is calculated as cost of sales across our copper operations divided by pounds sold (both on an attributable
basis using Barrick’s ownership share).
|
|
|
|
|
|
|
|
|
BARRICK YEAR-END 2025 |
66 |
MANAGEMENT’S DISCUSSION AND
ANALYSIS |
Reconciliation of Copper Cost of Sales to C1 cash costs and All-in sustaining costs, including on a per pound basis, by operating
site
|
|
|
|
|
|
|
|
|
|
|
|
|
|
|
|
|
|
|
|
|
|
|
|
|
For the three months ended |
| ($ millions, except per pound information in
dollars) |
12/31/25
|
|
9/30/25 |
| |
Zaldívar |
Lumwana |
Jabal Sayid |
|
Zaldívar |
Lumwana |
Jabal Sayid |
| Cost of sales |
175 |
|
282 |
|
38 |
|
|
85 |
|
193 |
|
33 |
|
| Depreciation/amortization
|
(32) |
|
(89) |
|
(7) |
|
|
(20) |
|
(68) |
|
(7) |
|
| Treatment and refinement charges |
0 |
|
53 |
|
0 |
|
|
0 |
|
42 |
|
2 |
|
| Less:
royalties |
0 |
|
(37) |
|
0 |
|
|
0 |
|
(25) |
|
0 |
|
| Costs allocated to by-products |
0 |
|
(7) |
|
(15) |
|
|
(1) |
|
(2) |
|
(4) |
|
|
|
|
|
|
|
|
|
| C1 cash cost of sales |
143 |
|
202 |
|
16 |
|
|
64 |
|
140 |
|
24 |
|
| Rehabilitation
- accretion and amortization |
1
|
|
1
|
|
0
|
|
|
0
|
|
1
|
|
0
|
|
| Royalties |
0 |
|
37 |
|
0 |
|
|
0 |
|
25 |
|
0 |
|
| Minesite exploration and
evaluation costs |
3 |
|
0 |
|
0 |
|
|
1 |
|
0 |
|
0 |
|
| Minesite sustaining capital expenditures |
20 |
|
92 |
|
4 |
|
|
13 |
|
78 |
|
2 |
|
| Sustaining leases |
1 |
|
0 |
|
1 |
|
|
2 |
|
0 |
|
0 |
|
|
|
|
|
|
|
|
|
| All-in
sustaining costs |
168
|
|
332
|
|
21
|
|
|
80
|
|
244
|
|
26
|
|
| Tonnes sold - attributable basis
(thousands of tonnes) |
12 |
|
47 |
|
8 |
|
|
8 |
|
37 |
|
7 |
|
| Pounds sold - attributable basis
(millions pounds) |
27 |
|
103 |
|
17 |
|
|
17 |
|
83 |
|
16 |
|
COS/lb
a,b |
6.33
|
|
2.76
|
|
2.21
|
|
|
5.02
|
|
2.32
|
|
2.08
|
|
C1 cash costs per
pounda |
5.17 |
|
1.97 |
|
0.94 |
|
|
3.80 |
|
1.68 |
|
1.47 |
|
AISC/lba |
6.03 |
|
3.24 |
|
1.20 |
|
|
4.82 |
|
2.93 |
|
1.65 |
|
|
|
|
|
|
|
|
|
|
|
|
|
|
|
|
|
|
|
|
|
|
|
|
|
|
|
|
|
|
|
|
|
|
|
|
|
| ($ millions, except per
pound information in dollars) |
|
|
For the years
ended |
|
12/31/25
|
|
12/31/24 |
|
12/31/23 |
| |
Zaldívar |
Lumwana |
Jabal Sayid |
|
Zaldívar |
Lumwana |
Jabal Sayid |
|
Zaldívar |
Lumwana |
Jabal Sayid |
| Cost of sales |
423 |
|
877 |
|
137 |
|
|
347 |
|
704 |
|
118 |
|
|
354 |
|
723 |
|
107 |
|
| Depreciation/amortization
|
(94) |
|
(286) |
|
(27) |
|
|
(89) |
|
(244) |
|
(24) |
|
|
(81) |
|
(257) |
|
(24) |
|
| Treatment and refinement charges |
0 |
|
173 |
|
6 |
|
|
0 |
|
140 |
|
22 |
|
|
0 |
|
166 |
|
25 |
|
| Less:
royalties |
0 |
|
(108) |
|
0 |
|
|
0 |
|
(67) |
|
0 |
|
|
0 |
|
(62) |
|
0 |
|
| Costs allocated to by-products |
(1) |
|
(13) |
|
(32) |
|
|
0 |
|
0 |
|
(25) |
|
|
(1) |
|
0 |
|
(18) |
|
|
|
|
|
|
|
|
|
|
|
|
|
| C1 cash cost of sales |
328 |
|
643 |
|
84 |
|
|
258 |
|
533 |
|
91 |
|
|
272 |
|
570 |
|
90 |
|
| Rehabilitation
- accretion and amortization |
2
|
|
4
|
|
0
|
|
|
0
|
|
9
|
|
0
|
|
|
0
|
|
9
|
|
0
|
|
| Royalties |
0 |
|
108 |
|
0 |
|
|
0 |
|
67 |
|
0 |
|
|
0 |
|
62 |
|
0 |
|
| Minesite exploration and
evaluation costs |
7 |
|
0 |
|
0 |
|
|
4 |
|
0 |
|
0 |
|
|
7 |
|
0 |
|
0 |
|
| Minesite sustaining capital expenditures |
48 |
|
298 |
|
10 |
|
|
34 |
|
312 |
|
10 |
|
|
34 |
|
223 |
|
9 |
|
| Sustaining leases |
6 |
|
1 |
|
2 |
|
|
7 |
|
1 |
|
3 |
|
|
6 |
|
2 |
|
4 |
|
|
|
|
|
|
|
|
|
|
|
|
|
| All-in
sustaining costs |
391
|
|
1,054
|
|
96
|
|
|
303
|
|
922
|
|
104
|
|
|
319
|
|
866
|
|
103
|
|
| Tonnes sold - attributable basis
(thousands of tonnes) |
37 |
|
157 |
|
30 |
|
|
38 |
|
109 |
|
30 |
|
|
42 |
|
113 |
|
30 |
|
| Pounds sold - attributable basis
(millions pounds) |
82 |
|
346 |
|
66 |
|
|
85 |
|
239 |
|
67 |
|
|
92 |
|
249 |
|
67 |
|
COS/lb
a,b |
5.14
|
|
2.54
|
|
2.09
|
|
|
4.09
|
|
2.94
|
|
1.77
|
|
|
3.83
|
|
2.91
|
|
1.60
|
|
C1 cash costs per
pounda |
3.98 |
|
1.86 |
|
1.28 |
|
|
3.04 |
|
2.23 |
|
1.37 |
|
|
2.95 |
|
2.29 |
|
1.35 |
|
AISC/lba |
4.75 |
|
3.05 |
|
1.46 |
|
|
3.58 |
|
3.85 |
|
1.56 |
|
|
3.46 |
|
3.48 |
|
1.53 |
|
a.COS/lb, C1 cash costs/lb and AISC/lb may not calculate based on amounts presented in this table due to
rounding.
b.Copper COS/lb is calculated as cost of sales across our copper operations divided by pounds sold (both on an attributable
basis using Barrick’s ownership share).
EBITDA, Adjusted EBITDA, Attributable
EBITDA, Attributable EBITDA Margin and Net Leverage
EBITDA is a non-GAAP financial measure, which excludes the following from net
earnings:
■Income tax expense;
■Finance
costs;
■Finance income; and
■Depreciation.
Management believes that
EBITDA is a valuable indicator of our ability to generate liquidity by producing operating cash flow to fund working capital needs, service debt
obligations, and fund capital expenditures. Management uses EBITDA for this purpose. EBITDA is also frequently used by investors and analysts for
valuation purposes whereby EBITDA is multiplied by a factor or “EBITDA multiple” that is based on an observed or inferred relationship between EBITDA and market values to determine the approximate total enterprise value of a
company.
Adjusted EBITDA removes the effect of impairment charges;
acquisition/disposition gains/losses;
|
|
|
|
|
|
|
|
|
BARRICK YEAR-END 2025 |
67 |
MANAGEMENT’S DISCUSSION AND
ANALYSIS |
foreign currency translation gains/losses; and other expense adjustments. We also remove the impact of
the income tax expense, finance costs, finance income and depreciation incurred in our equity method accounted investments. Attributable EBITDA further removes the non-controlling interest portion. We believe these items provide a greater level of
consistency with the adjusting items included in our adjusted net earnings reconciliation, with the exception that these amounts are adjusted to remove any impact on finance costs/income, income tax expense and/or depreciation as they do not
affect EBITDA. We believe this additional information will assist analysts, investors and other stakeholders of Barrick in better understanding our ability to generate liquidity from our attributable business, including equity method investments, by
excluding these amounts from the calculation as they are not indicative of the performance of our core mining business and do not necessarily reflect the underlying operating results for the periods presented. Additionally, it is aligned with how we
present our forward-looking guidance on gold ounces and copper pounds produced.
Attributable EBITDA margin is calculated as attributable EBITDA divided by
revenues - as adjusted. We
believe this ratio will assist analysts, investors and other stakeholders of Barrick to better understand the relationship between revenues and
EBITDA or operating profit.
Net leverage is calculated as debt, net of cash
divided by the sum of adjusted EBITDA of the last four consecutive quarters. We believe this ratio will assist analysts, investors and other stakeholders of Barrick in monitoring our leverage and evaluating our balance
sheet.
EBITDA, adjusted EBITDA, attributable EBITDA, attributable EBITDA margin
and net leverage are intended to provide additional information to investors and analysts and do not have any standardized definition under IFRS, and should not be considered in isolation or as a substitute for measures of performance prepared in
accordance with IFRS. EBITDA, adjusted EBITDA and attributable EBITDA exclude the impact of cash costs of financing activities and taxes, and the effects of changes in operating working capital balances, and therefore are not necessarily indicative
of operating profit or cash flow from operations as determined under IFRS. Other companies may calculate EBITDA, adjusted EBITDA, attributable EBITDA, attributable EBITDA margin and net leverage
differently.
Reconciliation of Net Earnings to EBITDA, Adjusted EBITDA and Attributable EBITDA
|
|
|
|
|
|
|
|
|
|
|
|
|
|
|
|
|
|
|
|
|
|
|
For the three months ended |
|
For the years ended |
| ($ millions) |
12/31/25
|
9/30/25 |
|
|
12/31/25
|
12/31/24 |
12/31/23 |
| Net earnings |
3,213 |
|
1,904 |
|
|
|
7,154 |
|
3,088 |
|
1,953 |
|
| Income tax
expense |
794 |
|
477 |
|
|
|
1,651 |
|
1,520 |
|
861 |
|
Finance costs,
neta |
42 |
|
21 |
|
|
|
138 |
|
143 |
|
83 |
|
| Depreciation |
599 |
|
460 |
|
|
|
1,906 |
|
1,915 |
|
2,043 |
|
| EBITDA
|
4,648
|
|
2,862
|
|
|
|
10,849
|
|
6,666
|
|
4,940
|
|
Impairment charges (reversals) of
non-current assetsb |
5 |
|
3 |
|
|
|
12 |
|
(457) |
|
312 |
|
Acquisition/disposition
gainsc |
(1,146) |
|
(250) |
|
|
|
(1,107) |
|
(24) |
|
(364) |
|
| Loss on currency
translation |
6 |
|
(3) |
|
|
|
3 |
|
39 |
|
93 |
|
Other expense adjustmentsd |
559 |
|
47 |
|
|
|
823 |
|
249 |
|
96 |
|
|
|
|
|
|
|
|
|
Income tax expense, net finance
costsa, and depreciation from equity investees |
238 |
|
197 |
|
|
|
732 |
|
532 |
|
397 |
|
| Adjusted
EBITDA |
4,310
|
|
2,856
|
|
|
|
11,312
|
|
7,005
|
|
5,474
|
|
| Non-controlling Interests |
(1,226) |
|
(834) |
|
|
|
(3,155) |
|
(1,820) |
|
(1,487) |
|
| Attributable
EBITDA |
3,084
|
|
2,022
|
|
|
|
8,157
|
|
5,185
|
|
3,987
|
|
Revenues
- as adjustede |
4,810
|
|
3,405
|
|
|
|
13,950
|
|
10,724
|
|
9,411
|
|
Attributable
EBITDA marginf |
64
|
% |
59
|
% |
|
|
58
|
% |
48
|
% |
42
|
% |
|
|
|
|
|
As at
12/31/25 |
As at
12/31/24 |
As at
12/31/23 |
Net leverageg |
|
|
|
|
-0.2:1 |
0.1:1 |
0.1:1 |
a.Finance costs
exclude accretion.
b.There were no significant impairment charges or reversals in 2025. Net impairment reversals for 2024 mainly relate to long-lived
asset impairment reversals at Lumwana and Veladero, partially offset by a goodwill impairment at Loulo-Gounkoto.
c.Acquisition/disposition
gains for 2025 relate to gain on sale of our 50% interest in the Donlin Gold project in Q2 2025, and sale of our Hemlo gold mine, our interest in the Tongon gold mine and the Alturas project, all occurring in Q4 2025. Q4 2025 was further impacted
by the accounting impact of regaining control of the Loulo-Gounkoto complex on December 16, 2025, which largely offset the losses recognized earlier in 2025 relating to the deconsolidation and recognition of an investment at fair value following the
change of control after it was placed under a temporary provisional administration on June 16, 2025. The acquisition/disposition gains in Q3 2025 mainly related to the revaluation of our 80% equity investment in Loulo-Gounkoto, as it was
deconsolidated and an investment at fair value was recognized in Q2 2025, as described above.
d.Other expense
adjustments for Q4 2025 and 2025 mainly relate to the settlement payment to the Government of Mali in November 2025 and the fair value increment on inventory resulting from the purchase price allocation when we regained control of Loulo-Gounkoto.
2025 was further impacted by reduced operations costs at Loulo-Gounkoto. Other expense adjustments for 2024 mainly relate to a payment to the Government of Mali to advance negotiations, a customs and royalty settlement at Tongon, interest and
penalties recognized following the settlement of the Zaldívar Tax Assessments in Chile, a provision made relating to a legacy mine site operated by Homestake Mining Company that was closed prior to the 2001 acquisition by Barrick, and an
accrual relating to the road construction in Tanzania per our community investment obligations under the Twiga partnership.
e.Refer to
Reconciliation of Sales to Realized Price per pound/ounce on page 69 of this MD&A.
f.Represents
attributable EBITDA divided by revenues - as adjusted.
g.Represents debt, net of cash divided by adjusted EBITDA of the last four consecutive quarters.
|
|
|
|
|
|
|
|
|
BARRICK YEAR-END 2025 |
68 |
MANAGEMENT’S DISCUSSION AND
ANALYSIS |
Realized
Price
Realized
price is a non-GAAP financial measure which excludes from sales:
■Treatment and
refining charges; and
■Cumulative catch-up adjustment to revenue relating to our streaming arrangements.
We believe this provides investors and
analysts with a more accurate measure with which to compare to market gold and copper prices and to assess our gold and copper sales performance. For those reasons, management believes that this measure provides a more accurate reflection of our
Company’s past performance and is a better indicator of its expected performance in future
periods.
The realized price measure is intended to provide additional information,
and does not have any standardized definition under IFRS and should not be considered in isolation or as a substitute for measures of performance prepared in accordance with IFRS. The measure is not necessarily indicative of sales as determined
under IFRS. Other companies may calculate this measure differently. The following table reconciles realized prices to the most directly comparable IFRS measure.
Reconciliation of Sales to Realized Price per ounce/pound
|
|
|
|
|
|
|
|
|
|
|
|
|
|
|
|
|
|
|
|
|
|
|
|
|
|
|
|
|
|
|
|
|
| ($ millions, except per ounce/pound information
in dollars) |
For the
three months ended |
For the years
ended |
| Gold |
Copper |
Gold |
Copper |
| |
12/31/25
|
9/30/25 |
12/31/25
|
9/30/25 |
12/31/25
|
12/31/24 |
12/31/23
|
12/31/25
|
12/31/24
|
12/31/23
|
| Sales |
5,353 |
|
3,748 |
|
514 |
|
320 |
|
15,147 |
|
11,820 |
|
10,350
|
|
1,475
|
|
855
|
|
795
|
|
| Sales applicable to non-controlling
interests |
(1,756) |
|
(1,237) |
|
0 |
|
0 |
|
(4,895) |
|
(3,579) |
|
(3,179) |
|
0 |
|
0 |
|
0 |
|
Sales applicable to equity method investmentsa,b |
418 |
|
377 |
|
233 |
|
147 |
|
1,353 |
|
849 |
|
667 |
|
679 |
|
603 |
|
587 |
|
|
|
|
|
|
|
|
|
|
|
|
Sales applicable to sites in closure or care and maintenancec |
(5) |
|
(1) |
|
0 |
|
0 |
|
(8) |
|
(8) |
|
(15) |
|
0 |
|
0 |
|
0 |
|
| Treatment and refining charges |
10 |
|
7 |
|
53 |
|
44 |
|
30 |
|
29 |
|
30 |
|
179 |
|
162 |
|
191 |
|
|
|
|
|
|
|
|
|
|
|
|
Otherd |
(10) |
|
0 |
|
0 |
|
0 |
|
(10) |
|
(7) |
|
(15) |
|
0 |
|
0 |
|
0 |
|
| Revenues – as
adjusted |
4,010 |
|
2,894 |
|
800 |
|
511 |
|
11,617 |
|
9,104 |
|
7,838 |
|
2,333 |
|
1,620 |
|
1,573 |
|
Ounces/pounds
sold (000s ounces/millions pounds)c |
960
|
|
837
|
|
147
|
|
116
|
|
3,318
|
|
3,798
|
|
4,024
|
|
494
|
|
391
|
|
408
|
|
Realized gold/copper price per ounce/pounde |
4,177 |
|
3,457 |
|
5.42 |
|
4.39 |
|
3,501 |
|
2,397 |
|
1,948 |
|
4.72 |
|
4.15 |
|
3.85 |
|
a.Represents
sales of $327 million and $1,038 million, respectively, for Q4 2025 and 2025 (Q3 2025: $294 million; 2024: $741 million; 2023: $667 million) applicable to our 45% equity method investment in Kibali and $91 million and $315
million, respectively (Q3 2025: $83 million; 2024: $108 million; 2023: $nil) applicable to our 24.5% equity method investment in Porgera for gold. Represents sales of $151 million and $394 million,
respectively, for Q4 2025 and 2025 (Q3 2025: $77 million; 2024: $357 million; 2023: $253 million) applicable to our 50% equity method investment in Zaldívar and $83 million and $291 million, respectively (Q3
2025: $71 million; 2024: $270 million; 2023: $253 million) applicable to our 50% equity method investment in Jabal Sayid for copper.
b.Sales
applicable to equity method investments are net of treatment and refinement charges.
c.On an
attributable basis. Excludes Pierina, which was producing incidental ounces until December 31, 2023 while in closure. It also excludes Long Canyon which is producing residual ounces from the leach pad while in care and maintenance.
d.Represents
cumulative catch-up adjustment to revenue relating to our streaming arrangements. Refer to note 2e to the Financial Statements for more information.
e.Realized price
per ounce/pound may not calculate based on amounts presented in this table.
|
|
|
|
|
|
|
|
|
BARRICK YEAR-END 2025 |
69 |
MANAGEMENT’S DISCUSSION AND
ANALYSIS |
The scientific and technical information contained in this MD&A has been reviewed and approved by Tricia Evans, BSc, SMERM, Mineral
Resource Manager: North America; Mark Roux, BSc (Hons), P. Grad. Cert. (Geostatistics), Pr. Sci. Nat, Resource Geology Lead – North America; Richard Peattie, MPhil, FAusIMM, Mineral Resources Manager:
Africa and Middle East; Peter Jones, MAIG, Manager Resource Geology – South America & Asia Pacific; and Joel Holliday, FAusIMM,
Executive Vice-President, Exploration – each a “Qualified Person” as defined in National Instrument 43-101 – Standards of Disclosure for Mineral Projects.
All mineral reserve and mineral resource estimates are estimated in accordance with National Instrument 43-101 – Standards of Disclosure for Mineral Projects. Unless otherwise noted, such mineral reserve and mineral resource estimates are as of December 31,
2025.
1A Tier One Gold
Asset is an asset with a $1,400/oz reserve with potential to deliver a minimum 10-year life, annual production of at least 500,000 ounces of gold and with costs per ounce in the lower half of the industry cost curve. Tier One Assets must be
located in a world-class geological district with potential for organic reserve growth and long-term geologically driven addition.
2A Tier Two Gold
Asset is an asset with a reserve with potential to deliver a minimum 10-year life, annual production of at least 250,000 ounces of gold and TCC/oz over the mine life that are in the lower half of the industry cost curve.
3A Tier One Copper Asset/Project is an asset with a $3.00/lb reserve with potential for +5Mt contained copper in support of
at least 20 years life, annual production of at least 200ktpa, with costs per pound in the lower half of the industry cost curve.
4A Strategic Asset
is an asset, which in the opinion of Barrick, has the potential to deliver significant unrealized value in the future.
5Currently
consists of Barrick’s Lumwana mine, Zaldívar and Jabal Sayid joint ventures, and Reko Diq project.
6Further
information on these non-GAAP financial measures, including detailed reconciliations, is included on pages 57 to 69 of this MD&A.
7Gold
COS/oz is calculated as cost of sales across our gold operations (excluding sites in closure or care and maintenance) divided by ounces sold (both on an attributable basis using Barrick’s ownership share). Copper COS/lb is calculated
as cost of sales across our copper operations divided by pounds sold (both on an attributable basis using Barrick’s ownership share).
8TRIFR is a ratio calculated as follows: number of reportable injuries x 1,000,000 hours divided by the total number of hours
worked. Reportable injuries include fatalities, lost time injuries, restricted duty injuries, and medically treated injuries. LTIFR is a ratio calculated as follows: number of lost time injuries x 1,000,000 hours divided by the total number of
hours worked.
9Class 1 - High Significance is defined as an incident that causes significant negative impacts on human health or the environment
or an incident that extends onto publicly accessible land and has the potential to cause significant adverse impact to surrounding communities, livestock or wildlife.
10Categories as defined in the Greenhouse Gas Protocol’s Technical Guidance for Calculating Scope 3 Emissions. Achievement of
Barrick’s Scope 3 targets will require collaboration with suppliers and customers in our value chain, which are outside of Barrick’s direct control.
11Preliminary figures and subject to external
assurance.
12All mineral resource and mineral reserve estimates of tonnes, Au oz, Ag oz and Cu Mt are reported to the second significant digit.
All measured and indicated mineral resource estimates of grade and all proven and probable mineral reserve estimates of grade for Au g/t, Ag g/t and Cu % are reported to two decimal places. All inferred mineral resource estimates of grade
for Au g/t, Ag g/t and Cu % are reported to one decimal place. 2025 polymetallic mineral resources and mineral reserves are estimated using the combined value of gold, copper & silver and accordingly are reported as gold, copper &
silver mineral resources and mineral reserves.
13Estimated in
accordance with National Instrument 43-101 - Standards of Disclosure for Mineral Projects as required by Canadian securities regulatory authorities. Estimates are as of December 31, 2025, unless otherwise noted. Proven reserves of 390
million tonnes grading 1.38 g/t, representing 17 million ounces of gold, and 520 million tonnes grading 0.38%, representing 2.0 million tonnes of copper. Probable reserves of 2,300 million tonnes grading 0.91 g/t, representing 68 million
ounces of gold, and 3,400 million tonnes grading 0.47%, representing 16 million tonnes of copper. Measured resources of 570 million tonnes grading 1.45 g/t, representing 26 million ounces of gold, and 740 million tonnes grading 0.36%,
representing 2.7 million tonnes of copper. Indicated resources of 4,200 million tonnes grading 0.95 g/t, representing 130 million ounces of gold, and 5,300 million tonnes grading 0.40%, representing 21 million tonnes of copper. Inferred
resources of 1,300 million tonnes grading 1.0 g/t, representing 43 million ounces of gold, and 1,400
|
|
|
|
|
|
|
|
|
BARRICK YEAR-END 2025 |
70 |
MANAGEMENT’S DISCUSSION AND
ANALYSIS |
million tonnes grading 0.3%, representing 4.2 million tonnes of copper. Totals may not appear to sum correctly due to rounding. Complete
mineral reserve and mineral resource data for all mines and projects referenced in this MD&A, including tonnes, grades, and ounces, can be found on pages 74-83 of Barrick’s Fourth Quarter and Year-End 2025 Report.
14Estimated in accordance with National Instrument 43-101 - Standards of Disclosure for Mineral Projects as required by Canadian securities regulatory authorities. Estimates are as of December 31, 2024, unless otherwise noted. Proven reserves of 270
million tonnes grading 1.75 g/t, representing 15 million ounces of gold, and 380 million tonnes grading 0.42%, representing 1.6 million tonnes of copper. Probable reserves of 2,500 million tonnes grading 0.90 g/t, representing 74 million
ounces of gold, and 3,600 million tonnes grading 0.46%, representing 17 million tonnes of copper. Measured resources of 450 million tonnes grading 1.68 g/t, representing 24 million ounces of gold, and 600 million tonnes grading 0.38%,
representing 2.3 million tonnes of copper. Indicated resources of 4,800 million tonnes grading 1.01 g/t, representing 150 million ounces of gold, and 5,400 million tonnes grading 0.39%, representing 22 million tonnes of copper. Inferred
resources of 1,400 million tonnes grading 0.9 g/t, representing 41 million ounces of gold, and 1,300 million tonnes grading 0.3%, representing 3.9 million tonnes of copper. Totals may not appear to sum correctly due to rounding. Complete 2024
mineral reserve and mineral resource data for all mines and projects referenced in this MD&A, including tonnes, grades, and ounces, can be found on pages 32-45 of Barrick’s Annual Information Form/Form 40-F for the year ended
December 31, 2024 on file with Canadian provincial securities regulatory authorities and the U.S. Securities and Exchange Commission.
15Reserve
replacement measures attributable reserve gains in ounces or gold equivalent ouncesa calculated from the cumulative net change in attributable reserve in ounces or gold equivalent ouncesa, respectively, from the most recently completed three years (excluding any attributable acquisitions or
divestments).
The three-year rolling average gold mineral
reserve replacement percentage is calculated from the cumulative net change in attributable reserves in ounces from the three most recently completed years divided by the cumulative depletion in attributable reserve in ounces from the three most
recently completed years as set forth in the table below (excluding attributable acquisitions and divestments).b
The three-year average gold equivalent replacement percentage is calculated from the cumulative net change in attributable reserves in gold
equivalent ouncesa from the three most recently completed years divided by the cumulative depletion in attributable reserve in gold equivalent ouncesa from the three most recently completed years as set forth in the table below (excluding attributable acquisitions and divestments):b
|
|
|
|
|
|
|
|
|
|
|
|
|
|
|
|
|
|
|
|
|
| Year |
Attributable P&P Gold (Moz) |
Attributable P&P Gold Depletion (Moz) |
Attributable P&P Gold Net Change (Moz) |
Attributable P&P (GEOa) |
Attributable P&P Depletion (GEOa) |
Attributable P&P Net Change GEO (using reported reserve prices)a |
2023c |
77
|
(4.6)
|
5
|
105
|
(6.0)
|
6.7 |
2024d |
89
|
(4.6)
|
17
|
176
|
(6.1)
|
79 |
2025e |
85
|
(3.7)
|
1.8
|
171
|
(5.1)
|
1.4 |
2023 - 2025 Totalf |
N/A |
(12.9) |
23.8 |
N/A |
(17.2) |
87 |
a Gold equivalent ounces calculated
from our copper assets are calculated using long-term mineral reserve commodity prices of (I) $1,500/oz gold and $3.25/lb copper for 2025, (ii) $1,400/oz gold and $3.00/lb copper for 2024, and (iii) $1,300/oz gold and
$3.00/lb copper for 2023. All gold equivalent ounces are reported to the second significant digit.
b Complete mineral reserves and mineral resource data for all mines and projects, including tonnes, grades, and ounces, can be found in the Mineral
Reserves and Mineral Resources Tables included in pages # to # of the MD&A accompanying Barrick’s fourth quarter and full year 2025 financial statements filed on SEDAR+ at www.sedarplus.ca and on EDGAR at www.sec.gov. All estimates are
estimated in accordance with National Instrument 43-101 - Standards of Disclosure for Mineral Projects as required by Canadian securities regulatory authorities.
c Estimates are as of December 31, 2023. Proven mineral reserves of 250 million tonnes grading 1.85g/t, representing 15 million ounces of gold,
and 320 million tonnes grading 0.41%, representing 1.3 million tonnes of copper. Probable reserves of 1,200 million tonnes grading 1.61g/t, representing 61 million ounces of gold, and 1,100 million tonnes grading 0.38%, representing 4.3 million
tonnes of copper.
d Estimates are as of December 31, 2024. Proven mineral reserves of 270 million tonnes grading 1.75g/t, representing 15 million ounces of gold,
and 380 million tonnes grading 0.42%, representing 1.6 million tonnes of copper. Probable reserves of 2,500 million tonnes grading 0.90g/t, representing 74 million ounces of gold, and 3,600 million tonnes grading 0.46%, representing 17 million
tonnes of copper.
e Estimates are as of December 31, 2025. Proven mineral reserves of 390 million tonnes grading 1.38g/t, representing 17 million ounces of gold,
and 520 million tonnes grading 0.38%, representing 2.0 million tonnes of copper. Probable reserves of 2,300 million tonnes grading 0.91g/t, representing 68 million ounces of gold, and 3,900 million tonnes grading 0.46%, representing 18 million
tonnes of copper.
f Totals may not appear to sum correctly due to
rounding.
|
|
|
|
|
|
|
|
|
BARRICK YEAR-END 2025 |
71 |
MANAGEMENT’S DISCUSSION AND
ANALYSIS |
16Fourmile Significant Interceptsa
|
|
|
|
|
|
|
|
|
|
|
|
|
|
|
|
|
|
|
|
|
| Drill Results from Q4 2025 |
Drill Holeb |
Azimuth
|
Dip
|
Interval
(m) |
Width (m)
|
True Width (m)c |
Au
(g/t) |
| FM25-260DW1 |
152 |
(82) |
1335.3 - 1338.7 |
3.4 |
3.4 |
37.16 |
| FM25-262D
|
5
|
(86)
|
714.5 -
720.7 |
6.2
|
6.2
|
26.83
|
|
|
|
863 -
868.7 |
5.7
|
5.7
|
20.34
|
| FM25-263D |
25 |
(82) |
711.9 - 718.4 |
6.5 |
6.5 |
13.98 |
|
|
|
845.2 - 865.2 |
20.0 |
16.0 |
23.58 |
| FM25-291D
|
50
|
(79)
|
897.2 -
910.4 |
13.2
|
10.5
|
4.10
|
|
|
|
922.3
- 925.7 |
3.4
|
2.7
|
4.18
|
|
|
|
1378.2 - 1381.9 |
3.7 |
2.3 |
34.47 |
|
|
|
1519.1 -
1527.4 |
8.3
|
5.1
|
20.56
|
|
|
|
1548.5 - 1552 |
3.5 |
2.2 |
15.24 |
| FM25-300D |
51 |
(74) |
1314.6 - 1330.6 |
16.0 |
13.4 |
38.35 |
| FM25-303D
|
123
|
(75)
|
1131.4
- 1134.9 |
3.5
|
2.6
|
13.93
|
| FM25-314D |
41 |
(80) |
1291.4 - 1312.8 |
21.4 |
12.0 |
12.74 |
| FM25-316D
|
97
|
(79)
|
1244.8
- 1247.4 |
2.6
|
2.5
|
22.44
|
| FM25-318D |
66 |
(84) |
877.2 - 880 |
2.8 |
2.8 |
4.61 |
|
|
|
1201.5 - 1204.6 |
3.1 |
2.7 |
4.43 |
| FM25-319D
|
52
|
(75)
|
1129.9
- 1137.8 |
7.9
|
7.5
|
5.36
|
|
|
|
1143.6 -
1150.3 |
6.7
|
6.7
|
20.15
|
|
|
|
1200.6 - 1206.1 |
5.5 |
4.3 |
25.12 |
|
|
|
1353.6 - 1358.2 |
4.6 |
1.2 |
11.34 |
|
|
|
1391.7 - 1395.4 |
3.7 |
3.7 |
9.31 |
| FM25-321D |
195 |
(85) |
728.3 - 743.6 |
15.3 |
15.0 |
12.89 |
|
|
|
1092.1 - 1095.1 |
3.0 |
3.0 |
6.75 |
|
|
|
1101.2 - 1128.1 |
26.9 |
12.2 |
33.71 |
|
|
|
1150 - 1160.7 |
10.7 |
3.6 |
5.15 |
| FM25-326D
|
50
|
(72)
|
1214.6
- 1219.2 |
4.6
|
3.8
|
11.08
|
| FM25-328D |
245 |
(82) |
1127 - 1129.4 |
2.4 |
2.4 |
5.96 |
|
|
|
1137.2 - 1150.6 |
13.4 |
13.4 |
14.71 |
|
|
|
1185.7 - 1188.3 |
2.6 |
2.0 |
14.94 |
|
|
|
1201.2 - 1207 |
5.8 |
5.0 |
39.78 |
|
|
|
|
|
|
|
|
|
|
|
|
|
|
|
|
|
|
|
|
|
|
|
|
|
|
|
|
|
|
|
|
|
|
|
|
|
|
|
|
|
|
a.All intercepts calculated using a 3.4 g/t Au cutoff and are uncapped; minimum downhole intercept width is 2.4
meters; internal dilution is less than 20% total
width.
b.Fourmile drill hole nomenclature: Project area (FM - Fourmile) followed by the year (25 for 2025) then hole
number.
c.True width (TW) for FM drillholes has been estimated based on the latest geological and ore controls model and it is subject
to refinement as additional data becomes available.
The drilling results for Fourmile contained in this MD&A have been prepared in accordance with National Instrument 43-101 – Standards of Disclosure for Mineral Projects. All drill hole assay information has been manually reviewed and approved by staff geologists and re-checked by the project manager. Sample
preparation and analyses are conducted by an independent laboratory, ALS Minerals. Procedures are employed to ensure security of samples during their delivery from the drill rig to the laboratory. The quality assurance procedures, data verification
and assay protocols used in connection with drilling and sampling on Fourmile conform to industry accepted quality control methods.
17See the
Technical Report on the Cortez Complex, Lander and Eureka Counties, State of Nevada, USA, dated December 31, 2021, and filed on SEDAR+ at www.sedarplus.ca and EDGAR at www.sec.gov on March 18,
2022.
18H2 GRUG Significant Interceptsa
|
|
|
|
|
|
|
|
|
|
|
|
|
|
|
|
|
|
|
|
|
|
|
|
|
|
|
|
| Drill Results from Q4
2025 |
|
|
|
|
|
|
|
Includingc |
Drill
Holeb |
Azimuth |
Dip |
Interval (m) |
Width (m) |
|
Au (g/t) |
Interval
(m) |
Width
(m) |
Au
(g/t) |
| GRC-25001A |
154 |
(80) |
388.3-448.3 |
60 |
|
23.12 |
388.2-389.5 |
1.2 |
30.46 |
|
|
|
|
|
|
|
401.1-402.6 |
1.5 |
49.88 |
|
|
|
|
|
|
|
406.9-408.4 |
1.5 |
76 |
|
|
|
|
|
|
|
418.2-139.2 |
21 |
40.55 |
| GRC-25002
|
92
|
(79)
|
404-407.5
|
3.5
|
|
6.35
|
|
|
|
|
|
|
410.6-411.9 |
1.4 |
|
11.25 |
|
|
|
|
|
|
425.5-436.5 |
11 |
|
17.44 |
428.9-430.4 |
1.5 |
65 |
|
|
|
422.6-448.7 |
6.1 |
|
37.25 |
442.6-447.1 |
4.6 |
46.53 |
|
|
|
450.2-451.7 |
1.5 |
|
3.96 |
|
|
|
|
|
|
|
|
|
|
|
|
BARRICK YEAR-END 2025 |
72 |
MANAGEMENT’S DISCUSSION AND
ANALYSIS |
|
|
|
|
|
|
|
|
|
|
|
|
|
|
|
|
|
|
|
|
|
|
|
|
|
|
|
|
|
|
|
453.2-456.3 |
3 |
|
31.9 |
|
|
|
|
|
|
457.8-459.3 |
1.5 |
|
3.55 |
|
|
|
|
|
|
525.8-530.4 |
4.6 |
|
29.2 |
525.8-527.3 |
1.5 |
28 |
|
|
|
|
|
|
|
528.8-530.4 |
1.5 |
50.1 |
|
|
|
534-538.6
|
4.6
|
|
23
|
535.5-538.6
|
3
|
26.75
|
|
|
|
|
|
|
|
|
|
|
|
|
|
|
|
|
|
|
|
|
|
|
|
|
|
|
|
|
|
|
|
|
|
|
|
|
|
|
|
|
|
|
|
|
|
|
|
|
|
|
|
|
|
|
|
|
|
|
|
|
|
|
|
|
|
|
|
|
|
|
|
|
|
|
|
|
|
|
|
|
|
|
|
|
|
|
|
|
|
|
|
|
|
|
|
|
|
|
|
|
|
|
|
|
|
|
|
|
|
|
|
|
|
|
|
|
|
|
|
|
|
|
|
|
|
|
|
|
|
|
|
|
|
|
|
|
|
|
|
|
|
|
|
|
|
|
|
|
|
|
|
|
|
|
|
|
|
|
|
|
|
|
|
|
|
|
|
|
|
|
|
|
|
|
|
|
|
|
|
|
|
|
|
|
|
|
|
|
|
|
|
|
|
|
|
|
|
|
|
|
|
|
|
|
|
|
|
|
|
|
|
|
|
|
|
|
|
|
|
|
a.All intercepts calculated using a 3.4 g/t Au cutoff and are uncapped; minimum intercept width is 1.0 meters;
internal dilution is less than 20% total width.
b.Drill hole nomenclature: GRC Project area Goldrush followed by the year (25 for 2025) then hole
number.
c.Included intervals calculated using a 20.0 g/t intercept width and are uncapped; minimum intercept width is 1.0
meters; internal dilution is less than 20% total width.
The drilling results for Goldrush contained in this MD&A have been prepared in accordance with National Instrument 43-101 – Standards of Disclosure for Mineral Projects. All drill hole assay information has been manually reviewed and approved by staff geologists and re-checked by the project manager. Sample
preparation and analyses are conducted by an independent laboratory, ALS Minerals. Procedures are employed to ensure security of samples during their delivery from the drill rig to the laboratory. The quality assurance procedures, data verification
and assay protocols used in connection with drilling and sampling on Goldrush conform to industry accepted quality control methods.
19Refer to the
Technical Report on the Carlin Complex, Eureka and Elko County, Nevada, USA, dated March 14, 2025, and filed on SEDAR+ at www.sedarplus.ca and EDGAR at www.sec.gov on March 14,
2025.
20See the Technical Report on the Pueblo Viejo mine, Dominican Republic, dated March 17, 2023, and filed on SEDAR+ at
www.sedarplus.ca and EDGAR at www.sec.gov on March 17, 2023.
21Refer to the
Technical Report on the Reko Diq Project, Balochistan, Pakistan, dated February 19, 2025, and filed on SEDAR+ at www.sedarplus.ca and EDGAR at www.sec.gov on February 19,
2025.
22Estimated in accordance with National Instrument 43-101 - Standards of Disclosure for Mineral Projects as required by Canadian securities regulatory authorities. Estimates are as of December 31, 2024, unless otherwise noted. Reko Diq probable reserves
of 1,400 million tonnes grading 0.28 g/t representing 13 million ounces of gold, probable reserves of 1,500 million tonnes grading 0.48% representing 7.3 million tonnes of copper, indicated resources of 1,800 million tonnes grading 0.25 g/t
representing 15 million ounces of gold, inferred resources of 640 million tonnes grading 0.2 g/t representing 3.9 million ounces of gold, indicated resources of 2,000 million tonnes grading 0.43% representing 8.4 million tonnes of copper, and
inferred resources of 690 million tonnes grading 0.3% representing 2.2 million tonnes of copper. Complete 2024 mineral reserve and mineral resource data for all mines and projects referenced in this MD&A, including tonnes, grades, and ounces,
can be found on pages 83-92 of Barrick’s Fourth Quarter and Year-End 2024 Report.
23Refer to the
Technical Report on the Lumwana Expansion Project, Republic of Zambia, dated February 19, 2025, and filed on SEDAR+ at www.sedarplus.ca and EDGAR at www.sec.gov on February 19,
2025.
|
|
|
|
|
|
|
|
|
BARRICK YEAR-END 2025 |
73 |
MANAGEMENT’S DISCUSSION AND
ANALYSIS |
Glossary of Technical Terms
ALL-IN
SUSTAINING COSTS: A non-GAAP measure of cost per ounce/pound for gold/copper. Refer to page 59 of this MD&A for further
information and a reconciliation of the measure.
AUTOCLAVE: Oxidation process in which high temperatures and pressures are applied to convert refractory sulfide mineralization into amenable oxide
ore.
BY-PRODUCT: A secondary metal or mineral product recovered in the milling process such as silver.
C1 CASH COSTS: A non-GAAP
measure of cost per pound for copper. Refer to page 59 of this MD&A for further information and a reconciliation of the measure.
CONCENTRATE: A very fine,
powder-like product containing the valuable ore mineral from which most of the waste mineral has been eliminated.
CONTAINED OUNCES: Represents
ounces in the ground before loss of ounces not able to be recovered by the applicable metallurgical processing process.
DEVELOPMENT: Work carried out
for the purpose of gaining access to an ore body. In an underground mine, this includes shaft sinking, crosscutting, drifting and raising. In an open-pit mine, development includes the removal of overburden (more commonly referred to as stripping in
an open pit).
DILUTION: The effect of waste or low-grade ore which is unavoidably extracted and comingled with the ore mined thereby lowering the recovered grade from what
was planned to be mined.
DORÉ: Unrefined gold and silver bullion bars usually consisting of approximately 90 percent precious metals that will be further refined to almost
pure
metal.
DRILLING:
Core: drilling
with a hollow bit with a diamond cutting rim to produce a cylindrical core that is used for geological study and assays.
Reverse circulation: drilling that uses a rotating cutting bit within a double-walled drill pipe and produces rock chips rather than core. Air or water is circulated
down to the bit between the inner and outer wall of the drill pipe. The chips are forced to the surface through the center of the drill pipe and are collected, examined and assayed.
In-fill:
drilling closer spaced holes in between existing holes, used to provide greater geological detail and to help upgrade resource estimates to reserve estimates.
Step-out:
drilling to intersect a mineralized horizon or structure along strike or
down-dip.
EXPLORATION: Prospecting, sampling, mapping, drilling and other work involved in searching for
minerals.
FREE CASH FLOW: A non-GAAP measure that reflects our ability to generate cash flow. Refer to page 58 of this MD&A for a
definition.
GRADE: The amount of metal in each tonne of ore, expressed as grams per tonne (g/t) for precious metals and as a percentage for most other
metals.
Cut-off grade: the minimum metal grade at which an ore body can be economically mined (used in the calculation of ore
reserves).
Mill-head grade: metal content per tonne of ore going into a mill for processing.
Reserve grade:
estimated metal content of an ore body, based on reserve
calculations.
HEAP LEACHING: A process whereby
gold/copper is extracted by “heaping” broken ore on sloping impermeable pads and continually applying to the heaps a weak cyanide solution/sulfuric acid which dissolves the contained gold/copper. The gold/copper-laden
solution is then collected for gold/copper recovery.
HEAP LEACH PAD: A large impermeable foundation or pad used as a base for stacking ore for the purpose of heap
leaching.
MILL: A processing facility where ore is finely ground and thereafter undergoes physical or chemical treatment to extract the valuable
metals.
MINERAL RESERVE: See pages 74 to 83 – Summary Gold/Copper Mineral Reserves and Mineral
Resources.
MINERAL RESOURCE: See pages 74 to 83 – Summary Gold/Copper Mineral Reserves and Mineral
Resources.
OPEN PIT: A mine where the minerals are mined entirely from the surface.
ORE: Rock, generally containing
metallic or non-metallic minerals, which can be mined and processed at a
profit.
ORE BODY: A sufficiently large amount of ore that can be mined economically.
OUNCES: Troy ounce is a unit of
measure used for weighing gold at 999.9 parts per thousand purity and is equivalent to 31.1035g.
RECLAMATION: The process by
which lands disturbed as a result of mining activity are modified to support future beneficial land use. Reclamation activity may include the removal of buildings, equipment, machinery and other physical remnants of mining, closure of tailings
storage facilities, leach pads and other mine features, and contouring, covering and re-vegetation of waste rock dumps and other disturbed areas.
RECOVERY RATE: A term used in
process metallurgy to indicate the proportion of valuable material physically recovered in the processing of ore. It is generally stated as a percentage of the valuable material recovered compared to the total material originally contained in the
ore.
REFINING: The final stage of metal production in which impurities are removed through heating to extract the pure
metal.
ROASTING: The treatment of sulfide ore by heat and air, or oxygen enriched air, in order to oxidize sulfides and remove other elements (carbon, antimony or
arsenic).
SAFE CLOSURE: A closed tailings facility that does not pose ongoing material risks to people or the environment which has been confirmed by an Independent
Tailings Review Board or senior independent technical reviewer and signed off by an Accountable Executive as defined by the Global Industry Standard on Tailings Management.
STRIPPING: Removal of overburden
or waste rock overlying an ore body in preparation for mining by open-pit methods.
TAILINGS: The material that remains after all economically and technically recoverable precious metals have been removed from the ore during
processing.
TOTAL CASH COSTS: A non-GAAP measure of cost per ounce for gold. Refer to page 59 of this MD&A for further information and a reconciliation of the
measure.
|
|
|
|
|
|
|
|
|
BARRICK YEAR-END 2025 |
74 |
MANAGEMENT’S DISCUSSION AND
ANALYSIS |
Mineral Reserves and Mineral
Resources
The tables on the next eight pages set forth Barrick’s interest in the total proven and probable gold, silver and copper reserves and in the
total measured, indicated and inferred gold, silver and copper resources and certain related information at each property. For further details of proven and probable mineral reserves and measured, indicated and inferred mineral resources by
category, metal and property, see pages 74 to 83.
The Company has carefully
prepared and verified the mineral reserve and mineral resource figures and believes that its method of estimating mineral reserves has been verified by mining experience. These figures are estimates, however, and no assurance can be given that the
indicated quantities of metal will be produced. Metal price fluctuations may render mineral reserves containing relatively lower grades of mineralization uneconomic. Moreover, short-term operating factors relating to the mineral reserves, such as
the need for orderly development of ore bodies or the processing of new or different ore grades, could affect the Company’s profitability in any particular accounting period.
Definitions
A mineral resource
is a concentration or occurrence of diamonds, natural solid inorganic material, or natural solid fossilized organic material including
base and precious metals, coal, and industrial minerals in or on the Earth’s crust in such form and quantity and of such a grade or quality that it has reasonable prospects for economic extraction. The location, quantity, grade, geological
characteristics and continuity of a mineral resource are known, estimated or interpreted from specific geological evidence and knowledge. Mineral resources are sub-divided, in order of increasing geological confidence, into inferred, indicated and
measured categories.
An inferred mineral resource is that part of a mineral resource for which quantity and grade or quality can be estimated on the basis of geological evidence and limited sampling
and reasonably assumed, but not verified, geological and grade continuity. The estimate is based on limited information and sampling gathered through appropriate techniques from locations such as outcrops, trenches, pits, workings and drill
holes.
An indicated mineral resource is that part of a mineral resource for which quantity, grade or quality, densities, shape and physical characteristics can be estimated with a level
of confidence sufficient to allow the appropriate application of technical and economic
parameters, to support mine planning and evaluation of the economic viability of the deposit. The estimate is based on detailed and reliable
exploration and testing information gathered through appropriate techniques from locations such as outcrops, trenches, pits, workings and drill holes that are spaced closely enough for geological and grade continuity to be reasonably
assumed.
A measured mineral resource is that part of a mineral resource for which quantity, grade or quality, densities, shape and physical characteristics are so well established that
they can be estimated with confidence sufficient to allow the appropriate application of technical and economic parameters, to support production planning and evaluation of the economic viability of the deposit. The estimate is based
on detailed and reliable exploration, sampling and testing information gathered through appropriate techniques from locations such as outcrops, trenches, pits, workings and drill holes that are spaced closely enough to confirm both geological and
grade continuity.
Mineral resources, which are not mineral reserves, do not have
demonstrated economic viability.
A mineral reserve is
the economically mineable part of a measured or indicated mineral resource demonstrated by at least a preliminary feasibility study. This study must include adequate information on mining, processing, metallurgical, economic and other relevant
factors that demonstrate, at the time of reporting, that economic extraction can be justified.
A mineral reserve
includes diluting materials and allowances for losses that may occur when the material is mined. Mineral reserves are sub-divided in
order of increasing confidence into probable mineral reserves and proven mineral reserves. A probable mineral
reserve is the economically mineable part of an indicated and, in some circumstances, a measured mineral resource demonstrated by at
least a preliminary feasibility study. This study must include adequate information on mining, processing, metallurgical, economic and other relevant factors that demonstrate, at the time of reporting, that economic extraction can be
justified.
A proven mineral reserve is the economically mineable part of a measured mineral resource demonstrated by at least a preliminary feasibility study. This study must include
adequate information on mining, processing, metallurgical, economic and other relevant factors that demonstrate, at the time of reporting, that economic extraction is
justified.
|
|
|
|
|
|
|
|
|
BARRICK YEAR-END 2025 |
75 |
MANAGEMENT’S DISCUSSION AND
ANALYSIS |
|
|
|
|
|
|
|
|
|
|
|
|
|
|
|
|
|
|
|
|
|
|
|
|
|
|
|
|
|
|
|
|
|
|
|
|
|
|
|
Gold Mineral Reserves1,2,3,5 |
|
|
|
|
|
|
|
| As at December 31,
2025 |
PROVEN
9 |
|
PROBABLE9 |
|
TOTAL
9 |
|
|
Tonnes |
Grade |
Contained ozs |
|
Tonnes |
Grade |
Contained ozs |
|
Tonnes |
Grade |
Contained ozs |
| Based on attributable ounces |
|
(Mt) |
(g/t) |
(Moz) |
|
(Mt) |
(g/t) |
(Moz) |
|
(Mt) |
(g/t) |
(Moz) |
AFRICA AND MIDDLE
EAST |
|
|
|
|
|
|
|
|
|
|
|
|
| Bulyanhulu surface |
|
0.0038 |
4.20 |
0.00052 |
|
— |
— |
— |
|
0.0038 |
4.20 |
0.00052 |
| Bulyanhulu underground |
|
0.71 |
5.95 |
0.14 |
|
16 |
7.03 |
3.7 |
|
17 |
6.98 |
3.8 |
| Bulyanhulu (84.00%) total |
|
0.71 |
5.95 |
0.14 |
|
16 |
7.03 |
3.7 |
|
17 |
6.98 |
3.8 |
| Jabal Sayid surface |
|
0.14 |
0.46 |
0.0021 |
|
— |
— |
— |
|
0.14 |
0.46 |
0.0021 |
| Jabal Sayid underground |
|
8.4 |
0.30 |
0.080 |
|
3.2 |
0.49 |
0.051 |
|
12 |
|
0.35 |
0.13 |
| Jabal Sayid (50.00%) total |
|
8.5 |
0.30 |
0.082 |
|
3.2 |
0.49 |
0.051 |
|
12 |
0.35 |
0.13 |
| Kibali surface |
|
7.0 |
2.17 |
0.49 |
|
21 |
2.28 |
1.5 |
|
28 |
2.25 |
2.0 |
| Kibali underground |
|
6.4 |
4.19 |
0.87 |
|
16 |
3.74 |
1.9 |
|
23 |
3.86 |
2.8 |
| Kibali (45.00%) total |
|
13 |
3.13 |
1.4 |
|
37 |
2.92 |
3.5 |
|
50 |
2.97 |
4.8 |
Loulo-Gounkoto surface4 |
|
8.7 |
2.56 |
0.71 |
|
15 |
3.34 |
1.7 |
|
24 |
3.06 |
2.4 |
Loulo-Gounkoto
underground4 |
|
6.4 |
5.40 |
1.1 |
|
21 |
5.04 |
3.4 |
|
27 |
5.13 |
4.5 |
Loulo-Gounkoto (80.00%)
total4 |
|
15 |
3.77 |
1.8 |
|
36 |
4.32 |
5.0 |
|
51 |
4.16 |
6.9 |
| North Mara surface |
|
5.4 |
3.22 |
0.55 |
|
30 |
1.66 |
1.6 |
|
35 |
1.90 |
2.2 |
| North Mara underground |
|
1.8 |
3.18 |
0.18 |
|
6.2 |
4.47 |
0.89 |
|
7.9 |
4.18 |
1.1 |
| North Mara (84.00%) total |
|
7.1 |
3.21 |
0.73 |
|
36 |
2.14 |
2.5 |
|
43 |
2.32 |
3.2 |
|
|
|
|
|
|
|
|
|
|
|
|
|
| AFRICA AND MIDDLE EAST
TOTAL |
45 |
2.87 |
4.1 |
|
130 |
3.55 |
15 |
|
170 |
3.37 |
19 |
| SOUTH AMERICA AND ASIA
PACIFIC |
|
|
|
|
|
|
|
|
|
|
| Norte Abierto surface (50.00%) |
|
240 |
0.69 |
5.4 |
|
280 |
0.61 |
5.4 |
|
520 |
0.65 |
11 |
| Porgera surface |
|
1.8 |
2.88 |
0.16 |
|
8.4 |
2.28 |
0.61 |
|
10 |
2.38 |
0.78 |
| Porgera underground |
|
1.2 |
5.85 |
0.23 |
|
2.5 |
4.97 |
0.40 |
|
3.7 |
5.26 |
0.63 |
| Porgera (24.50%) total |
|
3.0 |
4.10 |
0.40 |
|
11 |
2.89 |
1.0 |
|
14 |
3.15 |
1.4 |
|
|
|
|
|
|
|
|
|
|
|
|
|
| Reko Diq surface (50.00%) |
|
— |
— |
— |
|
1,400 |
0.28 |
13 |
|
1,400 |
0.28 |
13 |
| Veladero surface
(50.00%) |
|
25 |
0.67 |
0.53 |
|
38 |
0.70 |
0.85 |
|
62 |
0.69 |
1.4 |
| SOUTH AMERICA AND ASIA PACIFIC TOTAL |
270 |
0.73 |
6.3 |
|
1,800 |
0.36 |
20 |
|
2,000 |
0.41 |
26 |
NORTH
AMERICA |
|
|
|
|
|
|
|
|
|
|
|
|
| Carlin surface |
|
5.0 |
1.56 |
0.25 |
|
52 |
2.32 |
3.9 |
|
57 |
2.25 |
4.1 |
| Carlin underground |
|
— |
— |
— |
|
18 |
8.15 |
4.7 |
|
18 |
8.15 |
4.7 |
| Carlin (61.50%) total |
|
5.0 |
1.56 |
0.25 |
|
70 |
3.81 |
8.6 |
|
75 |
3.66 |
8.8 |
| Cortez surface |
|
1.6 |
1.96 |
0.099 |
|
60 |
0.92 |
1.8 |
|
62 |
0.95 |
1.9 |
| Cortez underground |
|
— |
— |
— |
|
28 |
6.67 |
6.0 |
|
28 |
6.67 |
6.0 |
| Cortez (61.50%) total |
|
1.6 |
1.96 |
0.099 |
|
88 |
2.76 |
7.8 |
|
90 |
2.75 |
7.9 |
|
|
|
|
|
|
|
|
|
|
|
|
|
|
|
|
|
|
|
|
|
|
|
|
|
|
|
|
|
|
|
|
|
|
|
|
|
|
|
|
|
|
|
|
|
|
|
|
|
|
|
|
| Phoenix surface (61.50%) |
|
4.2 |
0.71 |
0.097 |
|
110 |
0.57 |
1.9 |
|
110 |
0.58 |
2.0 |
Pueblo Viejo surface
(60.00%)13 |
|
54 |
2.22 |
3.8 |
|
130 |
1.99 |
8.5 |
|
190 |
2.06 |
12 |
| Turquoise Ridge surface |
|
— |
— |
— |
|
25 |
2.20 |
1.7 |
|
25 |
2.20 |
1.7 |
| Turquoise Ridge underground |
|
6.6 |
11.67 |
2.5 |
|
14 |
10.09 |
4.7 |
|
21 |
10.59 |
7.2 |
| Turquoise Ridge (61.50%) total |
|
6.6 |
11.67 |
2.5 |
|
39 |
5.12 |
6.4 |
|
46 |
6.07 |
8.9 |
NORTH AMERICA
TOTAL |
|
71 |
2.96 |
6.8 |
|
440 |
2.37 |
33 |
|
510 |
2.46 |
40 |
|
|
|
|
|
|
|
|
|
|
|
|
|
TOTAL |
|
390
|
1.38
|
17
|
|
2,300
|
0.91
|
68
|
|
2,700
|
0.98
|
85
|
|
| See “Mineral Reserves and Resources
Endnotes”. |
|
|
|
|
|
|
|
|
|
|
|
|
|
|
|
|
|
|
|
|
|
|
|
|
|
|
|
|
|
|
|
|
|
|
|
|
|
|
|
|
|
|
|
|
|
|
|
|
|
|
|
|
|
|
|
|
|
|
|
|
|
|
|
|
|
|
|
|
|
|
|
|
|
|
|
|
|
|
|
|
|
|
|
|
|
|
|
|
|
|
|
|
|
|
|
|
|
|
|
|
|
|
|
|
|
|
|
|
|
|
|
|
|
|
|
|
|
|
|
|
|
|
|
|
|
|
|
|
|
|
|
|
|
|
|
|
|
|
|
|
|
|
|
|
|
|
|
|
|
|
|
|
|
|
|
BARRICK YEAR-END 2025 |
76 |
MANAGEMENT’S DISCUSSION AND
ANALYSIS |
|
|
|
|
|
|
|
|
|
|
|
|
|
|
|
|
|
|
|
|
|
|
|
|
|
|
|
|
|
|
|
|
|
|
|
|
|
|
|
|
|
|
|
|
|
|
|
|
|
|
|
|
|
|
|
|
|
|
|
|
|
|
|
|
|
|
|
|
|
|
|
|
|
|
|
|
|
|
|
|
|
|
|
|
|
|
|
|
|
|
|
|
|
|
|
|
|
|
|
|
|
|
|
|
|
|
|
|
|
|
|
|
|
|
|
|
|
|
|
|
|
|
|
|
|
|
|
|
|
|
|
|
|
|
|
|
|
|
|
|
|
|
|
|
|
|
|
|
|
|
|
|
|
|
|
|
|
|
|
|
|
|
|
|
|
|
|
|
|
|
|
|
|
|
|
|
|
|
|
|
|
|
|
|
|
|
|
|
|
|
|
|
|
|
|
|
|
|
|
|
|
|
|
|
|
|
|
|
|
|
|
|
|
|
|
|
|
|
|
|
|
|
|
|
|
|
|
|
|
|
|
|
|
|
|
|
|
|
|
|
|
|
|
|
|
|
|
|
|
|
|
|
|
|
|
|
|
|
|
|
|
|
|
|
|
|
|
|
|
|
|
|
|
|
|
|
|
|
|
|
|
|
|
|
|
|
|
|
|
|
|
|
|
|
|
|
|
|
|
|
|
|
|
|
|
|
|
|
|
|
|
|
|
|
|
|
|
|
|
|
|
|
|
|
|
|
|
|
|
Copper Mineral Reserves1,2,3,5 |
|
|
|
|
|
|
|
| As at December 31,
2025 |
PROVEN
9 |
|
PROBABLE9 |
|
TOTAL
9 |
|
|
Tonnes |
Cu Grade |
Contained Cu |
|
Tonnes |
Cu Grade |
Contained Cu |
|
Tonnes |
Cu Grade |
Contained Cu |
| Based on attributable tonnes |
|
(Mt) |
(%) |
(Mt) |
|
(Mt) |
(%) |
(Mt) |
|
(Mt) |
(%) |
(Mt) |
AFRICA AND MIDDLE
EAST |
|
|
|
|
|
|
|
|
|
|
|
|
| Bulyanhulu surface |
|
0.0038 |
|
0.33 |
|
0.000013 |
|
|
— |
— |
— |
|
0.0038 |
0.33 |
0.000013 |
| Bulyanhulu underground |
|
0.71 |
|
0.32 |
|
0.0023 |
|
|
16 |
0.36 |
0.059 |
|
17 |
0.36 |
0.061 |
| Bulyanhulu (84.00%) total |
|
0.71 |
|
0.32 |
|
0.0023 |
|
|
16 |
0.36 |
0.059 |
|
17 |
0.36 |
0.061 |
| Jabal Sayid surface |
|
0.14 |
2.65 |
0.0038 |
|
— |
— |
— |
|
0.14 |
2.65 |
0.0038 |
| Jabal Sayid underground |
|
8.4 |
2.07 |
0.17 |
|
3.2 |
2.32 |
0.075 |
|
12 |
2.14 |
0.25 |
| Jabal Sayid (50.00%) total |
|
8.5 |
2.08 |
0.18 |
|
3.2 |
2.32 |
0.075 |
|
12 |
2.15 |
0.25 |
| Lumwana surface (100%) |
|
150 |
0.47 |
0.69 |
|
1,400 |
0.52 |
7.4 |
|
1,600 |
0.52 |
8.1 |
AFRICA AND MIDDLE EAST TOTAL |
|
160
|
0.56 |
0.87 |
|
1,400 |
0.53 |
7.5 |
|
1,600 |
0.53 |
8.4 |
| SOUTH AMERICA AND ASIA PACIFIC |
|
|
|
|
|
|
|
|
|
|
| Norte Abierto surface (50.00%) |
|
240 |
0.25 |
0.60 |
|
280 |
0.23 |
0.64 |
|
520 |
0.24 |
1.2 |
| Reko Diq surface (50.00%) |
|
— |
— |
— |
|
1,500 |
0.48 |
7.3 |
|
1,500 |
0.48 |
7.3 |
| Zaldívar surface (50.00%) |
|
120 |
0.41 |
0.47 |
|
62 |
0.38 |
0.24 |
|
180 |
0.40 |
0.71 |
| SOUTH AMERICA AND ASIA PACIFIC
TOTAL |
|
360 |
0.30 |
1.1 |
|
1,800 |
0.44 |
8.2 |
|
2,200 |
0.42 |
9.2 |
NORTH
AMERICA |
|
|
|
|
|
|
|
|
|
|
|
|
| Phoenix surface (61.50%) |
|
6.0 |
0.15 |
0.0092 |
|
120 |
0.18 |
0.22 |
|
130 |
0.18 |
0.23 |
NORTH AMERICA
TOTAL |
|
6.0 |
0.15 |
0.0092 |
|
120 |
0.18 |
0.22 |
|
130 |
0.18 |
0.23 |
|
|
|
|
|
|
|
|
|
|
|
|
|
|
|
|
|
|
|
|
|
|
|
|
|
|
TOTAL |
|
520 |
0.38 |
2.0 |
|
3,400 |
0.47 |
16 |
|
3,900 |
0.46 |
18 |
|
|
|
|
|
|
|
|
|
|
|
|
|
| See “Mineral Reserves and Resources
Endnotes”. |
|
|
|
|
|
|
|
|
|
|
|
|
|
|
|
|
|
|
|
|
|
|
|
|
|
|
|
|
|
|
|
|
|
|
|
|
|
|
|
|
|
|
|
|
|
|
|
|
|
|
|
|
|
|
|
|
|
|
|
|
|
|
|
|
|
|
|
|
|
|
|
|
|
|
|
|
|
|
|
|
|
|
|
|
|
|
|
|
|
|
|
|
|
|
|
|
|
|
|
|
|
|
|
|
|
|
|
|
|
Silver Mineral Reserves1,2,3,5 |
|
|
|
|
|
|
|
| As at December 31,
2025 |
|
PROVEN
9 |
|
PROBABLE9 |
|
TOTAL
9 |
|
|
Tonnes |
Ag Grade |
Contained Ag |
|
Tonnes |
Ag Grade |
Contained Ag |
|
Tonnes |
Ag Grade |
Contained Ag |
| Based on attributable ounces |
|
(Mt) |
(g/t) |
(Moz) |
|
(Mt) |
(g/t) |
(Moz) |
|
(Mt) |
(g/t) |
(Moz) |
AFRICA AND MIDDLE
EAST |
|
|
|
|
|
|
|
|
|
|
|
|
| Bulyanhulu surface |
|
0.0038 |
|
5.10 |
0.00063 |
|
|
— |
— |
— |
|
0.0038 |
5.10 |
0.00063 |
| Bulyanhulu underground |
|
0.71 |
|
5.46 |
|
0.12 |
|
|
16 |
5.32 |
2.8 |
|
17 |
5.32 |
2.9 |
| Bulyanhulu (84.00%) total |
|
0.71 |
|
5.45 |
|
0.12 |
|
|
16 |
5.32 |
2.8 |
|
17 |
5.32 |
2.9 |
AFRICA AND MIDDLE EAST
TOTAL |
|
0.71 |
|
5.45 |
|
0.12 |
|
|
16 |
5.32 |
2.8 |
|
17 |
5.32 |
2.9 |
|
|
|
|
|
|
|
|
|
|
|
|
|
|
|
|
|
|
|
|
|
|
|
|
|
|
|
|
|
|
|
|
|
|
|
|
|
|
|
| SOUTH AMERICA AND ASIA
PACIFIC |
|
|
|
|
|
|
|
|
|
|
| Norte Abierto surface (50.00%) |
|
240 |
1.88 |
15.0 |
|
280 |
1.38 |
12 |
|
520 |
1.61 |
27 |
|
|
|
|
|
|
|
|
|
|
|
|
|
| Veladero surface (50.00%) |
|
25 |
12.17 |
9.7 |
|
38 |
13.97 |
17 |
|
62 |
13.25 |
27 |
| SOUTH AMERICA AND ASIA PACIFIC
TOTAL |
|
270 |
2.83 |
24 |
|
310 |
2.88 |
29 |
|
580 |
2.86 |
54 |
NORTH
AMERICA |
|
|
|
|
|
|
|
|
|
|
|
|
| Phoenix surface (61.50%) |
|
4.2 |
7.89 |
1.1 |
|
110 |
6.54 |
22 |
|
110 |
6.59 |
23 |
Pueblo Viejo surface
(60.00%)13 |
|
54 |
12.01 |
21 |
|
130 |
12.42 |
53 |
|
190 |
12.30 |
74 |
NORTH AMERICA
TOTAL |
|
58 |
11.70 |
22 |
|
240 |
9.81 |
75 |
|
300 |
10.18 |
97 |
|
|
|
|
|
|
|
|
|
|
|
|
|
TOTAL |
|
330 |
4.40 |
46 |
|
570 |
5.85 |
110 |
|
900 |
5.32 |
150 |
|
|
|
|
|
|
|
|
|
|
|
|
|
| See “Mineral Reserves and Resources
Endnotes”. |
|
|
|
|
|
|
|
|
|
|
|
|
|
|
|
|
|
|
|
|
|
|
|
|
|
|
|
|
|
|
|
|
|
|
|
|
|
|
|
|
|
|
|
|
|
|
|
|
|
|
|
|
|
|
|
|
|
|
|
|
|
|
|
BARRICK YEAR-END 2025 |
77 |
MANAGEMENT’S DISCUSSION AND
ANALYSIS |
|
|
|
|
|
|
|
|
|
|
|
|
|
|
|
|
|
|
|
|
|
|
|
|
|
|
|
|
|
|
|
|
|
|
|
|
|
|
|
|
|
|
|
|
|
|
|
|
|
Gold Mineral Resources1,3,5,6,7,8 |
|
|
|
|
|
|
|
|
|
|
|
|
|
|
|
|
| As at December 31,
2025 |
MEASURED
(M)9 |
|
INDICATED (I)9 |
|
|
|
(M) +
(I)9 |
|
INFERRED10 |
|
|
|
|
|
|
Tonnes |
Grade |
Contained ozs |
|
Tonnes |
Grade |
Contained ozs |
|
|
|
Contained ozs |
|
Tonnes |
Grade |
Contained ozs |
|
|
|
|
|
| Based on attributable ounces |
(Mt) |
(g/t) |
(Moz) |
|
(Mt) |
(g/t) |
(Moz) |
|
|
|
(Moz) |
|
(Mt) |
(g/t) |
(Moz) |
|
|
|
|
|
AFRICA AND MIDDLE
EAST |
|
|
|
|
|
|
|
|
|
|
|
|
|
|
|
|
|
|
|
|
| Bulyanhulu surface |
0.0038 |
|
4.20 |
|
0.00052 |
|
|
— |
— |
— |
|
|
|
0.00052 |
|
— |
— |
— |
|
|
|
|
|
| Bulyanhulu underground |
2.4 |
|
8.16 |
|
0.63 |
|
|
27 |
7.56 |
6.7 |
|
|
|
7.3 |
|
9.4 |
7.3 |
2.2 |
|
|
|
|
|
| Bulyanhulu (84.00%) total |
2.4 |
|
8.16 |
|
0.63 |
|
|
27 |
7.56 |
6.7 |
|
|
|
7.3 |
|
9.4 |
7.3 |
2.2 |
|
|
|
|
|
|
|
|
|
|
|
|
|
|
|
|
|
|
|
|
|
|
|
|
|
|
| Jabal Sayid surface |
0.14 |
0.46 |
0.0021 |
|
— |
— |
— |
|
|
|
0.0021 |
|
— |
— |
— |
|
|
|
|
|
| Jabal Sayid underground |
9.3 |
0.37 |
0.11 |
|
5.4 |
0.54 |
0.094 |
|
|
|
0.20 |
|
1.2 |
0.6 |
0.022 |
|
|
|
|
|
| Jabal Sayid (50.00%) total |
9.4 |
0.37 |
0.11 |
|
5.4 |
0.54 |
0.094 |
|
|
|
0.21 |
|
1.2 |
0.6 |
0.022 |
|
|
|
|
|
| Kibali surface |
11 |
2.04 |
0.70 |
|
38 |
2.17 |
2.6 |
|
|
|
3.3 |
|
18 |
2.0 |
1.1 |
|
|
|
|
|
| Kibali underground |
10 |
4.09 |
1.3 |
|
32 |
3.35 |
3.4 |
|
|
|
4.8 |
|
4.5 |
2.4 |
0.35 |
|
|
|
|
|
| Kibali (45.00%) total |
21 |
3.04 |
2.0 |
|
70 |
2.71 |
6.1 |
|
|
|
8.1 |
|
22 |
2.1 |
1.5 |
|
|
|
|
|
Loulo-Gounkoto surface4 |
11 |
2.54 |
0.89 |
|
19 |
3.34 |
2.1 |
|
|
|
3.0 |
|
2.8 |
2.4 |
0.22 |
|
|
|
|
|
Loulo-Gounkoto
underground4 |
18 |
4.16 |
2.4 |
|
38 |
4.22 |
5.1 |
|
|
|
7.5 |
|
12 |
2.0 |
0.81 |
|
|
|
|
|
Loulo-Gounkoto (80.00%)
total4 |
29 |
3.55 |
3.3 |
|
57 |
3.93 |
7.2 |
|
|
|
10 |
|
15 |
2.1 |
1.0 |
|
|
|
|
|
| North Mara surface |
9.9 |
2.68 |
0.85 |
|
48 |
1.64 |
2.5 |
|
|
|
3.4 |
|
12 |
1.7 |
0.64 |
|
|
|
|
|
| North Mara underground |
5.3 |
2.09 |
0.36 |
|
26 |
2.45 |
2.0 |
|
|
|
2.4 |
|
5.2 |
2.2 |
0.36 |
|
|
|
|
|
| North Mara (84.00%) total |
15 |
2.47 |
1.2 |
|
74 |
1.92 |
4.6 |
|
|
|
5.8 |
|
17 |
1.9 |
1.0 |
|
|
|
|
|
|
|
|
|
|
|
|
|
|
|
|
|
|
|
|
|
|
|
|
|
|
AFRICA AND MIDDLE EAST TOTAL |
76 |
2.95 |
7.3 |
|
230 |
3.28 |
25 |
|
|
|
32 |
|
65 |
2.8 |
5.8 |
|
|
|
|
|
| SOUTH AMERICA AND ASIA
PACIFIC |
|
|
|
|
|
|
|
|
|
|
|
|
|
|
|
|
|
|
|
|
|
|
|
|
|
|
|
|
|
|
|
|
|
|
|
|
|
|
|
|
|
| Norte Abierto surface (50.00%) |
320 |
0.67 |
6.9 |
|
800 |
0.54 |
14 |
|
|
|
21 |
|
380 |
0.4 |
5.3 |
|
|
|
|
|
| Pascua Lama surface (100%) |
43 |
1.86 |
2.6 |
|
390 |
1.49 |
19 |
|
|
|
21 |
|
15 |
1.7 |
0.86 |
|
|
|
|
|
| Porgera surface |
6.1 |
2.94 |
0.58 |
|
19 |
2.18 |
1.3 |
|
|
|
1.9 |
|
14 |
1.6 |
0.72 |
|
|
|
|
|
| Porgera underground |
2.6 |
5.24 |
0.44 |
|
5.2 |
4.52 |
0.75 |
|
|
|
1.2 |
|
1.9 |
3.8 |
0.23 |
|
|
|
|
|
| Porgera (24.50%) total |
8.7 |
3.63 |
1.0 |
|
24 |
2.68 |
2.1 |
|
|
|
3.1 |
|
16 |
1.9 |
0.95 |
|
|
|
|
|
|
|
|
|
|
|
|
|
|
|
|
|
|
|
|
|
|
|
|
|
|
| Reko Diq surface (50.00%) |
— |
— |
— |
|
1,800 |
0.25 |
15 |
|
|
|
15 |
|
660 |
0.2 |
4.1 |
|
|
|
|
|
| Veladero surface (50.00%) |
27 |
0.66 |
0.58 |
|
73 |
0.64 |
1.5 |
|
|
|
2.1 |
|
14 |
0.6 |
0.26 |
|
|
|
|
|
| SOUTH AMERICA AND ASIA PACIFIC
TOTAL |
400 |
0.86 |
11 |
|
3,100 |
0.51 |
51 |
|
|
|
62 |
|
1,100 |
0.3 |
11 |
|
|
|
|
|
|
|
|
|
|
|
|
|
|
|
|
|
|
|
|
|
|
|
|
|
|
| See “Mineral Reserves and Resources
Endnotes”. |
|
|
|
|
|
|
|
|
|
|
|
|
|
|
|
|
|
|
|
|
|
|
|
|
|
|
|
|
|
|
|
|
|
|
|
|
|
|
|
|
|
|
|
|
|
|
|
|
|
|
|
|
|
|
|
|
|
|
|
|
|
|
|
|
|
|
|
|
|
|
|
|
|
|
|
|
|
|
|
|
|
|
|
|
|
|
|
|
|
|
|
|
|
|
|
|
|
|
|
|
|
|
|
|
|
|
|
|
|
|
|
|
|
|
|
|
|
|
|
|
|
|
|
|
|
|
|
|
|
|
|
|
|
|
|
|
|
|
|
|
|
|
|
|
|
|
|
|
|
|
|
|
|
|
|
|
|
|
|
|
|
|
|
|
|
|
|
|
|
|
|
|
|
|
|
|
|
|
|
|
|
|
|
|
|
|
|
|
|
|
|
|
|
|
|
|
|
|
|
|
|
|
|
|
|
|
|
|
|
|
|
|
|
|
|
|
|
|
|
|
|
|
|
|
|
|
|
|
|
|
|
|
|
|
|
|
|
|
|
|
|
|
|
|
|
|
|
|
|
|
|
|
|
|
|
|
|
|
|
|
|
|
|
|
|
|
|
|
|
|
|
|
|
|
|
|
|
|
|
|
|
|
|
|
|
|
|
|
|
|
|
|
|
|
|
|
|
|
|
|
|
|
|
|
|
|
|
|
|
|
|
|
|
|
|
|
|
|
|
|
|
|
|
|
|
|
|
|
|
|
|
|
|
|
|
|
|
|
|
|
|
|
|
|
|
|
|
|
|
|
|
|
|
|
|
|
|
|
|
|
|
|
|
|
|
|
|
|
|
|
|
BARRICK YEAR-END 2025 |
78 |
MANAGEMENT’S DISCUSSION AND
ANALYSIS |
|
|
|
|
|
|
|
|
|
|
|
|
|
|
|
|
|
|
|
|
|
|
|
|
|
|
|
|
|
|
|
|
|
|
|
|
|
|
|
|
|
|
|
|
|
|
|
|
|
Gold Mineral Resources1,3,5,6,7,8 |
|
|
|
|
|
|
|
|
|
|
|
|
|
|
|
|
| As at December 31,
2025 |
MEASURED
(M)9 |
|
INDICATED (I)9 |
|
|
|
(M) +
(I)9 |
|
INFERRED
10 |
|
|
|
|
|
|
Tonnes |
Grade |
Contained ozs |
|
Tonnes |
Grade |
Contained ozs |
|
|
|
Contained ozs |
|
Tonnes |
Grade |
Contained ozs |
|
|
|
|
|
| Based on attributable ounces |
(Mt) |
(g/t) |
(Moz) |
|
(Mt) |
(g/t) |
(Moz) |
|
|
|
(Moz) |
|
(Mt) |
(g/t) |
(Moz) |
|
|
|
|
|
NORTH
AMERICA |
|
|
|
|
|
|
|
|
|
|
|
|
|
|
|
|
|
|
|
|
| Carlin surface |
9.6 |
1.31 |
0.41 |
|
87 |
1.95 |
5.5 |
|
|
|
5.9 |
|
40 |
0.9 |
1.2 |
|
|
|
|
|
| Carlin underground |
— |
— |
— |
|
36 |
7.86 |
9.1 |
|
|
|
9.1 |
|
20 |
7.3 |
4.6 |
|
|
|
|
|
| Carlin (61.50%) total |
9.6 |
1.31 |
0.41 |
|
120 |
3.67 |
15 |
|
|
|
15 |
|
59 |
3.0 |
5.8 |
|
|
|
|
|
| Cortez surface |
1.6 |
1.96 |
0.099 |
|
97 |
0.89 |
2.8 |
|
|
|
2.9 |
|
31 |
0.6 |
0.60 |
|
|
|
|
|
| Cortez underground |
— |
— |
— |
|
39 |
6.23 |
7.8 |
|
|
|
7.8 |
|
16 |
5.7 |
3.0 |
|
|
|
|
|
| Cortez (61.50%) total |
1.6 |
1.96 |
0.099 |
|
140 |
2.42 |
11 |
|
|
|
11 |
|
47 |
2.4 |
3.6 |
|
|
|
|
|
|
|
|
|
|
|
|
|
|
|
|
|
|
|
|
|
|
|
|
|
|
| Fourmile underground (100%) |
— |
— |
— |
|
4.6 |
17.59 |
2.6 |
|
|
|
2.6 |
|
25 |
16.9 |
13 |
|
|
|
|
|
|
|
|
|
|
|
|
|
|
|
|
|
|
|
|
|
|
|
|
|
|
|
|
|
|
|
|
|
|
|
|
|
|
|
|
|
|
|
|
|
|
|
|
|
|
|
|
|
|
|
|
|
|
|
|
|
|
|
|
|
|
|
|
|
|
|
|
|
|
|
|
|
|
|
|
|
|
|
|
|
|
|
|
|
|
|
|
|
|
|
|
|
|
|
|
|
|
|
|
|
|
|
|
|
|
|
|
|
|
|
|
|
|
|
|
|
|
|
|
|
|
|
|
|
|
|
| Phoenix surface (61.50%) |
4.2 |
0.71 |
0.097 |
|
300 |
0.45 |
4.3 |
|
|
|
4.4 |
|
16 |
0.4 |
0.23 |
|
|
|
|
|
Pueblo Viejo surface
(60.00%)13 |
65 |
2.07 |
4.3 |
|
180 |
1.82 |
11 |
|
|
|
15 |
|
9.4 |
1.5 |
0.46 |
|
|
|
|
|
| Turquoise Ridge surface |
9.0 |
10.99 |
3.2 |
|
43 |
1.88 |
2.6 |
|
|
|
2.6 |
|
14 |
1.1 |
0.50 |
|
|
|
|
|
| Turquoise Ridge underground |
— |
— |
— |
|
20 |
9.59 |
6.1 |
|
|
|
9.3 |
|
4.8 |
9.5 |
1.5 |
|
|
|
|
|
| Turquoise Ridge (61.50%) total |
9.0 |
10.99 |
3.2 |
|
63 |
4.30 |
8.7 |
|
|
|
12 |
|
19 |
3.2 |
2.0 |
|
|
|
|
|
NORTH AMERICA
TOTAL |
89 |
2.82 |
8.1 |
|
810 |
1.98 |
51 |
|
|
|
59 |
|
180 |
4.5 |
25 |
|
|
|
|
|
|
|
|
|
|
|
|
|
|
|
|
|
|
|
|
|
|
|
|
|
|
|
|
|
|
|
|
|
|
|
|
|
|
|
|
|
|
|
|
|
|
|
|
|
|
|
|
|
|
|
|
|
|
|
|
|
|
|
|
|
|
|
|
|
|
|
|
|
|
|
|
|
|
|
|
|
|
|
|
|
|
|
|
|
|
|
|
|
|
|
|
|
|
|
|
|
|
|
|
|
|
|
|
|
|
|
|
|
|
|
|
|
|
|
|
|
|
|
|
|
|
|
|
|
|
|
|
|
|
|
|
|
|
|
|
|
|
|
|
|
|
|
|
|
|
|
|
TOTAL |
570 |
1.45 |
26 |
|
4,200 |
0.95 |
130 |
|
|
|
150 |
|
1,300 |
1.0 |
43 |
|
|
|
|
|
|
|
|
|
|
|
|
|
|
|
|
|
|
|
|
|
|
|
|
|
|
|
|
|
|
|
|
See “Mineral
Reserves and Resources Endnotes”. |
|
|
|
|
|
|
|
|
|
|
|
|
|
|
|
|
|
|
|
|
|
|
|
|
|
|
|
|
|
|
|
|
|
|
|
|
|
|
|
|
|
|
|
|
|
|
|
|
|
|
|
|
|
|
|
|
|
|
|
|
|
|
|
|
|
|
|
|
|
|
|
|
|
|
|
|
|
|
|
|
|
|
|
|
|
|
|
|
|
|
|
|
|
|
|
|
|
|
|
|
|
|
|
|
|
|
|
|
|
|
|
|
|
|
|
|
|
|
|
|
|
|
|
|
|
|
|
|
|
|
|
|
|
|
|
|
|
|
|
|
|
|
|
|
|
|
|
|
|
|
|
|
|
|
|
|
|
|
|
|
|
|
|
|
|
|
|
|
|
|
|
|
|
|
|
|
|
|
|
|
|
|
|
|
|
|
|
|
|
|
|
|
|
|
|
|
|
|
|
|
|
|
|
|
|
|
|
BARRICK YEAR-END 2025 |
79 |
MANAGEMENT’S DISCUSSION AND
ANALYSIS |
|
|
|
|
|
|
|
|
|
|
|
|
|
|
|
|
|
|
|
|
|
|
|
|
|
|
|
|
|
|
|
|
|
|
|
|
|
|
|
|
|
|
|
|
|
|
|
Copper Mineral Resources1,3,5,6,7,8 |
|
|
|
|
|
|
|
|
|
|
|
| As at December 31,
2025 |
MEASURED
(M)9 |
|
INDICATED (I)9 |
|
|
|
(M) +
(I)9 |
|
INFERRED
10 |
|
|
Tonnes |
Grade |
Contained Cu |
|
Tonnes |
Grade |
Contained Cu |
|
|
|
Contained Cu |
|
Tonnes |
Grade |
Contained Cu |
| Based on attributable tonnes |
|
(Mt) |
(%) |
(Mt) |
|
(Mt) |
(%) |
(Mt) |
|
|
|
(Mt) |
|
(Mt) |
(%) |
(Mt) |
AFRICA AND MIDDLE
EAST |
|
|
|
|
|
|
|
|
|
|
|
|
|
|
|
|
| Bulyanhulu surface |
|
0.0038 |
|
0.33 |
|
0.000013 |
|
|
— |
— |
— |
|
|
|
0.000013 |
|
— |
— |
— |
| Bulyanhulu underground |
|
2.4 |
|
0.38 |
|
0.0093 |
|
|
27 |
0.38 |
0.11 |
|
|
|
0.11 |
|
9.4 |
0.3 |
0.032 |
| Bulyanhulu (84.00%) total |
|
2.4 |
|
0.38 |
|
0.0093 |
|
|
27 |
0.38 |
0.11 |
|
|
|
0.11 |
|
9.4 |
0.3 |
0.032 |
| Jabal Sayid surface |
|
0.14 |
2.65 |
0.0038 |
|
— |
— |
— |
|
|
|
0.0038 |
|
— |
— |
— |
| Jabal Sayid underground |
|
9.3 |
2.43 |
0.23 |
|
5.4 |
2.25 |
0.12 |
|
|
|
0.35 |
|
1.2 |
0.4 |
0.0049 |
| Jabal Sayid (50.00%) total |
|
9.4 |
2.44 |
0.23 |
|
5.4 |
2.25 |
0.12 |
|
|
|
0.35 |
|
1.2 |
0.4 |
0.0049 |
| Lumwana surface (100%) |
|
190 |
0.43 |
0.83 |
|
1,900 |
0.49 |
9.3 |
|
|
|
10 |
|
250 |
0.4 |
0.91 |
AFRICA AND MIDDLE EAST
TOTAL |
|
210 |
0.52 |
1.1 |
|
1,900 |
0.49 |
9.5 |
|
|
|
11 |
|
260 |
0.4 |
0.95 |
| SOUTH AMERICA AND ASIA
PACIFIC |
|
|
|
|
|
|
|
|
|
|
|
|
|
|
|
|
| Norte Abierto surface (50.00%) |
|
300 |
0.24 |
0.74 |
|
760 |
0.21 |
1.6 |
|
|
|
2.3 |
|
370 |
0.2 |
0.79 |
| Reko Diq surface (50.00%) |
|
— |
— |
— |
|
2,000 |
0.43 |
8.5 |
|
|
|
8.5 |
|
720 |
0.3 |
2.4 |
| Zaldívar surface (50.00%) |
|
230 |
0.38 |
0.86 |
|
280 |
0.35 |
0.99 |
|
|
|
1.9 |
|
14 |
0.3 |
0.046 |
| SOUTH AMERICA AND ASIA PACIFIC
TOTAL |
|
530 |
0.30 |
1.6 |
|
3,000 |
0.37 |
11 |
|
|
|
13 |
|
1,100 |
0.3 |
3.2 |
NORTH
AMERICA |
|
|
|
|
|
|
|
|
|
|
|
|
|
|
|
|
| Phoenix surface (61.50%) |
|
6.0 |
0.15 |
0.0092 |
|
330 |
0.16 |
0.54 |
|
|
|
0.55 |
|
19 |
0.1 |
0.023 |
NORTH AMERICA
TOTAL |
|
6.0 |
0.15 |
0.0092 |
|
330 |
0.16 |
0.54 |
|
|
|
0.55 |
|
19 |
0.1 |
0.023 |
|
|
|
|
|
|
|
|
|
|
|
|
|
|
|
|
|
TOTAL |
|
740 |
0.36 |
2.7 |
|
5,300 |
0.40 |
21 |
|
|
|
24 |
|
1,400 |
0.3 |
4.2 |
|
|
|
|
|
|
|
|
|
|
|
|
|
|
|
|
|
|
See “Mineral
Reserves and Resources Endnotes”. |
|
|
|
|
|
|
|
|
|
|
|
|
|
|
|
|
|
|
|
|
|
|
|
|
|
|
|
|
|
|
|
|
|
|
|
|
|
|
|
|
|
|
|
|
|
|
|
|
|
|
|
|
|
|
|
|
|
|
|
|
|
|
|
|
|
|
|
|
|
|
|
|
|
|
BARRICK YEAR-END 2025 |
80 |
MANAGEMENT’S DISCUSSION AND
ANALYSIS |
|
|
|
|
|
|
|
|
|
|
|
|
|
|
|
|
|
|
|
|
|
|
|
|
|
|
|
|
|
|
|
|
|
|
|
|
|
|
|
|
|
|
|
|
|
|
|
Silver Mineral Resources1,3,5,6,7,8 |
|
|
|
|
|
|
|
|
|
|
|
| As at December 31,
2025 |
MEASURED
(M)9 |
|
INDICATED (I)9 |
|
|
|
(M) +
(I)9 |
|
INFERRED
10 |
|
|
Tonnes |
Ag Grade |
Contained Ag |
|
Tonnes |
Ag Grade |
Contained Ag |
|
|
|
Contained Ag |
|
Tonnes |
Ag Grade |
Contained Ag |
| Based on attributable ounces |
|
(Mt) |
(g/t) |
(Moz) |
|
(Mt) |
(g/t) |
(Moz) |
|
|
|
(Moz) |
|
(Mt) |
(g/t) |
(Moz) |
AFRICA AND MIDDLE
EAST |
|
|
|
|
|
|
|
|
|
|
|
|
|
|
|
|
| Bulyanhulu surface |
|
0.0038 |
|
5.10 |
0.00063 |
|
|
— |
— |
— |
|
|
|
0.00063 |
|
— |
— |
— |
| Bulyanhulu underground |
|
2.4 |
|
6.94 |
0.54 |
|
|
27 |
5.70 |
5.0 |
|
|
|
5.6 |
|
9.4 |
5.8 |
1.8 |
| Bulyanhulu (84.00%) total |
|
2.4 |
|
6.94 |
0.54 |
|
|
27 |
5.70 |
5.0 |
|
|
|
5.6 |
|
9.4 |
5.8 |
1.8 |
AFRICA AND MIDDLE EAST
TOTAL |
|
2.4 |
|
6.94 |
0.54 |
|
|
27 |
5.70 |
5.0 |
|
|
|
5.6 |
|
9.4 |
5.8 |
1.8 |
| SOUTH AMERICA AND ASIA
PACIFIC |
|
|
|
|
|
|
|
|
|
|
|
|
|
|
|
|
| Norte Abierto surface (50.00%) |
|
320 |
1.72 |
18 |
|
800 |
1.18 |
30 |
|
|
|
48 |
|
380 |
1.0 |
13 |
| Pascua-Lama surface (100%) |
|
43 |
57.21 |
79 |
|
390 |
52.22 |
660 |
|
|
|
740 |
|
15 |
17.8 |
8.8 |
|
|
|
|
|
|
|
|
|
|
|
|
|
|
|
|
|
| Veladero surface (50.00%) |
|
27 |
12.50 |
11 |
|
73 |
13.56 |
32 |
|
|
|
43 |
|
14 |
13.8 |
6.3 |
|
|
|
|
|
|
|
|
|
|
|
|
|
|
|
|
|
| SOUTH AMERICA AND ASIA PACIFIC
TOTAL |
|
390 |
8.54 |
110 |
|
1,300 |
|
17.67 |
720 |
|
|
|
830 |
|
410 |
2.1 |
28 |
NORTH
AMERICA |
|
|
|
|
|
|
|
|
|
|
|
|
|
|
|
|
| Phoenix surface (61.50%) |
|
4.2 |
7.89 |
1.1 |
|
300 |
|
5.68 |
55 |
|
|
|
56 |
|
16 |
5.4 |
2.8 |
Pueblo Viejo surface
(60.00%)13 |
|
65 |
11.15 |
23 |
|
180 |
11.16 |
65 |
|
|
|
88 |
|
9.4 |
8.3 |
2.5 |
NORTH AMERICA
TOTAL |
|
69 |
10.95 |
24 |
|
480 |
7.75 |
120 |
|
|
|
140 |
|
26 |
6.5 |
5.3 |
|
|
|
|
|
|
|
|
|
|
|
|
|
|
|
|
|
|
|
|
|
|
|
|
|
|
|
|
|
|
|
|
|
|
TOTAL |
|
460 |
8.89 |
130 |
|
1,800 |
14.80 |
840 |
|
|
|
980 |
|
450 |
2.4 |
35 |
|
|
|
|
|
|
|
|
|
|
|
|
|
|
|
|
|
|
See “Mineral
Reserves and Resources Endnotes”. |
|
|
|
|
|
|
|
|
|
|
|
|
|
|
|
|
|
|
|
|
|
|
|
|
|
|
|
|
|
|
|
|
|
|
|
|
|
|
|
|
|
|
|
|
|
|
|
|
|
|
|
|
|
|
|
|
|
|
|
|
|
|
|
|
|
|
|
|
|
|
BARRICK YEAR-END 2025 |
81 |
MANAGEMENT’S DISCUSSION AND
ANALYSIS |
|
|
|
|
|
|
|
|
|
|
|
|
|
|
|
|
|
|
|
|
|
|
|
|
|
|
|
Summary Gold Mineral
Reserves1,2,3,5 |
| For the years ended December
31 |
2025 |
2024 |
|
Ownership |
Tonnes |
Grade
9 |
Ounces |
Ownership |
Tonnes |
Grade
9 |
Ounces |
| Based on attributable ounces |
% |
(Mt) |
(g/t) |
(Moz) |
% |
(Mt) |
(g/t) |
(Moz) |
AFRICA AND MIDDLE
EAST |
|
|
|
|
|
|
|
|
| Bulyanhulu surface |
84.00% |
0.0038 |
|
4.20 |
0.00052 |
|
84.00% |
0.0053 |
|
3.74 |
0.00064 |
|
| Bulyanhulu underground |
84.00% |
17 |
6.98 |
3.8 |
84.00% |
17 |
6.96 |
3.8 |
| Bulyanhulu Total |
84.00% |
17 |
6.98 |
3.8 |
84.00% |
17 |
6.96 |
3.8 |
|
|
|
|
|
|
|
|
|
| Jabal Sayid surface |
50.00% |
0.14 |
0.46 |
0.0021 |
50.00% |
0.14 |
0.66 |
0.0030 |
| Jabal Sayid underground |
50.00% |
12 |
|
0.35 |
0.13 |
50.00% |
13 |
|
0.37 |
0.16 |
| Jabal Sayid Total |
50.00% |
12 |
0.35 |
0.13 |
50.00% |
13 |
0.37 |
0.16 |
| Kibali surface |
45.00% |
28 |
2.25 |
2.0 |
45.00% |
24 |
2.13 |
1.6 |
| Kibali underground |
45.00% |
23 |
3.86 |
2.8 |
45.00% |
23 |
3.96 |
2.9 |
Kibali Total |
45.00% |
50 |
2.97 |
4.8 |
45.00% |
47 |
3.03 |
4.6 |
Loulo-Gounkoto surface4 |
80.00% |
24 |
3.06 |
2.4 |
80.00% |
26 |
2.95 |
2.5 |
Loulo-Gounkoto
underground4 |
80.00% |
27 |
5.13 |
4.5 |
80.00% |
31 |
4.90 |
4.9 |
Loulo-Gounkoto Total4 |
80.00% |
51 |
4.16 |
6.9 |
80.00% |
57 |
4.00 |
7.3 |
| North Mara surface |
84.00% |
35 |
1.90 |
2.2 |
84.00% |
30 |
1.92 |
1.9 |
| North Mara underground |
84.00% |
7.9 |
4.18 |
1.1 |
84.00% |
7.9 |
4.16 |
1.1 |
| North Mara Total |
84.00% |
43 |
2.32 |
3.2 |
84.00% |
38 |
2.39 |
2.9 |
Tongon surface11 |
— |
— |
— |
— |
89.70% |
8.0 |
2.41 |
0.62 |
|
|
|
|
|
|
|
|
|
|
|
|
|
|
|
|
| AFRICA AND MIDDLE EAST
TOTAL |
|
170 |
3.37 |
19 |
|
180 |
3.35 |
19 |
| SOUTH AMERICA AND ASIA
PACIFIC |
|
|
|
|
|
|
|
|
|
|
|
|
|
|
|
|
|
| Norte Abierto surface |
50.00% |
520 |
0.65 |
11 |
50.00% |
600 |
0.60 |
12 |
| Porgera surface |
24.50% |
10 |
2.38 |
0.78 |
24.50% |
7.3 |
2.87 |
0.68 |
| Porgera underground |
24.50% |
3.7 |
5.26 |
0.63 |
24.50% |
3.9 |
6.47 |
0.81 |
| Porgera Total |
24.50% |
14 |
3.15 |
1.4 |
24.50% |
11 |
4.11 |
1.5 |
Pueblo Viejo surface13 |
— |
— |
— |
— |
60.00% |
180 |
2.11 |
12 |
| Reko Diq surface |
50.00% |
1,400 |
0.28 |
13 |
50.00% |
1,400 |
0.28 |
13 |
| Veladero surface |
50.00% |
62 |
0.69 |
1.4 |
50.00% |
73 |
0.67 |
1.6 |
| SOUTH AMERICA AND ASIA PACIFIC
TOTAL |
|
2,000 |
0.41 |
26 |
|
2,300 |
0.54 |
40 |
NORTH
AMERICA |
|
|
|
|
|
|
|
|
| Carlin surface |
61.50% |
57 |
2.25 |
4.1 |
61.50% |
62 |
2.33 |
4.6 |
| Carlin underground |
61.50% |
18 |
8.15 |
4.7 |
61.50% |
20 |
7.69 |
4.8 |
| Carlin Total |
61.50% |
75 |
3.66 |
8.8 |
61.50% |
82 |
3.62 |
9.5 |
| Cortez surface |
61.50% |
62 |
0.95 |
1.9 |
61.50% |
64 |
1.05 |
2.2 |
| Cortez underground |
61.50% |
28 |
6.67 |
6.0 |
61.50% |
28 |
6.78 |
6.1 |
| Cortez Total |
61.50% |
90 |
2.75 |
7.9 |
61.50% |
92 |
2.79 |
8.3 |
Hemlo surface12 |
— |
— |
— |
— |
100% |
25 |
0.93 |
0.75 |
Hemlo underground12 |
— |
— |
— |
— |
100% |
6.5 |
4.28 |
0.90 |
Hemlo Total12 |
— |
— |
— |
— |
100% |
32 |
1.62 |
1.6 |
|
|
|
|
|
|
|
|
|
| Phoenix surface |
61.50% |
110 |
0.58 |
2.0 |
61.50% |
92 |
0.63 |
1.9 |
Pueblo Viejo surface13 |
60.00% |
190 |
2.06 |
12 |
— |
— |
— |
— |
| Turquoise Ridge surface |
61.50% |
25 |
2.20 |
1.7 |
61.50% |
27 |
2.12 |
1.8 |
| Turquoise Ridge underground |
61.50% |
21 |
10.59 |
7.2 |
61.50% |
22 |
10.00 |
7.1 |
| Turquoise Ridge Total |
61.50% |
46 |
6.07 |
8.9 |
61.50% |
49 |
5.69 |
8.9 |
NORTH AMERICA
TOTAL |
|
510 |
2.46 |
40 |
|
350 |
2.71 |
30 |
|
|
|
|
|
|
|
|
|
TOTAL |
|
2,700 |
0.98 |
85 |
|
2,800 |
0.99 |
89 |
|
|
|
|
|
|
|
|
|
See “Mineral Reserves and
Resources Endnotes”. |
|
|
|
|
|
|
|
|
|
|
|
|
|
|
BARRICK YEAR-END 2025 |
82 |
MANAGEMENT’S DISCUSSION AND
ANALYSIS |
|
|
|
|
|
|
|
|
|
|
|
|
|
|
|
|
|
|
|
|
|
|
|
|
|
|
|
Summary Copper Mineral
Reserves1,2,3,5 |
| For the years ended December
31 |
2025 |
2024 |
|
Ownership |
Tonnes |
Cu
Grade9 |
Contained Tonnes |
Ownership |
Tonnes |
Cu
Grade9 |
Contained
Tonnes |
| Based on attributable tonnes |
% |
(Mt) |
(%) |
(Mt) |
% |
(Mt) |
(%) |
(Mt) |
AFRICA AND MIDDLE
EAST |
|
|
|
|
|
|
|
|
| Bulyanhulu surface |
84.00% |
0.0038 |
0.33 |
0.000013 |
84.00% |
0.0053 |
0.38 |
0.000020 |
| Bulyanhulu underground |
84.00% |
17 |
0.36 |
0.061 |
84.00% |
17 |
0.35 |
0.060 |
| Bulyanhulu Total |
84.00% |
17 |
0.36 |
0.061 |
84.00% |
17 |
0.35 |
0.060 |
| Jabal Sayid surface |
50.00% |
0.14 |
2.65 |
0.0038 |
50.00% |
0.14 |
2.68 |
0.0037 |
| Jabal Sayid underground |
50.00% |
12 |
2.14 |
0.25 |
50.00% |
13 |
2.14 |
0.28 |
| Jabal Sayid Total |
50.00% |
12 |
2.15 |
0.25 |
50.00% |
13 |
2.14 |
0.28 |
| Lumwana surface |
100% |
1,600 |
0.52 |
8.1 |
100% |
1,600 |
0.52 |
8.3 |
| AFRICA AND MIDDLE EAST
TOTAL |
|
1,600 |
0.53 |
8.4 |
|
1,600 |
0.54 |
8.7 |
| SOUTH AMERICA AND ASIA
PACIFIC |
|
|
|
|
|
|
|
|
| Norte Abierto surface (50.00%) |
50.00% |
520 |
0.24 |
1.2 |
50.00% |
600 |
0.22 |
1.3 |
| Reko Diq surface (50.00%) |
50.00% |
1,500 |
0.48 |
7.3 |
50.00% |
1,500 |
0.48 |
7.3 |
| Zaldívar surface (50.00%) |
50.00% |
180 |
0.40 |
0.71 |
50.00% |
180 |
0.43 |
0.75 |
| SOUTH AMERICA AND ASIA PACIFIC
TOTAL |
|
2,200 |
0.42 |
9.2 |
|
2,300 |
0.41 |
9.4 |
NORTH
AMERICA |
|
|
|
|
|
|
|
|
| Phoenix surface |
61.50% |
130 |
0.18 |
0.23 |
61.50% |
120 |
0.18 |
0.21 |
NORTH AMERICA
TOTAL |
|
130 |
0.18 |
0.23 |
|
120 |
0.18 |
0.21 |
|
|
|
|
|
|
|
|
|
TOTAL |
|
3,900 |
0.46 |
18 |
|
4,000 |
0.45 |
18 |
|
|
|
|
|
|
|
|
|
See “Mineral Reserves and
Resources Endnotes”. |
|
|
|
|
|
|
|
|
|
|
|
|
|
|
BARRICK YEAR-END 2025 |
83 |
MANAGEMENT’S DISCUSSION AND
ANALYSIS |
Mineral Reserves and
Resources Endnotes
1.Mineral reserves (“reserves”) and mineral resources (“resources”) have been estimated as at December
31, 2025 (unless otherwise noted) in accordance with National Instrument 43-101 - Standards of Disclosure for Mineral Projects (“NI 43-101”) as required by Canadian securities regulatory authorities. For United States
reporting purposes, the SEC has adopted amendments to its disclosure rules to modernize the mineral property disclosure requirements for issuers whose securities are registered with the SEC under the Securities and Exchange Act of 1934, as amended
(the “Exchange Act”). These amendments became effective February 25, 2019 (the “SEC Modernization Rules”) with compliance required for the first fiscal year beginning on or after January 1, 2021. The SEC Modernization Rules
replace the historical property disclosure requirements for mining registrants that were included in SEC Industry Guide 7, which was rescinded from and after the required compliance date of the SEC Modernization Rules. As a result of the adoption of
the SEC Modernization Rules, the SEC now recognizes estimates of “measured”, “indicated” and “inferred” mineral resources. In addition, the SEC has amended its definitions of “proven mineral reserves”
and “probable mineral reserves” to be substantially similar to the corresponding Canadian Institute of Mining, Metallurgy and Petroleum definitions, as required by NI 43-101. U.S. investors should understand that “inferred”
mineral resources have a great amount of uncertainty as to their existence and great uncertainty as to their economic and legal feasibility. In addition, U.S. investors are cautioned not to assume that any part or all of Barrick’s mineral
resources constitute or will be converted into reserves. Mineral resource and mineral reserve estimations have been prepared by employees of Barrick, its joint venture partners or its joint venture operating companies, as applicable, under the
supervision of Tricia Evans, BSc, SMERM, Mineral Resource Manager: North America; Mark Roux, BSc (Hons), P. Grad. Cert. (Geostatistics), Pr. Sci. Nat, Resource Geology Lead – North America; Richard Peattie, MPhil, FAusIMM, Mineral
Resources Manager: Africa and Middle East; Peter Jones, MAIG, Manager Resource Geology – South America & Asia Pacific; and Joel Holliday, FAusIMM, Executive Vice-President, Exploration. For 2025, reserves have been estimated
based on an assumed gold price of US$1,500 per ounce, an assumed silver price of US$21.00 per ounce, and an assumed copper price of US$3.25 per pound and long-term average exchange rates of 1.30 CAD/US$, except at Zaldívar, where mineral
reserves for 2025 were calculated using Antofagasta guidance and an updated assumed copper price of US$4.15 per pound; and at Norte Abierto where mineral reserves are reported by Newmont within a $1,700 per ounce gold, $3.50 per pound copper and
$20 per ounce silver pit design. For 2024, reserves were estimated based on an assumed gold price of US$1,400 per ounce, an assumed silver price of US$20.00 per ounce, and an assumed copper price of US$3.00 per pound and long-term average exchange
rates of 1.30 CAD/US$, except at Tongon and Hemlo open pit, where mineral reserves were estimated using $1,650/oz; at Zaldívar, where mineral reserves were calculated using Antofagasta guidance and an updated assumed copper price of
US$3.80 per pound and at Norte Abierto where mineral reserves are reported by Newmont within a $1,200 per ounce of gold, $2.75 per pound of copper and $22 per ounce of silver pit design, before application of updated 2023 project economics using
escalated operating and capital costs resulting in Newmont guidance of $1,600 per ounce of gold, $4.00 per pound of copper and $23 per ounce of silver for assumed mineral reserve commodity prices. Reserve estimates incorporate current and/or
expected mine plans and cost levels at each property. Varying cut-off grades have been used depending on the mine and type of ore contained in the reserves. Barrick’s normal data verification procedures have been employed in
connection with the calculations. Verification procedures include industry-standard quality control practices. Resources as at December 31, 2025 have been estimated using varying cut-off grades, depending on both the type of mine or
project, its maturity and ore types at each property.
2.In
confirming our annual reserves for each of our mineral properties, projects, and operations, we conduct a reserve test on December 31 of each year to verify that the future undiscounted cash flow from reserves is positive. The cash flow
ignores all sunk costs and only considers future operating and closure expenses as well as any future capital costs.
3.All
mineral resource and mineral reserve estimates of tonnes, Au oz, Ag oz and Cu tonnes are reported to the second significant digit.
4.The
estimated mineral resources and mineral reserves for the Loulo-Gounkoto Complex, which were done under the 1991 Malian Mining Code and the Loulo and Gounkoto Mining Conventions under which the Complex has operated until 24 November 2025, have been
tested under the 2023 Mining Code and no material impact was found.
5.2025
polymetallic mineral resources and mineral reserves are estimated using the combined value of gold, copper & silver and accordingly are reported as gold, copper and silver mineral resources and mineral
reserves.
6.For 2025, mineral resources have been estimated based on an assumed gold price of US$2,000 per ounce, an assumed silver price
of US$25.00 per ounce, and an assumed copper price of US$4.50 per pound and long-term average exchange rates of 1.30 CAD/US$, except Zaldívar, where mineral resources for 2025 were estimated using Antofagasta guidance and an assumed copper
price of US$4.75 per pound, and Norte Abierto, where mineral resources are reported by Newmont within a $2,000 per ounce of gold, $4.00 per pound of copper and $23/oz per ounce of silver pit shell. For 2024, mineral resources were estimated
based on an assumed gold price of US$1,900 per ounce, an assumed silver price of US$24.00 per ounce, and an assumed copper price of US$4.00 per pound and long-term average exchange rates of 1.30 CAD/US$, except at Zaldívar, where mineral
resources for 2024 were calculated using Antofagasta guidance and an assumed copper price of US$4.40 and Norte Abierto, where mineral resources are reported by Newmont within a $1,400 per ounce of gold, $3.25 per pound of copper and $20 per ounce of
silver pit shell, before application of updated 2023 project economics using escalated operating and capital costs resulting in Newmont guidance of $1,600 per ounce of for gold, $4.00 per pound of for copper and $23 per ounce of silver for assumed
mineral resource commodity price.
7.Mineral resources which are not mineral reserves do not have demonstrated economic viability.
8.Mineral resources are reported inclusive of mineral
reserves.
9.All measured and indicated mineral resource estimates of grade and all proven and probable mineral reserve estimates of grade
for Au g/t, Ag g/t and Cu % are reported to two decimal places.
10.All
inferred mineral resource estimates of grade for Au g/t, Ag g/t and Cu % are reported to one decimal place.
11.On
December 1, 2025, Barrick sold its interest in the Tongon gold mine to the Atlantic Group. For additional information, see page 9 of Barrick’s Fourth Quarter and Year End Report
2025.
12.On November 26, 2025, Barrick sold the Hemlo gold mine to Carcetti Capital Corp. For additional information, see page 9 of
Barrick’s Fourth Quarter and Year End Report
2025.
13.For 2025 Mineral Resources and Mineral Reserves, Pueblo Viejo is reported as part of the North America Region and sub-totals.
For 2024 Mineral Resources and Mineral Reserves, Pueblo Viejo was reported as part of the South America and Asia Pacific Region and
sub-totals.
|
|
|
|
|
|
|
|
|
BARRICK YEAR-END 2025 |
84 |
MANAGEMENT’S DISCUSSION AND
ANALYSIS |