3Q25 Financial Results October 15, 2025
2 Forward-looking statements and use of non-GAAP financial measures This document contains forward-looking statements within the meaning of the Private Securities Litigation Reform Act of 1995. Any statement that does not describe historical or current facts is a forward- looking statement. These statements often include the words “believes,” “expects,” “anticipates,” “estimates,” “intends,” “plans,” “goals,” “targets,” “initiatives,” “potentially,” “probably,” “projects,” “outlook,” “guidance” or similar expressions or future conditional verbs such as “may,” “will,” “likely,” “should,” “would,” and “could.” Forward-looking statements are based upon the current beliefs and expectations of management, and on information currently available to management. Our statements speak as of the date hereof, and we do not assume any obligation to update these statements or to update the reasons why actual results could differ from those contained in such statements in light of new information or future events. We caution you, therefore, against relying on any of these forward-looking statements. They are neither statements of historical fact nor guarantees or assurances of future performance. While there is no assurance that any list of risks and uncertainties or risk factors is complete, important factors that could cause actual results to differ materially from those in the forward-looking statements include the following, without limitation: • Negative economic, business and political conditions, including as a result of the interest rate environment, supply chain disruptions, tariffs, inflationary pressures, and labor shortages that adversely affect the general economy, housing prices, the job market, consumer confidence, and spending habits; • The general state of the economy and employment, as well as general business and economic conditions, and changes in the competitive environment; • Our capital and liquidity requirements under regulatory standards and our ability to generate capital and liquidity on favorable terms; • The effect of changes in our credit ratings on our cost of funding, access to capital markets, ability to market our securities, and overall liquidity position; • The effect of changes in the level of commercial and consumer deposits on our funding costs and net interest margin; • Our ability to execute on our strategic business initiatives and achieve our financial performance goals across our Consumer and Commercial businesses, including our Private Bank; • The effects of geopolitical instability, including the wars in Ukraine and the Middle East, on economic and market conditions, inflationary pressures and the interest rate environment, commodity price and foreign exchange rate volatility, and heightened cybersecurity risks; • Our ability to comply with heightened supervisory requirements and expectations as well as new or amended regulations; • Liabilities and business restrictions resulting from litigation and regulatory investigations; • The effect of changes in interest rates on our net interest income, net interest margin, mortgage originations, mortgage servicing rights, and mortgages held for sale; • Changes in interest rates and market liquidity, as well as the magnitude of such changes, which may reduce interest margins, impact funding sources, and affect the ability to originate and distribute financial products in the primary and secondary markets; • Financial services reform and other current, pending, or future legislation or regulation that could have a negative effect on our revenue and businesses; • Environmental risks, such as physical or transition risks associated with climate change, and social and governance risks that could adversely affect our reputation, operations, business, and customers; • A failure in, or breach of, our compliance with laws, as well as operational or security systems or infrastructure, or those of our third-party vendors or other service providers, including as a result of cyberattacks; and • Management’s ability to identify and manage these and other risks. In addition to the above factors, we also caution that the actual amounts and timing of any future common stock dividends or share repurchases will be subject to various factors, including our capital position, financial performance, balance sheet growth, market conditions, and regulatory considerations, as well as any other factors that our Board of Directors deems relevant in making such a determination. Therefore, there can be no assurance that we will repurchase shares from, or pay any dividends to, holders of our common stock, or as to the amount of any such repurchases or dividends. More information about factors that could cause actual results to differ materially from those described in the forward-looking statements can be found in the “Risk Factors” section in Part I, Item 1A of our Annual Report on Form 10-K for the fiscal year ended December 31, 2024 as filed with the Securities and Exchange Commission. Non-GAAP Financial Measures: This document contains non-GAAP financial measures, with those denoted as Underlying for any given reporting period excluding certain items that may occur in that period which management does not consider indicative of the Company’s on-going financial performance. We believe these non-GAAP financial measures provide useful information to investors because they are used by our management to evaluate our operating performance and make day-to-day operating decisions. In addition, we believe those measures denoted as Underlying in any given reporting period reflect our on-going financial performance in that period and, accordingly, are useful to consider in addition to our GAAP financial results. The Appendix presents reconciliations of our non-GAAP measures to the most directly comparable GAAP financial measures. We caution investors not to place undue reliance on such non-GAAP financial measures, but to consider them with the most directly comparable GAAP measures. Non-GAAP financial measures have limitations as analytical tools and should not be considered in isolation or as a substitute for our results reported under GAAP.
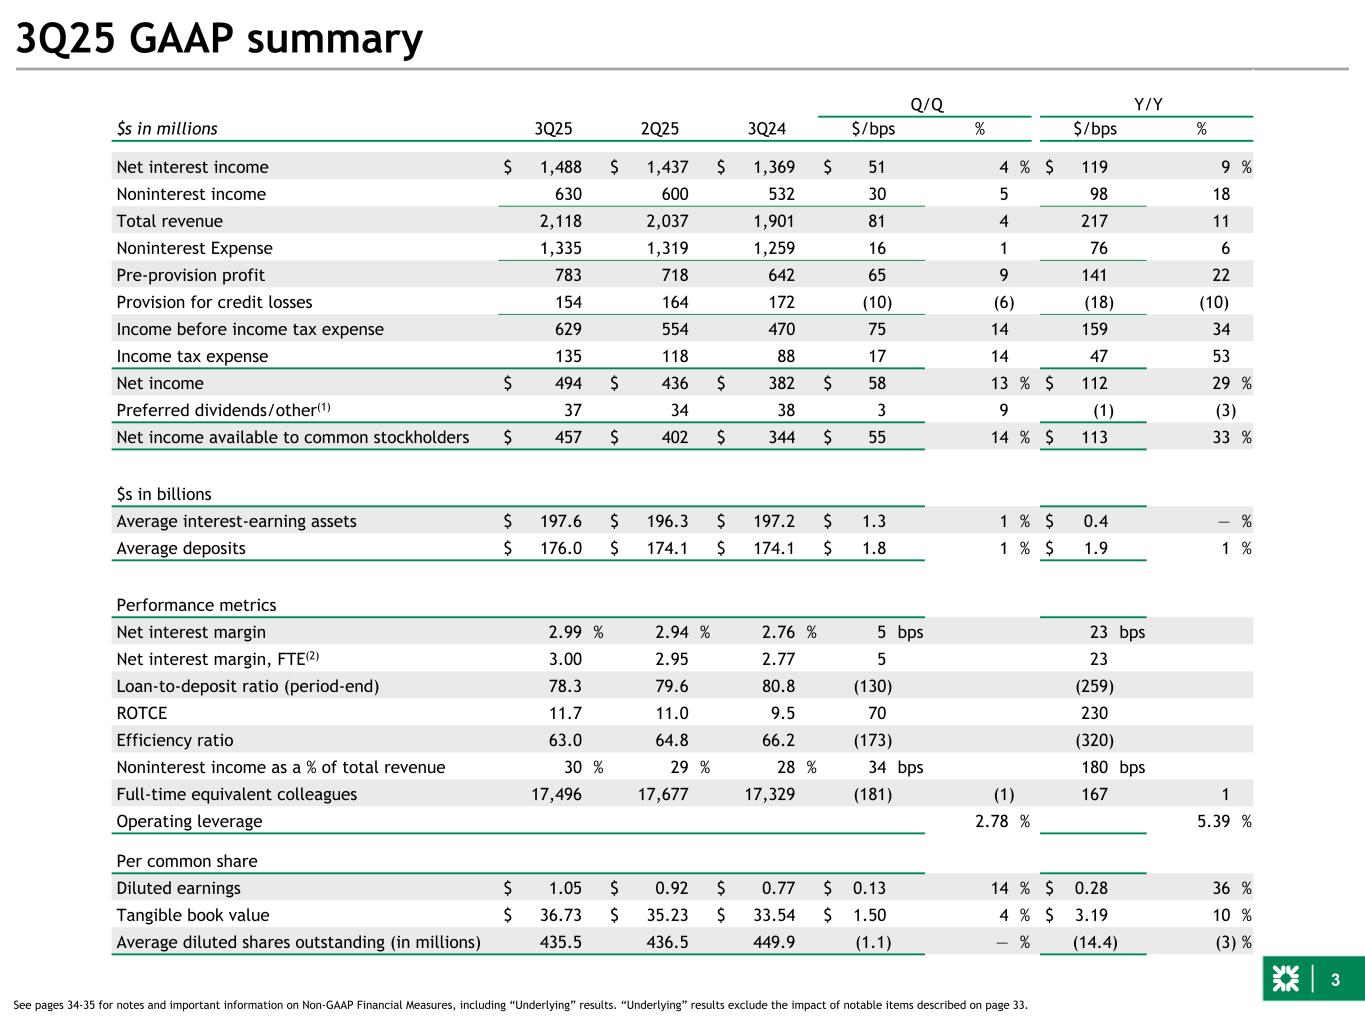
3 3Q25 GAAP summary 3Q25 2Q25 3Q24 Q/Q Y/Y $s in millions $/bps % $/bps % Net interest income $ 1,488 $ 1,437 $ 1,369 $ 51 4 % $ 119 9 % Noninterest income 630 600 532 30 5 98 18 Total revenue 2,118 2,037 1,901 81 4 217 11 Noninterest Expense 1,335 1,319 1,259 16 1 76 6 Pre-provision profit 783 718 642 65 9 141 22 Provision for credit losses 154 164 172 (10) (6) (18) (10) Income before income tax expense 629 554 470 75 14 159 34 Income tax expense 135 118 88 17 14 47 53 Net income $ 494 $ 436 $ 382 $ 58 13 % $ 112 29 % Preferred dividends/other(1) 37 34 38 3 9 (1) (3) Net income available to common stockholders $ 457 $ 402 $ 344 $ 55 14 % $ 113 33 % $s in billions Average interest-earning assets $ 197.6 $ 196.3 $ 197.2 $ 1.3 1 % $ 0.4 — % Average deposits $ 176.0 $ 174.1 $ 174.1 $ 1.8 1 % $ 1.9 1 % Performance metrics Net interest margin 2.99 % 2.94 % 2.76 % 5 bps 23 bps Net interest margin, FTE(2) 3.00 2.95 2.77 5 23 Loan-to-deposit ratio (period-end) 78.3 79.6 80.8 (130) (259) ROTCE 11.7 11.0 9.5 70 230 Efficiency ratio 63.0 64.8 66.2 (173) (320) Noninterest income as a % of total revenue 30 % 29 % 28 % 34 bps 180 bps Full-time equivalent colleagues 17,496 17,677 17,329 (181) (1) 167 1 Operating leverage 2.78 % 5.39 % Per common share Diluted earnings $ 1.05 $ 0.92 $ 0.77 $ 0.13 14 % $ 0.28 36 % Tangible book value $ 36.73 $ 35.23 $ 33.54 $ 1.50 4 % $ 3.19 10 % Average diluted shares outstanding (in millions) 435.5 436.5 449.9 (1.1) — % (14.4) (3) % See pages 34-35 for notes and important information on Non-GAAP Financial Measures, including “Underlying” results. “Underlying” results exclude the impact of notable items described on page 33.
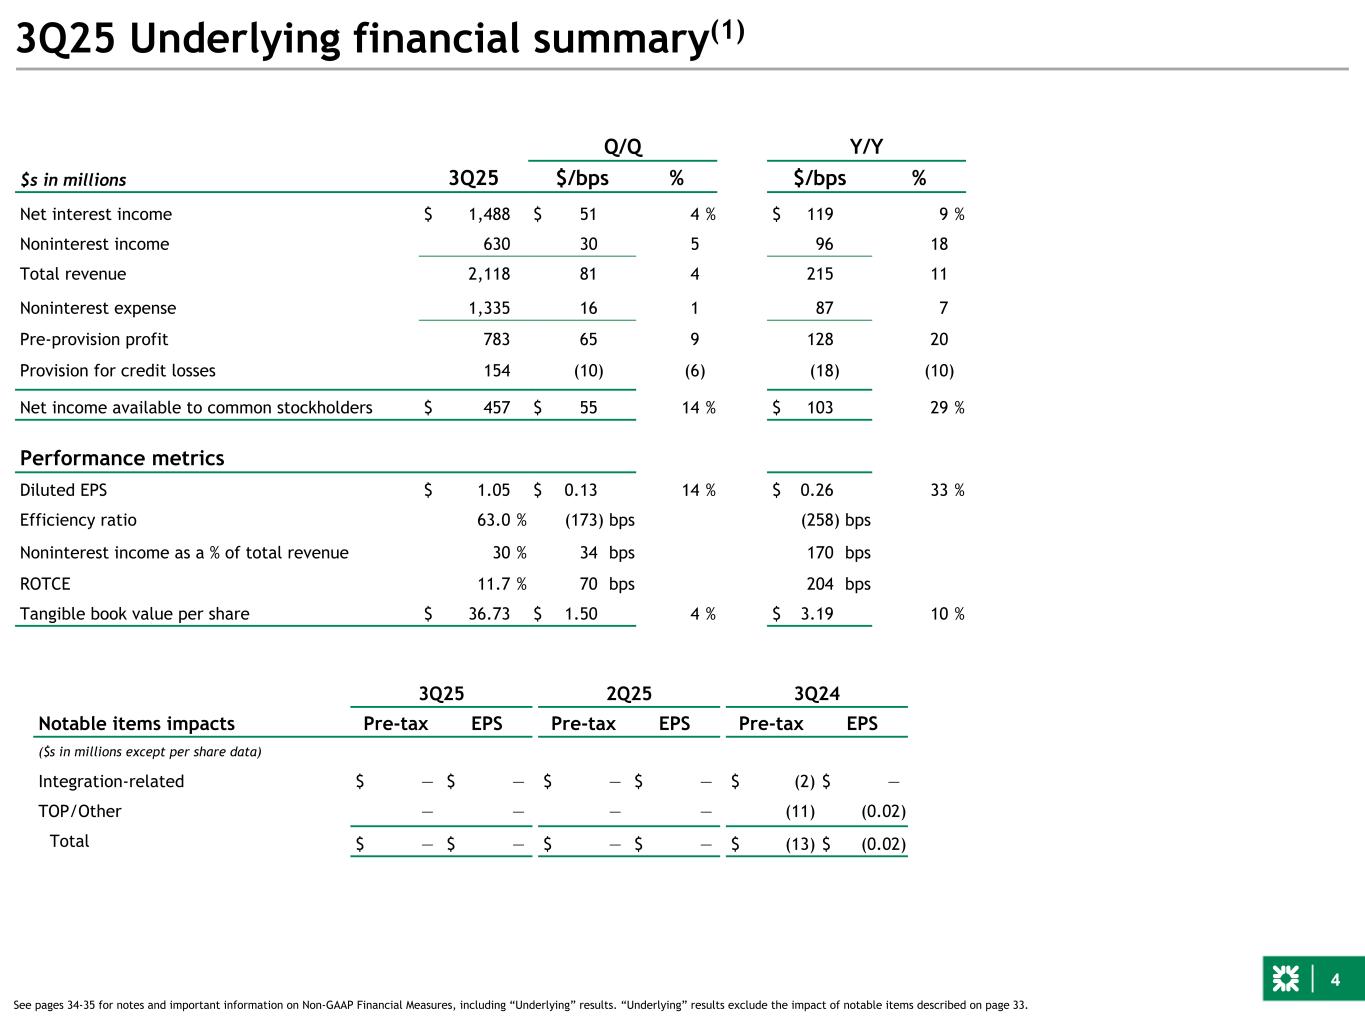
4 3Q25 Underlying financial summary(1) Q/Q Y/Y $s in millions 3Q25 $/bps % $/bps % Net interest income $ 1,488 $ 51 4 % $ 119 9 % Noninterest income 630 30 5 96 18 Total revenue 2,118 81 4 215 11 Noninterest expense 1,335 16 1 87 7 Pre-provision profit 783 65 9 128 20 Provision for credit losses 154 (10) (6) (18) (10) Net income available to common stockholders $ 457 $ 55 14 % $ 103 29 % Performance metrics Diluted EPS $ 1.05 $ 0.13 14 % $ 0.26 33 % Efficiency ratio 63.0 % (173) bps (258) bps Noninterest income as a % of total revenue 30 % 34 bps 170 bps ROTCE 11.7 % 70 bps 204 bps Tangible book value per share $ 36.73 $ 1.50 4 % $ 3.19 10 % See pages 34-35 for notes and important information on Non-GAAP Financial Measures, including “Underlying” results. “Underlying” results exclude the impact of notable items described on page 33. 3Q25 2Q25 3Q24 Notable items impacts Pre-tax EPS Pre-tax EPS Pre-tax EPS ($s in millions except per share data) Integration-related $ — $ — $ — $ — $ (2) $ — TOP/Other — — — — (11) (0.02) Total $ — $ — $ — $ — $ (13) $ (0.02)
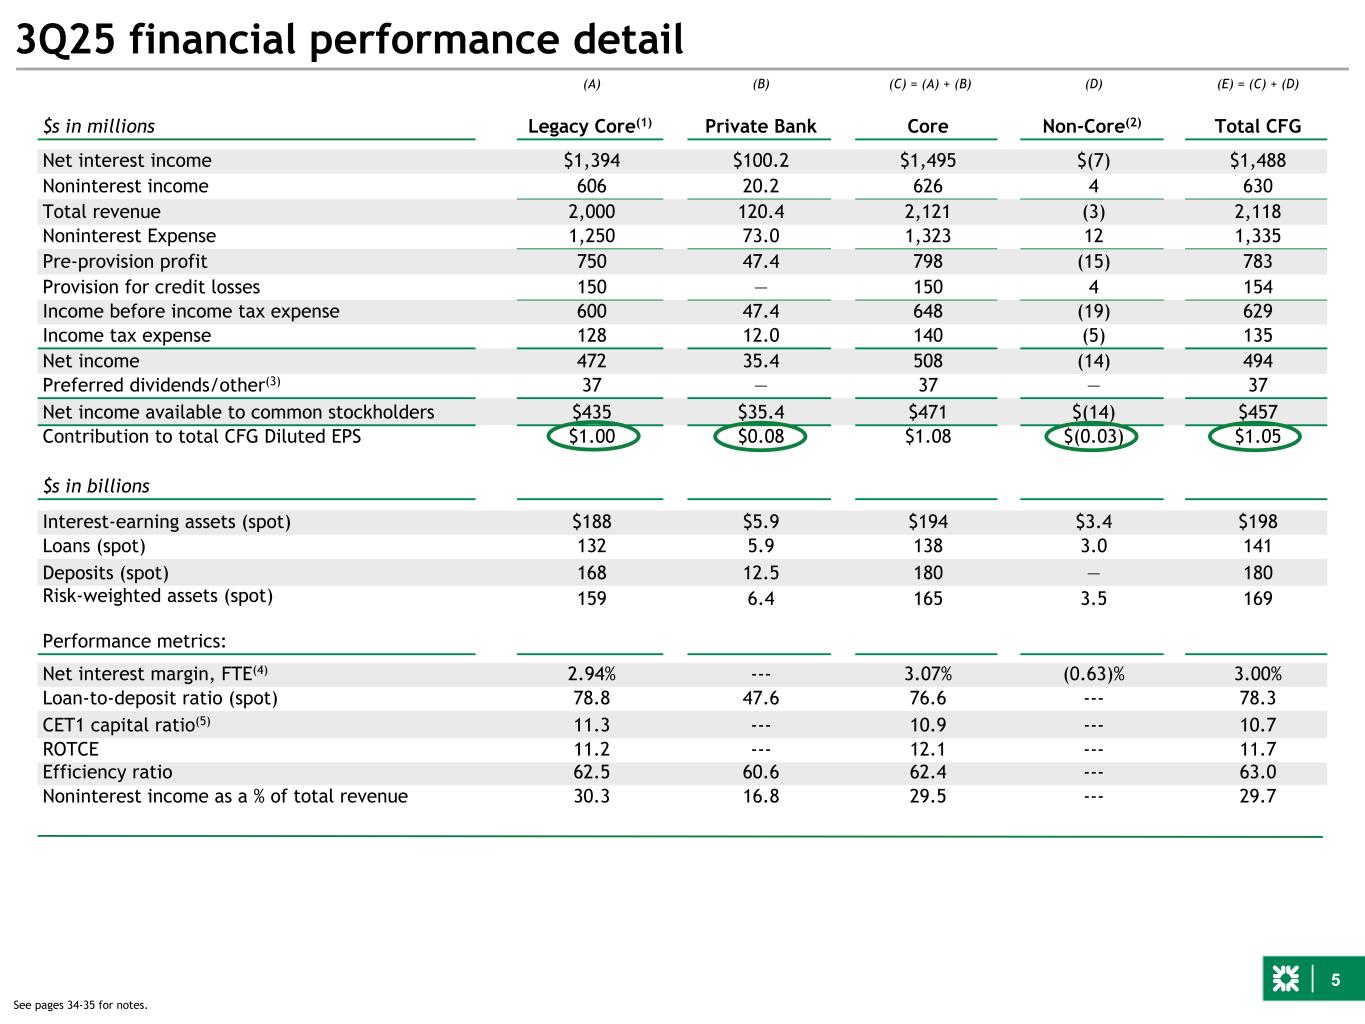
5 3Q25 financial performance detail (A) (B) (C) = (A) + (B) (D) (E) = (C) + (D) $s in millions Legacy Core(1) Private Bank Core Non-Core(2) Total CFG Net interest income $1,394 $100.2 $1,495 $(7) $1,488 Noninterest income 606 20.2 626 4 630 Total revenue 2,000 120.4 2,121 (3) 2,118 Noninterest Expense 1,250 73.0 1,323 12 1,335 Pre-provision profit 750 47.4 798 (15) 783 Provision for credit losses 150 — 150 4 154 Income before income tax expense 600 47.4 648 (19) 629 Income tax expense 128 12.0 140 (5) 135 Net income 472 35.4 508 (14) 494 Preferred dividends/other(3) 37 — 37 — 37 Net income available to common stockholders $435 $35.4 $471 $(14) $457 Contribution to total CFG Diluted EPS $1.00 $0.08 $1.08 $(0.03) $1.05 $s in billions Interest-earning assets (spot) $188 $5.9 $194 $3.4 $198 Loans (spot) 132 5.9 138 3.0 141 Deposits (spot) 168 12.5 180 — 180 Risk-weighted assets (spot) 159 6.4 165 3.5 169 Performance metrics: Net interest margin, FTE(4) 2.94% --- 3.07% (0.63)% 3.00% Loan-to-deposit ratio (spot) 78.8 47.6 76.6 --- 78.3 CET1 capital ratio(5) 11.3 --- 10.9 --- 10.7 ROTCE 11.2 --- 12.1 --- 11.7 Efficiency ratio 62.5 60.6 62.4 --- 63.0 Noninterest income as a % of total revenue 30.3 16.8 29.5 --- 29.7 See pages 34-35 for notes.
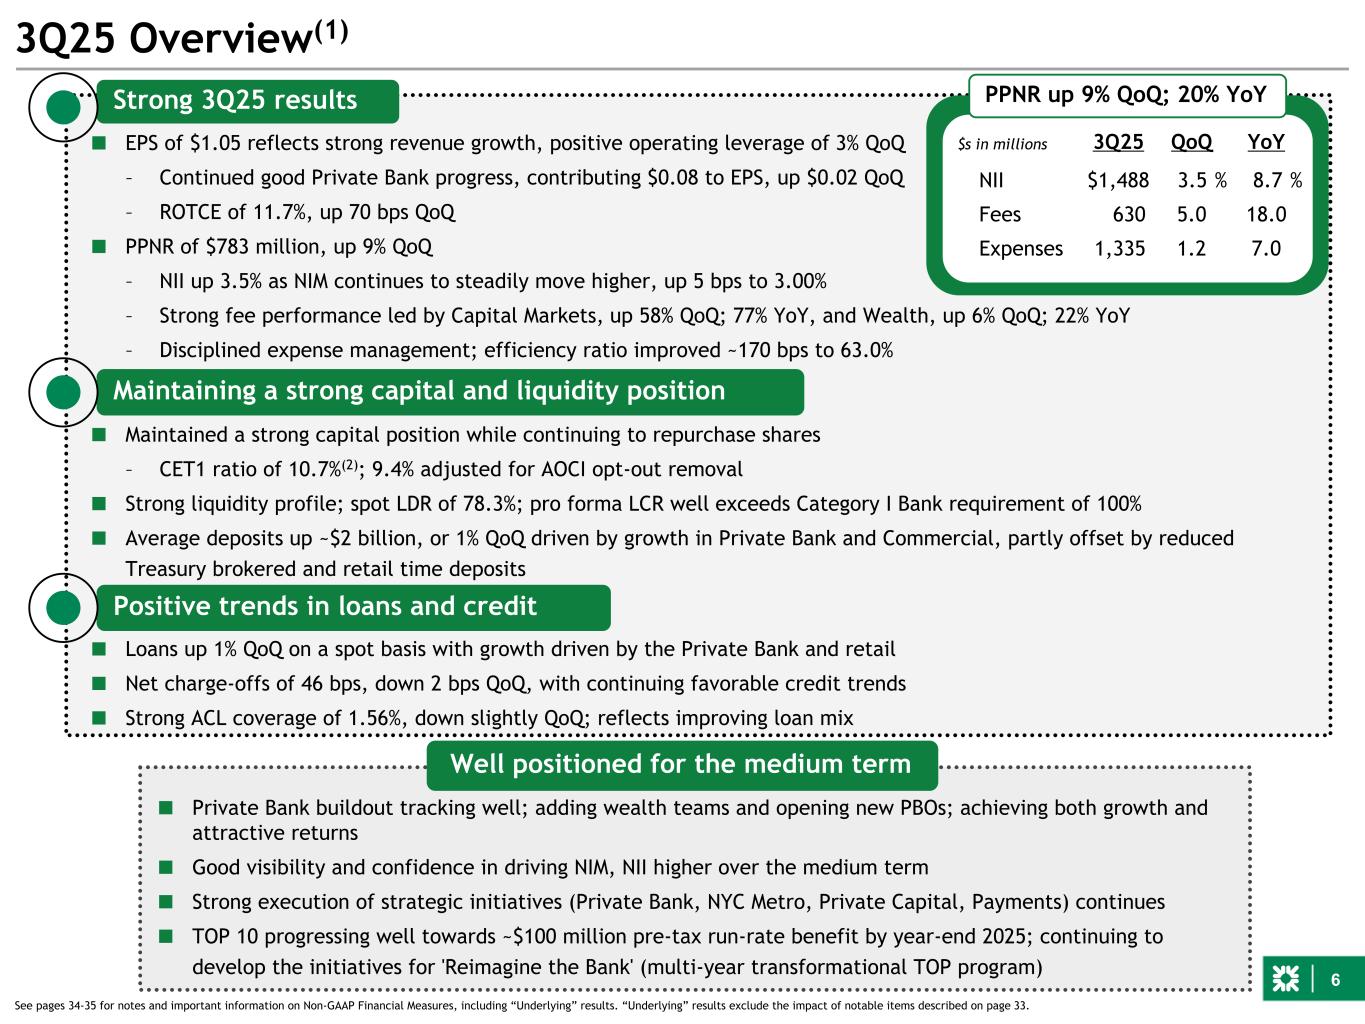
6 ■ EPS of $1.05 reflects strong revenue growth, positive operating leverage of 3% QoQ – Continued good Private Bank progress, contributing $0.08 to EPS, up $0.02 QoQ – ROTCE of 11.7%, up 70 bps QoQ ■ PPNR of $783 million, up 9% QoQ – NII up 3.5% as NIM continues to steadily move higher, up 5 bps to 3.00% – Strong fee performance led by Capital Markets, up 58% QoQ; 77% YoY, and Wealth, up 6% QoQ; 22% YoY – Disciplined expense management; efficiency ratio improved ~170 bps to 63.0% Strong 3Q25 results Maintaining a strong capital and liquidity position Positive trends in loans and credit 3Q25 Overview(1) ■ Maintained a strong capital position while continuing to repurchase shares – CET1 ratio of 10.7%(2); 9.4% adjusted for AOCI opt-out removal ■ Strong liquidity profile; spot LDR of 78.3%; pro forma LCR well exceeds Category I Bank requirement of 100% ■ Average deposits up ~$2 billion, or 1% QoQ driven by growth in Private Bank and Commercial, partly offset by reduced Treasury brokered and retail time deposits 3Q25 QoQ YoY NII $ 1,488 3.5 % 8.7 % Fees 630 5.0 18.0 Expenses 1,335 1.2 7.0 $s in millions ■ Loans up 1% QoQ on a spot basis with growth driven by the Private Bank and retail ■ Net charge-offs of 46 bps, down 2 bps QoQ, with continuing favorable credit trends ■ Strong ACL coverage of 1.56%, down slightly QoQ; reflects improving loan mix PPNR up 9% QoQ; 20% YoY ■ Private Bank buildout tracking well; adding wealth teams and opening new PBOs; achieving both growth and attractive returns ■ Good visibility and confidence in driving NIM, NII higher over the medium term ■ Strong execution of strategic initiatives (Private Bank, NYC Metro, Private Capital, Payments) continues ■ TOP 10 progressing well towards ~$100 million pre-tax run-rate benefit by year-end 2025; continuing to develop the initiatives for 'Reimagine the Bank' (multi-year transformational TOP program) Well positioned for the medium term See pages 34-35 for notes and important information on Non-GAAP Financial Measures, including “Underlying” results. “Underlying” results exclude the impact of notable items described on page 33.
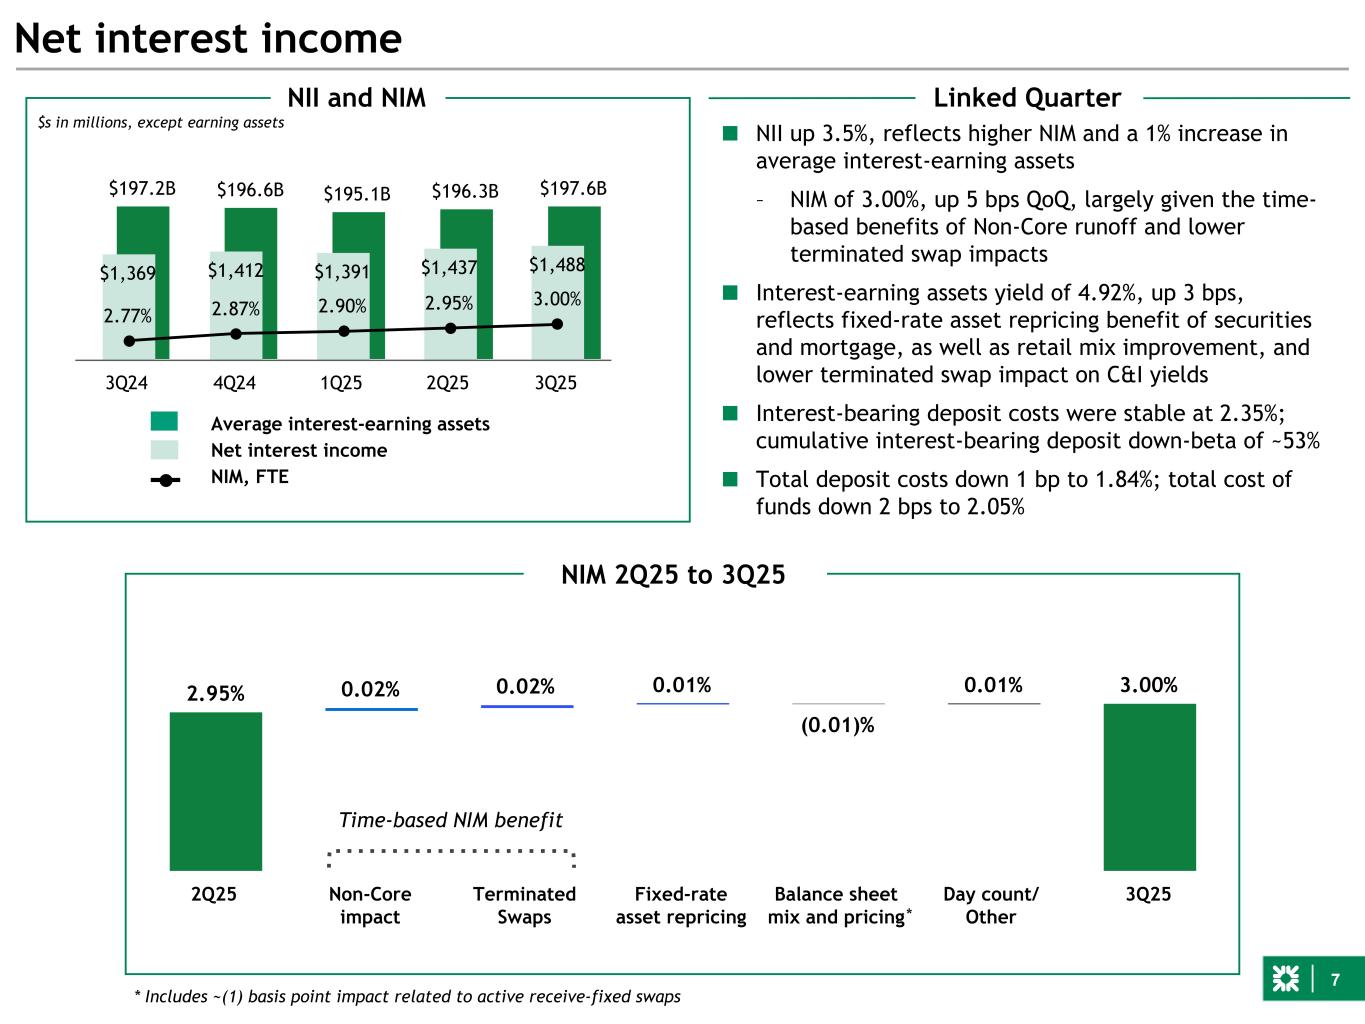
7 2.95% 0.02% 0.02% 0.01% (0.01)% 0.01% 3.00% 2Q25 Non-Core impact Terminated Swaps Fixed-rate asset repricing Balance sheet mix and pricing Day count/ Other 3Q25 $197.2B $196.6B $195.1B $196.3B $197.6B $1,369 $1,412 $1,391 $1,437 $1,488 2.77% 2.87% 2.90% 2.95% 3.00% 3Q24 4Q24 1Q25 2Q25 3Q25 ■ NII up 3.5%, reflects higher NIM and a 1% increase in average interest-earning assets – NIM of 3.00%, up 5 bps QoQ, largely given the time- based benefits of Non-Core runoff and lower terminated swap impacts ■ Interest-earning assets yield of 4.92%, up 3 bps, reflects fixed-rate asset repricing benefit of securities and mortgage, as well as retail mix improvement, and lower terminated swap impact on C&I yields ■ Interest-bearing deposit costs were stable at 2.35%; cumulative interest-bearing deposit down-beta of ~53% ■ Total deposit costs down 1 bp to 1.84%; total cost of funds down 2 bps to 2.05% Net interest income NII and NIM Average interest-earning assets Net interest income NIM, FTE Linked Quarter NIM 2Q25 to 3Q25 $s in millions, except earning assets * Includes ~(1) basis point impact related to active receive-fixed swaps Time-based NIM benefit *
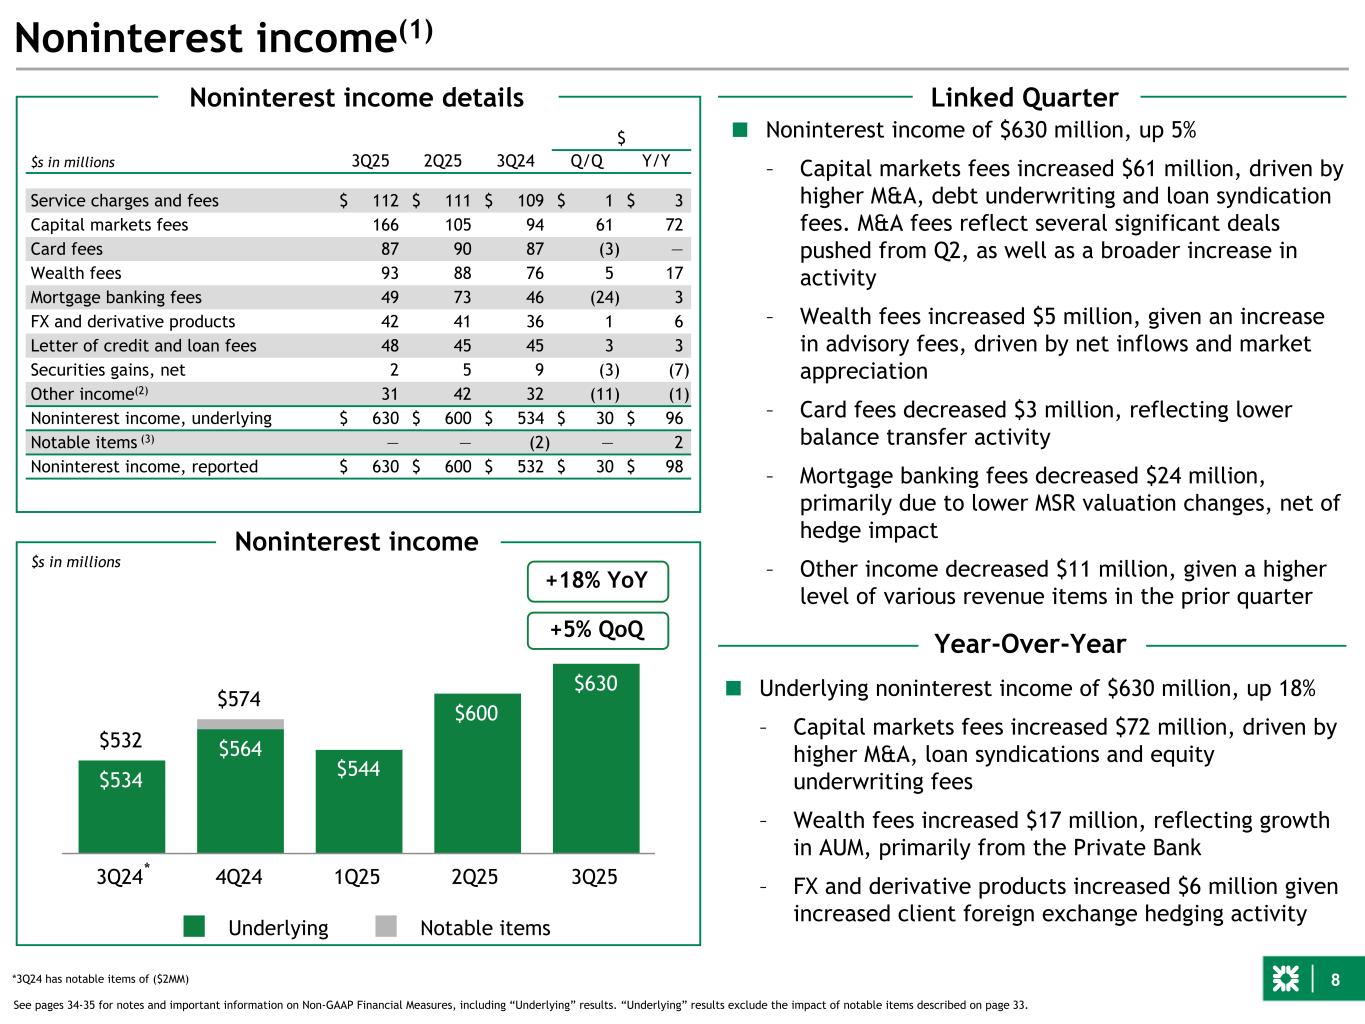
8 $532 $574 $544 $600 $630 $534 $564 $544 $600 $630 Underlying Notable items 3Q24 4Q24 1Q25 2Q25 3Q25 Noninterest income(1) $s in millions See pages 34-35 for notes and important information on Non-GAAP Financial Measures, including “Underlying” results. “Underlying” results exclude the impact of notable items described on page 33. Linked Quarter Year-Over-Year Noninterest income $s in millions 3Q25 2Q25 3Q24 $ Q/Q Y/Y Service charges and fees $ 112 $ 111 $ 109 $ 1 $ 3 Capital markets fees 166 105 94 61 72 Card fees 87 90 87 (3) — Wealth fees 93 88 76 5 17 Mortgage banking fees 49 73 46 (24) 3 FX and derivative products 42 41 36 1 6 Letter of credit and loan fees 48 45 45 3 3 Securities gains, net 2 5 9 (3) (7) Other income(2) 31 42 32 (11) (1) Noninterest income, underlying $ 630 $ 600 $ 534 $ 30 $ 96 Notable items (3) — — (2) — 2 Noninterest income, reported $ 630 $ 600 $ 532 $ 30 $ 98 * Noninterest income details *3Q24 has notable items of ($2MM) ■ Underlying noninterest income of $630 million, up 18% – Capital markets fees increased $72 million, driven by higher M&A, loan syndications and equity underwriting fees – Wealth fees increased $17 million, reflecting growth in AUM, primarily from the Private Bank – FX and derivative products increased $6 million given increased client foreign exchange hedging activity +18% YoY +5% QoQ ■ Noninterest income of $630 million, up 5% – Capital markets fees increased $61 million, driven by higher M&A, debt underwriting and loan syndication fees. M&A fees reflect several significant deals pushed from Q2, as well as a broader increase in activity – Wealth fees increased $5 million, given an increase in advisory fees, driven by net inflows and market appreciation – Card fees decreased $3 million, reflecting lower balance transfer activity – Mortgage banking fees decreased $24 million, primarily due to lower MSR valuation changes, net of hedge impact – Other income decreased $11 million, given a higher level of various revenue items in the prior quarter
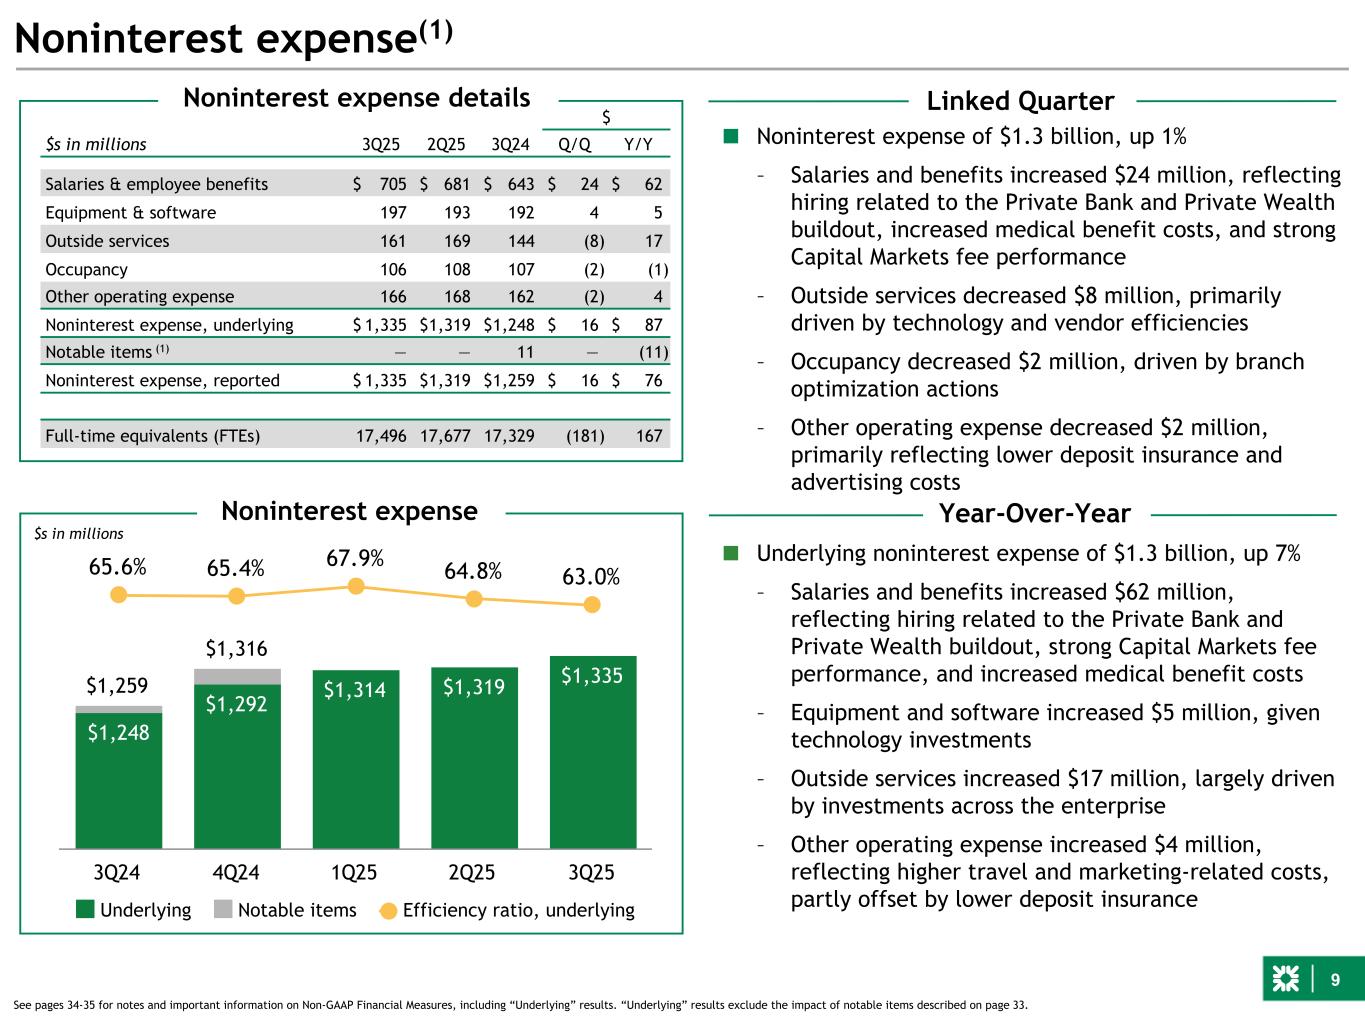
9 Noninterest expense(1) See pages 34-35 for notes and important information on Non-GAAP Financial Measures, including “Underlying” results. “Underlying” results exclude the impact of notable items described on page 33. Noninterest expense Linked Quarter Year-Over-Year 3Q25 2Q25 3Q24 $ $s in millions Q/Q Y/Y Salaries & employee benefits $ 705 $ 681 $ 643 $ 24 $ 62 Equipment & software 197 193 192 4 5 Outside services 161 169 144 (8) 17 Occupancy 106 108 107 (2) (1) Other operating expense 166 168 162 (2) 4 Noninterest expense, underlying $ 1,335 $ 1,319 $ 1,248 $ 16 $ 87 Notable items (1) — — 11 — (11) Noninterest expense, reported $ 1,335 $ 1,319 $ 1,259 $ 16 $ 76 Full-time equivalents (FTEs) 17,496 17,677 17,329 (181) 167 Noninterest expense details $1,259 $1,316 $1,314 $1,319 $1,335$1,248 $1,292 $1,314 $1,319 $1,335 65.6% 65.4% 67.9% 64.8% 63.0% Noninterest expense Noninterest expense, Underlying Efficiency ratio, underlying 3Q24 4Q24 1Q25 2Q25 3Q25 $1,259 $1,316 $1,248 $1,292 $1,314 $1,319 $1,335 65.6% 65.4% 67.9% 64.8% 63.0% Underlying Notable items Efficiency ratio, underlying 3Q24 4Q24 1Q25 2Q25 3Q25 ■ Noninterest expense of $1.3 billion, up 1% – Salaries and benefits increased $24 million, reflecting hiring related to the Private Bank and Private Wealth buildout, increased medical benefit costs, and strong Capital Markets fee performance – Outside services decreased $8 million, primarily driven by technology and vendor efficiencies – Occupancy decreased $2 million, driven by branch optimization actions – Other operating expense decreased $2 million, primarily reflecting lower deposit insurance and advertising costs ■ Underlying noninterest expense of $1.3 billion, up 7% – Salaries and benefits increased $62 million, reflecting hiring related to the Private Bank and Private Wealth buildout, strong Capital Markets fee performance, and increased medical benefit costs – Equipment and software increased $5 million, given technology investments – Outside services increased $17 million, largely driven by investments across the enterprise – Other operating expense increased $4 million, reflecting higher travel and marketing-related costs, partly offset by lower deposit insurance $s in millions
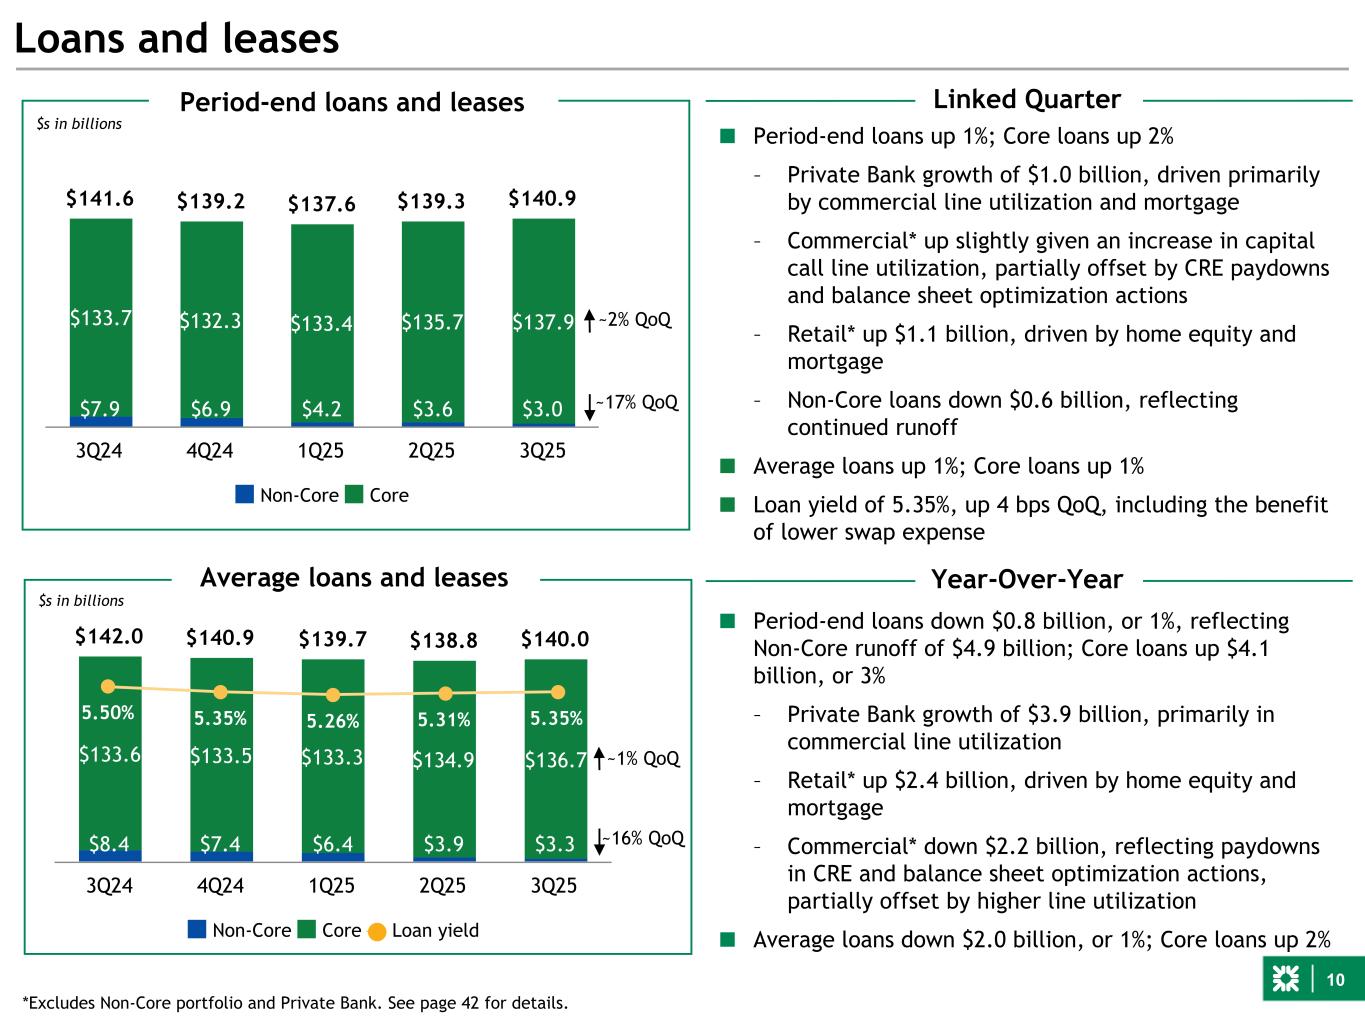
10 $142.0 $140.9 $139.7 $138.8 $140.0 $8.4 $7.4 $6.4 $3.9 $3.3 $133.6 $133.5 $133.3 $134.9 $136.7 Non-Core Core Loan yield 3Q24 4Q24 1Q25 2Q25 3Q25 ~16% QoQ ■ Period-end loans up 1%; Core loans up 2% – Private Bank growth of $1.0 billion, driven primarily by commercial line utilization and mortgage – Commercial* up slightly given an increase in capital call line utilization, partially offset by CRE paydowns and balance sheet optimization actions – Retail* up $1.1 billion, driven by home equity and mortgage – Non-Core loans down $0.6 billion, reflecting continued runoff ■ Average loans up 1%; Core loans up 1% ■ Loan yield of 5.35%, up 4 bps QoQ, including the benefit of lower swap expense Loans and leases $s in billions Average loans and leases $141.6 $139.2 $137.6 $139.3 $140.9 $7.9 $6.9 $4.2 $3.6 $3.0 $133.7 $132.3 $133.4 $135.7 $137.9 Non-Core Core 3Q24 4Q24 1Q25 2Q25 3Q25 $s in billions Period-end loans and leases 5.50% 5.35% 5.26% 5.31% 5.35% Linked Quarter Year-Over-Year ~17% QoQ ~2% QoQ ~1% QoQ *Excludes Non-Core portfolio and Private Bank. See page 42 for details. ■ Period-end loans down $0.8 billion, or 1%, reflecting Non-Core runoff of $4.9 billion; Core loans up $4.1 billion, or 3% – Private Bank growth of $3.9 billion, primarily in commercial line utilization – Retail* up $2.4 billion, driven by home equity and mortgage – Commercial* down $2.2 billion, reflecting paydowns in CRE and balance sheet optimization actions, partially offset by higher line utilization ■ Average loans down $2.0 billion, or 1%; Core loans up 2%
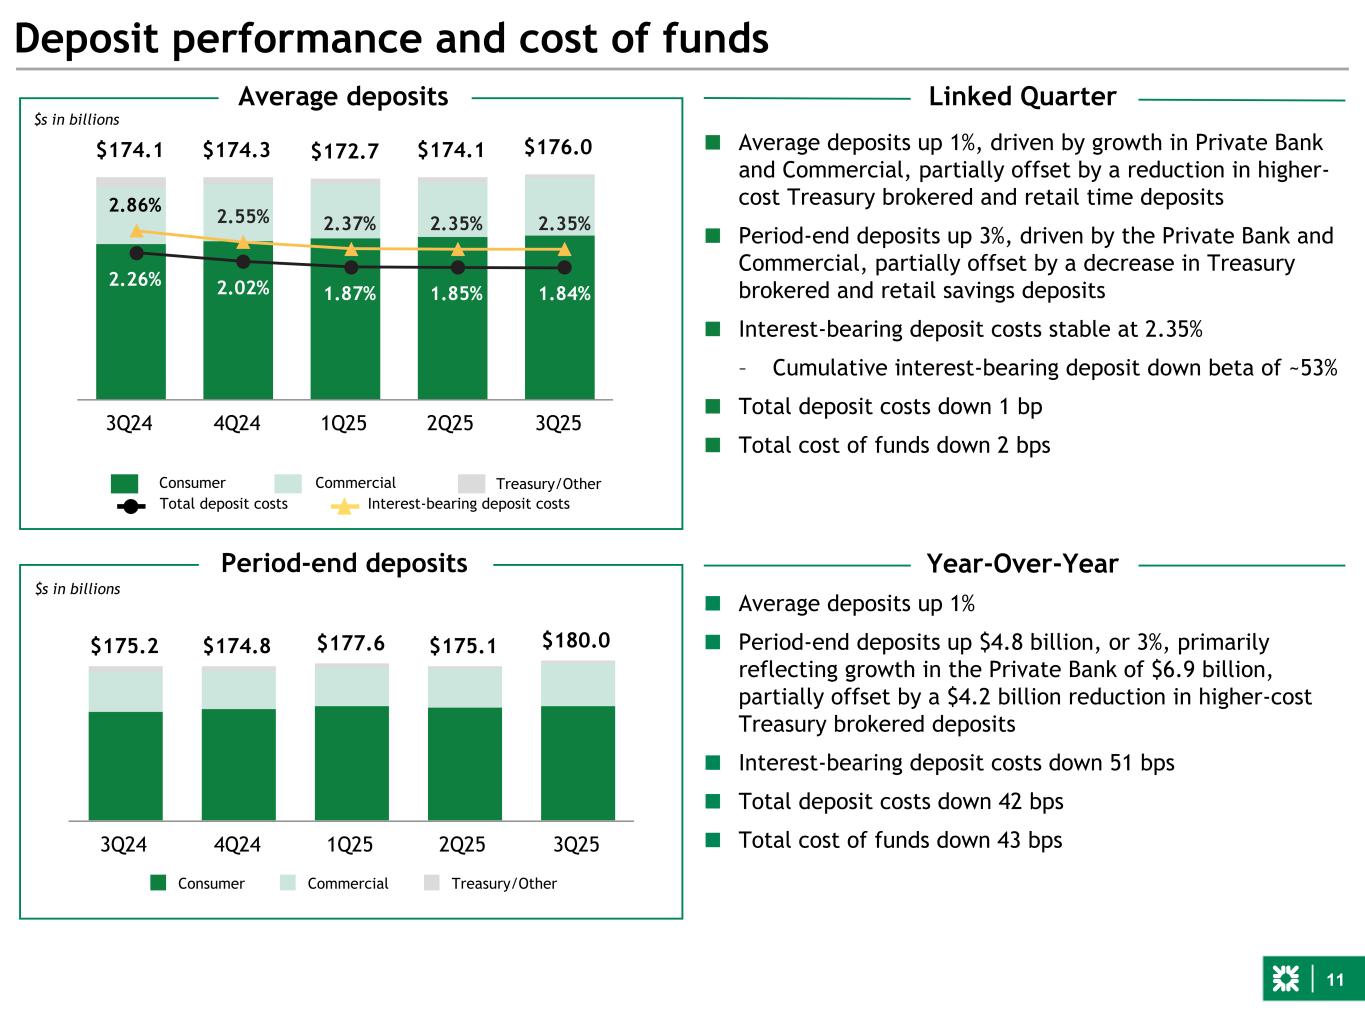
11 $174.1 $174.3 $172.7 $174.1 $176.0 3Q24 4Q24 1Q25 2Q25 3Q25 Deposit performance and cost of funds $s in billions Average deposits 2.26% 2.02% 1.87% 1.85% 1.84% 2.86% 2.55% 2.37% 2.35% 2.35% Total deposit costs Interest-bearing deposit costs CommercialConsumer Treasury/Other Year-Over-YearPeriod-end deposits Linked Quarter ■ Average deposits up 1%, driven by growth in Private Bank and Commercial, partially offset by a reduction in higher- cost Treasury brokered and retail time deposits ■ Period-end deposits up 3%, driven by the Private Bank and Commercial, partially offset by a decrease in Treasury brokered and retail savings deposits ■ Interest-bearing deposit costs stable at 2.35% – Cumulative interest-bearing deposit down beta of ~53% ■ Total deposit costs down 1 bp ■ Total cost of funds down 2 bps $s in billions ■ Average deposits up 1% ■ Period-end deposits up $4.8 billion, or 3%, primarily reflecting growth in the Private Bank of $6.9 billion, partially offset by a $4.2 billion reduction in higher-cost Treasury brokered deposits ■ Interest-bearing deposit costs down 51 bps ■ Total deposit costs down 42 bps ■ Total cost of funds down 43 bps $175.2 $174.8 $177.6 $175.1 $180.0 Consumer Commercial Treasury/Other 3Q24 4Q24 1Q25 2Q25 3Q25
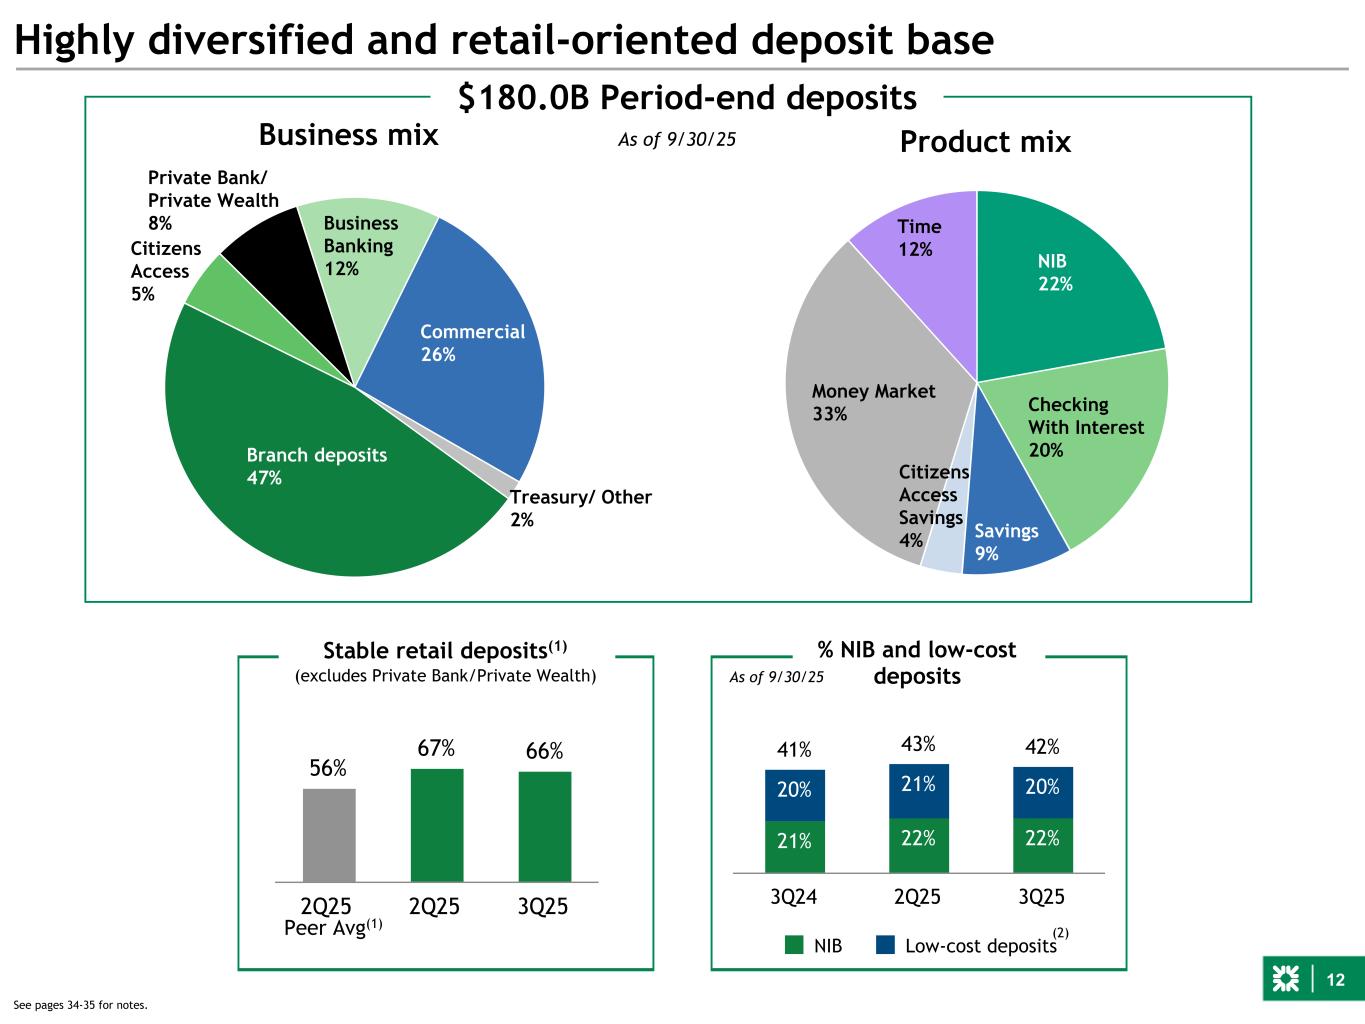
12 Branch deposits 47% Citizens Access 5% Private Bank/ Private Wealth 8% Business Banking 12% Commercial 26% Treasury/ Other 2% As of 9/30/25 Highly diversified and retail-oriented deposit base $180.0B Period-end deposits Peer Avg(1) Business mix Product mix Stable retail deposits(1) (excludes Private Bank/Private Wealth) 41% 43% 42% 21% 22% 22% 20% 21% 20% NIB Low-cost deposits 3Q24 2Q25 3Q25 % NIB and low-cost deposits (2) 56% 67% 66% 2Q25 2Q25 3Q25 See pages 34-35 for notes. NIB 22% Checking With Interest 20% Savings 9% Citizens Access Savings 4% Money Market 33% Time 12% As of 9/30/25
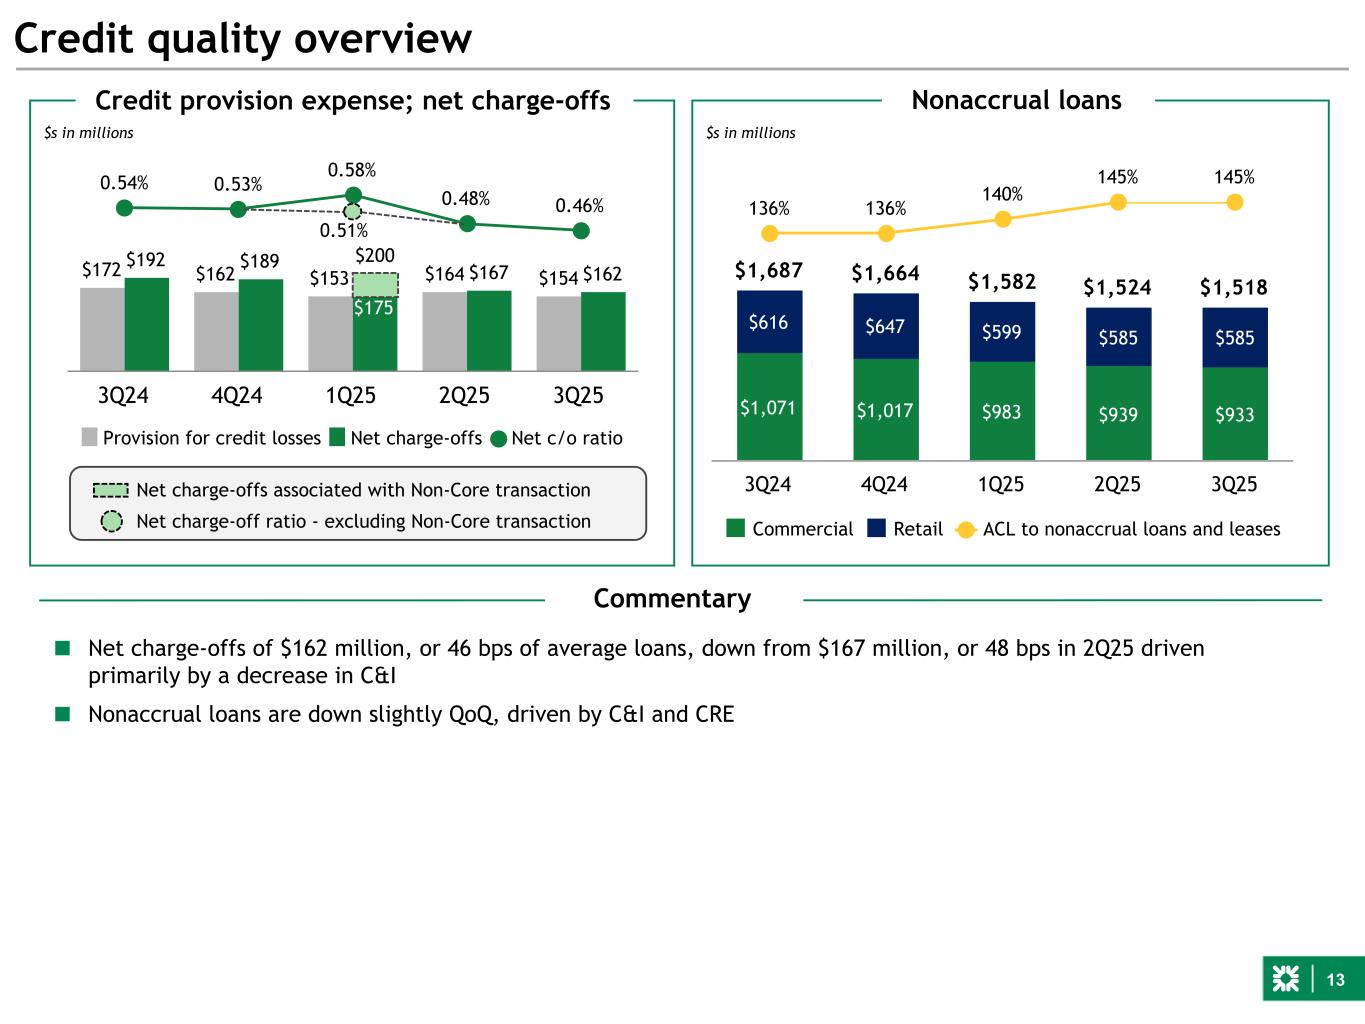
13 $172 $162 $153 $164 $154 $192 $189 $200 $167 $162 0.54% 0.53% 0.58% 0.48% 0.46% Provision for credit losses Net charge-offs Net c/o ratio 3Q24 4Q24 1Q25 2Q25 3Q25 0.51% Credit quality overview $s in millions $s in millions Credit provision expense; net charge-offs $1,687 $1,664 $1,582 $1,524 $1,518 $1,071 $1,017 $983 $939 $933 $616 $647 $599 $585 $585 136% 136% 140% 145% 145% Commercial Retail ACL to nonaccrual loans and leases 3Q24 4Q24 1Q25 2Q25 3Q25 Nonaccrual loans Net charge-offs associated with Non-Core transaction $175 Net charge-off ratio - excluding Non-Core transaction Commentary ■ Net charge-offs of $162 million, or 46 bps of average loans, down from $167 million, or 48 bps in 2Q25 driven primarily by a decrease in C&I ■ Nonaccrual loans are down slightly QoQ, driven by C&I and CRE
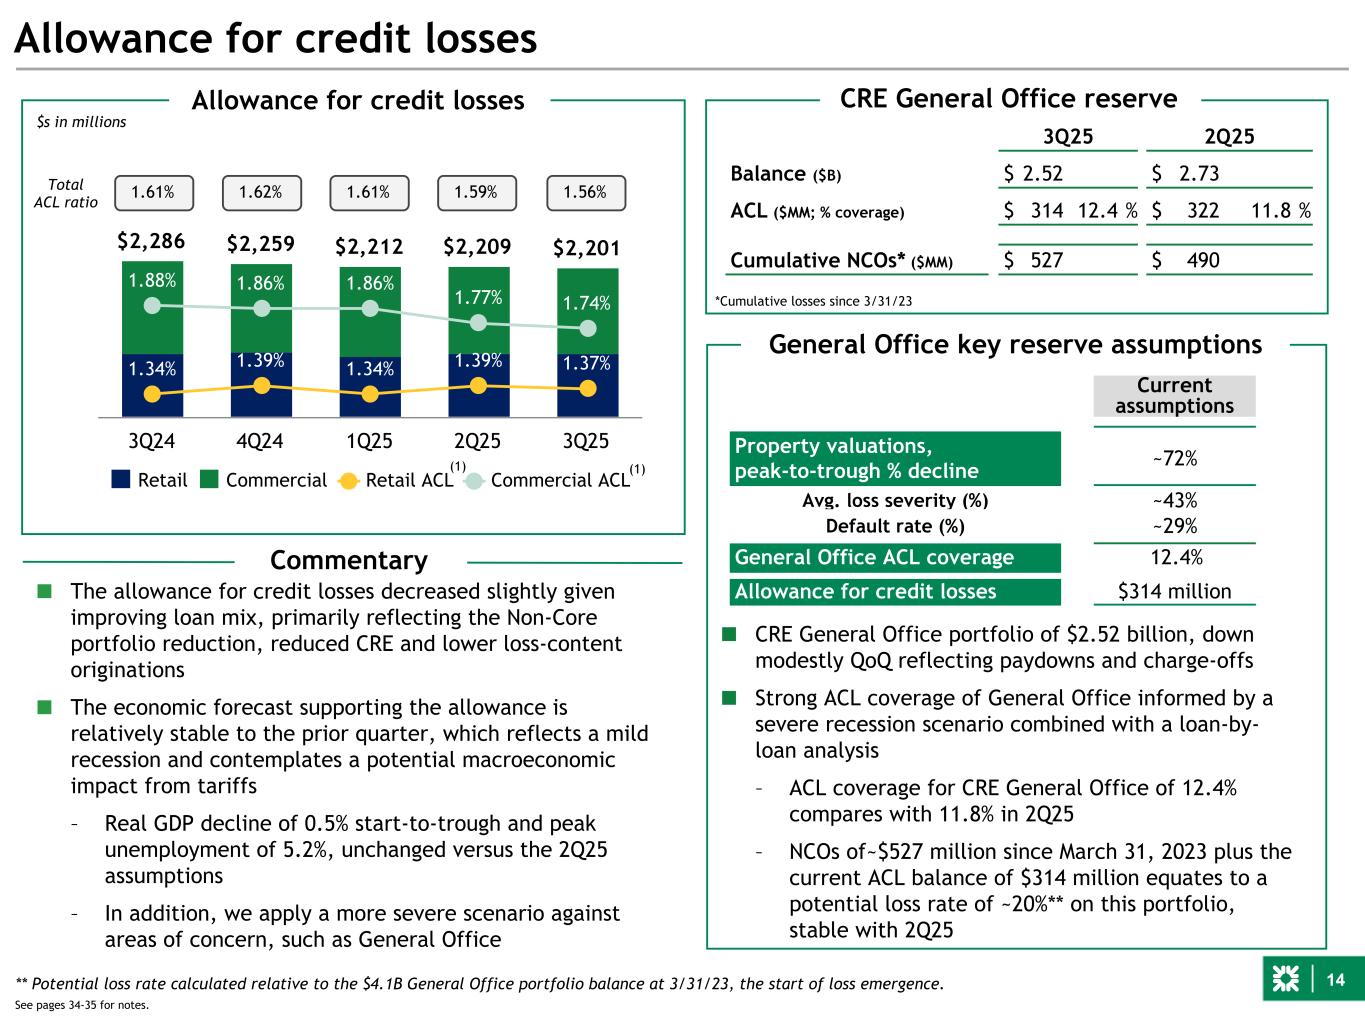
14 Allowance for credit losses Current assumptions Property valuations, peak-to-trough % decline ~72% Avg. loss severity (%) ~43% Default rate (%) ~29% General Office ACL coverage 12.4% Allowance for credit losses $314 million General Office key reserve assumptions ■ CRE General Office portfolio of $2.52 billion, down modestly QoQ reflecting paydowns and charge-offs ■ Strong ACL coverage of General Office informed by a severe recession scenario combined with a loan-by- loan analysis – ACL coverage for CRE General Office of 12.4% compares with 11.8% in 2Q25 – NCOs of~$527 million since March 31, 2023 plus the current ACL balance of $314 million equates to a potential loss rate of ~20%** on this portfolio, stable with 2Q25 3Q25 2Q25 Balance ($B) $ 2.52 $ 2.73 ACL ($MM; % coverage) $ 314 12.4 % $ 322 11.8 % Cumulative NCOs* ($MM) $ 527 $ 490 CRE General Office reserve *Cumulative losses since 3/31/23 $2,286 $2,259 $2,212 $2,209 $2,201 1.34% 1.39% 1.34% 1.39% 1.37% 1.88% 1.86% 1.86% 1.77% 1.74% Retail Commercial Retail ACL Commercial ACL 3Q24 4Q24 1Q25 2Q25 3Q25 $s in millions Allowance for credit losses (1) ** Potential loss rate calculated relative to the $4.1B General Office portfolio balance at 3/31/23, the start of loss emergence. ■ The allowance for credit losses decreased slightly given improving loan mix, primarily reflecting the Non-Core portfolio reduction, reduced CRE and lower loss-content originations ■ The economic forecast supporting the allowance is relatively stable to the prior quarter, which reflects a mild recession and contemplates a potential macroeconomic impact from tariffs – Real GDP decline of 0.5% start-to-trough and peak unemployment of 5.2%, unchanged versus the 2Q25 assumptions – In addition, we apply a more severe scenario against areas of concern, such as General Office Commentary 1.61% 1.62% 1.61% 1.59% 1.56%Total ACL ratio See pages 34-35 for notes. (1)
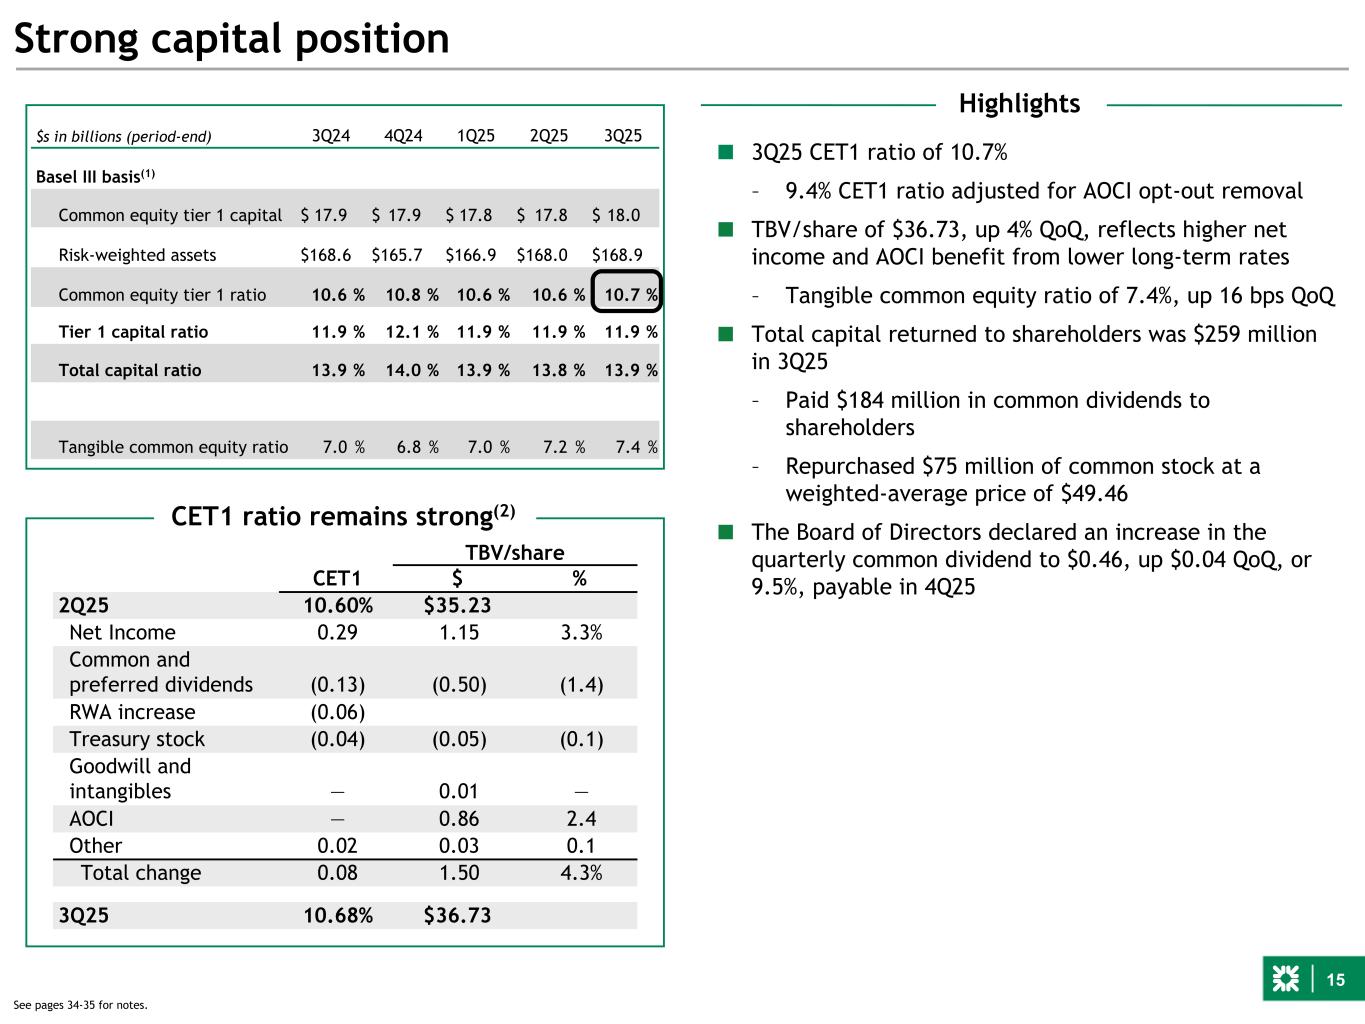
15 Strong capital position $s in billions (period-end) 3Q24 4Q24 1Q25 2Q25 3Q25 Basel III basis(1) Common equity tier 1 capital $ 17.9 $ 17.9 $ 17.8 $ 17.8 $ 18.0 Risk-weighted assets $ 168.6 $ 165.7 $ 166.9 $ 168.0 $ 168.9 Common equity tier 1 ratio 10.6 % 10.8 % 10.6 % 10.6 % 10.7 % Tier 1 capital ratio 11.9 % 12.1 % 11.9 % 11.9 % 11.9 % Total capital ratio 13.9 % 14.0 % 13.9 % 13.8 % 13.9 % Tangible common equity ratio 7.0 % 6.8 % 7.0 % 7.2 % 7.4 % TBV/share CET1 $ % 2Q25 10.60% $35.23 Net Income 0.29 1.15 3.3% Common and preferred dividends (0.13) (0.50) (1.4) RWA increase (0.06) Treasury stock (0.04) (0.05) (0.1) Goodwill and intangibles — 0.01 — AOCI — 0.86 2.4 Other 0.02 0.03 0.1 Total change 0.08 1.50 4.3% 3Q25 10.68% $36.73 CET1 ratio remains strong(2) Highlights ■ 3Q25 CET1 ratio of 10.7% – 9.4% CET1 ratio adjusted for AOCI opt-out removal ■ TBV/share of $36.73, up 4% QoQ, reflects higher net income and AOCI benefit from lower long-term rates – Tangible common equity ratio of 7.4%, up 16 bps QoQ ■ Total capital returned to shareholders was $259 million in 3Q25 – Paid $184 million in common dividends to shareholders – Repurchased $75 million of common stock at a weighted-average price of $49.46 ■ The Board of Directors declared an increase in the quarterly common dividend to $0.46, up $0.04 QoQ, or 9.5%, payable in 4Q25 See pages 34-35 for notes.
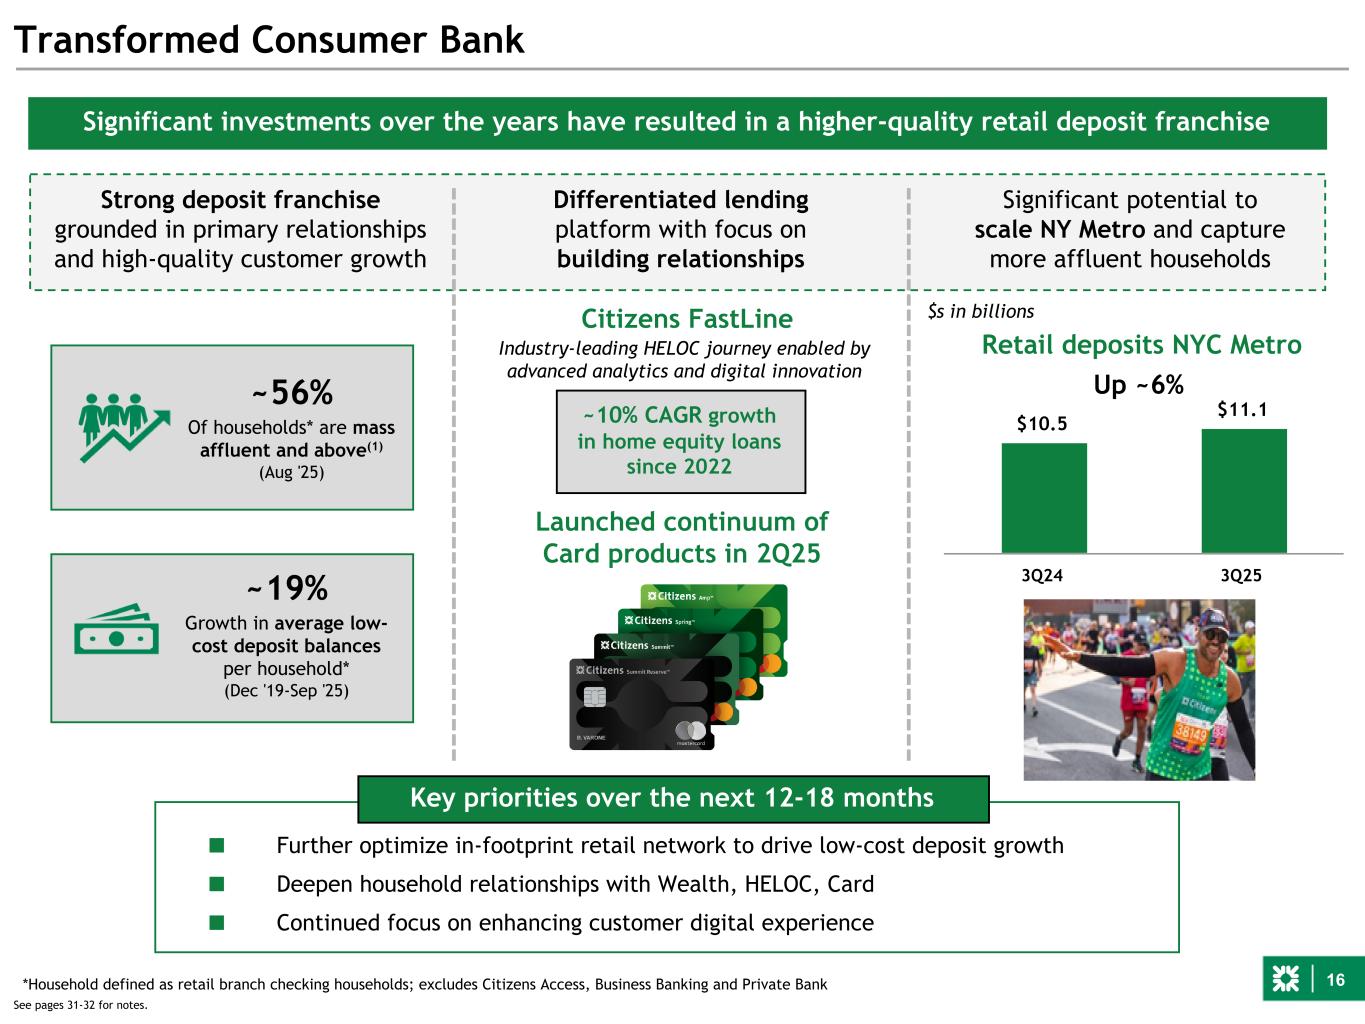
16 See pages 31-32 for notes. Transformed Consumer Bank Strong deposit franchise grounded in primary relationships and high-quality customer growth Differentiated lending platform with focus on building relationships Significant potential to scale NY Metro and capture more affluent households ~56% Of households* are mass affluent and above(1) (Aug '25) ~19% Growth in average low- cost deposit balances per household* (Dec '19-Sep '25) $10.5 $11.1 3Q24 3Q25 Retail deposits NYC Metro Up ~6% Significant investments over the years have resulted in a higher-quality retail deposit franchise ■ Further optimize in-footprint retail network to drive low-cost deposit growth ■ Deepen household relationships with Wealth, HELOC, Card ■ Continued focus on enhancing customer digital experience Key priorities over the next 12-18 months Launched continuum of Card products in 2Q25 ~10% CAGR growth in home equity loans since 2022 Industry-leading HELOC journey enabled by advanced analytics and digital innovation Citizens FastLine *Household defined as retail branch checking households; excludes Citizens Access, Business Banking and Private Bank $s in billions
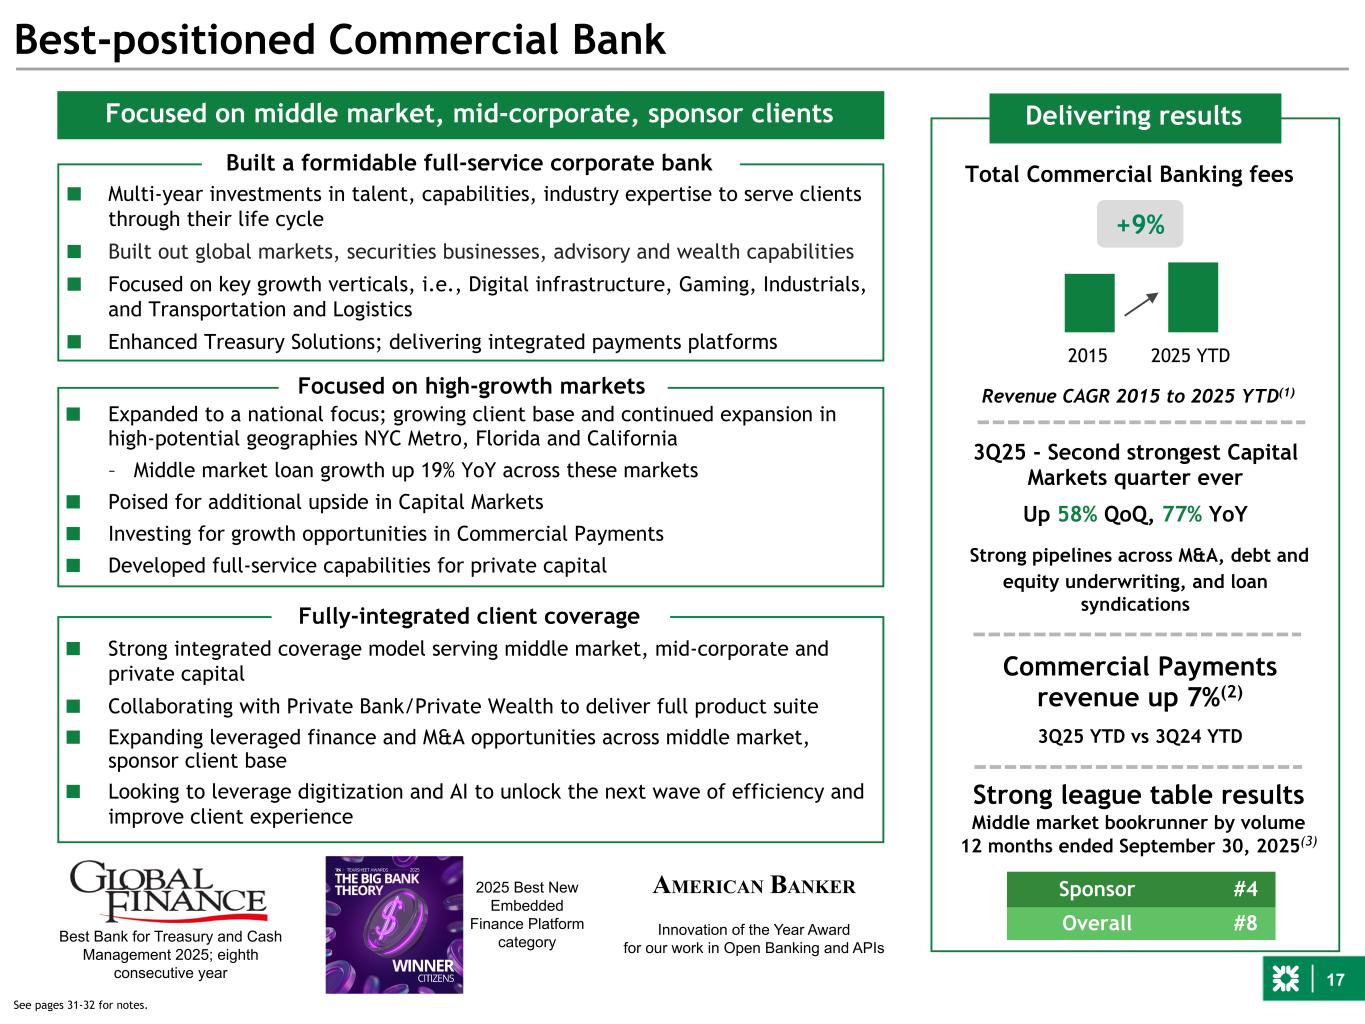
17 Best-positioned Commercial Bank Delivering results Strong league table results Middle market bookrunner by volume 12 months ended September 30, 2025(3) Sponsor #4 Overall #8 Revenue CAGR 2015 to 2025 YTD(1) Total Commercial Banking fees 3Q25 - Second strongest Capital Markets quarter ever Up 58% QoQ, 77% YoY Strong pipelines across M&A, debt and equity underwriting, and loan syndications ■ Multi-year investments in talent, capabilities, industry expertise to serve clients through their life cycle ■ Built out global markets, securities businesses, advisory and wealth capabilities ■ Focused on key growth verticals, i.e., Digital infrastructure, Gaming, Industrials, and Transportation and Logistics ■ Enhanced Treasury Solutions; delivering integrated payments platforms Focused on high-growth markets Fully-integrated client coverage Built a formidable full-service corporate bank ■ Expanded to a national focus; growing client base and continued expansion in high-potential geographies NYC Metro, Florida and California – Middle market loan growth up 19% YoY across these markets ■ Poised for additional upside in Capital Markets ■ Investing for growth opportunities in Commercial Payments ■ Developed full-service capabilities for private capital ■ Strong integrated coverage model serving middle market, mid-corporate and private capital ■ Collaborating with Private Bank/Private Wealth to deliver full product suite ■ Expanding leveraged finance and M&A opportunities across middle market, sponsor client base ■ Looking to leverage digitization and AI to unlock the next wave of efficiency and improve client experience Focused on middle market, mid-corporate, sponsor clients Best Bank for Treasury and Cash Management 2025; eighth consecutive year AMERICAN BANKER Innovation of the Year Award for our work in Open Banking and APIs 2015 2025 YTD +9% See pages 31-32 for notes. Commercial Payments revenue up 7%(2) 3Q25 YTD vs 3Q24 YTD 2025 Best New Embedded Finance Platform category
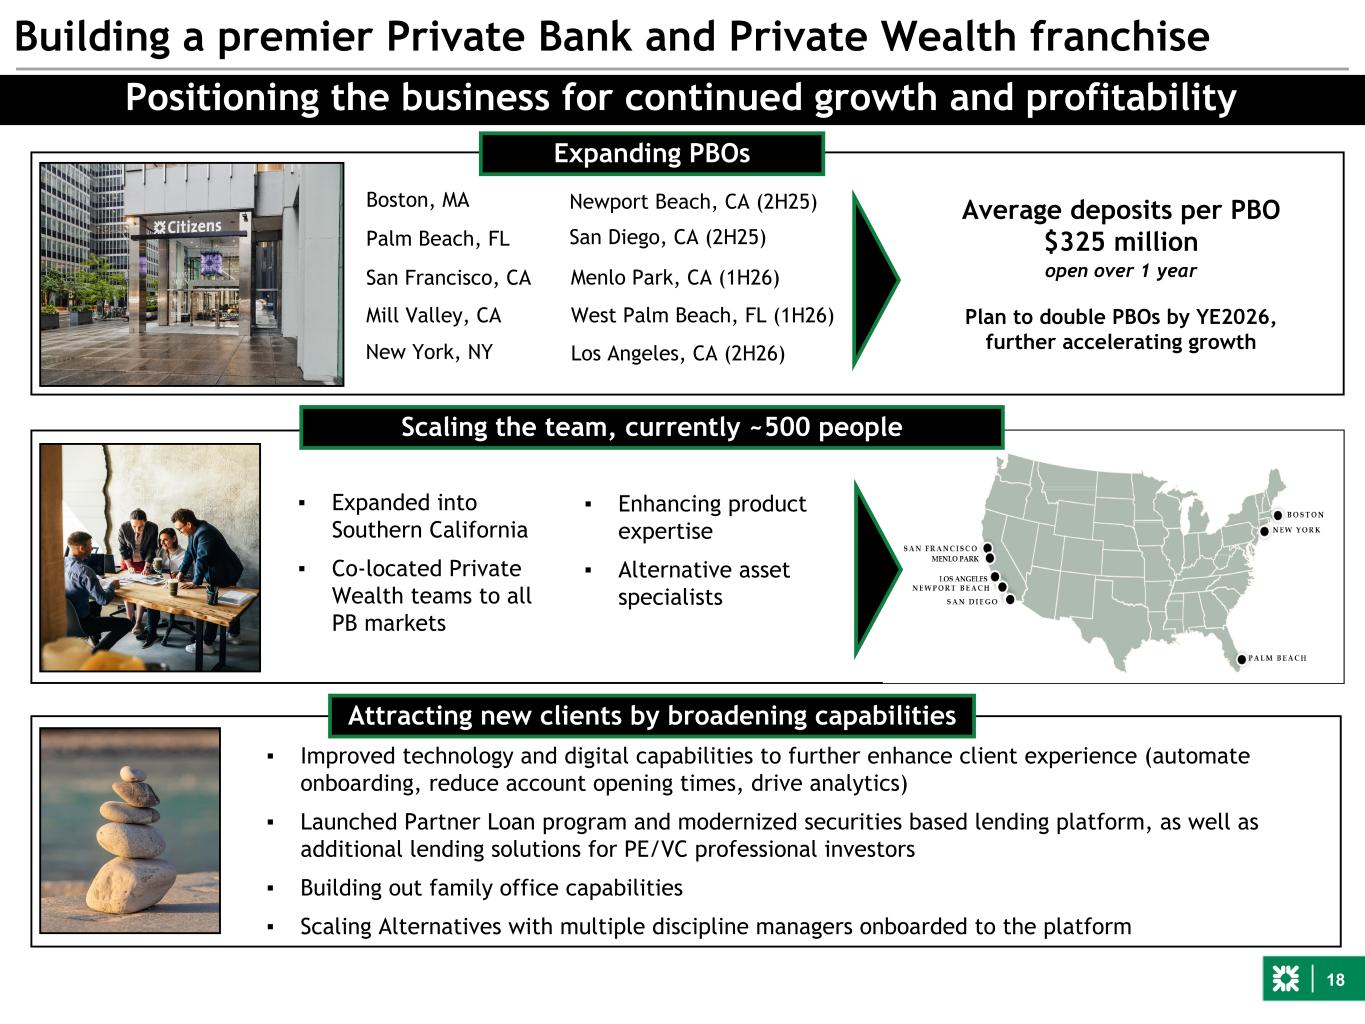
18 Building a premier Private Bank and Private Wealth franchise Expanding PBOs Positioning the business for continued growth and profitability Boston, MA Mill Valley, CA San Francisco, CA Palm Beach, FL New York, NY Menlo Park, CA (1H26) Newport Beach, CA (2H25) San Diego, CA (2H25) West Palm Beach, FL (1H26) Scaling the team, currently ~500 people ▪ Expanded into Southern California ▪ Co-located Private Wealth teams to all PB markets Attracting new clients by broadening capabilities ▪ Enhancing product expertise ▪ Alternative asset specialists ▪ Improved technology and digital capabilities to further enhance client experience (automate onboarding, reduce account opening times, drive analytics) ▪ Launched Partner Loan program and modernized securities based lending platform, as well as additional lending solutions for PE/VC professional investors ▪ Building out family office capabilities ▪ Scaling Alternatives with multiple discipline managers onboarded to the platform Average deposits per PBO $325 million open over 1 year Plan to double PBOs by YE2026, further accelerating growthLos Angeles, CA (2H26)
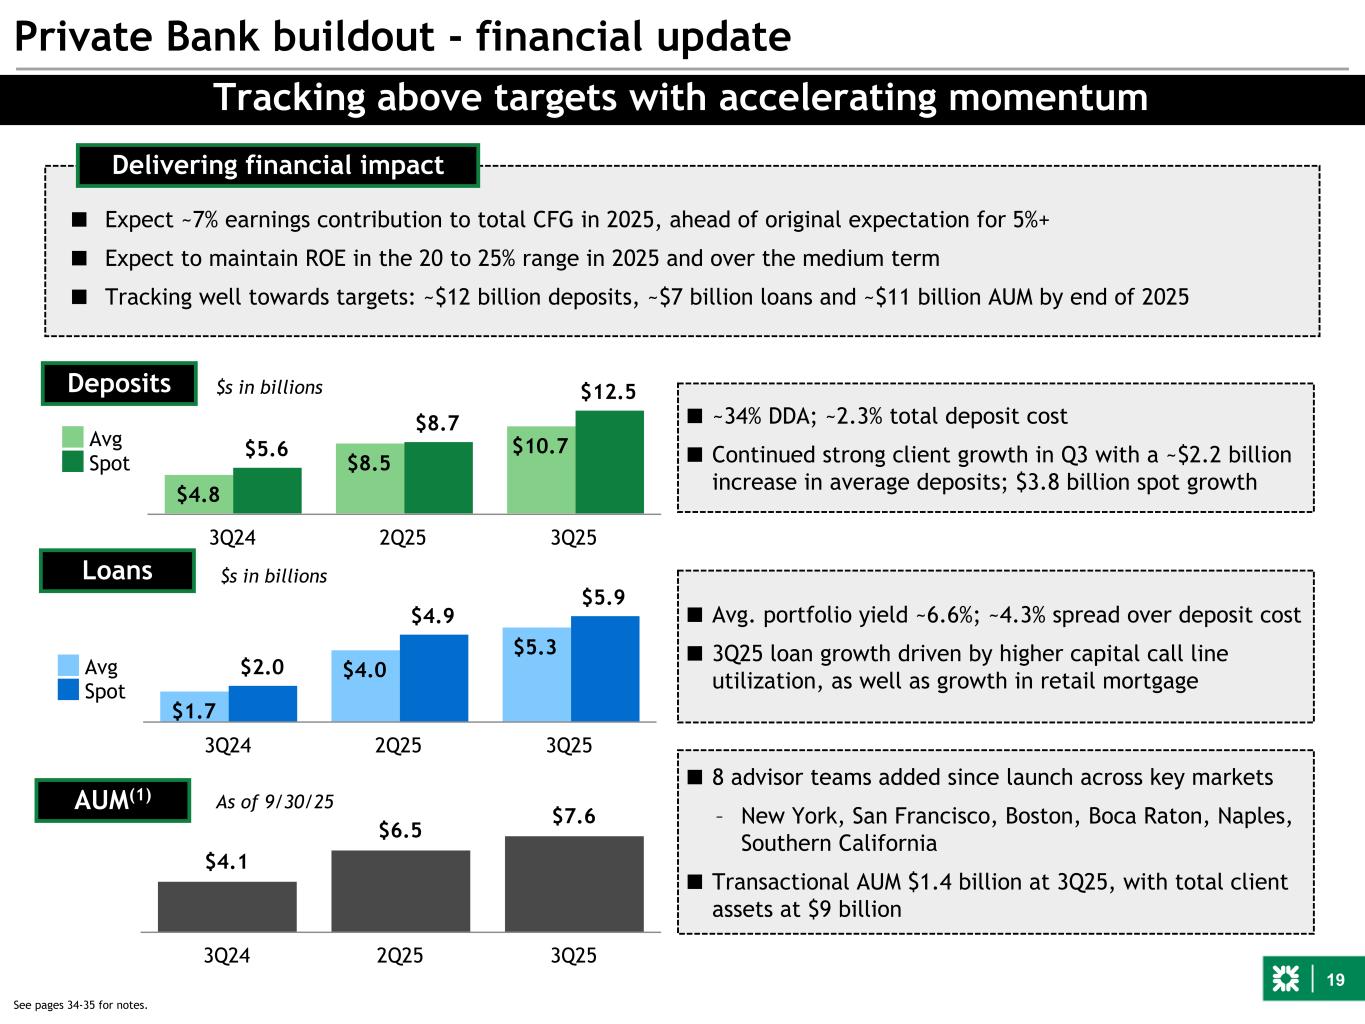
19 Private Bank buildout - financial update See pages 34-35 for notes. ■ Expect ~7% earnings contribution to total CFG in 2025, ahead of original expectation for 5%+ ■ Expect to maintain ROE in the 20 to 25% range in 2025 and over the medium term ■ Tracking well towards targets: ~$12 billion deposits, ~$7 billion loans and ~$11 billion AUM by end of 2025 Delivering financial impact Tracking above targets with accelerating momentum $4.8 $8.5 $10.7$5.6 $8.7 $12.5 Avg Spot 3Q24 2Q25 3Q25 $s in billionsDeposits $1.7 $4.0 $5.3 $2.0 $4.9 $5.9 Avg Spot 3Q24 2Q25 3Q25 Loans $4.1 $6.5 $7.6 3Q24 2Q25 3Q25 As of 9/30/25 AUM(1) ■ Avg. portfolio yield ~6.6%; ~4.3% spread over deposit cost ■ 3Q25 loan growth driven by higher capital call line utilization, as well as growth in retail mortgage ■ 8 advisor teams added since launch across key markets – New York, San Francisco, Boston, Boca Raton, Naples, Southern California ■ Transactional AUM $1.4 billion at 3Q25, with total client assets at $9 billion ■ ~34% DDA; ~2.3% total deposit cost ■ Continued strong client growth in Q3 with a ~$2.2 billion increase in average deposits; $3.8 billion spot growth $s in billions
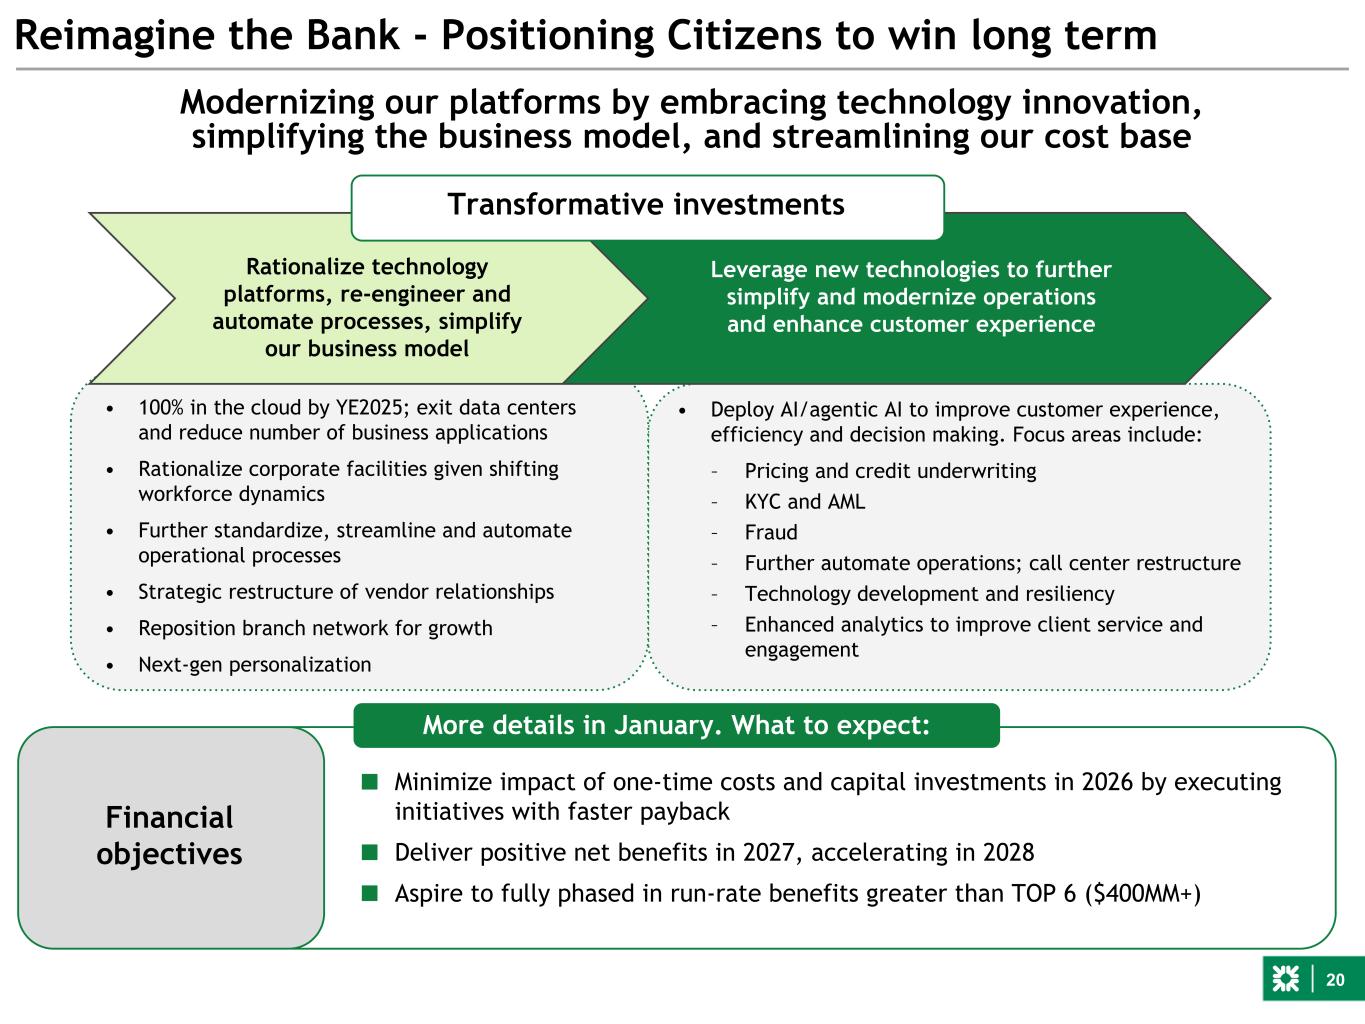
20 Financial objectives Reimagine the Bank - Positioning Citizens to win long term Further upskilling AI/ ML talent Retail network optimization AI-driven pricing, credit, collections Hyper- personalized CX Agentic AI enabled Call Center Vendor simplification – Redesign E2E processes and customer journeys – Build Agentic AI infrastructure Redesign customer journeys AI-driven fraud, KYC and AML tools Automate operations Empowered bankers with AI- driven intelligence Corporate facilities optimization [Program benefits to fund ongoing transformation beginning in 2026] Modernizing our platforms by embracing technology innovation, simplifying the business model, and streamlining our cost base ■ Minimize impact of one-time costs and capital investments in 2026 by executing initiatives with faster payback ■ Deliver positive net benefits in 2027, accelerating in 2028 ■ Aspire to fully phased in run-rate benefits greater than TOP 6 ($400MM+) More details in January. What to expect: Leverage new technologies to further simplify and modernize operations and enhance customer experience Rationalize technology platforms, re-engineer and automate processes, simplify our business model Transformative investments • Deploy AI/agentic AI to improve customer experience, efficiency and decision making. Focus areas include: – Pricing and credit underwriting – KYC and AML – Fraud – Further automate operations; call center restructure – Technology development and resiliency – Enhanced analytics to improve client service and engagement • 100% in the cloud by YE2025; exit data centers and reduce number of business applications • Rationalize corporate facilities given shifting workforce dynamics • Further standardize, streamline and automate operational processes • Strategic restructure of vendor relationships • Reposition branch network for growth • Next-gen personalization
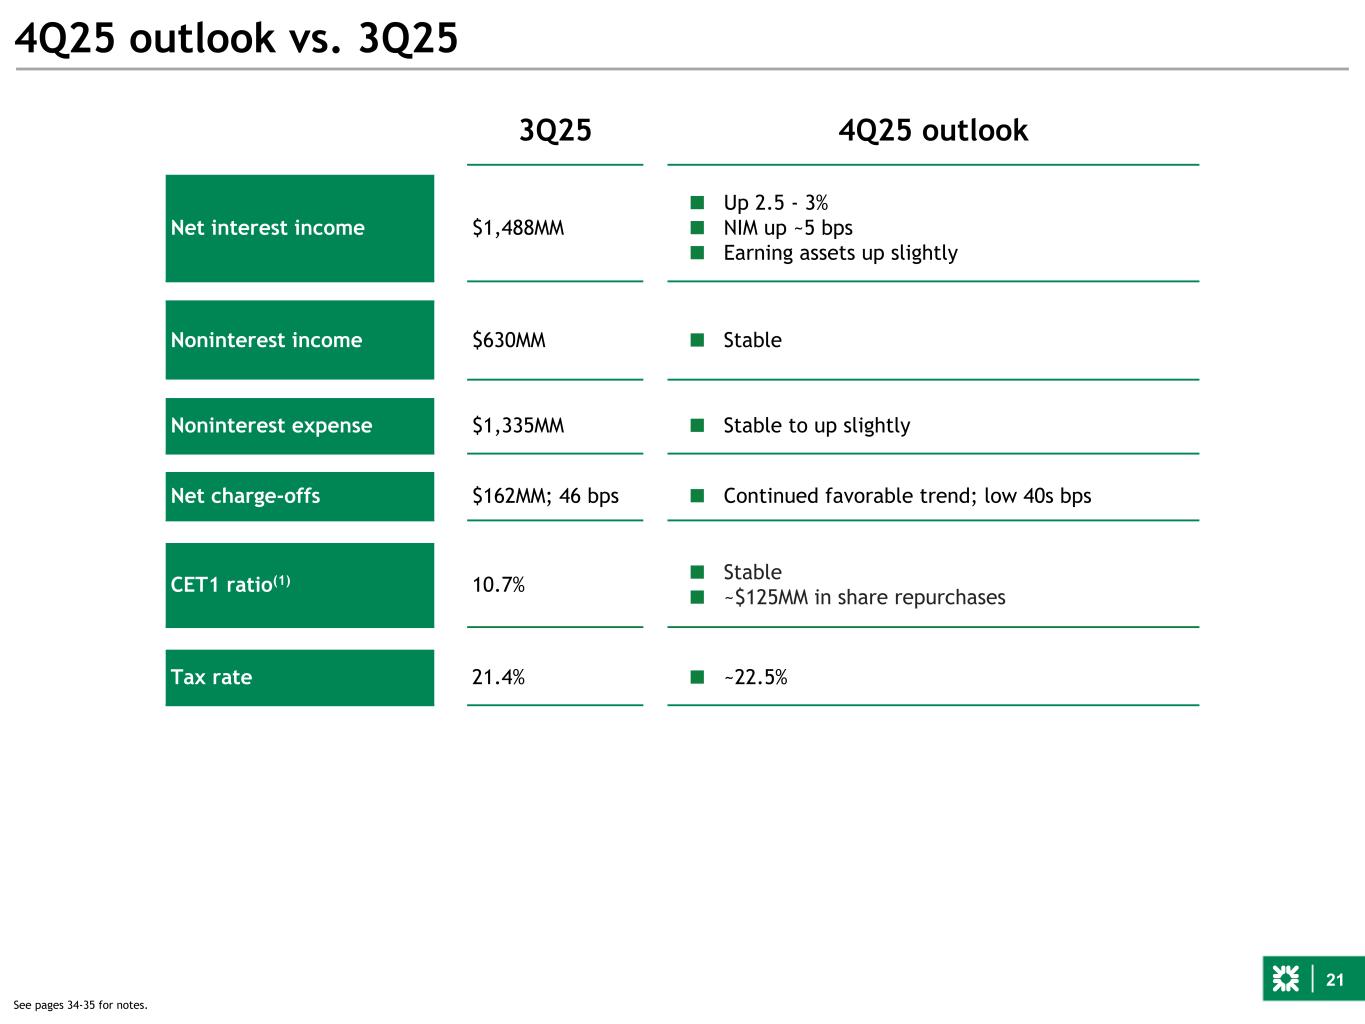
21 4Q25 outlook vs. 3Q25 See pages 34-35 for notes. 3Q25 4Q25 outlook Net interest income $1,488MM ■ Up 2.5 - 3% ■ NIM up ~5 bps ■ Earning assets up slightly Noninterest income $630MM ■ Stable Noninterest expense $1,335MM ■ Stable to up slightly Net charge-offs $162MM; 46 bps ■ Continued favorable trend; low 40s bps CET1 ratio(1) 10.7% ■ Stable ■ ~$125MM in share repurchases Tax rate 21.4% ■ ~22.5%
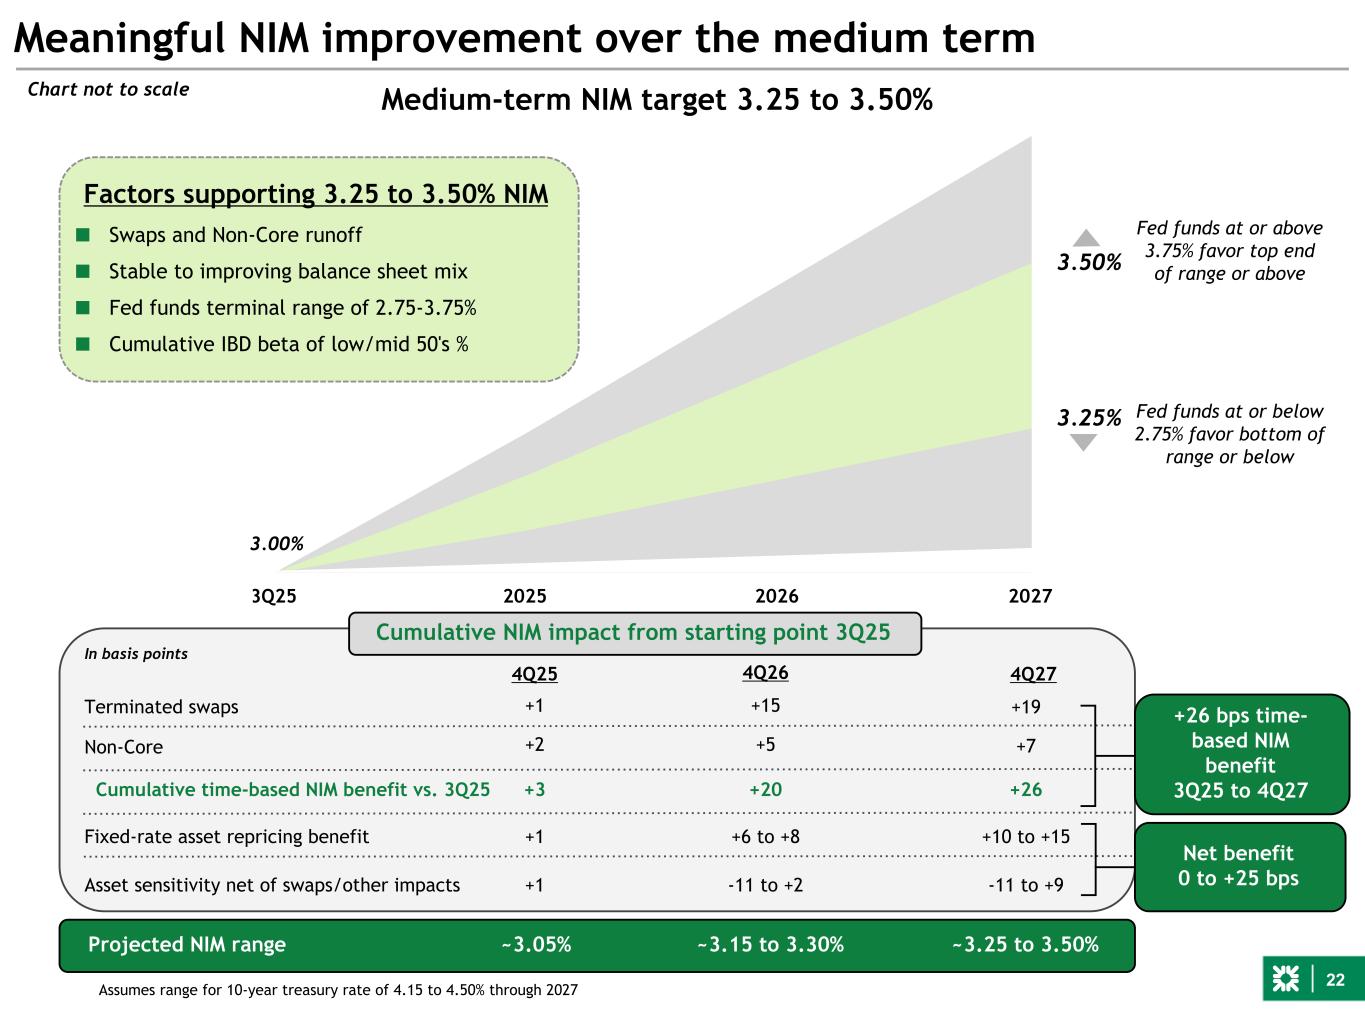
22 3Q25 2025 2026 2027 Meaningful NIM improvement over the medium term Medium-term NIM target 3.25 to 3.50% Terminated swaps Non-Core Asset sensitivity net of swaps/other impacts Projected NIM range Fixed-rate asset repricing benefit Cumulative time-based NIM benefit vs. 3Q25 4Q26 4Q27 In basis points +15 +5 +20 +19 +7 +26 +10 to +15 -11 to +9 ~3.25 to 3.50% Chart not to scale 3.00% Net benefit 0 to +25 bps 3.25% 3.50% Fed funds at or above 3.75% favor top end of range or above Fed funds at or below 2.75% favor bottom of range or below Factors supporting 3.25 to 3.50% NIM ■ Swaps and Non-Core runoff ■ Stable to improving balance sheet mix ■ Fed funds terminal range of 2.75-3.75% ■ Cumulative IBD beta of low/mid 50's % +26 bps time- based NIM benefit 3Q25 to 4Q27 4Q25 +1 +2 +3 ~3.05% ~3.15 to 3.30% Assumes range for 10-year treasury rate of 4.15 to 4.50% through 2027 +6 to +8+1 +1 -11 to +2 Cumulative NIM impact from starting point 3Q25
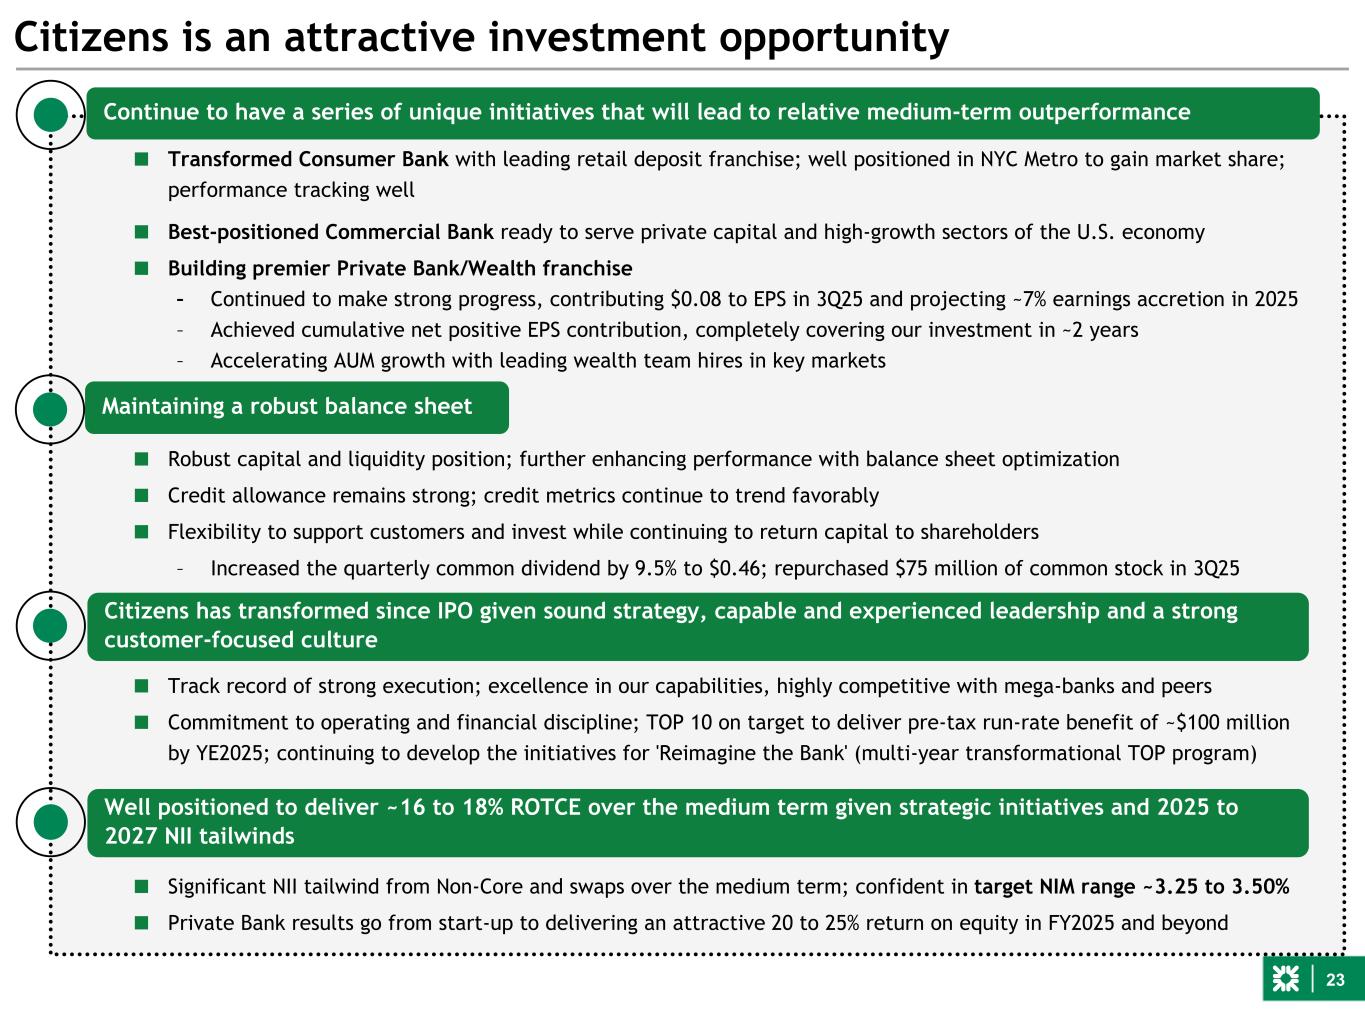
23 ■ Robust capital and liquidity position; further enhancing performance with balance sheet optimization ■ Credit allowance remains strong; credit metrics continue to trend favorably ■ Flexibility to support customers and invest while continuing to return capital to shareholders – Increased the quarterly common dividend by 9.5% to $0.46; repurchased $75 million of common stock in 3Q25 ■ Track record of strong execution; excellence in our capabilities, highly competitive with mega-banks and peers ■ Commitment to operating and financial discipline; TOP 10 on target to deliver pre-tax run-rate benefit of ~$100 million by YE2025; continuing to develop the initiatives for 'Reimagine the Bank' (multi-year transformational TOP program) Citizens is an attractive investment opportunity ■ Transformed Consumer Bank with leading retail deposit franchise; well positioned in NYC Metro to gain market share; performance tracking well ■ Best-positioned Commercial Bank ready to serve private capital and high-growth sectors of the U.S. economy ■ Building premier Private Bank/Wealth franchise – Continued to make strong progress, contributing $0.08 to EPS in 3Q25 and projecting ~7% earnings accretion in 2025 – Achieved cumulative net positive EPS contribution, completely covering our investment in ~2 years – Accelerating AUM growth with leading wealth team hires in key markets Maintaining a robust balance sheet Citizens has transformed since IPO given sound strategy, capable and experienced leadership and a strong customer-focused culture Well positioned to deliver ~16 to 18% ROTCE over the medium term given strategic initiatives and 2025 to 2027 NII tailwinds ■ Significant NII tailwind from Non-Core and swaps over the medium term; confident in target NIM range ~3.25 to 3.50% ■ Private Bank results go from start-up to delivering an attractive 20 to 25% return on equity in FY2025 and beyond Continue to have a series of unique initiatives that will lead to relative medium-term outperformance
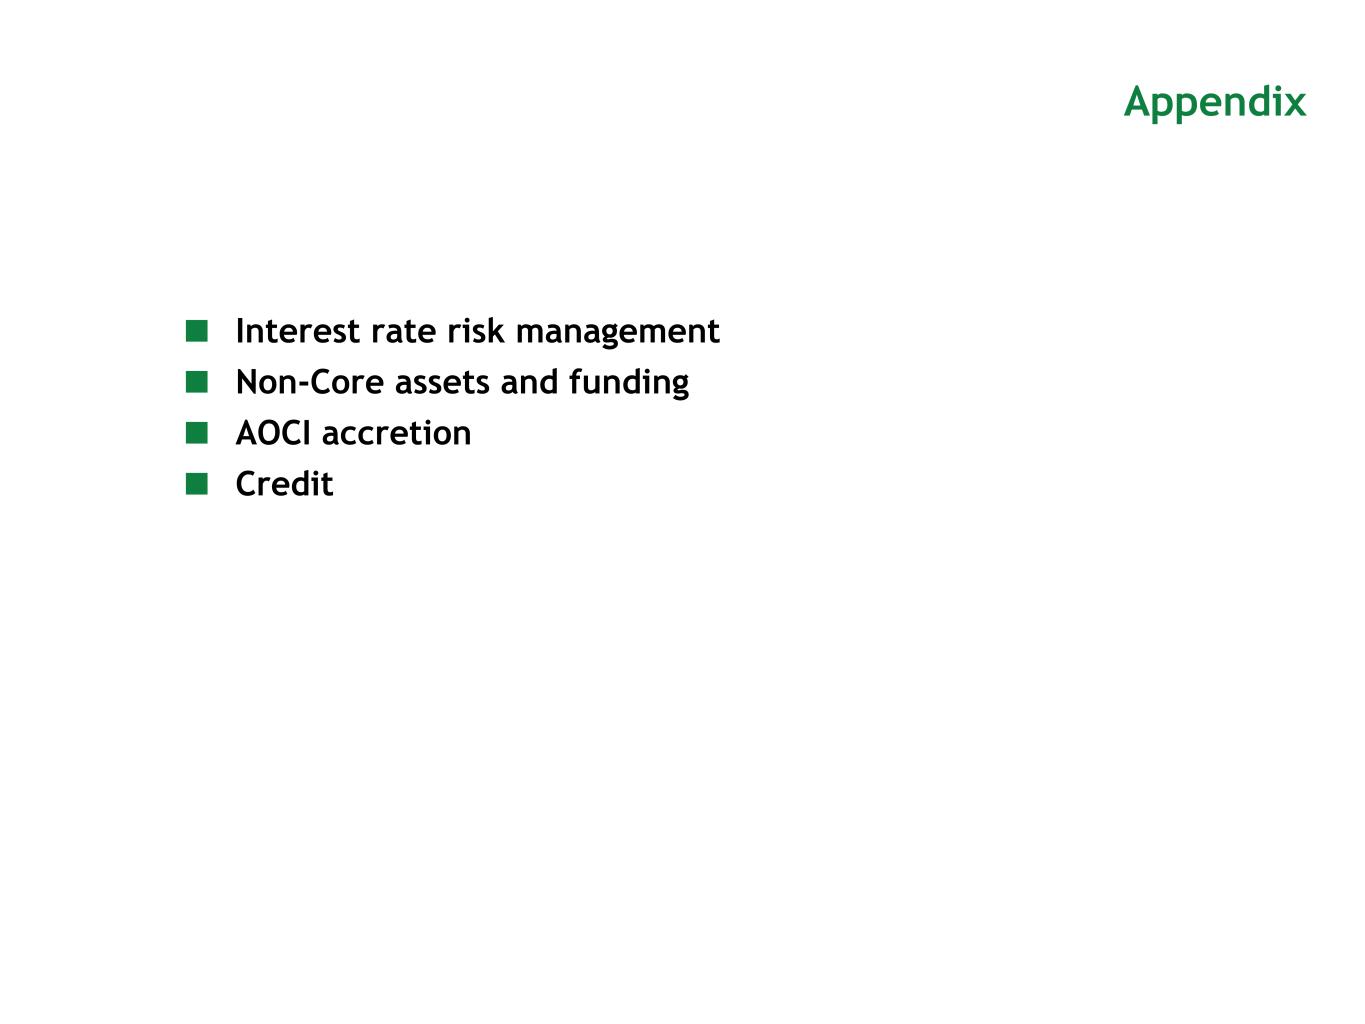
Appendix ■ Interest rate risk management ■ Non-Core assets and funding ■ AOCI accretion ■ Credit
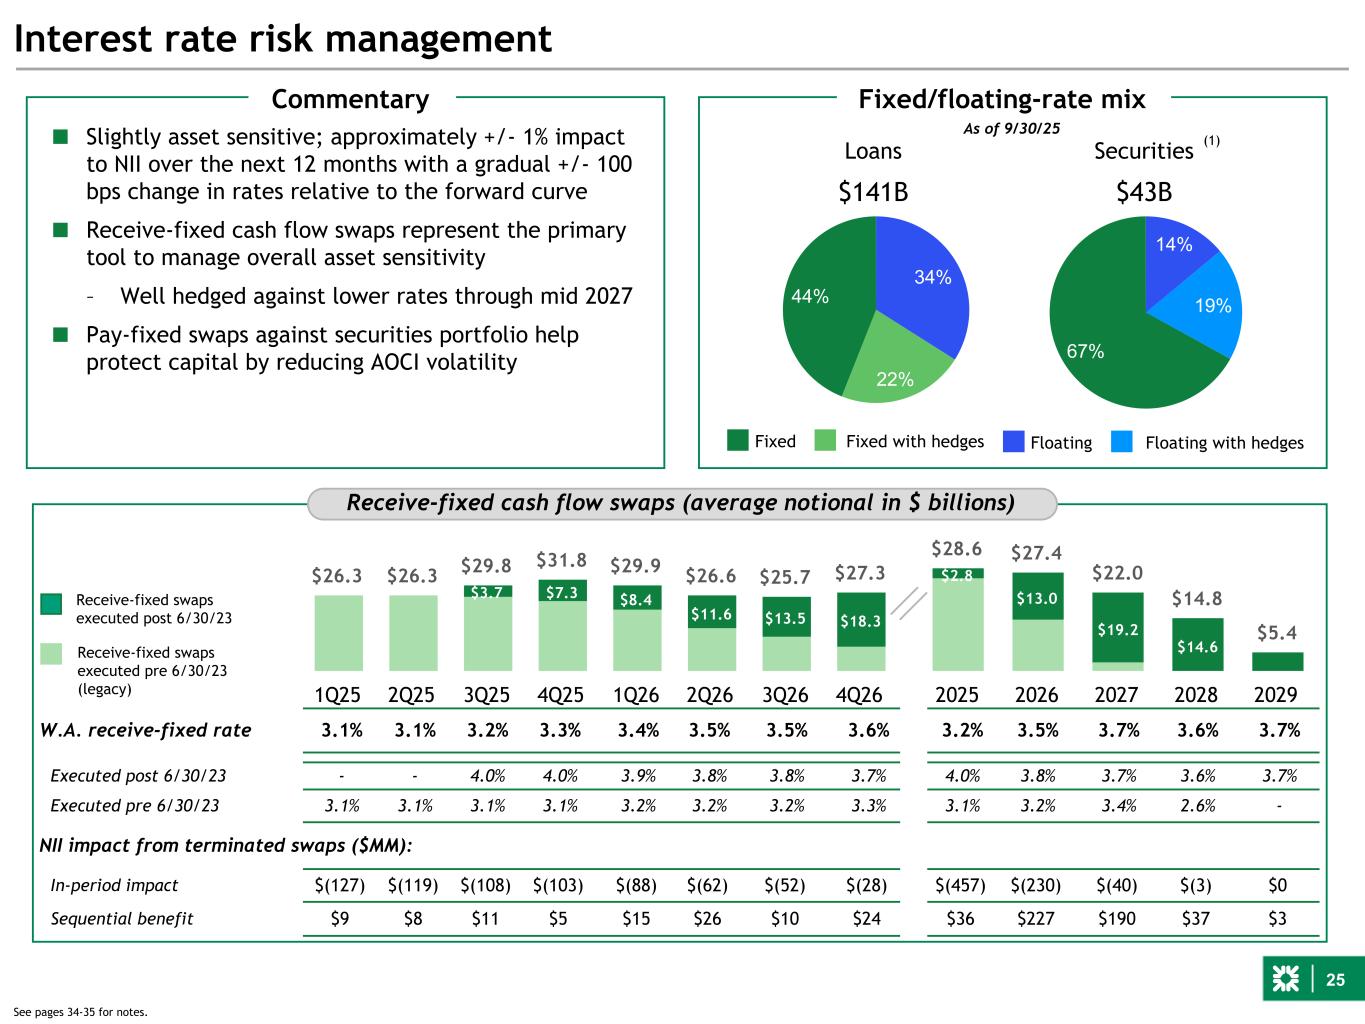
25 $26.3 $26.3 $29.8 $31.8 $29.9 $26.6 $25.7 $27.3 $3.7 $7.3 $8.4 $11.6 $13.5 $18.3 1Q25 2Q25 3Q25 4Q25 1Q26 2Q26 3Q26 4Q26 $28.6 $27.4 $22.0 $14.8 $5.4 $2.8 $13.0 $19.2 $14.6 2025 2026 2027 2028 2029 Interest rate risk management W.A. receive-fixed rate 3.1% 3.1% 3.2% 3.3% 3.4% 3.5% 3.5% 3.6% 3.2% 3.5% 3.7% 3.6% 3.7% Executed post 6/30/23 - - 4.0% 4.0% 3.9% 3.8% 3.8% 3.7% 4.0% 3.8% 3.7% 3.6% 3.7% Executed pre 6/30/23 3.1% 3.1% 3.1% 3.1% 3.2% 3.2% 3.2% 3.3% 3.1% 3.2% 3.4% 2.6% - NII impact from terminated swaps ($MM): In-period impact $(127) $(119) $(108) $(103) $(88) $(62) $(52) $(28) $(457) $(230) $(40) $(3) $0 Sequential benefit $9 $8 $11 $5 $15 $26 $10 $24 $36 $227 $190 $37 $3 Receive-fixed cash flow swaps (average notional in $ billions) ■ Slightly asset sensitive; approximately +/- 1% impact to NII over the next 12 months with a gradual +/- 100 bps change in rates relative to the forward curve ■ Receive-fixed cash flow swaps represent the primary tool to manage overall asset sensitivity – Well hedged against lower rates through mid 2027 ■ Pay-fixed swaps against securities portfolio help protect capital by reducing AOCI volatility Receive-fixed swaps executed post 6/30/23 Receive-fixed swaps executed pre 6/30/23 (legacy) Maintaining strong liquidity while shortening duration Fixed/floating-rate mix 14% 19% 67% Securities $43B 34% 22% 44% Loans $141B Fixed Fixed with hedges Floating Floating with hedges Commentary 15% 15% 70% 37% 16% 47% As of 9/30/25 (1) See pages 34-35 for notes.
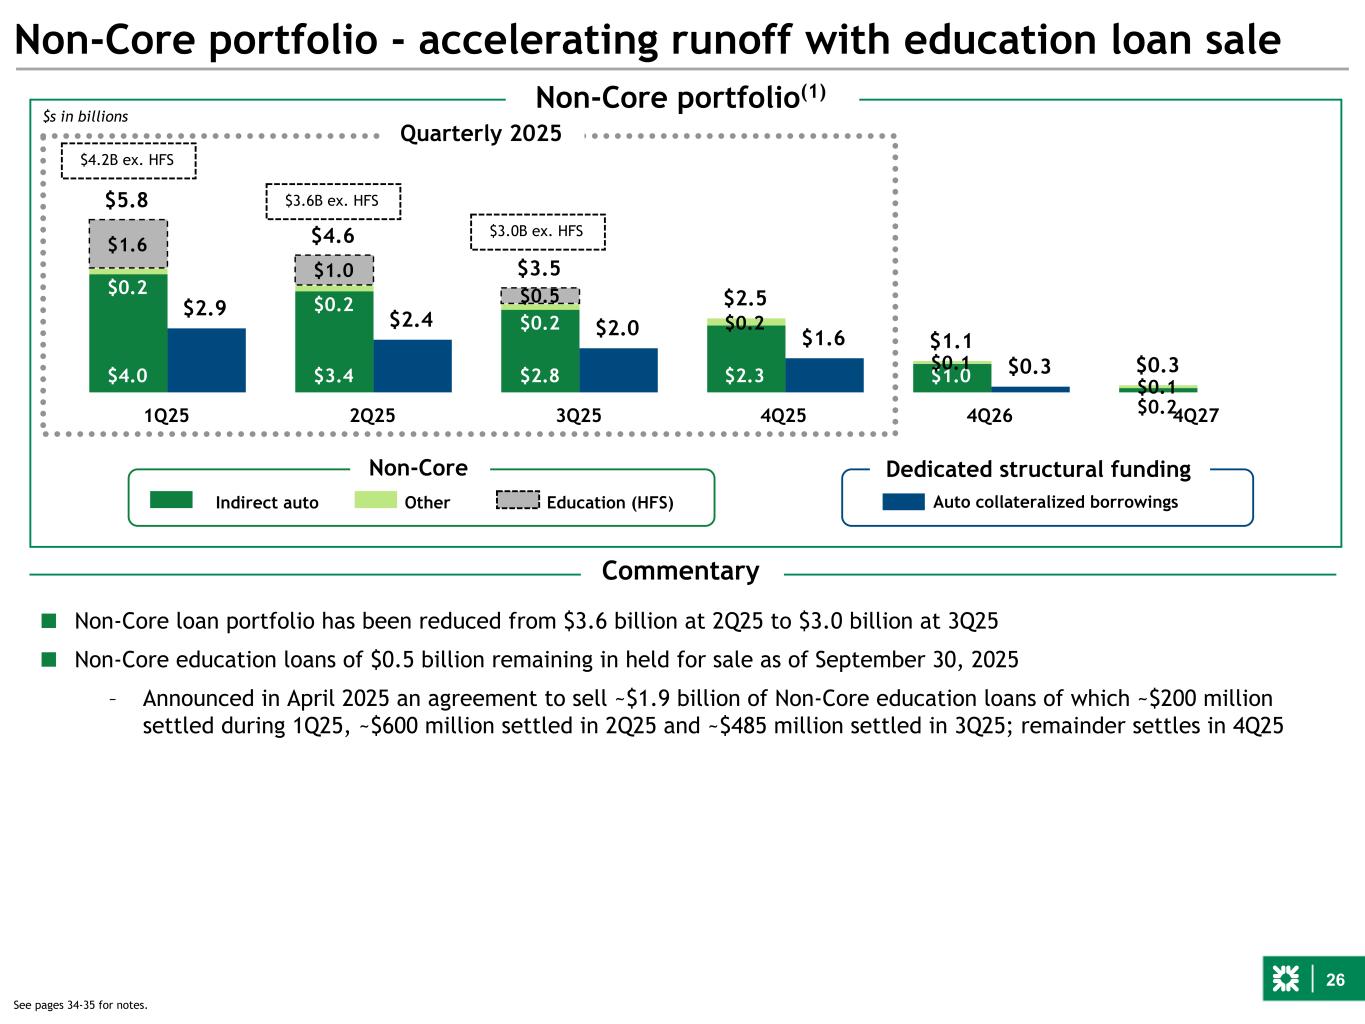
26 $5.8 $4.6 $3.5 $2.5 $1.1 $0.3 $2.9 $2.4 $2.0 $1.6 $0.3$4.0 $3.4 $2.8 $2.3 $1.0 $0.2 $0.2 $0.2 $0.2 $0.2 $0.1 $0.1 $1.6 $1.0 $0.5 1Q25 2Q25 3Q25 4Q25 4Q26 4Q27 Non-Core portfolio - accelerating runoff with education loan sale Non-Core Dedicated structural funding Non-Core portfolio(1) Indirect auto Auto collateralized borrowings $s in billions Other Quarterly 2025 Education (HFS) ■ Non-Core loan portfolio has been reduced from $3.6 billion at 2Q25 to $3.0 billion at 3Q25 ■ Non-Core education loans of $0.5 billion remaining in held for sale as of September 30, 2025 – Announced in April 2025 an agreement to sell ~$1.9 billion of Non-Core education loans of which ~$200 million settled during 1Q25, ~$600 million settled in 2Q25 and ~$485 million settled in 3Q25; remainder settles in 4Q25 $4.2B ex. HFS $3.6B ex. HFS $3.0B ex. HFS See pages 34-35 for notes. Commentary
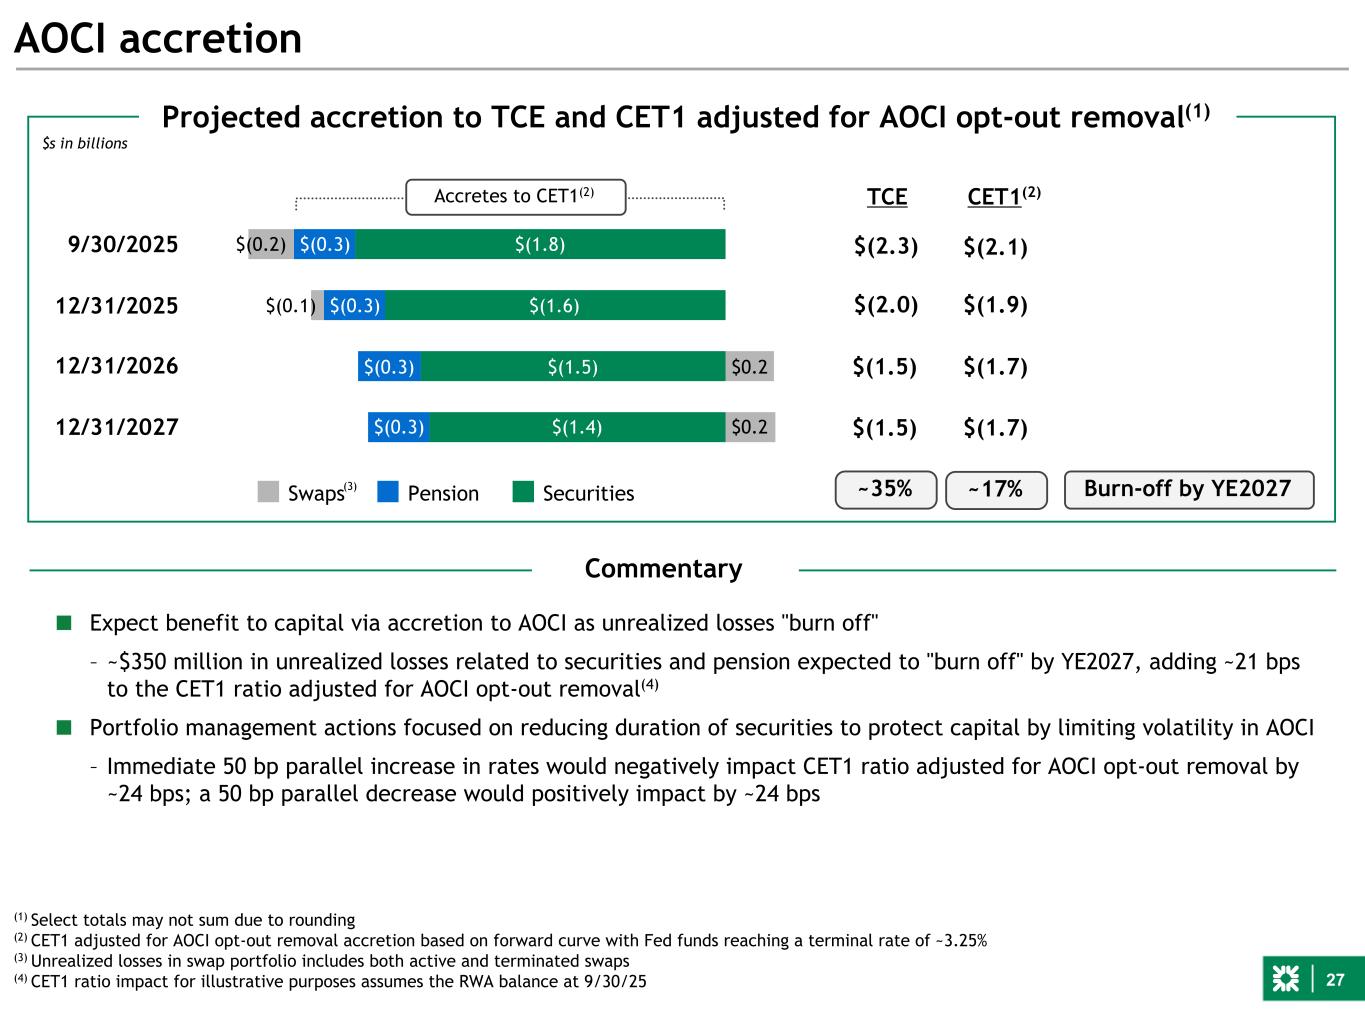
27 AOCI accretion Protecting CET1 - AFS marks; duration decreasing with securities portfolio hedging; less sensitivity to rates. Illustrate how sensitivity to a 50 bp move has fallen from 12/31/22 to 9/30/23 to 12/31/23 ...As recent actions limit AOCI volatility to protect capital $(1.8) $(1.6) $(1.5) $(1.4) $(0.3) $(0.3) $(0.3) $(0.3) $(0.2) $(0.1) $0.2 $0.2 Swaps Pension Securities 9/30/2025 12/31/2025 12/31/2026 12/31/2027 $(2.3) $(2.0) $(1.5) ~35% TCE CET1(2) $(2.1) $(1.9) $(1.7) Commentary ■ Expect benefit to capital via accretion to AOCI as unrealized losses "burn off" – ~$350 million in unrealized losses related to securities and pension expected to "burn off" by YE2027, adding ~21 bps to the CET1 ratio adjusted for AOCI opt-out removal(4) ■ Portfolio management actions focused on reducing duration of securities to protect capital by limiting volatility in AOCI – Immediate 50 bp parallel increase in rates would negatively impact CET1 ratio adjusted for AOCI opt-out removal by ~24 bps; a 50 bp parallel decrease would positively impact by ~24 bps Burn-off by YE2027~17% (1) Select totals may not sum due to rounding (2) CET1 adjusted for AOCI opt-out removal accretion based on forward curve with Fed funds reaching a terminal rate of ~3.25% (3) Unrealized losses in swap portfolio includes both active and terminated swaps (4) CET1 ratio impact for illustrative purposes assumes the RWA balance at 9/30/25 Projected accretion to TCE and CET1 adjusted for AOCI opt-out removal(1) Accretes to CET1(2) (3) $s in billions $(2.0) $(1.8) $(1.5) $(0.3) $(0.3) $(0.3) $(0.3) $(0.1) Swaps Pension Securities 6/30/2025 12/31/2025 12/31/2026 $(1.5) $(1.7)
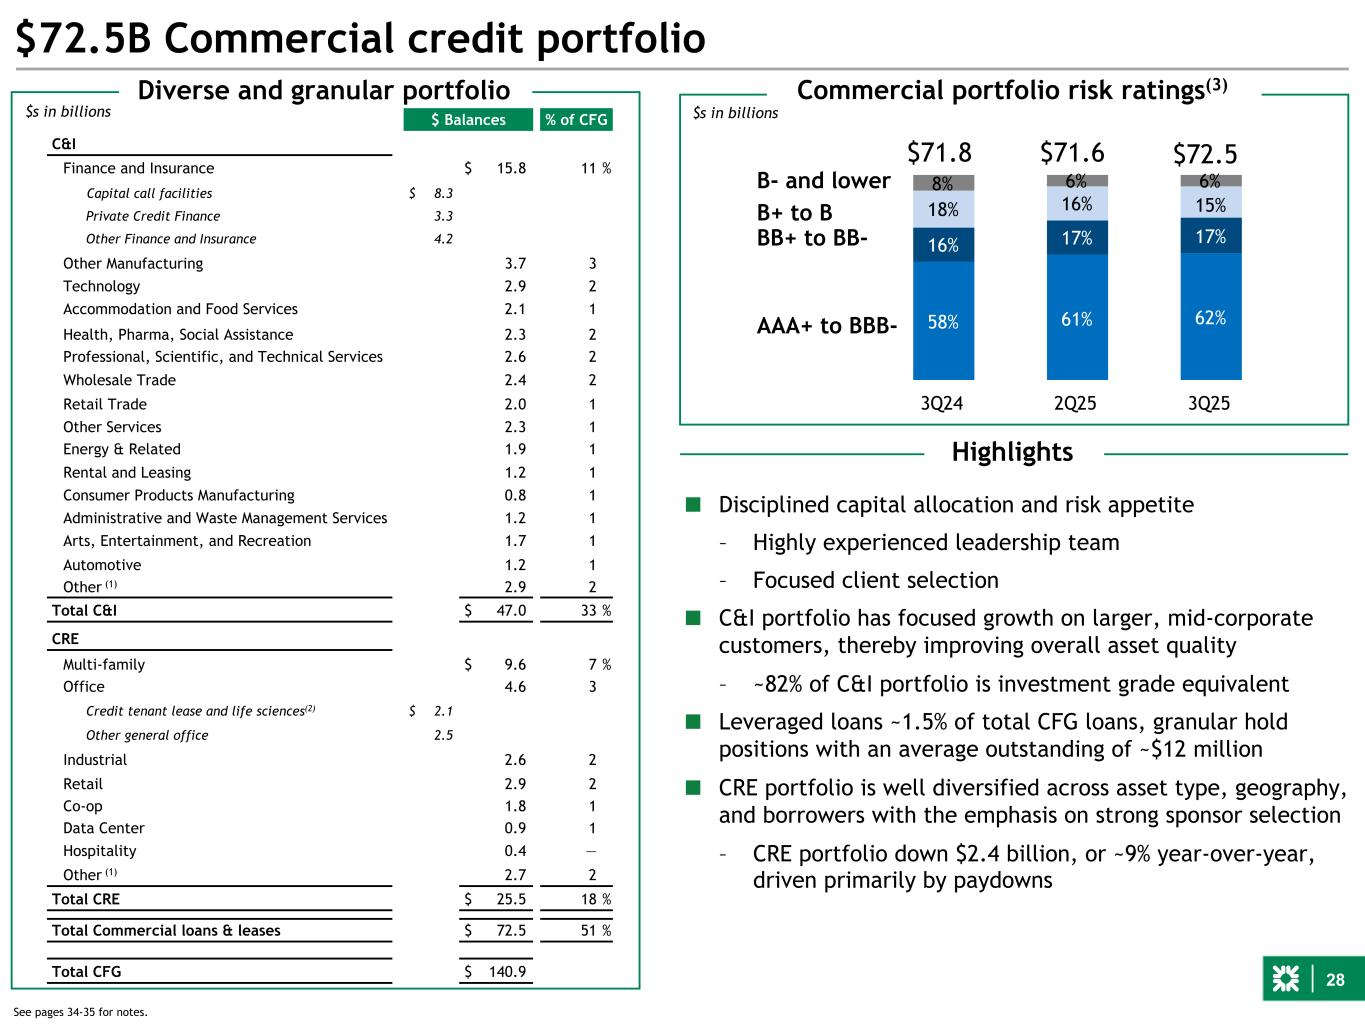
28 $72.5B Commercial credit portfolio Commercial portfolio risk ratings(3) $s in billions 58% 61% 62% 16% 17% 17% 18% 16% 15% 8% 6% 6% 3Q24 2Q25 3Q25 B- and lower B+ to B BB+ to BB- AAA+ to BBB- $72.5 Highlights $71.6 $ Balances % of CFG C&I Finance and Insurance $ 15.8 11 % Capital call facilities $ 8.3 Private Credit Finance 3.3 Other Finance and Insurance 4.2 Other Manufacturing 3.7 3 Technology 2.9 2 Accommodation and Food Services 2.1 1 Health, Pharma, Social Assistance 2.3 2 Professional, Scientific, and Technical Services 2.6 2 Wholesale Trade 2.4 2 Retail Trade 2.0 1 Other Services 2.3 1 Energy & Related 1.9 1 Rental and Leasing 1.2 1 Consumer Products Manufacturing 0.8 1 Administrative and Waste Management Services 1.2 1 Arts, Entertainment, and Recreation 1.7 1 Automotive 1.2 1 Other (1) 2.9 2 Total C&I $ 47.0 33 % CRE Multi-family $ 9.6 7 % Office 4.6 3 Credit tenant lease and life sciences(2) $ 2.1 Other general office 2.5 Industrial 2.6 2 Retail 2.9 2 Co-op 1.8 1 Data Center 0.9 1 Hospitality 0.4 — Other (1) 2.7 2 Total CRE $ 25.5 18 % Total Commercial loans & leases $ 72.5 51 % Total CFG $ 140.9 Diverse and granular portfolio ■ Disciplined capital allocation and risk appetite – Highly experienced leadership team – Focused client selection ■ C&I portfolio has focused growth on larger, mid-corporate customers, thereby improving overall asset quality – ~82% of C&I portfolio is investment grade equivalent ■ Leveraged loans ~1.5% of total CFG loans, granular hold positions with an average outstanding of ~$12 million ■ CRE portfolio is well diversified across asset type, geography, and borrowers with the emphasis on strong sponsor selection – CRE portfolio down $2.4 billion, or ~9% year-over-year, driven primarily by paydowns $71.8 See pages 34-35 for notes. $s in billions ■ [Non-depository financial institution (NDFI) balance under regulatory definition of [$15.9] billion; BBB- ratings equivalent]
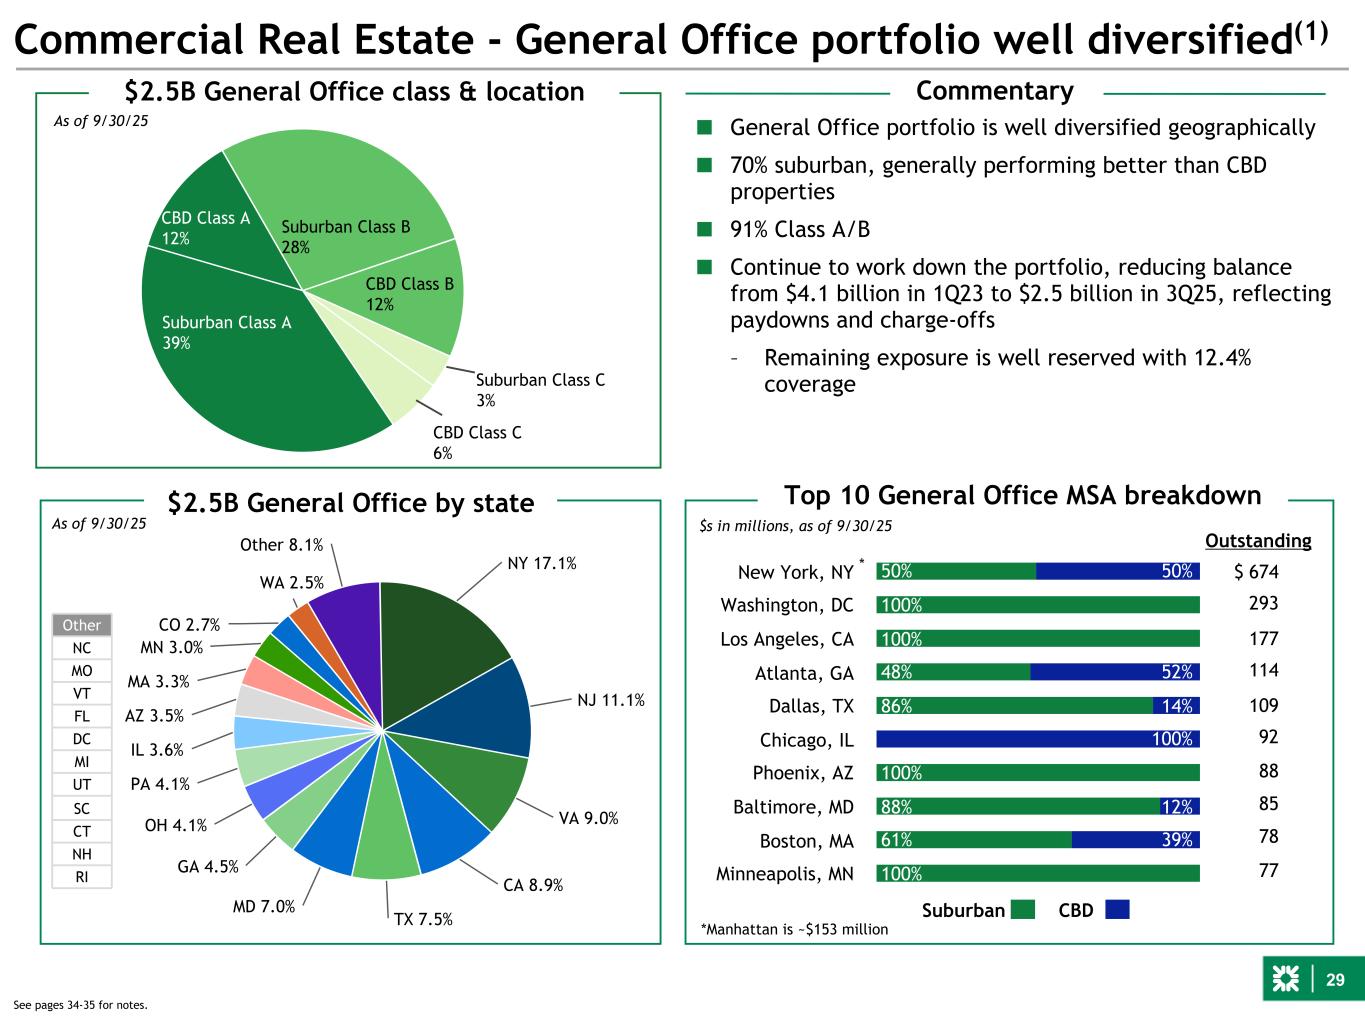
29 Suburban Class C 3% CBD Class C 6% Suburban Class A 39% CBD Class A 12% Suburban Class B 28% CBD Class B 12% 50% 100% 100% 48% 86% 100% 88% 61% 100% 50% 52% 14% 100% 12% 39% New York, NY Washington, DC Los Angeles, CA Atlanta, GA Dallas, TX Chicago, IL Phoenix, AZ Baltimore, MD Boston, MA Minneapolis, MN Suburban CBD NY 17.1% NJ 11.1% VA 9.0% CA 8.9% TX 7.5% MD 7.0% GA 4.5% OH 4.1% PA 4.1% IL 3.6% AZ 3.5% MA 3.3% MN 3.0% CO 2.7% WA 2.5% Other 8.1% Commercial Real Estate - General Office portfolio well diversified(1) $2.5B General Office by state Other NC MO VT FL DC MI UT SC CT NH RI $2.5B General Office class & location Outstanding *Manhattan is ~$153 million $ 674 293 177 114 109 92 88 85 78 77 $s in millions, as of 9/30/25 See pages 34-35 for notes. As of 9/30/25 As of 9/30/25 Commentary ■ General Office portfolio is well diversified geographically ■ 70% suburban, generally performing better than CBD properties ■ 91% Class A/B ■ Continue to work down the portfolio, reducing balance from $4.1 billion in 1Q23 to $2.5 billion in 3Q25, reflecting paydowns and charge-offs – Remaining exposure is well reserved with 12.4% coverage Top 10 General Office MSA breakdown *
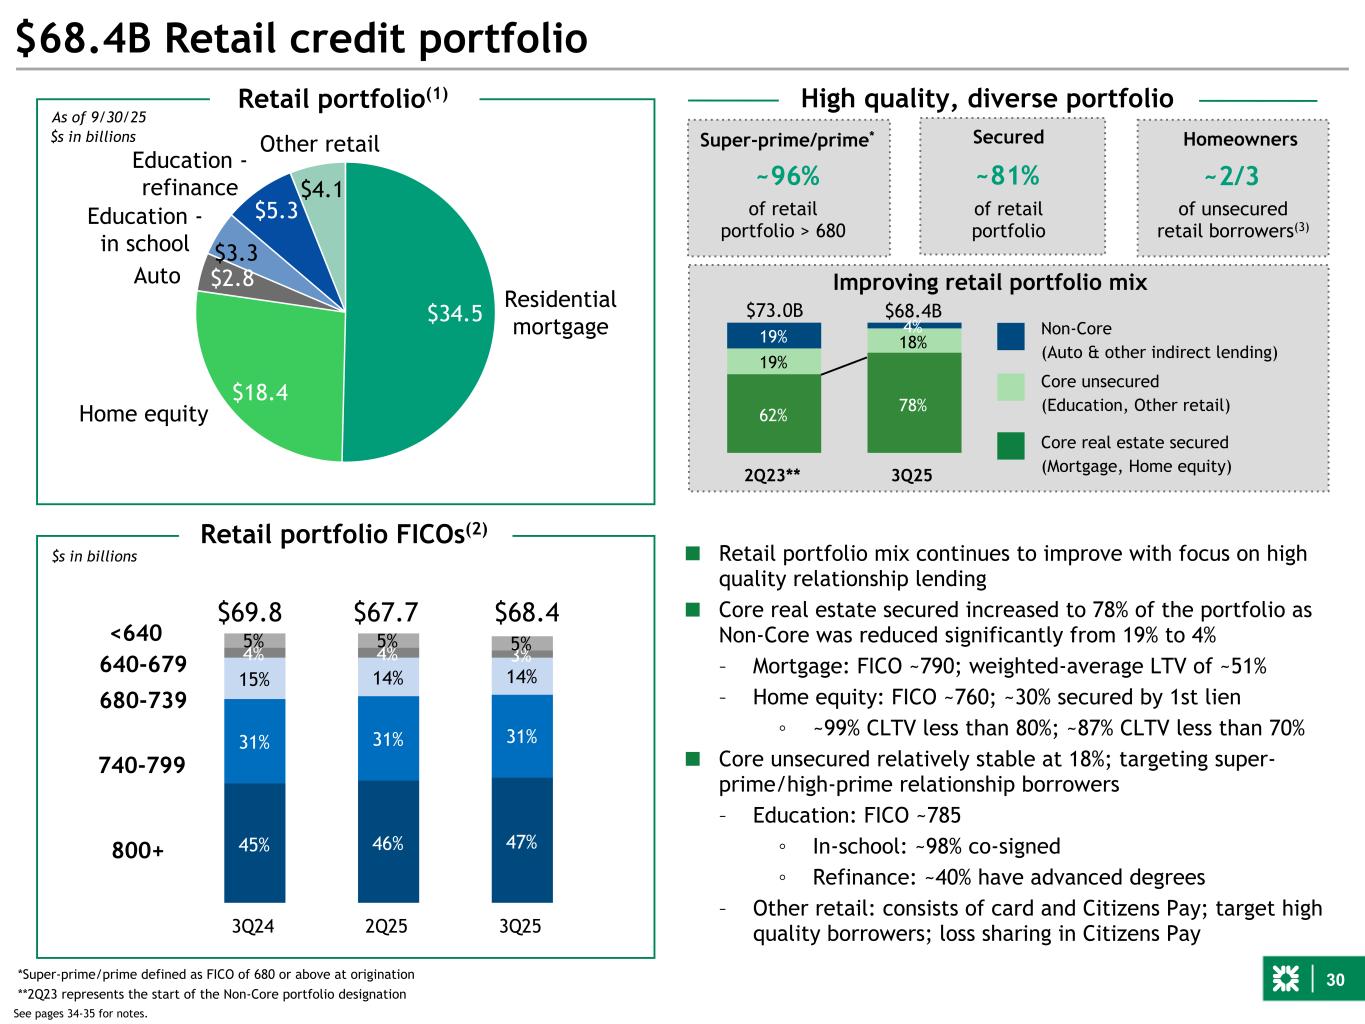
30 45% 46% 47% 31% 31% 31% 15% 14% 14% 4% 4% 3% 5% 5% 5% 3Q24 2Q25 3Q25 $34.5 $18.4 $2.8 $3.3 $5.3 $4.1 $68.4B Retail credit portfolio 800+ 740-799 680-739 640-679 <640 $68.4 $s in billions $67.7 Home equity Retail portfolio(1) Residential mortgage Auto Education - in school Education - refinance Other retail ~96% Super-prime/prime* ~81% Secured ■ Retail portfolio mix continues to improve with focus on high quality relationship lending ■ Core real estate secured increased to 78% of the portfolio as Non-Core was reduced significantly from 19% to 4% – Mortgage: FICO ~790; weighted-average LTV of ~51% – Home equity: FICO ~760; ~30% secured by 1st lien ◦ ~99% CLTV less than 80%; ~87% CLTV less than 70% ■ Core unsecured relatively stable at 18%; targeting super- prime/high-prime relationship borrowers – Education: FICO ~785 ◦ In-school: ~98% co-signed ◦ Refinance: ~40% have advanced degrees – Other retail: consists of card and Citizens Pay; target high quality borrowers; loss sharing in Citizens Pay High quality, diverse portfolio *Super-prime/prime defined as FICO of 680 or above at origination Retail portfolio FICOs(2) $69.8 Homeowners ~2/3 See pages 34-35 for notes. As of 9/30/25 62% 78% 19% 18%19% 4% 2Q23** 3Q25 Non-Core (Auto & other indirect lending) Core unsecured (Education, Other retail) Core real estate secured (Mortgage, Home equity) of unsecured retail borrowers(3) of retail portfolio > 680 Improving retail portfolio mix of retail portfolio **2Q23 represents the start of the Non-Core portfolio designation $68.4B$73.0B $s in billions
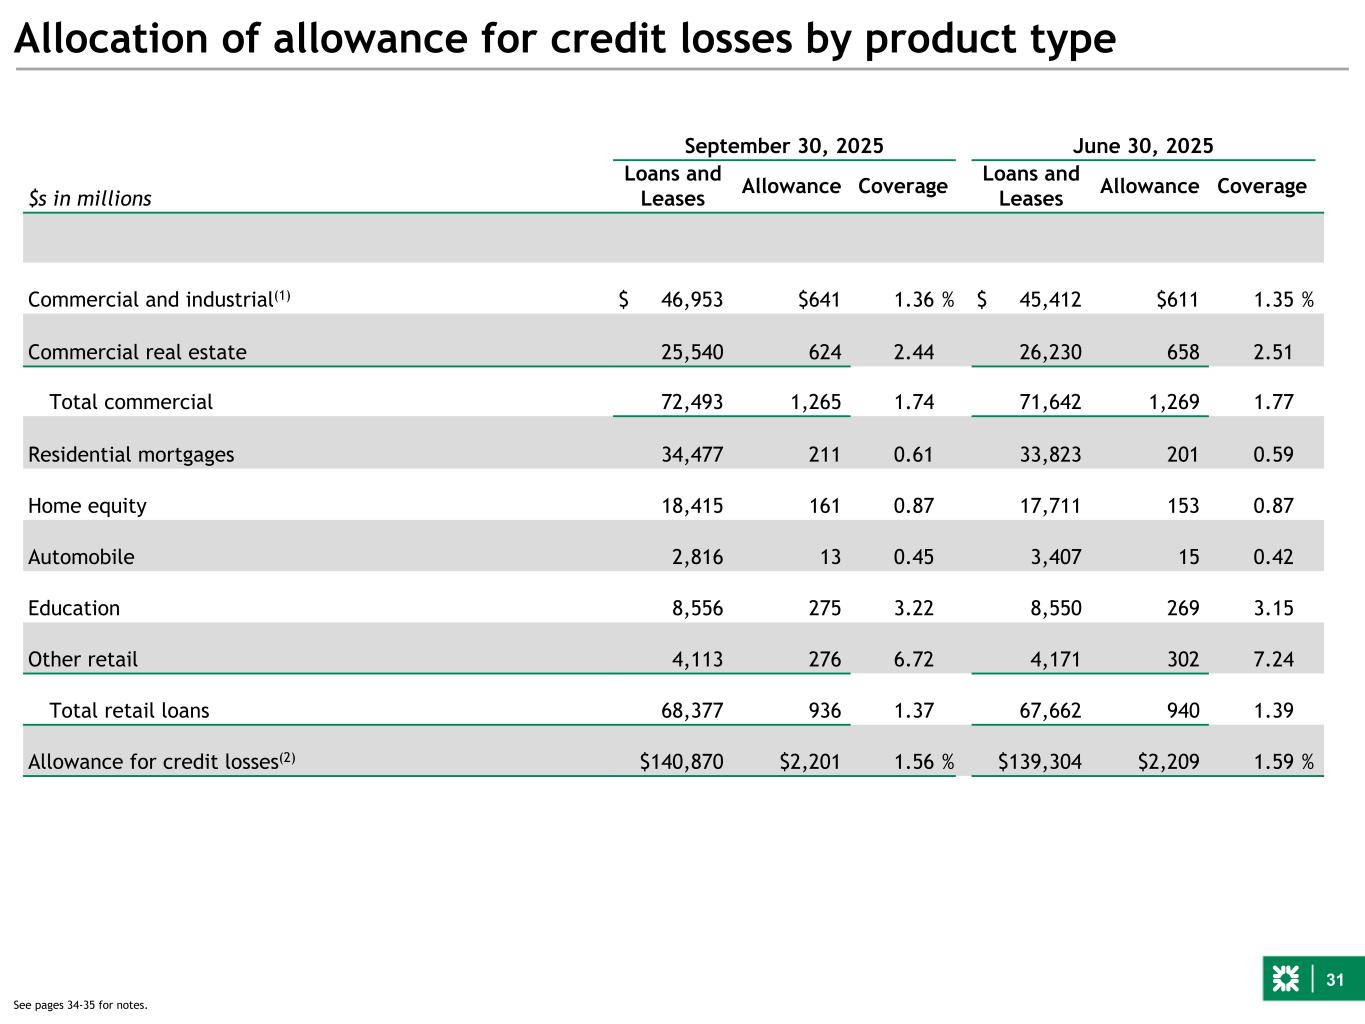
31 Allocation of allowance for credit losses by product type September 30, 2025 June 30, 2025 $s in millions Loans and Leases Allowance Coverage Loans and Leases Allowance Coverage Commercial and industrial(1) $ 46,953 $641 1.36 % $ 45,412 $611 1.35 % Commercial real estate 25,540 624 2.44 26,230 658 2.51 Total commercial 72,493 1,265 1.74 71,642 1,269 1.77 Residential mortgages 34,477 211 0.61 33,823 201 0.59 Home equity 18,415 161 0.87 17,711 153 0.87 Automobile 2,816 13 0.45 3,407 15 0.42 Education 8,556 275 3.22 8,550 269 3.15 Other retail 4,113 276 6.72 4,171 302 7.24 Total retail loans 68,377 936 1.37 67,662 940 1.39 Allowance for credit losses(2) $140,870 $2,201 1.56 % $139,304 $2,209 1.59 % See pages 34-35 for notes.
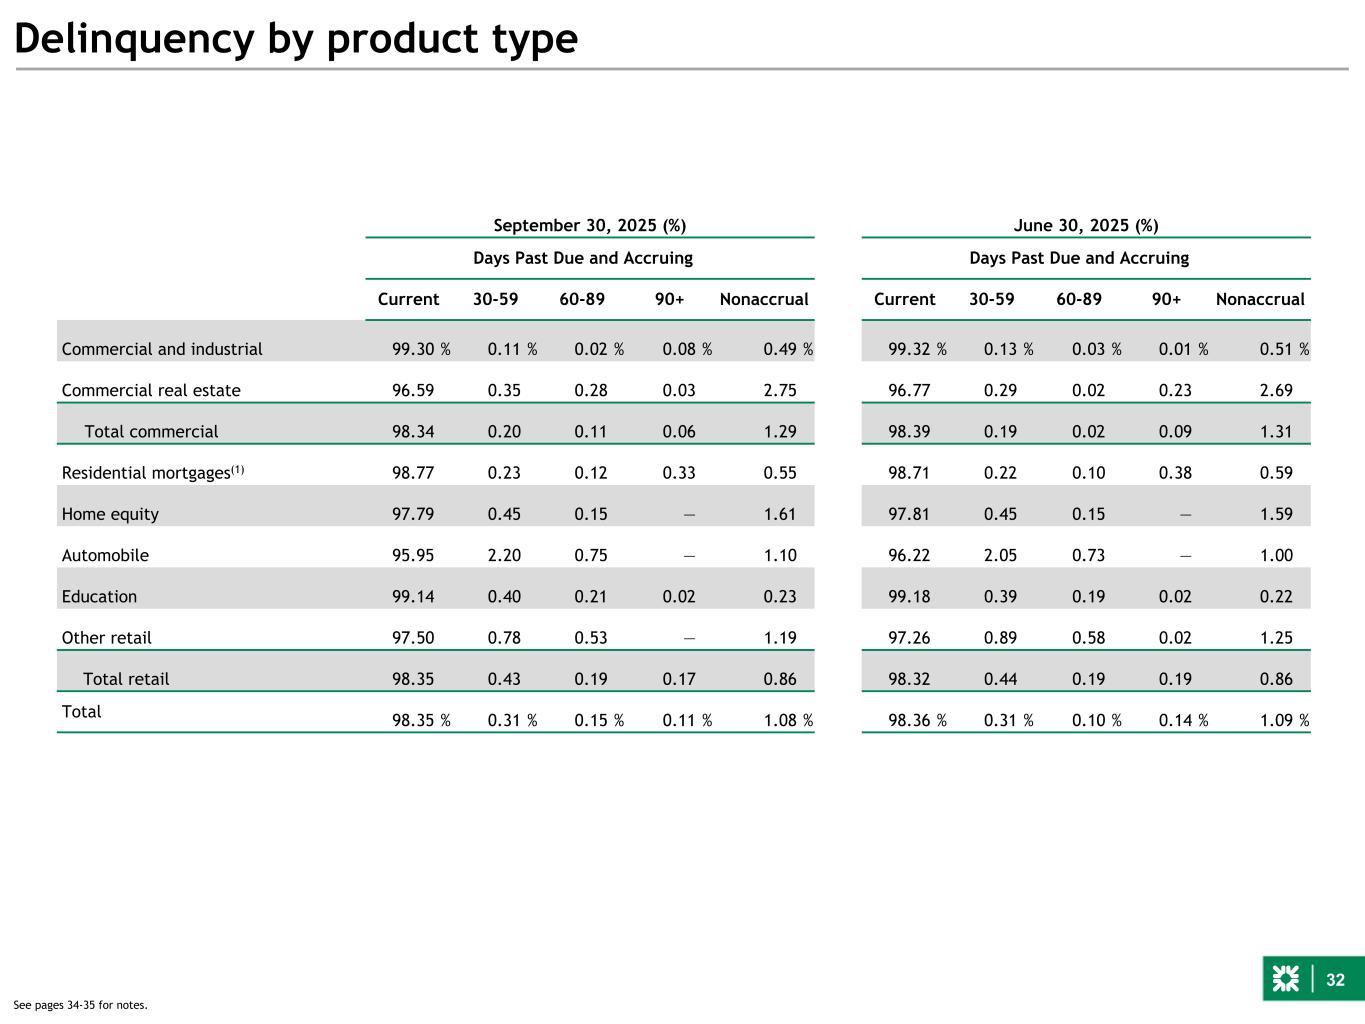
32 Delinquency by product type September 30, 2025 (%) June 30, 2025 (%) Days Past Due and Accruing Days Past Due and Accruing Current 30-59 60-89 90+ Nonaccrual Current 30-59 60-89 90+ Nonaccrual Commercial and industrial 99.30 % 0.11 % 0.02 % 0.08 % 0.49 % 99.32 % 0.13 % 0.03 % 0.01 % 0.51 % Commercial real estate 96.59 0.35 0.28 0.03 2.75 96.77 0.29 0.02 0.23 2.69 Total commercial 98.34 0.20 0.11 0.06 1.29 98.39 0.19 0.02 0.09 1.31 Residential mortgages(1) 98.77 0.23 0.12 0.33 0.55 98.71 0.22 0.10 0.38 0.59 Home equity 97.79 0.45 0.15 — 1.61 97.81 0.45 0.15 — 1.59 Automobile 95.95 2.20 0.75 — 1.10 96.22 2.05 0.73 — 1.00 Education 99.14 0.40 0.21 0.02 0.23 99.18 0.39 0.19 0.02 0.22 Other retail 97.50 0.78 0.53 — 1.19 97.26 0.89 0.58 0.02 1.25 Total retail 98.35 0.43 0.19 0.17 0.86 98.32 0.44 0.19 0.19 0.86 Total 98.35 % 0.31 % 0.15 % 0.11 % 1.08 % 98.36 % 0.31 % 0.10 % 0.14 % 1.09 % See pages 34-35 for notes.
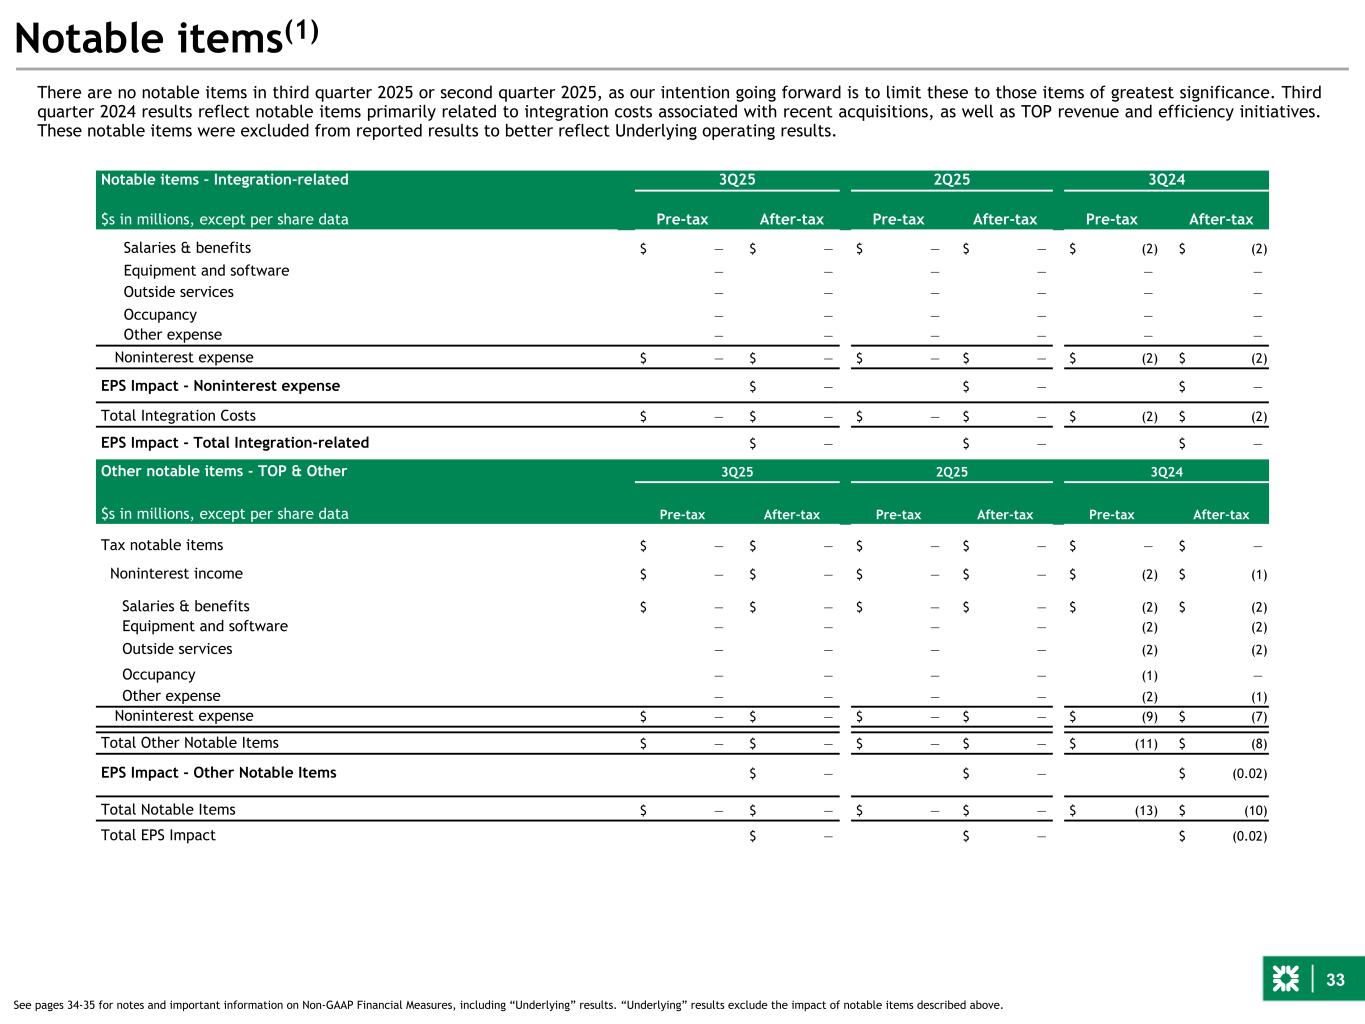
33 Notable items(1) There are no notable items in third quarter 2025 or second quarter 2025, as our intention going forward is to limit these to those items of greatest significance. Third quarter 2024 results reflect notable items primarily related to integration costs associated with recent acquisitions, as well as TOP revenue and efficiency initiatives. These notable items were excluded from reported results to better reflect Underlying operating results. See pages 34-35 for notes and important information on Non-GAAP Financial Measures, including “Underlying” results. “Underlying” results exclude the impact of notable items described above. Notable items - Integration-related 3Q25 2Q25 3Q24 $s in millions, except per share data Pre-tax After-tax Pre-tax After-tax Pre-tax After-tax Salaries & benefits $ — $ — $ — $ — $ (2) $ (2) Equipment and software — — — — — — Outside services — — — — — — Occupancy — — — — — — Other expense — — — — — — Noninterest expense $ — $ — $ — $ — $ (2) $ (2) EPS Impact - Noninterest expense $ — $ — $ — Total Integration Costs $ — $ — $ — $ — $ (2) $ (2) EPS Impact - Total Integration-related $ — $ — $ — Other notable items - TOP & Other 3Q25 2Q25 3Q24 $s in millions, except per share data Pre-tax After-tax Pre-tax After-tax Pre-tax After-tax Tax notable items $ — $ — $ — $ — $ — $ — Noninterest income $ — $ — $ — $ — $ (2) $ (1) Salaries & benefits $ — $ — $ — $ — $ (2) $ (2) Equipment and software — — — — (2) (2) Outside services — — — — (2) (2) Occupancy — — — — (1) — Other expense — — — — (2) (1) Noninterest expense $ — $ — $ — $ — $ (9) $ (7) Total Other Notable Items $ — $ — $ — $ — $ (11) $ (8) EPS Impact - Other Notable Items $ — $ — $ (0.02) Total Notable Items $ — $ — $ — $ — $ (13) $ (10) Total EPS Impact $ — $ — $ (0.02)
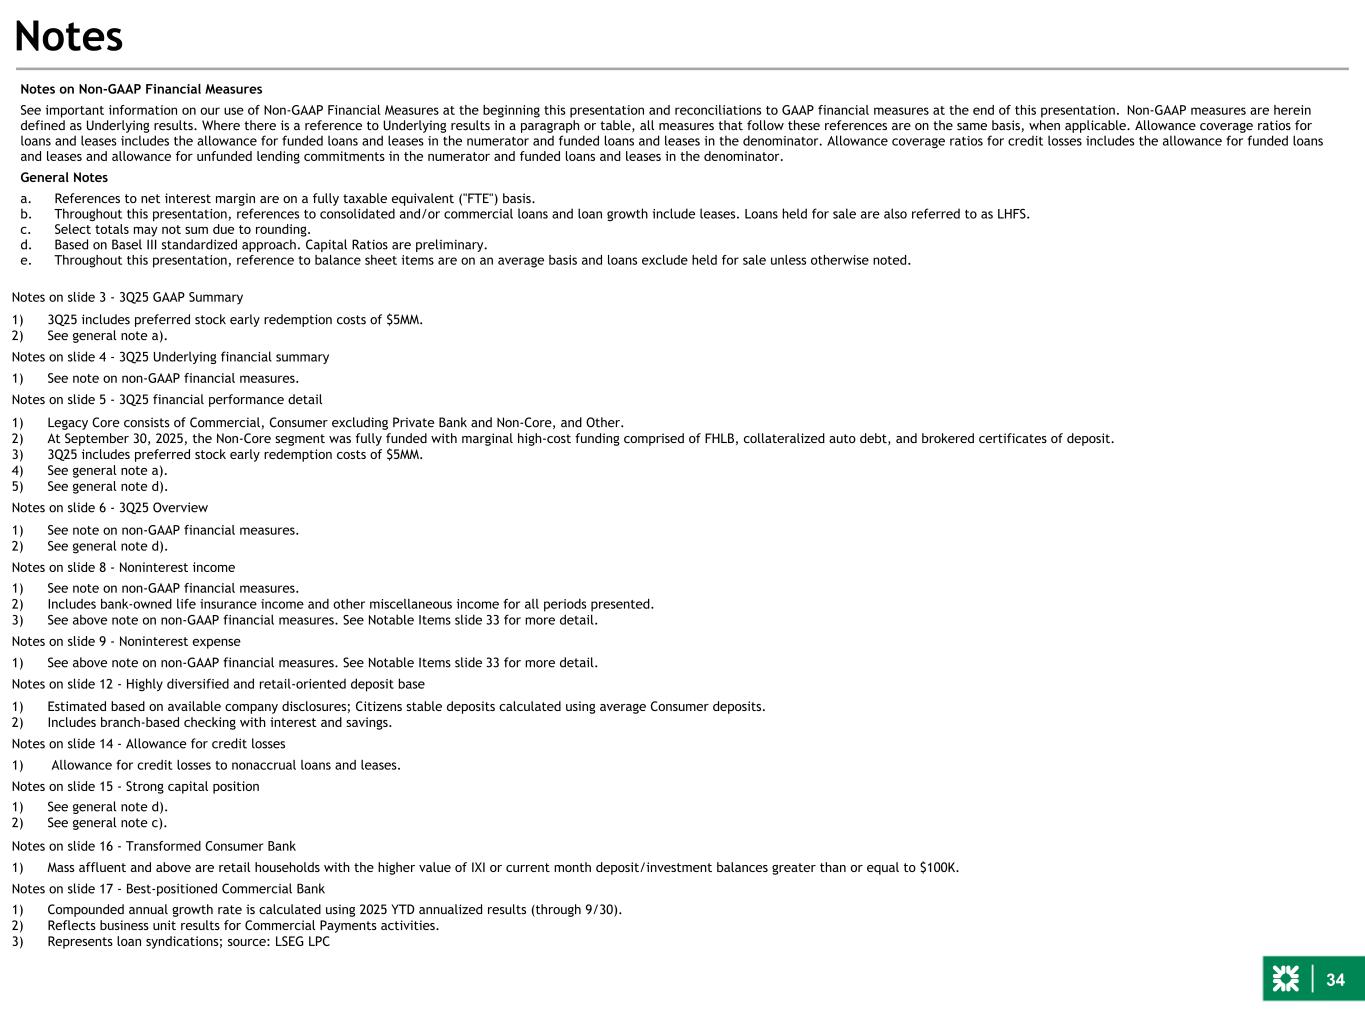
34 Notes on Non-GAAP Financial Measures See important information on our use of Non-GAAP Financial Measures at the beginning this presentation and reconciliations to GAAP financial measures at the end of this presentation. Non-GAAP measures are herein defined as Underlying results. Where there is a reference to Underlying results in a paragraph or table, all measures that follow these references are on the same basis, when applicable. Allowance coverage ratios for loans and leases includes the allowance for funded loans and leases in the numerator and funded loans and leases in the denominator. Allowance coverage ratios for credit losses includes the allowance for funded loans and leases and allowance for unfunded lending commitments in the numerator and funded loans and leases in the denominator. General Notes a. References to net interest margin are on a fully taxable equivalent ("FTE") basis. b. Throughout this presentation, references to consolidated and/or commercial loans and loan growth include leases. Loans held for sale are also referred to as LHFS. c. Select totals may not sum due to rounding. d. Based on Basel III standardized approach. Capital Ratios are preliminary. e. Throughout this presentation, reference to balance sheet items are on an average basis and loans exclude held for sale unless otherwise noted. Notes Notes on slide 3 - 3Q25 GAAP Summary 1) 3Q25 includes preferred stock early redemption costs of $5MM. 2) See general note a). Notes on slide 4 - 3Q25 Underlying financial summary 1) See note on non-GAAP financial measures. Notes on slide 5 - 3Q25 financial performance detail 1) Legacy Core consists of Commercial, Consumer excluding Private Bank and Non-Core, and Other. 2) At September 30, 2025, the Non-Core segment was fully funded with marginal high-cost funding comprised of FHLB, collateralized auto debt, and brokered certificates of deposit. 3) 3Q25 includes preferred stock early redemption costs of $5MM. 4) See general note a). 5) See general note d). Notes on slide 6 - 3Q25 Overview 1) See note on non-GAAP financial measures. 2) See general note d). Notes on slide 8 - Noninterest income 1) See note on non-GAAP financial measures. 2) Includes bank-owned life insurance income and other miscellaneous income for all periods presented. 3) See above note on non-GAAP financial measures. See Notable Items slide 33 for more detail. Notes on slide 9 - Noninterest expense 1) See above note on non-GAAP financial measures. See Notable Items slide 33 for more detail. Notes on slide 12 - Highly diversified and retail-oriented deposit base 1) Estimated based on available company disclosures; Citizens stable deposits calculated using average Consumer deposits. 2) Includes branch-based checking with interest and savings. Notes on slide 14 - Allowance for credit losses 1) Allowance for credit losses to nonaccrual loans and leases. Notes on slide 15 - Strong capital position 1) See general note d). 2) See general note c). Notes on slide 16 - Transformed Consumer Bank 1) Mass affluent and above are retail households with the higher value of IXI or current month deposit/investment balances greater than or equal to $100K. Notes on slide 17 - Best-positioned Commercial Bank 1) Compounded annual growth rate is calculated using 2025 YTD annualized results (through 9/30). 2) Reflects business unit results for Commercial Payments activities. 3) Represents loan syndications; source: LSEG LPC For slide 18 - *AUM as of 9/30/2025. As Assets Under Management referenced above represents aggregated AUM [of the Private Bank] across our investment advisory affiliates.
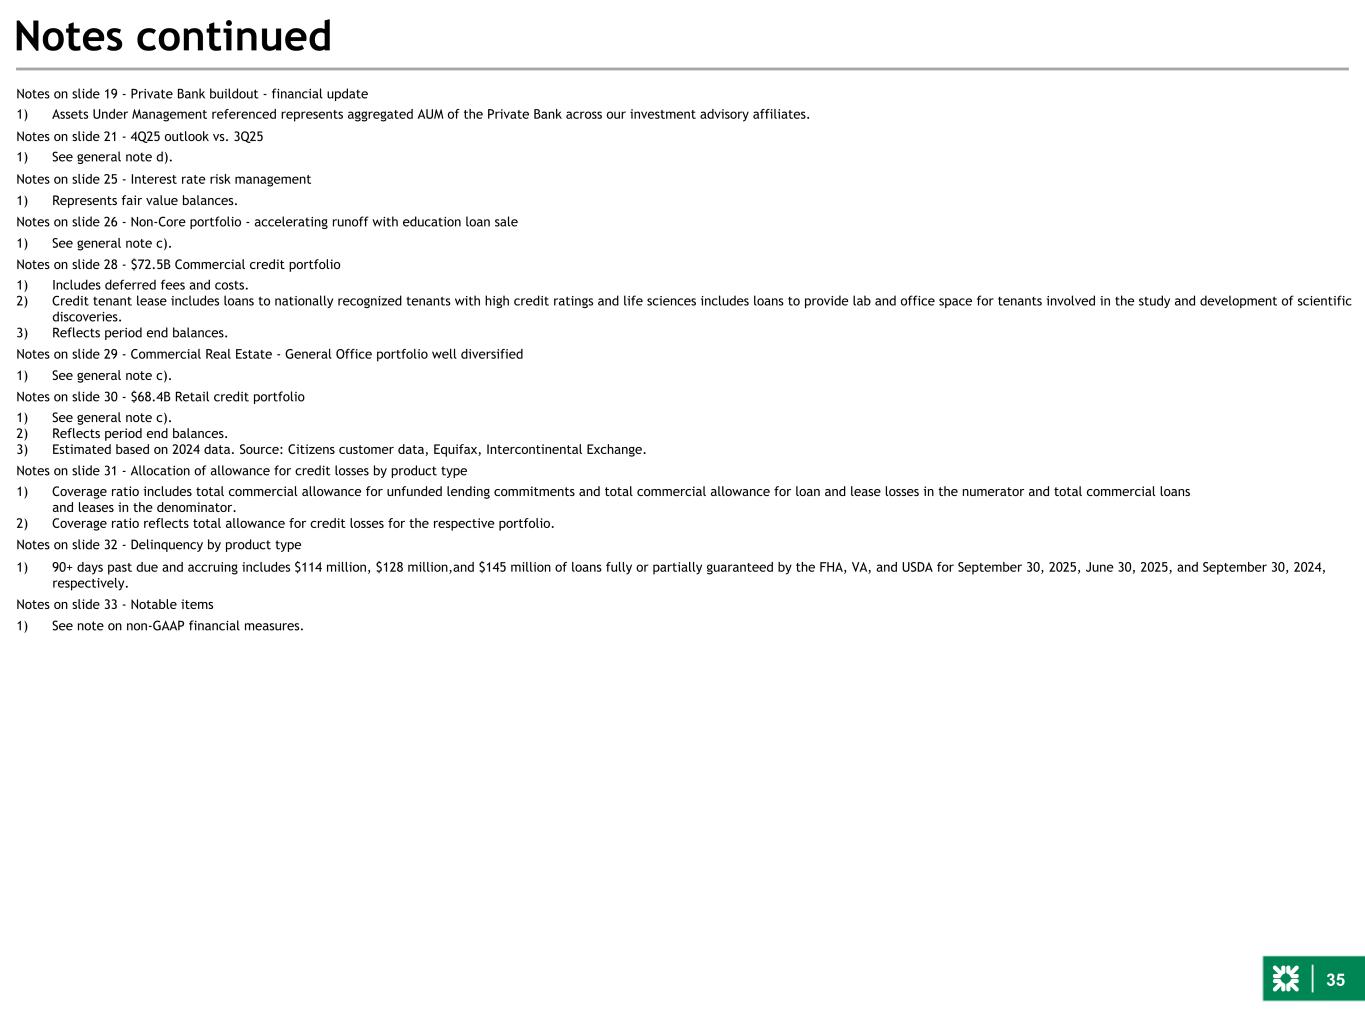
35 Notes continued Notes on slide 19 - Private Bank buildout - financial update 1) Assets Under Management referenced represents aggregated AUM of the Private Bank across our investment advisory affiliates. Notes on slide 21 - 4Q25 outlook vs. 3Q25 1) See general note d). Notes on slide 25 - Interest rate risk management 1) Represents fair value balances. Notes on slide 26 - Non-Core portfolio - accelerating runoff with education loan sale 1) See general note c). Notes on slide 28 - $72.5B Commercial credit portfolio 1) Includes deferred fees and costs. 2) Credit tenant lease includes loans to nationally recognized tenants with high credit ratings and life sciences includes loans to provide lab and office space for tenants involved in the study and development of scientific discoveries. 3) Reflects period end balances. Notes on slide 29 - Commercial Real Estate - General Office portfolio well diversified 1) See general note c). Notes on slide 30 - $68.4B Retail credit portfolio 1) See general note c). 2) Reflects period end balances. 3) Estimated based on 2024 data. Source: Citizens customer data, Equifax, Intercontinental Exchange. Notes on slide 31 - Allocation of allowance for credit losses by product type 1) Coverage ratio includes total commercial allowance for unfunded lending commitments and total commercial allowance for loan and lease losses in the numerator and total commercial loans and leases in the denominator. 2) Coverage ratio reflects total allowance for credit losses for the respective portfolio. Notes on slide 32 - Delinquency by product type 1) 90+ days past due and accruing includes $114 million, $128 million,and $145 million of loans fully or partially guaranteed by the FHA, VA, and USDA for September 30, 2025, June 30, 2025, and September 30, 2024, respectively. Notes on slide 33 - Notable items 1) See note on non-GAAP financial measures.
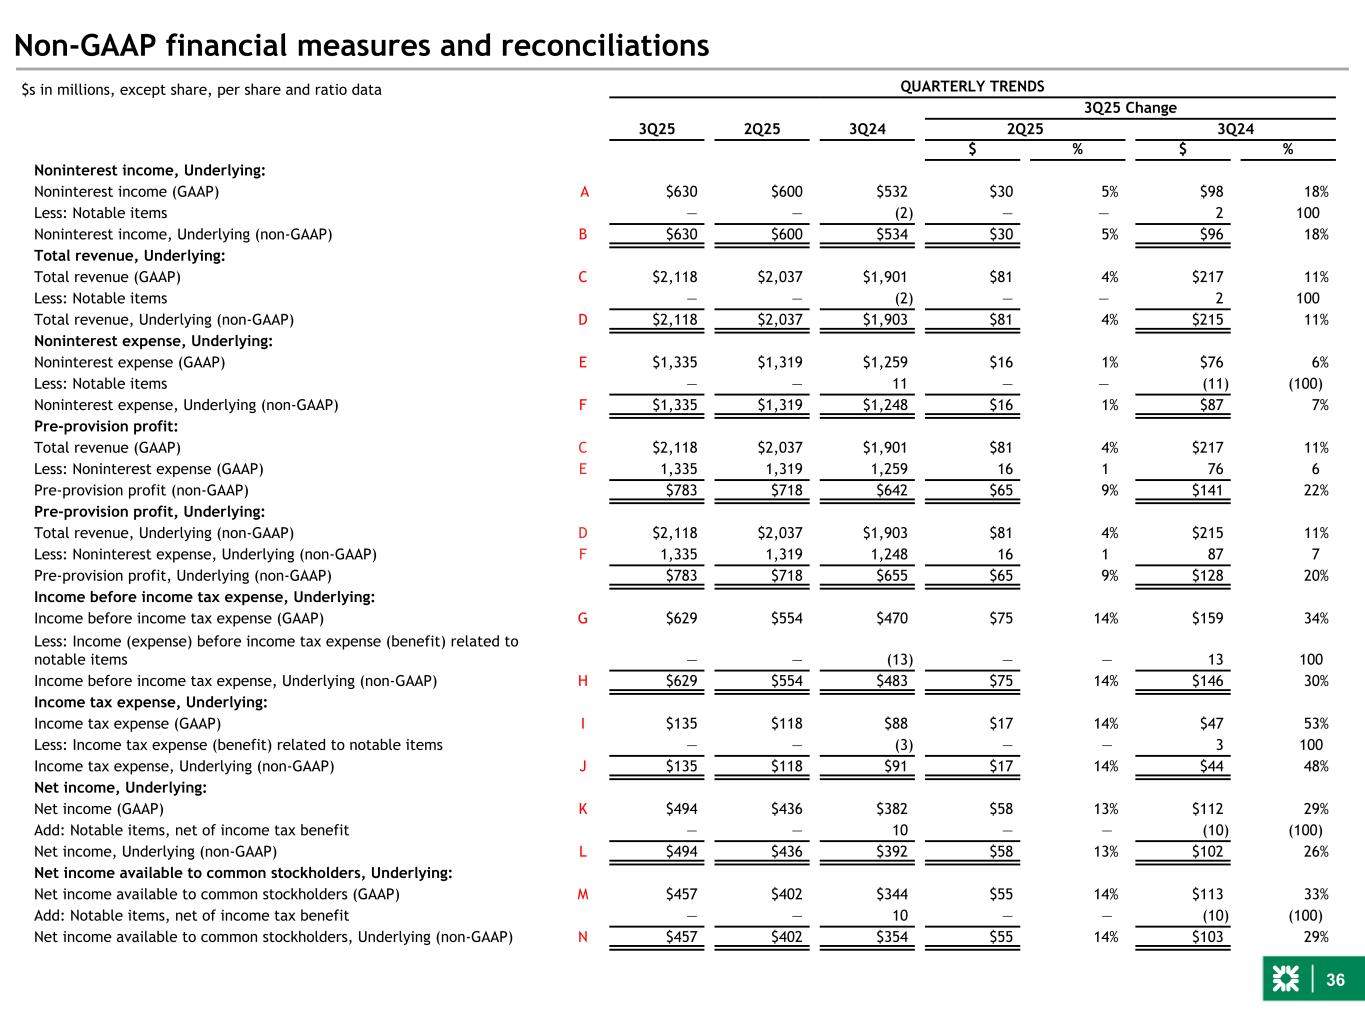
36 Non-GAAP financial measures and reconciliations $s in millions, except share, per share and ratio data QUARTERLY TRENDS 3Q25 Change 3Q25 2Q25 3Q24 2Q25 3Q24 $ % $ % Noninterest income, Underlying: Noninterest income (GAAP) A $630 $600 $532 $30 5% $98 18% Less: Notable items — — (2) — — 2 100 Noninterest income, Underlying (non-GAAP) B $630 $600 $534 $30 5% $96 18% Total revenue, Underlying: Total revenue (GAAP) C $2,118 $2,037 $1,901 $81 4% $217 11% Less: Notable items — — (2) — — 2 100 Total revenue, Underlying (non-GAAP) D $2,118 $2,037 $1,903 $81 4% $215 11% Noninterest expense, Underlying: Noninterest expense (GAAP) E $1,335 $1,319 $1,259 $16 1% $76 6% Less: Notable items — — 11 — — (11) (100) Noninterest expense, Underlying (non-GAAP) F $1,335 $1,319 $1,248 $16 1% $87 7% Pre-provision profit: Total revenue (GAAP) C $2,118 $2,037 $1,901 $81 4% $217 11% Less: Noninterest expense (GAAP) E 1,335 1,319 1,259 16 1 76 6 Pre-provision profit (non-GAAP) $783 $718 $642 $65 9% $141 22% Pre-provision profit, Underlying: Total revenue, Underlying (non-GAAP) D $2,118 $2,037 $1,903 $81 4% $215 11% Less: Noninterest expense, Underlying (non-GAAP) F 1,335 1,319 1,248 16 1 87 7 Pre-provision profit, Underlying (non-GAAP) $783 $718 $655 $65 9% $128 20% Income before income tax expense, Underlying: Income before income tax expense (GAAP) G $629 $554 $470 $75 14% $159 34% Less: Income (expense) before income tax expense (benefit) related to notable items — — (13) — — 13 100 Income before income tax expense, Underlying (non-GAAP) H $629 $554 $483 $75 14% $146 30% Income tax expense, Underlying: Income tax expense (GAAP) I $135 $118 $88 $17 14% $47 53% Less: Income tax expense (benefit) related to notable items — — (3) — — 3 100 Income tax expense, Underlying (non-GAAP) J $135 $118 $91 $17 14% $44 48% Net income, Underlying: Net income (GAAP) K $494 $436 $382 $58 13% $112 29% Add: Notable items, net of income tax benefit — — 10 — — (10) (100) Net income, Underlying (non-GAAP) L $494 $436 $392 $58 13% $102 26% Net income available to common stockholders, Underlying: Net income available to common stockholders (GAAP) M $457 $402 $344 $55 14% $113 33% Add: Notable items, net of income tax benefit — — 10 — — (10) (100) Net income available to common stockholders, Underlying (non-GAAP) N $457 $402 $354 $55 14% $103 29%
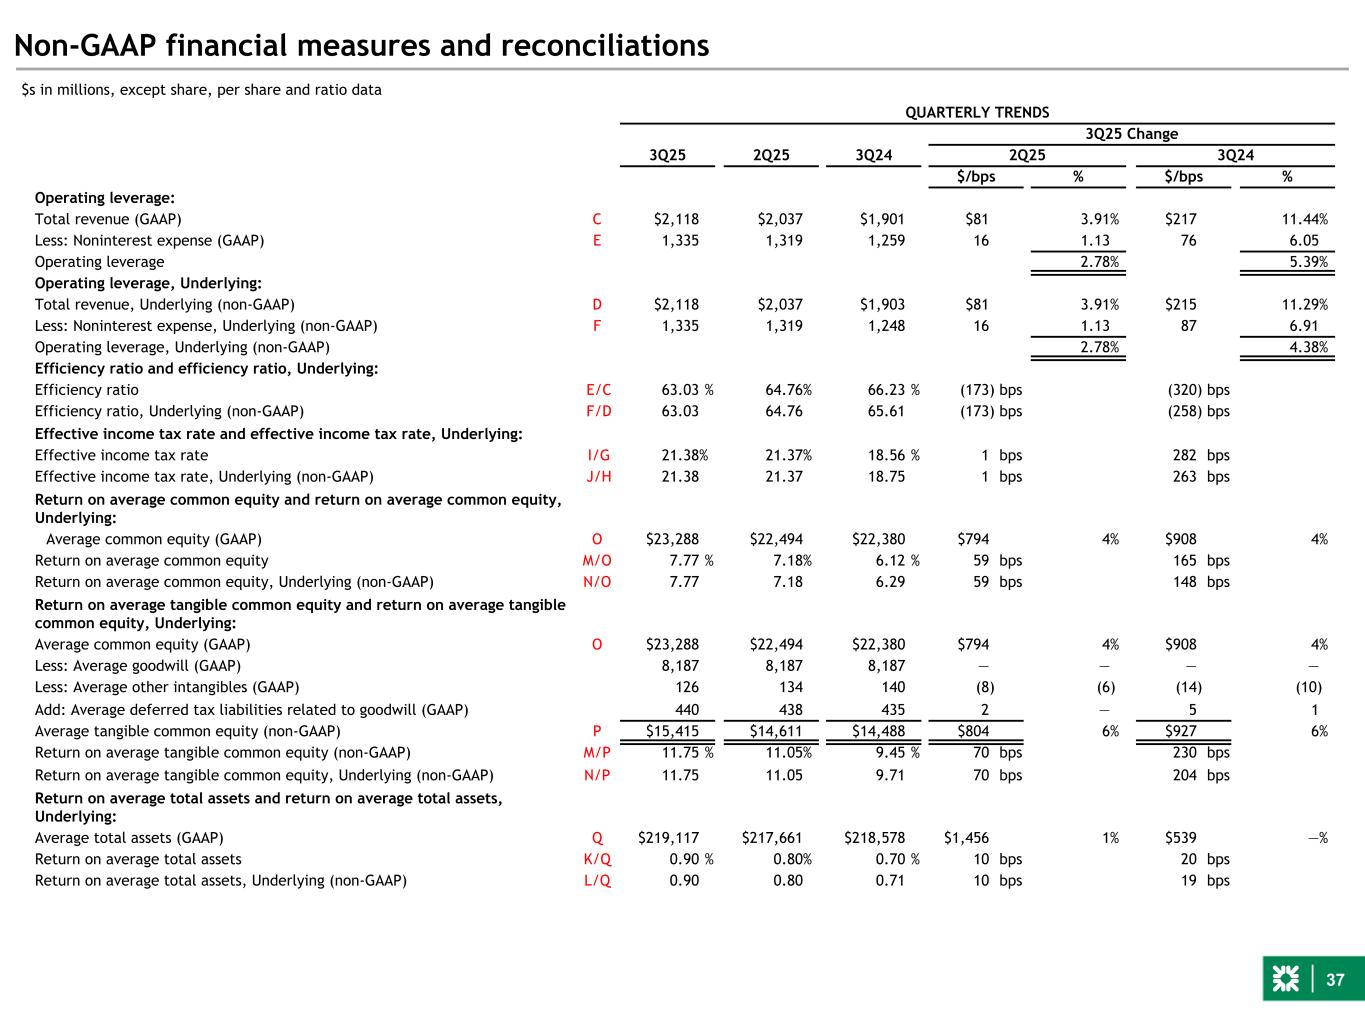
37 Non-GAAP financial measures and reconciliations QUARTERLY TRENDS 3Q25 Change 3Q25 2Q25 3Q24 2Q25 3Q24 $/bps % $/bps % Operating leverage: Total revenue (GAAP) C $2,118 $2,037 $1,901 $81 3.91% $217 11.44% Less: Noninterest expense (GAAP) E 1,335 1,319 1,259 16 1.13 76 6.05 Operating leverage 2.78% 5.39% Operating leverage, Underlying: Total revenue, Underlying (non-GAAP) D $2,118 $2,037 $1,903 $81 3.91% $215 11.29% Less: Noninterest expense, Underlying (non-GAAP) F 1,335 1,319 1,248 16 1.13 87 6.91 Operating leverage, Underlying (non-GAAP) 2.78% 4.38% Efficiency ratio and efficiency ratio, Underlying: Efficiency ratio E/C 63.03 % 64.76% 66.23 % (173) bps (320) bps Efficiency ratio, Underlying (non-GAAP) F/D 63.03 64.76 65.61 (173) bps (258) bps Effective income tax rate and effective income tax rate, Underlying: Effective income tax rate I/G 21.38% 21.37% 18.56 % 1 bps 282 bps Effective income tax rate, Underlying (non-GAAP) J/H 21.38 21.37 18.75 1 bps 263 bps Return on average common equity and return on average common equity, Underlying: Average common equity (GAAP) O $23,288 $22,494 $22,380 $794 4% $908 4% Return on average common equity M/O 7.77 % 7.18% 6.12 % 59 bps 165 bps Return on average common equity, Underlying (non-GAAP) N/O 7.77 7.18 6.29 59 bps 148 bps Return on average tangible common equity and return on average tangible common equity, Underlying: Average common equity (GAAP) O $23,288 $22,494 $22,380 $794 4% $908 4% Less: Average goodwill (GAAP) 8,187 8,187 8,187 — — — — Less: Average other intangibles (GAAP) 126 134 140 (8) (6) (14) (10) Add: Average deferred tax liabilities related to goodwill (GAAP) 440 438 435 2 — 5 1 Average tangible common equity (non-GAAP) P $15,415 $14,611 $14,488 $804 6% $927 6% Return on average tangible common equity (non-GAAP) M/P 11.75 % 11.05% 9.45 % 70 bps 230 bps Return on average tangible common equity, Underlying (non-GAAP) N/P 11.75 11.05 9.71 70 bps 204 bps Return on average total assets and return on average total assets, Underlying: Average total assets (GAAP) Q $219,117 $217,661 $218,578 $1,456 1% $539 —% Return on average total assets K/Q 0.90 % 0.80% 0.70 % 10 bps 20 bps Return on average total assets, Underlying (non-GAAP) L/Q 0.90 0.80 0.71 10 bps 19 bps $s in millions, except share, per share and ratio data
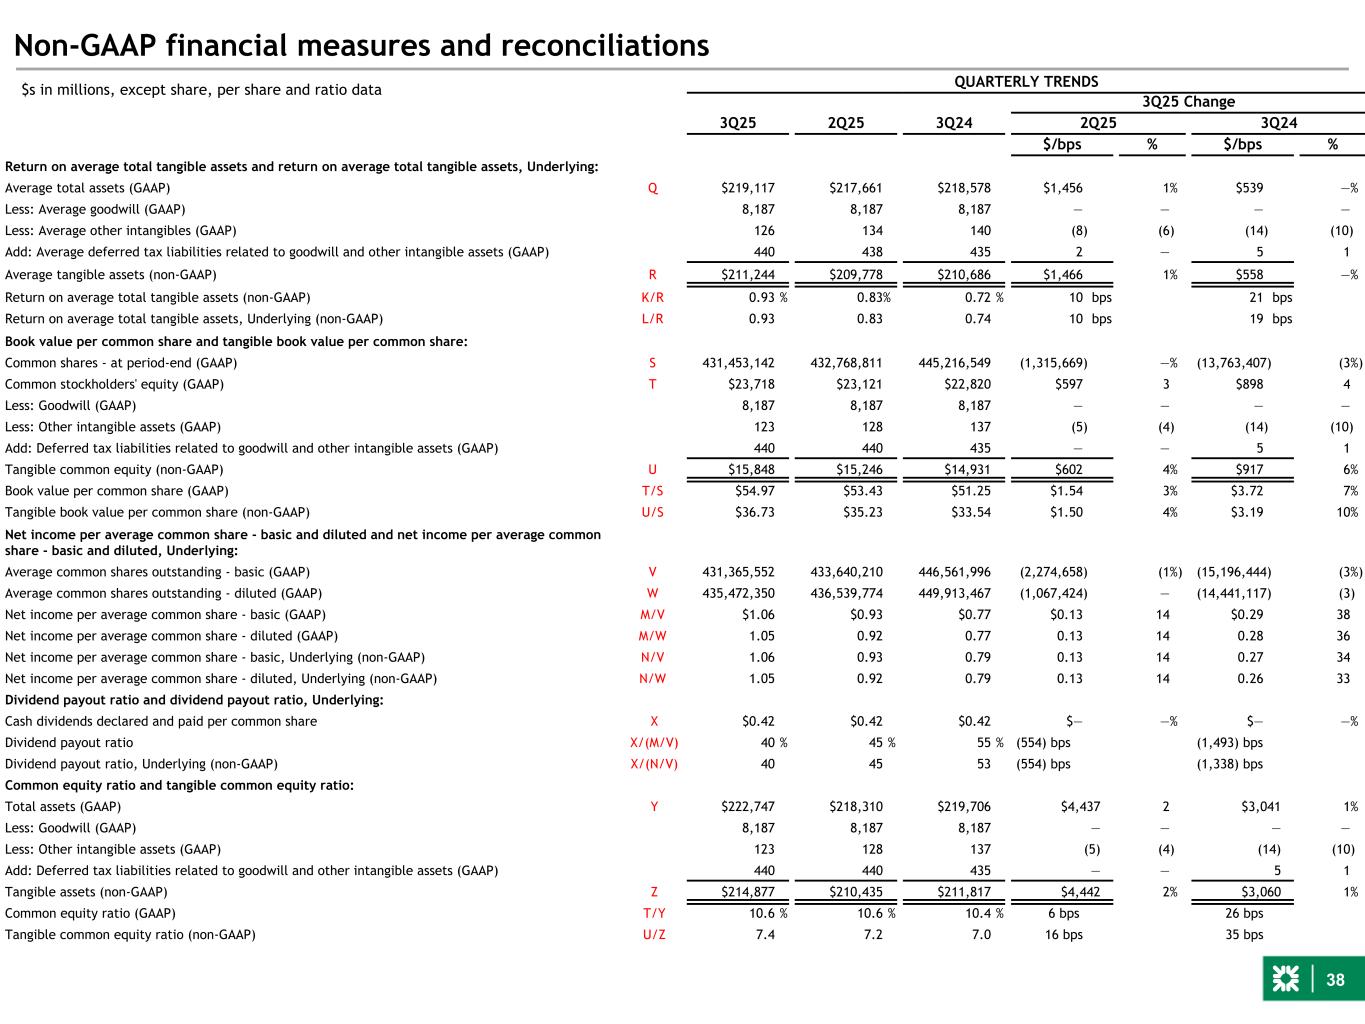
38 Non-GAAP financial measures and reconciliations QUARTERLY TRENDS 3Q25 Change 3Q25 2Q25 3Q24 2Q25 3Q24 $/bps % $/bps % Return on average total tangible assets and return on average total tangible assets, Underlying: Average total assets (GAAP) Q $219,117 $217,661 $218,578 $1,456 1% $539 —% Less: Average goodwill (GAAP) 8,187 8,187 8,187 — — — — Less: Average other intangibles (GAAP) 126 134 140 (8) (6) (14) (10) Add: Average deferred tax liabilities related to goodwill and other intangible assets (GAAP) 440 438 435 2 — 5 1 Average tangible assets (non-GAAP) R $211,244 $209,778 $210,686 $1,466 1% $558 —% Return on average total tangible assets (non-GAAP) K/R 0.93 % 0.83% 0.72 % 10 bps 21 bps Return on average total tangible assets, Underlying (non-GAAP) L/R 0.93 0.83 0.74 10 bps 19 bps Book value per common share and tangible book value per common share: Common shares - at period-end (GAAP) S 431,453,142 432,768,811 445,216,549 (1,315,669) —% (13,763,407) (3%) Common stockholders' equity (GAAP) T $23,718 $23,121 $22,820 $597 3 $898 4 Less: Goodwill (GAAP) 8,187 8,187 8,187 — — — — Less: Other intangible assets (GAAP) 123 128 137 (5) (4) (14) (10) Add: Deferred tax liabilities related to goodwill and other intangible assets (GAAP) 440 440 435 — — 5 1 Tangible common equity (non-GAAP) U $15,848 $15,246 $14,931 $602 4% $917 6% Book value per common share (GAAP) T/S $54.97 $53.43 $51.25 $1.54 3% $3.72 7% Tangible book value per common share (non-GAAP) U/S $36.73 $35.23 $33.54 $1.50 4% $3.19 10% Net income per average common share - basic and diluted and net income per average common share - basic and diluted, Underlying: Average common shares outstanding - basic (GAAP) V 431,365,552 433,640,210 446,561,996 (2,274,658) (1%) (15,196,444) (3%) Average common shares outstanding - diluted (GAAP) W 435,472,350 436,539,774 449,913,467 (1,067,424) — (14,441,117) (3) Net income per average common share - basic (GAAP) M/V $1.06 $0.93 $0.77 $0.13 14 $0.29 38 Net income per average common share - diluted (GAAP) M/W 1.05 0.92 0.77 0.13 14 0.28 36 Net income per average common share - basic, Underlying (non-GAAP) N/V 1.06 0.93 0.79 0.13 14 0.27 34 Net income per average common share - diluted, Underlying (non-GAAP) N/W 1.05 0.92 0.79 0.13 14 0.26 33 Dividend payout ratio and dividend payout ratio, Underlying: Cash dividends declared and paid per common share X $0.42 $0.42 $0.42 $— —% $— —% Dividend payout ratio X/(M/V) 40 % 45 % 55 % (554) bps (1,493) bps Dividend payout ratio, Underlying (non-GAAP) X/(N/V) 40 45 53 (554) bps (1,338) bps Common equity ratio and tangible common equity ratio: Total assets (GAAP) Y $222,747 $218,310 $219,706 $4,437 2 $3,041 1% Less: Goodwill (GAAP) 8,187 8,187 8,187 — — — — Less: Other intangible assets (GAAP) 123 128 137 (5) (4) (14) (10) Add: Deferred tax liabilities related to goodwill and other intangible assets (GAAP) 440 440 435 — — 5 1 Tangible assets (non-GAAP) Z $214,877 $210,435 $211,817 $4,442 2% $3,060 1% Common equity ratio (GAAP) T/Y 10.6 % 10.6 % 10.4 % 6 bps 26 bps Tangible common equity ratio (non-GAAP) U/Z 7.4 7.2 7.0 16 bps 35 bps $s in millions, except share, per share and ratio data
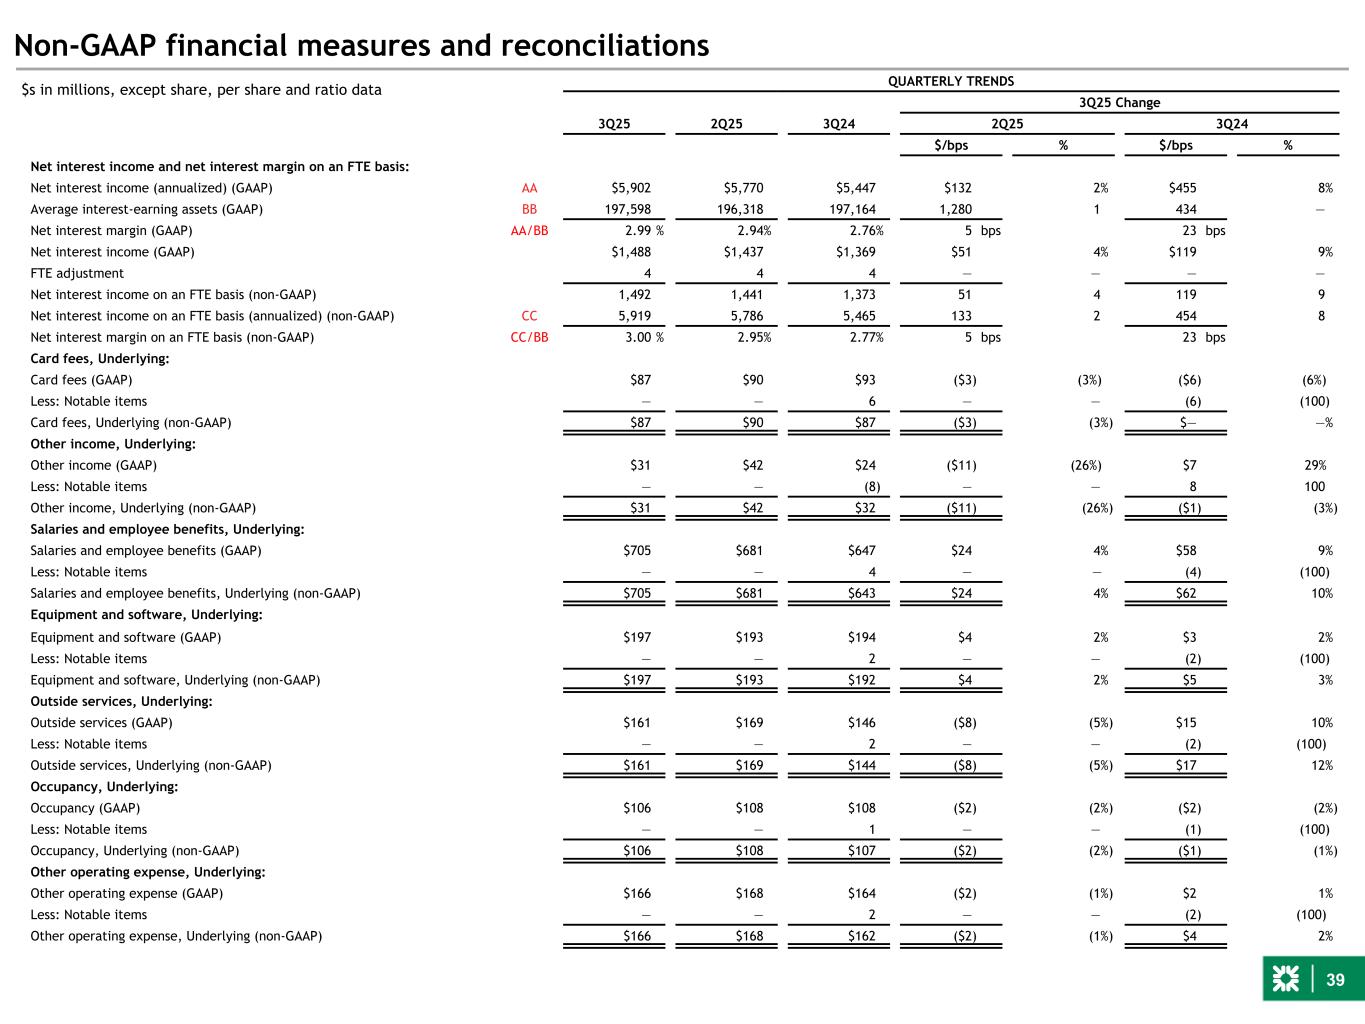
39 Non-GAAP financial measures and reconciliations QUARTERLY TRENDS 3Q25 Change 3Q25 2Q25 3Q24 2Q25 3Q24 $/bps % $/bps % Net interest income and net interest margin on an FTE basis: Net interest income (annualized) (GAAP) AA $5,902 $5,770 $5,447 $132 2% $455 8% Average interest-earning assets (GAAP) BB 197,598 196,318 197,164 1,280 1 434 — Net interest margin (GAAP) AA/BB 2.99 % 2.94% 2.76% 5 bps 23 bps Net interest income (GAAP) $1,488 $1,437 $1,369 $51 4% $119 9% FTE adjustment 4 4 4 — — — — Net interest income on an FTE basis (non-GAAP) 1,492 1,441 1,373 51 4 119 9 Net interest income on an FTE basis (annualized) (non-GAAP) CC 5,919 5,786 5,465 133 2 454 8 Net interest margin on an FTE basis (non-GAAP) CC/BB 3.00 % 2.95% 2.77% 5 bps 23 bps Card fees, Underlying: Card fees (GAAP) $87 $90 $93 ($3) (3%) ($6) (6%) Less: Notable items — — 6 — — (6) (100) Card fees, Underlying (non-GAAP) $87 $90 $87 ($3) (3%) $— —% Other income, Underlying: Other income (GAAP) $31 $42 $24 ($11) (26%) $7 29% Less: Notable items — — (8) — — 8 100 Other income, Underlying (non-GAAP) $31 $42 $32 ($11) (26%) ($1) (3%) Salaries and employee benefits, Underlying: Salaries and employee benefits (GAAP) $705 $681 $647 $24 4% $58 9% Less: Notable items — — 4 — — (4) (100) Salaries and employee benefits, Underlying (non-GAAP) $705 $681 $643 $24 4% $62 10% Equipment and software, Underlying: Equipment and software (GAAP) $197 $193 $194 $4 2% $3 2% Less: Notable items — — 2 — — (2) (100) Equipment and software, Underlying (non-GAAP) $197 $193 $192 $4 2% $5 3% Outside services, Underlying: Outside services (GAAP) $161 $169 $146 ($8) (5%) $15 10% Less: Notable items — — 2 — — (2) (100) Outside services, Underlying (non-GAAP) $161 $169 $144 ($8) (5%) $17 12% Occupancy, Underlying: Occupancy (GAAP) $106 $108 $108 ($2) (2%) ($2) (2%) Less: Notable items — — 1 — — (1) (100) Occupancy, Underlying (non-GAAP) $106 $108 $107 ($2) (2%) ($1) (1%) Other operating expense, Underlying: Other operating expense (GAAP) $166 $168 $164 ($2) (1%) $2 1% Less: Notable items — — 2 — — (2) (100) Other operating expense, Underlying (non-GAAP) $166 $168 $162 ($2) (1%) $4 2% $s in millions, except share, per share and ratio data
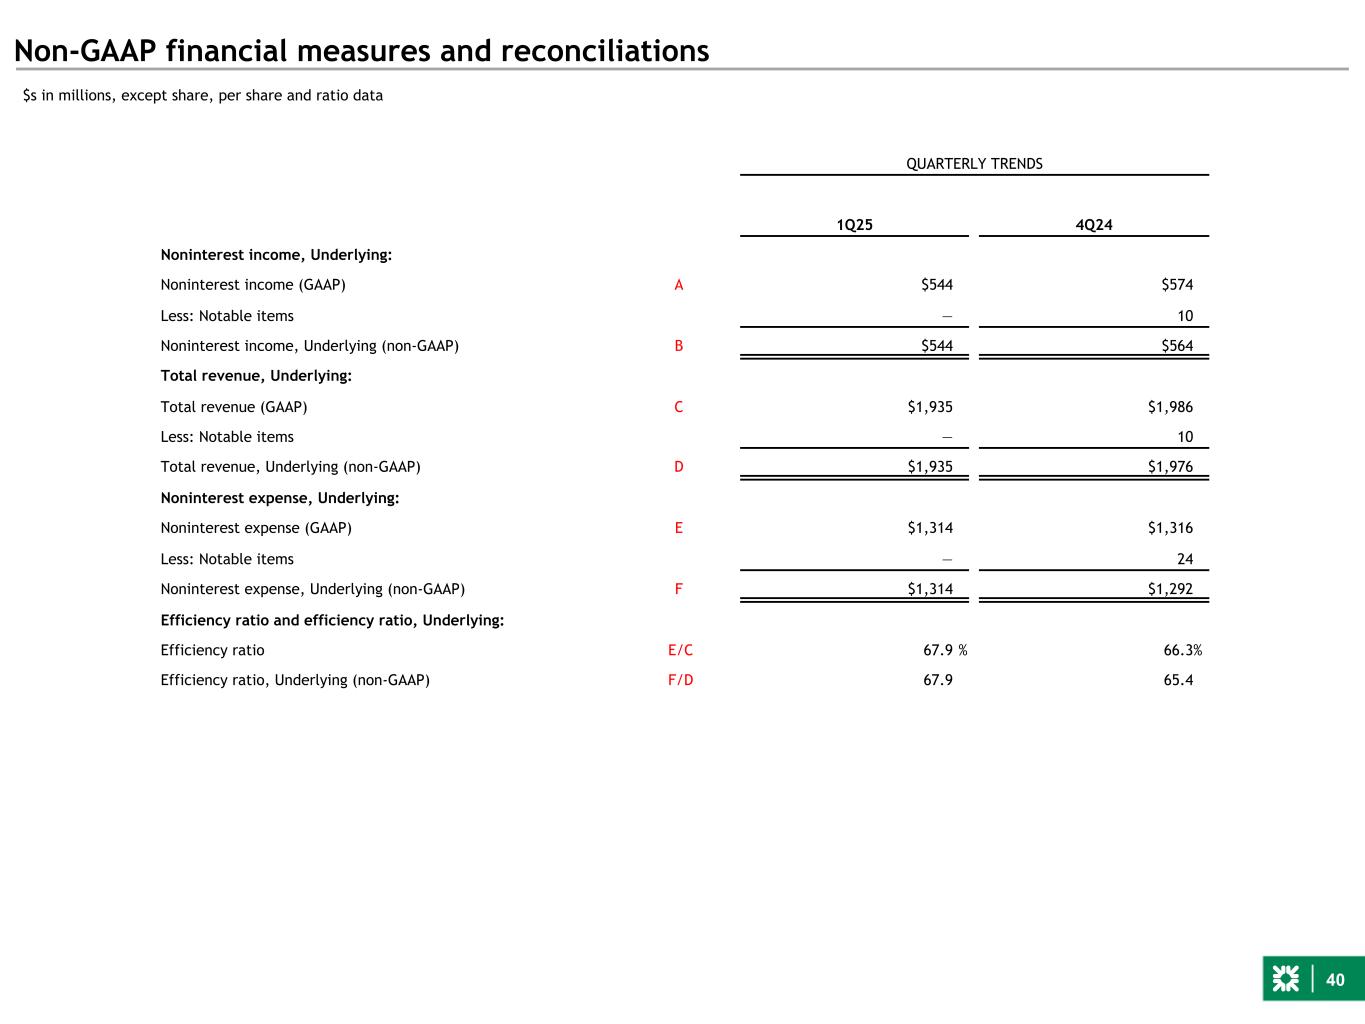
40 Non-GAAP financial measures and reconciliations $s in millions, except share, per share and ratio data QUARTERLY TRENDS 1Q25 4Q24 Noninterest income, Underlying: Noninterest income (GAAP) A $544 $574 Less: Notable items — 10 Noninterest income, Underlying (non-GAAP) B $544 $564 Total revenue, Underlying: Total revenue (GAAP) C $1,935 $1,986 Less: Notable items — 10 Total revenue, Underlying (non-GAAP) D $1,935 $1,976 Noninterest expense, Underlying: Noninterest expense (GAAP) E $1,314 $1,316 Less: Notable items — 24 Noninterest expense, Underlying (non-GAAP) F $1,314 $1,292 Efficiency ratio and efficiency ratio, Underlying: Efficiency ratio E/C 67.9 % 66.3% Efficiency ratio, Underlying (non-GAAP) F/D 67.9 65.4
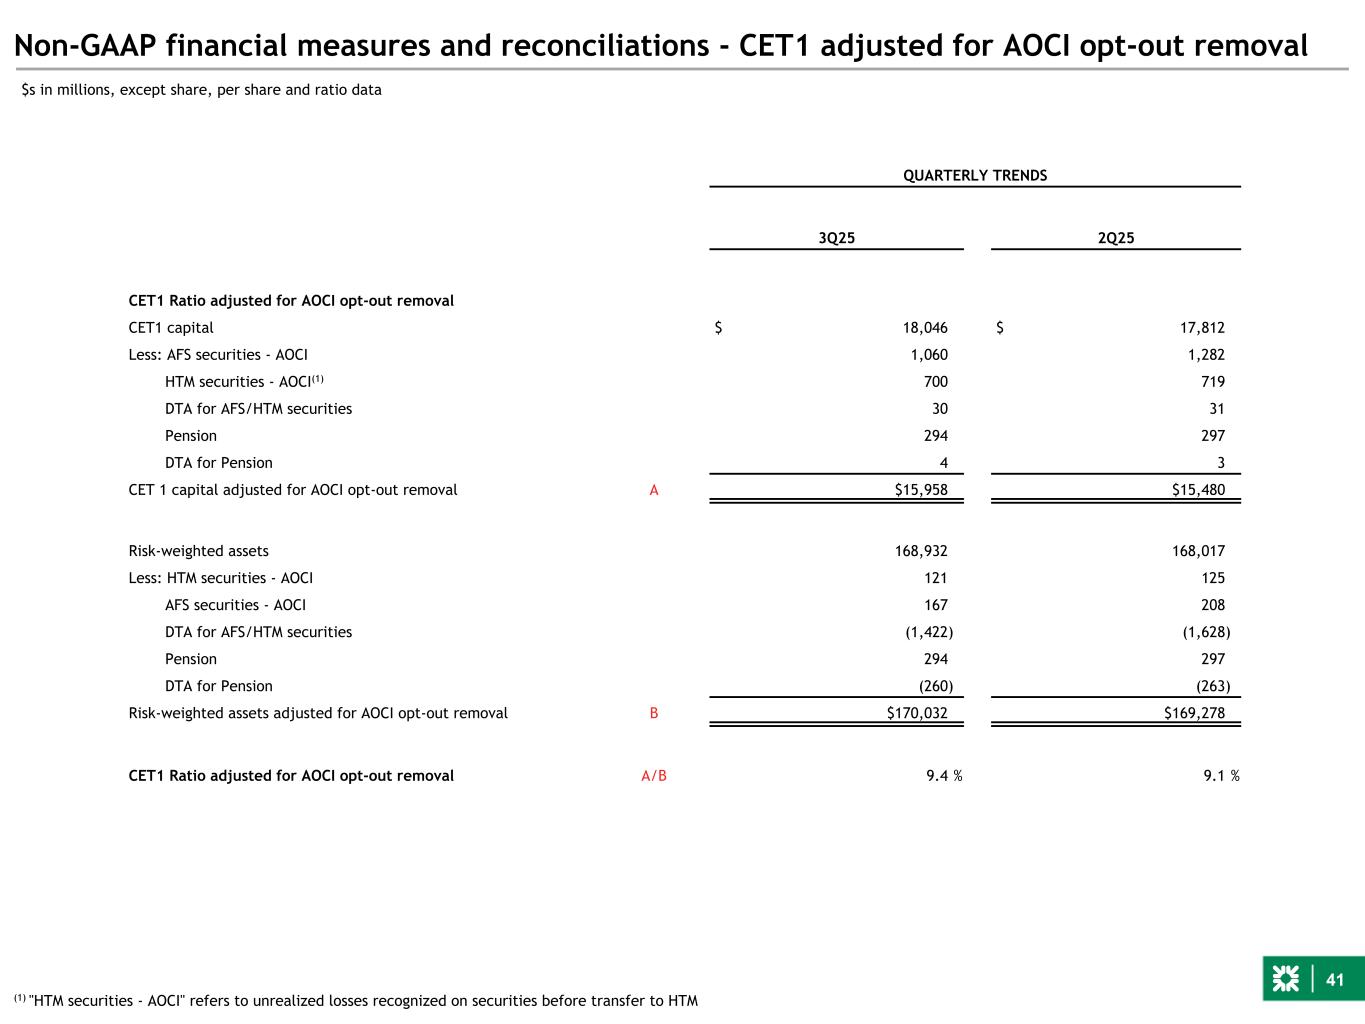
41 Non-GAAP financial measures and reconciliations - CET1 adjusted for AOCI opt-out removal QUARTERLY TRENDS 3Q25 2Q25 CET1 Ratio adjusted for AOCI opt-out removal CET1 capital $ 18,046 $ 17,812 Less: AFS securities - AOCI 1,060 1,282 HTM securities - AOCI(1) 700 719 DTA for AFS/HTM securities 30 31 Pension 294 297 DTA for Pension 4 3 CET 1 capital adjusted for AOCI opt-out removal A $15,958 $15,480 Risk-weighted assets 168,932 168,017 Less: HTM securities - AOCI 121 125 AFS securities - AOCI 167 208 DTA for AFS/HTM securities (1,422) (1,628) Pension 294 297 DTA for Pension (260) (263) Risk-weighted assets adjusted for AOCI opt-out removal B $170,032 $169,278 CET1 Ratio adjusted for AOCI opt-out removal A/B 9.4 % 9.1 % $s in millions, except share, per share and ratio data (1) "HTM securities - AOCI" refers to unrealized losses recognized on securities before transfer to HTM
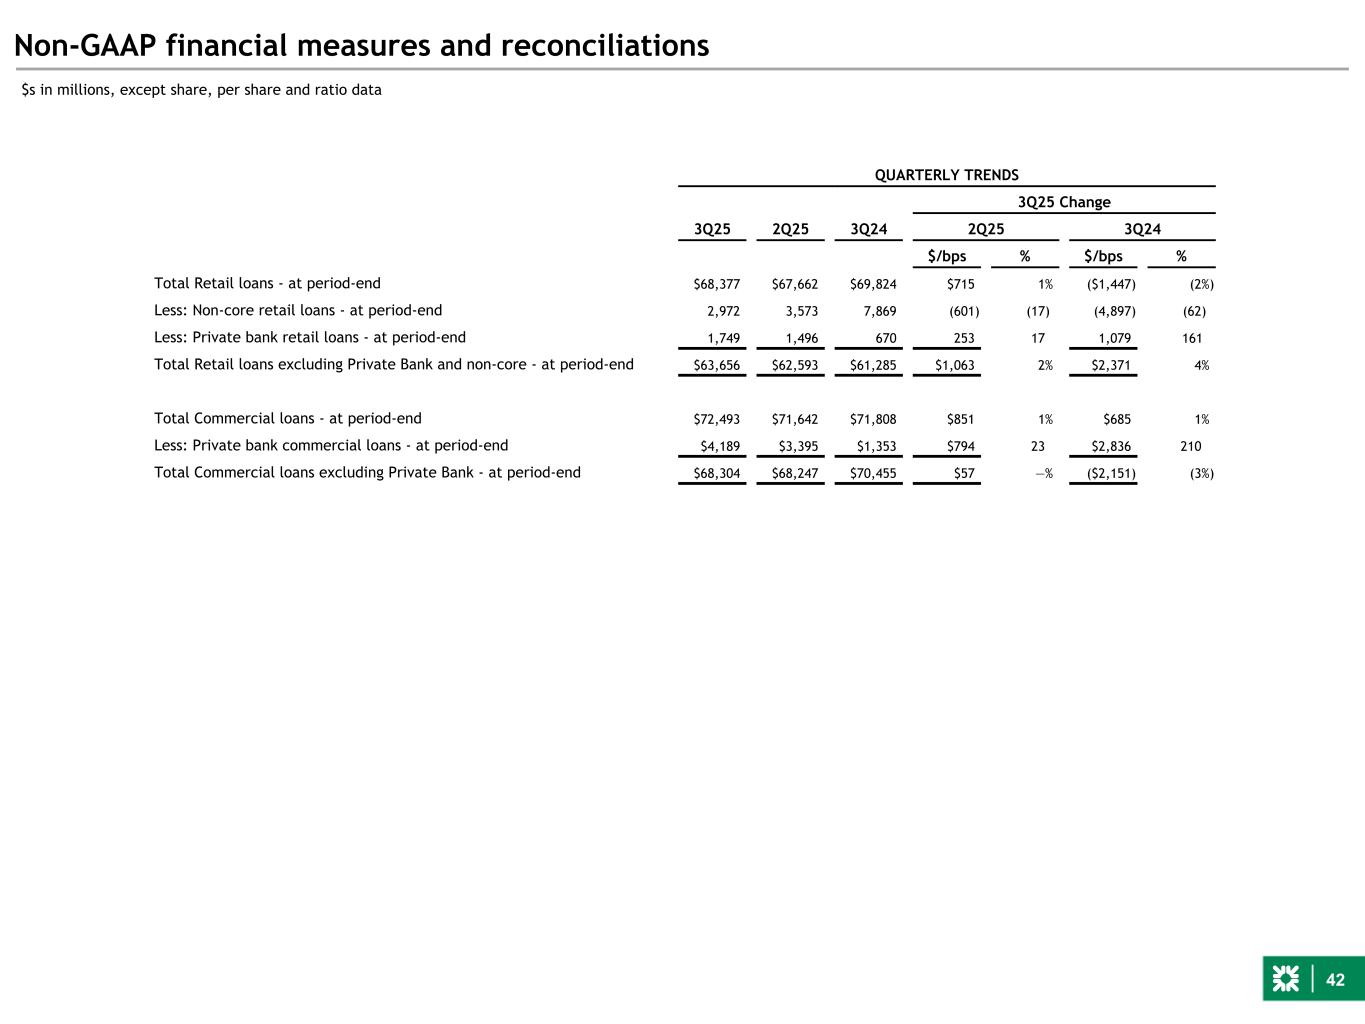
42 Non-GAAP financial measures and reconciliations QUARTERLY TRENDS 3Q25 Change 3Q25 2Q25 3Q24 2Q25 3Q24 $/bps % $/bps % Total Retail loans - at period-end $68,377 $67,662 $69,824 $715 1% ($1,447) (2%) Less: Non-core retail loans - at period-end 2,972 3,573 7,869 (601) (17) (4,897) (62) Less: Private bank retail loans - at period-end 1,749 1,496 670 253 17 1,079 161 Total Retail loans excluding Private Bank and non-core - at period-end $63,656 $62,593 $61,285 $1,063 2% $2,371 4% Total Commercial loans - at period-end $72,493 $71,642 $71,808 $851 1% $685 1% Less: Private bank commercial loans - at period-end $4,189 $3,395 $1,353 $794 23 $2,836 210 Total Commercial loans excluding Private Bank - at period-end $68,304 $68,247 $70,455 $57 —% ($2,151) (3%) $s in millions, except share, per share and ratio data
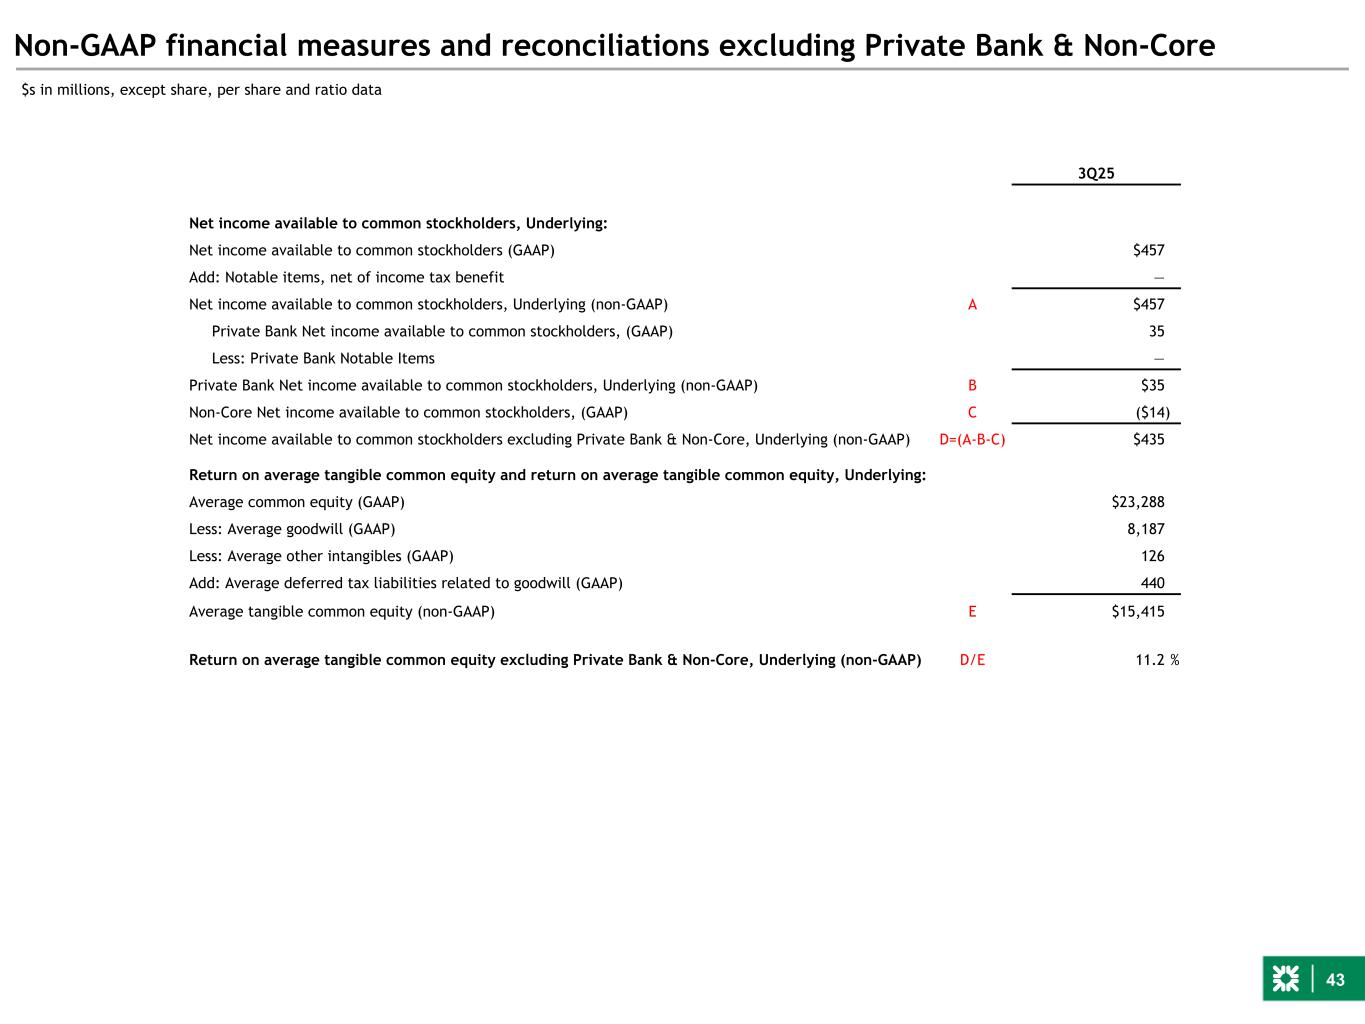
43 Non-GAAP financial measures and reconciliations excluding Private Bank & Non-Core $s in millions, except share, per share and ratio data 3Q25 Net income available to common stockholders, Underlying: Net income available to common stockholders (GAAP) $457 Add: Notable items, net of income tax benefit — Net income available to common stockholders, Underlying (non-GAAP) A $457 Private Bank Net income available to common stockholders, (GAAP) 35 Less: Private Bank Notable Items — Private Bank Net income available to common stockholders, Underlying (non-GAAP) B $35 Non-Core Net income available to common stockholders, (GAAP) C ($14) Net income available to common stockholders excluding Private Bank & Non-Core, Underlying (non-GAAP) D=(A-B-C) $435 Return on average tangible common equity and return on average tangible common equity, Underlying: Average common equity (GAAP) $23,288 Less: Average goodwill (GAAP) 8,187 Less: Average other intangibles (GAAP) 126 Add: Average deferred tax liabilities related to goodwill (GAAP) 440 Average tangible common equity (non-GAAP) E $15,415 Return on average tangible common equity excluding Private Bank & Non-Core, Underlying (non-GAAP) D/E 11.2 %
