3Q26 Financial Results October 16, 2026
2 Forward-looking statements and use of non-GAAP financial measures This document contains forward-looking statements within the meaning of the Private Securities Litigation Reform Act of 1995. Any statement that does not describe historical or current facts is a forward- looking statement. These statements often include the words "believes," "expects," "anticipates," "estimates," "intends," "plans," "goals," "targets," "initiatives," "potentially," "probably," "projects," "outlook," and "guidance", or similar expressions or future conditional verbs such as "may," "will," "likely," "should," "would," and "could." Forward-looking statements are based upon the current beliefs and expectations of management and on information currently available to management. Our statements speak as of the date hereof, and we do not assume any obligation to update these statements or to update the reasons why actual results could differ from those contained in such statements in light of new information or future events. We caution you, therefore, against relying on any of these forward-looking statements. They are neither statements of historical fact nor guarantees or assurances of future performance. While there is no assurance that any list of risks and uncertainties or risk factors is complete, important factors that could cause actual results to differ materially from those in the forward-looking statements include the following, without limitation: • Negative economic, business, and political conditions, including as a result of the interest rate environment, supply chain disruptions, tariffs, inflationary pressures, and labor shortages that adversely affect the general economy, housing prices, the job market, consumer confidence, and spending habits; • The general state of the economy and employment, as well as general business and economic conditions, and changes in the competitive environment; • Our capital and liquidity requirements under regulatory standards and our ability to generate capital and liquidity on favorable terms; • The effect of changes in our credit ratings on our cost of funding, access to capital markets, ability to market our securities, and overall liquidity position; • The effect of changes in the level of commercial and consumer deposits on our funding costs and net interest margin; • Our ability to achieve our financial performance goals and execute on our strategic business initiatives, including the continued expansion of Private Bank & Wealth, and our aim to position us as a more innovative, modern, and customer-centric bank; • The effects of geopolitical instability, including the war in Ukraine and the conflict in the Middle East, on economic and market conditions, inflationary pressures and the interest rate environment, commodity price and foreign exchange rate volatility, and heightened cybersecurity risks; • Our ability to comply with supervisory requirements and expectations as well as new or amended regulations; • Liabilities and business restrictions resulting from litigation and regulatory investigations; • The impact of changes in interest rates on our net interest income, net interest margin, mortgage originations, and mortgage servicing rights, as well as on market liquidity, which could affect our funding sources and ability to originate and distribute financial products in the primary and secondary markets; • Financial services reform and other current, pending, or future legislation or regulation that could have a negative effect on our revenue and businesses; • Environmental risks, such as physical or transition risks associated with climate change, and social and governance risks that could adversely affect our reputation, operations, business, and customers; • A failure in, or breach of, our compliance with laws, as well as operational or security systems or infrastructure, or those of our third-party vendors or other service providers, including as a result of cyberattacks; and • Management’s ability to identify and manage these and other risks. In addition to the above factors, we also caution that the actual amounts and timing of any future common stock dividends or share repurchases will be subject to various factors, including our capital position, financial performance, balance sheet growth, market conditions, and regulatory considerations, as well as any other factors that our Board of Directors deems relevant in making such a determination. Therefore, there can be no assurance that we will repurchase shares from, or pay any dividends to, holders of our common stock, or as to the amount of any such repurchases or dividends. More information about factors that could cause actual results to differ materially from those described in the forward-looking statements can be found in the “Risk Factors” section in Part I, Item 1A of our Annual Report on Form 10-K for the fiscal year ended December 31, 2025 as filed with the Securities and Exchange Commission. Non-GAAP Financial Measures: This document contains non-GAAP financial measures that we believe provide useful information to investors to understand our results of operations or financial condition. We caution investors not to place undue reliance on such non-GAAP financial measures, but to consider them with the most directly comparable GAAP financial measures. Non-GAAP financial measures have limitations as analytical tools and should not be considered in isolation or as a substitute for our results reported under GAAP. The Appendix presents reconciliations of our non-GAAP measures to the most directly comparable GAAP financial measures.
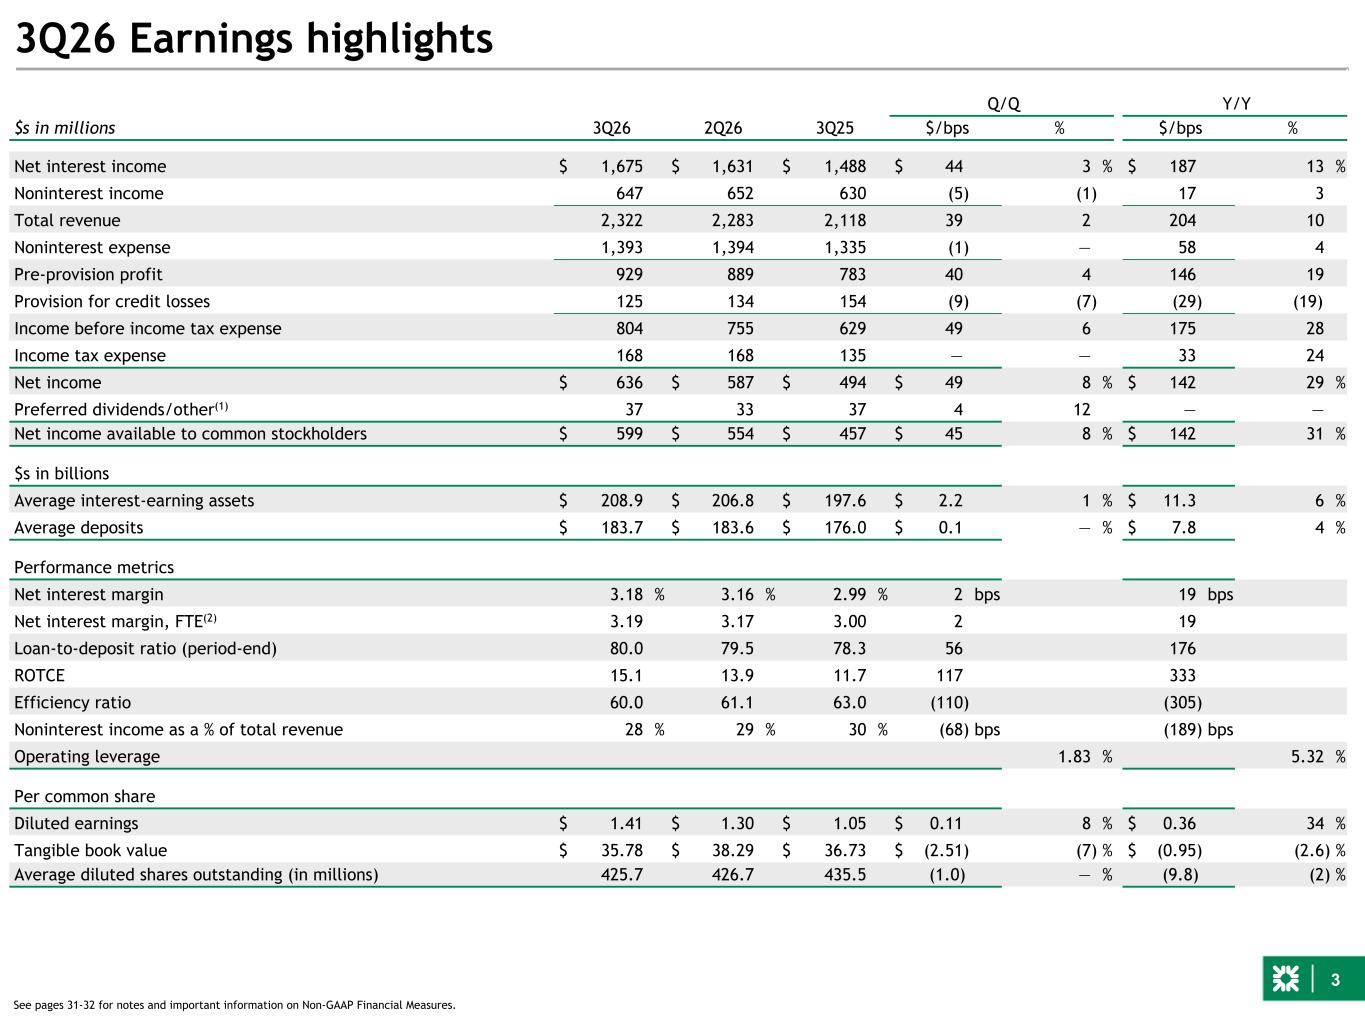
3 3Q26 Earnings highlights 3Q26 2Q26 3Q25 Q/Q Y/Y $s in millions $/bps % $/bps % Net interest income $ 1,675 $ 1,631 $ 1,488 $ 44 3 % $ 187 13 % Noninterest income 647 652 630 (5) (1) 17 3 Total revenue 2,322 2,283 2,118 39 2 204 10 Noninterest expense 1,393 1,394 1,335 (1) — 58 4 Pre-provision profit 929 889 783 40 4 146 19 Provision for credit losses 125 134 154 (9) (7) (29) (19) Income before income tax expense 804 755 629 49 6 175 28 Income tax expense 168 168 135 — — 33 24 Net income $ 636 $ 587 $ 494 $ 49 8 % $ 142 29 % Preferred dividends/other(1) 37 33 37 4 12 — — Net income available to common stockholders $ 599 $ 554 $ 457 $ 45 8 % $ 142 31 % $s in billions Average interest-earning assets $ 208.9 $ 206.8 $ 197.6 $ 2.2 1 % $ 11.3 6 % Average deposits $ 183.7 $ 183.6 $ 176.0 $ 0.1 — % $ 7.8 4 % Performance metrics Net interest margin 3.18 % 3.16 % 2.99 % 2 bps 19 bps Net interest margin, FTE(2) 3.19 3.17 3.00 2 19 Loan-to-deposit ratio (period-end) 80.0 79.5 78.3 56 176 ROTCE 15.1 13.9 11.7 117 333 Efficiency ratio 60.0 61.1 63.0 (110) (305) Noninterest income as a % of total revenue 28 % 29 % 30 % (68) bps (189) bps Operating leverage 1.83 % 5.32 % Per common share Diluted earnings $ 1.41 $ 1.30 $ 1.05 $ 0.11 8 % $ 0.36 34 % Tangible book value $ 35.78 $ 38.29 $ 36.73 $ (2.51) (7) % $ (0.95) (2.6) % Average diluted shares outstanding (in millions) 425.7 426.7 435.5 (1.0) — % (9.8) (2) % See pages 31-32 for notes and important information on Non-GAAP Financial Measures.
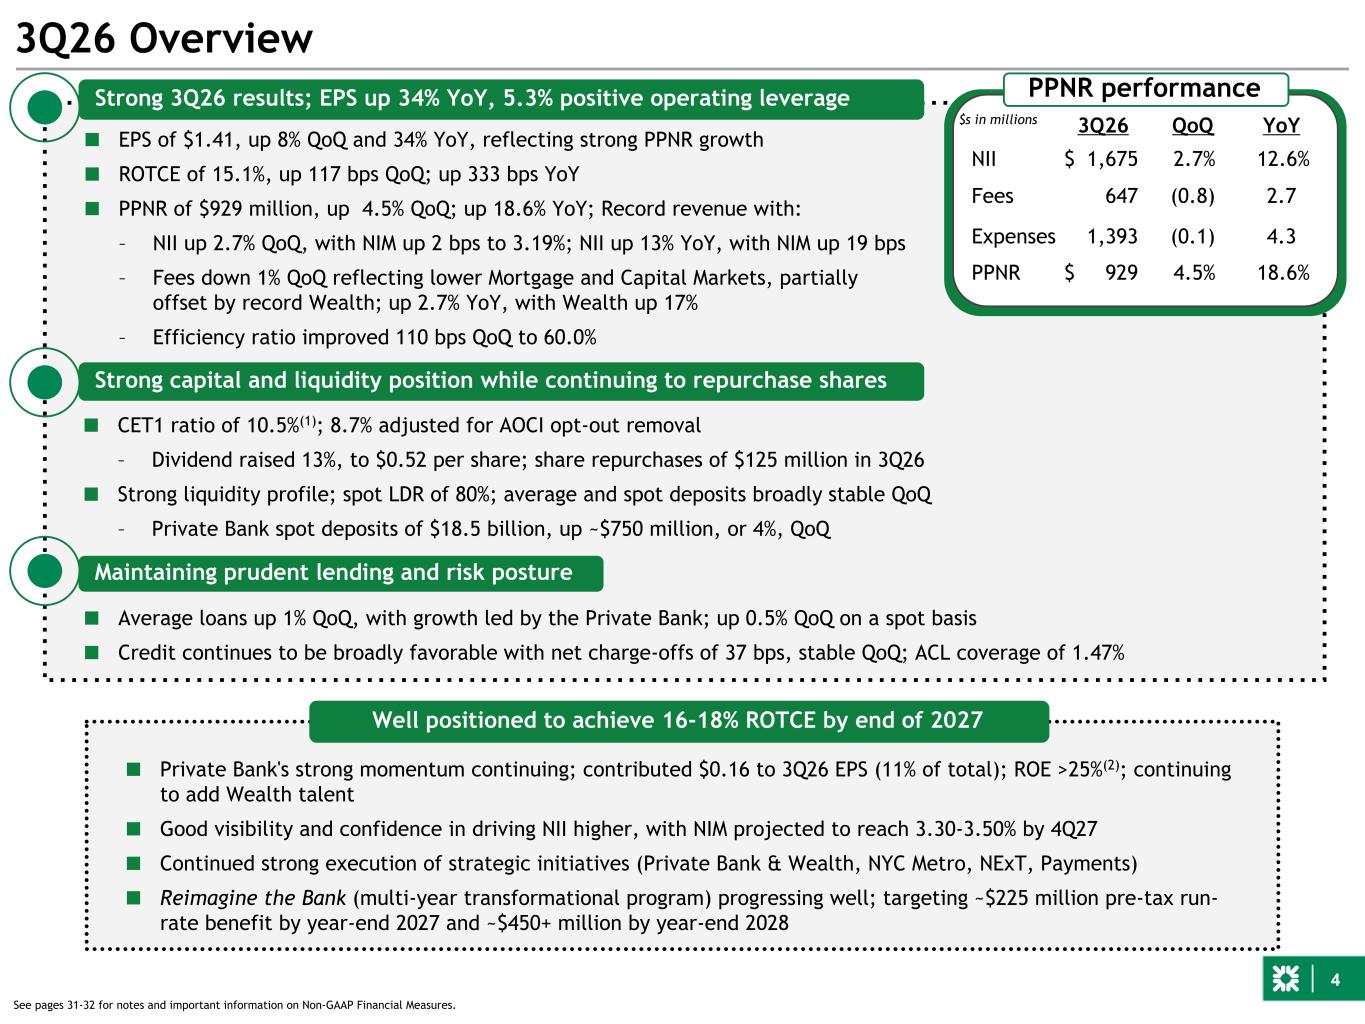
4 ■ CET1 ratio of 10.5%(1); 8.7% adjusted for AOCI opt-out removal – Dividend raised 13%, to $0.52 per share; share repurchases of $125 million in 3Q26 ■ Strong liquidity profile; spot LDR of 80%; average and spot deposits broadly stable QoQ – Private Bank spot deposits of $18.5 billion, up ~$750 million, or 4%, QoQ ■ Average loans up 1% QoQ, with growth led by the Private Bank; up 0.5% QoQ on a spot basis ■ Credit continues to be broadly favorable with net charge-offs of 37 bps, stable QoQ; ACL coverage of 1.47% ■ EPS of $1.41, up 8% QoQ and 34% YoY, reflecting strong PPNR growth ■ ROTCE of 15.1%, up 117 bps QoQ; up 333 bps YoY ■ PPNR of $929 million, up 4.5% QoQ; up 18.6% YoY; Record revenue with: – NII up 2.7% QoQ, with NIM up 2 bps to 3.19%; NII up 13% YoY, with NIM up 19 bps – Fees down 1% QoQ reflecting lower Mortgage and Capital Markets, partially offset by record Wealth; up 2.7% YoY, with Wealth up 17% – Efficiency ratio improved 110 bps QoQ to 60.0% Strong 3Q26 results; EPS up 34% YoY, 5.3% positive operating leverage Strong capital and liquidity position while continuing to repurchase shares Maintaining prudent lending and risk posture 3Q26 Overview ■ Private Bank's strong momentum continuing; contributed $0.16 to 3Q26 EPS (11% of total); ROE >25%(2); continuing to add Wealth talent ■ Good visibility and confidence in driving NII higher, with NIM projected to reach 3.30-3.50% by 4Q27 ■ Continued strong execution of strategic initiatives (Private Bank & Wealth, NYC Metro, NExT, Payments) ■ Reimagine the Bank (multi-year transformational program) progressing well; targeting ~$225 million pre-tax run- rate benefit by year-end 2027 and ~$450+ million by year-end 2028 Well positioned to achieve 16-18% ROTCE by end of 2027 PPNR performance 3Q26 QoQ YoY NII $ 1,675 2.7% 12.6% Fees 647 (0.8) 2.7 Expenses 1,393 (0.1) 4.3 PPNR $ 929 4.5% 18.6% See pages 31-32 for notes and important information on Non-GAAP Financial Measures. $s in millions
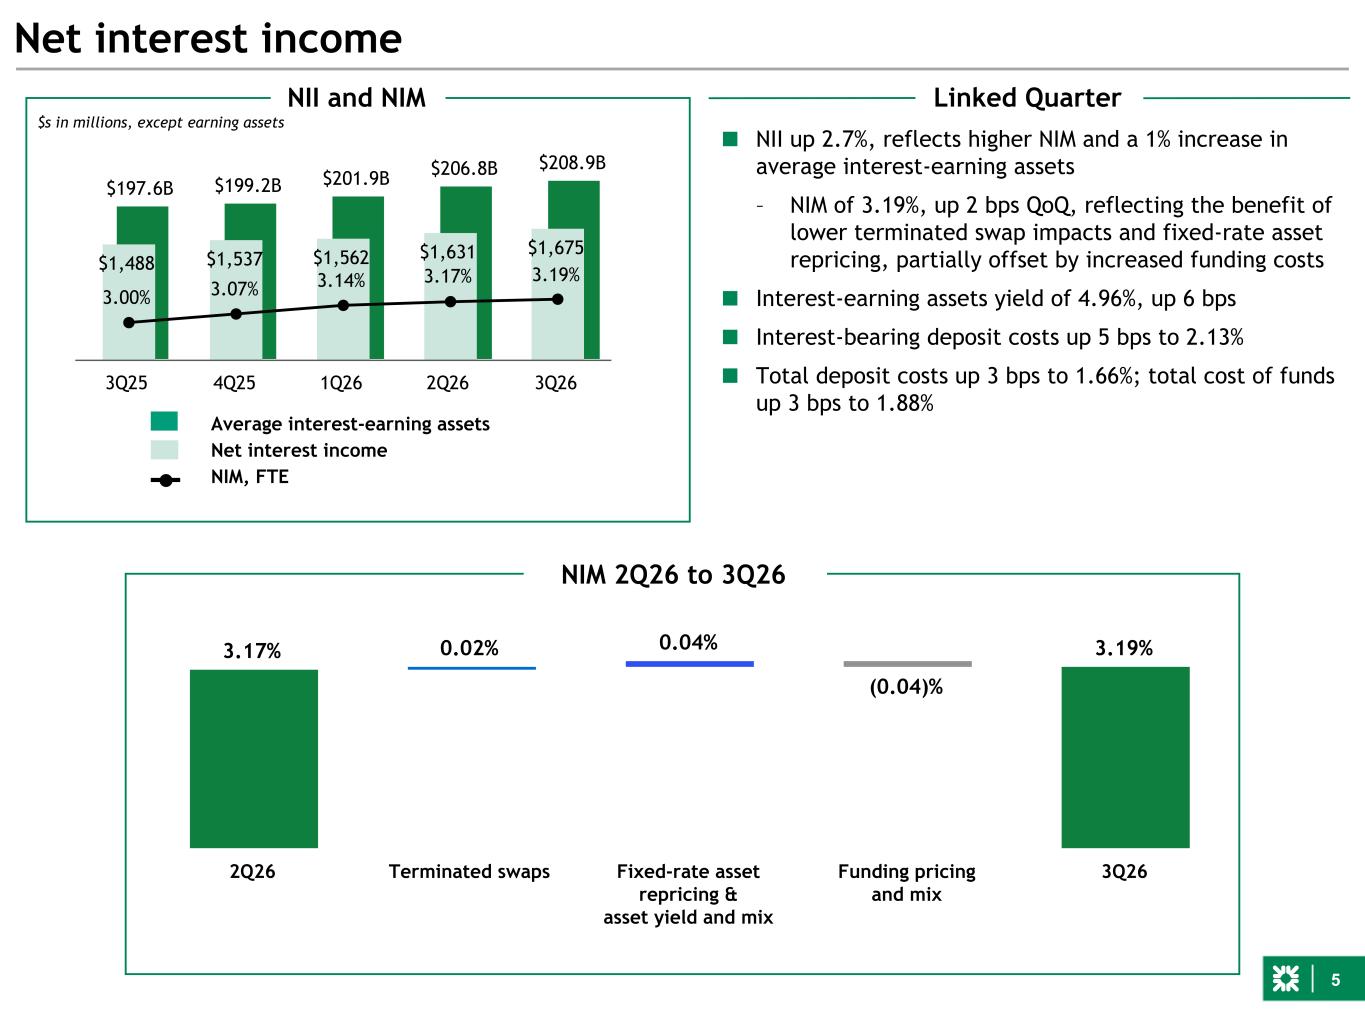
5 3.17% 0.02% 0.04% (0.04)% 3.19% 2Q26 Terminated swaps Fixed-rate asset repricing & asset yield and mix Funding pricing and mix 3Q26 $197.6B $199.2B $201.9B $206.8B $208.9B $1,488 $1,537 $1,562 $1,631 $1,675 3.00% 3.07% 3.14% 3.17% 3.19% 3Q25 4Q25 1Q26 2Q26 3Q26 ■ NII up 2.7%, reflects higher NIM and a 1% increase in average interest-earning assets – NIM of 3.19%, up 2 bps QoQ, reflecting the benefit of lower terminated swap impacts and fixed-rate asset repricing, partially offset by increased funding costs ■ Interest-earning assets yield of 4.96%, up 6 bps ■ Interest-bearing deposit costs up 5 bps to 2.13% ■ Total deposit costs up 3 bps to 1.66%; total cost of funds up 3 bps to 1.88% Net interest income NII and NIM Average interest-earning assets Net interest income NIM, FTE Linked Quarter NIM 2Q26 to 3Q26 $s in millions, except earning assets
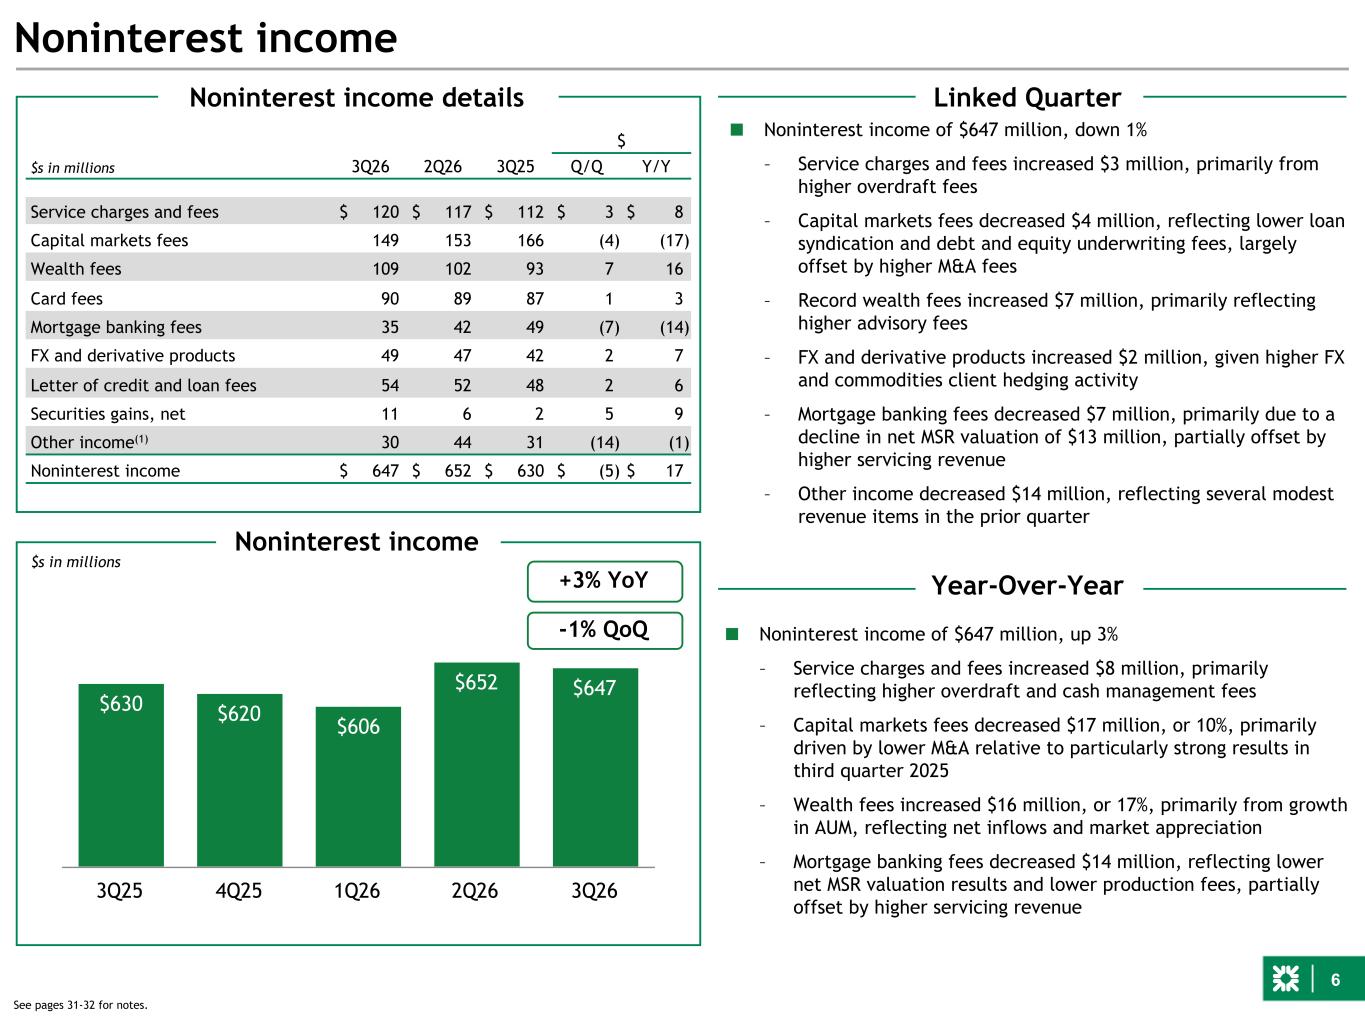
6 $630 $620 $606 $652 $647 3Q25 4Q25 1Q26 2Q26 3Q26 Noninterest income $s in millions Linked Quarter Year-Over-Year Noninterest income $s in millions 3Q26 2Q26 3Q25 $ Q/Q Y/Y Service charges and fees $ 120 $ 117 $ 112 $ 3 $ 8 Capital markets fees 149 153 166 (4) (17) Wealth fees 109 102 93 7 16 Card fees 90 89 87 1 3 Mortgage banking fees 35 42 49 (7) (14) FX and derivative products 49 47 42 2 7 Letter of credit and loan fees 54 52 48 2 6 Securities gains, net 11 6 2 5 9 Other income(1) 30 44 31 (14) (1) Noninterest income $ 647 $ 652 $ 630 $ (5) $ 17 Noninterest income details ■ Noninterest income of $647 million, up 3% – Service charges and fees increased $8 million, primarily reflecting higher overdraft and cash management fees – Capital markets fees decreased $17 million, or 10%, primarily driven by lower M&A relative to particularly strong results in third quarter 2025 – Wealth fees increased $16 million, or 17%, primarily from growth in AUM, reflecting net inflows and market appreciation – Mortgage banking fees decreased $14 million, reflecting lower net MSR valuation results and lower production fees, partially offset by higher servicing revenue +3% YoY -1% QoQ See pages 31-32 for notes. ■ Noninterest income of $647 million, down 1% – Service charges and fees increased $3 million, primarily from higher overdraft fees – Capital markets fees decreased $4 million, reflecting lower loan syndication and debt and equity underwriting fees, largely offset by higher M&A fees – Record wealth fees increased $7 million, primarily reflecting higher advisory fees – FX and derivative products increased $2 million, given higher FX and commodities client hedging activity – Mortgage banking fees decreased $7 million, primarily due to a decline in net MSR valuation of $13 million, partially offset by higher servicing revenue – Other income decreased $14 million, reflecting several modest revenue items in the prior quarter
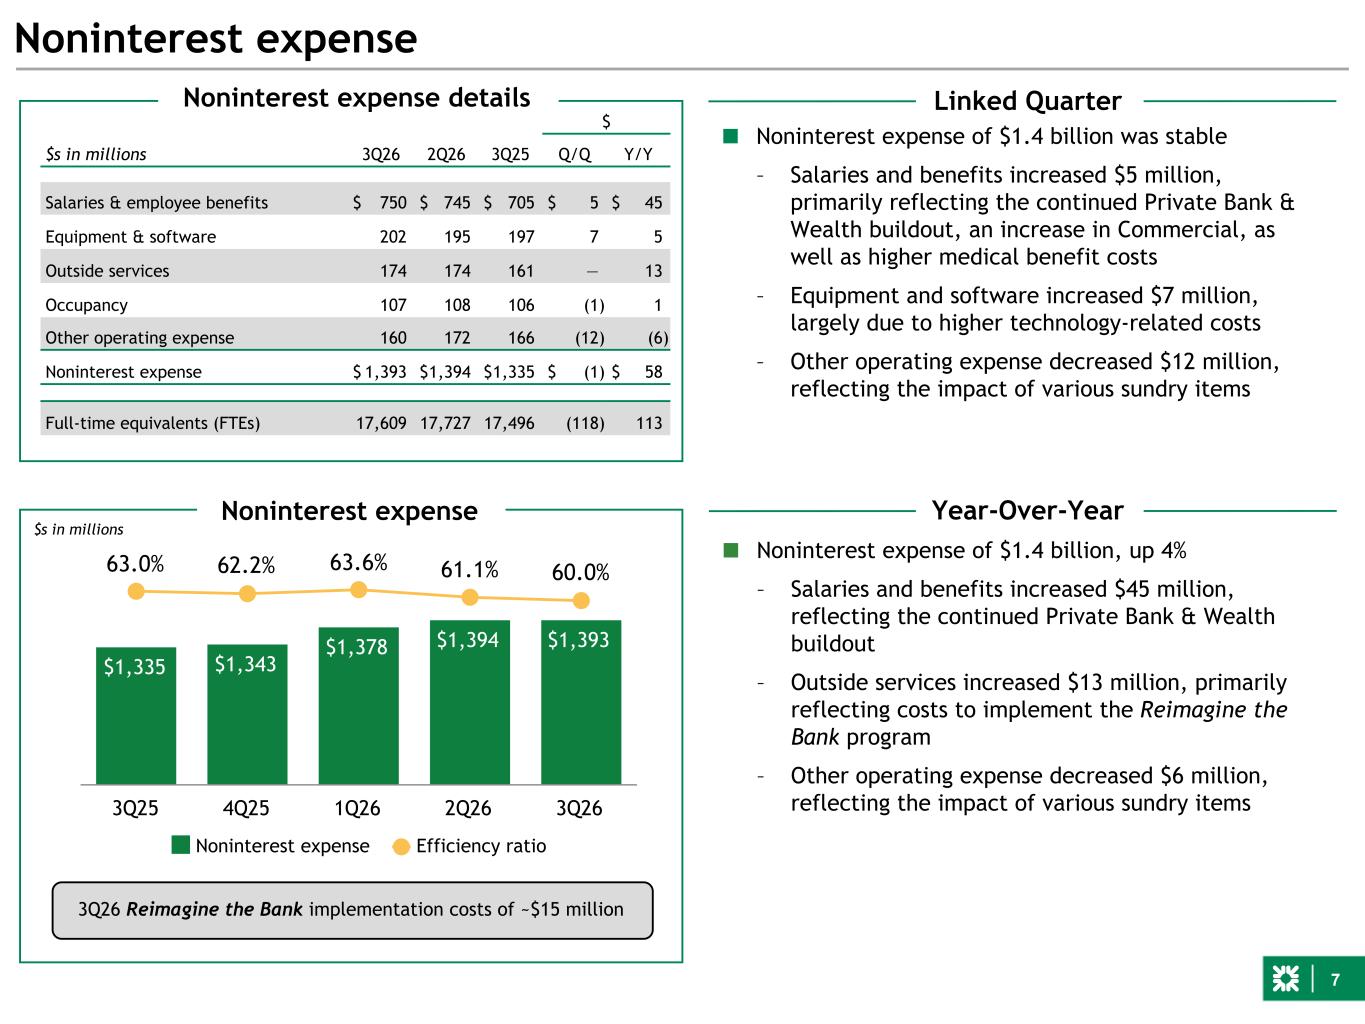
7 Noninterest expense Linked Quarter Year-Over-Year 3Q26 2Q26 3Q25 $ $s in millions Q/Q Y/Y Salaries & employee benefits $ 750 $ 745 $ 705 $ 5 $ 45 Equipment & software 202 195 197 7 5 Outside services 174 174 161 — 13 Occupancy 107 108 106 (1) 1 Other operating expense 160 172 166 (12) (6) Noninterest expense $ 1,393 $ 1,394 $ 1,335 $ (1) $ 58 Full-time equivalents (FTEs) 17,609 17,727 17,496 (118) 113 Noninterest expense details $1,335 $1,343 $1,378 $1,394 $1,393 63.0% 62.2% 63.6% 61.1% 60.0% Noninterest expense Efficiency ratio 3Q25 4Q25 1Q26 2Q26 3Q26 ■ Noninterest expense of $1.4 billion was stable – Salaries and benefits increased $5 million, primarily reflecting the continued Private Bank & Wealth buildout, an increase in Commercial, as well as higher medical benefit costs – Equipment and software increased $7 million, largely due to higher technology-related costs – Other operating expense decreased $12 million, reflecting the impact of various sundry items ■ Noninterest expense of $1.4 billion, up 4% – Salaries and benefits increased $45 million, reflecting the continued Private Bank & Wealth buildout – Outside services increased $13 million, primarily reflecting costs to implement the Reimagine the Bank program – Other operating expense decreased $6 million, reflecting the impact of various sundry items $s in millions Noninterest expense 3Q26 Reimagine the Bank implementation costs of ~$15 million
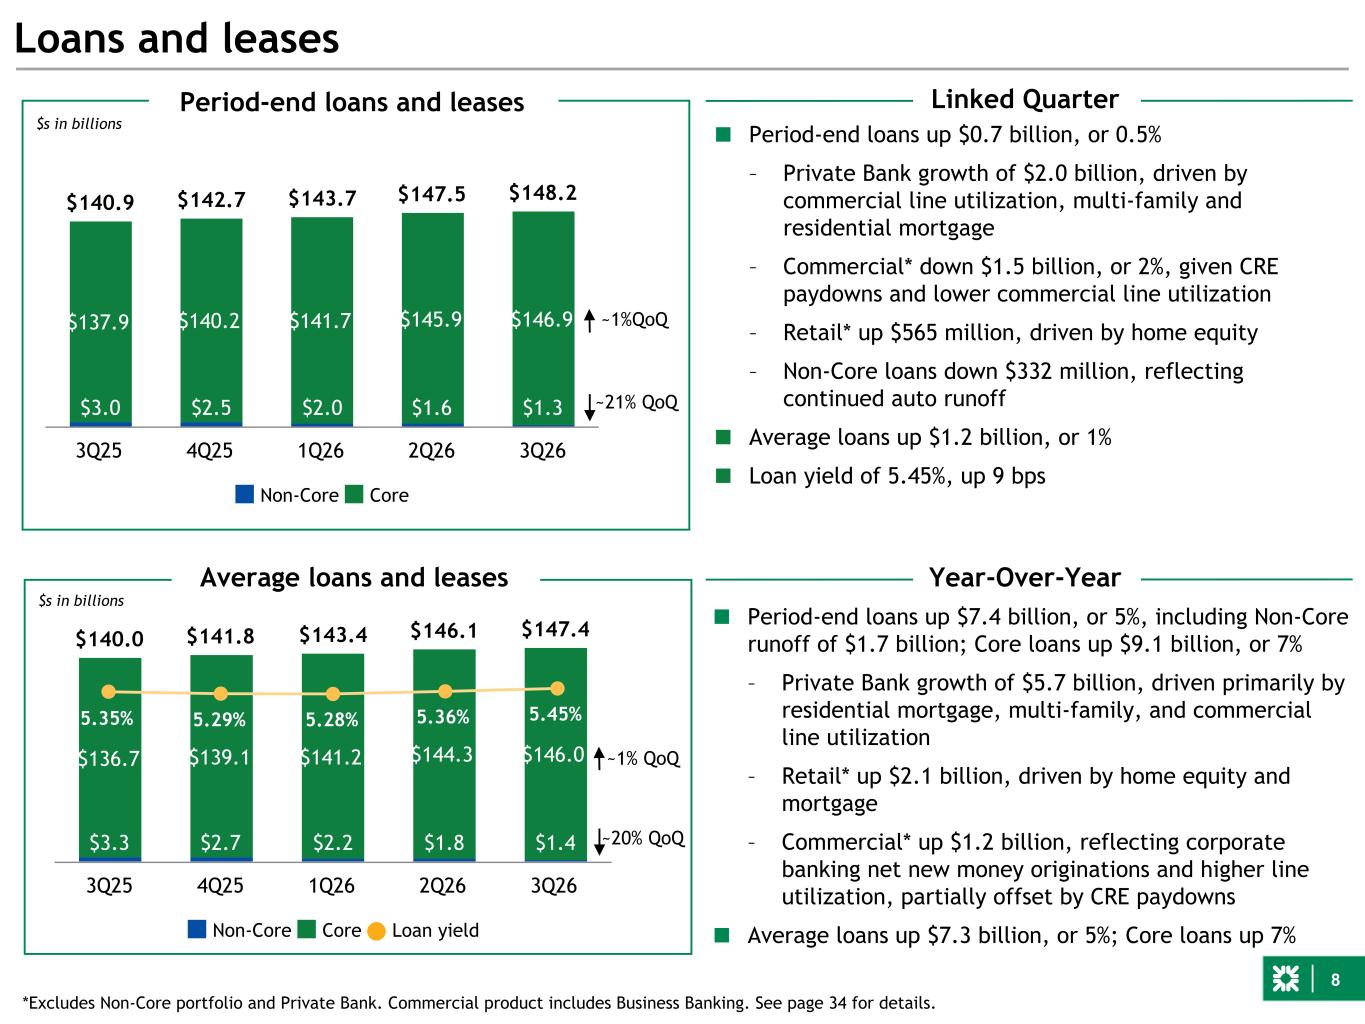
8 $140.0 $141.8 $143.4 $146.1 $147.4 $3.3 $2.7 $2.2 $1.8 $1.4 $136.7 $139.1 $141.2 $144.3 $146.0 Non-Core Core Loan yield 3Q25 4Q25 1Q26 2Q26 3Q26 ~20% QoQ ■ Period-end loans up $0.7 billion, or 0.5% – Private Bank growth of $2.0 billion, driven by commercial line utilization, multi-family and residential mortgage – Commercial* down $1.5 billion, or 2%, given CRE paydowns and lower commercial line utilization – Retail* up $565 million, driven by home equity – Non-Core loans down $332 million, reflecting continued auto runoff ■ Average loans up $1.2 billion, or 1% ■ Loan yield of 5.45%, up 9 bps Loans and leases $s in billions Average loans and leases $140.9 $142.7 $143.7 $147.5 $148.2 $3.0 $2.5 $2.0 $1.6 $1.3 $137.9 $140.2 $141.7 $145.9 $146.9 Non-Core Core 3Q25 4Q25 1Q26 2Q26 3Q26 $s in billions Period-end loans and leases 5.35% 5.29% 5.28% 5.36% 5.45% Linked Quarter Year-Over-Year ~21% QoQ ~1%QoQ ~1% QoQ *Excludes Non-Core portfolio and Private Bank. Commercial product includes Business Banking. See page 34 for details. ■ Period-end loans up $7.4 billion, or 5%, including Non-Core runoff of $1.7 billion; Core loans up $9.1 billion, or 7% – Private Bank growth of $5.7 billion, driven primarily by residential mortgage, multi-family, and commercial line utilization – Retail* up $2.1 billion, driven by home equity and mortgage – Commercial* up $1.2 billion, reflecting corporate banking net new money originations and higher line utilization, partially offset by CRE paydowns ■ Average loans up $7.3 billion, or 5%; Core loans up 7%
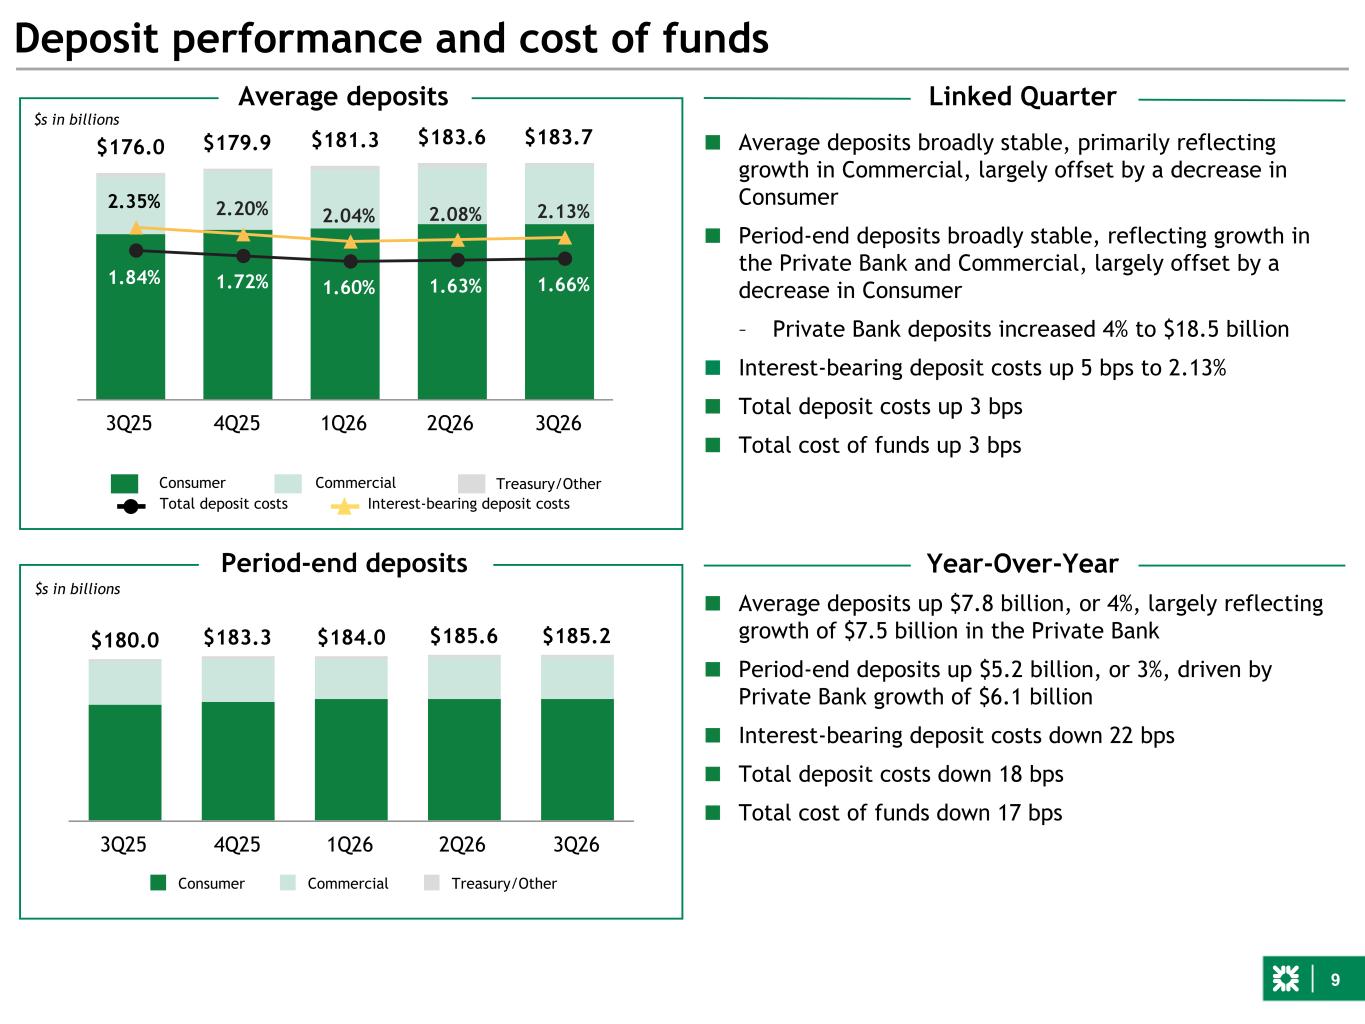
9 $176.0 $179.9 $181.3 $183.6 $183.7 3Q25 4Q25 1Q26 2Q26 3Q26 Deposit performance and cost of funds $s in billions Average deposits 1.84% 1.72% 1.60% 1.63% 1.66% 2.35% 2.20% 2.04% 2.08% 2.13% Total deposit costs Interest-bearing deposit costs CommercialConsumer Treasury/Other Year-Over-YearPeriod-end deposits Linked Quarter ■ Average deposits broadly stable, primarily reflecting growth in Commercial, largely offset by a decrease in Consumer ■ Period-end deposits broadly stable, reflecting growth in the Private Bank and Commercial, largely offset by a decrease in Consumer – Private Bank deposits increased 4% to $18.5 billion ■ Interest-bearing deposit costs up 5 bps to 2.13% ■ Total deposit costs up 3 bps ■ Total cost of funds up 3 bps $s in billions ■ Average deposits up $7.8 billion, or 4%, largely reflecting growth of $7.5 billion in the Private Bank ■ Period-end deposits up $5.2 billion, or 3%, driven by Private Bank growth of $6.1 billion ■ Interest-bearing deposit costs down 22 bps ■ Total deposit costs down 18 bps ■ Total cost of funds down 17 bps $180.0 $183.3 $184.0 $185.6 $185.2 Consumer Commercial Treasury/Other 3Q25 4Q25 1Q26 2Q26 3Q26
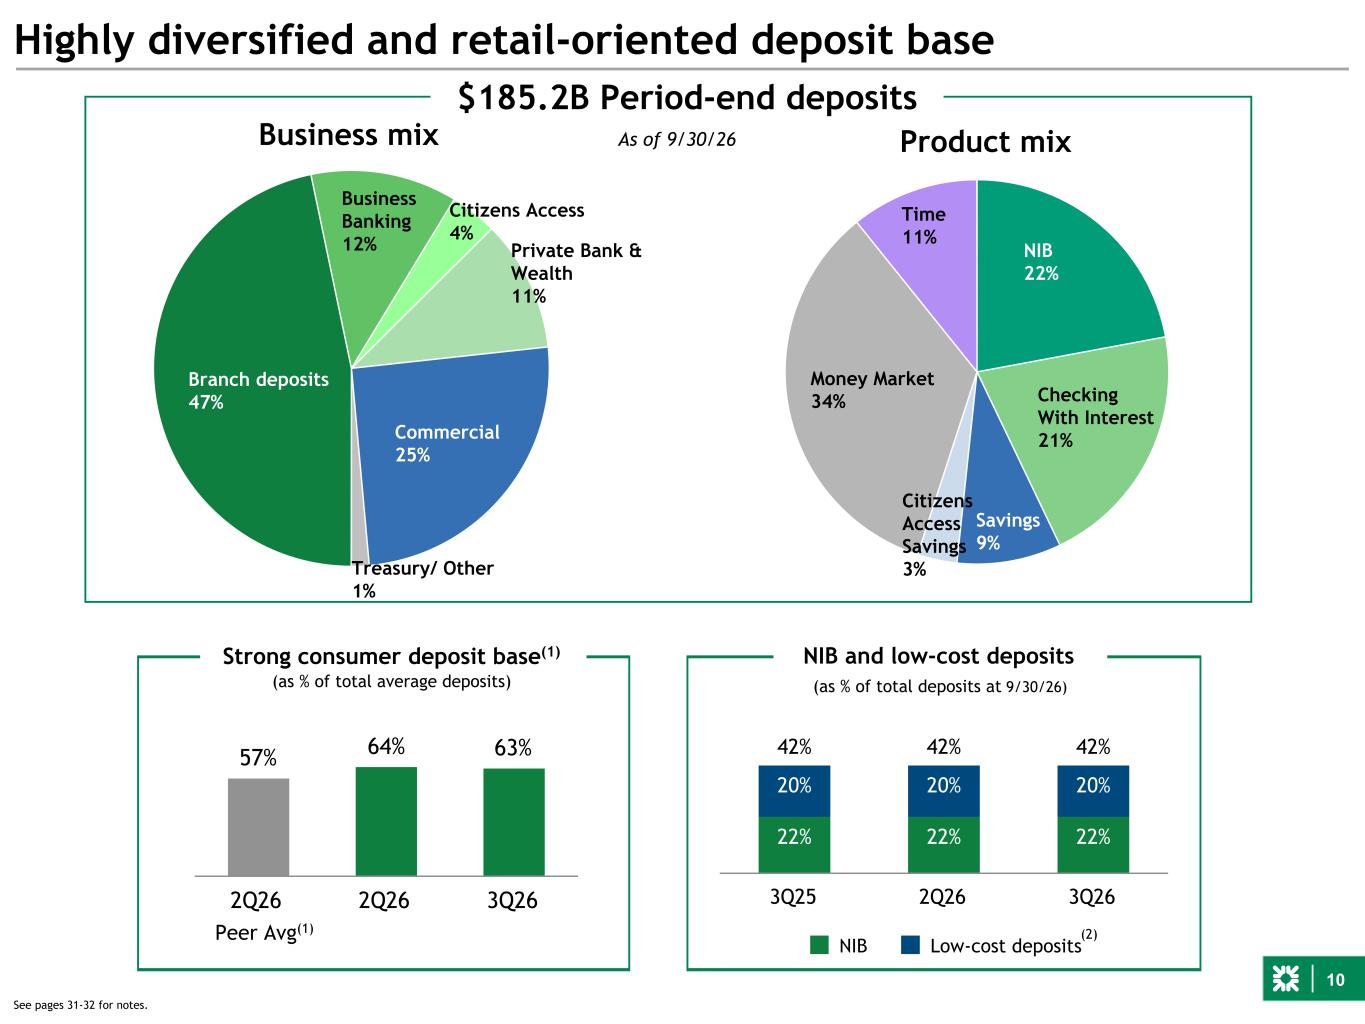
10 Branch deposits 47% Business Banking 12% Citizens Access 4% Private Bank & Wealth 11% Commercial 25% Treasury/ Other 1% As of 9/30/26 Highly diversified and retail-oriented deposit base $185.2B Period-end deposits Peer Avg(1) Business mix Product mix Strong consumer deposit base(1) (as % of total average deposits) 42% 42% 42% 22% 22% 22% 20% 20% 20% NIB Low-cost deposits 3Q25 2Q26 3Q26 NIB and low-cost deposits (2) 57% 64% 63% 2Q26 2Q26 3Q26 See pages 31-32 for notes. NIB 22% Checking With Interest 21% Savings 9% Citizens Access Savings 3% Money Market 34% Time 11% (as % of total deposits at 9/30/26)
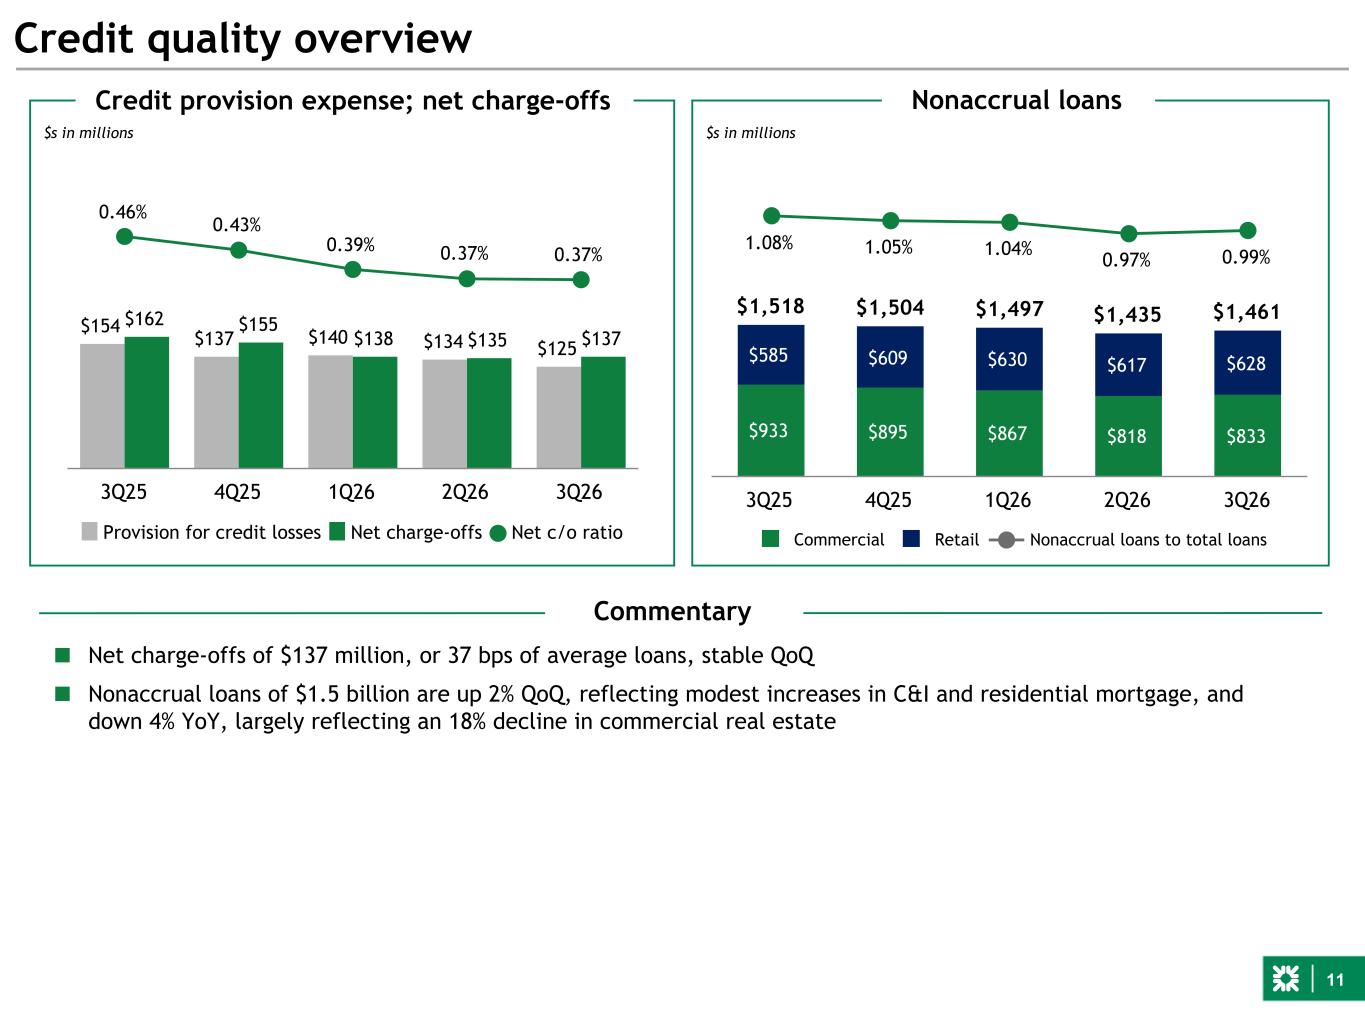
11 $1,518 $1,504 $1,497 $1,435 $1,461 $933 $895 $867 $818 $833 $585 $609 $630 $617 $628 Commercial Retail Nonaccrual loans to total loans 3Q25 4Q25 1Q26 2Q26 3Q26 $154 $137 $140 $134 $125 $162 $155 $138 $135 $137 0.46% 0.43% 0.39% 0.37% 0.37% Provision for credit losses Net charge-offs Net c/o ratio 3Q25 4Q25 1Q26 2Q26 3Q26 Credit quality overview $s in millions $s in millions Credit provision expense; net charge-offs Nonaccrual loans Commentary ■ Net charge-offs of $137 million, or 37 bps of average loans, stable QoQ ■ Nonaccrual loans of $1.5 billion are up 2% QoQ, reflecting modest increases in C&I and residential mortgage, and down 4% YoY, largely reflecting an 18% decline in commercial real estate 1.08% 1.05% 1.04% 0.97% 0.99%
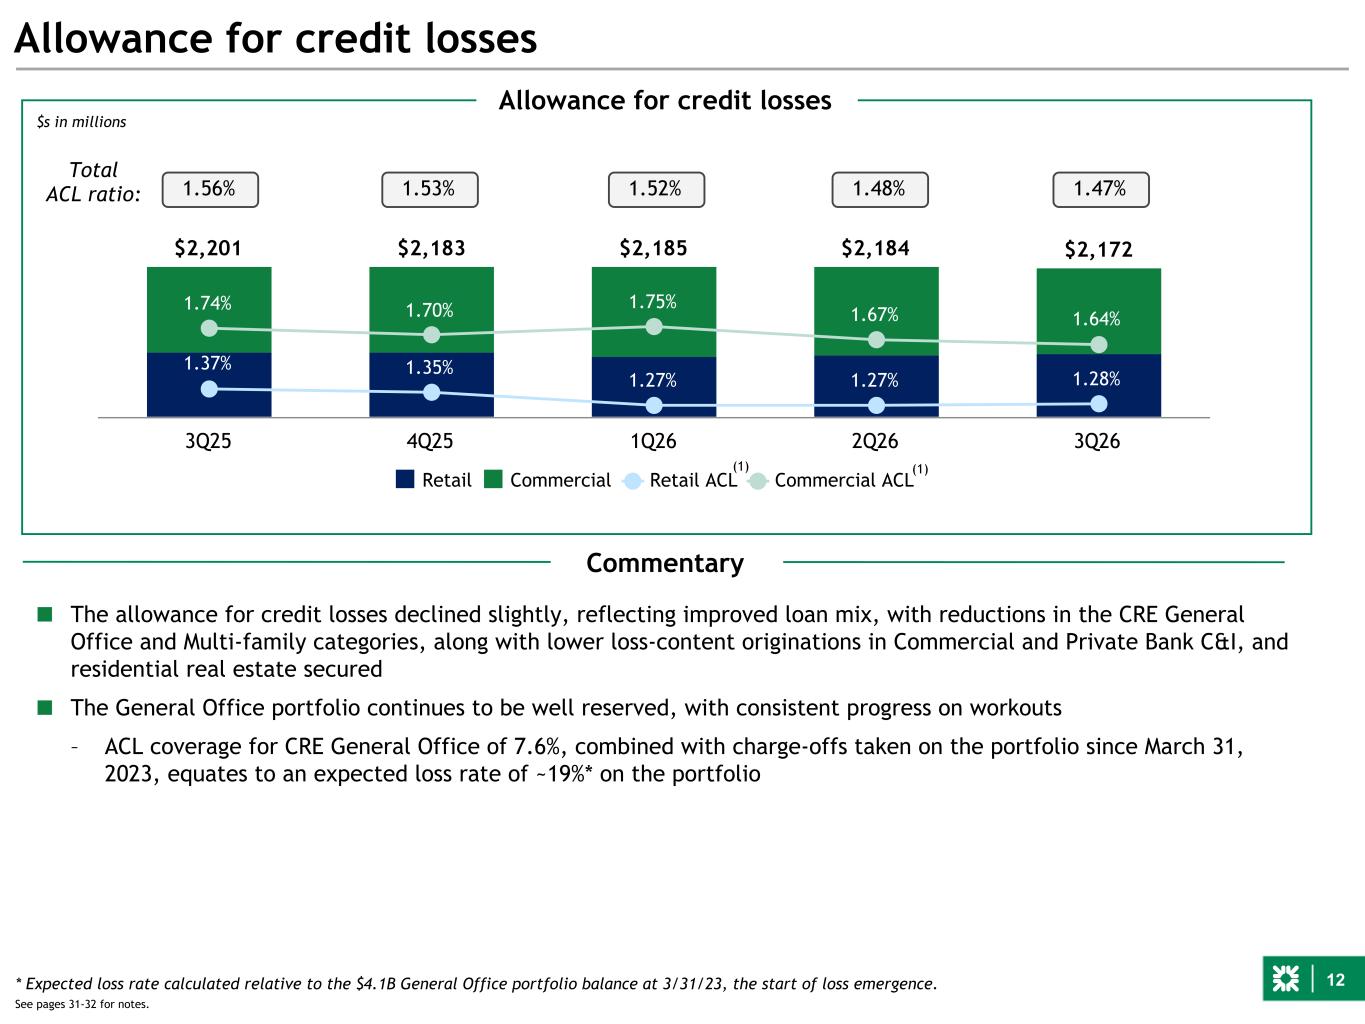
12 ■ The allowance for credit losses declined slightly, reflecting improved loan mix, with reductions in the CRE General Office and Multi-family categories, along with lower loss-content originations in Commercial and Private Bank C&I, and residential real estate secured ■ The General Office portfolio continues to be well reserved, with consistent progress on workouts – ACL coverage for CRE General Office of 7.6%, combined with charge-offs taken on the portfolio since March 31, 2023, equates to an expected loss rate of ~19%* on the portfolio Allowance for credit losses $2,201 $2,183 $2,185 $2,184 $2,172 1.37% 1.35% 1.27% 1.27% 1.28% 1.74% 1.70% 1.75% 1.67% 1.64% Retail Commercial Retail ACL Commercial ACL 3Q25 4Q25 1Q26 2Q26 3Q26 $s in millions Allowance for credit losses (1) * Expected loss rate calculated relative to the $4.1B General Office portfolio balance at 3/31/23, the start of loss emergence. Commentary 1.56% 1.53% 1.52% 1.48% 1.47% Total ACL ratio: See pages 31-32 for notes. (1)
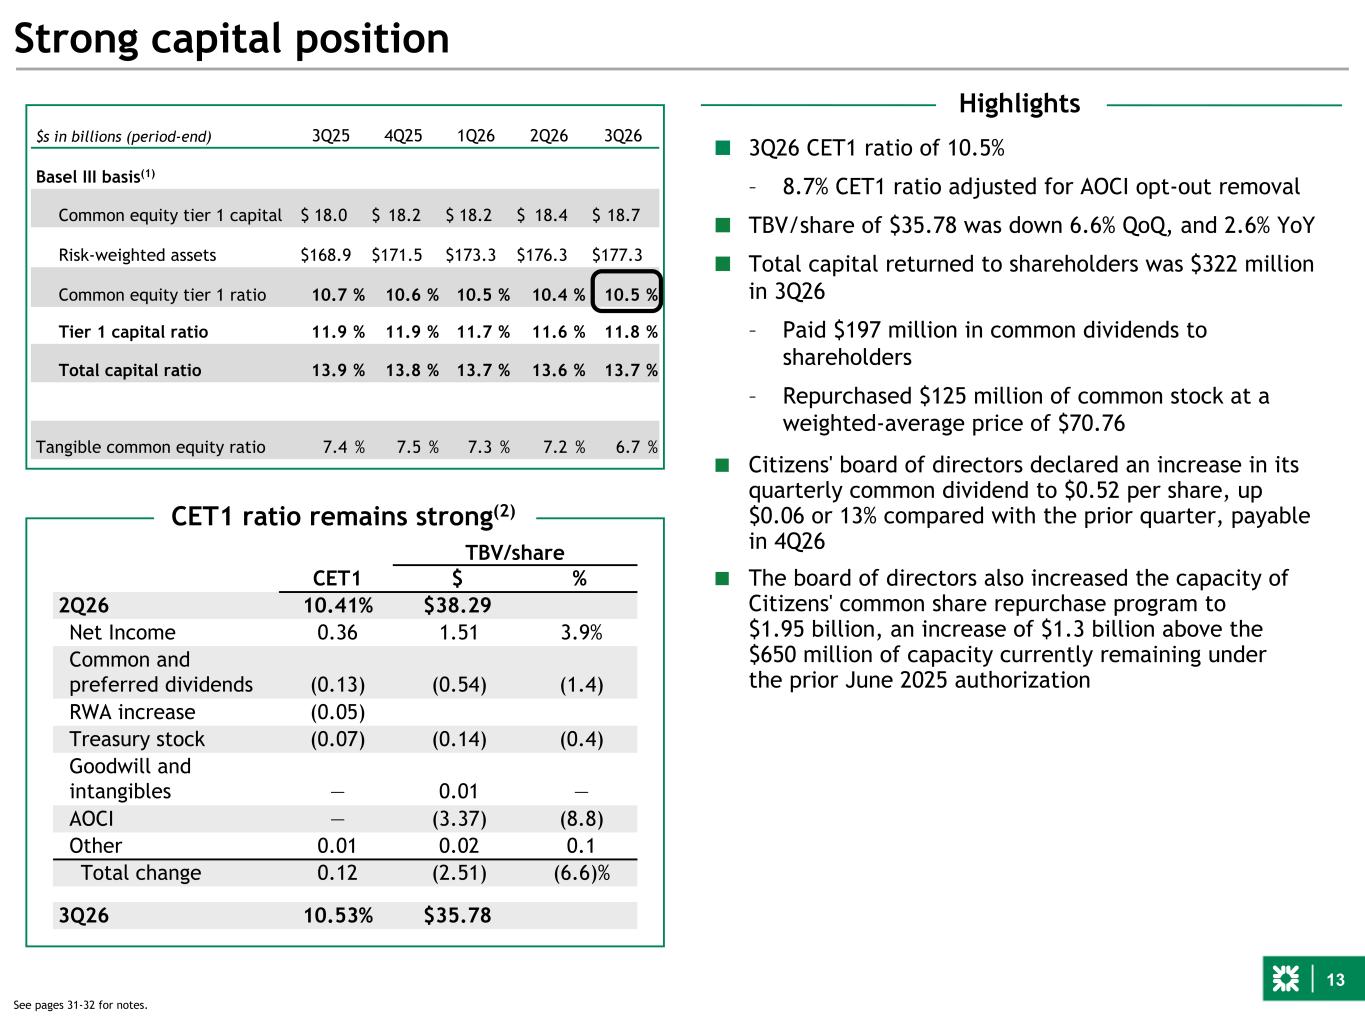
13 Strong capital position $s in billions (period-end) 3Q25 4Q25 1Q26 2Q26 3Q26 Basel III basis(1) Common equity tier 1 capital $ 18.0 $ 18.2 $ 18.2 $ 18.4 $ 18.7 Risk-weighted assets $ 168.9 $ 171.5 $ 173.3 $ 176.3 $ 177.3 Common equity tier 1 ratio 10.7 % 10.6 % 10.5 % 10.4 % 10.5 % Tier 1 capital ratio 11.9 % 11.9 % 11.7 % 11.6 % 11.8 % Total capital ratio 13.9 % 13.8 % 13.7 % 13.6 % 13.7 % Tangible common equity ratio 7.4 % 7.5 % 7.3 % 7.2 % 6.7 % TBV/share CET1 $ % 2Q26 10.41% $38.29 Net Income 0.36 1.51 3.9% Common and preferred dividends (0.13) (0.54) (1.4) RWA increase (0.05) Treasury stock (0.07) (0.14) (0.4) Goodwill and intangibles — 0.01 — AOCI — (3.37) (8.8) Other 0.01 0.02 0.1 Total change 0.12 (2.51) (6.6)% 3Q26 10.53% $35.78 CET1 ratio remains strong(2) Highlights ■ 3Q26 CET1 ratio of 10.5% – 8.7% CET1 ratio adjusted for AOCI opt-out removal ■ TBV/share of $35.78 was down 6.6% QoQ, and 2.6% YoY ■ Total capital returned to shareholders was $322 million in 3Q26 – Paid $197 million in common dividends to shareholders – Repurchased $125 million of common stock at a weighted-average price of $70.76 ■ Citizens' board of directors declared an increase in its quarterly common dividend to $0.52 per share, up $0.06 or 13% compared with the prior quarter, payable in 4Q26 ■ The board of directors also increased the capacity of Citizens' common share repurchase program to $1.95 billion, an increase of $1.3 billion above the $650 million of capacity currently remaining under the prior June 2025 authorization See pages 31-32 for notes.
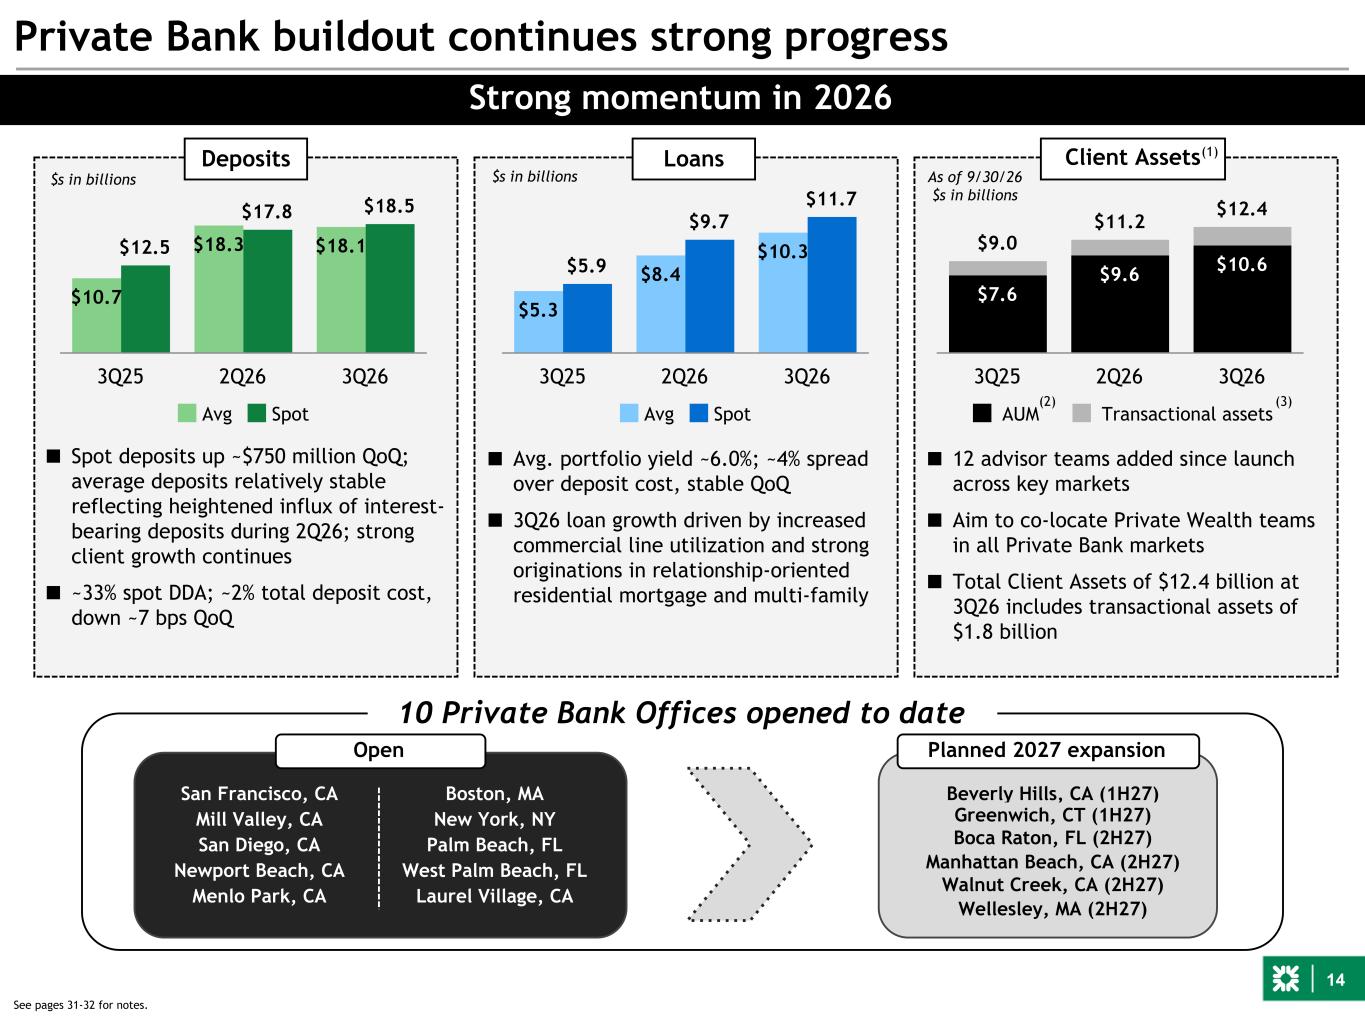
14 ■ Spot deposits up ~$750 million QoQ; average deposits relatively stable reflecting heightened influx of interest- bearing deposits during 2Q26; strong client growth continues ■ ~33% spot DDA; ~2% total deposit cost, down ~7 bps QoQ Deposits $5.3 $8.4 $10.3 $5.9 $9.7 $11.7 Avg Spot 3Q25 2Q26 3Q26 $10.7 $18.3 $18.1$12.5 $17.8 $18.5 Avg Spot 3Q25 2Q26 3Q26 Loans Private Bank buildout continues strong progress Strong momentum in 2026 $s in billions $9.0 $11.2 $12.4 $7.6 $9.6 $10.6 AUM Transactional assets 3Q25 2Q26 3Q26 As of 9/30/26 $s in billions Client Assets ■ Avg. portfolio yield ~6.0%; ~4% spread over deposit cost, stable QoQ ■ 3Q26 loan growth driven by increased commercial line utilization and strong originations in relationship-oriented residential mortgage and multi-family (2) (1) (3) 10 Private Bank Offices opened to date $s in billions ■ 12 advisor teams added since launch across key markets ■ Aim to co-locate Private Wealth teams in all Private Bank markets ■ Total Client Assets of $12.4 billion at 3Q26 includes transactional assets of $1.8 billion See pages 31-32 for notes. Open Planned 2027 expansion San Francisco, CA Boston, MA Mill Valley, CA New York, NY San Diego, CA Palm Beach, FL Newport Beach, CA West Palm Beach, FL Menlo Park, CA Laurel Village, CA Beverly Hills, CA (1H27) Greenwich, CT (1H27) Boca Raton, FL (2H27) Manhattan Beach, CA (2H27) Walnut Creek, CA (2H27) Wellesley, MA (2H27)
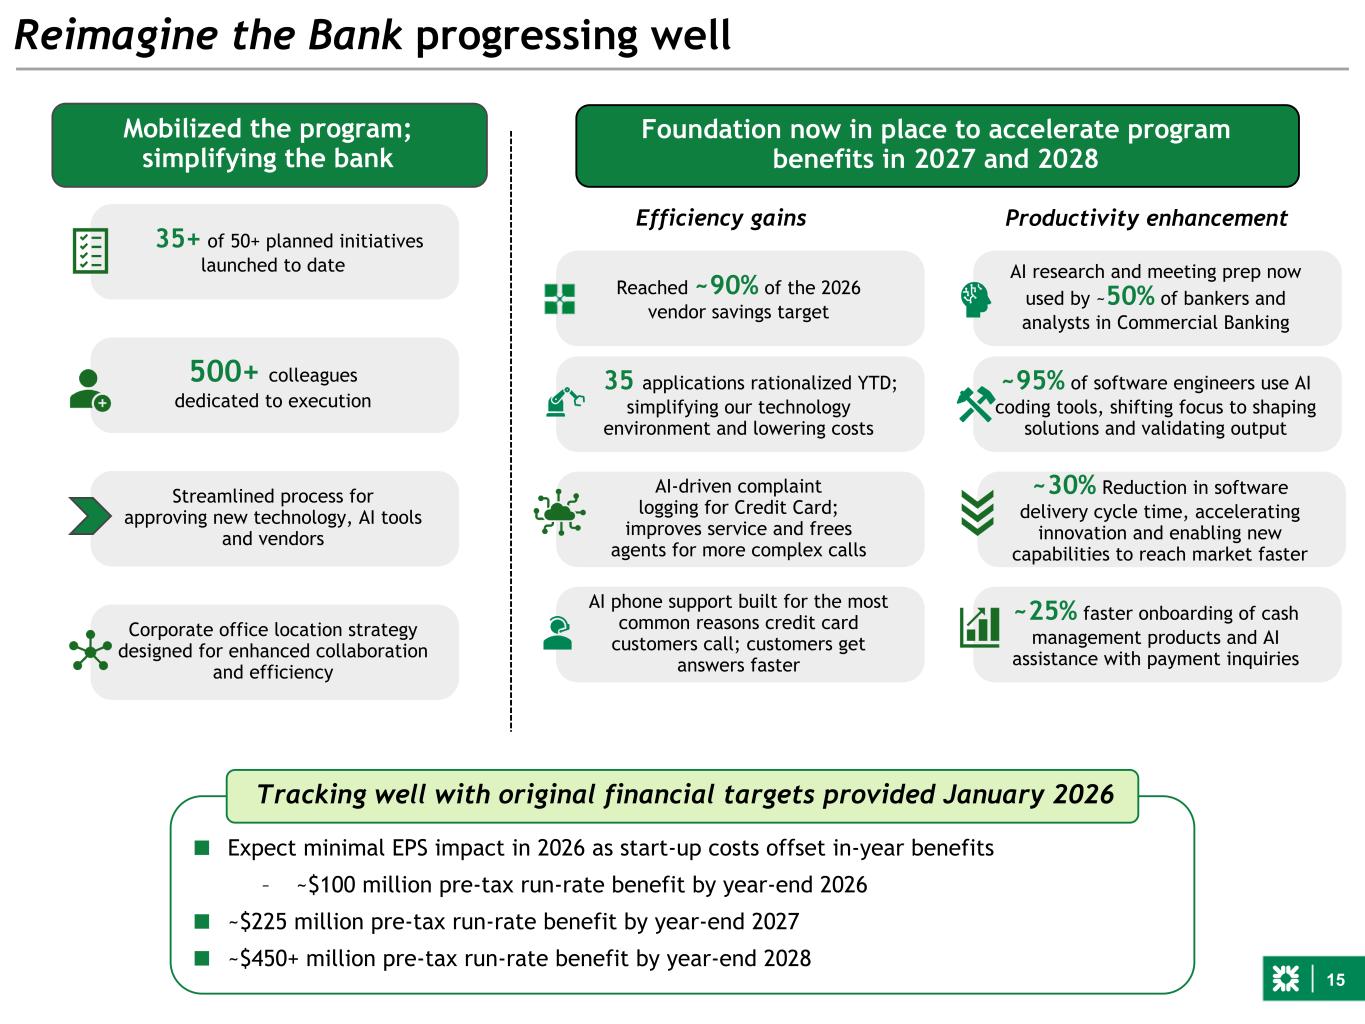
15 Reimagine the Bank progressing well Mobilized the program; simplifying the bank Foundation now in place to accelerate program benefits in 2027 and 2028 35+ of 50+ planned initiatives launched to date 500+ colleagues dedicated to execution Corporate office location strategy designed for enhanced collaboration and efficiency Streamlined process for approving new technology, AI tools and vendors AI research and meeting prep now used by ~50% of bankers and analysts in Commercial Banking AI phone support built for the most common reasons credit card customers call; customers get answers faster ~95% of software engineers use AI coding tools, shifting focus to shaping solutions and validating output AI-driven complaint logging for Credit Card; improves service and frees agents for more complex calls Reached ~90% of the 2026 vendor savings target ~25% faster onboarding of cash management products and AI assistance with payment inquiries ■ Expect minimal EPS impact in 2026 as start-up costs offset in-year benefits – ~$100 million pre-tax run-rate benefit by year-end 2026 ■ ~$225 million pre-tax run-rate benefit by year-end 2027 ■ ~$450+ million pre-tax run-rate benefit by year-end 2028 Tracking well with original financial targets provided January 2026 35 applications rationalized YTD; simplifying our technology environment and lowering costs ~30% Reduction in software delivery cycle time, accelerating innovation and enabling new capabilities to reach market faster Efficiency gains Productivity enhancement
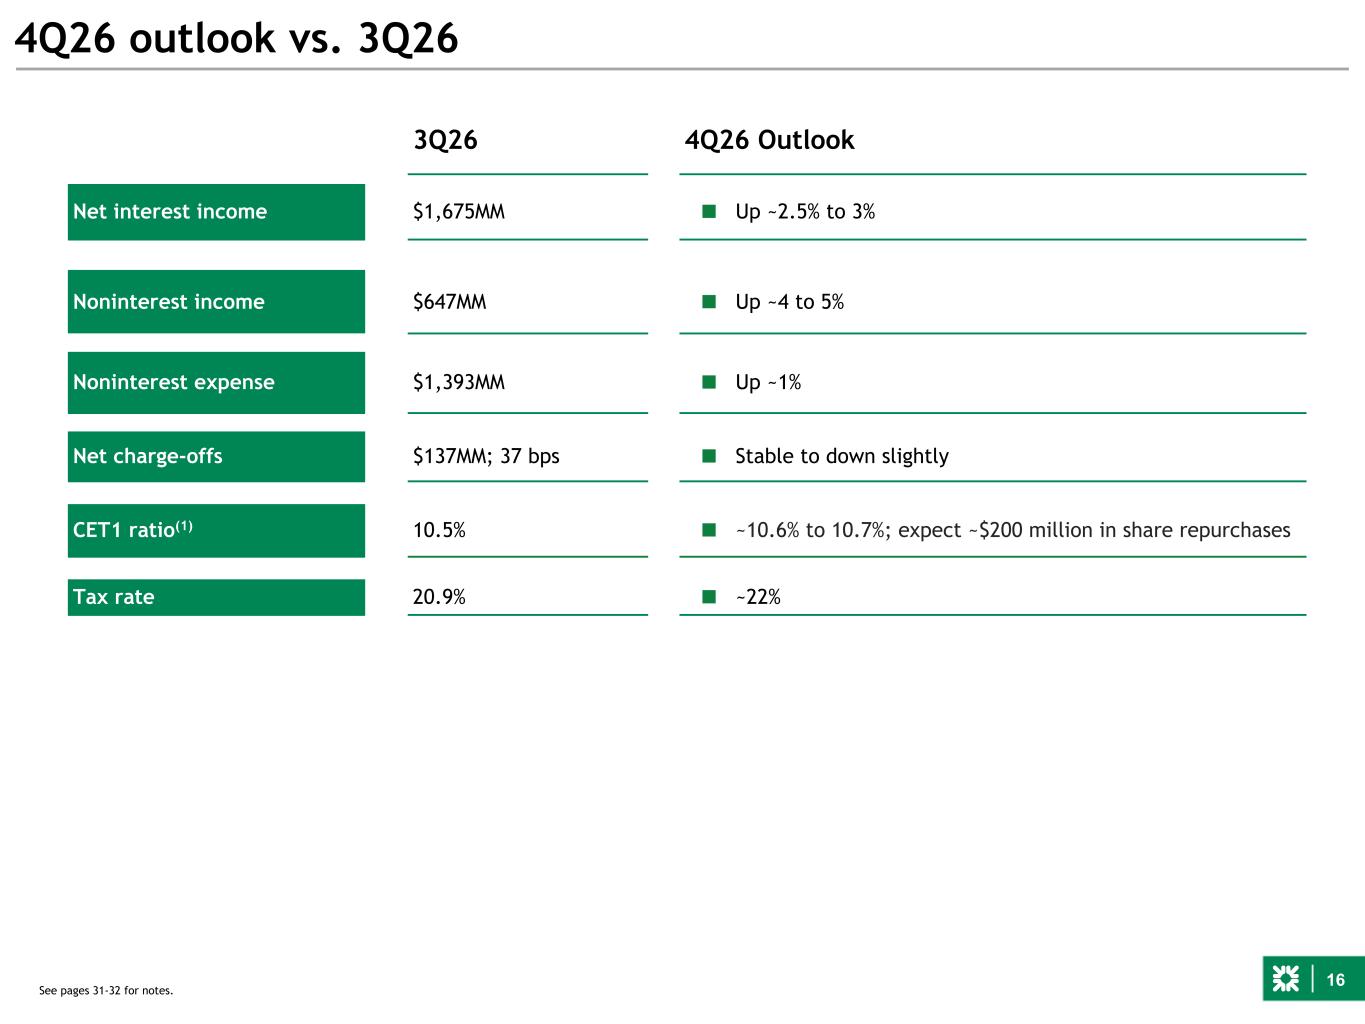
16 4Q26 outlook vs. 3Q26 3Q26 4Q26 Outlook Net interest income $1,675MM ■ Up ~2.5% to 3% Noninterest income $647MM ■ Up ~4 to 5% Noninterest expense $1,393MM ■ Up ~1% Net charge-offs $137MM; 37 bps ■ Stable to down slightly CET1 ratio(1) 10.5% ■ ~10.6% to 10.7%; expect ~$200 million in share repurchases Tax rate 20.9% ■ ~22% See pages 31-32 for notes.
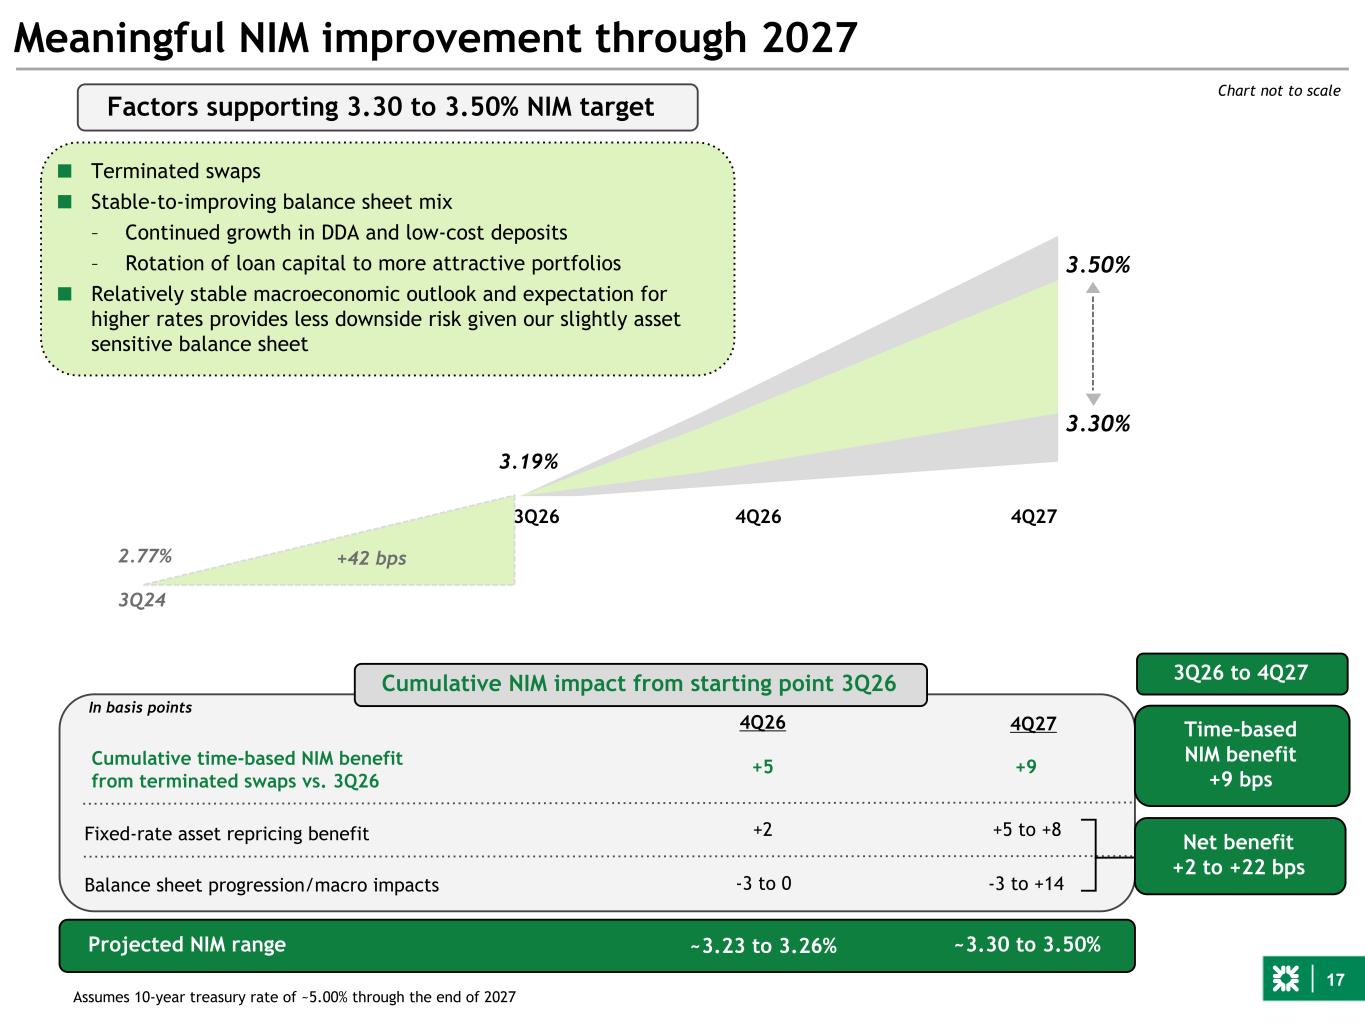
17 Meaningful NIM improvement through 2027 Balance sheet progression/macro impacts Projected NIM range Fixed-rate asset repricing benefit Cumulative time-based NIM benefit from terminated swaps vs. 3Q26 4Q26 4Q27 In basis points +5 +9 +5 to +8 -3 to +14 ~3.30 to 3.50% Chart not to scale Net benefit +2 to +22 bps 3.30% 3.50% ■ Terminated swaps ■ Stable-to-improving balance sheet mix – Continued growth in DDA and low-cost deposits – Rotation of loan capital to more attractive portfolios ■ Relatively stable macroeconomic outlook and expectation for higher rates provides less downside risk given our slightly asset sensitive balance sheet Assumes 10-year treasury rate of ~5.00% through the end of 2027 +2 Cumulative NIM impact from starting point 3Q26 3Q24 2.77% 3Q26 3.19% 4Q26 4Q27 +42 bps -3 to 0 ~3.23 to 3.26% 3Q26 to 4Q27 Factors supporting 3.30 to 3.50% NIM target Time-based NIM benefit +9 bps
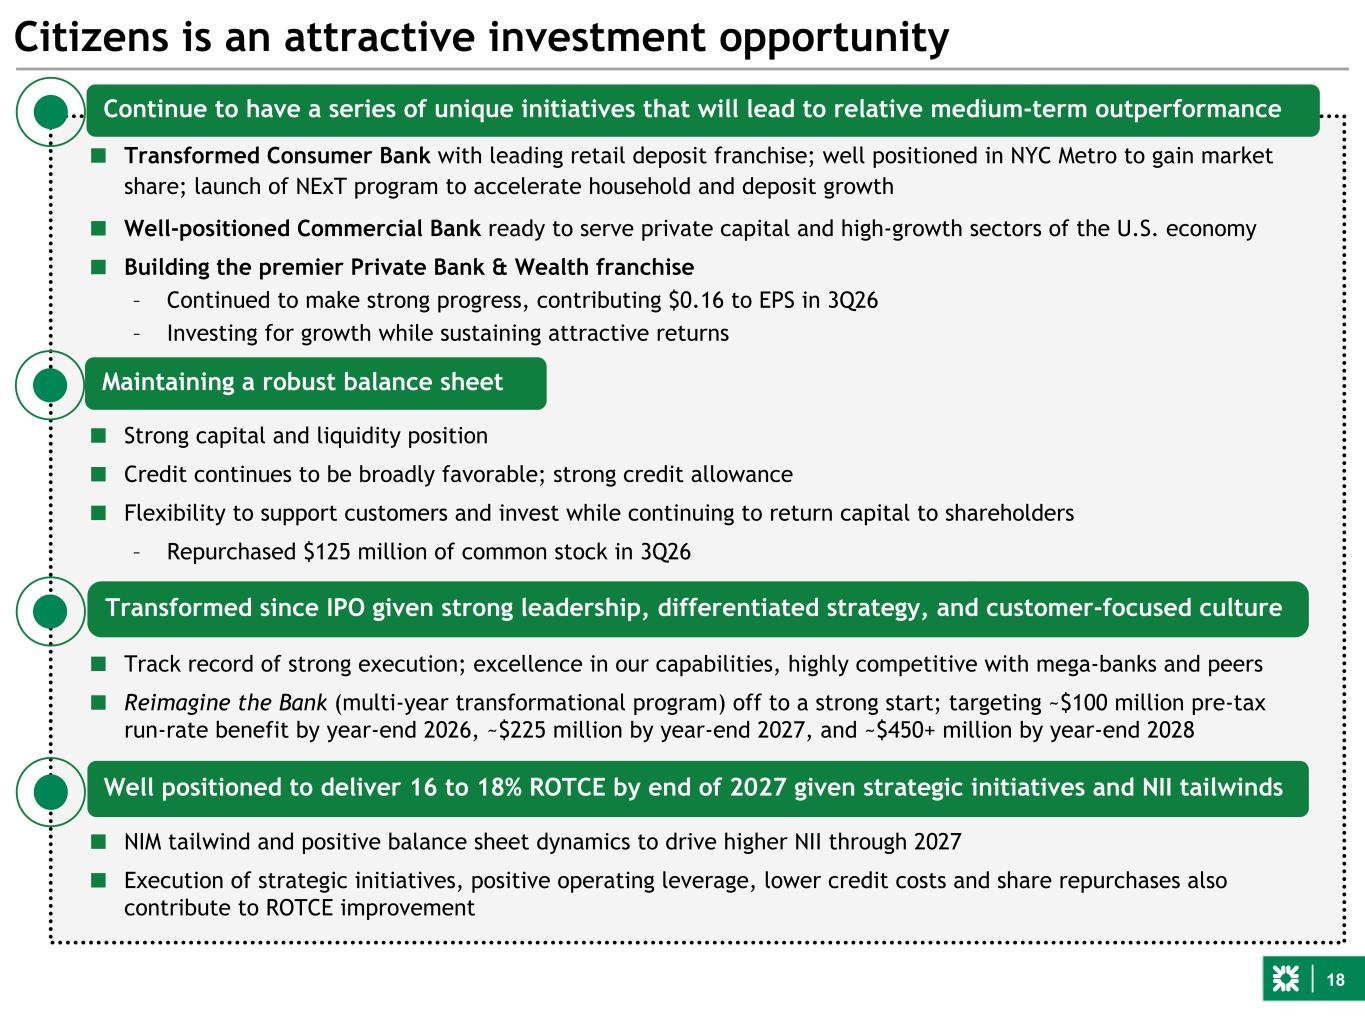
18 ■ Track record of strong execution; excellence in our capabilities, highly competitive with mega-banks and peers ■ Reimagine the Bank (multi-year transformational program) off to a strong start; targeting ~$100 million pre-tax run-rate benefit by year-end 2026, ~$225 million by year-end 2027, and ~$450+ million by year-end 2028 ■ Strong capital and liquidity position ■ Credit continues to be broadly favorable; strong credit allowance ■ Flexibility to support customers and invest while continuing to return capital to shareholders – Repurchased $125 million of common stock in 3Q26 Citizens is an attractive investment opportunity Maintaining a robust balance sheet Transformed since IPO given strong leadership, differentiated strategy, and customer-focused culture Well positioned to deliver 16 to 18% ROTCE by end of 2027 given strategic initiatives and NII tailwinds ■ Transformed Consumer Bank with leading retail deposit franchise; well positioned in NYC Metro to gain market share; launch of NExT program to accelerate household and deposit growth ■ Well-positioned Commercial Bank ready to serve private capital and high-growth sectors of the U.S. economy ■ Building the premier Private Bank & Wealth franchise – Continued to make strong progress, contributing $0.16 to EPS in 3Q26 – Investing for growth while sustaining attractive returns ■ NIM tailwind and positive balance sheet dynamics to drive higher NII through 2027 ■ Execution of strategic initiatives, positive operating leverage, lower credit costs and share repurchases also contribute to ROTCE improvement Continue to have a series of unique initiatives that will lead to relative medium-term outperformance
Appendix ■ Key performance metrics ■ Private Bank financial performance ■ Interest rate risk management ■ AOCI Accretion ■ Non-Core portfolio ■ Preferred dividend schedule ■ Credit
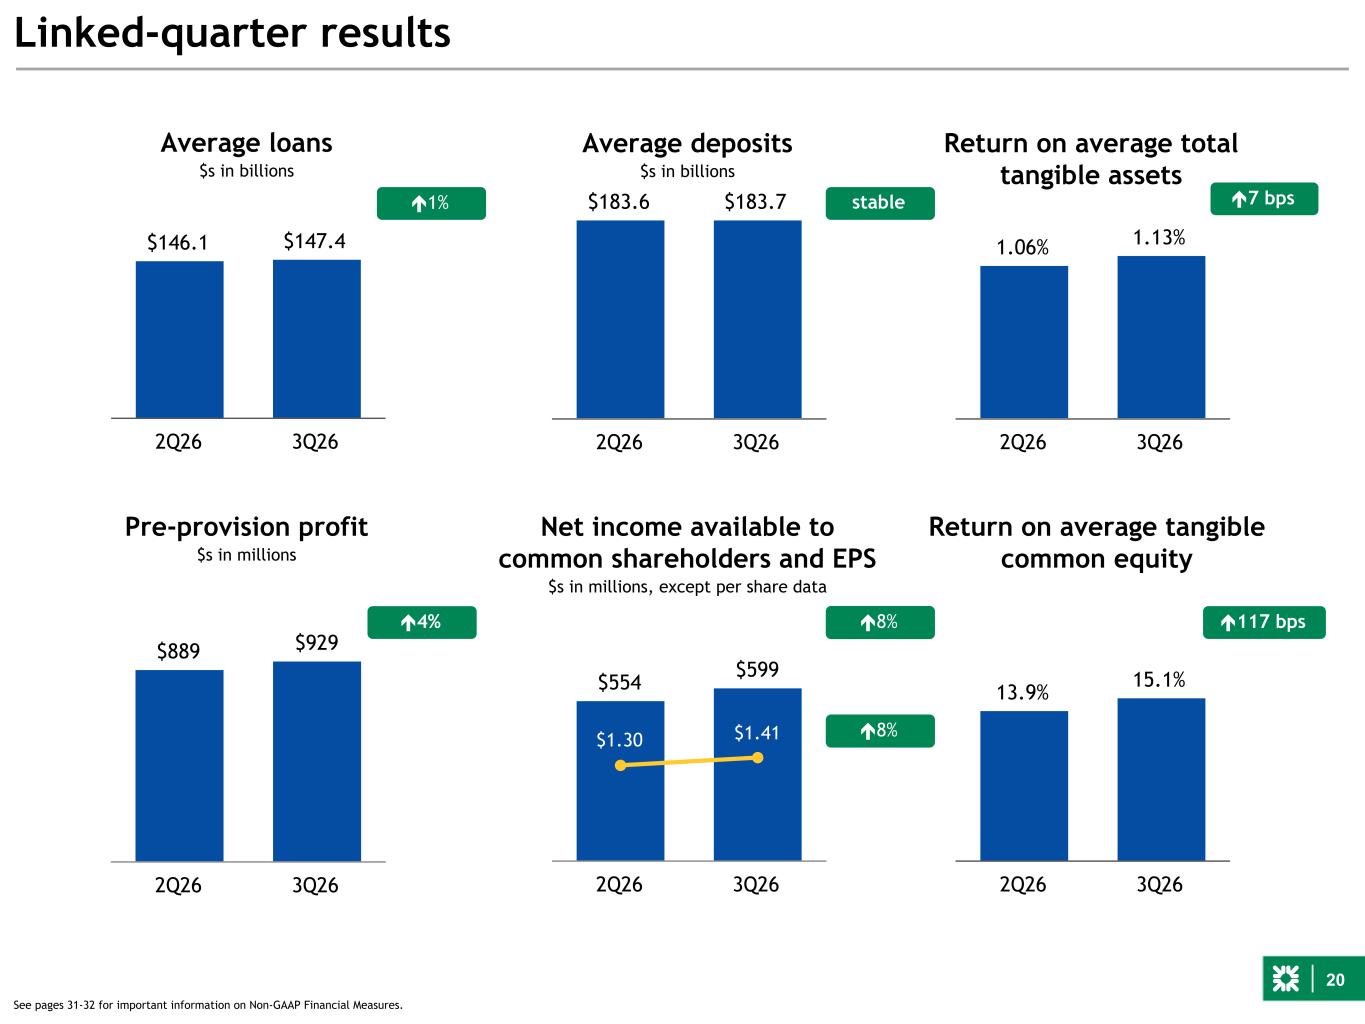
20 Net income available to common shareholders and EPS $s in millions, except per share data é4% $889 $929 2Q26 3Q26 Linked-quarter results Return on average total tangible assets Return on average tangible common equity Average loans $s in billions Average deposits $s in billions é1% $3.5 2 $3.5 6 é8% $146.1 $147.4 2Q26 3Q26 $183.6 $183.7 2Q26 3Q26 1.06% 1.13% 2Q26 3Q26 13.9% 15.1% 2Q26 3Q26 $554 $599 $1.30 $1.41 2Q26 3Q26 é8% Pre-provision profit $s in millions é117 bps é7 bpsstable Return on average tangible common equity See pages 31-32 for important information on Non-GAAP Financial Measures.
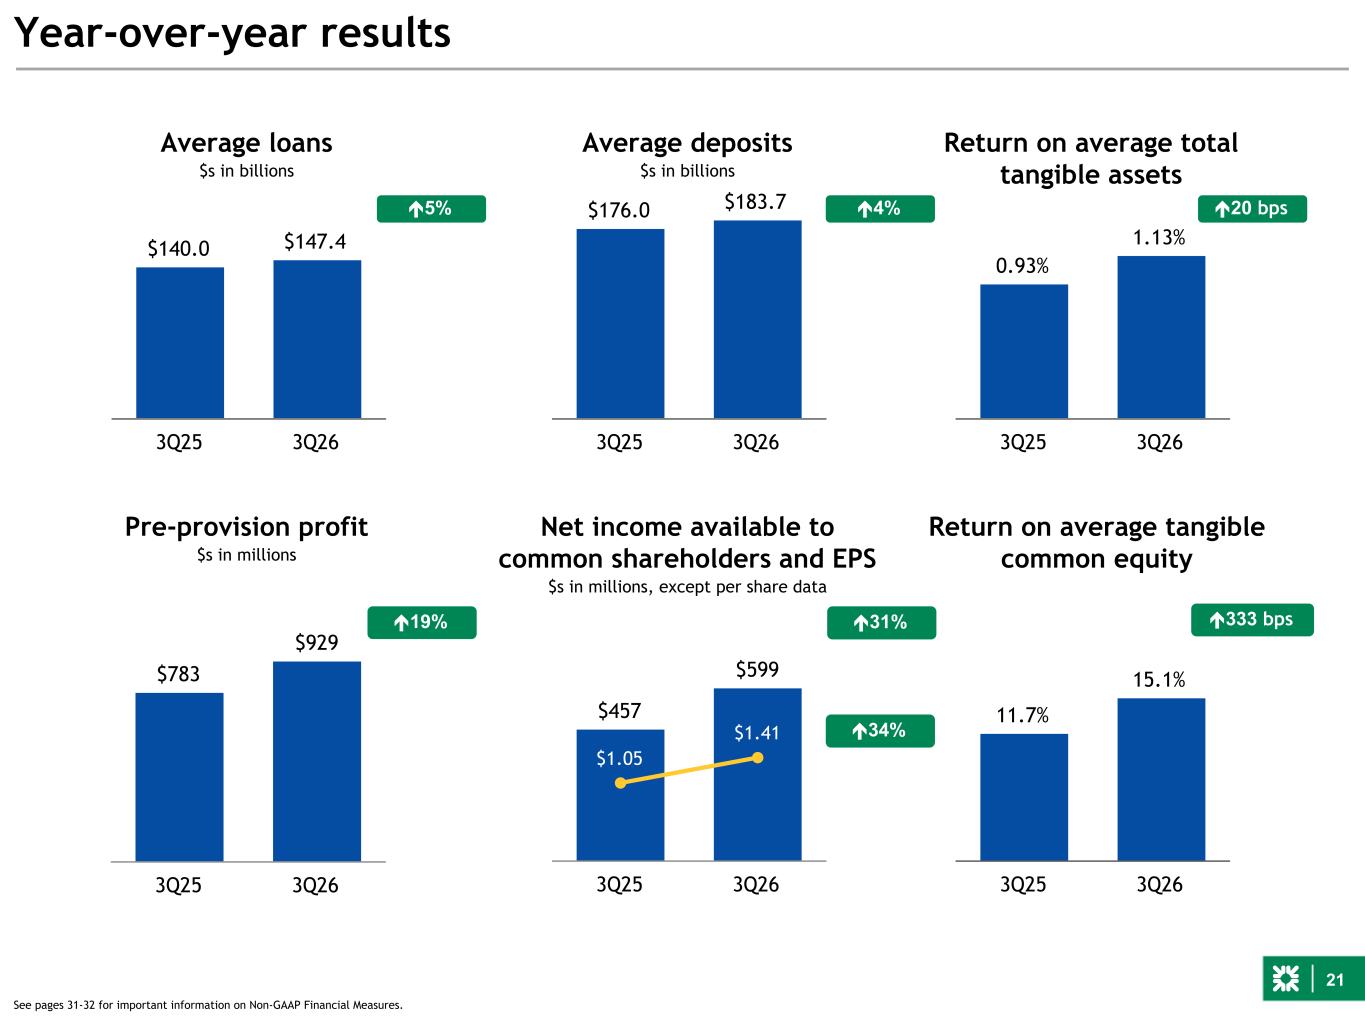
21 Net income available to common shareholders and EPS $s in millions, except per share data é19% $783 $929 3Q25 3Q26 Year-over-year results Return on average total tangible assets Return on average tangible common equity Average loans $s in billions Average deposits $s in billions é5% $3.5 2 $3.5 6 é34% $140.0 $147.4 3Q25 3Q26 $176.0 $183.7 3Q25 3Q26 0.93% 1.13% 3Q25 3Q26 11.7% 15.1% 3Q25 3Q26 $457 $599 $1.05 $1.41 3Q25 3Q26 é31% Pre-provision profit $s in millions é333 bps é20 bpsé4% See pages 31-32 for important information on Non-GAAP Financial Measures. Return on average tangible common equity
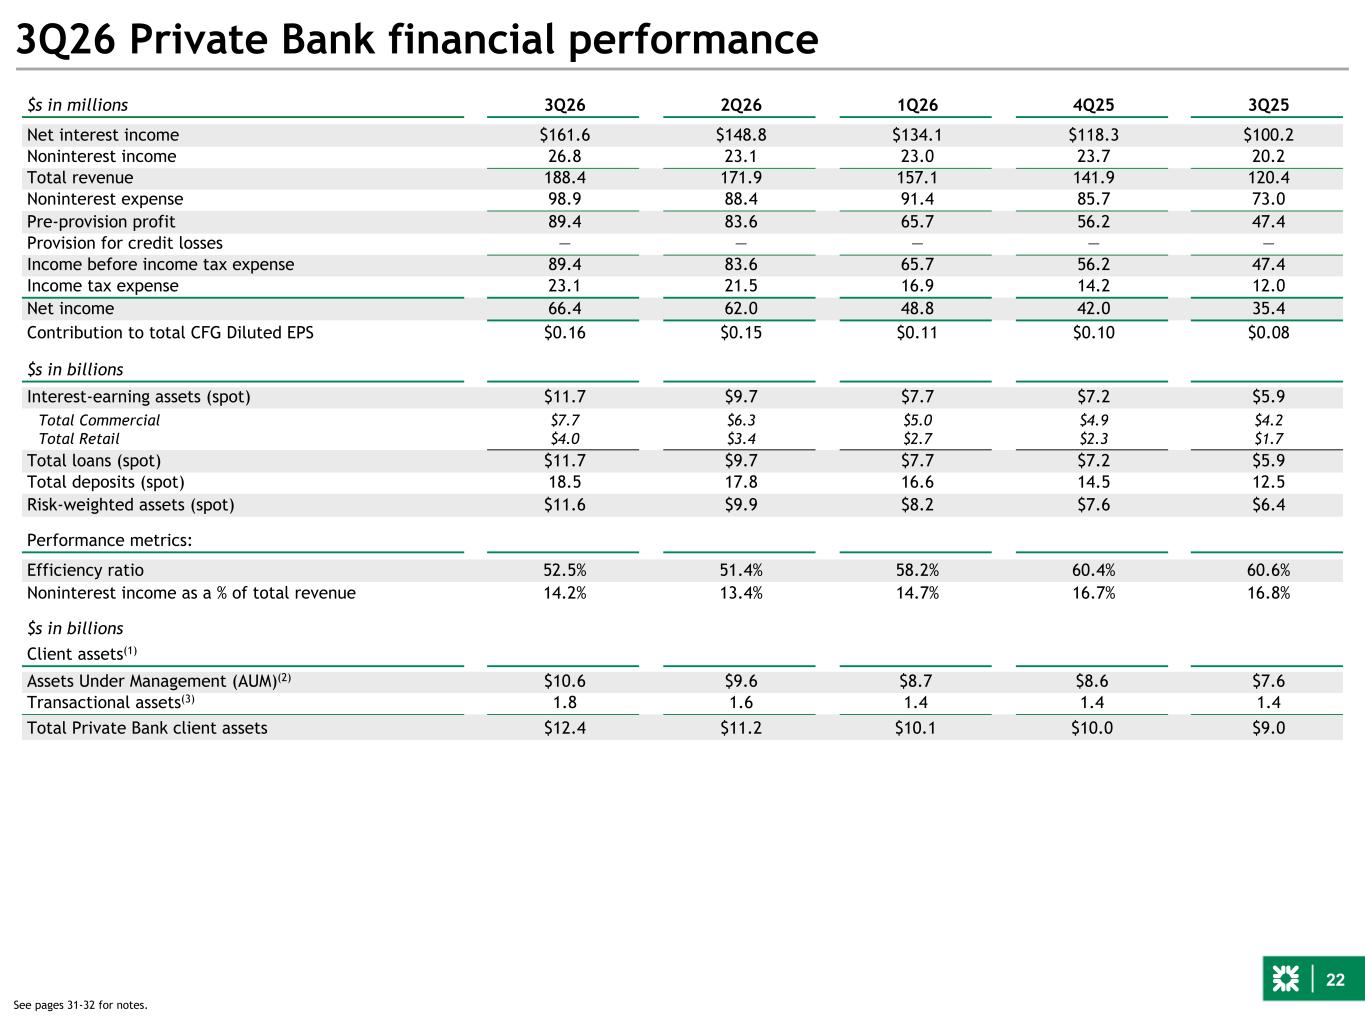
22 3Q26 Private Bank financial performance $s in millions 3Q26 2Q26 1Q26 4Q25 3Q25 Net interest income $161.6 $148.8 $134.1 $118.3 $100.2 Noninterest income 26.8 23.1 23.0 23.7 20.2 Total revenue 188.4 171.9 157.1 141.9 120.4 Noninterest expense 98.9 88.4 91.4 85.7 73.0 Pre-provision profit 89.4 83.6 65.7 56.2 47.4 Provision for credit losses — — — — — Income before income tax expense 89.4 83.6 65.7 56.2 47.4 Income tax expense 23.1 21.5 16.9 14.2 12.0 Net income 66.4 62.0 48.8 42.0 35.4 Contribution to total CFG Diluted EPS $0.16 $0.15 $0.11 $0.10 $0.08 $s in billions Interest-earning assets (spot) $11.7 $9.7 $7.7 $7.2 $5.9 Total Commercial $7.7 $6.3 $5.0 $4.9 $4.2 Total Retail $4.0 $3.4 $2.7 $2.3 $1.7 Total loans (spot) $11.7 $9.7 $7.7 $7.2 $5.9 Total deposits (spot) 18.5 17.8 16.6 14.5 12.5 Risk-weighted assets (spot) $11.6 $9.9 $8.2 $7.6 $6.4 Performance metrics: Efficiency ratio 52.5% 51.4% 58.2% 60.4% 60.6% Noninterest income as a % of total revenue 14.2% 13.4% 14.7% 16.7% 16.8% $s in billions Client assets(1) Assets Under Management (AUM)(2) $10.6 $9.6 $8.7 $8.6 $7.6 Transactional assets(3) 1.8 1.6 1.4 1.4 1.4 Total Private Bank client assets $12.4 $11.2 $10.1 $10.0 $9.0 See pages 31-32 for notes.
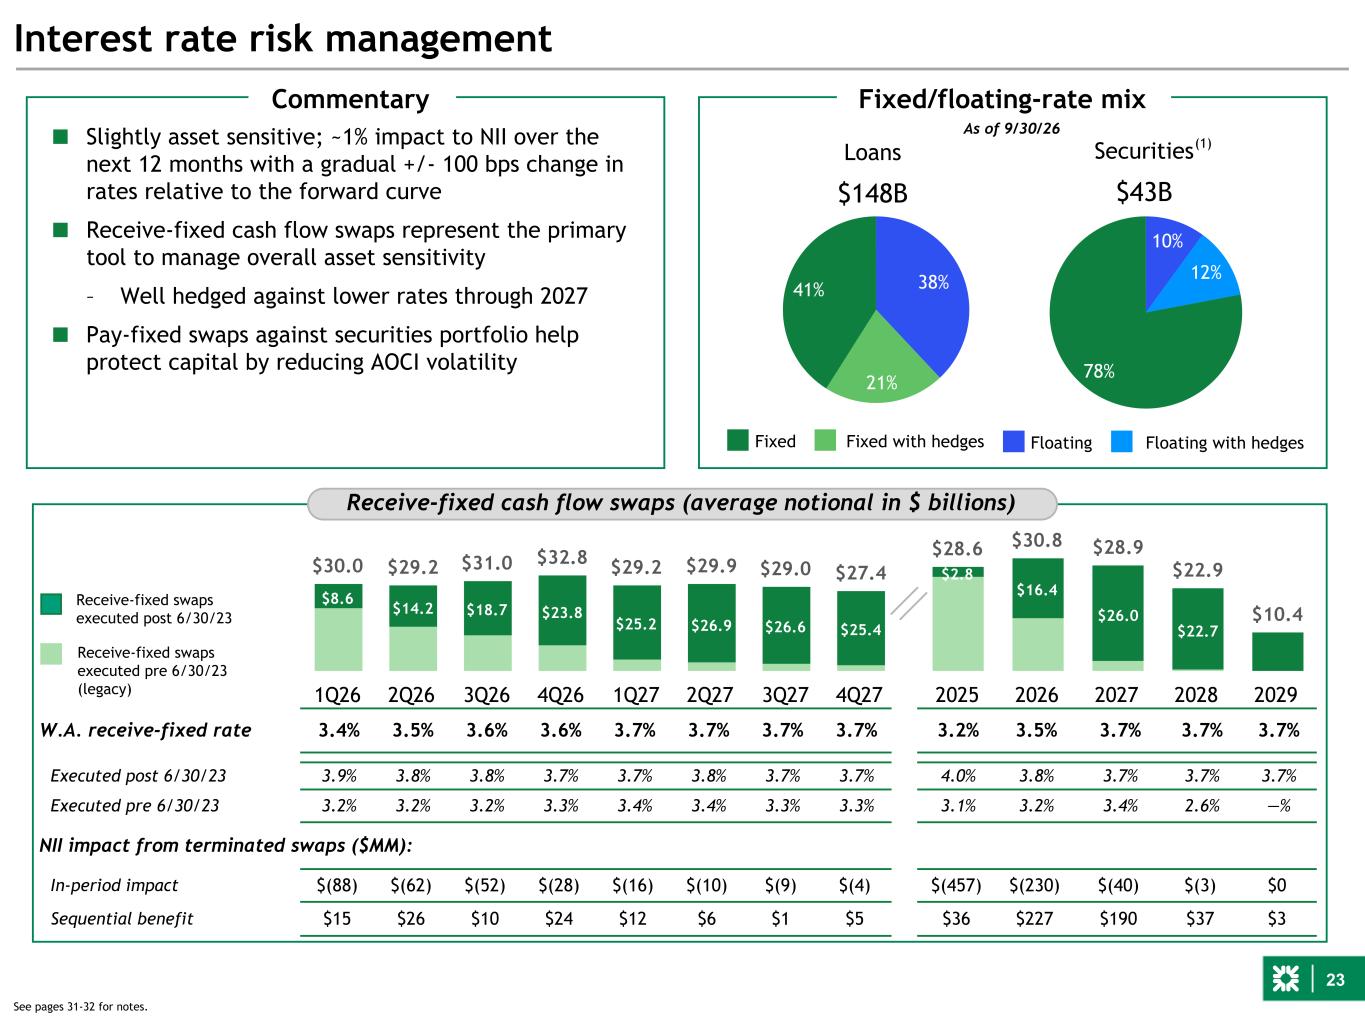
23 $30.0 $29.2 $31.0 $32.8 $29.2 $29.9 $29.0 $27.4 $8.6 $14.2 $18.7 $23.8 $25.2 $26.9 $26.6 $25.4 1Q26 2Q26 3Q26 4Q26 1Q27 2Q27 3Q27 4Q27 $28.6 $30.8 $28.9 $22.9 $10.4 $2.8 $16.4 $26.0 $22.7 2025 2026 2027 2028 2029 Interest rate risk management W.A. receive-fixed rate 3.4% 3.5% 3.6% 3.6% 3.7% 3.7% 3.7% 3.7% 3.2% 3.5% 3.7% 3.7% 3.7% Executed post 6/30/23 3.9% 3.8% 3.8% 3.7% 3.7% 3.8% 3.7% 3.7% 4.0% 3.8% 3.7% 3.7% 3.7% Executed pre 6/30/23 3.2% 3.2% 3.2% 3.3% 3.4% 3.4% 3.3% 3.3% 3.1% 3.2% 3.4% 2.6% —% NII impact from terminated swaps ($MM): In-period impact $(88) $(62) $(52) $(28) $(16) $(10) $(9) $(4) $(457) $(230) $(40) $(3) $0 Sequential benefit $15 $26 $10 $24 $12 $6 $1 $5 $36 $227 $190 $37 $3 Receive-fixed cash flow swaps (average notional in $ billions) ■ Slightly asset sensitive; ~1% impact to NII over the next 12 months with a gradual +/- 100 bps change in rates relative to the forward curve ■ Receive-fixed cash flow swaps represent the primary tool to manage overall asset sensitivity – Well hedged against lower rates through 2027 ■ Pay-fixed swaps against securities portfolio help protect capital by reducing AOCI volatility Receive-fixed swaps executed post 6/30/23 Receive-fixed swaps executed pre 6/30/23 (legacy) Fixed/floating-rate mix 10% 12% 78% Securities $43B 38% 21% 41% Loans $148B Fixed Fixed with hedges Floating Floating with hedges Commentary 15% 15% 70% As of 9/30/26 (1) See pages 31-32 for notes.
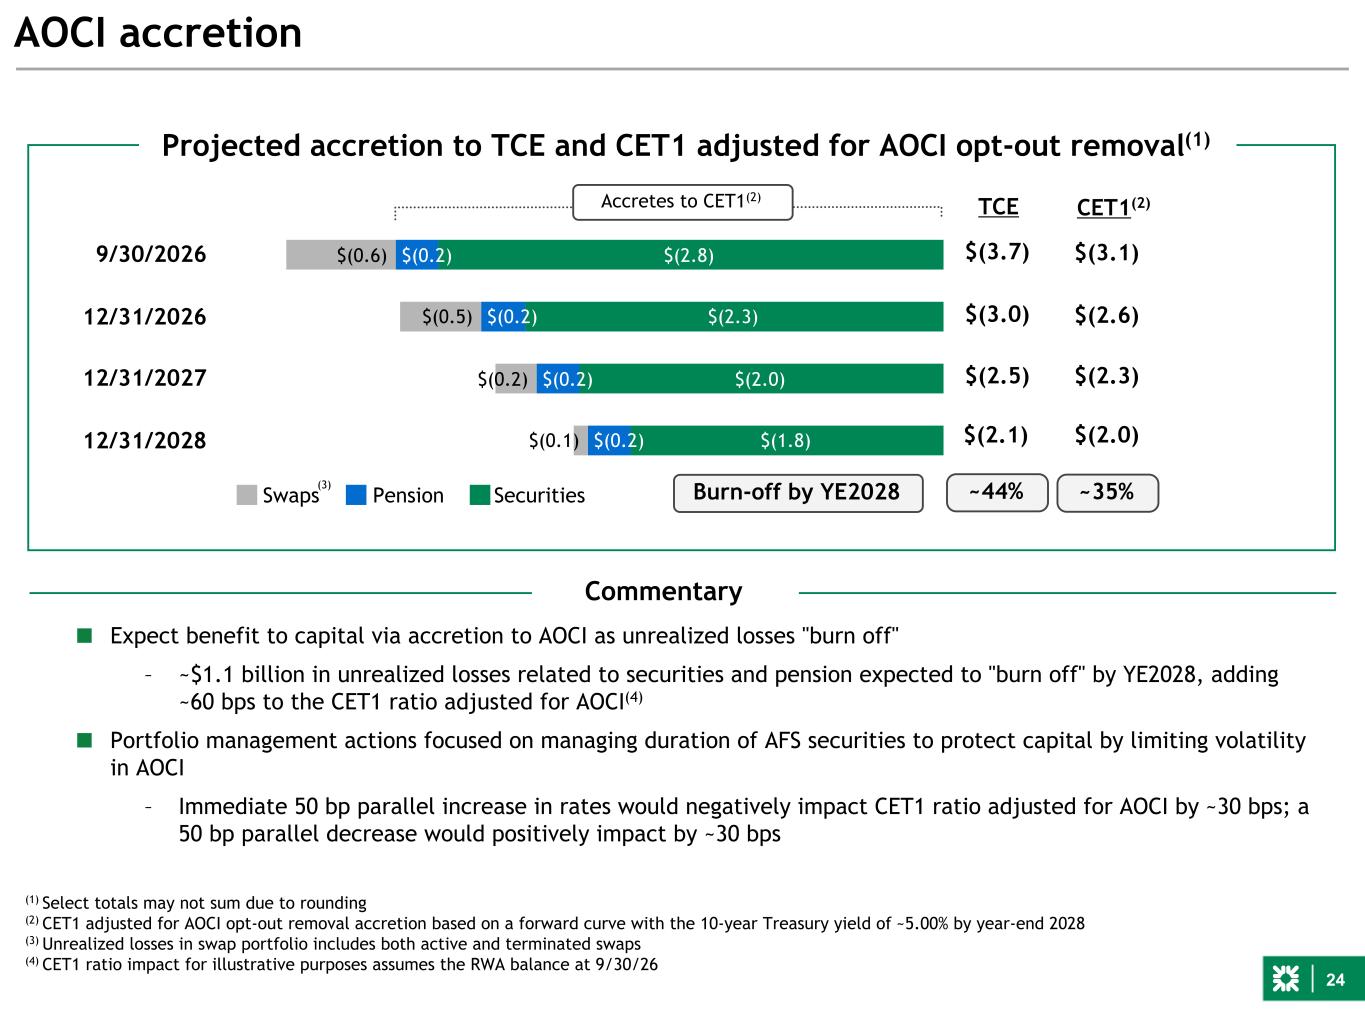
24 AOCI accretion Protecting CET1 - AFS marks; duration decreasing with securities portfolio hedging; less sensitivity to rates. Illustrate how sensitivity to a 50 bp move has fallen from 12/31/22 to 9/30/23 to 12/31/23 ...As recent actions limit AOCI volatility to protect capital $(2.8) $(2.3) $(2.0) $(1.8) $(0.2) $(0.2) $(0.2) $(0.2) $(0.6) $(0.5) $(0.2) $(0.1) 9/30/2026 12/31/2026 12/31/2027 12/31/2028 $(3.7) $(2.5) $(2.1) ~44% TCE CET1(2) $(3.1) $(2.3) $(2.0) Commentary ■ Expect benefit to capital via accretion to AOCI as unrealized losses "burn off" – ~$1.1 billion in unrealized losses related to securities and pension expected to "burn off" by YE2028, adding ~60 bps to the CET1 ratio adjusted for AOCI(4) ■ Portfolio management actions focused on managing duration of AFS securities to protect capital by limiting volatility in AOCI – Immediate 50 bp parallel increase in rates would negatively impact CET1 ratio adjusted for AOCI by ~30 bps; a 50 bp parallel decrease would positively impact by ~30 bps Burn-off by YE2028 ~35% (1) Select totals may not sum due to rounding (2) CET1 adjusted for AOCI opt-out removal accretion based on a forward curve with the 10-year Treasury yield of ~5.00% by year-end 2028 (3) Unrealized losses in swap portfolio includes both active and terminated swaps (4) CET1 ratio impact for illustrative purposes assumes the RWA balance at 9/30/26 Projected accretion to TCE and CET1 adjusted for AOCI opt-out removal(1) Accretes to CET1(2) (3) $(3.0) $(2.6) Swaps Pension Securities
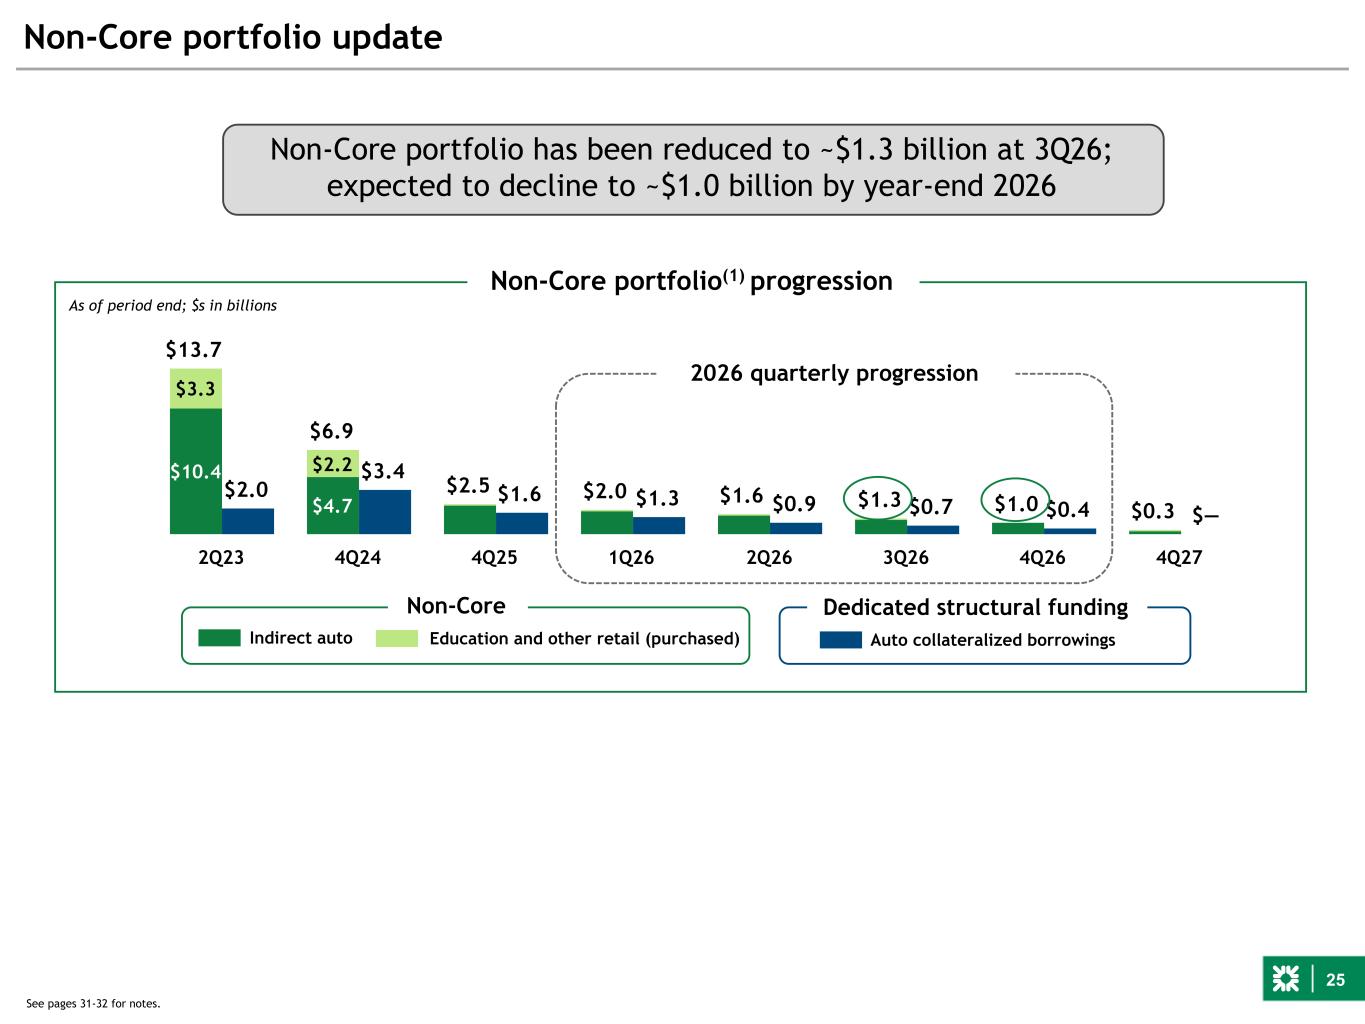
25 $13.7 $6.9 $2.5 $2.0 $1.6 $1.3 $1.0 $0.3 $2.0 $3.4 $1.6 $1.3 $0.9 $0.7 $0.4 $— $10.4 $4.7 $3.3 $2.2 2Q23 4Q24 4Q25 1Q26 2Q26 3Q26 4Q26 4Q27 Non-Core portfolio update Non-Core Dedicated structural funding Indirect auto Auto collateralized borrowings As of period end; $s in billions See pages 31-32 for notes. Non-Core portfolio(1) progression Education and other retail (purchased) Non-Core portfolio has been reduced to ~$1.3 billion at 3Q26; expected to decline to ~$1.0 billion by year-end 2026 2026 quarterly progression
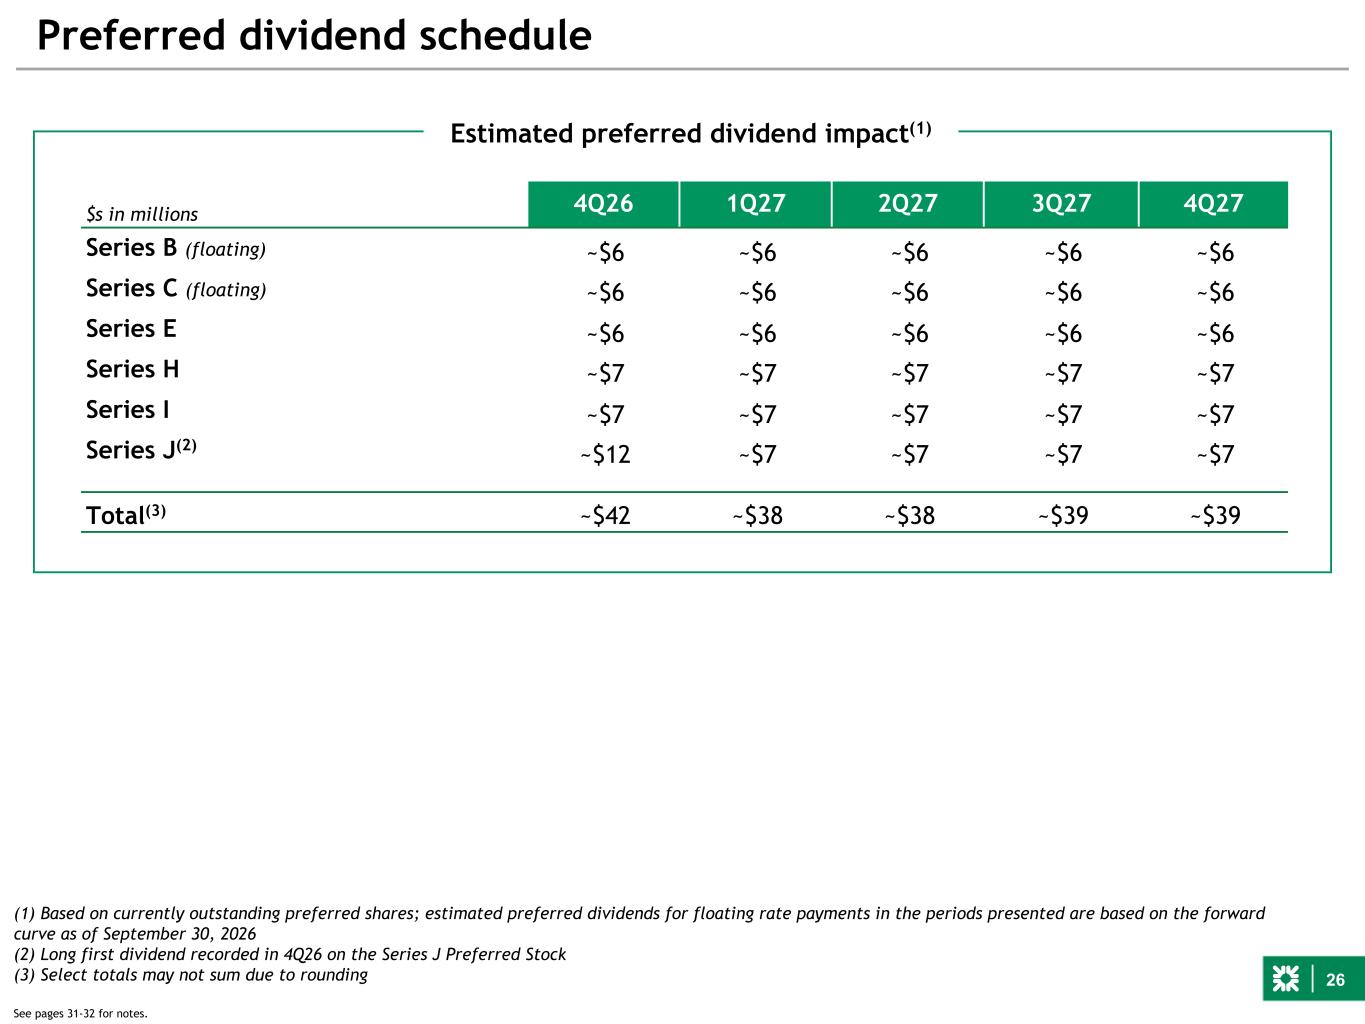
26 Preferred dividend schedule See pages 31-32 for notes. Estimated preferred dividend impact(1) $s in millions 4Q26 1Q27 2Q27 3Q27 4Q27 Series B (floating) ~$6 ~$6 ~$6 ~$6 ~$6 Series C (floating) ~$6 ~$6 ~$6 ~$6 ~$6 Series E ~$6 ~$6 ~$6 ~$6 ~$6 Series H ~$7 ~$7 ~$7 ~$7 ~$7 Series I ~$7 ~$7 ~$7 ~$7 ~$7 Series J(2) ~$12 ~$7 ~$7 ~$7 ~$7 Total(3) ~$42 ~$38 ~$38 ~$39 ~$39 (1) Based on currently outstanding preferred shares; estimated preferred dividends for floating rate payments in the periods presented are based on the forward curve as of September 30, 2026 (2) Long first dividend recorded in 4Q26 on the Series J Preferred Stock (3) Select totals may not sum due to rounding
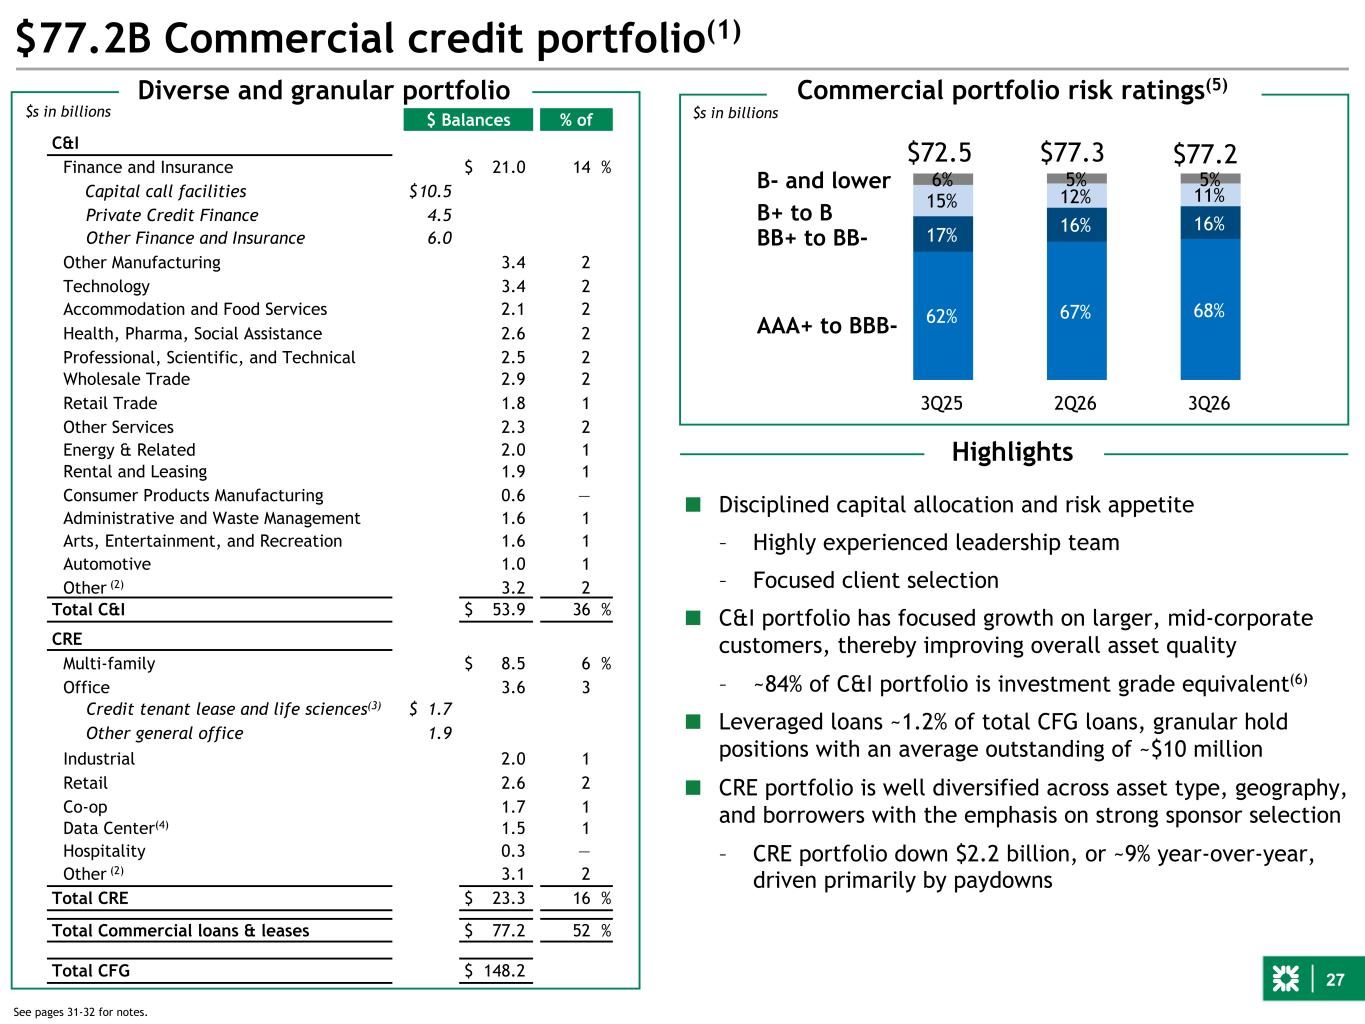
27 $77.2B Commercial credit portfolio(1) Commercial portfolio risk ratings(5) $s in billions 62% 67% 68% 17% 16% 16% 15% 12% 11% 6% 5% 5% 3Q25 2Q26 3Q26 B- and lower B+ to B BB+ to BB- AAA+ to BBB- $77.2 Highlights $77.3 $ Balances % of C&I Finance and Insurance $ 21.0 14 % Capital call facilities $ 10.5 Private Credit Finance 4.5 Other Finance and Insurance 6.0 Other Manufacturing 3.4 2 Technology 3.4 2 Accommodation and Food Services 2.1 2 Health, Pharma, Social Assistance 2.6 2 Professional, Scientific, and Technical 2.5 2 Wholesale Trade 2.9 2 Retail Trade 1.8 1 Other Services 2.3 2 Energy & Related 2.0 1 Rental and Leasing 1.9 1 Consumer Products Manufacturing 0.6 — Administrative and Waste Management 1.6 1 Arts, Entertainment, and Recreation 1.6 1 Automotive 1.0 1 Other (2) 3.2 2 Total C&I $ 53.9 36 % CRE Multi-family $ 8.5 6 % Office 3.6 3 Credit tenant lease and life sciences(3) $ 1.7 Other general office 1.9 Industrial 2.0 1 Retail 2.6 2 Co-op 1.7 1 Data Center(4) 1.5 1 Hospitality 0.3 — Other (2) 3.1 2 Total CRE $ 23.3 16 % Total Commercial loans & leases $ 77.2 52 % Total CFG $ 148.2 Diverse and granular portfolio ■ Disciplined capital allocation and risk appetite – Highly experienced leadership team – Focused client selection ■ C&I portfolio has focused growth on larger, mid-corporate customers, thereby improving overall asset quality – ~84% of C&I portfolio is investment grade equivalent(6) ■ Leveraged loans ~1.2% of total CFG loans, granular hold positions with an average outstanding of ~$10 million ■ CRE portfolio is well diversified across asset type, geography, and borrowers with the emphasis on strong sponsor selection – CRE portfolio down $2.2 billion, or ~9% year-over-year, driven primarily by paydowns $72.5 See pages 31-32 for notes. $s in billions
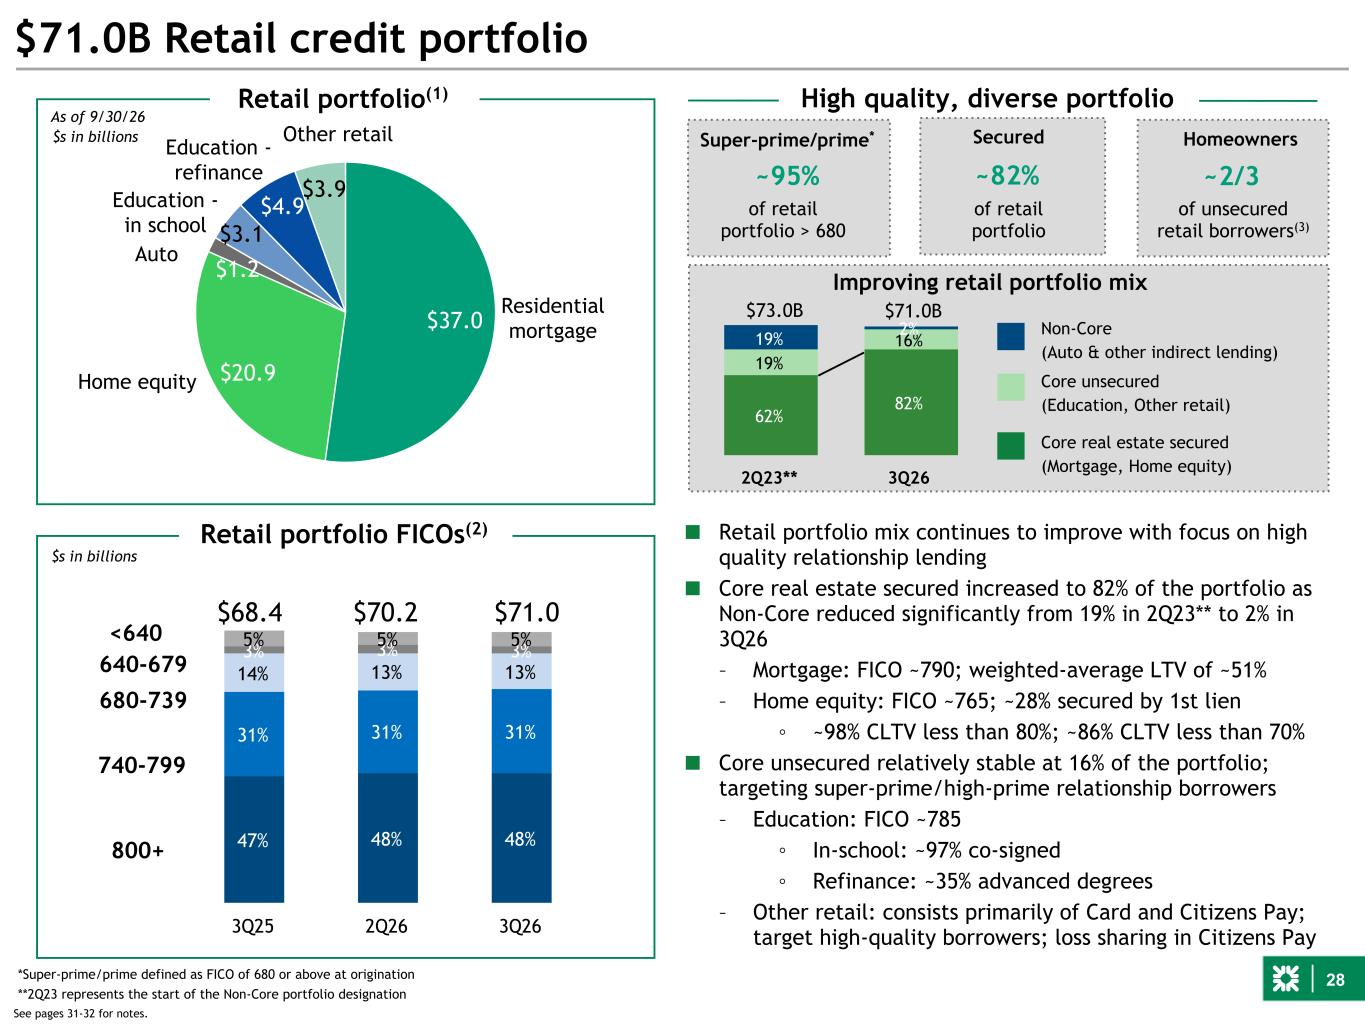
28 47% 48% 48% 31% 31% 31% 14% 13% 13% 3% 3% 3%5% 5% 5% 3Q25 2Q26 3Q26 $37.0 $20.9 $1.2 $3.1 $4.9 $3.9 $71.0B Retail credit portfolio 800+ 740-799 680-739 640-679 <640 $71.0 $s in billions $70.2 Home equity Retail portfolio(1) Residential mortgage Auto Education - in school Education - refinance Other retail ~95% Super-prime/prime* ~82% Secured ■ Retail portfolio mix continues to improve with focus on high quality relationship lending ■ Core real estate secured increased to 82% of the portfolio as Non-Core reduced significantly from 19% in 2Q23** to 2% in 3Q26 – Mortgage: FICO ~790; weighted-average LTV of ~51% – Home equity: FICO ~765; ~28% secured by 1st lien ◦ ~98% CLTV less than 80%; ~86% CLTV less than 70% ■ Core unsecured relatively stable at 16% of the portfolio; targeting super-prime/high-prime relationship borrowers – Education: FICO ~785 ◦ In-school: ~97% co-signed ◦ Refinance: ~35% advanced degrees – Other retail: consists primarily of Card and Citizens Pay; target high-quality borrowers; loss sharing in Citizens Pay High quality, diverse portfolio *Super-prime/prime defined as FICO of 680 or above at origination Retail portfolio FICOs(2) $68.4 Homeowners ~2/3 See pages 31-32 for notes. As of 9/30/26 62% 82% 19% 16%19% 2% 2Q23** 3Q26 Non-Core (Auto & other indirect lending) Core unsecured (Education, Other retail) Core real estate secured (Mortgage, Home equity) of unsecured retail borrowers(3) of retail portfolio > 680 Improving retail portfolio mix of retail portfolio **2Q23 represents the start of the Non-Core portfolio designation $71.0B$73.0B $s in billions To discuss: provide LTV stratification of 1st mortgages in light of B3E?
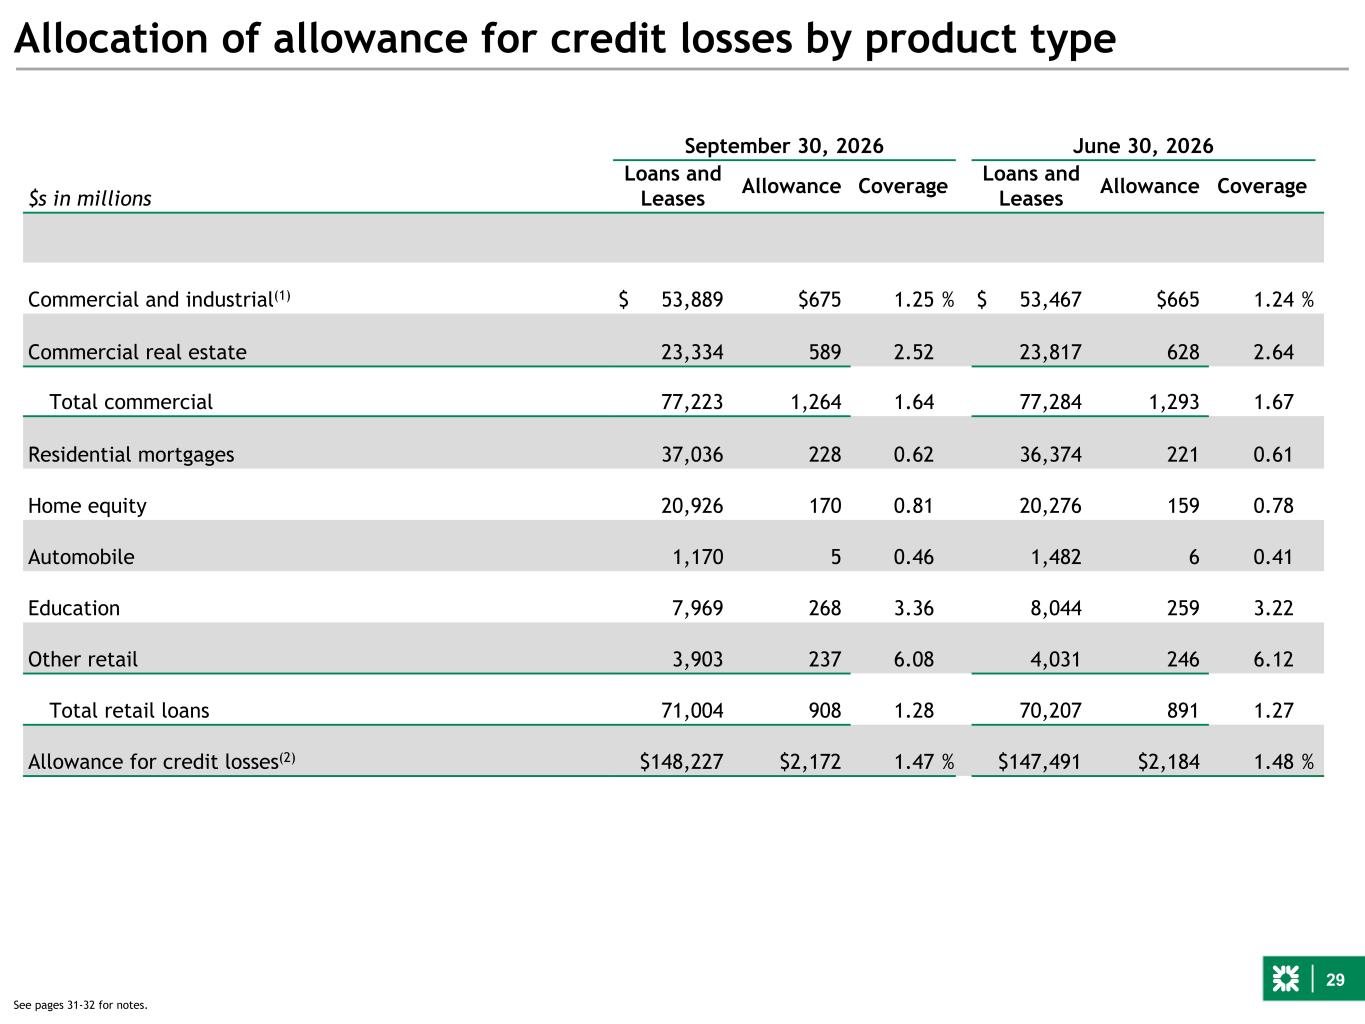
29 Allocation of allowance for credit losses by product type September 30, 2026 June 30, 2026 $s in millions Loans and Leases Allowance Coverage Loans and Leases Allowance Coverage Commercial and industrial(1) $ 53,889 $675 1.25 % $ 53,467 $665 1.24 % Commercial real estate 23,334 589 2.52 23,817 628 2.64 Total commercial 77,223 1,264 1.64 77,284 1,293 1.67 Residential mortgages 37,036 228 0.62 36,374 221 0.61 Home equity 20,926 170 0.81 20,276 159 0.78 Automobile 1,170 5 0.46 1,482 6 0.41 Education 7,969 268 3.36 8,044 259 3.22 Other retail 3,903 237 6.08 4,031 246 6.12 Total retail loans 71,004 908 1.28 70,207 891 1.27 Allowance for credit losses(2) $148,227 $2,172 1.47 % $147,491 $2,184 1.48 % See pages 31-32 for notes.
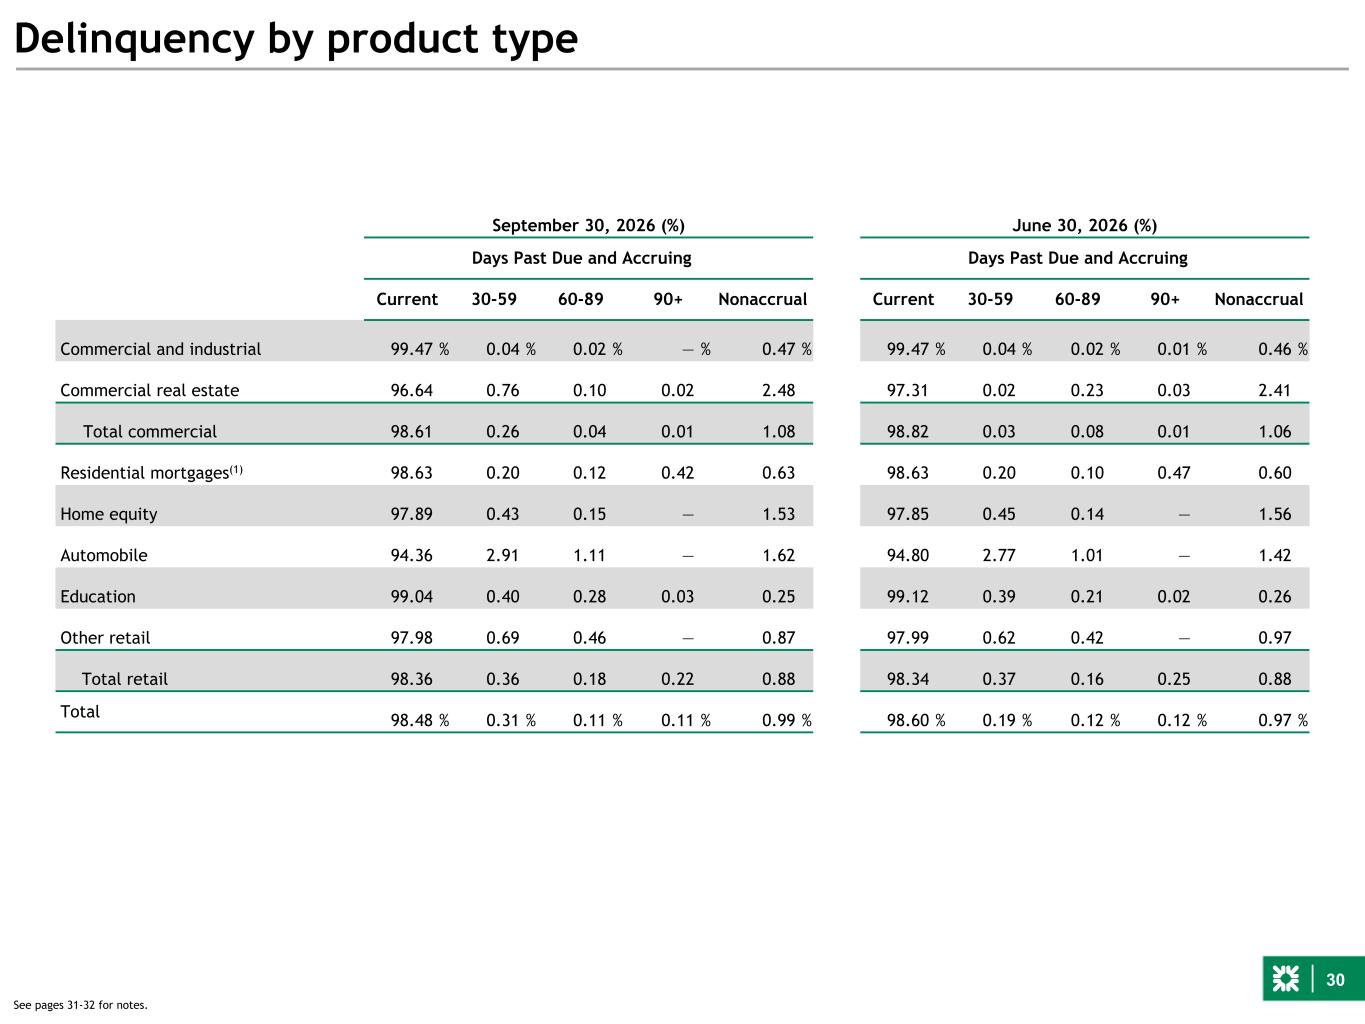
30 Delinquency by product type September 30, 2026 (%) June 30, 2026 (%) Days Past Due and Accruing Days Past Due and Accruing Current 30-59 60-89 90+ Nonaccrual Current 30-59 60-89 90+ Nonaccrual Commercial and industrial 99.47 % 0.04 % 0.02 % — % 0.47 % 99.47 % 0.04 % 0.02 % 0.01 % 0.46 % Commercial real estate 96.64 0.76 0.10 0.02 2.48 97.31 0.02 0.23 0.03 2.41 Total commercial 98.61 0.26 0.04 0.01 1.08 98.82 0.03 0.08 0.01 1.06 Residential mortgages(1) 98.63 0.20 0.12 0.42 0.63 98.63 0.20 0.10 0.47 0.60 Home equity 97.89 0.43 0.15 — 1.53 97.85 0.45 0.14 — 1.56 Automobile 94.36 2.91 1.11 — 1.62 94.80 2.77 1.01 — 1.42 Education 99.04 0.40 0.28 0.03 0.25 99.12 0.39 0.21 0.02 0.26 Other retail 97.98 0.69 0.46 — 0.87 97.99 0.62 0.42 — 0.97 Total retail 98.36 0.36 0.18 0.22 0.88 98.34 0.37 0.16 0.25 0.88 Total 98.48 % 0.31 % 0.11 % 0.11 % 0.99 % 98.60 % 0.19 % 0.12 % 0.12 % 0.97 % See pages 31-32 for notes.
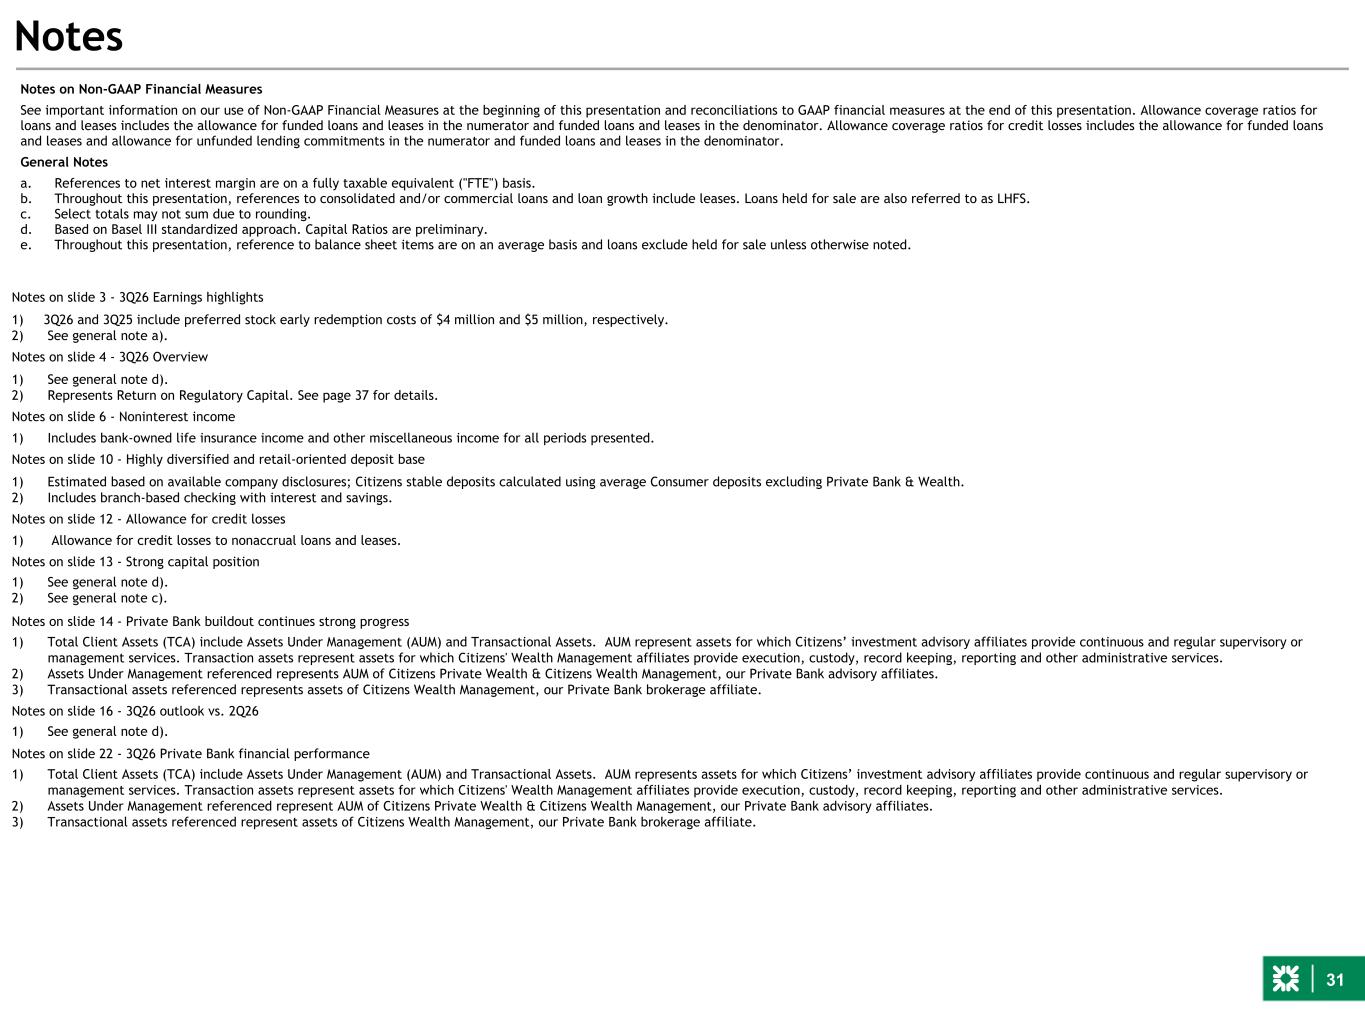
31 Notes on Non-GAAP Financial Measures See important information on our use of Non-GAAP Financial Measures at the beginning of this presentation and reconciliations to GAAP financial measures at the end of this presentation. Allowance coverage ratios for loans and leases includes the allowance for funded loans and leases in the numerator and funded loans and leases in the denominator. Allowance coverage ratios for credit losses includes the allowance for funded loans and leases and allowance for unfunded lending commitments in the numerator and funded loans and leases in the denominator. General Notes a. References to net interest margin are on a fully taxable equivalent ("FTE") basis. b. Throughout this presentation, references to consolidated and/or commercial loans and loan growth include leases. Loans held for sale are also referred to as LHFS. c. Select totals may not sum due to rounding. d. Based on Basel III standardized approach. Capital Ratios are preliminary. e. Throughout this presentation, reference to balance sheet items are on an average basis and loans exclude held for sale unless otherwise noted. Notes Notes on slide 3 - 3Q26 Earnings highlights 1) 3Q26 and 3Q25 include preferred stock early redemption costs of $4 million and $5 million, respectively. 2) See general note a). Notes on slide 4 - 3Q26 Overview 1) See general note d). 2) Represents Return on Regulatory Capital. See page 37 for details. Notes on slide 6 - Noninterest income 1) Includes bank-owned life insurance income and other miscellaneous income for all periods presented. Notes on slide 10 - Highly diversified and retail-oriented deposit base 1) Estimated based on available company disclosures; Citizens stable deposits calculated using average Consumer deposits excluding Private Bank & Wealth. 2) Includes branch-based checking with interest and savings. Notes on slide 12 - Allowance for credit losses 1) Allowance for credit losses to nonaccrual loans and leases. Notes on slide 13 - Strong capital position 1) See general note d). 2) See general note c). Notes on slide 14 - Private Bank buildout continues strong progress 1) Total Client Assets (TCA) include Assets Under Management (AUM) and Transactional Assets. AUM represent assets for which Citizens’ investment advisory affiliates provide continuous and regular supervisory or management services. Transaction assets represent assets for which Citizens' Wealth Management affiliates provide execution, custody, record keeping, reporting and other administrative services. 2) Assets Under Management referenced represents AUM of Citizens Private Wealth & Citizens Wealth Management, our Private Bank advisory affiliates. 3) Transactional assets referenced represents assets of Citizens Wealth Management, our Private Bank brokerage affiliate. Notes on slide 16 - 3Q26 outlook vs. 2Q26 1) See general note d). Notes on slide 22 - 3Q26 Private Bank financial performance 1) Total Client Assets (TCA) include Assets Under Management (AUM) and Transactional Assets. AUM represents assets for which Citizens’ investment advisory affiliates provide continuous and regular supervisory or management services. Transaction assets represent assets for which Citizens' Wealth Management affiliates provide execution, custody, record keeping, reporting and other administrative services. 2) Assets Under Management referenced represent AUM of Citizens Private Wealth & Citizens Wealth Management, our Private Bank advisory affiliates. 3) Transactional assets referenced represent assets of Citizens Wealth Management, our Private Bank brokerage affiliate.
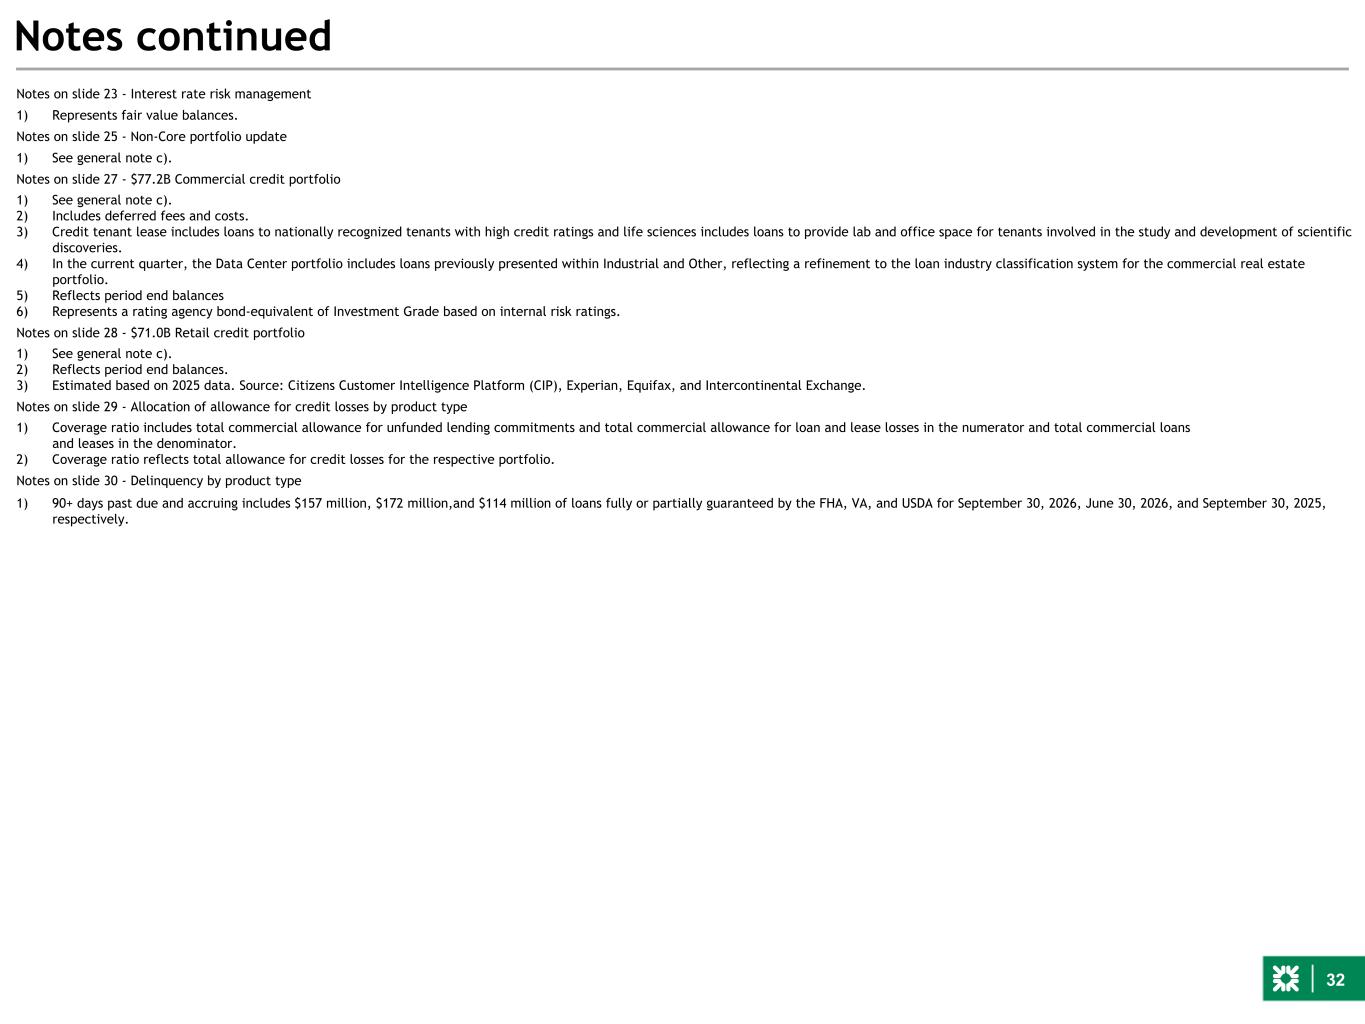
32 Notes continued Notes on slide 23 - Interest rate risk management 1) Represents fair value balances. Notes on slide 25 - Non-Core portfolio update 1) See general note c). Notes on slide 27 - $77.2B Commercial credit portfolio 1) See general note c). 2) Includes deferred fees and costs. 3) Credit tenant lease includes loans to nationally recognized tenants with high credit ratings and life sciences includes loans to provide lab and office space for tenants involved in the study and development of scientific discoveries. 4) In the current quarter, the Data Center portfolio includes loans previously presented within Industrial and Other, reflecting a refinement to the loan industry classification system for the commercial real estate portfolio. 5) Reflects period end balances 6) Represents a rating agency bond-equivalent of Investment Grade based on internal risk ratings. Notes on slide 28 - $71.0B Retail credit portfolio 1) See general note c). 2) Reflects period end balances. 3) Estimated based on 2025 data. Source: Citizens Customer Intelligence Platform (CIP), Experian, Equifax, and Intercontinental Exchange. Notes on slide 29 - Allocation of allowance for credit losses by product type 1) Coverage ratio includes total commercial allowance for unfunded lending commitments and total commercial allowance for loan and lease losses in the numerator and total commercial loans and leases in the denominator. 2) Coverage ratio reflects total allowance for credit losses for the respective portfolio. Notes on slide 30 - Delinquency by product type 1) 90+ days past due and accruing includes $157 million, $172 million,and $114 million of loans fully or partially guaranteed by the FHA, VA, and USDA for September 30, 2026, June 30, 2026, and September 30, 2025, respectively.
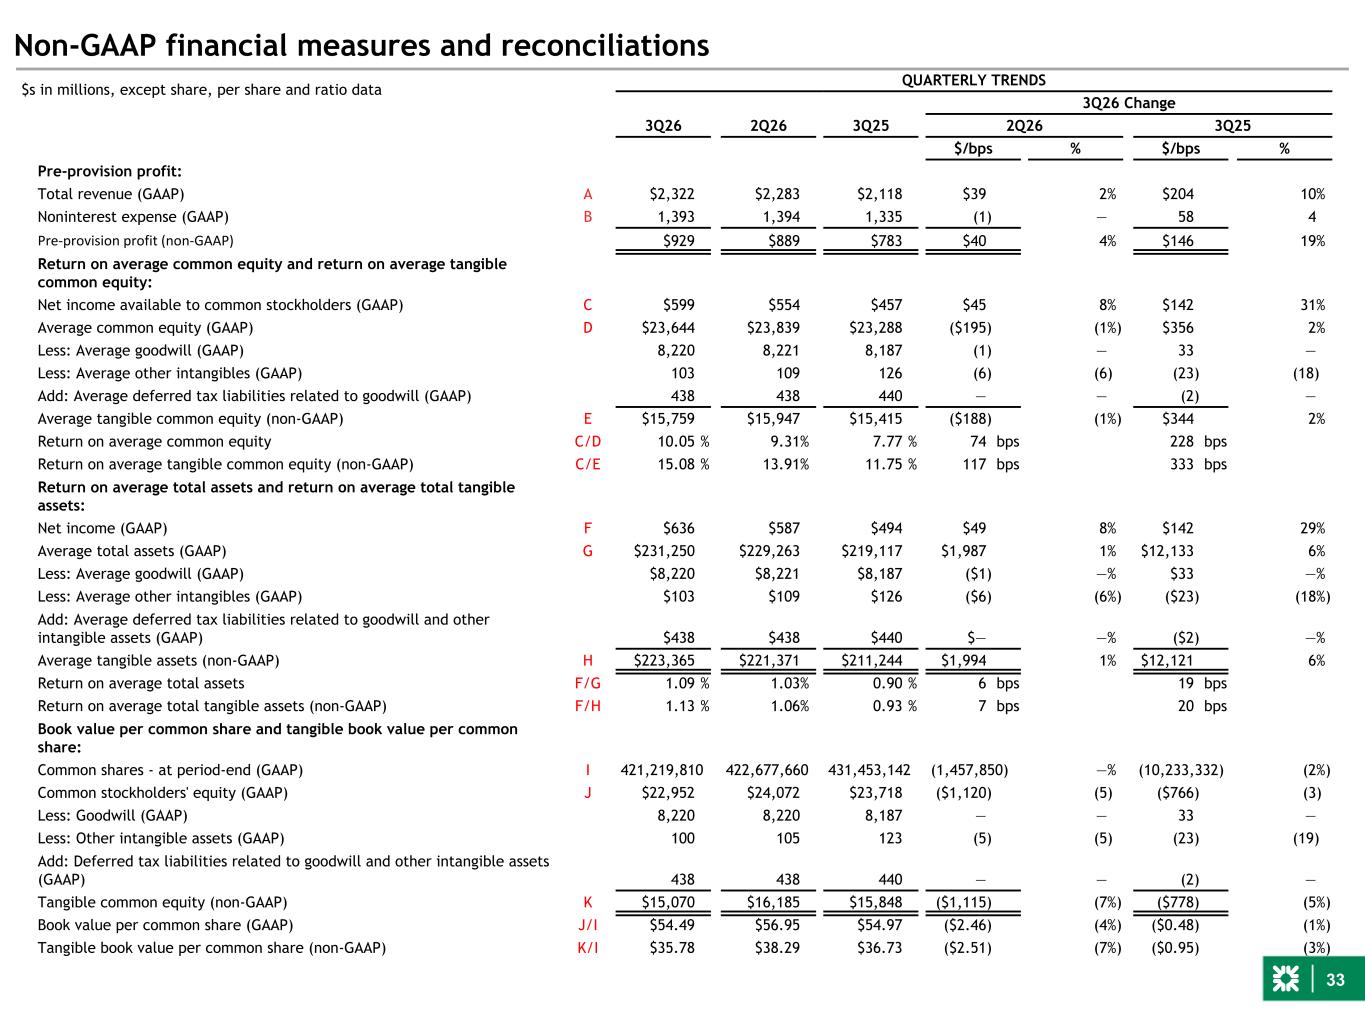
33 Non-GAAP financial measures and reconciliations $s in millions, except share, per share and ratio data QUARTERLY TRENDS 3Q26 Change 3Q26 2Q26 3Q25 2Q26 3Q25 $/bps % $/bps % Pre-provision profit: Total revenue (GAAP) A $2,322 $2,283 $2,118 $39 2% $204 10% Noninterest expense (GAAP) B 1,393 1,394 1,335 (1) — 58 4 Pre-provision profit (non-GAAP) $929 $889 $783 $40 4% $146 19% Return on average common equity and return on average tangible common equity: Net income available to common stockholders (GAAP) C $599 $554 $457 $45 8% $142 31% Average common equity (GAAP) D $23,644 $23,839 $23,288 ($195) (1%) $356 2% Less: Average goodwill (GAAP) 8,220 8,221 8,187 (1) — 33 — Less: Average other intangibles (GAAP) 103 109 126 (6) (6) (23) (18) Add: Average deferred tax liabilities related to goodwill (GAAP) 438 438 440 — — (2) — Average tangible common equity (non-GAAP) E $15,759 $15,947 $15,415 ($188) (1%) $344 2% Return on average common equity C/D 10.05 % 9.31% 7.77 % 74 bps 228 bps Return on average tangible common equity (non-GAAP) C/E 15.08 % 13.91% 11.75 % 117 bps 333 bps Return on average total assets and return on average total tangible assets: Net income (GAAP) F $636 $587 $494 $49 8% $142 29% Average total assets (GAAP) G $231,250 $229,263 $219,117 $1,987 1% $12,133 6% Less: Average goodwill (GAAP) $8,220 $8,221 $8,187 ($1) —% $33 —% Less: Average other intangibles (GAAP) $103 $109 $126 ($6) (6%) ($23) (18%) Add: Average deferred tax liabilities related to goodwill and other intangible assets (GAAP) $438 $438 $440 $— —% ($2) —% Average tangible assets (non-GAAP) H $223,365 $221,371 $211,244 $1,994 1% $12,121 6% Return on average total assets F/G 1.09 % 1.03% 0.90 % 6 bps 19 bps Return on average total tangible assets (non-GAAP) F/H 1.13 % 1.06% 0.93 % 7 bps 20 bps Book value per common share and tangible book value per common share: Common shares - at period-end (GAAP) I 421,219,810 422,677,660 431,453,142 (1,457,850) —% (10,233,332) (2%) Common stockholders' equity (GAAP) J $22,952 $24,072 $23,718 ($1,120) (5) ($766) (3) Less: Goodwill (GAAP) 8,220 8,220 8,187 — — 33 — Less: Other intangible assets (GAAP) 100 105 123 (5) (5) (23) (19) Add: Deferred tax liabilities related to goodwill and other intangible assets (GAAP) 438 438 440 — — (2) — Tangible common equity (non-GAAP) K $15,070 $16,185 $15,848 ($1,115) (7%) ($778) (5%) Book value per common share (GAAP) J/I $54.49 $56.95 $54.97 ($2.46) (4%) ($0.48) (1%) Tangible book value per common share (non-GAAP) K/I $35.78 $38.29 $36.73 ($2.51) (7%) ($0.95) (3%)
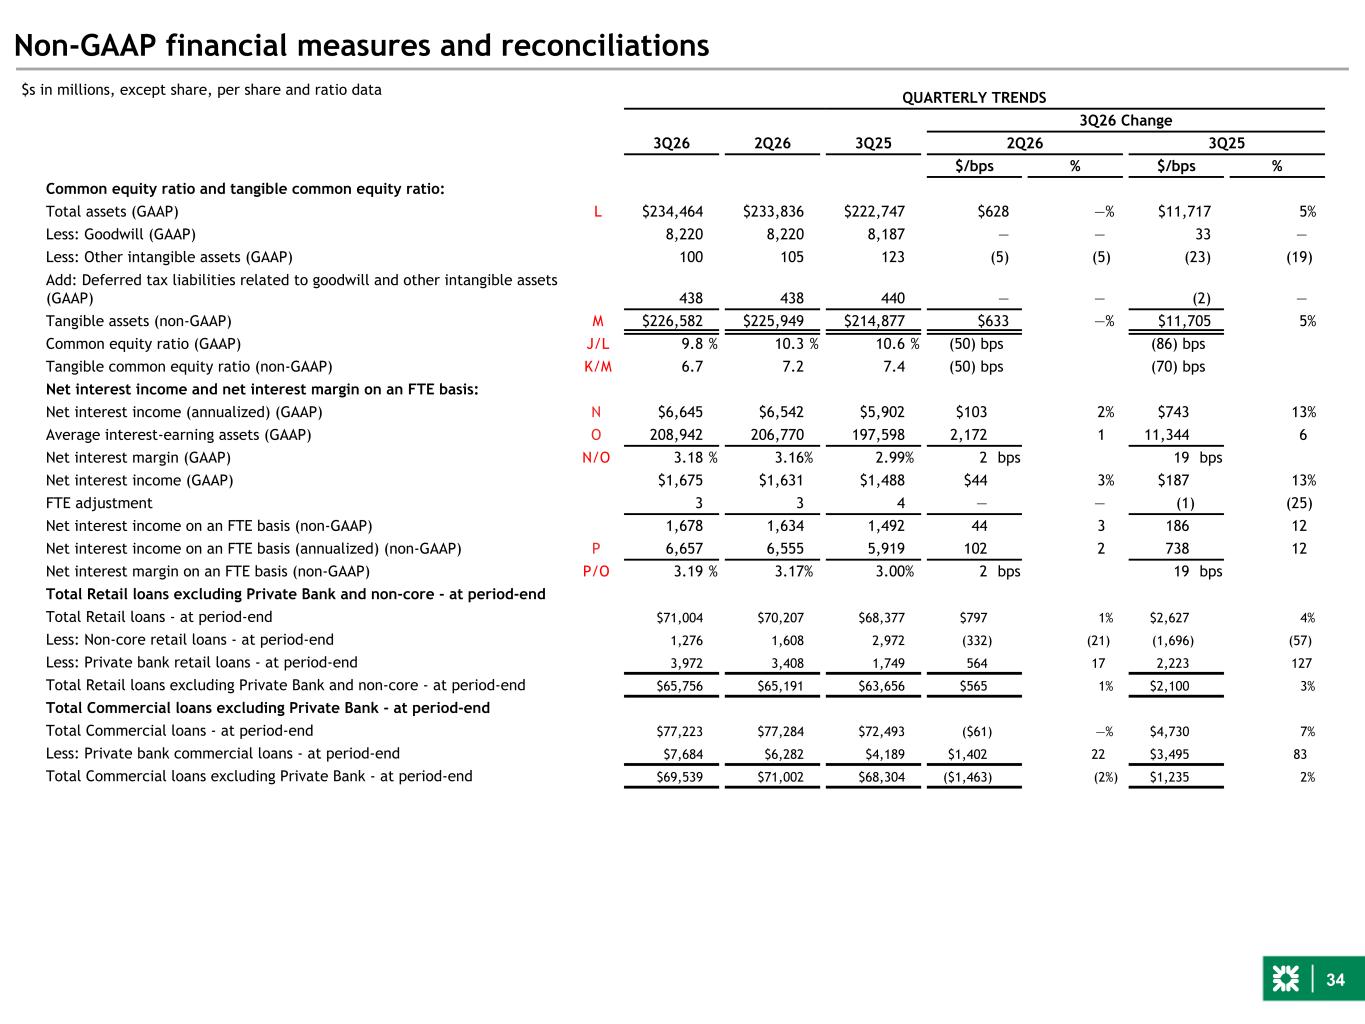
34 Non-GAAP financial measures and reconciliations QUARTERLY TRENDS 3Q26 Change 3Q26 2Q26 3Q25 2Q26 3Q25 $/bps % $/bps % Common equity ratio and tangible common equity ratio: Total assets (GAAP) L $234,464 $233,836 $222,747 $628 —% $11,717 5% Less: Goodwill (GAAP) 8,220 8,220 8,187 — — 33 — Less: Other intangible assets (GAAP) 100 105 123 (5) (5) (23) (19) Add: Deferred tax liabilities related to goodwill and other intangible assets (GAAP) 438 438 440 — — (2) — Tangible assets (non-GAAP) M $226,582 $225,949 $214,877 $633 —% $11,705 5% Common equity ratio (GAAP) J/L 9.8 % 10.3 % 10.6 % (50) bps (86) bps Tangible common equity ratio (non-GAAP) K/M 6.7 7.2 7.4 (50) bps (70) bps Net interest income and net interest margin on an FTE basis: Net interest income (annualized) (GAAP) N $6,645 $6,542 $5,902 $103 2% $743 13% Average interest-earning assets (GAAP) O 208,942 206,770 197,598 2,172 1 11,344 6 Net interest margin (GAAP) N/O 3.18 % 3.16% 2.99% 2 bps 19 bps Net interest income (GAAP) $1,675 $1,631 $1,488 $44 3% $187 13% FTE adjustment 3 3 4 — — (1) (25) Net interest income on an FTE basis (non-GAAP) 1,678 1,634 1,492 44 3 186 12 Net interest income on an FTE basis (annualized) (non-GAAP) P 6,657 6,555 5,919 102 2 738 12 Net interest margin on an FTE basis (non-GAAP) P/O 3.19 % 3.17% 3.00% 2 bps 19 bps Total Retail loans excluding Private Bank and non-core - at period-end Total Retail loans - at period-end $71,004 $70,207 $68,377 $797 1% $2,627 4% Less: Non-core retail loans - at period-end 1,276 1,608 2,972 (332) (21) (1,696) (57) Less: Private bank retail loans - at period-end 3,972 3,408 1,749 564 17 2,223 127 Total Retail loans excluding Private Bank and non-core - at period-end $65,756 $65,191 $63,656 $565 1% $2,100 3% Total Commercial loans excluding Private Bank - at period-end Total Commercial loans - at period-end $77,223 $77,284 $72,493 ($61) —% $4,730 7% Less: Private bank commercial loans - at period-end $7,684 $6,282 $4,189 $1,402 22 $3,495 83 Total Commercial loans excluding Private Bank - at period-end $69,539 $71,002 $68,304 ($1,463) (2%) $1,235 2% $s in millions, except share, per share and ratio data
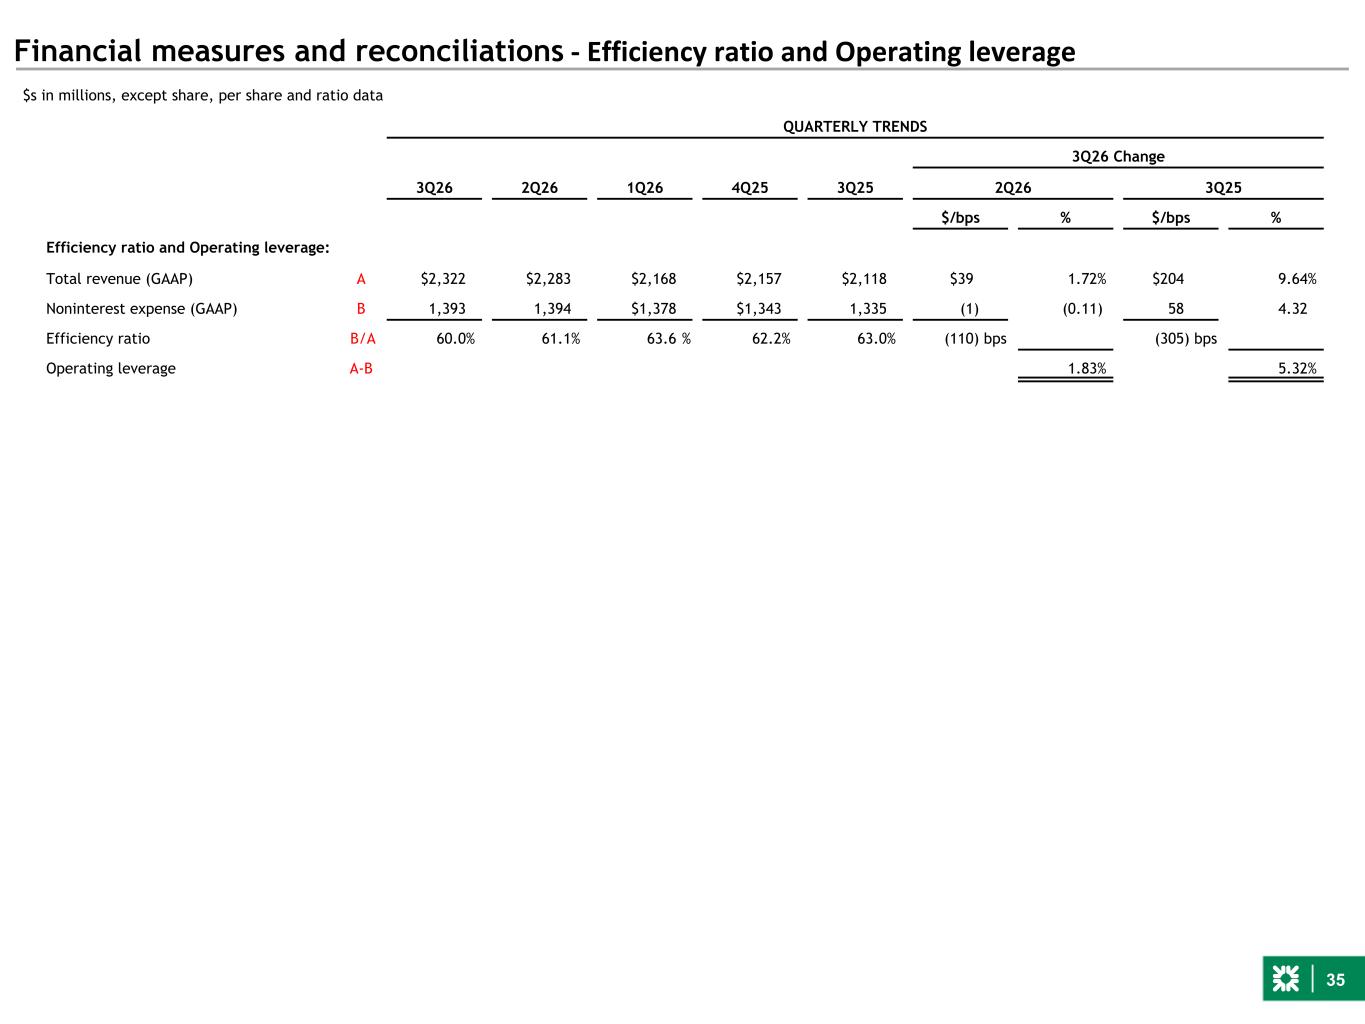
35 Financial measures and reconciliations - Efficiency ratio and Operating leverage $s in millions, except share, per share and ratio data QUARTERLY TRENDS 3Q26 Change 3Q26 2Q26 1Q26 4Q25 3Q25 2Q26 3Q25 $/bps % $/bps % Efficiency ratio and Operating leverage: Total revenue (GAAP) A $2,322 $2,283 $2,168 $2,157 $2,118 $39 1.72% $204 9.64% Noninterest expense (GAAP) B 1,393 1,394 $1,378 $1,343 1,335 (1) (0.11) 58 4.32 Efficiency ratio B/A 60.0% 61.1% 63.6 % 62.2% 63.0% (110) bps (305) bps Operating leverage A-B 1.83% 5.32%
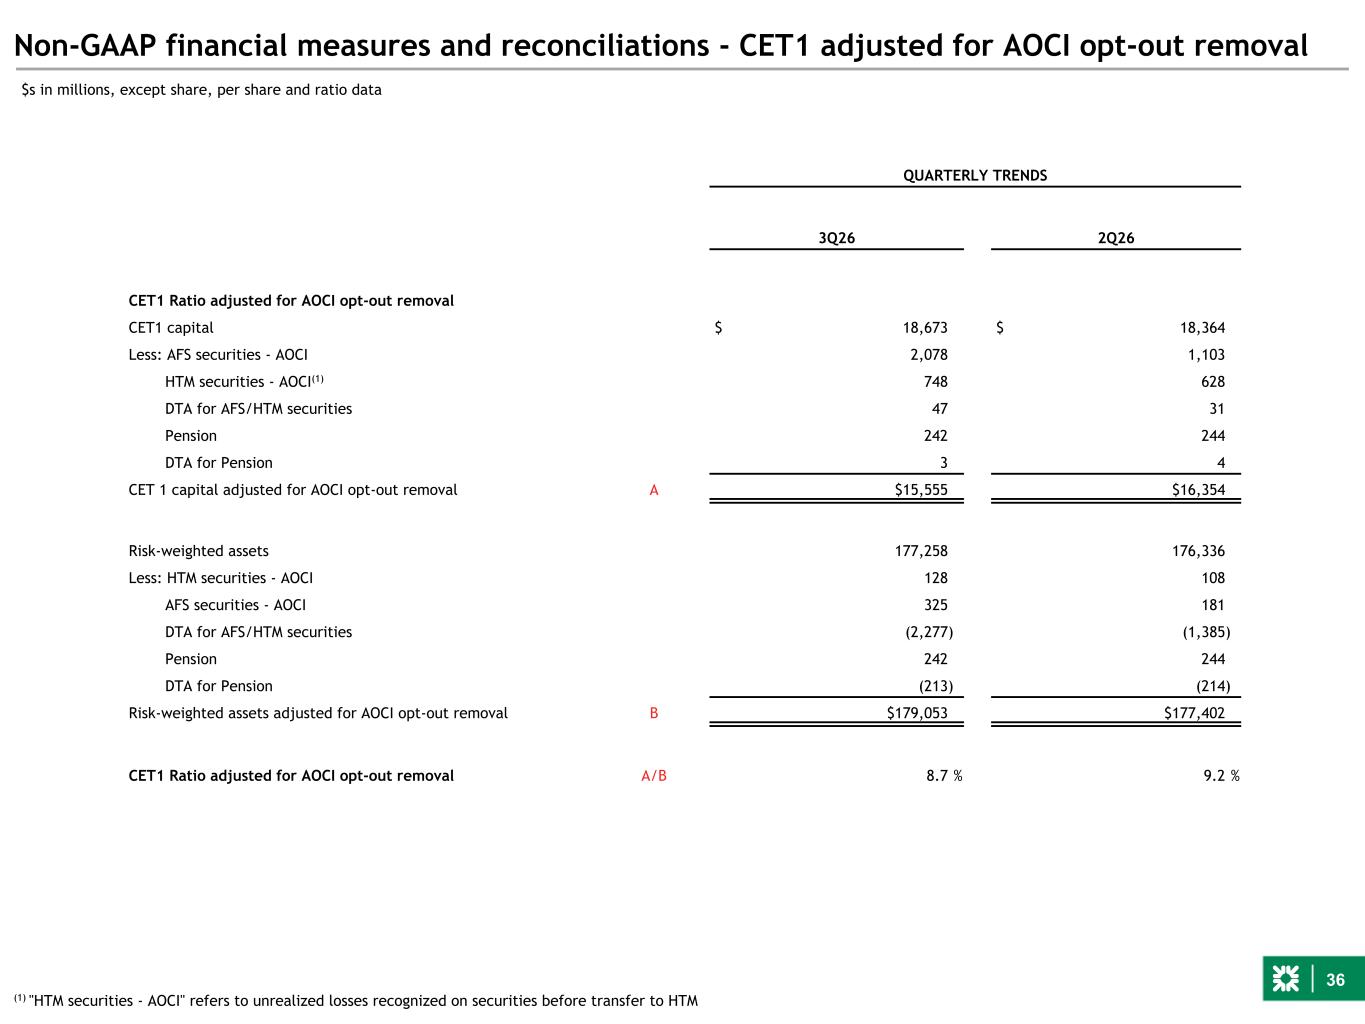
36 Non-GAAP financial measures and reconciliations - CET1 adjusted for AOCI opt-out removal QUARTERLY TRENDS 3Q26 2Q26 CET1 Ratio adjusted for AOCI opt-out removal CET1 capital $ 18,673 $ 18,364 Less: AFS securities - AOCI 2,078 1,103 HTM securities - AOCI(1) 748 628 DTA for AFS/HTM securities 47 31 Pension 242 244 DTA for Pension 3 4 CET 1 capital adjusted for AOCI opt-out removal A $15,555 $16,354 Risk-weighted assets 177,258 176,336 Less: HTM securities - AOCI 128 108 AFS securities - AOCI 325 181 DTA for AFS/HTM securities (2,277) (1,385) Pension 242 244 DTA for Pension (213) (214) Risk-weighted assets adjusted for AOCI opt-out removal B $179,053 $177,402 CET1 Ratio adjusted for AOCI opt-out removal A/B 8.7 % 9.2 % $s in millions, except share, per share and ratio data (1) "HTM securities - AOCI" refers to unrealized losses recognized on securities before transfer to HTM
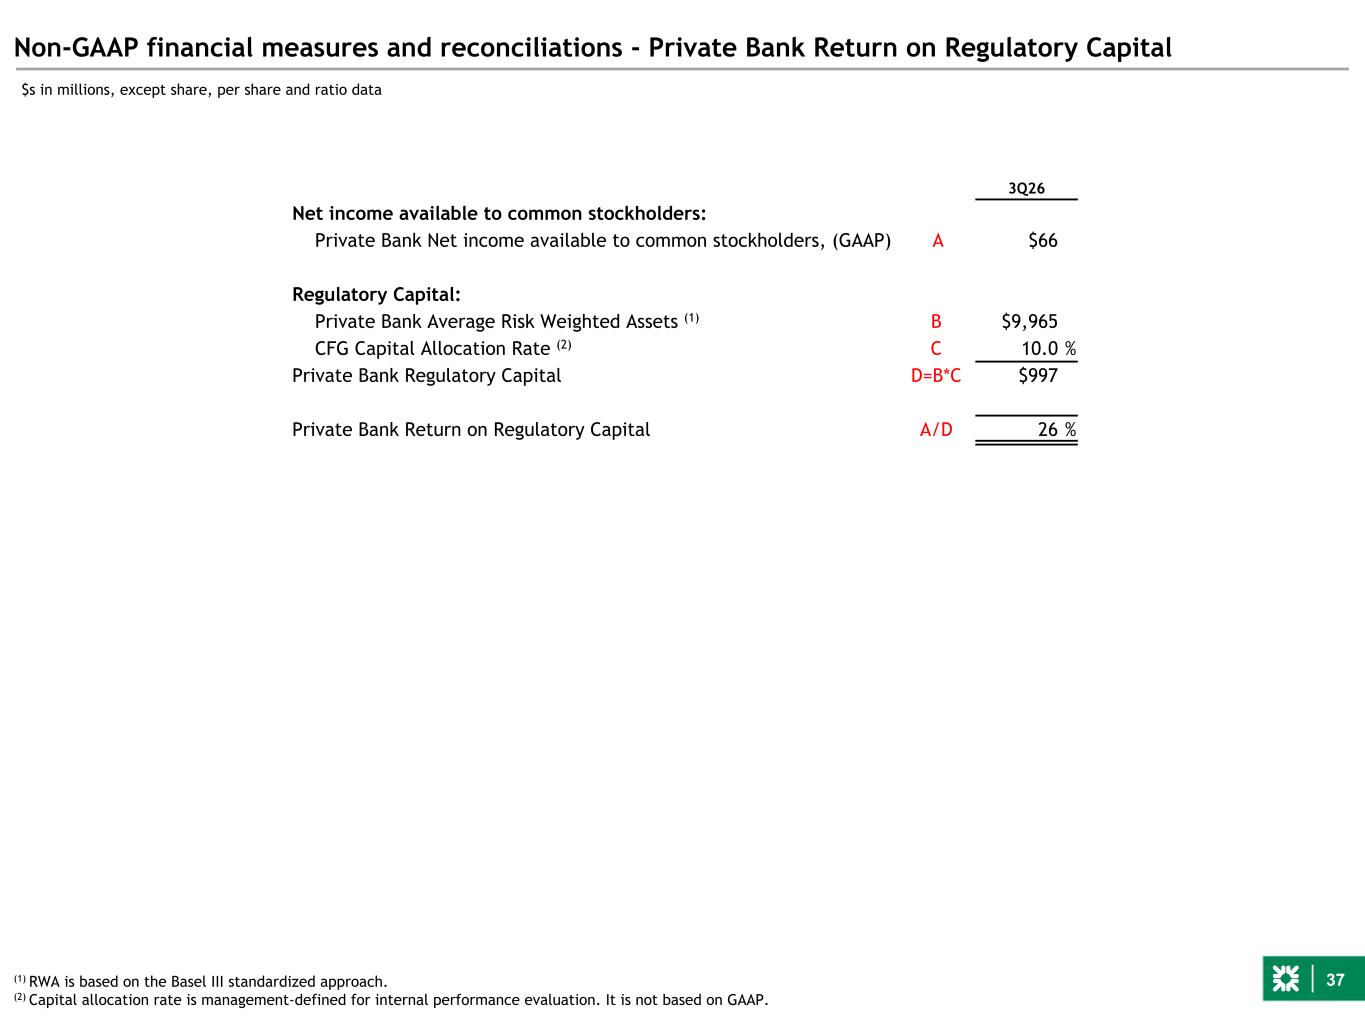
37 Non-GAAP financial measures and reconciliations - Private Bank Return on Regulatory Capital $s in millions, except share, per share and ratio data 3Q26 Net income available to common stockholders: Private Bank Net income available to common stockholders, (GAAP) A $66 Regulatory Capital: Private Bank Average Risk Weighted Assets (1) B $9,965 CFG Capital Allocation Rate (2) C 10.0 % Private Bank Regulatory Capital D=B*C $997 Private Bank Return on Regulatory Capital A/D 26 % (1) RWA is based on the Basel III standardized approach. (2) Capital allocation rate is management-defined for internal performance evaluation. It is not based on GAAP.