
Investor Presentation Third Quarter 2026
Cautionary Note Regarding Forward-Looking Statements This presentation contains “forward-looking statements” within the meaning of the U.S. Private Securities Litigation Reform Act of 1995, including without limitation those regarding Popular’s business, financial condition, results of operations and objectives, outlook, performance, earnings and expenses. These statements are not guarantees of future performance, are based on the current expectations of Popular, Inc.’s management and, by their nature, involve risks, uncertainties, estimates and assumptions. Potential factors, some of which are beyond our control, could cause actual results to differ materially from those expressed in, or implied by, such forward-looking statements. More information on the risks and important factors that could affect our future results and financial condition is included in our Form 10-K for the year ended December 31, 2025, our Form 10-Q for the quarters ended March 31, 2026 and June 30, 2026, and our Form 10-Q for the quarter ended September 30, 2026, to be filed with the Securities and Exchange Commission. Our filings are available on our website (www.popular.com) and on the Securities and Exchange Commission website (www.sec.gov). We assume no obligation to update or revise any forward-looking statements which speak as of their respective dates. 2
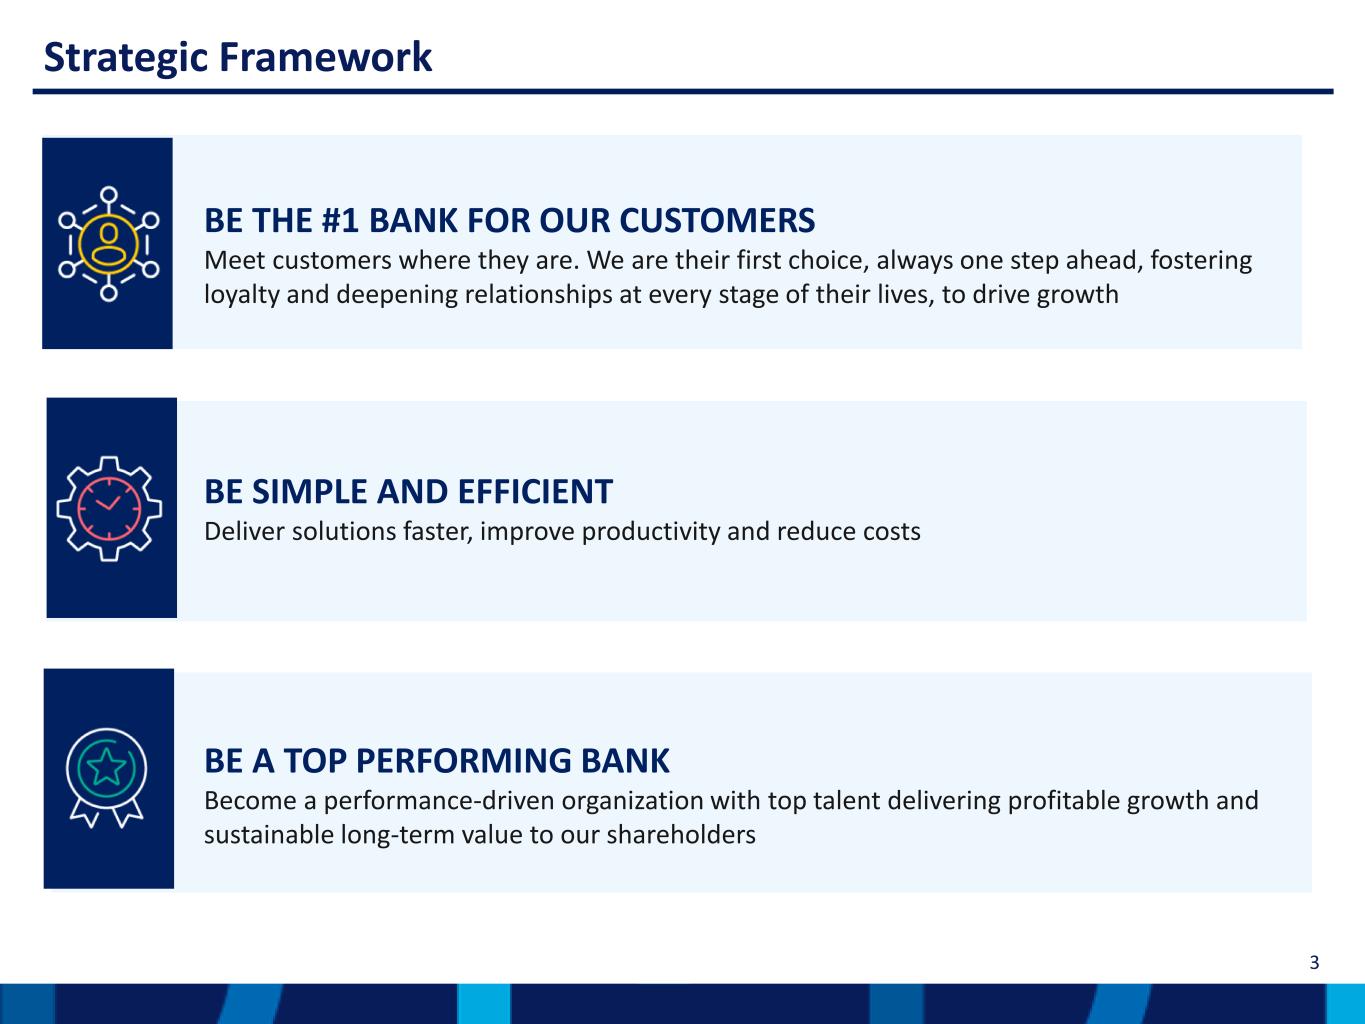
Strategic Framework BE SIMPLE AND EFFICIENT Deliver solutions faster, improve productivity and reduce costs BE THE #1 BANK FOR OUR CUSTOMERS Meet customers where they are. We are their first choice, always one step ahead, fostering loyalty and deepening relationships at every stage of their lives, to drive growth BE A TOP PERFORMING BANK Become a performance-driven organization with top talent delivering profitable growth and sustainable long-term value to our shareholders 3
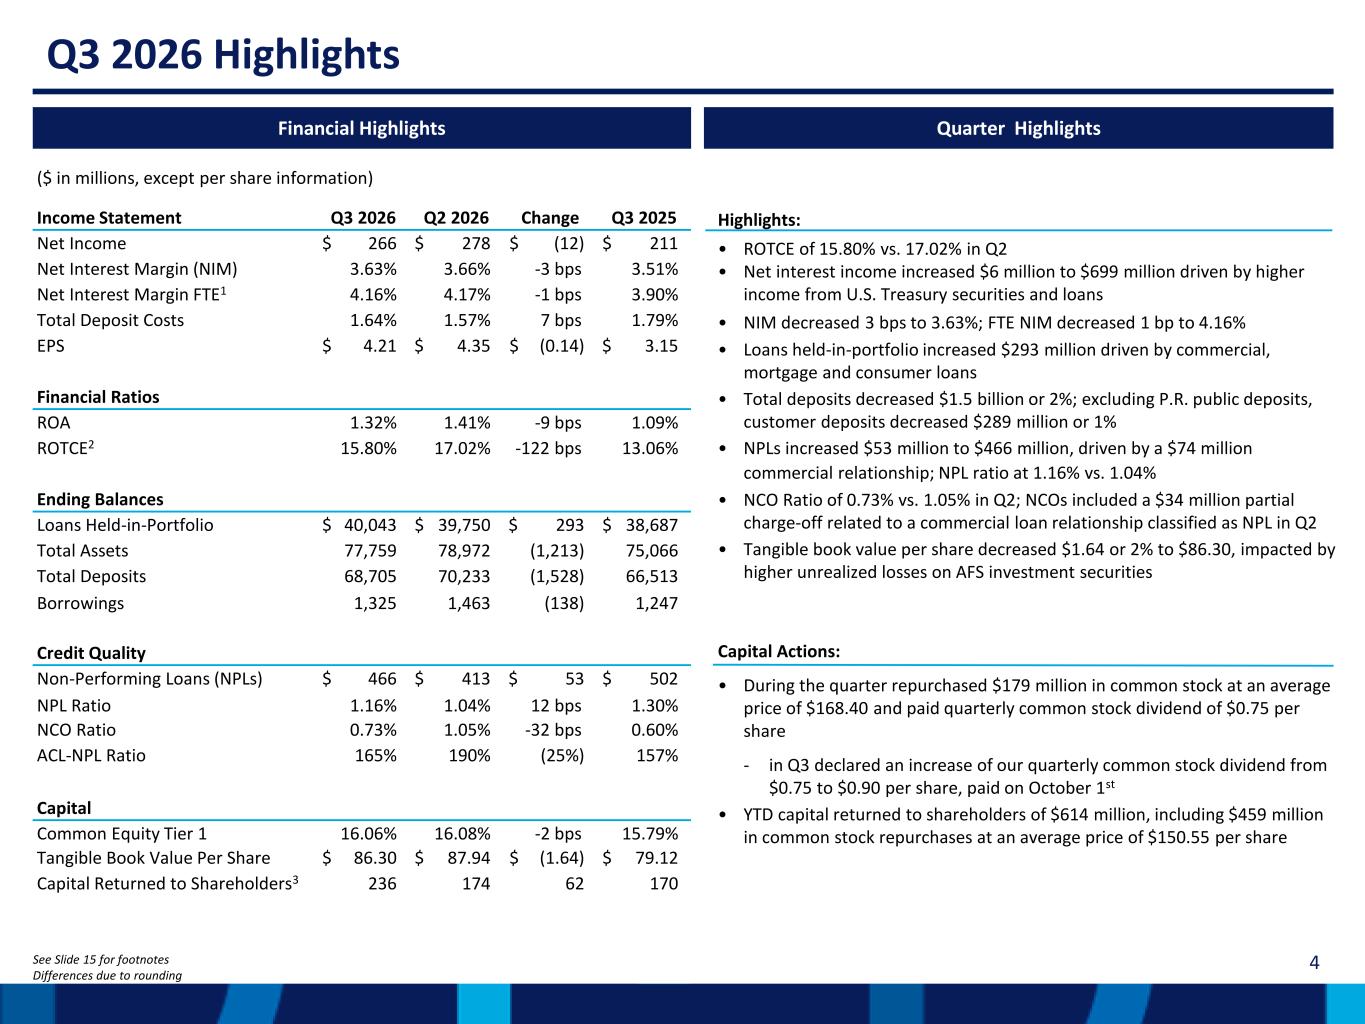
Q3 2026 Highlights See Slide 15 for footnotes Differences due to rounding ($ in millions, except per share information) Income Statement Q3 2026 Q2 2026 Change Q3 2025 Net Income $ 266 $ 278 $ (12) $ 211 Net Interest Margin (NIM) 3.63% 3.66% -3 bps 3.51% Net Interest Margin FTE1 4.16% 4.17% -1 bps 3.90% Total Deposit Costs 1.64% 1.57% 7 bps 1.79% EPS $ 4.21 $ 4.35 $ (0.14) $ 3.15 Financial Ratios ROA 1.32% 1.41% -9 bps 1.09% ROTCE2 15.80% 17.02% -122 bps 13.06% Ending Balances Loans Held-in-Portfolio $ 40,043 $ 39,750 $ 293 $ 38,687 Total Assets 77,759 78,972 (1,213) 75,066 Total Deposits 68,705 70,233 (1,528) 66,513 Borrowings 1,325 1,463 (138) 1,247 Credit Quality Non-Performing Loans (NPLs) $ 466 $ 413 $ 53 $ 502 NPL Ratio 1.16% 1.04% 12 bps 1.30% NCO Ratio 0.73% 1.05% -32 bps 0.60% ACL-NPL Ratio 165% 190% (25%) 157% Capital Common Equity Tier 1 16.06% 16.08% -2 bps 15.79% Tangible Book Value Per Share $ 86.30 $ 87.94 $ (1.64) $ 79.12 Capital Returned to Shareholders3 236 174 62 170 Financial Highlights Quarter Highlights Highlights: • ROTCE of 15.80% vs. 17.02% in Q2 • Net interest income increased $6 million to $699 million driven by higher income from U.S. Treasury securities and loans • NIM decreased 3 bps to 3.63%; FTE NIM decreased 1 bp to 4.16% • Loans held-in-portfolio increased $293 million driven by commercial, mortgage and consumer loans • Total deposits decreased $1.5 billion or 2%; excluding P.R. public deposits, customer deposits decreased $289 million or 1% • NPLs increased $53 million to $466 million, driven by a $74 million commercial relationship; NPL ratio at 1.16% vs. 1.04% • NCO Ratio of 0.73% vs. 1.05% in Q2; NCOs included a $34 million partial charge-off related to a commercial loan relationship classified as NPL in Q2 • Tangible book value per share decreased $1.64 or 2% to $86.30, impacted by higher unrealized losses on AFS investment securities Capital Actions: • During the quarter repurchased $179 million in common stock at an average price of $168.40 and paid quarterly common stock dividend of $0.75 per share - in Q3 declared an increase of our quarterly common stock dividend from $0.75 to $0.90 per share, paid on October 1st • YTD capital returned to shareholders of $614 million, including $459 million in common stock repurchases at an average price of $150.55 per share 4
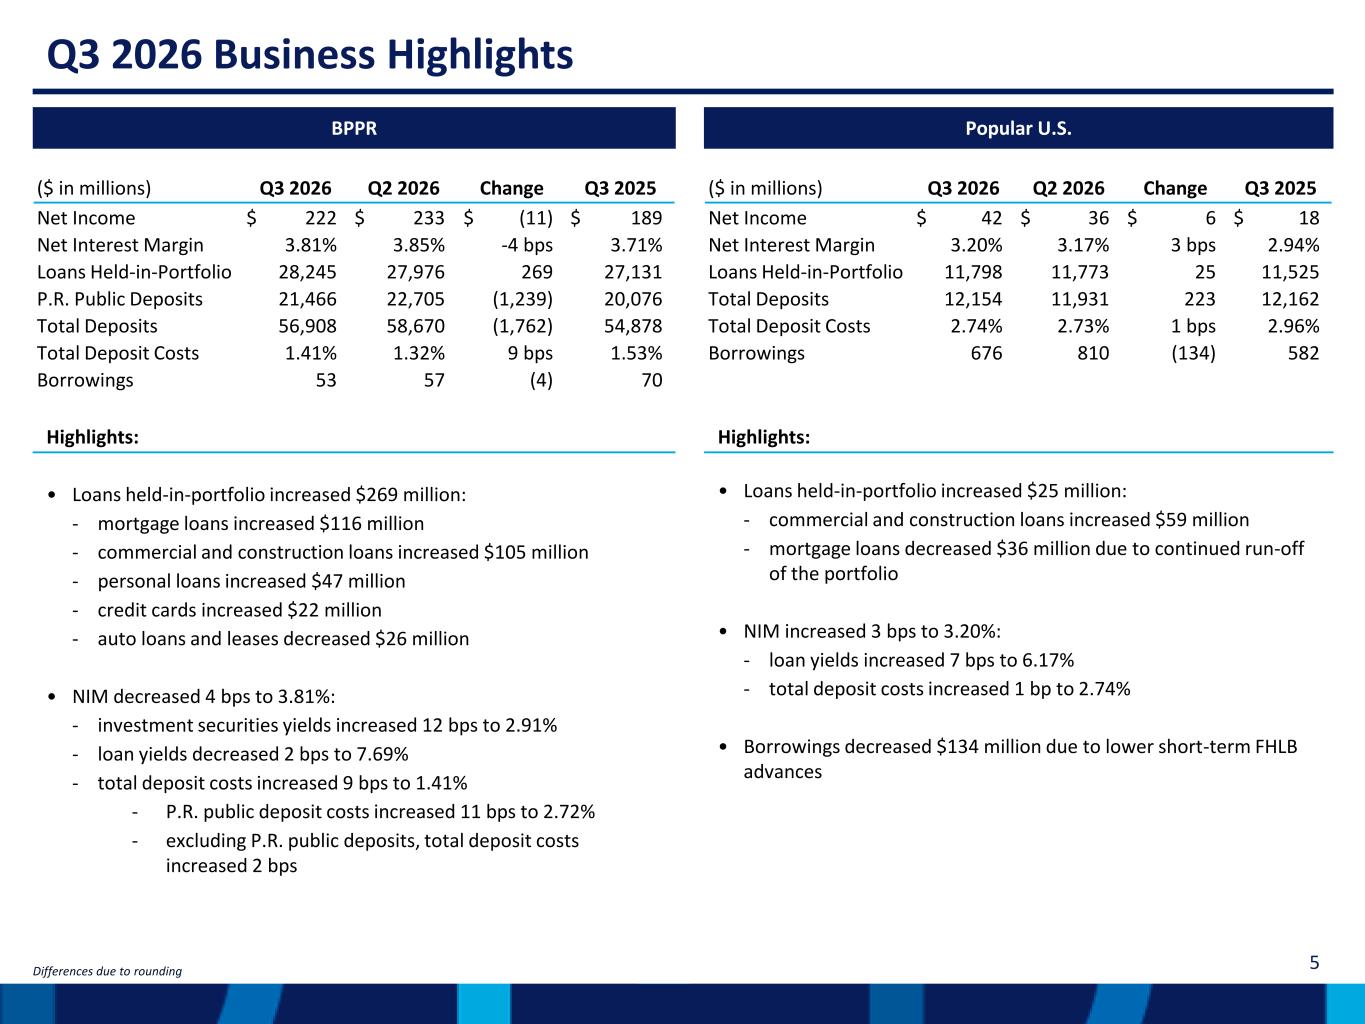
Q3 2026 Business Highlights Differences due to rounding ($ in millions) Q3 2026 Q2 2026 Change Q3 2025 Net Income $ 222 $ 233 $ (11) $ 189 Net Interest Margin 3.81% 3.85% -4 bps 3.71% Loans Held-in-Portfolio 28,245 27,976 269 27,131 P.R. Public Deposits 21,466 22,705 (1,239) 20,076 Total Deposits 56,908 58,670 (1,762) 54,878 Total Deposit Costs 1.41% 1.32% 9 bps 1.53% Borrowings 53 57 (4) 70 Highlights: • Loans held-in-portfolio increased $269 million: - mortgage loans increased $116 million - commercial and construction loans increased $105 million - personal loans increased $47 million - credit cards increased $22 million - auto loans and leases decreased $26 million • NIM decreased 4 bps to 3.81%: - investment securities yields increased 12 bps to 2.91% - loan yields decreased 2 bps to 7.69% - total deposit costs increased 9 bps to 1.41% ‐ P.R. public deposit costs increased 11 bps to 2.72% ‐ excluding P.R. public deposits, total deposit costs increased 2 bps Highlights: • Loans held-in-portfolio increased $25 million: - commercial and construction loans increased $59 million - mortgage loans decreased $36 million due to continued run-off of the portfolio • NIM increased 3 bps to 3.20%: - loan yields increased 7 bps to 6.17% - total deposit costs increased 1 bp to 2.74% • Borrowings decreased $134 million due to lower short-term FHLB advances BPPR Popular U.S. ($ in millions) Q3 2026 Q2 2026 Change Q3 2025 Net Income $ 42 $ 36 $ 6 $ 18 Net Interest Margin 3.20% 3.17% 3 bps 2.94% Loans Held-in-Portfolio 11,798 11,773 25 11,525 Total Deposits 12,154 11,931 223 12,162 Total Deposit Costs 2.74% 2.73% 1 bps 2.96% Borrowings 676 810 (134) 582 5
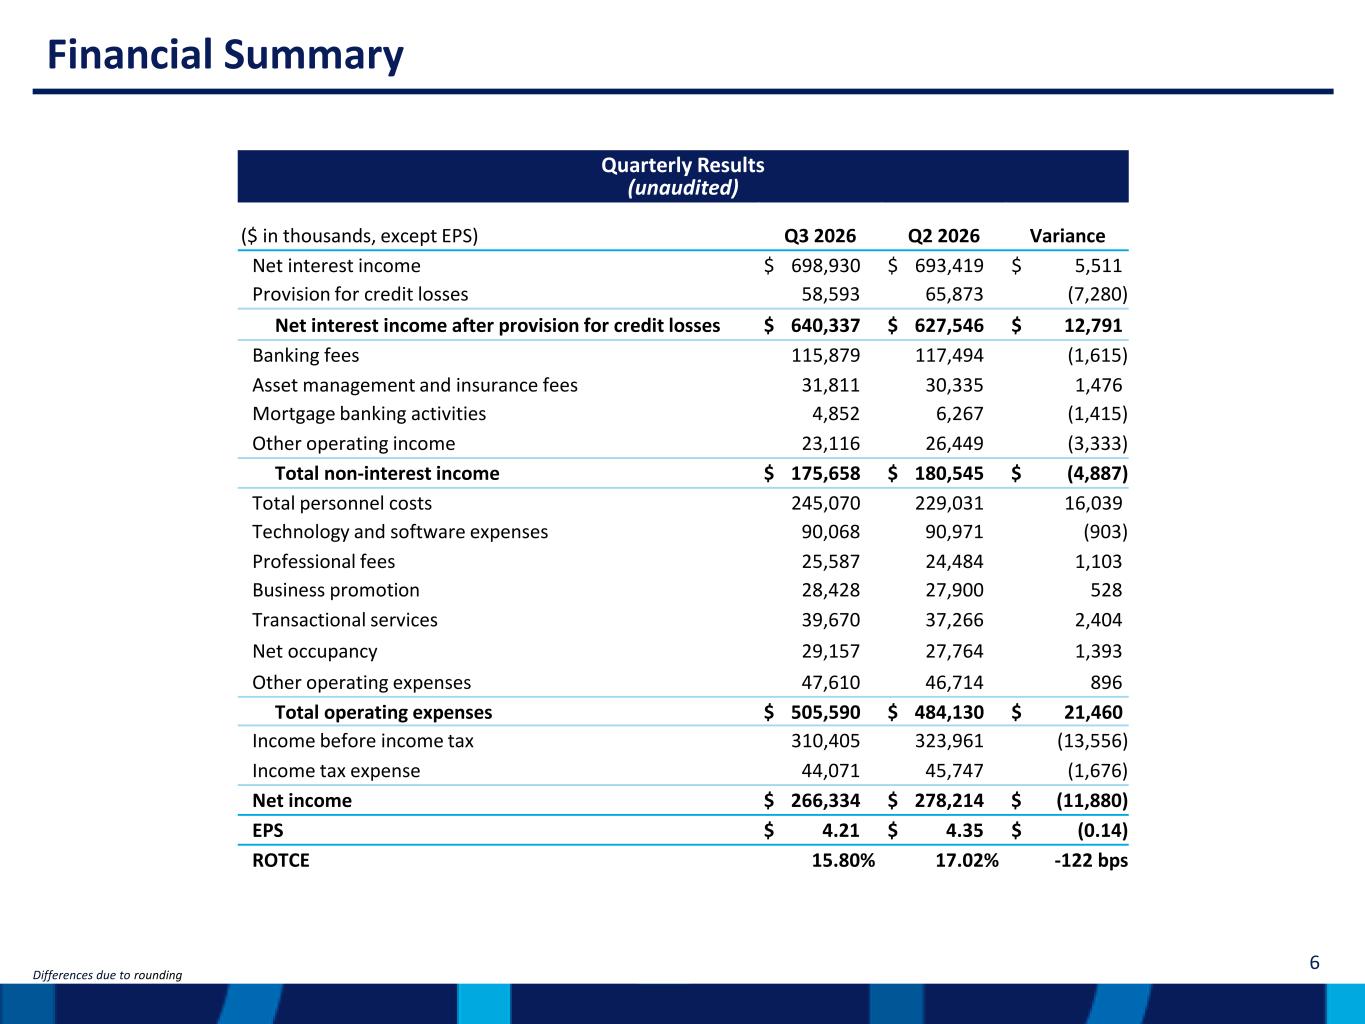
Financial Summary Differences due to rounding Quarterly Results (unaudited) ($ in thousands, except EPS) Q3 2026 Q2 2026 Variance Net interest income $ 698,930 $ 693,419 $ 5,511 Provision for credit losses 58,593 65,873 (7,280) Net interest income after provision for credit losses $ 640,337 $ 627,546 $ 12,791 Banking fees 115,879 117,494 (1,615) Asset management and insurance fees 31,811 30,335 1,476 Mortgage banking activities 4,852 6,267 (1,415) Other operating income 23,116 26,449 (3,333) Total non-interest income $ 175,658 $ 180,545 $ (4,887) Total personnel costs 245,070 229,031 16,039 Technology and software expenses 90,068 90,971 (903) Professional fees 25,587 24,484 1,103 Business promotion 28,428 27,900 528 Transactional services 39,670 37,266 2,404 Net occupancy 29,157 27,764 1,393 Other operating expenses 47,610 46,714 896 Total operating expenses $ 505,590 $ 484,130 $ 21,460 Income before income tax 310,405 323,961 (13,556) Income tax expense 44,071 45,747 (1,676) Net income $ 266,334 $ 278,214 $ (11,880) EPS $ 4.21 $ 4.35 $ (0.14) ROTCE 15.80% 17.02% -122 bps 6
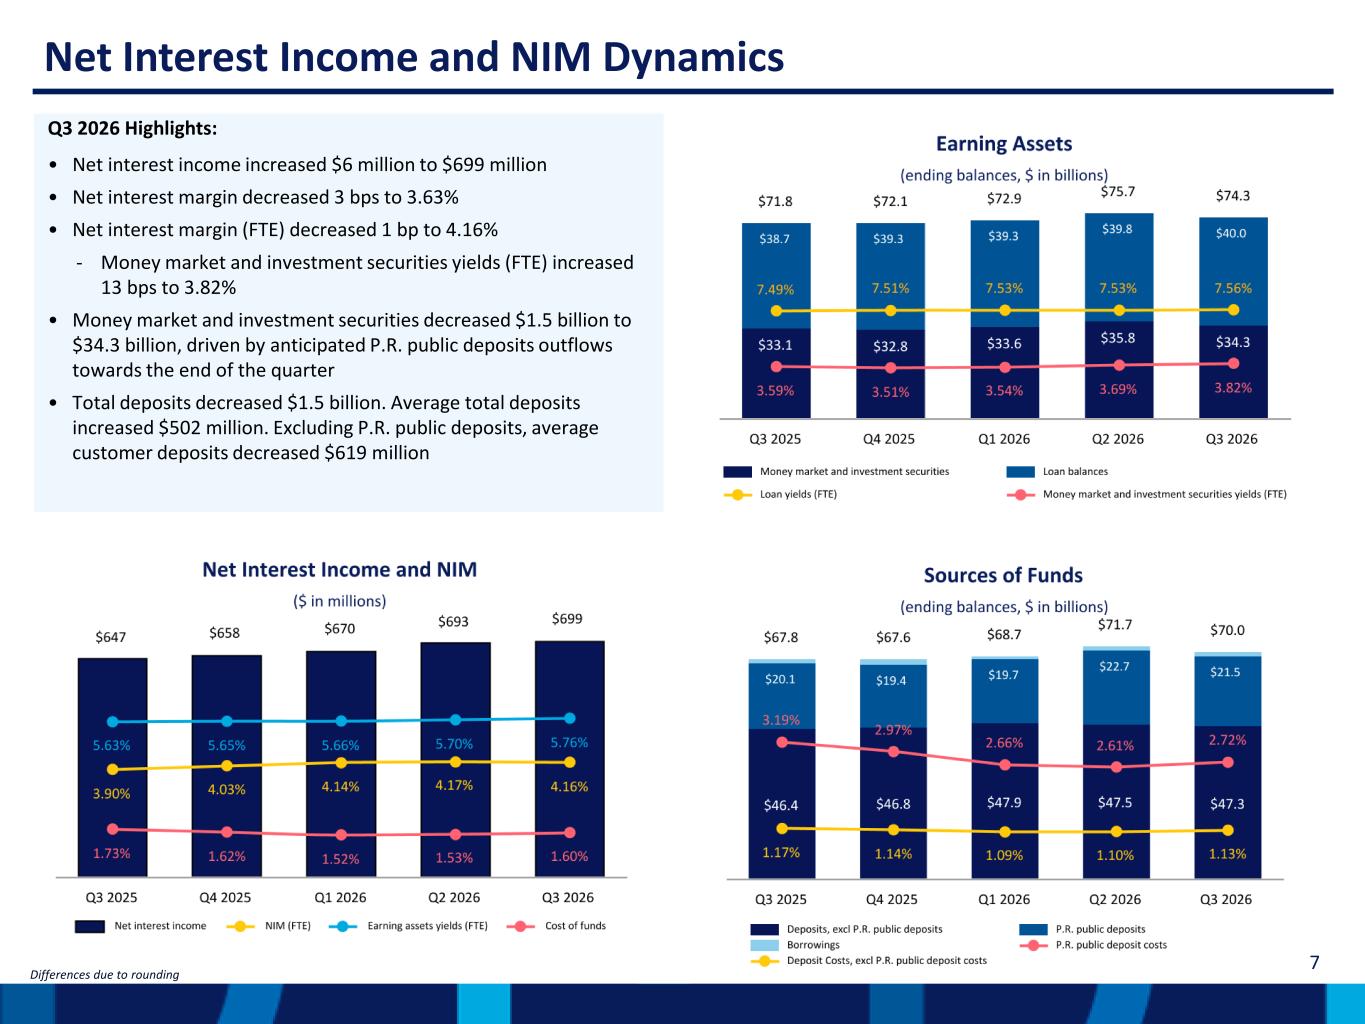
Net Interest Income and NIM Dynamics Q3 2026 Highlights: • Net interest income increased $6 million to $699 million • Net interest margin decreased 3 bps to 3.63% • Net interest margin (FTE) decreased 1 bp to 4.16% ‐ Money market and investment securities yields (FTE) increased 13 bps to 3.82% • Money market and investment securities decreased $1.5 billion to $34.3 billion, driven by anticipated P.R. public deposits outflows towards the end of the quarter • Total deposits decreased $1.5 billion. Average total deposits increased $502 million. Excluding P.R. public deposits, average customer deposits decreased $619 million Differences due to rounding 7
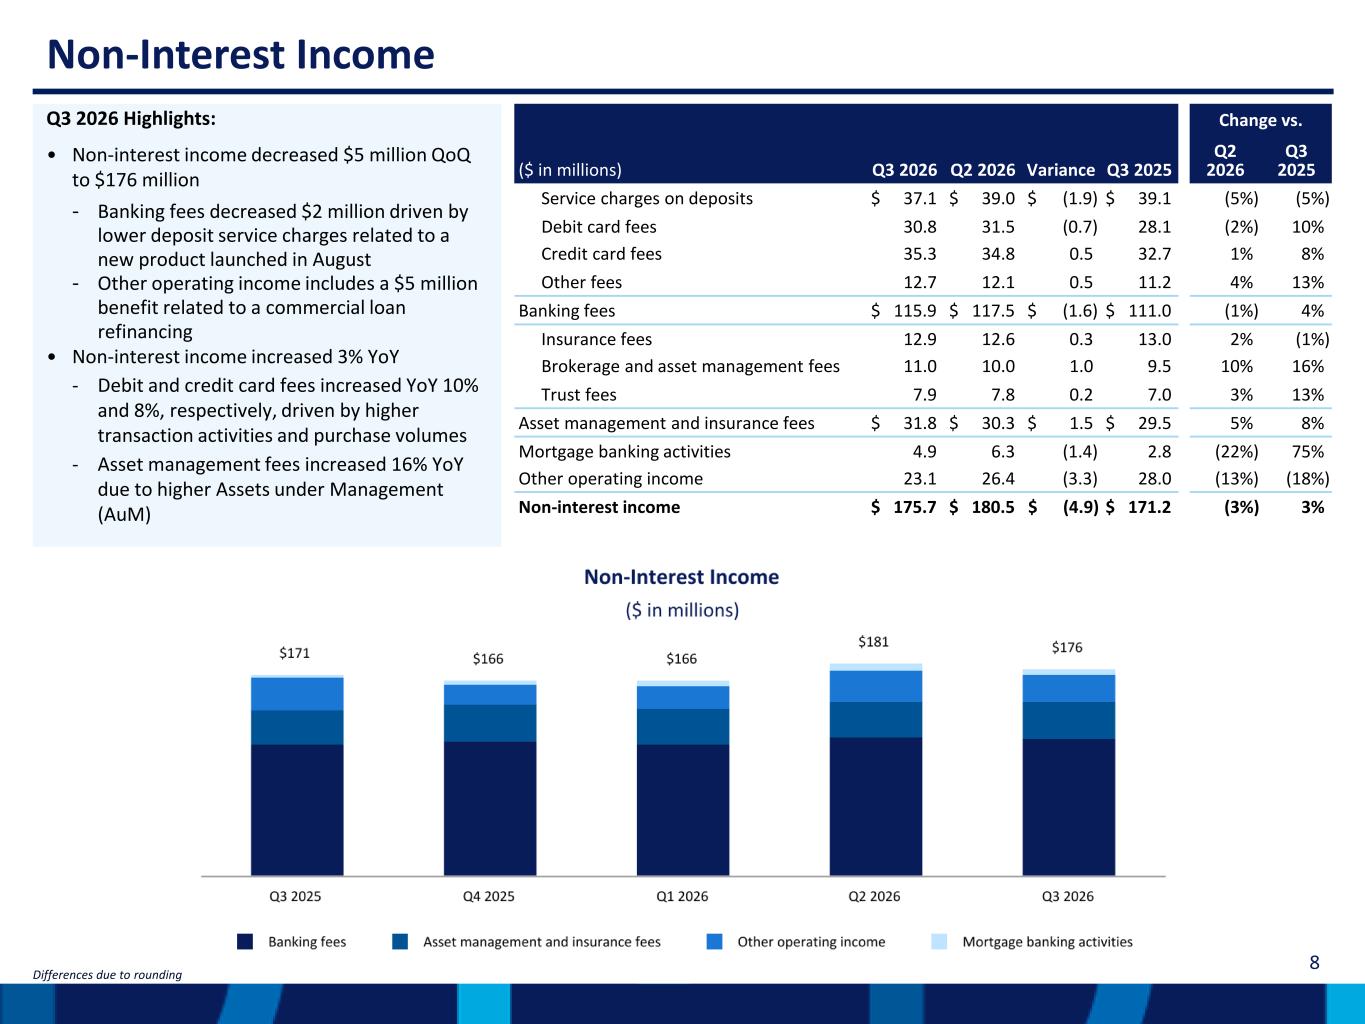
Non-Interest Income Q3 2026 Highlights: • Non-interest income decreased $5 million QoQ to $176 million - Banking fees decreased $2 million driven by lower deposit service charges related to a new product launched in August - Other operating income includes a $5 million benefit related to a commercial loan refinancing • Non-interest income increased 3% YoY - Debit and credit card fees increased YoY 10% and 8%, respectively, driven by higher transaction activities and purchase volumes - Asset management fees increased 16% YoY due to higher Assets under Management (AuM) Differences due to rounding Change vs. ($ in millions) Q3 2026 Q2 2026 Variance Q3 2025 Q2 2026 Q3 2025 Service charges on deposits $ 37.1 $ 39.0 $ (1.9) $ 39.1 (5%) (5%) Debit card fees 30.8 31.5 (0.7) 28.1 (2%) 10% Credit card fees 35.3 34.8 0.5 32.7 1% 8% Other fees 12.7 12.1 0.5 11.2 4% 13% Banking fees $ 115.9 $ 117.5 $ (1.6) $ 111.0 (1%) 4% Insurance fees 12.9 12.6 0.3 13.0 2% (1%) Brokerage and asset management fees 11.0 10.0 1.0 9.5 10% 16% Trust fees 7.9 7.8 0.2 7.0 3% 13% Asset management and insurance fees $ 31.8 $ 30.3 $ 1.5 $ 29.5 5% 8% Mortgage banking activities 4.9 6.3 (1.4) 2.8 (22%) 75% Other operating income 23.1 26.4 (3.3) 28.0 (13%) (18%) Non-interest income $ 175.7 $ 180.5 $ (4.9) $ 171.2 (3%) 3% 8
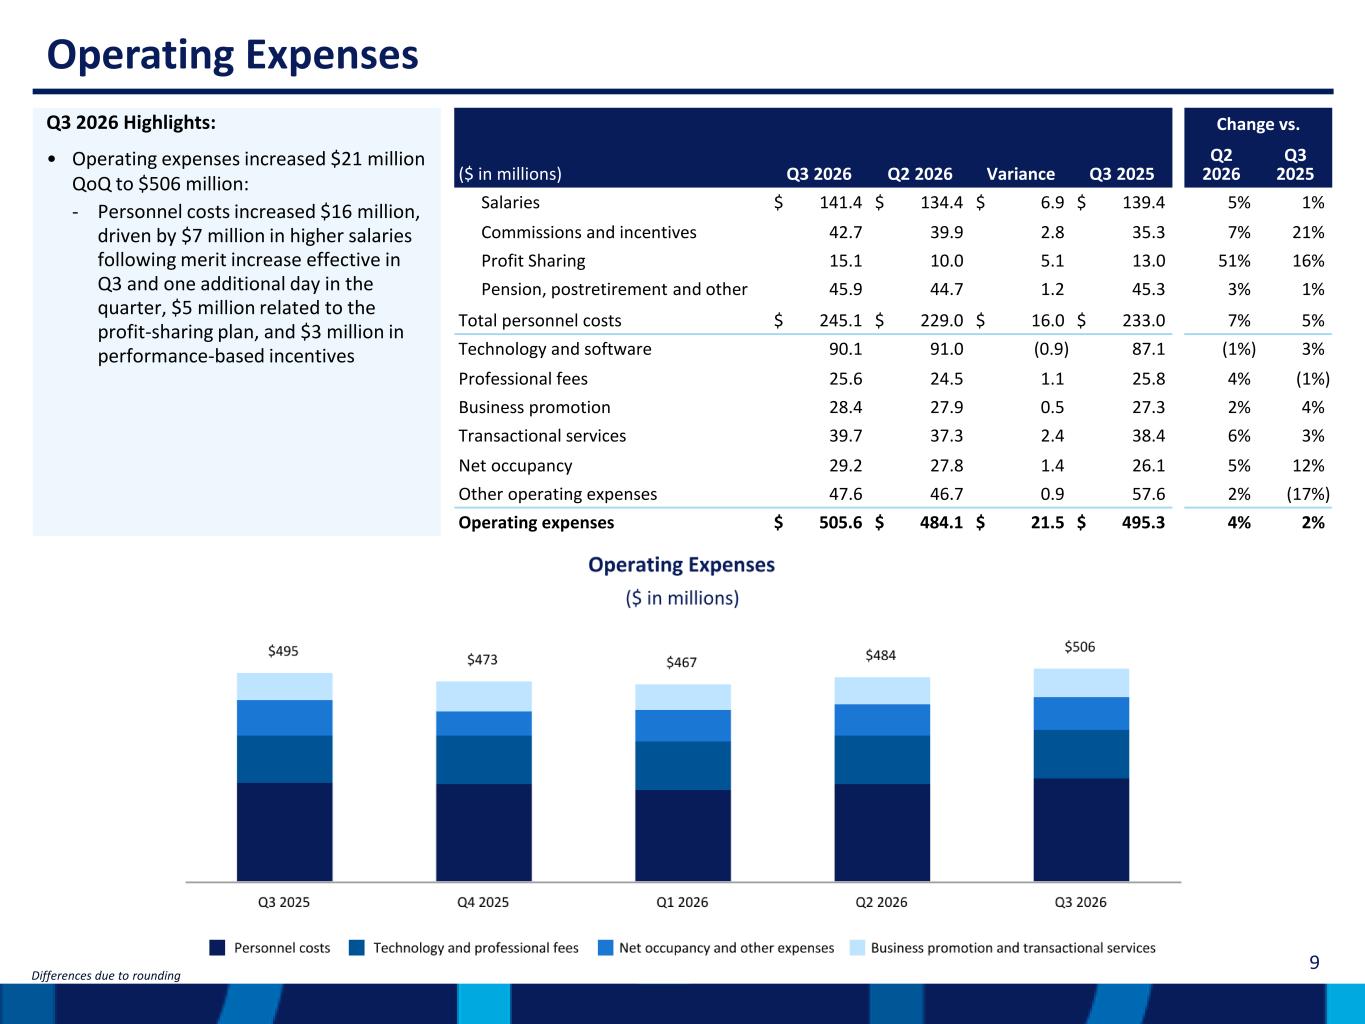
Operating Expenses Differences due to rounding Q3 2026 Highlights: • Operating expenses increased $21 million QoQ to $506 million: - Personnel costs increased $16 million, driven by $7 million in higher salaries following merit increase effective in Q3 and one additional day in the quarter, $5 million related to the profit-sharing plan, and $3 million in performance-based incentives Change vs. ($ in millions) Q3 2026 Q2 2026 Variance Q3 2025 Q2 2026 Q3 2025 Salaries $ 141.4 $ 134.4 $ 6.9 $ 139.4 5% 1% Commissions and incentives 42.7 39.9 2.8 35.3 7% 21% Profit Sharing 15.1 10.0 5.1 13.0 51% 16% Pension, postretirement and other 45.9 44.7 1.2 45.3 3% 1% Total personnel costs $ 245.1 $ 229.0 $ 16.0 $ 233.0 7% 5% Technology and software 90.1 91.0 (0.9) 87.1 (1%) 3% Professional fees 25.6 24.5 1.1 25.8 4% (1%) Business promotion 28.4 27.9 0.5 27.3 2% 4% Transactional services 39.7 37.3 2.4 38.4 6% 3% Net occupancy 29.2 27.8 1.4 26.1 5% 12% Other operating expenses 47.6 46.7 0.9 57.6 2% (17%) Operating expenses $ 505.6 $ 484.1 $ 21.5 $ 495.3 4% 2% 9
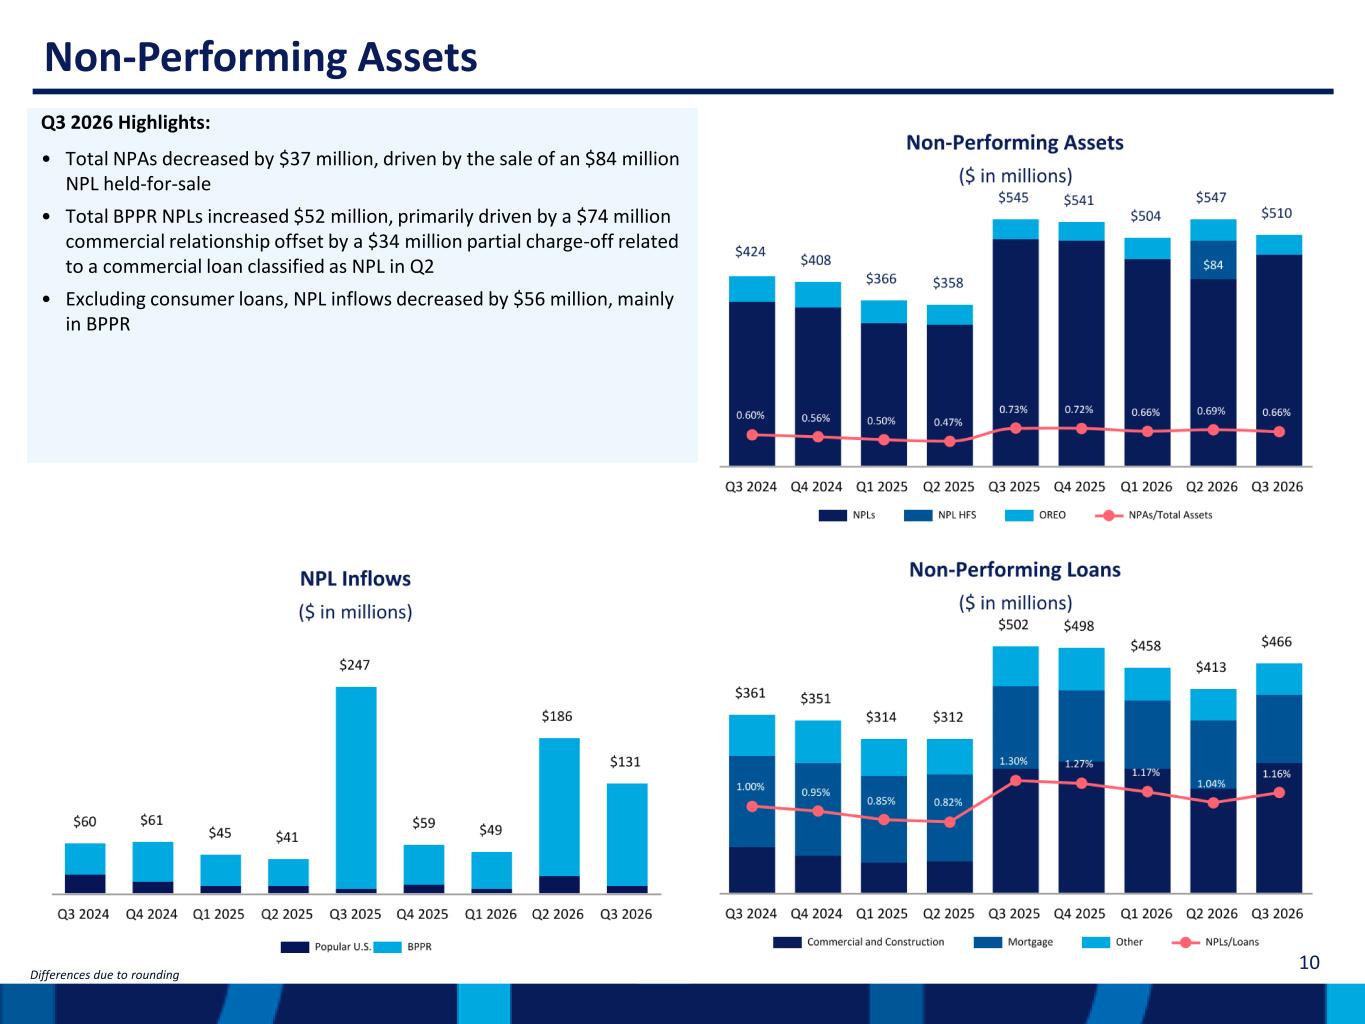
Non-Performing Assets Q3 2026 Highlights: • Total NPAs decreased by $37 million, driven by the sale of an $84 million NPL held-for-sale • Total BPPR NPLs increased $52 million, primarily driven by a $74 million commercial relationship offset by a $34 million partial charge-off related to a commercial loan classified as NPL in Q2 • Excluding consumer loans, NPL inflows decreased by $56 million, mainly in BPPR Differences due to rounding 10
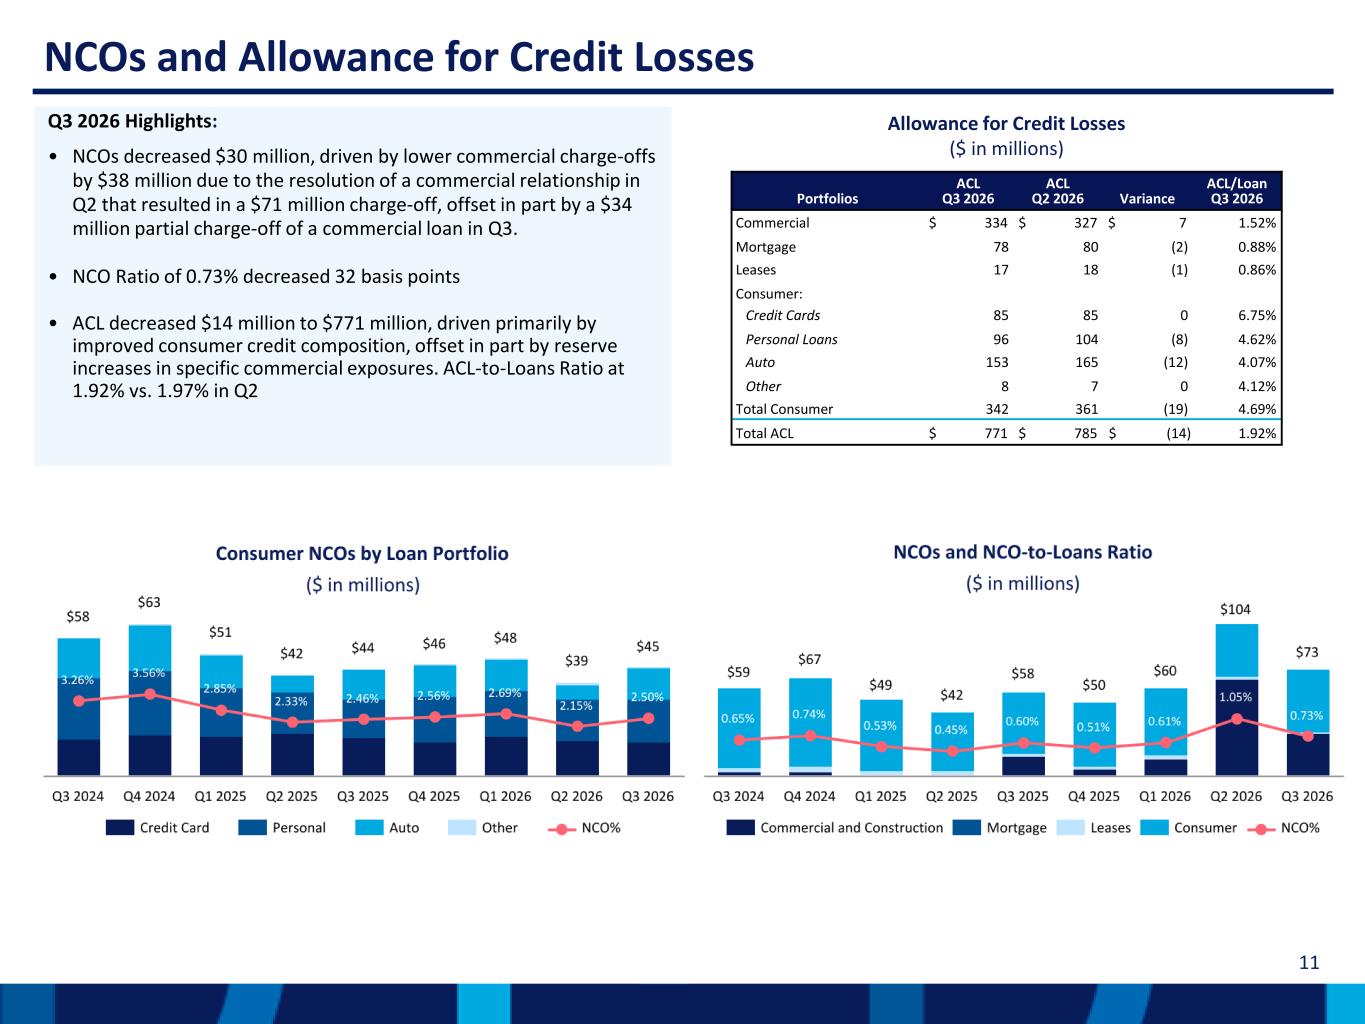
NCOs and Allowance for Credit Losses Q3 2026 Highlights: • NCOs decreased $30 million, driven by lower commercial charge-offs by $38 million due to the resolution of a commercial relationship in Q2 that resulted in a $71 million charge-off, offset in part by a $34 million partial charge-off of a commercial loan in Q3. • NCO Ratio of 0.73% decreased 32 basis points • ACL decreased $14 million to $771 million, driven primarily by improved consumer credit composition, offset in part by reserve increases in specific commercial exposures. ACL-to-Loans Ratio at 1.92% vs. 1.97% in Q2 Allowance for Credit Losses ($ in millions) 11 Portfolios ACL Q3 2026 ACL Q2 2026 Variance ACL/Loan Q3 2026 Commercial $ 334 $ 327 $ 7 1.52% Mortgage 78 80 (2) 0.88% Leases 17 18 (1) 0.86% Consumer: Credit Cards 85 85 0 6.75% Personal Loans 96 104 (8) 4.62% Auto 153 165 (12) 4.07% Other 8 7 0 4.12% Total Consumer 342 361 (19) 4.69% Total ACL $ 771 $ 785 $ (14) 1.92%
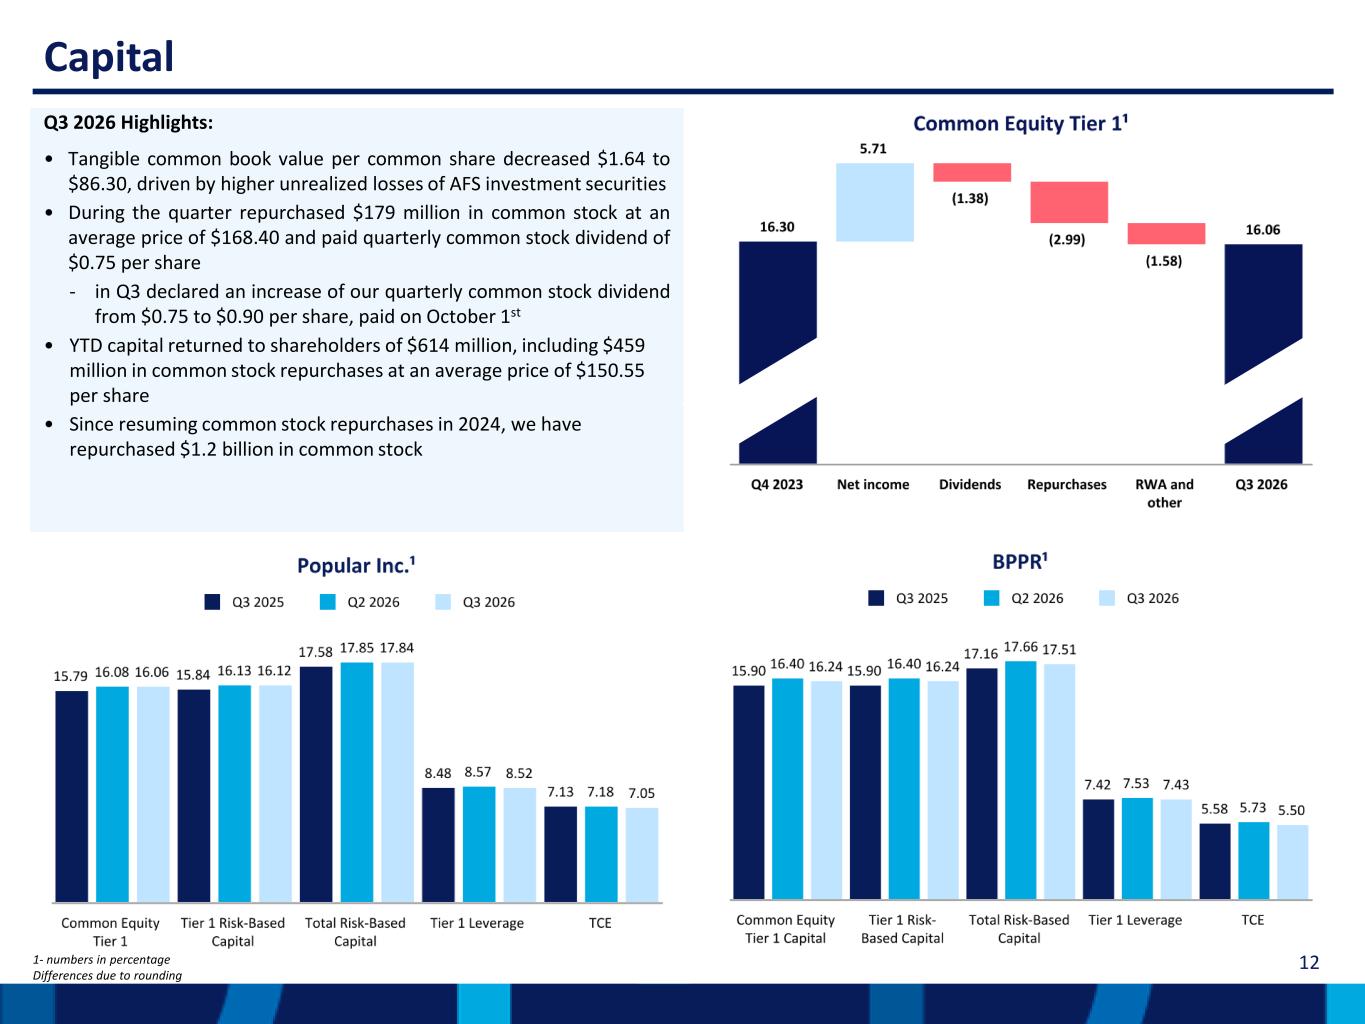
Capital Q3 2026 Highlights: • Tangible common book value per common share decreased $1.64 to $86.30, driven by higher unrealized losses of AFS investment securities • During the quarter repurchased $179 million in common stock at an average price of $168.40 and paid quarterly common stock dividend of $0.75 per share ‐ in Q3 declared an increase of our quarterly common stock dividend from $0.75 to $0.90 per share, paid on October 1st • YTD capital returned to shareholders of $614 million, including $459 million in common stock repurchases at an average price of $150.55 per share • Since resuming common stock repurchases in 2024, we have repurchased $1.2 billion in common stock 121- numbers in percentage Differences due to rounding
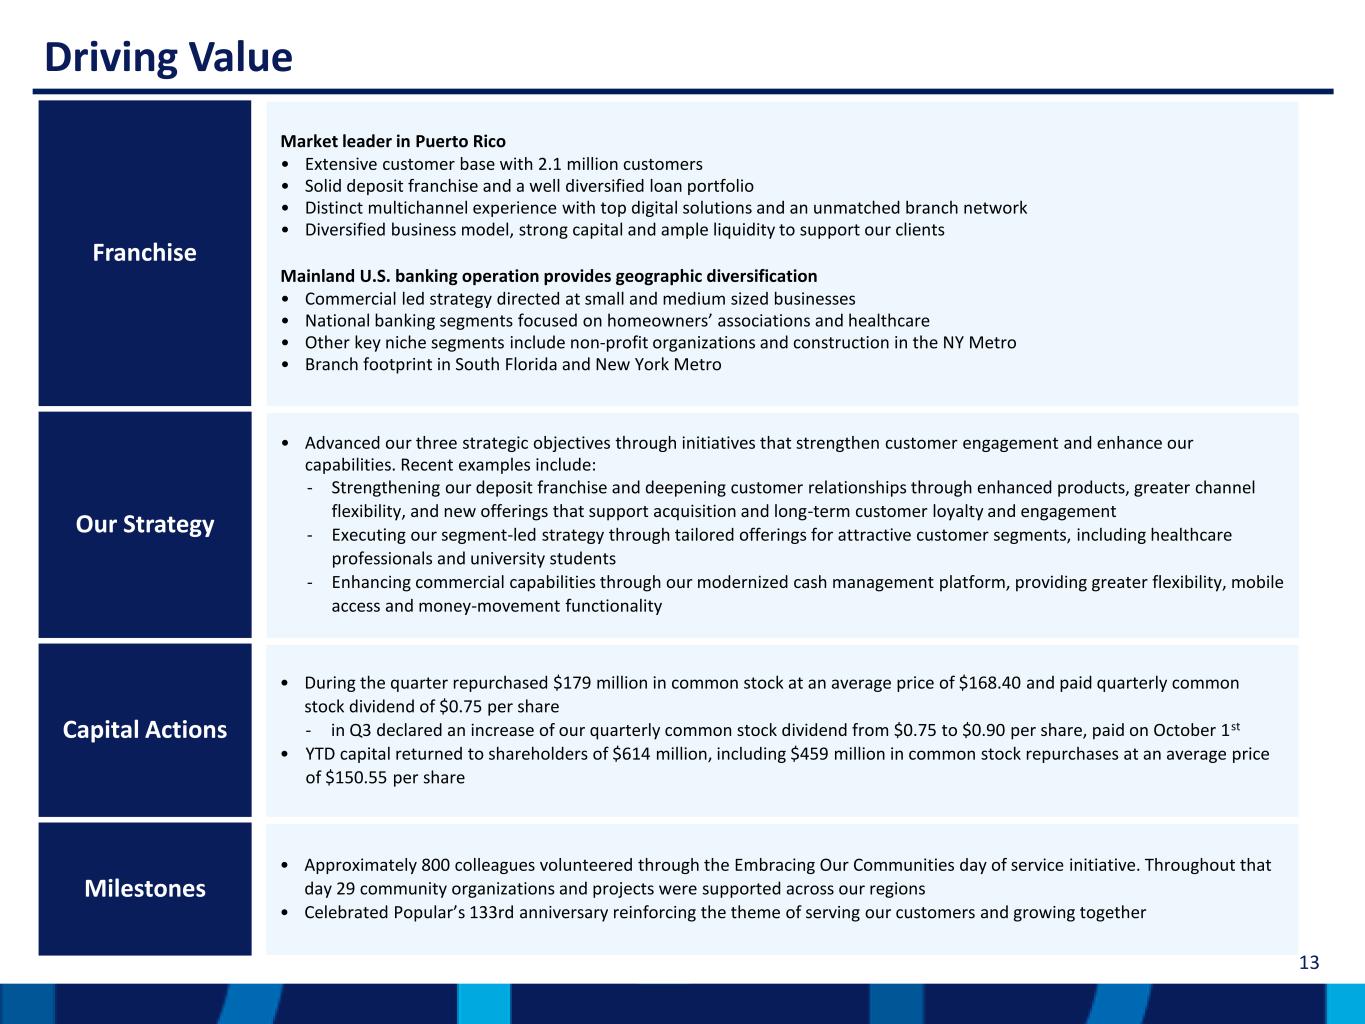
13 Driving Value Franchise Market leader in Puerto Rico • Extensive customer base with 2.1 million customers • Solid deposit franchise and a well diversified loan portfolio • Distinct multichannel experience with top digital solutions and an unmatched branch network • Diversified business model, strong capital and ample liquidity to support our clients Mainland U.S. banking operation provides geographic diversification • Commercial led strategy directed at small and medium sized businesses • National banking segments focused on homeowners’ associations and healthcare • Other key niche segments include non-profit organizations and construction in the NY Metro • Branch footprint in South Florida and New York Metro Our Strategy • Advanced our three strategic objectives through initiatives that strengthen customer engagement and enhance our capabilities. Recent examples include: ‐ Strengthening our deposit franchise and deepening customer relationships through enhanced products, greater channel flexibility, and new offerings that support acquisition and long-term customer loyalty and engagement ‐ Executing our segment-led strategy through tailored offerings for attractive customer segments, including healthcare professionals and university students ‐ Enhancing commercial capabilities through our modernized cash management platform, providing greater flexibility, mobile access and money-movement functionality Capital Actions • During the quarter repurchased $179 million in common stock at an average price of $168.40 and paid quarterly common stock dividend of $0.75 per share ‐ in Q3 declared an increase of our quarterly common stock dividend from $0.75 to $0.90 per share, paid on October 1st • YTD capital returned to shareholders of $614 million, including $459 million in common stock repurchases at an average price of $150.55 per share Milestones • Approximately 800 colleagues volunteered through the Embracing Our Communities day of service initiative. Throughout that day 29 community organizations and projects were supported across our regions • Celebrated Popular’s 133rd anniversary reinforcing the theme of serving our customers and growing together
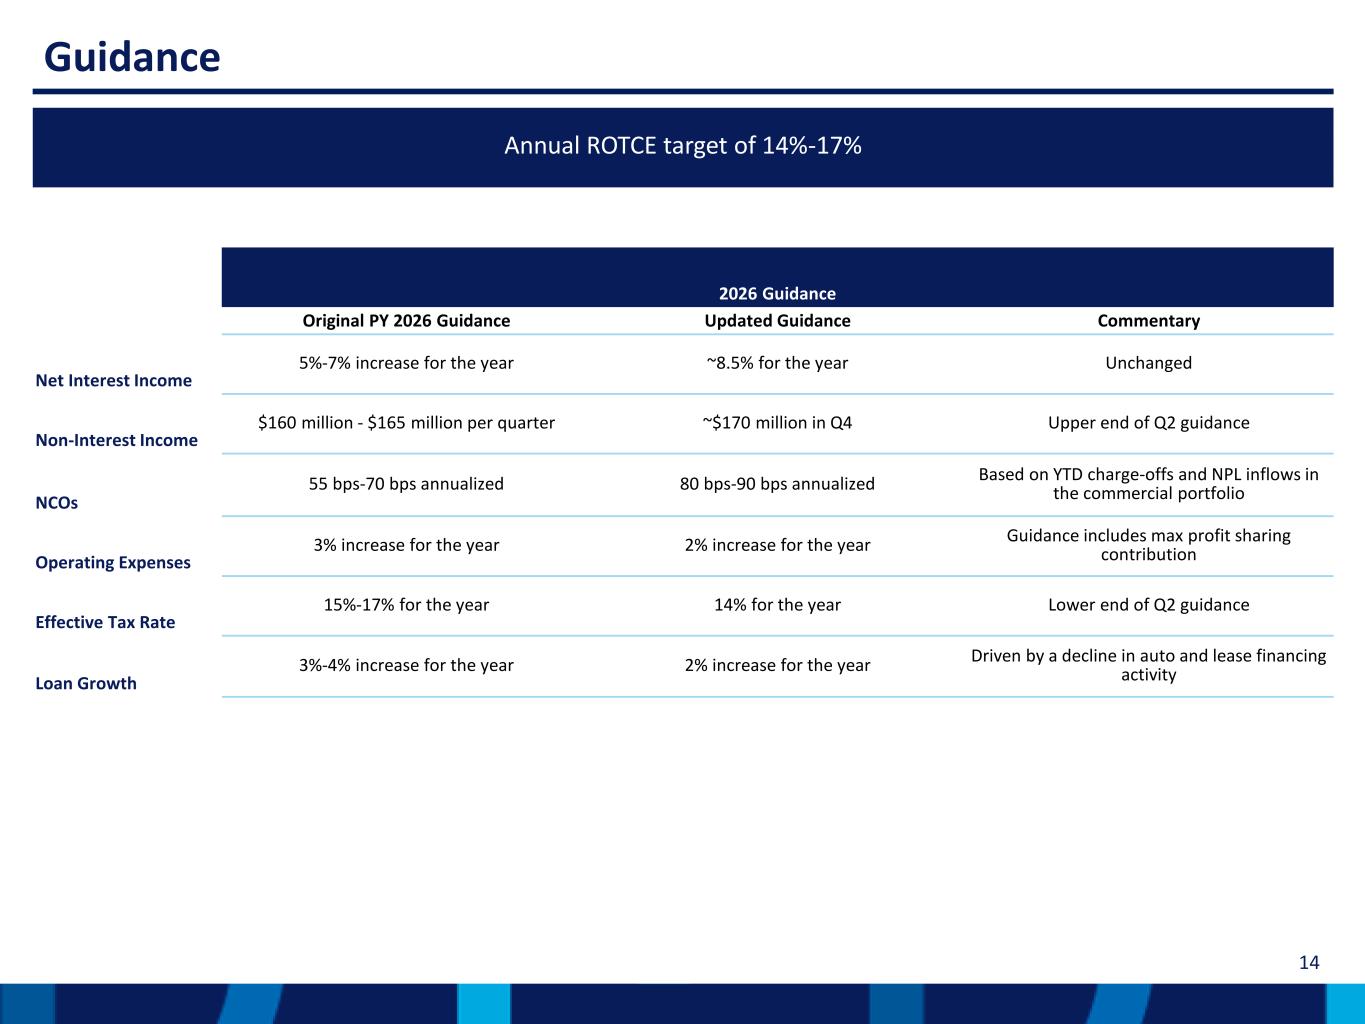
14 Guidance 2026 Guidance Original PY 2026 Guidance Updated Guidance Commentary Net Interest Income 5%-7% increase for the year ~8.5% for the year Unchanged Non-Interest Income $160 million - $165 million per quarter ~$170 million in Q4 Upper end of Q2 guidance NCOs 55 bps-70 bps annualized 80 bps-90 bps annualized Based on YTD charge-offs and NPL inflows in the commercial portfolio Operating Expenses 3% increase for the year 2% increase for the year Guidance includes max profit sharing contribution Effective Tax Rate 15%-17% for the year 14% for the year Lower end of Q2 guidance Loan Growth 3%-4% increase for the year 2% increase for the year Driven by a decline in auto and lease financing activity Annual ROTCE target of 14%-17%
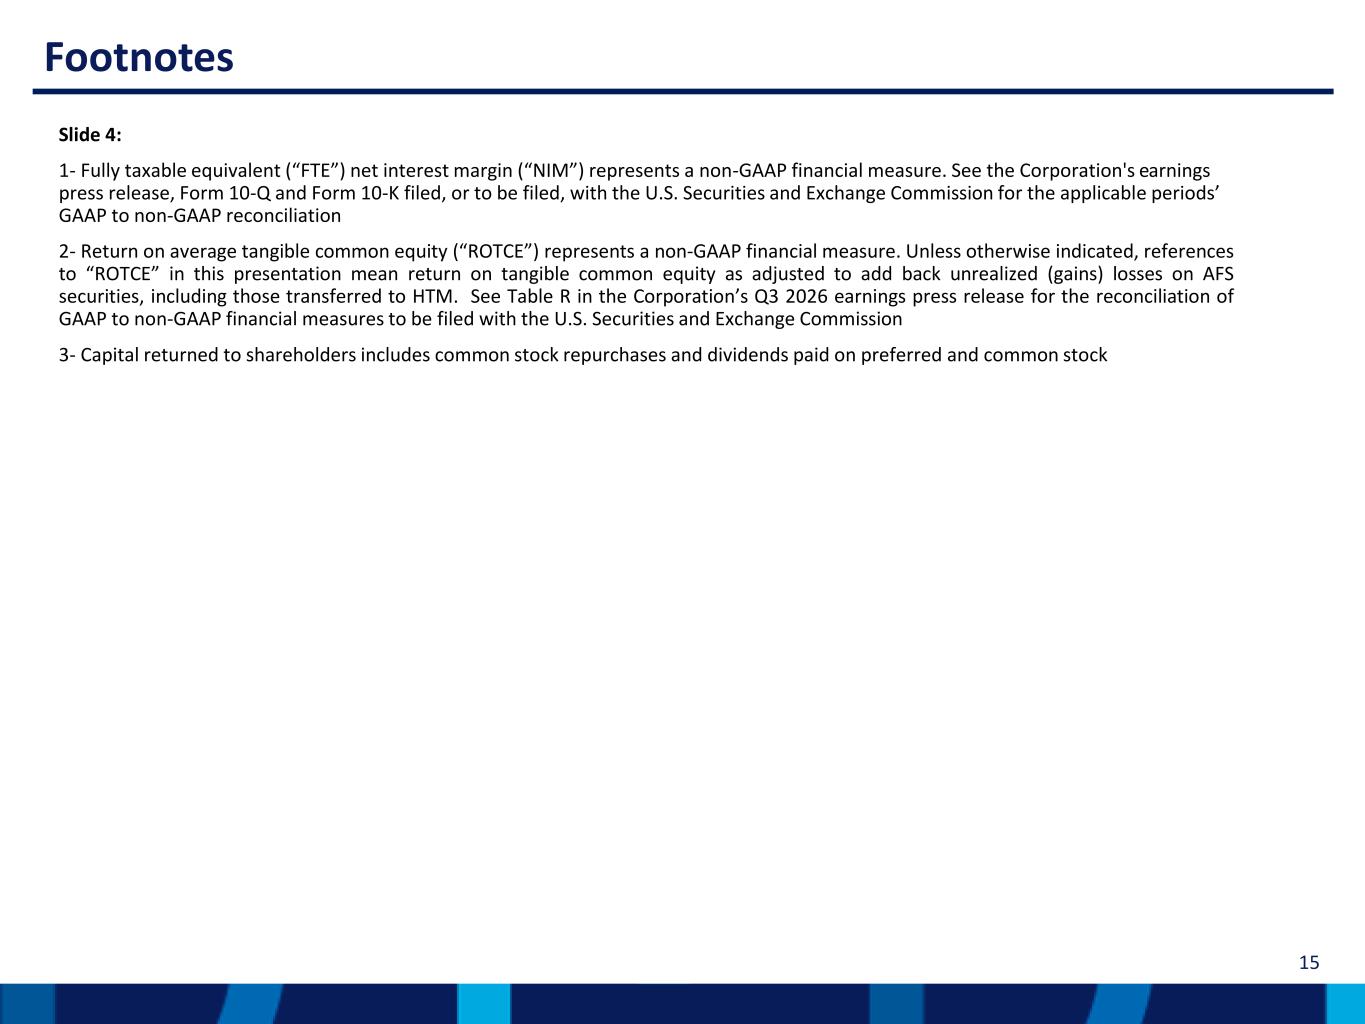
15 Footnotes Slide 4: 1- Fully taxable equivalent (“FTE”) net interest margin (“NIM”) represents a non-GAAP financial measure. See the Corporation's earnings press release, Form 10-Q and Form 10-K filed, or to be filed, with the U.S. Securities and Exchange Commission for the applicable periods’ GAAP to non-GAAP reconciliation 2- Return on average tangible common equity (“ROTCE”) represents a non-GAAP financial measure. Unless otherwise indicated, references to “ROTCE” in this presentation mean return on tangible common equity as adjusted to add back unrealized (gains) losses on AFS securities, including those transferred to HTM. See Table R in the Corporation’s Q3 2026 earnings press release for the reconciliation of GAAP to non-GAAP financial measures to be filed with the U.S. Securities and Exchange Commission 3- Capital returned to shareholders includes common stock repurchases and dividends paid on preferred and common stock

Investor Presentation Third Quarter 2026 Appendix
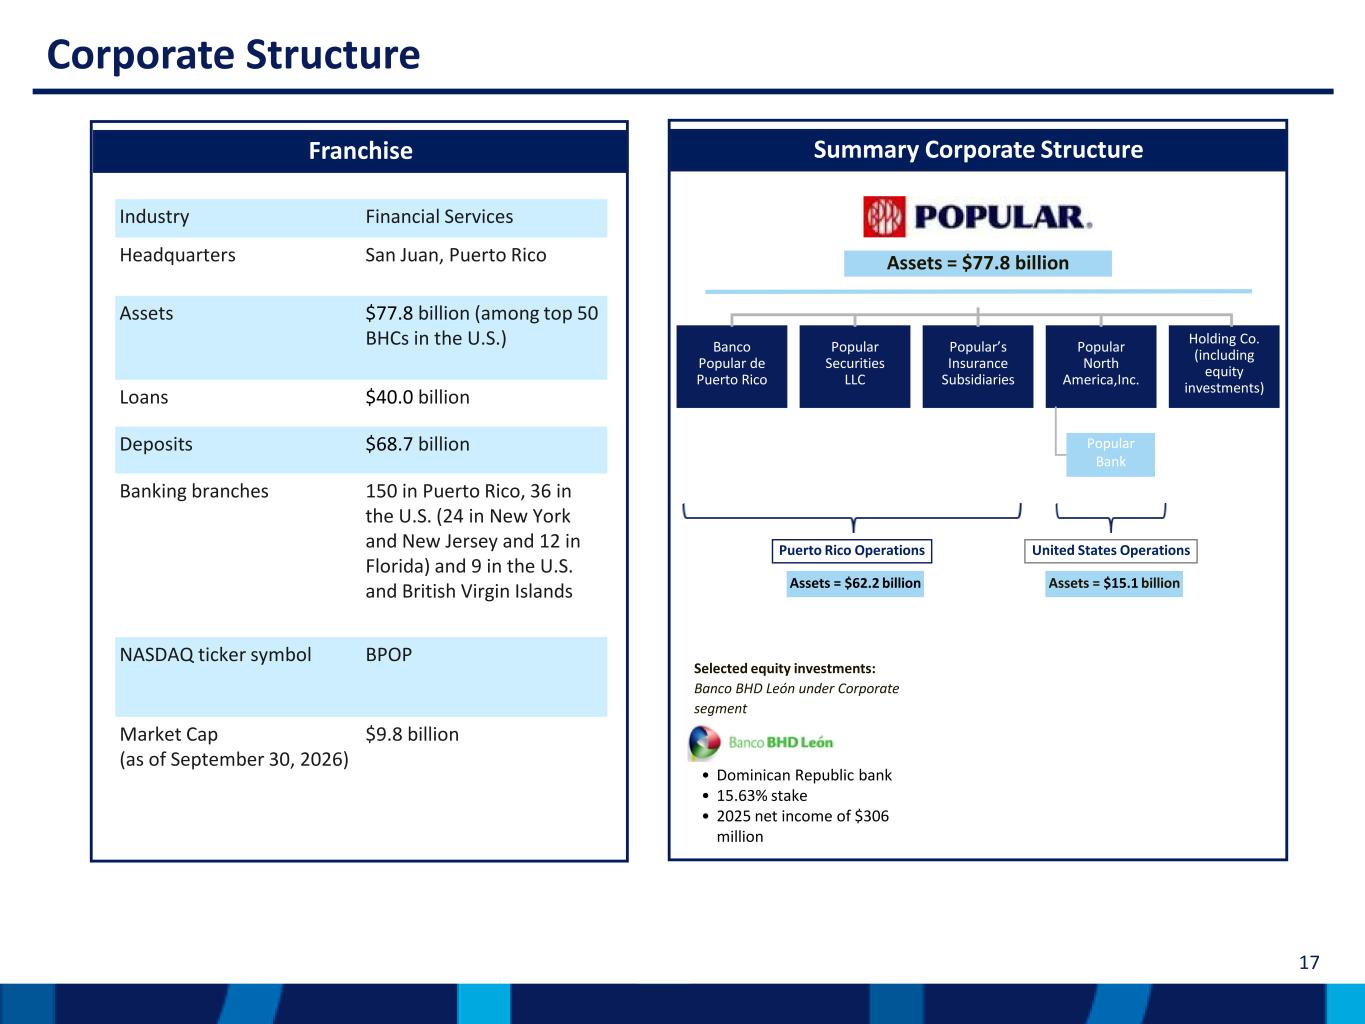
Earnings Earnings 17 Corporate Structure Summary Corporate Structure Banco Popular de Puerto Rico Franchise Selected equity investments: Banco BHD León under Corporate segment • Dominican Republic bank • 15.63% stake • 2025 net income of $306 million Industry Financial Services Headquarters San Juan, Puerto Rico Assets $77.8 billion (among top 50 BHCs in the U.S.) Loans $40.0 billion Deposits $68.7 billion Banking branches 150 in Puerto Rico, 36 in the U.S. (24 in New York and New Jersey and 12 in Florida) and 9 in the U.S. and British Virgin Islands NASDAQ ticker symbol BPOP Market Cap (as of September 30, 2026) $9.8 billion Assets = $77.8 billion Assets = $62.2 billion Assets = $15.1 billion Puerto Rico Operations United States Operations Popular Securities LLC Popular’s Insurance Subsidiaries Popular North America,Inc. Holding Co. (including equity investments) Popular Bank
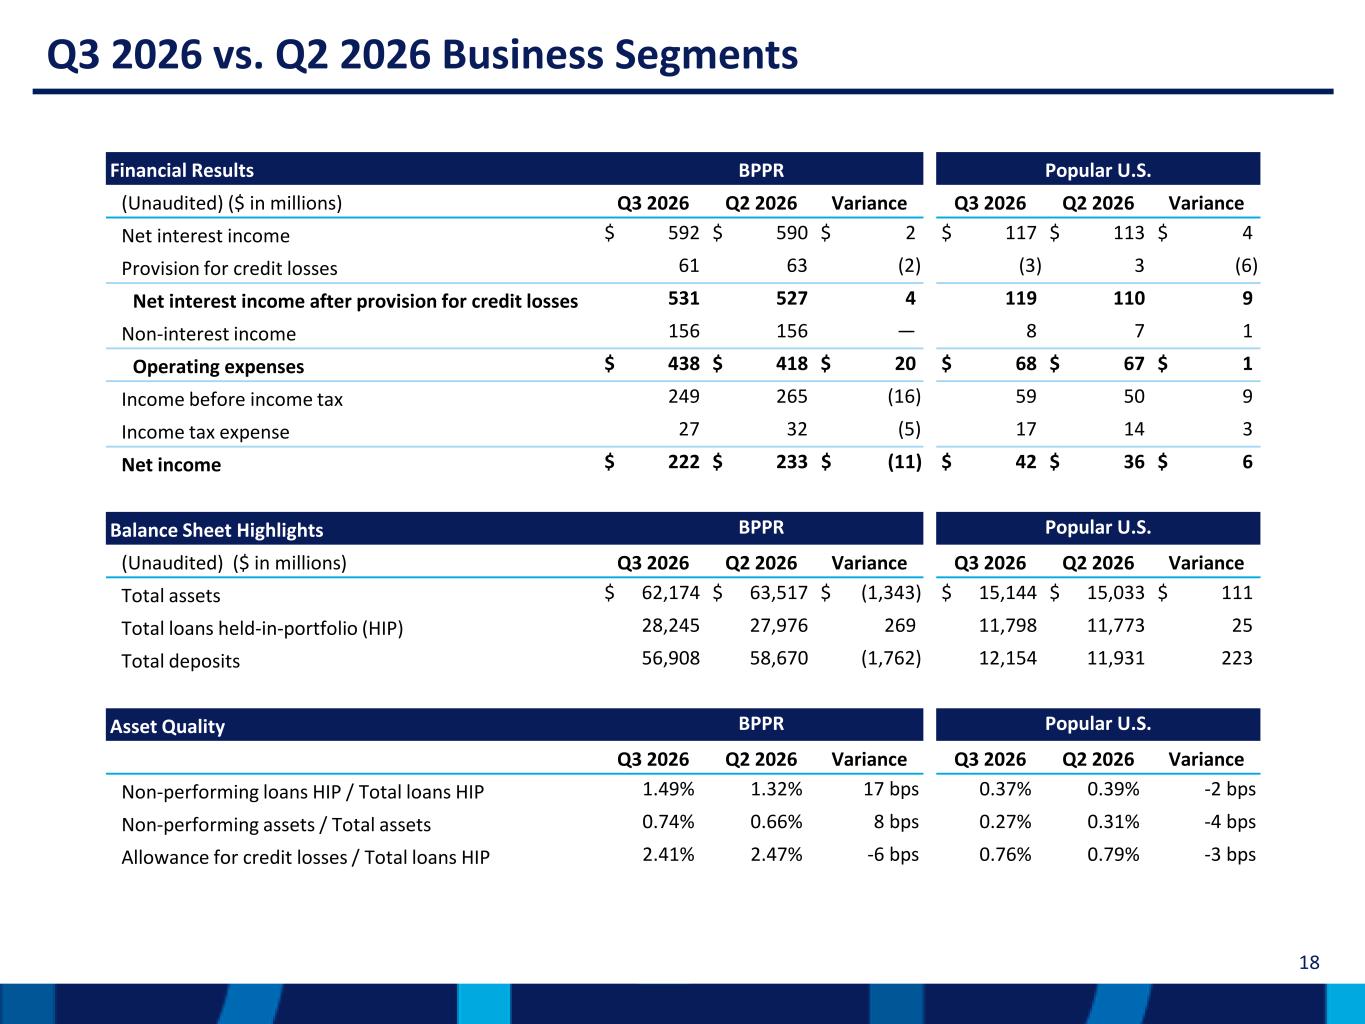
18 Q3 2026 vs. Q2 2026 Business Segments Financial Results BPPR Popular U.S. (Unaudited) ($ in millions) Q3 2026 Q2 2026 Variance Q3 2026 Q2 2026 Variance Net interest income $ 592 $ 590 $ 2 $ 117 $ 113 $ 4 Provision for credit losses 61 63 (2) (3) 3 (6) Net interest income after provision for credit losses 531 527 4 119 110 9 Non-interest income 156 156 — 8 7 1 Operating expenses $ 438 $ 418 $ 20 $ 68 $ 67 $ 1 Income before income tax 249 265 (16) 59 50 9 Income tax expense 27 32 (5) 17 14 3 Net income $ 222 $ 233 $ (11) $ 42 $ 36 $ 6 Balance Sheet Highlights BPPR Popular U.S. (Unaudited) ($ in millions) Q3 2026 Q2 2026 Variance Q3 2026 Q2 2026 Variance Total assets $ 62,174 $ 63,517 $ (1,343) $ 15,144 $ 15,033 $ 111 Total loans held-in-portfolio (HIP) 28,245 27,976 269 11,798 11,773 25 Total deposits 56,908 58,670 (1,762) 12,154 11,931 223 Asset Quality BPPR Popular U.S. Q3 2026 Q2 2026 Variance Q3 2026 Q2 2026 Variance Non-performing loans HIP / Total loans HIP 1.49% 1.32% 17 bps 0.37% 0.39% -2 bps Non-performing assets / Total assets 0.74% 0.66% 8 bps 0.27% 0.31% -4 bps Allowance for credit losses / Total loans HIP 2.41% 2.47% -6 bps 0.76% 0.79% -3 bps
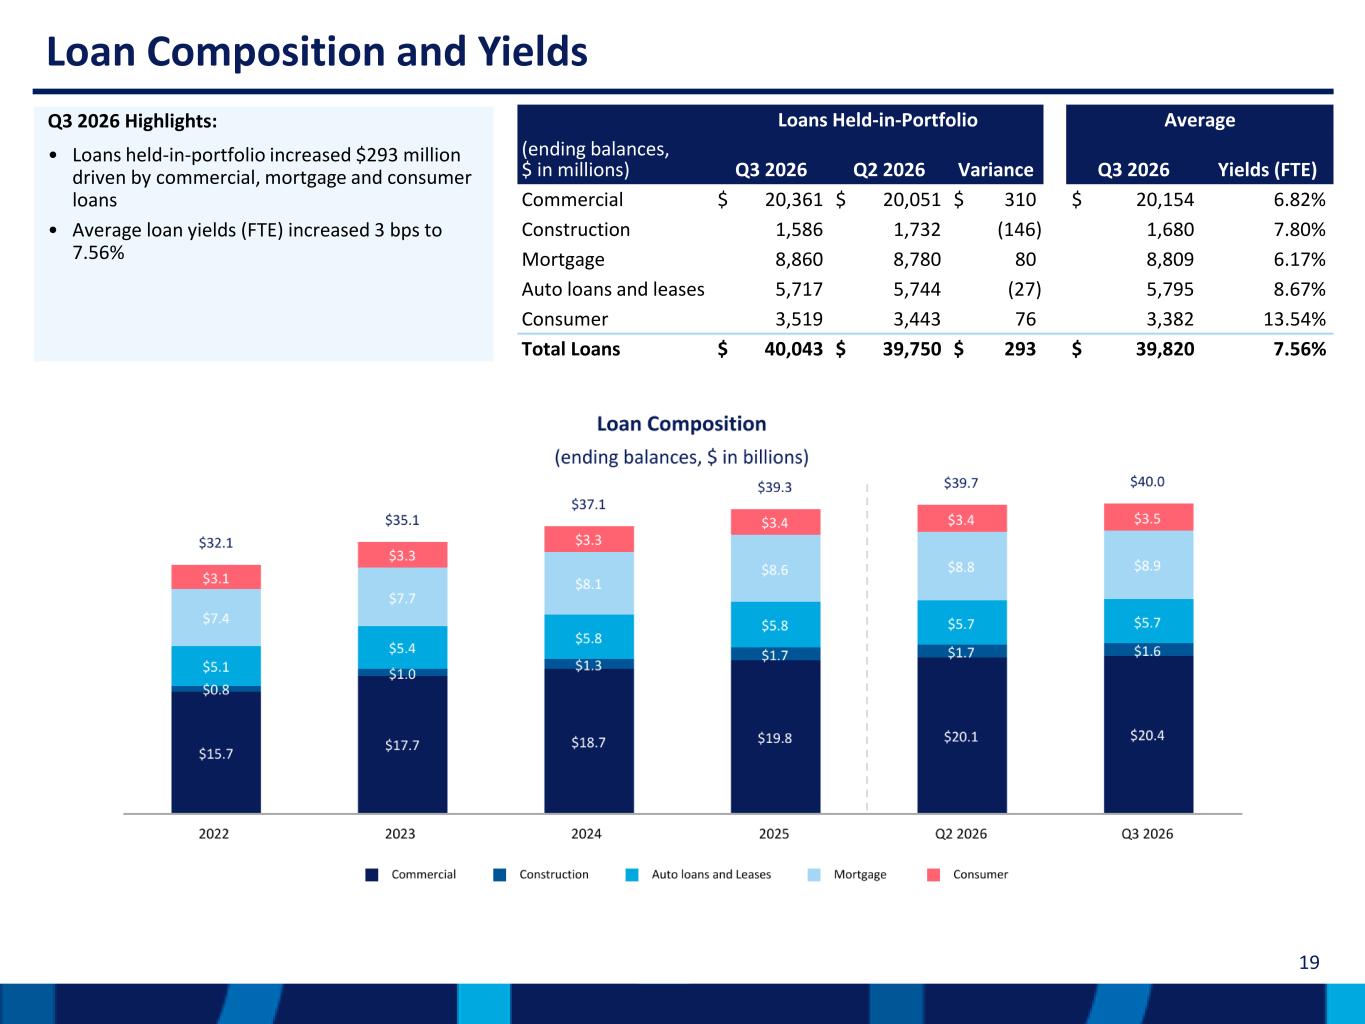
19 Loan Composition and Yields Q3 2026 Highlights: • Loans held-in-portfolio increased $293 million driven by commercial, mortgage and consumer loans • Average loan yields (FTE) increased 3 bps to 7.56% Loans Held-in-Portfolio Average (ending balances, $ in millions) Q3 2026 Q2 2026 Variance Q3 2026 Yields (FTE) Commercial $ 20,361 $ 20,051 $ 310 $ 20,154 6.82% Construction 1,586 1,732 (146) 1,680 7.80% Mortgage 8,860 8,780 80 8,809 6.17% Auto loans and leases 5,717 5,744 (27) 5,795 8.67% Consumer 3,519 3,443 76 3,382 13.54% Total Loans $ 40,043 $ 39,750 $ 293 $ 39,820 7.56%
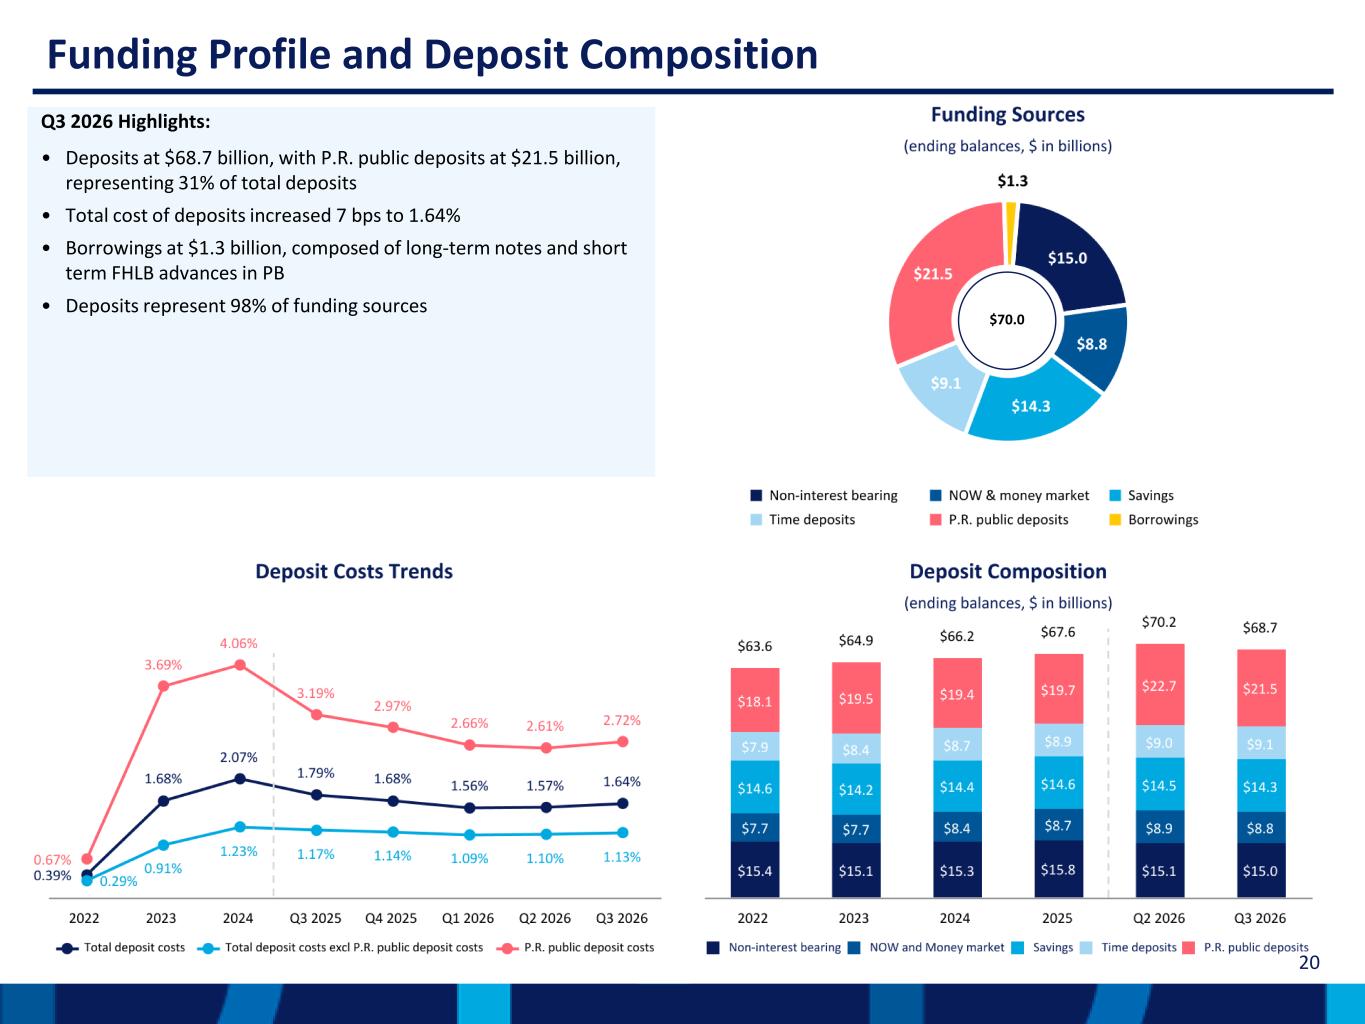
20 Funding Profile and Deposit Composition Q3 2026 Highlights: • Deposits at $68.7 billion, with P.R. public deposits at $21.5 billion, representing 31% of total deposits • Total cost of deposits increased 7 bps to 1.64% • Borrowings at $1.3 billion, composed of long-term notes and short term FHLB advances in PB • Deposits represent 98% of funding sources $70.0
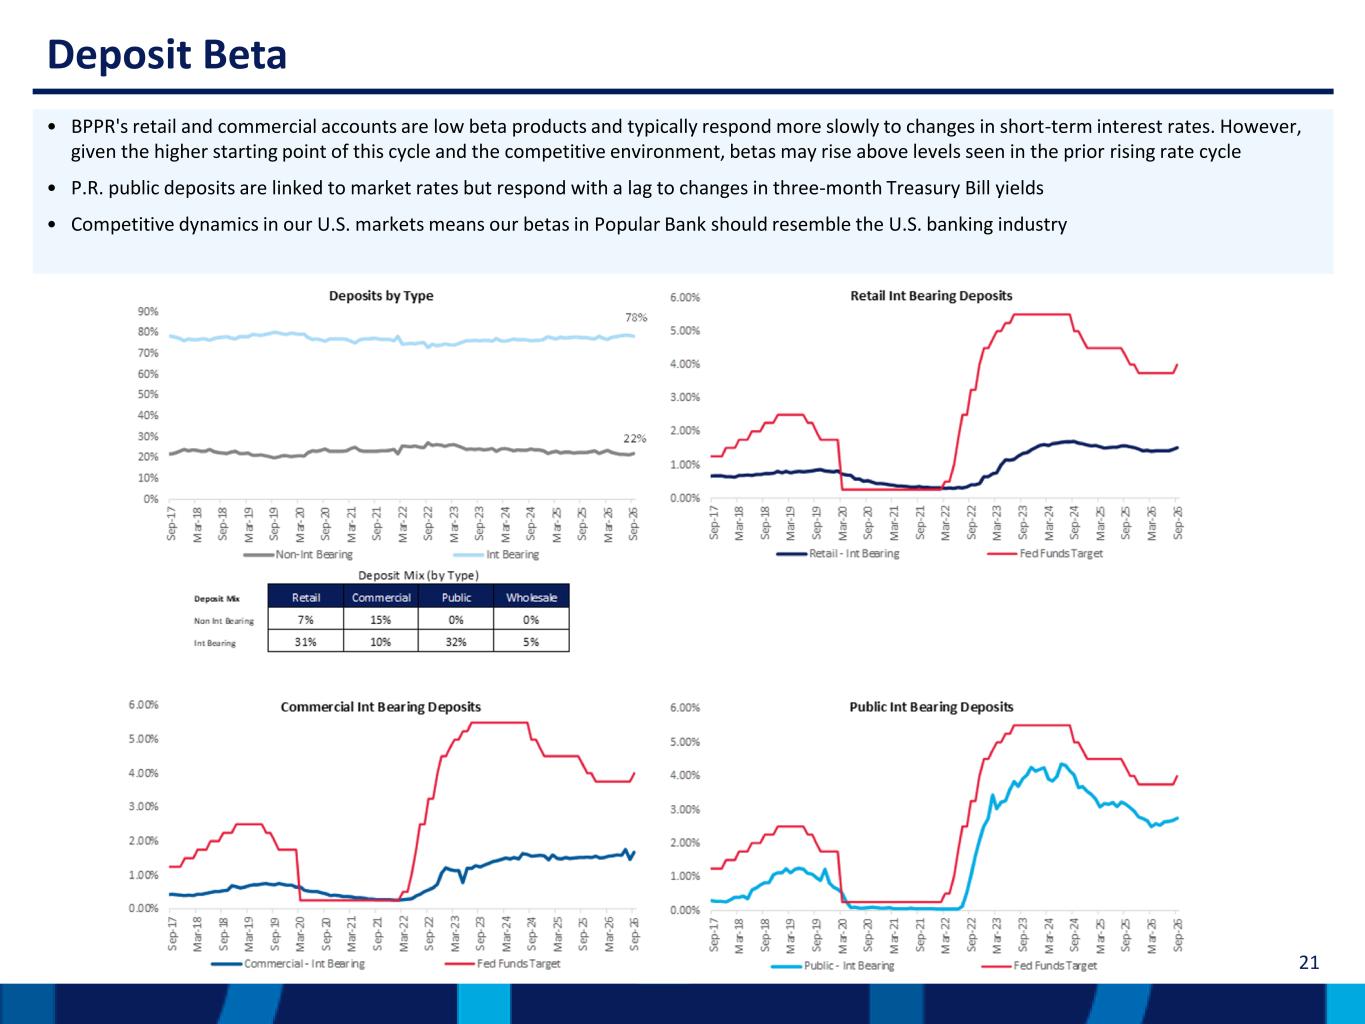
21 Deposit Beta • BPPR's retail and commercial accounts are low beta products and typically respond more slowly to changes in short-term interest rates. However, given the higher starting point of this cycle and the competitive environment, betas may rise above levels seen in the prior rising rate cycle • P.R. public deposits are linked to market rates but respond with a lag to changes in three-month Treasury Bill yields • Competitive dynamics in our U.S. markets means our betas in Popular Bank should resemble the U.S. banking industry
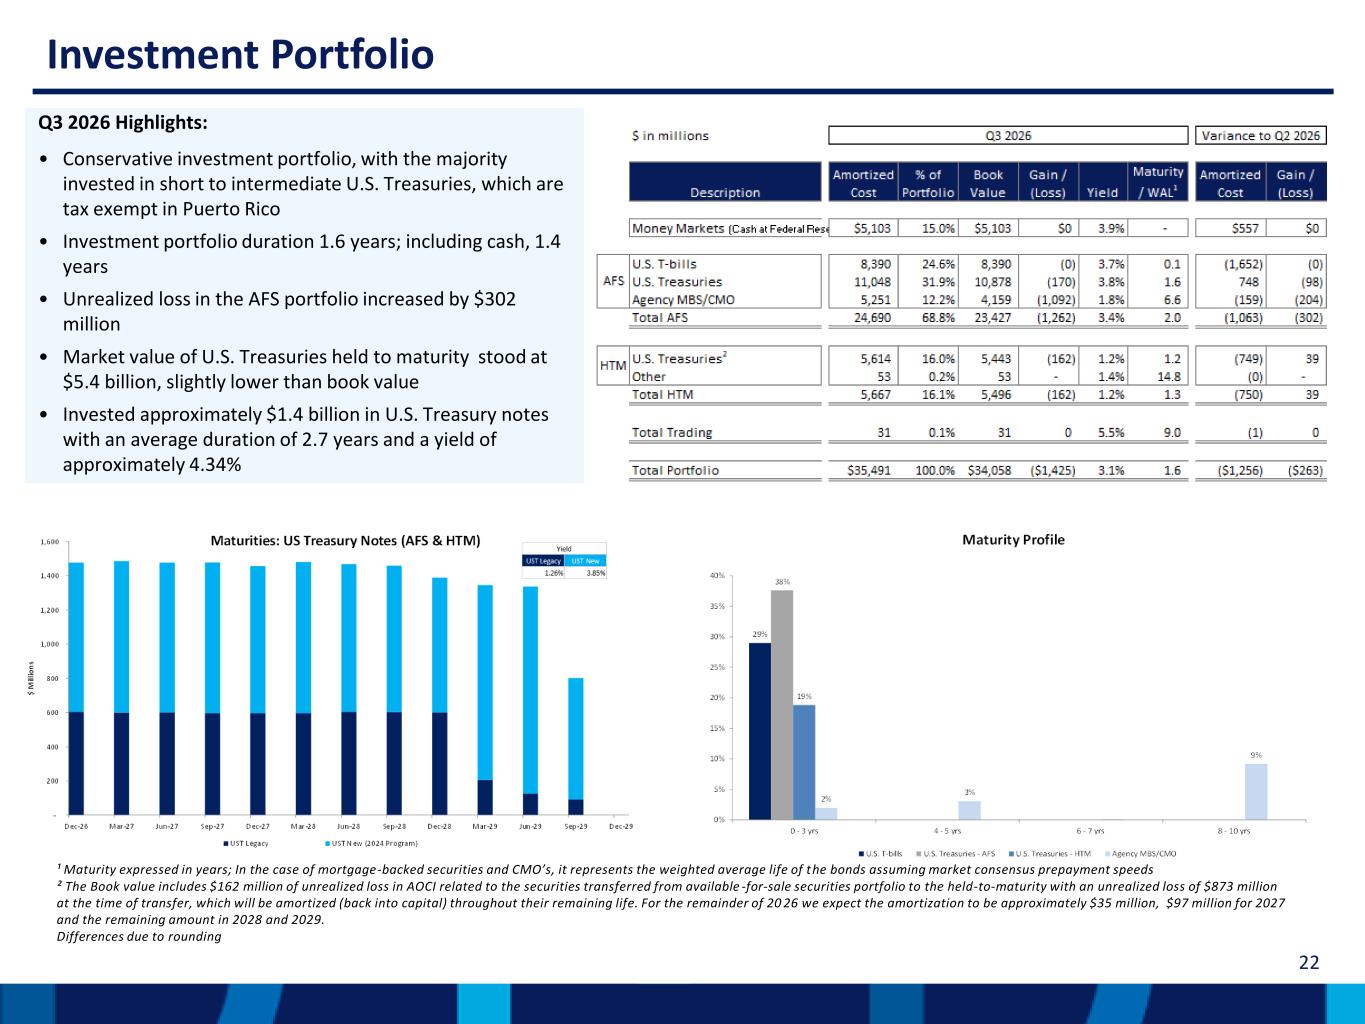
22 Investment Portfolio Q3 2026 Highlights: • Conservative investment portfolio, with the majority invested in short to intermediate U.S. Treasuries, which are tax exempt in Puerto Rico • Investment portfolio duration 1.6 years; including cash, 1.4 years • Unrealized loss in the AFS portfolio increased by $302 million • Market value of U.S. Treasuries held to maturity stood at $5.4 billion, slightly lower than book value • Invested approximately $1.4 billion in U.S. Treasury notes with an average duration of 2.7 years and a yield of approximately 4.34% ¹ Maturity expressed in years; In the case of mortgage-backed securities and CMO’s, it represents the weighted average life of the bonds assuming market consensus prepayment speeds ² The Book value includes $162 million of unrealized loss in AOCI related to the securities transferred from available -for-sale securities portfolio to the held-to-maturity with an unrealized loss of $873 million at the time of transfer, which will be amortized (back into capital) throughout their remaining life. For the remainder of 20 26 we expect the amortization to be approximately $35 million, $97 million for 2027 and the remaining amount in 2028 and 2029. Differences due to rounding
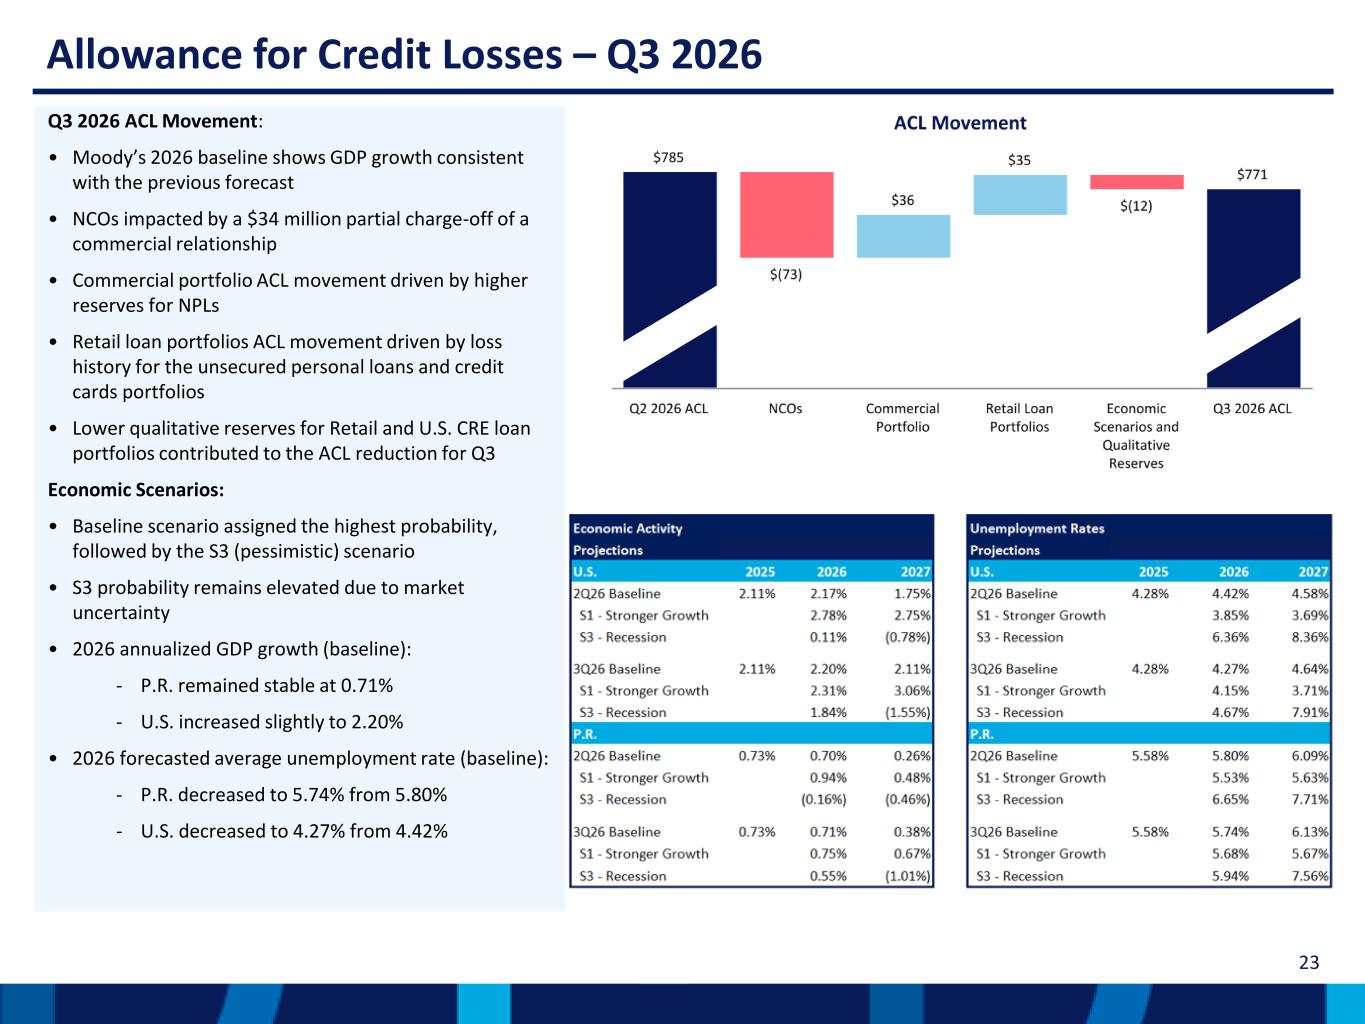
23 Allowance for Credit Losses – Q3 2026 Q3 2026 ACL Movement: • Moody’s 2026 baseline shows GDP growth consistent with the previous forecast • NCOs impacted by a $34 million partial charge-off of a commercial relationship • Commercial portfolio ACL movement driven by higher reserves for NPLs • Retail loan portfolios ACL movement driven by loss history for the unsecured personal loans and credit cards portfolios • Lower qualitative reserves for Retail and U.S. CRE loan portfolios contributed to the ACL reduction for Q3 Economic Scenarios: • Baseline scenario assigned the highest probability, followed by the S3 (pessimistic) scenario • S3 probability remains elevated due to market uncertainty • 2026 annualized GDP growth (baseline): ‐ P.R. remained stable at 0.71% ‐ U.S. increased slightly to 2.20% • 2026 forecasted average unemployment rate (baseline): ‐ P.R. decreased to 5.74% from 5.80% ‐ U.S. decreased to 4.27% from 4.42%
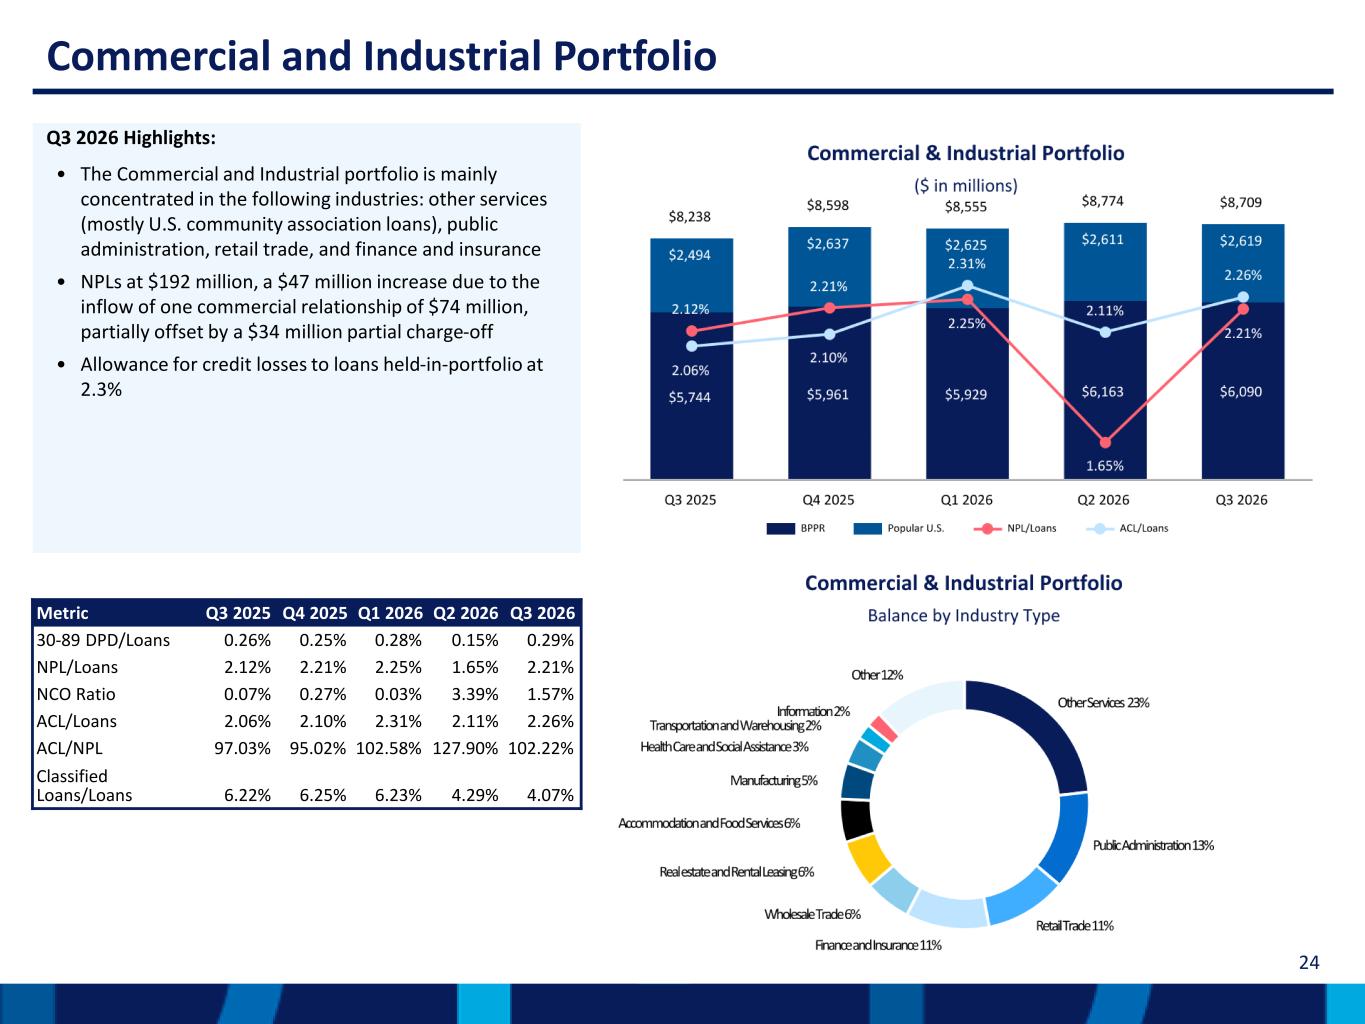
24 Commercial and Industrial Portfolio Q3 2026 Highlights: • The Commercial and Industrial portfolio is mainly concentrated in the following industries: other services (mostly U.S. community association loans), public administration, retail trade, and finance and insurance • NPLs at $192 million, a $47 million increase due to the inflow of one commercial relationship of $74 million, partially offset by a $34 million partial charge-off • Allowance for credit losses to loans held-in-portfolio at 2.3% Metric Q3 2025 Q4 2025 Q1 2026 Q2 2026 Q3 2026 30-89 DPD/Loans 0.26% 0.25% 0.28% 0.15% 0.29% NPL/Loans 2.12% 2.21% 2.25% 1.65% 2.21% NCO Ratio 0.07% 0.27% 0.03% 3.39% 1.57% ACL/Loans 2.06% 2.10% 2.31% 2.11% 2.26% ACL/NPL 97.03% 95.02% 102.58% 127.90% 102.22% Classified Loans/Loans 6.22% 6.25% 6.23% 4.29% 4.07%
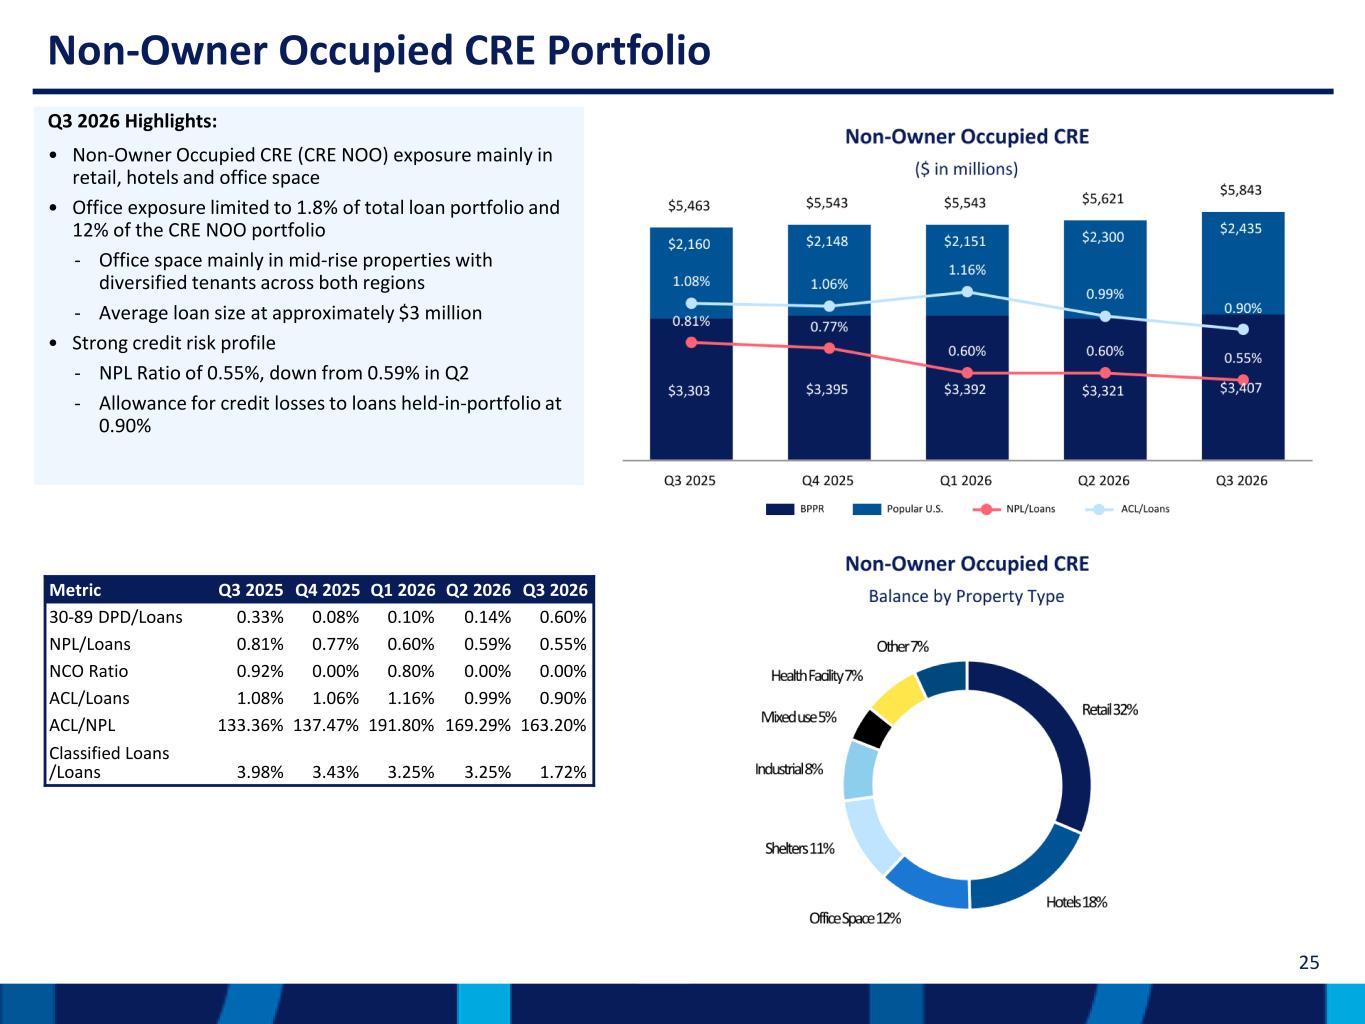
25 Non-Owner Occupied CRE Portfolio Q3 2026 Highlights: • Non-Owner Occupied CRE (CRE NOO) exposure mainly in retail, hotels and office space • Office exposure limited to 1.8% of total loan portfolio and 12% of the CRE NOO portfolio ‐ Office space mainly in mid-rise properties with diversified tenants across both regions ‐ Average loan size at approximately $3 million • Strong credit risk profile ‐ NPL Ratio of 0.55%, down from 0.59% in Q2 ‐ Allowance for credit losses to loans held-in-portfolio at 0.90% Metric Q3 2025 Q4 2025 Q1 2026 Q2 2026 Q3 2026 30-89 DPD/Loans 0.33% 0.08% 0.10% 0.14% 0.60% NPL/Loans 0.81% 0.77% 0.60% 0.59% 0.55% NCO Ratio 0.92% 0.00% 0.80% 0.00% 0.00% ACL/Loans 1.08% 1.06% 1.16% 0.99% 0.90% ACL/NPL 133.36% 137.47% 191.80% 169.29% 163.20% Classified Loans /Loans 3.98% 3.43% 3.25% 3.25% 1.72%
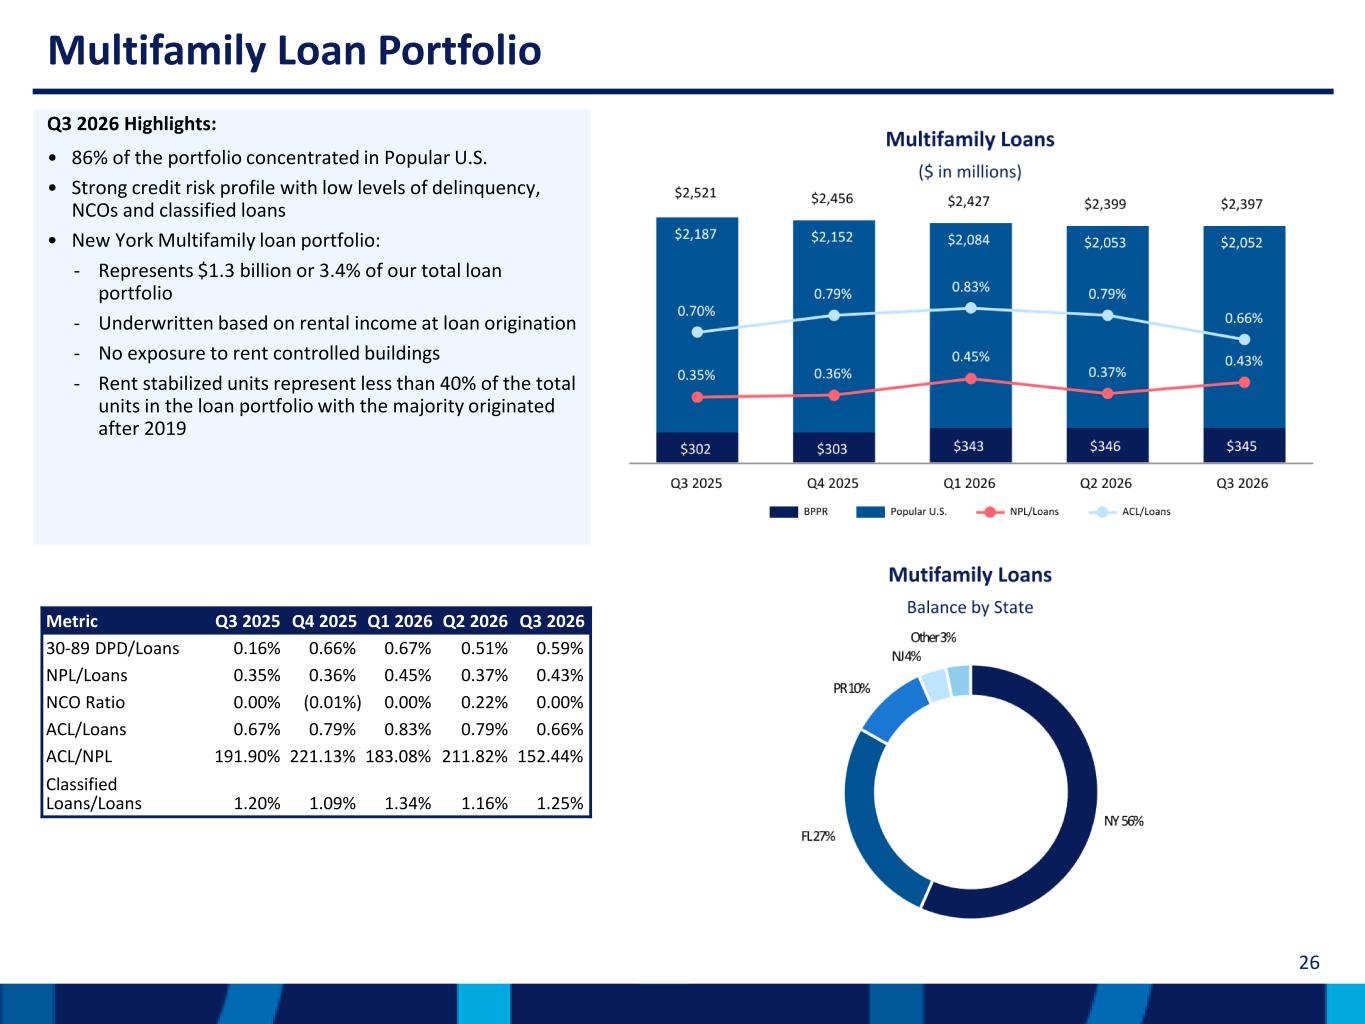
26 Multifamily Loan Portfolio Q3 2026 Highlights: • 86% of the portfolio concentrated in Popular U.S. • Strong credit risk profile with low levels of delinquency, NCOs and classified loans • New York Multifamily loan portfolio: ‐ Represents $1.3 billion or 3.4% of our total loan portfolio ‐ Underwritten based on rental income at loan origination ‐ No exposure to rent controlled buildings ‐ Rent stabilized units represent less than 40% of the total units in the loan portfolio with the majority originated after 2019 Metric Q3 2025 Q4 2025 Q1 2026 Q2 2026 Q3 2026 30-89 DPD/Loans 0.16% 0.66% 0.67% 0.51% 0.59% NPL/Loans 0.35% 0.36% 0.45% 0.37% 0.43% NCO Ratio 0.00% (0.01%) 0.00% 0.22% 0.00% ACL/Loans 0.67% 0.79% 0.83% 0.79% 0.66% ACL/NPL 191.90% 221.13% 183.08% 211.82% 152.44% Classified Loans/Loans 1.20% 1.09% 1.34% 1.16% 1.25%
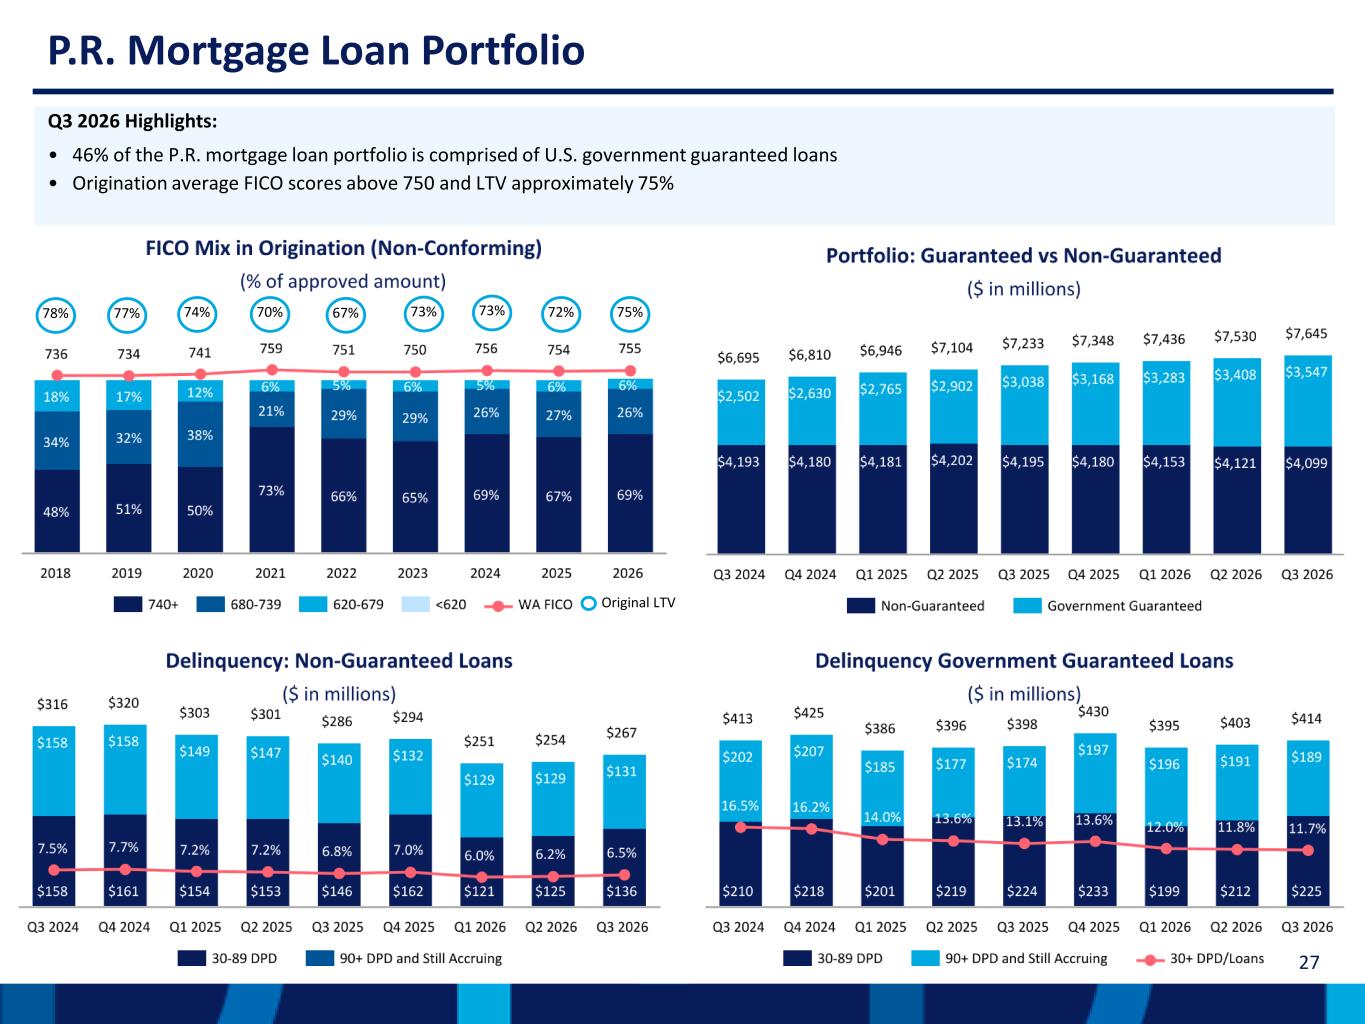
27 P.R. Mortgage Loan Portfolio Q3 2026 Highlights: • 46% of the P.R. mortgage loan portfolio is comprised of U.S. government guaranteed loans • Origination average FICO scores above 750 and LTV approximately 75% 78% Original LTV 75%72%73%73%67%70%74%77%
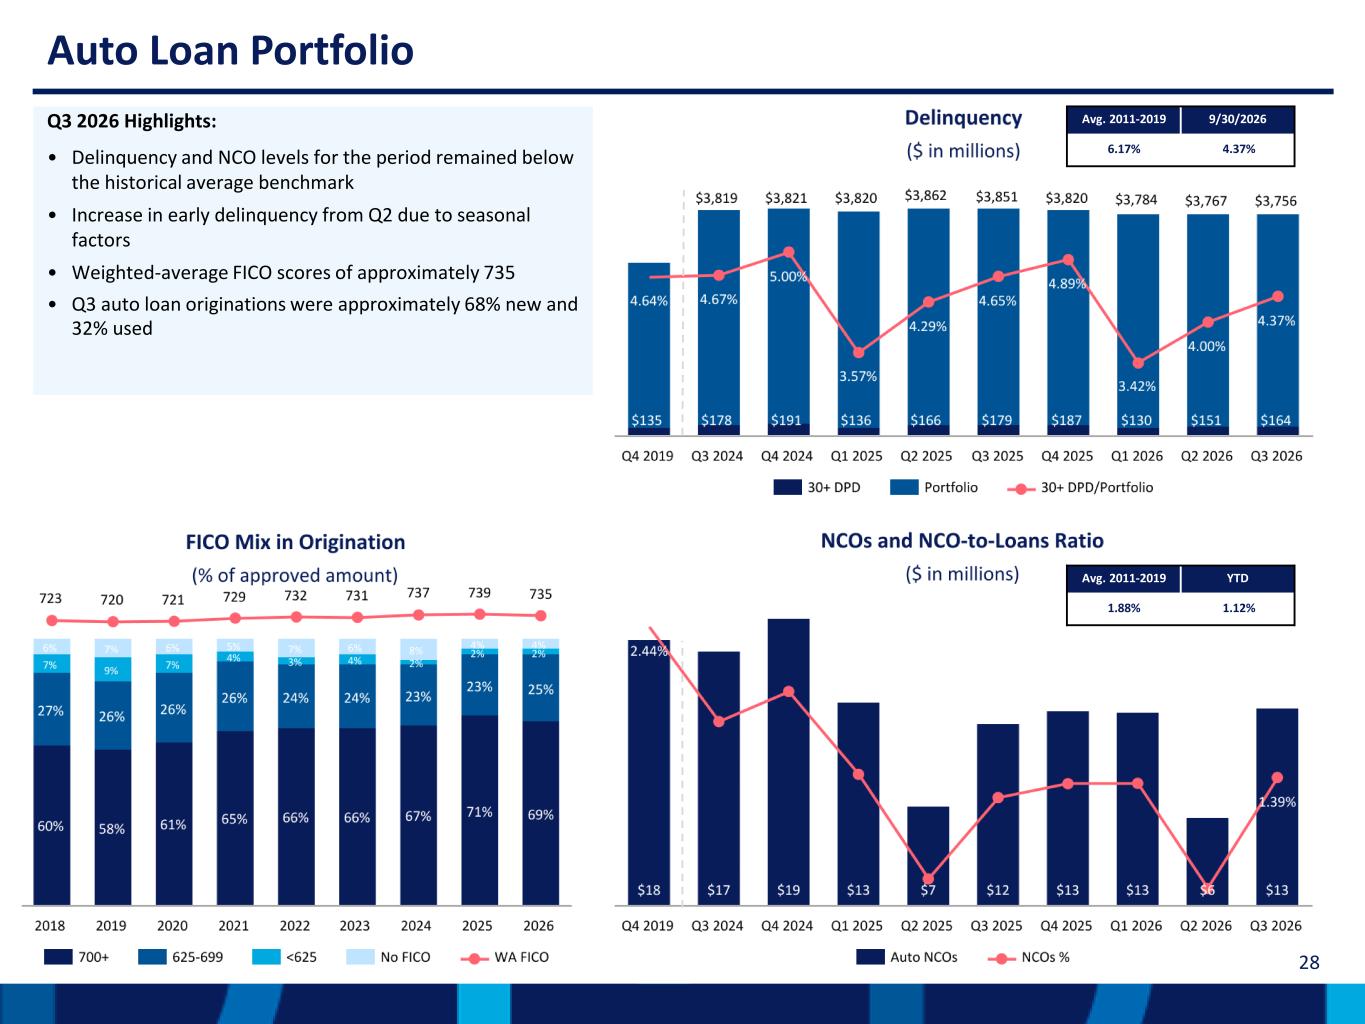
28 Auto Loan Portfolio Q3 2026 Highlights: • Delinquency and NCO levels for the period remained below the historical average benchmark • Increase in early delinquency from Q2 due to seasonal factors • Weighted-average FICO scores of approximately 735 • Q3 auto loan originations were approximately 68% new and 32% used Avg. 2011-2019 9/30/2026 6.17% 4.37% Avg. 2011-2019 YTD 1.88% 1.12%
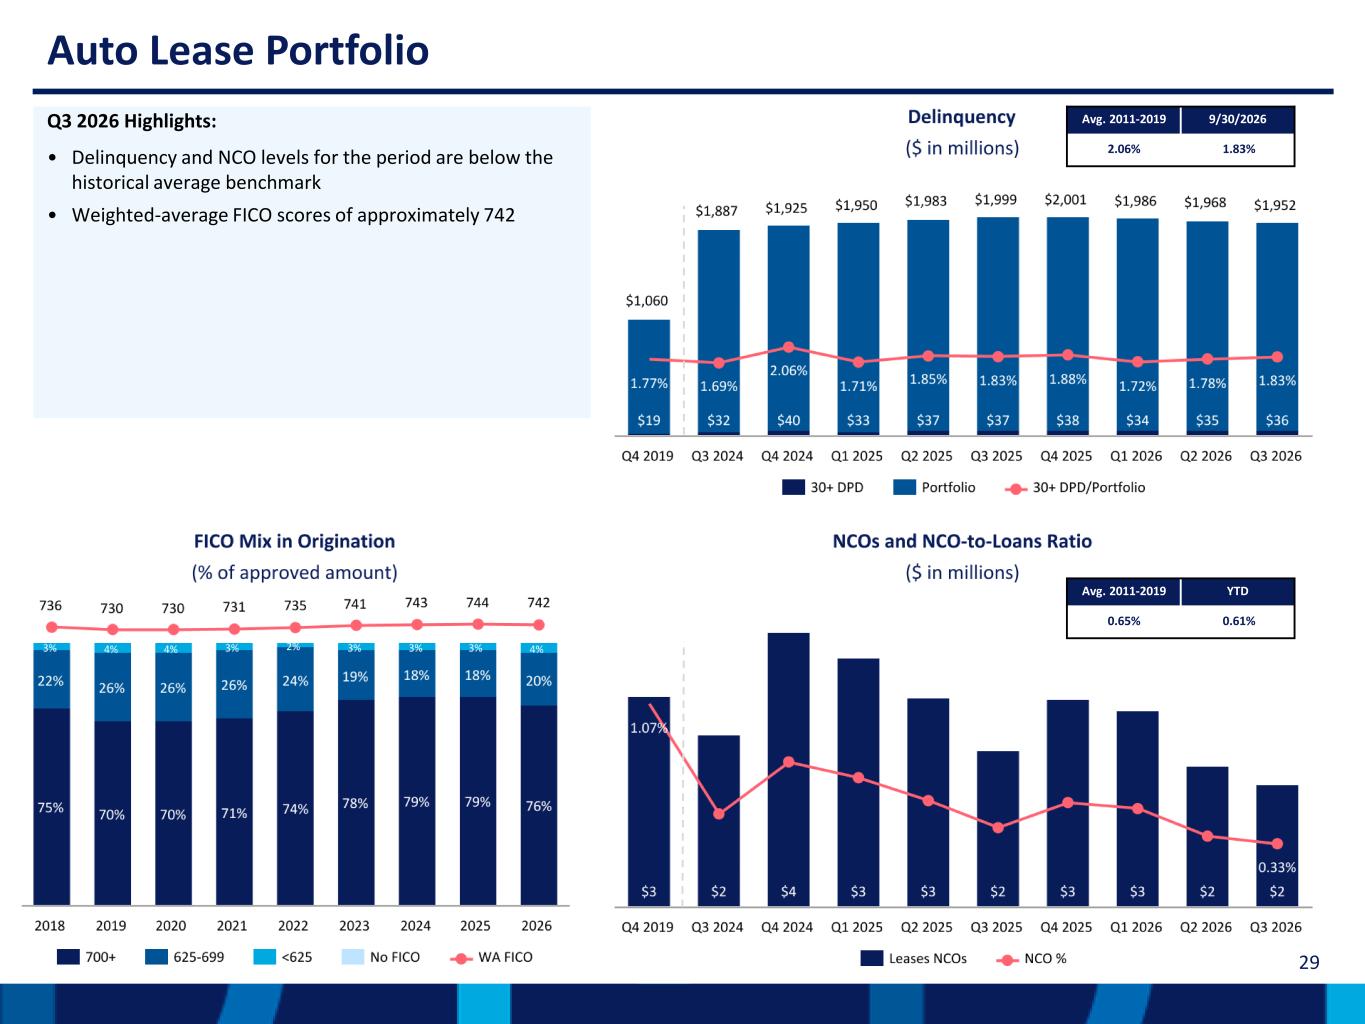
29 Auto Lease Portfolio Q3 2026 Highlights: • Delinquency and NCO levels for the period are below the historical average benchmark • Weighted-average FICO scores of approximately 742 Avg. 2011-2019 9/30/2026 2.06% 1.83% Avg. 2011-2019 YTD 0.65% 0.61%
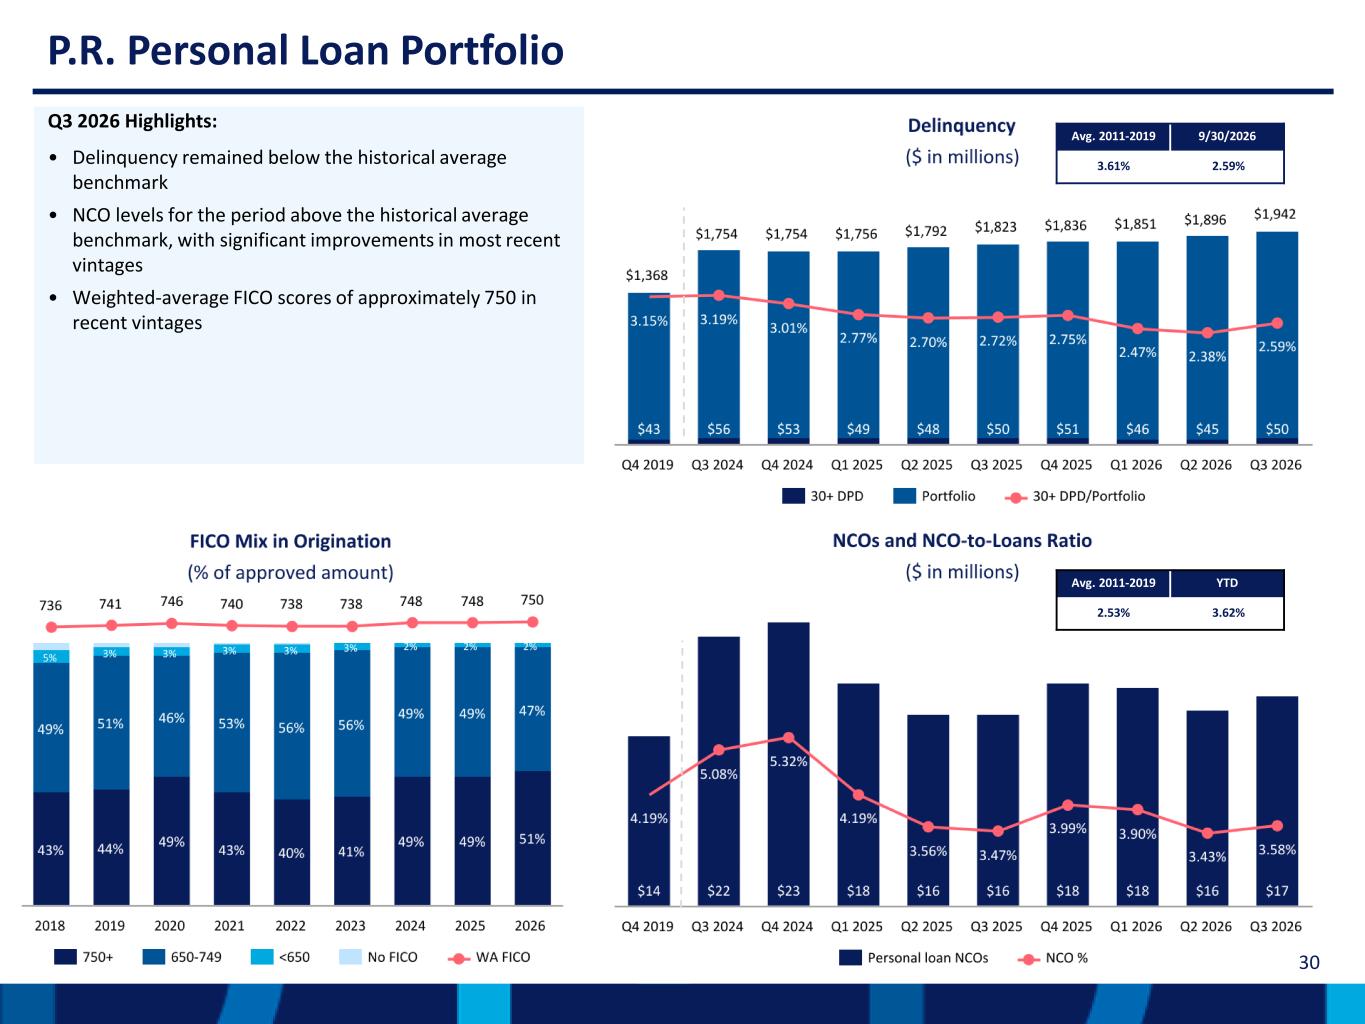
30 P.R. Personal Loan Portfolio Q3 2026 Highlights: • Delinquency remained below the historical average benchmark • NCO levels for the period above the historical average benchmark, with significant improvements in most recent vintages • Weighted-average FICO scores of approximately 750 in recent vintages Avg. 2011-2019 9/30/2026 3.61% 2.59% Avg. 2011-2019 YTD 2.53% 3.62%
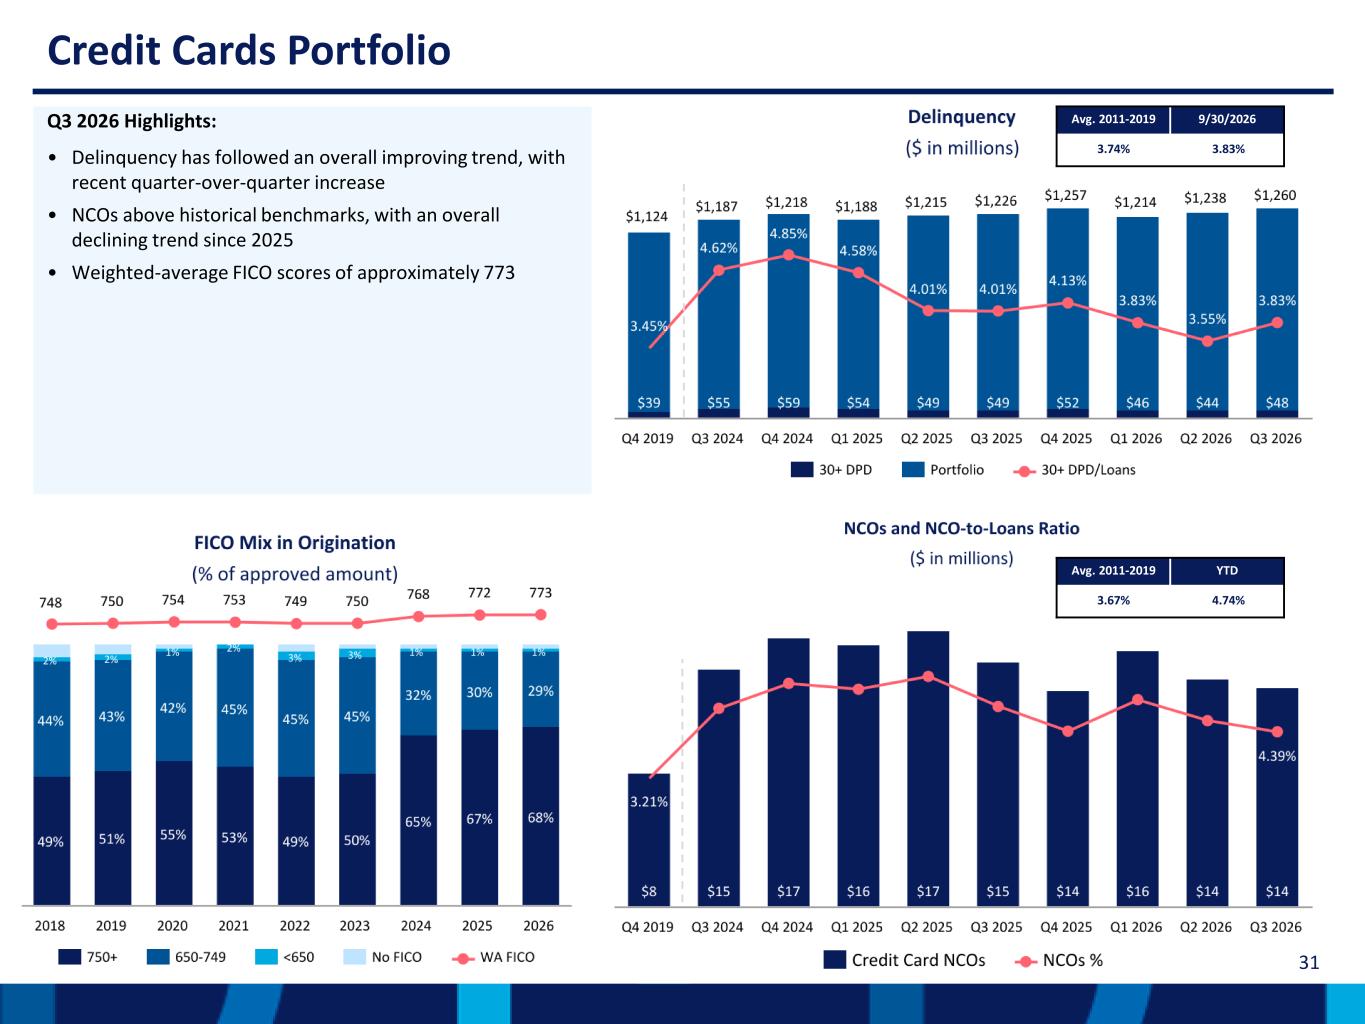
31 Credit Cards Portfolio Q3 2026 Highlights: • Delinquency has followed an overall improving trend, with recent quarter-over-quarter increase • NCOs above historical benchmarks, with an overall declining trend since 2025 • Weighted-average FICO scores of approximately 773 Avg. 2011-2019 9/30/2026 3.74% 3.83% Avg. 2011-2019 YTD 3.67% 4.74%
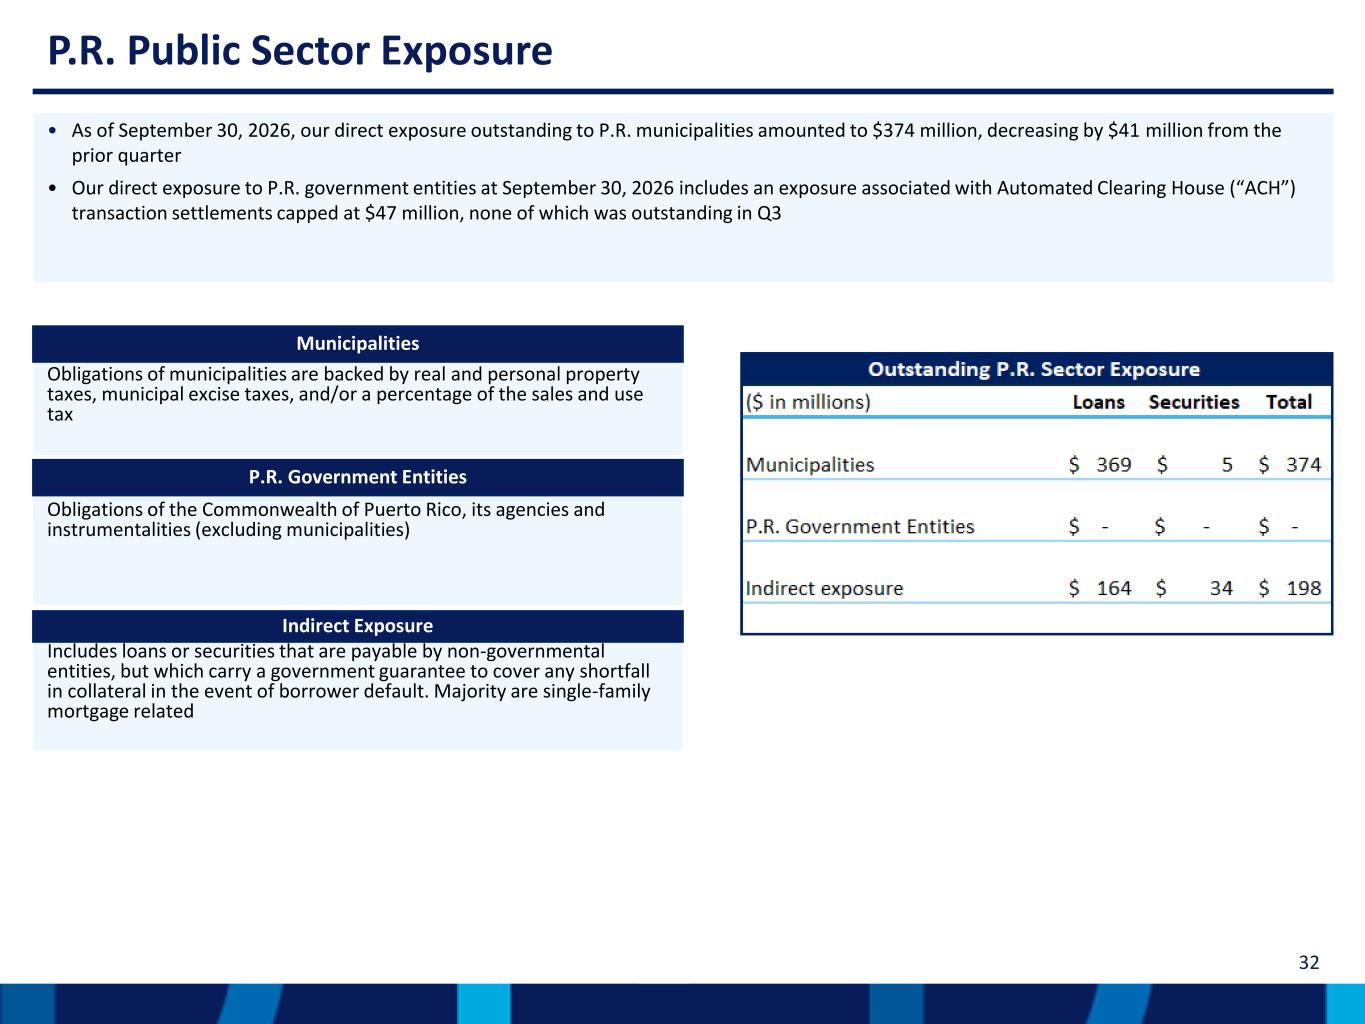
32 P.R. Public Sector Exposure • As of September 30, 2026, our direct exposure outstanding to P.R. municipalities amounted to $374 million, decreasing by $41 million from the prior quarter • Our direct exposure to P.R. government entities at September 30, 2026 includes an exposure associated with Automated Clearing House (“ACH”) transaction settlements capped at $47 million, none of which was outstanding in Q3 Includes loans or securities that are payable by non-governmental entities, but which carry a government guarantee to cover any shortfall in collateral in the event of borrower default. Majority are single-family mortgage related Indirect Exposure Obligations of municipalities are backed by real and personal property taxes, municipal excise taxes, and/or a percentage of the sales and use tax Municipalities Obligations of the Commonwealth of Puerto Rico, its agencies and instrumentalities (excluding municipalities) P.R. Government Entities
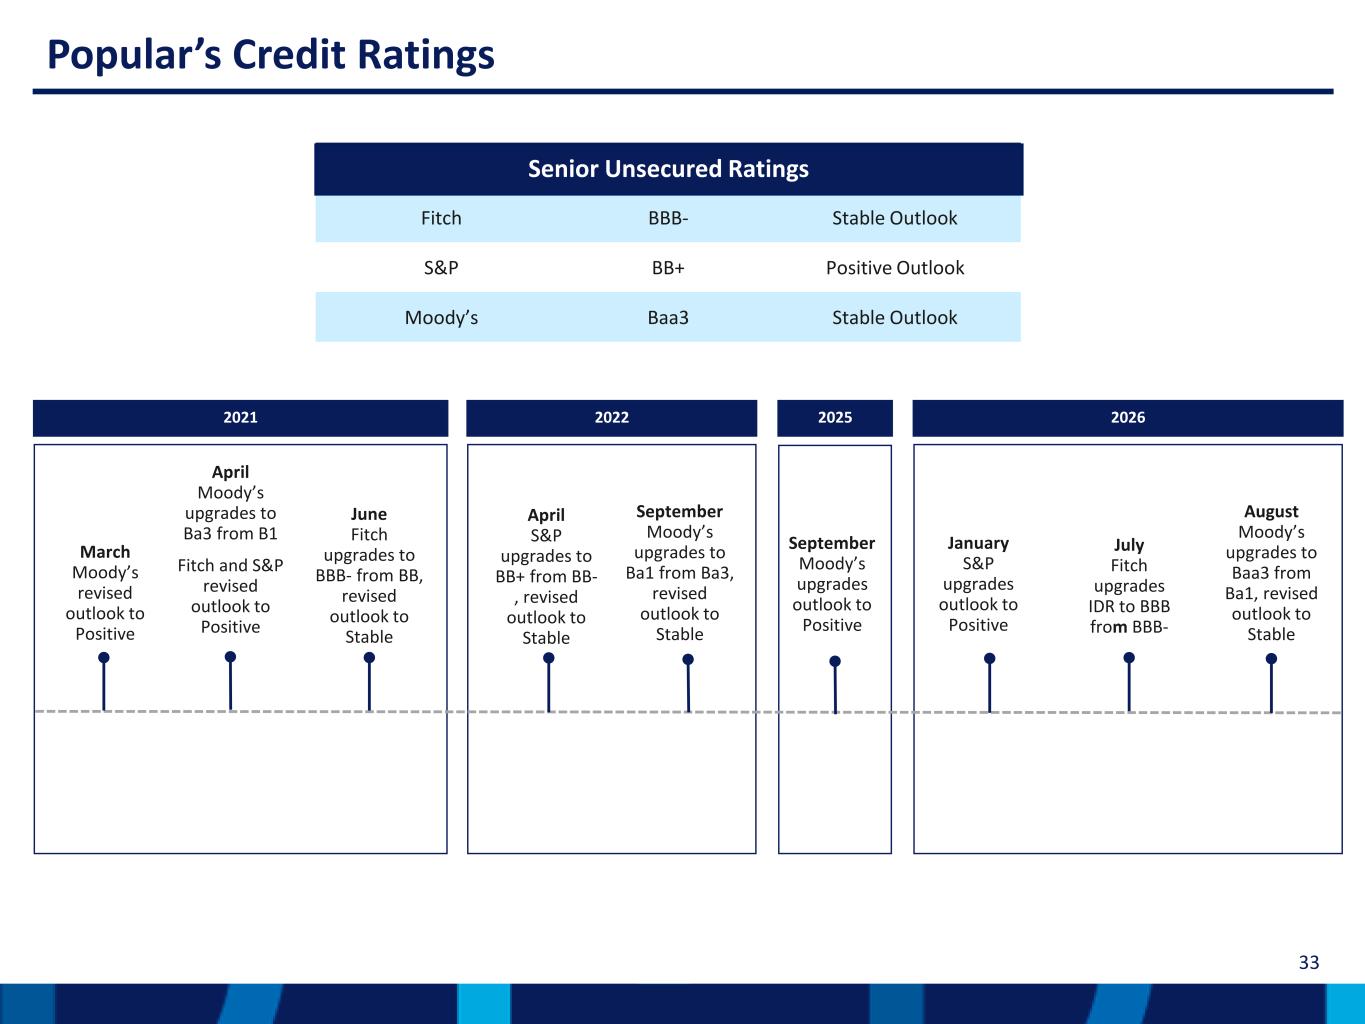
33 2026 January S&P upgrades outlook to Positive Senior Unsecured Ratings Fitch BBB- Stable Outlook S&P BB+ Positive Outlook Moody’s Baa3 Stable Outlook 2021 March Moody’s revised outlook to Positive April Moody’s upgrades to Ba3 from B1 Fitch and S&P revised outlook to Positive June Fitch upgrades to BBB- from BB, revised outlook to Stable April S&P upgrades to BB+ from BB- , revised outlook to Stable September Moody’s upgrades to Ba1 from Ba3, revised outlook to Stable Senior Uns Ratings 2025 September Moody’s upgrades outlook to Positive 2022 Popular’s Credit Ratings July Fitch upgrades IDR to BBB from BBB- August Moody’s upgrades to Baa3 from Ba1, revised outlook to Stable

Investor Presentation Third Quarter 2026