| Earnings Call 3Q 2025 October 23, 2025 |

| Statements included in this communication, which are not historical in nature are intended to be, and are hereby identified as, forward-looking statements for purposes of the safe harbor provided by Section 27A of the Securities Act of 1933 and Section 21E of the Securities Exchange Act of 1934. Forward-looking statements are based on, among other things, management’s beliefs, assumptions, current expectations, estimates and projections about the financial services industry, the economy and SouthState. Words and phrases such as “may,” “approximately,” “continue,” “should,” “expects,” “projects,” “anticipates,” “is likely,” “look ahead,” “look forward,” “believes,” “will,” “intends,” “estimates,” “strategy,” “plan,” “could,” “potential,” “possible” and variations of such words and similar expressions are intended to identify such forward-looking statements. SouthState Bank Corporation (“SouthState” or the “Company”) cautions readers that forward looking statements are subject to certain risks, uncertainties and assumptions that are difficult to predict with regard to, among other things, timing, extent, likelihood and degree of occurrence, which could cause actual results to differ materially from anticipated results. Such risks, uncertainties and assumptions, include, among others, the following: (1) economic volatility risk, including as a result of monetary, fiscal, and trade law policies, such as tariffs, and inflation, potentially resulting in higher rates, deterioration in the credit markets, greater than expected noninterest expenses, excessive loan losses, or on the other hand lower rates, which also may have other negative consequences, which risks could be exacerbated by potential negative economic developments resulting from federal spending cuts and/or one or more federal budget-related impasses or actions; (2) risks related to the ability of the Company to pursue its strategic plans which depend upon certain growth goals in our lines of business; (3) risks related to the merger and integration of SouthState and Independent Bank Group, Inc. (“Independent” or “IBTX”) including, among others, (i) the risk that the cost savings and any revenue synergies from the merger may not be fully realized or may take longer than anticipated to be realized, (ii) the risk that the integration of Independent’s operations into SouthState’s operations will be materially delayed or will be more costly or difficult than expected or that the parties are otherwise unable to successfully integrate Independent’s businesses into SouthState’s businesses, (iii) the amount of the costs, fees, expenses and charges related to the merger, and (iv) reputational risk and the reaction of each company's customers, suppliers, employees or other business partners to the merger; (4) risks relating to the ability to retain our culture and attract and retain qualified people as we grow and are located in new markets, and being able to offer competitive salaries and benefits, including flexibility of working remotely or in the office; (5) deposit attrition, client loss or revenue loss following completed mergers or acquisitions that may be greater than anticipated; (6) credit risks associated with an obligor’s failure to meet the terms of any contract with SouthState Bank, N.A. (the “Bank”) or otherwise fail to perform as agreed under the terms of any loan-related document; (7) interest rate risk primarily resulting from our inability to effectively manage the risk, and their impact on the Bank’s earnings, including from the correspondent and mortgage divisions, housing demand, the market value of the Bank’s loan and securities portfolios, and the market value of SouthState’s equity; (8) inflationary risks negatively impacting our business and profitability, earnings and budgetary projections, or demand for our products and services; (9) a decrease in our net interest income due to the interest rate environment; (10) liquidity risk affecting the Bank’s ability to meet its obligations when they come due; (11) unexpected outflows of uninsured deposits may require us to sell investment securities at a loss; (12) potential deterioration in real estate values; (13) the loss of value of our investment portfolio could negatively impact market perceptions of us and could lead to deposit withdrawals; (14) price risk focusing on changes in market factors that may affect the value of traded instruments in “mark-to-market” portfolios; (15) transaction risk arising from problems with service or product delivery; (16) the impact of increasing digitization of the banking industry and movement of customers to on-line platforms, and the possible impact on the Bank’s results of operations, customer base, expenses, suppliers and operations; (17) controls and procedures risk, including the potential failure or circumvention of our controls and procedures or failure to comply with regulations related to controls and procedures; (18) volatility in the financial services industry (including failures or rumors of failures of other depository institutions), along with actions taken by governmental agencies to address such turmoil, could affect the ability of depository institutions, including us, to attract and retain depositors and to borrow or raise capital; (19) the impact of competition with other financial institutions, including deposit and loan pricing pressures and the resulting impact, including as a result of compression to net interest margin; (20) compliance risk involving risk to earnings or capital resulting from violations of or nonconformance with laws, rules, regulations, prescribed practices, or ethical standards, and contractual obligations regarding data privacy and cybersecurity; (21) regulatory change risk resulting from new laws, rules, regulations, accounting principles, proscribed practices or ethical standards, including, without limitation, the possibility that regulatory agencies may require higher levels of capital above the current regulatory-mandated minimums and including the impact of special FDIC assessments, the Consumer Financial Protection Bureau regulations or other guidance, and the possibility of changes in accounting standards, policies, principles and practices; (22) risks related to the legal, regulatory, and supervisory environment, including changes in financial services legislation, regulation, policies, or government officials or other personnel; (23) strategic risk resulting from adverse business decisions or improper implementation of business decisions; (24) reputation risk that adversely affects earnings or capital arising from negative public opinion including the effects of social media on market perceptions of us and banks generally; (25) cybersecurity risk related to the dependence of SouthState on internal computer systems and the technology of outside service providers, as well as the potential impacts of internal or external security breaches, which may subject the Company to potential business disruptions or financial losses resulting from deliberate attacks or unintentional events; (26) reputational and operational risks associated with environment, social and governance (ESG) matters, including the impact of changes in federal and state laws, regulations and guidance relating to climate change; (27) excessive loan losses; (28) reputational risk and possible higher than estimated reduced revenue from previously announced or proposed regulatory changes in the Bank’s consumer programs and products; (29) operational, technological, cultural, regulatory, legal, credit and other risks associated with the exploration, consummation and integration of potential future acquisitions, whether involving stock or cash consideration; (30) catastrophic events such as hurricanes, tornados, earthquakes, floods or other natural or human disasters, including public health crises and infectious disease outbreaks, as well as any government actions in response to such events, and the related disruption to local, regional and global economic activity and financial markets, and the impact that any of the foregoing may have on SouthState and its customers and other constituencies; (31) geopolitical risk from terrorist activities and armed conflicts that may result in economic and supply disruptions, and loss of market and consumer confidence; (32) the risks of fluctuations in market prices for SouthState common stock that may or may not reflect economic condition or performance of SouthState; (33) the payment of dividends on SouthState common stock, which is subject to legal and regulatory limitations as well as the discretion of the board of directors of SouthState, SouthState’s performance and other factors; (34) ownership dilution risk associated with potential acquisitions in which SouthState’s stock may be issued as consideration for an acquired company; and (35) other factors that may affect future results of SouthState, as disclosed in SouthState’s Annual Report on Form 10-K, Quarterly Reports on Form 10-Q, and Current Reports on Form 8-K, filed by SouthState with the U.S. Securities and Exchange Commission (“SEC”) and available on the SEC’s website at http://www.sec.gov, any of which could cause actual results to differ materially from future results expressed, implied or otherwise anticipated by such forward-looking statements. All forward-looking statements speak only as of the date they are made and are based on information available at that time. SouthState does not undertake any obligation to update or otherwise revise any forward-looking statements, whether as a result of new information, future events, or otherwise, except as required by federal securities laws. As forward-looking statements involve significant risks and uncertainties, caution should be exercised against placing undue reliance on such statements. CAUTIONARY NOTE REGARDING FORWARD LOOKING STATEMENTS |

| Ranked #14 by S&P Global Greenwich Excellence & Best Brand Awards for Small Business Banking from Coalition Greenwich $65 B Assets $48 B Loans Enhanced Scale Through IBTX Partnership 343 Branch Locations 12 of 15 Fastest Growing U.S. MSAs(2) #5 Largest Regional Bank in the South(3) Dominant Southern Franchise $55 B Deposits $7.4 B Market Cap 17 SOUTHSTATE BANK CORPORATION OVERVIEW (1) $66B Assets $48B Loans $54B Deposits $10B Market Cap 343 Branch Locations 12 of 15 Fastest Growing U.S. MSAs(3) #5 Largest Regional Bank in the South(4) (1) ~ (4) For end note descriptions, see Earnings Presentation End Notes starting on slide 34. PROJECTED POPULATION GROWTH(2) Fastest-growing 20% of MSAs highlighted in blue 3 |

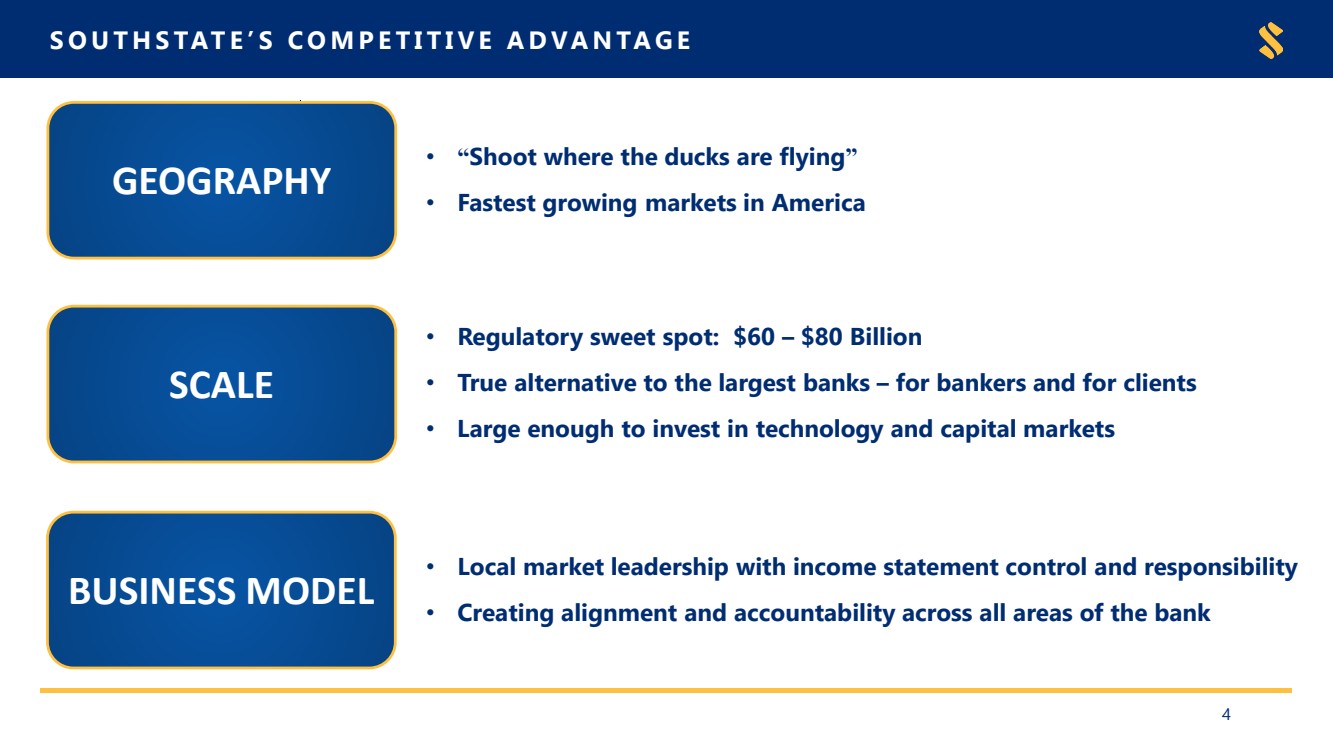
| SOUTHSTATE’S COMPETITIVE ADVANTAGE GEOGRAPHY • Regulatory sweet spot: $60 – $80 Billion • True alternative to the largest banks – for bankers and for clients • Large enough to invest in technology and capital markets • Local market leadership with income statement control and responsibility • Creating alignment and accountability across all areas of the bank • “Shoot where the ducks are flying” • Fastest growing markets in America SCALE BUSINESS MODEL 4 |
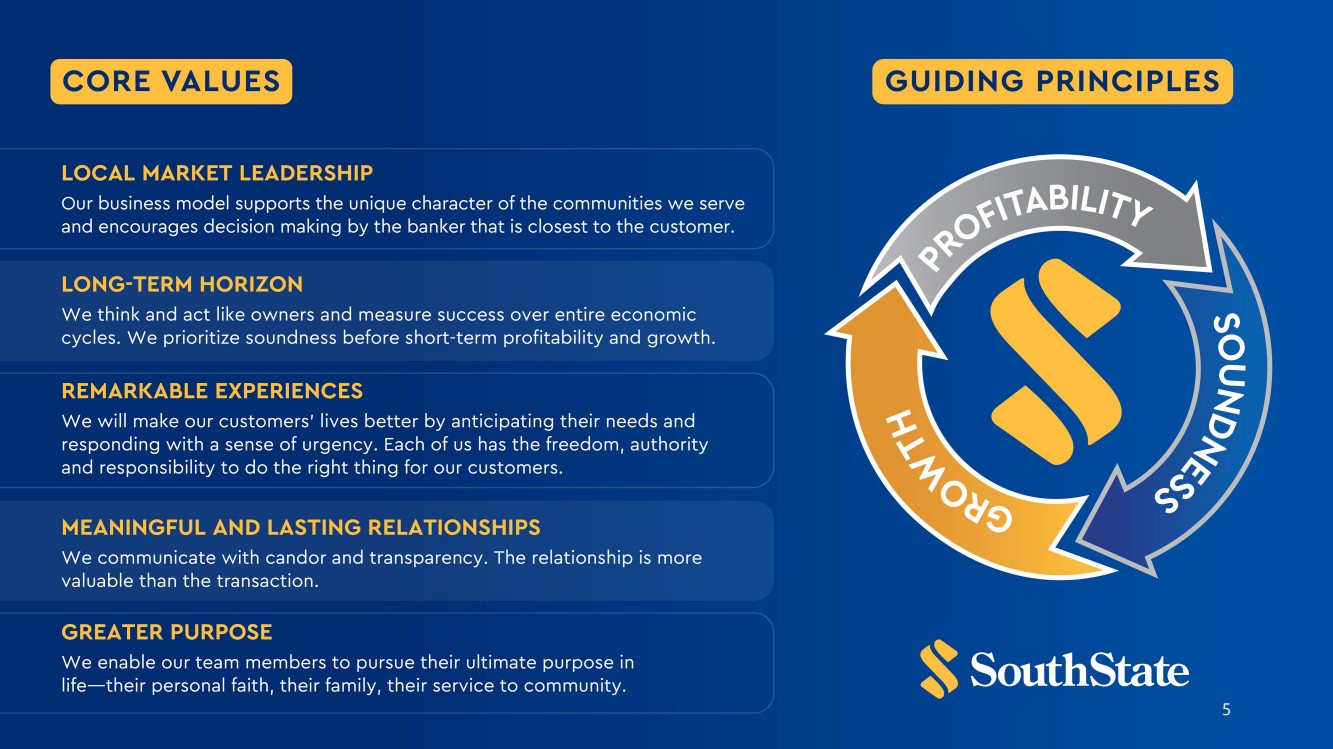
| 5 |
| POSITIONED FOR THE FUTURE IN THE BEST GROWTH MARKETS IN AMERICA 6 4% 4% 2% 1% 7% 4% 23% 22% 16% 15% 21% 12% % Loans 7% % Deposits 7% 18% 16% For end note descriptions, see Earnings Presentation End Notes starting on slide 34. Rank MSA % Growth 1 Austin-Round Rock-San Marcos, TX 19.5% 2 Dallas-Fort Worth-Arlington, TX 12.6% 3 Orlando-Kissimmee-Sanford, FL 11.8% 4 San Antonio-New Braunfels, TX 11.6% 5 Charlotte-Concord-Gastonia, NC-SC 11.3% 6 Tampa-St. Petersburg-Clearwater, FL 10.3% 7 Phoenix-Mesa-Chandler, AZ 9.5% 8 Atlanta-Sandy Springs-Roswell, GA 8.2% 9 Houston-Pasadena-The Woodlands, TX 8.1% 10 Miami-Fort Lauderdale-West Palm Beach, FL 7.5% 11 Riverside-San Bernardino-Ontario, CA 7.1% 12 Denver-Aurora-Centennial, CO 7.0% 13 Philadelphia-Camden-Wilm., PA-NJ-DE-MD 5.5% 14 New York-Newark-Jersey City, NY-NJ 4.1% 15 Chicago-Naperville-Elgin, IL-IN-WI 3.1% 16 San Diego-Chula Vista-Carlsbad, CA 3.0% 17 Baltimore-Columbia-Towson, MD 3.0% 18 Seattle-Tacoma-Bellevue, WA 2.6% 19 Detroit-Warren-Dearborn, MI 2.0% 20 Washington-Arlington-Alexandria, DC-VA-MD-WV 1.9% 21 Minneapolis-St. Paul-Bloomington, MN-WI 1.9% 22 St. Louis, MO-IL 1.1% 23 Boston-Cambridge-Newton, MA-NH 0.8% 24 Los Angeles-Long Beach-Anaheim, CA -0.5% 25 San Francisco-Oakland-Fremont, CA -3.5% Employment Growth in Top 25 Largest MSAs % Change from February 2020 to August 2025 |

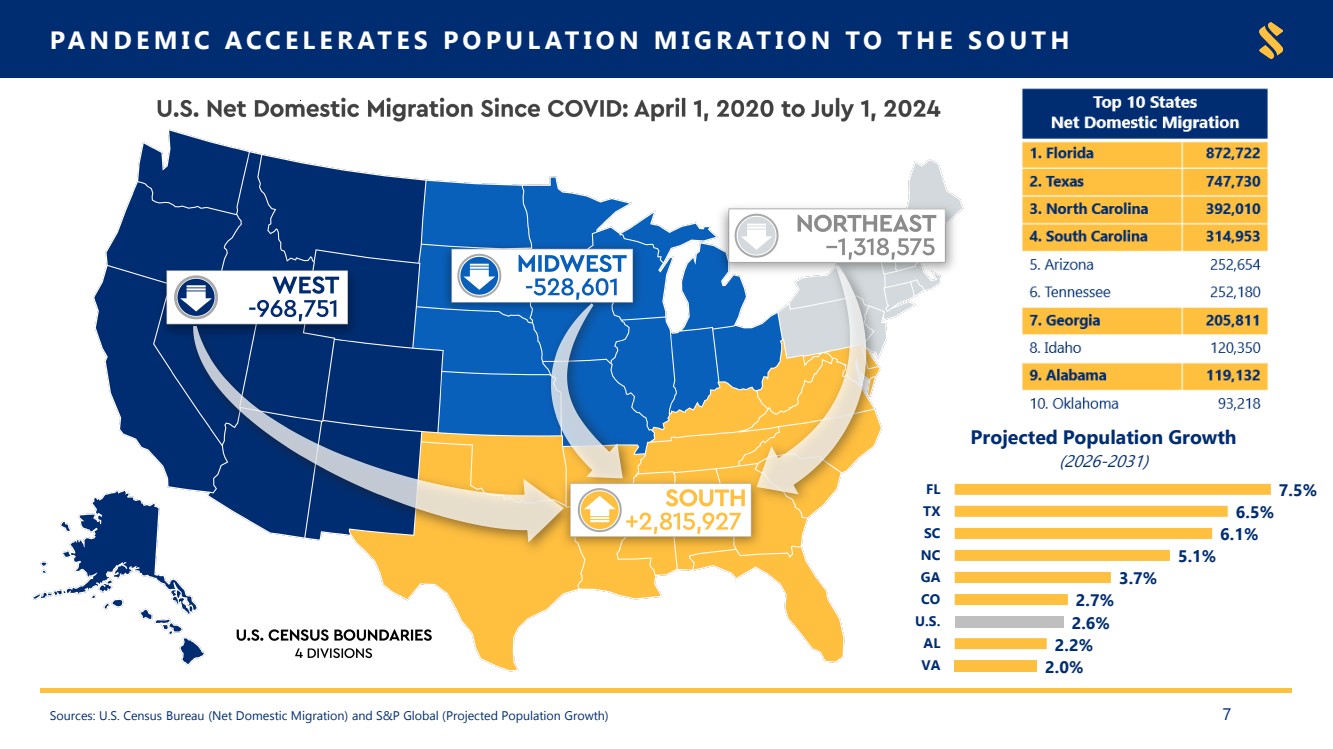
| 2.0% 2.2% 2.6% 2.7% 3.7% 5.1% 6.1% 6.5% 7.5% VA AL U.S. CO GA NC SC TX FL Projected Population Growth (2026-2031) Sources: U.S. Census Bureau (Net Domestic Migration) and S&P Global (Projected Population Growth) PANDEMIC ACCELERATES POPULATION MIGRATION TO THE SOUTH 7 |
| Quarterly Results |

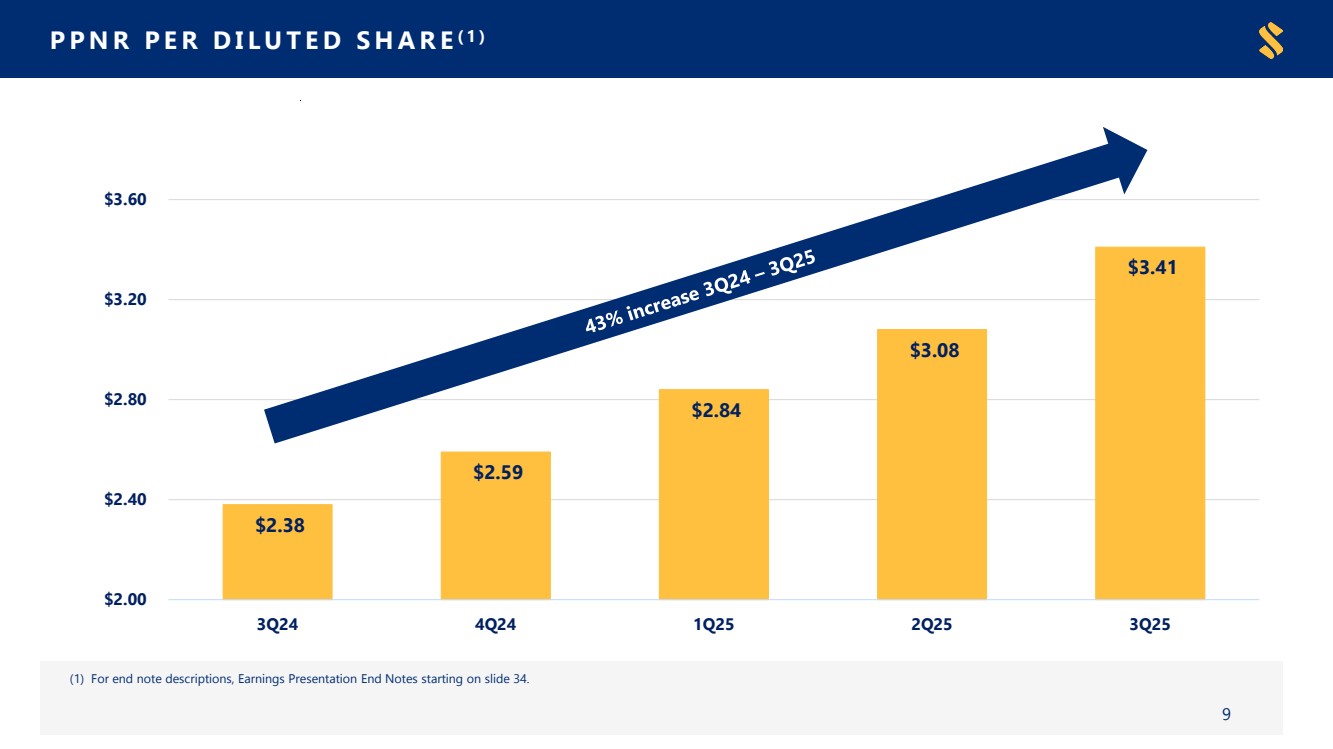
| PPNR PER DILUTED SHARE (1) (1) For end note descriptions, Earnings Presentation End Notes starting on slide 34. 9 $2.38 $2.59 $2.84 $3.08 $3.41 $2.00 $2.40 $2.80 $3.20 $3.60 3Q24 4Q24 1Q25 2Q25 3Q25 |
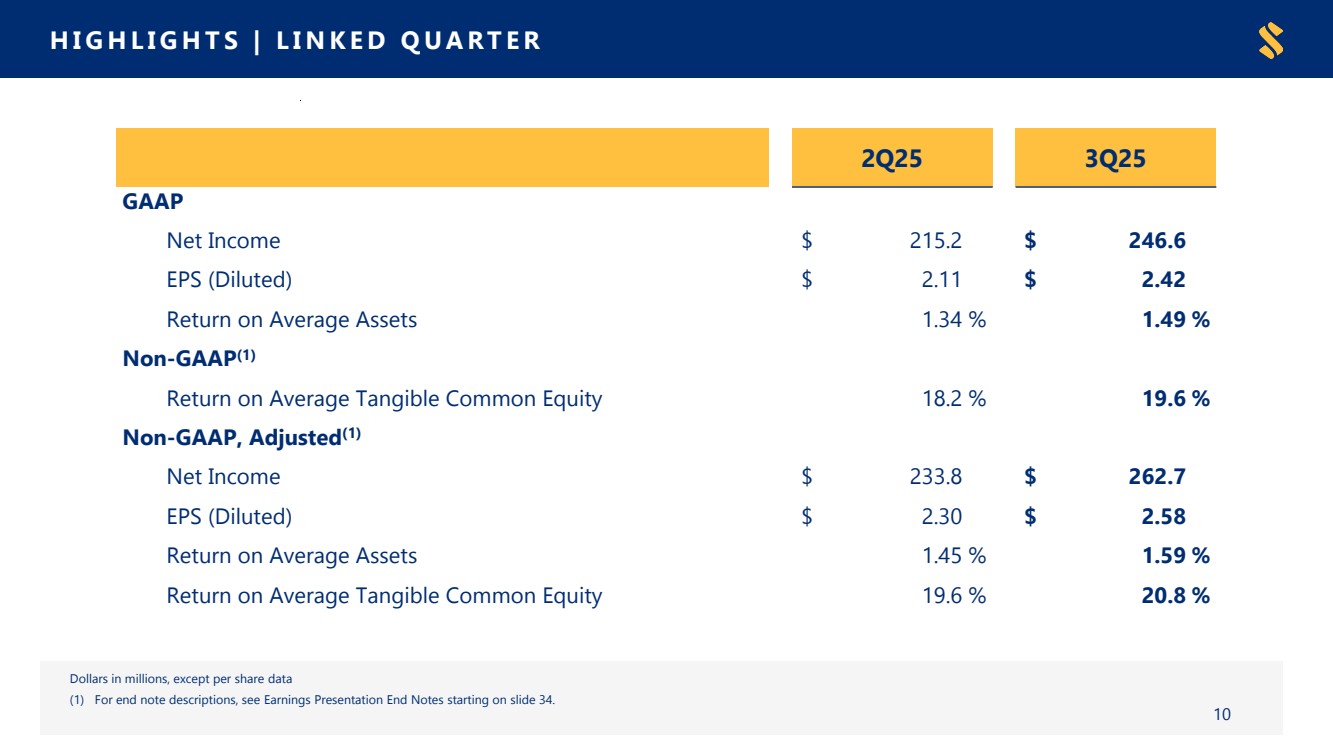
| HIGHLIGHTS | LINKED QUARTER Dollars in millions, except per share data (1) For end note descriptions, see Earnings Presentation End Notes starting on slide 34. 10 2Q25 3Q25 GAAP Net Income $ 215.2 $ 246.6 EPS (Diluted) $ 2.11 $ 2.42 Return on Average Assets 1.34 % 1.49 % Non-GAAP(1) Return on Average Tangible Common Equity 18.2 % 19.6 % Non-GAAP, Adjusted(1) Net Income $ 233.8 $ 262.7 EPS (Diluted) $ 2.30 $ 2.58 Return on Average Assets 1.45 % 1.59 % Return on Average Tangible Common Equity 19.6 % 20.8 % |
| QUARTERLY HIGHLIGHTS | 3Q 2025 * : Annualized percentages (1) ~ (4) For end note descriptions, see Earnings Presentation End Notes starting on slide 34. 11 • Reported Diluted Earnings per Share (“EPS”) of $2.42; adjusted Diluted EPS (non-GAAP)(1) of $2.58 • Revenue, non-tax equivalent, of $699 million, up $34 million, or 5%, compared to the prior quarter • Pre-Provision Net Revenue (“PPNR”)(non-GAAP)(2) of $347.3 million • Year-over-year PPNR/share growth (non-GAAP)(2) of 43% • Net interest margin, non-tax equivalent and tax equivalent (non-GAAP)(3) of 4.05% and 4.06%, respectively, up 0.03% and 0.04%, respectively, from prior quarter • Noninterest Income of $99.1 million, up $12 million compared to the prior quarter, primarily due to an increase in correspondent banking and capital markets income • Net charge-offs of 27 bps*, primarily attributable to one credit that was charged off during the quarter, bringing the year-to-date net charge-offs to 12 bps* (4) • Loans increased by $401 million, or 3%*, and deposits increased by $376 million, or 3%*; average loans increased by $571 million, or 5%*, and average deposits increased by $625 million, or 5%* • Total loan yield of 6.48%, up 0.15% from prior quarter; total deposit cost of 1.91%, up 0.07% from prior quarter • Efficiency ratio of 50% and adjusted efficiency ratio (non-GAAP)(1) of 47% |

| $351.5 $369.8 $544.5 $577.9 3.40% $599.7 3.48% 3.85% 4.02% 4.06% 3.00% 3.25% 3.50% 3.75% 4.00% 4.25% $200 $300 $400 $500 $600 $700 3Q24 4Q24 1Q25 2Q25 3Q25 Net Interest Income Net Interest Margin, TE (1) NET INTEREST MARGIN (TE) (1) Dollars in millions (1) For end note descriptions, see Earnings Presentation End Notes starting on slide 34. 12 |

| LOAN PRODUCTION VS LOAN GROWTH $1,459 $1,233 $1,352 $2,049 $1,648 $1,932 $2,124 $3,335 $3,375 $480 $372 $279 $568 $314 $355 $(263) $501 $401 $(500) $— $500 $1,000 $1,500 $2,000 $2,500 $3,000 $3,500 3Q23 4Q23 1Q24 2Q24 3Q24 4Q24 1Q25 2Q25 3Q25 Loan Production Loan Portfolio Growth Dollars in millions (1) & (2) For end note descriptions, see Earnings Presentation End Notes starting on slide 34. 13 (1) (2) (1) |

| Balance Sheet |

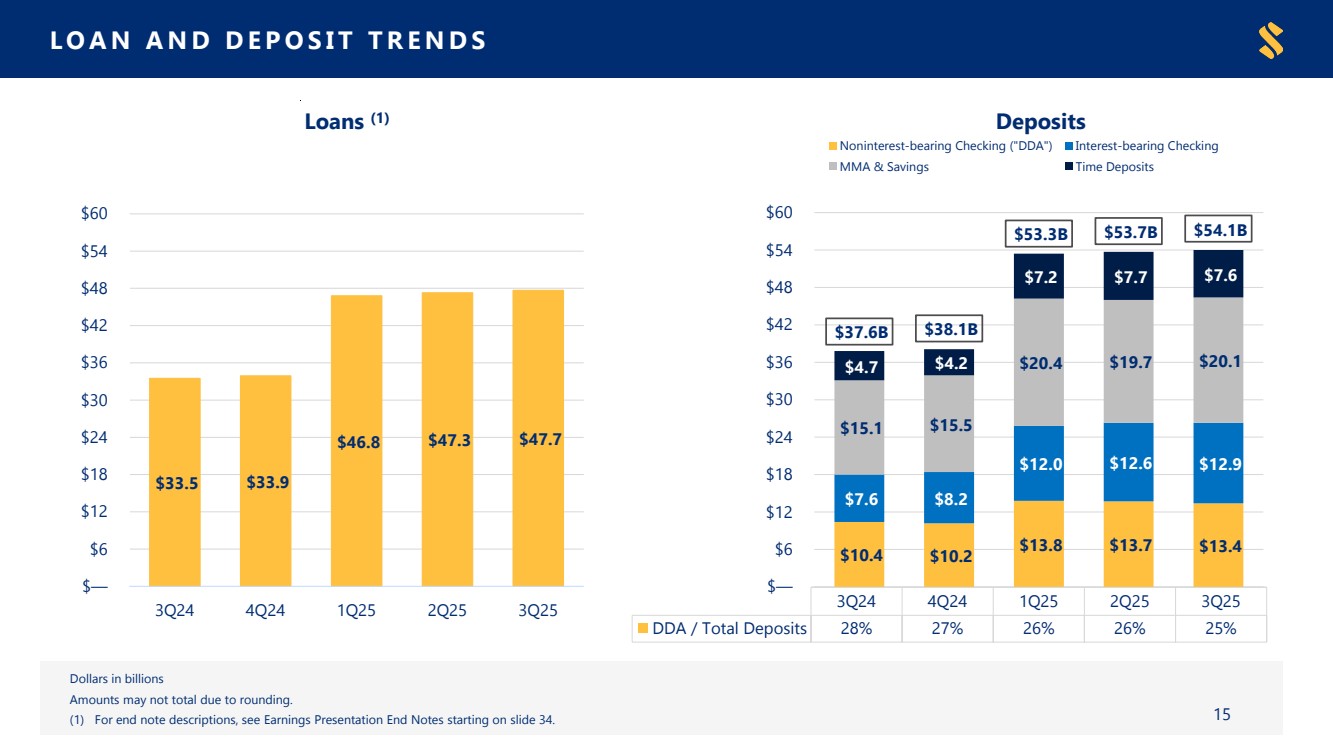
| 3Q24 4Q24 1Q25 2Q25 3Q25 DDA / Total Deposits 28% 27% 26% 26% 25% LOAN AND DEPOSIT TRENDS $33.5 $33.9 $46.8 $47.3 $47.7 $- $0.2B $0.4B $0.6B $0.8B $1.0B $1.2B $— $6 $12 $18 $24 $30 $36 $42 $48 $54 $60 3Q24 4Q24 1Q25 2Q25 3Q25 Loans (1) Dollars in billions Amounts may not total due to rounding. (1) For end note descriptions, see Earnings Presentation End Notes starting on slide 34. 15 $10.4 $10.2 $13.8 $13.7 $13.4 $7.6 $8.2 $12.0 $12.6 $12.9 $15.1 $15.5 $20.4 $19.7 $20.1 $4.7 $4.2 $7.2 $7.7 $7.6 $37.6B $38.1B $53.3B $53.7B $54.1B $— $6 $12 $18 $24 $30 $36 $42 $48 $54 $60 Deposits Noninterest-bearing Checking ("DDA") Interest-bearing Checking MMA & Savings Time Deposits |
| Investor CRE (2) 37% Consumer RE 21% Owner-Occupied CRE 16% C&I 18% CDL (1) 6% Cons / Other 2% TOTAL LOAN PORTFOLIO 16 Data as of September 30, 2025 Loan portfolio balances, average balances or percentage exclude loans held for sale; Amounts may not total due to rounding. (1)~(3) For end note descriptions, see Earnings Presentation End Notes starting on slide 34. Loan Type No. of Loans Balance Avg. Loan Balance Investor CRE 11,541 $ 17.6B $ 1,525,400 Consumer RE 50,081 10.2B 203,700 Owner-Occupied CRE 8,973 7.5B 839,100 C & I 22,218 8.6B 389,300 Constr., Dev. & Land 3,746 2.7B 715,200 Cons / Other 48,014 1.0B 20,900 Total 144,573 $ 47.7B $ 329,700 Loan Relationships Top 10 Represents ~ 2% of total loans Top 20 Represents ~ 3% of total loans Loans by Type Total Loans $47.7 Billion |

| PREMIUM CORE † DEPOSIT FRANCHISE Noninterest-bearing Checking $13.4B Interest-bearing Checking $12.9B Savings $2.9B Money Market $17.2B Time Deposits $7.6B 17 Data as of September 30, 2025 Dollars in billions except for average checking balances; Amounts may not total due to rounding. † & (1) For end note descriptions, see Earnings Presentation End Notes starting on slide 34. Total Deposits $54.1 Billion Deposits by Type 1.91% 2.09% 1.00% 1.25% 1.50% 1.75% 2.00% 2.25% 2.50% SSB Peer Average Total Cost of Deposits 3Q25 (1) |

| Credit |

| 0.57% 0.63% 0.60% 0.68% 0.67% —% 0.25% 0.50% 0.75% 1.00% 3Q24 4Q24 1Q25 2Q25 3Q25 Nonperforming Assets to Loans & OREO 0.92% 1.15% 1.41% 1.44% 1.54% 2.36% 2.86% 2.84% 2.99% 3.10% —% 1.00% 2.00% 3.00% 4.00% 3Q24 4Q24 1Q25 2Q25 3Q25 Criticized & Classified Asset Trends Special Mention / Assets Substandard / Assets ASSET QUALITY METRICS & LOAN LOSS RESERVE Dollars in millions (1) Excluding acquisition date charge-offs of $17.3 million and $39.4 million recorded during the quarters ended June 30, 2025 and March 31, 2025, respectively, in connection with the Independent merger, to conform with the Company’s charge-off policies and practices. (2) Unamortized discount on acquired loans was $310 million, $393 million, $457 million, $37 million, $40 million, $43 million, $47 million, and $51 million for the quarters ended September 30, 2025, June 30, 2025, March 31, 2025, December 31, 2024, September 30, 2024, June 30, 2024, March 31, 2024, and December 31, 2023, respectively. 19 0.07% 0.06% 0.04% 0.06% 0.27% —% 0.25% 0.50% 3Q24 4Q24 1Q25 2Q25 3Q25 Net Charge-Offs to Loans $457 $470 $472 $468 $465 $624 $621 $590 $56 $53 $50 $42 $45 $62 $65 $69 1.58% 1.60% 1.57% 1.52% 1.51% 1.47% 1.45% 1.38% 1.00% 1.40% 1.80% 2.20% $150 $300 $450 $600 $750 4Q23 1Q24 2Q24 3Q24 4Q24 1Q25 2Q25 3Q25 $ in millions Total ACL(2) plus Reserve for Unfunded Commitments Total ACL Reserve for Unfunded Commitments % of Total Loans (1) (1) |

| 0.05% 0.05% 0.07% 0.10% 0.10% 0.11% 0.11% 0.12% 0.12% 0.14% 0.16% 0.17% 0.17% 0.21% 0.21% 0.23% 0.24% 0.24% 0.25% 0.29% 0.39% Peer 1 Peer 2 Peer 3 Peer 4 Peer 5 Peer 6 Peer 7 Peer 8 Peer 9 Peer 10 Peer 11 Peer 12 Peer 13 Peer 14 Peer 15 Peer 16 Peer 17 Peer 18 Peer 19 Source: S&P Global Market Intelligence (1) Peers as disclosed in the most recent SSB proxy statement. HISTORY OF RESILIENT CREDIT 20 Net Charge-offs (“NCO”) / Average Loans (1) : 2015 – 2Q 2025 YTD Average SSB Peer Average (1) |

| Capital |

| CAPITAL RATIOS 2Q25 3Q25(2) Tangible Common Equity(1) 8.5 % 8.8 % Tier 1 Leverage 9.2 % 9.4 % Tier 1 Common Equity 11.2 % 11.5 % Tier 1 Risk-Based Capital 11.2 % 11.5 % Total Risk-Based Capital 14.5 % 14.0 % Bank CRE Concentration Ratio 277 % 272 % Bank CDL Concentration Ratio 49 % 38 % (1)&(2) For end note descriptions, see Earnings Presentation End Notes starting on slide 34. 22 |

| Appendix |

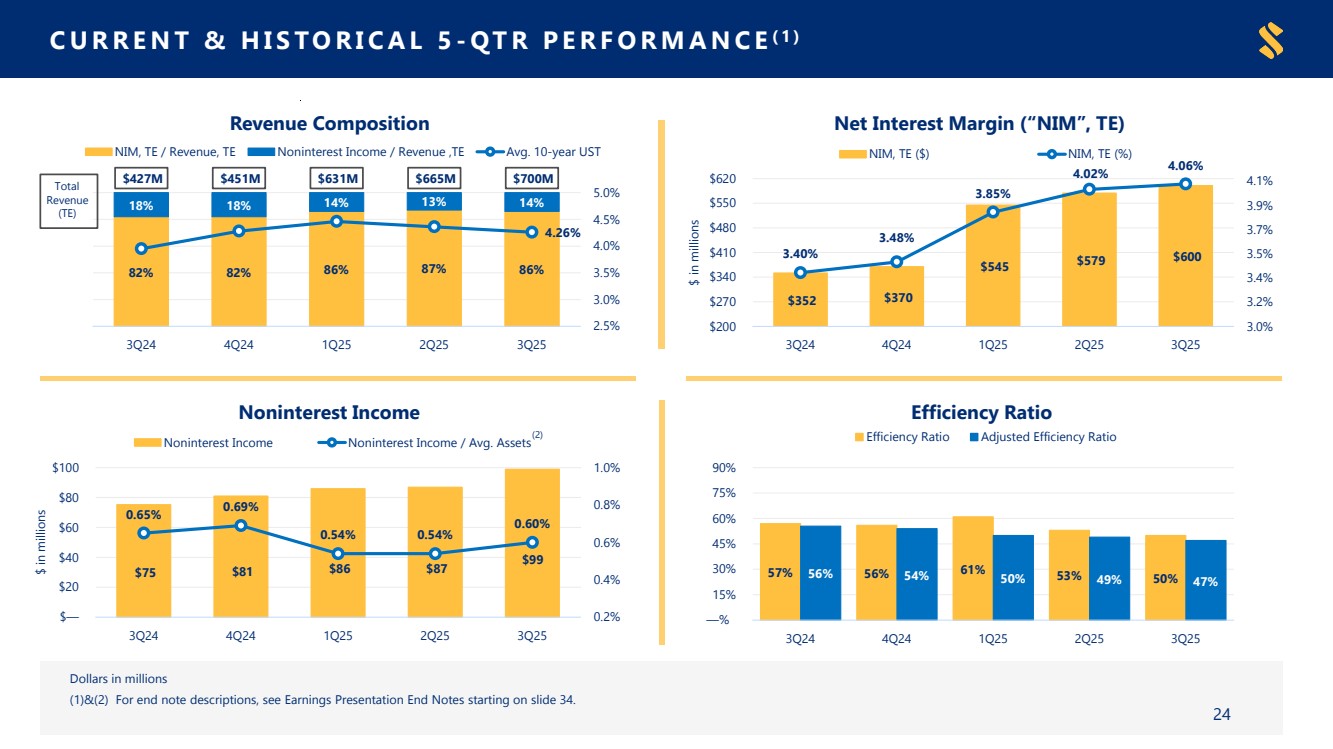
| CURRENT & HISTORICAL 5 - QTR PERFORMANCE (1) 82% 82% 86% 87% 86% 18% 18% 14% 13% 14% $427M $451M $631M $665M $700M 4.26% 2.5% 3.0% 3.5% 4.0% 4.5% 5.0% 0% 20% 40% 60% 80% 100% 3Q24 4Q24 1Q25 2Q25 3Q25 Revenue Composition NIM, TE / Revenue, TE Noninterest Income / Revenue ,TE Avg. 10-year UST Total Revenue (TE) Dollars in millions (1)&(2) For end note descriptions, see Earnings Presentation End Notes starting on slide 34. $75 $81 $86 $87 $99 0.65% 0.69% 0.54% 0.54% 0.60% 0.2% 0.4% 0.6% 0.8% 1.0% $— $20 $40 $60 $80 $100 3Q24 4Q24 1Q25 2Q25 3Q25 $ in millions Noninterest Income Noninterest Income Noninterest Income / Avg. Assets $352 $370 $545 $579 3.40% $600 3.48% 3.85% 4.02% 4.06% 3.0% 3.2% 3.4% 3.5% 3.7% 3.9% 4.1% $200 $270 $340 $410 $480 $550 $620 3Q24 4Q24 1Q25 2Q25 3Q25 $ in millions Net Interest Margin (“NIM”, TE) NIM, TE ($) NIM, TE (%) 57% 56% 61% 56% 54% 50% 53% 49% 50% 47% —% 15% 30% 45% 60% 75% 90% 3Q24 4Q24 1Q25 2Q25 3Q25 Efficiency Ratio Efficiency Ratio Adjusted Efficiency Ratio 24 (2) |
| $(7.5) $(7.4) $(7.2) $(5.4) $(4.3) $17.4 $20.9 $16.7 $19.2 $25.5 ($10.0) ($5.0) $0.0 $5.0 $10.0 $15.0 $20.0 $25.0 $30.0 $35.0 $(15) $(10) $(5) $— $5 $10 $15 $20 $25 $30 $35 3Q24 4Q24 1Q25 2Q25 3Q25 $ in millions Correspondent Revenue Breakout ARC Revenues, gross Interest on VM FI Revenues Operational Revenues Total Revenues, gross • Provides capital markets hedging (ARC), fixed income sales, international, clearing and other services to over 1,300 financial institutions across the country CORRESPONDENT BANKING DIVISION 25 1,314 Financial Institution Clients (1) For end note descriptions, see Earnings Presentation End Notes starting on slide 34. Correspondent banking and capital markets income, gross $ 17,381 $ 20,905 $ 16,715 $ 19,161 $ 25,522 Interest on centrally-cleared Variation Margin ("VM")(1) (7,488) (7,350) (7,170) (5,394) (4,318) Total Correspondent Banking and Capital Markets Income $ 9,893 $ 13,555 $ 9,545 $ 13,767 $ 21,204 |

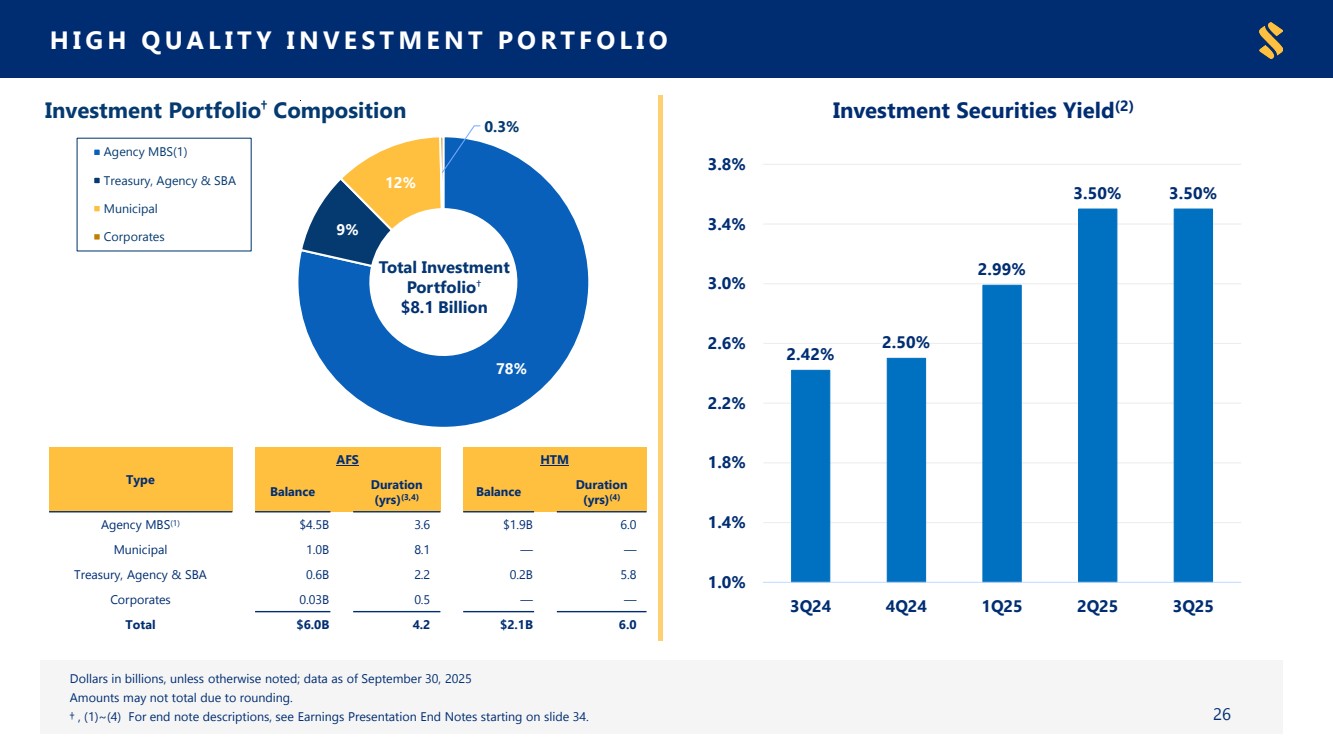
| Dollars in billions, unless otherwise noted; data as of September 30, 2025 Amounts may not total due to rounding. † , (1)~(4) For end note descriptions, see Earnings Presentation End Notes starting on slide 34. 2.42% 2.50% 2.99% 3.50% 3.50% 1.0% 1.4% 1.8% 2.2% 2.6% 3.0% 3.4% 3.8% 3Q24 4Q24 1Q25 2Q25 3Q25 Investment Securities Yield(2) HIGH QUALITY INVESTMENT PORTFOLIO 78% 9% 12% 0.3% Investment Portfolio† Composition Agency MBS(1) Treasury, Agency & SBA Municipal Corporates Type AFS HTM Balance Duration (yrs)(3,4) Balance Duration (yrs)(4) Agency MBS(1) $4.5B 3.6 $1.9B 6.0 Municipal 1.0B 8.1 — — Treasury, Agency & SBA 0.6B 2.2 0.2B 5.8 Corporates 0.03B 0.5 — — Total $6.0B 4.2 $2.1B 6.0 26 Total Investment Portfolio† $8.1 Billion |
| NON - GAAP RECONCILIATIONS – RETURN ON AVG. TANGIBLE COMMON EQUITY Dollars in thousands The tangible measures are non-GAAP measures and exclude the effect of period end or average balance of intangible assets; the tangible returns on equity and common equity measures also add back the after-tax amortization of intangibles to GAAP basis net income. 27 Return on Average Tangible Equity 2Q25 3Q25 Net income (GAAP) $ 215,224 $ 246,641 Plus: Amortization of intangibles 24,048 23,426 Effective tax rate 24 % 23 % Amortization of intangibles, net of tax 18,341 17,979 Net income plus after-tax amortization of intangibles (non-GAAP) $ 233,565 $ 264,620 Average shareholders' common equity $ 8,692,582 $ 8,867,408 Less: Average intangible assets 3,535,410 3,516,575 Average tangible common equity $ 5,157,172 $ 5,350,833 Return on Average Tangible Common Equity (Non-GAAP) 18.2% 19.6% |

| NON - GAAP RECONCILIATIONS – ADJUSTED NET INCOME & ADJUSTED EARNINGS PER SHARE (“EPS”) Dollars in thousands, except for per share data (1) Includes pre-tax cyber incident (reimbursement) costs of $3,000, $(3.6) million and $111,000 for the quarters ended September 30, 2025 and June 30, 2025, respectively. 28 Adjusted Net Income 2Q25 3Q25 Net income (GAAP) $ 215,224 $ 246,641 Plus: Merger, branch consolidation, severance related and other expense, net of tax (1) 18,593 16,032 Adjusted Net Income (Non-GAAP) $ 233,817 $ 262,673 Adjusted EPS 2Q25 3Q25 Diluted weighted-average common shares 101,845 101,735 Adjusted net income (non-GAAP) $ 233,817 $ 262,673 Adjusted EPS, Diluted (Non-GAAP) $ 2.30 $ 2.58 |

| NON - GAAP RECONCILIATIONS – ADJUSTED RETURN ON AVG. ASSETS & AVG. TANGIBLE COMMON EQUITY Dollars in thousands The tangible measures are non-GAAP measures and exclude the effect of period end or average balance of intangible assets; the tangible returns on equity and common equity measures also add back the after-tax amortization of intangibles to GAAP basis net income. 29 Dollars in thousands, except for per share data Adjusted Return on Average Assets 2Q25 3Q25 Adjusted net income (non-GAAP) $ 233,817 $ 262,673 Total average assets 64,550,881 65,489,544 Adjusted Return on Average Assets (Non-GAAP) 1.45% 1.59% Adjusted Return on Average Tangible Common Equity 2Q25 3Q25 Adjusted net income (non-GAAP) $ 233,817 $ 262,673 Plus: Amortization of intangibles, net of tax 18,341 17,979 Adjusted net income plus after-tax amortization of intangibles (non-GAAP) $ 252,158 $ 280,652 Average tangible common equity $ 5,157,172 $ 5,350,833 Adjusted Return on Average Tangible Common Equity (Non-GAAP) 19.61% 20.81% |

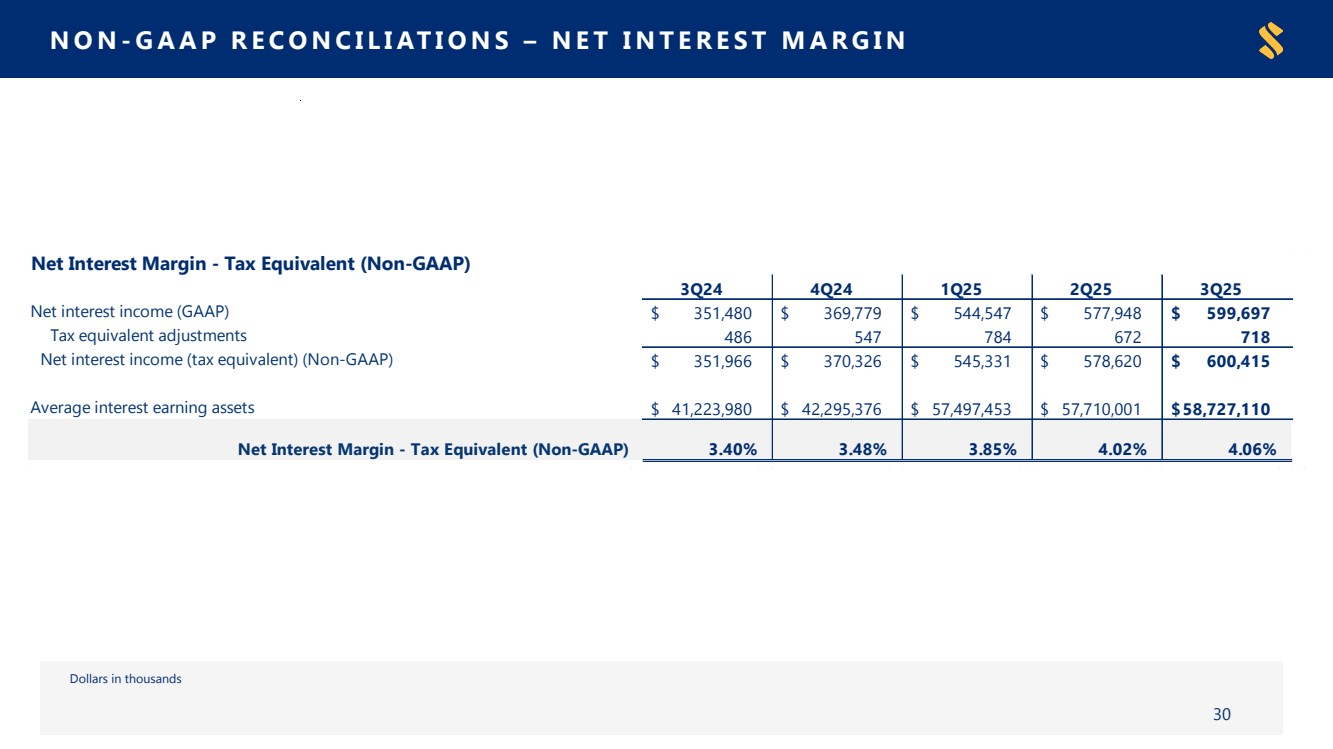
| NON - GAAP RECONCILIATIONS – NET INTEREST MARGIN Dollars in thousands 30 Dollars in thousands, except for per share data Net Interest Margin - Tax Equivalent (Non-GAAP) 3Q24 4Q24 1Q25 2Q25 3Q25 Net interest income (GAAP) $ 351,480 $ 369,779 $ 544,547 $ 577,948 $ 599,697 Tax equivalent adjustments 486 547 784 672 718 Net interest income (tax equivalent) (Non-GAAP) $ 351,966 $ 370,326 $ 545,331 $ 578,620 $ 600,415 Average interest earning assets $ 41,223,980 $ 42,295,376 $ 57,497,453 $ 57,710,001 $58,727,110 Net Interest Margin - Tax Equivalent (Non-GAAP) 3.40% 3.48% 3.85% 4.02% 4.06% |
| NON - GAAP RECONCILIATIONS – PPNR, PPNR/WEIGHTED AVG. CS, ADJUSTED & CORRESPONDENT & CAPITAL MARKETS INCOME (UNAUDITED) Dollars and weighted average commons share outstanding in thousands except per share data (1) Includes pre-tax cyber incident (reimbursement) costs of $3,000, $(3.6) million, $111,000, $329,000, $56,000, and $3.5 million for the quarters ended September 30, 2025, June 30, 2025, March 31, 2025, December 31, 2024, and September 30, 2024, respectively. 31 3Q24 4Q24 1Q25 2Q25 3Q25 Net interest income (GAAP) $ 351,480 $ 369,779 $ 544,547 $ 577,948 $ 599,697 Plus: Noninterest income 74,934 80,545 86,088 86,817 99,086 Less: Losses on sales of securities, net — (50) (228,811) — — Gain on sale leaseback, net of transaction costs — — 229,279 — — Total revenue, adjusted (non-GAAP) $ 426,414 $ 450,374 $ 630,167 $ 664,765 $ 698,783 Less: Noninterest expense 246,847 256,609 408,826 375,061 372,342 PPNR (Non-GAAP) $ 179,567 $ 193,765 $ 221,341 $ 289,704 $ 326,441 Plus: Merger, branch consolidation, severance related and other expense (1) 3,304 6,531 68,006 24,379 20,889 FDIC Special Assessment — (621) — — — Total adjustments $ 3,304 $ 5,910 $ 68,006 $ 24,379 $ 20,889 PPNR, Adjusted (Non-GAAP) $ 182,871 $ 199,675 $ 289,347 $ 314,083 $ 347,330 Weighted average common shares outstanding, diluted 76,805 76,958 101,829 101,845 101,735 PPNR, Adjusted per Weighted Avg. Common Shares Outstanding, Diluted (Non-GAAP) $ 2.38 $ 2.59 $ 2.84 $ 3.08 $ 3.41 Correspondent & Capital Markets Income 3Q24 4Q24 1Q25 2Q25 3Q25 ARC revenues $ 1,471 $ 3,379 $ 414 $ 5,083 $ 8,926 FI revenues 4,937 7,190 6,398 6,192 8,045 Operational revenues 3,485 2,986 2,733 2,492 4,233 Total Correspondent & Capital Markets Income $ 9,893 $ 13,555 $ 9,545 $ 13,767 $ 21,204 PPNR, Adjusted (Non-GAAP) |

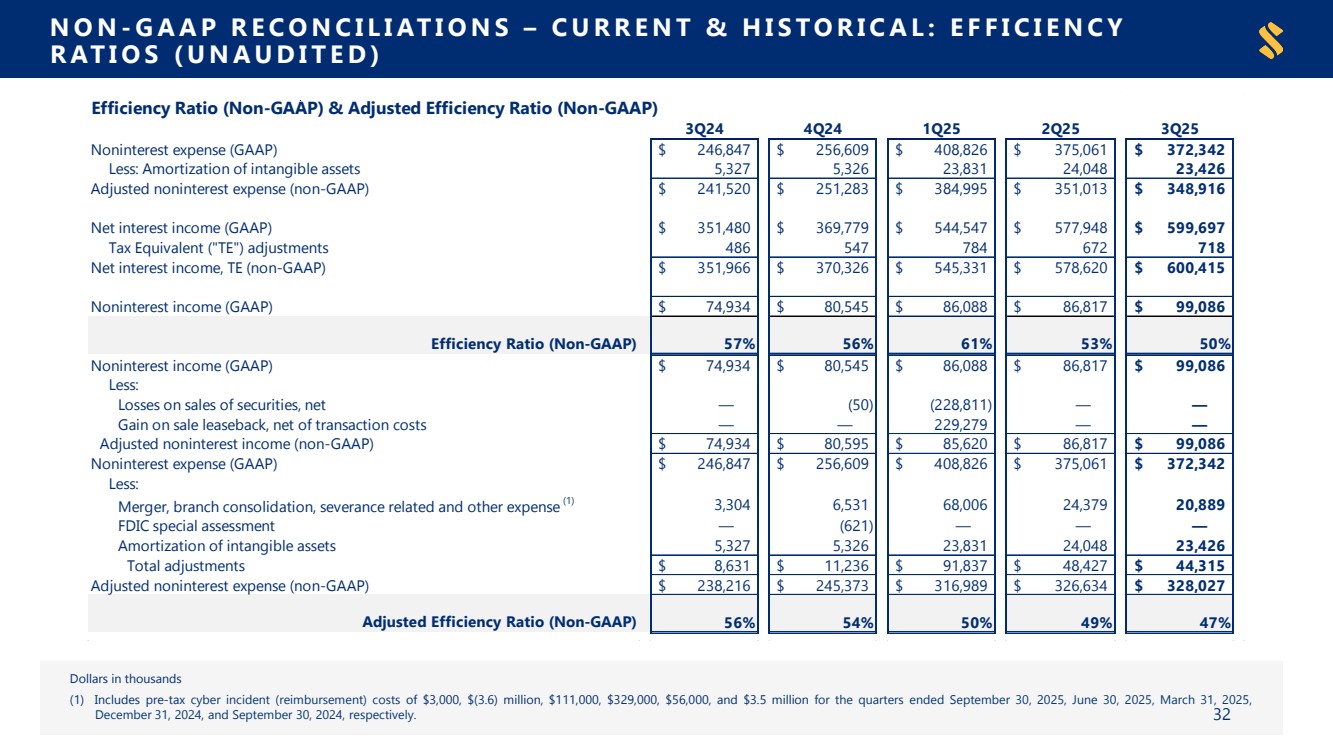
| NON - GAAP RECONCILIATIONS – CURRENT & HISTORICAL: EFFICIENCY RATIOS (UNAUDITED) Dollars in thousands (1) Includes pre-tax cyber incident (reimbursement) costs of $3,000, $(3.6) million, $111,000, $329,000, $56,000, and $3.5 million for the quarters ended September 30, 2025, June 30, 2025, March 31, 2025, December 31, 2024, and September 30, 2024, respectively. 32 3Q24 4Q24 1Q25 2Q25 3Q25 Noninterest expense (GAAP) $ 246,847 $ 256,609 $ 408,826 $ 375,061 $ 372,342 Less: Amortization of intangible assets 5,327 5,326 23,831 24,048 23,426 Adjusted noninterest expense (non-GAAP) $ 241,520 $ 251,283 $ 384,995 $ 351,013 $ 348,916 Net interest income (GAAP) $ 351,480 $ 369,779 $ 544,547 $ 577,948 $ 599,697 Tax Equivalent ("TE") adjustments 486 547 784 672 718 Net interest income, TE (non-GAAP) $ 351,966 $ 370,326 $ 545,331 $ 578,620 $ 600,415 Noninterest income (GAAP) $ 74,934 $ 80,545 $ 86,088 $ 86,817 $ 99,086 Efficiency Ratio (Non-GAAP) 57% 56% 61% 53% 50% Noninterest income (GAAP) $ 74,934 $ 80,545 $ 86,088 $ 86,817 $ 99,086 Less: Losses on sales of securities, net — (50) (228,811) — — Gain on sale leaseback, net of transaction costs — — 229,279 — — Adjusted noninterest income (non-GAAP) $ 74,934 $ 80,595 $ 85,620 $ 86,817 $ 99,086 Noninterest expense (GAAP) $ 246,847 $ 256,609 $ 408,826 $ 375,061 $ 372,342 Less: Merger, branch consolidation, severance related and other expense (1) 3,304 6,531 68,006 24,379 20,889 FDIC special assessment — (621) — — — Amortization of intangible assets 5,327 5,326 23,831 24,048 23,426 Total adjustments $ 8,631 $ 11,236 $ 91,837 $ 48,427 $ 44,315 Adjusted noninterest expense (non-GAAP) $ 238,216 $ 245,373 $ 316,989 $ 326,634 $ 328,027 Adjusted Efficiency Ratio (Non-GAAP) 56% 54% 50% 49% 47% Efficiency Ratio (Non-GAAP) & Adjusted Efficiency Ratio (Non-GAAP) |
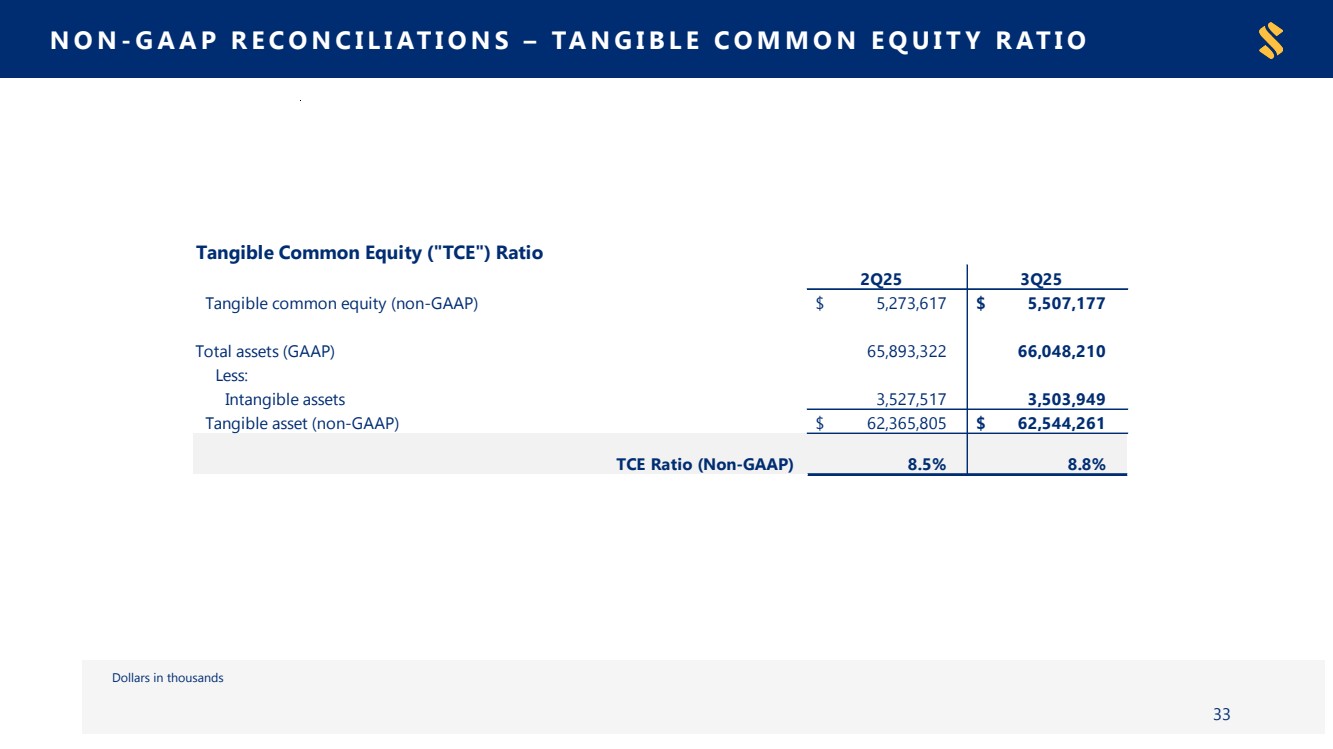
| NON - GAAP RECONCILIATIONS – TANGIBLE COMMON EQUITY RATIO Dollars in thousands 33 Tangible Common Equity ("TCE") Ratio 2Q25 3Q25 Tangible common equity (non-GAAP) $ 5,273,617 $ 5,507,177 Total assets (GAAP) 65,893,322 66,048,210 Less: Intangible assets 3,527,517 3,503,949 Tangible asset (non-GAAP) $ 62,365,805 $ 62,544,261 TCE Ratio (Non-GAAP) 8.5% 8.8% |
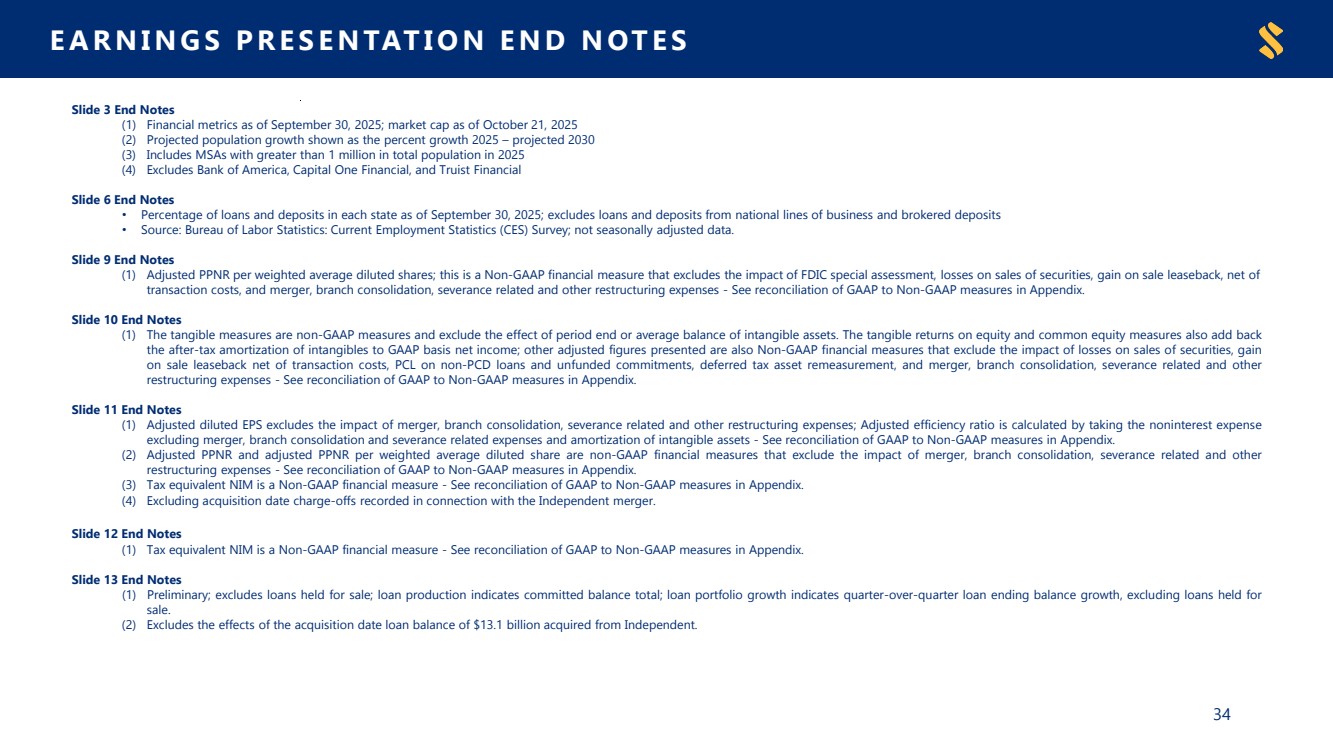
| EARNINGS PRESENTATION END NOTES 34 Slide 3 End Notes (1) Financial metrics as of September 30, 2025; market cap as of October 21, 2025 (2) Projected population growth shown as the percent growth 2025 – projected 2030 (3) Includes MSAs with greater than 1 million in total population in 2025 (4) Excludes Bank of America, Capital One Financial, and Truist Financial Slide 6 End Notes • Percentage of loans and deposits in each state as of September 30, 2025; excludes loans and deposits from national lines of business and brokered deposits • Source: Bureau of Labor Statistics: Current Employment Statistics (CES) Survey; not seasonally adjusted data. Slide 9 End Notes (1) Adjusted PPNR per weighted average diluted shares; this is a Non-GAAP financial measure that excludes the impact of FDIC special assessment, losses on sales of securities, gain on sale leaseback, net of transaction costs, and merger, branch consolidation, severance related and other restructuring expenses - See reconciliation of GAAP to Non-GAAP measures in Appendix. Slide 10 End Notes (1) The tangible measures are non-GAAP measures and exclude the effect of period end or average balance of intangible assets. The tangible returns on equity and common equity measures also add back the after-tax amortization of intangibles to GAAP basis net income; other adjusted figures presented are also Non-GAAP financial measures that exclude the impact of losses on sales of securities, gain on sale leaseback net of transaction costs, PCL on non-PCD loans and unfunded commitments, deferred tax asset remeasurement, and merger, branch consolidation, severance related and other restructuring expenses - See reconciliation of GAAP to Non-GAAP measures in Appendix. Slide 11 End Notes (1) Adjusted diluted EPS excludes the impact of merger, branch consolidation, severance related and other restructuring expenses; Adjusted efficiency ratio is calculated by taking the noninterest expense excluding merger, branch consolidation and severance related expenses and amortization of intangible assets - See reconciliation of GAAP to Non-GAAP measures in Appendix. (2) Adjusted PPNR and adjusted PPNR per weighted average diluted share are non-GAAP financial measures that exclude the impact of merger, branch consolidation, severance related and other restructuring expenses - See reconciliation of GAAP to Non-GAAP measures in Appendix. (3) Tax equivalent NIM is a Non-GAAP financial measure - See reconciliation of GAAP to Non-GAAP measures in Appendix. (4) Excluding acquisition date charge-offs recorded in connection with the Independent merger. Slide 12 End Notes (1) Tax equivalent NIM is a Non-GAAP financial measure - See reconciliation of GAAP to Non-GAAP measures in Appendix. Slide 13 End Notes (1) Preliminary; excludes loans held for sale; loan production indicates committed balance total; loan portfolio growth indicates quarter-over-quarter loan ending balance growth, excluding loans held for sale. (2) Excludes the effects of the acquisition date loan balance of $13.1 billion acquired from Independent. |
| EARNINGS PRESENTATION END NOTES 35 Slide 15 End Notes (1) Excludes loans held for sale. Slide 16 End Notes (1) CDL includes residential construction, commercial construction, and all land development loans. (2) Investor CRE includes nonowner-occupied CRE and other income producing property. Slide 17 End Notes † Core deposits defined as non-time deposits (1) Source: S&P Global Market Intelligence; 3Q25 MRQs available as of October 21, 2025; Peers as disclosed in the most recent SSB proxy statement. Slide 22 End Notes (1) The tangible measures are non-GAAP measures and exclude the effect of period end intangible assets - See reconciliation of GAAP to Non-GAAP measures in Appendix. (2) Preliminary Slide 24 End Notes (1) Total revenue and noninterest income are adjusted by gains or losses on sales of securities and gains on sale leaseback. The total revenue also includes tax equivalent adjustments; Tax equivalent NIM, efficiency ratio and adjusted efficiency ratio are Non-GAAP financial measures; Adjusted Efficiency Ratio excludes losses on sales of securities, gain on sale leaseback net of transaction costs, merger, branch consolidation, FDIC special assessment, severance related and other restructuring expenses, and amortization of intangible assets , as applicable – See Current & Historical Efficiency Ratios and Net Interest Margin reconciliation in Appendix. (2) Annualized Slide 25 End Notes (1) Interest on centrally-cleared variation margin (expense or income) is included in ARC revenue within Correspondent Banking and Capital Markets Income. Slide 26 End Notes † Investment portfolio excludes non-marketable equity. (1) MBS issued by U.S. government agencies or sponsored enterprises (commercial and residential collateral) (2) Investment securities yield include non-marketable equity and trading securities. (3) Excludes principal receivable balance as of September 30, 2025. (4) Based on current book value |
|