(7) Represents various federal and local reimbursement programs in the United Kingdom and Canada.
1
Portfolio
(dollars in thousands at Welltower pro rata ownership)
In-Place NOI Diversification(1)
By Partner:
Total Properties
Seniors Housing Operating
Seniors Housing Triple-net
Outpatient Medical
Long-Term/ Post-Acute Care
Total
% of Total
Barchester
261
$
217,296
$
265,944
$
—
$
—
$
483,240
11.6
%
Cogir Management Corporation
182
338,244
—
—
—
338,244
8.1
%
Care UK
168
245,768
—
—
—
245,768
5.9
%
Sunrise Senior Living
85
230,936
—
—
—
230,936
5.6
%
Avir Health Group
130
—
—
—
210,100
210,100
5.1
%
Oakmont Management Group
69
178,696
—
—
—
178,696
4.3
%
Avery Healthcare
95
99,104
77,352
—
—
176,456
4.2
%
StoryPoint Senior Living
109
167,564
—
—
—
167,564
4.0
%
HC One Ltd
215
131,512
—
—
—
131,512
3.2
%
Sagora Senior Living
73
116,264
—
—
—
116,264
2.8
%
Remaining
1,147
1,129,708
269,444
116,192
365,964
1,881,308
45.2
%
Total
2,534
$
2,855,092
$
612,740
$
116,192
$
576,064
$
4,160,088
100.0
%
By Country:
United States
1,611
$
1,883,928
$
233,268
$
116,192
$
569,464
$
2,802,852
67.4
%
United Kingdom
786
717,748
376,264
—
—
1,094,012
26.3
%
Canada
137
253,416
3,208
—
6,600
263,224
6.3
%
Total
2,534
$
2,855,092
$
612,740
$
116,192
$
576,064
$
4,160,088
100.0
%
By MSA:
Greater London
143
$
182,044
$
81,816
$
—
$
—
$
263,860
6.3
%
Los Angeles
52
127,100
21,328
564
2,640
151,632
3.6
%
New York / New Jersey
70
97,988
20,196
12,088
16,128
146,400
3.5
%
Dallas
80
97,044
936
2,160
30,568
130,708
3.1
%
Houston
54
26,936
—
73,340
19,992
120,268
2.9
%
Montréal
26
84,604
—
—
—
84,604
2.0
%
Washington D.C.
32
62,740
6,288
—
13,408
82,436
2.0
%
Boston
26
68,548
11,888
184
—
80,620
1.9
%
San Francisco
23
57,004
11,164
—
2,492
70,660
1.7
%
Chicago
34
54,312
7,192
—
—
61,504
1.5
%
Philadelphia
36
31,464
5,232
376
13,628
50,700
1.2
%
Tampa
31
14,256
2,448
928
26,952
44,584
1.1
%
Seattle
28
40,940
1,268
244
1,964
44,416
1.1
%
Raleigh
11
11,156
31,352
—
—
42,508
1.0
%
Charlotte
23
20,332
10,328
10,548
—
41,208
1.0
%
San Antonio
19
24,564
920
488
15,208
41,180
1.0
%
San Diego
14
29,984
7,532
—
3,212
40,728
1.0
%
Cleveland
24
33,352
2,460
—
3,912
39,724
1.0
%
Pittsburgh
21
21,700
5,416
2,452
5,812
35,380
0.9
%
Minneapolis
21
34,148
—
548
—
34,696
0.8
%
Remaining
1,766
1,734,876
384,976
12,272
420,148
2,552,272
61.4
%
Total
2,534
$
2,855,092
$
612,740
$
116,192
$
576,064
$
4,160,088
100.0
%
Notes:
(1) Represents current quarter annualized In-Place NOI. See page 17 for reconciliation.
2
Portfolio
(dollars, units and occupancy at Welltower pro rata ownership; dollars in thousands)
Seniors Housing Operating
Total Portfolio Performance(1)
4Q24
1Q25
2Q25
3Q25
4Q25
Properties
1,085
1,113
1,171
1,199
1,659
Units
118,818
124,742
129,758
131,792
160,218
Total occupancy
84.8
%
85.1
%
85.6
%
86.9
%
87.4
%
Total revenues
$
1,808,025
$
1,901,227
$
2,007,567
$
2,109,690
$
2,607,559
Operating expenses
1,366,423
1,410,579
1,464,457
1,530,131
1,902,889
NOI
$
441,602
$
490,648
$
543,110
$
579,559
$
704,670
NOI margin
24.4
%
25.8
%
27.1
%
27.5
%
27.0
%
Recurring cap-ex
$
75,822
$
68,359
$
63,937
$
78,803
$
116,560
Other cap-ex
$
188,301
$
135,045
$
118,646
$
131,668
$
166,439
Same Store Performance(2)
4Q24
1Q25
2Q25
3Q25
4Q25
Properties
875
875
875
875
875
Units
98,967
98,950
98,944
98,943
98,944
Occupancy
85.5
%
86.2
%
87.3
%
88.6
%
89.5
%
Same store revenues
$
1,429,732
$
1,471,911
$
1,504,244
$
1,542,552
$
1,566,559
Compensation
611,804
615,699
623,755
636,087
648,384
Utilities
62,769
71,222
59,911
69,320
65,421
Food
60,347
57,375
59,493
60,826
63,139
Repairs and maintenance
38,830
39,088
39,604
42,720
41,957
Property taxes
44,402
49,249
49,473
49,751
46,780
All other
221,926
218,172
224,307
225,227
231,695
Same store operating expenses
1,040,078
1,050,805
1,056,543
1,083,931
1,097,376
Same store NOI
$
389,654
$
421,106
$
447,701
$
458,621
$
469,183
Same store NOI margin %
27.3
%
28.6
%
29.8
%
29.7
%
30.0
%
Year over year NOI growth rate
20.4
%
Year over year revenue growth rate
9.6
%
Partners(3)
Properties
Pro Rata Units
Welltower Ownership %(4)
Top Markets
4Q25 NOI
% of Total
Cogir Management Corporation
182
27,604
94.0
%
Greater London
$
51,536
7.3
%
Care UK
168
10,751
100.0
%
Southern California
47,805
6.8
%
Sunrise Senior Living
85
7,751
91.5
%
Northern California
34,649
4.9
%
Barchester
111
6,811
100.0
%
Dallas
24,631
3.5
%
Oakmont Management Group
69
6,911
100.0
%
New York / New Jersey
24,367
3.5
%
StoryPoint Senior Living
109
11,079
94.7
%
Montreal
21,269
3.0
%
HC One Ltd
215
12,336
100.0
%
Washington D.C.
18,279
2.6
%
Sagora Senior Living
73
8,476
100.0
%
Boston
17,049
2.4
%
Legend Senior Living
59
5,060
87.7
%
Chicago
13,604
1.9
%
Avery Healthcare
45
3,386
94.8
%
Seattle
10,591
1.5
%
Belmont Village
21
2,803
95.0
%
Top markets
41,244
5.8
%
Discovery Senior Living
75
6,011
57.7
%
All other
663,426
94.2
%
Quality Senior Living
38
4,222
87.4
%
Total
$
704,670
100.0
%
Axis Residential
29
4,639
100.0
%
Remaining
370
41,951
Total
1,649
159,791
Notes:
(1) Properties, units, occupancy and cap-ex exclude land parcels, properties under development/redevelopment, leased properties and nonoperational properties.
(3) Represents partner concentration based on annualized In-Place NOI for the quarter ended December 31, 2025. Property count and pro rata units represent the In-Place portfolio.
(4) Welltower ownership percentage weighted based on In-Place NOI. See page 17 for reconciliation.
3
Portfolio
(dollars in thousands at Welltower pro rata ownership)
Payment Coverage Stratification
EBITDARM Coverage(1)
EBITDAR Coverage(1)
% of In-Place NOI
Seniors Housing Triple-net
Long-Term/ Post- Acute Care
Total
Weighted Average Maturity
Number of Leases
Seniors Housing Triple-net
Long-Term/ Post- Acute Care
Total
Weighted Average Maturity
Number of Leases
<.85x
0.2
%
0.1
%
0.3
%
8
3
0.2
%
0.1
%
0.3
%
8
3
.85x-.95x
—
%
—
%
—
%
—
—
—
%
—
%
—
%
—
—
.95x-1.05x
—
%
—
%
—
%
—
—
0.4
%
3.4
%
3.8
%
12
3
1.05x-1.15x
—
%
—
%
—
%
—
—
0.6
%
—
%
0.6
%
8
3
1.15x-1.25x
0.3
%
—
%
0.3
%
5
1
4.6
%
0.3
%
4.9
%
8
6
1.25x-1.35x
1.0
%
1.3
%
2.3
%
9
3
1.1
%
0.6
%
1.7
%
6
2
>1.35
5.7
%
4.8
%
10.5
%
10
22
0.3
%
1.8
%
2.1
%
14
12
Total
7.2
%
6.2
%
13.4
%
10
29
7.2
%
6.2
%
13.4
%
10
29
Revenue and Lease Maturity(2)
Rental Income
Year
Seniors Housing Triple-net
Outpatient Medical
Long-Term / Post-Acute Care
Interest Income
Total Revenues
% of Total
2026
$
3,244
$
2,581
$
9,282
$
75,751
$
90,858
6.0
%
2027
—
1,898
1,287
66,989
70,174
4.6
%
2028
—
3,816
6,669
2,522
13,007
0.9
%
2029
1,115
5,317
—
4,297
10,729
0.7
%
2030
12,525
6,363
30,222
183
49,293
3.2
%
2031
6,752
4,991
4,630
216
16,589
1.1
%
2032
97,170
3,159
54,172
356
154,857
10.2
%
2033
63,400
959
1,070
—
65,429
4.3
%
2034
433
4,127
—
274
4,834
0.3
%
2035
36,868
4,212
15,007
840
56,927
3.7
%
Thereafter
381,817
80,999
450,735
75,408
988,959
65.0
%
$
603,324
$
118,422
$
573,074
$
226,836
$
1,521,656
100.0
%
Weighted Avg Maturity Years
15
12
16
8
14
Notes:
(1) Represents trailing twelve month coverage metrics as of September 30, 2025 for stable portfolio only. Agreements included represent 47% of total Seniors Housing Triple-net and Long-Term/Post-Acute Care In-Place NOI. See page 17 for a reconciliation. Agreements with mixed units use the predominant type based on investment balance.
(2) Excludes all land parcels, developments and investments classified as held for sale, as well as Seniors Housing Triple-net and Long-Term / Post-Acute Care leases accounted for on a cash basis where substantially all contractual rental income during the most recent period was not collected. Rental income represents annualized cash base rent for effective lease agreements. The amounts are derived from the current contracted monthly cash base rent, net of collectability reserves, if applicable. Rental income does not include common area maintenance charges, the amortization of above/below market lease intangibles or other non-cash income. Interest income represents the annualized contractual rate of interest for loans, net of collectability reserves, if applicable.
4
Portfolio
(dollars, square feet and occupancy at Welltower pro rata ownership; dollars in thousands except per square feet)
Outpatient Medical
Total Portfolio Performance(1)
4Q24
1Q25
2Q25
3Q25
4Q25
Properties
429
433
434
437
194
Square feet
21,430,682
21,775,061
21,914,499
22,073,485
8,801,545
Occupancy
94.3
%
94.5
%
94.4
%
94.2
%
95.5
%
Total revenues
$
205,361
$
214,693
$
215,718
$
219,238
$
148,862
Operating expenses
61,392
66,804
65,197
65,851
45,000
NOI
$
143,969
$
147,889
$
150,521
$
153,387
$
103,862
NOI margin
70.1
%
68.9
%
69.8
%
70.0
%
69.8
%
Revenues per square foot
$
38.33
$
39.44
$
39.37
$
39.73
$
67.65
NOI per square foot
$
26.87
$
27.17
$
27.47
$
27.80
$
47.20
Recurring cap-ex
$
11,029
$
6,191
$
13,221
$
19,324
$
4,298
Other cap-ex
$
16,756
$
9,742
$
9,297
$
14,051
$
1,963
Same Store Performance(2)
4Q24
1Q25
2Q25
3Q25
4Q25
Properties
104
104
104
104
104
Occupancy
97.3
%
97.2
%
97.5
%
97.6
%
97.5
%
Same store revenues
$
27,460
$
27,443
$
27,732
$
26,071
$
27,459
Same store operating expenses
4,237
4,186
4,104
2,489
3,681
Same store NOI
$
23,223
$
23,257
$
23,628
$
23,582
$
23,778
NOI margin
84.6
%
84.7
%
85.2
%
90.5
%
86.6
%
Year over year NOI growth rate
2.4
%
Portfolio Diversification
by Tenant(3)
Rental Income
% of Total
Quality Indicators
Kelsey-Seybold
$
73,348
61.9
%
Health system affiliated properties as % of NOI(3)
99.6
%
UnitedHealth
15,356
13.0
%
Health system affiliated tenants as % of rental income(3)
91.6
%
Atrium Health
10,456
8.8
%
Investment grade tenants as % of rental income(3)
91.0
%
Normal Regional Health
1,333
1.1
%
Retention (trailing twelve months)(3)
85.8
%
Community Health Systems
1,243
1.0
%
Average remaining lease term (years)(3)
11.8
Remaining portfolio
16,686
14.2
%
Average building size (square feet)(3)
70,997
Total
$
118,422
100.0
%
Average age (years)
19
Expirations(3)
2026
2027
2028
2029
2030
Thereafter
Occupied square feet
103,031
73,139
143,266
198,607
272,024
3,232,891
% of occupied square feet
2.6
%
1.8
%
3.6
%
4.9
%
6.8
%
80.3
%
Notes:
(1) Properties, square feet, occupancy and cap-ex exclude land parcels, properties under development/redevelopment and nonoperational properties. Per square foot amounts are annualized.
(2) Includes 104 same store properties representing 3,434,064 square feet. See pages 17 and 18 for reconciliation.
(3) Excludes all land parcels, developments and investments held for sale. Rental income represents annualized cash base rent for effective lease agreements. The amounts are derived from the current contracted monthly cash base rent, net of collectability reserves, if applicable. Rental income does not include common area maintenance charges, the amortization of above/below market lease intangibles or other non-cash income. Retention includes month-to-month tenants retained.
5
Investment
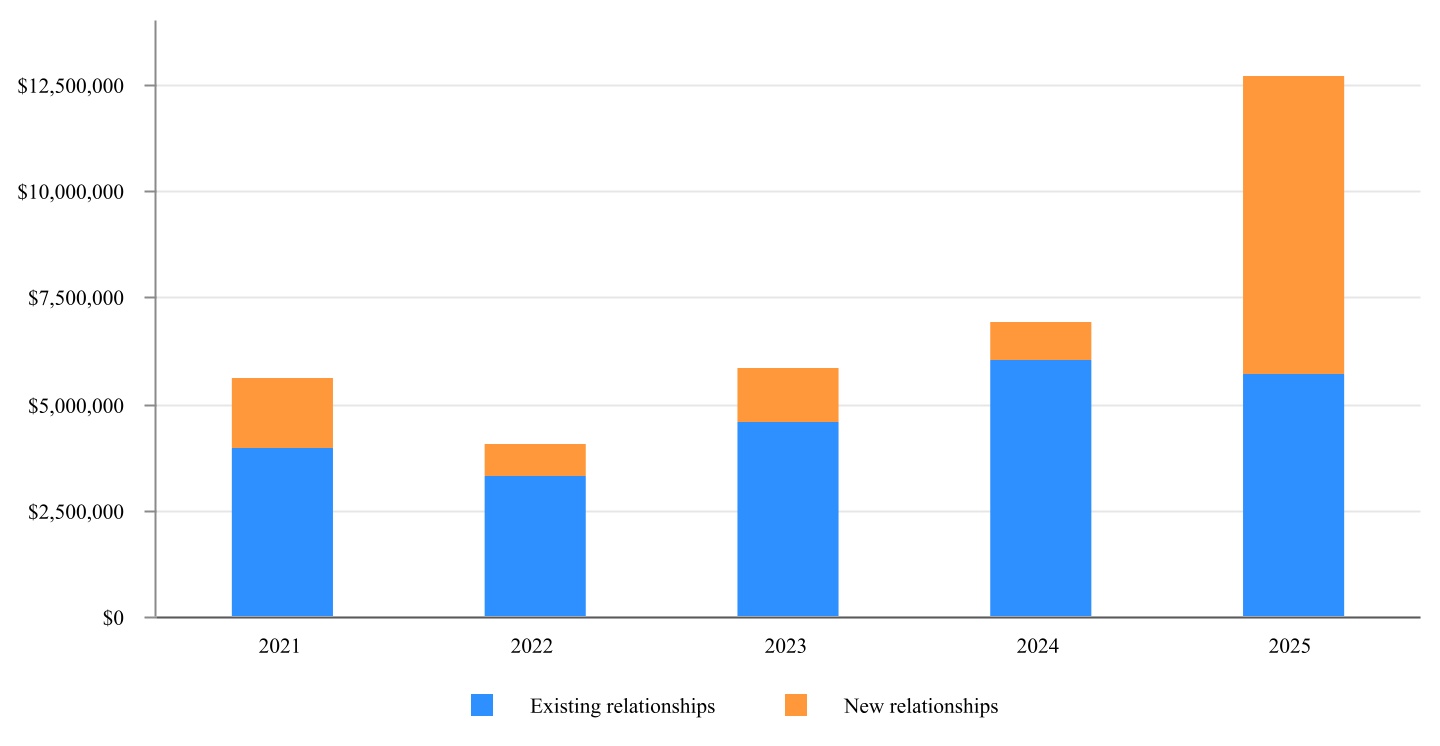
(dollars in thousands at Welltower pro rata ownership)
Relationship Investment History
Detail of Acquisitions/JVs(1)
2021
2022
2023
2024
1Q25
2Q25
3Q25
4Q25
21-25 Total
Count
35
27
52
54
26
16
18
30
276
Total
$
4,101,534
$
2,785,739
$
4,222,706
$
5,287,140
$
2,612,747
$
978,896
$
1,351,102
$
12,623,382
$
35,314,348
Low
5,000
6,485
2,950
970
13,358
4,825
13,200
7,725
970
Median
45,157
66,074
65,134
39,863
54,794
50,994
38,440
72,835
51,850
High
1,576,642
389,149
644,443
936,814
990,908
296,300
397,335
6,644,176
6,644,176
Investment Timing
Acquisitions and Loan Funding(2)
Yield
Construction Conversions(3)
Year 1 Yield
Dispositions and Loan Repayments
Yield
October
$
12,191,703
7.4
%
$
44,353
0.3
%
$
3,230,100
8.4
%
November
666,949
7.5
%
11,111
(5.8)
%
2,343,845
6.0
%
December
951,139
7.2
%
117,655
0.2
%
1,881,397
6.4
%
Total
$
13,809,791
7.4
%
$
173,119
(0.2)
%
$
7,455,342
7.1
%
Notes:
(1) Includes non-yielding asset acquisitions.
(2) Includes advances for non-real estate loans. Excludes land acquisitions and advances for development loans.
(3) Includes expansion conversions and excludes in substance real estate investments.
6
Investment
(dollars in thousands at Welltower pro rata ownership, except per bed / unit / square foot)
Gross Investment Activity
Fourth Quarter 2025
Properties
Beds / Units / Square Feet
Investment Per Bed / Unit / SqFt
Pro Rata Amount
Yield
Acquisitions and Loan Funding(1)
Seniors Housing Operating
553
35,582
units
$
239,760
$
8,531,155
Seniors Housing Triple-net
156
9,962
units
324,775
3,235,410
Long-Term/Post-Acute Care
44
4,584
beds
188,647
864,756
Loan funding
1,178,470
Total acquisitions and loan funding(2)
753
13,809,791
7.4
%
Development Funding(3)
Development projects:
Seniors Housing Operating
47
5,018
units
100,066
Outpatient Medical
—
—
sf
9,648
Total development projects
47
109,714
Redevelopment and expansion projects:
Seniors Housing Operating
1
28
units
2,221
Total development funding
48
111,935
9.8
%
Total gross investments
13,921,726
7.8
%
Dispositions and Loan Repayments(4)
Seniors Housing Operating
5
224
units
60,462
13,543
Seniors Housing Triple-net
15
564
units
123,404
69,600
Outpatient Medical
244
13,586,796
sf
381
5,175,887
Long-Term/Post-Acute Care
39
4,971
beds
168,220
836,222
Loan repayments
1,360,090
Total dispositions and loan repayments(5)
303
7,455,342
7.1
%
Net investments (dispositions)
$
6,466,384
Notes:
(1) Acquisitions represent purchase price excluding accounting adjustments pursuant to U.S. GAAP, for all consolidated and unconsolidated property acquisitions. Pro rata amounts include joint venture real estate loans receivable. Loan advances represent cash funded for real estate and non-real estate loans receivable, excluding development loans. Includes acquisition of leaseholds and additional ownership interest in properties, which are both excluded from property, unit and per unit metrics.
(2) Acquisition yields represents annualized contractual or projected cash rent/NOI to be generated divided by investment amount, excluding land parcels. Loan funding yield represents annualized contractual interest divided by investment amount.
(3) Amounts represent cash funded for all developments/expansions including construction in progress, loans and in substance real estate. Yield represents projected annualized cash rent/NOI to be generated upon conversion/stabilization divided by commitment amount.
(4) Amounts represent proceeds received for loan repayments and consolidated and unconsolidated property sales. Includes disposition of partial ownership interest in properties which are excluded from property, unit and per unit metrics. Other property dispositions include the sale of land parcels and nonoperational properties.
(5) Yield represents annualized cash rent/interest/NOI that was being generated pre-disposition divided by proceeds. Pro rata amounts include joint venture real estate loans receivable.
7
Investment
(dollars in thousands, except per bed / unit / square foot, at Welltower pro rata ownership)
Gross Investment Activity
Year-To-Date 2025
Properties
Beds / Units / Square Feet
Investment Per Bed / Unit / SqFt
Pro Rata Amount
Yield
Acquisitions and Loan Funding(1)
Seniors Housing Operating
681
53,327
units
$
207,215
$
11,050,144
Seniors Housing Triple-net
173
11,103
units
320,892
3,562,864
Outpatient Medical
1
46,835
sf
484
22,691
Long-Term/Post-Acute Care
160
18,934
beds
155,190
2,938,367
Loan funding
1,702,500
Total acquisitions and loan funding(2)
1,015
19,276,566
7.4
%
Development Funding(3)
Development projects:
Seniors Housing Operating
58
7,432
units
358,422
Outpatient Medical
7
439,205
sf
94,926
Total development projects
65
453,348
Redevelopment and expansion projects:
Seniors Housing Operating
2
427
units
8,385
Outpatient Medical
—
—
sf
1,305
Total redevelopment and expansion projects
2
9,690
Total development funding
67
463,038
8.1
%
Total gross investments
19,739,604
7.4
%
Dispositions and Loan Repayments(4)
Seniors Housing Operating
24
3,884
units
55,984
217,443
Seniors Housing Triple-net
20
1,371
units
181,692
249,100
Outpatient Medical
245
13,642,382
sf
381
5,197,950
Long-Term/Post-Acute Care
43
5,532
beds
154,404
854,162
Other property dispositions
15,400
Loan repayments
1,689,555
Total dispositions and loan repayments(5)
332
8,223,610
7.3
%
Net investments (dispositions)
$
11,515,994
Notes:
(1) Acquisitions represent purchase price excluding accounting adjustments pursuant to U.S. GAAP, for all consolidated and unconsolidated property acquisitions. Pro rata amounts include joint venture real estate loans receivable. Loan advances represent cash funded for real estate and non-real estate loans receivable, excluding development loans. Includes acquisition of leaseholds and additional ownership interest in properties, which are both excluded from property, unit and per unit metrics.
(2) Acquisition yields represents annualized contractual or projected cash rent/NOI to be generated divided by investment amount, excluding land parcels. Loan funding yield represents annualized contractual interest divided by investment amount.
(3) Amounts represent cash funded for all developments/expansions including construction in progress, loans and in substance real estate. Yield represents projected annualized cash rent/NOI to be generated upon conversion/stabilization divided by commitment amount.
(4) Amounts represent proceeds received for loan repayments and consolidated and unconsolidated property sales. Includes disposition of partial ownership interest in properties which are excluded from property, unit and per unit metrics. Other property dispositions include the sale of land parcels and nonoperational properties.
(5) Yield represents annualized cash rent/interest/NOI that was being generated pre-disposition divided by proceeds. Pro rata amounts include joint venture real estate loans receivable.
8
Investment
(dollars in thousands at Welltower pro rata ownership)
Development Funding Projections(1)
Projected Future Funding
Projects
Beds / Units / Square Feet
Stable Yields(2)
2026 Funding
Funding Thereafter
Total Unfunded Commitments
Committed Balances
Seniors Housing Operating
42
4,083
10.4
%
$
370,374
$
195,763
$
566,137
$
1,343,206
Development Project Conversion Estimates(1)
Quarterly Conversions
Annual Conversions
Amount
Year 1 Yields(2)
Stable Yields(2)
Amount
Year 1 Yields(2)
Stable Yields(2)
1Q25 actual
$
302,507
3.5
%
6.7
%
2025 actual
$
1,207,115
1.3
%
7.1
%
2Q25 actual
459,917
1.2
%
6.9
%
2026 estimate
611,972
(0.8)
%
9.6
%
3Q25 actual
260,558
(0.2)
%
7.6
%
2027 estimate
486,984
(1.6)
%
11.2
%
4Q25 actual
184,133
(0.2)
%
7.3
%
Thereafter estimate
244,250
1.7
%
10.9
%
Total
$
1,207,115
1.3
%
7.1
%
Total
$
2,550,321
0.3
%
8.8
%
Unstabilized Properties
9/30/2025 Properties
Stabilizations
Construction Conversions(1)
Acquisitions/ Dispositions
12/31/2025 Properties
Beds / Units
Seniors Housing Operating
64
(10)
5
9
68
9,928
Seniors Housing Triple-net
8
(1)
—
—
7
499
Total
72
(11)
5
9
75
10,427
Occupancy
9/30/2025 Properties
Stabilizations
Construction Conversions(3)
Acquisitions/ Dispositions
Progressions
12/31/2025 Properties
0% - 50%
31
(1)
4
9
(11)
32
50% - 70%
11
(2)
1
—
10
20
70% +
30
(8)
—
—
1
23
Total
72
(11)
5
9
—
75
Occupancy
12/31/2025 Properties
Months In Operation
Revenues
% of Total Revenues(4)
Gross Investment Balance
% of Total Gross Investment
0% - 50%
32
8
$
118,513
0.9
%
$
1,378,619
2.1
%
50% - 70%
20
20
219,790
1.7
%
917,406
1.4
%
70% +
23
42
302,329
2.3
%
1,165,876
1.8
%
Total
75
22
$
640,632
4.9
%
$
3,461,901
5.3
%
(1) Includes development projects (construction in progress, development loans and in substance real estate) and excludes expansion projects. Actual conversions exclude $206,183,000 of in substance real estate investment projects placed in service. Projects expected to be delivered in phases over multiple quarters are reflected in the last quarter.
(2) Actual yields may vary.
(3) Includes expansion and development loan conversions.
(4) Percent of total revenues based on current quarter annualized pro rata total revenues on page 11.
9
Financial
(dollars in thousands at Welltower pro rata ownership)
Components of NAV
Stabilized NOI
Pro rata beds/units/square feet
Seniors Housing Operating(1)
$
2,855,092
159,791
units
Seniors Housing Triple-net
612,740
28,895
units
Outpatient Medical
116,192
4,150,913
square feet
Long-Term/Post-Acute Care
576,064
41,339
beds
Total In-Place NOI(2)
4,160,088
Incremental stabilized NOI(3)
159,235
Total stabilized NOI
$
4,319,323
Obligations
Lines of credit and commercial paper(4)
$
—
Senior unsecured notes(4)
16,451,346
Secured debt(4)
3,564,334
Financing lease liabilities
544,901
Total debt
20,560,581
Add (Subtract):
Other liabilities (assets), net(5)
729,212
Cash and cash equivalents and restricted cash
(5,243,581)
Net obligations
$
16,046,212
Other Assets
Land parcels(6)
360,321
Effective Interest Rate(9)
Real estate loans receivable(7)
3,174,141
9.0%
Non-real estate loans receivable(8)
200,469
10.3%
Joint venture real estate loans receivables(10)
227,755
5.7%
Property dispositions(11)
2,734,954
Development properties:(12)
Current balance
781,364
Unfunded commitments
578,736
Committed balances
$
1,360,100
Projected yield
10.4
%
Projected NOI
$
141,450
Common shares outstanding(13)
716,258
Notes:
(1) Includes $10,266,000 attributable to our proportional share of income (loss) from unconsolidated management company investments.
(3) Represents incremental NOI from Seniors Housing Operating unstabilized properties.
(4) Represents principal amounts due and does not include unamortized premiums/discounts, deferred loan expenses or other fair value adjustments as reflected on the balance sheet. Includes $870,255,000 of foreign secured debt and $378,710,000 of foreign failed sale-leaseback financing obligations.
(5) Includes liabilities / (assets) that impact cash or NOI and excludes non-real estate loans and non-cash items such straight-line rent receivable, unearned revenues, intangible assets and above/below market lease intangibles.
(6) Includes land parcels and predevelopment projects.
(7) Represents $3,192,028,000 of real estate loans, excluding development loans and including certain in substance real estate developments and held to maturity debt securities, net of $17,887,000 of credit allowances.
(8) Represents $207,202,000 of non-real estate loans, net of $6,733,000 of credit allowances.
(9) Average cash-pay interest rates are 7.8%, 2.2% and 5.7% for real estate, non-real estate loans and joint venture real estate loans, respectively. Rates exclude non-accrual/interest-free loans.
(10) Represents our partners' share of Welltower loans made to select joint ventures secured by the joint venture owned properties.
(11) Represents proceeds from expected property dispositions in the next twelve months.
(12) Includes expansion projects. Includes partial conversions to date.
(13) Includes December 31, 2025 common shares, OP Units and DownREIT Units outstanding and the dilutive impact of exchangeable senior unsecured notes.
10
Financial
(dollars in thousands at Welltower pro rata ownership)
Net Operating Income(1)
4Q24
1Q25
2Q25
3Q25
4Q25
Revenues:
Seniors Housing Operating
Resident fees and services
$
1,805,306
$
1,897,810
$
2,003,039
$
2,100,724
$
2,588,078
Other income
2,719
3,417
4,528
8,966
19,481
Total revenues
1,808,025
1,901,227
2,007,567
2,109,690
2,607,559
Seniors Housing Triple-net
Rental income
58,918
103,399
104,360
99,423
167,485
Interest income
8,167
2,111
—
—
—
Other income
38
32
346
91
537
Total revenues
67,123
105,542
104,706
99,514
168,022
Outpatient Medical
Rental income
203,247
212,554
213,552
217,188
147,701
Other income
2,114
2,139
2,166
2,050
1,161
Total revenues
205,361
214,693
215,718
219,238
148,862
Long-Term/Post-Acute Care
Rental income
122,471
145,439
165,214
184,261
211,841
Other income
21
199
14
194
5
Total revenues
122,492
145,638
165,228
184,455
211,846
Corporate
Interest income
66,261
63,572
65,256
70,477
56,158
Other income
32,195
34,179
30,512
52,439
31,513
Total revenues
98,456
97,751
95,768
122,916
87,671
Total
Resident fees and services
1,805,306
1,897,810
2,003,039
2,100,724
2,588,078
Rental income
384,636
461,392
483,126
500,872
527,027
Interest income
74,428
65,683
65,256
70,477
56,158
Other income
37,087
39,966
37,566
63,740
52,697
Total revenues
2,301,457
2,464,851
2,588,987
2,735,813
3,223,960
Property operating expenses:
Seniors Housing Operating
1,366,423
1,410,579
1,464,457
1,530,131
1,902,889
Seniors Housing Triple-net
5,834
5,190
4,817
4,496
4,490
Outpatient Medical
61,392
66,804
65,197
65,851
45,000
Long-Term/Post-Acute Care
4,063
3,495
3,705
3,609
2,974
Corporate
6,385
4,054
4,740
6,025
6,261
Total property operating expenses
1,444,097
1,490,122
1,542,916
1,610,112
1,961,614
Net operating income:
Seniors Housing Operating
441,602
490,648
543,110
579,559
704,670
Seniors Housing Triple-net
61,289
100,352
99,889
95,018
163,532
Outpatient Medical
143,969
147,889
150,521
153,387
103,862
Long-Term/Post-Acute Care
118,429
142,143
161,523
180,846
208,872
Corporate
92,071
93,697
91,028
116,891
81,410
Net operating income
$
857,360
$
974,729
$
1,046,071
$
1,125,701
$
1,262,346
Note:
(1) Please see discussion of Supplemental Reporting Measures on page 16. Includes amounts from investments sold or held for sale. NOI related to DownREITs included at 100%.
11
Financial
(dollars in thousands)
Leverage and EBITDA Reconciliations(1)
Twelve Months Ended
Three Months Ended
December 31, 2025
December 31, 2025
Net income (loss)
$
961,837
$
117,767
Interest expense
651,955
203,784
Income tax expense (benefit)
(7,116)
(4,985)
Depreciation and amortization
2,084,868
594,151
EBITDA
3,691,544
910,717
Loss (income) from unconsolidated entities
14,297
(4,442)
Stock-based compensation
1,555,858
1,507,748
Loss (gain) on extinguishment of debt, net
9,245
3,089
Loss (gain) on real estate dispositions and acquisitions of controlling interests, net
(1,449,043)
(1,378,391)
Impairment of assets
121,283
45,924
Provision for loan losses, net
(9,416)
(7,384)
Loss (gain) on derivatives and financial instruments, net
22,407
(5,656)
Other expenses
201,201
125,844
Casualty losses, net of recoveries
11,367
3,115
Other impairment(2)
604
—
Total adjustments
477,803
289,847
Adjusted EBITDA
$
4,169,347
$
1,200,564
Interest Coverage Ratios
Interest expense
$
651,955
$
203,784
Capitalized interest
33,799
7,476
Non-cash interest expense
(51,629)
(14,546)
Total interest
$
634,125
$
196,714
EBITDA
$
3,691,544
$
910,717
Interest coverage ratio
5.82
x
4.63
x
Adjusted EBITDA
$
4,169,347
$
1,200,564
Adjusted Interest coverage ratio
6.57
x
6.10
x
Fixed Charge Coverage Ratios
Total interest
$
634,125
$
196,714
Secured debt principal amortization
64,408
16,698
Total fixed charges
$
698,533
$
213,412
EBITDA
$
3,691,544
$
910,717
Fixed charge coverage ratio
5.28
x
4.27
x
Adjusted EBITDA
$
4,169,347
$
1,200,564
Adjusted Fixed charge coverage ratio
5.97
x
5.63
x
Net Debt to EBITDA Ratios
Total debt(3)
$
19,737,446
Less: cash and cash equivalents and restricted cash
(5,209,539)
Net debt
$
14,527,907
EBITDA Annualized
$
3,642,868
Net debt to EBITDA ratio
3.99
x
Adjusted EBITDA Annualized
$
4,802,256
Net debt to Adjusted EBITDA ratio
3.03
x
Notes:
(1) Please see discussion of Supplemental Reporting Measures on page 16.
(2) Represents the write-off of straight-line rent receivable and unamortized lease incentive balances related to leases placed on cash recognition.
(3) Includes unamortized premiums/discounts, other fair value adjustments, financing lease liabilities of $540,144,000 and failed sale-leaseback financing obligations of $378,710,000. Excludes operating lease liabilities of $1,642,849,000 related to ASC 842.
12
Financial
(in thousands except share price)
Leverage and Current Capitalization(1)
% of Total
Book capitalization
Lines of credit and commercial paper(2)
$
—
—
%
Long-term debt obligations(2)(3)
19,737,446
34.18
%
Cash and cash equivalents and restricted cash
(5,209,539)
(9.02)
%
Net debt to consolidated book capitalization
$
14,527,907
25.16
%
Total equity and noncontrolling interests(4)
43,202,939
74.84
%
Consolidated book capitalization
$
57,730,846
100.00
%
Joint venture debt, net(5)
537,643
Total book capitalization
$
58,268,489
Undepreciated book capitalization
Lines of credit and commercial paper(2)
$
—
—
%
Long-term debt obligations(2)(3)
19,737,446
28.99
%
Cash and cash equivalents and restricted cash
(5,209,539)
(7.65)
%
Net debt to consolidated undepreciated book capitalization
$
14,527,907
21.34
%
Accumulated depreciation and amortization
10,350,621
15.20
%
Total equity and noncontrolling interests(4)
43,202,939
63.46
%
Consolidated undepreciated book capitalization
$
68,081,467
100.00
%
Joint venture debt, net(5)
537,643
Total undepreciated book capitalization
$
68,619,110
Enterprise value
Lines of credit and commercial paper(2)
$
—
—
%
Long-term debt obligations(2)(3)
19,737,446
13.63
%
Cash and cash equivalents and restricted cash
(5,209,539)
(3.60)
%
Net debt to consolidated enterprise value
$
14,527,907
10.03
%
Common shares outstanding
696,507
Period end share price
185.61
Common equity market capitalization
$
129,278,664
89.23
%
Noncontrolling interests(4)
1,073,441
0.74
%
Consolidated enterprise value
$
144,880,012
100.00
%
Joint venture debt, net(5)
537,643
Total enterprise value
$
145,417,655
Secured debt as % of total assets
Secured debt(2)
$
2,813,780
3.62
%
Gross asset value(6)
$
77,653,668
Total debt as % of gross asset value
Total debt(2)(3)
$
19,737,446
25.42
%
Gross asset value(6)
$
77,653,668
Unsecured debt as % of unencumbered assets
Unsecured debt(2)
$
16,383,522
23.05
%
Unencumbered gross assets(7)
$
71,085,327
Notes:
(1) Please see discussion of Supplemental Reporting Measures on page 16.
(2) Amounts include unamortized premiums/discounts and other fair value adjustments as reflected on the balance sheet.
(3) Includes financing lease liabilities of $540,144,000 and failed sale-leaseback financing obligations of $378,710,000 and excludes operating lease liabilities of $1,642,849,000 related to ASC 842.
(4) Includes all noncontrolling interests (redeemable and permanent) as reflected on our balance sheet.
(5) Net of Welltower's share of unconsolidated debt and minority partners' share of Welltower consolidated debt.
(6) Gross asset value equals total assets plus accumulated depreciation as reflected on the balance sheet.
(7) Unencumbered gross assets equal gross asset value for consolidated properties that are not financed with secured debt.
13
Financial
(dollars in thousands)
Debt Maturities and Scheduled Principal Amortization(1)
Year
Lines of Credit and Commercial Paper(2)
Senior Unsecured Notes(3)
Consolidated Secured Debt
Noncontrolling Interests' Share of Consolidated Debt
Share of Unconsolidated Secured Debt
Combined Debt(4)
% of Total
Wtd. Avg. Interest Rate (5)
2026
$
—
$
2,703,561
$
246,296
$
(2,479)
$
30,570
$
2,977,948
15.17
%
4.22
%
2027
—
1,901,060
355,635
(2,365)
133,514
2,387,844
12.16
%
3.87
%
2028
—
2,539,475
191,638
(334)
32,101
2,762,880
14.07
%
3.84
%
2029
—
2,159,899
420,896
(75,814)
22,628
2,527,609
12.87
%
3.43
%
2030
—
1,750,000
158,629
(332)
1,443
1,909,740
9.73
%
3.86
%
2031
—
1,350,000
59,561
(349)
371,780
1,780,992
9.07
%
3.48
%
2032
—
1,050,000
71,215
(360)
49,738
1,170,593
5.96
%
3.49
%
2033
—
—
419,640
(36,872)
658
383,426
1.95
%
4.82
%
2034
—
672,250
207,139
(8,193)
688
871,884
4.44
%
4.41
%
2035
—
1,250,000
42,724
(561)
22,325
1,314,488
6.69
%
5.06
%
Thereafter
—
1,150,000
399,707
(143)
—
1,549,564
7.89
%
5.02
%
Totals
$
—
$
16,526,245
$
2,573,080
$
(127,802)
$
665,445
$
19,636,968
100.00
%
Weighted Avg. Interest Rate(5)
—
%
3.95
%
4.06
%
4.48
%
5.34
%
4.01
%
Weighted Avg. Maturity Years
—
4.8
6.8
5.0
4.5
5.0
% Floating Rate Debt(5)
—
%
23.15
%
9.26
%
58.61
%
0.05
%
20.32
%
Debt by Local Currency(1)
Lines of Credit and Commercial Paper(2)
Senior Unsecured Notes(3)
Consolidated Secured Debt
Noncontrolling Interests' Share of Consolidated Debt
Share of Unconsolidated Secured Debt
Combined Debt(4)
Investment Hedges(6)
United States
$
—
$
12,709,899
$
1,728,066
$
(112,189)
$
624,591
$
14,950,367
$
—
United Kingdom
—
1,411,725
—
—
—
1,411,725
11,872,886
Canada
—
2,404,621
845,014
(15,613)
40,854
3,274,876
6,220,269
Totals
$
—
$
16,526,245
$
2,573,080
$
(127,802)
$
(127,802)
$
665,445
$
19,636,968
$
18,093,155
Notes:
(1) Represents principal amounts due excluding unamortized premiums/discounts or other fair value adjustments as reflected on the balance sheet.
(2) Our unsecured commercial paper program and our unsecured revolving credit facility had a zero balance as of December 31, 2025. The unsecured revolving credit facility is comprised of a $2,000,000,000 tranche that matures on July 24, 2029 and a $3,000,000,000 tranche that matures on July 24, 2028. The $3,000,000,000 tranche may be extended for two successive terms of six months at our option. Commercial paper borrowings are backstopped by the unsecured revolving credit facility.
(3) Senior Unsecured Notes include the following:
•2026 includes CAD $2,747,615,000 of unsecured term loans (approximately $2,003,561,000 USD at December 31, 2025) that mature on October 9, 2026, and bear interest at adjusted CORRA + 0.30%.
•2027 includes a $1,000,000,000 unsecured term loan and a CAD $250,000,000 unsecured term loan (approximately $182,300,000 USD at December 31, 2025). The loans mature on July 19, 2026 . The interest rates on the loans are adjusted SOFR + 0.78% for USD and adjusted CORRA + 0.78% for CAD. Both term loans may be extended for two successive terms of six months at our option.
•2027 also includes CAD $300,000,000 of 2.95% senior unsecured notes (approximately $218,760,000 USD at December 31, 2025) that matures on January 15, 2027.
•2028 includes $1,035,000,000 of 2.75% exchangeable senior unsecured notes that mature on May 15, 2028 unless earlier exchanged, purchased or redeemed.
•2028 also includes £550,000,000 of 4.80% senior unsecured notes (approximately $739,475,000 USD at December 31, 2025). The notes mature on November 20, 2028.
•2029 includes $1,035,000,000 of 3.125% exchangeable senior unsecured notes that mature on July 15, 2029 unless earlier exchanged, purchased or redeemed.
•2034 includes £500,000,000 of 4.50% senior unsecured notes (approximately $672,250,000 USD at December 31, 2025). The notes mature on December 1, 2034.
(4) Excludes operating lease liabilities of $1,642,849,000, finance lease liabilities of $540,144,000, and failed sale-leaseback financing obligations of $378,710,000 related to ASC 842.
(5) Based on variable interest rates and foreign currency exchange rates in effect as of December 31, 2025. The interest rate on the unsecured revolving credit facility is adjusted SOFR + 0.705%. Commercial paper, senior notes and secured debt average interest rate represents the face value note rate. Includes the impact of notional swaps and caps to convert fixed rate debt to SOFR-based floating rate debt, and SOFR-based floating rate debt and CORRA-based floating rate debt to fixed rate debt.
(6) Represents notional value of foreign currency derivative contracts at end of period spot FX rates. The fair market value of the gains (losses) of these contracts is currently USD $(415,895,000), as represented in other assets (liabilities) on the balance sheet. We supplement our local currency debt with foreign currency derivative contracts to offset the translation and economic exposures related to our international investments. Currently, our foreign currency derivatives are comprised of cross-currency swaps.
14
Glossary
Age: Current year, less the year built, adjusted for major renovations. Average age is weighted by pro rata NOI.
Cap-ex, Tenant Improvements, Leasing Commissions: Represents amounts incurred for: 1) recurring and non-recurring capital expenditures required to maintain and re-tenant our properties; 2) second generation tenant improvements; and 3) leasing commissions paid to third party leasing agents to secure new tenants. Excludes sustainability investments.
Construction Conversion: Represents completed construction projects that were placed into service and began generating NOI.
EBITDAR: Earnings before interest, taxes, depreciation, amortization and rent. The company uses unaudited, periodic financial information provided solely by tenants/borrowers to calculate EBITDAR and has not independently verified the information.
EBITDAR Coverage: Represents the ratio of EBITDAR to contractual rent for leases or interest and principal payments for loans. EBITDAR coverage is a measure of a property’s ability to generate sufficient cash flows for the operator/borrower to pay rent and meet other obligations. The coverage shown excludes properties that are unstabilized, closed or for which data is not available or meaningful.
EBITDARM: Earnings before interest, taxes, depreciation, amortization, rent and management fees. The company uses unaudited, periodic financial information provided solely by tenants/borrowers to calculate EBITDARM and has not independently verified the information.
EBITDARM Coverage: Represents the ratio of EBITDARM to contractual rent for leases or interest and principal payments for loans. EBITDARM coverage is a measure of a property’s ability to generate sufficient cash flows for the operator/borrower to pay rent and meet other obligations, assuming that management fees are not paid. The coverage shown excludes properties that are unstabilized, closed or for which data is not available or meaningful.
Health System - Affiliated: Outpatient medical properties are considered affiliated with a health system if one or more of the following conditions are met: 1) the land parcel is contained within the physical boundaries of a hospital campus; 2) the land parcel is located adjacent to the campus; 3) the building is physically connected to the hospital regardless of the land ownership structure; 4) a ground lease is maintained with a health system entity; 5) a master lease is maintained with a health system entity; 6) significant square footage is leased to a health system entity; 7) the property includes an ambulatory surgery center with a hospital partnership interest; or 8) a significant square footage is leased to a physician group that is either employed, directly or indirectly by a health system, or has a significant clinical and financial affiliation with the health system.
Long-Term/Post-Acute Care: Includes all skilled nursing, rehabilitation and long-term/post-acute care facilities where the majority of individuals require 24-hour nursing or medical care. Generally, these properties are licensed for Medicaid and/or Medicare reimbursement and are subject to triple-net operating leases. Most of these facilities focus on higher acuity patients and offer rehabilitation units specializing in cardiac, orthopedic, dialysis, neurological or pulmonary rehabilitation.
MSA: For the United States and Canada, we use the Metropolitan Statistical Area as defined by the U.S. Census Bureau and the Census Metropolitan Areas as defined by Statistics Canada, respectively. For the United Kingdom, we generally use the Metro Region as defined by EuroStat with Greater London defined as a 55-mile radius around the city’s center.
Occupancy: Outpatient Medical occupancy represents the percentage of total rentable square feet leased and occupied, including month-to-month leases, as of the date reported. Occupancy for all other property types represents average quarterly operating occupancy based on the most recent quarter of available data and excludes properties that are unstabilized, closed or for which data is not available or meaningful. The company uses unaudited, periodic financial information provided solely by tenants/borrowers to calculate occupancy and has not independently verified the information. Occupancy metrics are reflected at our pro rata share.
Outpatient Medical: Outpatient medical buildings include properties offering ambulatory medical services such as primary and secondary care, outpatient surgery, diagnostic procedures and rehabilitation. These properties are typically affiliated with a health system and may be located on a hospital campus. They are specifically designed and constructed for use by healthcare professionals to provide services to patients. They also include medical office buildings that typically contain sole and group physician practices and may provide laboratory and other specialty services.
Seniors Housing Operating (SHO): Includes independent, assisted living and dementia care properties in the U.S. and Canada and all care homes in the U.K. generally structured to take advantage of the REIT Investment Diversification and Empowerment Act of 2007, as well as Wellness Housing properties.
Seniors Housing Triple-net (SH-NNN): Includes independent, assisted living and dementia care properties in the U.S. and Canada and all care homes in the U.K. subject to triple-net operating leases.
Square Feet: Net rentable square feet calculated utilizing Building Owners and Managers Association measurement standards.
Stable: Generally, a triple-net rental property is considered stable (versus unstabilized or under development) when it has achieved EBITDAR coverage of 1.00x or greater for three consecutive months or, if targeted performance has not been achieved, 12 months following the budgeted stabilization date. Triple-net properties for which income is recognized on a cash basis and for which substantially all contractual rent during the period has not been collected are excluded from the stable portfolio. A Seniors Housing Operating facility is considered stable upon the earliest of 90% occupancy, NOI at or above the underwritten target or 12 months past the underwritten stabilization date. Excludes assets held for sale and assets disposed of during the current quarter.
Unstabilized: An acquisition that does not meet the stable criteria upon closing or a construction property that has opened but not yet reached stabilization.
15
Supplemental Reporting Measures
We believe that revenues and net income, as defined by U.S. generally accepted accounting principles ("U.S. GAAP"), are the most appropriate earnings measurements. However, we consider EBITDA, Adjusted EBITDA, RevPOR, ExpPOR, SS RevPOR, SS ExpPOR, NOI, In-Place NOI ("IPNOI") and Same Store NOI ("SSNOI") to be useful supplemental measures of our operating performance. Excluding EBITDA and Adjusted EBITDA, these supplemental measures are disclosed on our pro rata ownership basis. Pro rata amounts are derived by reducing consolidated amounts for minority partners’ noncontrolling ownership interests and adding our minority ownership share of unconsolidated amounts. We do not control unconsolidated investments. While we consider pro rata disclosures useful, they may not accurately depict the legal and economic implications of our joint venture arrangements and should be used with caution.
We define NOI as total revenues, including tenant reimbursements, less property operating expenses. Property operating expenses represent costs associated with managing, maintaining and servicing tenants for our properties. These expenses include, but are not limited to, property-related payroll and benefits, property management fees paid to managers, marketing, housekeeping, food service, maintenance, utilities, property taxes and insurance. General and administrative expenses represent general overhead costs that are unrelated to property operations and are unallocable to the properties. These expenses include, but are not limited to, payroll and benefits related to corporate employees, professional services, office expenses and depreciation of corporate fixed assets. IPNOI represents cash NOI excluding interest income, other income and non-IPNOI and adjusted for timing of current quarter portfolio changes such as acquisitions, development conversions, segment transitions and dispositions. Properties classified as held for sale and leased properties are excluded from IPNOI. SSNOI is used to evaluate the operating performance of our properties using a consistent population which controls for changes in the composition of our portfolio. As used herein, same store is generally defined as those revenue-generating properties in the portfolio for the relevant year-over-year reporting periods. Acquisitions and development conversions are included in the same store amounts five full quarters after acquisition or being placed into service. Land parcels, loans and leased properties, as well as any properties sold or classified as held for sale during the period, are excluded from the same store amounts. Redeveloped properties (including major refurbishments of a Seniors Housing Operating property where 20% or more of units are simultaneously taken out of commission for 30 days or more or Outpatient Medical properties undergoing a change in intended use) are excluded from the same store amounts until five full quarters post completion of the redevelopment. Properties undergoing operator transitions and/or segment transitions are also excluded from the same store amounts until five full quarters post completion of the operator transition or segment transition. In addition, properties significantly impacted by force majeure, acts of God or other extraordinary adverse events are excluded from same store amounts until five full quarters after the properties are placed back into service. SSNOI excludes non-cash NOI and includes adjustments to present consistent property ownership percentages and to translate Canadian properties and UK properties using a consistent exchange rate. Normalizers include adjustments that in management’s opinion are appropriate in considering SSNOI, a supplemental, non-GAAP performance measure. None of these adjustments, which may increase or decrease SSNOI, are reflected in our financial statements prepared in accordance with U.S. GAAP. Significant normalizers (defined as any that individually exceed 0.50% of SSNOI growth per property type) are separately disclosed and explained. We believe NOI, IPNOI and SSNOI provide investors relevant and useful information because they measure the operating performance of our properties at the property level on an unleveraged basis. We use NOI, IPNOI and SSNOI to make decisions about resource allocations and to assess the property level performance of our portfolio.
RevPOR represents the average revenues generated per occupied room per month and ExpPOR represents the average expenses per occupied room per month at our Seniors Housing Operating properties. These metrics are calculated as our pro rata share of total resident fees and services revenues or property operating expenses from the income statement, divided by average monthly occupied room days. SS RevPOR and SS ExpPOR are used to evaluate the RevPOR and ExpPOR performance of our properties under a consistent population, which eliminates changes in the composition of our portfolio. They are based on the same pool of properties used for SSNOI and include any revenue and expense normalizations used for SSNOI. We use RevPOR, ExpPOR, SS RevPOR and SS ExpPOR to evaluate the revenue-generating capacity and profit potential of our Seniors Housing Operating portfolio independent of fluctuating occupancy rates. They are also used in comparison against industry and competitor statistics, if known, to evaluate the quality of our Seniors Housing Operating portfolio.
We measure our credit strength both in terms of leverage ratios and coverage ratios. The leverage ratios indicate how much of our balance sheet capitalization is related to long-term debt, net of cash and restricted cash. We expect to maintain capitalization ratios and coverage ratios sufficient to maintain a capital structure consistent with our current profile. The ratios are based on EBITDA and Adjusted EBITDA. EBITDA is defined as earnings (net income per income statement) before interest expense, income taxes, depreciation and amortization. Adjusted EBITDA is defined as EBITDA excluding unconsolidated entities and including adjustments for stock-based compensation expense, provision for loan losses, gains/losses on extinguishment of debt, gains/losses on disposition of properties and acquisitions of controlling interests, impairment of assets, gains/losses on derivatives and financial instruments, other expenses, other impairment charges and other adjustments deemed appropriate in management's opinion. We believe that EBITDA and Adjusted EBITDA, along with net income, are important supplemental measures because they provide additional information to assess and evaluate the performance of our operations. We primarily use these measures to determine our interest coverage ratio, which represents EBITDA and Adjusted EBITDA divided by total interest, and our fixed charge coverage ratio, which represents EBITDA and Adjusted EBITDA divided by fixed charges. Fixed charges include total interest and secured debt principal amortization. Our leverage ratios include net debt to Adjusted EBITDA, book capitalization, undepreciated book capitalization and consolidated enterprise value. Book capitalization represents the sum of net debt (defined as total long-term debt, excluding operating lease liabilities, less cash and cash equivalents and restricted cash), total equity and redeemable noncontrolling interests. Undepreciated book capitalization represents book capitalization adjusted for accumulated depreciation and amortization. Consolidated enterprise value represents book capitalization adjusted for the fair market value of our common stock. Our leverage ratios are defined as the proportion of net debt to total capitalization.
Our supplemental reporting measures and similarly entitled financial measures are widely used by investors, equity and debt analysts and rating agencies in the valuation, comparison, rating and investment recommendations of companies. Our management uses these financial measures to facilitate internal and external comparisons to historical operating results and in making operating decisions. Additionally, these measures are utilized by the Board of Directors to evaluate management performance. None of the supplemental reporting measures represent net income or cash flow provided from operating activities as determined in accordance with U.S. GAAP and should not be considered as alternative measures of profitability or liquidity. Finally, the supplemental reporting measures, as defined by us, may not be comparable to similarly entitled items reported by other real estate investment trusts or other companies. Multi-period amounts may not equal the sum of the individual quarterly amounts due to rounding.
16
Supplemental Reporting Measures
(dollars in thousands)
Non-GAAP Reconciliations
NOI Reconciliation
4Q24
1Q25
2Q25
3Q25
4Q25
Net income (loss)
$
123,753
$
257,266
$
304,618
$
282,186
$
117,767
Loss (gain) on real estate dispositions and acquisitions of controlling interests, net
(8,195)
(51,777)
(14,850)
(4,025)
(1,378,391)
Loss (income) from unconsolidated entities
(6,429)
(1,263)
7,392
12,610
(4,442)
Income tax expense (benefit)
114
(5,519)
1,053
2,335
(4,985)
Other expenses
34,405
14,060
16,598
44,699
125,844
Impairment of assets
23,647
52,402
19,876
3,081
45,924
Provision for loan losses, net
(245)
(2,007)
(1,113)
1,088
(7,384)
Loss (gain) on extinguishment of debt, net
—
6,156
w
—
—
3,089
Loss (gain) on derivatives and financial instruments, net
(9,102)
(3,210)
(409)
31,682
(5,656)
General and administrative expenses
48,707
63,758
64,175
63,124
1,557,378
Depreciation and amortization
480,406
485,869
495,036
509,812
594,151
Interest expense
154,469
144,962
141,157
162,052
203,784
Consolidated net operating income
841,530
960,697
1,033,533
1,108,644
1,247,079
NOI attributable to unconsolidated investments(1)
31,158
28,316
26,069
29,337
26,430
NOI attributable to noncontrolling interests(2)
(15,328)
(14,284)
(13,531)
(12,280)
(11,163)
Pro rata net operating income (NOI)(3)
$
857,360
$
974,729
$
1,046,071
$
1,125,701
$
1,262,346
In-Place NOI Reconciliation
At Welltower pro rata ownership
Seniors Housing Operating
Seniors Housing Triple-net
Outpatient Medical
Long-Term /Post-Acute Care
Corporate
Total
Revenues
$
2,607,559
$
168,022
$
148,862
$
211,846
$
87,671
$
3,223,960
Property operating expenses
(1,902,889)
(4,490)
(45,000)
(2,974)
(6,261)
(1,961,614)
NOI(3)
704,670
163,532
103,862
208,872
81,410
1,262,346
Adjust:
Interest income
—
—
—
—
(56,158)
(56,158)
Other income
(2,419)
(537)
(19)
(5)
(25,705)
(28,685)
Sold / held for sale
1,334
(1,000)
(71,124)
(25,877)
—
(96,667)
Nonoperational(4)
1,313
—
25
(323)
—
1,015
Non In-Place NOI(5)
(25,423)
(26,426)
(3,696)
(38,750)
453
(93,842)
Timing adjustments(6)
34,298
17,616
—
99
—
52,013
Total adjustments
9,103
(10,347)
(74,814)
(64,856)
(81,410)
(222,324)
In-Place NOI
713,773
153,185
29,048
144,016
—
1,040,022
Annualized In-Place NOI
$
2,855,092
$
612,740
$
116,192
$
576,064
$
—
$
4,160,088
Same Store Property Reconciliation
Seniors Housing Operating
Seniors Housing Triple-net
Outpatient Medical
Long-Term /Post-Acute Care
Total
Total properties
1,887
430
202
381
2,900
Recent acquisitions and development conversions(7)
(586)
(173)
(8)
(139)
(906)
Under development
(43)
—
—
—
(43)
Under redevelopment(8)
(2)
—
—
(1)
(3)
Current held for sale
(13)
(2)
(82)
(1)
(98)
Land parcels, loans and leased properties
(174)
(4)
(8)
(30)
(216)
Transitions(9)
(185)
(4)
—
(24)
(213)
Other(10)
(9)
—
—
(2)
(11)
Same store properties
875
247
104
184
1,410
Notes:
(1) Represents Welltower's interests in joint ventures where Welltower is the minority partner.
(2) Represents minority partners' interests in joint ventures where Welltower is the majority partner.
(3) Represents Welltower's pro rata share of NOI. See page 11 for more information.
(4) Primarily includes development properties and land parcels.
(5) Primarily represents non-cash NOI and NOI associated with leased properties.
(6) Represents timing adjustments for current quarter acquisitions, construction conversions and segment or operator transitions.
(7) Acquisitions and development conversions will enter the same store pool five full quarters after acquisition or certificate of occupancy.
(8) Redevelopment properties will enter the same store pool after five full quarters of operations post redevelopment completion.
(9) Transitioned properties will enter the same store pool after five full quarters of operations with the new operator in place or under the new structure.
(10) Represents properties that are either closed or being closed.
17
Supplemental Reporting Measures
(dollars in thousands at Welltower pro rata ownership)
Same Store NOI Reconciliation
4Q24
1Q25
2Q25
3Q25
4Q25
Y/o/Y
Seniors Housing Operating
NOI
$
441,602
$
490,648
$
543,110
$
579,559
$
704,670
Non-cash NOI on same store properties
(1,963)
(2,560)
(1,443)
(1,966)
(2,010)
NOI attributable to non-same store properties
(51,765)
(68,597)
(93,456)
(116,010)
(229,879)
Currency and ownership adjustments(1)
(594)
1,369
(4,342)
(5,627)
(4,939)
Other normalizing adjustments(2)
2,374
246
3,832
2,665
1,341
SSNOI
389,654
421,106
447,701
458,621
469,183
20.4
%
Seniors Housing Triple-net
NOI
61,289
100,352
99,889
95,018
163,532
Non-cash NOI on same store properties
(10,123)
(9,328)
(9,070)
(7,881)
(7,042)
NOI attributable to non-same store properties
22,316
(17,100)
(15,499)
(10,825)
(79,462)
Currency and ownership adjustments(1)
1,119
1,546
278
(1,241)
(1,636)
Normalizing adjustments for joint venture recapitalization(3)
(1,349)
(1,400)
(1,400)
(467)
—
Other normalizing adjustments(2)
—
—
—
—
(222)
SSNOI
73,252
74,070
74,198
74,604
75,170
2.6
%
Outpatient Medical
NOI
143,969
147,889
150,521
153,387
103,862
Non-cash NOI on same store properties
(2,706)
(2,594)
(2,521)
(2,326)
(2,239)
NOI attributable to non-same store properties
(118,040)
(122,027)
(124,265)
(127,459)
(77,845)
Other normalizing adjustments(2)
—
(11)
(107)
(20)
—
SSNOI
23,223
23,257
23,628
23,582
23,778
2.4
%
Long-Term/Post-Acute Care
NOI
118,429
142,143
161,523
180,846
208,872
Non-cash NOI on same store properties
(10,670)
(12,007)
(12,451)
(12,181)
(11,680)
NOI attributable to non-same store properties
(35,971)
(56,886)
(75,831)
(94,572)
(122,038)
Currency and ownership adjustments(1)
552
150
91
83
56
Normalizing adjustments for service agreement termination(4)
970
970
970
647
—
SSNOI
73,310
74,370
74,302
74,823
75,210
2.6
%
Corporate
NOI
92,071
93,697
91,028
116,891
81,410
NOI attributable to non-same store properties
(92,071)
(93,697)
(91,028)
(116,891)
(81,410)
SSNOI
—
—
—
—
—
Total
NOI
857,360
974,729
1,046,071
1,125,701
1,262,346
Non-cash NOI on same store properties
(25,462)
(26,489)
(25,485)
(24,354)
(22,971)
NOI attributable to non-same store properties
(275,531)
(358,307)
(400,079)
(465,757)
(590,634)
Currency and ownership adjustments(1)
1,077
3,065
(3,973)
(6,785)
(6,519)
Normalizing adjustments, net
1,995
(195)
3,295
2,825
1,119
SSNOI
$
559,439
$
592,803
$
619,829
$
631,630
$
643,341
15.0
%
Notes:
(1) Includes adjustments to reflect consistent property ownership percentages, to translate Canadian properties at a USD/CAD rate of 1.43 and to translate UK properties at a GBP/USD rate of 1.23.
(2) Represents aggregate normalizing adjustments which are individually less than 0.50% of SSNOI growth per property type.
(3) Represents normalizing adjustment related to a joint venture recapitalization associated with one Seniors Housing Triple-net lease.
(4) Represents normalizing adjustment related to the termination of a service agreement related to one Long-Term/Post-Acute Care lease.
18
Supplemental Reporting Measures
(dollars in thousands, except RevPOR, SS RevPOR and SSNOI/unit)
SHO RevPOR Reconciliation
United States
United Kingdom
Canada
Total
Consolidated SHO revenues
$
1,575,369
$
821,109
$
178,899
$
2,575,377
Unconsolidated SHO revenues attributable to Welltower(1)
44,360
6,628
2,237
53,225
SHO revenues attributable to noncontrolling interests(2)
(18,436)
—
(2,607)
(21,043)
Pro rata SHO revenues(3)
1,601,293
827,737
178,529
2,607,559
Non-cash and non-RevPOR revenues
(4,134)
(945)
(177)
(5,256)
Revenues attributable to non in-place properties
(4,619)
(199,564)
—
(204,183)
SHO local revenues
1,592,540
627,228
178,352
2,398,120
Average occupied units/month
89,041
24,104
20,064
133,209
RevPOR/month in USD
$
5,913
$
8,603
$
2,939
$
5,952
RevPOR/month in local currency(4)
£
6,994
$
4,199
Reconciliations of SHO SS RevPOR Growth, SSNOI Growth and SSNOI/Unit
United States
United Kingdom
Canada
Total
4Q24
4Q25
4Q24
4Q25
4Q24
4Q25
4Q24
4Q25
SHO SS RevPOR Growth
Consolidated SHO revenues
$
1,308,177
$
1,575,369
$
324,638
$
821,109
$
131,514
$
178,899
$
1,764,329
$
2,575,377
Unconsolidated SHO revenues attributable to WELL(1)
33,920
44,360
4,148
6,628
28,054
2,237
66,122
53,225
SHO revenues attributable to noncontrolling interests(2)
(20,079)
(18,436)
—
—
(2,347)
(2,607)
(22,426)
(21,043)
SHO pro rata revenues(3)
1,322,018
1,601,293
328,786
827,737
157,221
178,529
1,808,025
2,607,559
Non-cash and non-RevPOR revenues on same store properties
(2,292)
(2,769)
(14)
(6)
(208)
(222)
(2,514)
(2,997)
Revenues attributable to non-same store properties
(197,586)
(362,976)
(145,291)
(619,462)
(29,621)
(37,765)
(372,498)
(1,020,203)
Currency and ownership adjustments(4)
5,875
751
(7,333)
(15,706)
(2,495)
(3,403)
(3,953)
(18,358)
SHO SS RevPOR revenues(5)
$
1,128,015
$
1,236,299
$
176,148
$
192,563
$
124,897
$
137,139
$
1,429,060
$
1,566,001
Avg. occupied units/month(6)
63,608
66,733
6,332
6,577
14,680
15,223
84,620
88,533
SHO SS RevPOR(7)
$
5,863
$
6,125
$
9,197
$
9,680
$
2,813
$
2,978
$
5,583
$
5,848
SS RevPOR YOY growth
4.5
%
5.3
%
5.9
%
4.7
%
SHO SSNOI Growth
Consolidated SHO NOI
$
319,413
$
465,091
$
65,879
$
169,281
$
45,397
$
63,561
$
430,689
$
697,933
Unconsolidated SHO NOI attributable to WELL(1)
11,658
17,581
865
1,485
10,759
1,026
23,282
20,092
SHO NOI attributable to noncontrolling interests(2)
(11,308)
(12,138)
—
—
(1,061)
(1,215)
(12,369)
(13,353)
SHO pro rata NOI(3)
319,763
470,534
66,744
170,766
55,095
63,372
441,602
704,672
Non-cash NOI on same store properties
(1,839)
(1,998)
(124)
(12)
—
—
(1,963)
(2,010)
NOI attributable to non-same store properties
(20,453)
(101,029)
(20,575)
(115,534)
(10,737)
(13,316)
(51,765)
(229,879)
Currency and ownership adjustments(4)
2,113
387
(1,841)
(4,162)
(866)
(1,164)
(594)
(4,939)
Other normalizing adjustments(8)
3,197
1,183
—
—
(823)
158
2,374
1,341
SHO pro rata SSNOI(5)
$
302,781
$
369,077
$
44,204
$
51,058
$
42,669
$
49,050
$
389,654
$
469,185
SHO SSNOI growth
21.9
%
15.5
%
15.0
%
20.4
%
SHO SSNOI/Unit
Trailing four quarters' SSNOI(5)
$
1,404,675
$
198,219
$
193,717
$
1,796,611
Average units in service(9)
74,987
7,516
16,442
98,945
SSNOI/unit in USD
$
18,732
$
26,373
$
11,782
$
18,158
SSNOI/unit in local currency(4)
£
21,441
$
16,831
Notes:
(1) Represents Welltower's interests in joint ventures where Welltower is the minority partner.
(2) Represents minority partners' interests in joint ventures where Welltower is the majority partner.
(3) Represents SHO revenues/NOI at Welltower pro rata ownership. See page 11 for more information.
(4) Includes where appropriate adjustments to reflect consistent property ownership percentages, to translate Canadian properties at a USD/CAD rate of 1.43 and to translate UK properties at a GBP/USD rate of 1.23.
(5) Represents SS SHO RevPOR revenues/SSNOI at Welltower pro rata ownership. See page 18 for more information.
(6) Represents average occupied units for SS properties related solely to referenced country on a pro rata basis.
(7) Represents pro rata SS average revenues generated per occupied room per month.
(8) Represents aggregate normalizing adjustments which are individually less than .50% of SSNOI growth.
(9) Represents average units in service for SS properties related solely to referenced country on a pro rata basis.
19
Forward-Looking Statement and Risk Factors
Forward-Looking Statements and Risk Factors
This document contains "forward-looking statements" as defined in the Private Securities Litigation Reform Act of 1995. When Welltower uses words such as "may," "will," "intend," "should," "believe," "expect," "anticipate," "project," "pro forma," "estimate" or similar expressions that do not relate solely to historical matters, Welltower is making forward-looking statements. Forward-looking statements are not guarantees of future performance and involve risks and uncertainties that may cause Welltower's actual results to differ materially from Welltower's expectations discussed in the forward-looking statements. This may be a result of various factors, including, but not limited to: the impact of macroeconomic and geopolitical developments, including economic downturns, elevated inflation and interest rates, political or social conflict, unrest or violence or similar events; the status of the economy; the status of capital markets, including availability and cost of capital; issues facing the healthcare industry, including compliance with, and changes to, regulations and payment policies, responding to government investigations and punitive settlements, public perception of the healthcare industry and operators’/tenants’ difficulty in cost effectively obtaining and maintaining adequate liability and other insurance; changes in financing terms; competition within the healthcare and seniors housing industries; negative developments in the operating results or financial condition of operators/tenants, including, but not limited to, their ability to pay rent and repay loans; Welltower's ability to transition or sell properties with profitable results; the failure to make new investments or acquisitions as and when anticipated; natural disasters, public health emergencies and extreme weather affecting Welltower's properties; Welltower's ability to re-lease space at similar rates as vacancies occur; Welltower's ability to timely reinvest sale proceeds at similar rates to assets sold; operator/tenant or joint venture partner bankruptcies or insolvencies; the cooperation of joint venture partners; government regulations affecting Medicare and Medicaid reimbursement rates and operational requirements; liability or contract claims by or against operators/tenants; unanticipated difficulties and/or expenditures relating to future investments or acquisitions; environmental laws affecting Welltower's properties; changes in rules or practices governing Welltower's financial reporting; the movement of U.S. and foreign currency exchange rates and changes to U.S. and global monetary, fiscal or trade policies; Welltower's approach to artificial intelligence; Welltower's ability to maintain its qualification as a REIT; key management personnel recruitment and retention; and other risks described in Welltower's reports filed from time to time with the SEC. Welltower undertakes no obligation to update or revise publicly any forward-looking statements, whether because of new information, future events or otherwise, or to update the reasons why actual results could differ from those projected in any forward-looking statements.
Additional Information
The information in this supplemental information package should be read in conjunction with our Annual Report on Form 10-K, Quarterly Reports on Form 10-Q, Current Reports on Form 8-K, our earnings press release dated February 10, 2026 and other information filed with, or furnished to, the SEC. The Supplemental Reporting Measures and reconciliations of Non-GAAP measures are an integral part of the information presented herein.
You can access our Annual Report on Form 10-K, Quarterly Reports on Form 10-Q, Current Reports on Form 8-K and amendments to those reports filed or furnished pursuant to Section 13(a) or 15(d) of the Exchange Act at www.welltower.com as soon as reasonably practicable after they are filed with, or furnished to, the SEC. You can also review these SEC filings and other information by accessing the SEC's website at http://www.sec.gov. We routinely post important information on our website at www.welltower.com in the “Investors” section, including corporate and investor presentations and financial information. We intend to use our website as a means of disclosing material, non-public information and for complying with our disclosure obligations under Regulation FD. Such disclosures will be included on our website under the heading "Investors." Accordingly, investors should monitor such portion of our website in addition to following our press releases, public conference calls and filings with the SEC. The information on or connected to our website is not, and shall not be deemed to be, a part of, or incorporated into this supplemental information package.
About Welltower
Welltower Inc. (NYSE: WELL), an S&P 500 company, is positioned at the center of the silver economy, focusing on rental housing for aging seniors across the United States, United Kingdom and Canada. Our portfolio of 2,500+ seniors and wellness housing communities are positioned at the intersection of housing and hospitality, creating vibrant communities for mature renters and older adults. We believe our real estate portfolio is unmatched, located in highly attractive micromarkets with stunning built environments. Yet, we are an unusual real estate organization as we view ourselves as an operating company in a real estate wrapper, driven by highly-aligned partnerships and an unconventional culture. Through our disciplined approach to capital allocation powered by our Data Science platform and superior operating results driven by the Welltower Business System - our end-to-end operating platform - we aspire to deliver long-term compounding of per share growth for our existing investors, our North Star. More information is available at www.welltower.com.