In Q2 FY26, Cirrus Logic delivered record September quarter revenue of $561.0 million, towards the top end of our guidance range, and GAAP and non-GAAP earnings per share of $2.48 and $2.83, respectively. During the quarter, we were delighted to see multiple smartphone customers introduce their latest-generation devices featuring our audio and high-performance mixed-signal (HPMS) components. Outside of smartphones, we continued to execute on our plan to grow market share in the PC market. Progress in this space included securing our first mainstream consumer laptop design, expanding our collaboration with leading PC platform vendors, and developing new products with superior voice and audio capture capabilities. Additionally, we continue to focus on our general market business, where products tend to enjoy long lifespans and gross margins that are well above our corporate average. During the quarter, we gained design momentum with customers on all 14 variants of our latest-generation ADCs, DACs, and ultra-high-performance audio codec. We also received positive initial feedback on our family of analog front-end components targeting imaging applications and saw increased engagement on our latest timing product family. Looking forward, we are optimistic about the opportunities ahead of us as we continue to leverage our mixed-signal design and signal processing expertise to diversify our product portfolio and expand our addressable market.
Figure A: Cirrus Logic Q2 FY26
Q2 FY26
GAAP
Adj.
Non-GAAP*
Revenue
$561.0
$561.0
Gross Profit
$294.4
$0.3
$294.7
Gross Margin
52.5%
52.5%
Operating Expense
$149.6
($21.9)
$127.7
Operating Income
$144.8
$22.2
$167.0
Operating Profit
25.8%
29.8%
Interest Income
$8.7
$8.7
Other Expense
$(0.1)
$(0.1)
Income Tax Expense
$21.8
$3.9
$25.7
Net Income
$131.6
$18.4
$150.0
Diluted EPS
$2.48
$0.35
$2.83
*Complete GAAP to Non-GAAP reconciliations available on page 11
Numbers may not sum due to rounding
$ millions, except EPS
Revenue and Gross Margin
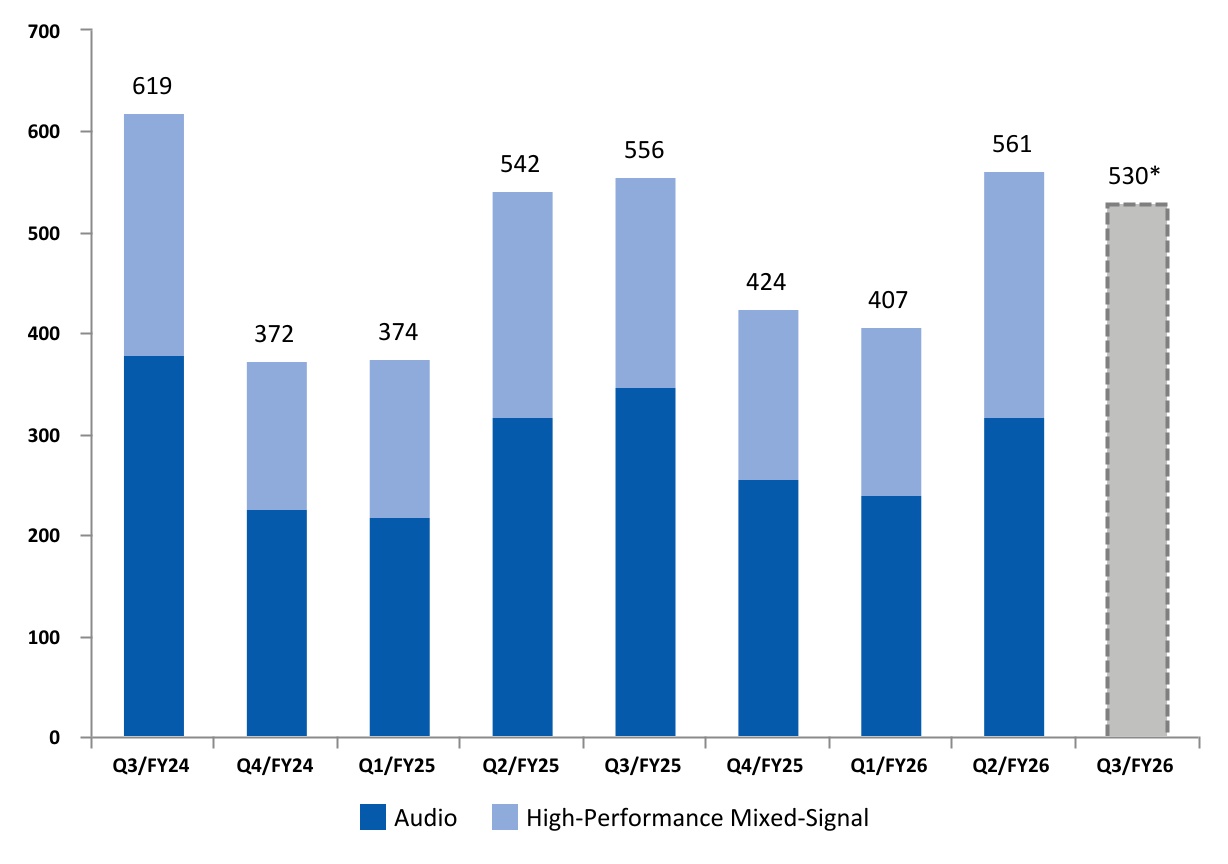
Revenue for the September quarter was $561.0 million, up thirty-eight percent quarter over quarter and up four percent year over year. The increase in revenue on a sequential basis reflects higher smartphone unit volumes. The year-over-year increase was primarily driven by higher smartphone unit volumes and sales associated with our latest-generation products. This was partially offset by pricing reductions. In the December quarter, we expect revenue to range from $500 million to $560 million, down six percent sequentially and approximately down five percent year over year at the midpoint.
In Q2 FY26, revenue derived from our audio and high-performance mixed-signal product lines represented 57 percent and 43 percent of total revenue, respectively. One customer contributed approximately 90 percent of total revenue in Q2 FY26. Our relationship with our largest customer remains
Q2 FY26 Letter to Shareholders
2
outstanding, with continued strong design activity across a wide range of products. While we understand there is intense interest in this customer, in accordance with our policy, we do not discuss specifics about this business.
GAAP gross margin in the September quarter was 52.5 percent, compared to 52.6 percent in Q1 FY26 and 52.2 percent in Q2 FY25. Non-GAAP gross margin in the September quarter was 52.5 percent, compared to 52.6 percent in Q1 FY26 and 52.2 percent in Q2 FY25. On a year-over-year basis, the increase in gross margin was largely due to a more favorable product mix. This was partially offset by higher inventory reserves. In the December quarter, we expect gross margin to range from 51 percent to 53 percent.
Operating Profit, Tax, and EPS
Operating profit for Q2 FY26 was 25.8 percent on a GAAP basis and 29.8 percent on a non-GAAP basis. GAAP operating expense was $149.6 million and included $20.2 million in stock-based compensation and $1.6 million in amortization of acquisition intangibles. On a sequential basis, GAAP operating expense increased by $8.0 million, primarily driven by higher variable compensation, product development costs that were largely due to tape outs, and facilities-related costs. This was partially offset by a reduction in employee-related expenses. On a year-over-year basis, GAAP operating expense decreased by $1.1 million largely due to lower stock-based compensation and product development costs. This was offset by
Q2 FY26 Letter to Shareholders
3
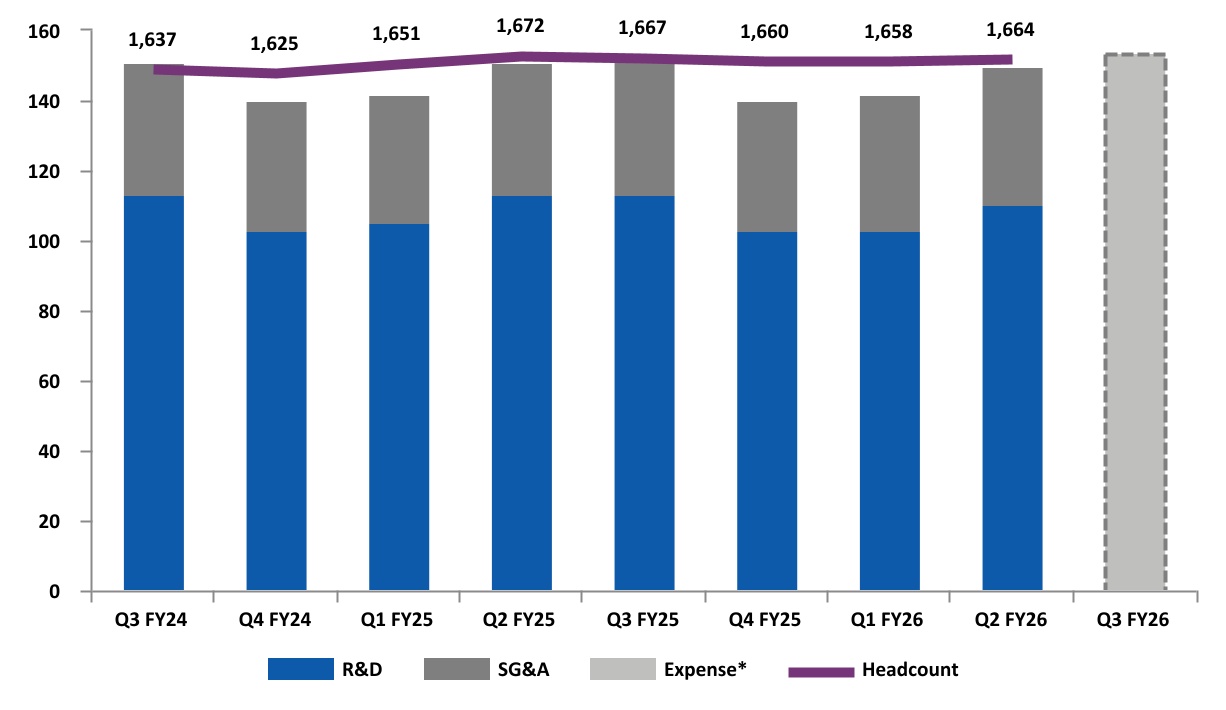
higher employee-related expenses, mostly due to annual salary increases. Non-GAAP operating expense for the quarter was $127.7 million, up $8.2 million sequentially and up $0.9 million year over year. The company’s total headcount exiting Q2 was 1,664.
Combined GAAP R&D and SG&A expenses for Q3 FY26 are expected to range from $151 million to $157 million, including approximately $21 million in stock-based compensation expense and $2 million in amortization of acquisition intangibles, resulting in a non-GAAP operating expense range between $128 million and $134 million.
Figure C: GAAP R&D and SG&A Expenses ($M)/Headcount Q3 FY24 to Q3 FY26
*Reflects midpoint of combined R&D and SG&A guidance as of November 4, 2025
For the September quarter, GAAP tax expense was $21.8 million on GAAP pre-tax income of $153.4 million, resulting in an effective tax rate of 14.2 percent. Non-GAAP tax expense for the quarter was $25.7 million on non-GAAP pre-tax income of $175.6 million, resulting in a non-GAAP effective tax rate of 14.6 percent. Both the GAAP and non-GAAP effective tax rates include the year-to-date beneficial impact of the One Big Beautiful Bill Act (the "OBBBA"), which was signed into law on July 4, 2025 and reinstated the immediate tax deductibility of U.S. R&D expenditures, among other provisions. We estimate that our FY26 non-GAAP effective tax rate will range from approximately 16 percent to 18 percent.
GAAP earnings per share for the September quarter was $2.48, compared to earnings per share of $1.14 in the prior quarter and $1.83 in Q2 FY25. Non-GAAP earnings per share for the September quarter was $2.83, versus $1.51 in Q1 FY26 and $2.25 in Q2 FY25.
Q2 FY26 Letter to Shareholders
4
Balance Sheet
Our cash and investment balance at the end of Q2 FY26 was $896.0 million, up from $847.8 million in the prior quarter and $706.6 million in Q2 FY25. . Cash flow from operations for the September quarter was $92.2 million. During the quarter, we repurchased 361,708 shares at an average price of $110.55, returning $40.0 million of cash to shareholders in the form of buybacks. At the end of Q2 FY26, the company had $414.1 million remaining in its share repurchase authorization. Over the long term, we expect strong cash flow generation, and we will continue to evaluate potential uses of this cash, including investing in the business to pursue organic growth opportunities, M&A, and returning capital to shareholders through share repurchases.
Q2 FY26 inventory was $236.4 million, down from $279.0 million in Q1 FY26. In Q3 FY26, we expect inventory to be slightly down sequentially.
Company Strategy
We remain committed to our three-pronged strategy for growing our business: first, maintaining our leadership position in smartphone audio; second, increasing HPMS content in smartphones; and third, leveraging our strength in audio and HPMS to expand into additional applications and markets with both existing and new components.
Smartphones
In smartphones, the company maintained its position as a leading supplier of audio solutions, as we experienced strong demand for our latest-generation custom boosted amplifier and first 22-nanometer smart codec. These components feature an innovative new architecture that delivers significant power and efficiency improvements while also saving valuable board space and enabling system design flexibility. As a reminder to our shareholders, while many of our products ship into consumer end devices, much of our custom silicon business offers greater returns over a significantly longer period than is typical of consumer products. For example, our latest-generation audio components superseded a codec and amplifiers that had been shipping in high-volume flagship phones for five and six years, respectively. We regard this as an important strength of our business, providing solid long-term visibility, sustained revenue contribution, and the ability to leverage our R&D resources in new areas that can drive further innovation and growth. This past quarter, a leading Android OEM also introduced its latest flagship smartphone featuring two Cirrus Logic boosted amplifiers and a haptic driver. While the majority of our general market R&D investments are focused on developing products for new markets, we continue to engage with customers on next-generation flagship smartphones and expect additional designs from various customers to come to market in the future.
Beyond audio, we continue to pursue opportunities to diversify our revenue and grow our smartphone content with HPMS solutions. Customer engagement with our camera controllers remains strong, and we were delighted to see the technology continue to be featured as an important differentiator in the new generation of devices. We believe there is an exciting path for innovation in camera controllers, and we are engaged on next-generation components that offer further feature and performance enhancements. Additionally, we continue to invest in product development for power and battery technologies, which we view as a longer-term growth driver within our HPMS product line. Today, we have a number of R&D programs underway related to battery performance, health, and longevity. Our teams are focused on
Q2 FY26 Letter to Shareholders
5
maximizing power efficiency and integrating more digital processing and control alongside analog circuits. We believe our work in this area will contribute to product diversification and broaden our footprint in the years ahead.
New Applications and Markets
Outside of smartphones, we are committed to leveraging our intellectual property and engineering capabilities to expand into new applications and markets. Our most immediate opportunity is in the PC market, where we are executing on our plan to meaningfully grow share. During the quarter, design activity across our laptop portfolio was strong, and we expect a range of consumer and commercial laptops featuring our components to come to market over the next year as the adoption of SoundWire Device Class Audio accelerates. Demand for our PC components has been driven by increased customer interest in high-quality audio and the shift toward thinner, lighter, and more power-efficient designs. After our initial success in high-end laptop programs, we are now also strategically focused on expanding into mainstream designs to target higher-volume opportunities. This enables us to capture a greater share of our serviceable addressable market and unlock additional long-term revenue opportunities. Building on our initial wins with mainstream commercial laptops earlier this year, we are delighted to have recently secured our first mainstream consumer laptop design, which is expected to ship during the next calendar year. These strategically important wins validate our capabilities and position the company well to secure more mainstream devices in the future. To enable faster time to market for OEMs, we are expanding our collaboration with leading PC platform vendors with the introduction of new audio and HPMS solutions that address a larger portion of our PC SAM in both commercial and consumer products. Further, as voice increasingly becomes a natural and preferred way to interact with AI-enabled PCs, we are developing new products to capitalize on this opportunity. These products also deliver superior voice and audio capture capabilities, including noise cleanup and voice detection. Additionally, they support ultra-low power modes, which are critical to enable features such as voice wake for AI applications while the device is in standby. We expect the first product with this technology to sample with customers during the December quarter. Overall, we are encouraged by the momentum we are building in the PC market and believe there are significant opportunities for Cirrus Logic to drive long-term revenue growth in these market segments.
While PCs represent a significant growth opportunity outside of smartphones, we also have strong interest in our general market products, which span a large number of customers across the professional audio, automotive, industrial, and imaging end markets. Applications in these areas tend to have long lifespans and gross margins that are well above our corporate average. We are targeting a growing share of these highly profitable market segments by efficiently leveraging our low-power, high-performance intellectual property to develop differentiated components for a wide range of applications and tiers. During the quarter, we gained design momentum with prosumer and automotive customers on all 14 variants of our latest-generation ADCs, DACs, and ultra-high-performance audio codec, and expect new end products utilizing these components to come to market over the next 12 months. Additionally, we are seeing increased engagement from automotive and professional audio customers on our latest timing product family, which began shipping last quarter. The company is also sampling a family of high-performance analog front-end components targeting imaging applications, and initial feedback has been positive. We are extremely pleased with our progress to date in these areas. Looking forward, we plan to further build out this portfolio of products and leverage our mixed-signal design and advanced low-power signal processing expertise to drive growth opportunities in new applications and markets.
Q2 FY26 Letter to Shareholders
6
Summary and Guidance
For the December quarter, we expect the following results:
•Revenue to range between $500 million and $560 million;
•GAAP gross margin to be between 51 percent and 53 percent; and
•Combined GAAP R&D and SG&A expenses to range between $151 million and $157 million, including approximately $21 million in stock-based compensation expense and $2 million in amortization of acquisition intangibles, resulting in a non-GAAP operating expense range between $128 million and $134 million.
In conclusion, we are proud to have delivered strong financial results for Q2 FY26 while also continuing to execute on our strategy. During the quarter, new flagship smartphones with our components came to market, we continued to build momentum with our PC business, and we had strong customer engagement across our portfolio of general market components. With an extensive intellectual property portfolio and a solid product roadmap, we believe that we are well-positioned to capitalize on the opportunities ahead of us to drive long-term shareholder value.
Sincerely,
John Forsyth
President &
Chief Executive Officer
Jeff Woolard
Chief Financial Officer
Conference Call Q&A Session
Cirrus Logic will host a live Q&A session at 5 p.m. ET today to answer questions related to its financial results and business outlook. Participants may listen to the conference call on the Cirrus Logic website.
A replay of the webcast can be accessed on the Cirrus Logic website approximately two hours following its completion or by calling (609) 800-9909 or toll-free at (800) 770-2030 (Access Code: 95424).
Use of Non-GAAP Financial Information
To supplement Cirrus Logic's financial statements presented on a GAAP basis, Cirrus has provided non-GAAP financial information, including non-GAAP net income, diluted earnings per share, operating income and profit, operating expenses, gross margin and profit, tax expense, tax expense impact on earnings per share, effective tax rate, free cash flow, and free cash flow margin. A reconciliation of the adjustments to
Q2 FY26 Letter to Shareholders
7
GAAP results is included in the tables below. We are also providing guidance on our expected non-GAAP expected effective tax rate. We are not able to provide guidance on our GAAP effective tax rate or a related reconciliation without unreasonable efforts since our future GAAP effective tax rate depends on our future stock price and related stock-based compensation information that is not currently available.
Non-GAAP financial information is not meant as a substitute for GAAP results but is included because management believes such information is useful to our investors for informational and comparative purposes. In addition, certain non-GAAP financial information is used internally by management to evaluate and manage the company. The non-GAAP financial information used by Cirrus Logic may differ from that used by other companies. These non-GAAP measures should be considered in addition to, and not as a substitute for, the results prepared in accordance with GAAP.
Safe Harbor Statement
Except for historical information contained herein, the matters set forth in this shareholder letter contain forward-looking statements, including statements about our ability to leverage our mixed-signal design and signal processing expertise to diversify our product portfolio and expand our addressable market; our ability to maintain our leadership position in smartphone audio; our ability to increase HPMS content in smartphones; our ability to leverage our strength in audio and HPMS to expand into additional applications and markets with both new and existing components; our expectation that our latest-generation custom boosted amplifier and first 22-nanometer smart codec will ship for multiple generations and provide the company an opportunity for sustained revenue contribution; our ability to deploy R&D resources on new projects that can drive further innovation and growth; our expectation that next-generation flagship smartphones will come to market in the future; our expectation that power and battery technologies will drive longer-term growth, contribute to product diversification, and broaden our footprint in the years ahead; our ability to leverage our intellectual property and engineering capabilities to expand into new applications and markets; our ability to expand into mainstream designs to capture a greater share of our serviceable addressable market and unlock additional long-term revenue opportunities; our expectation that new end products with our components will come to market in the next 12 months; our ability to drive long-term revenue growth and grow market share in the PC market; our expectation that the first product designed to capitalize on opportunities in AI-enabled PCs will sample with customers during the December quarter; our belief there is an exciting path for innovation in camera controllers; our expectation that new end products utilizing our general market components will come to market over the next 12 months; our ability to capitalize on the opportunities ahead of us to drive long-term shareholder value; our expectation that inventory will be down slightly sequentially; our non-GAAP effective tax rate for the full fiscal year 2026; and our forecasts for the third quarter of fiscal year 2026 revenue, gross margin, combined research and development and selling, general and administrative expense levels, stock-based compensation expense, and amortization of acquisition intangibles. In some cases, forward-looking statements are identified by words such as “emerge,” “expect,” “anticipate,” “foresee,” “target,” “project,” “believe,” “goals,” “opportunity,” “estimates,” “intend,” “will,” and variations of these types of words and similar expressions. In addition, any statements that refer to our plans, expectations, strategies, or other characterizations of future events or circumstances are forward-looking statements. These forward-looking statements are based on our current expectations, estimates, and assumptions and are subject to certain risks and uncertainties that could cause actual results to differ materially, and readers should not place undue reliance on such statements. These risks and uncertainties include, but are not limited to, the following: the level and timing of orders and shipments during the third quarter of fiscal year 2026, customer cancellations of orders, or the failure to place orders consistent with forecasts; changes in government trade policies, including the imposition of tariffs and export restrictions; global economic conditions and uncertainty;
Q2 FY26 Letter to Shareholders
8
and the risk factors listed in our Form 10-K for the year ended March 29, 2025 and in our other filings with the Securities and Exchange Commission, which are available at www.sec.gov. The foregoing information concerning our business outlook represents our outlook as of the date of this news release, and we expressly disclaim any obligation to update or revise any forward-looking statements, whether as a result of new developments or otherwise.
Cirrus Logic, Cirrus and the Cirrus Logic logo are registered trademarks of Cirrus Logic, Inc. All other company or product names noted herein may be trademarks of their respective holders.
Q2 FY26 Letter to Shareholders
9
Summary of Financial Data Below:
CONSOLIDATED CONDENSED STATEMENT OF OPERATIONS
(in thousands, except per share data; unaudited)
Three Months Ended
Six Months Ended
Sep. 27, 2025
Jun. 28, 2025
Sep. 28, 2024
Sep. 27, 2025
Sep. 28, 2024
Q2'26
Q1'26
Q2'25
Q2'26
Q2'25
Audio
$
318,214
$
240,043
$
316,588
$
558,257
$
535,558
High-Performance Mixed-Signal
242,746
167,229
225,269
409,975
380,325
Net sales
560,960
407,272
541,857
968,232
915,883
Cost of sales
266,586
193,242
259,267
459,828
444,368
Gross profit
294,374
214,030
282,590
508,404
471,515
Gross margin
52.5
%
52.6
%
52.2
%
52.5
%
51.5
%
Research and development
110,021
102,892
112,925
212,913
218,288
Selling, general and administrative
39,589
38,744
37,813
78,333
74,583
Total operating expenses
149,610
141,636
150,738
291,246
292,871
Income from operations
144,764
72,394
131,852
217,158
178,644
Interest income
8,695
8,622
8,134
17,317
16,336
Other income (expense)
(63)
(388)
19
(451)
1,628
Income before income taxes
153,396
80,628
140,005
234,024
196,608
Provision for income taxes
21,800
19,931
37,865
41,731
52,373
Net income
$
131,596
$
60,697
$
102,140
$
192,293
$
144,235
Basic earnings per share
$
2.57
$
1.17
$
1.92
$
3.74
$
2.70
Diluted earnings per share:
$
2.48
$
1.14
$
1.83
$
3.61
$
2.59
Weighted average number of shares:
Basic
51,175
51,727
53,275
51,451
53,354
Diluted
53,054
53,319
55,800
53,195
55,753
Prepared in accordance with Generally Accepted Accounting Principles
Q2 FY26 Letter to Shareholders
10
RECONCILIATION BETWEEN GAAP AND NON-GAAP FINANCIAL INFORMATION CONTINUED
(in thousands, except per share data; unaudited)
(not prepared in accordance with GAAP)
Non-GAAP financial information is not meant as financial information is not meant as a substitute for GAAP results, but is included because management believes such information is useful to our investors for informational and comparative purposes. In addition, certain non-GAAP financial information is used internally by management to evaluate and manage the company. As a note, the non-GAAP financial information used by Cirrus Logic may differ from that used by other companies. These non-GAAP measures should be considered in addition to, and not as a substitute for, the results prepared in accordance with GAAP.
Three Months Ended
Six Months Ended
Sep. 27, 2025
Jun. 28, 2025
Sep. 28, 2024
Sep. 27, 2025
Sep. 28, 2024
Net Income Reconciliation
Q2'26
Q1'26
Q2'25
Q2'26
Q2'25
GAAP Net Income
$
131,596
$
60,697
$
102,140
$
192,293
$
144,235
Amortization of acquisition intangibles
1,648
1,647
1,864
3,295
3,836
Stock-based compensation expense
20,597
20,809
22,447
41,406
43,832
Lease impairment
—
—
—
—
1,019
Adjustment to income taxes
(3,861)
(2,839)
(1,162)
(6,700)
(5,267)
Non-GAAP Net Income
$
149,980
$
80,314
$
125,289
$
230,294
$
187,655
Earnings Per Share Reconciliation
GAAP Diluted earnings per share
$
2.48
$
1.14
$
1.83
$
3.61
$
2.59
Effect of Amortization of acquisition intangibles
0.03
0.03
0.04
0.06
0.07
Effect of Stock-based compensation expense
0.39
0.39
0.40
0.78
0.79
Effect of Lease impairment
—
—
—
—
0.02
Effect of Adjustment to income taxes
(0.07)
(0.05)
(0.02)
(0.12)
(0.10)
Non-GAAP Diluted earnings per share
$
2.83
$
1.51
$
2.25
$
4.33
$
3.37
Operating Income Reconciliation
GAAP Operating Income
$
144,764
$
72,394
$
131,852
$
217,158
$
178,644
GAAP Operating Profit
25.8
%
17.8
%
24.3
%
22.4
%
19.5
%
Amortization of acquisition intangibles
1,648
1,647
1,864
3,295
3,836
Stock-based compensation expense - COGS
363
300
355
663
621
Stock-based compensation expense - R&D
13,019
13,072
15,844
26,091
31,607
Stock-based compensation expense - SG&A
7,215
7,437
6,248
14,652
11,604
Lease impairment
—
—
—
—
1,019
Non-GAAP Operating Income
$
167,009
$
94,850
$
156,163
$
261,859
$
227,331
Non-GAAP Operating Profit
29.8
%
23.3
%
28.8
%
27.0
%
24.8
%
Operating Expense Reconciliation
GAAP Operating Expenses
$
149,610
$
141,636
$
150,738
$
291,246
$
292,871
Amortization of acquisition intangibles
(1,648)
(1,647)
(1,864)
(3,295)
(3,836)
Stock-based compensation expense - R&D
(13,019)
(13,072)
(15,844)
(26,091)
(31,607)
Stock-based compensation expense - SG&A
(7,215)
(7,437)
(6,248)
(14,652)
(11,604)
Lease impairment
—
—
—
—
(1,019)
Non-GAAP Operating Expenses
$
127,728
$
119,480
$
126,782
$
247,208
$
244,805
Gross Margin/Profit Reconciliation
GAAP Gross Profit
$
294,374
$
214,030
$
282,590
$
508,404
$
471,515
GAAP Gross Margin
52.5
%
52.6
%
52.2
%
52.5
%
51.5
%
Stock-based compensation expense - COGS
363
300
355
663
621
Non-GAAP Gross Profit
$
294,737
$
214,330
$
282,945
$
509,067
$
472,136
Non-GAAP Gross Margin
52.5
%
52.6
%
52.2
%
52.6
%
51.5
%
Effective Tax Rate Reconciliation
GAAP Tax Expense
$
21,800
$
19,931
$
37,865
$
41,731
$
52,373
GAAP Effective Tax Rate
14.2
%
24.7
%
27.0
%
17.8
%
26.6
%
Adjustments to income taxes
3,861
2,839
1,162
6,700
5,267
Non-GAAP Tax Expense
$
25,661
$
22,770
$
39,027
$
48,431
$
57,640
Non-GAAP Effective Tax Rate
14.6
%
22.1
%
23.8
%
17.4
%
23.5
%
Tax Impact to EPS Reconciliation
GAAP Tax Expense
$
0.41
$
0.37
$
0.68
$
0.78
$
0.94
Adjustments to income taxes
0.07
0.05
0.02
0.12
0.10
Non-GAAP Tax Expense
$
0.48
$
0.42
$
0.70
$
0.90
$
1.04
Q2 FY26 Letter to Shareholders
11
CONSOLIDATED CONDENSED BALANCE SHEET
(in thousands; unaudited)
Sep. 27, 2025
Mar. 29, 2025
Sep. 28, 2024
ASSETS
Current assets
Cash and cash equivalents
$
593,476
$
539,620
$
445,759
Marketable securities
52,424
56,160
32,499
Accounts receivable, net
355,397
216,009
324,098
Inventories
236,409
299,092
271,765
Prepaid wafers
45,056
52,560
71,740
Other current assets
84,238
76,293
79,044
Total current Assets
1,367,000
1,239,734
1,224,905
Long-term marketable securities
250,146
239,036
228,302
Right-of-use lease assets
125,315
126,688
133,316
Property and equipment, net
151,154
159,900
168,265
Intangibles, net
24,451
27,461
25,700
Goodwill
435,936
435,936
435,936
Deferred tax asset
46,511
48,150
48,619
Long-term prepaid wafers
—
15,512
37,804
Other assets
29,170
34,656
53,292
Total assets
$
2,429,683
$
2,327,073
$
2,356,139
LIABILITIES AND STOCKHOLDERS' EQUITY
Current liabilities
Accounts payable
$
79,974
$
63,162
$
91,899
Accrued salaries and benefits
52,689
52,075
51,861
Lease liability
19,481
21,811
22,800
Other accrued liabilities
58,179
58,140
62,716
Total current liabilities
210,323
195,188
229,276
Non-current lease liability
120,985
121,908
129,806
Non-current income taxes
45,357
44,040
42,683
Other long-term liabilities
10,576
16,488
26,247
Total long-term liabilities
176,918
182,436
198,736
Stockholders' equity:
Capital stock
1,903,638
1,860,281
1,819,589
Accumulated earnings
139,025
90,351
107,233
Accumulated other comprehensive (loss) income
(221)
(1,183)
1,305
Total stockholders' equity
2,042,442
1,949,449
1,928,127
Total liabilities and stockholders' equity
$
2,429,683
$
2,327,073
$
2,356,139
Prepared in accordance with Generally Accepted Accounting Principles
Q2 FY26 Letter to Shareholders
12
CONSOLIDATED CONDENSED STATEMENT OF CASH FLOWS
(in thousands; unaudited)
Three Months Ended
Sep. 27,
Sep. 28,
2025
2024
Q2'26
Q2'25
Cash flows from operating activities:
Net income
$
131,596
$
102,140
Adjustments to reconcile net income to net cash provided by operating activities:
Depreciation and amortization
12,704
12,618
Stock-based compensation expense
20,597
22,447
Deferred income taxes
7,470
4,984
Loss on retirement or write-off of long-lived assets
—
12
Other non-cash charges
68
87
Net change in operating assets and liabilities:
Accounts receivable, net
(141,312)
(134,019)
Inventories
42,575
(39,199)
Prepaid wafers
16,878
25,531
Other assets
(8,485)
(341)
Accounts payable and other accrued liabilities
29,451
27,268
Income taxes payable
(19,328)
(13,297)
Net cash provided by operating activities
92,214
8,231
Cash flows from investing activities:
Maturities and sales of available-for-sale marketable securities
39,752
835
Purchases of available-for-sale marketable securities
(43,171)
(3,577)
Purchases of property, equipment and software
(3,868)
(2,670)
Investments in technology
(642)
(70)
Net cash used in investing activities
(7,929)
(5,482)
Cash flows from financing activities:
Net proceeds from the issuance of common stock
1,568
4,859
Repurchase of stock to satisfy employee tax withholding obligations
(1,261)
(3,207)
Repurchase and retirement of common stock
(39,986)
(49,993)
Net cash used in financing activities
(39,679)
(48,341)
Net increase (decrease) in cash and cash equivalents
44,606
(45,592)
Cash and cash equivalents at beginning of period
548,870
491,351
Cash and cash equivalents at end of period
$
593,476
$
445,759
Prepared in accordance with Generally Accepted Accounting Principles
Q2 FY26 Letter to Shareholders
13
RECONCILIATION BETWEEN GAAP AND NON-GAAP FINANCIAL INFORMATION
(in thousands; unaudited)
Free cash flow, a non-GAAP financial measure, is GAAP cash flow from operations (or cash provided by operating activities) less capital expenditures. Capital expenditures include purchases of property, equipment and software as well as investments in technology, as presented within our GAAP Consolidated Condensed Statement of Cash Flows. Free cash flow margin represents free cash flow divided by revenue.
Twelve Months Ended
Three Months Ended
Sep. 27,
Sep. 27,
Jun. 28,
Mar. 29,
Dec. 28,
2025
2025
2025
2025
2024
Q2'26
Q2'26
Q1'26
Q4'25
Q3'25
Net cash provided by operating activities (GAAP)
$
557,319
$
92,214
$
116,131
$
130,386
$
218,588
Capital expenditures
(23,148)
(4,510)
(2,770)
(9,181)
(6,687)
Free Cash Flow (Non-GAAP)
$
534,171
$
87,704
$
113,361
$
121,205
$
211,901
Cash Flow from Operations as a Percentage of Revenue (GAAP)
29
%
16
%
29
%
31
%
39
%
Capital Expenditures as a Percentage of Revenue (GAAP)
1
%
1
%
1
%
2
%
1
%
Free Cash Flow Margin (Non-GAAP)
27
%
16
%
28
%
29
%
38
%
Q2 FY26 Letter to Shareholders
14
RECONCILIATION BETWEEN GAAP AND NON-GAAP FINANCIAL INFORMATION