In Q3 FY26, Cirrus Logic delivered revenue of $580.6 million and record GAAP and non-GAAP earnings per share of $2.66 and $2.97, respectively. Stronger-than-anticipated demand for our components shipping into smartphones and a favorable mix of end devices resulted in revenue above our guidance range. We also saw continued momentum in PCs, reflecting disciplined execution against our growth strategy during the quarter. Highlights include ramping our latest-generation amplifier and codec in mainstream PC platforms ahead of customer product launches and sampling a new component designed to enable and enhance the use of voice as an interface for AI-enabled PCs. We were also pleased to see multiple leading OEMs introduce PCs at the Consumer Electronics Show (CES) in January that use a variety of our amplifiers, codecs, and haptic drivers. Design activity accelerated in our general market business, driven by our portfolio of ADCs, DACs, and ultra-high-performance audio codecs. We also began sampling a new prosumer audio product family that will expand our addressable market by delivering solutions that span additional tiers and categories of products. This builds upon our portfolio of world-class components that already service many of these markets today, particularly in professional audio and prosumer applications. Finally, we announced a new series of automotive haptic components that we believe represents a growing opportunity for Cirrus Logic in the coming years. Looking ahead, we are optimistic about our opportunities to continue to leverage our mixed-signal design and signal processing expertise to drive profitable growth in both existing and new applications and markets.
Figure A: Cirrus Logic Q3 FY26
Q3 FY26
GAAP
Adj.
Non-GAAP*
Revenue
$580.6
$580.6
Gross Profit
$308.1
$—
$308.2
Gross Margin
53.1%
53.1%
Operating Expense
$155.2
($22.2)
$133.0
Operating Income
$152.9
$22.2
$175.1
Operating Profit
26.3%
30.2%
Interest Income
$9.3
$9.3
Other Expense
$0.2
$0.2
Income Tax Expense
$22.1
$5.8
$28.0
Net Income
$140.3
$16.4
$156.7
Diluted EPS
$2.66
$0.31
$2.97
*Complete GAAP to Non-GAAP reconciliations available on page 10
Numbers may not sum due to rounding
$ millions, except EPS
Revenue and Gross Margin
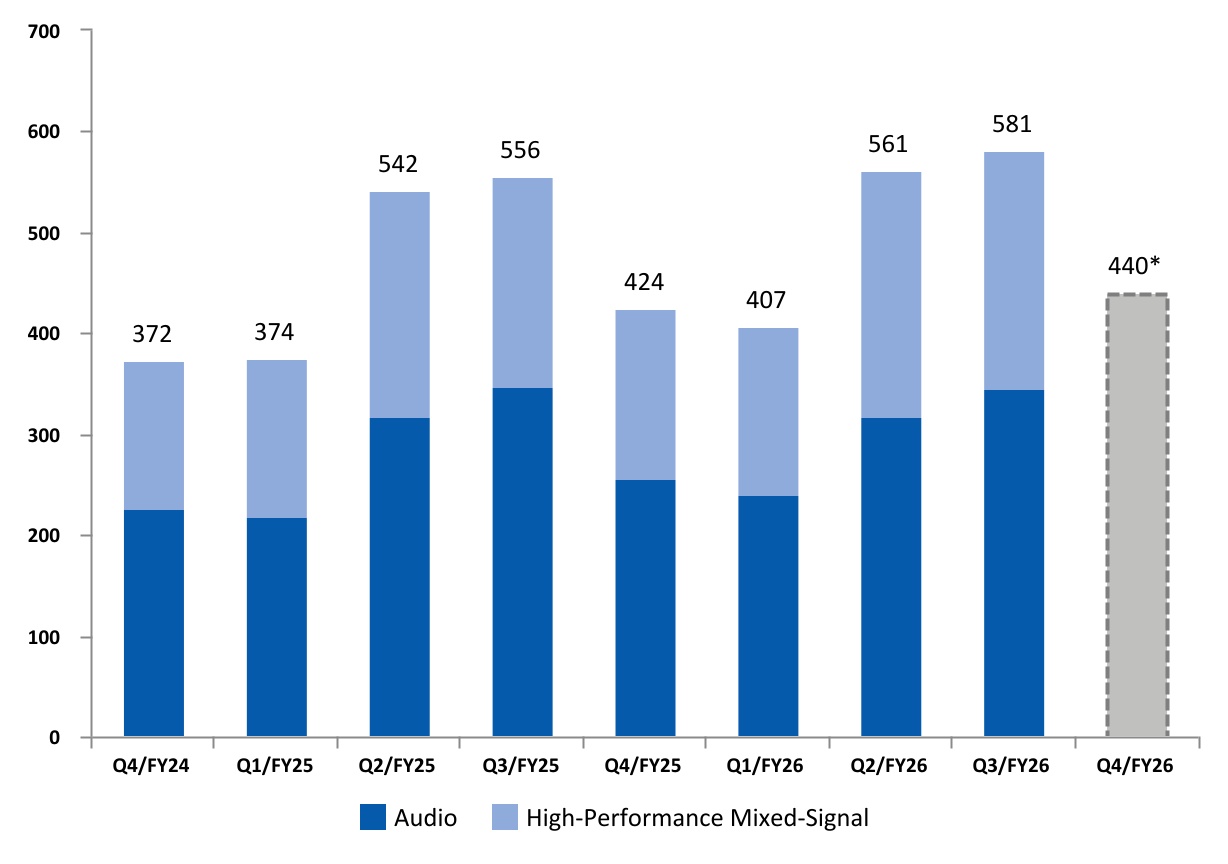
Revenue for the December quarter was $580.6 million, which is up four percent quarter over quarter and year over year. The increase in revenue on a sequential basis reflects higher smartphone unit volumes. This was partially offset by a decline in general market sales. The year-over-year increase was primarily driven by higher smartphone unit volumes. This was partially offset by previously anticipated pricing reductions and lower general market sales. In the March quarter, we expect revenue to range from $410 million to $470 million, down 24 percent sequentially and up four percent year over year at the midpoint.
Q3 FY26 Letter to Shareholders
2
In Q3 FY26, revenue derived from our audio and high-performance mixed-signal (HPMS) product lines represented 59 percent and 41 percent of total revenue, respectively. One customer contributed approximately 94 percent of total revenue in Q3 FY26. Our relationship with our largest customer remains outstanding, with continued strong design activity across a wide range of products. While we understand there is intense interest in this customer, in accordance with our policy, we do not discuss specifics about this business.
GAAP gross margin in the December quarter was 53.1 percent, compared to 52.5 percent in Q2 FY26 and 53.6 percent in Q3 FY25. Non-GAAP gross margin in the December quarter was 53.1 percent, compared to 52.5 percent in Q2 FY26 and 53.6 percent in Q3 FY25. On a quarter-over-quarter basis, the increase reflects the benefit of a reduction in inventory reserves and, to a lesser extent, supply chain efficiencies. On a year-over-year basis, the decrease in gross margin was largely due to the impact of previously anticipated pricing reductions, which were mostly offset by cost reductions. In the March quarter, we expect gross margin to range from 51 percent to 53 percent.
Operating Profit, Tax, and EPS
Operating profit for Q3 FY26 was 26.3 percent on a GAAP basis and 30.2 percent on a non-GAAP basis. GAAP operating expense was $155.2 million and included $20.5 million in stock-based compensation and
Q3 FY26 Letter to Shareholders
3
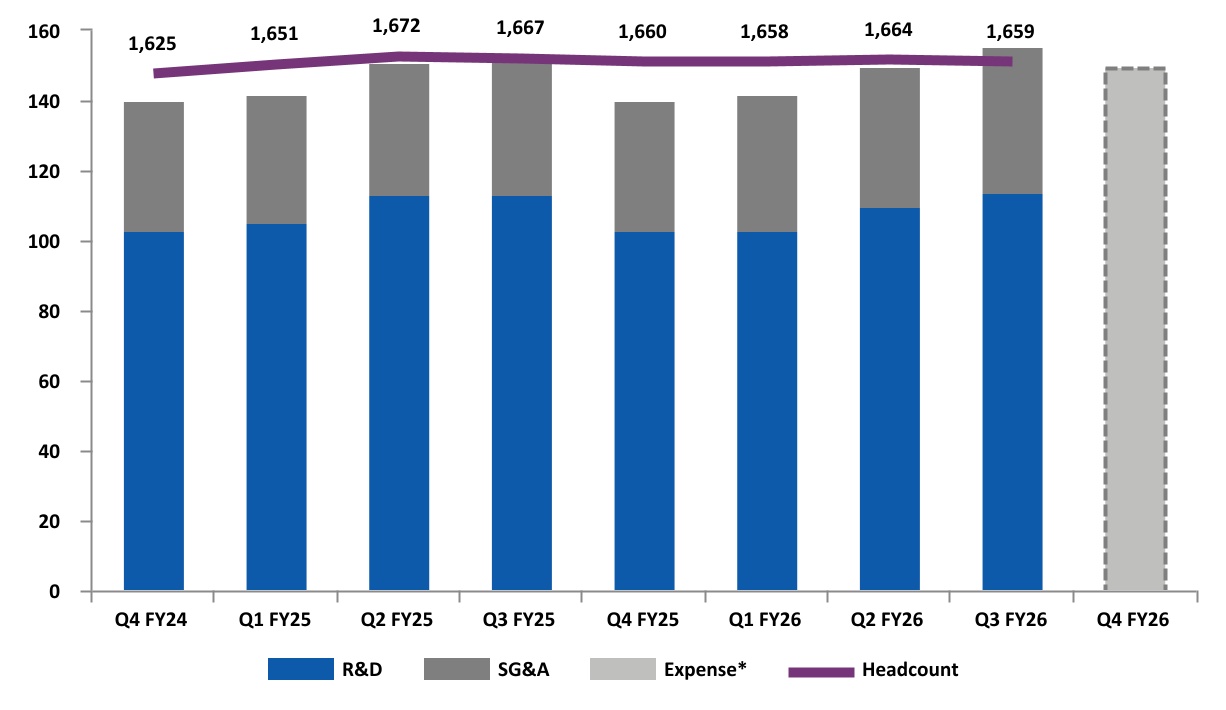
$1.6 million in amortization of acquisition intangibles. On a sequential basis, GAAP operating expense increased by $5.6 million, primarily driven by higher employee-related expenses. This was partially offset by lower product development costs, largely associated with the timing of tape outs. On a year-over-year basis, GAAP operating expense increased by $3.2 million largely due to higher employee-related expenses and, to a lesser extent, professional expenses. This was partially offset by a decrease in product development costs associated with lower wafer and tape out expenses. Non-GAAP operating expense for the quarter was $133.0 million, up $5.3 million sequentially and $3.8 million year over year. The company’s total headcount exiting Q3 was 1,659.
Combined GAAP R&D and SG&A expenses for Q4 FY26 are expected to range from $147 million to $153 million, including approximately $21 million in stock-based compensation expense and $2 million in amortization of acquisition intangibles, resulting in a non-GAAP operating expense range between $124 million and $130 million.
Figure C: GAAP R&D and SG&A Expenses ($M)/Headcount Q4 FY24 to Q4 FY26
*Reflects midpoint of combined R&D and SG&A guidance as of February 3, 2026
For the December quarter, GAAP tax expense was $22.1 million on GAAP pre-tax income of $162.4 million, resulting in an effective tax rate of 13.6 percent. Non-GAAP tax expense for the quarter was $28.0 million on non-GAAP pre-tax income of $184.7 million, resulting in a non-GAAP effective tax rate of 15.1 percent. Both the GAAP and non-GAAP effective tax rates reflect the ongoing beneficial impact of the One Big Beautiful Bill Act, which reinstated the immediate tax deductibility of U.S. R&D expenditures, among other provisions. We estimate that our FY26 non-GAAP effective tax rate will range from approximately 16 percent to 18 percent.
Q3 FY26 Letter to Shareholders
4
GAAP earnings per share for the December quarter was $2.66, compared to earnings per share of $2.48 in the prior quarter and $2.11 in Q3 FY25. Non-GAAP earnings per share for the December quarter was $2.97, versus $2.83 in Q2 FY26 and $2.51 in Q3 FY25.
Balance Sheet
Our cash and investment balance at the end of Q3 FY26 was $1.08 billion, up from $896.0 million in the prior quarter and $816.6 million in Q3 FY25. Cash flow from operations for the December quarter was $290.8 million. During the quarter, we repurchased 591,423 shares at an average price of $118.33, returning $70.0 million of cash to shareholders in the form of buybacks. At the end of Q3 FY26, the company had $344.1 million remaining in its share repurchase authorization. Over the long term, we expect strong cash flow generation, and we will continue to evaluate potential uses of this cash, including investing in the business to pursue organic growth opportunities, M&A, and returning capital to shareholders through share repurchases. Q3 FY26 inventory was $189.5 million, down from $236.4 million in Q2 FY26.
Company Strategy
We remain committed to a three-pronged strategy for growing our business: first, maintaining our leadership position in smartphone audio; second, increasing HPMS content in smartphones; and third, leveraging our strength in audio and HPMS to expand into additional applications and markets with both existing and new components.
Smartphones
In smartphones, demand for our latest-generation custom boosted amplifier and 22-nanometer smart codec remained robust during the quarter. These products are based on innovative new architectures that are designed to enable system-level improvements with each new smartphone generation, extending our product lifecycles, while also providing longer-term visibility and sustained revenue contribution. Beyond audio, we are excited about our opportunities to expand our value in smartphones through HPMS solutions. Customer engagement with our camera controllers remains strong, and the features they help enable have been very well received. Through our close engineering collaboration, which has delivered multiple generations of camera controllers, we believe our technology roadmap is well-suited to address future opportunities. We see an exciting path for innovation and are actively developing next-generation components to deliver enhanced features, improved performance, and greater system efficiency. We also continue to invest R&D dollars in intellectual property and capabilities around advanced battery and power applications, and we have a number of programs underway that aim to enhance overall battery performance, health, and longevity. Customer interest in this technology has been encouraging, and we are actively pursuing sockets where we can deliver more efficient and flexible solutions through the integration of digital processing and control alongside analog circuits. Looking ahead, we believe our investments will drive product diversification, expand our footprint, and support long-term revenue growth across the HPMS portfolio.
New Applications and Markets
Outside of smartphones, we are leveraging our intellectual property and engineering capabilities to expand into new applications and markets, with PCs remaining our most immediate opportunity. Design
Q3 FY26 Letter to Shareholders
5
activity across our PC portfolio was strong, and we expect a variety of devices featuring our components to launch in the coming quarters, including mainstream platforms that use our latest-generation amplifier and codec. The company is executing on our plan to expand our footprint in mainstream laptops to pursue higher-volume opportunities and capture a larger share of our serviceable addressable market. To address the increasing importance of voice as an interface for AI-enabled PCs, we are developing new products that enhance voice and audio capture functionality in a variety of modes and/or configurations, including ultra-low-power sleep modes. The first product with this technology is now sampling, and we are seeing strong interest from several leading OEMs and PC platform vendors. Finally, we were excited to see multiple customer products introduced at CES that use a variety of our amplifiers, codecs, and haptic drivers. These product launches included our first win with a new customer in their high-end laptop platform that features up to six Cirrus Logic amplifiers and our latest-generation codec. We are pleased with our progress in PCs and remain focused on growing our overall market share in the years ahead.
The company is also investing in general market products that span a large number of customers across the professional audio, automotive, industrial, and imaging end markets, as they typically have long product lifecycles and gross margins that are well above our corporate average. During the quarter, we saw strong design momentum with our latest-generation ADCs, DACs, and ultra-high-performance audio codec, and expect end products utilizing these components to come to market over the next year. We also began sampling a new prosumer audio product family in this portfolio that broadens our addressable market by delivering solutions that span more tiers and categories of our customers’ products. Furthermore, we recently announced a new series of automotive haptic components that are designed to consistently deliver a range of tactile responses in real time for applications across a wide range of in-cabin interfaces. Although we are in the early stages of participation in the automotive haptic market, we believe this represents an important growth opportunity for Cirrus Logic as more vehicles transition from traditional buttons to touch-based interfaces. Looking ahead, we plan to further expand our portfolio of general market products by applying our advanced low-power signal processing and mixed-signal design expertise to drive growth in new applications and markets.
Summary and Guidance
For the March quarter, we expect the following results:
•Revenue to range between $410 million and $470 million;
•GAAP gross margin to be between 51 percent and 53 percent; and
•Combined GAAP R&D and SG&A expenses to range between $147 million and $153 million, including approximately $21 million in stock-based compensation expense and $2 million in amortization of acquisition intangibles, resulting in a non-GAAP operating expense range between $124 million and $130 million.
In conclusion, we delivered outstanding financial results for Q3 FY26. During the quarter, we experienced robust demand for our components shipping into smartphones, advanced our efforts to grow our PC business, and gained traction in other applications within our general market business. With a consistent track record of innovation and disciplined execution, we are excited about the opportunities to drive long-term growth across our business and deliver shareholder value.
Q3 FY26 Letter to Shareholders
6
Sincerely,
John Forsyth
President &
Chief Executive Officer
Jeff Woolard
Chief Financial Officer
Conference Call Q&A Session
Cirrus Logic will host a live Q&A session at 5 p.m. ET today to answer questions related to its financial results and business outlook. Participants may listen to the conference call on the Cirrus Logic website. A replay of the webcast can be accessed on the Cirrus Logic website.
Use of Non-GAAP Financial Information
To supplement Cirrus Logic's financial statements presented on a GAAP basis, Cirrus has provided non-GAAP financial information, including non-GAAP net income, diluted earnings per share, operating income and profit, operating expenses, gross margin and profit, tax expense, tax expense impact on earnings per share, effective tax rate, free cash flow, and free cash flow margin. A reconciliation of the adjustments to GAAP results is included in the tables below. We are also providing guidance on our expected non-GAAP expected effective tax rate. We are not able to provide guidance on our GAAP effective tax rate or a related reconciliation without unreasonable efforts since our future GAAP effective tax rate depends on our future stock price and related stock-based compensation information that is not currently available.
Non-GAAP financial information is not meant as a substitute for GAAP results but is included because management believes such information is useful to our investors for informational and comparative purposes. In addition, certain non-GAAP financial information is used internally by management to evaluate and manage the company. The non-GAAP financial information used by Cirrus Logic may differ from that used by other companies. These non-GAAP measures should be considered in addition to, and not as a substitute for, the results prepared in accordance with GAAP.
Safe Harbor Statement
Except for historical information contained herein, the matters set forth in this shareholder letter contain forward-looking statements, including statements about our belief that a new prosumer audio product family expands our addressable market; our expectation that a new family of automotive haptic components represents an important growth opportunity for Cirrus Logic in the coming years; our expectations for strong cash flow generation over the long term; our ability to leverage our mixed-signal design and signal processing expertise to drive profitable growth in both existing and new applications and markets; our ability to maintain our leadership position in smartphone audio; our ability to increase
Q3 FY26 Letter to Shareholders
7
HPMS content in smartphones; our ability to leverage our strength in audio and HPMS to expand into additional applications and markets with both new and existing components; our expectation that our latest-generation custom boosted amplifier and 22-nanometer smart codec are designed to enable system-level improvements with each new smartphone generation, extending our product lifecycles, while also providing longer-term visibility and sustained revenue contribution; our ability to expand our value in smartphones through HPMS solutions; our belief that our camera controller technology roadmap is well suited to address future opportunities; our ability to develop next-generation components that deliver enhanced features, improved performance, and greater system efficiency; our ability to deliver more efficient and flexible battery and power solutions through the integration of digital processing and control alongside analog circuits; our ability to drive product diversification, expand our footprint, and support long-term revenue growth across the HPMS portfolio; our ability to leverage our intellectual property and engineering capabilities to expand into new applications and markets; our expectation that a variety of PCs featuring our components will launch in the coming quarters, including mainstream platforms that use our latest-generation amplifier and codec; our ability to execute on our plan to expand our footprint in mainstream laptops to pursue higher-volume opportunities and capture a larger share of our serviceable addressable market; our ability to develop new products that enhance voice and audio capture functionality in a variety of modes and/or configurations, including ultra-low power sleep modes; our ability to grow our overall market share in PCs in the years ahead; our expectation that end products using our latest-generation general market ADCs, DACs, and ultra-high-performance audio codec will come to market over the next year; our ability to further expand our portfolio of general market products by applying our advanced low-power signal processing and mixed-signal design expertise to drive growth in new applications and markets; our ability to drive long-term growth across our business and deliver shareholder value; our non-GAAP effective tax rate for the full fiscal year 2026; and our forecasts for the fourth quarter of fiscal year 2026 revenue, gross margin, combined research and development and selling, general and administrative expense levels, stock-based compensation expense, and amortization of acquisition intangibles. In some cases, forward-looking statements are identified by words such as “emerge,” “expect,” “anticipate,” “foresee,” “target,” “project,” “believe,” “goals,” “opportunity,” “estimates,” “intend,” “will,” and variations of these types of words and similar expressions. In addition, any statements that refer to our plans, expectations, strategies, or other characterizations of future events or circumstances are forward-looking statements. These forward-looking statements are based on our current expectations, estimates, and assumptions and are subject to certain risks and uncertainties that could cause actual results to differ materially, and readers should not place undue reliance on such statements. These risks and uncertainties include, but are not limited to, the following: the level and timing of orders and shipments during the fourth quarter of fiscal year 2026, customer cancellations of orders, or the failure to place orders consistent with forecasts; changes in government trade policies, including the imposition of tariffs and export restrictions; global economic conditions and uncertainty; and the risk factors listed in our Form 10-K for the year ended March 29, 2025 and in our other filings with the Securities and Exchange Commission, which are available at www.sec.gov. The foregoing information concerning our business outlook represents our outlook as of the date of this news release, and we expressly disclaim any obligation to update or revise any forward-looking statements, whether as a result of new developments or otherwise.
Cirrus Logic, Cirrus and the Cirrus Logic logo are registered trademarks of Cirrus Logic, Inc. All other company or product names noted herein may be trademarks of their respective holders.
Q3 FY26 Letter to Shareholders
8
Summary of Financial Data Below:
CONSOLIDATED CONDENSED STATEMENT OF OPERATIONS
(in thousands, except per share data; unaudited)
Three Months Ended
Nine Months Ended
Dec. 27, 2025
Sep. 27, 2025
Dec. 28, 2024
Dec. 27, 2025
Dec. 28, 2024
Q3'26
Q2'26
Q3'25
Q3'26
Q3'25
Audio
$
344,455
$
318,214
$
346,272
$
902,713
$
881,830
High-Performance Mixed-Signal
236,169
242,746
209,466
646,143
589,791
Net sales
580,624
560,960
555,738
1,548,856
1,471,621
Cost of sales
272,498
266,586
257,951
732,326
702,319
Gross profit
308,126
294,374
297,787
816,530
769,302
Gross margin
53.1
%
52.5
%
53.6
%
52.7
%
52.3
%
Research and development
113,553
110,021
112,976
326,466
331,264
Selling, general and administrative
41,646
39,589
39,042
119,979
113,625
Total operating expenses
155,199
149,610
152,018
446,445
444,889
Income from operations
152,927
144,764
145,769
370,085
324,413
Interest income
9,276
8,695
8,146
26,593
24,482
Other income (expense)
246
(63)
(214)
(205)
1,414
Income before income taxes
162,449
153,396
153,701
396,473
350,309
Provision for income taxes
22,139
21,800
37,696
63,870
90,069
Net income
$
140,310
$
131,596
$
116,005
$
332,603
$
260,240
Basic earnings per share
$
2.75
$
2.57
$
2.19
$
6.48
$
4.89
Diluted earnings per share:
$
2.66
$
2.48
$
2.11
$
6.27
$
4.69
Weighted average number of shares:
Basic
51,037
51,175
53,081
51,313
53,263
Diluted
52,698
53,054
55,076
53,041
55,529
Prepared in accordance with Generally Accepted Accounting Principles
Q3 FY26 Letter to Shareholders
9
RECONCILIATION BETWEEN GAAP AND NON-GAAP FINANCIAL INFORMATION
(in thousands, except per share data; unaudited)
(not prepared in accordance with GAAP)
Non-GAAP financial information is not meant as financial information is not meant as a substitute for GAAP results, but is included because management believes such information is useful to our investors for informational and comparative purposes. In addition, certain non-GAAP financial information is used internally by management to evaluate and manage the company. As a note, the non-GAAP financial information used by Cirrus Logic may differ from that used by other companies. These non-GAAP measures should be considered in addition to, and not as a substitute for, the results prepared in accordance with GAAP.
Three Months Ended
Nine Months Ended
Dec. 27, 2025
Sep. 27, 2025
Dec. 28, 2024
Dec. 27, 2025
Dec. 28, 2024
Net Income Reconciliation
Q3'26
Q2'26
Q3'25
Q3'26
Q3'25
GAAP Net Income
$
140,310
$
131,596
$
116,005
$
332,603
$
260,240
Amortization of acquisition intangibles
1,648
1,648
1,647
4,943
5,483
Stock-based compensation expense
20,558
20,597
20,823
61,964
64,655
Lease impairment
—
—
661
—
1,680
Adjustment to income taxes
(5,818)
(3,861)
(827)
(12,518)
(6,094)
Non-GAAP Net Income
$
156,698
$
149,980
$
138,309
$
386,992
$
325,964
Earnings Per Share Reconciliation
GAAP Diluted earnings per share
$
2.66
$
2.48
$
2.11
$
6.27
$
4.69
Effect of Amortization of acquisition intangibles
0.03
0.03
0.03
0.09
0.10
Effect of Stock-based compensation expense
0.39
0.39
0.38
1.17
1.16
Effect of Lease impairment
—
—
0.01
—
0.03
Effect of Adjustment to income taxes
(0.11)
(0.07)
(0.02)
(0.23)
(0.11)
Non-GAAP Diluted earnings per share
$
2.97
$
2.83
$
2.51
$
7.30
$
5.87
Operating Income Reconciliation
GAAP Operating Income
$
152,927
$
144,764
$
145,769
$
370,085
$
324,413
GAAP Operating Profit
26.3
%
25.8
%
26.2
%
23.9
%
22.0
%
Amortization of acquisition intangibles
1,648
1,648
1,647
4,943
5,483
Stock-based compensation expense - COGS
24
363
351
687
972
Stock-based compensation expense - R&D
13,280
13,019
14,498
39,371
46,105
Stock-based compensation expense - SG&A
7,254
7,215
5,974
21,906
17,578
Lease impairment
—
—
661
—
1,680
Non-GAAP Operating Income
$
175,133
$
167,009
$
168,900
$
436,992
$
396,231
Non-GAAP Operating Profit
30.2
%
29.8
%
30.4
%
28.2
%
26.9
%
Operating Expense Reconciliation
GAAP Operating Expenses
$
155,199
$
149,610
$
152,018
$
446,445
$
444,889
Amortization of acquisition intangibles
(1,648)
(1,648)
(1,647)
(4,943)
(5,483)
Stock-based compensation expense - R&D
(13,280)
(13,019)
(14,498)
(39,371)
(46,105)
Stock-based compensation expense - SG&A
(7,254)
(7,215)
(5,974)
(21,906)
(17,578)
Lease impairment
—
—
(661)
—
(1,680)
Non-GAAP Operating Expenses
$
133,017
$
127,728
$
129,238
$
380,225
$
374,043
Gross Margin/Profit Reconciliation
GAAP Gross Profit
$
308,126
$
294,374
$
297,787
$
816,530
$
769,302
GAAP Gross Margin
53.1
%
52.5
%
53.6
%
52.7
%
52.3
%
Stock-based compensation expense - COGS
24
363
351
687
972
Non-GAAP Gross Profit
$
308,150
$
294,737
$
298,138
$
817,217
$
770,274
Non-GAAP Gross Margin
53.1
%
52.5
%
53.6
%
52.8
%
52.3
%
Effective Tax Rate Reconciliation
GAAP Tax Expense
$
22,139
$
21,800
$
37,696
$
63,870
$
90,069
GAAP Effective Tax Rate
13.6
%
14.2
%
24.5
%
16.1
%
25.7
%
Adjustments to income taxes
5,818
3,861
827
12,518
6,094
Non-GAAP Tax Expense
$
27,957
$
25,661
$
38,523
$
76,388
$
96,163
Non-GAAP Effective Tax Rate
15.1
%
14.6
%
21.8
%
16.5
%
22.8
%
Tax Impact to EPS Reconciliation
GAAP Tax Expense
$
0.42
$
0.41
$
0.68
$
1.20
$
1.62
Adjustments to income taxes
0.11
0.07
0.02
0.23
0.11
Non-GAAP Tax Expense
$
0.53
$
0.48
$
0.70
$
1.43
$
1.73
Q3 FY26 Letter to Shareholders
10
CONSOLIDATED CONDENSED BALANCE SHEET
(in thousands; unaudited)
Dec. 27, 2025
Mar. 29, 2025
Dec. 28, 2024
ASSETS
Current assets
Cash and cash equivalents
$
778,083
$
539,620
$
526,444
Marketable securities
44,280
56,160
37,535
Accounts receivable, net
278,989
216,009
261,943
Inventories
189,483
299,092
275,558
Prepaid assets
54,373
48,236
51,323
Prepaid wafers
32,873
52,560
66,113
Other current assets
31,268
28,057
31,534
Total current Assets
1,409,349
1,239,734
1,250,450
Long-term marketable securities
259,564
239,036
252,594
Right-of-use lease assets
123,432
126,688
129,597
Property and equipment, net
148,352
159,900
163,837
Intangibles, net
22,619
27,461
23,957
Goodwill
435,936
435,936
435,936
Deferred tax asset
38,247
48,150
40,895
Long-term prepaid wafers
—
15,512
23,020
Other assets
19,021
34,656
42,954
Total assets
$
2,456,520
$
2,327,073
$
2,363,240
LIABILITIES AND STOCKHOLDERS' EQUITY
Current liabilities
Accounts payable
$
68,863
$
63,162
$
77,907
Accrued salaries and benefits
49,769
52,075
48,029
Software license agreements
26,803
26,745
26,985
Lease liability
19,713
21,811
21,858
Other accrued liabilities
19,043
31,395
36,134
Total current liabilities
184,191
195,188
210,913
Non-current lease liability
117,599
121,908
124,622
Non-current income taxes
46,033
44,040
43,401
Other long-term liabilities
5,468
16,488
21,506
Total long-term liabilities
169,100
182,436
189,529
Stockholders' equity:
Capital stock
1,925,238
1,860,281
1,840,791
Accumulated earnings
178,693
90,351
124,101
Accumulated other comprehensive loss
(702)
(1,183)
(2,094)
Total stockholders' equity
2,103,229
1,949,449
1,962,798
Total liabilities and stockholders' equity
$
2,456,520
$
2,327,073
$
2,363,240
Prepared in accordance with Generally Accepted Accounting Principles
Q3 FY26 Letter to Shareholders
11
CONSOLIDATED CONDENSED STATEMENT OF CASH FLOWS
(in thousands; unaudited)
Three Months Ended
Dec. 27,
Dec. 28,
2025
2024
Q3'26
Q3'25
Cash flows from operating activities:
Net income
$
140,310
$
116,005
Adjustments to reconcile net income to net cash provided by operating activities:
Depreciation and amortization
13,077
12,824
Stock-based compensation expense
20,558
20,823
Deferred income taxes
8,292
8,379
Loss on retirement or write-off of long-lived assets
—
369
Other non-cash charges
(26)
(379)
Net change in operating assets and liabilities:
Accounts receivable, net
76,408
62,155
Inventories
46,926
(3,793)
Prepaid wafers
12,183
20,411
Other assets
8,791
1,720
Accounts payable and other accrued liabilities
(30,468)
(21,556)
Income taxes payable
(5,217)
1,630
Net cash provided by operating activities
290,834
218,588
Cash flows from investing activities:
Maturities and sales of available-for-sale marketable securities
50,697
12,423
Purchases of available-for-sale marketable securities
(52,104)
(44,868)
Purchases of property, equipment and software
(5,086)
(6,687)
Investments in technology
(74)
—
Net cash used in investing activities
(6,567)
(39,132)
Cash flows from financing activities:
Net proceeds from the issuance of common stock
1,042
378
Repurchase of stock to satisfy employee tax withholding obligations
(30,722)
(29,112)
Repurchase and retirement of common stock
(69,980)
(70,037)
Net cash used in financing activities
(99,660)
(98,771)
Net increase in cash and cash equivalents
184,607
80,685
Cash and cash equivalents at beginning of period
593,476
445,759
Cash and cash equivalents at end of period
$
778,083
$
526,444
Prepared in accordance with Generally Accepted Accounting Principles
Q3 FY26 Letter to Shareholders
12
RECONCILIATION BETWEEN GAAP AND NON-GAAP FINANCIAL INFORMATION
(in thousands; unaudited)
Free cash flow, a non-GAAP financial measure, is GAAP cash flow from operations (or cash provided by operating activities) less capital expenditures. Capital expenditures include purchases of property, equipment and software as well as investments in technology, as presented within our GAAP Consolidated Condensed Statement of Cash Flows. Free cash flow margin represents free cash flow divided by revenue.
Twelve Months Ended
Three Months Ended
Dec. 27,
Dec. 27,
Sep. 27,
Jun. 28,
Mar. 29,
2025
2025
2025
2025
2025
Q3'26
Q3'26
Q2'26
Q1'26
Q4'25
Net cash provided by operating activities (GAAP)
$
629,565
$
290,834
$
92,214
$
116,131
$
130,386
Capital expenditures
(21,621)
(5,160)
(4,510)
(2,770)
(9,181)
Free Cash Flow (Non-GAAP)
$
607,944
$
285,674
$
87,704
$
113,361
$
121,205
Cash Flow from Operations as a Percentage of Revenue (GAAP)
32
%
50
%
16
%
29
%
31
%
Capital Expenditures as a Percentage of Revenue (GAAP)
1
%
1
%
1
%
1
%
2
%
Free Cash Flow Margin (Non-GAAP)
31
%
49
%
16
%
28
%
29
%
Q3 FY26 Letter to Shareholders
13
RECONCILIATION BETWEEN GAAP AND NON-GAAP FINANCIAL INFORMATION