Cirrus Logic reported record full fiscal year revenue of $2.0 billion for FY26. GAAP and non-GAAP operating profit for the full fiscal year were 23.0 percent and 27.5 percent, respectively. We also delivered record GAAP and non-GAAP earnings per share in FY26 of $7.85 and $9.26, respectively. Revenue increased five percent year-over-year, while non-GAAP earnings per share increased 23 percent. Q4 FY26 revenue was $448.5 million and GAAP and non-GAAP earnings per share were $1.56 and $1.95, respectively. Additionally, we returned $280.0 million to shareholders through share repurchases during the year. With an outstanding balance sheet that includes approximately $1.2 billion in cash and investments and no debt, we believe the company is well-positioned to pursue new opportunities that will support long-term value creation.
In FY26, we continued to execute on our three-pronged strategy to grow Cirrus Logic by maintaining our leadership in smartphone audio, increasing high-performance mixed-signal (HPMS) content in smartphones, and leveraging our audio and HPMS expertise and intellectual property to expand into additional applications and markets.
In smartphones, we experienced robust demand for our latest custom boosted amplifier and 22-nanometer smart codec, both of which deliver meaningful system-level improvements and exceptional audio performance. The company advanced our HPMS strategy by beginning the development of next-generation camera controller components and technologies. We also made excellent progress in advanced battery and power applications, where we validated multiple new technologies and intellectual property in silicon. Our achievements were underscored by a recent announcement from our largest customer that highlights our collaboration on a solution to support Face ID implementations in future products. We are designing our first product in this area, a smart power IC, which represents an exciting new application space for Cirrus Logic. Additionally, we recently joined our largest customer’s American Manufacturing Program and are working with both our customer and GlobalFoundries to develop new process technologies for our products, including efforts to manufacture for the first time in their Malta, New York facility.
Beyond smartphones, we made considerable progress in FY26 implementing our strategy to expand into new applications and markets. We achieved strong year-over-year revenue growth in PCs as we gained share across all PC segments. The introduction of new amplifiers and codecs that target a wider range of platforms and AI-enabled PCs has positioned the company well for strong growth in FY27. And in our general market business, we developed multiple new product families that broaden our presence in the professional audio, automotive, industrial, and imaging end markets.
In conclusion, we are extremely proud of our execution in FY26. We delivered record financial results, broadened our engagement with our largest customer, advanced our plan to drive application and market diversification, and positioned the company for an exciting future across many fronts. We would like to thank all of our employees worldwide for the hard work, customer focus and commitment to excellence they show daily, and all of our customers for the trust and support they place in Cirrus Logic.
Q4 and Full Fiscal Year 2026 Letter to Shareholders
2
Figure A: Cirrus Logic Q4 FY26 and Full Fiscal Year 2026 Results
Q4 FY26
GAAP
Adj.
Non-GAAP*
Revenue
$448.5
$448.5
Gross Profit
$237.6
$0.3
$237.9
Gross Margin
53.0%
53.0%
Operating Expense
$147.3
($21.2)
$126.1
Operating Income
$90.3
$21.5
$111.8
Operating Profit
20.1%
24.9%
Interest Income
$10.2
$10.2
Other Expense
$(0.3)
$(0.3)
Income Tax Expense
$18.5
$1.0
$19.5
Net Income
$81.8
$20.5
$102.3
Diluted EPS
$1.56
$0.39
$1.95
FY26
GAAP
Adj.
Non-GAAP*
Revenue
$1,997.4
$1,997.4
Gross Profit
$1,054.2
$1.0
$1,055.1
Gross Margin
52.8%
52.8%
Operating Expense
$593.8
($87.4)
$506.4
Operating Income
$460.4
$88.4
$548.8
Operating Profit
23.0%
27.5%
Interest Income
$36.8
$36.8
Other Expense
$(0.5)
$(0.5)
Income Tax Expense
$82.3
$13.5
$95.9
Net Income
$414.4
$74.9
$489.3
Diluted EPS
$7.85
$1.42
$9.26
*Complete GAAP to Non-GAAP reconciliations available on page 12
Numbers may not sum due to rounding
$ millions, except EPS
Revenue and Gross Margin
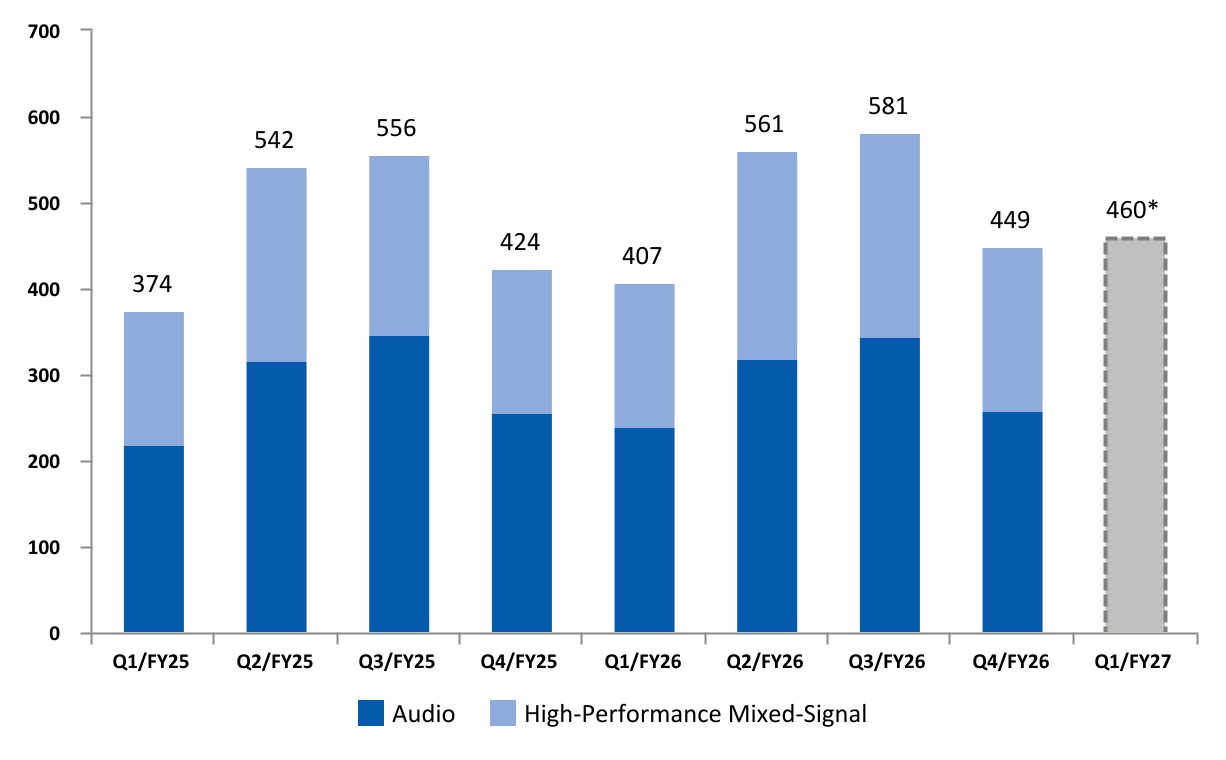
Cirrus Logic reported revenue for FY26 of $2.0 billion, up five percent year over year. The increase in full year revenue was primarily driven by demand for components shipping into smartphones, as well as higher PC sales. Revenue for the March quarter was $448.5 million, down 23 percent quarter over quarter and up six percent year over year. The sequential decline in revenue was largely driven by lower smartphone unit volumes. On a year-over-year basis, the increase in revenue was primarily driven by strong demand for components shipping into smartphones. This was partially offset by pricing reductions and, to a lesser extent, lower general market sales. In the June quarter, we expect revenue to range from $430 million to $490 million, up three percent sequentially and up 13 percent year over year at the midpoint.
In FY26, revenue derived from our audio and HPMS product lines represented 58 percent and 42 percent of total revenue, respectively. In Q4 FY26, revenue derived from our audio and HPMS product lines represented 57 percent and 43 percent of total revenue, respectively. One customer contributed approximately 91 percent of total revenue in FY26 and 92 percent of total revenue in Q4 FY26.
Q4 and Full Fiscal Year 2026 Letter to Shareholders
FY26 GAAP gross margin was 52.8 percent, compared to 52.5 percent in FY25. Non-GAAP gross margin for the full fiscal year was 52.8 percent, compared to 52.6 percent the prior year. The year-over-year increase in gross margin was due to a more favorable product mix. GAAP gross margin in the March quarter was 53.0 percent, compared to 53.1 percent in Q3 FY26 and 53.4 percent in Q4 FY25. Non-GAAP gross margin in the March quarter was 53.0 percent, compared to 53.1 percent in Q3 FY26 and 53.5 percent in Q4 FY25. On a year-over-year basis, the decline in gross margin is primarily due to higher freight expense. In the June quarter, we expect gross margin to range from 51 percent to 53 percent.
Operating Profit, Tax, and EPS
For FY26, Cirrus Logic delivered GAAP operating profit of 23.0 percent, compared to 21.6 percent the prior year. Non-GAAP operating profit was 27.5 percent, compared to 26.5 percent in FY25. GAAP operating expense for the full fiscal year was $593.8 million and included $80.8 million in stock-based compensation and $6.6 million in amortization of acquisition intangibles. GAAP operating expense in FY25 was $585.7 million and included $82.8 million in stock-based compensation, $7.1 million in amortization of acquisition intangibles, and $1.7 million in lease impairments. On a year-over-year basis, GAAP operating expense increased by $8.1 million primarily due to higher employee-related expenses. This was partially offset by a reduction in product development costs, largely due to the timing of new products. Non-GAAP operating expense for the full fiscal year was $506.4 million, up $12.3 million from $494.1 million in FY25.
Q4 and Full Fiscal Year 2026 Letter to Shareholders
4
Operating profit for Q4 FY26 was 20.1 percent on a GAAP basis and 24.9 percent on a non-GAAP basis. GAAP operating expense for the quarter was $147.3 million and included $19.6 million in stock-based compensation and $1.6 million in amortization of acquisition intangibles. On a sequential basis, GAAP operating expense decreased by $7.9 million primarily due to a reduction in variable compensation and employee-related expenses. On a year-over-year basis, GAAP operating expense increased by $6.6 million largely due to higher employee-related expenses. This was partially offset by a reduction in product development costs, primarily associated with the timing of new products. Non-GAAP operating expense for the quarter was $126.1 million, down $6.9 million sequentially and up $6.1 million year over year. The company’s total headcount exiting Q4 was 1,668.
Combined GAAP R&D and SG&A expenses for Q1 FY27 are expected to range from $155 million to $161 million, including approximately $21 million in stock-based compensation expense and $2 million in amortization of acquisition intangibles, resulting in a non-GAAP operating expense range between $132 million and $138 million. Given the considerable range of opportunities across our business discussed elsewhere in this letter, we expect R&D investment to grow in FY27.
Figure C: GAAP R&D and SG&A Expenses ($M)/Headcount Q1 FY25 to Q1 FY27
*Reflects midpoint of combined R&D and SG&A guidance as of May 6, 2026
GAAP tax expense for FY26 was $82.3 million on GAAP pre-tax income of $496.7 million, resulting in a full-year GAAP effective tax rate of 16.6 percent. Non-GAAP tax expense for FY26 was $95.9 million on non-GAAP pre-tax income of $585.1 million, resulting in a full year non-GAAP effective tax rate of 16.4 percent. For the March quarter, GAAP tax expense was $18.5 million on GAAP pre-tax income of $100.3 million, resulting in an effective tax rate of 18.4 percent. Non-GAAP tax expense for the quarter was $19.5 million on non-GAAP pre-tax income of $121.8 million, resulting in a non-GAAP effective tax rate of 16.0 percent. The GAAP and non-GAAP effective tax rates for the full fiscal year and the current quarter reflect the beneficial impact of the One Big Beautiful Bill Act’s reinstatement of immediate tax deductions for
Q4 and Full Fiscal Year 2026 Letter to Shareholders
5
U.S. R&D expenditures. We estimate that our FY27 non-GAAP effective tax rate will range from approximately 16 percent to 18 percent.
We delivered record GAAP and non-GAAP earnings per share in FY26. GAAP earnings per share was $7.85, compared to $6.00 the prior year. Non-GAAP earnings per share for the full fiscal year was $9.26, versus $7.54 in FY25. GAAP earnings per share for the March quarter was $1.56, compared to earnings per share of $2.66 the prior quarter and earnings per share of $1.31 in Q4 FY25. Non-GAAP earnings per share for the March quarter was $1.95, versus $2.97 in Q3 FY26 and $1.67 in Q4 FY25.
Balance Sheet
Our cash and investment balance at the end of FY26 was $1.2 billion, up from $834.8 million the prior year and $1.1 billion in Q3 FY26. For the full fiscal year, cash flow from operations was strong at $650.6 million. In FY26, we returned $280.0 million of cash to shareholders as we repurchased 2.5 million shares at an average price of $113.91. Cash flow from operations for the March quarter was $151.4 million. During the quarter, we repurchased 491,104 shares at an average price of $142.54, returning $70.0 million of cash to shareholders. At the end of Q4 FY26, the company had $274.1 million remaining in its share repurchase authorization. Q4 FY26 inventory was $240.9 million, up from $189.5 million in Q3 FY26.
Company Strategy
We continue to believe that our long-term growth is best served by the successful execution of three core strategic priorities: first, maintaining our leadership position in smartphone audio; second, increasing HPMS content in smartphones; and third, leveraging our strength and intellectual property in audio and HPMS to expand into additional applications and markets with both existing and new components. In FY26, we made significant progress across each of these areas.
Our stated goal of maintaining our leadership position in smartphone audio chiefly centers around the custom silicon side of our business. In FY26, we continued to experience strong demand for the latest-generation custom boosted amplifier and 22-nanometer smart codec that were first launched in customer products in FY25. Designed to deliver significant system-level improvements, including power and efficiency gains and greater architectural flexibility, we expect these components to enjoy extended product lifecycles and deliver sustained revenue contribution.
In the second of our strategic priority areas — expanding HPMS products in smartphones — we made considerable positive progress in FY26. Customer demand for our camera controllers remained strong, and engagement around our roadmap for future camera controllers was equally robust. These products continue to enhance a core part of the smartphone experience, and we are actively designing the next-generation components that will bring advanced functionality and differentiation to the camera performance of future smartphones.
We are also very pleased with our progress this year in advanced battery and power applications. In FY26, we validated new technologies and intellectual property in silicon that demonstrate our ability to enhance battery performance, health, and longevity, as well as improve efficiency for application-specific power management solutions. Moreover, our goal to expand HPMS content in smartphones has frequently been advanced by demonstrating our capabilities in components designed for other end-products, and in the past year we were excited to deliver new high-performance power solutions for both accessory and tablet devices. While we continue to pursue multiple opportunities in power, our progress in this area was
Q4 and Full Fiscal Year 2026 Letter to Shareholders
6
exemplified by our largest customer’s recent announcement that highlights our collaboration in the development of advanced mixed-signal process technologies for key applications in their future products, including Face ID. This collaboration with our largest customer is representative of the deep engineering partnership that we have cultivated over the past 20 years, which is built on outstanding execution, innovation, and trust. It also marks an exciting new application space for Cirrus Logic and we are in the design phase of our first product, a smart power IC for 3D sensing that integrates high-efficiency power delivery, precision current drive, and programmable control.
Outside of smartphones, we made significant advances in FY26 in the execution of our strategy to expand into new applications and markets. We leveraged our best-in-class intellectual property and engineering expertise to develop new general market products that are expected to enable Cirrus Logic to capture a higher share of our serviceable addressable market (SAM). In PCs, we delivered strong year-over-year revenue growth, largely driven by share gains across all platforms. Demand for our components is fueled by several industry trends: the desire for high-quality audio in thinner, lighter, and more power-efficient devices; the transition to the MIPI SoundWire® interface (SDCA); and the adoption of AI-enabled PCs. To capitalize on these opportunities in FY26, we launched our latest-generation amplifier and codec, which address a wider range of platforms and support content growth in mainstream devices. Additionally, we started production on a new codec with enhanced voice functionality and sampled another new smart codec with integrated, ultra-low-power processing to support voice as an interface for AI-enabled PCs. We believe voice will be a critical enabler for agentic interaction across many different types of edge device, including PCs, and we will continue to leverage our expertise and intellectual property in this area to deliver significant enhancements to the AI user experience. Finally, we increased our collaboration with leading PC platform vendors, which contributed to share gains in both commercial and consumer devices and positioned the company to address a larger portion of our PC SAM. Looking ahead to FY27, we are encouraged by the customer engagement and design activity across our PC business, and we anticipate strong growth to continue as the transition to SDCA accelerates and our content per device increases.
Beyond PCs, we made meaningful progress expanding our general market product portfolio in FY26 and are encouraged by the momentum we are building in this area of our business. We introduced multiple new product families that target a broad range of customers across the professional audio, automotive, industrial, and imaging end markets. These components typically benefit from long lifecycles and gross margins that are well above our corporate average, making them an attractive and strategically important contributor to our business. As we continue ramping production of our ultra-high performance audio ADCs, DACs, and codec in both professional audio and automotive applications, we are excited to have started sampling our latest family of high-performance audio converters in the December quarter. This new product family broadens our addressable market by delivering solutions that span more tiers and categories of our customers’ devices. More recently, we announced a new series of industrial imaging components that are designed for high-precision scanning systems. These new components provide advanced imaging capabilities that enable faster scan times, improve efficiency, and lower system costs. We continue to leverage our extensive intellectual property portfolio and advanced mixed-signal expertise as we execute on our vision to drive application and market diversification.
Finally, during FY26 we were delighted to be included as a part of our largest customer’s American Manufacturing Program, through which we are collaborating with both our customer and GlobalFoundries to develop new process technologies, including efforts to manufacture products for the first time at the GlobalFoundries facility in Malta, New York. Participation in this program was one of several important steps we took over the past year to advance both process and geographic diversification across our supply chain.
Q4 and Full Fiscal Year 2026 Letter to Shareholders
7
Summary and Guidance
For the June quarter we expect the following results:
•Revenue to range between $430 million and $490 million;
•GAAP gross margin to be between 51 percent and 53 percent; and
•Combined GAAP R&D and SG&A expenses to range between $155 million and $161 million, including approximately $21 million in stock-based compensation expense and $2 million in amortization of acquisition intangibles, resulting in a non-GAAP operating expense range between $132 million and $138 million.
In conclusion, we are extremely pleased to have delivered record revenue and earnings per share in FY26. This past year we made excellent progress in both our core business and market expansion initiatives. As we look ahead to FY27 and beyond, we see the strongest pipeline of opportunities in front of us in recent history, and we are excited at the potential for continued delivery of outstanding results and long-term growth.
Sincerely,
John Forsyth
President &
Chief Executive Officer
Jeff Woolard
Chief Financial Officer
Conference Call Q&A Session
Cirrus Logic will host a live Q&A session at 5 p.m. ET today to answer questions related to its financial results and business outlook. Participants may listen to the conference call on the Cirrus Logic website. A replay of the webcast can be accessed on the Cirrus Logic website.
Use of Non-GAAP Financial Information
To supplement Cirrus Logic's financial statements presented on a GAAP basis, Cirrus has provided non-GAAP financial information, including non-GAAP net income, diluted earnings per share, operating income and profit, operating expenses, gross margin and profit, tax expense, tax expense impact on earnings per share, effective tax rate, free cash flow, and free cash flow margin. A reconciliation of the adjustments to GAAP results is included in the tables below. We are also providing guidance on our expected non-GAAP effective tax rate. We are not able to provide guidance on our GAAP effective tax rate or a related reconciliation without unreasonable efforts since our future GAAP effective tax rate depends on our future stock price and related stock-based compensation information that is not currently available.
Q4 and Full Fiscal Year 2026 Letter to Shareholders
8
Non-GAAP financial information is not meant as a substitute for GAAP results but is included because management believes such information is useful to our investors for informational and comparative purposes. In addition, certain non-GAAP financial information is used internally by management to evaluate and manage the company. The non-GAAP financial information used by Cirrus Logic may differ from that used by other companies. These non-GAAP measures should be considered in addition to, and not as a substitute for, the results prepared in accordance with GAAP.
Safe Harbor Statement
Except for historical information contained herein, the matters set forth in this shareholder letter contain forward-looking statements, including statements about our ability to pursue new opportunities that will support long-term value creation; our ability to develop new process technologies for our products and advance geographic diversification across our supply chain; our ability to develop new process technologies and manufacture products for the first time at GlobalFoundries’ Malta, New York facility; our ability to grow PC revenue in FY27; our ability to execute on our strategic priorities: maintaining our leadership position in smartphone audio; increasing HPMS content in smartphones; and leveraging our strength and intellectual property in audio and HPMS to expand into additional applications and markets with both existing and new components; our expectation that our latest-generation custom boosted amplifier and 22-nanometer smart codec will have extended product lifecycles and deliver sustained revenue contribution; our ability to design next-generation camera controllers and technology that bring enhanced functionality and differentiation to the camera performance of future smartphones; our ability to enhance battery performance, health, and longevity, as well as improve efficiency for application-specific power management solutions; our ability to develop a smart power IC for 3D sensing that integrates high-efficiency power delivery, precision current drive, and programmable control; our expectation that our new general market products will enable Cirrus Logic to capture a higher share of our serviceable addressable market; our belief that voice will be a critical enabler for agentic interaction across many different types of edge device, including PCs, and our ability to leverage our expertise and intellectual property in this area to deliver significant enhancements to the AI user experience; our expectation that our content per PC will increase; our expectation that the transition to SDCA and increased content per device will drive strong growth in FY27; our expectation that our general market business will have long lifecycles and gross margins that are well above our corporate average; our belief that our latest family of high-performance audio converters broadens our addressable market; our ability to leverage our extensive intellectual property portfolio and advanced mixed-signal expertise to drive application and market diversification and long-term revenue growth; our expectation for continued delivery of outstanding results and long-term growth; our expectation that our R&D investment will grow in FY27; our non-GAAP effective tax rate for the full fiscal year 2027; and our forecasts for the first quarter of fiscal year 2027 revenue, gross margin, combined research and development and selling, general and administrative expense levels, stock-based compensation expense, and amortization of acquisition intangibles. In some cases, forward-looking statements are identified by words such as “emerge,” “expect,” “anticipate,” “foresee,” “target,” “project,” “believe,” “goals,” “opportunity,” “estimates,” “intend,” “will,” and variations of these types of words and similar expressions. In addition, any statements that refer to our plans, expectations, strategies, or other characterizations of future events or circumstances are forward-looking statements. These forward-looking statements are based on our current expectations, estimates, and assumptions and are subject to certain risks and uncertainties that could cause actual results to differ materially, and readers should not place undue reliance on such statements. These risks and uncertainties include, but are not limited to, the following: the level and timing of orders and shipments during the first quarter of fiscal year 2027, customer cancellations of orders, or the failure to place orders consistent with forecasts; or changes in government trade policies, including the imposition of tariffs and export restrictions, could have an adverse impact on our business operations and sales; changes with respect to our current expectations of future smartphone unit
Q4 and Full Fiscal Year 2026 Letter to Shareholders
9
volumes; and the risk factors listed in our Form 10-K for the year ended March 29, 2025 and in our other filings with the Securities and Exchange Commission, which are available at www.sec.gov. The foregoing information concerning our business outlook represents our outlook as of the date of this news release, and we expressly disclaim any obligation to update or revise any forward-looking statements, whether as a result of new developments or otherwise.
Cirrus Logic, Cirrus and the Cirrus Logic logo are registered trademarks of Cirrus Logic, Inc. All other company or product names noted herein may be trademarks of their respective holders.
Q4 and Full Fiscal Year 2026 Letter to Shareholders
10
Summary of Financial Data Below:
CONSOLIDATED CONDENSED STATEMENT OF OPERATIONS
(in thousands, except per share data; unaudited)
Three Months Ended
Twelve Months Ended
Mar. 28, 2026
Dec. 27, 2025
Mar. 29, 2025
Mar. 28, 2026
Mar. 29, 2025
Q4'26
Q3'26
Q4'25
Q4'26
Q4'25
Audio
$
257,220
$
344,455
$
255,326
$
1,159,933
$
1,137,157
High-Performance Mixed-Signal
191,303
236,169
169,130
837,446
758,920
Net sales
448,523
580,624
424,456
1,997,379
1,896,077
Cost of sales
210,881
272,498
197,720
943,207
900,039
Gross profit
237,642
308,126
226,736
1,054,172
996,038
Gross margin
53.0
%
53.1
%
53.4
%
52.8
%
52.5
%
Research and development
107,487
113,553
103,420
433,953
434,684
Selling, general and administrative
39,860
41,646
37,370
159,839
150,995
Total operating expenses
147,347
155,199
140,790
593,792
585,679
Income from operations
90,295
152,927
85,946
460,380
410,359
Interest income
10,248
9,276
8,604
36,841
33,086
Other income (expense)
(282)
246
55
(487)
1,469
Income before income taxes
100,261
162,449
94,605
496,734
444,914
Provision for income taxes
18,456
22,139
23,338
82,326
113,407
Net income
$
81,805
$
140,310
$
71,267
$
414,408
$
331,507
Basic earnings per share
$
1.61
$
2.75
$
1.35
$
8.10
$
6.24
Diluted earnings per share:
$
1.56
$
2.66
$
1.31
$
7.85
$
6.00
Weighted average number of shares:
Basic
50,822
51,037
52,756
51,137
53,135
Diluted
52,369
52,698
54,324
52,822
55,241
Prepared in accordance with Generally Accepted Accounting Principles
Q4 and Full Fiscal Year 2026 Letter to Shareholders
11
RECONCILIATION BETWEEN GAAP AND NON-GAAP FINANCIAL INFORMATION
(in thousands, except per share data; unaudited)
(not prepared in accordance with GAAP)
Three Months Ended
Twelve Months Ended
Mar. 28, 2026
Dec. 27, 2025
Mar. 29, 2025
Mar. 28, 2026
Mar. 29, 2025
Net Income Reconciliation
Q4'26
Q3'26
Q4'25
Q4'26
Q4'25
GAAP Net Income
$
81,805
$
140,310
$
71,267
$
414,408
$
331,507
Amortization of acquisition intangibles
1,647
1,648
1,647
6,590
7,130
Stock-based compensation expense
19,847
20,558
19,491
81,811
84,146
Lease impairment
—
—
—
—
1,680
Adjustment to income taxes
(1,020)
(5,818)
(1,772)
(13,538)
(7,866)
Non-GAAP Net Income
$
102,279
$
156,698
$
90,633
$
489,271
$
416,597
Earnings Per Share Reconciliation
GAAP Diluted earnings per share
$
1.56
$
2.66
$
1.31
$
7.85
$
6.00
Effect of Amortization of acquisition intangibles
0.03
0.03
0.03
0.12
0.13
Effect of Stock-based compensation expense
0.38
0.39
0.36
1.55
1.52
Effect of Lease impairment
—
—
—
—
0.03
Effect of Adjustment to income taxes
(0.02)
(0.11)
(0.03)
(0.26)
(0.14)
Non-GAAP Diluted earnings per share
$
1.95
$
2.97
$
1.67
$
9.26
$
7.54
Operating Income Reconciliation
GAAP Operating Income
$
90,295
$
152,927
$
85,946
$
460,380
$
410,359
GAAP Operating Profit
20.1
%
26.3
%
20.2
%
23.0
%
21.6
%
Amortization of acquisition intangibles
1,647
1,648
1,647
6,590
7,130
Stock-based compensation expense - COGS
289
24
360
976
1,332
Stock-based compensation expense - R&D
12,327
13,280
13,079
51,698
59,184
Stock-based compensation expense - SG&A
7,231
7,254
6,052
29,137
23,630
Lease impairment
—
—
—
—
1,680
Non-GAAP Operating Income
$
111,789
$
175,133
$
107,084
$
548,781
$
503,315
Non-GAAP Operating Profit
24.9
%
30.2
%
25.2
%
27.5
%
26.5
%
Operating Expense Reconciliation
GAAP Operating Expenses
$
147,347
$
155,199
$
140,790
$
593,792
$
585,679
Amortization of acquisition intangibles
(1,647)
(1,648)
(1,647)
(6,590)
(7,130)
Stock-based compensation expense - R&D
(12,327)
(13,280)
(13,079)
(51,698)
(59,184)
Stock-based compensation expense - SG&A
(7,231)
(7,254)
(6,052)
(29,137)
(23,630)
Lease impairment
—
—
—
—
(1,680)
Non-GAAP Operating Expenses
$
126,142
$
133,017
$
120,012
$
506,367
$
494,055
Gross Margin/Profit Reconciliation
GAAP Gross Profit
$
237,642
$
308,126
$
226,736
$
1,054,172
$
996,038
GAAP Gross Margin
53.0
%
53.1
%
53.4
%
52.8
%
52.5
%
Stock-based compensation expense - COGS
289
24
360
976
1,332
Non-GAAP Gross Profit
$
237,931
$
308,150
$
227,096
$
1,055,148
$
997,370
Non-GAAP Gross Margin
53.0
%
53.1
%
53.5
%
52.8
%
52.6
%
Effective Tax Rate Reconciliation
GAAP Tax Expense
$
18,456
$
22,139
$
23,338
$
82,326
$
113,407
GAAP Effective Tax Rate
18.4
%
13.6
%
24.7
%
16.6
%
25.5
%
Adjustments to income taxes
1,020
5,818
1,772
13,538
7,866
Non-GAAP Tax Expense
$
19,476
$
27,957
$
25,110
$
95,864
$
121,273
Non-GAAP Effective Tax Rate
16.0
%
15.1
%
21.7
%
16.4
%
22.5
%
Tax Impact to EPS Reconciliation
GAAP Tax Expense
$
0.35
$
0.42
$
0.43
$
1.56
$
2.05
Adjustments to income taxes
0.02
0.11
0.03
0.26
0.14
Non-GAAP Tax Expense
$
0.37
$
0.53
$
0.46
$
1.82
$
2.19
Q4 and Full Fiscal Year 2026 Letter to Shareholders
12
CONSOLIDATED CONDENSED BALANCE SHEET
(in thousands; unaudited)
Mar. 28, 2026
Dec. 27, 2025
Mar. 29, 2025
ASSETS
Current assets
Cash and cash equivalents
$
800,930
$
778,083
$
539,620
Marketable securities
86,697
44,280
56,160
Accounts receivable, net
220,149
278,989
216,009
Inventories
240,871
189,483
299,092
Prepaid assets
47,587
54,373
48,236
Prepaid wafers
14,733
32,873
52,560
Other current assets
22,741
31,268
28,057
Total current Assets
1,433,708
1,409,349
1,239,734
Long-term marketable securities
266,160
259,564
239,036
Right-of-use lease assets
120,676
123,432
126,688
Property and equipment, net
143,975
148,352
159,900
Intangibles, net
20,727
22,619
27,461
Goodwill
435,936
435,936
435,936
Deferred tax asset
49,824
38,247
48,150
Long-term prepaid wafers
—
—
15,512
Other assets
18,368
19,021
34,656
Total assets
$
2,489,374
$
2,456,520
$
2,327,073
LIABILITIES AND STOCKHOLDERS' EQUITY
Current liabilities
Accounts payable
$
80,645
$
68,863
$
63,162
Accrued salaries and benefits
52,723
49,769
52,075
Software license agreements
22,229
26,803
26,745
Lease liability
19,872
19,713
21,811
Other accrued liabilities
19,187
19,043
31,395
Total current liabilities
194,656
184,191
195,188
Non-current lease liability
114,105
117,599
121,908
Non-current income taxes
46,721
46,033
44,040
Other long-term liabilities
5,896
5,468
16,488
Total long-term liabilities
166,722
169,100
182,436
Stockholders' equity:
Capital stock
1,945,958
1,925,238
1,860,281
Accumulated earnings
184,881
178,693
90,351
Accumulated other comprehensive loss
(2,843)
(702)
(1,183)
Total stockholders' equity
2,127,996
2,103,229
1,949,449
Total liabilities and stockholders' equity
$
2,489,374
$
2,456,520
$
2,327,073
Prepared in accordance with Generally Accepted Accounting Principles
Q4 and Full Fiscal Year 2026 Letter to Shareholders
13
CONSOLIDATED CONDENSED STATEMENT OF CASH FLOWS
(in thousands; unaudited)
Three Months Ended
Mar. 28,
Mar. 29,
2026
2025
Q4'26
Q4'25
Cash flows from operating activities:
Net income
$
81,805
$
71,267
Adjustments to reconcile net income to net cash provided by operating activities:
Depreciation and amortization
13,346
13,150
Stock-based compensation expense
19,847
19,491
Deferred income taxes
(10,947)
(7,497)
Loss on retirement or write-off of long-lived assets
—
1
Other non-cash charges
(213)
(33)
Net change in operating assets and liabilities:
Accounts receivable, net
58,840
45,934
Inventories
(51,388)
(23,534)
Prepaid wafers
18,140
21,061
Other assets
6,333
11,341
Accounts payable and other accrued liabilities
10,080
(17,937)
Income taxes payable
5,577
(2,858)
Net cash provided by operating activities
151,420
130,386
Cash flows from investing activities:
Maturities and sales of available-for-sale marketable securities
34,158
9,392
Purchases of available-for-sale marketable securities
(86,172)
(13,322)
Purchases of property, equipment and software
(2,396)
(3,429)
Investments in technology
—
(5,752)
Net cash used in investing activities
(54,410)
(13,111)
Cash flows from financing activities:
Net proceeds from the issuance of common stock
875
—
Repurchase of stock to satisfy employee tax withholding obligations
(5,038)
(4,099)
Repurchase and retirement of common stock
(69,999)
(100,000)
Net cash used in financing activities
(74,162)
(104,099)
Net increase in cash and cash equivalents
22,848
13,176
Cash and cash equivalents at beginning of period
778,082
526,444
Cash and cash equivalents at end of period
$
800,930
$
539,620
Prepared in accordance with Generally Accepted Accounting Principles
Q4 and Full Fiscal Year 2026 Letter to Shareholders
14
RECONCILIATION BETWEEN GAAP AND NON-GAAP FINANCIAL INFORMATION
(in thousands; unaudited)
Free cash flow, a non-GAAP financial measure, is GAAP cash flow from operations (or cash provided by operating activities) less capital expenditures. Capital expenditures include purchases of property, equipment and software as well as investments in technology, as presented within our GAAP Consolidated Condensed Statement of Cash Flows. Free cash flow margin represents free cash flow divided by revenue.
Twelve Months Ended
Three Months Ended
Mar. 28,
Mar. 28,
Dec. 27,
Sep. 27,
Jun. 28,
2026
2026
2025
2025
2025
Q4'26
Q4'26
Q3'26
Q2'26
Q1'26
Net cash provided by operating activities (GAAP)
$
650,599
$
151,420
$
290,834
$
92,214
$
116,131
Capital expenditures
(14,836)
(2,396)
(5,160)
(4,510)
(2,770)
Free Cash Flow (Non-GAAP)
$
635,763
$
149,024
$
285,674
$
87,704
$
113,361
Cash Flow from Operations as a Percentage of Revenue (GAAP)
33
%
34
%
50
%
16
%
29
%
Capital Expenditures as a Percentage of Revenue (GAAP)
1
%
1
%
1
%
1
%
1
%
Free Cash Flow Margin (Non-GAAP)
32
%
33
%
49
%
16
%
28
%
Q4 and Full Fiscal Year 2026 Letter to Shareholders
15
RECONCILIATION BETWEEN GAAP AND NON-GAAP FINANCIAL INFORMATION
(in millions; unaudited)
(not prepared in accordance with GAAP)
Q1 FY27
Guidance
Operating Expense Reconciliation
GAAP Operating Expenses
$155 - 161
Stock-based compensation expense
(21)
Amortization of acquisition intangibles
(2)
Non-GAAP Operating Expenses
$132 - 138
Q4 and Full Fiscal Year 2026 Letter to Shareholders