Q3 2026 Results Presentation October 26, 2026
1 Forward-Looking Statements Readers should note that in addition to the historical information contained herein, this presentation contains, and future oral and written statements of the Company and its management may contain, “forward-looking statements” within the meanings of the Private Securities Litigation Reform Act of 1995, Section 27A of the Securities Act of 1933, as amended, and Section 21E of the Securities Exchange Act of 1934, as amended. Forward-looking statements generally can be identified by the use of forward-looking terminology such as “will,” “propose,” “may,” “plan,” “seek,” “expect,” “intend,” “estimate,” “anticipate,” “believe,” “continue,” or “should,” or similar terminology and the negative forms of such words. Any forward-looking statements presented herein are made only as of the date of this presentation, and the Company does not undertake any obligation to update or revise any forward-looking statements to reflect changes in assumptions, the occurrence of unanticipated events, or otherwise. Factors that could cause actual results to differ materially from these forward-looking statements include, but are not limited to: (1) the strength of the local, state, national and international economies and financial markets (including effects of inflationary pressures, global energy market conditions, the threat or implementation of tariffs, immigration enforcement and changes in foreign policy); (2) policy changes in, and the interpretation and prioritization of, local, state and federal laws, regulations and governmental policies, including executive orders; (3) the economic impact of any future terrorist threats and attacks, widespread disease or pandemics, acts of war or other threats thereof (including the Russian invasion of Ukraine, ongoing conflicts in the Middle East, and other international military conflicts that can increase levels of political and economic unpredictability, contribute to rising energy and commodity prices, affect global supply chains, increase the volatility of financial markets, and other matters beyond our control), and the response of the local, state and national governments to any such adverse external events; (4) new and revised accounting policies and practices, as may be adopted by state and federal regulatory banking agencies, the Financial Accounting Standards Board or the Public Company Accounting Oversight Board; (5) the imposition of tariffs or other governmental policies impacting the value of products produced by the Company's commercial borrowers; (6) changes in interest rates, including as a result of the recent increase in the benchmark federal funds rate by the Federal Reserve, and prepayment rates of the Company’s assets; (7) increased competition in the financial services sector, including from non- bank competitors such as credit unions, private credit firms, fintech companies, and digital asset service providers, and the inability to attract new customers; (8) technological changes implemented by us and other parties, including our third-party vendors, which may have unforeseen consequences to us and our customers; (9) emerging issues related to the development and use of artificial intelligence that could give rise to legal or regulatory action, damage our reputation or otherwise materially harm our business or customers; (10) unexpected results of acquisitions, which may include failure to realize the anticipated benefits of acquisitions and the possibility that transaction costs may be greater than anticipated, including the acquisition of CNB; (11) the loss of key executives and employees, talent shortages and employee turnover; (12) changes in consumer spending; (13) unexpected outcomes or costs of existing or new litigation or other legal proceedings and regulatory actions involving the Company; (14) the economic impact on the Company and its customers of climate change, natural disasters and of exceptional weather occurrences such as tornadoes, floods and blizzards; (15) fluctuations in the value of securities held in our securities portfolio, including as a result of changes in interest rates; (16) credit risks and risks from concentrations (by type of borrower, geographic area, collateral and industry) within our loan portfolio (including commercial real estate loans) and large loans to certain borrowers; (17) the overall health of the local and national real estate market; (18) the ability to maintain an adequate level of allowance for credit losses on loans; (19) the concentration of large deposits from certain clients who have balances above current FDIC insurance limits and who may withdraw deposits to diversify their exposure; (20) the availability of future equity and debt issuances and other capital raising opportunities on favorable terms; (21) the ability to successfully manage liquidity risk, which may increase dependence on non-core funding sources such as brokered deposits, and may negatively impact the Company’s cost of funds; (22) the level of nonperforming assets on our balance sheet; (23) interruptions involving our information technology and communications systems or those of our third-party servicers; (24) the occurrence of fraudulent activity, breaches or failures of our third-party vendors’ information security controls or cybersecurity-related incidents, including as a result of sophisticated attacks using artificial intelligence and similar tools or as a result of insider fraud; (25) the effectiveness of the Company’s risk management framework; (26) the possibility that stockholders of Tri-County Financial Group, Inc. ("Tri-County" or "TYFG") may not approve the merger agreement; (27) the risk that a condition to closing of the proposed transaction may not be satisfied, that either party may terminate the merger agreement or that the closing of the proposed transaction might be delayed or not occur at all; (28) potential adverse reactions or changes to business or employee relationships, including those resulting from the announcement or completion of the proposed transaction; (29) the diversion of management time on transaction-related issues; (30) the ultimate timing, outcome and results of integrating the operations of TYFG into those of HBT; (31) the effects of the merger in HBT’s future financial condition, results of operations, strategy and plans; (32) regulatory approvals of the transaction; and (33) the ability of the Company to manage the risks associated with the foregoing as well as anticipated. Readers should note that the forward-looking statements included in this presentation are not a guarantee of future events, and that actual events may differ materially from those made in or suggested by the forward- looking statements. Additional information concerning the Company and its business, including additional factors that could materially affect the Company’s financial results, is included in the Company’s filings with the Securities and Exchange Commission.
2 Non-GAAP Financial Measures This presentation includes certain non-GAAP financial measures. While the Company believes these are useful measures for investors, they are not presented in accordance with GAAP. You should not consider non- GAAP measures in isolation or as a substitute for the most directly comparable or other financial measures calculated in accordance with GAAP. Because not all companies use identical calculations, the presentation herein of non-GAAP financial measures may not be comparable to other similarly titled measures of other companies. Tax-equivalent adjustments assume a federal tax rate of 21% and state tax rate of 9.5%. For a reconciliation of the non-GAAP measures we use to the most closely comparable GAAP measures, see the Appendix to this presentation. Important Information and Where to Find It In connection with the proposed Tri-County transaction, HBT Financial has filed and will file materials with the SEC, including a Registration Statement on Form S-4 of HBT Financial that included a proxy statement of Tri- County and a prospectus of HBT Financial. The Registration Statement has been declared effective by the SEC, and on or about September 18, 2026, HBT Financial and Tri-County mailed a definitive proxy statement/ prospectus to the stockholders of Tri-County in connection with its special meeting of stockholders to be held on October 29, 2026. This presentation is not a substitute for the proxy statement/prospectus or the Registration Statement or for any other document that HBT Financial and Tri-County may file with the SEC and send to Tri-County’s stockholders in connection with the proposed transaction. TRI-COUNTY’S STOCKHOLDERS ARE URGED TO CAREFULLY AND THOROUGHLY READ THE PROXY STATEMENT/PROSPECTUS AND THE REGISTRATION STATEMENT, AS MAY BE AMENDED OR SUPPLEMENTED FROM TIME TO TIME, AND OTHER RELEVANT DOCUMENTS FILED BY HBT FINANCIAL AND TRI-COUNTY WITH THE SEC, BECAUSE THEY CONTAIN IMPORTANT INFORMATION ABOUT HBT FINANCIAL, TRI-COUNTY, THE PROPOSED TRANSACTION, THE RISKS RELATED THERETO AND RELATED MATTERS. Investors may obtain free copies of the Registration Statement and the definitive proxy statement/prospectus, as each may be amended from time to time, and other relevant documents filed by HBT Financial and Tri- County with the SEC (when they become available), through the website maintained by the SEC at www.sec.gov. Copies of documents filed with the SEC by HBT Financial are available free of charge from HBT Financial’s website at https://ir.hbtfinancial.com or by contacting HBT Financial’s Investor Relations Department at HBTIR@hbtbank.com. Copies of documents filed with the SEC by Tri-County are not available on Tri-County's website, but will be provided free of charge upon request. To request such documents, please call (815) 538-2265. Participants in the Proxy Solicitation HBT Financial, Tri-County and their respective directors and certain of their executive officers and other members of management and employees may be deemed, under SEC rules, to be participants in the solicitation of proxies from Tri-County’s stockholders in connection with the proposed transaction. Information regarding the executive officers and directors of HBT Financial is included in its definitive proxy statement for its 2026 annual meeting filed with the SEC on April 8, 2026. Information regarding the executive officers and directors of Tri-County and additional information regarding the persons who may be deemed participants and their direct and indirect interests, by security holdings or otherwise, is set forth in the Registration Statement and definitive proxy statement/prospectus filed, and other materials when they are filed, with the SEC in connection with the proposed transaction. Free copies of these documents may be obtained as described in the paragraphs above. No Offer or Solicitation Communications in this presentation do not constitute an offer to sell or the solicitation of an offer to subscribe for or buy any securities or a solicitation of any vote or approval with respect to the proposed transaction or otherwise, nor shall there be any sale, issuance or transfer of securities in any jurisdiction in which such offer, solicitation or sale would be unlawful prior to registration or qualification under the securities laws of any such jurisdiction.
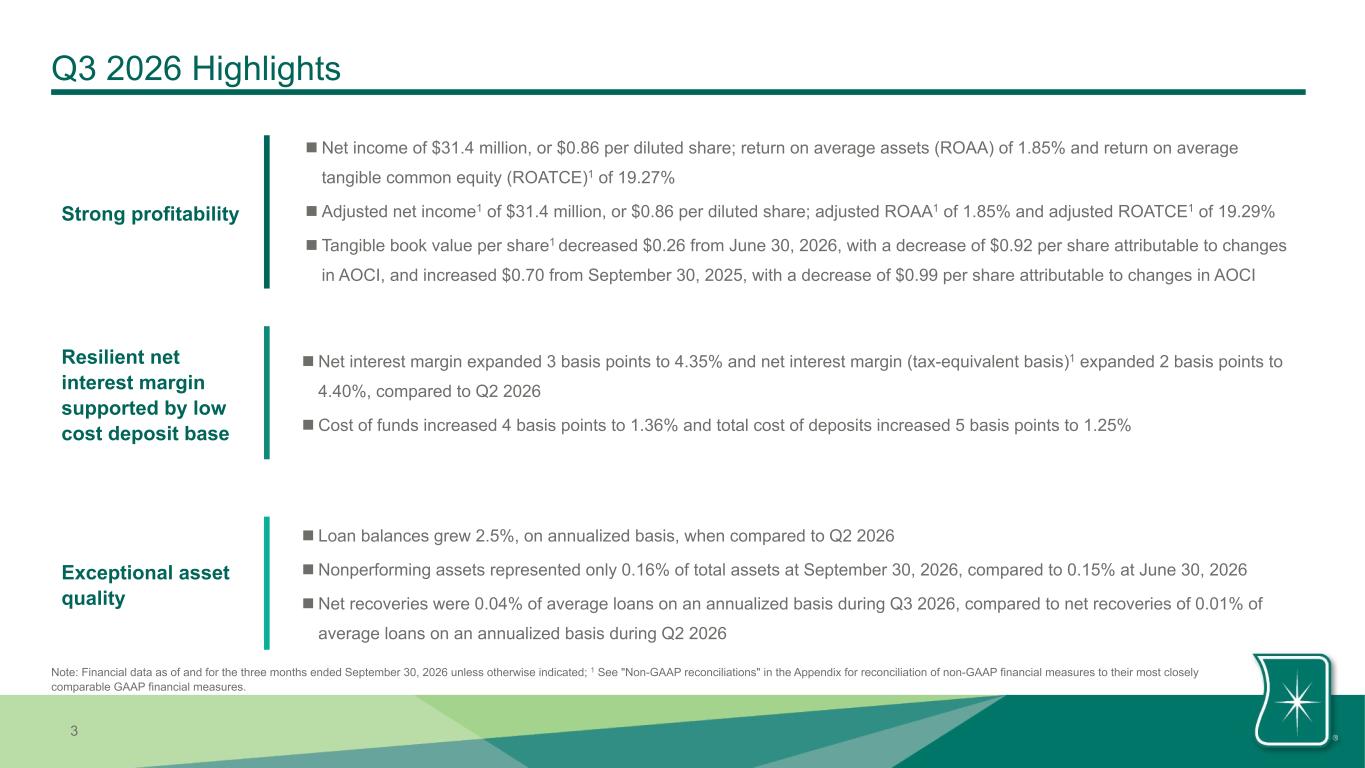
3 Exceptional asset quality Strong profitability Resilient net interest margin supported by low cost deposit base n Loan balances grew 2.5%, on annualized basis, when compared to Q2 2026 n Nonperforming assets represented only 0.16% of total assets at September 30, 2026, compared to 0.15% at June 30, 2026 n Net recoveries were 0.04% of average loans on an annualized basis during Q3 2026, compared to net recoveries of 0.01% of average loans on an annualized basis during Q2 2026 n Net income of $31.4 million, or $0.86 per diluted share; return on average assets (ROAA) of 1.85% and return on average tangible common equity (ROATCE)1 of 19.27% n Adjusted net income1 of $31.4 million, or $0.86 per diluted share; adjusted ROAA1 of 1.85% and adjusted ROATCE1 of 19.29% n Tangible book value per share1 decreased $0.26 from June 30, 2026, with a decrease of $0.92 per share attributable to changes in AOCI, and increased $0.70 from September 30, 2025, with a decrease of $0.99 per share attributable to changes in AOCI Q3 2026 Highlights Note: Financial data as of and for the three months ended September 30, 2026 unless otherwise indicated; 1 See "Non-GAAP reconciliations" in the Appendix for reconciliation of non-GAAP financial measures to their most closely comparable GAAP financial measures. n Net interest margin expanded 3 basis points to 4.35% and net interest margin (tax-equivalent basis)1 expanded 2 basis points to 4.40%, compared to Q2 2026 n Cost of funds increased 4 basis points to 1.36% and total cost of deposits increased 5 basis points to 1.25%
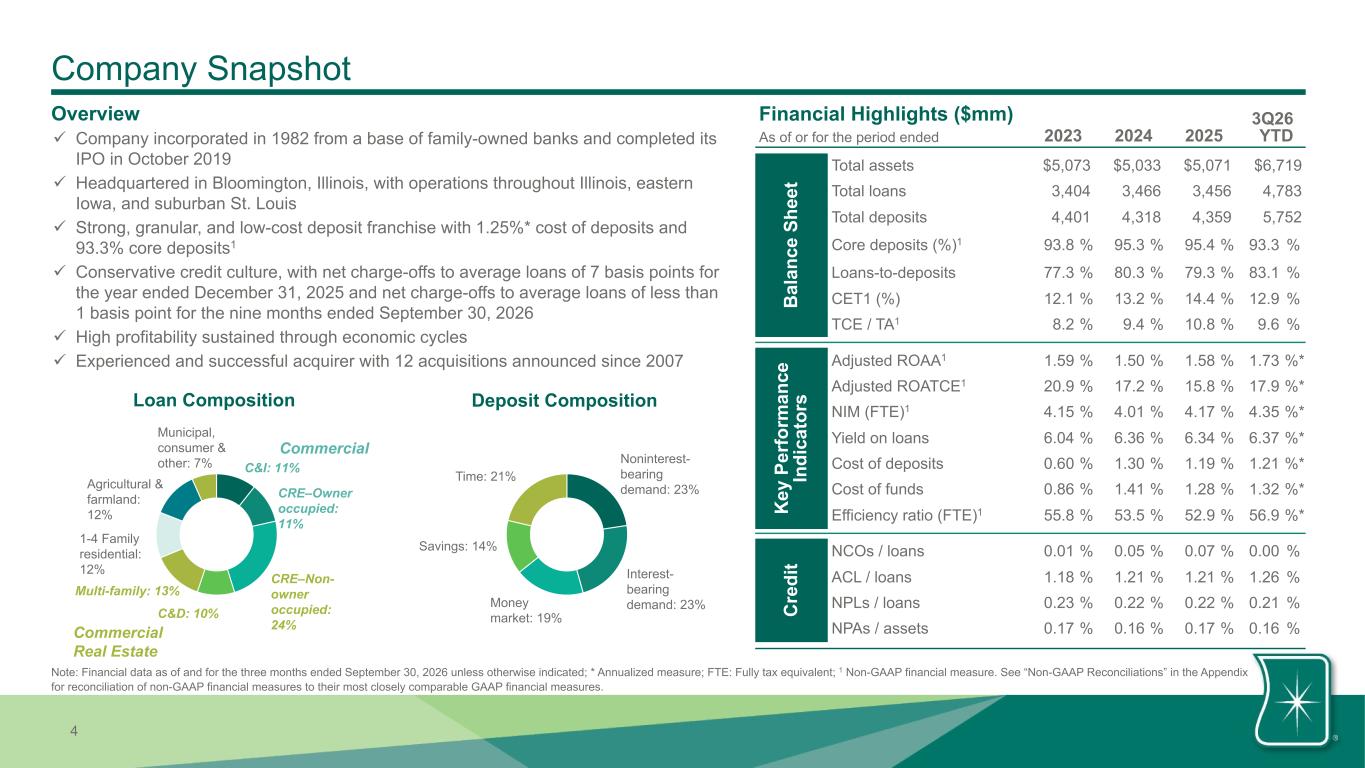
4 Company Snapshot Overview ü Company incorporated in 1982 from a base of family-owned banks and completed its IPO in October 2019 ü Headquartered in Bloomington, Illinois, with operations throughout Illinois, eastern Iowa, and suburban St. Louis ü Strong, granular, and low-cost deposit franchise with 1.25%* cost of deposits and 93.3% core deposits1 ü Conservative credit culture, with net charge-offs to average loans of 7 basis points for the year ended December 31, 2025 and net charge-offs to average loans of less than 1 basis point for the nine months ended September 30, 2026 ü High profitability sustained through economic cycles ü Experienced and successful acquirer with 12 acquisitions announced since 2007 Loan Composition Deposit Composition Noninterest- bearing demand: 23% Interest- bearing demand: 23%Money market: 19% Savings: 14% Time: 21%C&I: 11% CRE–Owner occupied: 11% CRE–Non- owner occupied: 24% C&D: 10% Multi-family: 13% 1-4 Family residential: 12% Agricultural & farmland: 12% Municipal, consumer & other: 7% Commercial Real Estate Note: Financial data as of and for the three months ended September 30, 2026 unless otherwise indicated; * Annualized measure; FTE: Fully tax equivalent; 1 Non-GAAP financial measure. See “Non-GAAP Reconciliations” in the Appendix for reconciliation of non-GAAP financial measures to their most closely comparable GAAP financial measures. Commercial Financial Highlights ($mm) 2023 2024 2025 3Q26 YTDAs of or for the period ended B al an ce S he et Total assets $5,073 $5,033 $5,071 $6,719 Total loans 3,404 3,466 3,456 4,783 Total deposits 4,401 4,318 4,359 5,752 Core deposits (%)1 93.8 % 95.3 % 95.4 % 93.3 % Loans-to-deposits 77.3 % 80.3 % 79.3 % 83.1 % CET1 (%) 12.1 % 13.2 % 14.4 % 12.9 % TCE / TA1 8.2 % 9.4 % 10.8 % 9.6 % K ey P er fo rm an ce In di ca to rs Adjusted ROAA1 1.59 % 1.50 % 1.58 % 1.73 %* Adjusted ROATCE1 20.9 % 17.2 % 15.8 % 17.9 %* NIM (FTE)1 4.15 % 4.01 % 4.17 % 4.35 %* Yield on loans 6.04 % 6.36 % 6.34 % 6.37 %* Cost of deposits 0.60 % 1.30 % 1.19 % 1.21 %* Cost of funds 0.86 % 1.41 % 1.28 % 1.32 %* Efficiency ratio (FTE)1 55.8 % 53.5 % 52.9 % 56.9 %* C re di t NCOs / loans 0.01 % 0.05 % 0.07 % 0.00 % ACL / loans 1.18 % 1.21 % 1.21 % 1.26 % NPLs / loans 0.23 % 0.22 % 0.22 % 0.21 % NPAs / assets 0.17 % 0.16 % 0.17 % 0.16 %
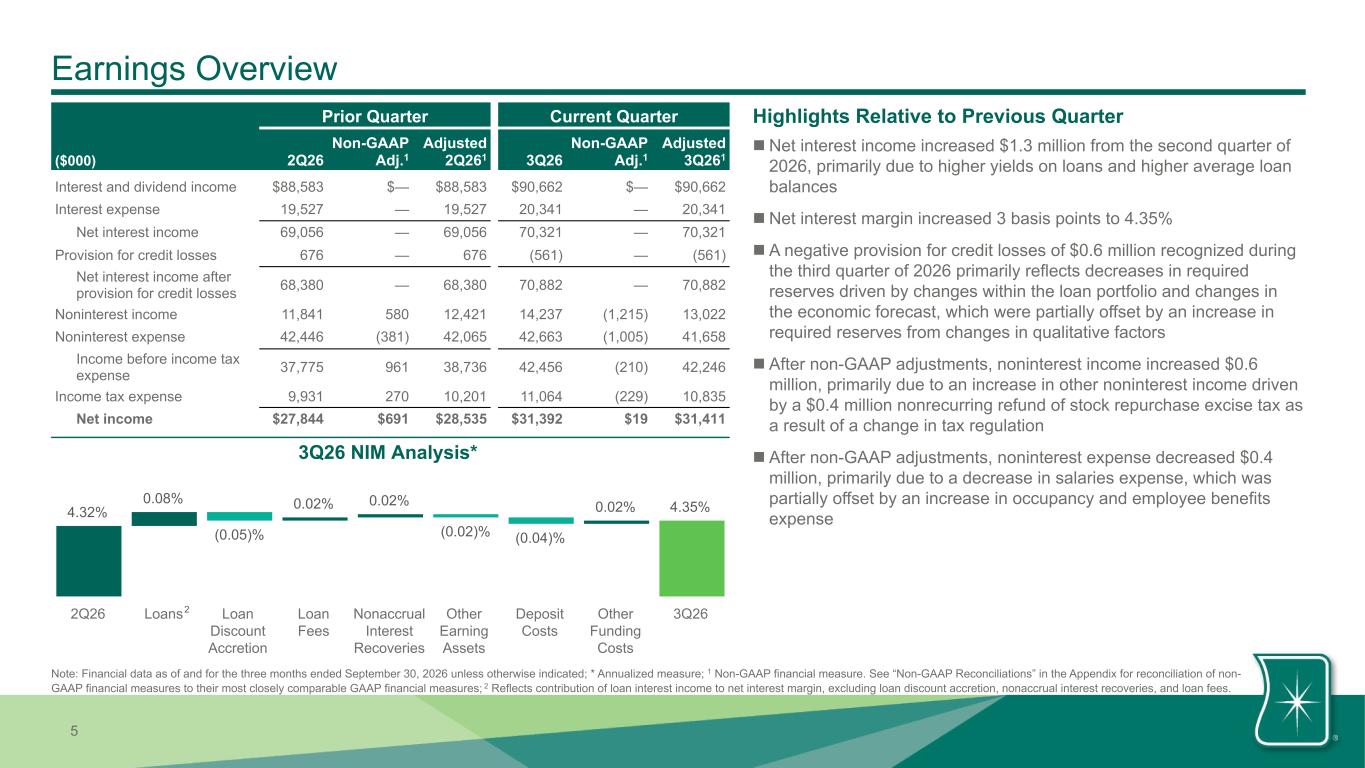
5 4.32% 0.08% (0.05)% 0.02% 0.02% (0.02)% (0.04)% 0.02% 4.35% 2Q26 Loans Loan Discount Accretion Loan Fees Nonaccrual Interest Recoveries Other Earning Assets Deposit Costs Other Funding Costs 3Q26 Earnings Overview Prior Quarter Current Quarter ($000) 2Q26 Non-GAAP Adj.1 Adjusted 2Q261 3Q26 Non-GAAP Adj.1 Adjusted 3Q261 Interest and dividend income $88,583 $— $88,583 $90,662 $— $90,662 Interest expense 19,527 — 19,527 20,341 — 20,341 Net interest income 69,056 — 69,056 70,321 — 70,321 Provision for credit losses 676 — 676 (561) — (561) Net interest income after provision for credit losses 68,380 — 68,380 70,882 — 70,882 Noninterest income 11,841 580 12,421 14,237 (1,215) 13,022 Noninterest expense 42,446 (381) 42,065 42,663 (1,005) 41,658 Income before income tax expense 37,775 961 38,736 42,456 (210) 42,246 Income tax expense 9,931 270 10,201 11,064 (229) 10,835 Net income $27,844 $691 $28,535 $31,392 $19 $31,411 Highlights Relative to Previous Quarter 2 n Net interest income increased $1.3 million from the second quarter of 2026, primarily due to higher yields on loans and higher average loan balances n Net interest margin increased 3 basis points to 4.35% n A negative provision for credit losses of $0.6 million recognized during the third quarter of 2026 primarily reflects decreases in required reserves driven by changes within the loan portfolio and changes in the economic forecast, which were partially offset by an increase in required reserves from changes in qualitative factors n After non-GAAP adjustments, noninterest income increased $0.6 million, primarily due to an increase in other noninterest income driven by a $0.4 million nonrecurring refund of stock repurchase excise tax as a result of a change in tax regulation n After non-GAAP adjustments, noninterest expense decreased $0.4 million, primarily due to a decrease in salaries expense, which was partially offset by an increase in occupancy and employee benefits expense 3Q26 NIM Analysis* Note: Financial data as of and for the three months ended September 30, 2026 unless otherwise indicated; * Annualized measure; 1 Non-GAAP financial measure. See “Non-GAAP Reconciliations” in the Appendix for reconciliation of non- GAAP financial measures to their most closely comparable GAAP financial measures; 2 Reflects contribution of loan interest income to net interest margin, excluding loan discount accretion, nonaccrual interest recoveries, and loan fees.
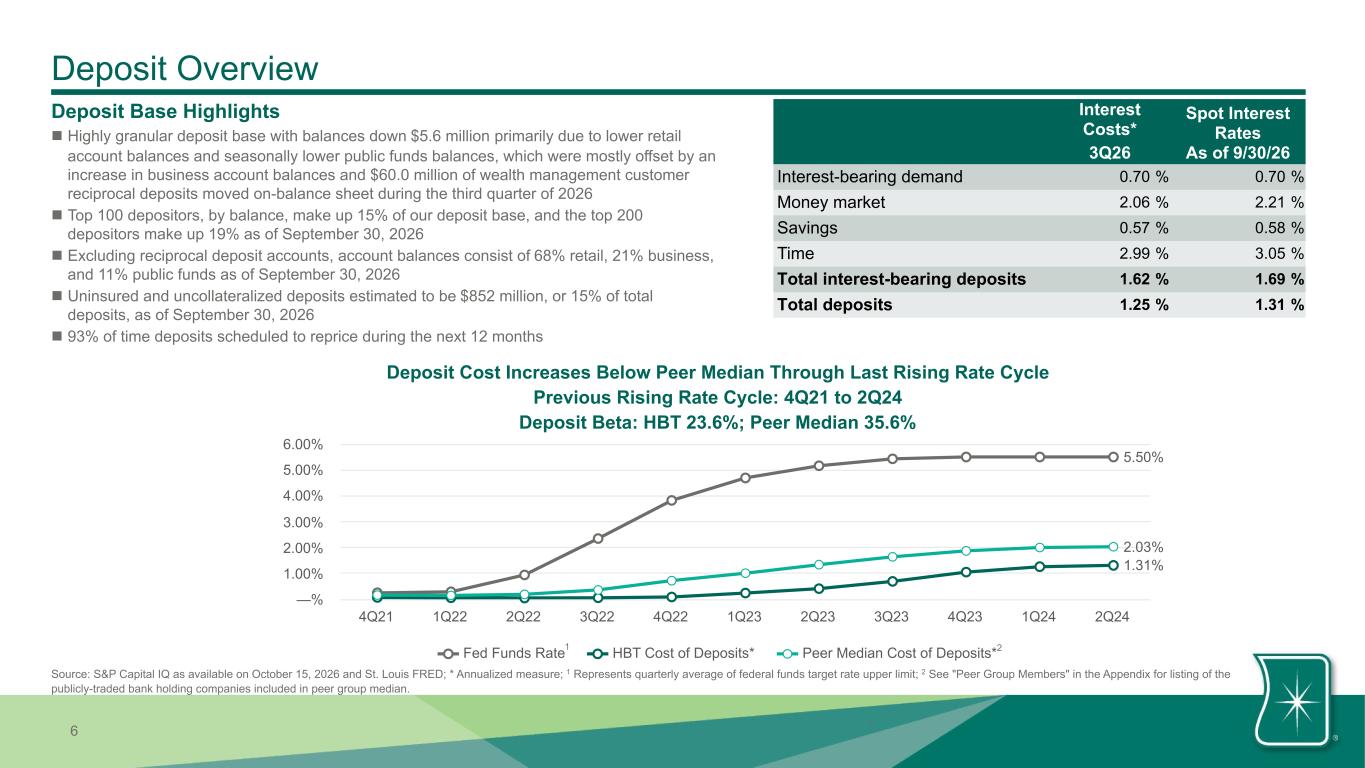
6 5.50% 1.31% 2.03% Fed Funds Rate HBT Cost of Deposits* Peer Median Cost of Deposits* 4Q21 1Q22 2Q22 3Q22 4Q22 1Q23 2Q23 3Q23 4Q23 1Q24 2Q24 —% 1.00% 2.00% 3.00% 4.00% 5.00% 6.00% Deposit Overview Deposit Base Highlights n Highly granular deposit base with balances down $5.6 million primarily due to lower retail account balances and seasonally lower public funds balances, which were mostly offset by an increase in business account balances and $60.0 million of wealth management customer reciprocal deposits moved on-balance sheet during the third quarter of 2026 n Top 100 depositors, by balance, make up 15% of our deposit base, and the top 200 depositors make up 19% as of September 30, 2026 n Excluding reciprocal deposit accounts, account balances consist of 68% retail, 21% business, and 11% public funds as of September 30, 2026 n Uninsured and uncollateralized deposits estimated to be $852 million, or 15% of total deposits, as of September 30, 2026 n 93% of time deposits scheduled to reprice during the next 12 months Interest Costs* 3Q26 Spot Interest Rates As of 9/30/26 Interest-bearing demand 0.70 % 0.70 % Money market 2.06 % 2.21 % Savings 0.57 % 0.58 % Time 2.99 % 3.05 % Total interest-bearing deposits 1.62 % 1.69 % Total deposits 1.25 % 1.31 % 1 Deposit Cost Increases Below Peer Median Through Last Rising Rate Cycle Previous Rising Rate Cycle: 4Q21 to 2Q24 Deposit Beta: HBT 23.6%; Peer Median 35.6% 1 Source: S&P Capital IQ as available on October 15, 2026 and St. Louis FRED; * Annualized measure; 1 Represents quarterly average of federal funds target rate upper limit; 2 See "Peer Group Members" in the Appendix for listing of the publicly-traded bank holding companies included in peer group median. 2
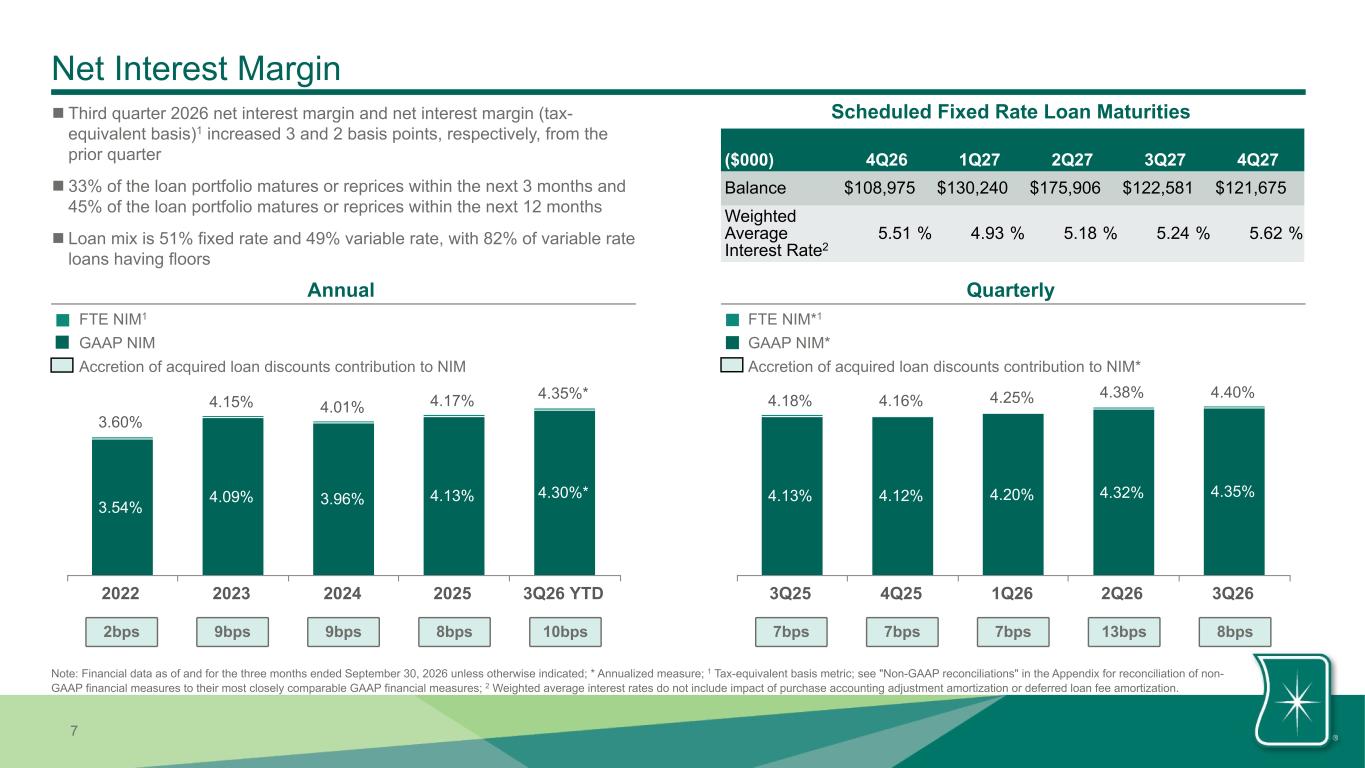
7 Net Interest Margin Annual Quarterly FTE NIM*1 GAAP NIM* Accretion of acquired loan discounts contribution to NIM* FTE NIM1 GAAP NIM Accretion of acquired loan discounts contribution to NIM 3.60% 4.15% 4.01% 4.17% 4.35%* 3.54% 4.09% 3.96% 4.13% 4.30%* 2022 2023 2024 2025 3Q26 YTD 4.18% 4.16% 4.25% 4.38% 4.40% 4.13% 4.12% 4.20% 4.32% 4.35% 3Q25 4Q25 1Q26 2Q26 3Q26 n Third quarter 2026 net interest margin and net interest margin (tax- equivalent basis)1 increased 3 and 2 basis points, respectively, from the prior quarter n 33% of the loan portfolio matures or reprices within the next 3 months and 45% of the loan portfolio matures or reprices within the next 12 months n Loan mix is 51% fixed rate and 49% variable rate, with 82% of variable rate loans having floors Scheduled Fixed Rate Loan Maturities ($000) 4Q26 1Q27 2Q27 3Q27 4Q27 Balance $ 108,975 $ 130,240 $ 175,906 $ 122,581 $ 121,675 Weighted Average Interest Rate2 5.51 % 4.93 % 5.18 % 5.24 % 5.62 % Note: Financial data as of and for the three months ended September 30, 2026 unless otherwise indicated; * Annualized measure; 1 Tax-equivalent basis metric; see "Non-GAAP reconciliations" in the Appendix for reconciliation of non- GAAP financial measures to their most closely comparable GAAP financial measures; 2 Weighted average interest rates do not include impact of purchase accounting adjustment amortization or deferred loan fee amortization. 2bps 9bps 9bps 8bps 10bps 7bps 7bps 7bps 13bps 8bps
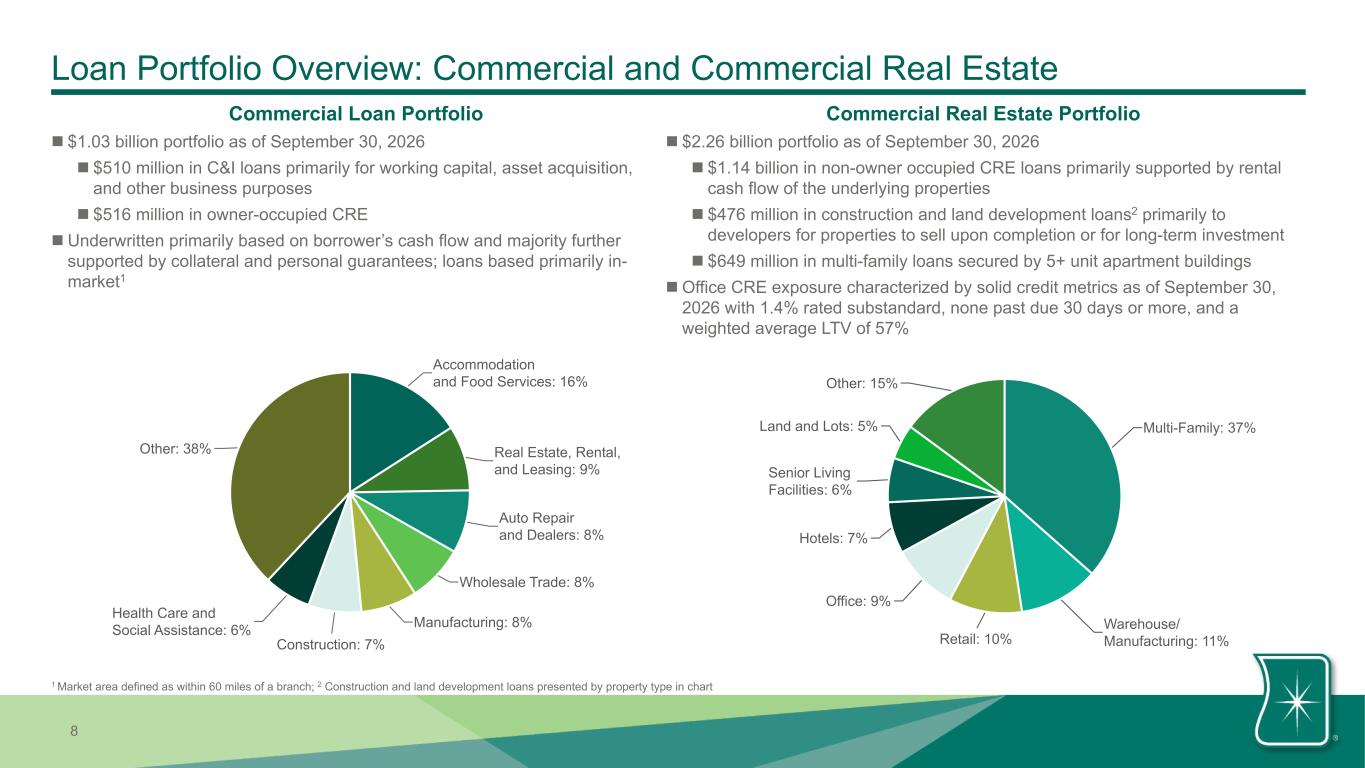
8 Loan Portfolio Overview: Commercial and Commercial Real Estate n $2.26 billion portfolio as of September 30, 2026 n $1.14 billion in non-owner occupied CRE loans primarily supported by rental cash flow of the underlying properties n $476 million in construction and land development loans2 primarily to developers for properties to sell upon completion or for long-term investment n $649 million in multi-family loans secured by 5+ unit apartment buildings n Office CRE exposure characterized by solid credit metrics as of September 30, 2026 with 1.4% rated substandard, none past due 30 days or more, and a weighted average LTV of 57% Commercial Real Estate PortfolioCommercial Loan Portfolio n $1.03 billion portfolio as of September 30, 2026 n $510 million in C&I loans primarily for working capital, asset acquisition, and other business purposes n $516 million in owner-occupied CRE n Underwritten primarily based on borrower’s cash flow and majority further supported by collateral and personal guarantees; loans based primarily in- market1 Accommodation and Food Services: 16% Real Estate, Rental, and Leasing: 9% Auto Repair and Dealers: 8% Wholesale Trade: 8% Manufacturing: 8% Construction: 7% Health Care and Social Assistance: 6% Other: 38% Multi-Family: 37% Warehouse/ Manufacturing: 11%Retail: 10% Office: 9% Hotels: 7% Senior Living Facilities: 6% Land and Lots: 5% Other: 15% 1 Market area defined as within 60 miles of a branch; 2 Construction and land development loans presented by property type in chart
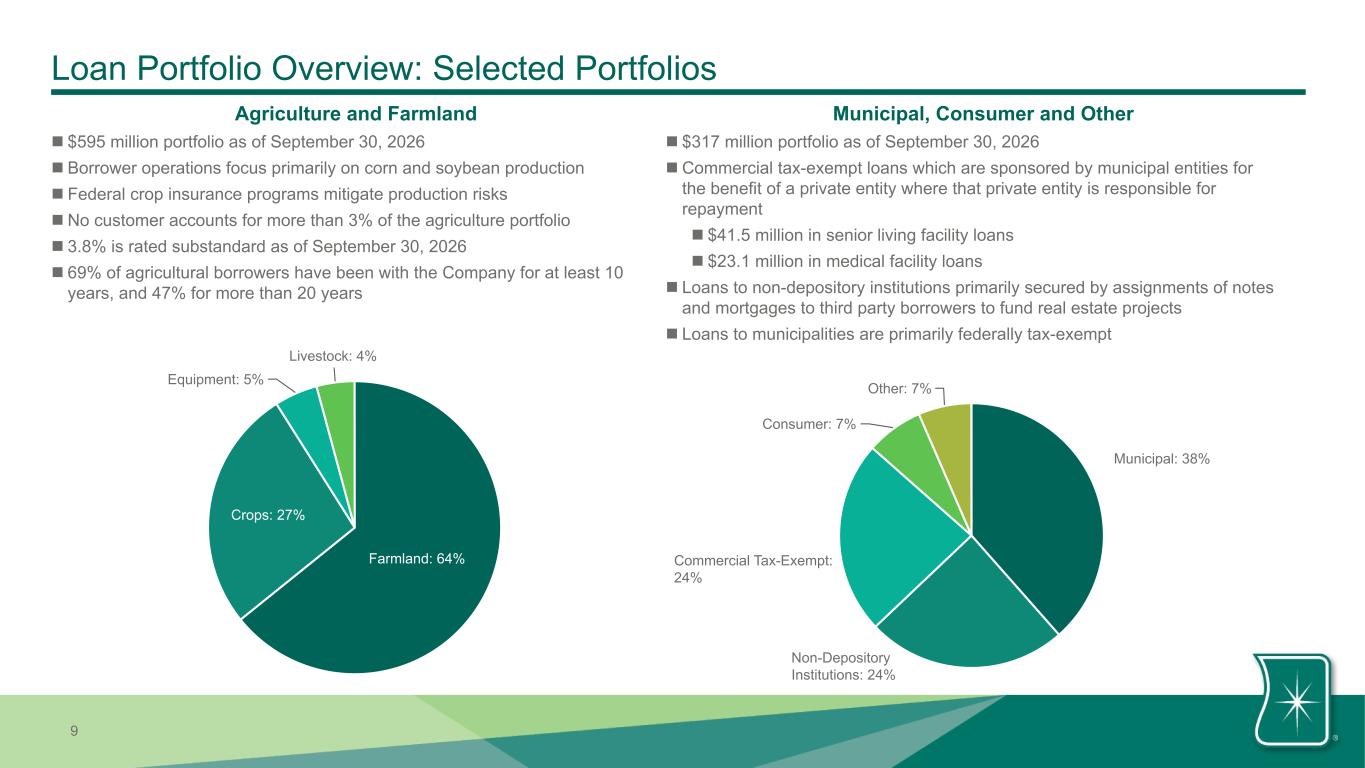
9 Loan Portfolio Overview: Selected Portfolios n $595 million portfolio as of September 30, 2026 n Borrower operations focus primarily on corn and soybean production n Federal crop insurance programs mitigate production risks n No customer accounts for more than 3% of the agriculture portfolio n 3.8% is rated substandard as of September 30, 2026 n 69% of agricultural borrowers have been with the Company for at least 10 years, and 47% for more than 20 years n $317 million portfolio as of September 30, 2026 n Commercial tax-exempt loans which are sponsored by municipal entities for the benefit of a private entity where that private entity is responsible for repayment n $41.5 million in senior living facility loans n $23.1 million in medical facility loans n Loans to non-depository institutions primarily secured by assignments of notes and mortgages to third party borrowers to fund real estate projects n Loans to municipalities are primarily federally tax-exempt Farmland: 64% Crops: 27% Equipment: 5% Livestock: 4% Municipal: 38% Non-Depository Institutions: 24% Commercial Tax-Exempt: 24% Consumer: 7% Other: 7% Municipal, Consumer and OtherAgriculture and Farmland
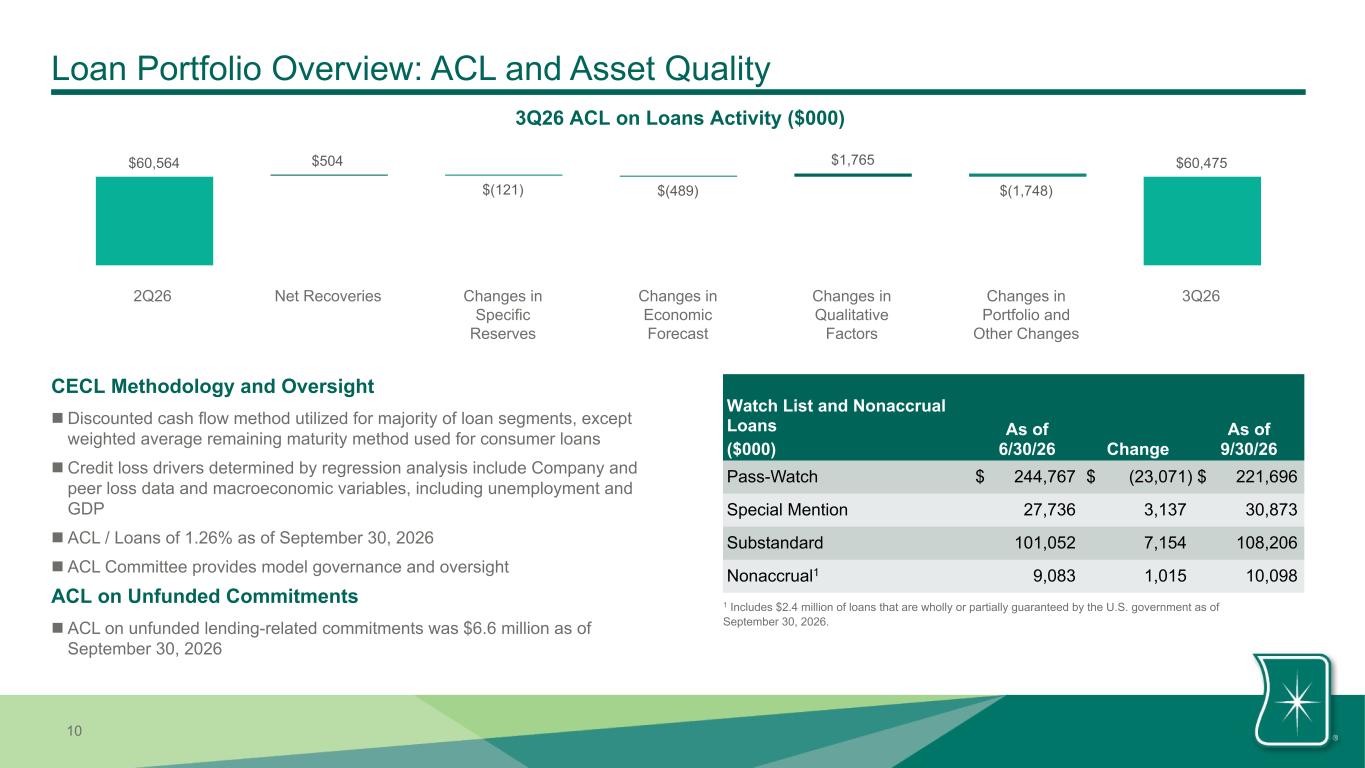
10 Loan Portfolio Overview: ACL and Asset Quality 3Q26 ACL on Loans Activity ($000) Watch List and Nonaccrual Loans ($000) As of 6/30/26 Change As of 9/30/26 Pass-Watch $ 244,767 $ (23,071) $ 221,696 Special Mention 27,736 3,137 30,873 Substandard 101,052 7,154 108,206 Nonaccrual1 9,083 1,015 10,098 CECL Methodology and Oversight n Discounted cash flow method utilized for majority of loan segments, except weighted average remaining maturity method used for consumer loans n Credit loss drivers determined by regression analysis include Company and peer loss data and macroeconomic variables, including unemployment and GDP n ACL / Loans of 1.26% as of September 30, 2026 n ACL Committee provides model governance and oversight ACL on Unfunded Commitments n ACL on unfunded lending-related commitments was $6.6 million as of September 30, 2026 1 Includes $2.4 million of loans that are wholly or partially guaranteed by the U.S. government as of September 30, 2026. $60,564 $504 $(121) $(489) $1,765 $(1,748) $60,475 2Q26 Net Recoveries Changes in Specific Reserves Changes in Economic Forecast Changes in Qualitative Factors Changes in Portfolio and Other Changes 3Q26
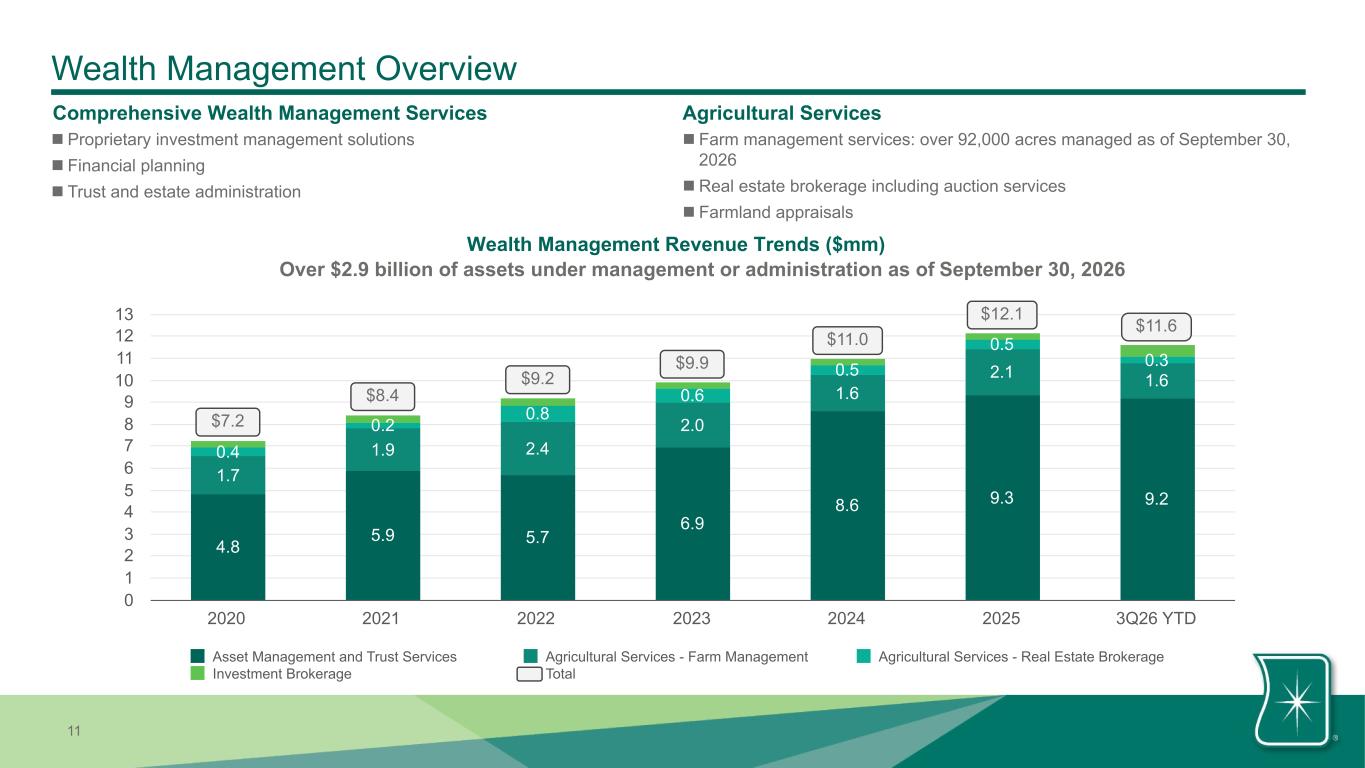
11 4.8 5.9 5.7 6.9 8.6 9.3 9.2 1.7 1.9 2.4 2.0 1.6 2.1 1.6 0.4 0.2 0.8 0.6 0.5 0.5 0.3 Asset Management and Trust Services Agricultural Services - Farm Management Agricultural Services - Real Estate Brokerage Investment Brokerage Total 2020 2021 2022 2023 2024 2025 3Q26 YTD 0 1 2 3 4 5 6 7 8 9 10 11 12 13 Wealth Management Overview Comprehensive Wealth Management Services n Proprietary investment management solutions n Financial planning n Trust and estate administration Wealth Management Revenue Trends ($mm) Agricultural Services n Farm management services: over 92,000 acres managed as of September 30, 2026 n Real estate brokerage including auction services n Farmland appraisals $12.1 $7.2 $8.4 $9.2 $9.9 Over $2.9 billion of assets under management or administration as of September 30, 2026 $11.0 $11.6
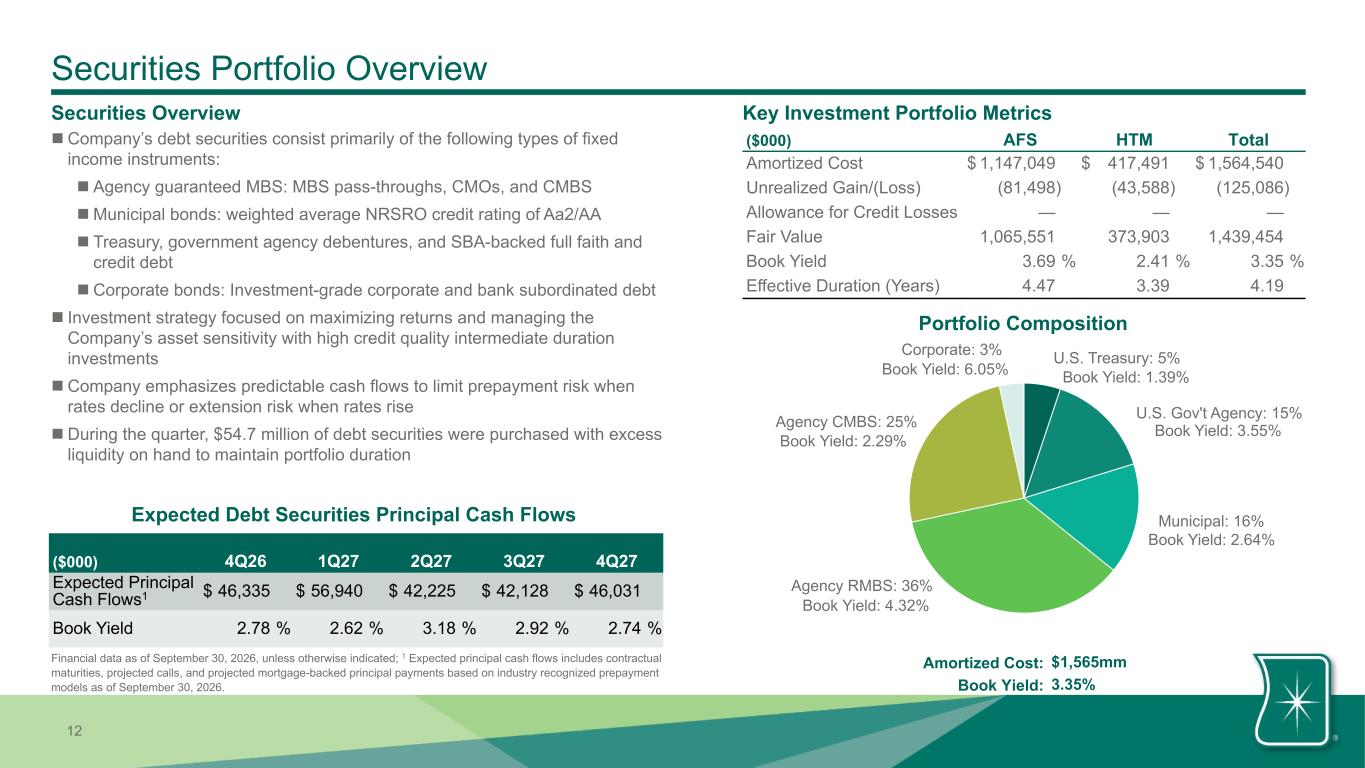
12 Securities Portfolio Overview Securities Overview Key Investment Portfolio Metrics ($000) AFS HTM Total Amortized Cost $ 1,147,049 $ 417,491 $ 1,564,540 Unrealized Gain/(Loss) (81,498) (43,588) (125,086) Allowance for Credit Losses — — — Fair Value 1,065,551 373,903 1,439,454 Book Yield 3.69 % 2.41 % 3.35 % Effective Duration (Years) 4.47 3.39 4.19 Portfolio Composition U.S. Treasury: 5% U.S. Gov't Agency: 15% Municipal: 16% Agency RMBS: 36% Agency CMBS: 25% Corporate: 3% Amortized Cost: $1,565mm Book Yield: 3.35% Book Yield: 3.55% Book Yield: 2.29% Book Yield: 1.39% Book Yield: 2.64% Book Yield: 4.32% Book Yield: 6.05% n Company’s debt securities consist primarily of the following types of fixed income instruments: n Agency guaranteed MBS: MBS pass-throughs, CMOs, and CMBS n Municipal bonds: weighted average NRSRO credit rating of Aa2/AA n Treasury, government agency debentures, and SBA-backed full faith and credit debt n Corporate bonds: Investment-grade corporate and bank subordinated debt n Investment strategy focused on maximizing returns and managing the Company’s asset sensitivity with high credit quality intermediate duration investments n Company emphasizes predictable cash flows to limit prepayment risk when rates decline or extension risk when rates rise n During the quarter, $54.7 million of debt securities were purchased with excess liquidity on hand to maintain portfolio duration Expected Debt Securities Principal Cash Flows ($000) 4Q26 1Q27 2Q27 3Q27 4Q27 Expected Principal Cash Flows1 $ 46,335 $ 56,940 $ 42,225 $ 42,128 $ 46,031 Book Yield 2.78 % 2.62 % 3.18 % 2.92 % 2.74 % Financial data as of September 30, 2026, unless otherwise indicated; 1 Expected principal cash flows includes contractual maturities, projected calls, and projected mortgage-backed principal payments based on industry recognized prepayment models as of September 30, 2026.
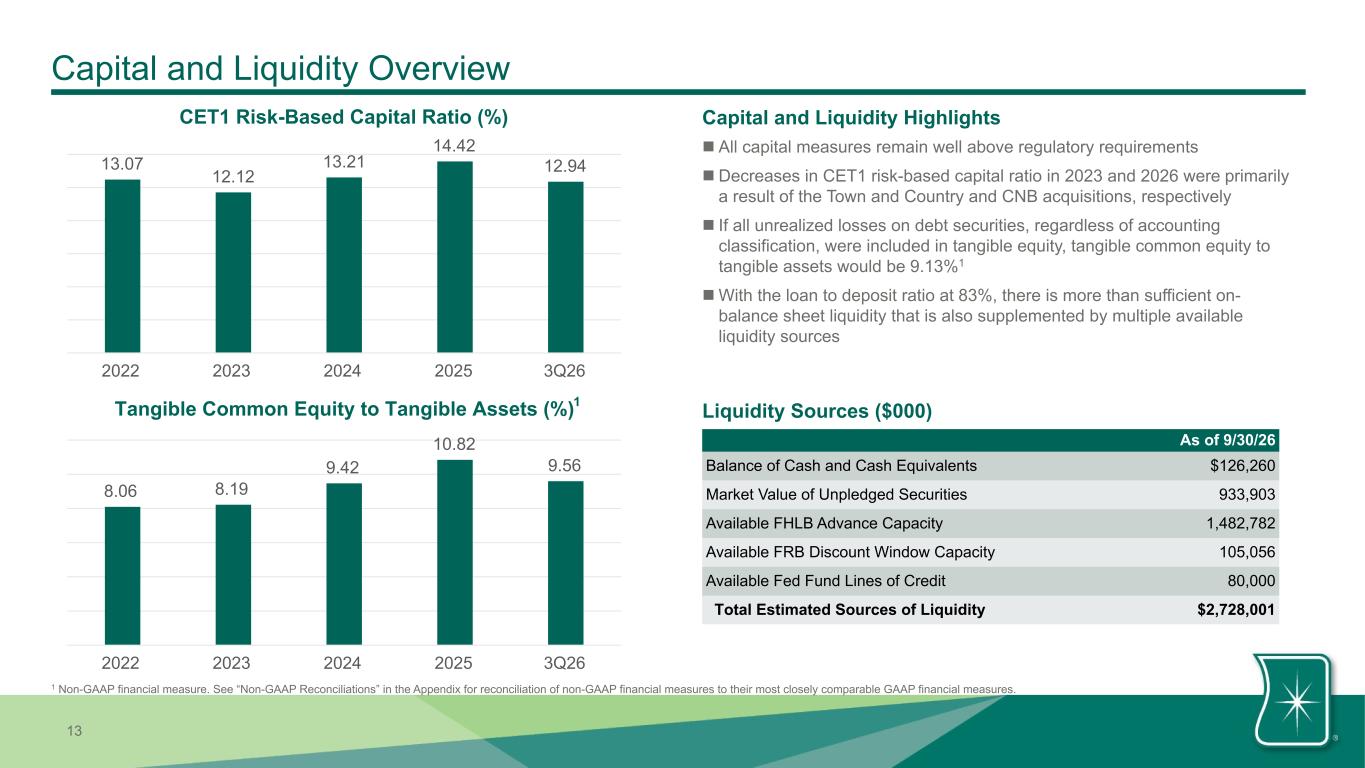
13 Capital and Liquidity Overview As of 9/30/26 Balance of Cash and Cash Equivalents $126,260 Market Value of Unpledged Securities 933,903 Available FHLB Advance Capacity 1,482,782 Available FRB Discount Window Capacity 105,056 Available Fed Fund Lines of Credit 80,000 Total Estimated Sources of Liquidity $2,728,001 Capital and Liquidity Highlights n All capital measures remain well above regulatory requirements n Decreases in CET1 risk-based capital ratio in 2023 and 2026 were primarily a result of the Town and Country and CNB acquisitions, respectively n If all unrealized losses on debt securities, regardless of accounting classification, were included in tangible equity, tangible common equity to tangible assets would be 9.13%1 n With the loan to deposit ratio at 83%, there is more than sufficient on- balance sheet liquidity that is also supplemented by multiple available liquidity sources CET1 Risk-Based Capital Ratio (%) 13.07 12.12 13.21 14.42 12.94 2022 2023 2024 2025 3Q26 Tangible Common Equity to Tangible Assets (%) 8.06 8.19 9.42 10.82 9.56 2022 2023 2024 2025 3Q26 1 1 Non-GAAP financial measure. See “Non-GAAP Reconciliations” in the Appendix for reconciliation of non-GAAP financial measures to their most closely comparable GAAP financial measures. Liquidity Sources ($000)
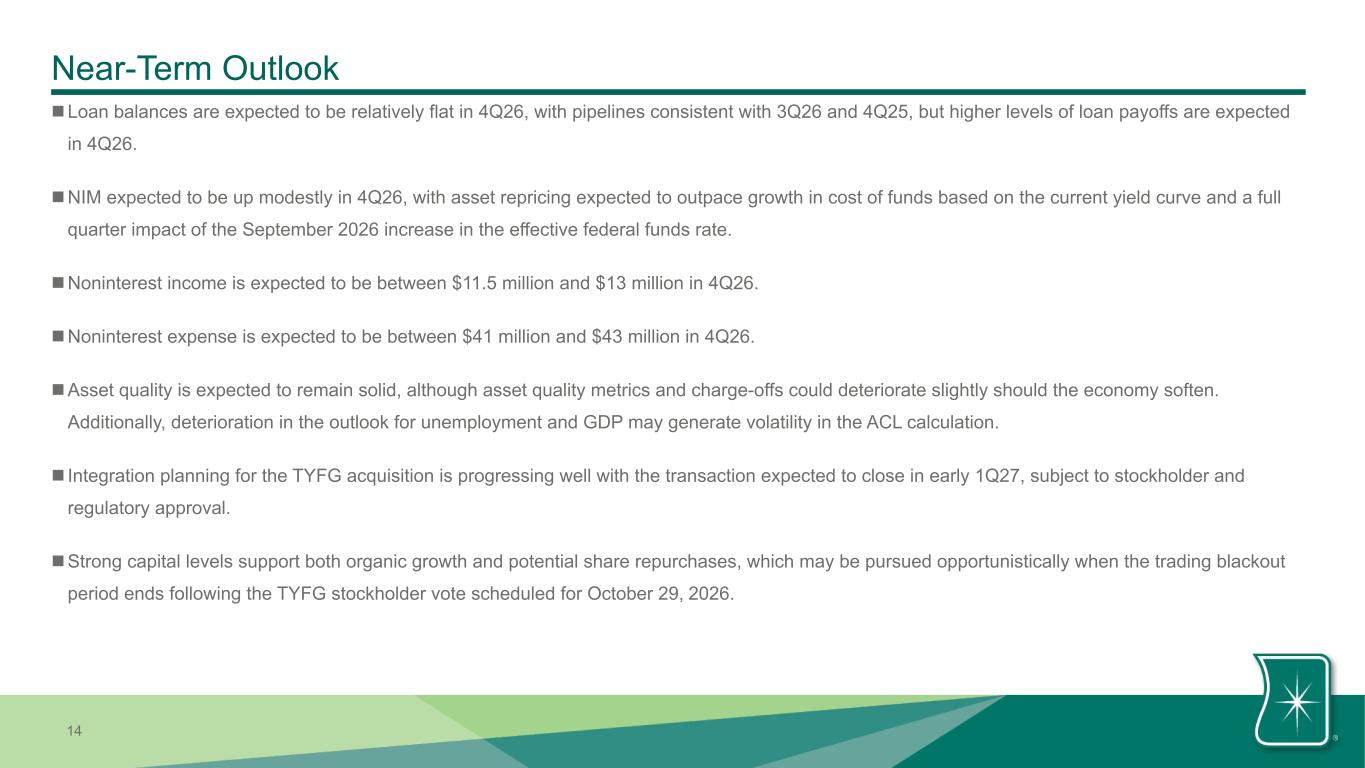
14 Near-Term Outlook nLoan balances are expected to be relatively flat in 4Q26, with pipelines consistent with 3Q26 and 4Q25, but higher levels of loan payoffs are expected in 4Q26. nNIM expected to be up modestly in 4Q26, with asset repricing expected to outpace growth in cost of funds based on the current yield curve and a full quarter impact of the September 2026 increase in the effective federal funds rate. nNoninterest income is expected to be between $11.5 million and $13 million in 4Q26. nNoninterest expense is expected to be between $41 million and $43 million in 4Q26. nAsset quality is expected to remain solid, although asset quality metrics and charge-offs could deteriorate slightly should the economy soften. Additionally, deterioration in the outlook for unemployment and GDP may generate volatility in the ACL calculation. n Integration planning for the TYFG acquisition is progressing well with the transaction expected to close in early 1Q27, subject to stockholder and regulatory approval. nStrong capital levels support both organic growth and potential share repurchases, which may be pursued opportunistically when the trading blackout period ends following the TYFG stockholder vote scheduled for October 29, 2026.
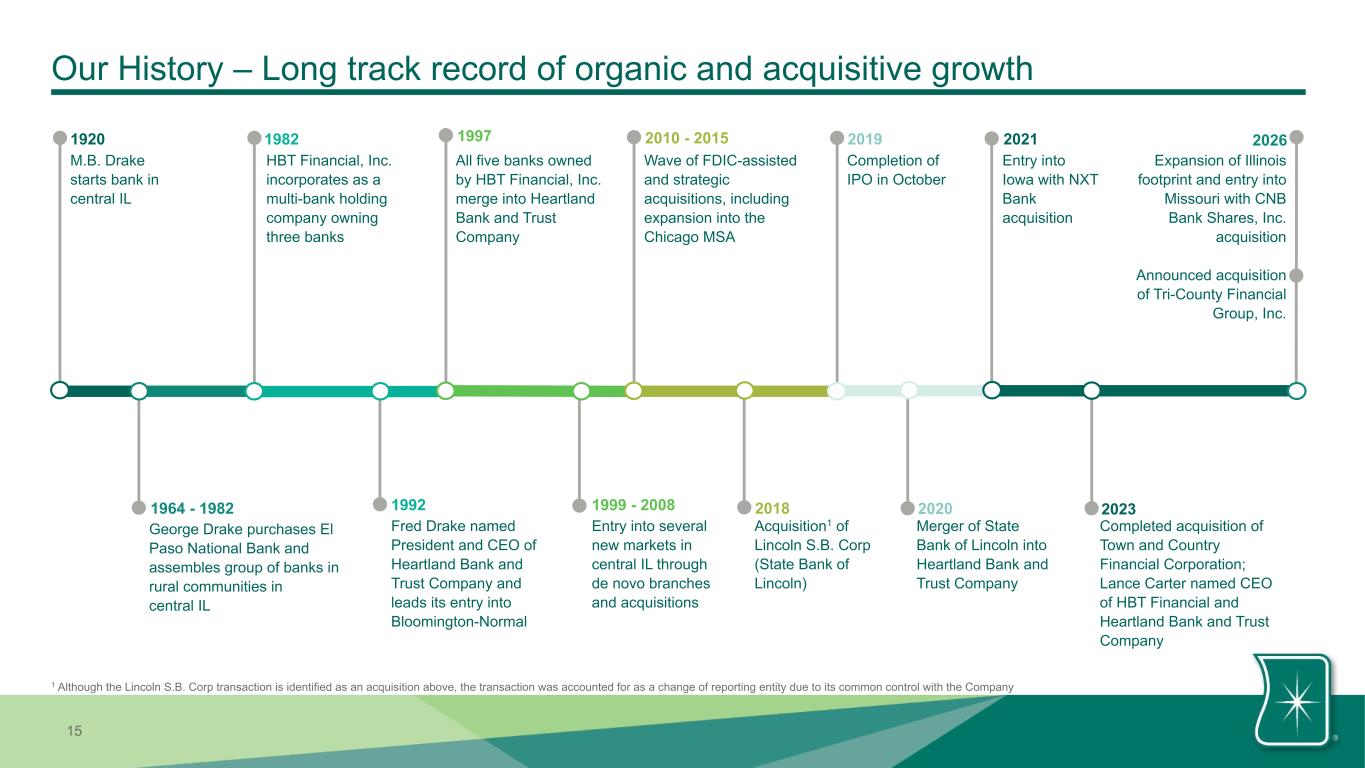
15 Our History – Long track record of organic and acquisitive growth All five banks owned by HBT Financial, Inc. merge into Heartland Bank and Trust Company 1997 1964 - 1982 George Drake purchases El Paso National Bank and assembles group of banks in rural communities in central IL M.B. Drake starts bank in central IL 1920 HBT Financial, Inc. incorporates as a multi-bank holding company owning three banks 1982 1992 Fred Drake named President and CEO of Heartland Bank and Trust Company and leads its entry into Bloomington-Normal Completion of IPO in October 2019 Acquisition1 of Lincoln S.B. Corp (State Bank of Lincoln) 2018 Entry into several new markets in central IL through de novo branches and acquisitions 1999 - 2008 2010 - 2015 Wave of FDIC-assisted and strategic acquisitions, including expansion into the Chicago MSA 2021 Entry into Iowa with NXT Bank acquisition 2020 Merger of State Bank of Lincoln into Heartland Bank and Trust Company 2026 Expansion of Illinois footprint and entry into Missouri with CNB Bank Shares, Inc. acquisition Announced acquisition of Tri-County Financial Group, Inc. 1 Although the Lincoln S.B. Corp transaction is identified as an acquisition above, the transaction was accounted for as a change of reporting entity due to its common control with the Company Completed acquisition of Town and Country Financial Corporation; Lance Carter named CEO of HBT Financial and Heartland Bank and Trust Company 2023
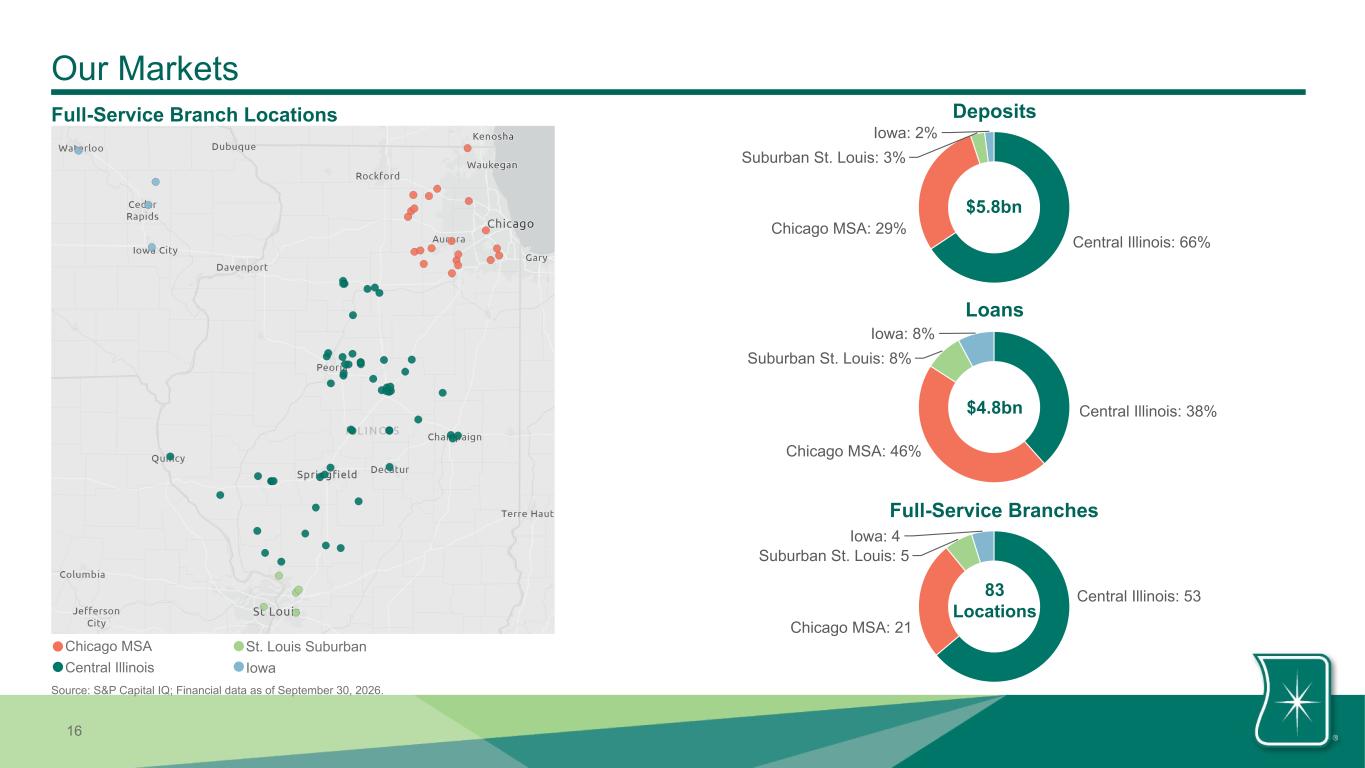
16 Central Illinois: 53 Chicago MSA: 21 Suburban St. Louis: 5 Iowa: 4 Our Markets Source: S&P Capital IQ; Financial data as of September 30, 2026. Full-Service Branch Locations Central Illinois: 66% Chicago MSA: 29% Suburban St. Louis: 3% Iowa: 2% $5.8bn Central Illinois: 38% Chicago MSA: 46% Suburban St. Louis: 8% Iowa: 8% $4.8bn 83 Locations Deposits Loans Full-Service Branches Chicago MSA Central Illinois St. Louis Suburban Iowa
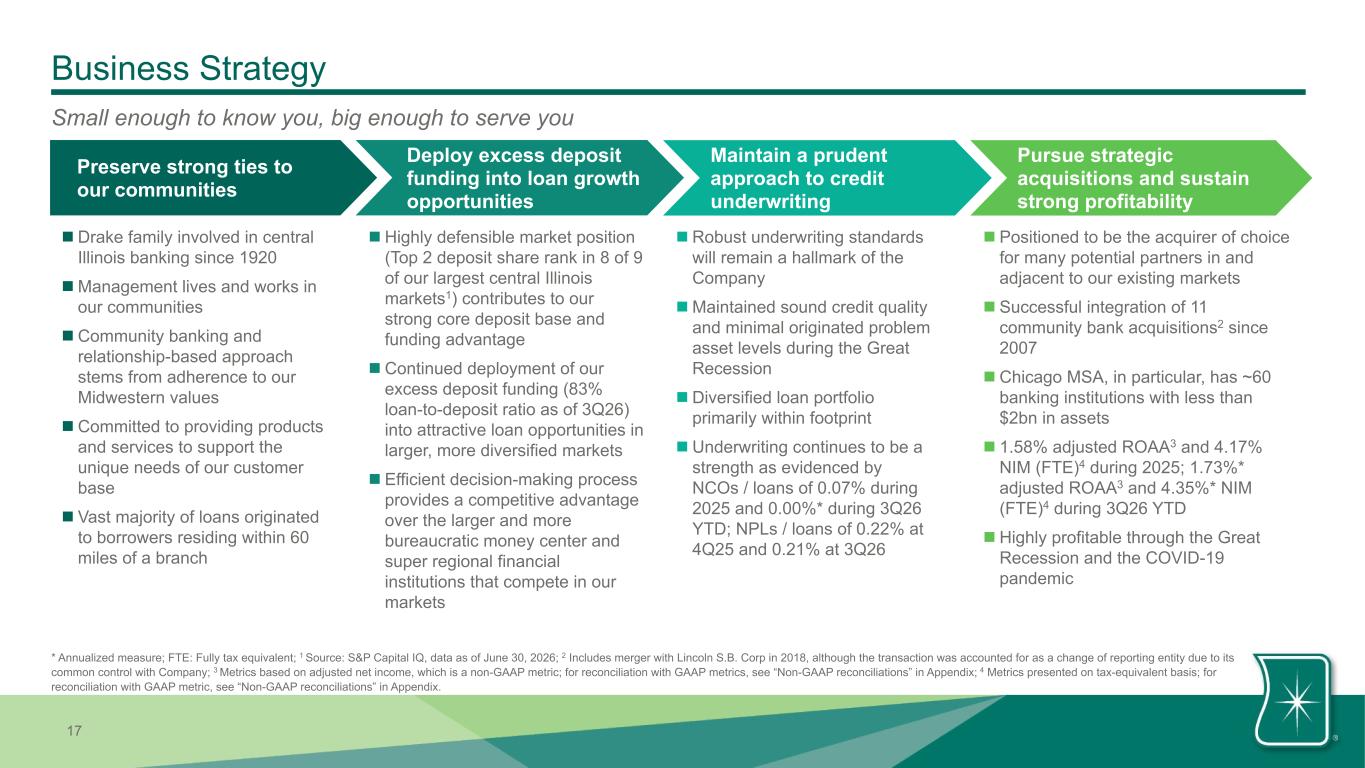
17 Business Strategy n Drake family involved in central Illinois banking since 1920 n Management lives and works in our communities n Community banking and relationship-based approach stems from adherence to our Midwestern values n Committed to providing products and services to support the unique needs of our customer base n Vast majority of loans originated to borrowers residing within 60 miles of a branch n Robust underwriting standards will remain a hallmark of the Company n Maintained sound credit quality and minimal originated problem asset levels during the Great Recession n Diversified loan portfolio primarily within footprint n Underwriting continues to be a strength as evidenced by NCOs / loans of 0.07% during 2025 and 0.00%* during 3Q26 YTD; NPLs / loans of 0.22% at 4Q25 and 0.21% at 3Q26 n Positioned to be the acquirer of choice for many potential partners in and adjacent to our existing markets n Successful integration of 11 community bank acquisitions2 since 2007 n Chicago MSA, in particular, has ~60 banking institutions with less than $2bn in assets n 1.58% adjusted ROAA3 and 4.17% NIM (FTE)4 during 2025; 1.73%* adjusted ROAA3 and 4.35%* NIM (FTE)4 during 3Q26 YTD n Highly profitable through the Great Recession and the COVID-19 pandemic n Highly defensible market position (Top 2 deposit share rank in 8 of 9 of our largest central Illinois markets1) contributes to our strong core deposit base and funding advantage n Continued deployment of our excess deposit funding (83% loan-to-deposit ratio as of 3Q26) into attractive loan opportunities in larger, more diversified markets n Efficient decision-making process provides a competitive advantage over the larger and more bureaucratic money center and super regional financial institutions that compete in our markets Preserve strong ties to our communities Deploy excess deposit funding into loan growth opportunities Maintain a prudent approach to credit underwriting Pursue strategic acquisitions and sustain strong profitability Small enough to know you, big enough to serve you * Annualized measure; FTE: Fully tax equivalent; 1 Source: S&P Capital IQ, data as of June 30, 2026; 2 Includes merger with Lincoln S.B. Corp in 2018, although the transaction was accounted for as a change of reporting entity due to its common control with Company; 3 Metrics based on adjusted net income, which is a non-GAAP metric; for reconciliation with GAAP metrics, see “Non-GAAP reconciliations” in Appendix; 4 Metrics presented on tax-equivalent basis; for reconciliation with GAAP metric, see “Non-GAAP reconciliations” in Appendix.
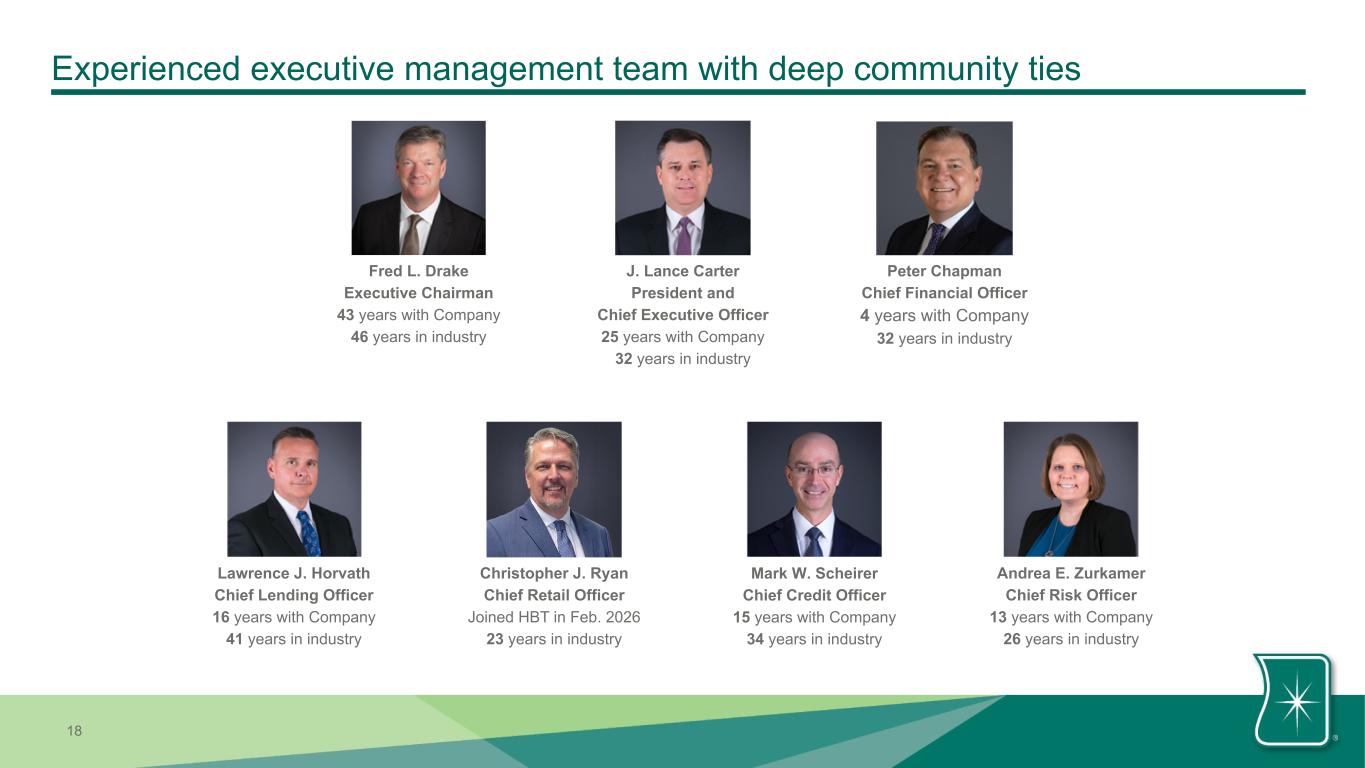
18 Experienced executive management team with deep community ties Fred L. Drake Executive Chairman 43 years with Company 46 years in industry J. Lance Carter President and Chief Executive Officer 25 years with Company 32 years in industry Lawrence J. Horvath Chief Lending Officer 16 years with Company 41 years in industry Mark W. Scheirer Chief Credit Officer 15 years with Company 34 years in industry Andrea E. Zurkamer Chief Risk Officer 13 years with Company 26 years in industry Christopher J. Ryan Chief Retail Officer Joined HBT in Feb. 2026 23 years in industry Peter Chapman Chief Financial Officer 4 years with Company 32 years in industry
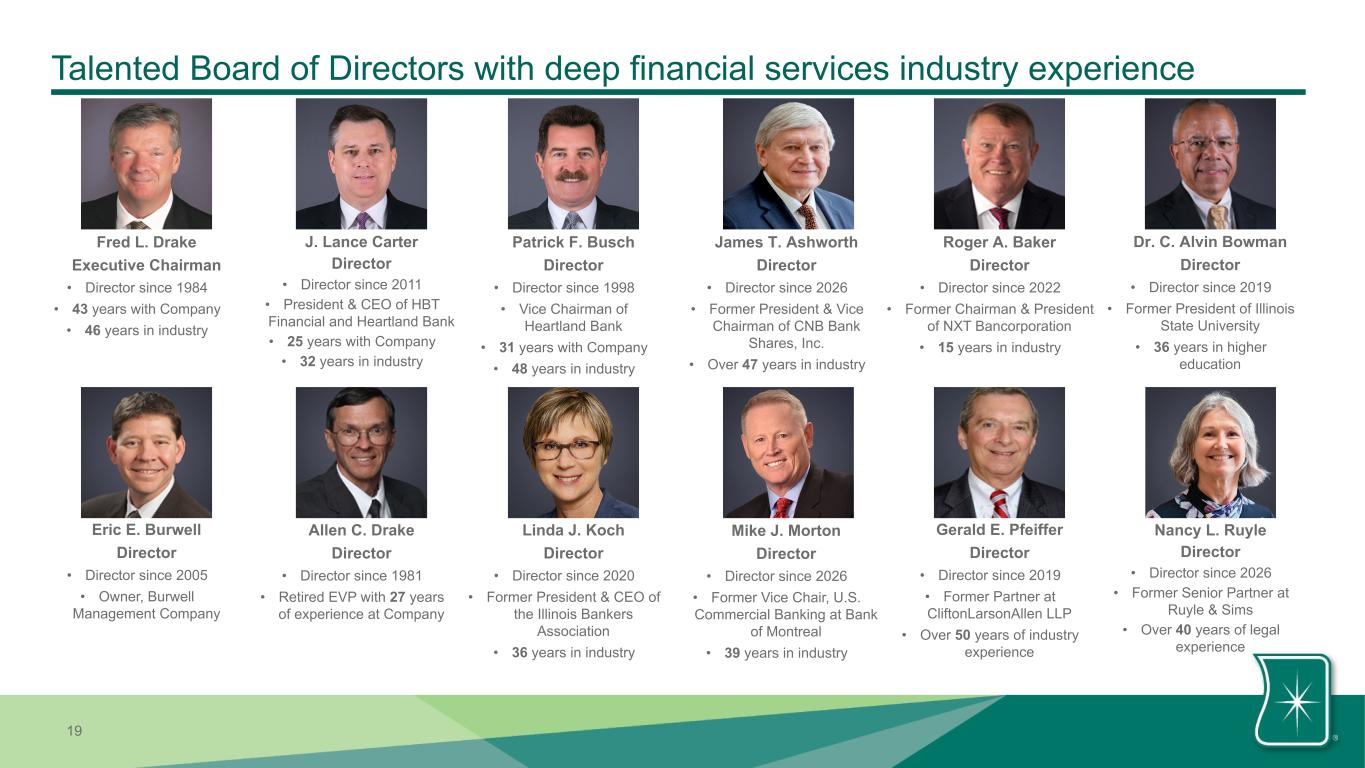
19 Talented Board of Directors with deep financial services industry experience Fred L. Drake Executive Chairman • Director since 1984 • 43 years with Company • 46 years in industry J. Lance Carter Director • Director since 2011 • President & CEO of HBT Financial and Heartland Bank • 25 years with Company • 32 years in industry Patrick F. Busch Director • Director since 1998 • Vice Chairman of Heartland Bank • 31 years with Company • 48 years in industry Eric E. Burwell Director • Director since 2005 • Owner, Burwell Management Company Linda J. Koch Director • Director since 2020 • Former President & CEO of the Illinois Bankers Association • 36 years in industry Gerald E. Pfeiffer Director • Director since 2019 • Former Partner at CliftonLarsonAllen LLP • Over 50 years of industry experience Allen C. Drake Director • Director since 1981 • Retired EVP with 27 years of experience at Company Dr. C. Alvin Bowman Director • Director since 2019 • Former President of Illinois State University • 36 years in higher education Roger A. Baker Director • Director since 2022 • Former Chairman & President of NXT Bancorporation • 15 years in industry James T. Ashworth Director • Director since 2026 • Former President & Vice Chairman of CNB Bank Shares, Inc. • Over 47 years in industry Nancy L. Ruyle Director • Director since 2026 • Former Senior Partner at Ruyle & Sims • Over 40 years of legal experience Mike J. Morton Director • Director since 2026 • Former Vice Chair, U.S. Commercial Banking at Bank of Montreal • 39 years in industry
20 Investment Highlights 3 1 2 4 Track record of successfully integrating acquisitions Consistent performance through economic cycles and consistent out-performance of peers drives long-term shareholder value Strong, granular, low-cost deposit base provides funding for diversified loan portfolio and loan growth opportunities Prudent risk management
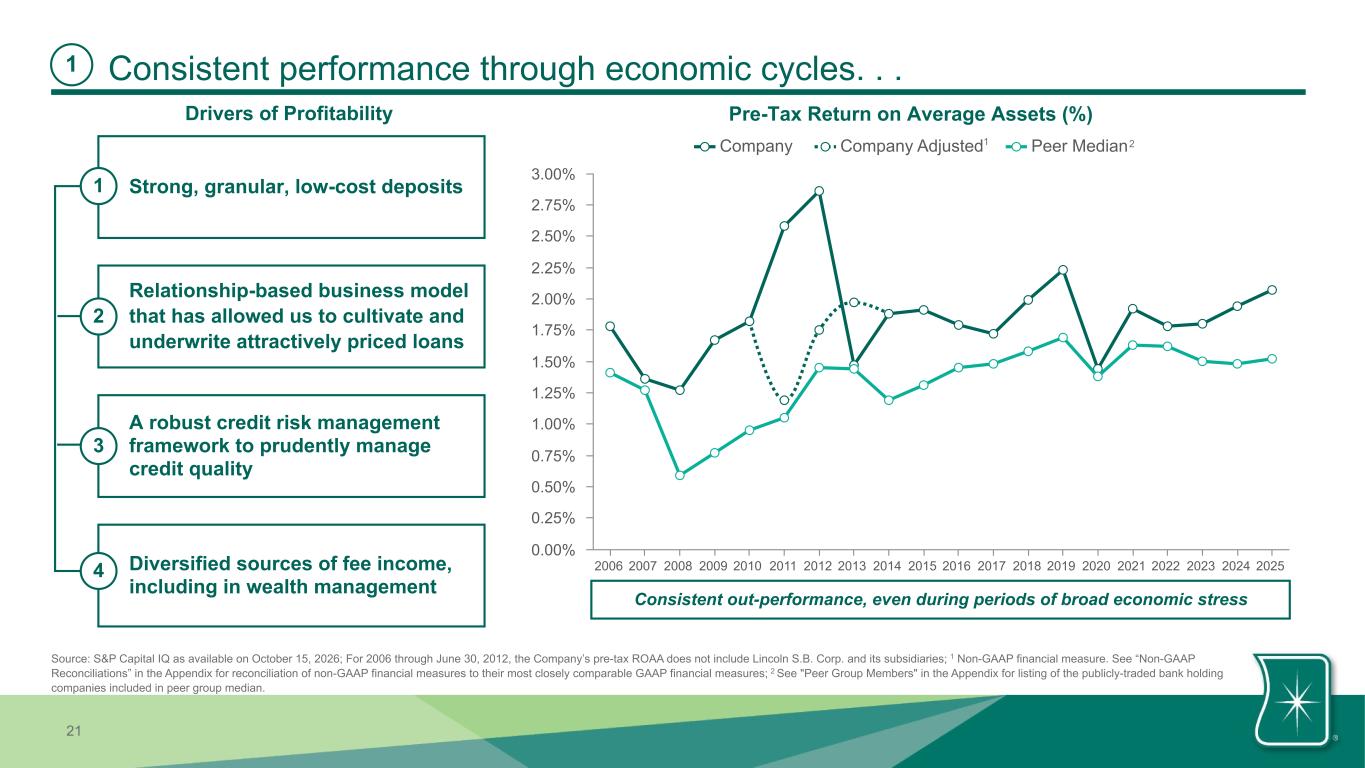
21 Consistent performance through economic cycles. . . Drivers of Profitability Strong, granular, low-cost deposits1 Relationship-based business model that has allowed us to cultivate and underwrite attractively priced loans A robust credit risk management framework to prudently manage credit quality Diversified sources of fee income, including in wealth management 4 Consistent out-performance, even during periods of broad economic stress 1 2 3 Pre-Tax Return on Average Assets (%) Company Company Adjusted Peer Median 2006 2007 2008 2009 2010 2011 2012 2013 2014 2015 2016 2017 2018 2019 2020 2021 2022 2023 2024 2025 0.00% 0.25% 0.50% 0.75% 1.00% 1.25% 1.50% 1.75% 2.00% 2.25% 2.50% 2.75% 3.00% 1 Source: S&P Capital IQ as available on October 15, 2026; For 2006 through June 30, 2012, the Company’s pre-tax ROAA does not include Lincoln S.B. Corp. and its subsidiaries; 1 Non-GAAP financial measure. See “Non-GAAP Reconciliations” in the Appendix for reconciliation of non-GAAP financial measures to their most closely comparable GAAP financial measures; 2 See "Peer Group Members" in the Appendix for listing of the publicly-traded bank holding companies included in peer group median. 2
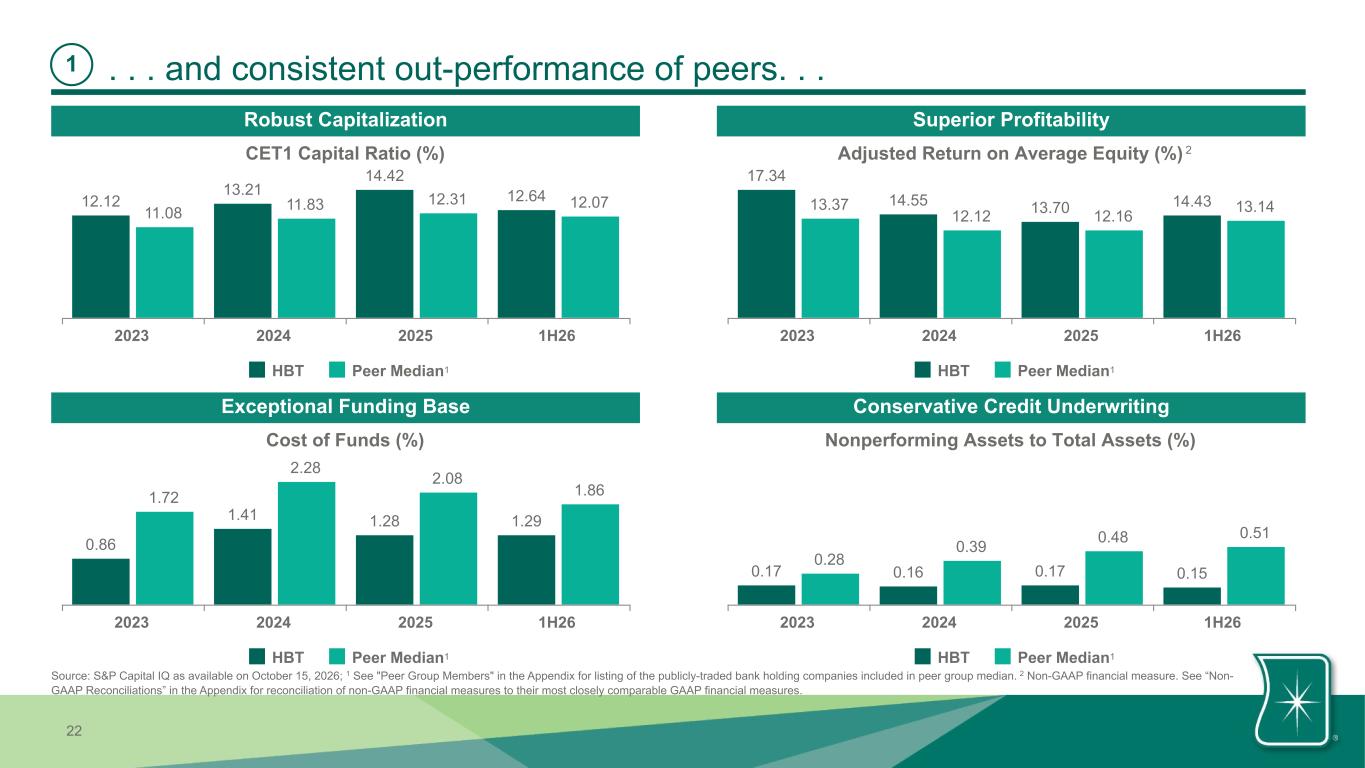
22 . . . and consistent out-performance of peers. . .1 CET1 Capital Ratio (%) 12.12 13.21 14.42 12.64 11.08 11.83 12.31 12.07 HBT Peer Median 2023 2024 2025 1H26 Adjusted Return on Average Equity (%) 17.34 14.55 13.70 14.4313.37 12.12 12.16 13.14 HBT Peer Median 2023 2024 2025 1H26 Cost of Funds (%) 0.86 1.41 1.28 1.29 1.72 2.28 2.08 1.86 HBT Peer Median 2023 2024 2025 1H26 Nonperforming Assets to Total Assets (%) 0.17 0.16 0.17 0.15 0.28 0.39 0.48 0.51 HBT Peer Median 2023 2024 2025 1H26 Robust Capitalization Superior Profitability Exceptional Funding Base Conservative Credit Underwriting 1 11 1 Source: S&P Capital IQ as available on October 15, 2026; 1 See "Peer Group Members" in the Appendix for listing of the publicly-traded bank holding companies included in peer group median. 2 Non-GAAP financial measure. See “Non- GAAP Reconciliations” in the Appendix for reconciliation of non-GAAP financial measures to their most closely comparable GAAP financial measures. 2
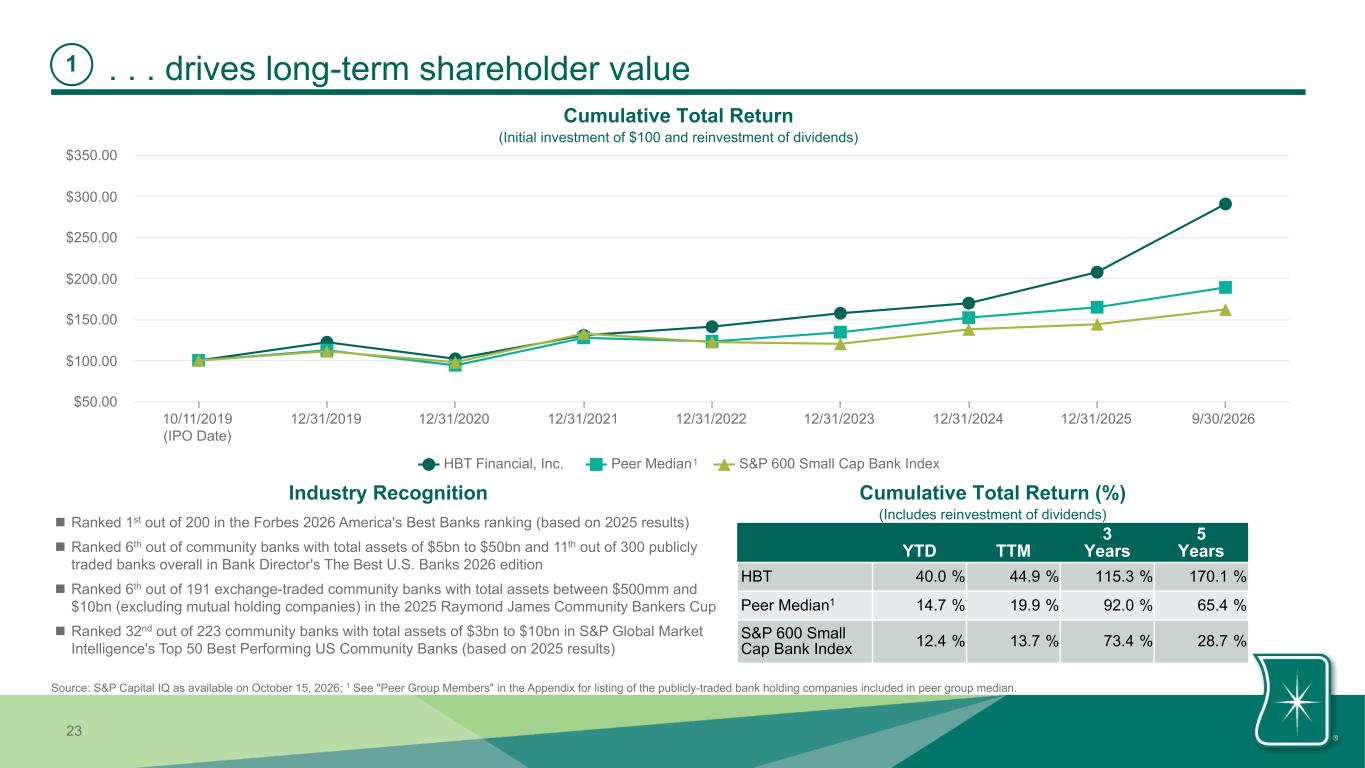
23 . . . drives long-term shareholder value1 HBT Financial, Inc. Peer Median S&P 600 Small Cap Bank Index 10/11/2019 (IPO Date) 12/31/2019 12/31/2020 12/31/2021 12/31/2022 12/31/2023 12/31/2024 12/31/2025 9/30/2026 $50.00 $100.00 $150.00 $200.00 $250.00 $300.00 $350.00 Cumulative Total Return (Initial investment of $100 and reinvestment of dividends) 1 Source: S&P Capital IQ as available on October 15, 2026; 1 See "Peer Group Members" in the Appendix for listing of the publicly-traded bank holding companies included in peer group median. YTD TTM 3 Years 5 Years HBT 40.0 % 44.9 % 115.3 % 170.1 % Peer Median1 14.7 % 19.9 % 92.0 % 65.4 % S&P 600 Small Cap Bank Index 12.4 % 13.7 % 73.4 % 28.7 % Cumulative Total Return (%) (Includes reinvestment of dividends) Industry Recognition n Ranked 1st out of 200 in the Forbes 2026 America's Best Banks ranking (based on 2025 results) n Ranked 6th out of community banks with total assets of $5bn to $50bn and 11th out of 300 publicly traded banks overall in Bank Director's The Best U.S. Banks 2026 edition n Ranked 6th out of 191 exchange-traded community banks with total assets between $500mm and $10bn (excluding mutual holding companies) in the 2025 Raymond James Community Bankers Cup n Ranked 32nd out of 223 community banks with total assets of $3bn to $10bn in S&P Global Market Intelligence's Top 50 Best Performing US Community Banks (based on 2025 results)
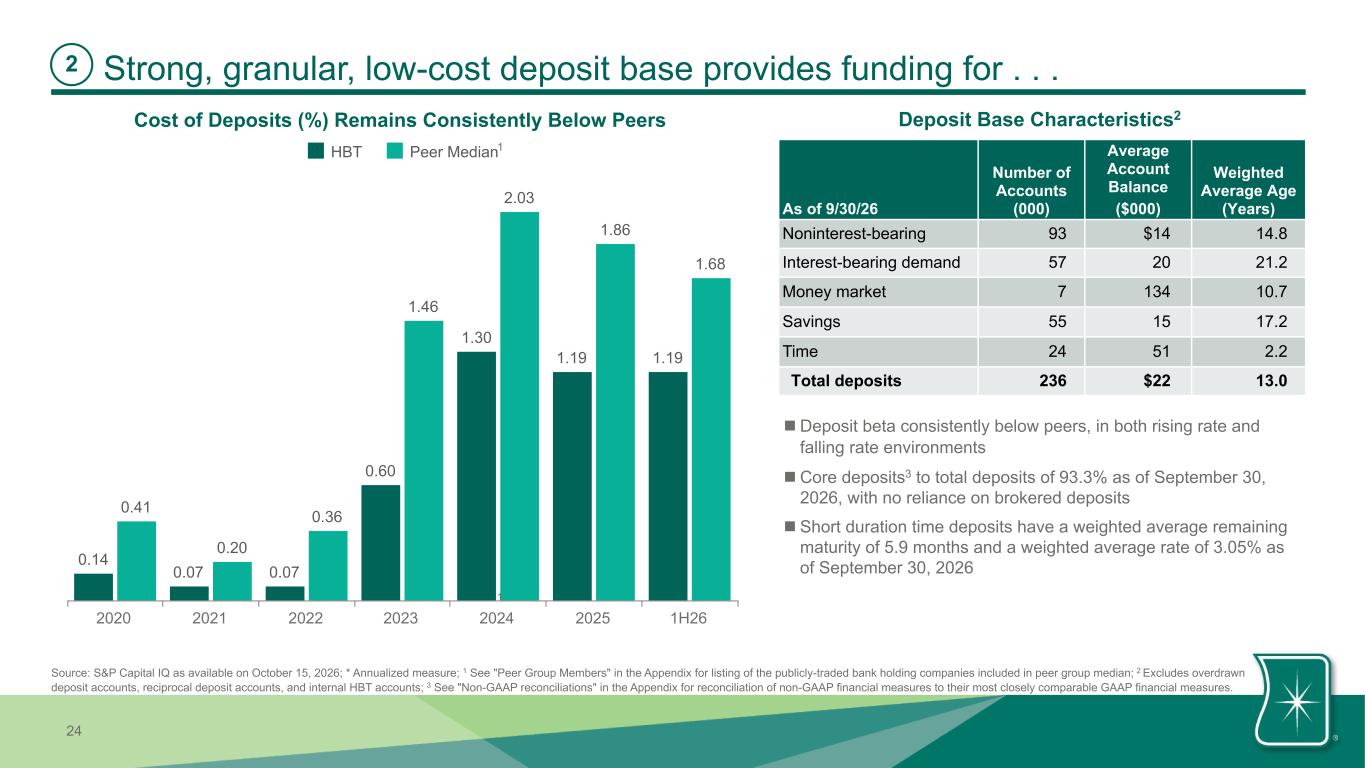
24 0.14 0.07 0.07 0.60 1.30 1.19 1.19 0.41 0.20 0.36 1.46 2.03 1.86 1.68 HBT Peer Median 2020 2021 2022 2023 2024 2025 1H26 Strong, granular, low-cost deposit base provides funding for . . . Cost of Deposits (%) Remains Consistently Below Peers 1 2 As of 9/30/26 Number of Accounts (000) Average Account Balance ($000) Weighted Average Age (Years) Noninterest-bearing 93 $14 14.8 Interest-bearing demand 57 20 21.2 Money market 7 134 10.7 Savings 55 15 17.2 Time 24 51 2.2 Total deposits 236 $22 13.0 Deposit Base Characteristics2 1 Source: S&P Capital IQ as available on October 15, 2026; * Annualized measure; 1 See "Peer Group Members" in the Appendix for listing of the publicly-traded bank holding companies included in peer group median; 2 Excludes overdrawn deposit accounts, reciprocal deposit accounts, and internal HBT accounts; 3 See "Non-GAAP reconciliations" in the Appendix for reconciliation of non-GAAP financial measures to their most closely comparable GAAP financial measures. n Deposit beta consistently below peers, in both rising rate and falling rate environments n Core deposits3 to total deposits of 93.3% as of September 30, 2026, with no reliance on brokered deposits n Short duration time deposits have a weighted average remaining maturity of 5.9 months and a weighted average rate of 3.05% as of September 30, 2026 1
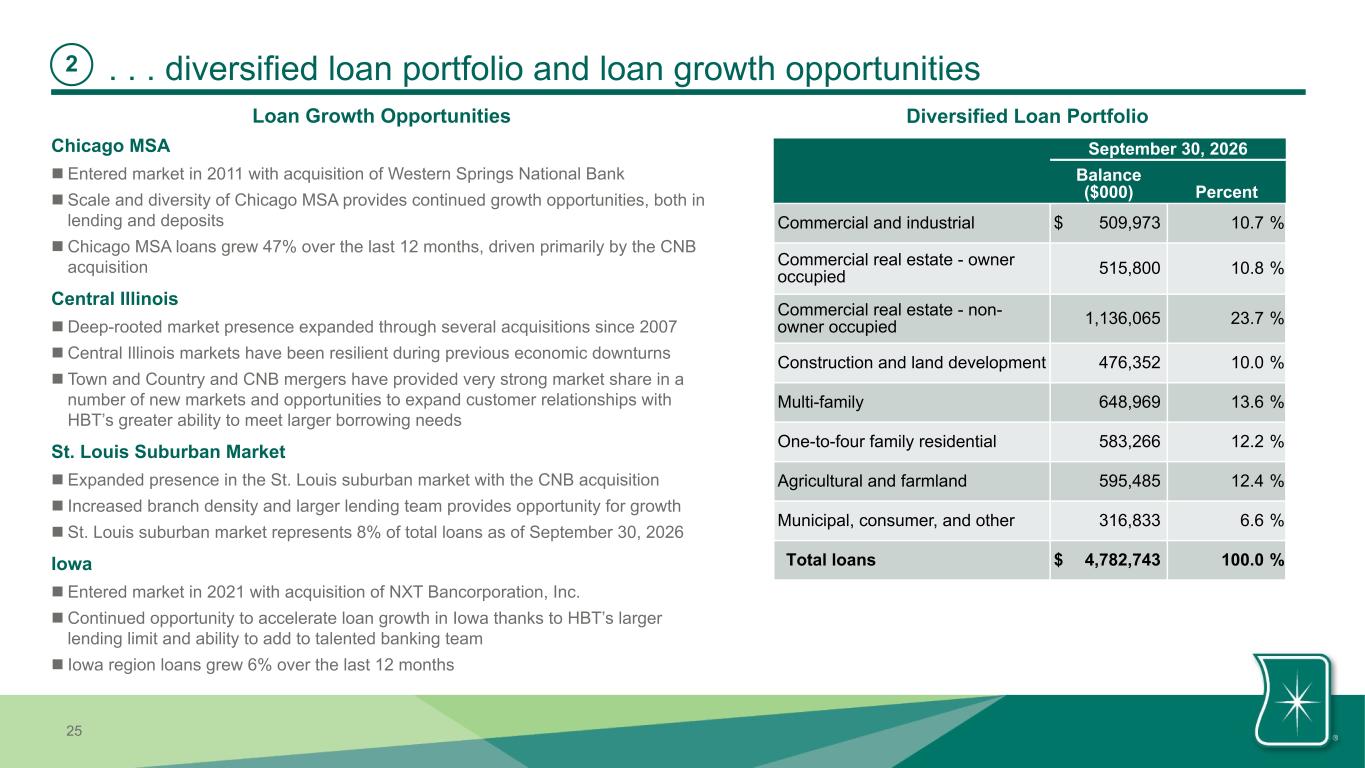
25 . . . diversified loan portfolio and loan growth opportunities2 September 30, 2026 Balance ($000) Percent Commercial and industrial $ 509,973 10.7 % Commercial real estate - owner occupied 515,800 10.8 % Commercial real estate - non- owner occupied 1,136,065 23.7 % Construction and land development 476,352 10.0 % Multi-family 648,969 13.6 % One-to-four family residential 583,266 12.2 % Agricultural and farmland 595,485 12.4 % Municipal, consumer, and other 316,833 6.6 % Total loans $ 4,782,743 100.0 % Diversified Loan Portfolio Chicago MSA n Entered market in 2011 with acquisition of Western Springs National Bank n Scale and diversity of Chicago MSA provides continued growth opportunities, both in lending and deposits n Chicago MSA loans grew 47% over the last 12 months, driven primarily by the CNB acquisition Central Illinois n Deep-rooted market presence expanded through several acquisitions since 2007 n Central Illinois markets have been resilient during previous economic downturns n Town and Country and CNB mergers have provided very strong market share in a number of new markets and opportunities to expand customer relationships with HBT’s greater ability to meet larger borrowing needs St. Louis Suburban Market n Expanded presence in the St. Louis suburban market with the CNB acquisition n Increased branch density and larger lending team provides opportunity for growth n St. Louis suburban market represents 8% of total loans as of September 30, 2026 Iowa n Entered market in 2021 with acquisition of NXT Bancorporation, Inc. n Continued opportunity to accelerate loan growth in Iowa thanks to HBT’s larger lending limit and ability to add to talented banking team n Iowa region loans grew 6% over the last 12 months Loan Growth Opportunities
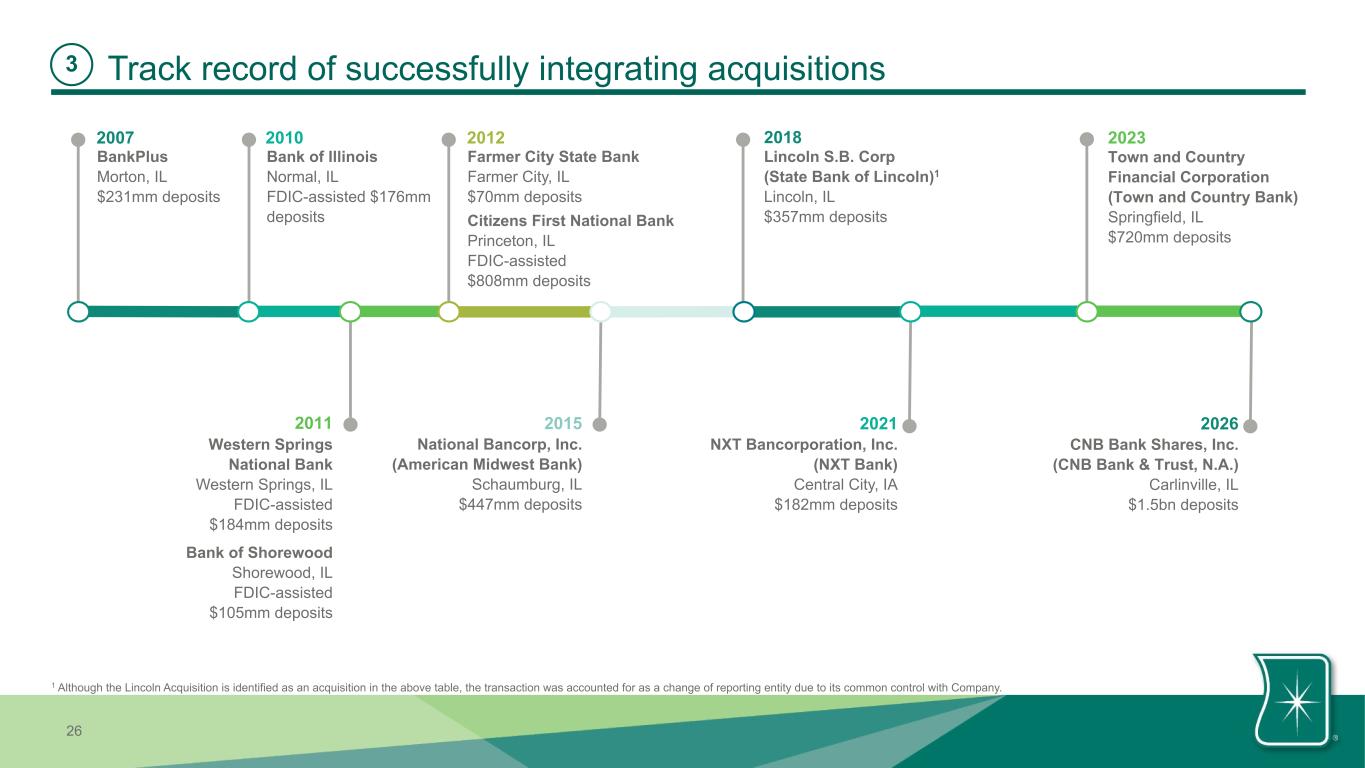
26 2026 CNB Bank Shares, Inc. (CNB Bank & Trust, N.A.) Carlinville, IL $1.5bn deposits Track record of successfully integrating acquisitions BankPlus Morton, IL $231mm deposits 2007 2012 Bank of Illinois Normal, IL FDIC-assisted $176mm deposits Western Springs National Bank Western Springs, IL FDIC-assisted $184mm deposits 2011 Citizens First National Bank Princeton, IL FDIC-assisted $808mm deposits Farmer City State Bank Farmer City, IL $70mm deposits 20182010 Bank of Shorewood Shorewood, IL FDIC-assisted $105mm deposits Lincoln S.B. Corp (State Bank of Lincoln)1 Lincoln, IL $357mm deposits 2021 NXT Bancorporation, Inc. (NXT Bank) Central City, IA $182mm deposits 2015 National Bancorp, Inc. (American Midwest Bank) Schaumburg, IL $447mm deposits 2023 Town and Country Financial Corporation (Town and Country Bank) Springfield, IL $720mm deposits 3 1 Although the Lincoln Acquisition is identified as an acquisition in the above table, the transaction was accounted for as a change of reporting entity due to its common control with Company.
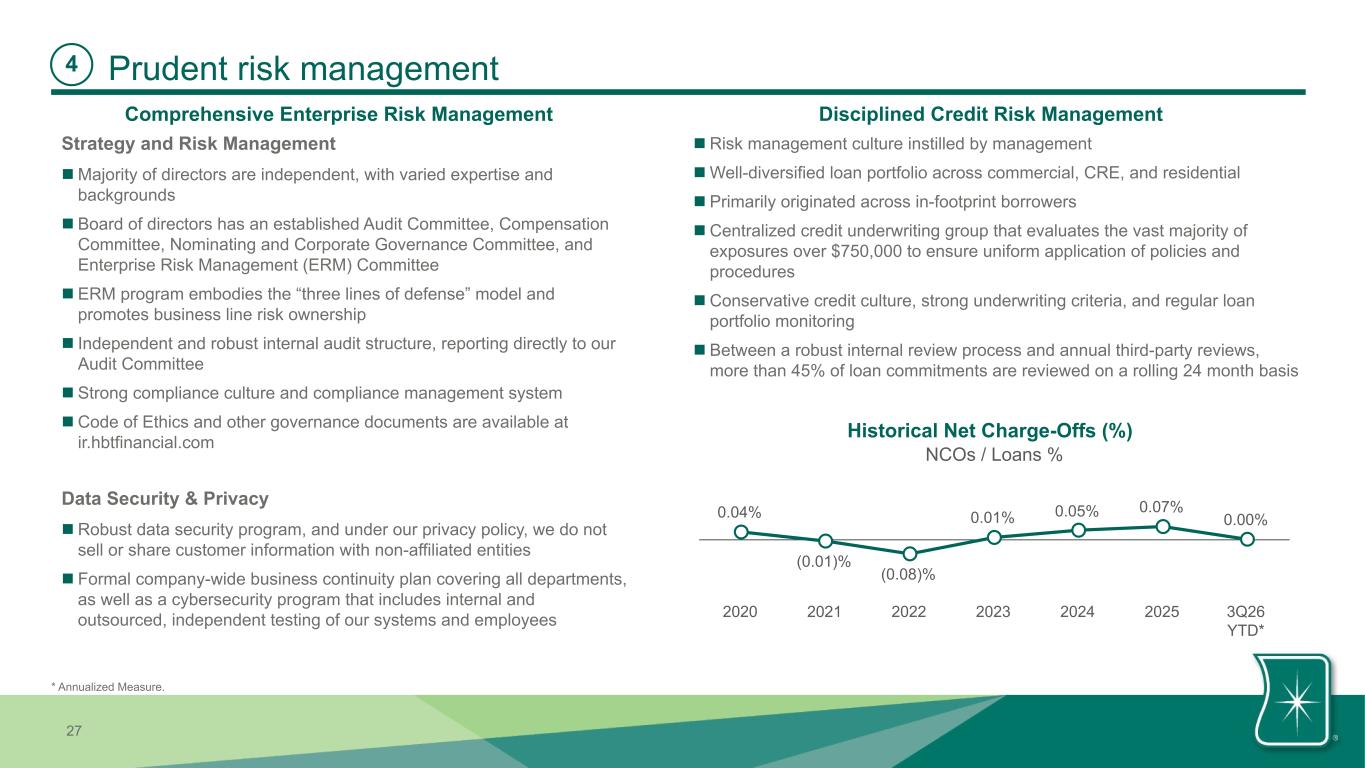
27 Prudent risk management n Risk management culture instilled by management n Well-diversified loan portfolio across commercial, CRE, and residential n Primarily originated across in-footprint borrowers n Centralized credit underwriting group that evaluates the vast majority of exposures over $750,000 to ensure uniform application of policies and procedures n Conservative credit culture, strong underwriting criteria, and regular loan portfolio monitoring n Between a robust internal review process and annual third-party reviews, more than 45% of loan commitments are reviewed on a rolling 24 month basis Strategy and Risk Management n Majority of directors are independent, with varied expertise and backgrounds n Board of directors has an established Audit Committee, Compensation Committee, Nominating and Corporate Governance Committee, and Enterprise Risk Management (ERM) Committee n ERM program embodies the “three lines of defense” model and promotes business line risk ownership n Independent and robust internal audit structure, reporting directly to our Audit Committee n Strong compliance culture and compliance management system n Code of Ethics and other governance documents are available at ir.hbtfinancial.com Data Security & Privacy n Robust data security program, and under our privacy policy, we do not sell or share customer information with non-affiliated entities n Formal company-wide business continuity plan covering all departments, as well as a cybersecurity program that includes internal and outsourced, independent testing of our systems and employees Comprehensive Enterprise Risk Management Disciplined Credit Risk Management Historical Net Charge-Offs (%) 4 NCOs / Loans % 0.04% (0.01)% (0.08)% 0.01% 0.05% 0.07% 0.00% 2020 2021 2022 2023 2024 2025 3Q26 YTD* * Annualized Measure.
28 Appendix
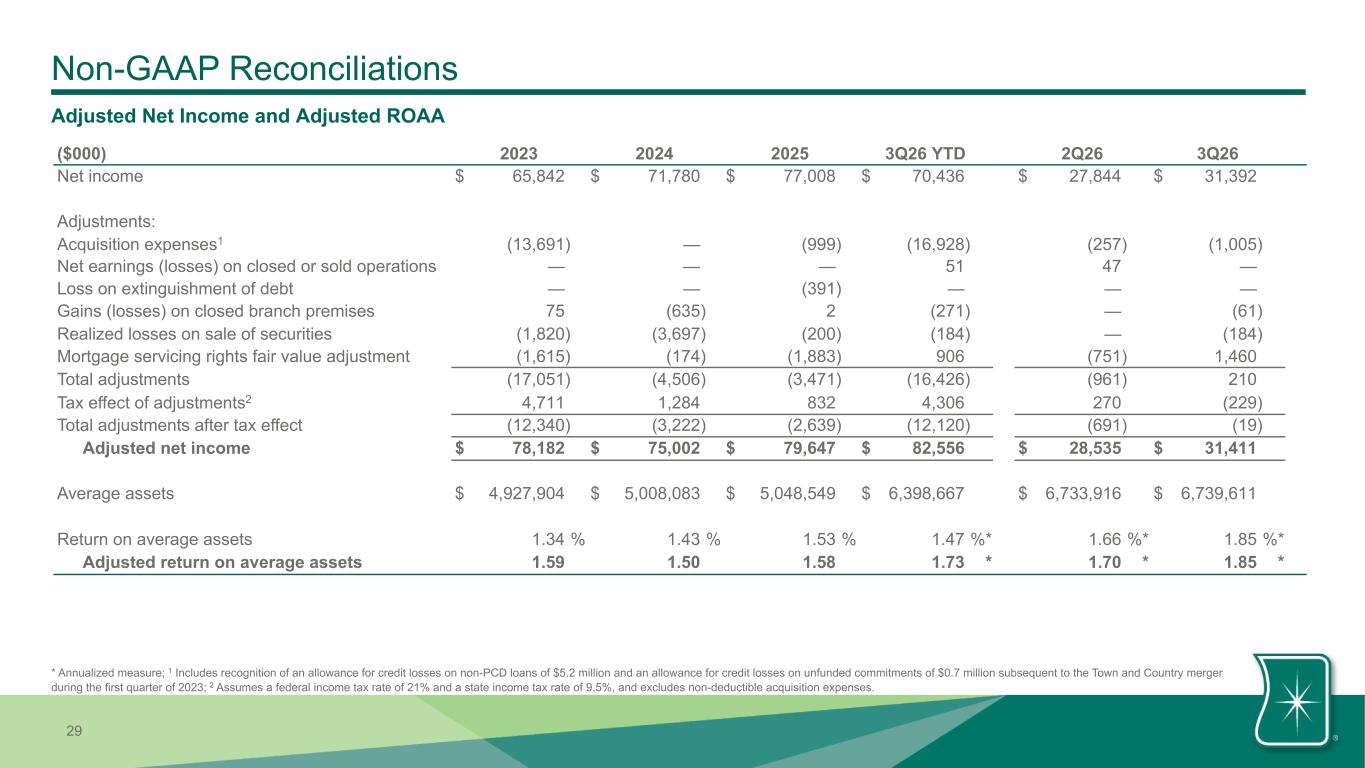
29 Non-GAAP Reconciliations Adjusted Net Income and Adjusted ROAA ($000) 2023 2024 2025 3Q26 YTD 2Q26 3Q26 Net income $ 65,842 $ 71,780 $ 77,008 $ 70,436 $ 27,844 $ 31,392 Adjustments: Acquisition expenses1 (13,691) — (999) (16,928) (257) (1,005) Net earnings (losses) on closed or sold operations — — — 51 47 — Loss on extinguishment of debt — — (391) — — — Gains (losses) on closed branch premises 75 (635) 2 (271) — (61) Realized losses on sale of securities (1,820) (3,697) (200) (184) — (184) Mortgage servicing rights fair value adjustment (1,615) (174) (1,883) 906 (751) 1,460 Total adjustments (17,051) (4,506) (3,471) (16,426) (961) 210 Tax effect of adjustments2 4,711 1,284 832 4,306 270 (229) Total adjustments after tax effect (12,340) (3,222) (2,639) (12,120) (691) (19) Adjusted net income $ 78,182 $ 75,002 $ 79,647 $ 82,556 $ 28,535 $ 31,411 Average assets $ 4,927,904 $ 5,008,083 $ 5,048,549 $ 6,398,667 $ 6,733,916 $ 6,739,611 Return on average assets 1.34 % 1.43 % 1.53 % 1.47 %* 1.66 %* 1.85 %* Adjusted return on average assets 1.59 1.50 1.58 1.73 * 1.70 * 1.85 * * Annualized measure; 1 Includes recognition of an allowance for credit losses on non-PCD loans of $5.2 million and an allowance for credit losses on unfunded commitments of $0.7 million subsequent to the Town and Country merger during the first quarter of 2023; 2 Assumes a federal income tax rate of 21% and a state income tax rate of 9.5%, and excludes non-deductible acquisition expenses.
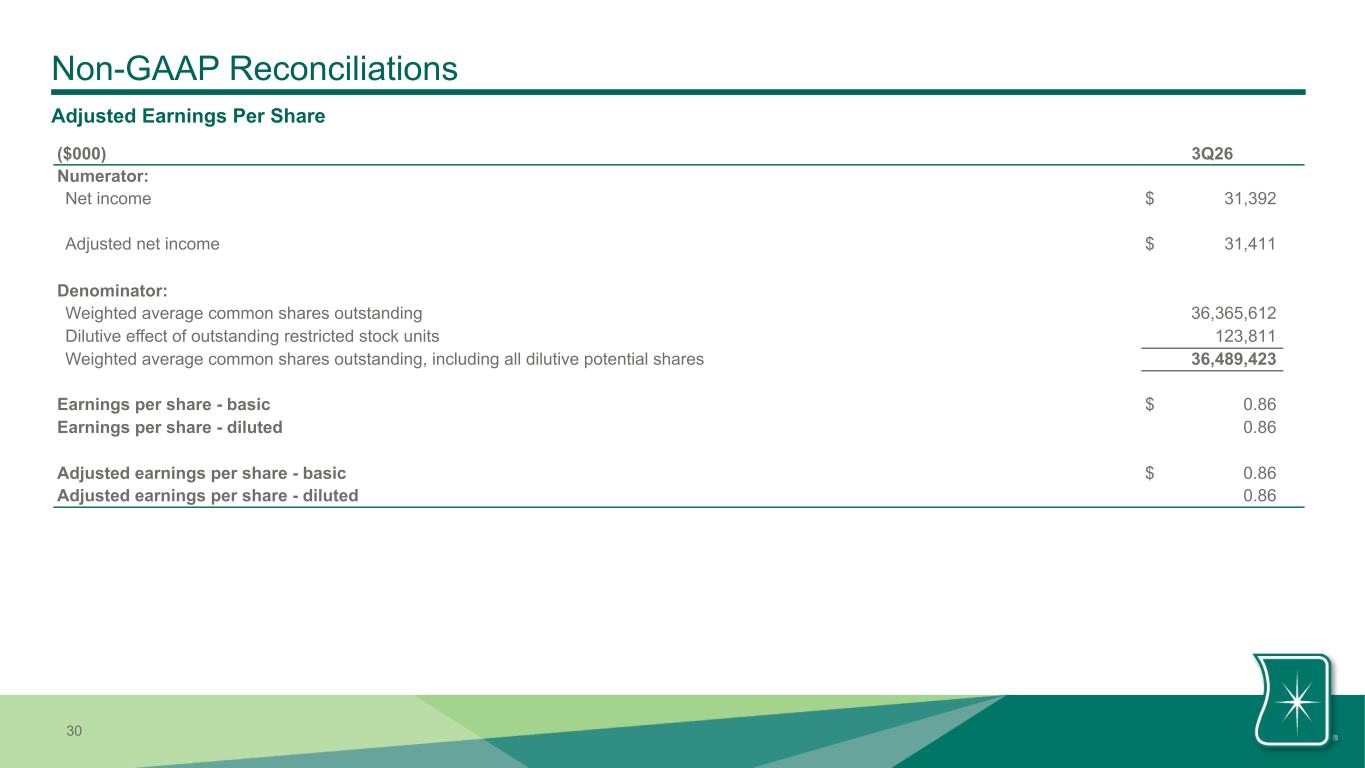
30 Non-GAAP Reconciliations Adjusted Earnings Per Share ($000) 3Q26 Numerator: Net income $ 31,392 Adjusted net income $ 31,411 Denominator: Weighted average common shares outstanding 36,365,612 Dilutive effect of outstanding restricted stock units 123,811 Weighted average common shares outstanding, including all dilutive potential shares 36,489,423 Earnings per share - basic $ 0.86 Earnings per share - diluted 0.86 Adjusted earnings per share - basic $ 0.86 Adjusted earnings per share - diluted 0.86
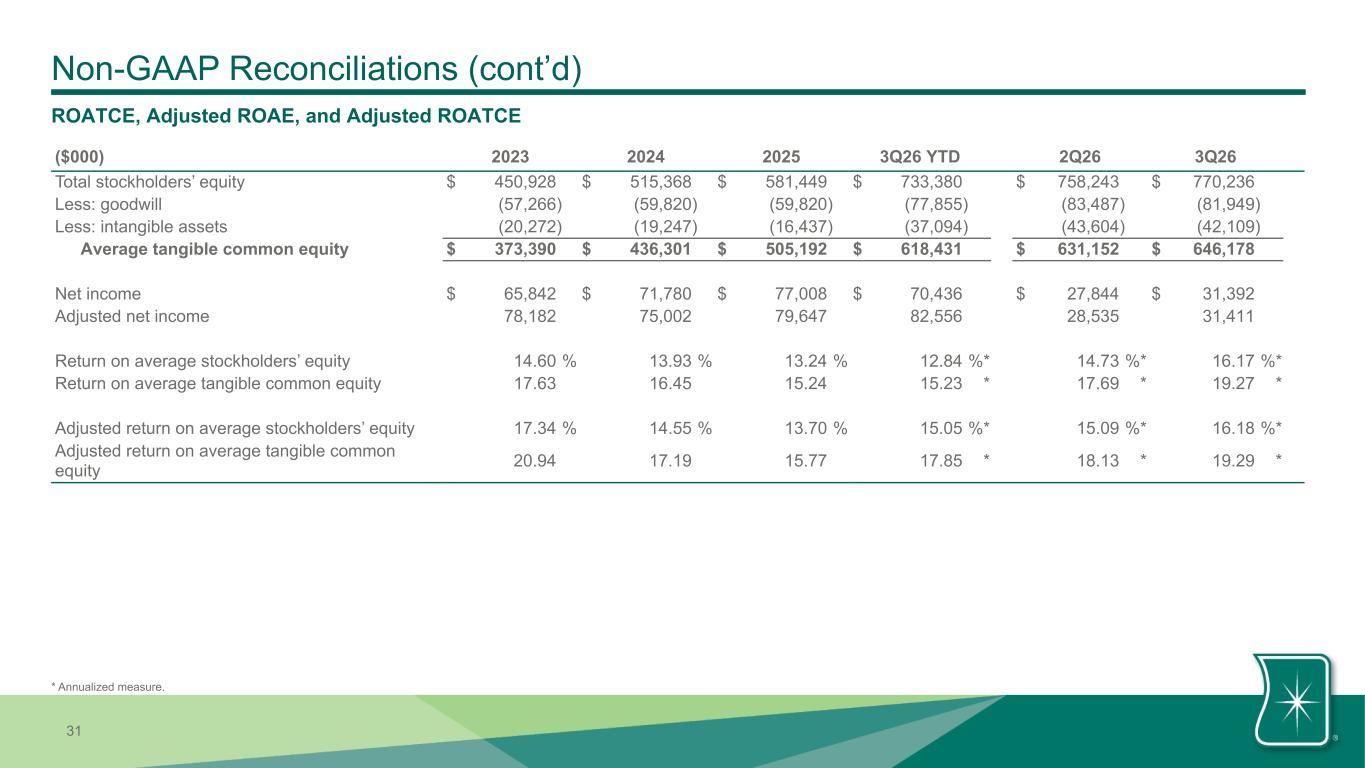
31 Non-GAAP Reconciliations (cont’d) ROATCE, Adjusted ROAE, and Adjusted ROATCE ($000) 2023 2024 2025 3Q26 YTD 2Q26 3Q26 Total stockholders’ equity $ 450,928 $ 515,368 $ 581,449 $ 733,380 $ 758,243 $ 770,236 Less: goodwill (57,266) (59,820) (59,820) (77,855) (83,487) (81,949) Less: intangible assets (20,272) (19,247) (16,437) (37,094) (43,604) (42,109) Average tangible common equity $ 373,390 $ 436,301 $ 505,192 $ 618,431 $ 631,152 $ 646,178 Net income $ 65,842 $ 71,780 $ 77,008 $ 70,436 $ 27,844 $ 31,392 Adjusted net income 78,182 75,002 79,647 82,556 28,535 31,411 Return on average stockholders’ equity 14.60 % 13.93 % 13.24 % 12.84 %* 14.73 %* 16.17 %* Return on average tangible common equity 17.63 16.45 15.24 15.23 * 17.69 * 19.27 * Adjusted return on average stockholders’ equity 17.34 % 14.55 % 13.70 % 15.05 %* 15.09 %* 16.18 %* Adjusted return on average tangible common equity 20.94 17.19 15.77 17.85 * 18.13 * 19.29 * * Annualized measure.
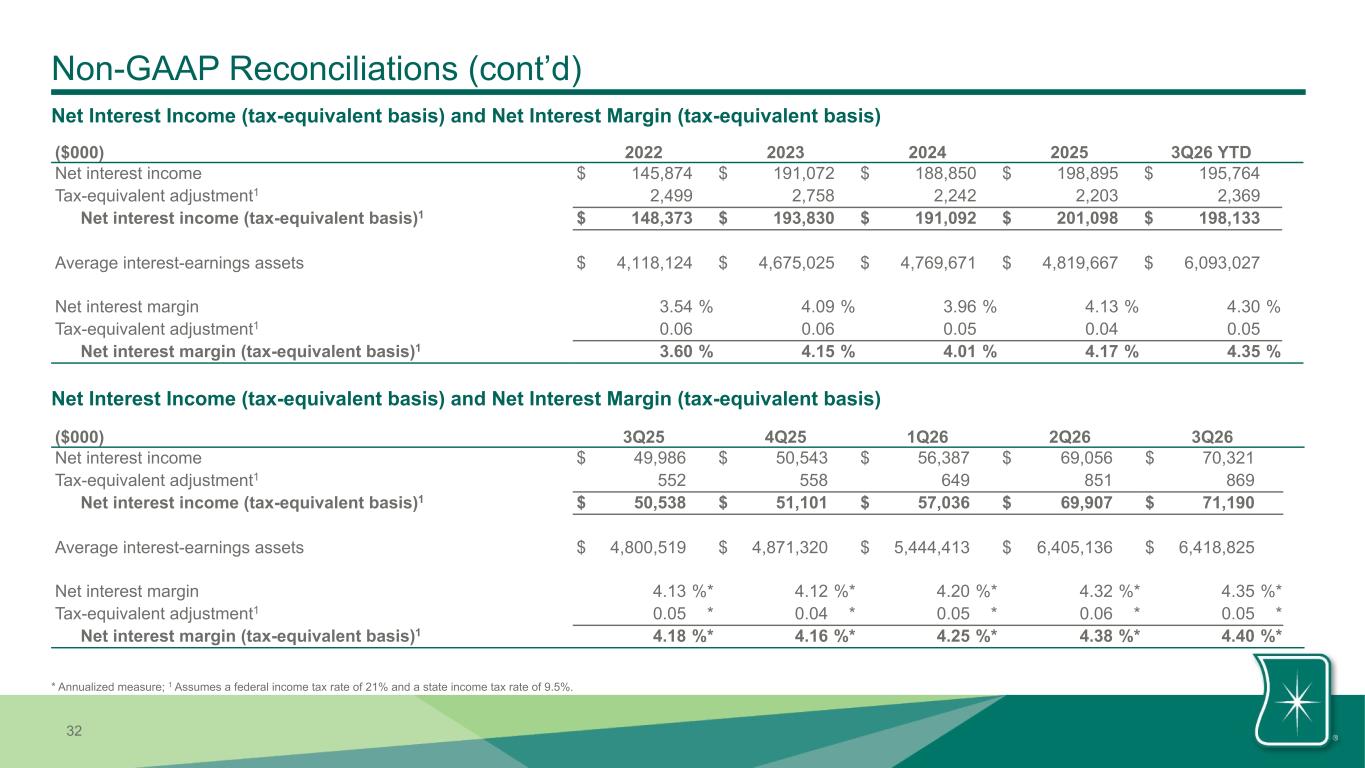
32 Non-GAAP Reconciliations (cont’d) ($000) 2022 2023 2024 2025 3Q26 YTD Net interest income $ 145,874 $ 191,072 $ 188,850 $ 198,895 $ 195,764 Tax-equivalent adjustment1 2,499 2,758 2,242 2,203 2,369 Net interest income (tax-equivalent basis)1 $ 148,373 $ 193,830 $ 191,092 $ 201,098 $ 198,133 Average interest-earnings assets $ 4,118,124 $ 4,675,025 $ 4,769,671 $ 4,819,667 $ 6,093,027 Net interest margin 3.54 % 4.09 % 3.96 % 4.13 % 4.30 % Tax-equivalent adjustment1 0.06 0.06 0.05 0.04 0.05 Net interest margin (tax-equivalent basis)1 3.60 % 4.15 % 4.01 % 4.17 % 4.35 % Net Interest Income (tax-equivalent basis) and Net Interest Margin (tax-equivalent basis) Net Interest Income (tax-equivalent basis) and Net Interest Margin (tax-equivalent basis) ($000) 3Q25 4Q25 1Q26 2Q26 3Q26 Net interest income $ 49,986 $ 50,543 $ 56,387 $ 69,056 $ 70,321 Tax-equivalent adjustment1 552 558 649 851 869 Net interest income (tax-equivalent basis)1 $ 50,538 $ 51,101 $ 57,036 $ 69,907 $ 71,190 Average interest-earnings assets $ 4,800,519 $ 4,871,320 $ 5,444,413 $ 6,405,136 $ 6,418,825 Net interest margin 4.13 %* 4.12 %* 4.20 %* 4.32 %* 4.35 %* Tax-equivalent adjustment1 0.05 * 0.04 * 0.05 * 0.06 * 0.05 * Net interest margin (tax-equivalent basis)1 4.18 %* 4.16 %* 4.25 %* 4.38 %* 4.40 %* * Annualized measure; 1 Assumes a federal income tax rate of 21% and a state income tax rate of 9.5%.
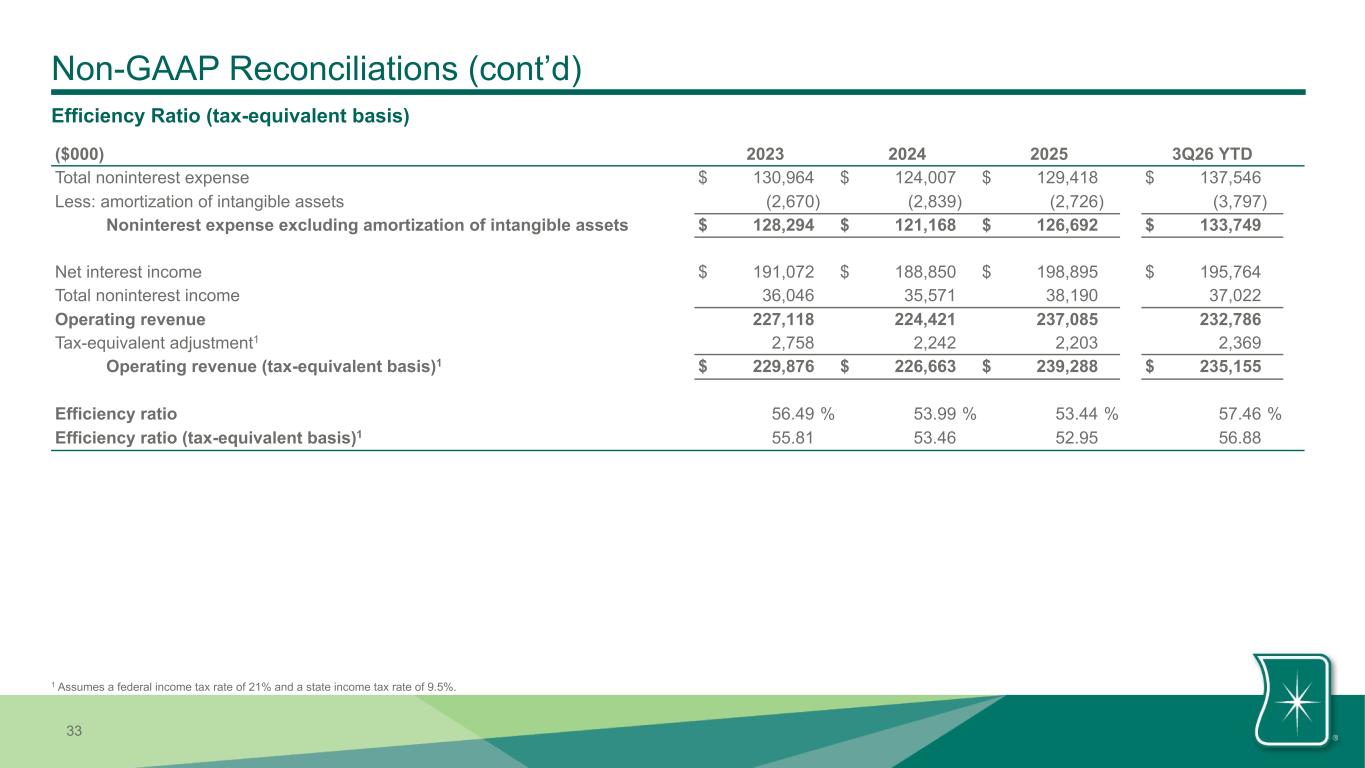
33 Non-GAAP Reconciliations (cont’d) Efficiency Ratio (tax-equivalent basis) ($000) 2023 2024 2025 3Q26 YTD Total noninterest expense $ 130,964 $ 124,007 $ 129,418 $ 137,546 Less: amortization of intangible assets (2,670) (2,839) (2,726) (3,797) Noninterest expense excluding amortization of intangible assets $ 128,294 $ 121,168 $ 126,692 $ 133,749 Net interest income $ 191,072 $ 188,850 $ 198,895 $ 195,764 Total noninterest income 36,046 35,571 38,190 37,022 Operating revenue 227,118 224,421 237,085 232,786 Tax-equivalent adjustment1 2,758 2,242 2,203 2,369 Operating revenue (tax-equivalent basis)1 $ 229,876 $ 226,663 $ 239,288 $ 235,155 Efficiency ratio 56.49 % 53.99 % 53.44 % 57.46 % Efficiency ratio (tax-equivalent basis)1 55.81 53.46 52.95 56.88 1 Assumes a federal income tax rate of 21% and a state income tax rate of 9.5%.
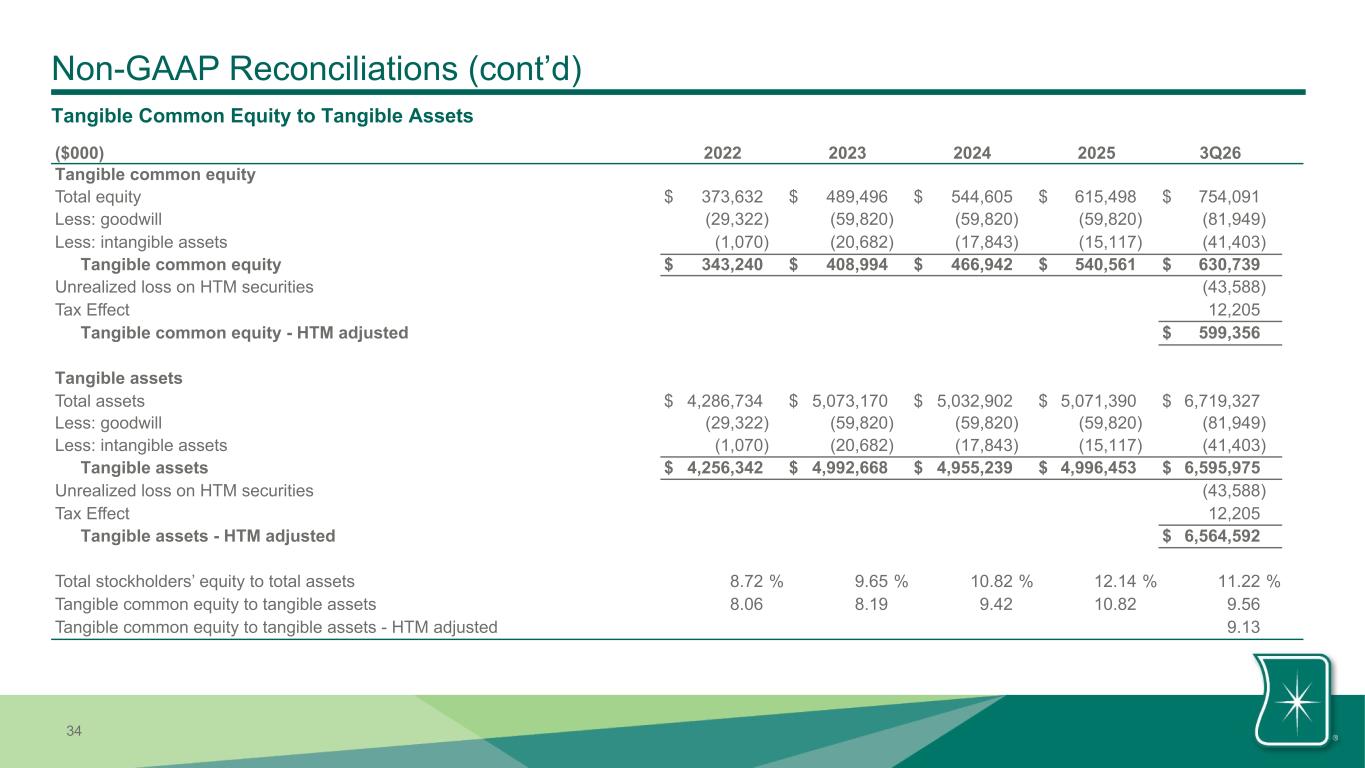
34 Non-GAAP Reconciliations (cont’d) ($000) 2022 2023 2024 2025 3Q26 Tangible common equity Total equity $ 373,632 $ 489,496 $ 544,605 $ 615,498 $ 754,091 Less: goodwill (29,322) (59,820) (59,820) (59,820) (81,949) Less: intangible assets (1,070) (20,682) (17,843) (15,117) (41,403) Tangible common equity $ 343,240 $ 408,994 $ 466,942 $ 540,561 $ 630,739 Unrealized loss on HTM securities (43,588) Tax Effect 12,205 Tangible common equity - HTM adjusted $ 599,356 Tangible assets Total assets $ 4,286,734 $ 5,073,170 $ 5,032,902 $ 5,071,390 $ 6,719,327 Less: goodwill (29,322) (59,820) (59,820) (59,820) (81,949) Less: intangible assets (1,070) (20,682) (17,843) (15,117) (41,403) Tangible assets $ 4,256,342 $ 4,992,668 $ 4,955,239 $ 4,996,453 $ 6,595,975 Unrealized loss on HTM securities (43,588) Tax Effect 12,205 Tangible assets - HTM adjusted $ 6,564,592 Total stockholders’ equity to total assets 8.72 % 9.65 % 10.82 % 12.14 % 11.22 % Tangible common equity to tangible assets 8.06 8.19 9.42 10.82 9.56 Tangible common equity to tangible assets - HTM adjusted 9.13 Tangible Common Equity to Tangible Assets
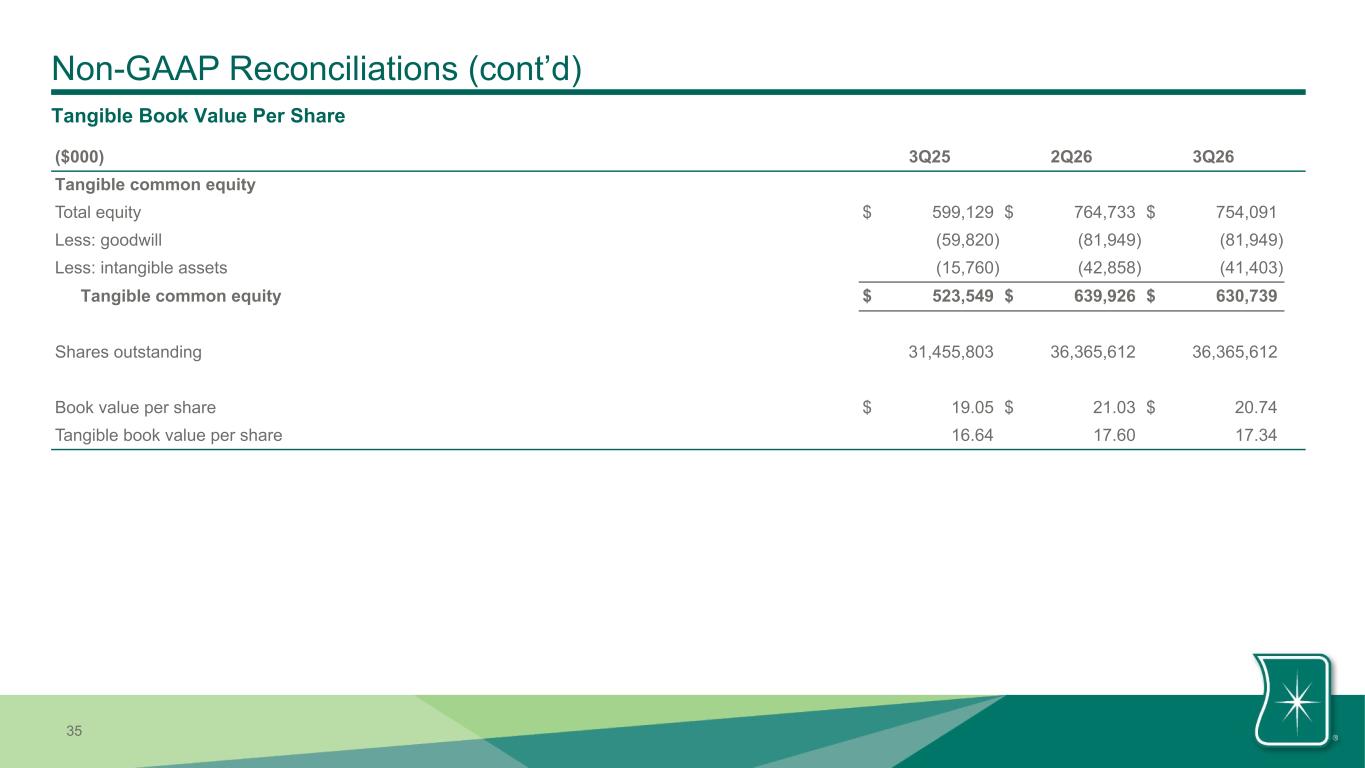
35 Non-GAAP Reconciliations (cont’d) ($000) 3Q25 2Q26 3Q26 Tangible common equity Total equity $ 599,129 $ 764,733 $ 754,091 Less: goodwill (59,820) (81,949) (81,949) Less: intangible assets (15,760) (42,858) (41,403) Tangible common equity $ 523,549 $ 639,926 $ 630,739 Shares outstanding 31,455,803 36,365,612 36,365,612 Book value per share $ 19.05 $ 21.03 $ 20.74 Tangible book value per share 16.64 17.60 17.34 Tangible Book Value Per Share
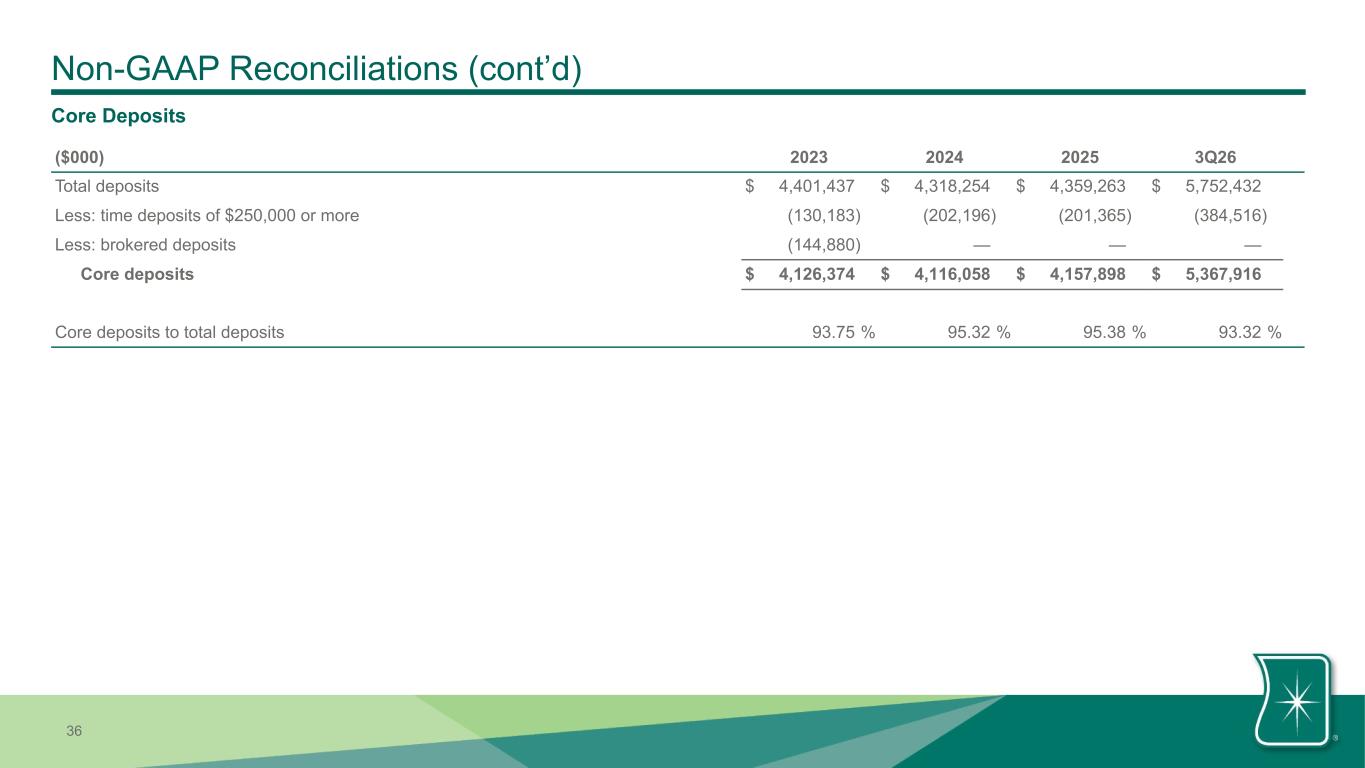
36 Non-GAAP Reconciliations (cont’d) ($000) 2023 2024 2025 3Q26 Total deposits $ 4,401,437 $ 4,318,254 $ 4,359,263 $ 5,752,432 Less: time deposits of $250,000 or more (130,183) (202,196) (201,365) (384,516) Less: brokered deposits (144,880) — — — Core deposits $ 4,126,374 $ 4,116,058 $ 4,157,898 $ 5,367,916 Core deposits to total deposits 93.75 % 95.32 % 95.38 % 93.32 % Core Deposits
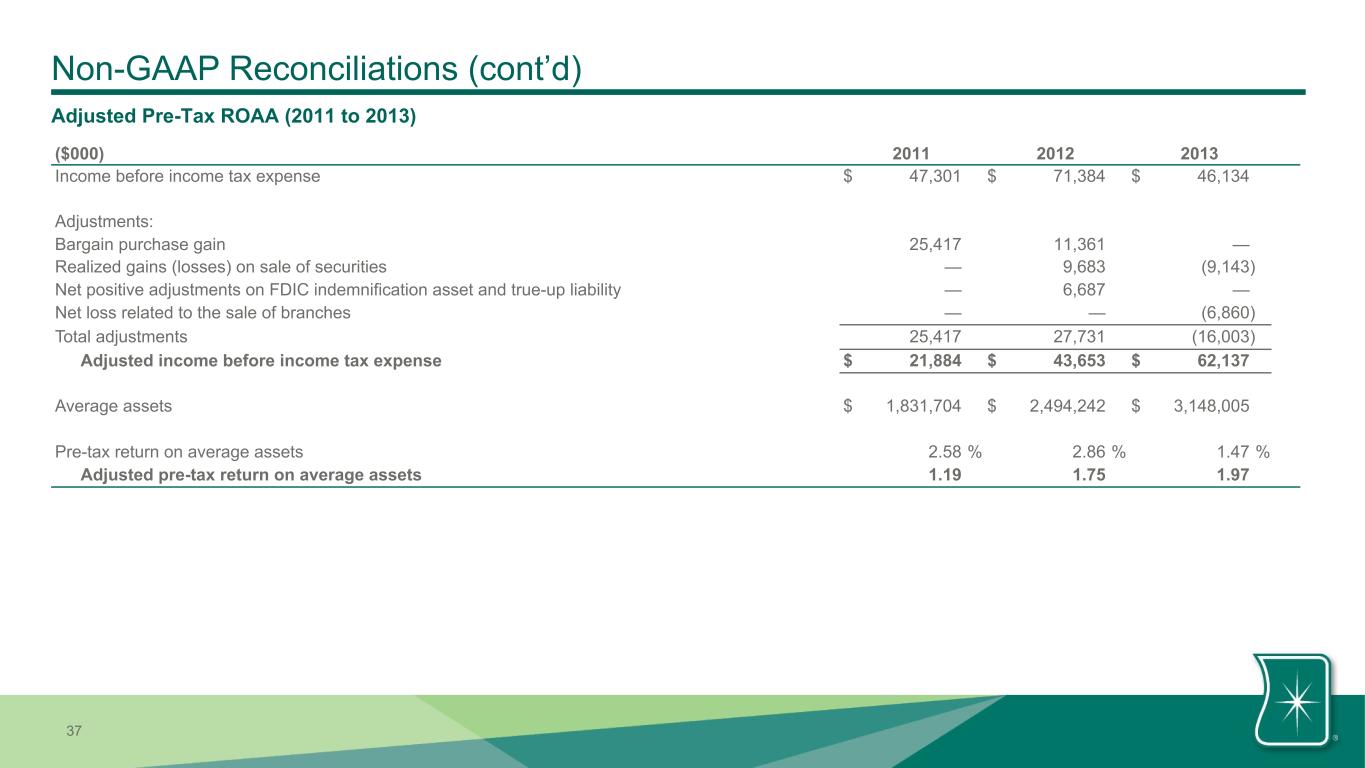
37 Non-GAAP Reconciliations (cont’d) ($000) 2011 2012 2013 Income before income tax expense $ 47,301 $ 71,384 $ 46,134 Adjustments: Bargain purchase gain 25,417 11,361 — Realized gains (losses) on sale of securities — 9,683 (9,143) Net positive adjustments on FDIC indemnification asset and true-up liability — 6,687 — Net loss related to the sale of branches — — (6,860) Total adjustments 25,417 27,731 (16,003) Adjusted income before income tax expense $ 21,884 $ 43,653 $ 62,137 Average assets $ 1,831,704 $ 2,494,242 $ 3,148,005 Pre-tax return on average assets 2.58 % 2.86 % 1.47 % Adjusted pre-tax return on average assets 1.19 1.75 1.97 Adjusted Pre-Tax ROAA (2011 to 2013)
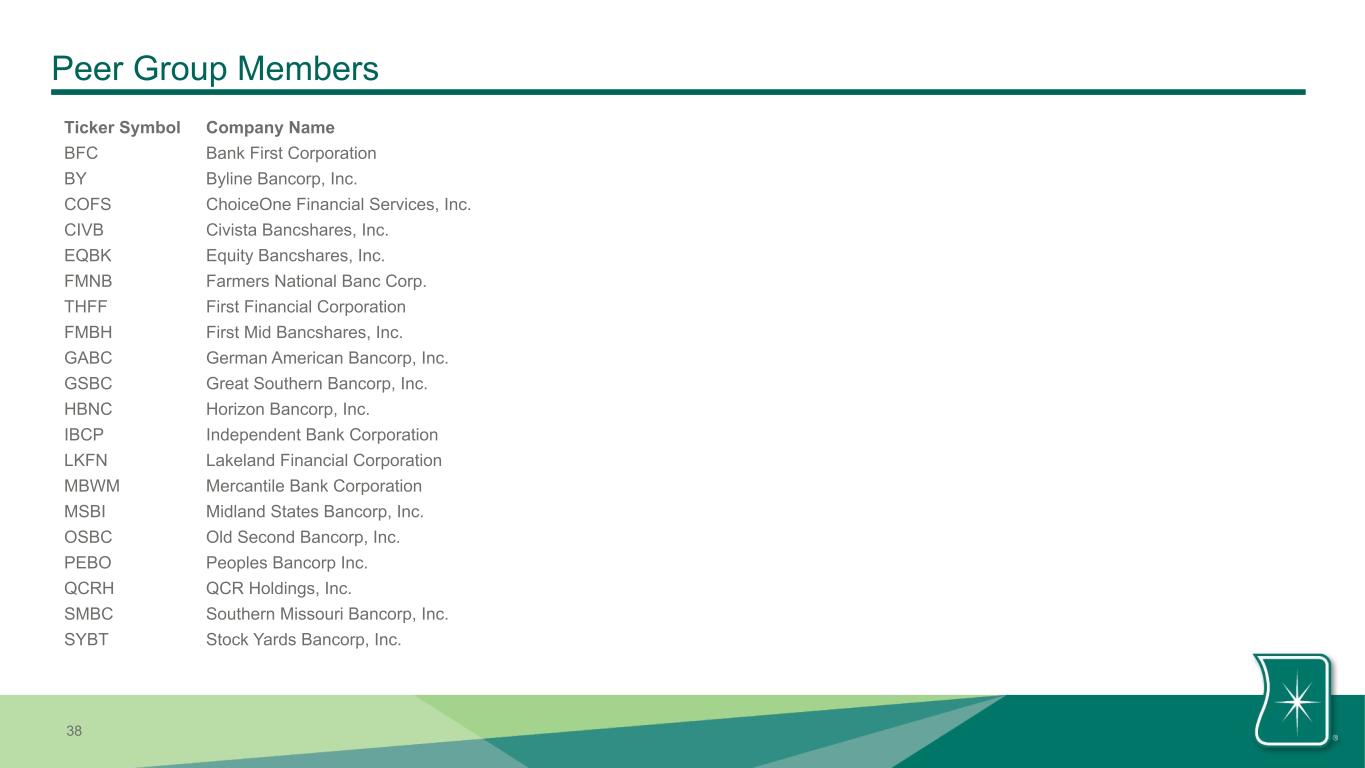
38 Peer Group Members Ticker Symbol Company Name BFC Bank First Corporation BY Byline Bancorp, Inc. COFS ChoiceOne Financial Services, Inc. CIVB Civista Bancshares, Inc. EQBK Equity Bancshares, Inc. FMNB Farmers National Banc Corp. THFF First Financial Corporation FMBH First Mid Bancshares, Inc. GABC German American Bancorp, Inc. GSBC Great Southern Bancorp, Inc. HBNC Horizon Bancorp, Inc. IBCP Independent Bank Corporation LKFN Lakeland Financial Corporation MBWM Mercantile Bank Corporation MSBI Midland States Bancorp, Inc. OSBC Old Second Bancorp, Inc. PEBO Peoples Bancorp Inc. QCRH QCR Holdings, Inc. SMBC Southern Missouri Bancorp, Inc. SYBT Stock Yards Bancorp, Inc.

0 118 104 0 118 104 0 118 104 165 211 142 165 211 142 245 230 168 245 230 168 255 255 255