Mimi L. Carsley | Chief Financial Officer | mcarsley@jackhenry.com
FOR IMMEDIATE RELEASE
Jack Henry & Associates, Inc. Reports Second Quarter Fiscal 2026 Results
Second quarter summary:
• GAAP revenue increased 7.9% and GAAP operating income increased 29.4% for the fiscal three months ended December 31, 2025, compared to the prior fiscal year quarter.
• Non-GAAP adjusted revenue increased 6.7% and non-GAAP adjusted operating income increased 24.3% for the fiscal three months ended December 31, 2025, compared to the prior fiscal year quarter.1
•GAAP EPS was $1.72 per diluted share for the fiscal three months ended December 31, 2025, compared to $1.34 per diluted share in the prior fiscal year quarter representing growth of 28.6%.
Fiscal year-to-date summary:
• GAAP revenue increased 7.6% and GAAP operating income increased 25.1% for the fiscal year-to-date period ended December 31, 2025, compared to the prior fiscal year-to-date period.
• Non-GAAP adjusted revenue increased 7.7% and non-GAAP adjusted operating income increased 21.2% for the fiscal year-to-date period ended December 31, 2025, compared to the prior fiscal year-to-date period.1
• GAAP EPS was $3.70 per diluted share for the fiscal year-to-date period ended December 31, 2025, compared to $2.97 per diluted share in the prior fiscal year-to-date period representing growth of 24.5%.
• Cash and cash equivalents were $28.2 million at December 31, 2025, and $25.7 million at December 31, 2024.
• Debt outstanding related to credit facilities was $20 million at December 31, 2025, and $150 million at December 31, 2024.
Compared to the same period in the prior fiscal year:
Second Qtr Revenue
Second Qtr Operating Income
FY'26 YTD Net Income
GAAP
Non-GAAP1
GAAP
Non-GAAP1
GAAP
Non-GAAP1
increased
increased
increased
increased
increased
increased
7.9%
6.7%
29.4%
24.3%
23.8%
20.0%
FY'26 YTD Revenue
FY'26 YTD Operating Income
FY'26 YTD EBITDA
GAAP
Non-GAAP1
GAAP
Non-GAAP1
Non-GAAP2
increased
increased
increased
increased
increased
7.6%
7.7%
25.1%
21.2%
16.0%
Full year fiscal 2026 guidance (Dollars in millions):3
Current
GAAP
Low
High
Revenue
$2,508
$2,525
Operating margin4
24.3%
24.5%
EPS
$6.61
$6.72
Non-GAAP5
Adjusted revenue
$2,474
$2,491
Adjusted operating margin
23.7%
23.9%
Monett, MO, February 3, 2026 - Jack Henry & Associates, Inc. (Nasdaq: JKHY), a leading financial technology provider, today announced results for fiscal second quarter ended December 31, 2025.
1 See tables below on page 4 reconciling non-GAAP financial measures to GAAP.
2See table below on page 14 reconciling net income to non-GAAP EBITDA.
3 The full fiscal year guidance assumes no additional acquisitions or dispositions will be made during fiscal year 2026.
4Operating margin is calculated by dividing operating income by revenue.
5 See tables below on page 9 reconciling fiscal year 2026 GAAP to non-GAAP guidance.
1
According to Greg Adelson, President and CEO, “We are pleased to report very strong financial results for the second quarter of our fiscal year. Our sales teams delivered outstanding results across all areas, including our core segment where we won 22 competitive core deals in the quarter while maintaining a robust pipeline fueled by a growing demand environment. Our new public cloud-native solutions – including the Jack Henry Platform™, Tap2Local™ and Rapid Transfers – are experiencing strong momentum and providing meaningful competitive advantages for our bank and credit union clients. We are extremely well-positioned in the market and remain laser-focused on our key differentiators of culture, service, innovation, strategy, and execution.”
Operating Results
Revenue, operating expenses, operating income, and net income for the fiscal three and six months ended December 31, 2025, compared to the fiscal three and six months ended December 31, 2024, were as follows:
Revenue
(Unaudited, dollars in thousands)
Three Months Ended December 31,
% Change
Six Months Ended December 31,
% Change
2025
2024
2025
2024
Revenue
Services and Support
$
345,809
$
323,027
7.1
%
$
722,659
$
679,706
6.3
%
Percentage of Total Revenue
55.8
%
56.3
%
57.2
%
57.9
%
Processing
273,525
250,821
9.1
%
541,412
495,123
9.3
%
Percentage of Total Revenue
44.2
%
43.7
%
42.8
%
42.1
%
REVENUE
$
619,334
$
573,848
7.9
%
$
1,264,071
$
1,174,829
7.6
%
•Services and support revenue increased for the fiscal three months ended December 31, 2025, primarily driven by growth in data processing and hosting revenue within private and public cloud revenue of 9.2% and higher deconversion revenue by $6,143. Processing revenue increased for the fiscal three months ended December 31, 2025, primarily driven by growth in digital and transaction revenue of 14.8%, card revenue of 6.1%, and faster payments products revenue, of 52.1%.
•Services and support revenue increased for the fiscal six months ended December 31, 2025, primarily driven by growth in data processing and hosting revenue within private and public cloud revenue of 8.6% and higher deconversion revenue by $11,072. Processing revenue increased for the fiscal six months ended December 31, 2025, primarily driven by growth in card revenue of 7.5%, digital and transaction revenue of 14.3%, and faster payments products revenue of 53.9%.
•For the fiscal three months ended December 31, 2025, core segment revenue increased 8.4%, payments segment revenue increased 8.0%, complementary segment revenue increased 9.6%, and corporate and other segment revenue decreased 9.8%. For the fiscal three months ended December 31, 2025, core segment non-GAAP adjusted revenue increased 7.4%, payments segment non-GAAP adjusted revenue increased 6.4%, complementary segment non-GAAP adjusted revenue increased 8.7%, and corporate and other non-GAAP adjusted segment revenue decreased 10.1%. Total non-GAAP adjusted revenue increased 6.7% for the same period (see revenue lines of segment break-out tables on pages 5 and 6 below for a reconciliation of GAAP segment revenue to non-GAAP adjusted segment revenue).
•For the fiscal six months ended December 31, 2025, core segment revenue increased 4.2%, payments segment revenue increased 8.5%, complementary segment revenue increased 9.9%, and corporate and other segment revenue increased 9.3%. For the fiscal six months ended December 31, 2025, core segment non-GAAP adjusted revenue increased 6.8%, payments segment non-GAAP adjusted revenue increased 7.4%, complementary segment non-GAAP adjusted revenue increased 9.0%, and corporate and other non-GAAP adjusted segment revenue increased 9.0%. Total non-GAAP adjusted revenue increased 7.7% for the same period (see revenue lines of segment break-out tables on pages 7 and 8 below for a reconciliation of GAAP segment revenue to non-GAAP adjusted segment revenue).
2
Operating Expenses and Operating Income
(Unaudited, dollars in thousands)
Three Months Ended December 31,
% Change
Six Months Ended December 31,
% Change
2025
2024
2025
2024
Cost of Revenue
$
350,989
$
332,850
5.4
%
$
699,554
$
676,282
3.4
%
Percentage of Total Revenue6
56.7
%
58.0
%
55.3
%
57.6
%
Research and Development
42,228
41,095
2.8
%
81,505
80,780
0.9
%
Percentage of Total Revenue6
6.8
%
7.2
%
6.4
%
6.9
%
Selling, General, and Administrative
66,969
76,901
(12.9)
%
139,799
143,489
(2.6)
%
Percentage of Total Revenue6
10.8
%
13.4
%
11.1
%
12.2
%
OPERATING EXPENSES
460,186
450,846
2.1
%
920,858
900,551
2.3
%
OPERATING INCOME
$
159,148
$
123,002
29.4
%
$
343,213
$
274,278
25.1
%
Operating Margin6
25.7
%
21.4
%
27.2
%
23.3
%
•Cost of revenue increased for the fiscal three months ended December 31, 2025, compared to the fiscal three months ended December 31, 2024, primarily due to higher direct costs generally consistent with increases in related lines of revenue and higher personnel costs tempered by lower than normal medical claims, quarter-over-quarter.
•Cost of revenue increased for the fiscal six months ended December 31, 2025, compared to the fiscal six months ended December 31, 2024, primarily due to higher direct costs generally consistent with increases in related lines of revenue, higher personnel costs tempered by lower than normal medical claims, and increased amortization of intangible assets, period over period.
•Research and development expense increased for the fiscal three and six months ended December 31, 2025, compared to the fiscal three and six months ended December 31, 2024.
•Selling, general, and administrative expense decreased for the fiscal three months ended December 31, 2025, compared to the fiscal three months ended December 31, 2024, primarily due to the decrease in travel and entertainment and meeting expenses related to the timing of our Connect conference and the higher gain on sale of assets, net, in the current fiscal year quarter of $3,032 compared to the prior fiscal year quarter.
•Selling, general, and administrative expense decreased for the fiscal six months ended December 31, 2025, compared to the fiscal six months ended December 31, 2024, primarily due to higher personnel costs partially related to a limited increase in employee headcount in the trailing twelve months and higher professional service costs that were more than offset by lower than normal medical claims and the higher gain on sale of assets, net, in the current fiscal year period of $6,829 compared to the prior fiscal year period.
Net Income
(Unaudited, in thousands,
except per share data)
Three Months Ended December 31,
% Change
Six Months Ended December 31,
% Change
2025
2024
2025
2024
Income Before Income Taxes
$
164,193
$
127,381
28.9
%
$
354,511
$
284,179
24.7
%
Provision for Income Taxes
39,525
29,536
33.8
%
85,856
67,143
27.9
%
NET INCOME
$
124,668
$
97,845
27.4
%
$
268,655
$
217,036
23.8
%
Diluted earnings per share
$
1.72
$
1.34
28.6
%
$
3.70
$
2.97
24.5
%
•Effective tax rates for the fiscal three and six months ended December 31, 2025, and 2024, were 24.1% and 24.2% and 23.2% and 23.6%, respectively.
According to Mimi Carsley, CFO and Treasurer, “Our second quarter results included continuing robust growth in key areas of our revenue that include solid growth in cloud revenue, demand momentum from our faster payments products, card and digital. Overall, revenue grew 8% on a GAAP basis and 7% on a non-GAAP basis. Revenue growth contributed to non-GAAP operating income growth of over 24%, benefitting from our disciplined approach to costs and lower than normal medical claims experience on our self-insured healthcare plan.”
6Operating margin is calculated by dividing operating income by revenue. Operating margin plus operating expense components as a percentage of total revenue may not equal 100% due to rounding.
3
Impact of Non-GAAP Adjustments
The tables below show our revenue, operating income, and net income for the fiscal three and six months ended December 31, 2025, compared to the fiscal three and six months ended December 31, 2024, excluding the impacts of deconversions in the fiscal quarters and fiscal year-to-date periods ended December 31, 2025, and December 31, 2024, the gain on sale of assets, net, in the current fiscal quarter and fiscal year-to-date period, the impact of a contract change in the prior fiscal quarter and fiscal year-to-date period, and the acquisition in the current fiscal quarter and fiscal year-to-date period.
(Unaudited, dollars in thousands)
Three Months Ended December 31,
% Change
Six Months Ended December 31,
% Change
2025
2024
2025
2024
GAAP Revenue*
$
619,334
$
573,848
7.9
%
$
1,264,071
$
1,174,829
7.6
%
Adjustments:
Deconversion revenue
(6,212)
(69)
(14,838)
(3,766)
Revenue related to a contract change
—
(1,223)
—
(13,471)
Revenue from the acquisition
(1,945)
—
(1,945)
—
NON-GAAP ADJUSTED REVENUE*
$
611,177
$
572,556
6.7
%
$
1,247,288
$
1,157,592
7.7
%
GAAP Operating Income
$
159,148
$
123,002
29.4
%
$
343,213
$
274,278
25.1
%
Adjustments:
Operating (income) loss from deconversions
(3,600)
622
(10,701)
(2,873)
Operating income related to a contract change
—
(164)
—
(1,970)
Gain on sale of assets, net
(3,032)
—
(6,829)
—
Operating (income) loss from the acquisition
984
—
984
—
NON-GAAP ADJUSTED OPERATING INCOME
$
153,500
$
123,460
24.3
%
$
326,667
$
269,435
21.2
%
Non-GAAP Adjusted Operating Margin**
25.1
%
21.6
%
26.2
%
23.3
%
GAAP Net Income
$
124,668
$
97,845
27.4
%
$
268,655
$
217,036
23.8
%
Adjustments:
Net (income) loss from deconversions
(3,600)
622
(10,701)
(2,873)
Net income related to a contract change
—
(164)
(1,970)
Gain on sale of assets, net
(3,032)
—
(6,829)
—
Net loss from the acquisition
984
—
984
—
Tax impact of adjustments***
1,356
(110)
3,971
1,162
NON-GAAP ADJUSTED NET INCOME
$
120,376
$
98,193
22.6
%
$
256,080
$
213,355
20.0
%
*GAAP revenue is comprised of services and support and processing revenues (see page 2). Services and support revenue less deconversion revenue for the three months ended December 31, 2025, and 2024 which was $6,212 for the current fiscal year quarter and $69 for the prior fiscal year quarter, and reducing the three months ended December 31, 2024, amount also for revenue related to a contractual change of $1,223, results in non-GAAP adjusted services and support revenue growth of 5.6% quarter over quarter. Processing revenue less revenue from the acquisition for the three months ended December 31, 2025, of $1,945, results in non-GAAP adjusted processing revenue growth of 8.3% quarter over quarter.
Services and support revenue less deconversion revenue for the six months ended December 31, 2025, and 2024 which was $14,838 for the current fiscal year period and $3,766 for the prior fiscal year period, and reducing the six months ended December 31, 2024, amount also for revenue related to a contractual change of $13,471, results in non-GAAP adjusted services and support revenue growth of 6.8% period over period. Processing revenue less revenue from the acquisition for the three months ended December 31, 2025, of $1,945, results in non-GAAP adjusted processing revenue growth of 9.0% period over period.
**Non-GAAP adjusted operating margin is calculated by dividing non-GAAP adjusted operating income by non-GAAP adjusted revenue.
***The tax impact of adjustments is calculated using a tax rate of 24% for the fiscal three and six months ended December 31, 2025, and 2024. The tax rate for non-GAAP adjustment items takes a broad look at the Company's recurring tax adjustments and applies them to non-GAAP revenue that does not have its own specific tax impacts.
4
The tables below show the segment break-out of revenue and cost of revenue for each period presented, as adjusted for the items above, and include a reconciliation to non-GAAP adjusted operating income presented above.
Three Months Ended December 31, 2025
(Unaudited, dollars in thousands)
Core
Payments
Complementary
Corporate and Other
Total
GAAP REVENUE
$
186,100
$
231,975
$
181,708
$
19,551
$
619,334
Non-GAAP adjustments*
(3,050)
(3,342)
(1,702)
(63)
(8,157)
NON-GAAP ADJUSTED REVENUE
183,050
228,633
180,006
19,488
611,177
GAAP COST OF REVENUE
74,930
120,044
69,265
86,750
350,989
Non-GAAP adjustments*
(703)
(2,547)
(288)
(94)
(3,632)
NON-GAAP ADJUSTED COST OF REVENUE
74,227
117,497
68,977
86,656
347,357
GAAP SEGMENT INCOME
$
111,170
$
111,931
$
112,443
$
(67,199)
Segment Income Margin**
59.7
%
48.3
%
61.9
%
(343.7)
%
NON-GAAP ADJUSTED SEGMENT INCOME
$
108,823
$
111,136
$
111,029
$
(67,168)
Non-GAAP Adjusted Segment Income Margin**
59.4
%
48.6
%
61.7
%
(344.7)
%
Research and Development
42,228
Selling, General, and Administrative
66,969
Non-GAAP adjustments unassigned to a segment***
1,123
NON-GAAP TOTAL ADJUSTED OPERATING EXPENSES
457,677
NON-GAAP ADJUSTED OPERATING INCOME
$
153,500
*Revenue non-GAAP adjustments for the Payments segment were ($1,945) of acquisition revenue and ($1,397) of deconversion revenue. Revenue non-GAAP adjustments for the remainder of the segments were deconversion revenue. Cost of revenue non-GAAP adjustments for the Payments segment were ($2,409) of acquisition costs and ($138) of deconversion costs. Cost of revenue non-GAAP adjustment for the Corporate and Other segment was acquisition costs. Cost of revenue non-GAAP adjustments for the remainder of the segments were deconversion costs.
**Segment income margin is calculated by dividing segment income by revenue for each segment. Non-GAAP adjusted segment income margin is calculated by dividing non-GAAP adjusted segment income by non-GAAP adjusted revenue for each segment.
***Non-GAAP adjustments unassigned to a segment were a gain on sale of assets of $3,032 less deconversion costs of $1,484, research and development costs related to the acquisition of $371, and selling, general, and administrative costs related to the acquisition of $54.
5
Three Months Ended December 31, 2024
(Unaudited, dollars in thousands)
Core
Payments
Complementary
Corporate and Other
Total
GAAP REVENUE
$
171,607
$
214,836
$
165,732
$
21,673
$
573,848
Non-GAAP adjustments*
(1,203)
(34)
(60)
5
(1,292)
NON-GAAP ADJUSTED REVENUE
170,404
214,802
165,672
21,678
572,556
GAAP COST OF REVENUE
70,324
114,738
64,542
83,246
332,850
Non-GAAP adjustments*
(1,147)
(53)
(99)
—
(1,299)
NON-GAAP ADJUSTED COST OF REVENUE
69,177
114,685
64,443
83,246
331,551
GAAP SEGMENT INCOME
$
101,283
$
100,098
$
101,190
$
(61,573)
Segment Income Margin**
59.0
%
46.6
%
61.1
%
(284.1)
%
NON-GAAP ADJUSTED SEGMENT INCOME
$
101,227
$
100,117
$
101,229
$
(61,568)
Non-GAAP Adjusted Segment Income Margin
59.4
%
46.6
%
61.1
%
(284.0)
%
Research and Development
41,095
Selling, General, and Administrative
76,901
Non-GAAP adjustments unassigned to a segment***
(451)
NON-GAAP TOTAL ADJUSTED OPERATING EXPENSES
449,096
NON-GAAP ADJUSTED OPERATING INCOME
$
123,460
*Revenue non-GAAP adjustments for the Core segment were ($1,223) of revenue related to the contractual change and $20 of deconversion revenue. Revenue non-GAAP adjustments for the remainder of the segments were deconversion revenue. Cost of revenue non-GAAP adjustments for the Core segment were cost of revenue related to a contractual change of ($1,059) and ($88) of deconversion costs. Cost of revenue non-GAAP adjustments for the remainder of the segments were deconversion costs.
**Segment income margin is calculated by dividing segment income by revenue for each segment. Non-GAAP adjusted segment income margin is calculated by dividing non-GAAP adjusted segment income by non-GAAP adjusted revenue for each segment.
***Non-GAAP adjustments unassigned to a segment were deconversion costs.
6
Six Months Ended December 31, 2025
(Unaudited, dollars in thousands)
Core
Payments
Complementary
Corporate and Other
Total
GAAP REVENUE
$
381,393
$
462,868
$
375,926
$
43,884
$
1,264,071
Non-GAAP adjustments*
(6,269)
(6,825)
(3,578)
(111)
(16,783)
NON-GAAP ADJUSTED REVENUE
375,124
456,043
372,348
43,773
1,247,288
GAAP COST OF REVENUE
148,067
238,703
141,526
171,258
699,554
Non-GAAP adjustments*
(1,146)
(2,698)
(596)
(95)
(4,535)
NON-GAAP ADJUSTED COST OF REVENUE
146,921
236,005
140,930
171,163
695,019
GAAP SEGMENT INCOME
$
233,326
$
224,165
$
234,400
$
(127,374)
Segment Income Margin**
61.2
%
48.4
%
62.4
%
(290.3)
%
NON-GAAP ADJUSTED SEGMENT INCOME
$
228,203
$
220,038
$
231,418
$
(127,390)
Non-GAAP Adjusted Segment Income Margin
60.8
%
48.2
%
62.2
%
(291.0)
%
Research and Development
81,505
Selling, General, and Administrative
139,799
Non-GAAP adjustments unassigned to a segment***
4,298
NON-GAAP TOTAL ADJUSTED OPERATING EXPENSES
920,621
NON-GAAP ADJUSTED OPERATING INCOME
$
326,667
*Revenue non-GAAP adjustments for the Payments segment were ($1,945) of acquisition revenue and ($4,880) of deconversion revenue. Revenue non-GAAP adjustments for the remainder of the segments were deconversion revenue. Cost of revenue non-GAAP adjustments for the Payments segment were ($2,409) of acquisition costs and ($289) of deconversion costs. Cost of revenue non-GAAP adjustments for the Corporate and Other segment were ($94) of acquisition costs and ($1) of deconversion costs. Cost of revenue non-GAAP adjustments for the remainder of the segments were deconversion costs.
**Segment income margin is calculated by dividing segment income by revenue for each segment. Non-GAAP adjusted segment income margin is calculated by dividing non-GAAP adjusted segment income by non-GAAP adjusted revenue for each segment.
***Non-GAAP adjustments unassigned to a segment were a gain on sale of assets of $6,829 less deconversion costs of $2,106, research and development costs related to the acquisition of $371, and selling, general, and administrative costs related to the acquisition of $54.
7
Six Months Ended December 31, 2024
(Unaudited, dollars in thousands)
Core
Payments
Complementary
Corporate and Other
Total
GAAP REVENUE
$
365,896
$
426,758
$
342,012
$
40,163
$
1,174,829
Non-GAAP adjustments*
(14,738)
(1,948)
(533)
(18)
(17,237)
NON-GAAP ADJUSTED REVENUE
351,158
424,810
341,479
40,145
1,157,592
GAAP COST OF REVENUE
151,271
227,757
131,686
165,568
676,282
Non-GAAP adjustments*
(11,626)
(71)
(159)
—
(11,856)
NON-GAAP ADJUSTED COST OF REVENUE
139,645
227,686
131,527
165,568
664,426
GAAP SEGMENT INCOME
$
214,625
$
199,001
$
210,326
$
(125,405)
Segment Income Margin**
58.7
%
46.6
%
61.5
%
(312.2)
%
NON-GAAP ADJUSTED SEGMENT INCOME
$
211,513
$
197,124
$
209,952
$
(125,423)
Non-GAAP Adjusted Segment Income Margin
60.2
%
46.4
%
61.5
%
(312.4)
%
Research and Development
80,780
Selling, General, and Administrative
143,489
Non-GAAP adjustments unassigned to a segment***
(538)
NON-GAAP TOTAL ADJUSTED OPERATING EXPENSES
888,157
NON-GAAP ADJUSTED OPERATING INCOME
$
269,435
*Revenue non-GAAP adjustments for the Core segment were ($13,471) of revenue related to the contractual change and ($1,267) of deconversion revenue. Revenue non-GAAP adjustments for the remainder of the segments were deconversion revenue. Cost of revenue non-GAAP adjustments for the Core segment were cost of revenue related to a contractual change of ($11,501) and ($125) of deconversion costs. Cost of revenue non-GAAP adjustments for the remainder of the segments were deconversion costs.
**Segment income margin is calculated by dividing segment income by revenue for each segment. Non-GAAP adjusted segment income margin is calculated by dividing non-GAAP adjusted segment income by non-GAAP adjusted revenue for each segment.
***Non-GAAP adjustments unassigned to a segment were deconversion costs.
8
The table below shows our GAAP to non-GAAP guidance for the fiscal year ending June 30, 2026. Fiscal year 2026 non-GAAP guidance excludes the impacts of deconversion revenue and related operating expenses, acquisition revenues and related operating expenses, the revenues and operating expenses related to a contractual change, and the gain on sale of assets, and assumes no additional acquisitions or dispositions will be made during the fiscal year.
GAAP to Non-GAAP GUIDANCE (Dollars in millions, except per share data)
Annual FY'26
Adjusted for FY26 Comparison
Reported
Contractual Change
Low
High
FY25
FY25
FY25
GAAP REVENUE
$
2,508
$
2,525
$
2,375
$
2,375
$
—
Growth
5.6
%
6.3
%
Deconversions*
28
28
34
34
—
Acquisition
6
6
—
—
—
Contractual change
—
—
16
—
16
NON-GAAP ADJUSTED REVENUE**
$
2,474
$
2,491
$
2,326
$
2,341
$
(16)
Non-GAAP Adjusted Growth
6.4
%
7.1
%
GAAP OPERATING EXPENSES
$
1,900
$
1,906
$
1,807
$
1,807
$
—
Growth
5.2
%
5.5
%
Deconversion costs*
7
7
6
6
—
Acquisition costs
11
11
—
—
—
Contractual change
—
—
14
—
14
Gain on sale of assets
(7)
(7)
—
—
—
NON-GAAP ADJUSTED OPERATING EXPENSES**
$
1,889
$
1,895
$
1,787
$
1,800
$
(14)
Non-GAAP Adjusted Growth
5.7
%
6.1
%
GAAP OPERATING INCOME
$
609
$
619
$
569
$
569
$
—
Growth
7.0
%
8.8
%
GAAP OPERATING MARGIN
24.3
%
24.5
%
23.9
%
23.9
%
NON-GAAP ADJUSTED OPERATING INCOME**
$
586
$
596
$
539
$
541
$
(2)
Non-GAAP Adjusted Growth
8.7
%
10.6
%
NON-GAAP ADJUSTED OPERATING MARGIN
23.7
%
23.9
%
23.2
%
23.1
%
GAAP EPS
$
6.61
$
6.72
$
6.24
$
6.24
$
—
Growth
6.0
%
7.7
%
*Deconversion revenue and related operating expenses are based on actual results for fiscal six months ended December 31, 2025, and estimates for the remainder of the fiscal year 2026. See the Company’s Form 8-K filed with the Securities and Exchange Commission on January 27, 2026.
**GAAP to Non-GAAP revenue, operating expenses, and operating income may not foot due to rounding.
9
Balance Sheet and Cash Flow Review
•Cash and cash equivalents were $28 million at December 31, 2025, compared to $26 million at December 31, 2024.
•Trade receivables were $298 million at December 31, 2025, compared to $283 million at December 31, 2024.
•The Company had $20 million of borrowings at December 31, 2025, compared to $150 million of borrowings at December 31, 2024.
•Deferred revenue was $271 million at December 31, 2025, compared to $269 million at December 31, 2024.
•Stockholders' equity increased to $2,203 million at December 31, 2025, compared to $1,976 million at December 31, 2024.
*See table below for Net Cash Provided by Operating Activities and on page 14 for Return on Average Shareholders’ Equity. Tables reconciling the non-GAAP measures Free Cash Flow and Net Operating Profit After Tax Return on Invested Capital (NOPAT ROIC) to GAAP measures are on pages 14 and 15. See the Use of Non-GAAP Financial Information section below for the definitions of Free Cash Flow and NOPAT ROIC.
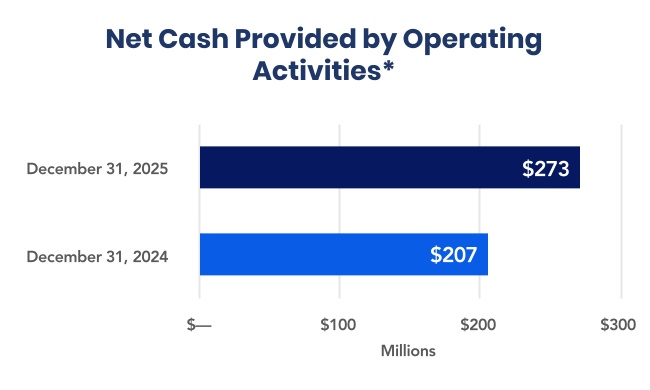
The following table summarizes net cash from operating activities:
(Unaudited, in thousands)
Six Months Ended December 31,
2025
2024
Net income
$
268,655
$
217,036
Depreciation
20,743
22,731
Amortization
84,304
79,517
Change in deferred income taxes
69,734
(8,745)
Other non-cash expenses
9,416
15,535
Change in receivables
21,385
49,811
Change in deferred revenue
(92,379)
(119,463)
Change in other assets and liabilities*
(108,603)
(49,879)
NET CASH FROM OPERATING ACTIVITIES
$
273,255
$
206,543
*For the fiscal six months ended December 31, 2025, the change in other assets and liabilities includes the change in prepaid expenses, deferred costs and other of $(56,056), accrued expenses of $(34,863), income taxes of $(9,345), and the change in accounts payable of $(8,339). For the fiscal six months ended December 31, 2024, the change in other assets and liabilities includes the change in prepaid expenses, deferred costs and other of $(34,384), the change in accrued expenses of $(19,450), the change in accounts payable of $(5,583) partially offset by the change in income taxes of $9,538.
10
The following table summarizes net cash from investing activities:
(Unaudited, in thousands)
Six Months Ended December 31,
2025
2024
Payment for acquisitions
$
(42,391)
$
—
Capital expenditures
(30,096)
(29,469)
Proceeds from sale of assets
24,572
—
Purchased software
(2,908)
(3,528)
Computer software developed
(92,484)
(85,803)
Purchase of investments
(13,500)
(2,000)
Proceeds from investments
1,000
1,000
NET CASH FROM INVESTING ACTIVITIES
$
(155,807)
$
(119,800)
The following table summarizes net cash from financing activities:
(Unaudited, in thousands)
Six Months Ended December 31,
2025
2024
Borrowings on credit facilities
$
125,000
$
165,000
Repayments on credit facilities
(105,000)
(165,000)
Purchase of treasury stock
(125,237)
(17,050)
Dividends paid
(83,979)
(80,193)
Net cash from issuance of stock and tax related to stock-based compensation
(1,969)
(2,131)
NET CASH FROM FINANCING ACTIVITIES
$
(191,185)
$
(99,374)
Use of Non-GAAP Financial Information
Generally Accepted Accounting Principles (GAAP) is the term used to refer to the standard framework of guidelines for financial accounting in the United States. GAAP includes the standards, conventions, and rules accountants follow in recording and summarizing transactions in the preparation of financial statements. In addition to reporting financial results in accordance with GAAP, we have provided certain non-GAAP financial measures, including adjusted revenue, adjusted segment revenue, adjusted operating income, adjusted segment income, adjusted cost of revenue, adjusted segment cost of revenue, adjusted operating expenses, adjusted operating margin, adjusted segment income margin, non-GAAP earnings before interest, taxes, depreciation, and amortization (non-GAAP EBITDA), free cash flow, net operating profit after tax return on invested capital (NOPAT ROIC), and non-GAAP adjusted net income.
We believe non-GAAP financial measures help investors better understand the underlying fundamentals and true operations of our business. Adjusted revenue, adjusted segment revenue, adjusted operating income, adjusted operating margin, adjusted segment income, adjusted segment income margin, adjusted cost of revenue, adjusted segment cost of revenue, adjusted operating expenses, and adjusted net income eliminate one-time deconversion revenue and associated costs, the gain on sale of assets, net, an acquisition, and a contractual change, which management believes are not indicative of the Company's operating performance. Such adjustments give investors further insight into our performance. Non-GAAP EBITDA is defined as net income attributable to the Company before the effect of interest expense, taxes, depreciation, and amortization, adjusted for net income before the effect of interest expense, taxes, depreciation, and amortization attributable to eliminated one-time deconversions, the gain on sale of assets, net, an acquisition, and a contractual change. Free cash flow is defined as net cash from operating activities, less capitalized expenditures, internal use software, and capitalized software, plus proceeds from the sale of assets. NOPAT ROIC is defined as operating income for the trailing four quarters multiplied by one minus the average effective tax rate (ETR) for the trailing four quarters, with the result divided by average invested capital (average of the beginning and ending period balances). Management believes that non-GAAP EBITDA is an important measure of the Company’s overall operating performance and excludes certain costs and other transactions that management deems one time or non-operational in nature; free cash flow is useful to measure the funds generated in a given period that are available for debt service requirements and strategic capital decisions; and NOPAT ROIC is a measure of the Company’s allocation efficiency and effectiveness of its invested capital. For these reasons, management also uses these non-GAAP financial measures in its assessment and management of the Company's performance.
11
Non-GAAP financial measures used by the Company may not be comparable to similarly titled non-GAAP measures used by other companies. Non-GAAP financial measures have no standardized meaning prescribed by GAAP and therefore, are unlikely to be comparable with calculations of similar measures for other companies.
Any non-GAAP financial measures should be considered in context with the GAAP financial presentation and should not be considered in isolation or as a substitute for GAAP measures. Reconciliations of the non-GAAP financial measures to related GAAP measures are included.
About Jack Henry & Associates, Inc.®
Quarterly Conference Call
Jack HenryTM (Nasdaq: JKHY) is a well-rounded financial technology company that strengthens connections between financial institutions and the people and businesses they serve. We are an S&P 500 company that prioritizes openness, collaboration, and user centricity — offering banks and credit unions a vibrant ecosystem of internally developed modern capabilities as well as the ability to integrate with leading fintechs. For nearly 50 years, Jack Henry has provided technology solutions to enable clients to innovate faster, strategically differentiate, and successfully compete while serving the evolving needs of their accountholders. We empower approximately 7,400 clients with people-inspired innovation, personal service, and insight-driven solutions that help reduce the barriers to financial health. Additional information is available at www.jackhenry.com.
The Company will hold a conference call on February 4, 2026, at 7:45 a.m. Central Time, and investors are invited to listen at www.jackhenry.com. A webcast replay will be available approximately one hour after the event at ir.jackhenry.com/corporate-events-and-presentations and will remain available for one year.
Statements made in this news release that are not historical facts are "forward-looking statements" within the meaning of the Private Securities Litigation Reform Act of 1995, Section 27A of the Securities Act of 1933 and Section 21E of the Securities Exchange Act of 1934. Because forward-looking statements relate to the future, they are subject to inherent risks and uncertainties that could cause actual results to differ materially from those expressed or implied by such statements. Such risks and uncertainties include, but are not limited to, those discussed in the Company's Securities and Exchange Commission filings, including the Company's most recent reports on Form 10-K and Form 10-Q, particularly under the heading Risk Factors. Any forward-looking statement made in this news release speaks only as of the date of the news release, and the Company expressly disclaims any obligation to publicly update or revise any forward-looking statement, whether because of new information, future events or otherwise.
MEDIA CONTACT
Jeremy Elwood
Corporate Communications
Jack Henry & Associates, Inc.
417-235-6652
JDElwood@jackhenry.com
ANALYST CONTACT
Vance Sherard, CFA
Investor Relations
Jack Henry & Associates, Inc.
417-235-6652
VSherard@jackhenry.com
12
Condensed Consolidated Statements of Income (Unaudited)
(Dollars in thousands, except per share data)
Three Months Ended December 31,
% Change
Six Months Ended December 31,
% Change
2025
2024
2025
2024
REVENUE
$
619,334
$
573,848
7.9
%
$
1,264,071
$
1,174,829
7.6
%
Cost of Revenue
350,989
332,850
5.4
%
699,554
676,282
3.4
%
Research and Development
42,228
41,095
2.8
%
81,505
80,780
0.9
%
Selling, General, and Administrative
66,969
76,901
(12.9)
%
139,799
143,489
(2.6)
%
EXPENSES
460,186
450,846
2.1
%
920,858
900,551
2.3
%
OPERATING INCOME
159,148
123,002
29.4
%
343,213
274,278
25.1
%
Interest income
6,187
7,159
(13.6)
%
13,326
15,506
(14.1)
%
Interest expense
(1,142)
(2,780)
(58.9)
%
(2,028)
(5,605)
(63.8)
%
Interest Income, net
5,045
4,379
15.2
%
11,298
9,901
14.1
%
INCOME BEFORE INCOME TAXES
164,193
127,381
28.9
%
354,511
284,179
24.7
%
Provision for Income Taxes
39,525
29,536
33.8
%
85,856
67,143
27.9
%
NET INCOME
$
124,668
$
97,845
27.4
%
$
268,655
$
217,036
23.8
%
Diluted net income per share
$
1.72
$
1.34
$
3.70
$
2.97
Diluted weighted average shares outstanding
72,413
73,082
72,661
73,080
Consolidated Balance Sheet Highlights (Unaudited)
(In thousands)
December 31,
% Change
2025
2024
Cash and cash equivalents
$
28,216
$
25,653
10.0
%
Receivables
298,458
283,223
5.4
%
Total assets
3,060,044
2,911,770
5.1
%
Accounts payable and accrued expenses
$
191,905
$
209,926
(8.6)
%
Current and long-term debt
20,000
150,000
(86.7)
%
Deferred revenue
270,994
269,469
0.6
%
Stockholders' equity
2,203,058
1,975,565
11.5
%
13
Calculation of Non-GAAP Earnings Before Income Taxes, Depreciation and Amortization (Non-GAAP EBITDA)
Three Months Ended December 31,
% Change
Six Months Ended December 31,
% Change
(Dollars in thousands)
2025
2024
2025
2024
Net income
$
124,668
$
97,845
$
268,655
$
217,036
Net interest
(5,045)
(4,379)
(11,298)
(9,901)
Taxes
39,525
29,536
85,856
67,143
Depreciation and amortization
53,155
51,754
105,047
102,248
Less: Net income before interest expense, taxes, depreciation and amortization attributable to eliminated one-time adjustments*
(6,118)
458
(17,015)
(4,842)
NON-GAAP EBITDA
$
206,185
$
175,214
17.7
%
$
431,245
$
371,684
16.0
%
*The fiscal second quarter 2026 and 2025 adjustments for net income before interest expense, taxes, depreciation and amortization were for deconversions of ($3,600), a gain on sale of assets, net, of ($3,032), and an acquisition of $514, and were for deconversions of $622 and a contract change of ($164), respectively. The fiscal year-to-date 2026 and 2025 adjustments were for deconversions of ($10,701), a gain on sale of assets, net, of ($6,828), and an acquisition of $514, and were for deconversions of ($2,873) and a contractual change of ($1,969), respectively.
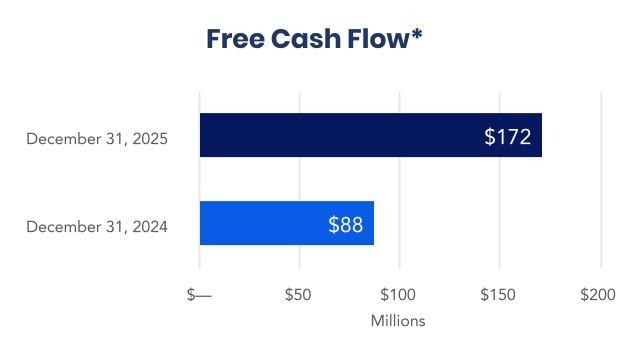
Calculation of Free Cash Flow (Non-GAAP)
Six Months Ended December 31,
(In thousands)
2025
2024
Net cash from operating activities
$
273,255
$
206,543
Capitalized expenditures
(30,096)
(29,469)
Internal use software
(2,908)
(3,528)
Proceeds from sale of assets
24,572
—
Capitalized software
(92,484)
(85,803)
FREE CASH FLOW
$
172,339
$
87,743
Net income
$
268,655
$
217,036
Operating cash conversion*
101.7%
95.2%
Free cash flow conversion (excluding proceeds from sale of assets)*
55.0%
40.4%
*Operating cash conversion is net cash from operating activities divided by net income. Free cash flow conversion is free cash flow less proceeds from sale of assets of $24,572 for fiscal 2026 and $0 for fiscal 2025 divided by net income.
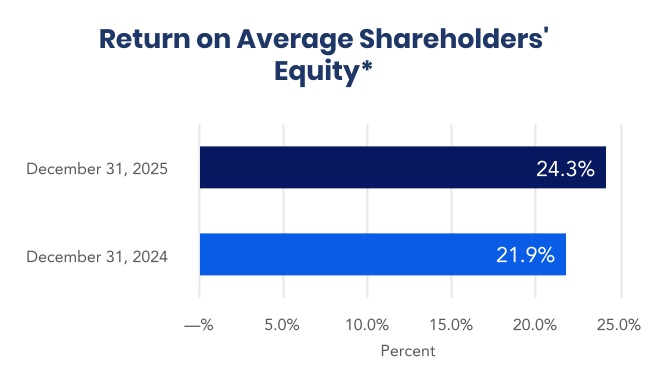
Calculation of the Return on Average Shareholders’ Equity
December 31,
(In thousands)
2025
2024
Net income (trailing four quarters)
$
507,367
$
405,208
Average stockholder's equity (period beginning and ending balances)
2,089,312
1,849,976
RETURN ON AVERAGE SHAREHOLDERS’ EQUITY
24.3%
21.9%
14
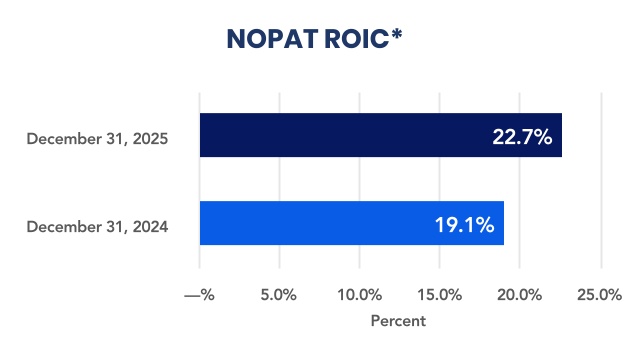
Calculation of NOPAT ROIC (Non-GAAP)
December 31,
(In thousands)
2025
2024
Operating income (trailing four quarters)
$
637,650
$
512,003
Average Effective Tax Rate (trailing four quarters)
22.6
%
23.3
%
NOPAT operating income (trailing four quarters)*
493,541
392,706
Average invested capital (period beginning and ending balances)
2,174,312
2,052,476
NOPAT ROIC
22.7%
19.1%
*NOPAT operating income is calculated by multiplying the trailing four quarters operating income by one minus the average ETR. NOPAT ROIC is calculated by dividing NOPAT operating income by average invested capital (period beginning and ending balances).
FAQ for Analysts / Investors
1.)Why does fiscal 2025 non-GAAP revenue used for growth calculation not match reported fiscal 2025 non-GAAP revenue?
•The restructuring of a third-party agreement has resulted in a $16 million fiscal year-over-year revenue headwind, with $12 million of that coming in the first quarter.
•The remaining $4 million will impact the rest of the fiscal year.
•This restructuring has also resulted in a decrease in the related costs and the impact on margins is expected to be minimal.
•This has been adjusted for a consistent fiscal year-over-year comparison and is included in our fiscal year 2026 guidance (see page 9).
2.) What are some key elements of the outlook for the second half of fiscal 2026?
•We expect the year-over-year revenue growth rates to slow slightly as we face overall tougher prior year comparables from the second half of fiscal 2025.
•We expect some contraction in margins in the second half of fiscal 2026 compared to the first half where we experienced lower than normal expense for medical claims under our self-insured employee healthcare plan.