2026 Second Quarter Earnings Call August 6, 2026 Supplemental information
Encompass Health 2 The information contained in this presentation includes certain assumptions, estimates, projections and other forward- looking statements that reflect Encompass Health’s current outlook, views and plans with respect to future events, including the business outlook, guidance and growth targets, future reimbursement rates, labor availability and costs, the effect of tariffs on costs, legislative and regulatory developments, such as the effects of Medicaid and Medicare payment system changes, including RCD, TEAM, and state supplemental payment programs, strategy, capital expenditures, acquisition and other development activities, such as the de novo pipeline and bed additions, operational and quality of care initiatives, dividend strategies, leverage, repurchases of securities, outstanding shares of common stock, effective tax rates, financial performance, financial assumptions and considerations, balance sheet and cash flow plans, market barriers to entry, and addressable market size. These assumptions, estimates, projections and other forward-looking statements are based on what the Company believes, as of the date hereof, to be reasonable. Inevitably, there will be differences between such forward-looking statements and actual events or results, and those differences may be material. There can be no assurance any estimates, projections or forward-looking statements will be realized. All such assumptions, estimates, projections and forward-looking statements speak only as of the date hereof. Encompass Health undertakes no duty to publicly update or revise the information contained herein. You are cautioned not to place undue reliance on the assumptions, estimates, projections and other forward-looking statements in this presentation as they are based on current expectations and general assumptions and are subject to various risks, uncertainties and other factors, including those set forth in the earnings release attached as to the Company’s Form 8-K dated August 5, 2026 (the “Q2 Earnings Release Form 8-K”), the Form 10-K for the year ended December 31, 2025, the Forms 10-Q for the quarters ended March 31, 2026 and when filed, June 30, 2026, and in other documents Encompass Health previously filed with the SEC, many of which are beyond Encompass Health’s control, that may cause actual events or results to differ materially from the views, beliefs and estimates expressed herein. Note regarding presentation of non-GAAP financial measures The following presentation includes certain “non-GAAP financial measures” as defined in Regulation G under the Securities Exchange Act of 1934, including Adjusted EBITDA, leverage ratios, adjusted earnings per share, and adjusted free cash flow. Schedules are attached that reconcile the non-GAAP financial measures included in the following presentation to the most directly comparable financial measures calculated and presented in accordance with Generally Accepted Accounting Principles in the United States. The Q2 Earnings Release Form 8-K provides further explanation and disclosure regarding Encompass Health’s use of non-GAAP financial measures and should be read in conjunction with this supplemental information. Forward-looking statements
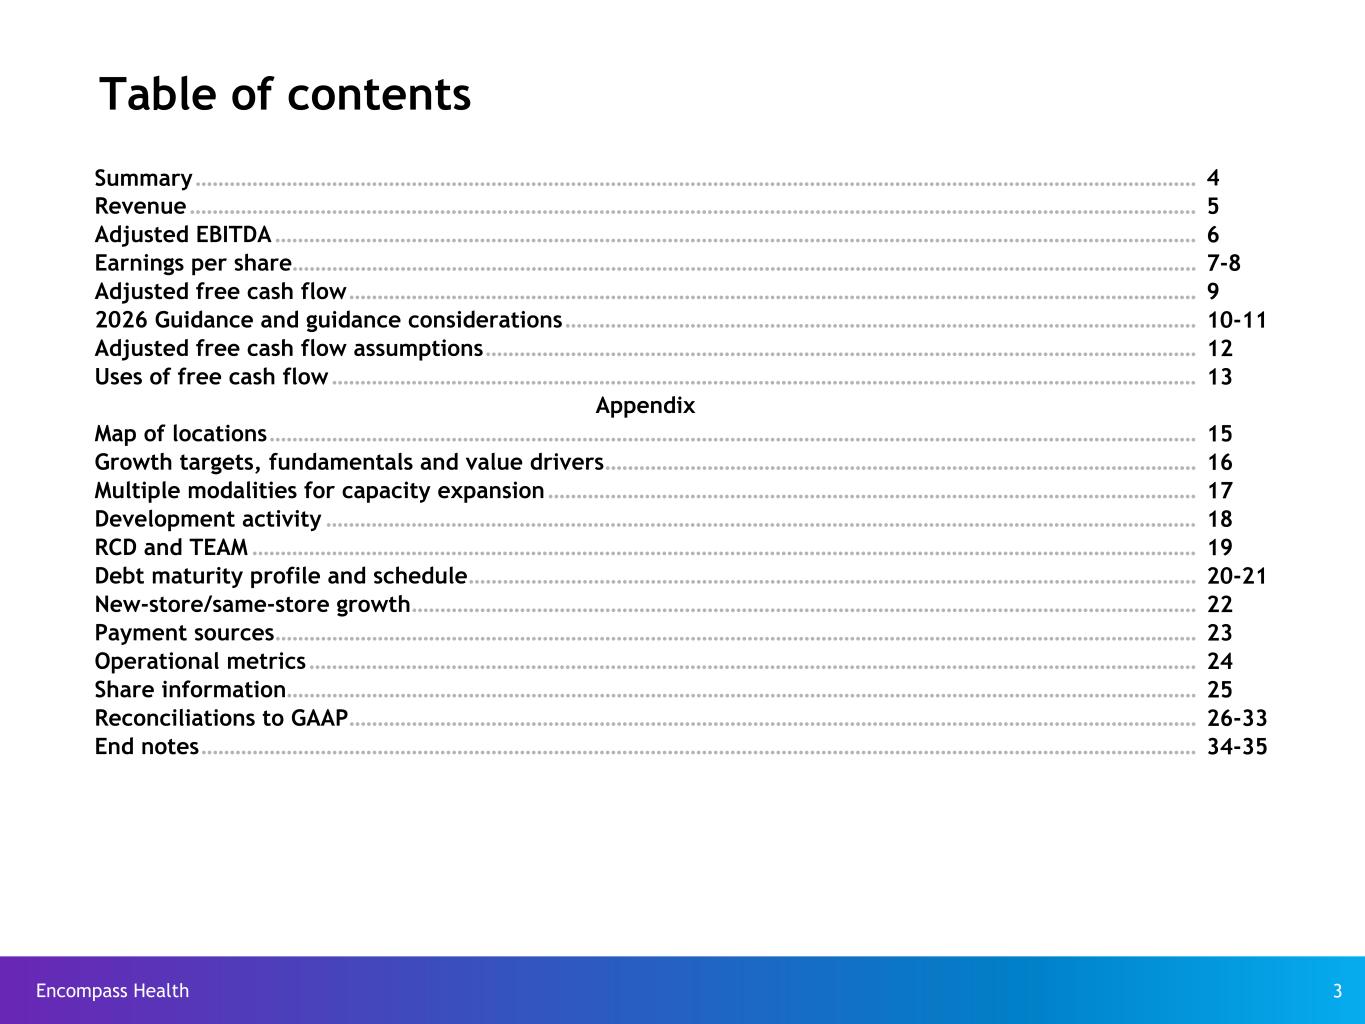
Encompass Health 3 Summary ................................................................................................................................................................................ 4 Revenue ................................................................................................................................................................................. 5 Adjusted EBITDA .................................................................................................................................................................. 6 Earnings per share ............................................................................................................................................................... 7-8 Adjusted free cash flow ..................................................................................................................................................... 9 2026 Guidance and guidance considerations ............................................................................................................... 10-11 Adjusted free cash flow assumptions ............................................................................................................................. 12 Uses of free cash flow ........................................................................................................................................................ 13 Appendix Map of locations ................................................................................................................................................................... 15 Growth targets, fundamentals and value drivers ........................................................................................................ 16 Multiple modalities for capacity expansion .................................................................................................................. 17 Development activity ......................................................................................................................................................... 18 RCD and TEAM ...................................................................................................................................................................... 19 Debt maturity profile and schedule ................................................................................................................................ 20-21 New-store/same-store growth .......................................................................................................................................... 22 Payment sources .................................................................................................................................................................. 23 Operational metrics ............................................................................................................................................................ 24 Share information ................................................................................................................................................................ 25 Reconciliations to GAAP ..................................................................................................................................................... 26-33 End notes ............................................................................................................................................................................... 34-35 Table of contents
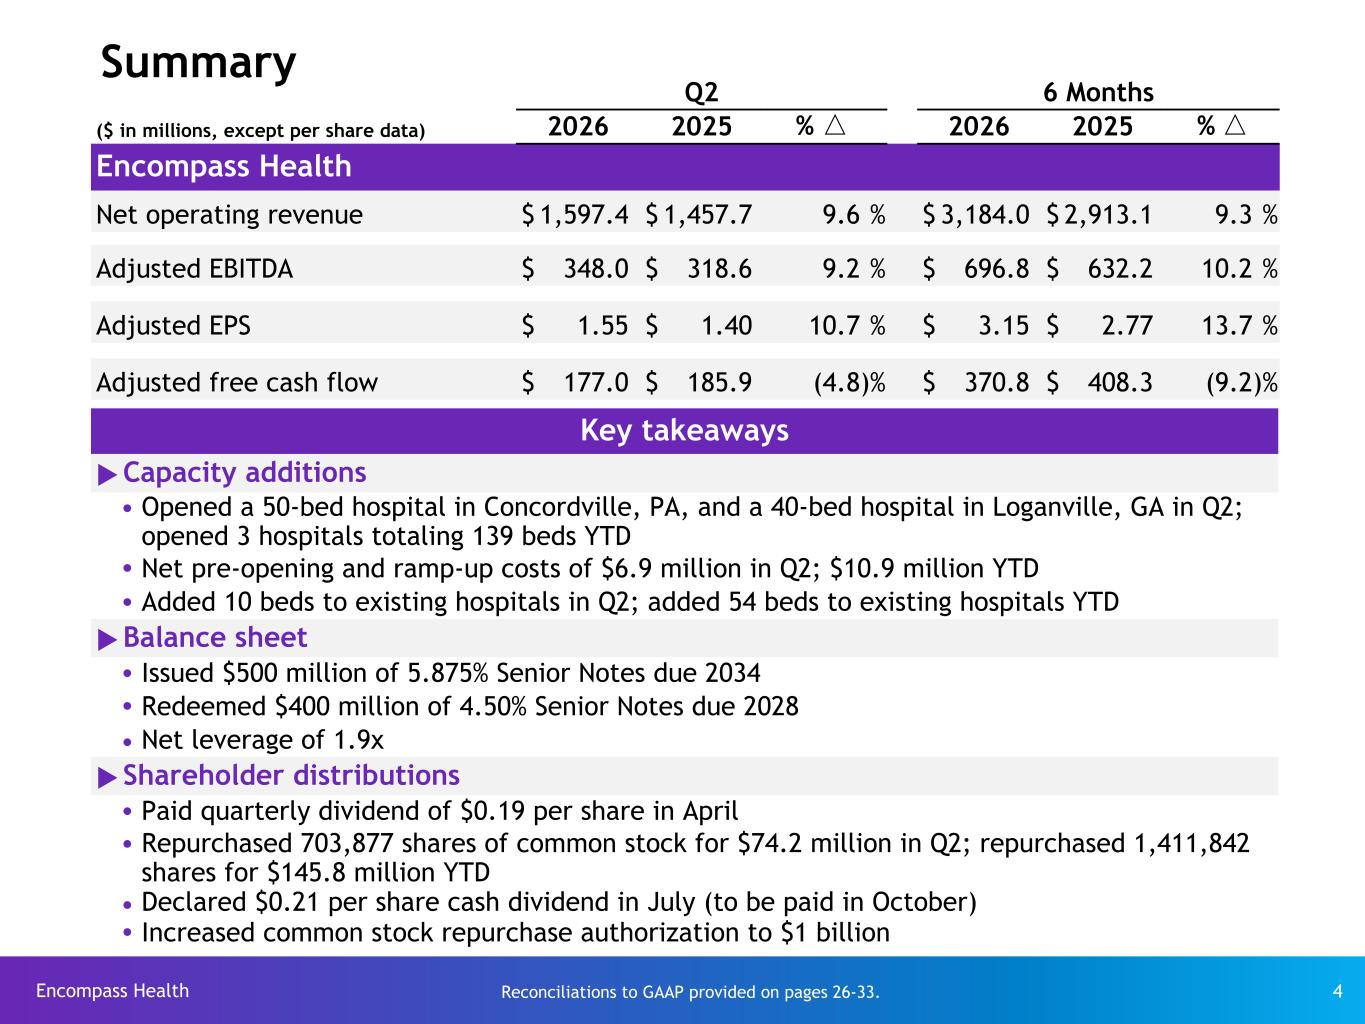
Encompass Health 4 Summary Q2 6 Months ($ in millions, except per share data) 2026 2025 % △ 2026 2025 % △ Encompass Health Net operating revenue $ 1,597.4 $ 1,457.7 9.6 % $ 3,184.0 $ 2,913.1 9.3 % Adjusted EBITDA $ 348.0 $ 318.6 9.2 % $ 696.8 $ 632.2 10.2 % Adjusted EPS $ 1.55 $ 1.40 10.7 % $ 3.15 $ 2.77 13.7 % Adjusted free cash flow $ 177.0 $ 185.9 (4.8) % $ 370.8 $ 408.3 (9.2) % Reconciliations to GAAP provided on pages 26-33. Key takeaways uCapacity additions Ÿ Opened a 50-bed hospital in Concordville, PA, and a 40-bed hospital in Loganville, GA in Q2; opened 3 hospitals totaling 139 beds YTD Ÿ Net pre-opening and ramp-up costs of $6.9 million in Q2; $10.9 million YTD Ÿ Added 10 beds to existing hospitals in Q2; added 54 beds to existing hospitals YTD uBalance sheet Ÿ Issued $500 million of 5.875% Senior Notes due 2034 Ÿ Redeemed $400 million of 4.50% Senior Notes due 2028 Ÿ Net leverage of 1.9x uShareholder distributions Ÿ Paid quarterly dividend of $0.19 per share in April Ÿ Repurchased 703,877 shares of common stock for $74.2 million in Q2; repurchased 1,411,842 shares for $145.8 million YTD Ÿ Declared $0.21 per share cash dividend in July (to be paid in October) Ÿ Increased common stock repurchase authorization to $1 billion
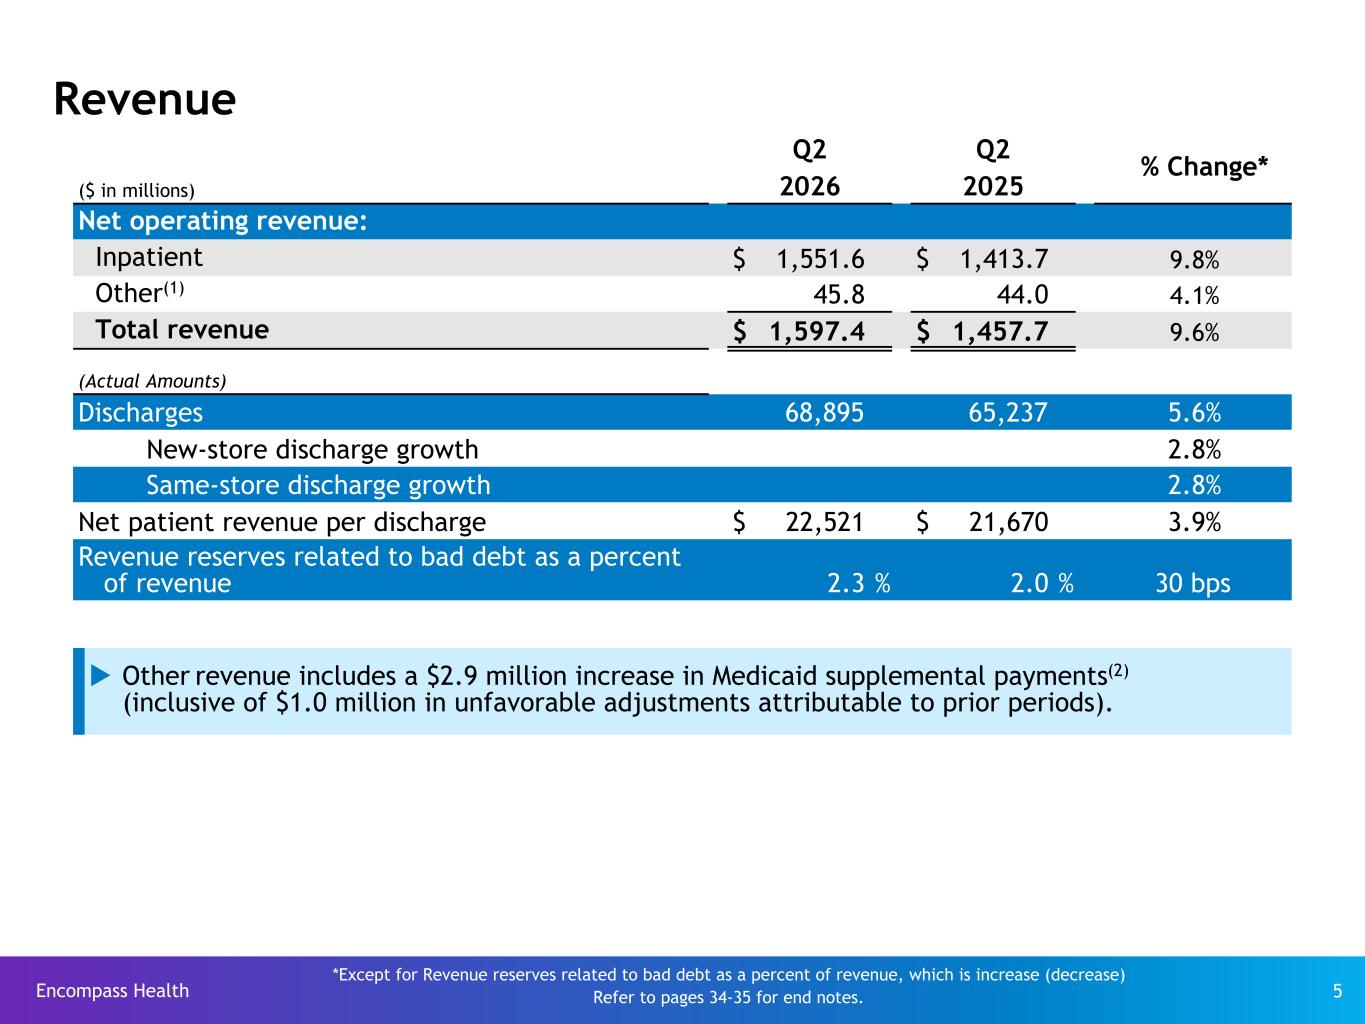
Encompass Health 5 Revenue Q2 Q2 % Change* ($ in millions) 2026 2025 Net operating revenue: Inpatient $ 1,551.6 $ 1,413.7 9.8% Other(1) 45.8 44.0 4.1% Total revenue $ 1,597.4 $ 1,457.7 9.6% (Actual Amounts) Discharges 68,895 65,237 5.6% New-store discharge growth 2.8% Same-store discharge growth 2.8% Net patient revenue per discharge $ 22,521 $ 21,670 3.9% Revenue reserves related to bad debt as a percent of revenue 2.3 % 2.0 % 30 bps *Except for Revenue reserves related to bad debt as a percent of revenue, which is increase (decrease) Refer to pages 34-35 for end notes. u Other revenue includes a $2.9 million increase in Medicaid supplemental payments(2) (inclusive of $1.0 million in unfavorable adjustments attributable to prior periods).
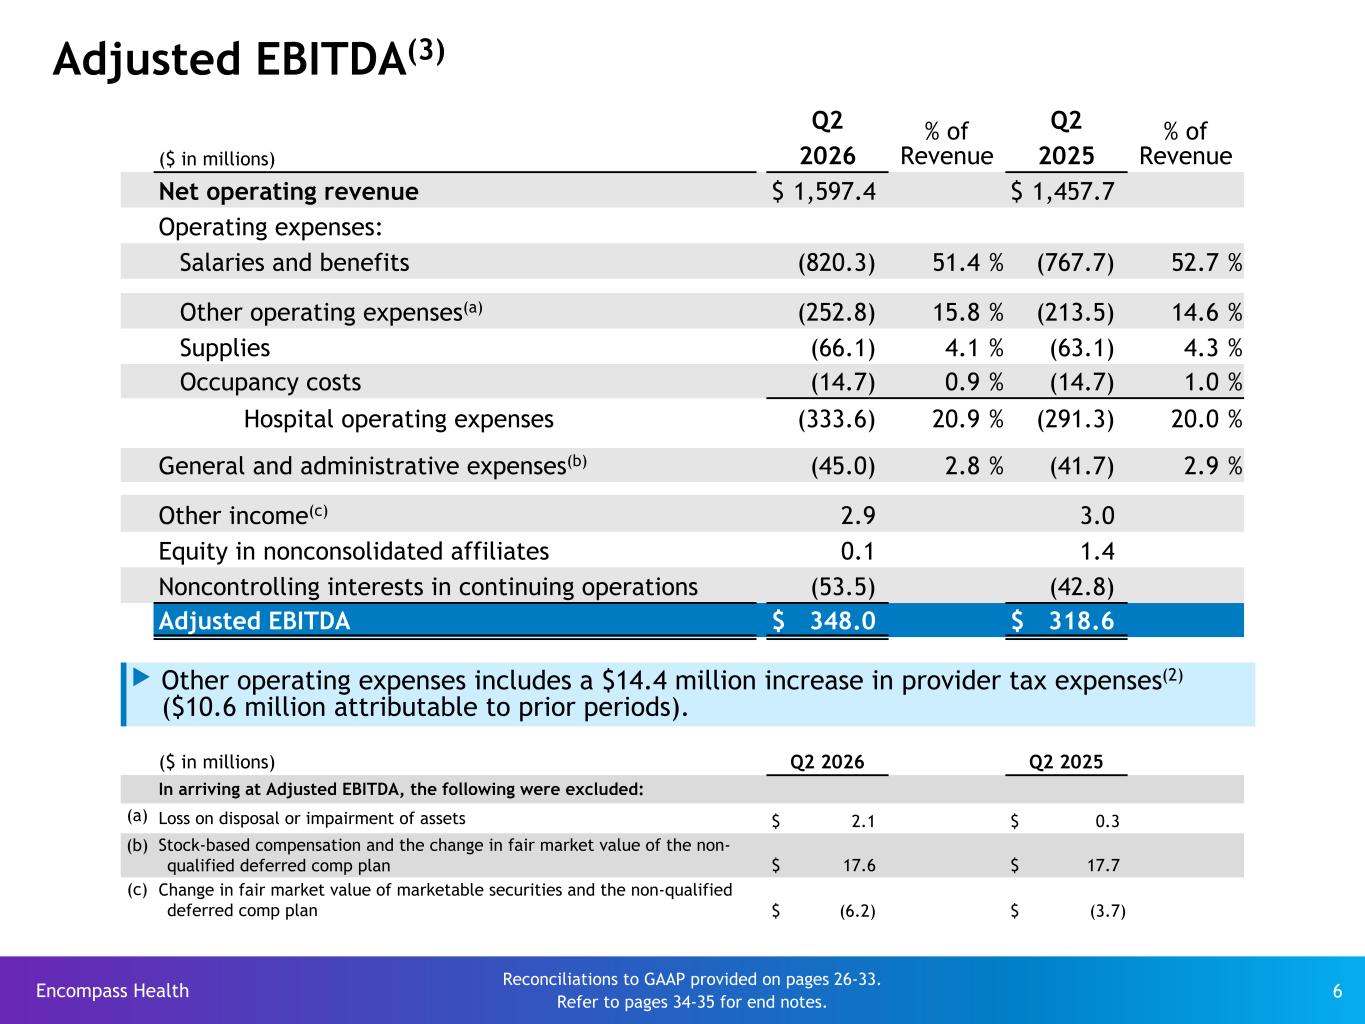
Encompass Health 6 Adjusted EBITDA(3) Q2 % of Revenue Q2 % of Revenue($ in millions) 2026 2025 Net operating revenue $ 1,597.4 $ 1,457.7 Operating expenses: Salaries and benefits (820.3) 51.4 % (767.7) 52.7 % Other operating expenses(a) (252.8) 15.8 % (213.5) 14.6 % Supplies (66.1) 4.1 % (63.1) 4.3 % Occupancy costs (14.7) 0.9 % (14.7) 1.0 % Hospital operating expenses (333.6) 20.9 % (291.3) 20.0 % General and administrative expenses(b) (45.0) 2.8 % (41.7) 2.9 % Other income(c) 2.9 3.0 Equity in nonconsolidated affiliates 0.1 1.4 Noncontrolling interests in continuing operations (53.5) (42.8) Adjusted EBITDA $ 348.0 $ 318.6 ($ in millions) Q2 2026 Q2 2025 In arriving at Adjusted EBITDA, the following were excluded: (a) Loss on disposal or impairment of assets $ 2.1 $ 0.3 (b) Stock-based compensation and the change in fair market value of the non- qualified deferred comp plan $ 17.6 $ 17.7 (c) Change in fair market value of marketable securities and the non-qualified deferred comp plan $ (6.2) $ (3.7) Reconciliations to GAAP provided on pages 26-33. Refer to pages 34-35 for end notes. u Other operating expenses includes a $14.4 million increase in provider tax expenses(2) ($10.6 million attributable to prior periods).
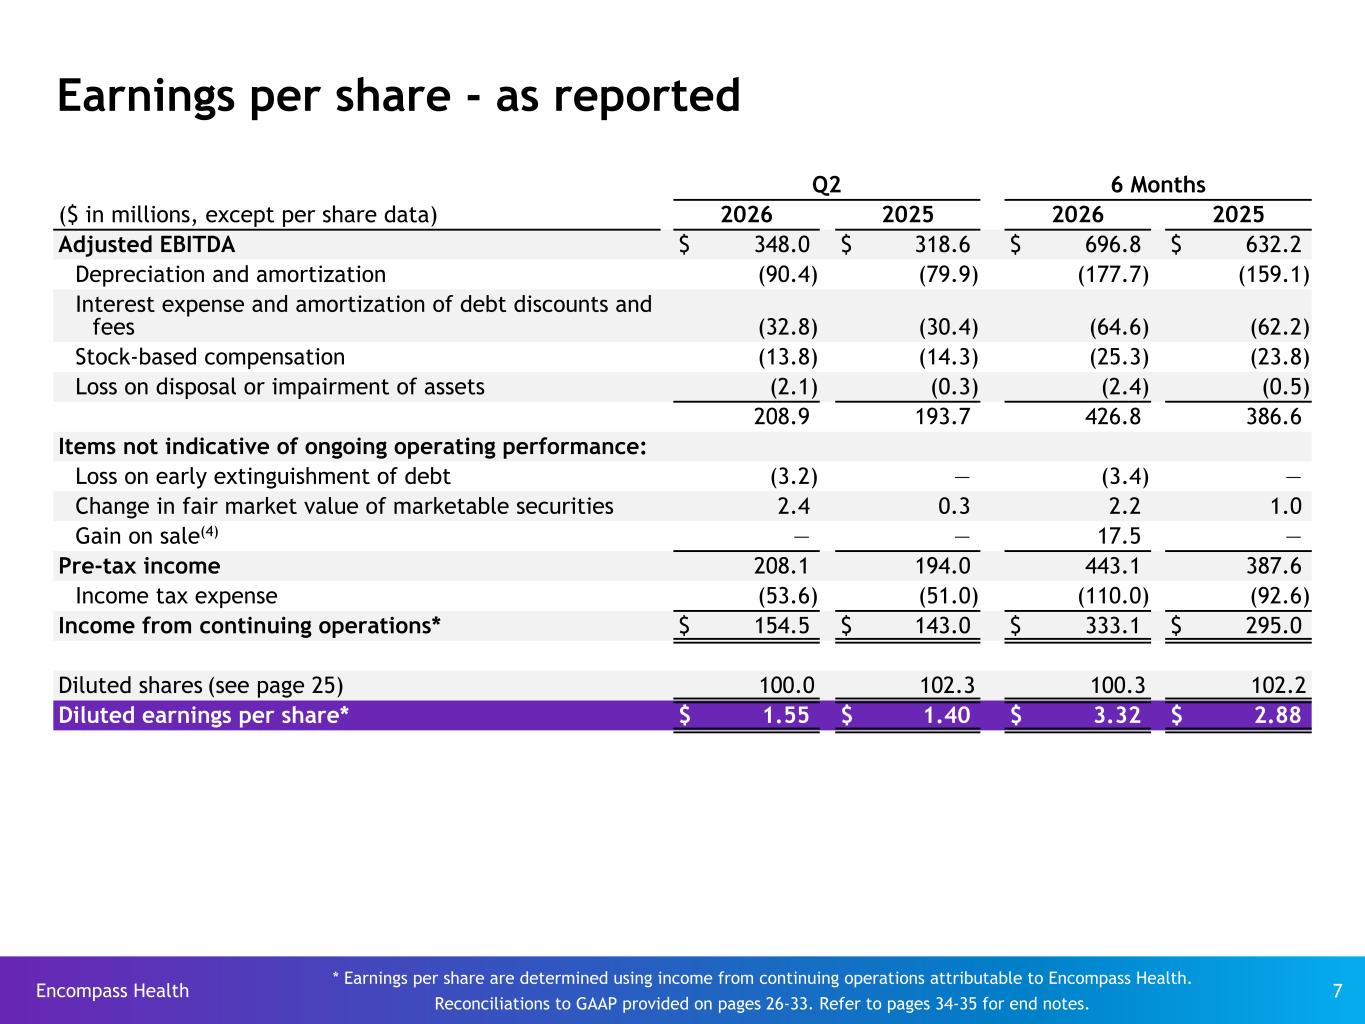
Encompass Health 7 Earnings per share - as reported Q2 6 Months ($ in millions, except per share data) 2026 2025 2026 2025 Adjusted EBITDA $ 348.0 $ 318.6 $ 696.8 $ 632.2 Depreciation and amortization (90.4) (79.9) (177.7) (159.1) Interest expense and amortization of debt discounts and fees (32.8) (30.4) (64.6) (62.2) Stock-based compensation (13.8) (14.3) (25.3) (23.8) Loss on disposal or impairment of assets (2.1) (0.3) (2.4) (0.5) 208.9 193.7 426.8 386.6 Items not indicative of ongoing operating performance: Loss on early extinguishment of debt (3.2) — (3.4) — Change in fair market value of marketable securities 2.4 0.3 2.2 1.0 Gain on sale(4) — — 17.5 — Pre-tax income 208.1 194.0 443.1 387.6 Income tax expense (53.6) (51.0) (110.0) (92.6) Income from continuing operations* $ 154.5 $ 143.0 $ 333.1 $ 295.0 Diluted shares (see page 25) 100.0 102.3 100.3 102.2 Diluted earnings per share* $ 1.55 $ 1.40 $ 3.32 $ 2.88 * Earnings per share are determined using income from continuing operations attributable to Encompass Health. Reconciliations to GAAP provided on pages 26-33. Refer to pages 34-35 for end notes.
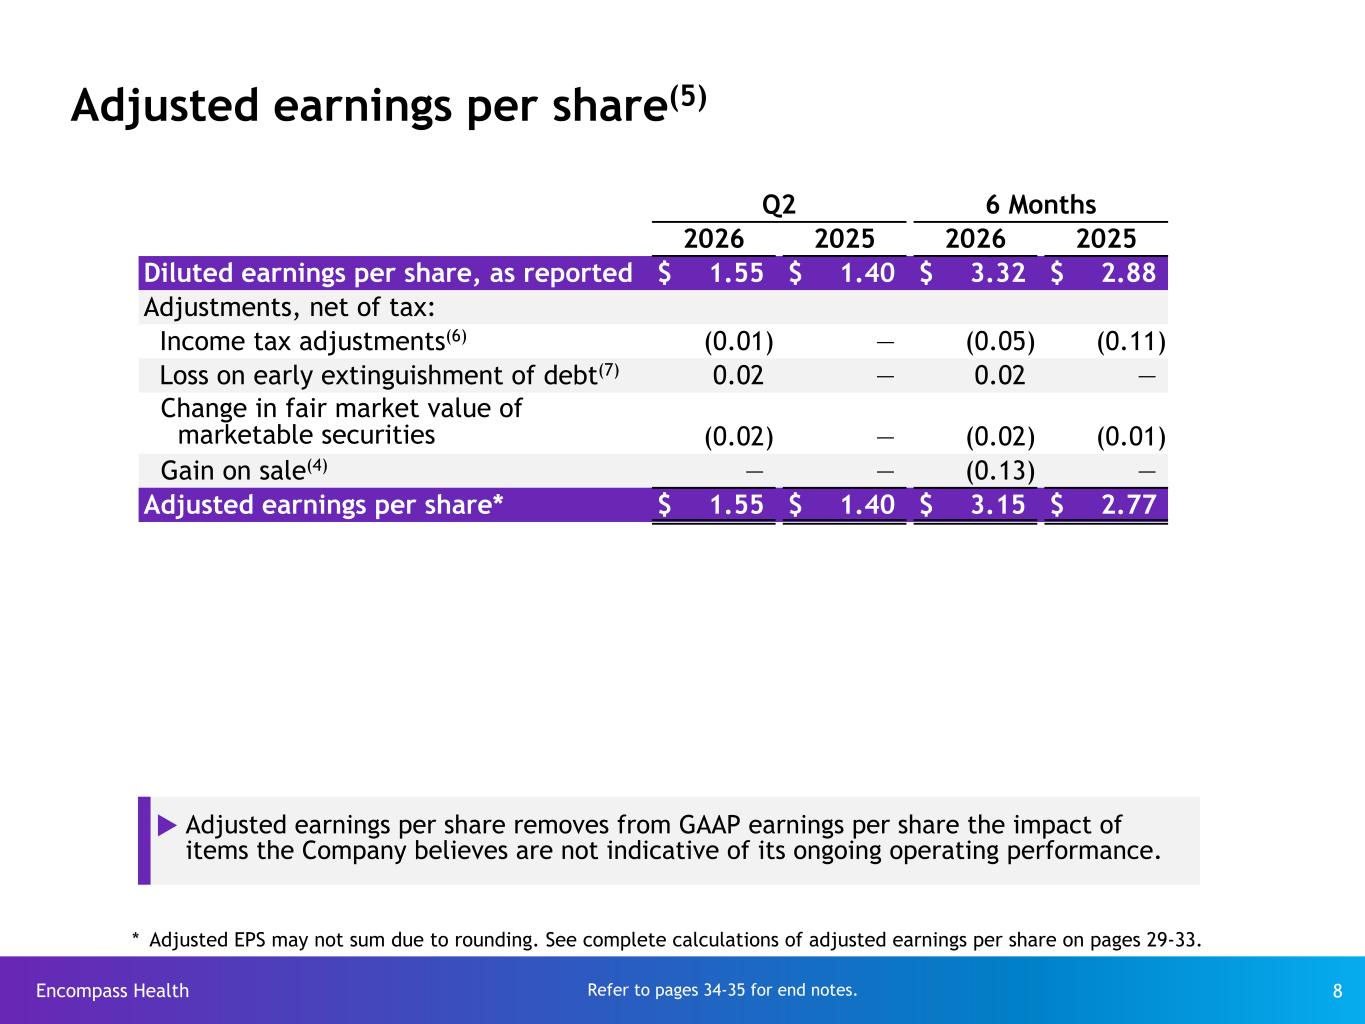
Encompass Health 8 Adjusted earnings per share(5) Refer to pages 34-35 for end notes. Q2 6 Months 2026 2025 2026 2025 Diluted earnings per share, as reported $ 1.55 $ 1.40 $ 3.32 $ 2.88 Adjustments, net of tax: Income tax adjustments(6) (0.01) — (0.05) (0.11) Loss on early extinguishment of debt(7) 0.02 — 0.02 — Change in fair market value of marketable securities (0.02) — (0.02) (0.01) Gain on sale(4) — — (0.13) — Adjusted earnings per share* $ 1.55 $ 1.40 $ 3.15 $ 2.77 u Adjusted earnings per share removes from GAAP earnings per share the impact of items the Company believes are not indicative of its ongoing operating performance. * Adjusted EPS may not sum due to rounding. See complete calculations of adjusted earnings per share on pages 29-33.
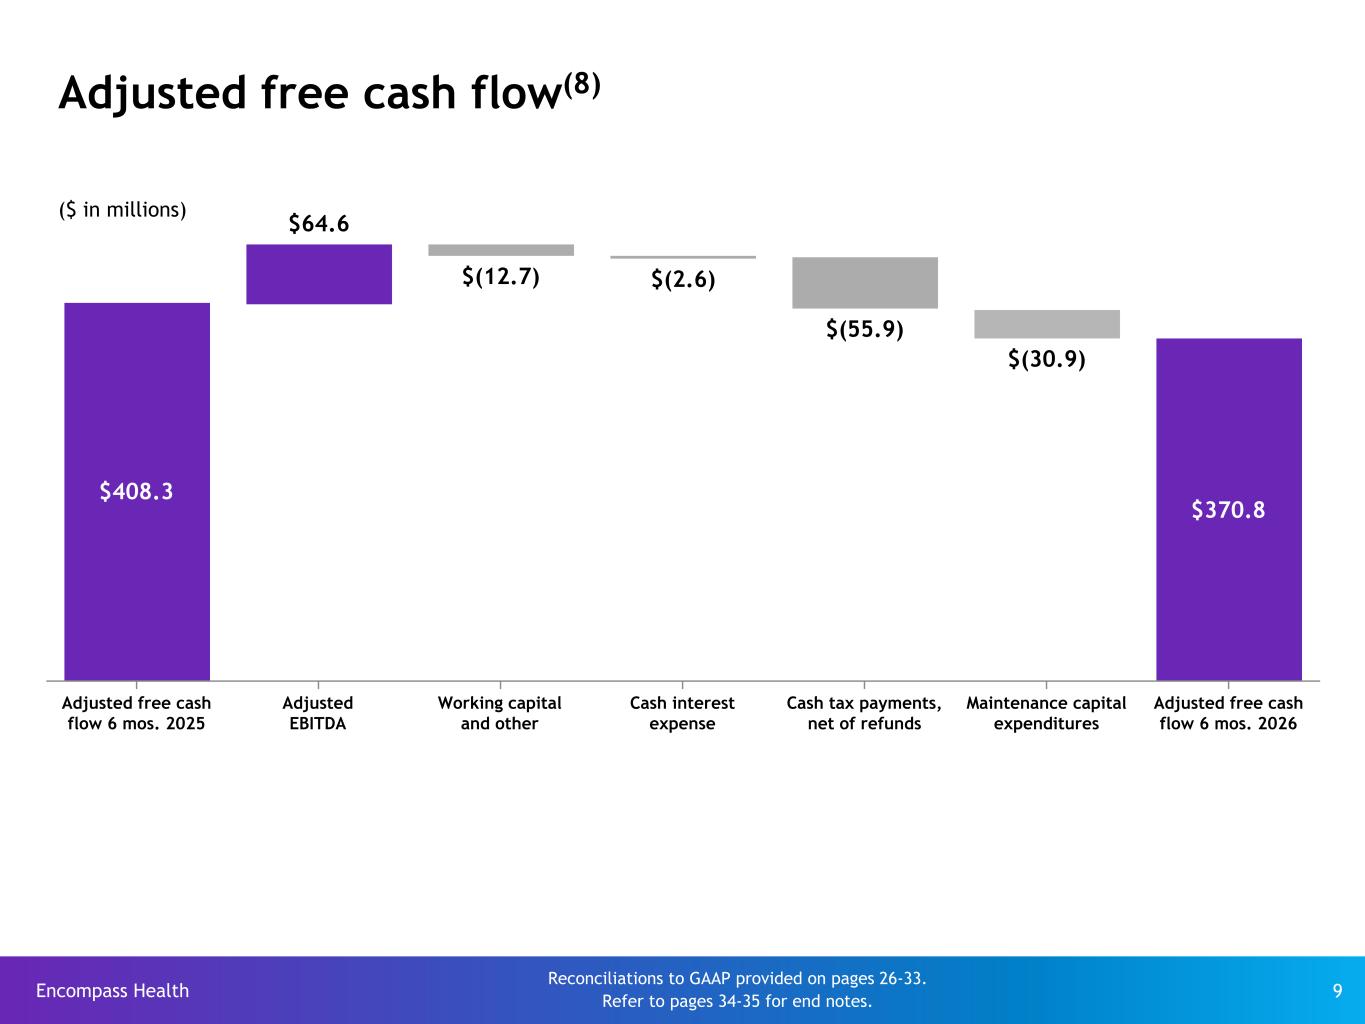
Encompass Health 9 $408.3 $64.6 $(12.7) $(2.6) $(55.9) $(30.9) $370.8 Adjusted free cash flow 6 mos. 2025 Adjusted EBITDA Working capital and other Cash interest expense Cash tax payments, net of refunds Maintenance capital expenditures Adjusted free cash flow 6 mos. 2026 Adjusted free cash flow(8) Reconciliations to GAAP provided on pages 26-33. Refer to pages 34-35 for end notes. ($ in millions)
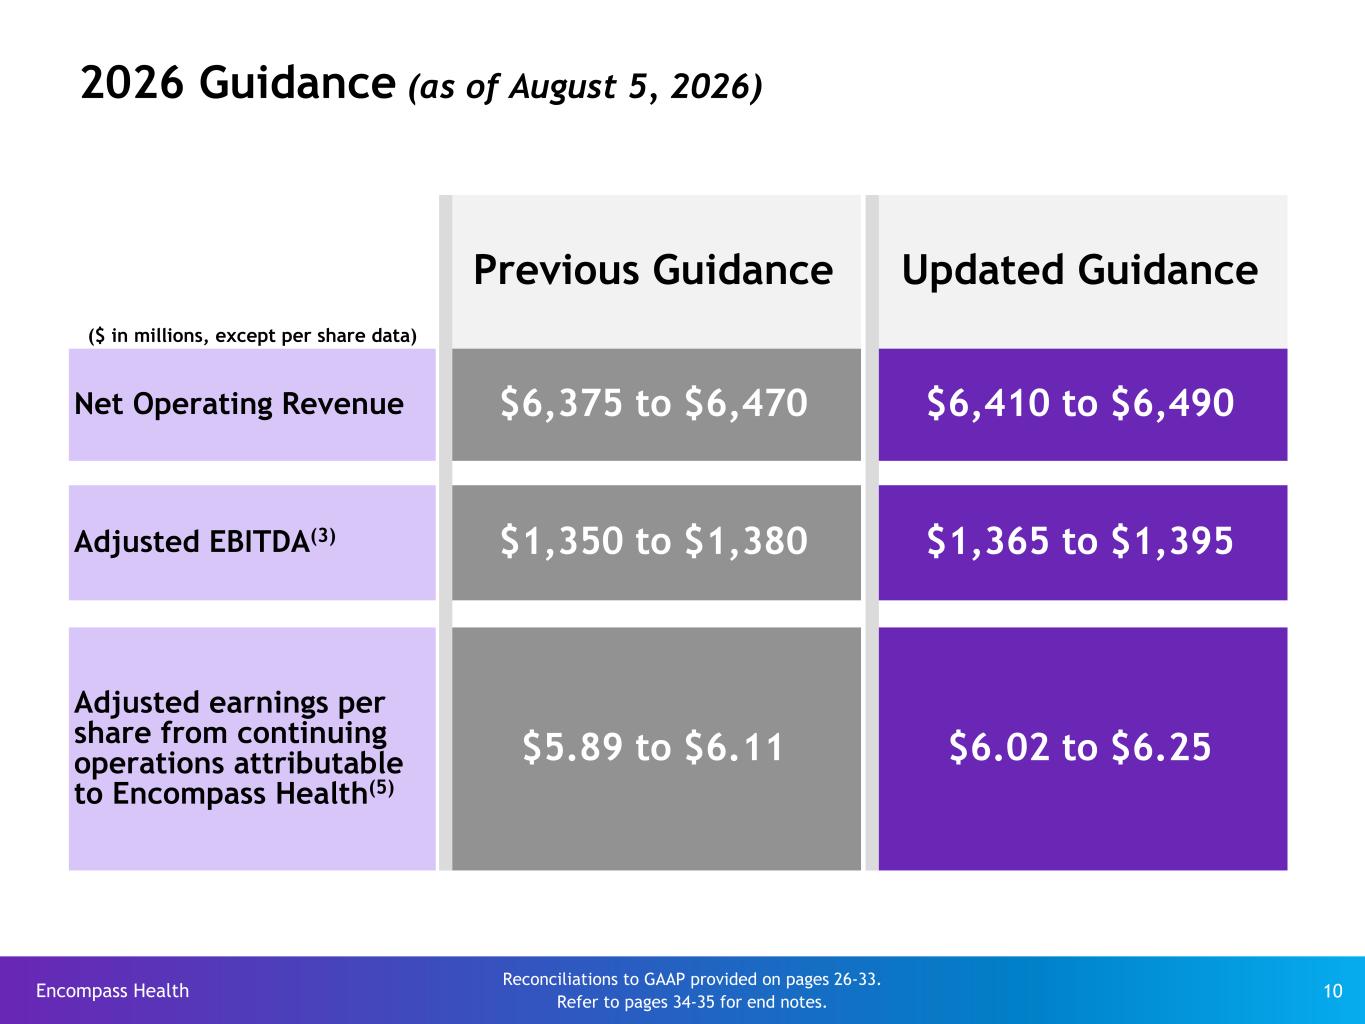
Encompass Health 10 2026 Guidance (as of August 5, 2026) Previous Guidance Updated Guidance ($ in millions, except per share data) Net Operating Revenue $6,375 to $6,470 $6,410 to $6,490 Adjusted EBITDA(3) $1,350 to $1,380 $1,365 to $1,395 Adjusted earnings per share from continuing operations attributable to Encompass Health(5) $5.89 to $6.11 $6.02 to $6.25 Reconciliations to GAAP provided on pages 26-33. Refer to pages 34-35 for end notes.
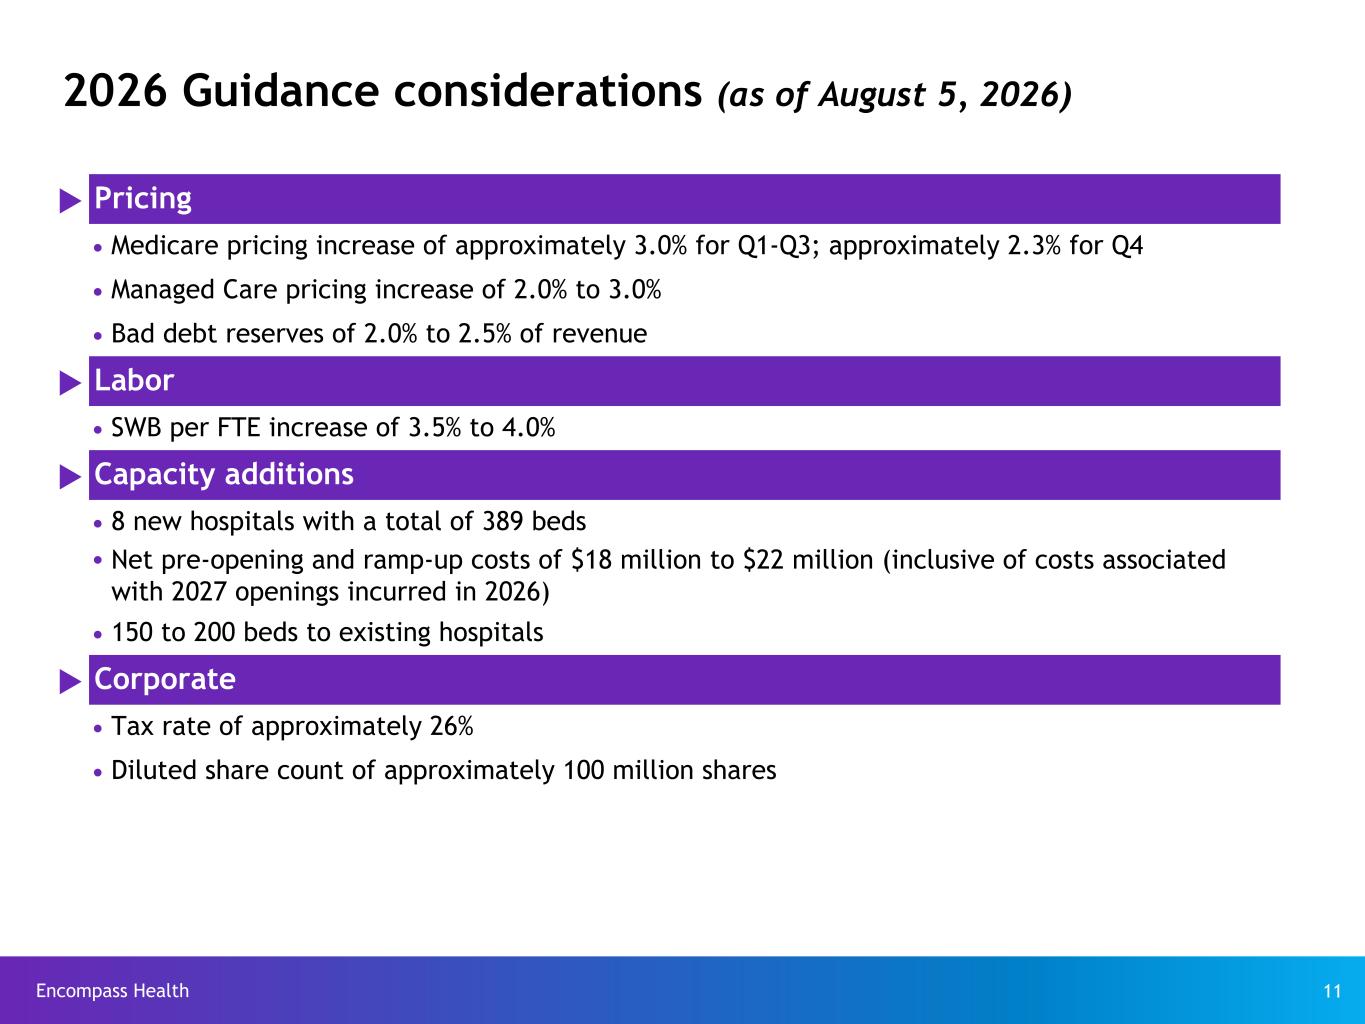
Encompass Health 11 2026 Guidance considerations (as of August 5, 2026) u Pricing Ÿ Medicare pricing increase of approximately 3.0% for Q1-Q3; approximately 2.3% for Q4 Ÿ Managed Care pricing increase of 2.0% to 3.0% Ÿ Bad debt reserves of 2.0% to 2.5% of revenue u Labor Ÿ SWB per FTE increase of 3.5% to 4.0% u Capacity additions Ÿ 8 new hospitals with a total of 389 beds Ÿ Net pre-opening and ramp-up costs of $18 million to $22 million (inclusive of costs associated with 2027 openings incurred in 2026) Ÿ 150 to 200 beds to existing hospitals u Corporate Ÿ Tax rate of approximately 26% Ÿ Diluted share count of approximately 100 million shares
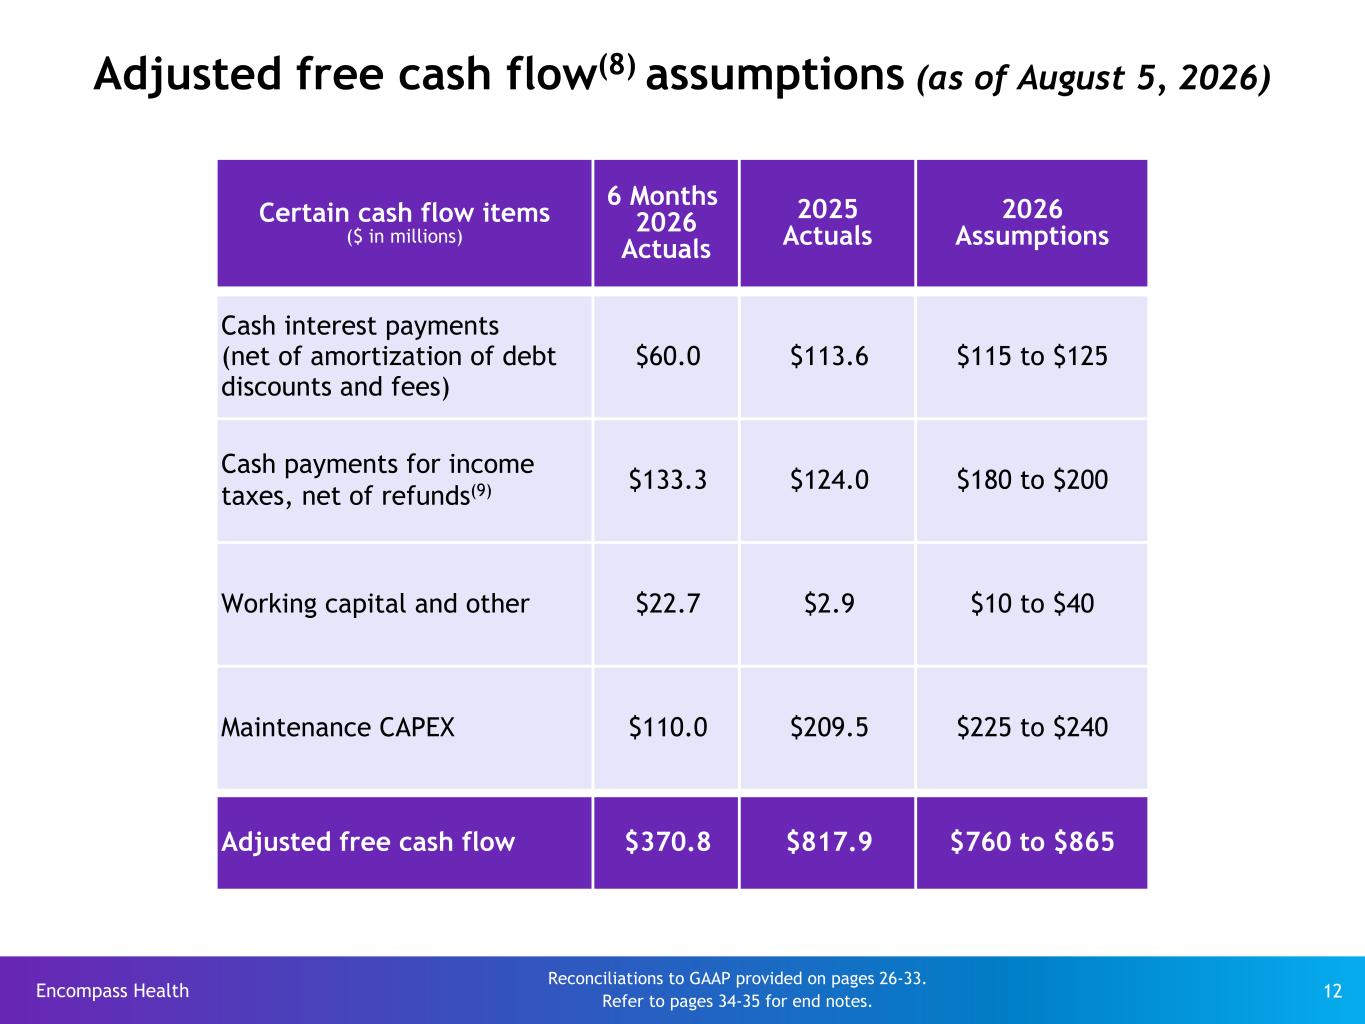
Encompass Health 12 Adjusted free cash flow(8) assumptions (as of August 5, 2026) Certain cash flow items ($ in millions) 6 Months 2026 Actuals 2025 Actuals 2026 Assumptions Cash interest payments (net of amortization of debt discounts and fees) $60.0 $113.6 $115 to $125 Cash payments for income taxes, net of refunds(9) $133.3 $124.0 $180 to $200 Working capital and other $22.7 $2.9 $10 to $40 Maintenance CAPEX $110.0 $209.5 $225 to $240 Adjusted free cash flow $370.8 $817.9 $760 to $865 Reconciliations to GAAP provided on pages 26-33. Refer to pages 34-35 for end notes.
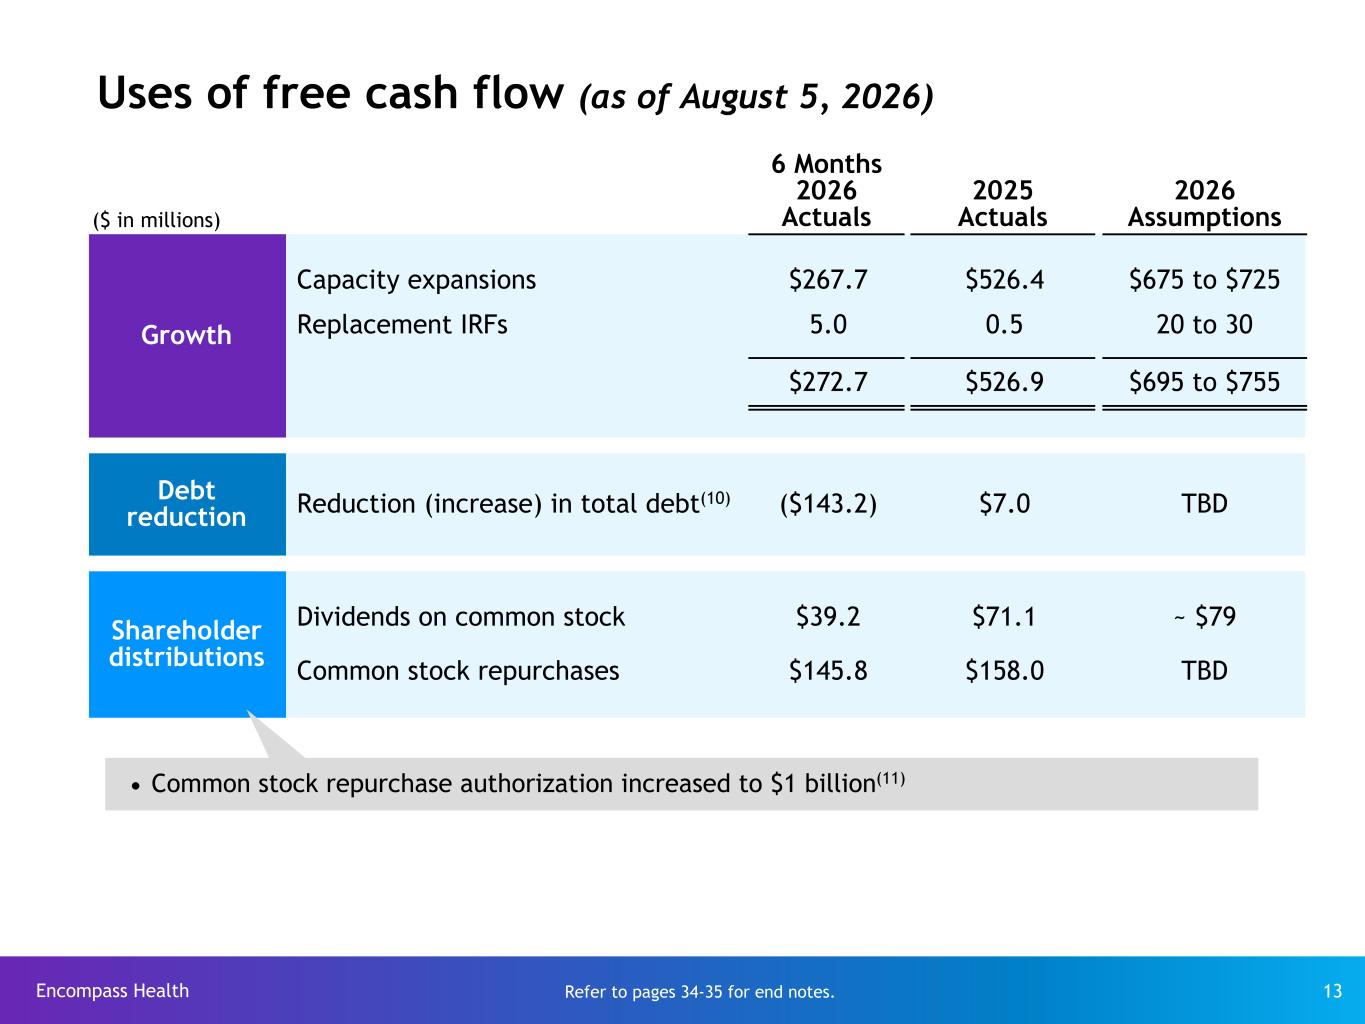
Encompass Health 13 Uses of free cash flow (as of August 5, 2026) ($ in millions) 6 Months 2026 Actuals 2025 Actuals 2026 Assumptions Growth Capacity expansions $267.7 $526.4 $675 to $725 Replacement IRFs 5.0 0.5 20 to 30 $272.7 $526.9 $695 to $755 Debt reduction Reduction (increase) in total debt(10) ($143.2) $7.0 TBD Shareholder distributions Dividends on common stock $39.2 $71.1 ~ $79 Common stock repurchases $145.8 $158.0 TBD Refer to pages 34-35 for end notes. Ÿ Common stock repurchase authorization increased to $1 billion(11)
Appendix
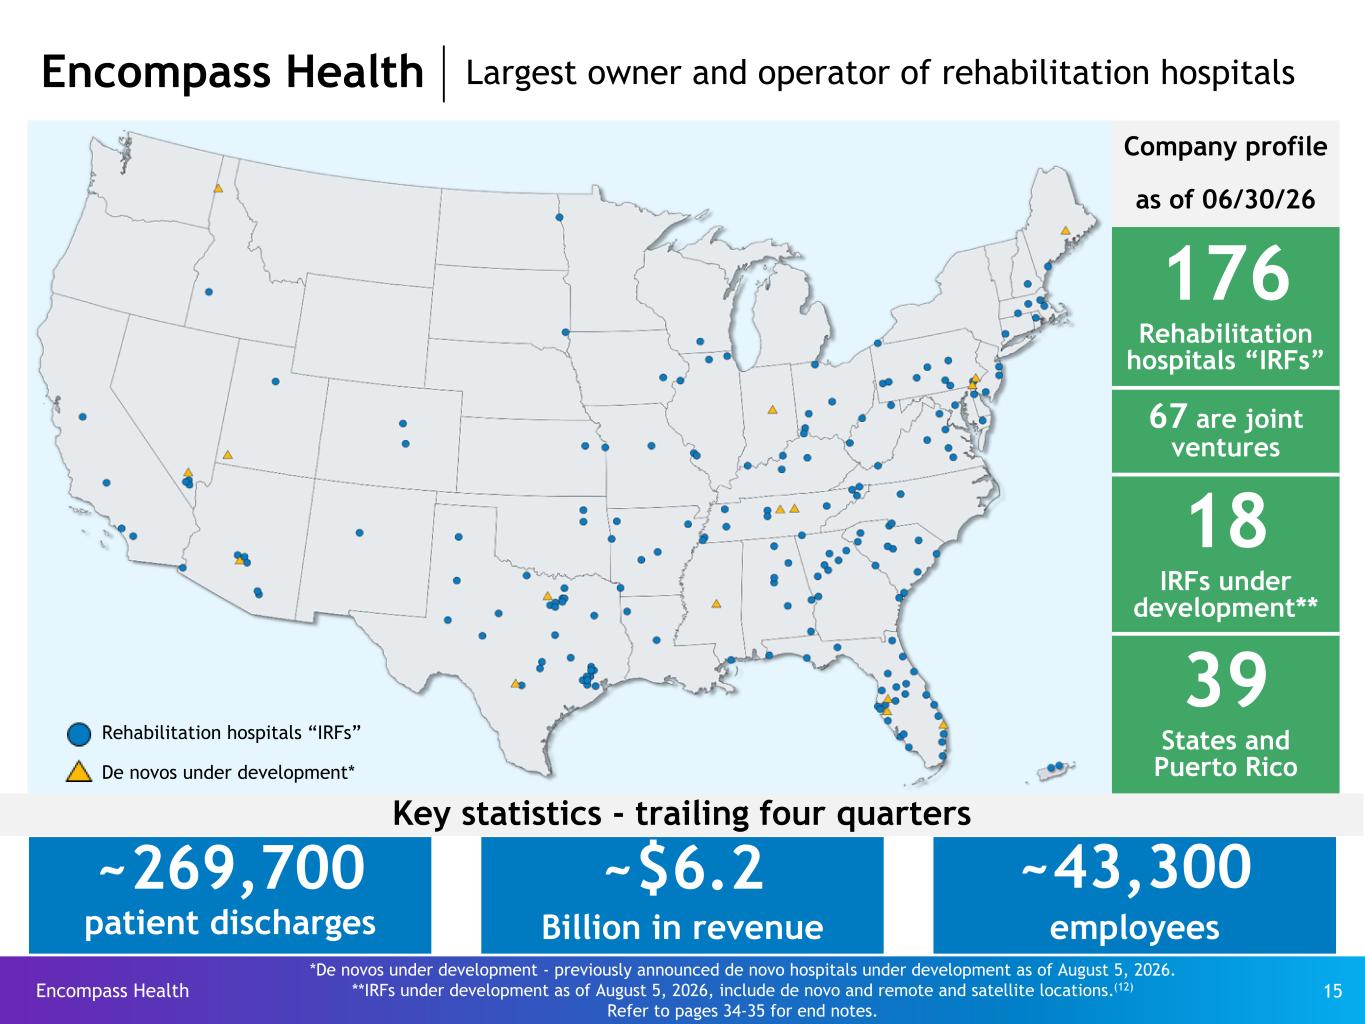
Encompass Health 15 *De novos under development - previously announced de novo hospitals under development as of August 5, 2026. **IRFs under development as of August 5, 2026, include de novo and remote and satellite locations.(12) Refer to pages 34-35 for end notes. Encompass Health Largest owner and operator of rehabilitation hospitals Company profile as of 06/30/26 176 Rehabilitation hospitals “IRFs” 67 are joint ventures 18 IRFs under development** 39 States and Puerto Rico Rehabilitation hospitals “IRFs” De novos under development* Key statistics - trailing four quarters ~269,700 patient discharges ~$6.2 Billion in revenue ~43,300 employees
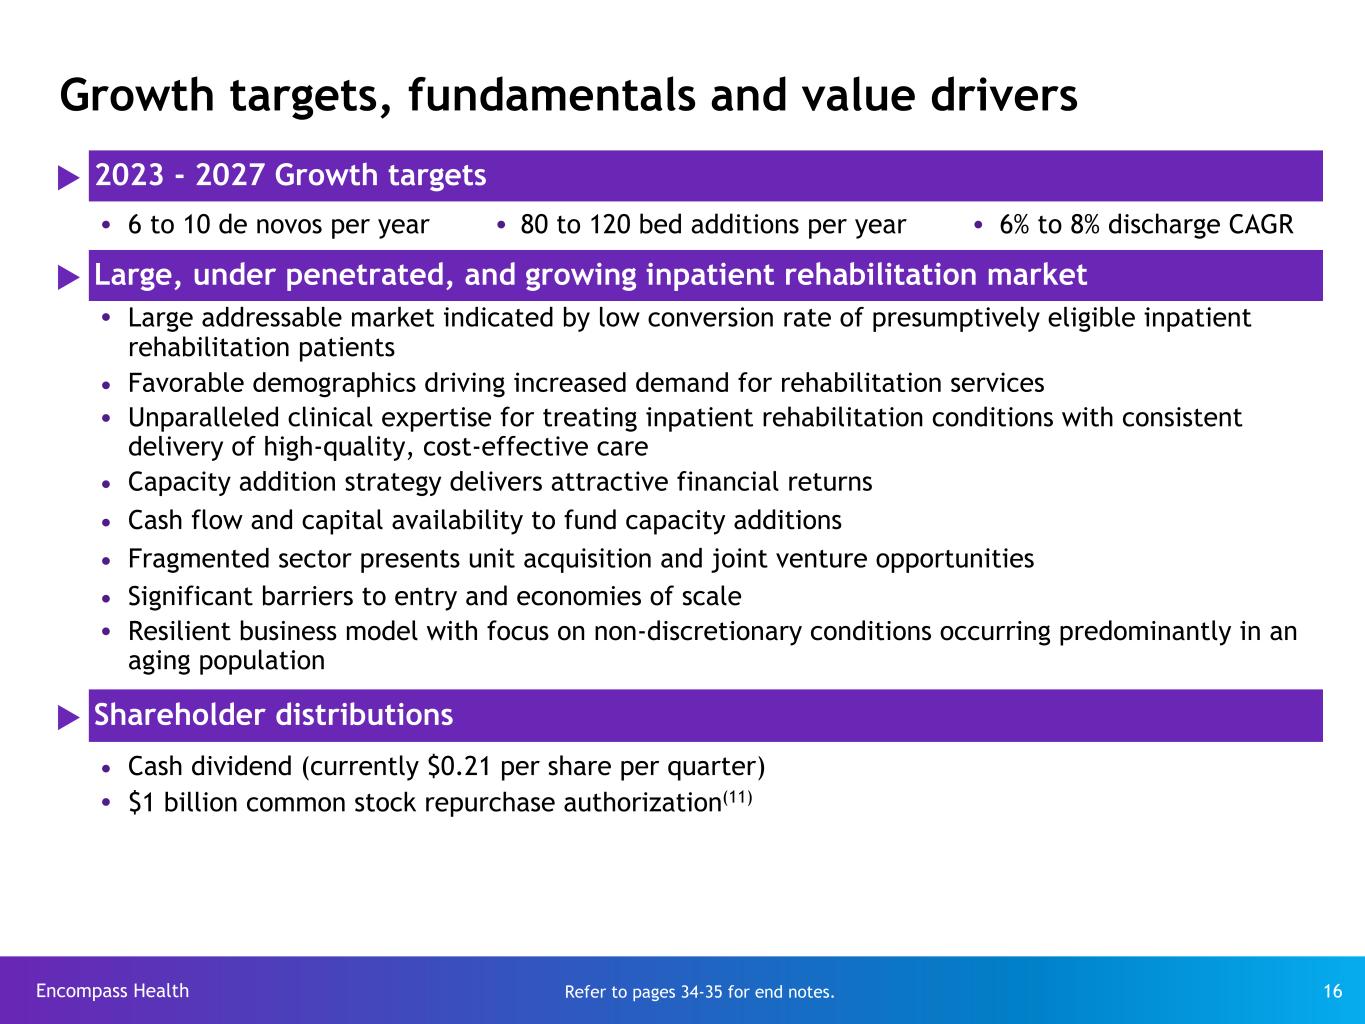
Encompass Health 16 u 2023 - 2027 Growth targets Ÿ 6 to 10 de novos per year Ÿ 80 to 120 bed additions per year Ÿ 6% to 8% discharge CAGR u Large, under penetrated, and growing inpatient rehabilitation market Ÿ Large addressable market indicated by low conversion rate of presumptively eligible inpatient rehabilitation patients Ÿ Favorable demographics driving increased demand for rehabilitation services Ÿ Unparalleled clinical expertise for treating inpatient rehabilitation conditions with consistent delivery of high-quality, cost-effective care Ÿ Capacity addition strategy delivers attractive financial returns Ÿ Cash flow and capital availability to fund capacity additions Ÿ Fragmented sector presents unit acquisition and joint venture opportunities Ÿ Significant barriers to entry and economies of scale Ÿ Resilient business model with focus on non-discretionary conditions occurring predominantly in an aging population u Shareholder distributions Ÿ Cash dividend (currently $0.21 per share per quarter) Ÿ $1 billion common stock repurchase authorization(11) Refer to pages 34-35 for end notes. Growth targets, fundamentals and value drivers
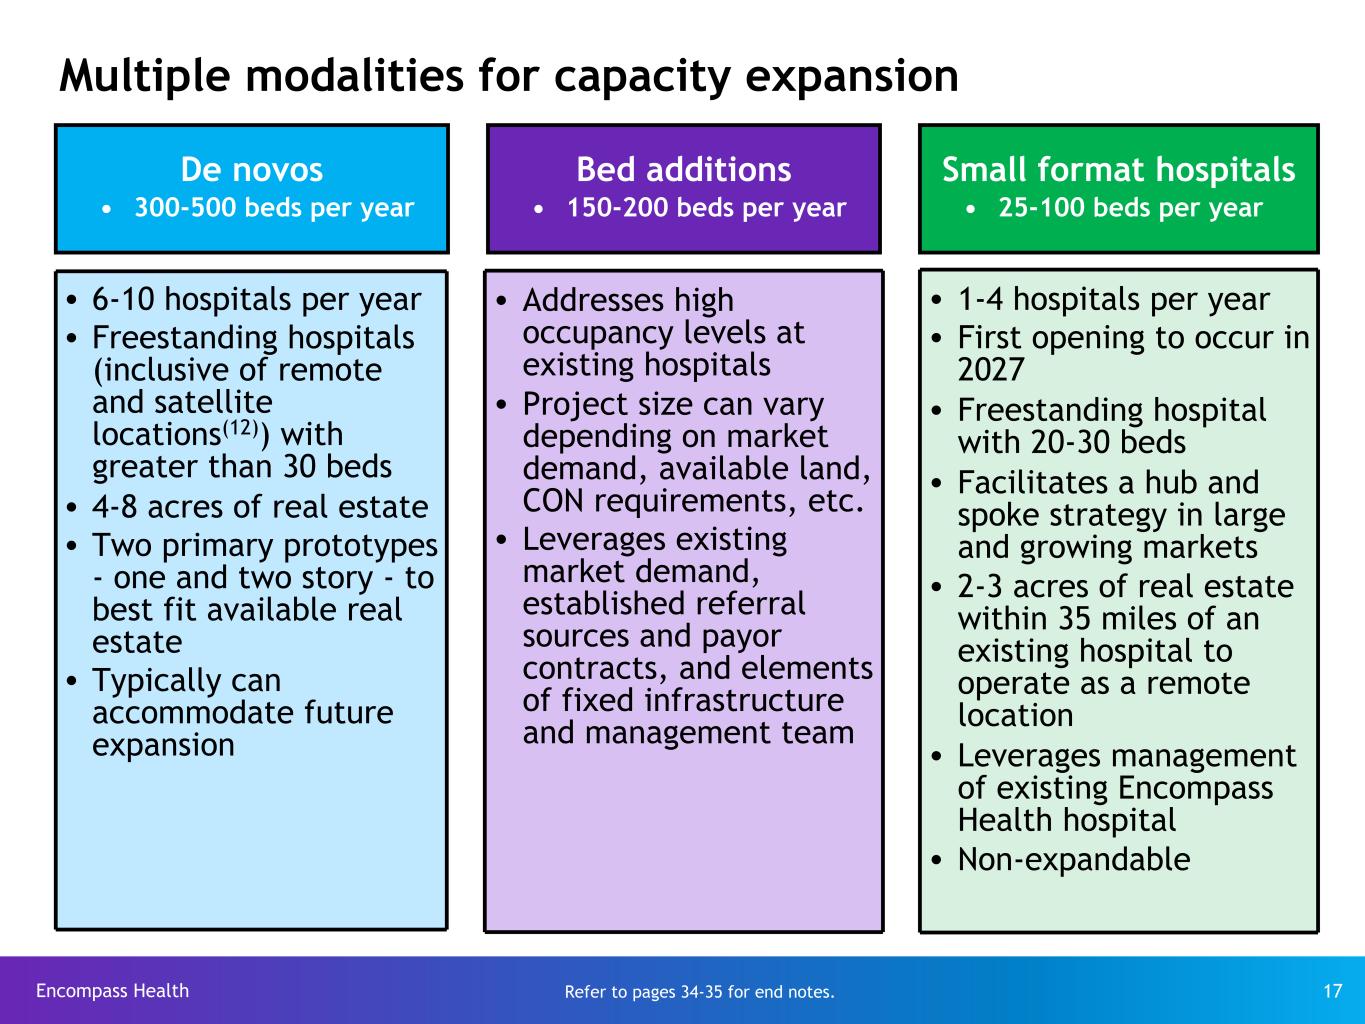
Encompass Health 17 Multiple modalities for capacity expansion De novos • 300-500 beds per year Small format hospitals • 25-100 beds per year Ÿ 6-10 hospitals per year Ÿ Freestanding hospitals (inclusive of remote and satellite locations(12)) with greater than 30 beds Ÿ 4-8 acres of real estate Ÿ Two primary prototypes - one and two story - to best fit available real estate Ÿ Typically can accommodate future expansion Ÿ Addresses high occupancy levels at existing hospitals Ÿ Project size can vary depending on market demand, available land, CON requirements, etc. Ÿ Leverages existing market demand, established referral sources and payor contracts, and elements of fixed infrastructure and management team Ÿ 1-4 hospitals per year Ÿ First opening to occur in 2027 Ÿ Freestanding hospital with 20-30 beds Ÿ Facilitates a hub and spoke strategy in large and growing markets Ÿ 2-3 acres of real estate within 35 miles of an existing hospital to operate as a remote location Ÿ Leverages management of existing Encompass Health hospital Ÿ Non-expandable Refer to pages 34-35 for end notes. Bed additions • 150-200 beds per year
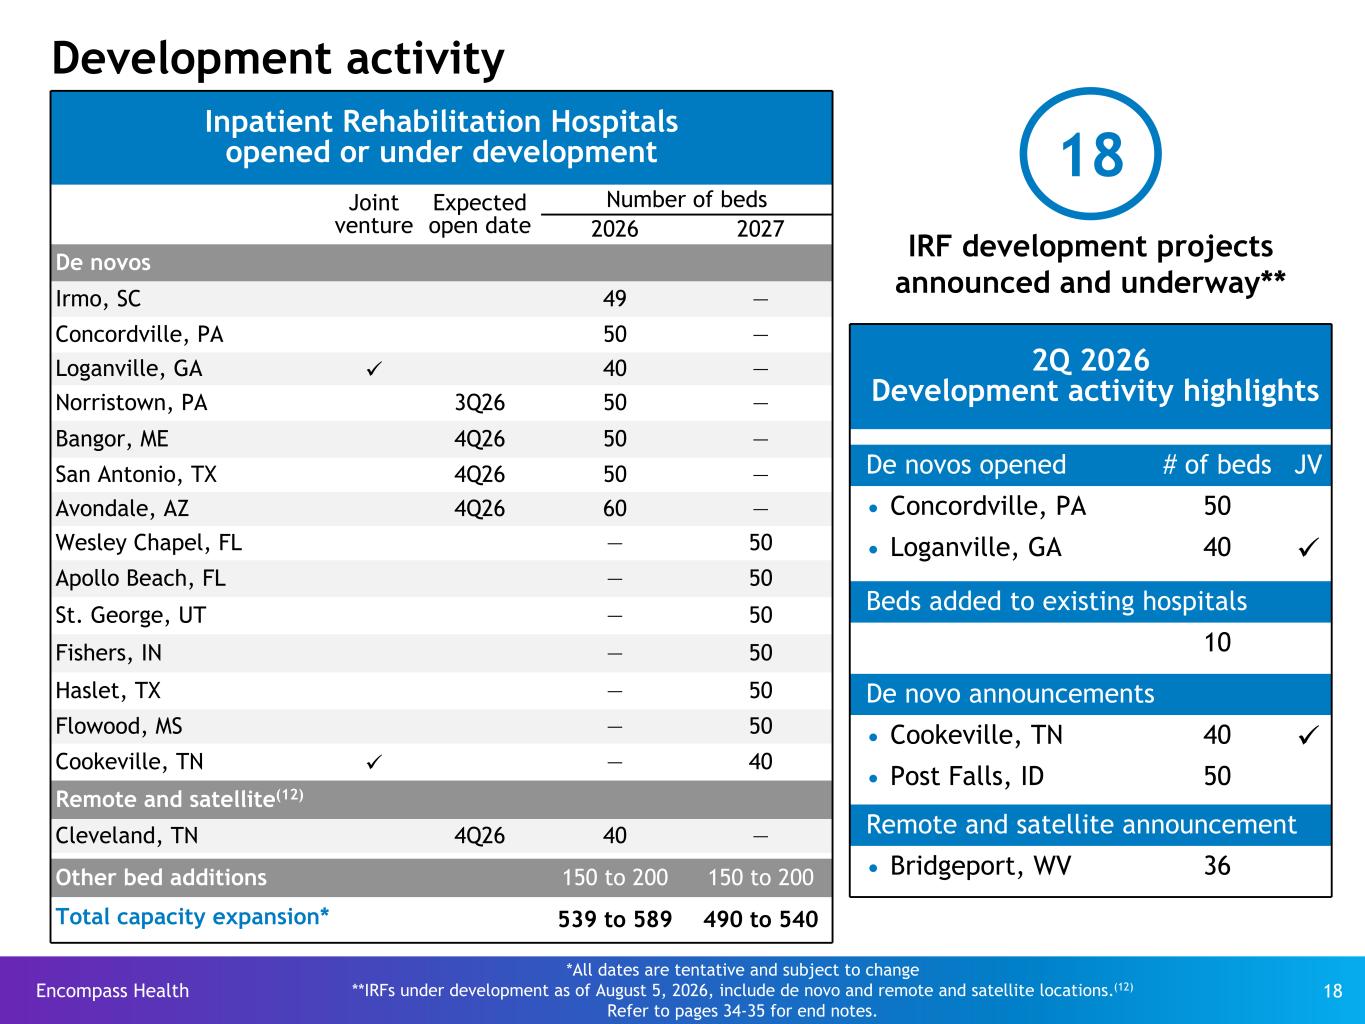
Encompass Health 18 Inpatient Rehabilitation Hospitals opened or under development Joint venture Expected open date Number of beds 2026 2027 De novos Irmo, SC 49 — Concordville, PA 50 — Loganville, GA ü 40 — Norristown, PA 3Q26 50 — Bangor, ME 4Q26 50 — San Antonio, TX 4Q26 50 — Avondale, AZ 4Q26 60 — Wesley Chapel, FL — 50 Apollo Beach, FL — 50 St. George, UT — 50 Fishers, IN — 50 Haslet, TX — 50 Flowood, MS — 50 Cookeville, TN ü — 40 Remote and satellite(12) Cleveland, TN 4Q26 40 — Other bed additions 150 to 200 150 to 200 Total capacity expansion* 539 to 589 490 to 540 Development activity 2Q 2026 Development activity highlights uDe novos opened # of beds JV Ÿ Concordville, PA 50 Ÿ Loganville, GA 40 ü Beds added to existing hospitals 10 De novo announcements Ÿ Cookeville, TN 40 ü Ÿ Post Falls, ID 50 Remote and satellite announcement Ÿ Bridgeport, WV 36 IRF development projects announced and underway** 18 *All dates are tentative and subject to change **IRFs under development as of August 5, 2026, include de novo and remote and satellite locations.(12) Refer to pages 34-35 for end notes.
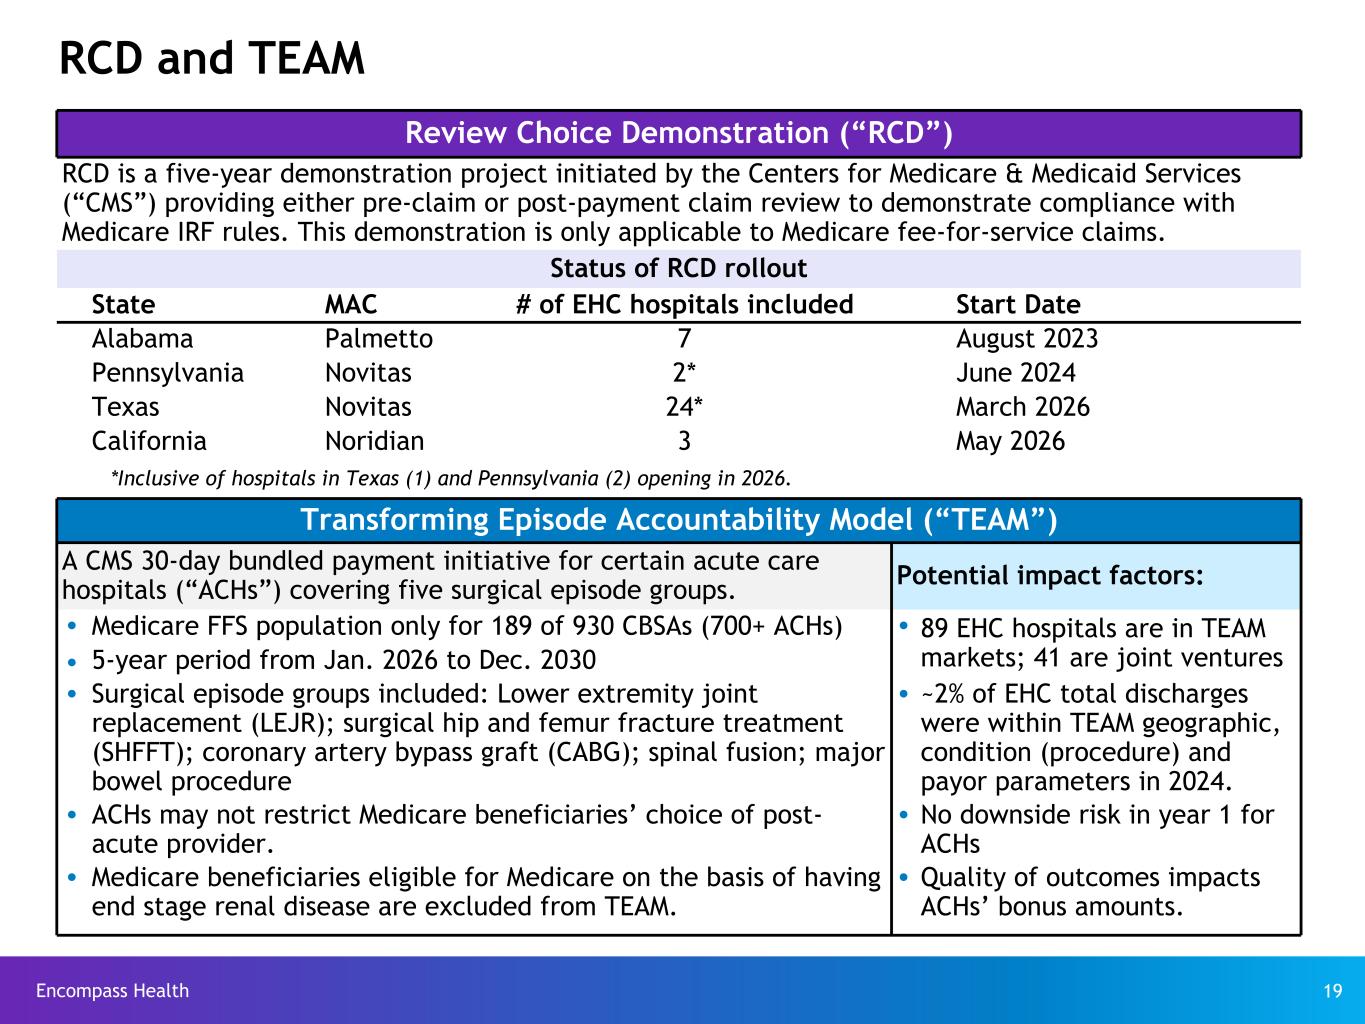
Encompass Health 19 RCD and TEAM Review Choice Demonstration (“RCD”) RCD is a five-year demonstration project initiated by the Centers for Medicare & Medicaid Services (“CMS”) providing either pre-claim or post-payment claim review to demonstrate compliance with Medicare IRF rules. This demonstration is only applicable to Medicare fee-for-service claims. Status of RCD rollout State MAC # of EHC hospitals included Start Date Alabama Palmetto 7 August 2023 Pennsylvania Novitas 2* June 2024 Texas Novitas 24* March 2026 California Noridian 3 May 2026 *Inclusive of hospitals in Texas (1) and Pennsylvania (2) opening in 2026. Transforming Episode Accountability Model (“TEAM”) A CMS 30-day bundled payment initiative for certain acute care hospitals (“ACHs”) covering five surgical episode groups. Potential impact factors: Ÿ Medicare FFS population only for 189 of 930 CBSAs (700+ ACHs) Ÿ 89 EHC hospitals are in TEAM markets; 41 are joint venturesŸ 5-year period from Jan. 2026 to Dec. 2030 Ÿ Surgical episode groups included: Lower extremity joint replacement (LEJR); surgical hip and femur fracture treatment (SHFFT); coronary artery bypass graft (CABG); spinal fusion; major bowel procedure Ÿ ~2% of EHC total discharges were within TEAM geographic, condition (procedure) and payor parameters in 2024. Ÿ ACHs may not restrict Medicare beneficiaries’ choice of post- acute provider. Ÿ No downside risk in year 1 for ACHs Ÿ Medicare beneficiaries eligible for Medicare on the basis of having end stage renal disease are excluded from TEAM. Ÿ Quality of outcomes impacts ACHs’ bonus amounts.
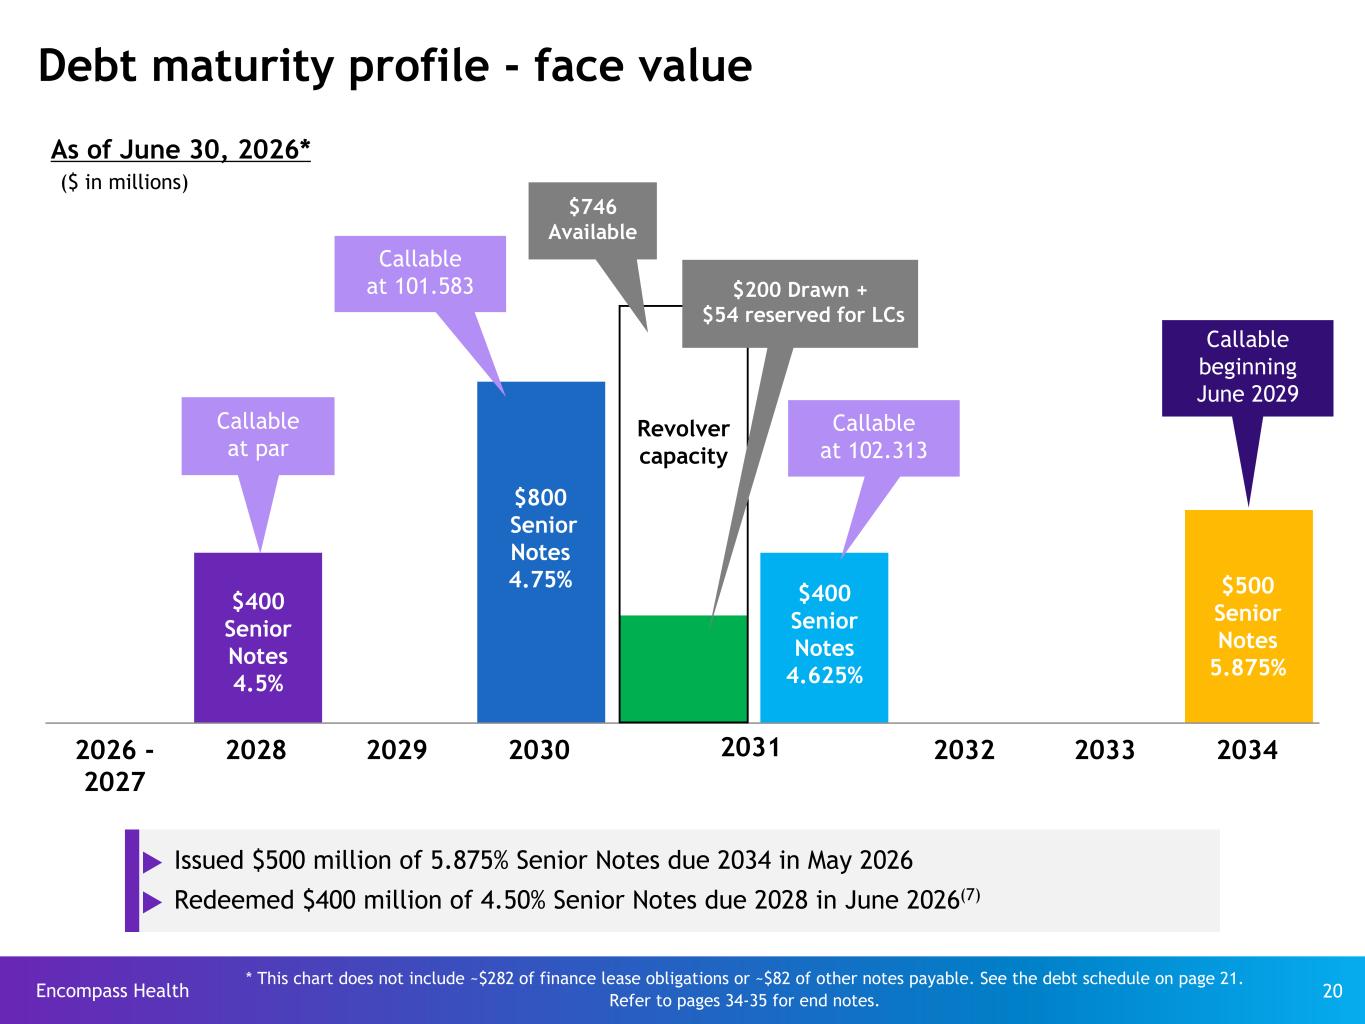
Encompass Health 20 2026 - 2027 2028 2029 2030 2031 2031 2032 2033 2034 * This chart does not include ~$282 of finance lease obligations or ~$82 of other notes payable. See the debt schedule on page 21. Refer to pages 34-35 for end notes. Debt maturity profile - face value ($ in millions) Revolver capacity $800 Senior Notes 4.75% $400 Senior Notes 4.5% As of June 30, 2026* $746 Available $200 Drawn + $54 reserved for LCs Callable at par $400 Senior Notes 4.625% Callable at 101.583 u Issued $500 million of 5.875% Senior Notes due 2034 in May 2026 u Redeemed $400 million of 4.50% Senior Notes due 2028 in June 2026(7) 2031 Callable at 102.313 Callable beginning June 2029 $500 Senior Notes 5.875%
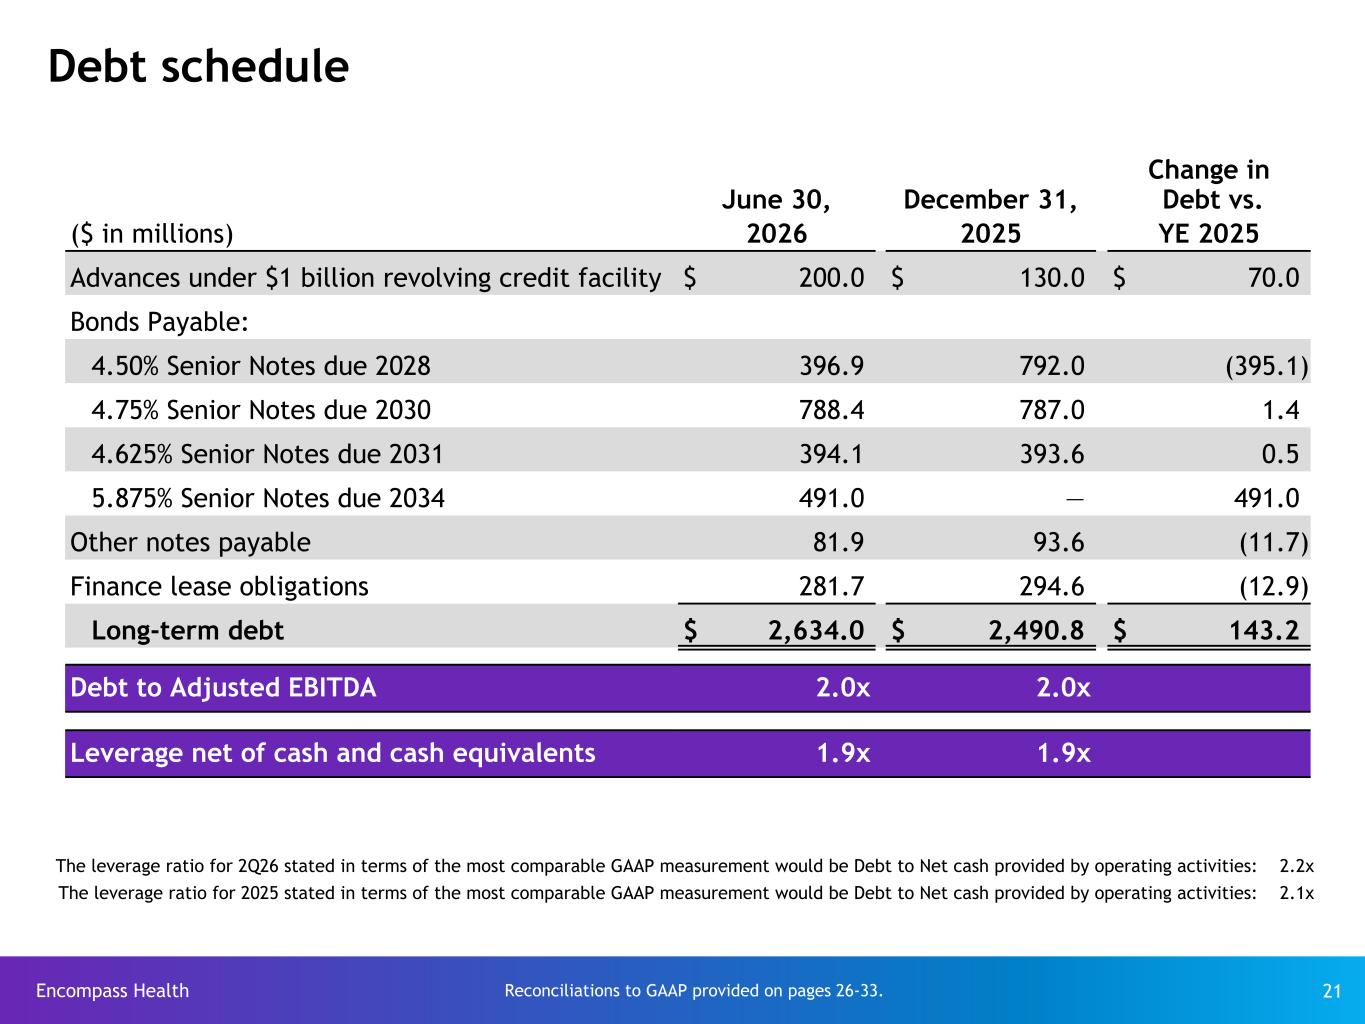
Encompass Health 21 Debt schedule Change in June 30, December 31, Debt vs. ($ in millions) 2026 2025 YE 2025 Advances under $1 billion revolving credit facility $ 200.0 $ 130.0 $ 70.0 Bonds Payable: 4.50% Senior Notes due 2028 396.9 792.0 (395.1) 4.75% Senior Notes due 2030 788.4 787.0 1.4 4.625% Senior Notes due 2031 394.1 393.6 0.5 5.875% Senior Notes due 2034 491.0 — 491.0 Other notes payable 81.9 93.6 (11.7) Finance lease obligations 281.7 294.6 (12.9) Long-term debt $ 2,634.0 $ 2,490.8 $ 143.2 Debt to Adjusted EBITDA 2.0x 2.0x Leverage net of cash and cash equivalents 1.9x 1.9x Reconciliations to GAAP provided on pages 26-33. The leverage ratio for 2Q26 stated in terms of the most comparable GAAP measurement would be Debt to Net cash provided by operating activities: 2.2x The leverage ratio for 2025 stated in terms of the most comparable GAAP measurement would be Debt to Net cash provided by operating activities: 2.1x
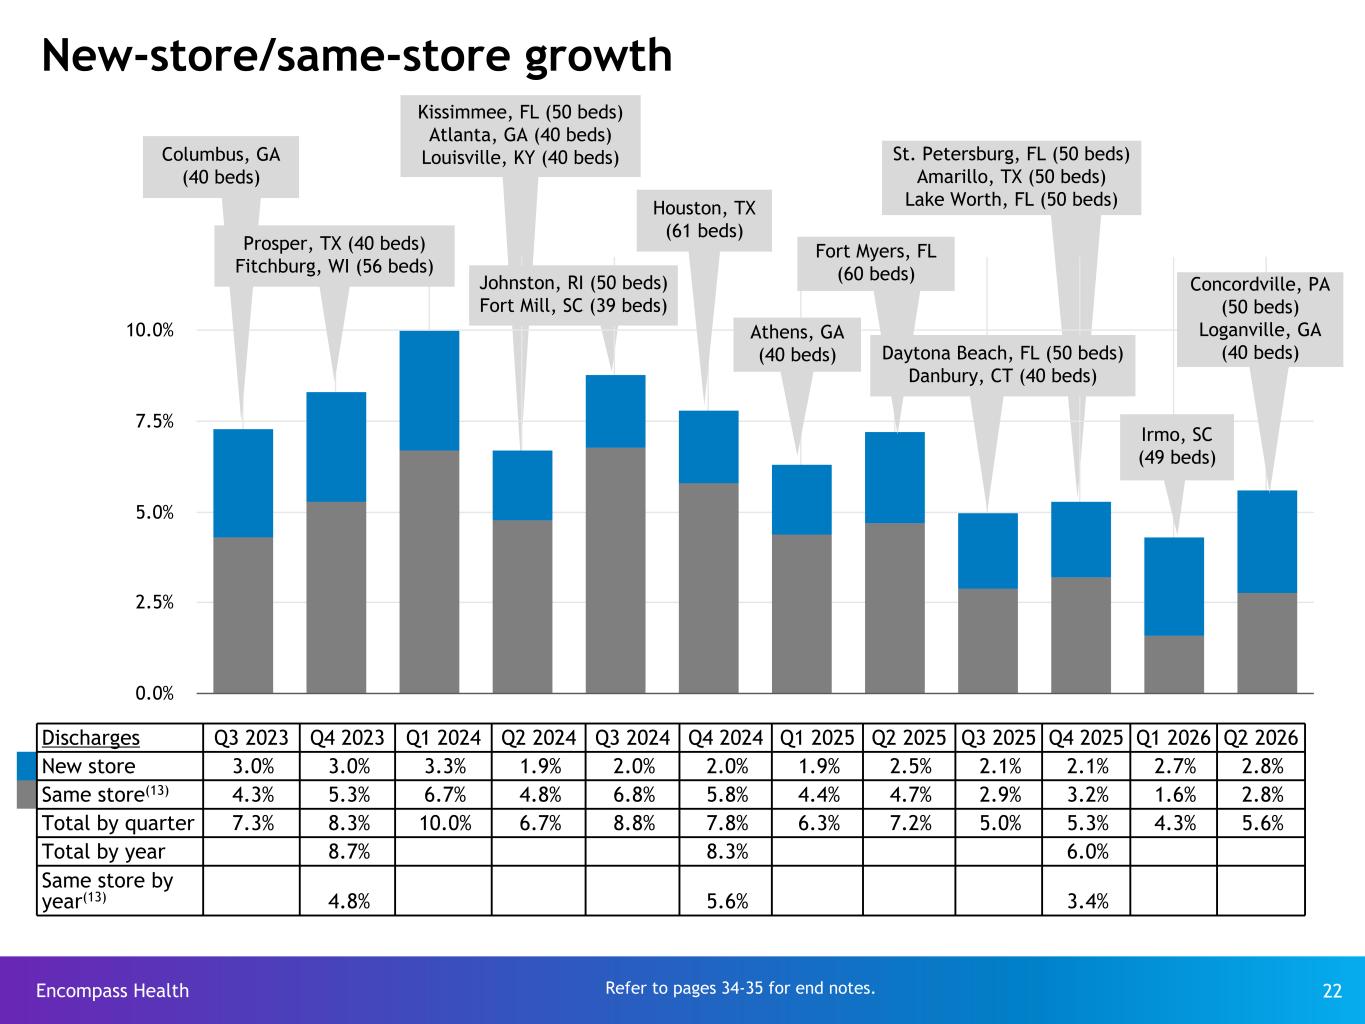
Encompass Health 22 0.0% 2.5% 5.0% 7.5% 10.0% New-store/same-store growth Discharges Q3 2023 Q4 2023 Q1 2024 Q2 2024 Q3 2024 Q4 2024 Q1 2025 Q2 2025 Q3 2025 Q4 2025 Q1 2026 Q2 2026 New store 3.0% 3.0% 3.3% 1.9% 2.0% 2.0% 1.9% 2.5% 2.1% 2.1% 2.7% 2.8% Same store(13) 4.3% 5.3% 6.7% 4.8% 6.8% 5.8% 4.4% 4.7% 2.9% 3.2% 1.6% 2.8% Total by quarter 7.3% 8.3% 10.0% 6.7% 8.8% 7.8% 6.3% 7.2% 5.0% 5.3% 4.3% 5.6% Total by year 8.7% 8.3% 6.0% Same store by year(13) 4.8% 5.6% 3.4% Johnston, RI (50 beds) Fort Mill, SC (39 beds) Athens, GA (40 beds) Irmo, SC (49 beds) Columbus, GA (40 beds) Prosper, TX (40 beds) Fitchburg, WI (56 beds) Kissimmee, FL (50 beds) Atlanta, GA (40 beds) Louisville, KY (40 beds) Refer to pages 34-35 for end notes. Houston, TX (61 beds) Fort Myers, FL (60 beds) Daytona Beach, FL (50 beds) Danbury, CT (40 beds) St. Petersburg, FL (50 beds) Amarillo, TX (50 beds) Lake Worth, FL (50 beds) Concordville, PA (50 beds) Loganville, GA (40 beds)
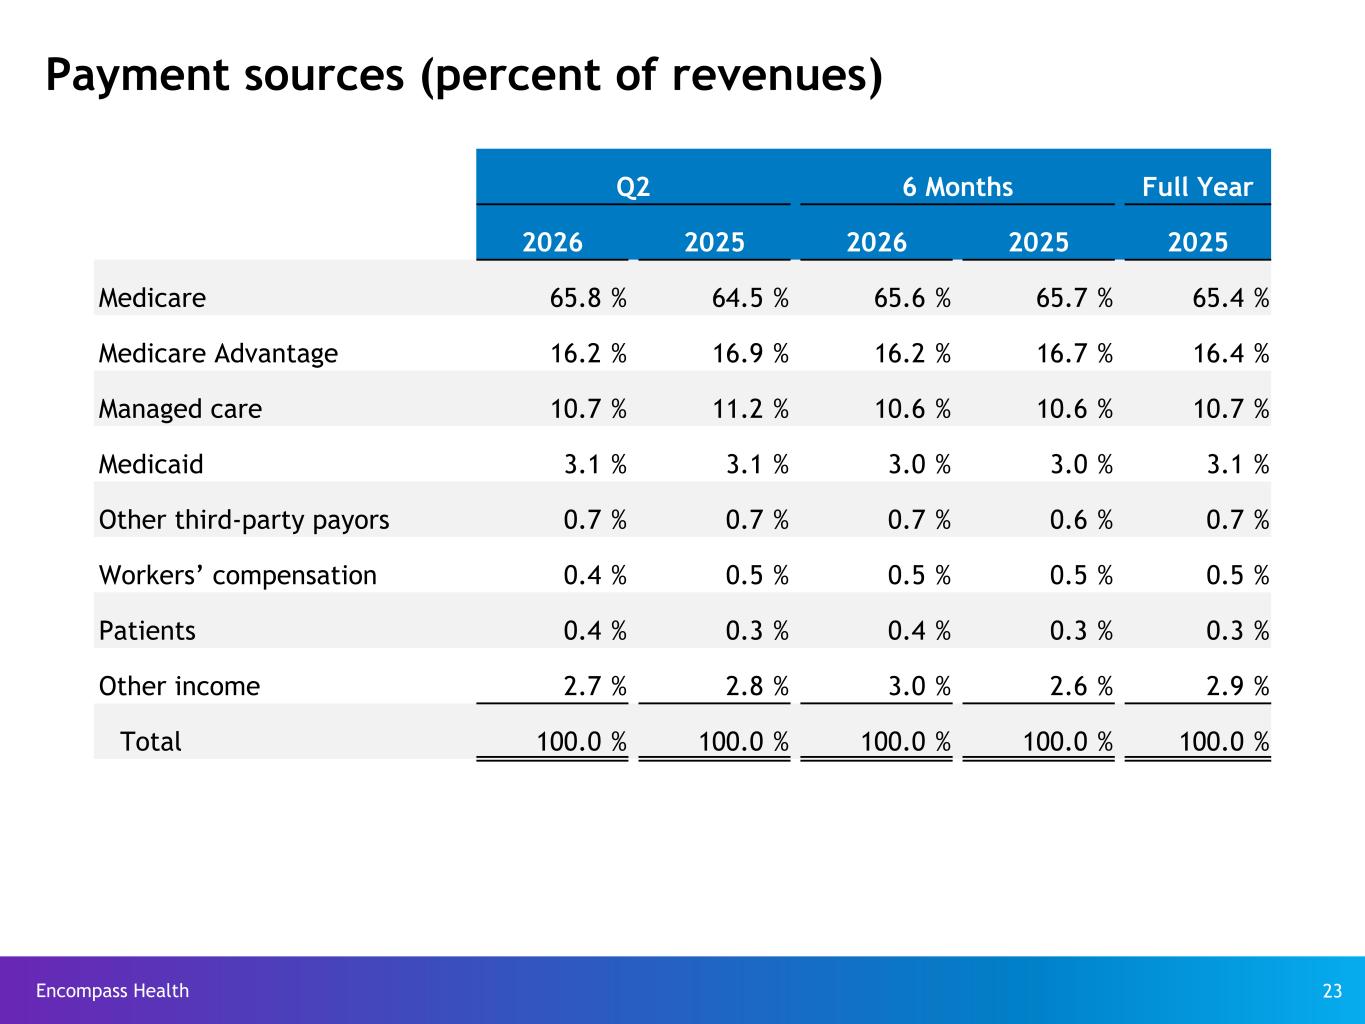
Encompass Health 23 Payment sources (percent of revenues) Q2 6 Months Full Year 2026 2025 2026 2025 2025 Medicare 65.8 % 64.5 % 65.6 % 65.7 % 65.4 % Medicare Advantage 16.2 % 16.9 % 16.2 % 16.7 % 16.4 % Managed care 10.7 % 11.2 % 10.6 % 10.6 % 10.7 % Medicaid 3.1 % 3.1 % 3.0 % 3.0 % 3.1 % Other third-party payors 0.7 % 0.7 % 0.7 % 0.6 % 0.7 % Workers’ compensation 0.4 % 0.5 % 0.5 % 0.5 % 0.5 % Patients 0.4 % 0.3 % 0.4 % 0.3 % 0.3 % Other income 2.7 % 2.8 % 3.0 % 2.6 % 2.9 % Total 100.0 % 100.0 % 100.0 % 100.0 % 100.0 %
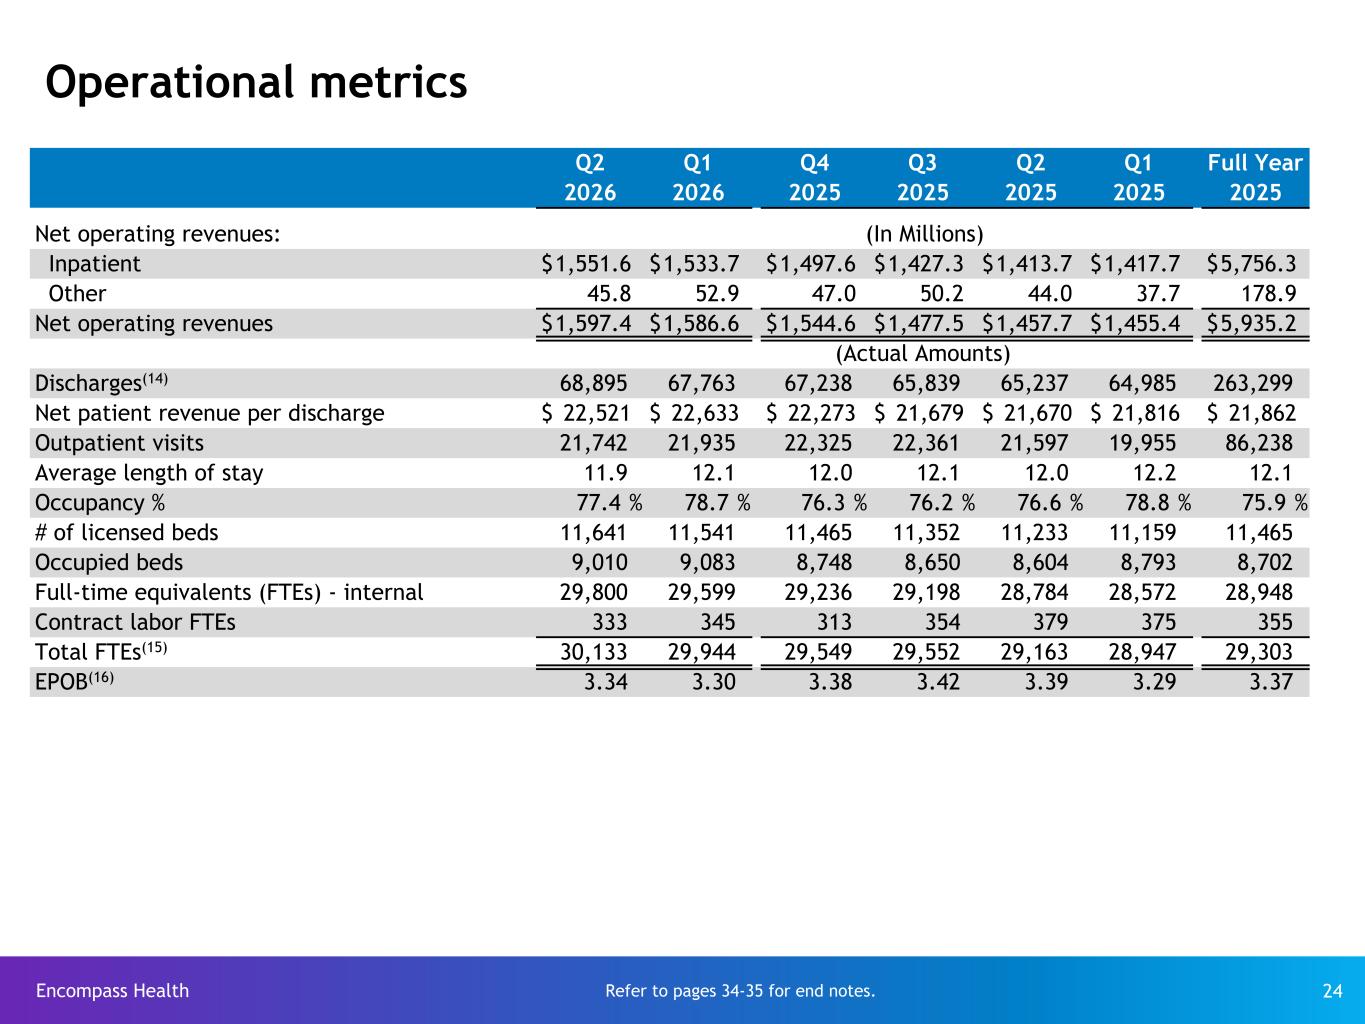
Encompass Health 24 Operational metrics Q2 Q1 Q4 Q3 Q2 Q1 Full Year 2026 2026 2025 2025 2025 2025 2025 Net operating revenues: (In Millions) Inpatient $ 1,551.6 $ 1,533.7 $ 1,497.6 $ 1,427.3 $ 1,413.7 $ 1,417.7 $ 5,756.3 Other 45.8 52.9 47.0 50.2 44.0 37.7 178.9 Net operating revenues $ 1,597.4 $ 1,586.6 $ 1,544.6 $ 1,477.5 $ 1,457.7 $ 1,455.4 $ 5,935.2 (Actual Amounts) Discharges(14) 68,895 67,763 67,238 65,839 65,237 64,985 263,299 Net patient revenue per discharge $ 22,521 $ 22,633 $ 22,273 $ 21,679 $ 21,670 $ 21,816 $ 21,862 Outpatient visits 21,742 21,935 22,325 22,361 21,597 19,955 86,238 Average length of stay 11.9 12.1 12.0 12.1 12.0 12.2 12.1 Occupancy % 77.4 % 78.7 % 76.3 % 76.2 % 76.6 % 78.8 % 75.9 % # of licensed beds 11,641 11,541 11,465 11,352 11,233 11,159 11,465 Occupied beds 9,010 9,083 8,748 8,650 8,604 8,793 8,702 Full-time equivalents (FTEs) - internal 29,800 29,599 29,236 29,198 28,784 28,572 28,948 Contract labor FTEs 333 345 313 354 379 375 355 Total FTEs(15) 30,133 29,944 29,549 29,552 29,163 28,947 29,303 EPOB(16) 3.34 3.30 3.38 3.42 3.39 3.29 3.37 Refer to pages 34-35 for end notes.
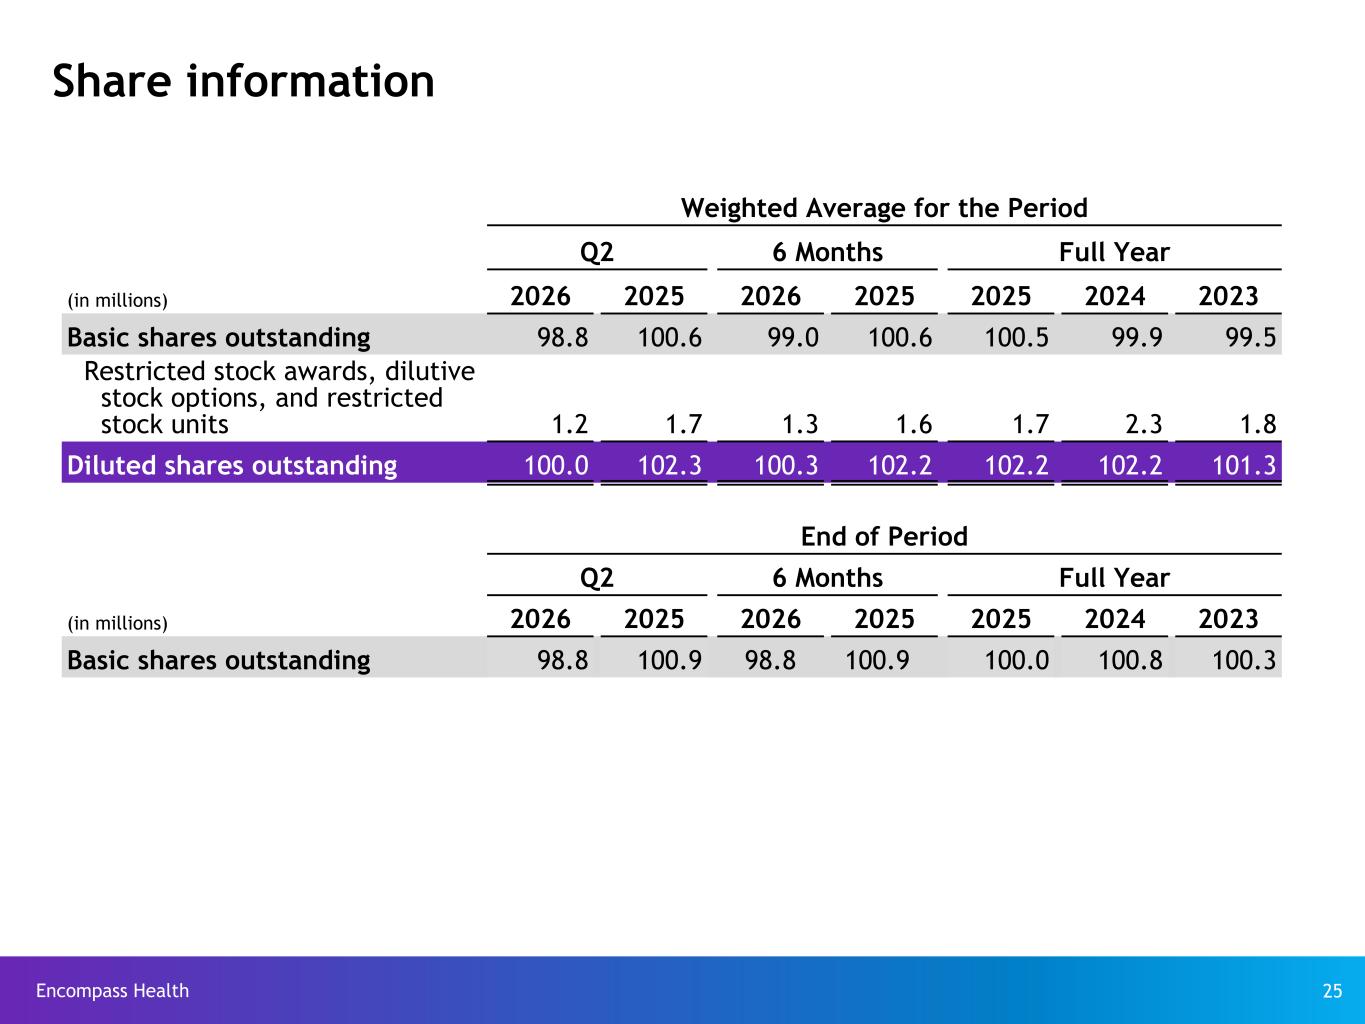
Encompass Health 25 Share information Weighted Average for the Period Q2 6 Months Full Year (in millions) 2026 2025 2026 2025 2025 2024 2023 Basic shares outstanding 98.8 100.6 99.0 100.6 100.5 99.9 99.5 Restricted stock awards, dilutive stock options, and restricted stock units 1.2 1.7 1.3 1.6 1.7 2.3 1.8 Diluted shares outstanding 100.0 102.3 100.3 102.2 102.2 102.2 101.3 End of Period Q2 6 Months Full Year (in millions) 2026 2025 2026 2025 2025 2024 2023 Basic shares outstanding 98.8 100.9 98.8 100.9 100.0 100.8 100.3
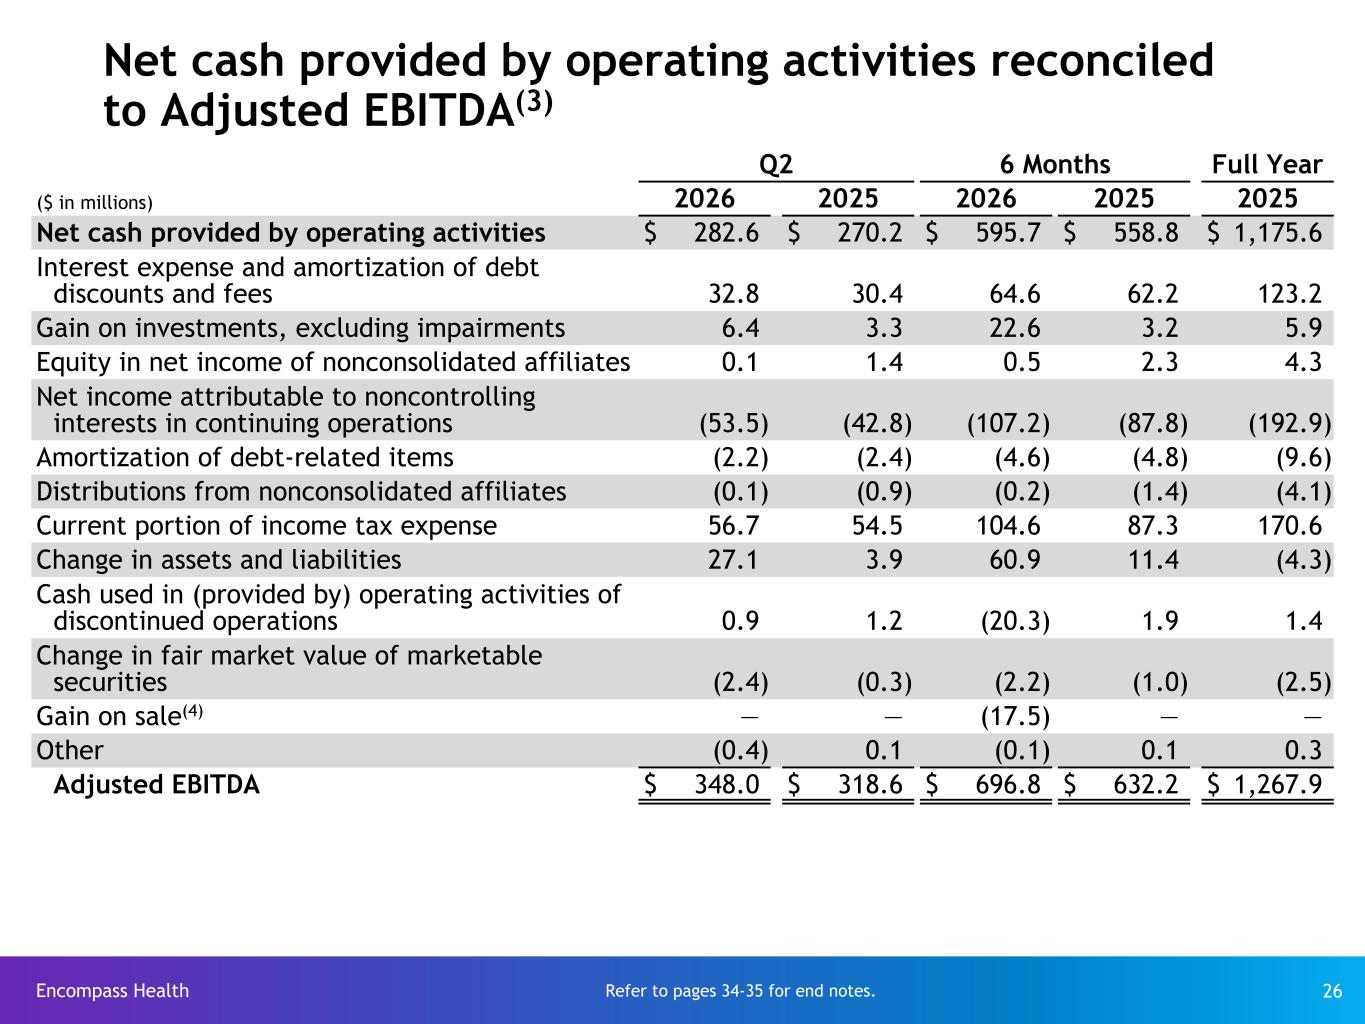
Encompass Health 26 Net cash provided by operating activities reconciled to Adjusted EBITDA(3) Q2 6 Months Full Year ($ in millions) 2026 2025 2026 2025 2025 Net cash provided by operating activities $ 282.6 $ 270.2 $ 595.7 $ 558.8 $ 1,175.6 Interest expense and amortization of debt discounts and fees 32.8 30.4 64.6 62.2 123.2 Gain on investments, excluding impairments 6.4 3.3 22.6 3.2 5.9 Equity in net income of nonconsolidated affiliates 0.1 1.4 0.5 2.3 4.3 Net income attributable to noncontrolling interests in continuing operations (53.5) (42.8) (107.2) (87.8) (192.9) Amortization of debt-related items (2.2) (2.4) (4.6) (4.8) (9.6) Distributions from nonconsolidated affiliates (0.1) (0.9) (0.2) (1.4) (4.1) Current portion of income tax expense 56.7 54.5 104.6 87.3 170.6 Change in assets and liabilities 27.1 3.9 60.9 11.4 (4.3) Cash used in (provided by) operating activities of discontinued operations 0.9 1.2 (20.3) 1.9 1.4 Change in fair market value of marketable securities (2.4) (0.3) (2.2) (1.0) (2.5) Gain on sale(4) — — (17.5) — — Other (0.4) 0.1 (0.1) 0.1 0.3 Adjusted EBITDA $ 348.0 $ 318.6 $ 696.8 $ 632.2 $ 1,267.9 Refer to pages 34-35 for end notes.
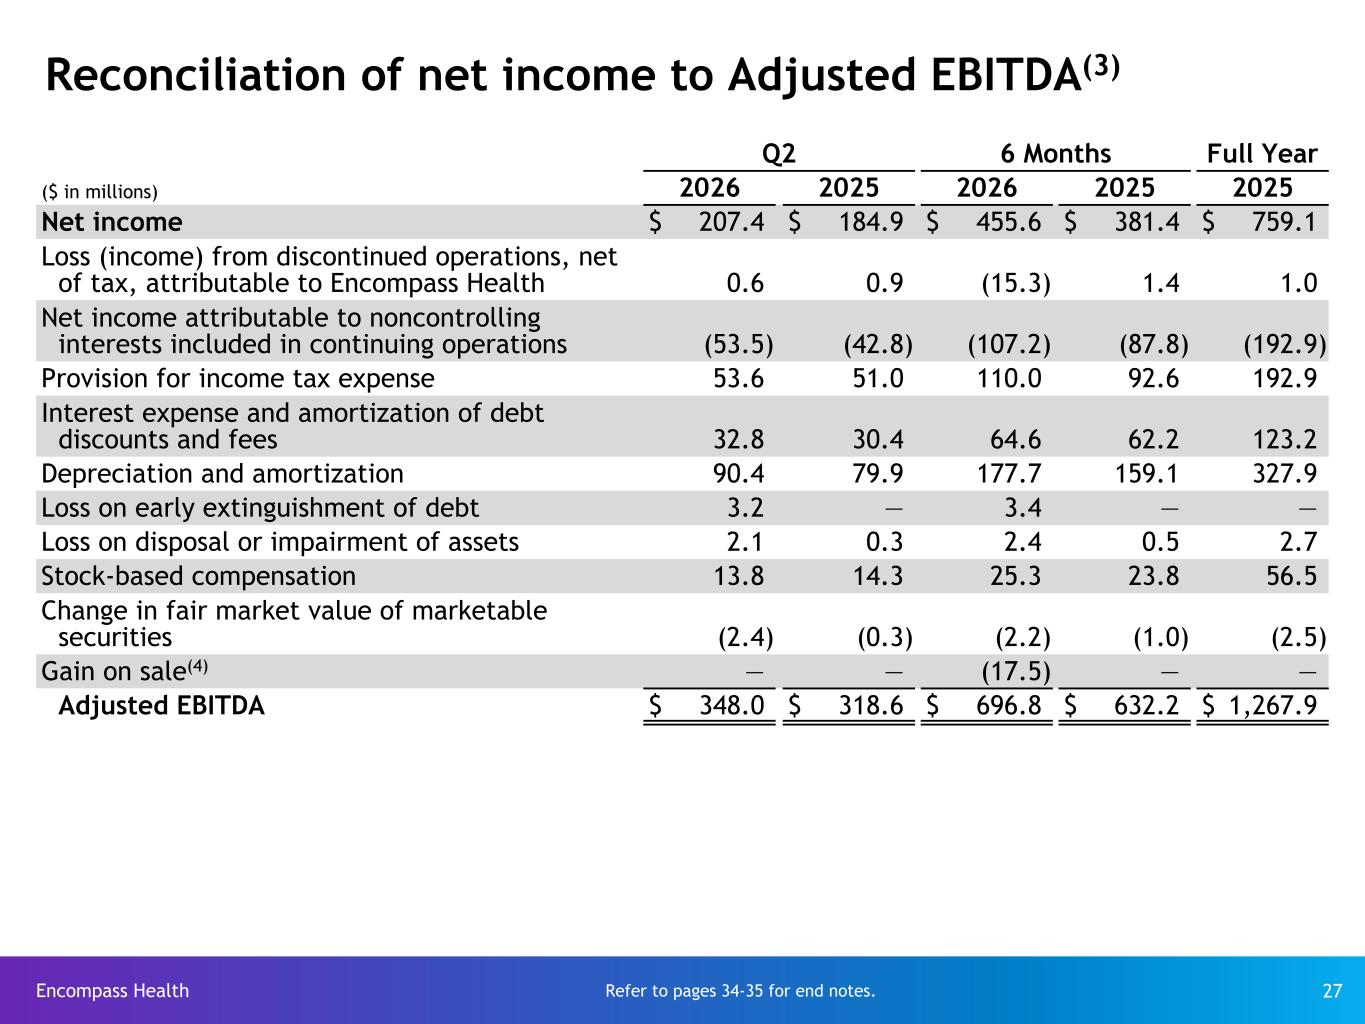
Encompass Health 27 Reconciliation of net income to Adjusted EBITDA(3) Q2 6 Months Full Year ($ in millions) 2026 2025 2026 2025 2025 Net income $ 207.4 $ 184.9 $ 455.6 $ 381.4 $ 759.1 Loss (income) from discontinued operations, net of tax, attributable to Encompass Health 0.6 0.9 (15.3) 1.4 1.0 Net income attributable to noncontrolling interests included in continuing operations (53.5) (42.8) (107.2) (87.8) (192.9) Provision for income tax expense 53.6 51.0 110.0 92.6 192.9 Interest expense and amortization of debt discounts and fees 32.8 30.4 64.6 62.2 123.2 Depreciation and amortization 90.4 79.9 177.7 159.1 327.9 Loss on early extinguishment of debt 3.2 — 3.4 — — Loss on disposal or impairment of assets 2.1 0.3 2.4 0.5 2.7 Stock-based compensation 13.8 14.3 25.3 23.8 56.5 Change in fair market value of marketable securities (2.4) (0.3) (2.2) (1.0) (2.5) Gain on sale(4) — — (17.5) — — Adjusted EBITDA $ 348.0 $ 318.6 $ 696.8 $ 632.2 $ 1,267.9 Refer to pages 34-35 for end notes.
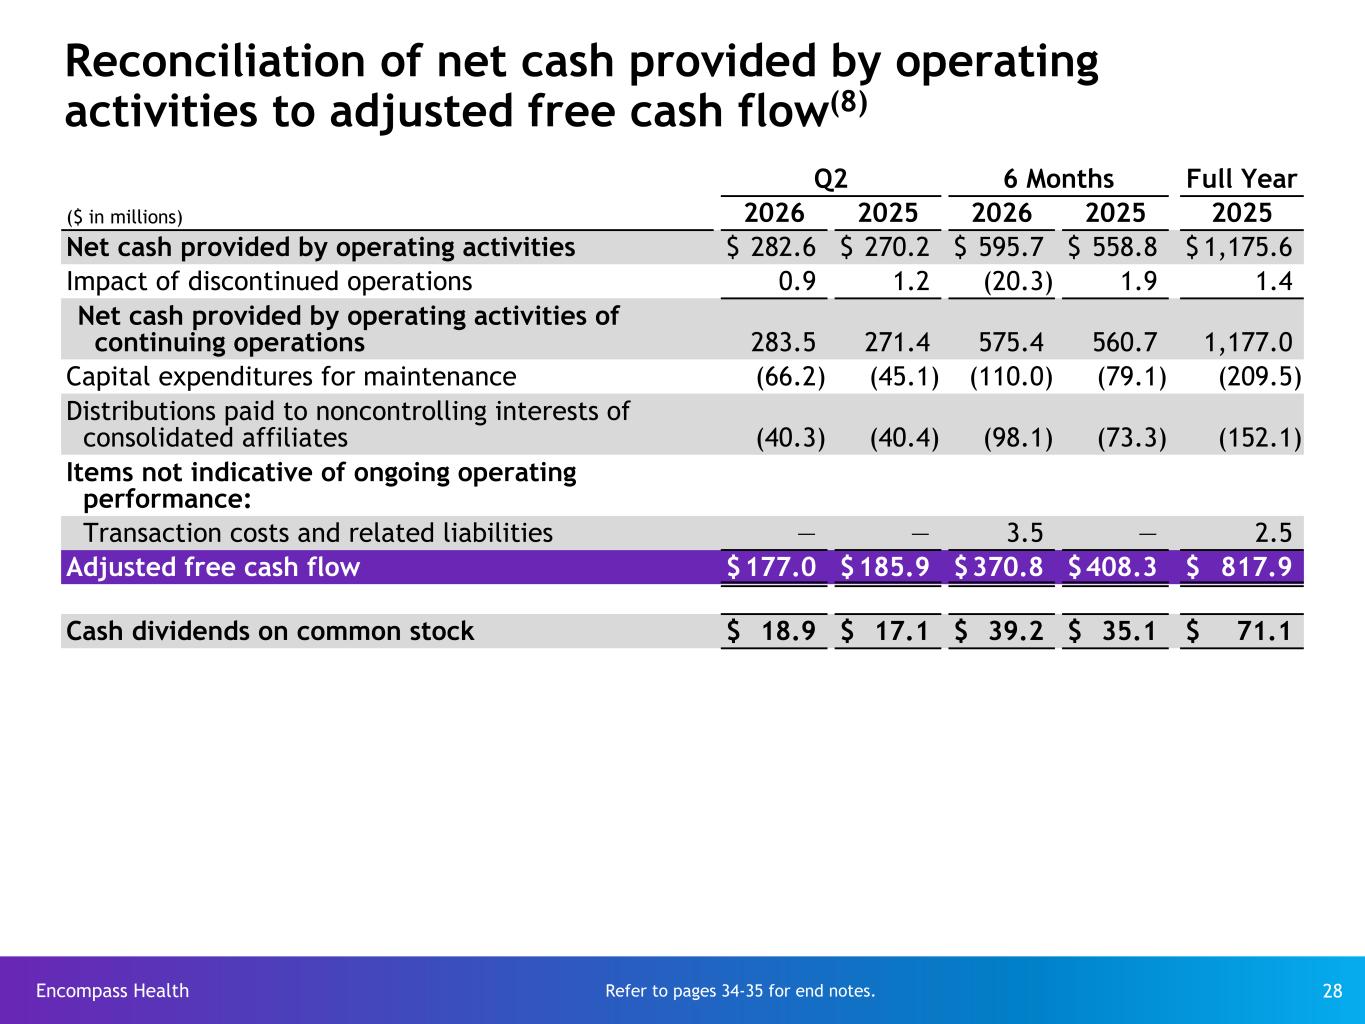
Encompass Health 28 Reconciliation of net cash provided by operating activities to adjusted free cash flow(8) Q2 6 Months Full Year ($ in millions) 2026 2025 2026 2025 2025 Net cash provided by operating activities $ 282.6 $ 270.2 $ 595.7 $ 558.8 $ 1,175.6 Impact of discontinued operations 0.9 1.2 (20.3) 1.9 1.4 Net cash provided by operating activities of continuing operations 283.5 271.4 575.4 560.7 1,177.0 Capital expenditures for maintenance (66.2) (45.1) (110.0) (79.1) (209.5) Distributions paid to noncontrolling interests of consolidated affiliates (40.3) (40.4) (98.1) (73.3) (152.1) Items not indicative of ongoing operating performance: Transaction costs and related liabilities — — 3.5 — 2.5 Adjusted free cash flow $ 177.0 $ 185.9 $ 370.8 $ 408.3 $ 817.9 Cash dividends on common stock $ 18.9 $ 17.1 $ 39.2 $ 35.1 $ 71.1 Refer to pages 34-35 for end notes.
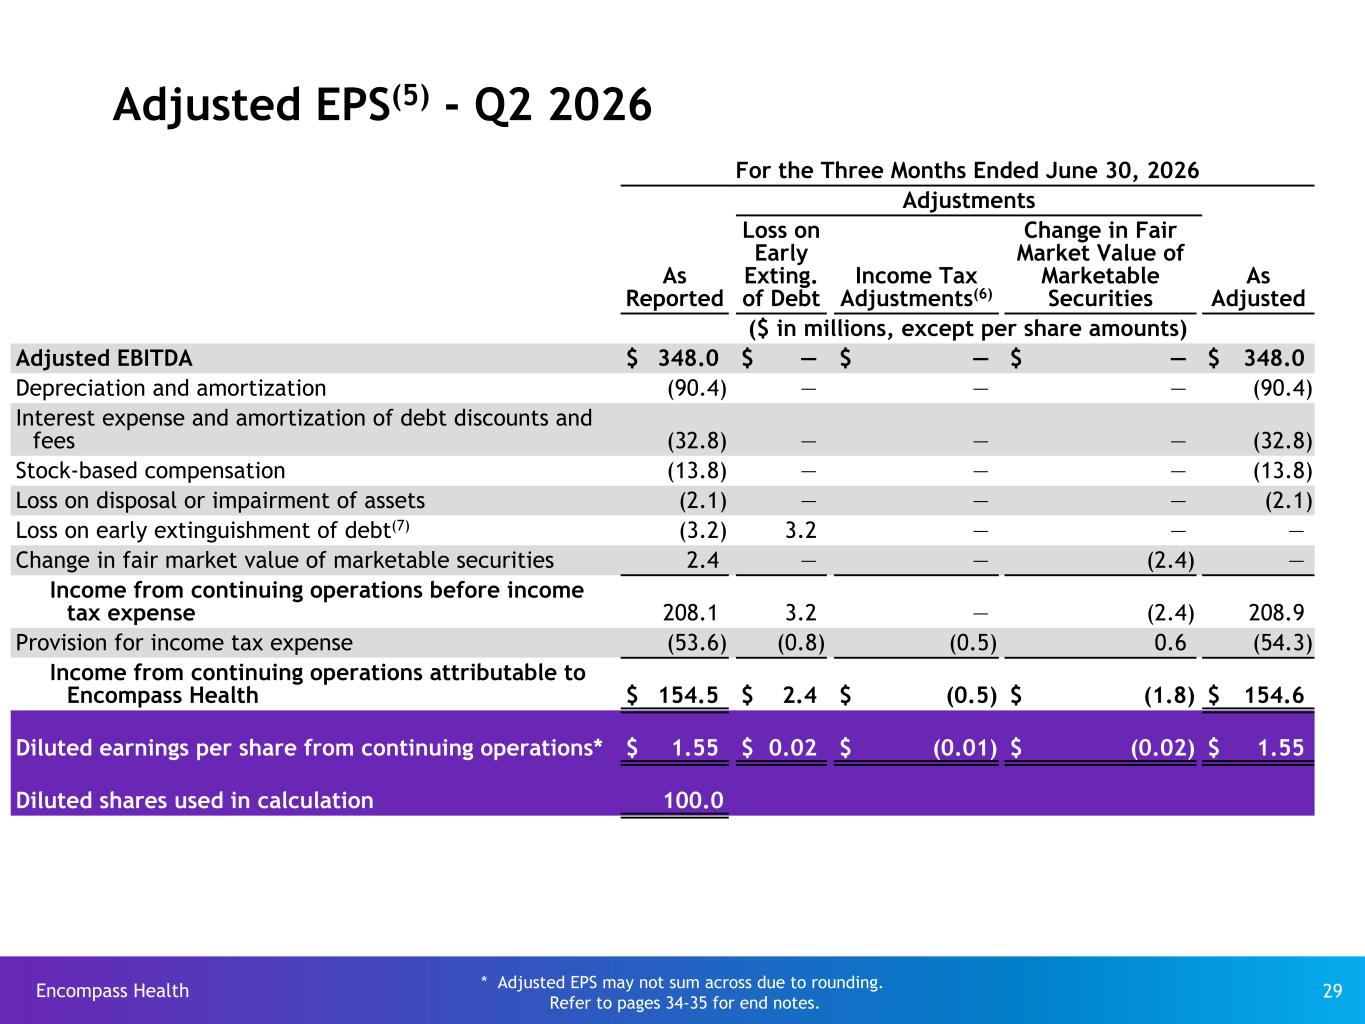
Encompass Health 29 For the Three Months Ended June 30, 2026 Adjustments As Reported Loss on Early Exting. of Debt Income Tax Adjustments(6) Change in Fair Market Value of Marketable Securities As Adjusted ($ in millions, except per share amounts) Adjusted EBITDA $ 348.0 $ — $ — $ — $ 348.0 Depreciation and amortization (90.4) — — — (90.4) Interest expense and amortization of debt discounts and fees (32.8) — — — (32.8) Stock-based compensation (13.8) — — — (13.8) Loss on disposal or impairment of assets (2.1) — — — (2.1) Loss on early extinguishment of debt(7) (3.2) 3.2 — — — Change in fair market value of marketable securities 2.4 — — (2.4) — Income from continuing operations before income tax expense 208.1 3.2 — (2.4) 208.9 Provision for income tax expense (53.6) (0.8) (0.5) 0.6 (54.3) Income from continuing operations attributable to Encompass Health $ 154.5 $ 2.4 $ (0.5) $ (1.8) $ 154.6 Diluted earnings per share from continuing operations* $ 1.55 $ 0.02 $ (0.01) $ (0.02) $ 1.55 Diluted shares used in calculation 100.0 * Adjusted EPS may not sum across due to rounding. Refer to pages 34-35 for end notes. Adjusted EPS(5) - Q2 2026
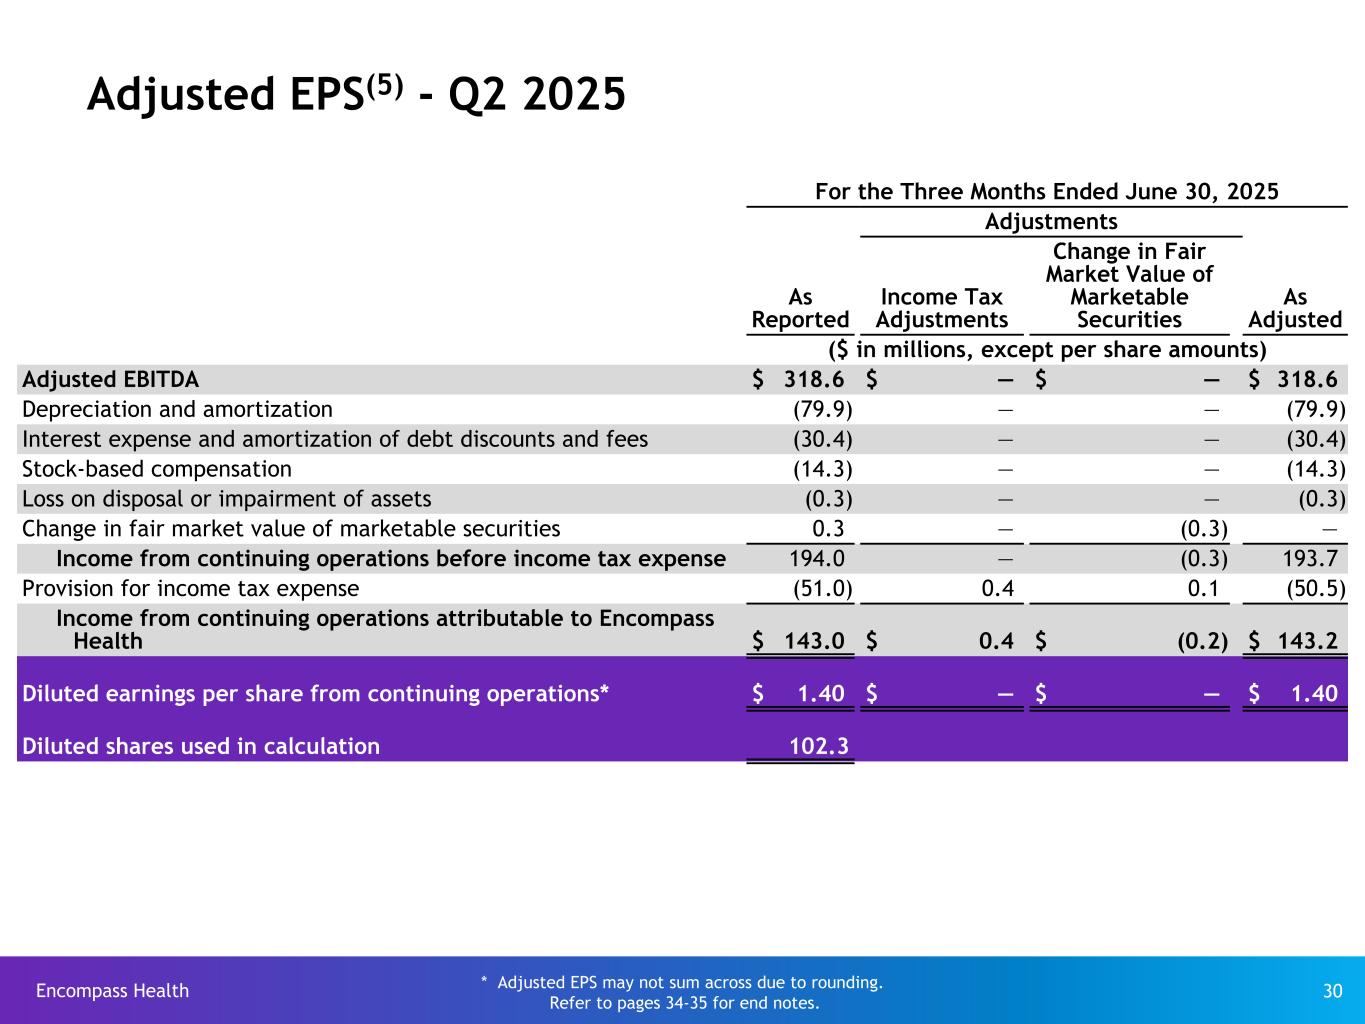
Encompass Health 30 For the Three Months Ended June 30, 2025 Adjustments As Reported Income Tax Adjustments Change in Fair Market Value of Marketable Securities As Adjusted ($ in millions, except per share amounts) Adjusted EBITDA $ 318.6 $ — $ — $ 318.6 Depreciation and amortization (79.9) — — (79.9) Interest expense and amortization of debt discounts and fees (30.4) — — (30.4) Stock-based compensation (14.3) — — (14.3) Loss on disposal or impairment of assets (0.3) — — (0.3) Change in fair market value of marketable securities 0.3 — (0.3) — Income from continuing operations before income tax expense 194.0 — (0.3) 193.7 Provision for income tax expense (51.0) 0.4 0.1 (50.5) Income from continuing operations attributable to Encompass Health $ 143.0 $ 0.4 $ (0.2) $ 143.2 Diluted earnings per share from continuing operations* $ 1.40 $ — $ — $ 1.40 Diluted shares used in calculation 102.3 Adjusted EPS(5) - Q2 2025 * Adjusted EPS may not sum across due to rounding. Refer to pages 34-35 for end notes.
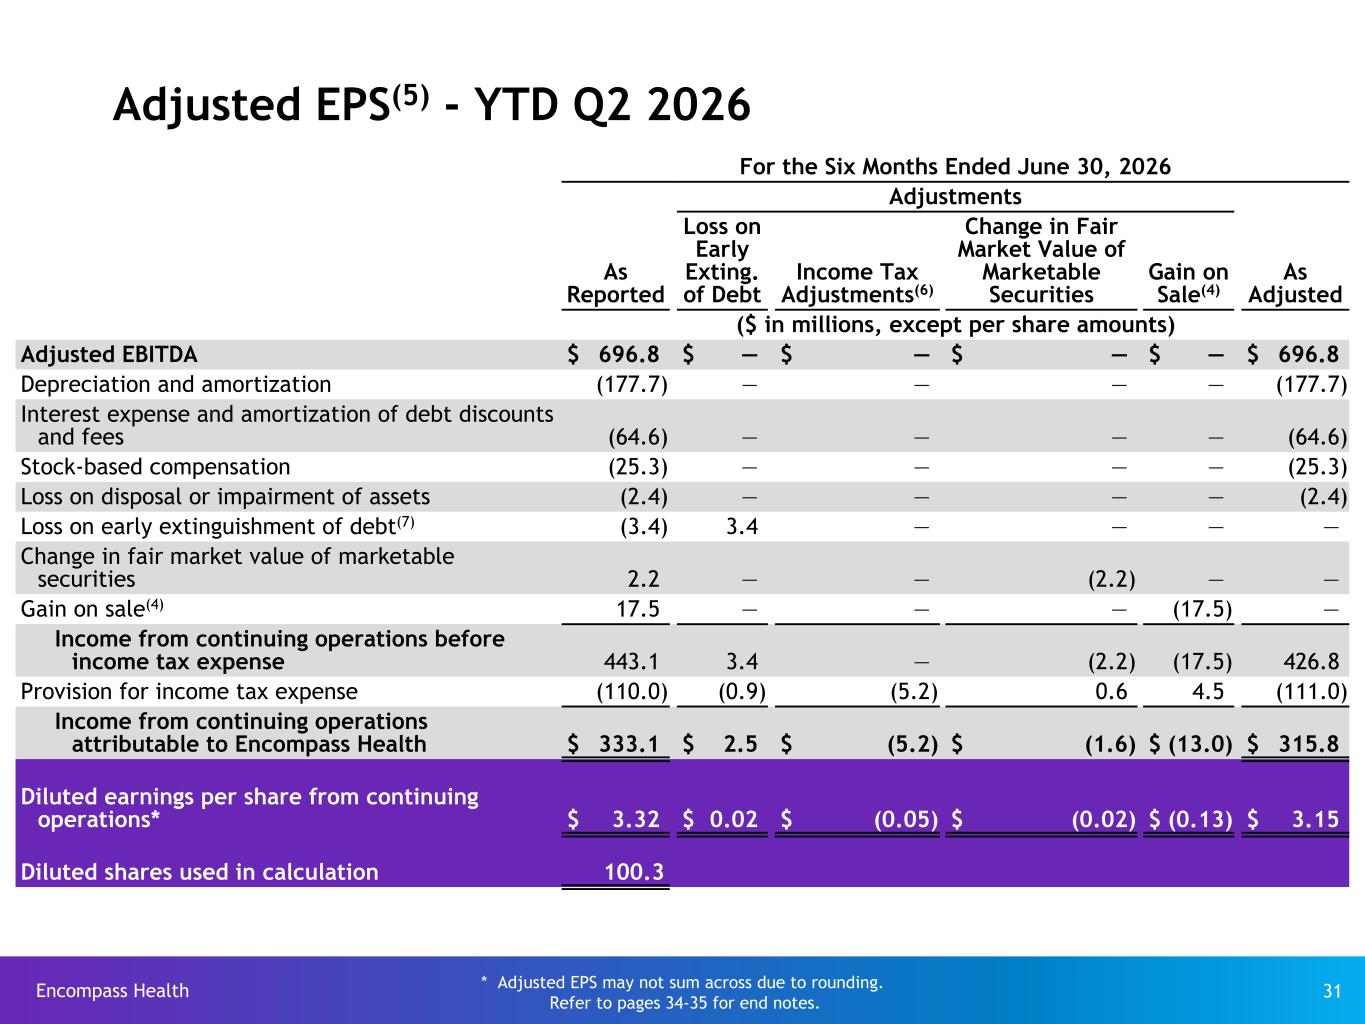
Encompass Health 31 For the Six Months Ended June 30, 2026 Adjustments As Reported Loss on Early Exting. of Debt Income Tax Adjustments(6) Change in Fair Market Value of Marketable Securities Gain on Sale(4) As Adjusted ($ in millions, except per share amounts) Adjusted EBITDA $ 696.8 $ — $ — $ — $ — $ 696.8 Depreciation and amortization (177.7) — — — — (177.7) Interest expense and amortization of debt discounts and fees (64.6) — — — — (64.6) Stock-based compensation (25.3) — — — — (25.3) Loss on disposal or impairment of assets (2.4) — — — — (2.4) Loss on early extinguishment of debt(7) (3.4) 3.4 — — — — Change in fair market value of marketable securities 2.2 — — (2.2) — — Gain on sale(4) 17.5 — — — (17.5) — Income from continuing operations before income tax expense 443.1 3.4 — (2.2) (17.5) 426.8 Provision for income tax expense (110.0) (0.9) (5.2) 0.6 4.5 (111.0) Income from continuing operations attributable to Encompass Health $ 333.1 $ 2.5 $ (5.2) $ (1.6) $ (13.0) $ 315.8 Diluted earnings per share from continuing operations* $ 3.32 $ 0.02 $ (0.05) $ (0.02) $ (0.13) $ 3.15 Diluted shares used in calculation 100.3 * Adjusted EPS may not sum across due to rounding. Refer to pages 34-35 for end notes. Adjusted EPS(5) - YTD Q2 2026
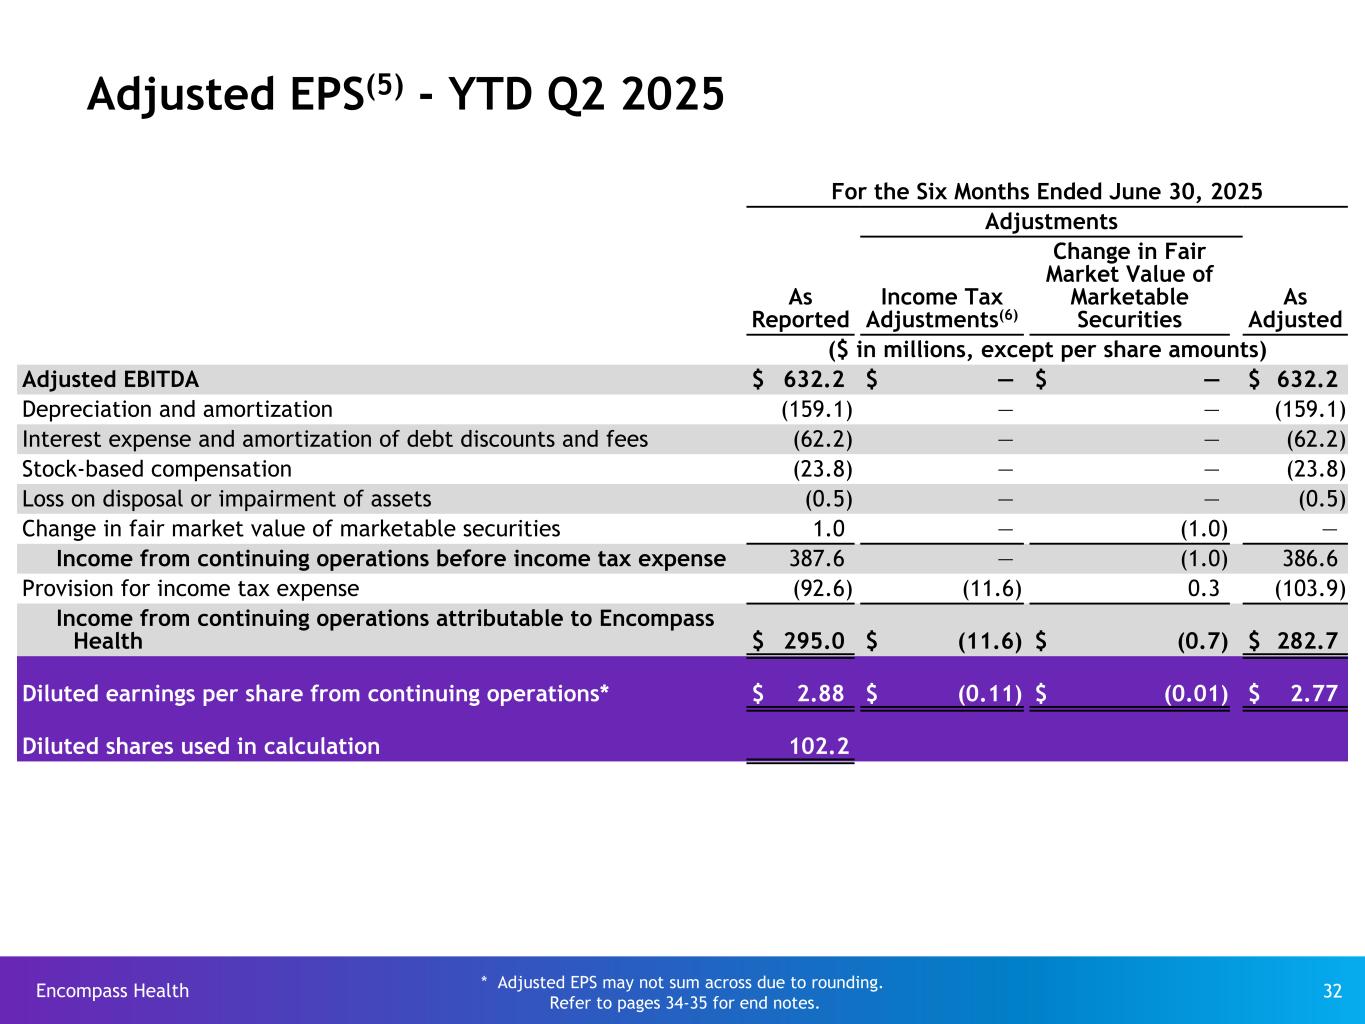
Encompass Health 32 For the Six Months Ended June 30, 2025 Adjustments As Reported Income Tax Adjustments(6) Change in Fair Market Value of Marketable Securities As Adjusted ($ in millions, except per share amounts) Adjusted EBITDA $ 632.2 $ — $ — $ 632.2 Depreciation and amortization (159.1) — — (159.1) Interest expense and amortization of debt discounts and fees (62.2) — — (62.2) Stock-based compensation (23.8) — — (23.8) Loss on disposal or impairment of assets (0.5) — — (0.5) Change in fair market value of marketable securities 1.0 — (1.0) — Income from continuing operations before income tax expense 387.6 — (1.0) 386.6 Provision for income tax expense (92.6) (11.6) 0.3 (103.9) Income from continuing operations attributable to Encompass Health $ 295.0 $ (11.6) $ (0.7) $ 282.7 Diluted earnings per share from continuing operations* $ 2.88 $ (0.11) $ (0.01) $ 2.77 Diluted shares used in calculation 102.2 Adjusted EPS(5) - YTD Q2 2025 * Adjusted EPS may not sum across due to rounding. Refer to pages 34-35 for end notes.
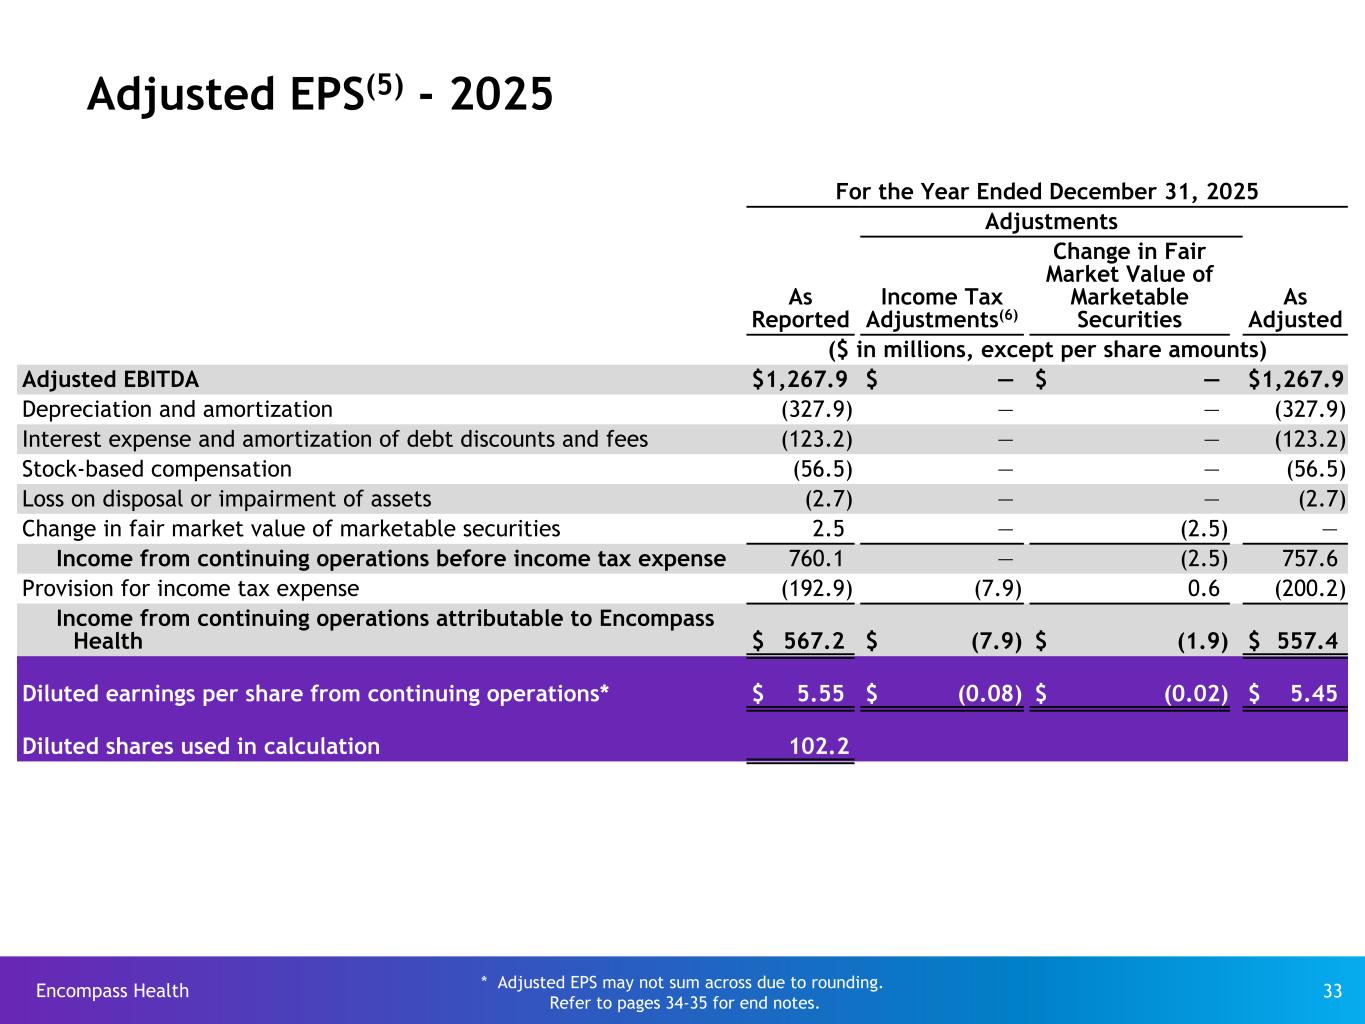
Encompass Health 33 For the Year Ended December 31, 2025 Adjustments As Reported Income Tax Adjustments(6) Change in Fair Market Value of Marketable Securities As Adjusted ($ in millions, except per share amounts) Adjusted EBITDA $ 1,267.9 $ — $ — $ 1,267.9 Depreciation and amortization (327.9) — — (327.9) Interest expense and amortization of debt discounts and fees (123.2) — — (123.2) Stock-based compensation (56.5) — — (56.5) Loss on disposal or impairment of assets (2.7) — — (2.7) Change in fair market value of marketable securities 2.5 — (2.5) — Income from continuing operations before income tax expense 760.1 — (2.5) 757.6 Provision for income tax expense (192.9) (7.9) 0.6 (200.2) Income from continuing operations attributable to Encompass Health $ 567.2 $ (7.9) $ (1.9) $ 557.4 Diluted earnings per share from continuing operations* $ 5.55 $ (0.08) $ (0.02) $ 5.45 Diluted shares used in calculation 102.2 Adjusted EPS(5) - 2025 * Adjusted EPS may not sum across due to rounding. Refer to pages 34-35 for end notes.
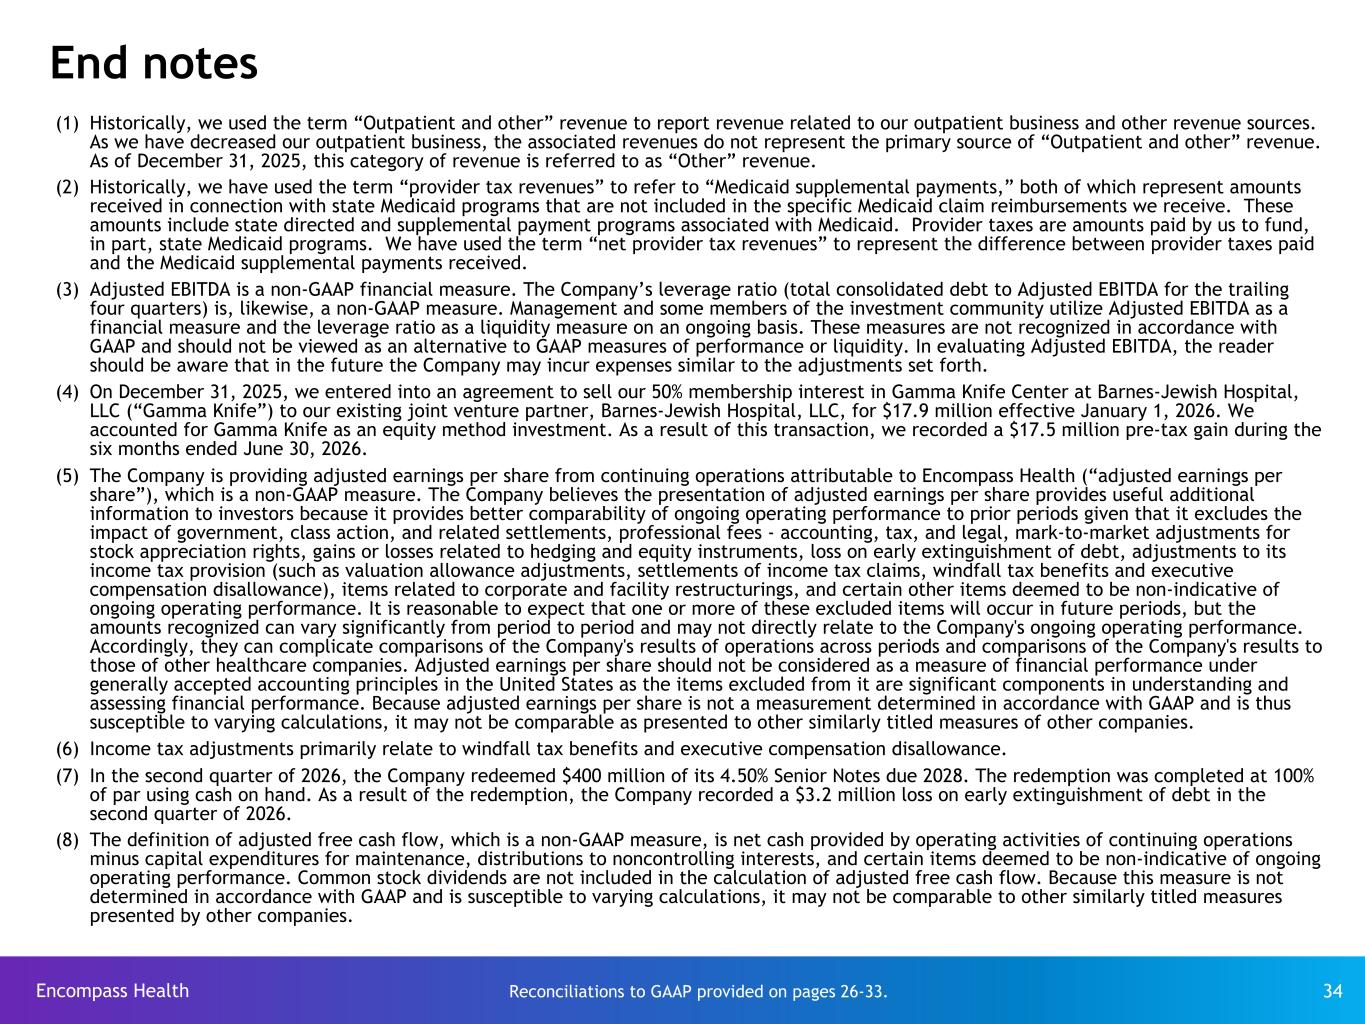
Encompass Health 34 End notes Reconciliations to GAAP provided on pages 26-33. (1) Historically, we used the term “Outpatient and other” revenue to report revenue related to our outpatient business and other revenue sources. As we have decreased our outpatient business, the associated revenues do not represent the primary source of “Outpatient and other” revenue. As of December 31, 2025, this category of revenue is referred to as “Other” revenue. (2) Historically, we have used the term “provider tax revenues” to refer to “Medicaid supplemental payments,” both of which represent amounts received in connection with state Medicaid programs that are not included in the specific Medicaid claim reimbursements we receive. These amounts include state directed and supplemental payment programs associated with Medicaid. Provider taxes are amounts paid by us to fund, in part, state Medicaid programs. We have used the term “net provider tax revenues” to represent the difference between provider taxes paid and the Medicaid supplemental payments received. (3) Adjusted EBITDA is a non-GAAP financial measure. The Company’s leverage ratio (total consolidated debt to Adjusted EBITDA for the trailing four quarters) is, likewise, a non-GAAP measure. Management and some members of the investment community utilize Adjusted EBITDA as a financial measure and the leverage ratio as a liquidity measure on an ongoing basis. These measures are not recognized in accordance with GAAP and should not be viewed as an alternative to GAAP measures of performance or liquidity. In evaluating Adjusted EBITDA, the reader should be aware that in the future the Company may incur expenses similar to the adjustments set forth. (4) On December 31, 2025, we entered into an agreement to sell our 50% membership interest in Gamma Knife Center at Barnes-Jewish Hospital, LLC (“Gamma Knife”) to our existing joint venture partner, Barnes-Jewish Hospital, LLC, for $17.9 million effective January 1, 2026. We accounted for Gamma Knife as an equity method investment. As a result of this transaction, we recorded a $17.5 million pre-tax gain during the six months ended June 30, 2026. (5) The Company is providing adjusted earnings per share from continuing operations attributable to Encompass Health (“adjusted earnings per share”), which is a non-GAAP measure. The Company believes the presentation of adjusted earnings per share provides useful additional information to investors because it provides better comparability of ongoing operating performance to prior periods given that it excludes the impact of government, class action, and related settlements, professional fees - accounting, tax, and legal, mark-to-market adjustments for stock appreciation rights, gains or losses related to hedging and equity instruments, loss on early extinguishment of debt, adjustments to its income tax provision (such as valuation allowance adjustments, settlements of income tax claims, windfall tax benefits and executive compensation disallowance), items related to corporate and facility restructurings, and certain other items deemed to be non-indicative of ongoing operating performance. It is reasonable to expect that one or more of these excluded items will occur in future periods, but the amounts recognized can vary significantly from period to period and may not directly relate to the Company's ongoing operating performance. Accordingly, they can complicate comparisons of the Company's results of operations across periods and comparisons of the Company's results to those of other healthcare companies. Adjusted earnings per share should not be considered as a measure of financial performance under generally accepted accounting principles in the United States as the items excluded from it are significant components in understanding and assessing financial performance. Because adjusted earnings per share is not a measurement determined in accordance with GAAP and is thus susceptible to varying calculations, it may not be comparable as presented to other similarly titled measures of other companies. (6) Income tax adjustments primarily relate to windfall tax benefits and executive compensation disallowance. (7) In the second quarter of 2026, the Company redeemed $400 million of its 4.50% Senior Notes due 2028. The redemption was completed at 100% of par using cash on hand. As a result of the redemption, the Company recorded a $3.2 million loss on early extinguishment of debt in the second quarter of 2026. (8) The definition of adjusted free cash flow, which is a non-GAAP measure, is net cash provided by operating activities of continuing operations minus capital expenditures for maintenance, distributions to noncontrolling interests, and certain items deemed to be non-indicative of ongoing operating performance. Common stock dividends are not included in the calculation of adjusted free cash flow. Because this measure is not determined in accordance with GAAP and is susceptible to varying calculations, it may not be comparable to other similarly titled measures presented by other companies.
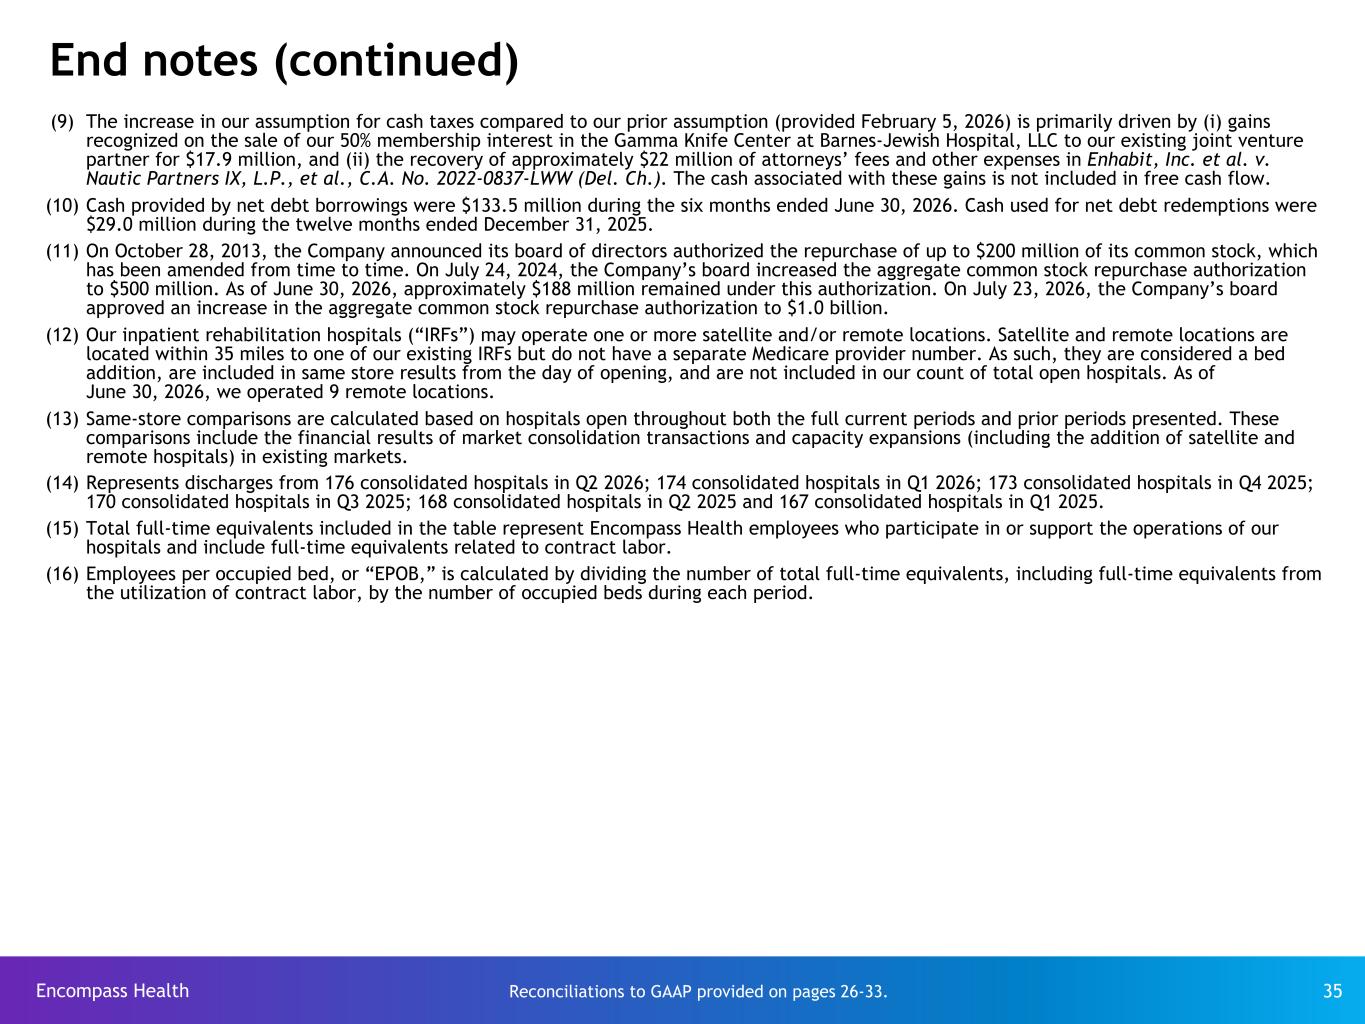
Encompass Health 35 End notes (continued) (9) The increase in our assumption for cash taxes compared to our prior assumption (provided February 5, 2026) is primarily driven by (i) gains recognized on the sale of our 50% membership interest in the Gamma Knife Center at Barnes-Jewish Hospital, LLC to our existing joint venture partner for $17.9 million, and (ii) the recovery of approximately $22 million of attorneys’ fees and other expenses in Enhabit, Inc. et al. v. Nautic Partners IX, L.P., et al., C.A. No. 2022-0837-LWW (Del. Ch.). The cash associated with these gains is not included in free cash flow. (10) Cash provided by net debt borrowings were $133.5 million during the six months ended June 30, 2026. Cash used for net debt redemptions were $29.0 million during the twelve months ended December 31, 2025. (11) On October 28, 2013, the Company announced its board of directors authorized the repurchase of up to $200 million of its common stock, which has been amended from time to time. On July 24, 2024, the Company’s board increased the aggregate common stock repurchase authorization to $500 million. As of June 30, 2026, approximately $188 million remained under this authorization. On July 23, 2026, the Company’s board approved an increase in the aggregate common stock repurchase authorization to $1.0 billion. (12) Our inpatient rehabilitation hospitals (“IRFs”) may operate one or more satellite and/or remote locations. Satellite and remote locations are located within 35 miles to one of our existing IRFs but do not have a separate Medicare provider number. As such, they are considered a bed addition, are included in same store results from the day of opening, and are not included in our count of total open hospitals. As of June 30, 2026, we operated 9 remote locations. (13) Same-store comparisons are calculated based on hospitals open throughout both the full current periods and prior periods presented. These comparisons include the financial results of market consolidation transactions and capacity expansions (including the addition of satellite and remote hospitals) in existing markets. (14) Represents discharges from 176 consolidated hospitals in Q2 2026; 174 consolidated hospitals in Q1 2026; 173 consolidated hospitals in Q4 2025; 170 consolidated hospitals in Q3 2025; 168 consolidated hospitals in Q2 2025 and 167 consolidated hospitals in Q1 2025. (15) Total full-time equivalents included in the table represent Encompass Health employees who participate in or support the operations of our hospitals and include full-time equivalents related to contract labor. (16) Employees per occupied bed, or “EPOB,” is calculated by dividing the number of total full-time equivalents, including full-time equivalents from the utilization of contract labor, by the number of occupied beds during each period. Reconciliations to GAAP provided on pages 26-33.