
CONFIDENTIAL
Special Committee Presentation
October 28, 2004
Important Information
Confidential Material Presented to the Special Committee of the Board of Directors of Johnson Outdoors, Inc.
The following pages contain material that is being provided to the Special Committee of the Board of Directors (the “Special Committee”) of Johnson Outdoors Inc. (the “Company”) in the context of a meeting held to consider a proposed business combination between the Company and JO Acquisition Corp., a company formed by Helen P. Johnson-Leipold to acquire the outstanding shares of capital stock of the Company held by shareholders other than Ms. Johnson-Leipold, certain members of her family or affiliates of her or her family members. The accompanying material was compiled or prepared on a confidential basis for use by the Special Committee and not with a view toward public disclosure. The information utilized in preparing this presentation was obtained from the Company and other public sources. Any estimates and projections for the Company contained herein have been prepared by senior management or are publicly available, or are based upon such estimates and projections, and involve numerous and significant subjective determinations, which may or may not prove to be correct. No representation or warranty, express or implied, is made as to the accuracy or completeness of such information and nothing contained herein is, or shall be relied upon as, a representation, whether as to the past or the future. Because this material was prepared for use in the context of an oral presentation to the Special Committee, which is familiar with the business and affairs of the Company, neither the Company nor William Blair & Company, L.L.C. (“William Blair”) nor any of their respective legal or financial advisors or accountants take any responsibility for the accuracy or completeness of any of the material if used by persons other than the Special Committee. The accompanying materials speak only as of October 28, 2004. Neither the Company nor William Blair undertakes any obligation to update or otherwise revise the accompanying materials after such date.
Table of Contents
I. Executive Summary II. Situation Overview
III. Valuation Discussion Materials A. M&A Premiums Paid Analysis
B. Comparable Public Companies Analysis C. Comparable M&A Transactions Analysis IV. Historical and Projected Financial Information A. Historical and Projected Financial Information B. Discounted Cash Flow Analysis C. Leveraged Buyout Analysis Appendices A. Form of Fairness Opinion B. Comparable Public Companies Detail C. Working Capital Adjustment

Executive Summary
Executive Summary
Background
The Company designs, manufactures and markets a portfolio of consumer brands across four categories: watercraft, marine electronics, diving and outdoor equipment. Brands include, among others: Old Town canoes and kayaks; Ocean Kayak, Necky and Dimension kayaks; Minn Kota motors; Humminbird fish finders; SCUBAPRO and SnorkelPro; UWATEC dive equipment; and Eureka! tents. The company has 26 locations around the world, employs 1,500 people and generated annual sales of approximately $355 million in fiscal 2004.
On February 20, 2004, the Company announced it had received a non-binding proposal to acquire certain of the outstanding shares of the Company for a cash price of $18.00 per share. The proposal was signed by Samuel C. Johnson and Helen P. Johnson-Leipold (together with affiliated entities and family members, the “Johnson Group”).
Through its existing ownership position, the Johnson Group has both economic and voting control of the Company. As of October 18, 2004, the Johnson Group owned a 52.7% economic interest and 76.5% voting interest in the outstanding shares of the Company.
The proposal stated: “To facilitate this transaction, we have engaged investment bankers and have received indications of interest from nationally recognized lending institutions with respect to the financing for the proposed transaction. Together with amounts available from the Company’s existing funds, we believe that such financing will be sufficient to meet the needs of this transaction and to operate the business going forward, subject of course, to satisfactory completion of due diligence.”
The proposal also stated: “Given our involvement with the Company, we would anticipate that the Board of Directors would establish an independent special committee to evaluate our proposal and engage separate advisors. In this regard, please note that we do not have any interest in selling our shares in the Company and therefore will not support an alternative transaction.”
1
Executive Summary
Key Assumptions Underlying Our Review and Analysis
William Blair & Company’s role is to render its opinion as to the fairness, from a financial point of view, of the $20.10 per share in cash to be paid to the holders of the outstanding shares of common stock (other than Helen P. Johnson-Leipold, Imogene P. Johnson and the other parties to the Contribution Agreement (as defined in the Merger Agreement) and JO Acquisition Corp.) of Johnson Outdoors Inc. (the “Company” or “JOUT”) in connection with the proposed merger between JO Acquisition Corp. and the Company
In connection with rendering this opinion, William Blair has examined: the draft Agreement and Plan of Merger dated October 26, 2004;
certain audited historical financial statements of the Company for the five years ended September 30, 2003; the unaudited financial statements of the Company for the year ended September 30, 2004; certain internal business, operating and financial information and forecasts of the Company (the “Forecasts”), prepared by the senior management of the Company; the Company’s historical Forecasts for each of the four years ended September 30, 2004 the financial position and operating results of the Company compared with those of certain other publicly traded companies we deemed relevant; the financial terms of the proposed merger compared with publicly available information regarding the financial terms of certain other business combinations we deemed relevant; current and historical market prices and trading volumes of the common stock of the Company; and other publicly available information about the Company
2
Executive Summary
Key Assumptions Underlying Our Review and Analysis
We have also held discussions with members of the senior management of the Company to discuss the foregoing, have considered other matters which we have deemed relevant to our inquiry and have taken into account such accepted financial and investment banking procedures and considerations as we have deemed relevant
In connection with our engagement, we were not requested to approach, nor did we hold discussions with, third parties to solicit indications of interest in a possible acquisition of the Company
3
Executive Summary
Summary of Analyses
M&A Premiums Paid Analysis
Analyzed the merger premiums of domestic public transactions announced since January 1, 2001
Comparable Public Companies Analysis
Trading multiple analysis based on companies that William Blair considered similar to the Company based on the selected companies’ operations
Comparable M&A Transactions Analysis
Transaction multiple analysis based on transactions that William Blair considered similar to the proposed acquisition based on the target operations
Discounted Cash Flow Analysis
Utilized the Company’s fiscal 2005 – 2009 forecasts to derive free cash flows for the Company and discounted those cash flows, along with a terminal value back to September 30, 2004
Leveraged Buyout Analysis
Utilized the Company’s 2005 – 2009 forecasts to analyze the values that a typical LBO could be completed under established return parameters
4
Situation Overview
Situation Overview
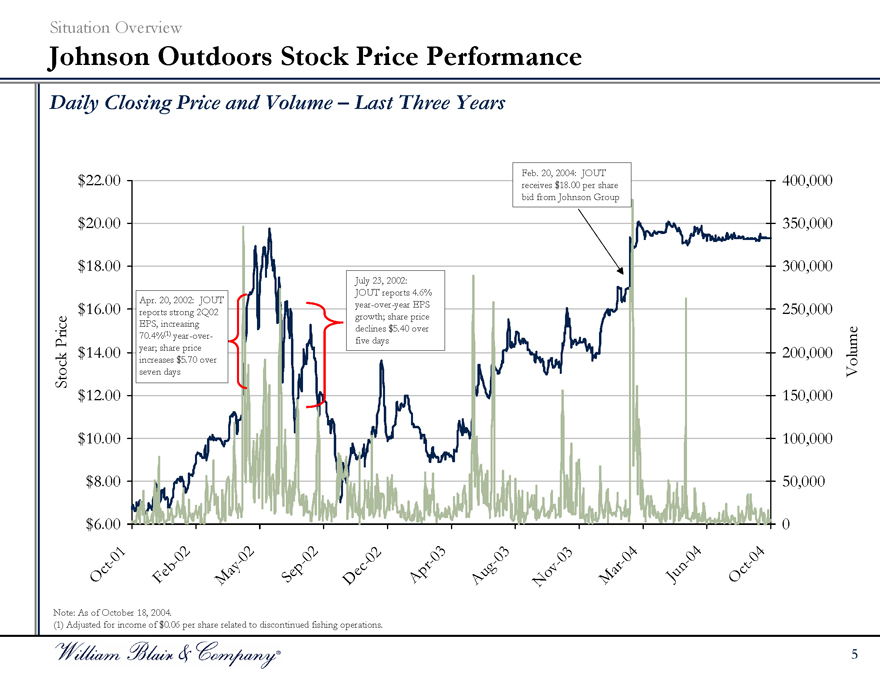
Johnson Outdoors Stock Price Performance
Daily Closing Price and Volume – Last Three Years
Stock Price $22.00 $20.00 $18.00 $16.00
$14.00 $12.00 $10.00 $8.00 $6.00
Apr. 20, 2002: JOUT reports strong 2Q02 EPS, increasing 70.4%(1) year-over-year; share price increases $5.70 over seven days
July 23, 2002: JOUT reports 4.6% year-over-year EPS growth; share price declines $5.40 over five days
Feb. 20, 2004: JOUT receives $18.00 per share bid from Johnson Group
Oct-01
Feb-02
May-02
Sep-02
Dec-02
Apr-03
Aug-03
Nov-03
Mar-04
Jun-04
Oct-04
400,000 350,000 300,000 250,000
200,000 150,000 100,000 50,000 0
Volume
Note: As of October 18, 2004.
(1) Adjusted for income of $0.06 per share related to discontinued fishing operations.
5
Situation Overview
Johnson Outdoors Stock Price Performance
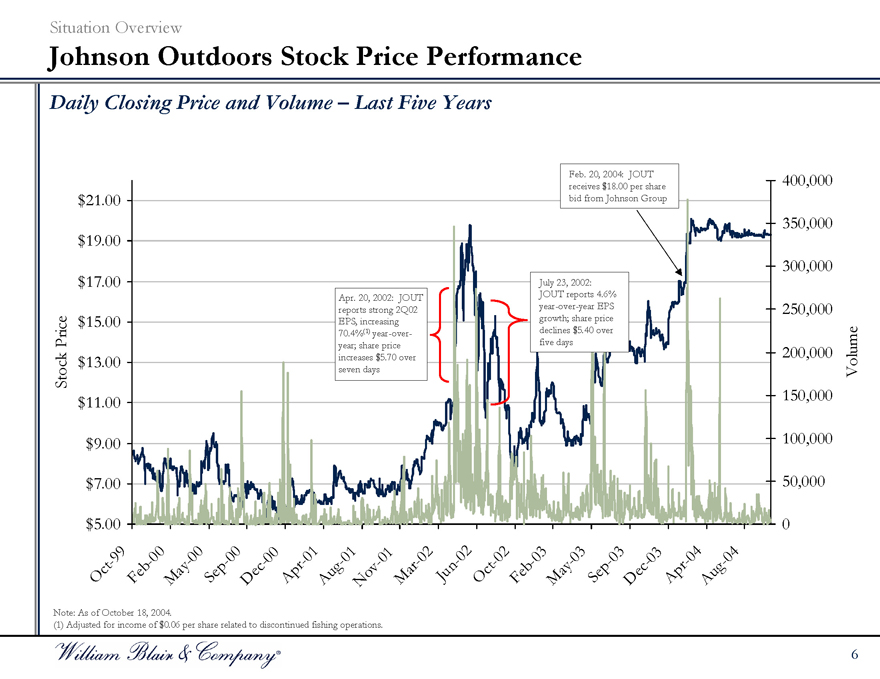
Daily Closing Price and Volume – Last Five Years
Stock Price $21.00 $19.00 $17.00 $15.00 $13.00 $11.00 $9.00 $7.00 $5.00
Apr. 20, 2002: JOUT reports strong 2Q02 EPS, increasing 70.4%(1) year-over-year; share price increases $5.70 over seven days
July 23, 2002: JOUT reports 4.6% year-over-year EPS growth; share price declines $5.40 over five days
Feb. 20, 2004: JOUT receives $18.00 per share bid from Johnson Group
Oct-99
Feb-00
May-00
Sep-00
Dec-00
Apr-01
Aug-01
Nov-01
Mar-02
Jun-02
Oct-02
Feb-03
May-03
Sep-03
Dec-03
Apr-04
Aug-04
400,000 350,000 300,000 250,000
200,000 150,000 100,000 50,000 0
Volume
Note: As of October 18, 2004.
(1) Adjusted for income of $0.06 per share related to discontinued fishing operations.
6
Situation Overview
Distribution of Historical Trading
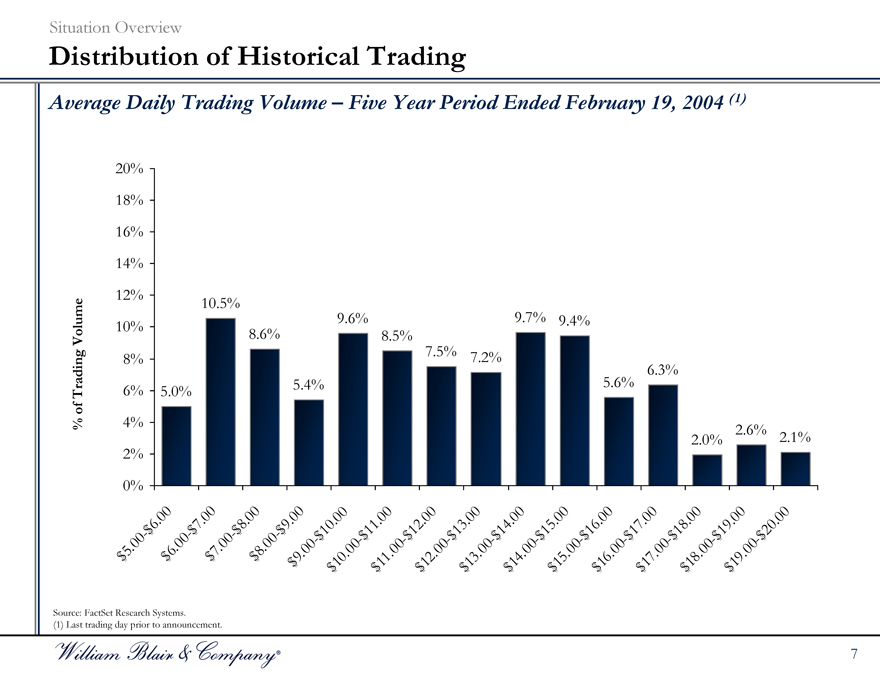
Average Daily Trading Volume – Five Year Period Ended February 19, 2004 (1)
% of Trading Volume
20% 18% 16% 14% 12% 10% 8% 6% 4% 2% 0%
$5.00-$6.00
$6.00-$7.00
$7.00-$8.00
$8.00-$9.00
$9.00-$10.00
$10.00-$11.00
$11.00-$12.00
$12.00-$13.00
$13.00-$14.00
$14.00-$15.00
$15.00-$16.00
$16.00-$17.00
$17.00-$18.00
$18.00-$19.00
$19.00-$20.00
5.0%
10.5%
8.6%
5.4%
9.6%
8.5%
7.5%
7.2%
9.7%
9.4%
5.6%
6.3%
2.0%
2.6%
2.1%
Source: FactSet Research Systems.
(1) Last trading day prior to announcement.
7
Situation Overview
Distribution of Historical Trading
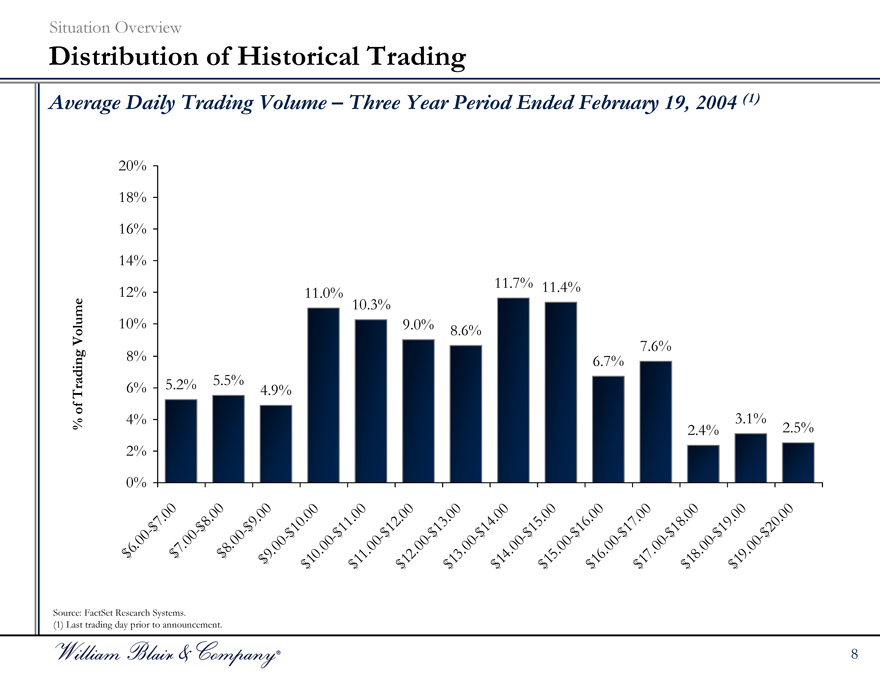
Average Daily Trading Volume – Three Year Period Ended February 19, 2004 (1)
% of Trading Volume
20% 18% 16% 14% 12% 10% 8% 6% 4% 2% 0%
$6.00-$7.00
$7.00-$8.00
$8.00-$9.00
$9.00-$10.00
$10.00-$11.00
$11.00-$12.00
$12.00-$13.00
$13.00-$14.00
$14.00-$15.00
$15.00-$16.00
$16.00-$17.00
$17.00-$18.00
$18.00-$19.00
$19.00-$20.00
5.2%
5.5%
4.9%
11.0%
10.3%
9.0%
8.6%
11.7%
11.4%
6.7%
7.6%
2.4%
3.1%
2.5%
Source: FactSet Research Systems. (1) Last trading day prior to announcement.
8
Situation Overview
Distribution of Historical Trading
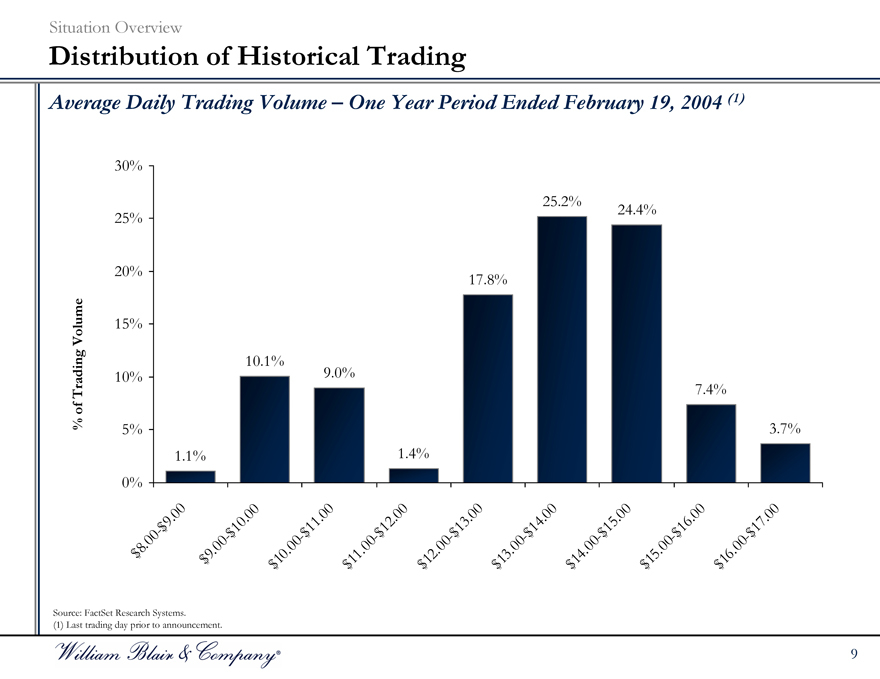
Average Daily Trading Volume – One Year Period Ended February 19, 2004 (1)
% of Trading Volume
30% 25% 20% 15% 10% 5% 0%
$8.00-$9.00
$9.00-$10.00
$10.00-$11.00
$11.00-$12.00
$12.00-$13.00
$13.00-$14.00
$14.00-$15.00
$15.00-$16.00
$16.00-$17.00
1.1%
10.1%
9.0%
1.4%
17.8%
25.2%
24.4%
7.4%
3.7%
Source: FactSet Research Systems. (1) Last trading day prior to announcement.
9
Situation Overview
Distribution of Historical Trading
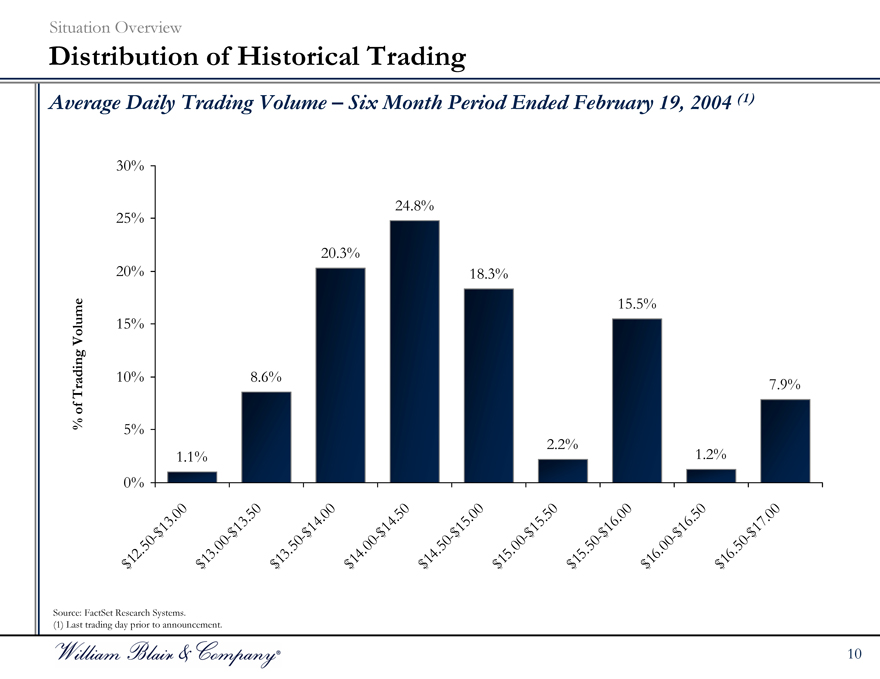
Average Daily Trading Volume – Six Month Period Ended February 19, 2004 (1)
30%
25%
20%
15%
10%
5%
0%
% of Trading Volume
1.1%
8.6%
20.3%
24.8%
18.3%
2.2%
15.5%
1.2%
7.9%
$12.50-$13.00
$13.00-$13.50
$13.50-$14.00
$14.00-$14.50
$14.50-$15.00
$15.00-$15.50
$15.50-$16.00
$16.00-$16.50
$16.50-$17.00
Source: FactSet Research Systems. (1) Last trading day prior to announcement.
10
Situation Overview
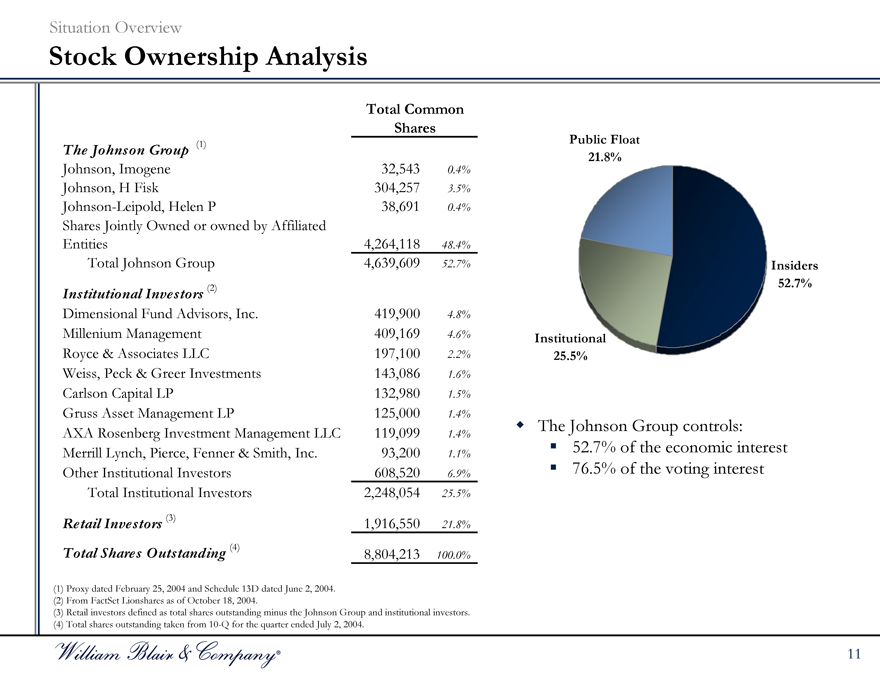
Stock Ownership Analysis
Total Common
Shares
The Johnson Group (1)
Johnson, Imogene 32,543 0.4%
Johnson, H Fisk 304,257 3.5%
Johnson-Leipold, Helen P 38,691 0.4%
Shares Jointly Owned or owned by Affiliated
Entities 4,264,118 48.4%
Total Johnson Group 4,639,609 52.7%
Institutional Investors (2)
Dimensional Fund Advisors, Inc. 419,900 4.8%
Millenium Management 409,169 4.6%
Royce & Associates LLC 197,100 2.2%
Weiss, Peck & Greer Investments 143,086 1.6%
Carlson Capital LP 132,980 1.5%
Gruss Asset Management LP 125,000 1.4%
AXA Rosenberg Investment Management LLC 119,099 1.4%
Merrill Lynch, Pierce, Fenner & Smith, Inc. 93,200 1.1%
Other Institutional Investors 608,520 6.9%
Total Institutional Investors 2,248,054 25.5%
Retail Investors (3) 1,916,550 21.8%
Total Shares Outstanding (4) 8,804,213 100.0%
Public Float 21.8%
Institutional 25.5%
Insiders 52.7%
The Johnson Group controls:
52.7% of the economic interest 76.5% of the voting interest
(1) Proxy dated February 25, 2004 and Schedule 13D dated June 2, 2004. (2) From FactSet Lionshares as of October 18, 2004.
(3) Retail investors defined as total shares outstanding minus the Johnson Group and institutional investors. (4) Total shares outstanding taken from 10-Q for the quarter ended July 2, 2004.
11

Valuation Discussion Materials

A. M&A Premiums Paid Analysis
M&A Premiums Paid Analysis
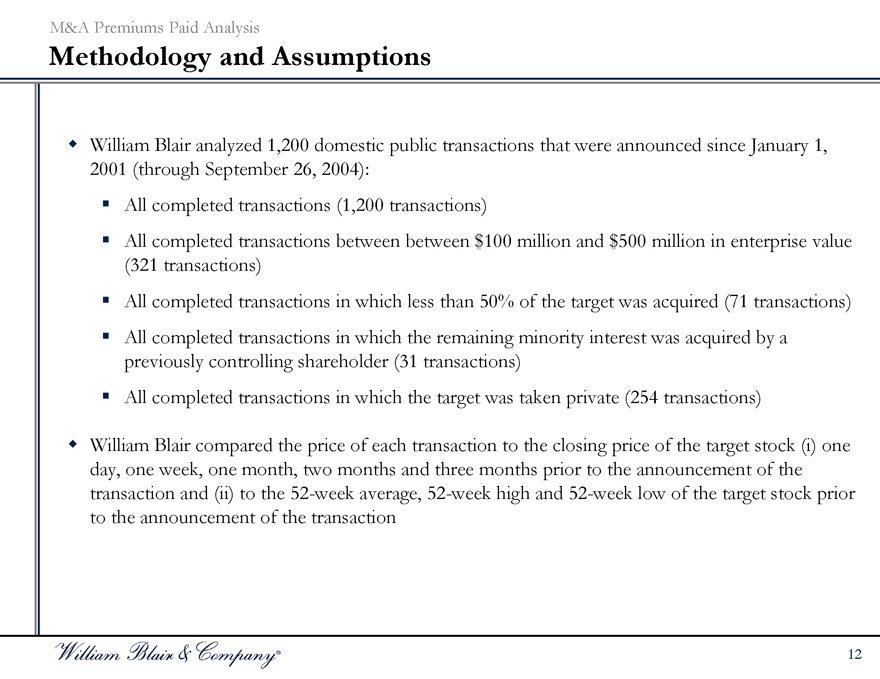
Methodology and Assumptions
William Blair analyzed 1,200 domestic public transactions that were announced since January 1, 2001 (through September 26, 2004): All completed transactions (1,200 transactions) All completed transactions between between $100 million and $500 million in enterprise value (321 transactions) All completed transactions in which less than 50% of the target was acquired (71 transactions) All completed transactions in which the remaining minority interest was acquired by a previously controlling shareholder (31 transactions) All completed transactions in which the target was taken private (254 transactions)
William Blair compared the price of each transaction to the closing price of the target stock (i) one day, one week, one month, two months and three months prior to the announcement of the transaction and (ii) to the 52-week average, 52-week high and 52-week low of the target stock prior to the announcement of the transaction
12
M&A Premiums Paid Analysis
Premiums Paid Summary
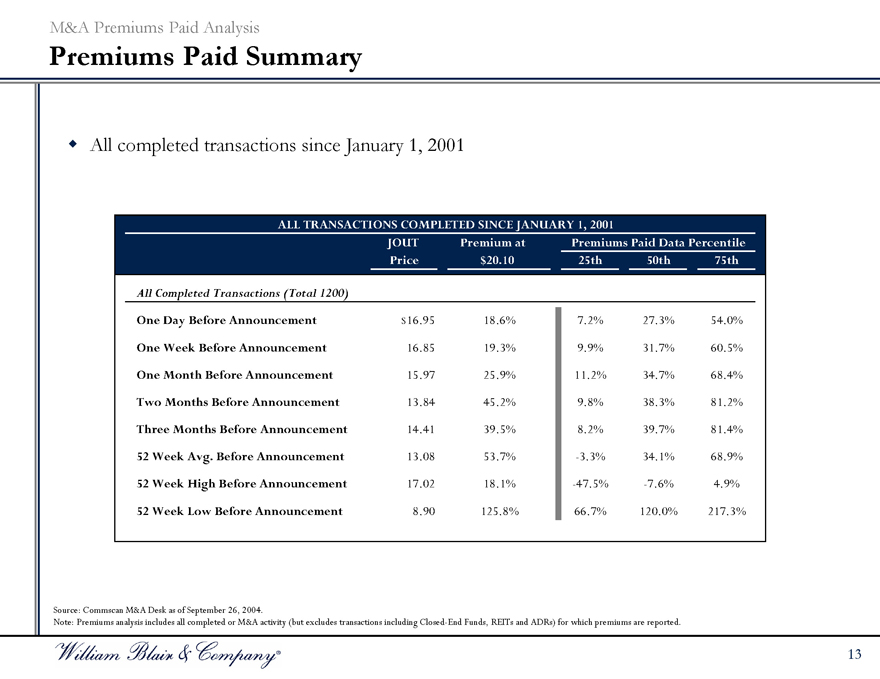
All completed transactions since January 1, 2001
ALL TRANSACTIONS COMPLETED SINCE JANUARY 1, 2001
JOUT Premium at Premiums Paid Data Percentile
Price $20.10 25th 50th 75th
All Completed Transactions (Total 1200)
One Day Before Announcement $16.95 18.6% 7.2% 27.3% 54.0%
One Week Before Announcement 16.85 19.3% 9.9% 31.7% 60.5%
One Month Before Announcement 15.97 25.9% 11.2% 34.7% 68.4%
Two Months Before Announcement 13.84 45.2% 9.8% 38.3% 81.2%
Three Months Before Announcement 14.41 39.5% 8.2% 39.7% 81.4%
52 Week Avg. Before Announcement 13.08 53.7% -3.3% 34.1% 68.9%
52 Week High Before Announcement 17.02 18.1% -47.5% -7.6% 4.9%
52 Week Low Before Announcement 8.90 125.8% 66.7% 120.0% 217.3%
Source: Commscan M&A Desk as of September 26, 2004.
Note: Premiums analysis includes all completed or M&A activity (but excludes transactions including Closed-End Funds, REITs and ADRs) for which premiums are reported.
13
M&A Premiums Paid Analysis
Premiums Paid Summary
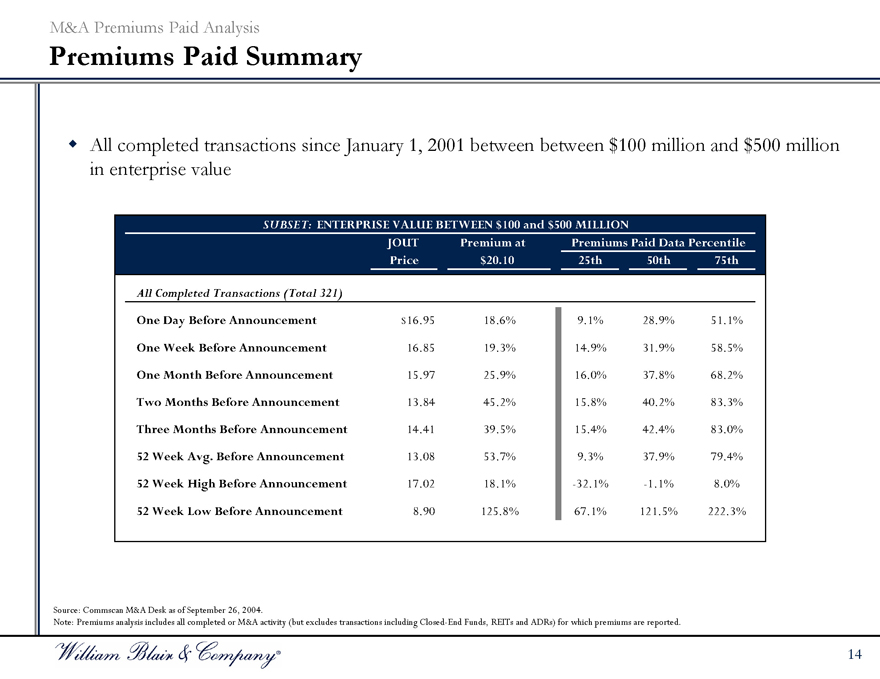
All completed transactions since January 1, 2001 between $100 million and $500 million in enterprise value
SUBSET: ENTERPRISE VALUE BETWEEN $100 and $500 MILLION
JOUT Premium at Premiums Paid Data Percentile
Price $20.10 25th 50th 75th
All Completed Transactions (Total 321)
One Day Before Announcement $16.95 18.6% 9.1% 28.9% 51.1%
One Week Before Announcement 16.85 19.3% 14.9% 31.9% 58.5%
One Month Before Announcement 15.97 25.9% 16.0% 37.8% 68.2%
Two Months Before Announcement 13.84 45.2% 15.8% 40.2% 83.3%
Three Months Before Announcement 14.41 39.5% 15.4% 42.4% 83.0%
52 Week Avg. Before Announcement 13.08 53.7% 9.3% 37.9% 79.4%
52 Week High Before Announcement 17.02 18.1% -32.1% -1.1% 8.0%
52 Week Low Before Announcement 8.90 125.8% 67.1% 121.5% 222.3%
Source: Commscan M&A Desk as of September 26, 2004.
Note: Premiums analysis includes all completed or M&A activity (but excludes transactions including Closed-End Funds, REITs and ADRs) for which premiums are reported.
14
M&A Premiums Paid Analysis
Premiums Paid Summary
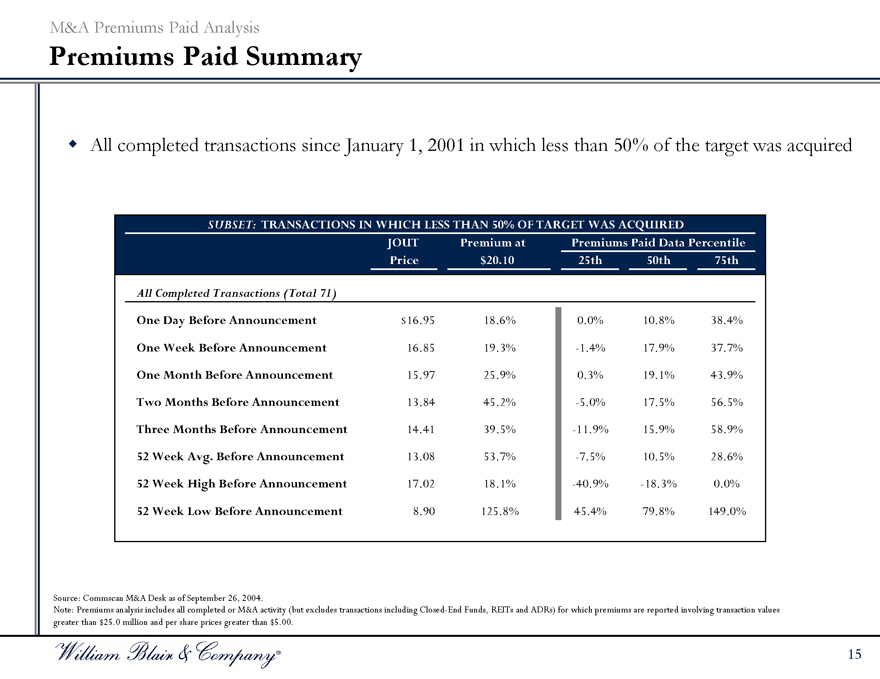
All completed transactions since January 1, 2001 in which less than 50% of the target was acquired
SUBSET: TRANSACTIONS IN WHICH LESS THAN 50% OF TARGET WAS ACQUIRED
JOUT Premium at Premiums Paid Data Percentile
Price $20.10 25th 50th 75th
All Completed Transactions (Total 71)
One Day Before Announcement $16.95 18.6% 0.0% 10.8% 38.4%
One Week Before Announcement 16.85 19.3% -1.4% 17.9% 37.7%
One Month Before Announcement 15.97 25.9% 0.3% 19.1% 43.9%
Two Months Before Announcement 13.84 45.2% -5.0% 17.5% 56.5%
Three Months Before Announcement 14.41 39.5% -11.9% 15.9% 58.9%
52 Week Avg. Before Announcement 13.08 53.7% -7.5% 10.5% 28.6%
52 Week High Before Announcement 17.02 18.1% -40.9% -18.3% 0.0%
52 Week Low Before Announcement 8.90 125.8% 45.4% 79.8% 149.0%
Source: Commscan M&A Desk as of September 26, 2004.
Note: Premiums analysis includes all completed or M&A activity (but excludes transactions including Closed-End Funds, REITs and ADRs) for which premiums are reported involving transaction values greater than $25.0 million and per share prices greater than $5.00.
15
M&A Premiums Paid Analysis
Premiums Paid Summary
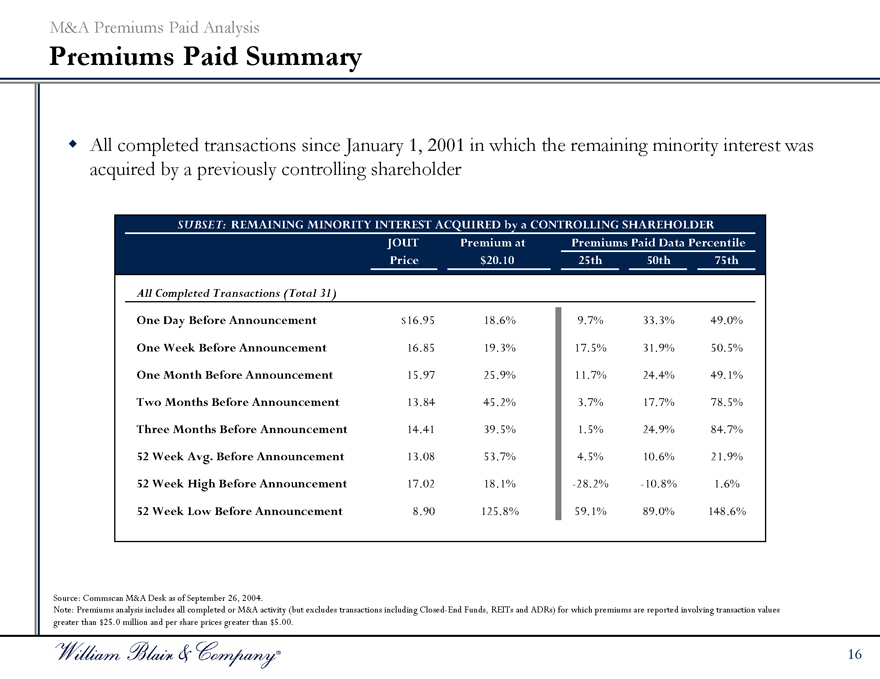
All completed transactions since January 1, 2001 in which the remaining minority interest was acquired by a previously controlling shareholder
SUBSET: REMAINING MINORITY INTEREST ACQUIRED by a CONTROLLING SHAREHOLDER
JOUT Premium at Premiums Paid Data Percentile
Price $20.10 25th 50th 75th
All Completed Transactions (Total 31)
One Day Before Announcement $16.95 18.6% 9.7% 33.3% 49.0%
One Week Before Announcement 16.85 19.3% 17.5% 31.9% 50.5%
One Month Before Announcement 15.97 25.9% 11.7% 24.4% 49.1%
Two Months Before Announcement 13.84 45.2% 3.7% 17.7% 78.5%
Three Months Before Announcement 14.41 39.5% 1.5% 24.9% 84.7%
52 Week Avg. Before Announcement 13.08 53.7% 4.5% 10.6% 21.9%
52 Week High Before Announcement 17.02 18.1% -28.2% -10.8% 1.6%
52 Week Low Before Announcement 8.90 125.8% 59.1% 89.0% 148.6%
Source: Commscan M&A Desk as of September 26, 2004.
Note: Premiums analysis includes all completed or M&A activity (but excludes transactions including Closed-End Funds, REITs and ADRs) for which premiums are reported involving transaction values greater than $25.0 million and per share prices greater than $5.00.
16
M&A Premiums Paid Analysis
Premiums Paid Summary
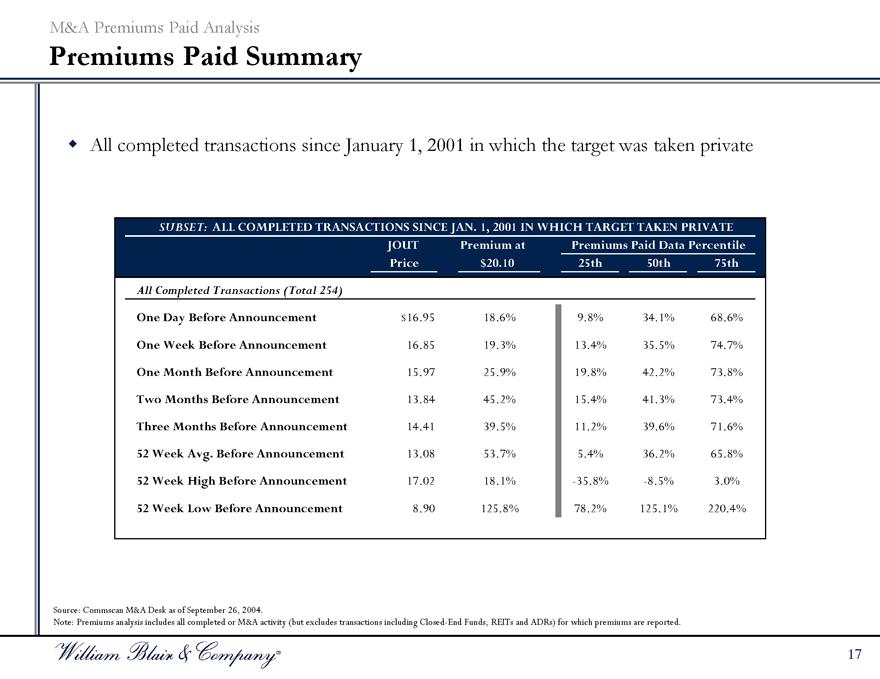
All completed transactions since January 1, 2001 in which the target was taken private
SUBSET: ALL COMPLETED TRANSACTIONS SINCE JAN. 1, 2001 IN WHICH TARGET TAKEN PRIVATE
JOUT Premium at Premiums Paid Data Percentile
Price $20.10 25th 50th 75th
All Completed Transactions (Total 254)
One Day Before Announcement $16.95 18.6% 9.8% 34.1% 68.6%
One Week Before Announcement 16.85 19.3% 13.4% 35.5% 74.7%
One Month Before Announcement 15.97 25.9% 19.8% 42.2% 73.8%
Two Months Before Announcement 13.84 45.2% 15.4% 41.3% 73.4%
Three Months Before Announcement 14.41 39.5% 11.2% 39.6% 71.6%
52 Week Avg. Before Announcement 13.08 53.7% 5.4% 36.2% 65.8%
52 Week High Before Announcement 17.02 18.1% -35.8% -8.5% 3.0%
52 Week Low Before Announcement 8.90 125.8% 78.2% 125.1% 220.4%
Source: Commscan M&A Desk as of September 26, 2004.
Note: Premiums analysis includes all completed or M&A activity (but excludes transactions including Closed-End Funds, REITs and ADRs) for which premiums are reported.
17

B. Comparable Public Companies Analysis
Comparable Public Companies Analysis
Comparable Companies Analysis
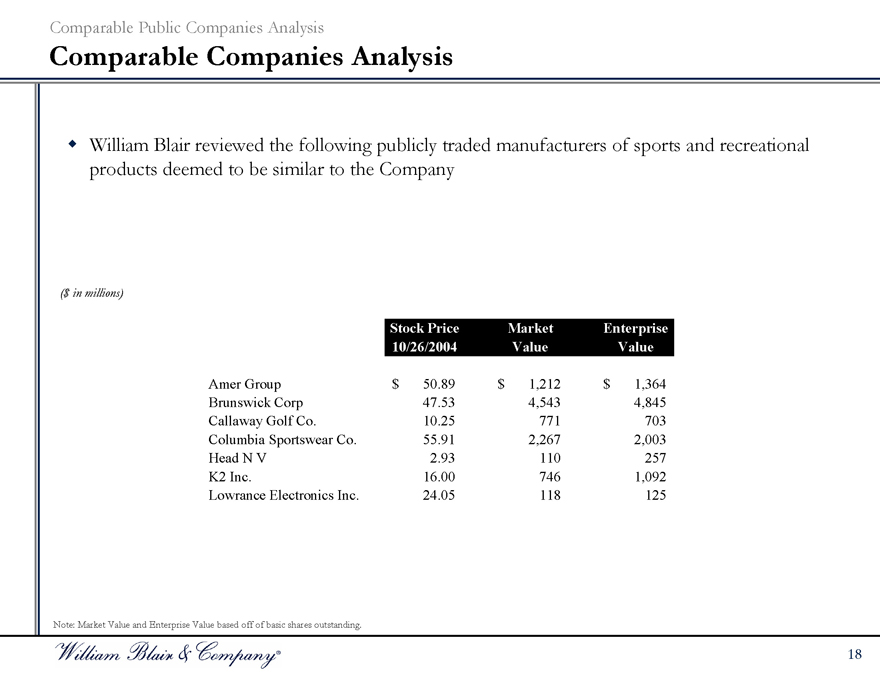
William Blair reviewed the following publicly traded manufacturers of sports and recreational products deemed to be similar to the Company
($ in millions)
Stock Price 10/26/2004 Market Value Enterprise Value
Amer Group $50.89 $1,212 $1,364
Brunswick Corp 47.53 4,543 4,845
Callaway Golf Co. 10.25 771 703
Columbia Sportswear Co. 55.91 2,267 2,003
Head N V 2.93 110 257
K2 Inc. 16.00 746 1,092
Lowrance Electronics Inc. 24.05 118 125
Note: Market Value and Enterprise Value based off of basic shares outstanding.
18
Comparable Public Companies Analysis
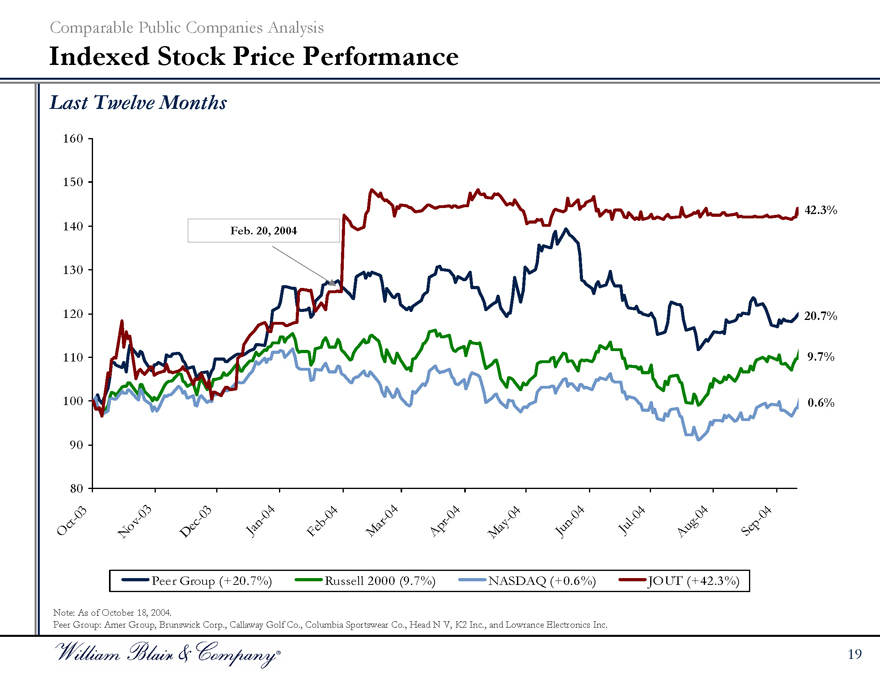
Indexed Stock Price Performance
Last Twelve Months
160 150 140 130 120 110 100 90 80
Feb. 20, 2004
42.3% 20.7% 9.7% 0.6%
Oct-03
Nov-03
Dec-03
Jan-04
Feb-04
Mar-04
Apr-04
May-04
Jun-04
Jul-04
Aug-04
Sep-04
Peer Group (+20.7%)
Russell 2000 (9.7%)
NASDAQ (+0.6%)
JOUT (+42.3%)
Note: As of October 18, 2004.
Peer Group: Amer Group, Brunswick Corp., Callaway Golf Co., Columbia Sportswear Co., Head N V, K2 Inc., and Lowrance Electronics Inc.
19
Comparable Public Companies Analysis
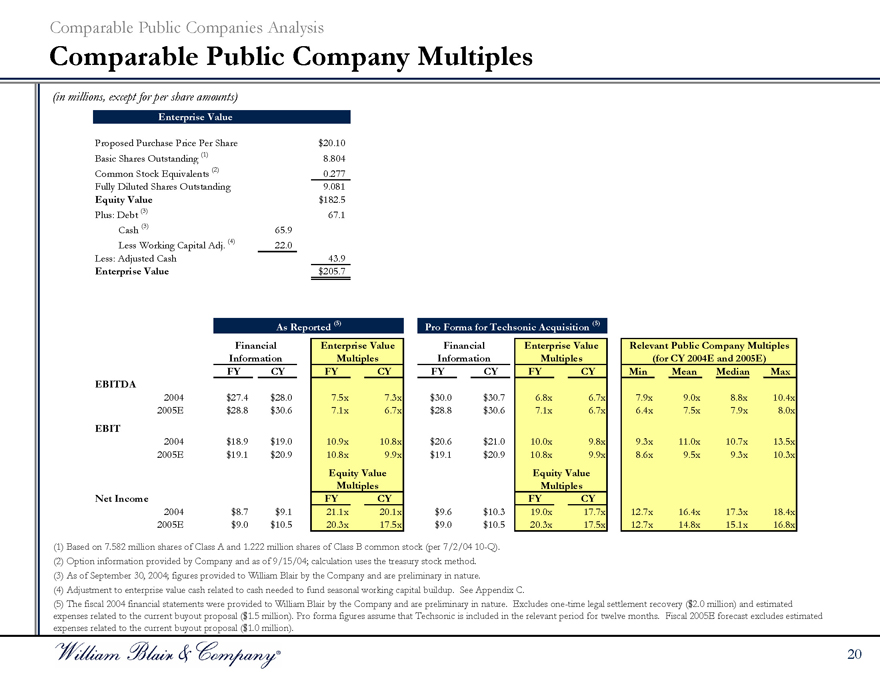
Comparable Public Company Multiples
(in millions, except for per share amounts)
Enterprise Value
Proposed Purchase Price Per Share $20.10
Basic Shares Outstanding (1) 8.804
Common Stock Equivalents (2) 0.277
Fully Diluted Shares Outstanding 9.081
Equity Value $182.5
Plus: Debt (3) 67.1
Cash (3) 65.9
Less Working Capital Adj. (4) 22.0
Less: Adjusted Cash 43.9
Enterprise Value $205.7
As Reported (5) Pro Forma for Techsonic Acquisition (5)
Financial Information Enterprise Value Multiples Financial Information Enterprise Value Multiples Relevant Public Company Multiples (for CY 2004E and 2005E)
FY CY FY CY FY CY FY CY Min Mean Median Max
EBITDA
2004 $27.4 $28.0 7.5x 7.3x $30.0 $30.7 6.8x 6.7x 7.9x 9.0x 8.8x 10.4x
2005E $28.8 $30.6 7.1x 6.7x $28.8 $30.6 7.1x 6.7x 6.4x 7.5x 7.9x 8.0x
EBIT
2004 $18.9 $19.0 10.9x 10.8x $20.6 $21.0 10.0x 9.8x 9.3x 11.0x 10.7x 13.5x
2005E $19.1 $20.9 10.8x 9.9x $19.1 $20.9 10.8x 9.9x 8.6x 9.5x 9.3x 10.3x
Equity Value Multiples Equity Value Multiples
Net Income FY CY FY CY
2004 $8.7 $9.1 21.1x 20.1x $9.6 $10.3 19.0x 17.7x 12.7x 16.4x 17.3x 18.4x
2005E $9.0 $10.5 20.3x 17.5x $9.0 $10.5 20.3x 17.5x 12.7x 14.8x 15.1x 16.8x
(1) Based on 7.582 million shares of Class A and 1.222 million shares of Class B common stock (per 7/2/04 10-Q). (2) Option information provided by Company and as of 9/15/04; calculation uses the treasury stock method. (3) As of September 30, 2004; figures provided to William Blair by the Company and are preliminary in nature. (4) Adjustment to enterprise value cash related to cash needed to fund seasonal working capital buildup. See Appendix C.
(5) The fiscal 2004 financial statements were provided to William Blair by the Company and are preliminary in nature. Excludes one-time legal settlement recovery ($2.0 million) and estimated expenses related to the current buyout proposal ($1.5 million). Pro forma figures assume that Techsonic is included in the relevant period for twelve months. Fiscal 2005E forecast excludes estimated expenses related to the current buyout proposal ($1.0 million).
20

C. Comparable M&A Transactions Analysis
Comparable M&A Transactions Analysis
Selected Comparable M&A Transactions
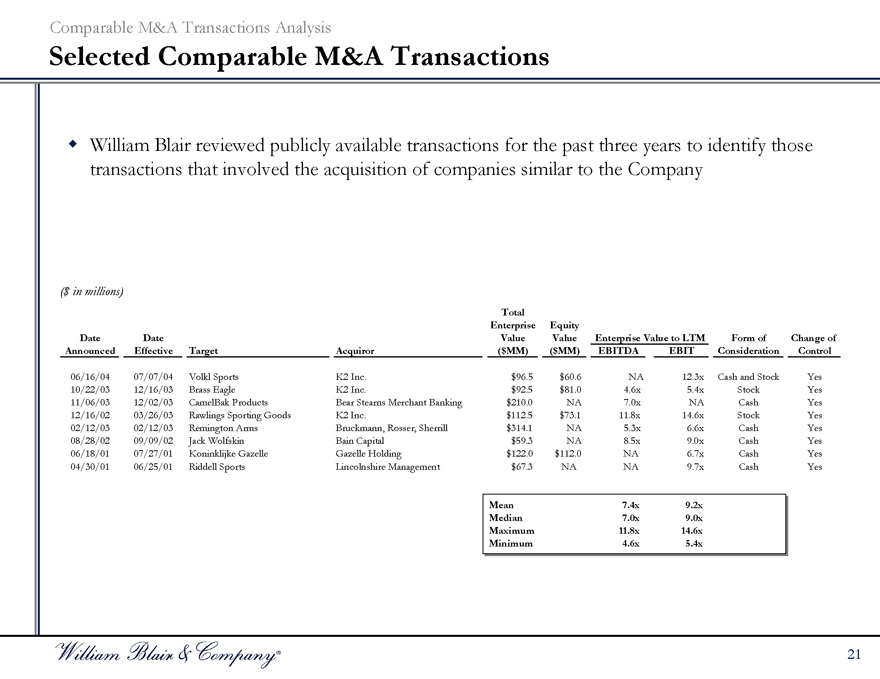
William Blair reviewed publicly available transactions for the past three years to identify those transactions that involved the acquisition of companies similar to the Company
($in millions)
Total Enterprise Value ($MM) Equity Value ($MM)
Enterprise Value to LTM Form of Consideration Change of Control
Date Announced Date Effective Target Acquiror EBITDA EBIT
06/16/04 07/07/04 Volkl Sports K2 Inc. $96.5 $60.6 NA 12.3x Cash and Stock Yes
10/22/03 12/16/03 Brass Eagle K2 Inc. $92.5 $81.0 4.6x 5.4x Stock Yes
11/06/03 12/02/03 CamelBak Products Bear Stearns Merchant Banking $210.0 NA 7.0x NA Cash Yes
12/16/02 03/26/03 Rawlings Sporting Goods K2 Inc. $112.5 $73.1 11.8x 14.6x Stock Yes
02/12/03 02/12/03 Remington Arms Bruckmann, Rosser, Sherrill $314.1 NA 5.3x 6.6x Cash Yes
08/28/02 09/09/02 Jack Wolfskin Bain Capital $59.3 NA 8.5x 9.0x Cash Yes
06/18/01 07/27/01 Koninklijke Gazelle Gazelle Holding $122.0 $112.0 NA 6.7x Cash Yes
04/30/01 06/25/01 Riddell Sports Lincolnshire Management $67.3 NA NA 9.7x Cash Yes
Mean 7.4x 9.2x
Median 7.0x 9.0x
Maximum 11.8x 14.6x
Minimum 4.6x 5.4x
21
Comparable M&A Transactions Analysis
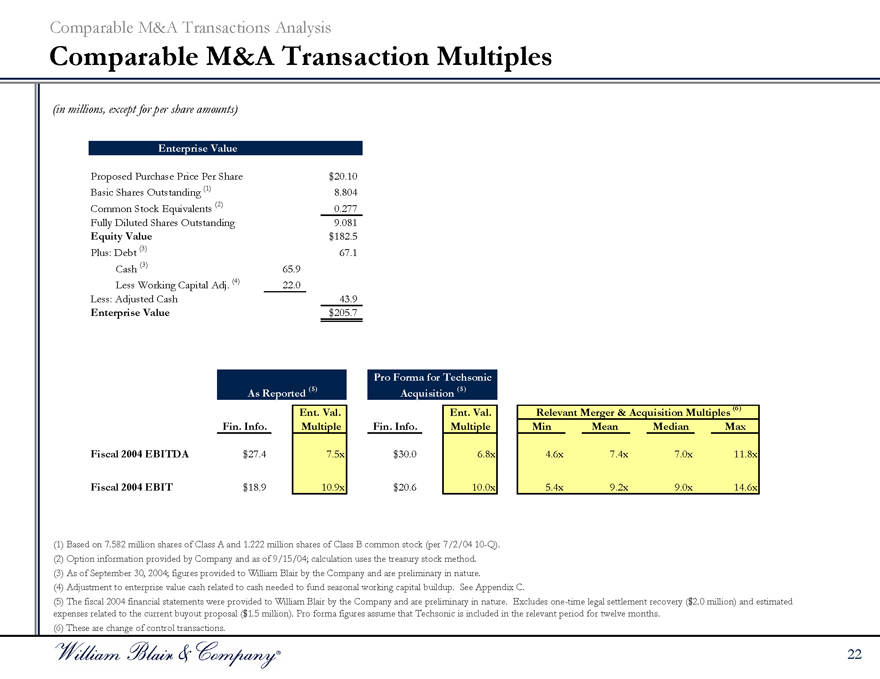
Comparable M&A Transaction Multiples
(in millions, except for per share amounts)
Enterprise Value
Proposed Purchase Price Per Share $20.10
Basic Shares Outstanding (1) 8.804
Common Stock Equivalents (2) 0.277
Fully Diluted Shares Outstanding 9.081
Equity Value $182.5
Plus: Debt (3) 67.1
Cash (3) 65.9
Less Working Capital Adj. (4) 22.0
Less: Adjusted Cash 43.9
Enterprise Value $205.7
As Reported (5) Acquisition (5) Pro Forma for Techsonic
Fin. Info. Ent. Val. Multiple Fin. Info. Ent. Val. Multiple Relevant Merger & Acquisition Multiples (6) Min Mean Median Max
Fiscal 2004 EBITDA $27.4 7.5x $30.0 6.8x 4.6x 7.4x 7.0x 11.8x
Fiscal 2004 EBIT $18.9 10.9x $20.6 10.0x 5.4x 9.2x 9.0x 14.6x
(1) Based on 7.582 million shares of Class A and 1.222 million shares of Class B common stock (per 7/2/04 10-Q). (2) Option information provided by Company and as of 9/15/04; calculation uses the treasury stock method. (3) As of September 30, 2004; figures provided to William Blair by the Company and are preliminary in nature. (4) Adjustment to enterprise value cash related to cash needed to fund seasonal working capital buildup. See Appendix C.
(5) The fiscal 2004 financial statements were provided to William Blair by the Company and are preliminary in nature. Excludes one-time legal settlement recovery ($2.0 million) and estimated expenses related to the current buyout proposal ($1.5 million). Pro forma figures assume that Techsonic is included in the relevant period for twelve months.
(6) These are change of control transactions.
22

Historical and Projected Financial Information

A. Historical and Projected Financial Information
Historical and Projected Financial Information
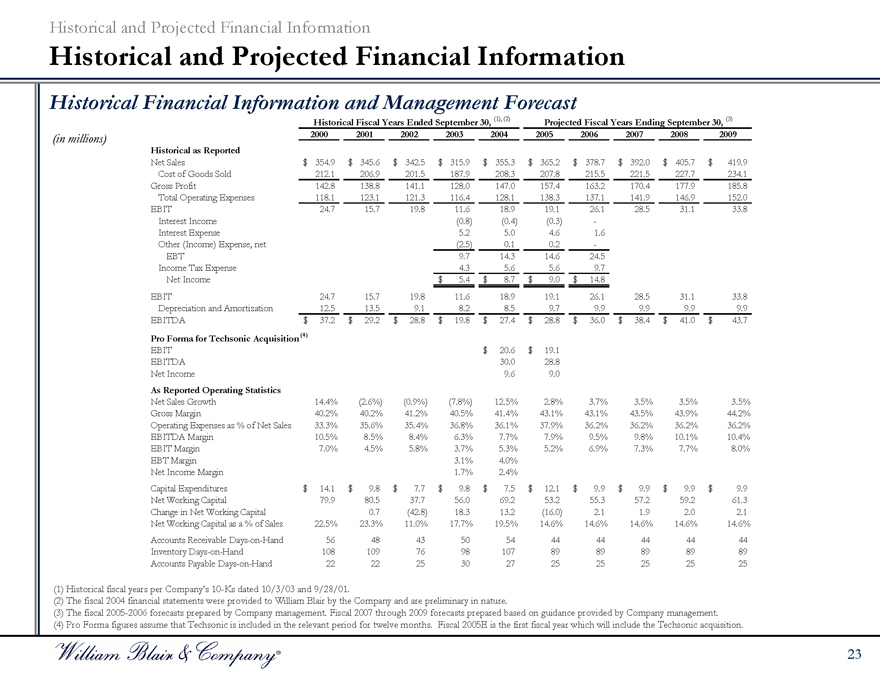
Historical and Projected Financial Information
Historical Financial Information and Management Forecast
Historical Fiscal Years Ended September 30, (1), (2) Projected Fiscal Years Ending September 30, (3)
(in millions) 2000 2001 2002 2003 2004 2005 2006 2007 2008 2009
Historical as Reported
Net Sales $354.9 $345.6 $342.5 $315.9 $355.3 $365.2 $378.7 $392.0 $405.7 $419.9
Cost of Goods Sold 212.1 206.9 201.5 187.9 208.3 207.8 215.5 221.5 227.7 234.1
Gross Profit 142.8 138.8 141.1 128.0 147.0 157.4 163.2 170.4 177.9 185.8
Total Operating Expenses 118.1 123.1 121.3 116.4 128.1 138.3 137.1 141.9 146.9 152.0
EBIT 24.7 15.7 19.8 11.6 18.9 19.1 26.1 28.5 31.1 33.8
Interest Income (0.8) (0.4) (0.3) -
Interest Expense 5.2 5.0 4.6 1.6
Other (Income) Expense, net (2.5) 0.1 0.2 -
EBT 9.7 14.3 14.6 24.5
Income Tax Expense 4.3 5.6 5.6 9.7
Net Income $5.4 $8.7 $9.0 $14.8
EBIT 24.7 15.7 19.8 11.6 18.9 19.1 26.1 28.5 31.1 33.8
Depreciation and Amortization 12.5 13.5 9.1 8.2 8.5 9.7 9.9 9.9 9.9 9.9
EBITDA $37.2 $29.2 $28.8 $19.8 $27.4 $28.8 $36.0 $38.4 $41.0 $43.7
Pro Forma for Techsonic Acquisition (4)
EBIT $20.6 $19.1
EBITDA 30.0 28.8
Net Income 9.6 9.0
As Reported Operating Statistics
Net Sales Growth 14.4% (2.6%) (0.9%) (7.8%) 12.5% 2.8% 3.7% 3.5% 3.5% 3.5%
Gross Margin 40.2% 40.2% 41.2% 40.5% 41.4% 43.1% 43.1% 43.5% 43.9% 44.2%
Operating Expenses as % of Net Sales 33.3% 35.6% 35.4% 36.8% 36.1% 37.9% 36.2% 36.2% 36.2% 36.2%
EBITDA Margin 10.5% 8.5% 8.4% 6.3% 7.7% 7.9% 9.5% 9.8% 10.1% 10.4%
EBIT Margin 7.0% 4.5% 5.8% 3.7% 5.3% 5.2% 6.9% 7.3% 7.7% 8.0%
EBT Margin 3.1% 4.0%
Net Income Margin 1.7% 2.4%
Capital Expenditures $14.1 $9.8 $7.7 $9.8 $7.5 $12.1 $9.9 $9.9 $9.9 $9.9
Net Working Capital 79.9 80.5 37.7 56.0 69.2 53.2 55.3 57.2 59.2 61.3
Change in Net Working Capital 0.7 (42.8) 18.3 13.2 (16.0) 2.1 1.9 2.0 2.1
Net Working Capital as a % of Sales 22.5% 23.3% 11.0% 17.7% 19.5% 14.6% 14.6% 14.6% 14.6% 14.6%
Accounts Receivable Days-on-Hand 56 48 43 50 54 44 44 44 44 44
Inventory Days-on-Hand 108 109 76 98 107 89 89 89 89 89
Accounts Payable Days-on-Hand 22 22 25 30 27 25 25 25 25 25
(1) Historical fiscal years per Company’s 10-Ks dated 10/3/03 and 9/28/01.
(2) The fiscal 2004 financial statements were provided to William Blair by the Company and are preliminary in nature.
(3) The fiscal 2005-2006 forecasts prepared by Company management. Fiscal 2007 through 2009 forecasts prepared based on guidance provided by Company management. (4) Pro Forma figures assume that Techsonic is included in the relevant period for twelve months. Fiscal 2005E is the first fiscal year which will include the Techsonic acquisition.
23
Historical and Projected Financial Information
Financial Information
We have compared the Company’s historical EBIT to budget for each of fiscal years 2001 through 2004, and found that historical GAAP EBIT has trailed budgeted EBIT by an average of 20% over that period. Therefore, the Alternative Forecast discounts budgeted EBIT by a factor of 15% in the projected fiscal periods 2006 through 2009 (the “Alternative Forecast”) with no adjustment to fiscal 2005E
The Alternative Forecast also reflects an adjustment to the Company’s projected working capital. For historical years 2000 through 2004, working capital as a percentage of sales averaged 18.8%, and per the forecast provided by the Company (the “Management Forecast”), is projected to decline to 14.6% of sales. The adjustment pegs working capital at 18.0% of sales.
24
Historical and Projected Financial Information
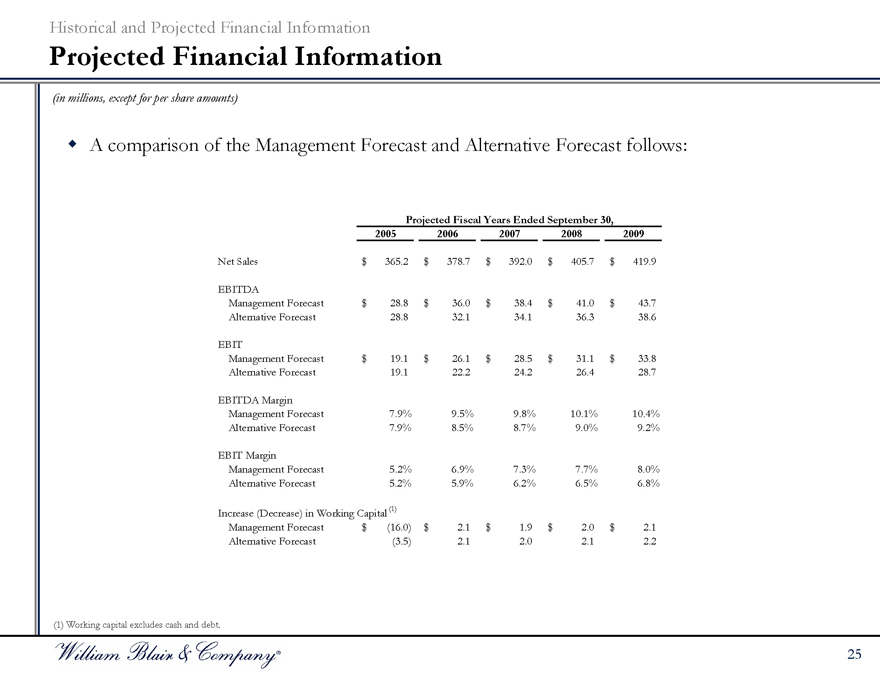
Projected Financial Information
(in millions, except for per share amounts)
A comparison of the Management Forecast and Alternative Forecast follows:
Projected Fiscal Years Ended September 30,
2005 2006 2007 2008 2009
Net Sales $365.2 $378.7 $392.0 $405.7 $419.9
EBITDA
Management Forecast $28.8 $36.0 $38.4 $41.0 $43.7
Alternative Forecast 28.8 32.1 34.1 36.3 38.6
EBIT
Management Forecast $19.1 $26.1 $28.5 $31.1 $33.8
Alternative Forecast 19.1 22.2 24.2 26.4 28.7
EBITDA Margin
Management Forecast 7.9% 9.5% 9.8% 10.1% 10.4%
Alternative Forecast 7.9% 8.5% 8.7% 9.0% 9.2%
EBIT Margin
Management Forecast 5.2% 6.9% 7.3% 7.7% 8.0%
Alternative Forecast 5.2% 5.9% 6.2% 6.5% 6.8%
Increase (Decrease) in Working Capital (1)
Management Forecast $(16.0) $2.1 $1.9 $2.0 $2.1
Alternative Forecast (3.5) 2.1 2.0 2.1 2.2
25

B. Discounted Cash Flow Analysis
Discounted Cash Flow Analysis
Methodology and Assumptions
A discounted cash flow analysis calculates the present value of the Company based upon its future earnings stream and corresponding cash flows
William Blair examined the future earnings and “free cash flows” of the Company through fiscal 2009 based on:
Management Forecast Alternative Forecast
William Blair estimated the value of the Company at the end of fiscal year 2009 (“terminal value”) by assuming the Company would be purchased by an independent party based upon a multiple of the projected trailing EBITDA
The sum of the above two components is the preliminary estimate of the Company’s total present value
William Blair assumed the following preliminary valuation parameters:
Terminal EBITDA multiples ranging from 6.0x to 8.5x Discount rates ranging from 13.0% to 15.0% Discounted to September 30, 2004
26
Discounted Cash Flow Analysis
Discounted Cash Flow Analysis
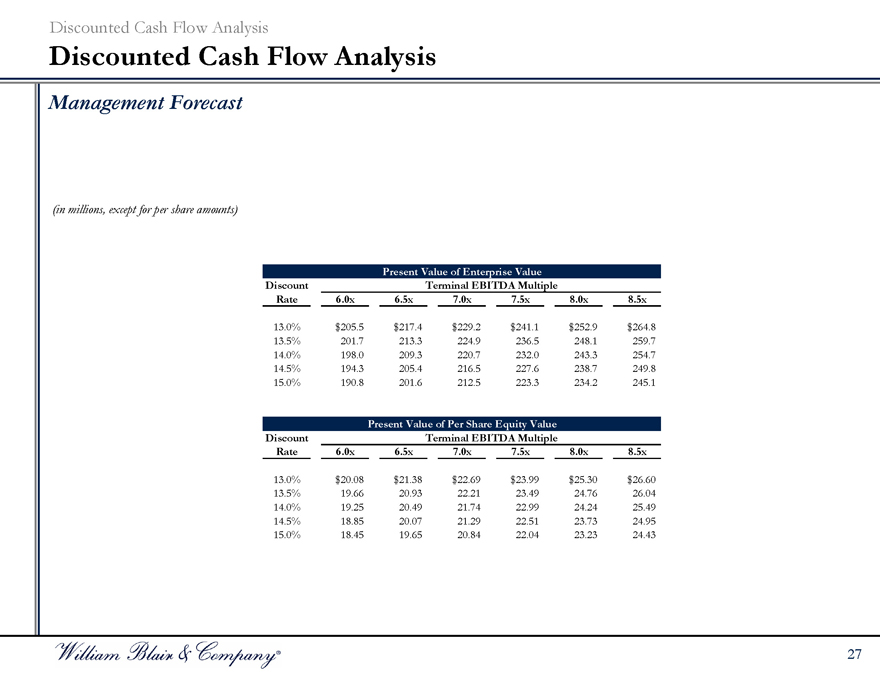
Management Forecast
(in millions, except for per share amounts)
Present Value of Enterprise Value
Discount Terminal EBITDA Multiple
Rate 6.0x 6.5x 7.0x 7.5x 8.0x 8.5x
13.0% $205.5 $217.4 $229.2 $241.1 $252.9 $264.8
13.5% 201.7 213.3 224.9 236.5 248.1 259.7
14.0% 198.0 209.3 220.7 232.0 243.3 254.7
14.5% 194.3 205.4 216.5 227.6 238.7 249.8
15.0% 190.8 201.6 212.5 223.3 234.2 245.1
Present Value of Per Share Equity Value
Discount Terminal EBITDA Multiple
Rate 6.0x 6.5x 7.0x 7.5x 8.0x 8.5x
13.0% $20.08 $21.38 $22.69 $23.99 $25.30 $26.60
13.5% 19.66 20.93 22.21 23.49 24.76 26.04
14.0% 19.25 20.49 21.74 22.99 24.24 25.49
14.5% 18.85 20.07 21.29 22.51 23.73 24.95
15.0% 18.45 19.65 20.84 22.04 23.23 24.43
27
Discounted Cash Flow Analysis
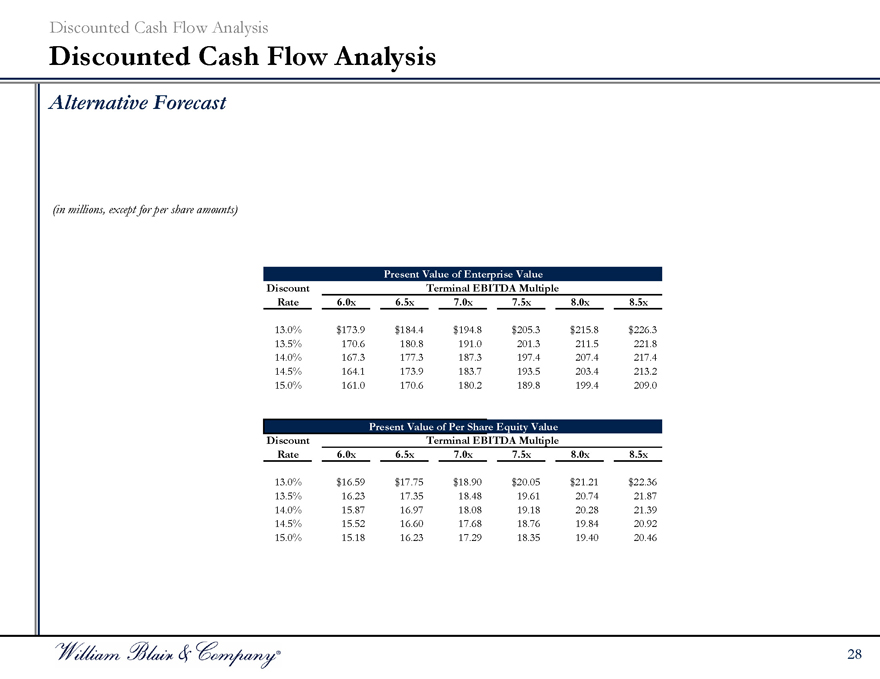
Discounted Cash Flow Analysis
Alternative Forecast
(in millions, except for per share amounts)
Discount Present Value of Enterprise Value Terminal EBITDA Multiple
Rate 6.0x 6.5x 7.0x 7.5x 8.0x 8.5x
13.0% $173.9 $184.4 $194.8 $205.3 $215.8 $226.3
13.5% 170.6 180.8 191.0 201.3 211.5 221.8
14.0% 167.3 177.3 187.3 197.4 207.4 217.4
14.5% 164.1 173.9 183.7 193.5 203.4 213.2
15.0% 161.0 170.6 180.2 189.8 199.4 209.0
Discount Present Value of Per Share Equity Value Terminal EBITDA Multiple
Rate 6.0x 6.5x 7.0x 7.5x 8.0x 8.5x
13.0% $16.59 $17.75 $18.90 $20.05 $21.21 $22.36
13.5% 16.23 17.35 18.48 19.61 20.74 21.87
14.0% 15.87 16.97 18.08 19.18 20.28 21.39
14.5% 15.52 16.60 17.68 18.76 19.84 20.92
15.0% 15.18 16.23 17.29 18.35 19.40 20.46
28
C. Leveraged Buyout Analysis
Leveraged Buyout Analysis
Methodology and Assumptions
William Blair performed a leveraged buyout analysis of the Company based on:
Management Forecast Alternative Forecast
William Blair assumed the following preliminary valuation/capitalization parameters:
Bank debt maximum of 3.5x 2004 EBITDA; subordinated debt maximum of 1.0x 2004 EBITDA Bank debt interest rate of 6.0%; coupon on subordinated debt of 12.0% Exit multiples ranging from 6.0x to 8.5x EBITDA
18% targeted returns for subordinated debt investors (including warrants) 22.5%—27.5% targeted returns for equity investors
29
Leveraged Buyout Analysis
Leveraged Buyout Analysis
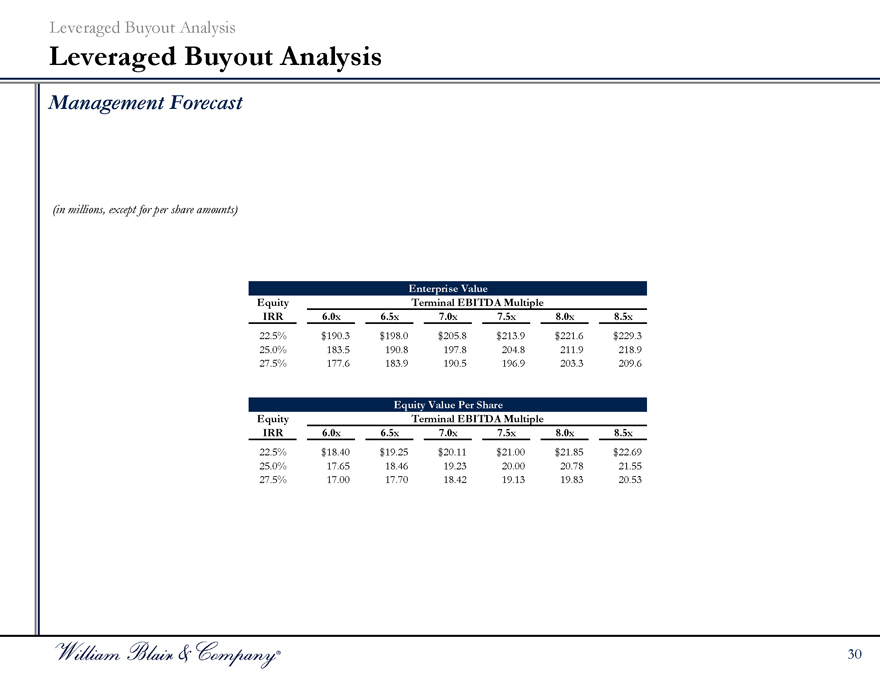
Management Forecast
(in millions, except for per share amounts)
Equity Enterprise Value Terminal EBITDA Multiple
IRR 6.0x 6.5x 7.0x 7.5x 8.0x 8.5x
22.5% $190.3 $198.0 $205.8 $213.9 $221.6 $229.3
25.0% 183.5 190.8 197.8 204.8 211.9 218.9
27.5% 177.6 183.9 190.5 196.9 203.3 209.6
Equity Equity Value Per Share Terminal EBITDA Multiple
IRR 6.0x 6.5x 7.0x 7.5x 8.0x 8.5x
22.5% $18.40 $19.25 $20.11 $21.00 $21.85 $22.69
25.0% 17.65 18.46 19.23 20.00 20.78 21.55
27.5% 17.00 17.70 18.42 19.13 19.83 20.53
30
Leveraged Buyout Analysis
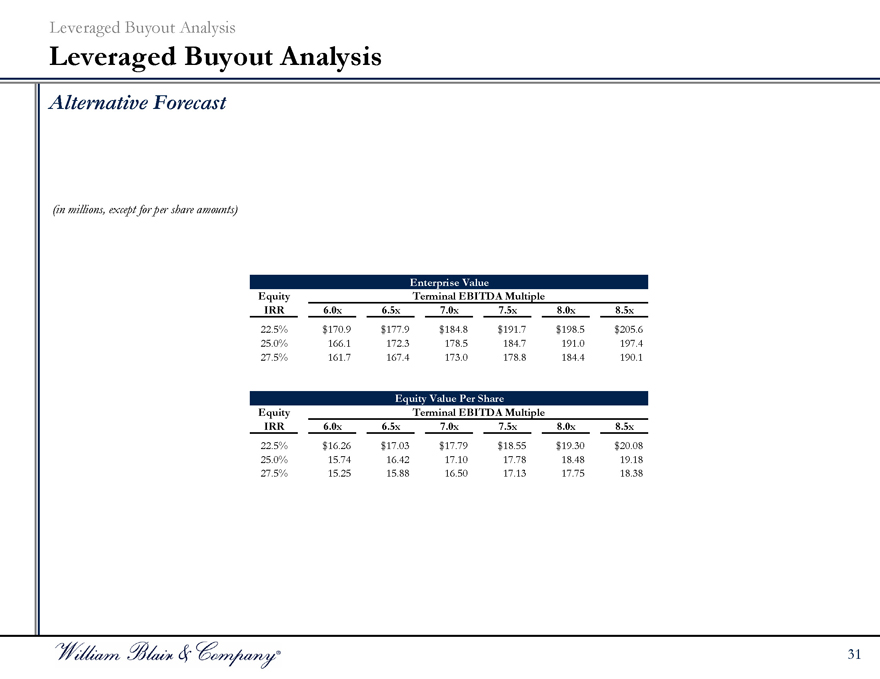
Leveraged Buyout Analysis
Alternative Forecast
(in millions, except for per share amounts)
Equity Enterprise Value Terminal EBITDA Multiple
IRR 6.0x 6.5x 7.0x 7.5x 8.0x 8.5x
22.5% $170.9 $177.9 $184.8 $191.7 $198.5 $205.6
25.0% 166.1 172.3 178.5 184.7 191.0 197.4
27.5% 161.7 167.4 173.0 178.8 184.4 190.1
Equity Equity Value Per Share Terminal EBITDA Multiple
IRR 6.0x 6.5x 7.0x 7.5x 8.0x 8.5x
22.5% $16.26 $17.03 $17.79 $18.55 $19.30 $20.08
25.0% 15.74 16.42 17.10 17.78 18.48 19.18
27.5% 15.25 15.88 16.50 17.13 17.75 18.38
31
Appendices

A. Form of Fairness Opinion

B. Comparable Public Companies Detail
Comparable Public Companies Detail
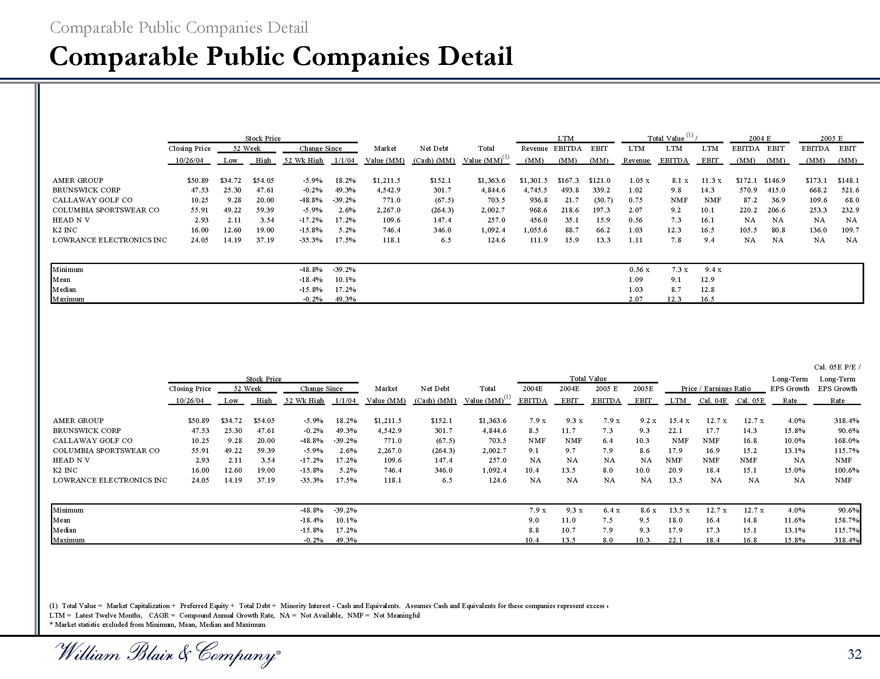
Comparable Public Companies Detail
Closing Price 10/26/04 52 Week Low Stock Price High Change Since 52 Wk High Market 1/1/04 Net Debt Value (MM) Total (Cash) (MM) Revenue Value (MM)(1) EBITDA (MM) LTM EBIT (MM) LTM (MM) LTM Revenue Total Value (1) / LTM EBITDA EBITDA EBIT 2004 E EBIT (MM) EBITDA (MM) 2005 E EBIT (MM) (MM)
AMER GROUP $50.89 $34.72 $54.05 -5.9% 18.2% $1,211.5 $152.1 $1,363.6 $1,301.5 $167.3 $121.0 1.05 x 8.1 x 11.3 x $172.1 $146.9 $173.1 $148.1
BRUNSWICK CORP 47.53 25.30 47.61 -0.2% 49.3% 4,542.9 301.7 4,844.6 4,745.5 493.8 339.2 1.02 9.8 14.3 570.9 415.0 668.2 521.6
CALLAWAY GOLF CO 10.25 9.28 20.00 -48.8% -39.2% 771.0 (67.5) 703.5 936.8 21.7 (30.7) 0.75 NMF NMF 87.2 36.9 109.6 68.0
COLUMBIA SPORTSWEAR CO 55.91 49.22 59.39 -5.9% 2.6% 2,267.0 (264.3) 2,002.7 968.6 218.6 197.3 2.07 9.2 10.1 220.2 206.6 253.3 232.9
HEAD N V 2.93 2.11 3.54 -17.2% 17.2% 109.6 147.4 257.0 456.0 35.1 15.9 0.56 7.3 16.1 NA NA NA NA
K2 INC 16.00 12.60 19.00 -15.8% 5.2% 746.4 346.0 1,092.4 1,055.6 88.7 66.2 1.03 12.3 16.5 105.5 80.8 136.0 109.7
LOWRANCE ELECTRONICS INC 24.05 14.19 37.19 -35.3% 17.5% 118.1 6.5 124.6 111.9 15.9 13.3 1.11 7.8 9.4 NA NA NA NA
Minimum -48.8% -39.2% 0.56 x 7.3 x 9.4 x
Mean -18.4% 10.1% 1.09 9.1 12.9
Median -15.8% 17.2% 1.03 8.7 12.8
Maximum -0.2% 49.3% 2.07 12.3 16.5
Closing Price 10/26/04 52 Week Low Stock Price Change Since High Market 52 Wk High Net Debt 1/1/04 Total Value (MM) 2004E (Cash) (MM) 2004E Value (MM)(1) 2005 E EBITDA Total Value 2005E EBIT Price / Earnings Ratio EBITDA EPS Growth EBIT EPS Growth LTM Cal. 04E Long-Term Cal. 05E Long-Term Rate Cal. 05E P/E / Rate
AMER GROUP $50.89 $34.72 $54.05 -5.9% 18.2% $1,211.5 $152.1 $1,363.6 7.9 x 9.3 x 7.9 x 9.2 x 15.4 x 12.7 x 12.7 x 4.0% 318.4%
BRUNSWICK CORP 47.53 25.30 47.61 -0.2% 49.3% 4,542.9 301.7 4,844.6 8.5 11.7 7.3 9.3 22.1 17.7 14.3 15.8% 90.6%
CALLAWAY GOLF CO 10.25 9.28 20.00 -48.8% -39.2% 771.0 (67.5) 703.5 NMF NMF 6.4 10.3 NMF NMF 16.8 10.0% 168.0%
COLUMBIA SPORTSWEAR CO 55.91 49.22 59.39 -5.9% 2.6% 2,267.0 (264.3) 2,002.7 9.1 9.7 7.9 8.6 17.9 16.9 15.2 13.1% 115.7%
HEAD N V 2.93 2.11 3.54 -17.2% 17.2% 109.6 147.4 257.0 NA NA NA NA NMF NMF NMF NA NMF
K2 INC 16.00 12.60 19.00 -15.8% 5.2% 746.4 346.0 1,092.4 10.4 13.5 8.0 10.0 20.9 18.4 15.1 15.0% 100.6%
LOWRANCE ELECTRONICS INC 24.05 14.19 37.19 -35.3% 17.5% 118.1 6.5 124.6 NA NA NA NA 13.5 NA NA NA NMF
Minimum -48.8% -39.2% 7.9 x 9.3 x 6.4 x 8.6 x 13.5 x 12.7 x 12.7 x 4.0% 90.6%
Mean -18.4% 10.1% 9.0 11.0 7.5 9.5 18.0 16.4 14.8 11.6% 158.7%
Median -15.8% 17.2% 8.8 10.7 7.9 9.3 17.9 17.3 15.1 13.1% 115.7%
Maximum -0.2% 49.3% 10.4 13.5 8.0 10.3 22.1 18.4 16.8 15.8% 318.4%
(1) Total Value = Market Capitalization + Preferred Equity + Total Debt + Minority Interest—Cash and Equivalents. Assumes Cash and Equivalents for these companies represent excess LTM = Latest Twelve Months, CAGR = Compound Annual Growth Rate, NA = Not Available, NMF = Not Meaningful * Market statistic excluded from Minimum, Mean, Median and Maximum
32

Comparable Public Companies Detail
Comparable Public Companies Detail
Gross Profit as a % of Revenue EBITDA as a % of Revenue EBIT as a % of Revenue 3 YR CAGR
LTM 4 YR Avg LTM 4 YR Avg LTM 4 YR Avg Revenue EBITDA EBIT EPS
AMER GROUP 48.4% 49.1% 12.9% 12.4% 9.3% 9.1% 7.5% 8.6% 9.3% 7.7%
BRUNSWICK CORP 25.1% 21.9% 10.4% 11.3% 7.1% 7.2% 2.7% -12.9% -18.3% -14.9%
CALLAWAY GOLF CO 37.8% 48.2% 2.3% 17.6% -3.3% 12.7% -0.9% -12.1% -18.6% -15.8%
COLUMBIA SPORTSWEAR CO 48.1% 46.0% 22.6% 21.0% 20.4% 18.7% 15.7% 24.4% 25.4% 26.0%
HEAD N V 39.3% 40.3% 7.7% 9.5% 3.5% 5.3% 2.7% -20.1% -39.3% NMF
K2 INC 32.3% 29.4% 8.4% 7.0% 6.3% 4.6% 2.6% -1.9% -5.0% -17.7%
LOWRANCE ELECTRONICS INC 42.3% 39.5% 14.2% 10.3% 11.9% 7.7% 15.1% 54.4% 75.2% 49.7%
Minimum 25.1% 21.9% 2.3% 7.0% -3.3% 4.6% -0.9% -20.1% -39.3% -17.7%
Mean 39.0% 39.2% 11.2% 12.7% 7.9% 9.3% 6.5% 5.8% 4.1% 5.8%
Median 39.3% 40.3% 10.4% 11.3% 7.1% 7.7% 2.7% -1.9% -5.0% -3.6%
Maximum 48.4% 49.1% 22.6% 21.0% 20.4% 18.7% 15.7% 54.4% 75.2% 49.7%
Source: Historical data per company filings.
(1) Total Value = Market Capitalization + Preferred Equity + Total Debt + Minority Interest—Cash and Equivalents. Assumes Cash and Equivalents for these companies represent excess cash. LTM = Latest Twelve Months, CAGR = Compound Annual Growth Rate, NA = Not Available, NMF = Not Meaningful
33

C. Working Capital Adjustment
Working Capital Adjustment
Working Capital Adjustment
William Blair reviewed monthly working capital for the Company (including the impact of the increase in working capital resulting from the Techsonic Industries acquisition) and average annual working capital for fiscal 2004 (1)
For purposes of this analysis, working capital is defined as accounts receivable plus inventory less accounts payable The Company is currently at the low point of its working capital cycle, having seasonally low accounts receivable and inventory balances and seasonally high cash balances Some portion of the current cash balances will be required to fund the seasonal buildup of working capital
A company’s enterprise value equals (i) its equity value plus (ii) the value of its debt. To the extent there is excess cash, it should be subtracted from the value of debt if the excess cash could be used to pay down debt
(Valuation: Measuring and Managing the Value of Companies, by Tom Copeland, Tim Koller and Jack Murrin, 1996)
William Blair applied a downward adjustment to cash on hand at September 30, 2004 to reflect the amount by which the Company’s average monthly working capital for fiscal 2004 exceeded working capital at September 30, 2004, since this amount should not be deemed “excess cash” and therefore is not available to pay down debt
Average monthly working capital for fiscal 2004 was $120.0 million Working capital at September 30, 2004 was $97.8 million Downward adjustment to cash at September 30, 2004 totaled $22.0 million
(1) The fiscal 2004 financial statements were provided to William Blair by the Company and are preliminary in nature.
34
Working Capital Adjustment
Working Capital Adjustment
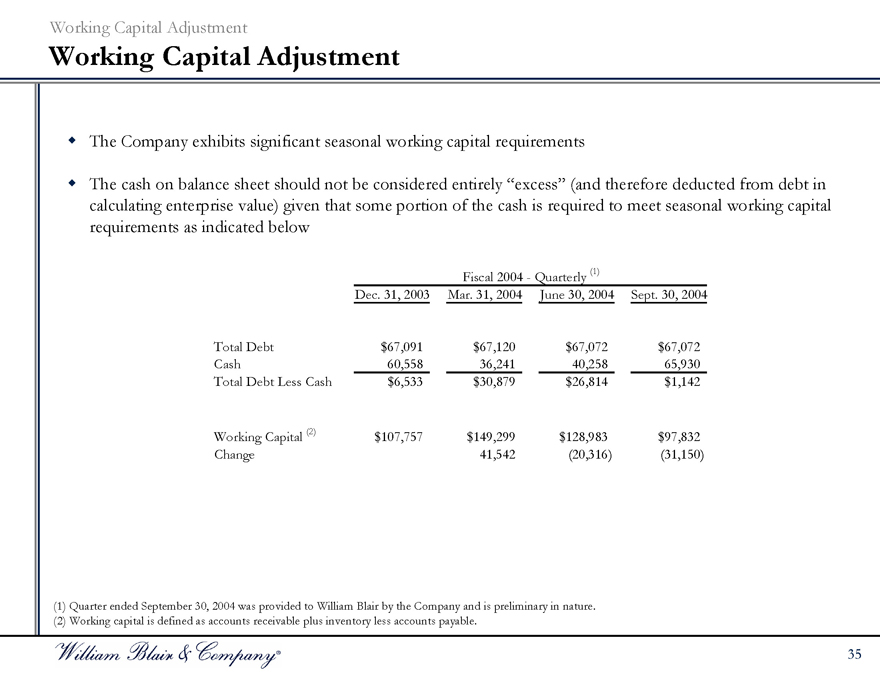
The Company exhibits significant seasonal working capital requirements
The cash on balance sheet should not be considered entirely “excess” (and therefore deducted from debt in calculating enterprise value) given that some portion of the cash is required to meet seasonal working capital requirements as indicated below
Fiscal 2004 - Quarterly (1)
Dec. 31, 2003 Mar. 31, 2004 June 30, 2004 Sept. 30, 2004
Total Debt $67,091 $67,120 $67,072 $67,072
Cash 60,558 36,241 40,258 65,930
Total Debt Less Cash $6,533 $30,879 $26,814 $1,142
Working Capital (2) $107,757 $149,299 $128,983 $97,832
Change 41,542 (20,316) (31,150)
(1) Quarter ended September 30, 2004 was provided to William Blair by the Company and is preliminary in nature. (2) Working capital is defined as accounts receivable plus inventory less accounts payable.
35