FY27 Segments and Investor Metrics September 2026
This presentation contains forward-looking statements, which are any predictions, projections, or other statements about future events. These statements are based on current expectations and assumptions that are subject to risks and uncertainties. Actual results could materially differ because of factors discussed in the Risk Factors section and other sections of our Form 10-K, Forms 10-Q, and other reports and filings with the Securities and Exchange Commission. We do not undertake any duty to update forward-looking statements.
All growth comparisons in this presentation relate to the corresponding period of last fiscal year unless otherwise noted. Numbers may not foot due to rounding. Agenda A note from Satya Updates for FY27 Segment Structure Metric Changes Restated Historical Financials FY27 Q1 Adjusted Outlook
Our updated segment reporting Satya Nadella, Chairman and Chief Executive Officer of Microsoft There’s no question AI represents a profound shift in both technology and business. It is changing what we build and how we operate, and it is blurring the boundaries between our products and reshaping our business models. To reflect this and provide increased transparency to investors, we are updating our financial reporting to mirror how the business is operating, how we allocate resources, and where we are headed. Beginning with FY27, we will transition from our current three reporting segments, Productivity and Business Processes, Intelligent Cloud, and More Personal Computing, to two segments: Agents and Infra and Devices and Consumer. Within each of these segments, you will have full transparency of quarterly revenue across each of our key businesses, including Azure, M365 Cloud, Industry solutions, and ads. We will continue to focus on security, quality, and innovation in everything we do. We want every organization to own its own continuous learning loop so it retains its core IP, and to ensure AI empowers every person, amplifying their agency and ambition. That is what we mean by a frontier ecosystem, ensuring value flows and accrues across people, companies, industries, and countries, thereby leading to broad-based economic growth. As we build this ecosystem, the layers of our stack are not separate opportunities but reinforce each other. Investing in one strengthens the others and allows us to deliver customer value in a differentiated way.
Our updated segment reporting Satya Nadella, Chairman and Chief Executive Officer of Microsoft Our Agents and Infra segment brings together our high-value apps and agents, including Microsoft 365 and GitHub, our multi-model system grounded in rich-enterprise context, and global-scale Azure infrastructure. Under this reporting structure, Azure becomes more purely our consumption-based platform and infrastructure business. Microsoft 365 Cloud brings together our high-value apps and agents across knowledge work, code, and security (Security has largely been part of this business already; the new structure makes that alignment clearer). We are also bringing together the reporting of all our business process solutions as part of the new Industry solutions metric. This integrated architecture across agents and infra is how we think about engaging with customers and driving their outcomes, building products, and monetization. It’s no longer about building or selling one app or service, but about connecting the entire trajectory of a “job to be done.” This expands our opportunity across every layer of the stack, from apps and agents that compress and complete tasks, workflows, and processes; to model systems that power agent reasoning and actions; to infrastructure that trains and serves those models and agent loops in the most efficient way. Our Devices and Consumer segment is where we bring ubiquitous intelligence to billions of people every day, with expansive TAMs across search and advertising, XBOX, and Windows. This reporting structure brings our advertising businesses together better reflecting their shared economics and the increasingly connected experiences across search, browsing, content discovery, and transactions. Across our tech stack, business models, and go-to-market, we are well positioned to generate high returns on invested capital because of the built-in diversification of our businesses, architectural coherence of our stack, and operational synergies. I have never been more confident in the opportunity ahead. Thank you for your continued investment in Microsoft. Satya

Segment Structure
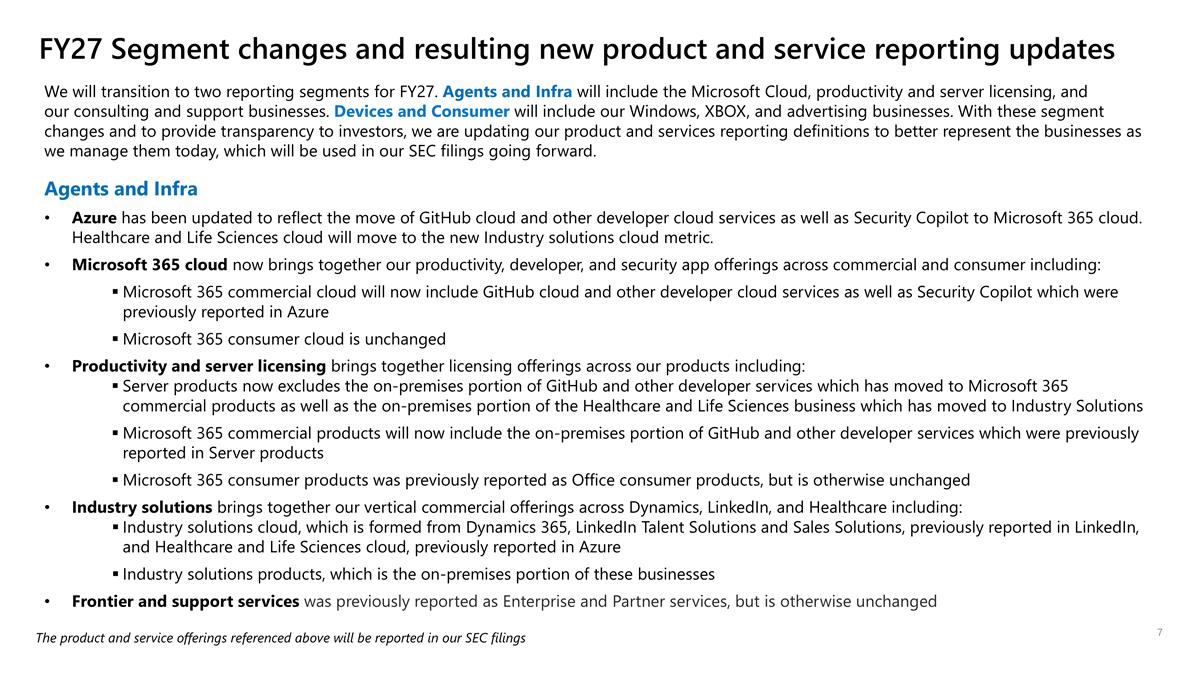
We will transition to two reporting segments for FY27. Agents and Infra will include the Microsoft Cloud, productivity and server licensing, and our consulting and support businesses. Devices and Consumer will include our Windows, XBOX, and advertising businesses. With these segment changes and to provide transparency to investors, we are updating our product and services reporting definitions to better represent the businesses as we manage them today, which will be used in our SEC filings going forward. Agents and Infra Azure has been updated to reflect the move of GitHub cloud and other developer cloud services as well as Security Copilot to Microsoft 365 cloud. Healthcare and Life Sciences cloud will move to the new Industry solutions cloud metric. Microsoft 365 cloud now brings together our productivity, developer, and security app offerings across commercial and consumer including: Microsoft 365 commercial cloud will now include GitHub cloud and other developer cloud services as well as Security Copilot which were previously reported in Azure Microsoft 365 consumer cloud is unchanged Productivity and server licensing brings together licensing offerings across our products including: Server products now excludes the on-premises portion of GitHub and other developer services which has moved to Microsoft 365 commercial products as well as the on-premises portion of the Healthcare and Life Sciences business which has moved to Industry Solutions Microsoft 365 commercial products will now include the on-premises portion of GitHub and other developer services which were previously reported in Server products Microsoft 365 consumer products was previously reported as Office consumer products, but is otherwise unchanged Industry solutions brings together our vertical commercial offerings across Dynamics, LinkedIn, and Healthcare including: Industry solutions cloud, which is formed from Dynamics 365, LinkedIn Talent Solutions and Sales Solutions, previously reported in LinkedIn, and Healthcare and Life Sciences cloud, previously reported in Azure Industry solutions products, which is the on-premises portion of these businesses Frontier and support services was previously reported as Enterprise and Partner services, but is otherwise unchanged FY27 Segment changes and resulting new product and service reporting updates The product and service offerings referenced above will be reported in our SEC filings
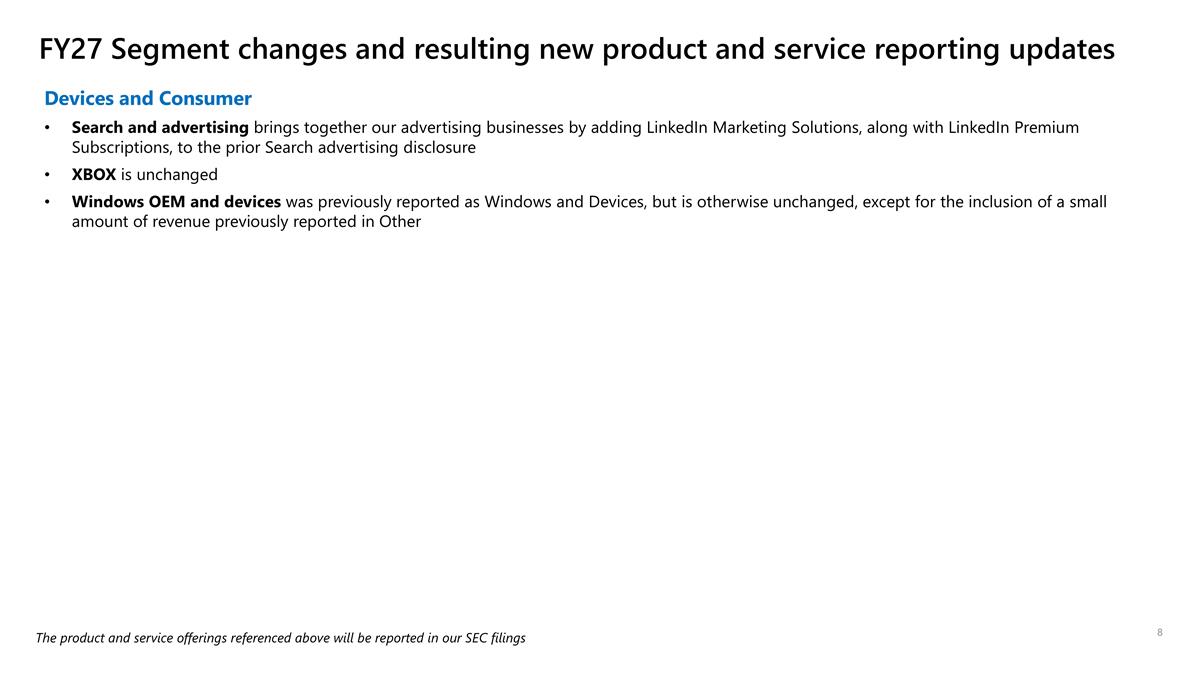
Devices and Consumer Search and advertising brings together our advertising businesses by adding LinkedIn Marketing Solutions, along with LinkedIn Premium Subscriptions, to the prior Search advertising disclosure XBOX is unchanged Windows OEM and devices was previously reported as Windows and Devices, but is otherwise unchanged, except for the inclusion of a small amount of revenue previously reported in Other The product and service offerings referenced above will be reported in our SEC filings FY27 Segment changes and resulting new product and service reporting updates
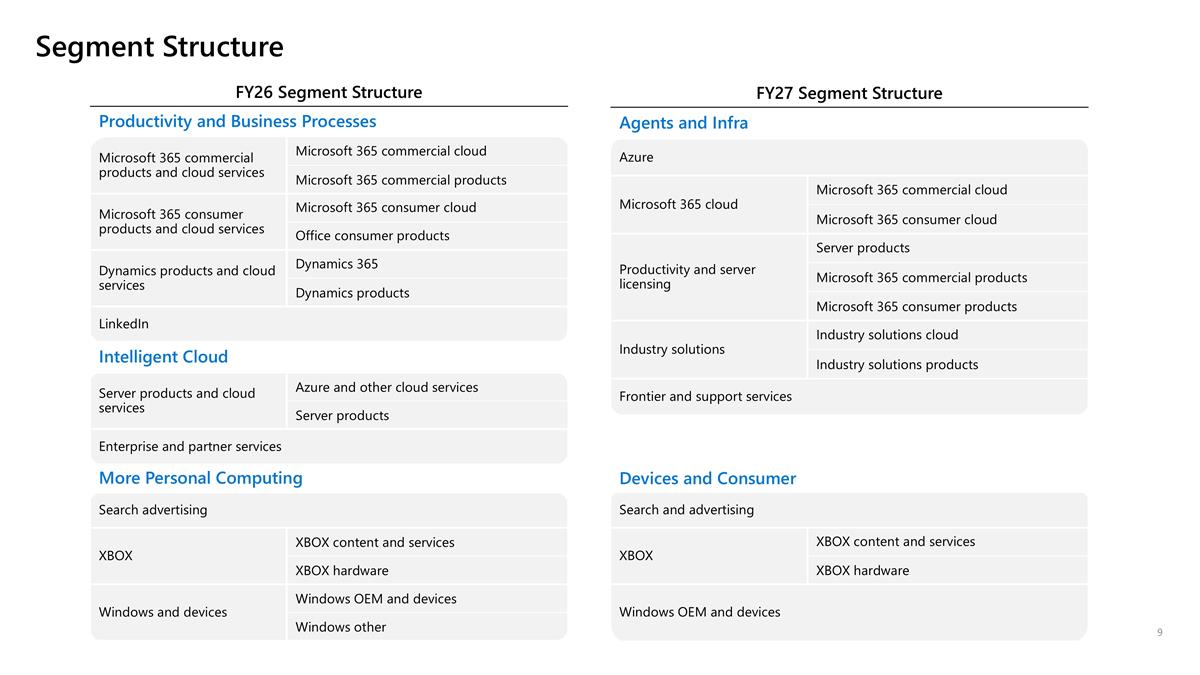
Segment Structure FY27 Segment Structure Agents and Infra Azure Microsoft 365 cloud Microsoft 365 commercial cloud Microsoft 365 consumer cloud Productivity and server licensing Server products Microsoft 365 commercial products Microsoft 365 consumer products Industry solutions Industry solutions cloud Industry solutions products Frontier and support services Devices and Consumer Search and advertising XBOX XBOX content and services XBOX hardware Windows OEM and devices FY26 Segment Structure Productivity and Business Processes Microsoft 365 commercial products and cloud services Microsoft 365 commercial cloud Microsoft 365 commercial products Microsoft 365 consumer products and cloud services Microsoft 365 consumer cloud Office consumer products Dynamics products and cloud services Dynamics 365 Dynamics products LinkedIn Intelligent Cloud Server products and cloud services Azure and other cloud services Server products Enterprise and partner services More Personal Computing Search advertising XBOX XBOX content and services XBOX hardware Windows and devices Windows OEM and devices Windows other

Metric Changes
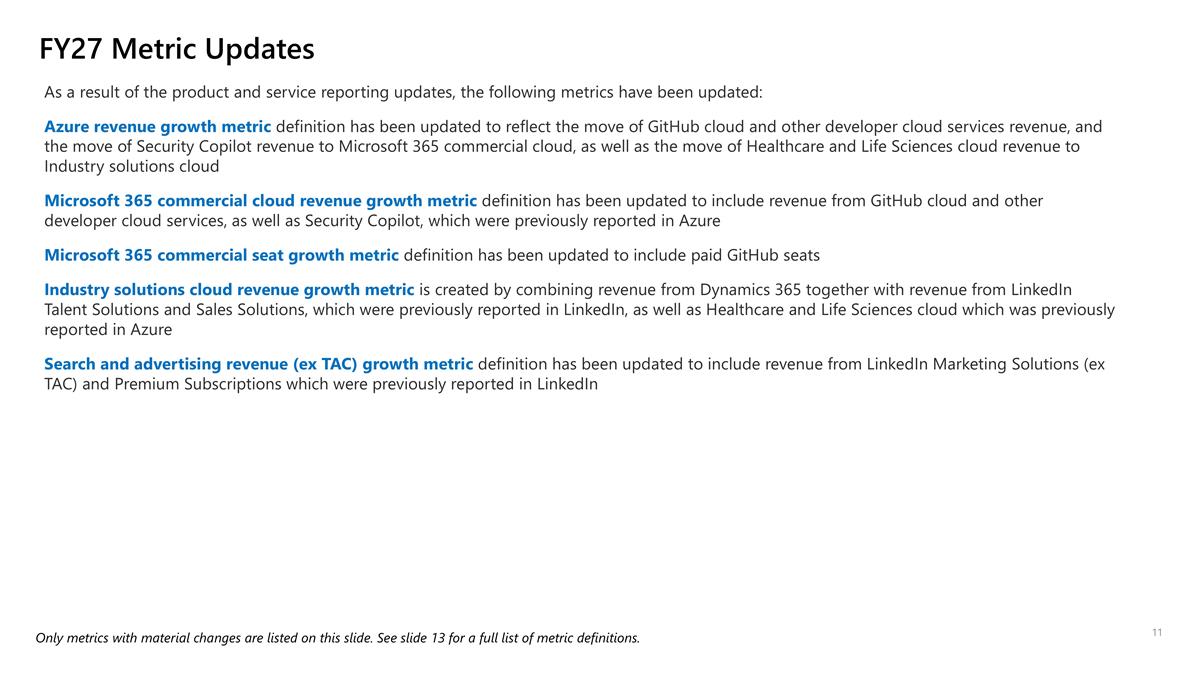
As a result of the product and service reporting updates, the following metrics have been updated: Azure revenue growth metric definition has been updated to reflect the move of GitHub cloud and other developer cloud services revenue, and the move of Security Copilot revenue to Microsoft 365 commercial cloud, as well as the move of Healthcare and Life Sciences cloud revenue to Industry solutions cloud Microsoft 365 commercial cloud revenue growth metric definition has been updated to include revenue from GitHub cloud and other developer cloud services, as well as Security Copilot, which were previously reported in Azure Microsoft 365 commercial seat growth metric definition has been updated to include paid GitHub seats Industry solutions cloud revenue growth metric is created by combining revenue from Dynamics 365 together with revenue from LinkedIn Talent Solutions and Sales Solutions, which were previously reported in LinkedIn, as well as Healthcare and Life Sciences cloud which was previously reported in Azure Search and advertising revenue (ex TAC) growth metric definition has been updated to include revenue from LinkedIn Marketing Solutions (ex TAC) and Premium Subscriptions which were previously reported in LinkedIn FY27 Metric Updates Only metrics with material changes are listed on this slide. See slide 13 for a full list of metric definitions.
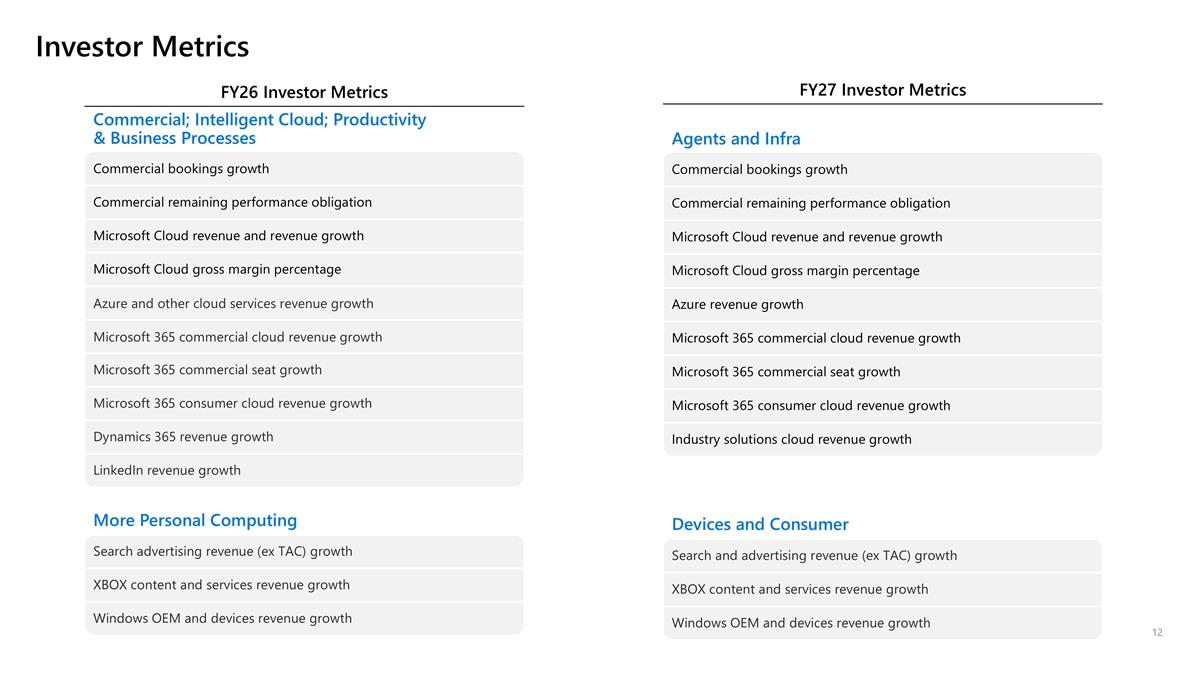
Investor Metrics FY26 Investor Metrics Commercial; Intelligent Cloud; Productivity & Business Processes Commercial bookings growth Commercial remaining performance obligation Microsoft Cloud revenue and revenue growth Microsoft Cloud gross margin percentage Azure and other cloud services revenue growth Microsoft 365 commercial cloud revenue growth Microsoft 365 commercial seat growth Microsoft 365 consumer cloud revenue growth Dynamics 365 revenue growth LinkedIn revenue growth More Personal Computing Search advertising revenue (ex TAC) growth XBOX content and services revenue growth Windows OEM and devices revenue growth FY27 Investor Metrics Agents and Infra Commercial bookings growth Commercial remaining performance obligation Microsoft Cloud revenue and revenue growth Microsoft Cloud gross margin percentage Azure revenue growth Microsoft 365 commercial cloud revenue growth Microsoft 365 commercial seat growth Microsoft 365 consumer cloud revenue growth Industry solutions cloud revenue growth Devices and Consumer Search and advertising revenue (ex TAC) growth XBOX content and services revenue growth Windows OEM and devices revenue growth
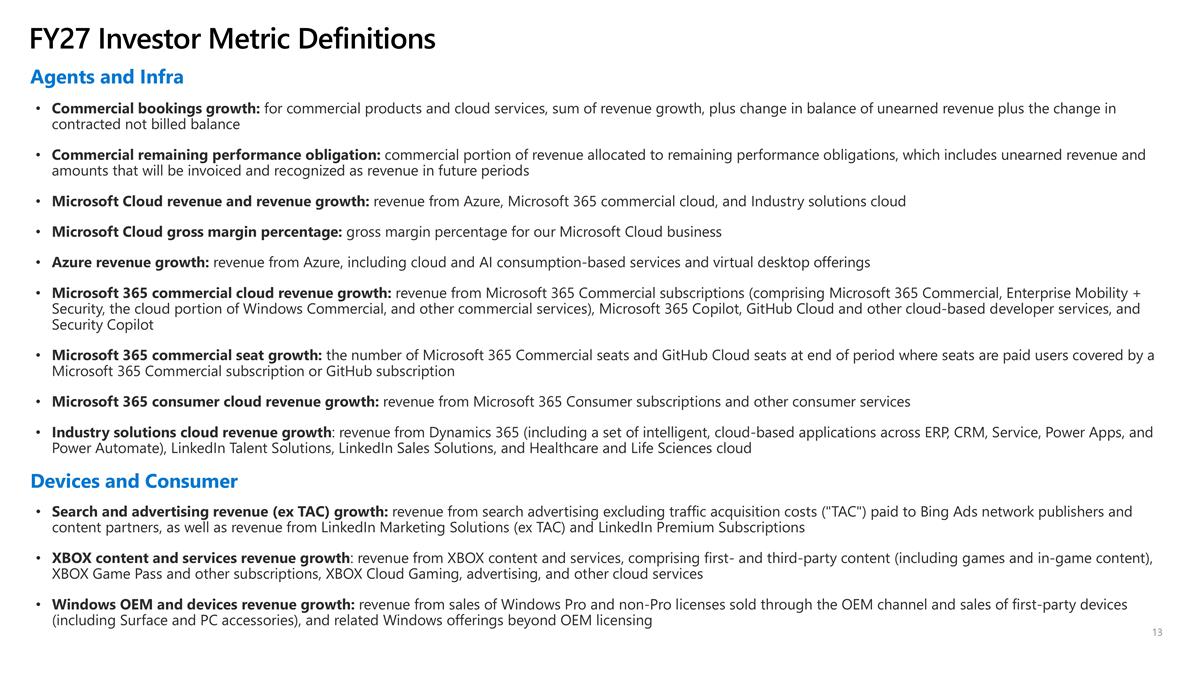
Commercial bookings growth: for commercial products and cloud services, sum of revenue growth, plus change in balance of unearned revenue plus the change in contracted not billed balance Commercial remaining performance obligation: commercial portion of revenue allocated to remaining performance obligations, which includes unearned revenue and amounts that will be invoiced and recognized as revenue in future periods Microsoft Cloud revenue and revenue growth: revenue from Azure, Microsoft 365 commercial cloud, and Industry solutions cloud Microsoft Cloud gross margin percentage: gross margin percentage for our Microsoft Cloud business Azure revenue growth: revenue from Azure, including cloud and AI consumption-based services and virtual desktop offerings Microsoft 365 commercial cloud revenue growth: revenue from Microsoft 365 Commercial subscriptions (comprising Microsoft 365 Commercial, Enterprise Mobility + Security, the cloud portion of Windows Commercial, and other commercial services), Microsoft 365 Copilot, GitHub Cloud and other cloud-based developer services, and Security Copilot Microsoft 365 commercial seat growth: the number of Microsoft 365 Commercial seats and GitHub Cloud seats at end of period where seats are paid users covered by a Microsoft 365 Commercial subscription or GitHub subscription Microsoft 365 consumer cloud revenue growth: revenue from Microsoft 365 Consumer subscriptions and other consumer services Industry solutions cloud revenue growth: revenue from Dynamics 365 (including a set of intelligent, cloud-based applications across ERP, CRM, Service, Power Apps, and Power Automate), LinkedIn Talent Solutions, LinkedIn Sales Solutions, and Healthcare and Life Sciences cloud Agents and Infra Devices and Consumer Search and advertising revenue (ex TAC) growth: revenue from search advertising excluding traffic acquisition costs ("TAC") paid to Bing Ads network publishers and content partners, as well as revenue from LinkedIn Marketing Solutions (ex TAC) and LinkedIn Premium Subscriptions XBOX content and services revenue growth: revenue from XBOX content and services, comprising first- and third-party content (including games and in-game content), XBOX Game Pass and other subscriptions, XBOX Cloud Gaming, advertising, and other cloud services Windows OEM and devices revenue growth: revenue from sales of Windows Pro and non-Pro licenses sold through the OEM channel and sales of first-party devices (including Surface and PC accessories), and related Windows offerings beyond OEM licensing FY27 Investor Metric Definitions

Restated Historical Financials
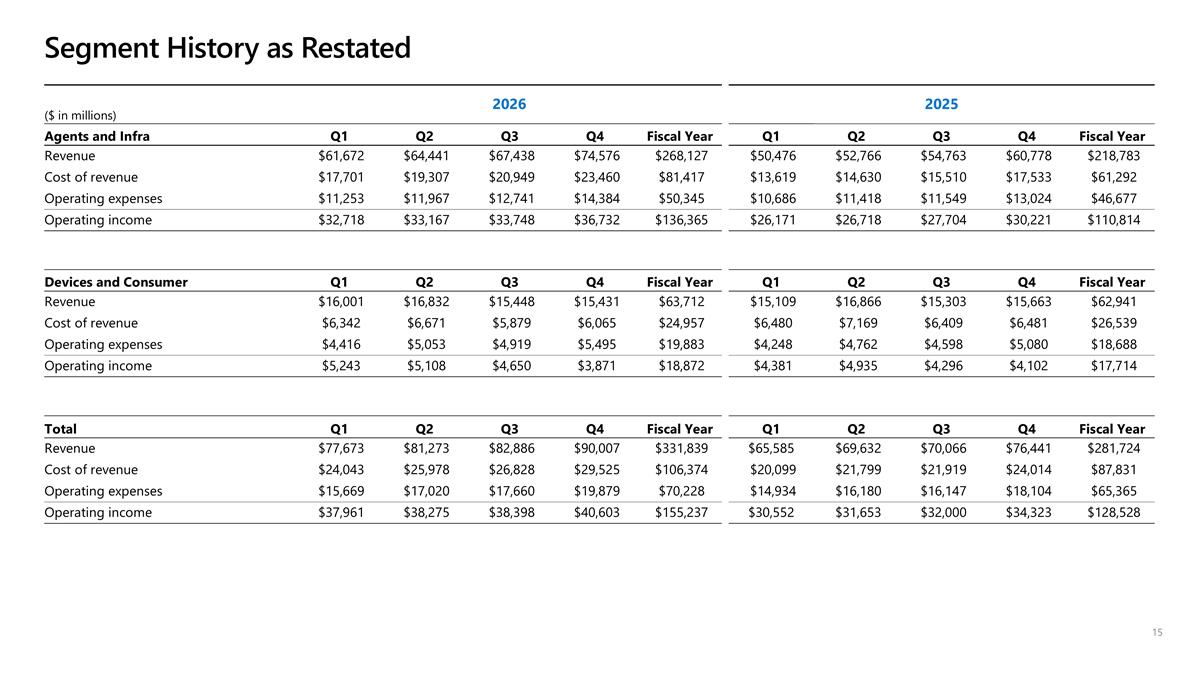
($ in millions) 2026 2025 Agents and Infra Q1 Q2 Q3 Q4 Fiscal Year Q1 Q2 Q3 Q4 Fiscal Year Revenue $61,672 $64,441 $67,438 $74,576 $268,127 $50,476 $52,766 $54,763 $60,778 $218,783 Cost of revenue $17,701 $19,307 $20,949 $23,460 $81,417 $13,619 $14,630 $15,510 $17,533 $61,292 Operating expenses $11,253 $11,967 $12,741 $14,384 $50,345 $10,686 $11,418 $11,549 $13,024 $46,677 Operating income $32,718 $33,167 $33,748 $36,732 $136,365 $26,171 $26,718 $27,704 $30,221 $110,814 Devices and Consumer Q1 Q2 Q3 Q4 Fiscal Year Q1 Q2 Q3 Q4 Fiscal Year Revenue $16,001 $16,832 $15,448 $15,431 $63,712 $15,109 $16,866 $15,303 $15,663 $62,941 Cost of revenue $6,342 $6,671 $5,879 $6,065 $24,957 $6,480 $7,169 $6,409 $6,481 $26,539 Operating expenses $4,416 $5,053 $4,919 $5,495 $19,883 $4,248 $4,762 $4,598 $5,080 $18,688 Operating income $5,243 $5,108 $4,650 $3,871 $18,872 $4,381 $4,935 $4,296 $4,102 $17,714 Total Q1 Q2 Q3 Q4 Fiscal Year Q1 Q2 Q3 Q4 Fiscal Year Revenue $77,673 $81,273 $82,886 $90,007 $331,839 $65,585 $69,632 $70,066 $76,441 $281,724 Cost of revenue $24,043 $25,978 $26,828 $29,525 $106,374 $20,099 $21,799 $21,919 $24,014 $87,831 Operating expenses $15,669 $17,020 $17,660 $19,879 $70,228 $14,934 $16,180 $16,147 $18,104 $65,365 Operating income $37,961 $38,275 $38,398 $40,603 $155,237 $30,552 $31,653 $32,000 $34,323 $128,528 Segment History as Restated
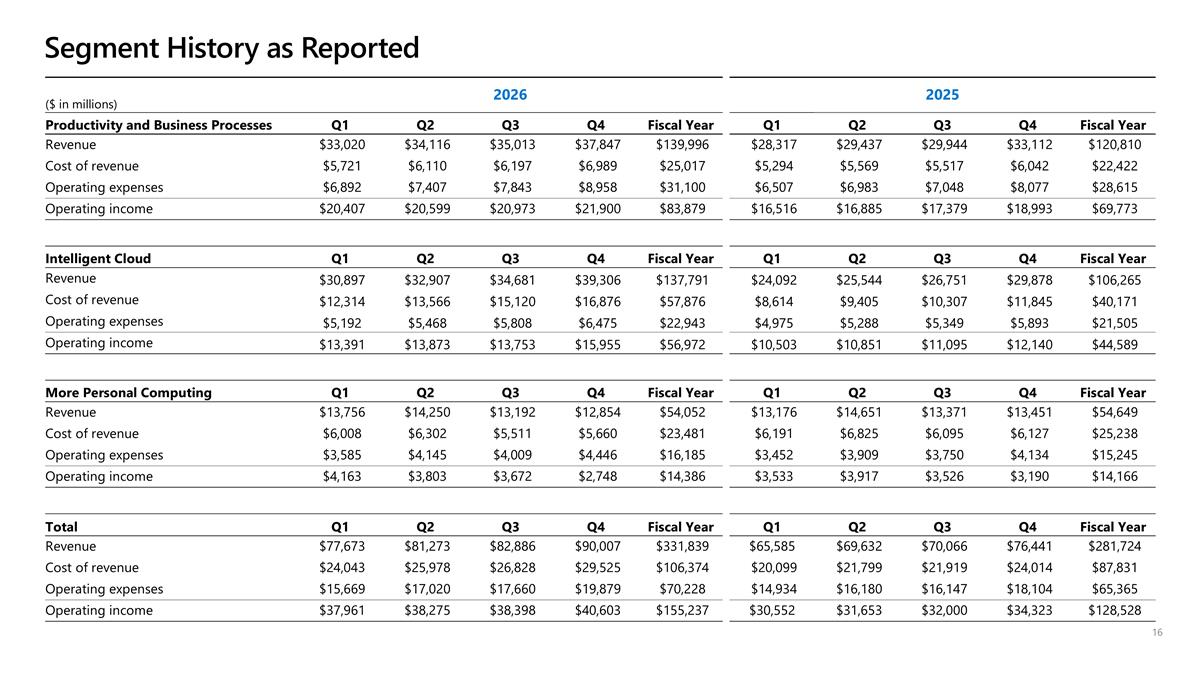
($ in millions) 2026 2025 Productivity and Business Processes Q1 Q2 Q3 Q4 Fiscal Year Q1 Q2 Q3 Q4 Fiscal Year Revenue $33,020 $34,116 $35,013 $37,847 $139,996 $28,317 $29,437 $29,944 $33,112 $120,810 Cost of revenue $5,721 $6,110 $6,197 $6,989 $25,017 $5,294 $5,569 $5,517 $6,042 $22,422 Operating expenses $6,892 $7,407 $7,843 $8,958 $31,100 $6,507 $6,983 $7,048 $8,077 $28,615 Operating income $20,407 $20,599 $20,973 $21,900 $83,879 $16,516 $16,885 $17,379 $18,993 $69,773 Intelligent Cloud Q1 Q2 Q3 Q4 Fiscal Year Q1 Q2 Q3 Q4 Fiscal Year Revenue $30,897 $32,907 $34,681 $39,306 $137,791 $24,092 $25,544 $26,751 $29,878 $106,265 Cost of revenue $12,314 $13,566 $15,120 $16,876 $57,876 $8,614 $9,405 $10,307 $11,845 $40,171 Operating expenses $5,192 $5,468 $5,808 $6,475 $22,943 $4,975 $5,288 $5,349 $5,893 $21,505 Operating income $13,391 $13,873 $13,753 $15,955 $56,972 $10,503 $10,851 $11,095 $12,140 $44,589 More Personal Computing Q1 Q2 Q3 Q4 Fiscal Year Q1 Q2 Q3 Q4 Fiscal Year Revenue $13,756 $14,250 $13,192 $12,854 $54,052 $13,176 $14,651 $13,371 $13,451 $54,649 Cost of revenue $6,008 $6,302 $5,511 $5,660 $23,481 $6,191 $6,825 $6,095 $6,127 $25,238 Operating expenses $3,585 $4,145 $4,009 $4,446 $16,185 $3,452 $3,909 $3,750 $4,134 $15,245 Operating income $4,163 $3,803 $3,672 $2,748 $14,386 $3,533 $3,917 $3,526 $3,190 $14,166 Total Q1 Q2 Q3 Q4 Fiscal Year Q1 Q2 Q3 Q4 Fiscal Year Revenue $77,673 $81,273 $82,886 $90,007 $331,839 $65,585 $69,632 $70,066 $76,441 $281,724 Cost of revenue $24,043 $25,978 $26,828 $29,525 $106,374 $20,099 $21,799 $21,919 $24,014 $87,831 Operating expenses $15,669 $17,020 $17,660 $19,879 $70,228 $14,934 $16,180 $16,147 $18,104 $65,365 Operating income $37,961 $38,275 $38,398 $40,603 $155,237 $30,552 $31,653 $32,000 $34,323 $128,528 Segment History as Reported
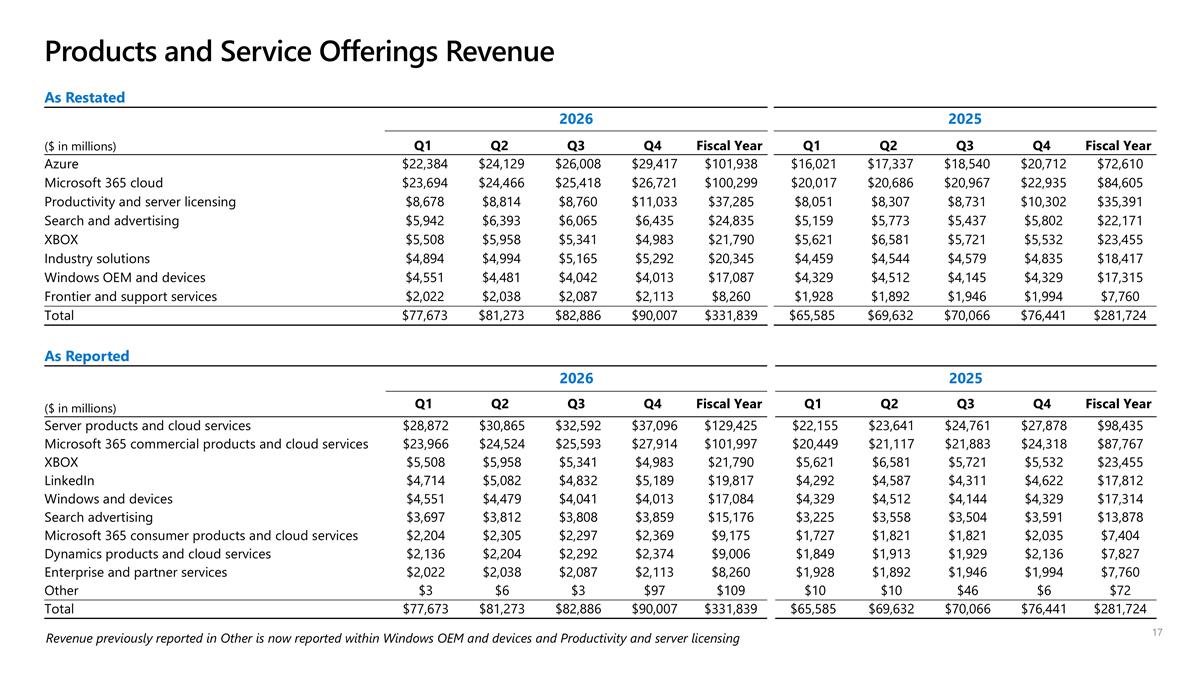
Products and Service Offerings Revenue As Reported 2026 2025 ($ in millions) Q1 Q2 Q3 Q4 Fiscal Year Q1 Q2 Q3 Q4 Fiscal Year Server products and cloud services $28,872 $30,865 $32,592 $37,096 $129,425 $22,155 $23,641 $24,761 $27,878 $98,435 Microsoft 365 commercial products and cloud services $23,966 $24,524 $25,593 $27,914 $101,997 $20,449 $21,117 $21,883 $24,318 $87,767 XBOX $5,508 $5,958 $5,341 $4,983 $21,790 $5,621 $6,581 $5,721 $5,532 $23,455 LinkedIn $4,714 $5,082 $4,832 $5,189 $19,817 $4,292 $4,587 $4,311 $4,622 $17,812 Windows and devices $4,551 $4,479 $4,041 $4,013 $17,084 $4,329 $4,512 $4,144 $4,329 $17,314 Search advertising $3,697 $3,812 $3,808 $3,859 $15,176 $3,225 $3,558 $3,504 $3,591 $13,878 Microsoft 365 consumer products and cloud services $2,204 $2,305 $2,297 $2,369 $9,175 $1,727 $1,821 $1,821 $2,035 $7,404 Dynamics products and cloud services $2,136 $2,204 $2,292 $2,374 $9,006 $1,849 $1,913 $1,929 $2,136 $7,827 Enterprise and partner services $2,022 $2,038 $2,087 $2,113 $8,260 $1,928 $1,892 $1,946 $1,994 $7,760 Other $3 $6 $3 $97 $109 $10 $10 $46 $6 $72 Total $77,673 $81,273 $82,886 $90,007 $331,839 $65,585 $69,632 $70,066 $76,441 $281,724 As Restated 2026 2025 ($ in millions) Q1 Q2 Q3 Q4 Fiscal Year Q1 Q2 Q3 Q4 Fiscal Year Azure $22,384 $24,129 $26,008 $29,417 $101,938 $16,021 $17,337 $18,540 $20,712 $72,610 Microsoft 365 cloud $23,694 $24,466 $25,418 $26,721 $100,299 $20,017 $20,686 $20,967 $22,935 $84,605 Productivity and server licensing $8,678 $8,814 $8,760 $11,033 $37,285 $8,051 $8,307 $8,731 $10,302 $35,391 Search and advertising $5,942 $6,393 $6,065 $6,435 $24,835 $5,159 $5,773 $5,437 $5,802 $22,171 XBOX $5,508 $5,958 $5,341 $4,983 $21,790 $5,621 $6,581 $5,721 $5,532 $23,455 Industry solutions $4,894 $4,994 $5,165 $5,292 $20,345 $4,459 $4,544 $4,579 $4,835 $18,417 Windows OEM and devices $4,551 $4,481 $4,042 $4,013 $17,087 $4,329 $4,512 $4,145 $4,329 $17,315 Frontier and support services $2,022 $2,038 $2,087 $2,113 $8,260 $1,928 $1,892 $1,946 $1,994 $7,760 Total $77,673 $81,273 $82,886 $90,007 $331,839 $65,585 $69,632 $70,066 $76,441 $281,724 Revenue previously reported in Other is now reported within Windows OEM and devices and Productivity and server licensing
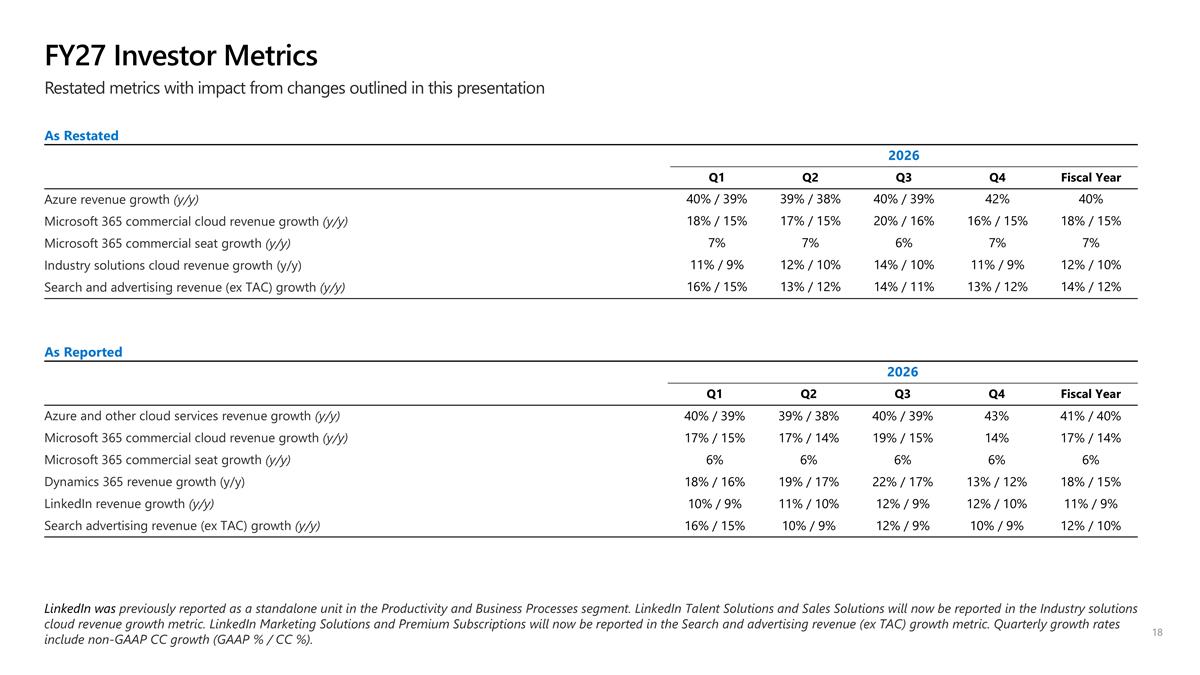
FY27 Investor Metrics As Reported 2026 Q1 Q2 Q3 Q4 Fiscal Year Azure and other cloud services revenue growth (y/y) 40% / 39% 39% / 38% 40% / 39% 43% 41% / 40% Microsoft 365 commercial cloud revenue growth (y/y) 17% / 15% 17% / 14% 19% / 15% 14% 17% / 14% Microsoft 365 commercial seat growth (y/y) 6% 6% 6% 6% 6% Dynamics 365 revenue growth (y/y) 18% / 16% 19% / 17% 22% / 17% 13% / 12% 18% / 15% LinkedIn revenue growth (y/y) 10% / 9% 11% / 10% 12% / 9% 12% / 10% 11% / 9% Search advertising revenue (ex TAC) growth (y/y) 16% / 15% 10% / 9% 12% / 9% 10% / 9% 12% / 10% Restated metrics with impact from changes outlined in this presentation LinkedIn was previously reported as a standalone unit in the Productivity and Business Processes segment. LinkedIn Talent Solutions and Sales Solutions will now be reported in the Industry solutions cloud revenue growth metric. LinkedIn Marketing Solutions and Premium Subscriptions will now be reported in the Search and advertising revenue (ex TAC) growth metric. Quarterly growth rates include non-GAAP CC growth (GAAP % / CC %). As Restated 2026 Q1 Q2 Q3 Q4 Fiscal Year Azure revenue growth (y/y) 40% / 39% 39% / 38% 40% / 39% 42% 40% Microsoft 365 commercial cloud revenue growth (y/y) 18% / 15% 17% / 15% 20% / 16% 16% / 15% 18% / 15% Microsoft 365 commercial seat growth (y/y) 7% 7% 6% 7% 7% Industry solutions cloud revenue growth (y/y) 11% / 9% 12% / 10% 14% / 10% 11% / 9% 12% / 10% Search and advertising revenue (ex TAC) growth (y/y) 16% / 15% 13% / 12% 14% / 11% 13% / 12% 14% / 12%
FY27 Q1 Adjusted Outlook
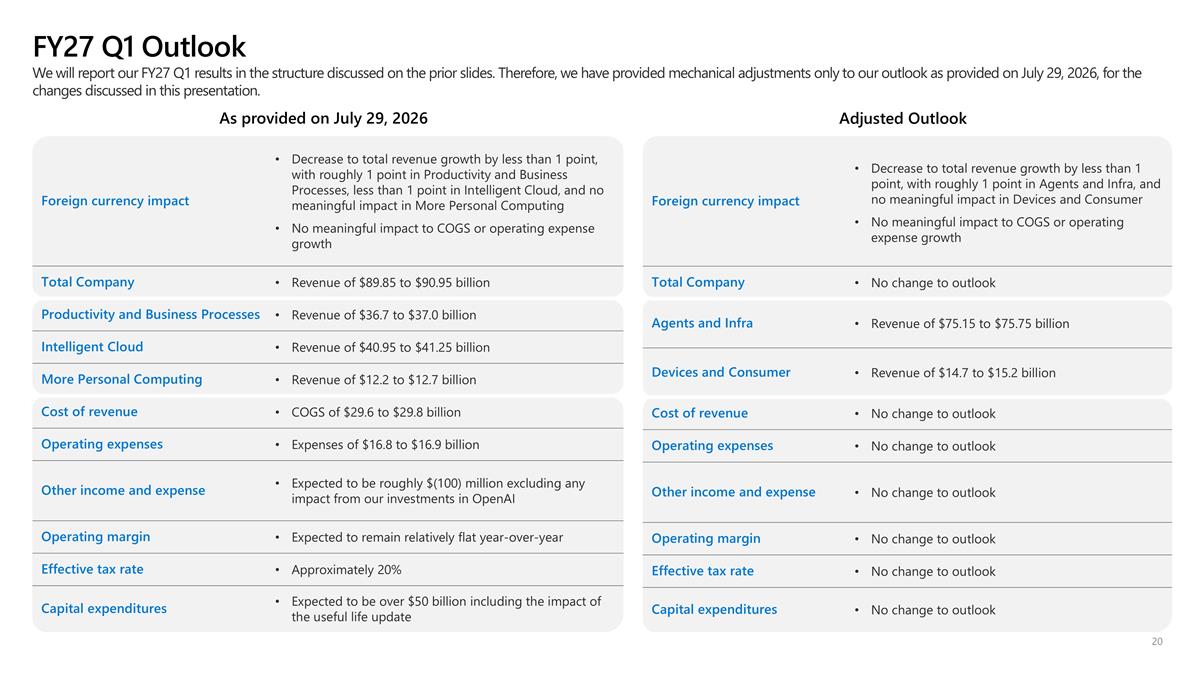
FY27 Q1 Outlook We will report our FY27 Q1 results in the structure discussed on the prior slides. Therefore, we have provided mechanical adjustments only to our outlook as provided on July 29, 2026, for the changes discussed in this presentation. As provided on July 29, 2026 Foreign currency impact Decrease to total revenue growth by less than 1 point, with roughly 1 point in Productivity and Business Processes, less than 1 point in Intelligent Cloud, and no meaningful impact in More Personal Computing No meaningful impact to COGS or operating expense growth Total Company Revenue of $89.85 to $90.95 billion Productivity and Business Processes Revenue of $36.7 to $37.0 billion Intelligent Cloud Revenue of $40.95 to $41.25 billion More Personal Computing Revenue of $12.2 to $12.7 billion Cost of revenue COGS of $29.6 to $29.8 billion Operating expenses Expenses of $16.8 to $16.9 billion Other income and expense Expected to be roughly $(100) million excluding any impact from our investments in OpenAI Operating margin Expected to remain relatively flat year-over-year Effective tax rate Approximately 20% Capital expenditures Expected to be over $50 billion including the impact of the useful life update Adjusted Outlook Foreign currency impact Decrease to total revenue growth by less than 1 point, with roughly 1 point in Agents and Infra, and no meaningful impact in Devices and Consumer No meaningful impact to COGS or operating expense growth Total Company No change to outlook Agents and Infra Revenue of $75.15 to $75.75 billion Devices and Consumer Revenue of $14.7 to $15.2 billion Cost of revenue No change to outlook Operating expenses No change to outlook Other income and expense No change to outlook Operating margin No change to outlook Effective tax rate No change to outlook Capital expenditures No change to outlook
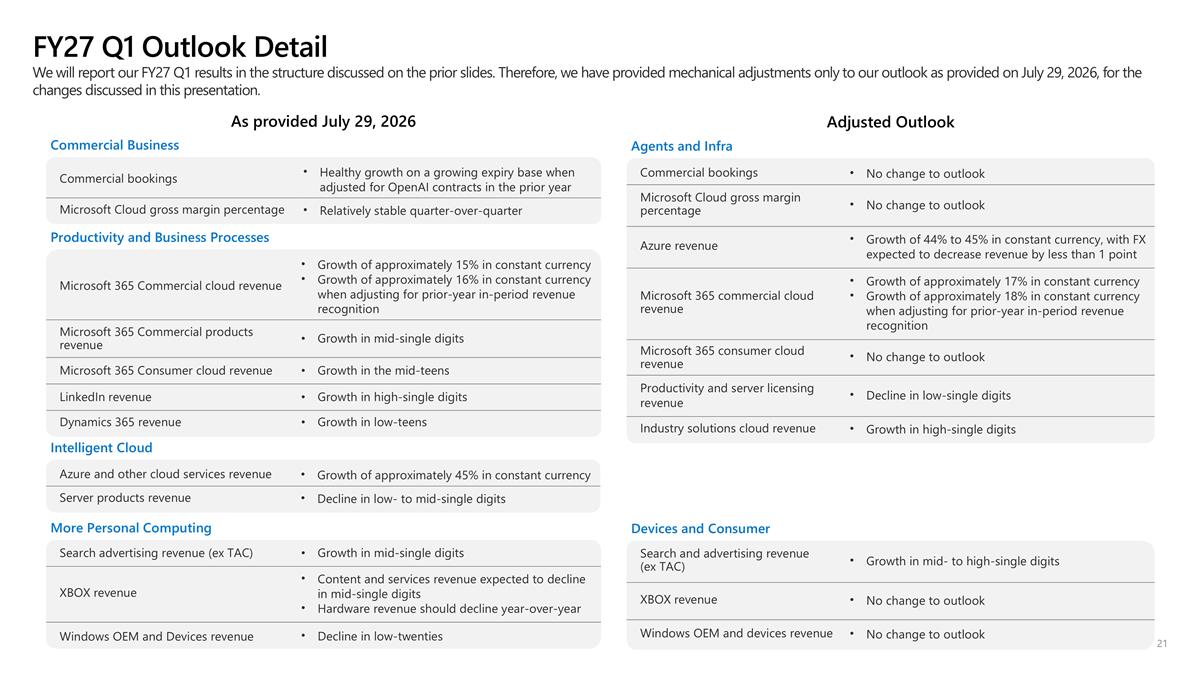
FY27 Q1 Outlook Detail As provided July 29, 2026 Commercial Business Commercial bookings Healthy growth on a growing expiry base when adjusted for OpenAI contracts in the prior year Microsoft Cloud gross margin percentage Relatively stable quarter-over-quarter Productivity and Business Processes Microsoft 365 Commercial cloud revenue Growth of approximately 15% in constant currency Growth of approximately 16% in constant currency when adjusting for prior-year in-period revenue recognition Microsoft 365 Commercial products revenue Growth in mid-single digits Microsoft 365 Consumer cloud revenue Growth in the mid-teens LinkedIn revenue Growth in high-single digits Dynamics 365 revenue Growth in low-teens Intelligent Cloud Azure and other cloud services revenue Growth of approximately 45% in constant currency Server products revenue Decline in low- to mid-single digits More Personal Computing Search advertising revenue (ex TAC) Growth in mid-single digits XBOX revenue Content and services revenue expected to decline in mid-single digits Hardware revenue should decline year-over-year Windows OEM and Devices revenue Decline in low-twenties Adjusted Outlook Agents and Infra Commercial bookings No change to outlook Microsoft Cloud gross margin percentage No change to outlook Azure revenue Growth of 44% to 45% in constant currency, with FX expected to decrease revenue by less than 1 point Microsoft 365 commercial cloud revenue Growth of approximately 17% in constant currency Growth of approximately 18% in constant currency when adjusting for prior-year in-period revenue recognition Microsoft 365 consumer cloud revenue No change to outlook Productivity and server licensing revenue Decline in low-single digits Industry solutions cloud revenue Growth in high-single digits Devices and Consumer Search and advertising revenue (ex TAC) Growth in mid- to high-single digits XBOX revenue No change to outlook Windows OEM and devices revenue No change to outlook We will report our FY27 Q1 results in the structure discussed on the prior slides. Therefore, we have provided mechanical adjustments only to our outlook as provided on July 29, 2026, for the changes discussed in this presentation.