Please wait

Exhibit 96.4


LOGO   

AOM AREA-2 S-K 1300 Technical Report Summary


Rev. 06-21-2026


UPDATED Title PAGE

S-K 1300 Technical Report Summary (TRS) for AOM AREA-2

Submitted to American Ocean Minerals Corporation

June 2026


LOGO

   AOM AREA-2 S-K 1300 TECHNICAL REPORT SUMMARY               JUNE 21, 2026   0 


LOGO   

AOM AREA-2 S-K 1300 Technical Report Summary


Rev. 06-21-2026


Table of Contents


I.   Executive Summary

     5  

A. Introduction

     5  

B. Property Description and Ownership

     5  

C. Geology and Resource Estimate

     8  

D. Status of Exploration

     8  

E.  Development and Operations

     8  

F.  Mineral Reserve Estimate

     9  

G. Capital and Operating Costs

     9  

H. Economic Analysis

     9  

I.   Permitting Requirements

     9  

J.   Qualified Person’s Conclusions and Recommendations

     9  

II.   Introduction

     10  

A. Registrant Information

     11  

B. Terms of Reference and Purpose

     12  

C. Sources of Information

     12  

D. Personal Inspection Summary

     12  

E.  Previously Filed Technical Report Summary Reports

     12  

III. Property Description

     13  

A. Property Location

     13  

B. Mineral Rights

     15  

C. Description of Property Rights

     15  

D. Royalties and Taxes

     16  

IV.  Accessibility, Climate, Local Resources, Infrastructure and Physiography

     17  

A. Bathymetry and Seafloor Description

     17  

B. Access to Property

     17  

C. Availability of Required Infrastructure

     17  

V. History

     18  

VI.  Geological Setting, Mineralization, and Deposit

     18  

A. Global Distribution

     18  

B. Local Geology

     19  

C. Sediments

     19  

D. Ocean Currents

     19  

E.  Local and Property Geology

     20  

1.  Mineralization

     20  

2.  Deposit Type

     20  


LOGO

   AOM AREA-2 S-K 1300 TECHNICAL REPORT SUMMARY               JUNE 21, 2026   1 


LOGO   

AOM AREA-2 S-K 1300 Technical Report Summary


Rev. 06-21-2026


VII.   Exploration

     21  

A. Exploration Work

     21  

B. Terrain-based Domains

     23  

C. Anticipated Exploration Methods

     23  

VIII.   Sample Preparation, Analysis, and Security

     24  

IX.   Data Verification

     26  

A. Mineral Resources

     26  

1.  Exploration Data Compilation and Validation

     26  

2.  Limitations on and Adequacy of Data Verification

     26  

X.   Mineral Processing and Metallurgical Testing

     28  

A. Candidate processing methods

     28  

XI.   Mineral Resource Estimate

     28  

A. Key Assumptions, Parameters, and Methods

     28  

1.  Methods

     28  

2.  Subareas and Block Delineations

     28  

B. Basis for Establishing the Prospects of Economic Extraction of Mineral Resources

     29  

C. Mineral Resource Classification

     29  

D. Assumptions for Multiple Commodity Mineral Resource Estimate

     30  

E.  Mineral Resource Uncertainty Discussion

     30  

F.  Qualified Person’s Opinion on Factors that are Likely to Influence the Prospect of Economic Extraction

     32  

XII.   Mineral Reserve Estimates

     32  

XIII.   Mining Methods

     32  

XIV.   Processing and Recovery Methods

     32  

XV.    Infrastructure

     32  

XVI.   Market Studies

     32  

XVII. Environmental Studies, Permitting, and Plans, Negotiations, or Agreements with Local Individuals or Groups

     33  

XVIII.  Capital and Operating Costs

     34  

XIX.   Economic Analysis

     34  

XX.    Adjacent Properties

     34  

XXI.   Other Relevant Data and Information

     34  

XXII. Interpretation and Conclusions

     34  

XXIII.  Recommendations regarding Mineral Resources

     35  

XXIV.  References

     37  

XXV. Reliance on Information Provided by the Registrant

     40  


LOGO

   AOM AREA-2 S-K 1300 TECHNICAL REPORT SUMMARY               JUNE 21, 2026   2 


LOGO   

AOM AREA-2 S-K 1300 Technical Report Summary


Rev. 06-21-2026


Tables


Table 1. List of Acronyms

     4  

Table 2. Inferred Mineral Estimation

     8  

Table 3. Area 2 North Vertices

     13  

Table 4. Area 2 South Vertices

     13  

Table 5. Area 2 (geodesic km2) Depths, and Slopes

     17  

Table 6. Inferred Mineral Resources AOM Area 2

     31  

Figures


Figure 1. Location Map AOM AREA-2

     7  

Figure 2. Location map in relation to continents.

     10  

Figure 3. AOM AREA-2 Exploration Application Area and Bathymetry

     14  

Figure 4. Free Fall Grab Sampler (after Lee et al. 2008).

     22  

Figure 5. Standard Survey Station Layout Conducted by JICA.

     22  


LOGO

   AOM AREA-2 S-K 1300 TECHNICAL REPORT SUMMARY               JUNE 21, 2026   3 


LOGO   

AOM AREA-2 S-K 1300 Technical Report Summary


Rev. 06-21-2026


Table 1. List of Acronyms


AD    Armed Dredge
AOM    American Ocean Minerals
BC    Box Corer
CCD    Carbonate Compensation Depth, below which carbonate minerals dissolve faster than they accrue
CCZ    The seafloor region between the Clarion and Clipperton Fracture Zones
Co    Cobalt
Cu    Copper
DSHMRA    Deep Seabed Hard Mineral Resources Act
EEZ    Exclusive Economic Zone
ESRI    Environmental Systems Research Institute
EV    Electric vehicle
FFG    Free-fall grab samplers
GEBCO    General Bathymetric Chart of the Oceans
GIS    Geographic Information System; here using the ESRI ArcGIS pro software
ISA    International Seabed Authority of the United Nations
LC    Long Corer
MBES    Multibeam echosounders
Mn    Manganese
My    million years before the present
N    North
Ni    Nickel
NOAA    United States National Atmospheric and Oceanic Administration
S    South
TRS    Technical Report Summary
UNCLOS    United Nations Convention on the Law of the Sea
US    United States (of America)
W    West


LOGO

   AOM AREA-2 S-K 1300 TECHNICAL REPORT SUMMARY               JUNE 21, 2026   4 


LOGO   

AOM AREA-2 S-K 1300 Technical Report Summary


Rev. 06-21-2026


I. EXECUTIVE SUMMARY

A. Introduction

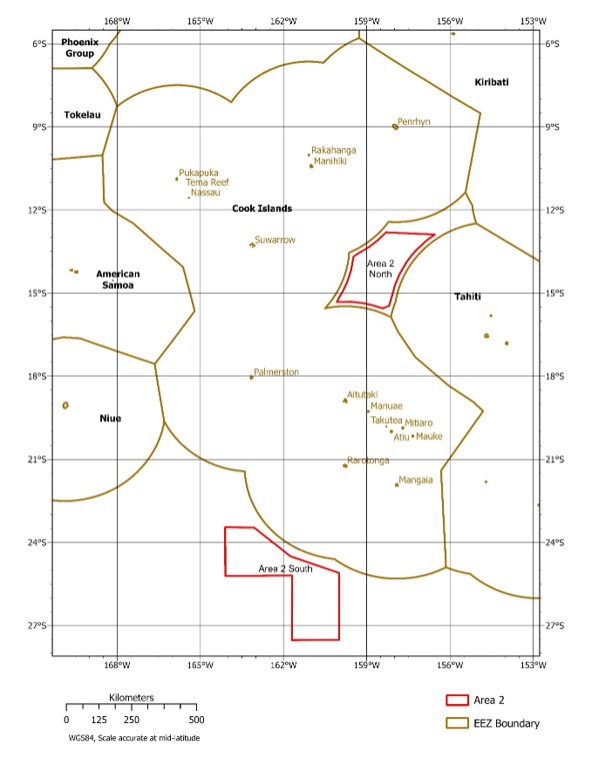
A very large manganese, cobalt, nickel, and copper resource occurring as polymetallic nodules is located on the seafloor in the Southern Pacific Ocean, Penrhyn Basin, adjacent to the Exclusive Economic Zone of the Cook Islands. American Ocean Minerals Corporation (AOM) is a Delaware Limited Liability Company, undertaking assessment on the technical and economic viability of recovering metals from polymetallic nodules from two non-contiguous Subareas (Subareas Dorado North and Dorado South, together named “Area 2”, see Figure 1) totaling approximately 146,154 km2.

AOM AREA-2 has commissioned WYCO Mineral Advisors (WYCO) to produce a Technical Report Summary (TRS) focused on the Mineral Resources in Area 2 (Dorado). The Assessment is based on historical data and is preliminary in nature, and results in only Inferred Mineral Resources.

B. Property Description and Ownership

Four consortia of offshore development companies demonstrated the technical feasibility of collecting, lifting, and converting nodules into metals in the 1970s, but development of the industry was frustrated by the absence of regulation and a governing body. In 1994, the United Nations (UN) established the International Seabed Authority (ISA) pursuant to the UN Convention on the Law of the Sea (UNCLOS). The ISA governs the development of seabed resources for UNCLOS member states in the territories beyond the Exclusive Economic Zones (EEZ) governed by coastal states.

At the time of this report, the ISA is yet to finalize the Mining Code, including Regulations on the Exploitation of Mineral Resources in the Area as required under UNCLOS.

In 1980, the Unites States of America (U.S) enacted the Deep Seabed Hard Mineral Resources Act (DSHMRA) 30 U.S.C. §1401 et seq.) authorizing the National Oceanic and Atmospheric Administration (NOAA) to issue licenses for exploration and permits for commercial recovery from the deep seabed. These activities are limited to areas beyond national jurisdiction and are intended to ensure that U.S. entities can participate in seabed mining despite the US not being a party to the UNCLOS or the 1994 Implementation Agreement.

AOM is in the process of applying for a license covering two areas directly under the U.S. regulatory regime governed by DSHMRA. It is important to note the license has not been approved by DSHMRA and is not under an exploration contract issued by the ISA. Subject to regulatory review and approval, AOM anticipates that any future commercial recovery activities would be conducted pursuant to a permit issued by National Oceanic and Atmospheric Administration (NOAA) under the U.S. legal regime.


LOGO

   AOM AREA-2 S-K 1300 TECHNICAL REPORT SUMMARY               JUNE 21, 2026   5 


LOGO   

AOM AREA-2 S-K 1300 Technical Report Summary


Rev. 06-21-2026


These applications will have to undergo review and commencement of Commercial Recovery is subject to approval of these licenses under DSHMRA. At the time of writing this report, AOM does not hold any exploration licenses or commercial recovery permits under the DSHMRA framework.

Any reference to activities proposed to be conducted by AOM is inherently uncertain and should be considered forward-looking in nature. No assurance can be given that any permit under DSHMRA will be issued, or that if issued, such permit will contain terms and conditions commercially or operationally viable for the project considered in this assessment.

The proposed license area consists of two non-contiguous Subareas (Subareas Dorado North and Dorado South, together named “Area 2”, see Figure 1) in the Southern Pacific Ocean, in the Penrhyn Basin, totaling approximately 146,154 km2.

AOM does not hold the first priority of right over Area 2 North (Dorado North), the subarea that hosts the entire quantified Inferred Mineral Resource reported in this TRS. Following AOM Area-2 LLC’s exploration license application to NOAA (submitted November 26, 2025, and determined to be in substantial compliance on December 29, 2025), NOAA notified AOM that an earlier-filed application by a separate party had established a priority of right over Dorado North under 15 CFR Part 970. AOM has elected to continue its application, thereby preserving a subordinate and contingent position with respect to that subarea. The reported resource is accordingly subject to resolution of the competing priority of right, to the issuance of the necessary regulatory authorizations, and to confirmatory exploration; no assurance can be given that any license or permit will be granted.


LOGO

   AOM AREA-2 S-K 1300 TECHNICAL REPORT SUMMARY               JUNE 21, 2026   6 


LOGO   

AOM AREA-2 S-K 1300 Technical Report Summary


Rev. 06-21-2026


LOGO

Figure 1. Location Map AOM AREA-2


LOGO

   AOM AREA-2 S-K 1300 TECHNICAL REPORT SUMMARY               JUNE 21, 2026   7 


LOGO   

AOM AREA-2 S-K 1300 Technical Report Summary


Rev. 06-21-2026


C. Geology and Resource Estimate

The formation and distribution of polymetallic nodules in Area 2 are primarily controlled by water depth, latitude, and seafloor sediment type. Geological domains identified include volcanic outcrops, volcanic highs, sediment drifts, and high-slope (>10°) areas, which were excluded from resource estimates.

Exploration data underpinning the Mineral Resource estimates comprise historical sampling mostly by Japanese scientists using free-fall grab samplers (FFG) and box core (BC) samplers. Nodule abundance is reported on a wet basis with an assumed moisture content of 30%

Mineral Resource estimation is based on the extensive reports published by these Japanese scientists. The Mineral Resource classification follows SEC Regulation S-K (subpart 1300), with limited data density and modifying factors resulting in Mineral Resource Estimation. No abundance values are available for Area 2 South, making it impossible to estimate the extent and tonnage of ore in this area. Excluding areas with a greater than 10° slope and applying a cut-off grade of 6 kg/m² (abundance), the Inferred resources for Area 2 North are shown in Table 2.

Table 2. Inferred Mineral Estimation Area 2 North


Area 2
North

   Total
Area
Km2
     Mineralized
km2*
     Mt Wet
Nodules
     Avg. Dry Weight %  
   Mn      Co      Ni      Cu  
     56,509        40,235        586        15.9        0.417        0.36        0.21  


*

km2 with Abundance > 6 kg/m2 and seafloor slope < 10°.1

D. Status of Exploration

The project is not at stage where Exploration has initiated.

E. Development and Operations

The project is not at stage where Development and Operations plans are needed.

 
1 

The mineralization reported in this table is classified as an Inferred Mineral Resource — the lowest confidence category under S-K 1300 — and is estimated from historical exploration data of limited sampling density. An Inferred Mineral Resource has a high degree of geological uncertainty, may not have economic or other modifying factors applied to it, may not be used to assess the economic viability of a mining project, and may not be directly converted to a mineral reserve. The reported resource is located entirely within Area-2 North (Dorado North). AOM does not currently hold an exploration license or commercial recovery permit for the property, and AOM does not hold the first priority of right over Area-2 North (Dorado North), whose priority of right has been established by an earlier-filed applicant as described in this report; the reported resource is therefore subject to the resolution of competing priority, to licenses being granted (i.e., to the issuance of the necessary regulatory authorizations), and to confirmatory exploration. No assurance can be given that any license or permit will be granted.


LOGO

   AOM AREA-2 S-K 1300 TECHNICAL REPORT SUMMARY               JUNE 21, 2026   8 


LOGO   

AOM AREA-2 S-K 1300 Technical Report Summary


Rev. 06-21-2026


F. Mineral Reserve Estimate

The project is not at a stage where Mineral Reserve can be estimated.

G. Capital and Operating Costs

The project is not at the stage where Capital and Operating Costs can be estimated.

H. Economic Analysis

The project is not at a stage where Economic Analysis would be appropriate

I. Permitting Requirements

To obtain an exploration license, NOAA must have a complete administrative record showing that the applicant is eligible and that the proposed exploration plan is environmentally and operationally responsible. Although the exact required “shape” of the submittal depends on NOAA’s implementing text, the substantive elements NOAA expects (and has historically required) include: the applicant’s eligibility and corporate structure; delineation of the requested license area; the detailed exploration plan of work and schedule; the technical capability to conduct exploration and any test mining; the environmental baseline and monitoring plan for exploration activities; safety and pollution prevention controls; and evidence of financial responsibility.

J. Qualified Person’s Conclusions and Recommendations

It is the QP’s opinion that the Mineral Resources Estimate derived from the published data is representative of the informing data, and that the data is of sufficient quality to support a Mineral Resource Estimate for Area 2 at an Inferred confidence level. It is important to understand that the “inferred” designation for a mineral resource is fundamentally a guide to help set priorities for subsequent, more detailed exploration work that will be necessary to precede commercial recovery of the resource.

The QP notes that the resources estimate is based on historic work by different parties that may or may not have had various sampling and Quality Assurance/Quality Control (QA/QC) programs which adds a degree of uncertainty with all the samples. However, the work was performed by well-established oceanographic researchers that would have been expected to be competent in sampling and analysis. Future sampling programs to be carried out by AOM will include a robust QA/QC program.


LOGO

   AOM AREA-2 S-K 1300 TECHNICAL REPORT SUMMARY               JUNE 21, 2026   9 


LOGO   

AOM AREA-2 S-K 1300 Technical Report Summary


Rev. 06-21-2026


II. INTRODUCTION

American Ocean Minerals Corporation (AOM) is a Delaware Limited Liability Company duly formed and registered on September 16, 2025. The corporation’s current headquarters and principal place of business is 400 N. Asley Drive, Suite 1900, Tampa, Florida 33602, and its Delaware Registered Agent is likewise A Registered Agent Inc., 8 The Green, Suite A, Dover, Delaware 19901.

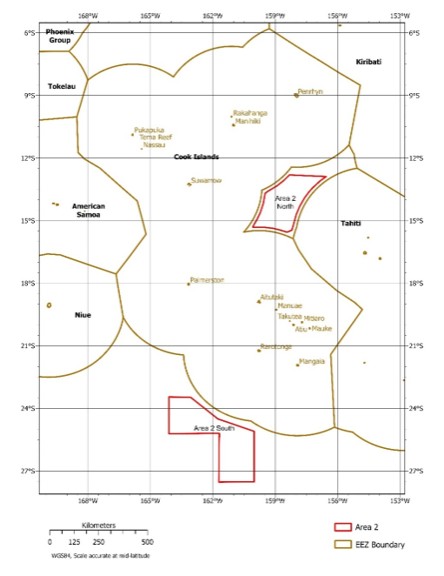
The proposed exploration area consists of two non-contiguous Subareas (Subareas North and South), together named “Area 2” (see Figure 2) is in the Penrhyn Basin of the central South Pacific Ocean, adjacent to the Exclusive Economic Zone of the Cook Islands, totaling approximately 146,154 km².


LOGO

Figure 2. Location map


LOGO

   AOM AREA-2 S-K 1300 TECHNICAL REPORT SUMMARY               JUNE 21, 2026   10 


LOGO   

AOM AREA-2 S-K 1300 Technical Report Summary


Rev. 06-21-2026


A. Registrant Information

This Technical Report Summary (TRS) for Area 2 by WYCO Mineral Advisors with and Dr. Charles Morgan. Charles was the primary author of sections 7, 9, and 11 and Mr. Christopher Wyatt was the primary author of the other sections.

Christopher J. Wyatt is a Registered Member, Society for Mining, Metallurgy, and Exploration (SME) (3574500), a Qualified Professional with the Mining & Metallurgical Society of America (MMSA) (1364QP), Member of the Australasian Institute of Mining & Metallurgy (MAusIMM 319010).

He is a graduate of the Colorado School of Mines, M.S. in Mineral Economics, California Polytechnic University, San Luis Obispo, MBA; California Polytechnic University, San Luis Obispo, M.S. in Engineering Management; University of California-Berkeley, B.S. in Mineral Engineering.

He has practiced in the mineral industry across a variety of minerals continuously since 1990. His experience includes exploration and development with Manganese Nodules initially at university and continuously since 2014, including being an author for both NI 43-101 reports and JORC Technical reports on Manganese Nodules in the Pacific Ocean.

Mr. Wyatt is the President of WYCO Mineral Advisors LLC, incorporated in the State of South Dakota.


Signature: LOGO


Charles L. Morgan is a registered Member of the Society for Mining, Metallurgy, and Exploration, Member number: 4041112.

Charles Morgan obtained a BA degree in Chemistry from the University of California, San Diego (1971) and a PhD in Oceanography and Limnology from the University of Wisconsin, Madison (1975). Between 1975 and 1984 he worked for Lockheed in California on its deep seabed mining program in the deep northeastern tropical Pacific.

Morgan served as the Technical Chair of the Underwater Mining Institute (UMI) between 1994 and 2015. During that period the UMI (currently renamed the Underwater Minerals Conference) grew from a small annual conference based primarily in the U.S. to a much larger conference held in 13 different countries during this period.

Morgan was appointed by the U.S. State Department in 1997 as the first, and currently only, member from the U.S. on the International Seabed Authority Legal and Technical Commission; he served on the Commission for its first five-year term, ending in 2001. He published several technical papers assessing the ferromanganese nodule resources within the Clarion-Clipperton Zone (e.g. Morgan 1999 and ISA 2009). Morgan is currently the principal in Moana Hohonu Consulting, LLC, incorporated in the State of Hawai`i, USA.


Signature:  LOGO


LOGO

   AOM AREA-2 S-K 1300 TECHNICAL REPORT SUMMARY               JUNE 21, 2026   11 


LOGO   

AOM AREA-2 S-K 1300 Technical Report Summary


Rev. 06-21-2026


B. Terms of Reference and Purpose

The effective date of this TRS report is June 21, 2026. It is the Qualified Person’s opinion that there are no known material changes after this date. This TRS uses US English spelling and a combination of Metric and Imperial units of measure. Ore grades are presented in dry weight percent (wt.%), while ore quantities are stated in metric tons (tonnes) or millions of tonnes. Except where noted, geographic coordinates in this TRS are presented in metric units using the World Geodetic System (WGS) 1984. All seafloor areas listed are geodesic areas. The purpose of this TRS is to report on Mineral Resources for AOM’s Area 2 Project Area.

C. Sources of Information

The Japanese Government conducted seabed mineral exploration in the South Pacific. Implementation and execution of the survey were consigned to JICA in cooperation with the Metal Mining Agency of Japan (MMAJ). JICA conducted three expeditions to the Project area using the RV Hakurei Maru No. 2 in 1986, 1990 and 2000 (JICA-MMAJ, 2001). The methods used for collection and analysis of these samples are described below.

Seafloor bathymetry was downloaded from the GEBCO 2025 map and seafloor slopes were derived from this map using GIS tools.2

D. Personal Inspection Summary

Personal Inspection was not possible as deposits are thousands of meters below sea level. However, the QPs for this report have been involved in similar exploration sampling programs for Manganese Nodules in the CCZ.

Dr. Morgan worked for ten years on the Lockheed Ocean Mineral exploration project from 1975 to 1984, including participation in several sampling cruises that recovered thousands of polymetallic nodule samples and several tonnes of nodules for ore assays and metallurgical testing. No direct observation of the deep seafloor was involved.

Mr. Wyatt has participated in several exploration sampling cruises that recovered nodules for analysis as well photographic, geophysical, and biologic data. No direct observation of the deep seafloor was involved.

E. Previously Filed Technical Report Summary Reports

This is the first TRS filed for this property.


2 

https://download.gebco.net/


LOGO

   AOM AREA-2 S-K 1300 TECHNICAL REPORT SUMMARY               JUNE 21, 2026   12 


LOGO   

AOM AREA-2 S-K 1300 Technical Report Summary


Rev. 06-21-2026


III. PROPERTY DESCRIPTION

A. Property Location

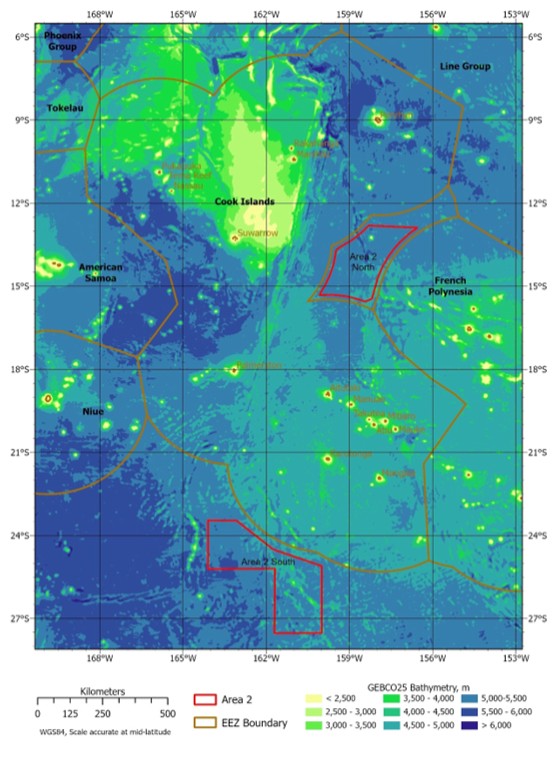
Table 3 and Table 4 list the coordinates of vertices that delineate each of these Subareas. Figure 3 shows the Area 2 exploration Subareas and the regional bathymetry. The Subareas were selected to optimize the resource potential while avoiding potential conflicts with areas currently delineated under the jurisdiction of nation states.

Table 3. Area 2 North Vertices


Vertex

   Longitude
(°W)
     Latitude
(°S)
 
1      –158.3070        –12.8081  
2      –156.5467        –12.8845  
3      –156.8388        –13.0966  
4      –157.2016        –13.4320  
5      –157.3843        –13.6390  
6      –157.5772        –13.8985  
7      –157.8209        –14.3208  
8      –157.9815        –14.7059  
9      –158.1019        –15.1395  
10      –158.1927        –15.4528  
11      –158.4217        –15.5515  
12      –158.7879        –15.4413  
13      –159.1050        –15.3647  
14      –159.5681        –15.3108  
15      –160.0767        –15.3177  
16      –160.0224        –15.2055  
17      –159.8555        –14.9178  
18      –159.7141        –14.6175  
19      –159.5697        –14.1903  
20      –159.4762        –13.6841  
21      –159.3489        –13.5923  
22      –158.9176        –13.3373  
23      –158.5880        –13.0786  

Table 4. Area 2 South Vertices


Vertex

   Longitude
(°W)
     Latitude
(°S)
 
1      –163.0925        –23.4546  
2      –161.7500        –24.5000  
3      –160.0000        –25.1000  
4      –160.0000        –27.5167  
5      –161.6967        –27.5098  
6      –161.6961        –25.2042  
7      –164.0980        –25.2109  
8      –164.1000        –23.4500  


LOGO

   AOM AREA-2 S-K 1300 TECHNICAL REPORT SUMMARY               JUNE 21, 2026   13 


LOGO   

AOM AREA-2 S-K 1300 Technical Report Summary


Rev. 06-21-2026


LOGO

Figure 3. AOM AREA-2 Exploration Application Area and Bathymetry


LOGO

   AOM AREA-2 S-K 1300 TECHNICAL REPORT SUMMARY               JUNE 21, 2026   14 


LOGO   

AOM AREA-2 S-K 1300 Technical Report Summary


Rev. 06-21-2026


B. Mineral Rights

AOM Area-2 LLC (whose parent company is American Ocean Minerals Corporation), under United States sponsorship, seeks the issuance of an exploration license from the National Oceanic and Atmospheric Administration (NOAA) pursuant to the Deep Seabed Hard Mineral Resources Act (DSHMRA), in accordance with the regulations at 15 C.F.R. Part 970. As of the effective date of this report, AOM Area-2 LLC does not hold an exploration license or a commercial recovery permit.

AOM Area-2 LLC submitted its exploration license application to NOAA on November 26, 2025, and received a determination of substantial compliance on December 29, 2025. In connection with that determination, NOAA notified AOM Area-2 LLC that, with respect to the northern subarea — Area 2 North, designated “Dorado North” — an earlier-filed application by a separate party had established a priority of right under the applicable provisions of 15 C.F.R. Part 970. AOM Area-2 LLC therefore does not hold the first priority of right over Dorado North. AOM Area-2 LLC has nonetheless elected to continue its application, thereby preserving a subordinate position with respect to Dorado North in the event the prior applicant fails to satisfy the applicable certification requirements or otherwise forfeits its priority of right.

This priority-of-right status is material to the Mineral Resource disclosure in this TRS because the entire quantified Inferred Mineral Resource reported herein is located within Dorado North. The geological classification of the mineralization is not affected by the tenure position — the data and the deposit are unchanged — but AOM’s legal position with respect to the area that hosts the resource is a separate and material fact. No abundance data are available for the southern subarea (Area 2 South, “Dorado South”), and accordingly no Mineral Resource is, or can presently be, estimated there; that subarea is described in this TRS as an area of potential economic interest only. The reported Inferred Mineral Resource is therefore subject to the resolution of the competing priority of right over Dorado North, to the issuance of the necessary regulatory authorizations, and to confirmatory exploration; no assurance can be given that any license or permit will be granted. Notwithstanding this priority-of-right status, the quantified Inferred Mineral Resource for Area 2 North (Dorado North) is retained as reported in this TRS; pending resolution of the competing priority of right, however, Dorado North is also presented as an area of economic interest.

C. Description of Property Rights

Area 2 is on the seafloor outside of any national jurisdiction. President Donald Trump signed Executive Order 14285, “Unleashing America’s Offshore Critical Minerals and Resources,” on April 24, 2025, aiming to fast-track U.S. deep seabed mining for critical minerals (e.g., cobalt, nickel, rare earths) in federal waters and promote development in international waters, leveraging the 1980 Deep Seabed Hard Mineral Resources Act (DSHMRA) and establishing the U.S. as a leader. The order directs agencies like NOAA to streamline permits, establishing a new regime for seabed mining.


LOGO

   AOM AREA-2 S-K 1300 TECHNICAL REPORT SUMMARY               JUNE 21, 2026   15 


LOGO   

AOM AREA-2 S-K 1300 Technical Report Summary


Rev. 06-21-2026


D. Royalties and Taxes

Under DSHMRA, royalties and taxes payable on any future commercial recovery of polymetallic nodules by U.S. entities in areas beyond national jurisdiction are governed by domestic U.S. law rather than international frameworks such as the ISA, to which the U.S. is not a party. DSHMRA does not prescribe specific royalty rates, it authorizes NOAA to issue exploration licenses and commercial recovery permits, with terms and conditions that may include financial obligations. These obligations are determined on a case-by-case basis during the permitting process and are designed to ensure that U.S. seabed mining activities are conducted responsibly and in alignment with national interests.

NOAA’s regulatory framework under DSHMRA includes provisions for public comment and environmental review but does not currently mandate a fixed royalty or taxation regime akin to ISA’s proposed ad valorem models. As such, financial terms are negotiated individually and may evolve with future legislative or executive directives, such as the April 2025 Executive Order promoting U.S. leadership in seabed mineral recovery.


LOGO

   AOM AREA-2 S-K 1300 TECHNICAL REPORT SUMMARY               JUNE 21, 2026   16 


LOGO   

AOM AREA-2 S-K 1300 Technical Report Summary


Rev. 06-21-2026


IV. ACCESSIBILITY, CLIMATE, LOCAL RESOURCES, INFRASTRUCTURE AND PHYSIOGRAPHY

A. Bathymetry and Seafloor Description

Figure 3, above, plots the seafloor depth distribution in the region including Area 2. Table 5 lists the descriptive statistics derived from the GEBCO25 map.

Table 5. Area 2 (geodesic km2) Depths, and Slopes


Area 2 (km²)


Statistic

   Depth
(m)
     Slope
(°)
 

North (56,509 km²)

   Std. Dev.      228        3.23  
   Median      –5,125        1.26  
   Maximum (deepest)      –6,040        36.85  
   Minimum (shallowest)      –1,653        0  

South (89,645 km²)

   Std. Dev.      313        3.62  
   Median      –5,165        1.85  
   Maximum (deepest)      –5,922        42.43  
   Minimum (shallowest)      –2,704        0  

B. Access to Property

Area 2 is located outside of any national jurisdiction. It is most easily accessible by ship from various ports in the American Samoa, New Zealand, and Australia. As the deposit does not include any habitable land and is not near coastal waters, all personnel and material are expected to be transported to the project area by ship. Exploration work is being planned to use modern oceanographic survey and sampling techniques.

C. Availability of Required Infrastructure

There are multiple vessels and equipment available to perform exploration and sampling activities. Additional infrastructure to harvest and process nodules will be dependent on regulations and future work requirements. It is expected that some infrastructure that currently exists can be used or repurposed. Additionally, multiple companies and governments are in the process of developing infrastructure that may be utilized in the future.


LOGO

   AOM AREA-2 S-K 1300 TECHNICAL REPORT SUMMARY               JUNE 21, 2026   17 


LOGO   

AOM AREA-2 S-K 1300 Technical Report Summary


Rev. 06-21-2026


V. HISTORY

The first cruise programs dedicated to investigating nodules in the Cook Islands and adjacent regions were mounted in the mid-1970s by the New Zealand Oceanographic Institute. As a precursor to this, the Institute compiled all available data from Challenger and Eltanin cruises completed elsewhere in the region into maps of the nodule properties, including their Mn, Fe, Ni, Co, and Cu contents, and their distribution (Glasby et al., 1974). Further cruises were undertaken in the late 1970s, targeting polymetallic nodules in the South Penrhyn Basin and Aitutaki Passage. Between 1976 and 1981, the Committee for Coordination of Joint Prospecting for Minerals Resources in South Pacific Offshore Areas (CCOP/SOPAC) carried out several cruises in the Cook Islands region. During these cruises, nodules were collected, and the results of their analyses served to define areas of potential economic interest to be surveyed in more detail by later cruises under the Japan-SOPAC Cooperative Study on Deep Sea Mineral Resources in the South Pacific (Cronan, 2013) .

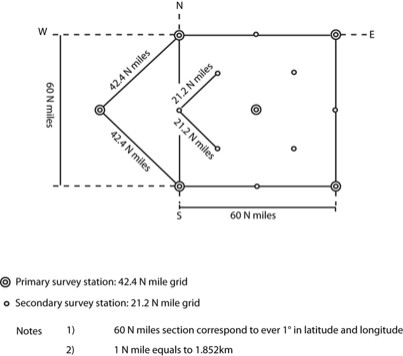
Extensive cruises were carried out in the region by the Japan International Cooperation Agency (JICA) between 1986 and 2000. JICA conducted three expeditions to the Project area using the RV Hakurei Maru No. 2 in 1986, 1990 and 2000. Samples were collected by freefall grab (FFG), box core (BC), long core (LC) and armed dredge (AD) tools. Survey stations were placed based on datum lines every 1° (111 km) in latitude and longitude Infill sites were placed on a 39.3-km (21.5-mi) grid. Three samples (FFG or BC) were collected at each survey station in the form of an inverted triangle. The base sampling point of each station was set at the southern apex of the triangle, and the two other samples were collected at the remaining apexes of the triangle. Sampling points were ~2.6 km (~1.4 mi) apart. Sampling was conducted in a clockwise direction.

VI. GEOLOGICAL SETTING, MINERALIZATION, AND DEPOSIT

A. Global Distribution

Polymetallic nodules with various grades of base metals are found in submarine settings worldwide (Monget, 2015). This widespread distribution was recognized by the early 1970s when Kennecott Exploration surveyed all the major ocean basins. Nodules form at a wide range of depths, from 4,000–6,000 m below sea level in the mid Pacific to 200 m below sea level in the Gulf of Bothnia (Boström et al., 1982) and 30 m in the Baltic Sea (Anufriev and Boltenkov, 2007). The location of nodule formation is reflected in nodule chemistry. Nodules with relatively high Co grades are found within the Cook Islands region, often accompanied by high nodule abundances.


LOGO

   AOM AREA-2 S-K 1300 TECHNICAL REPORT SUMMARY               JUNE 21, 2026   18 


LOGO   

AOM AREA-2 S-K 1300 Technical Report Summary


Rev. 06-21-2026


B. Local Geology

The Cook Islands include some of the oldest (90–124 Ma) known oceanic seafloor (Müller et al., 2016), compared to a global average oceanic crust age of 64 Ma (Seton et al., 2012). To the northwest, the Manihiki Plateau is dated ~123–124 Ma (Taylor, 2006; Timm et al., 2011) and might be part of a much larger submarine large igneous province that rifted apart shortly after its formation. The plateau has boundary faults and horsts on its northern and eastern sides as well as internal and broadly sub-parallel rift zones (Winterer et al., 1974). Dating of the region is compromised by a lack of detailed seabed magnetic data. Much of the formation formed during the Cretaceous long normal period (124.6–84 Ma).

Volcanic edifices are superimposed onto the seabed geology and include isolated chains of seamounts and knolls as well as more continuous volcanic rises. The chains are in a variety of orientations, but predominantly west-northwest trending and some are interpreted to have resulted from hotspot activity (Wessel and Kroenke, 2008; Jackson et al., 2020). Knolls and seamounts are found on the plateau as well as the abyssal plain, not least in the western Manihiki Plateau.

C. Sediments

Red clay is the dominant sediment in abyssal basins of the South Pacific (Glasby, 1976), described as predominantly zeolite-rich and red-brown pelagic clay, with biogenic silica and carbon increasing with decreasing latitude and at depths above 4,800 m (Heine et al., 2015).

Fine pelagic sediments described as red or brown clay are the predominant sediment type in Area 2. Deposition began during the pre-late Miocene, with the surface sediment likely to be deposited within the last 500 kyr (JICA-MMAJ, 2001). Sub-bottom profiling indicates that abyssal plains are covered by unconsolidated sediments, ≤20 m thick, and rarely exceed 40 m (JICA-MMAJ, 2001).

D. Ocean Currents

Two major oceanic currents supplying well-oxidized bottom water are thought to influence mineralization in the Cook Islands EEZ (Glasby et al., 1986). The westward-flowing Southern Equatorial Current system (Figure 4) is derived from a divergence along the equator that leads to the upwelling of nutrient-rich waters, stimulating high biological productivity. The current system is the northern limb of an anticlockwise-circulating gyre within which the Cook Islands EEZ sits. Biological productivity in the southern part of the Cook Islands EEZ is low (Lutz et al., 2007; Cronan, 2013).

The Antarctic Bottom Water, which flows between the seafloor and ~3,500 m, has been inferred to flow to the northeast along the Aitutaki Passage (Usui, 1983), along the ridge immediately south of the Nova-Canton Trough (Yamazaki, 1992), and around the northeastern margin of the Manihiki Plateau to enter the North Penrhyn Basin. The formation of polymetallic nodules has been attributed to increased flow of the Antarctic Bottom Water during the Paleogene or Cretaceous (Usui, 1994).


LOGO

   AOM AREA-2 S-K 1300 TECHNICAL REPORT SUMMARY               JUNE 21, 2026   19 


LOGO   

AOM AREA-2 S-K 1300 Technical Report Summary


Rev. 06-21-2026


E. Local and Property Geology

Local geology needs to be determined during the first phases of the exploration using the exploration surveying and sampling techniques described below.

1. Mineralization

The mineralization occurs at the water-sediment interface on the seafloor, in the form of polymetallic nodules that are significantly enriched in Co, Ni, and Cu. Locally, a minority component of the nodules occurs within the sediment, up to 30 cm depth. Polymetallic nodules are ubiquitous on the abyssal plains surrounding the Cook Islands, mostly at depths between 4,800 and 5,200 m (Kenex, 2014), in the shape of nodules fields that are continuous on a scale of tens of kilometers, essentially forming 2D deposits that trace the sediment-water interface.

The continuity of the mineralization on a regional scale (10s of km) is one of the main characteristics of this deposit type and a direct result of the factors controlling the mineralization also operating a regional scale. Within areas that are conducive to nodule formation, smaller-scale (several 100s of m) features can be present (e.g. knolls, escarpments, sub-circular depression and grooves) that prevent or negatively influence nodule formation. In general, within the abyssal plains, the areal extent of these smaller-scale features tends to be marginal compared to the areal extent of the nodule field. Because the thickness of the mineralized layer (up to several decimeters) is five orders of magnitude less than the lateral extent of the nodule fields (several 10s of km), no meaningful cross sections can be drafted.

The nodules within rea 2 are dark brown to black and measure up to ~20 cm along their long axis. Nodule shape and size are highly variable across the Project area, ranging from centimeter-sized, irregularly shaped pellets to decimeter-sized spheres and plates. The nodules exhibit concentric layering, with the nucleus often being a ‘foreign’ object (e.g. a shark’s tooth or a piece of pumice).

2. Deposit Type

Polymetallic nodules are hydrogenetic and diagenetic concretions of manganese and ferromanganese oxides with high levels of minor, adsorbed elements, including Co, Ni, Cu, Zn, Ti and other metals.


LOGO

   AOM AREA-2 S-K 1300 TECHNICAL REPORT SUMMARY               JUNE 21, 2026   20 


LOGO   

AOM AREA-2 S-K 1300 Technical Report Summary


Rev. 06-21-2026


Nodules with a relatively high Co grade (>0.26% Co) are found in the central Cook Islands (including the Project area). The higher grades are likely due to a high proportion of hydrogenetic growth, promoting the relative accumulation of Co ions in the oxic vernadite crystal structure (Fe is >13%) and a highly oxygenated bottom water mass (assumed to be the Antarctic Bottom Water). Similar controls on mineralization are described for ferromanganese crusts on seamounts and guyots where Co grades are typically >0.5% and have reported >1% Co (Hein and Morgan, 1999; Hein and Koschinsky, 2014).

In the northeastern Cook Islands, higher Ni and Cu grades are associated with higher primary productivity (surface plankton). Net export of this may have also helped lead to suboxic conditions and higher Ni and Mn grades, similar to those described in the CCZ (Lipton et al., 2016).

VII. EXPLORATION

Polymetallic nodule deposits are fundamentally two-dimensional; the nodules lie on the surface of or partially buried within fine-grained surficial sediments. No drilling is necessary for exploration or subsequent commercial recovery.

A. Exploration Work

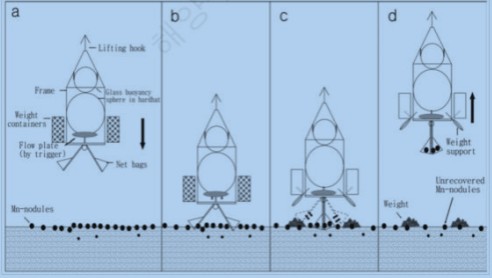
Most of the samples were collected during the JICA program using free fall grab (FFG) samplers. The principal components of FFG samplers are a pair of spring-loaded clamshell net bags for collecting the sample, an air-filled sphere to create buoyancy and containers filled with ballast.

The operation of an FFG sampler is shown schematically in Figure 4. The FFG sampler is released, untethered, over the side of the exploration ship and sinks to the seafloor under the weight of the ballast. When the FFG sampler makes contact with the seafloor ejection of the ballast is triggered which makes the sampler buoyant. As the sampler begins to rise, the clamshell net bags close, capturing the nodules at the land-out point. After it reaches the sea-surface, the FFG sampler is recovered by the boat. FFG samplers are quicker, easier and cheaper to operate for mineral resource samples than box corers (used for biological, geotechnical, mineral and other types of sampling) and so were preferred by the early exploration programs.


LOGO

   AOM AREA-2 S-K 1300 TECHNICAL REPORT SUMMARY               JUNE 21, 2026   21 


LOGO   

AOM AREA-2 S-K 1300 Technical Report Summary


Rev. 06-21-2026


LOGO

Figure 4. Free Fall Grab Sampler (after Lee et al. 2008).

Figure 5 shows the standard layout for use in collecting the FFG samples in the JICA program. Sample locations were collected by different satellite systems for each expedition, with accuracy improving with each survey. Sample locations were determined by the ship’s location during deployment. It is noted that sampling equipment can drift (including tethered sampling methods). Sample location precision is estimated to be in the order of 100–500 m against a sample spacing of ~25 km.


LOGO

Figure 5. Standard Survey Station Layout Conducted by JICA.


LOGO

   AOM AREA-2 S-K 1300 TECHNICAL REPORT SUMMARY               JUNE 21, 2026   22 


LOGO   

AOM AREA-2 S-K 1300 Technical Report Summary


Rev. 06-21-2026


B. Terrain-based Domains

Polymetallic nodule deposits of commercial interest occur on sediment-covered abyssal plains that constitute the vast majority of the Cook Islands deep seafloor. An important aspect of potential future exploration work will be the analysis of the relatively high resolution (compared to GEBCO) bathymetry collected by MBES surveying to distinguish the different components that make up the abyssal plains within Area 2 and to remove from consideration the other facies (e.g. ridges, calderas and other hard substrate or steep slope seafloor) that will not host commercially interesting nodule deposits.

C. Anticipated Exploration Methods

AOM possesses access to exploration equipment. The selection and configuration of this equipment have been undertaken with the intent that ensures that it is not only operationally capable of supporting the full range of planned geophysical, geochemical, and biological investigations within the proposed license areas, but also methodologically aligned with the expectations of U.S. regulators and the international community.

AOM anticipates its exploration and sampling will provide continuity and comparability with legacy U.S. and international datasets. Particular emphasis has been placed on the foundational work of the NOAA Deep Ocean Mining Environmental Study, which established the first systematic environmental baselines for U.S. exploration areas in the CCZ. The equipment and protocols selected by AOM are directly aligned with those earlier methods wherever possible, thereby ensuring that new data can be analyzed within the same interpretive frameworks and contribute to a coherent long-term record of environmental conditions and resource potential.

AOM aims to ensure that its equipment standards are consistent with contemporary international recommendations. AOM guarantees that all data generated will be directly comparable to results submitted by other contemporary explorers for this deep seabed resource, and therefore suitable for integration into shared environmental databases and regional environmental management plans.

The AOM exploration planned toolkit reflects advancements described in recent peer-reviewed literature, particularly in relation to high-resolution multibeam bathymetry (ship-based and from autonomous underwater vehicles), box coring, benthic imaging, and water-column monitoring. By integrating these improvements, AOM anticipates that the proposed exploration program does not merely replicate past efforts but enhances them.


LOGO

   AOM AREA-2 S-K 1300 TECHNICAL REPORT SUMMARY               JUNE 21, 2026   23 


LOGO   

AOM AREA-2 S-K 1300 Technical Report Summary


Rev. 06-21-2026


VIII. SAMPLE PREPARATION, ANALYSIS, AND SECURITY

The Mineral Resource estimate for Area 2 is derived from historical exploration data rather than from samples collected, prepared, or analyzed by or on behalf of AOM. The informing data were generated by the Government of Japan’s systematic seabed mineral exploration of the central South Pacific, the implementation of which was consigned to the Japan International Cooperation Agency (JICA) in cooperation with the Metal Mining Agency of Japan (MMAJ). JICA conducted three expeditions to the Project area aboard the RV Hakurei Maru No. 2 in 1986, 1990, and 2000 (JICA-MMAJ, 2001). The sample-preparation, analytical, and security practices described in this section are accordingly those of the original JICA programs, as documented in the public record and as assessed by the Qualified Persons, who bring direct professional experience with analogous polymetallic-nodule sampling programs; they were neither established nor supervised by AOM. The compilation and validation of the resulting dataset are addressed in Section IX (Data Verification).

The samples informing the estimate were recovered predominantly by free-fall grab (FFG) samplers, with a smaller number recovered by box-core (BC) samplers. The JICA program followed a systematic survey design: stations were established on datum lines spaced at 1° (approximately 111 km) of latitude and longitude, with infill stations on an approximately 39.3-km grid, and three FFG or BC samples were collected at each station in an inverted-triangle pattern with sampling points approximately 2.6 km apart. Nodule abundance (kilograms of nodules per square meter of seafloor) was determined by dividing the recovered nodule mass by the seafloor area subtended by the open jaws of the sampler (approximately 0.25 to 0.5 m²). Because FFG samplers are recognized to recover less than the full nodule complement present at a station, and no upward adjustment has been applied to the data, the abundance values and the tonnages reported in this TRS are, in this respect, conservative. Nodules are hygroscopic and were customarily weighed in the wet state shortly after recovery at sea; the reported metal grades are expressed on a dry-weight basis, the wet-to-dry conversion reflecting an assumed moisture content of approximately 30 percent (a wet-to-dry mass factor of 0.7) following pulverizing and drying of the material at a nominal 110 °C. Contemporaneous descriptions of the specific sample-preparation protocols employed during the JICA programs were not available for review.

The metal assays were performed by recognized methods that varied by expedition. Samples from the 1986 and 1990 cruises were assayed by X-ray fluorescence (XRF) onboard the vessel for copper, cobalt, iron, manganese, and nickel. Samples from the 2000 cruise were analyzed at ALS Chemex (Canada) by inductively coupled plasma emission spectroscopy for an expanded suite of elements comprising copper, cobalt, iron, manganese, nickel, titanium, silicon, aluminum, calcium, sodium, potassium, and phosphorus. To provide a common analytical reference, the United States Bureau of Mines distributed certified nodule reference materials designated “A-1” and “P-1” during the 1970s and 1980s; the JICA analysts obtained sub-samples of these standards in order to


LOGO

   AOM AREA-2 S-K 1300 TECHNICAL REPORT SUMMARY               JUNE 21, 2026   24 


LOGO   

AOM AREA-2 S-K 1300 Technical Report Summary


Rev. 06-21-2026


evaluate the accuracy of their methods. These reference materials were transferred to the United States Geological Survey following the closure of the Bureau in 1996. The standardization of assays against these certified materials provides a recognized basis for evaluating analytical accuracy and inter-program comparability. The individual results of the JICA reference-material tests are not, however, available.

The JICA expeditions were equipped with deep-sea cameras that recorded a photograph of the mineralized seafloor at each station immediately prior to sample collection. This station photography provides an independent visual record of nodule presence and relative abundance at the point of collection — a form of corroboration not available for many legacy nodule datasets — and was relied upon by the Qualified Persons in their assessment of the data.

The samples informing the estimate were collected several decades before the preparation of this TRS, under the sample-security and custody practices of the JICA programs of that era. Contemporaneous records documenting sample-security measures and chain of custody for those programs were not available for review; documentation of sample preparation and security was not available; no original records of the sample collections or survey measurements were located; and no secured or signed certificates for the analytical measurements were available. The quality-assurance and quality-control practices of the historical programs cannot be fully reconstructed. These limitations are inherent to the archival character of the dataset and are disclosed accordingly.

Having weighed the corroborating features of the record — the systematic survey design of the JICA programs; the standardization of assays to USBM certified reference materials; analysis by recognized methods and, for the 2000 cruise, by an established commercial laboratory; the independent station photography; the internal consistency of the results across three expeditions spanning some fourteen years; and the consistency of the data with the broader regional record for the cobalt-rich nodule province of the central South Pacific — against the limitations described above, it is the Qualified Persons’ opinion that the sample-preparation, analytical, and security procedures, as documented, are adequate to support a Mineral Resource estimate for Area 2 at the Inferred confidence level, and at that level only. The disclosed limitations are reflected in the conservative Inferred classification and in the recommendation for confirmatory sampling and exploration set out elsewhere in this TRS. The data-verification steps undertaken by the Qualified Persons, and their opinion on the adequacy of the data for the purposes used under Item 1302(d) of Regulation S-K, are set out in Section IX.


LOGO

   AOM AREA-2 S-K 1300 TECHNICAL REPORT SUMMARY               JUNE 21, 2026   25 


LOGO   

AOM AREA-2 S-K 1300 Technical Report Summary


Rev. 06-21-2026


IX. DATA VERIFICATION

A. Mineral Resources

1. Exploration Data Compilation and Validation

Most of the data were obtained from analysis of free-fall grab sampler recoveries, although a few results from box core recoveries are also included. Abundance (weight of nodules per unit area on the seafloor, (usually with units kg/m2) is estimated simply by dividing the weight of recovered nodules by the surface area covered by the open jaws of the sampler (~0.25 -0.5 m2 coverage). As discussed in Hennigar, Dick and Foell (1986), free-fall grab samplers are the best tools available for the first order assessment of nodule abundance, but they consistently underestimate the actual abundance. No adjustments have been made to the samples or the mineral resource estimation.

Metal content in the samples collected was determined by a variety of methods, including X-ray fluorescence and inductively coupled plasma emission spectroscopy. During the 1970s and 1980s, the U.S. Bureau of Mines distributed standard nodule samples (labeled “A-1” and “P-1”) that had been extensively analyzed by the Bureau and then mixed into a uniform powder.

These standard samples were later transferred to the U.S. Geological Survey after the Bureau closed in 1996. JICA scientists obtained sub-samples of these standards to evaluate the accuracy of their methods. No results of these standard tests are available; however, the scientists responsible for the analysis protocols were able to use state-of-the-art methods to ensure that their results were as accurate as possible.

2. Limitations on and Adequacy of Data Verification

The data underpinning the Area 2 Mineral Resource estimate are historical and could not be re-created through independent re-sampling. The Qualified Persons’ verification therefore comprised the steps available and appropriate for a legacy oceanographic dataset: (i) review of the provenance and methods of the three JICA expeditions described in Section VIII and in “Exploration Data Compilation and Validation” above, including the analytical methods employed (shipboard X-ray fluorescence for the 1986 and 1990 cruises and inductively coupled plasma emission spectroscopy at ALS Chemex (Canada) for the 2000 cruise); (ii) confirmation that the metal assays are referable to the United States Bureau of Mines certified nodule reference materials “A-1” and “P-1,” sub-samples of which the JICA analysts obtained to evaluate analytical accuracy; (iii) examination of the deep-sea station photographs, which provide an independent visual record of nodule presence and relative abundance at the point of collection; (iv) assessment of the internal consistency of the results across the three expeditions, conducted on a systematic survey grid over a period of some fourteen years, and of their consistency with the broader regional record for the cobalt-rich nodule province of the central South Pacific, including the New Zealand


LOGO

   AOM AREA-2 S-K 1300 TECHNICAL REPORT SUMMARY               JUNE 21, 2026   26 


LOGO   

AOM AREA-2 S-K 1300 Technical Report Summary


Rev. 06-21-2026


Oceanographic Institute, CCOP/SOPAC, and Cronan compilations; (v) review of the spatial distribution of the sample stations relative to the resource blocks and of the geostatistical estimation methodology (Empirical Bayesian Kriging on a 500 m grid) applied to the data, as described in Section XI; and (vi) application of the Qualified Persons’ direct professional experience with analogous polymetallic-nodule sampling programs in the Pacific.

The data informing the estimate are historical and were generated by a single national program; their underlying practices could not be independently re-verified by the Qualified Persons. Consistent with the archival character of the data, and as further described in Section VIII, the following documentation was not available for review: documentation of sample preparation and security; original records of the sample collections and survey measurements; and secured or signed certificates for the analytical measurements. The quality-assurance and quality-control practices of the historical programs cannot be fully reconstructed, and the individual results of the JICA tests against the USBM “A-1” and “P-1” reference materials are not available. Sample coverage is limited, and no abundance data are available for the southern subarea (Area 2 South), for which no Mineral Resource is, or can presently be, estimated. Because the abundance data derive substantially from free-fall grab samplers, which are recognized to under-recover nodules, and no upward adjustment has been applied, the reported abundances and tonnages are, in this respect, considered conservative rather than overstated.

Having weighed the verification steps and corroborating features described above against the limitations identified, it is the Qualified Persons’ opinion that the data are adequate for the purposes for which they are used in this TRS — namely, to support a Mineral Resource estimate for Area 2 North at the Inferred confidence level, and at that level only. The basis for this opinion is that the regional continuity characteristic of the polymetallic-nodule deposits of the central South Pacific, taken together with the direct and systematic historical sampling within the property by the JICA program, the standardization of the JICA assays to certified reference materials, the independent station photography, the internal consistency of the multi-expedition record, and its consistency with the broader regional dataset, is sufficient to imply — though not to verify — the geological and grade continuity required for an Inferred classification. The limitations described above, which preclude verification of that continuity and the application of contemporary quality-assurance documentation, are the defining characteristics of an Inferred Mineral Resource under S-K 1300 and are the reason the estimate is confined to that category. Consistent with that classification, no economic or other modifying factors have been applied to the estimate, the estimate has not been used to assess the economic viability of the Project, and the Inferred Mineral Resources are not, and may not be directly converted to, Mineral Reserves. In the Qualified Persons’ opinion, the additional sampling and exploration recommended elsewhere in this TRS — including in-fill sampling, multibeam echosounder bathymetry, and near-seafloor survey — would be required to verify geological and grade continuity and to support any reclassification of part of the Inferred Mineral Resources to a higher confidence category.


LOGO

   AOM AREA-2 S-K 1300 TECHNICAL REPORT SUMMARY               JUNE 21, 2026   27 


LOGO   

AOM AREA-2 S-K 1300 Technical Report Summary


Rev. 06-21-2026


X. MINERAL PROCESSING AND METALLURGICAL TESTING

A. Candidate processing methods

This project is not at a stage where a candidate processing method can be determined.

XI. MINERAL RESOURCE ESTIMATE

A. Key Assumptions, Parameters, and Methods

The AOM Area 2 Mineral Resource estimate includes estimation of nodule wet tonnage and the Mn, Fe, Co, Ni and Cu dry weight percentages within the polymetallic nodule deposits that occur in Area 2. The only modifying factors included are the elimination of seafloor areas with slopes greater than 10° and a cutoff abundance value of 6 kg/m2 below which the samples were not used in the resource estimation. Further exploration with MBES and near-seafloor surveying will be required to identify additional areas where obstacles to mining are smaller than the regional GEBCO maps reveal.

1. Methods

To develop preliminary resource estimates, AOM applied Empirical Bayesian Kriging (EBK), a geostatistical interpolation method suited for sparse but spatially structured datasets. Empirical Bayesian kriging (EBK) is a geostatistical interpolation method that automates the most difficult aspects of building a valid kriging model. Other kriging methods in Geostatistical Analyst require you to manually adjust parameters to receive accurate results, but EBK automatically calculates these parameters through a process of sub-setting and simulations.

Empirical Bayesian kriging also differs from other kriging methods by accounting for the error introduced by estimating the underlying semivariogram. Other kriging methods calculate the semivariogram from known data locations and use this single semivariogram to make predictions at unknown locations; this process implicitly assumes that the estimated semivariogram is the true semivariogram for the interpolation region. By not taking the uncertainty of semivariogram estimation into account, other kriging methods underestimate the standard errors of prediction.

2. Subareas and Block Delineations

EBK was used to generate continuous surfaces of polymetallic nodule abundance (wet weight, kg m-2) and dry-weight metal content for manganese (Mn), cobalt (Co), nickel (Ni), and copper (Cu). A fishnet grid with 500 m spacing between points was inserted into the area, and abundance and metal contents were extracted.


LOGO

   AOM AREA-2 S-K 1300 TECHNICAL REPORT SUMMARY               JUNE 21, 2026   28 


LOGO   

AOM AREA-2 S-K 1300 Technical Report Summary


Rev. 06-21-2026


B. Basis for Establishing the Prospects of Economic Extraction of Mineral Resources

Based on a range of metal prices for the metals contained in the nodules a cutoff grade of 6 kilograms of nodules per square meter (6kg/m2) was chosen as basis for economic extraction.

C. Mineral Resource Classification

Under S-K 1300 to reflect geological confidence, Mineral Resources are subdivided into the following categories based on increased geological confidence: Inferred, Indicated, and Measured, which are defined under S-K 1300 as:

Inferred Mineral Resource is that part of a mineral resource for which quantity and grade or quality are estimated based on limited geological evidence and sampling. The level of geological uncertainty associated with an inferred mineral resource is too high to apply relevant technical and economic factors likely to influence the prospects of economic extraction in a manner useful for evaluation of economic viability. Because an inferred mineral resource has the lowest level of geological confidence of all mineral resources, which prevents the application of the additional modifying factors not quantified in this TRS in a manner useful for evaluation of economic viability, an inferred mineral resource may not be considered when assessing the economic viability of a mining project, and may not be directly converted to a mineral reserve.

Indicated Mineral Resource is that part of a mineral resource for which quantity and grade or quality are estimated based on adequate geological evidence and sampling. The level of geological certainty associated with an indicated mineral resource is sufficient to allow a qualified person to apply modifying factors in sufficient detail to support mine planning and evaluation of the economic viability of the deposit. Because an indicated mineral resource has a lower level of confidence than the level of confidence of a measured mineral resource, an indicated mineral resource may only be converted to a probable mineral reserve.

Measured Mineral Resource is that part of a mineral resource for which quantity and grade or quality are estimated based on conclusive geological evidence and sampling. The level of geological certainty associated with a measured mineral resource is sufficient to allow a qualified person to apply modifying factors in sufficient detail to support detailed mine planning and final evaluation of the economic viability of the deposit. Because a measured mineral resource has a higher level of confidence than the level of confidence of either an indicated mineral resource or an inferred mineral resource, a measured mineral resource may be converted to a proven mineral reserve or to a probable mineral reserve.


LOGO

   AOM AREA-2 S-K 1300 TECHNICAL REPORT SUMMARY               JUNE 21, 2026   29 


LOGO   

AOM AREA-2 S-K 1300 Technical Report Summary


Rev. 06-21-2026


Based on the uncertainty of the QA/QC measures and analytical accuracies associated with the archival abundance and metal content available for this TRS, and the lack of sample density only Inferred Mineral Resources may be defined. The reported Inferred Mineral Resource is located entirely within Area 2 North (Dorado North) and is contingent on resolution of the competing priority of right over that subarea, as described under Mineral Rights.

The reported Inferred Mineral Resource is located entirely within Area 2 North (Dorado North) and is contingent on resolution of the competing priority of right over that subarea; the resource is retained as reported and, pending that resolution, Dorado North is also presented as an area of economic interest, as described under Mineral Rights.

D. Assumptions for Multiple Commodity Mineral Resource Estimate

No metal/mineral equivalents are being used or reported.

E. Mineral Resource Uncertainty Discussion

Mineral Resources are not Mineral Reserves and do not necessarily demonstrate economic viability. There is no certainty that all or any part of this Mineral Resource will be converted into Mineral Reserve.

Inferred Mineral Resources are too speculative geologically to have economic considerations applied to them to enable them to be categorized as mineral reserves.

Mineral Resource estimates may be materially affected by the quality of data, natural geological variability of mineralization and / or metallurgical recovery and the accuracy of the economic assumptions supporting reasonable prospects for economic extraction including metal prices, and mining and processing costs.

The quality of some of the data could not be independently verified. This does not necessarily mean that the data is inaccurate, however, it does increase the level of uncertainty regarding the quality of the data.

The following risks were identified:


Sample coverage is limited.


Uncertainty around QA/QC programs in place for the historic sampling programs.


Original records of the sample collections and survey measurements are not available.


Secured and signed certificates were not available for analytical measurements.


LOGO

   AOM AREA-2 S-K 1300 TECHNICAL REPORT SUMMARY               JUNE 21, 2026   30 


LOGO   

AOM AREA-2 S-K 1300 Technical Report Summary


Rev. 06-21-2026


Additional sampling and exploration to address the aforementioned points, will allow the evaluation and possible recategorization of part of the Mineral Resources from Inferred to Indicated.

Mineral Resources may also be affected by the estimation methodology and parameters and assumptions used in the grade estimation process including top-cutting (capping) of data or search and estimation strategies although it is the QP’s opinion that there is a low likelihood of this having a material impact on the Mineral Resource estimate.

Table 6 shows Mineral Resource estimate based on the above-described sources, assumptions, and methods. It is not possible to estimate the extent and tonnage in Area 2 South because no abundance estimates are available. Nodule abundance estimates are customarily listed as “wet” because the minerals are very hygroscopic and the samples are usually weighed soon after recovery at sea. In practice, the nodules lose about 6% of their weight within a few days or weeks, depending on whether they are in sealed sample containers, the temperature, and ambient humidity. The normal conversion to determine tonnage estimates is to multiply the wet weight by 0.7, which is the average weight difference after the nodules have been pulped and dried at 110°C for a few hours.

Table 6. Inferred Mineral Resources AOM Area 2


Area 2 North

   Total
Area
Km2
     Mineralized
km2*
     Mt Wet
Nodules
     Avg. Dry Weight %  
   Mn      Co      Ni      Cu  
     56,509        40,235        586        15.9        0.417        0.36        0.21  

* km2 with Abundance > 6 kg/m2 and seafloor slope < 10°. 3


3 

The mineralization reported in this table is classified as an Inferred Mineral Resource — the lowest confidence category under S-K 1300 — and is estimated from historical exploration data of limited sampling density. An Inferred Mineral Resource has a high degree of geological uncertainty, may not have economic or other modifying factors applied to it, may not be used to assess the economic viability of a mining project, and may not be directly converted to a mineral reserve. The reported resource is located entirely within Area-2 North (Dorado North). AOM does not currently hold an exploration license or commercial recovery permit for the property, and AOM does not hold the first priority of right over Area-2 North (Dorado North), whose priority of right has been established by an earlier-filed applicant as described in this report; the reported resource is therefore subject to the resolution of competing priority, to licenses being granted (i.e., to the issuance of the necessary regulatory authorizations), and to confirmatory exploration. No assurance can be given that any license or permit will be granted.


LOGO

   AOM AREA-2 S-K 1300 TECHNICAL REPORT SUMMARY               JUNE 21, 2026   31 


LOGO   

AOM AREA-2 S-K 1300 Technical Report Summary


Rev. 06-21-2026


F. Qualified Person’s Opinion on Factors that are Likely to Influence the Prospect of Economic Extraction

It is the QP’s opinion that the Mineral Resource Estimate is representative of the informing data and that the data are of sufficient quality to support this Mineral Resource Estimate to an Inferred confidence level.

Future Mineral Resource Estimates may be materially impacted from changes in geological knowledge as a result of new exploration data. Because the reported resource lies entirely within Area 2 North (Dorado North), over which AOM does not hold the first priority of right, the resolution of that competing priority of right is a factor likely to influence the prospect of economic extraction, as described under Mineral Rights.

XII. MINERAL RESERVE ESTIMATES

The project is not at a stage where Mineral Reserve can be estimated.

XIII. MINING METHODS

The project is not at stage where the mining method has been determined.

XIV. PROCESSING AND RECOVERY METHODS

The project is not at stage where the processing and recovery methods have been determined. Infrastructure

XV. INFRASTRUCTURE

The project is not at the stage where required infrastructure can be determined.

XVI. MARKET STUDIES

The project is not at the stage where market studies are needed


LOGO

   AOM AREA-2 S-K 1300 TECHNICAL REPORT SUMMARY               JUNE 21, 2026   32 


LOGO   

AOM AREA-2 S-K 1300 Technical Report Summary


Rev. 06-21-2026


XVII. ENVIRONMENTAL STUDIES, PERMITTING, AND PLANS, NEGOTIATIONS, OR AGREEMENTS WITH LOCAL INDIVIDUALS OR GROUPS

To obtain an exploration license, NOAA the regulatory body must have a complete administrative record showing that the applicant is eligible and that the proposed exploration plan is environmentally and operationally responsible. Although the exact required “shape” of the submittal depends on NOAA’s implementing text, the substantive elements NOAA expects (and has historically required) include: the applicant’s eligibility and corporate structure; delineation of the requested license area; the detailed exploration plan of work and schedule; the technical capability to conduct exploration and any test mining; the environmental baseline and monitoring plan for exploration activities; safety and pollution prevention controls; and evidence of financial responsibility.


LOGO

   AOM AREA-2 S-K 1300 TECHNICAL REPORT SUMMARY               JUNE 21, 2026   33 


LOGO   

AOM AREA-2 S-K 1300 Technical Report Summary


Rev. 06-21-2026


XVIII. CAPITAL AND OPERATING COSTS

The project is not at the stage where Capital and Operating Costs can be estimated.

XIX. ECONOMIC ANALYSIS

The project is not at a stage that Economic Analysis would be appropriate

XX. ADJACENT PROPERTIES

Area 2 North and South are separated by a buffer of approximately 10 nautical miles from any nearby jurisdictions:4


Area 2 North is surrounded by the Line Islands (Kiribati) EEZ to the northeast, the Tahiti (France) EEZ to the east, and the Cook Islands EEZ to the south, west, and northwest.


Area 2 South is near to the Cook Islands EEZ on the north.

XXI. OTHER RELEVANT DATA AND INFORMATION

It is the opinion of the QP that relevant material and information has been stated in the above sections of this TRS.

XXII. INTERPRETATION AND CONCLUSIONS

The Mineral Resource estimates provided based on historic data should be considered an Inferred Mineral Resource.


Geological and deposit related knowledge has been appropriately used to develop the mineral resource estimation.


The geological data used is considered reasonably reliable, representative and is fit for purpose in developing this Mineral Resource Estimate. It is believed further exploration will improve the confidence of the Mineral Resource Estimate.


Area 2 is in a region of the South Pacific near the Cook Islands EEZ and the Penrhyn Basin that has proven to have high grades and abundance values.

 
4 

https://isa.org.jm/exploration-contracts/polymetallic-nodules/


LOGO

   AOM AREA-2 S-K 1300 TECHNICAL REPORT SUMMARY               JUNE 21, 2026   34 


LOGO   

AOM AREA-2 S-K 1300 Technical Report Summary


Rev. 06-21-2026


Geological interpretation and estimating methodology is appropriate for the style of mineralization and data available to AOM.


The lack of documented QA/QC programs limit the confidence of the estimation results and that have been considered during the classification of the mineral resources resulting in an Inferred Mineral Resource.

The Inferred Resource category assigned to the Mineral Resource estimate reflects the confidence of the estimate as described above. Inferred resources have a high level of geological uncertainty and therefore cannot support the use of additional modifying factors required to convert Mineral Resources into Mineral Reserves.

XXIII. RECOMMENDATIONS REGARDING MINERAL RESOURCES


Secure exploration license for Area 2.


Plan and execute an exploration program. The program should aim to:


Construct updated procedures that describe in sufficient detail the activities of capture, administration, and backup of current and future data.


Improve the local geological knowledge of the deposit to better understand the geological controls on mineralization and include them in future updates of the geological models. This information should be included in future updates of the geological model as well as in grade estimation.


Meet requirements of DHSRMA


Refine the geological model should by interpreting the local lithological units.


Design and implement a samples (pulps) reanalysis campaign with an appropriate QA/QC program, and based on the results obtained,


Maintain an in-situ deposit and recovered sample photo library for all sampling campaigns going forward.


Maintain original and/or digitized records of all survey and sample data in a secure database.


Analysis and testing of samples should be completed by a reputable, and preferably ISO-accredited laboratory, qualified for the element or material to be analyzed or tested. All analytical or other test results should be supported by duly signed certificates or reports issued by the laboratory or testing facility and should be accompanied by a statement of the methods used.


Conduct replicate sampling at representative stations to confirm the existing nugget variability.


LOGO

   AOM AREA-2 S-K 1300 TECHNICAL REPORT SUMMARY               JUNE 21, 2026   35 


LOGO   

AOM AREA-2 S-K 1300 Technical Report Summary


Rev. 06-21-2026


Continue with infill sampling and photo transects to improve the Mineral Resource confidence and categorization.


Design and complete increasing scales of metallurgical development and testing.


Design and complete small and then commercial scale mineral recovery tests.


Complete additional geotechnical programs to support the development of efficient mineral recovery technologies.


Geotechnical, metallurgy and detailed local geology should be incorporated into future exploration programs to inform and develop detailed studies that could potential justify progressing the project to commercial production.


LOGO

   AOM AREA-2 S-K 1300 TECHNICAL REPORT SUMMARY               JUNE 21, 2026   36 


LOGO   

AOM AREA-2 S-K 1300 Technical Report Summary


Rev. 06-21-2026


XXIV. REFERENCES

Anufriev, G.S. and Boltenkov, B.S., 2007. Ferromanganese nodules of the Baltic Sea: composition, helium isotopes, and growth rate. Lithology and Mineral Resources, 42(3), pp.240-245.

Boström, K., Wiborg, L. and Ingri, J., 1982. Geochemistry and origin of ferromanganese concretions in the Gulf of Bothnia. Marine Geology, 50(1-2), pp.1-24.

Cronan, D.A., 2013. The distribution, abundance, composition and resource potential of the manganese nodules in the Cook Islands exclusive economic zone. Cook Islands Seabed Minerals Authority. Report, 1.

Glasby, G.P., 1976. Manganese nodules in the South Pacific: A review. New Zealand journal of geology and geophysics, 19(5), pp.707-736.

Glasby, G.P., 1986. Marine minerals in the Pacific. Oceanogr Mar Biol Ann Rev, 24, pp.11-64.

Glasby, G.P., Bäcker, H., Meylan, M.A., McDougall, J.C. and Singleton, R.J., 1974. Extensive manganese nodule province discovered in the Southwest Pacific near New Zealand. Meerestechnik-Marine Technology (Germany, FR), 5(5).

Heine, C., Yeo, L.G. and Müller, R.D., 2015. Evaluating global paleoshoreline models for the Cretaceous and Cenozoic. Australian Journal of Earth Sciences, 62(3), pp.275-287.

Jackson, M.G., Halldórsson, S.A., Price, A., Kurz, M.D., Konter, J.G., Koppers, A.A.P. and Day, J.M.D., 2020. Contrasting old and young volcanism from Aitutaki, Cook Islands: implications for the origins of the cook–austral volcanic chain. Journal of Petrology, 61(3), p.egaa037.

JICA-MMAJ, 2001, Report On The Cooperative Study Project On The Deepsea Mineral Resources In Selected Offshore Area of the SOPAC Region (Volume 1), Sea Area Of The Cook Islands February 9, 2001 Japan International Cooperation Agency, Metal Mining Agency Of Japan

Krishnaswami, S., Mangini, A., Thomas, J.H., Sharma, P., Cochran, J.K., Turekian, K.K. and Parker, P.D., 1982. 10Be and Th isotopes in manganese nodules and adjacent sediments: nodule growth histories and nuclide behavior. Earth and Planetary Science Letters, 59(2), pp.217-234.

Kuhn, T., Wegorzewski, A., Rühlemann, C. and Vink, A., 2017. Composition, formation, and occurrence of polymetallic nodules. In Deep-sea mining: Resource potential, technical and environmental considerations (pp. 23-63). Cham: Springer International Publishing.

Lee, G.C, Kim, J., Chi, S.B., Ko, Y.T and Ham, D.J., 2008. Examination for correction factor for manganese nodule abundance using the free fall grab and box corer. The Sea: Journal of the Korean Society of Oceanography, Vol 13, No. 3 pp 280-285.

Manheim, F.T. 1978, Book review of G. P. Glasby, Marine Manganese Deposits, in Geochemica et Cosmochimica Acta 42(5), p 541


LOGO

   AOM AREA-2 S-K 1300 TECHNICAL REPORT SUMMARY               JUNE 21, 2026   37 


LOGO   

AOM AREA-2 S-K 1300 Technical Report Summary


Rev. 06-21-2026


Mero, J.L. 1965, The Mineral Resources of the Sea. Elsevier, Amsterdam, 312 p

Monget, J.M., 2015. The NeoNodule Project-A Summary. ResearchGate.

Morgan, C.L, 1999, “Resource Estimates of the Clarion-Clipperton Manganese Nodule Deposits” Invited chapter in Cronan, D. S. (ed) Handbook of Marine Mineral Deposits, CRC Publishers, LLC,1999, p. 145-170.

Müller, R.D., Seton, M., Zahirovic, S., Williams, S.E., Matthews, K.J., Wright, N.M., Shephard, G.E., Maloney, K.T., Barnett-Moore, N., Hosseinpour, M. and Bower, D.J., 2016. Ocean basin evolution and global-scale plate reorganization events since Pangea breakup. Annual Review of Earth and Planetary Sciences, 44(1), pp.107-138.

Murray, J. and Renard, A.F. 1891. Report on deep-sea deposits based on the specimens collected during the voyage of HMS Challenger in the years 1872 to 1876. Challenger Reports, 525 p.

Parianos, J.M., 2021, Geology of the Clarion-Clipperton Zone: Fundamental Attributes in Polymetallic Nodule Resource Development, PhD Thesis, University of Évora - Institute for Research and Advanced Training, Portugal, 662 p.

Seton, M., Müller, R. D., Zahirovic, S., Williams, S., Wright, N. M., Cannon, J., et al. 2020. A global data set of present-day oceanic crustal age and seafloor spreading parameters. Geochemistry, Geophysics, Geosystems, 21, e2020GC009214. https://doi.org/10.1029/2020GC009214

Smith, A.J., 1990. FCF Earney Marine Mineral Resources. London and New York (Routledge, Chapman and Hall Ltd.), 1990. xxiv+ 387 pp., 94 figs. Price£ 65.00. Mineralogical Magazine, 54(377), pp.677-677.

Taylor, A.J., 2016. The essence of a few disaster stress/trauma studies.

Timm, C., Hoernle, K., Werner, R., Hauff, F., van den Bogaard, P., Michael, P., Coffin, M.F. and Koppers, A., 2011. Age and geochemistry of the oceanic Manihiki Plateau, SW Pacific: New evidence for a plume origin. Earth and Planetary Science Letters, 304(1-2), pp.135-146.

Usui, A. and Ito, T., 1994. Fossil manganese deposits buried within DSDP/ODP cores, Legs 1–126. Marine Geology, 119(1-2), pp.111-136.

Usui, A., 1983. Regional variation of manganese nodule facies on the Wake-Tahiti Transect: morphological, chemical and mineralogical study. Marine geology, 54(1-2), pp.27-51.

Wegorzewski, A.V., Grangeon, S., Webb, S.M., Heller, C. and Kuhn, T., 2020. Mineralogical transformations in polymetallic nodules and the change of Ni, Cu and Co crystal-chemistry upon burial in sediments. Geochimica et Cosmochimica Acta, 282, pp.19-37.


LOGO

   AOM AREA-2 S-K 1300 TECHNICAL REPORT SUMMARY               JUNE 21, 2026   38 


LOGO   

AOM AREA-2 S-K 1300 Technical Report Summary


Rev. 06-21-2026


Wegorzewski, A.V., Kuhn, T., Dohrmann, R., Wirth, R. and Grangeon, S., 2015. Mineralogical characterization of individual growth structures of Mn-nodules with different Ni+ Cu content from the central Pacific Ocean. American Mineralogist, 100(11-12), pp.2497-2508.

Wessel, P. and Kroenke, L.W., 2008. Pacific absolute plate motion since 145 Ma: An assessment of the fixed hot spot hypothesis. Journal of Geophysical Research: Solid Earth, 113(B6).

Winterer, E.L., Lonsdale, P.F., Matthews, J.L. and Rosendahl, B.R., 1974, October. Structure and acoustic stratigraphy of the Manihiki Plateau. In Deep Sea Research and Oceanographic Abstracts (Vol. 21, No. 10, pp. 793-813). Elsevier.

Yamazaki, T., 1992. Water content of surface sediments in the south of the Nova-Canton Trough, Central Equatorial Pacific (GH82-4 AREA): relevance to acquisition of depositional remanent magnetization. Geol. Survey of Japan Cruise Report, 22, pp.127-133.


LOGO

   AOM AREA-2 S-K 1300 TECHNICAL REPORT SUMMARY               JUNE 21, 2026   39 


LOGO   

AOM AREA-2 S-K 1300 Technical Report Summary


Rev. 06-21-2026


XXV. RELIANCE ON INFORMATION PROVIDED BY THE REGISTRANT

In preparing this report the QPs have relied on information provided by the registrant AOM, not previously acknowledged relating to the regarding the following aspects:


Legal and Governmental factors and matters outside the expertise of the QPs, such as statutory and regulatory interpretations Sections 3 and 19.

The QPs consider it is reasonable to rely upon the information provided by the registrant in respect of the above factors as the registrant employs specialist personnel in these areas who have access to information to which the QPs do not.


LOGO

   AOM AREA-2 S-K 1300 TECHNICAL REPORT SUMMARY               JUNE 21, 2026   40