First Citizens BancShares, Inc. Third Quarter 2025 Earnings Conference Call October 23, 2025 DRAFT Data as of 10/17/2025 and contains Restricted Data
2 Agenda Pages Section I – Third Quarter Overview & Strategic Priorities 4 – 6 Section II – Third Quarter 2025 Financial Results 7 – 26 Financial Highlights 8 – 9 Earnings Highlights 10 Net interest income, margin and betas 11 – 13 Noninterest income and expense 14 – 15 Balance Sheet Highlights 16 Loans and Leases 17 – 18 Deposits 19 – 20 SVB Commercial Segment Trends 21 Funding Mix 22 Credit Quality Trends and Allowance 23 – 24 Capital & Share Repurchase Plan Update 25 – 26 Section III – Financial Outlook 27 – 28 Section IV – Appendix 29 – 45 Section V – Non-GAAP Reconciliations 46 – 55 Agenda to be updated in subsequent draft once the materials are finalized. Please do not review
3 Forward Looking Statements This presentation contains “forward-looking statements” within the meaning of the Private Securities Litigation Reform Act of 1995 regarding the financial condition, results of operations, business plans, asset quality, future performance, and other strategic goals of BancShares. Words such as “anticipates,” “believes,” “estimates,” “expects,” “predicts,” “forecasts,” “intends,” “plans,” “projects,” “targets,” “designed,” “could,” “may,” “should,” “will,” “potential,” “continue,” “aims” or other similar words and expressions are intended to identify these forward-looking statements. These forward-looking statements are based on BancShares’ current expectations and assumptions regarding BancShares’ business, the economy, and other future conditions. Because forward-looking statements relate to future results and occurrences, they are subject to inherent risks, uncertainties, changes in circumstances and other factors that are difficult to predict. Many possible events or factors could affect BancShares’ future financial results and performance and could cause actual results, performance or achievements of BancShares to differ materially from any anticipated results expressed or implied by such forward-looking statements. Such risks and uncertainties include, among others, general competitive, economic (including the imposition of tariffs or trade barriers on trading partners), political (including impacts of the U.S. government shutdown), geopolitical events (including conflicts in Ukraine and the Middle East), natural disasters and market conditions, including changes in competitive pressures among financial institutions and the impacts related to or resulting from previous bank failures, the risks and impacts of future bank failures and other volatility in the banking industry, public perceptions of our business practices, including our deposit pricing and acquisition activity, the financial success or changing conditions or strategies of BancShares’ vendors or customers, including changes in demand for deposits, loans and other financial services, fluctuations in interest rates, changes in the quality or composition of BancShares’ loan or investment portfolio, actions of government regulators, including interest rate decisions by the Board of Governors of the Federal Reserve Board (the “Federal Reserve”), changes to estimates of future costs and benefits of actions taken by BancShares, BancShares’ ability to maintain adequate sources of funding and liquidity, the potential impact of decisions by the Federal Reserve on BancShares’ capital plans, adverse developments with respect to U.S. or global economic conditions, including significant turbulence in the capital or financial markets, the impact of any sustained or elevated inflationary environment, the impact of any cyberattack, information or security breach, the impact of implementation and compliance with current or proposed laws (including the 2025 U.S. budget reconciliation legislation), regulations and regulatory interpretations, including potential increased regulatory requirements, limitations, and costs, such as FDIC special assessments, increases to FDIC deposit insurance premiums and the proposed interagency rule on regulatory capital, along with the risk that such laws, regulations and regulatory interpretations may change, the availability of capital and personnel, and the risks associated with BancShares’ previous acquisition transactions, including the pending acquisition of 138 branches from BMO Bank N.A., or any future transactions. BancShares’ share repurchase program (“share repurchase program”, “share repurchase plan” or “SRP”) announced in 2025 allows BancShares to repurchase shares of its Class A common stock through 2026. BancShares is not obligated under the 2025 SRP to repurchase any minimum or particular number of shares, and repurchases may be suspended or discontinued at any time (subject to the terms of any Rule 10b5-1 plan in effect) without prior notice. The authorization to repurchase Class A common stock will be utilized at management’s discretion. The actual timing and amount of Class A common stock that may be repurchased under the 2025 SRP will depend on a number of factors, including the terms of any Rule 10b5-1 plan then in effect, price, general business and market conditions, regulatory requirements, and alternative investment opportunities or capital needs. Except to the extent required by applicable laws or regulations, BancShares disclaims any obligation to update forward-looking statements or to publicly announce the results of any revisions to any of the forward-looking statements included herein to reflect future events or developments. Additional factors which could affect the forward-looking statements can be found in BancShares’ Annual Report on Form 10-K for the fiscal year ended December 31, 2024 (the “2024 Form 10-K”) and its other filings with the SEC. Non-GAAP Measures Certain measures in this presentation, including those referenced as “adjusted” or “excluding PAA,” are “non-GAAP,” meaning they are numerical measures of BancShares’ financial performance, financial position or cash flows that are not presented in accordance with generally accepted accounting principles in the U.S. (“GAAP”) because they exclude or include amounts or are adjusted in some way so as to be different than the most direct comparable measures calculated and presented in accordance with GAAP in BancShares’ statements of income, balance sheets or statements of cash flows and also are not codified in U.S. banking regulations currently applicable to BancShares. BancShares management believes that non-GAAP financial measures, when reviewed in conjunction with GAAP financial information, can provide transparency about or an alternative means of assessing its operating results, financial position or cash flows to its investors, analysts and management. These non-GAAP measures should be considered in addition to, and not superior to or a substitute for, GAAP measures. Each non-GAAP measure is reconciled to the most comparable GAAP measure in the non-GAAP reconciliation in Section V of this presentation. Certain financial results referenced as “Adjusted” in this presentation exclude notable items. The Adjusted financial measures are non-GAAP. Refer to Section V of this presentation for a reconciliation of Non-GAAP financial measures to the most directly comparable GAAP measure. Reclassifications In certain instances, amounts reported for prior periods in this investor presentation have been reclassified to conform to the current financial statement presentation. Such reclassifications had no effect on previously reported stockholders’ equity or net income. Segment Reclassifications BancShares modified its segment reporting during the first quarter of 2025 as we transferred certain components from the SVB Commercial and General Bank segments to the Commercial Bank segment and modified our segment expense allocation methodology. The segment reporting updates did not result in the addition or removal of any of our existing segments at December 31, 2024, and the global fund banking and investor dependent loan portfolios, as well as a substantial portion of the innovation commercial and industrial (“innovation C&I”) and cash flow dependent loan portfolios, remain in the SVB Commercial segment. Segment disclosures for 2024 periods included in this presentation were recast to conform with the above described segment reporting changes. The methodologies that we use to allocate items among our segments are dynamic and may be updated periodically to reflect enhanced expense base allocation drivers, changes in the risk profile of a segment or changes in our organizational structure. Accordingly, financial results may be revised periodically to reflect these enhancements. Class Reclassifications During the second quarter of 2025, the loan classes which were reported in the SVB portfolio in the 2024 Form 10-K, were recast to the Commercial portfolio (the “2025 Loan Class Changes”) as summarized below. • Global fund banking remained a separate loan class, but is reported as a component of the Commercial portfolio. • Investor dependent–early stage and investor dependent–growth stage were combined into a single investor dependent loan class, which is reported as a component of the Commercial portfolio. • Cash flow dependent and innovation C&I was combined with the commercial and industrial loan class, which is reported as a component of the Commercial portfolio. Loan and leases for all periods presented in this presentation were recast to reflect the 2025 Loan Class Changes. The segment information in this presentation was not recast as a result of the 2025 Loan Class Changes because the composition of reportable segments is separate and distinct from the identification of loan classes. Important Notices To be updated in subsequent draft by internal and external legal. Please do not review
Third Quarter Overview & Strategic Priorities Section I
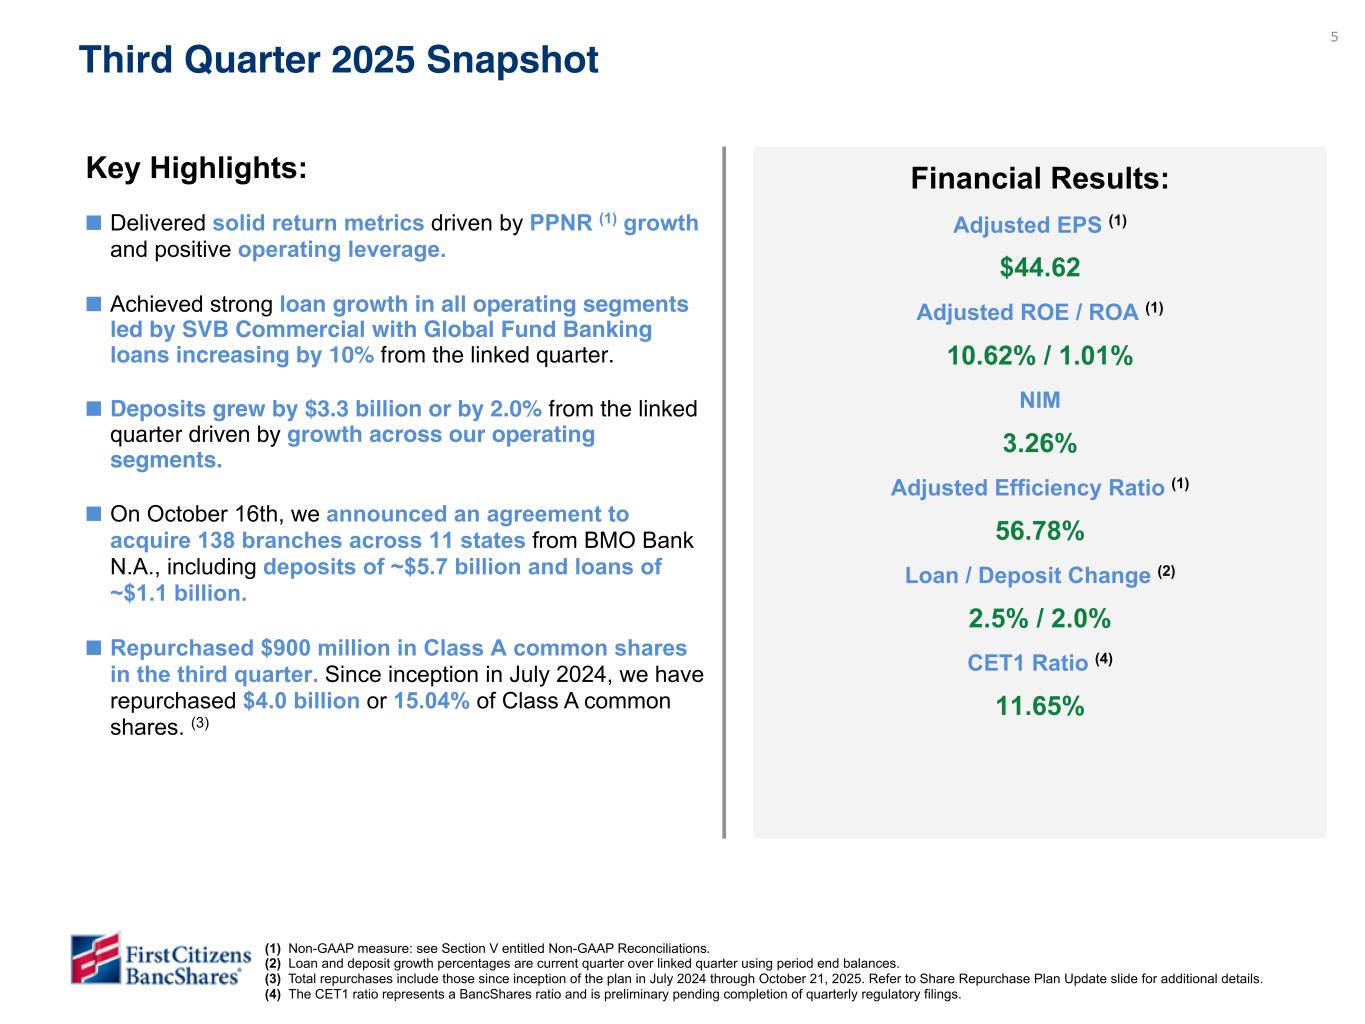
5 Third Quarter 2025 Snapshot Key Highlights: ■ Delivered solid return metrics driven by PPNR (1) growth and positive operating leverage. ■ Achieved strong loan growth in all operating segments led by SVB Commercial with Global Fund Banking loans increasing by 10% from the linked quarter. ■ Deposits grew by $3.3 billion or by 2.0% from the linked quarter driven by growth across our operating segments. ■ On October 16th, we announced an agreement to acquire 138 branches across 11 states from BMO Bank N.A., including deposits of ~$5.7 billion and loans of ~$1.1 billion. ■ Repurchased $900 million in Class A common shares in the third quarter. Since inception in July 2024, we have repurchased $4.0 billion or 15.04% of Class A common shares. (3) Financial Results: Adjusted EPS (1) $44.62 Adjusted ROE / ROA (1) 10.62% / 1.01% NIM 3.26% Adjusted Efficiency Ratio (1) 56.78% Loan / Deposit Change (2) 2.5% / 2.0% CET1 Ratio (4) 11.65% (1) Non-GAAP measure: see Section V entitled Non-GAAP Reconciliations. (2) Loan and deposit growth percentages are current quarter over linked quarter using period end balances. (3) Total repurchases include those since inception of the plan in July 2024 through October 21, 2025. Refer to Share Repurchase Plan Update slide for additional details. (4) The CET1 ratio represents a BancShares ratio and is preliminary pending completion of quarterly regulatory filings. Data highlighted in yellow subject to change. To be finalized in subsequent draft Craig - Do we want to highlight growth at all here since it wasn’t a positive story? We don’t have it in for now but traditionally have a bullet on this page re loans/deposits. Key Highlights: ■ Delivered solid financial results driven by PPNR (1) growth and positive credit performance. ■ Capital and liquidity positions remained strong, with the CET1 ratio (2) ending the quarter at 11.65% and total liquid assets of $61.9 billion. ■ Completed the $3.5 billion 2024 share repurchase plan and repurchased an additional $900 million in Class A common shares in the third quarter under the 2025 plan, bringing total repurchases since plan inception to $4.0 billion (15.04% of Class A common). (3) ■ Announced an agreement to acquire 138 branches located in 11 states from BMO Bank, N.A. bringing our high-touch service and deep sector expertise to clients and communities nationwide while also enabling us to further enhance our liquidity position to support strategic initiatives. ■ Vice Chairwoman and Head of the General Bank, Hope Bryant, was named to the American Banker’s 2025 list of the “Most Powerful Women in Banking” underscoring her leadership and vision, which help drive our success and industry leadership.
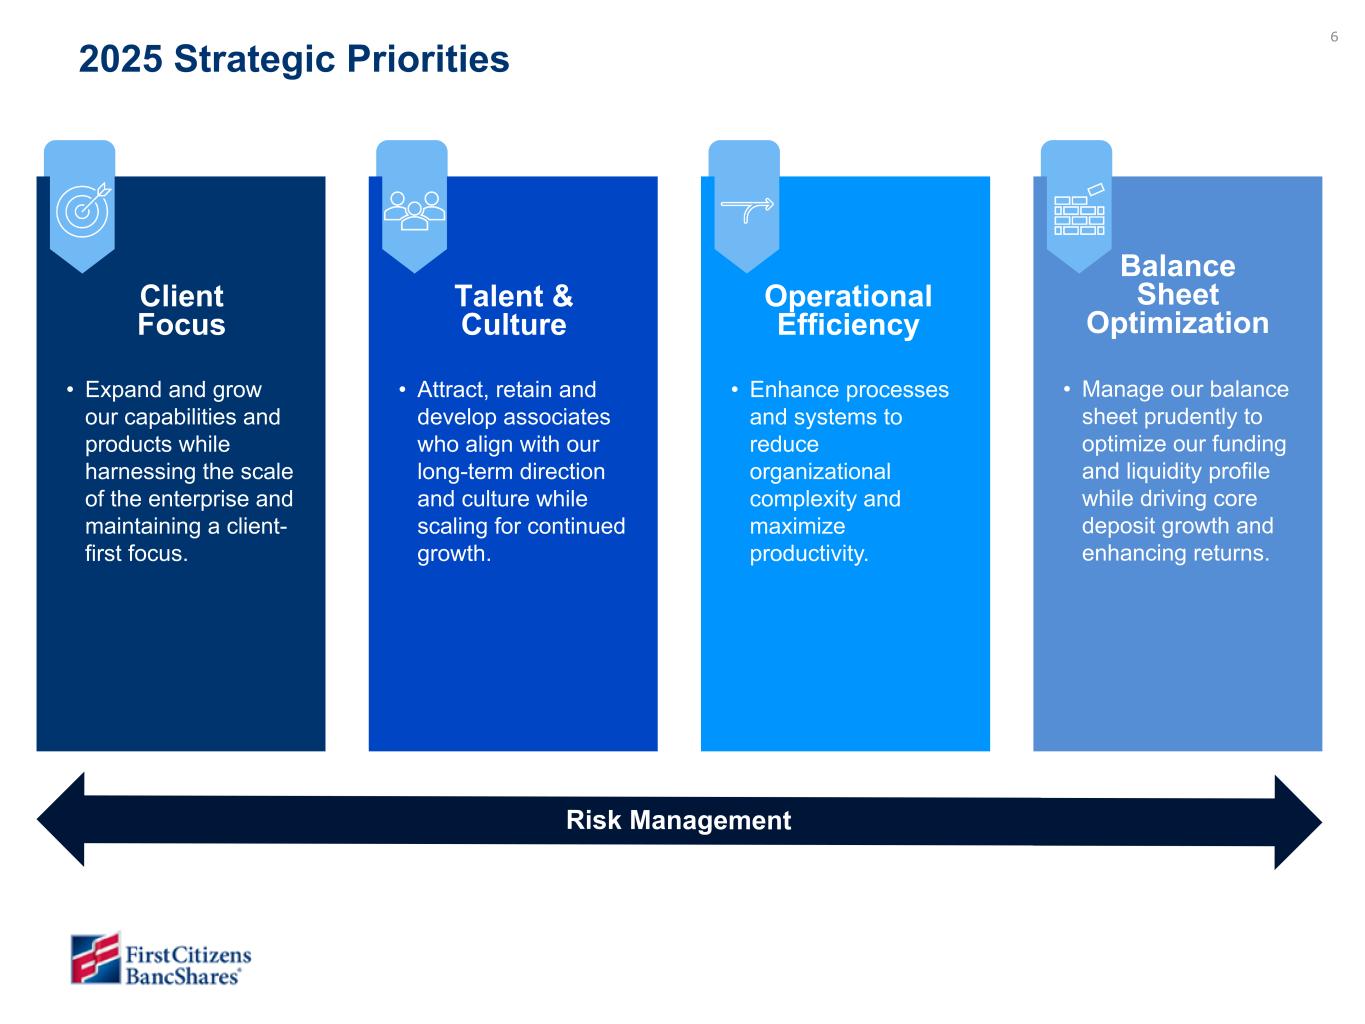
6 2025 Strategic Priorities • Expand and grow our capabilities and products while harnessing the scale of the enterprise and maintaining a client- first focus. Client Focus • Attract, retain and develop associates who align with our long-term direction and culture while scaling for continued growth. Talent & Culture • Enhance processes and systems to reduce organizational complexity and maximize productivity. Operational Efficiency • Manage our balance sheet prudently to optimize our funding and liquidity profile while driving core deposit growth and enhancing returns. Balance Sheet Optimization Risk Management
Third Quarter 2025 Financial Results Section II
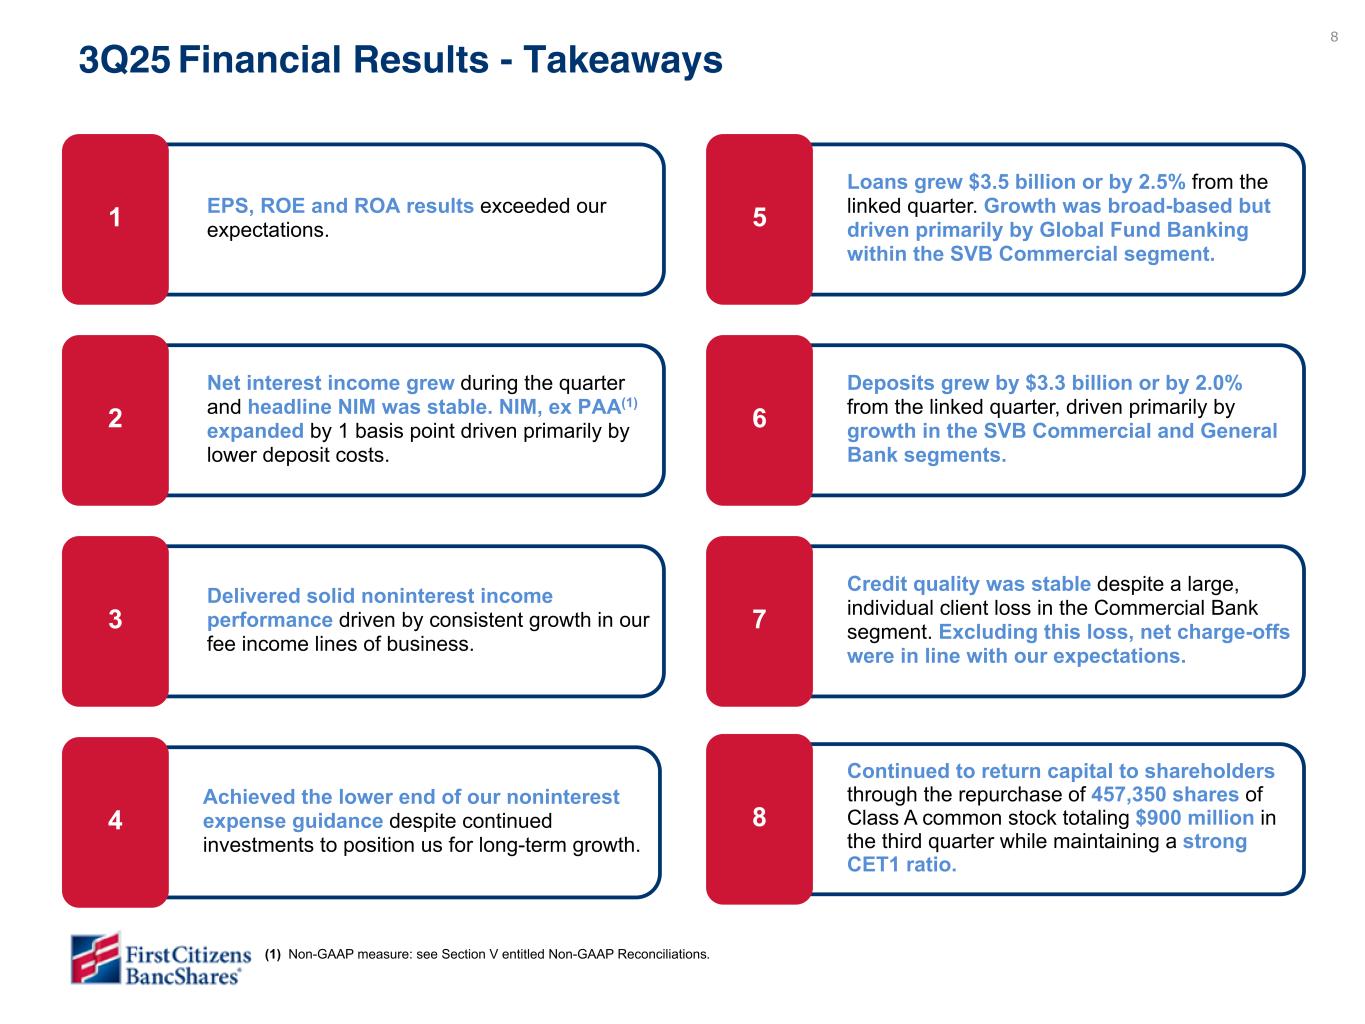
8 3Q25 Financial Results - Takeaways EPS, ROE and ROA results exceeded our expectations. 1 Credit quality was stable despite a large, individual client loss in the Commercial Bank segment. Excluding this loss, net charge-offs were in line with our expectations. 7 Deposits grew by $3.3 billion or by 2.0% from the linked quarter, driven primarily by growth in the SVB Commercial and General Bank segments. 6 Net interest income grew during the quarter and headline NIM was stable. NIM, ex PAA(1) expanded by 1 basis point driven primarily by lower deposit costs. 2 Delivered solid noninterest income performance driven by consistent growth in our fee income lines of business. 3 Loans grew $3.5 billion or by 2.5% from the linked quarter. Growth was broad-based but driven primarily by Global Fund Banking within the SVB Commercial segment. 5 While NII declined during the quarter as anticipated, it was aligned with our expectations. 1 Continued to maintain strong CET1 ratio while repurchasing $613 million in Class A common shares during 3Q25, bringing total repurchases since plan inception to $4.0 billion. 7 Credit quality remained stable, with no emerging problems outside of pressure points previously disclosed in the investor dependent, general office, and equipment finance portfolios. 6 Delivered solid noninterest income performance driven primarily by our Rail and commercial banking segments. 2 Continued to invest in talent, technology and risk infrastructure while realizing the lower end of our noninterest expense guidance. 3 Deposits grew by $3.3 billion or by 2.0% over the linked quarter exceeding our guidance, driven by growth in all of our operating segments. 5 Achieved broad-based loan growth in all of our operating segments, with balances up $3.5 billion or by 2.5% over the linked quarter. 4 Achieved the lower end of our noninterest expense guidance despite continued investments to position us for long-term growth. 4 (1) Non-GAAP measure: see Section V entitled Non-GAAP Reconciliations. Continued to return capital to shareholders through the repurchase of 457,350 shares of Class A common stock totaling $900 million in the third quarter while maintaining a strong CET1 ratio. 8
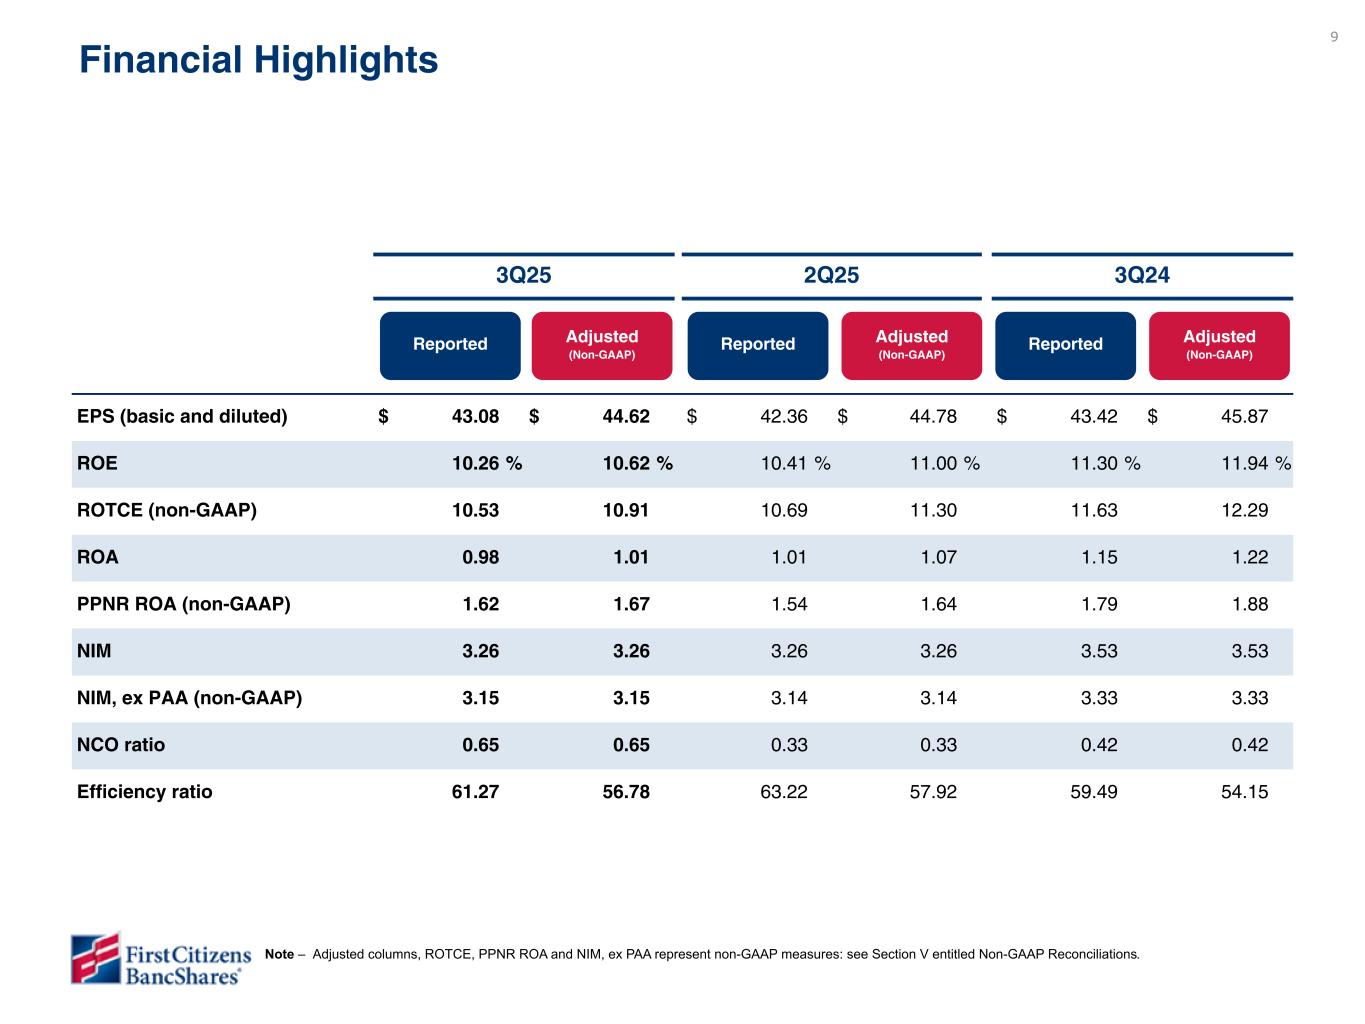
9 3Q25 2Q25 3Q24 EPS (basic and diluted) $ 43.08 $ 44.62 $ 42.36 $ 44.78 $ 43.42 $ 45.87 ROE 10.26 % 10.62 % 10.41 % 11.00 % 11.30 % 11.94 % ROTCE (non-GAAP) 10.53 10.91 10.69 11.30 11.63 12.29 ROA 0.98 1.01 1.01 1.07 1.15 1.22 PPNR ROA (non-GAAP) 1.62 1.67 1.54 1.64 1.79 1.88 NIM 3.26 3.26 3.26 3.26 3.53 3.53 NIM, ex PAA (non-GAAP) 3.15 3.15 3.14 3.14 3.33 3.33 NCO ratio 0.65 0.65 0.33 0.33 0.42 0.42 Efficiency ratio 61.27 56.78 63.22 57.92 59.49 54.15 Reported Adjusted (Non-GAAP) Reported Adjusted (Non-GAAP) Reported Adjusted (Non-GAAP) Financial Highlights Quarter-to-date Year-to-date Mar 23 Dec 22 Mar 22 Mar 23 Dec 21 EPS $ 16.67 $ 20.94 $ 19.25 $ 20.77 $ 12.09 $ 12.82 $ 67.40 $ 77.24 $ 53.88 $ 51.88 ROE 11.05 % 13.89 % 12.49 % 13.47 % 10.96 % 11.63 % 11.15 % 12.78 % 12.84 % 12.36 % ROTCE 11.70 % 14.71 % 13.17 % 14.20 % 12.00 % 12.72 % 11.78 % 13.50 % 14.12 % 13.60 % ROA 0.93 % 1.15 % 1.16 % 1.24 % 1.20 % 1.09 % 1.01 % 1.15 % 1.33 % 1.10 % PPNR ROA 1.70 % 1.81 % 1.72 % 1.86 % 1.33 % 1.17 % 1.84 % 1.64 % 1.41 % 1.11 % NIM 3.36 % 3.36 % 3.40 % 3.40 % 2.56 % 2.56 % 3.14 % 3.14 % 2.55 % 2.55 % Net charge-off ratio 0.14 % 0.14 % 0.10 % 0.10 % 0.04 % 0.04 % 0.12 % 0.12 % 0.08 % 0.08 % Efficiency ratio 61.74 % 54.08 % 61.91 % 53.32 % 65.40 % 62.51 % 60.50 % 56.40 % 64.43 % 64.34 % Reported Adjusted (Non-GAAP) Reported Adjusted (Non-GAAP) Reported Adjusted (Non-GAAP) Reported Adjusted (Non-GAAP) Reported Adjusted (Non-GAAP) Note – Adjusted columns, ROTCE, PPNR ROA and NIM, ex PAA represent non-GAAP measures: see Section V entitled Non-GAAP Reconciliations.
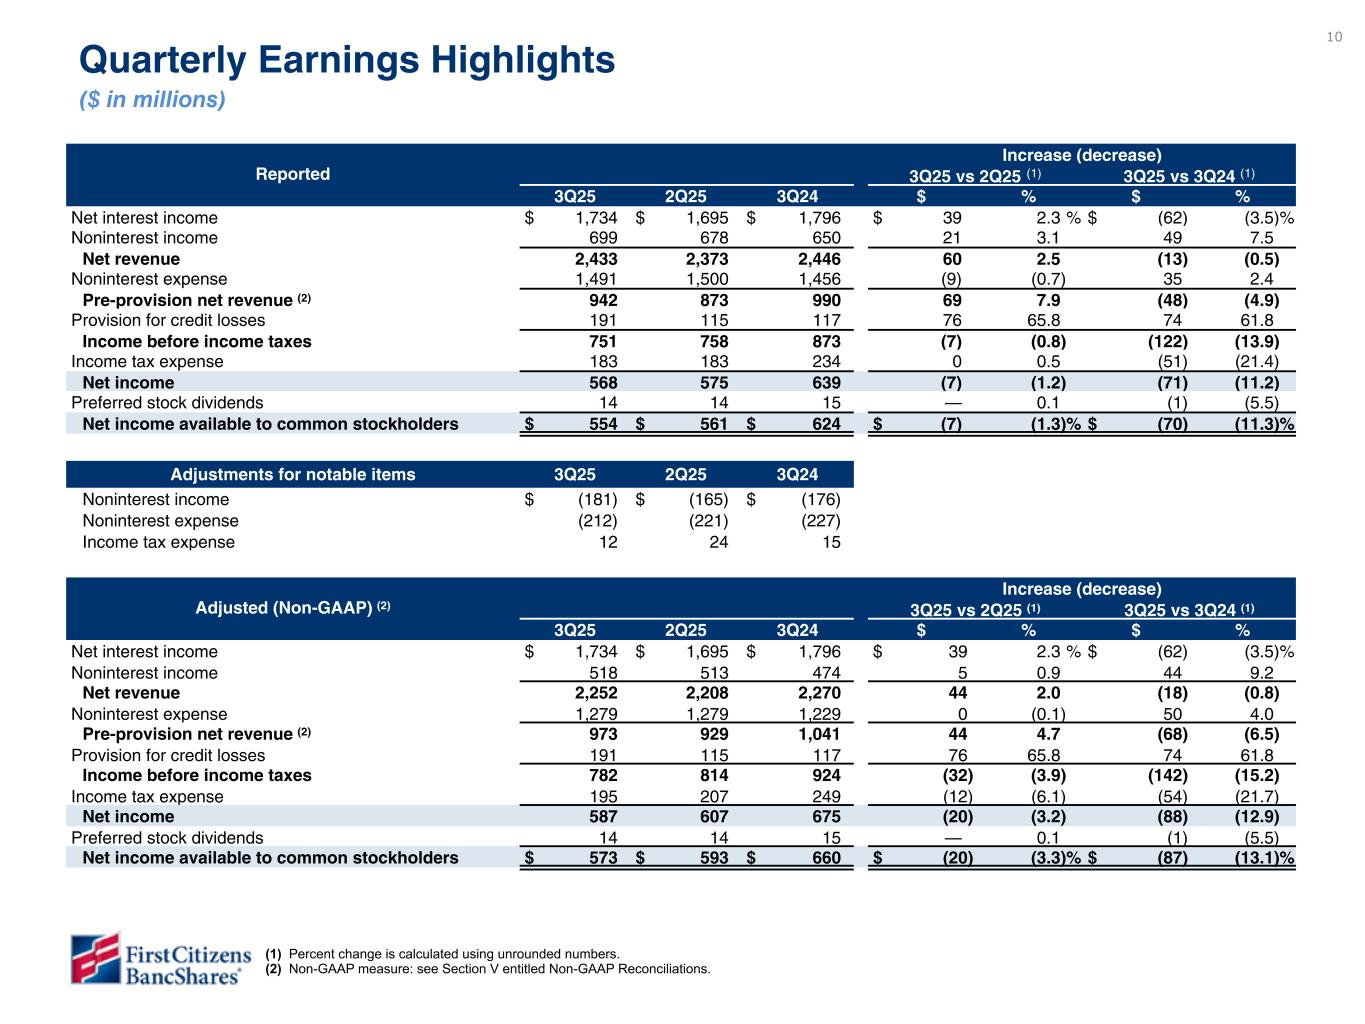
10 Reported Increase (decrease) 3Q25 vs 2Q25 (1) 3Q25 vs 3Q24 (1) 3Q25 2Q25 3Q24 $ % $ % Net interest income $ 1,734 $ 1,695 $ 1,796 $ 39 2.3 % $ (62) (3.5) % Noninterest income 699 678 650 21 3.1 49 7.5 Net revenue 2,433 2,373 2,446 60 2.5 (13) (0.5) Noninterest expense 1,491 1,500 1,456 (9) (0.7) 35 2.4 Pre-provision net revenue (2) 942 873 990 69 7.9 (48) (4.9) Provision for credit losses 191 115 117 76 65.8 74 61.8 Income before income taxes 751 758 873 (7) (0.8) (122) (13.9) Income tax expense 183 183 234 0 0.5 (51) (21.4) Net income 568 575 639 (7) (1.2) (71) (11.2) Preferred stock dividends 14 14 15 — 0.1 (1) (5.5) Net income available to common stockholders $ 554 $ 561 $ 624 $ (7) (1.3) % $ (70) (11.3) % Adjustments for notable items 3Q25 2Q25 3Q24 Noninterest income $ (181) $ (165) $ (176) Noninterest expense (212) (221) (227) Income tax expense 12 24 15 Adjusted (Non-GAAP) (2) Increase (decrease) 3Q25 vs 2Q25 (1) 3Q25 vs 3Q24 (1) 3Q25 2Q25 3Q24 $ % $ % Net interest income $ 1,734 $ 1,695 $ 1,796 $ 39 2.3 % $ (62) (3.5) % Noninterest income 518 513 474 5 0.9 44 9.2 Net revenue 2,252 2,208 2,270 44 2.0 (18) (0.8) Noninterest expense 1,279 1,279 1,229 0 (0.1) 50 4.0 Pre-provision net revenue (2) 973 929 1,041 44 4.7 (68) (6.5) Provision for credit losses 191 115 117 76 65.8 74 61.8 Income before income taxes 782 814 924 (32) (3.9) (142) (15.2) Income tax expense 195 207 249 (12) (6.1) (54) (21.7) Net income 587 607 675 (20) (3.2) (88) (12.9) Preferred stock dividends 14 14 15 — 0.1 (1) (5.5) Net income available to common stockholders $ 573 $ 593 $ 660 $ (20) (3.3) % $ (87) (13.1) % Quarterly Earnings Highlights ($ in millions) (1) Percent change is calculated using unrounded numbers. (2) Non-GAAP measure: see Section V entitled Non-GAAP Reconciliations.
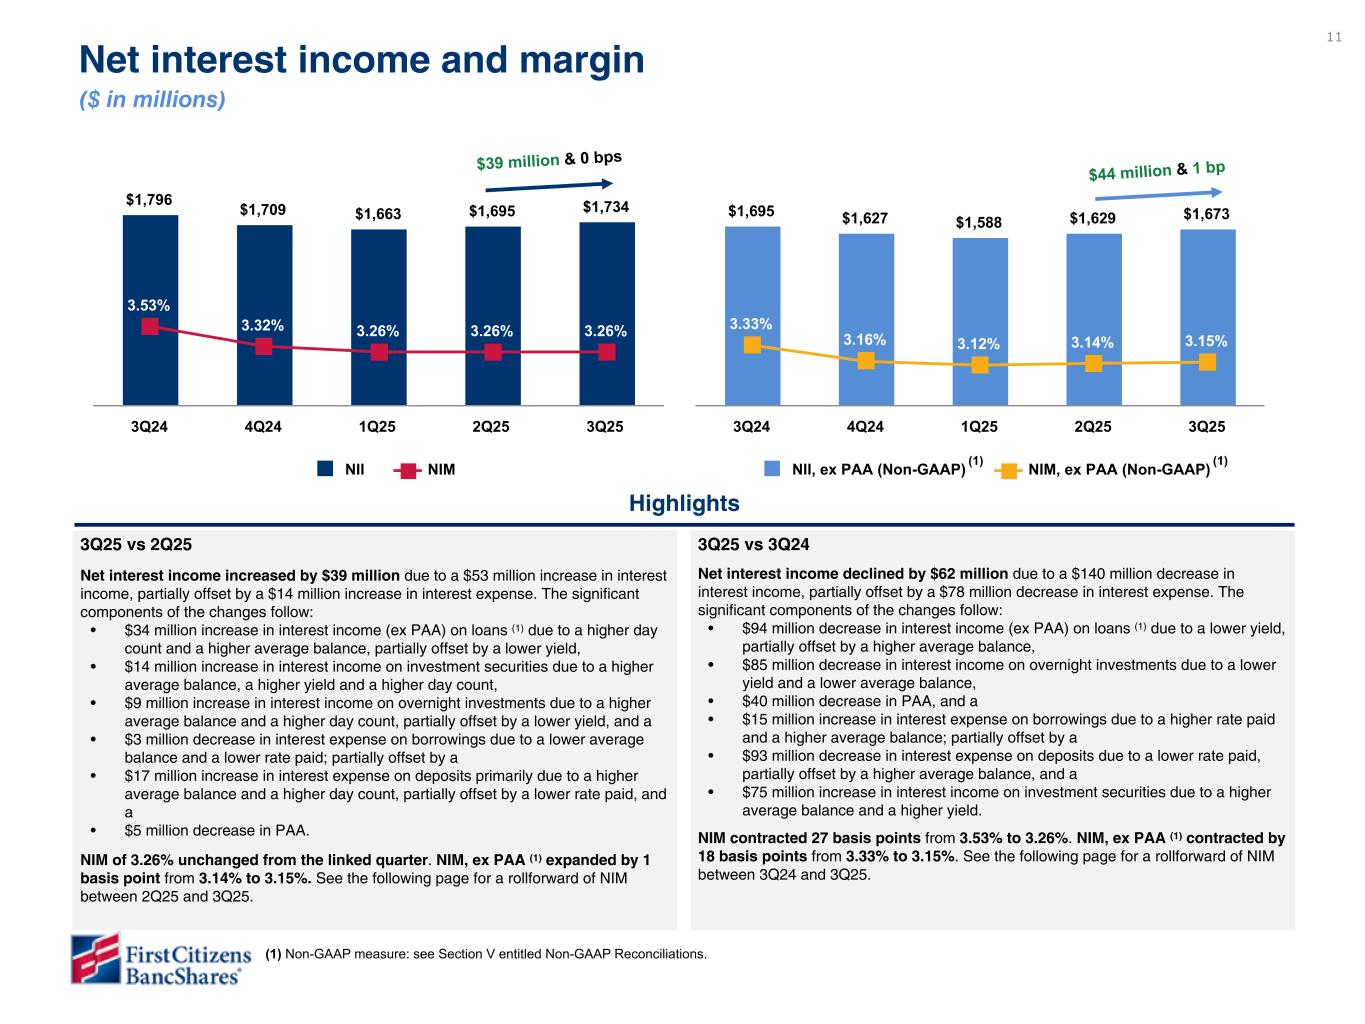
11 $1,695 $1,627 $1,588 $1,629 $1,673 3.33% 3.16% 3.12% 3.14% 3.15% NII, ex PAA (Non-GAAP) NIM, ex PAA (Non-GAAP) 3Q24 4Q24 1Q25 2Q25 3Q25 $1,796 $1,709 $1,663 $1,695 $1,734 3.53% 3.32% 3.26% 3.26% 3.26% NII NIM 3Q24 4Q24 1Q25 2Q25 3Q25 $2,441 $2,946 2.55% 3.14% YTD Dec 21 YTD Dec 22 YTD December 2022 vs YTD December 2021 Net interest income increased by $505 million due to a $483 million increase in interest income and a $22 million decrease in interest expense. The change in net interest income was primarily due to the following: ◦ $256 million increase on interest income on loans due to a higher yield and growth offset by lower SBA- PPP interest and fee income and lower accretion income, ◦ $138 million increase in interest income on investment securities due to higher yield and average balance, ◦ $118 million decline in interest expense on borrowings due to a lower rate and average balance, ◦ $89 million increase in interest income on overnight investments due to a higher yield despite a lower average balance; partially offset by a ◦ $96 million increase in interest expense on deposits due to a higher rate paid. NIM expanded from 2.55% to 3.14%. $505 million & 59 bps Highlights $39 million & 0 bps Net interest income and margin ($ in millions) $44 million & 1 bp 3Q25 vs 2Q25 Net interest income increased by $39 million due to a $53 million increase in interest income, partially offset by a $14 million increase in interest expense. The significant components of the changes follow: • $34 million increase in interest income (ex PAA) on loans (1) due to a higher day count and a higher average balance, partially offset by a lower yield, • $14 million increase in interest income on investment securities due to a higher average balance, a higher yield and a higher day count, • $9 million increase in interest income on overnight investments due to a higher average balance and a higher day count, partially offset by a lower yield, and a • $3 million decrease in interest expense on borrowings due to a lower average balance and a lower rate paid; partially offset by a • $17 million increase in interest expense on deposits primarily due to a higher average balance and a higher day count, partially offset by a lower rate paid, and a • $5 million decrease in PAA. NIM of 3.26% unchanged from the linked quarter. NIM, ex PAA (1) expanded by 1 basis point from 3.14% to 3.15%. See the following page for a rollforward of NIM between 2Q25 and 3Q25. 3Q25 vs 3Q24 Net interest income declined by $62 million due to a $140 million decrease in interest income, partially offset by a $78 million decrease in interest expense. The significant components of the changes follow: • $94 million decrease in interest income (ex PAA) on loans (1) due to a lower yield, partially offset by a higher average balance, • $85 million decrease in interest income on overnight investments due to a lower yield and a lower average balance, • $40 million decrease in PAA, and a • $15 million increase in interest expense on borrowings due to a higher rate paid and a higher average balance; partially offset by a • $93 million decrease in interest expense on deposits due to a lower rate paid, partially offset by a higher average balance, and a • $75 million increase in interest income on investment securities due to a higher average balance and a higher yield. NIM contracted 27 basis points from 3.53% to 3.26%. NIM, ex PAA (1) contracted by 18 basis points from 3.33% to 3.15%. See the following page for a rollforward of NIM between 3Q24 and 3Q25. (1) Non-GAAP measure: see Section V entitled Non-GAAP Reconciliations. (1) (1) Craig - We included the day count impact in overnight investments and investment securities as requested but have left off of borrowings as this had an immaterial impact (see Responses file for more information). Note that day count accounts for ~50% of the loan income change and more like 25% for overnights and investment securities.
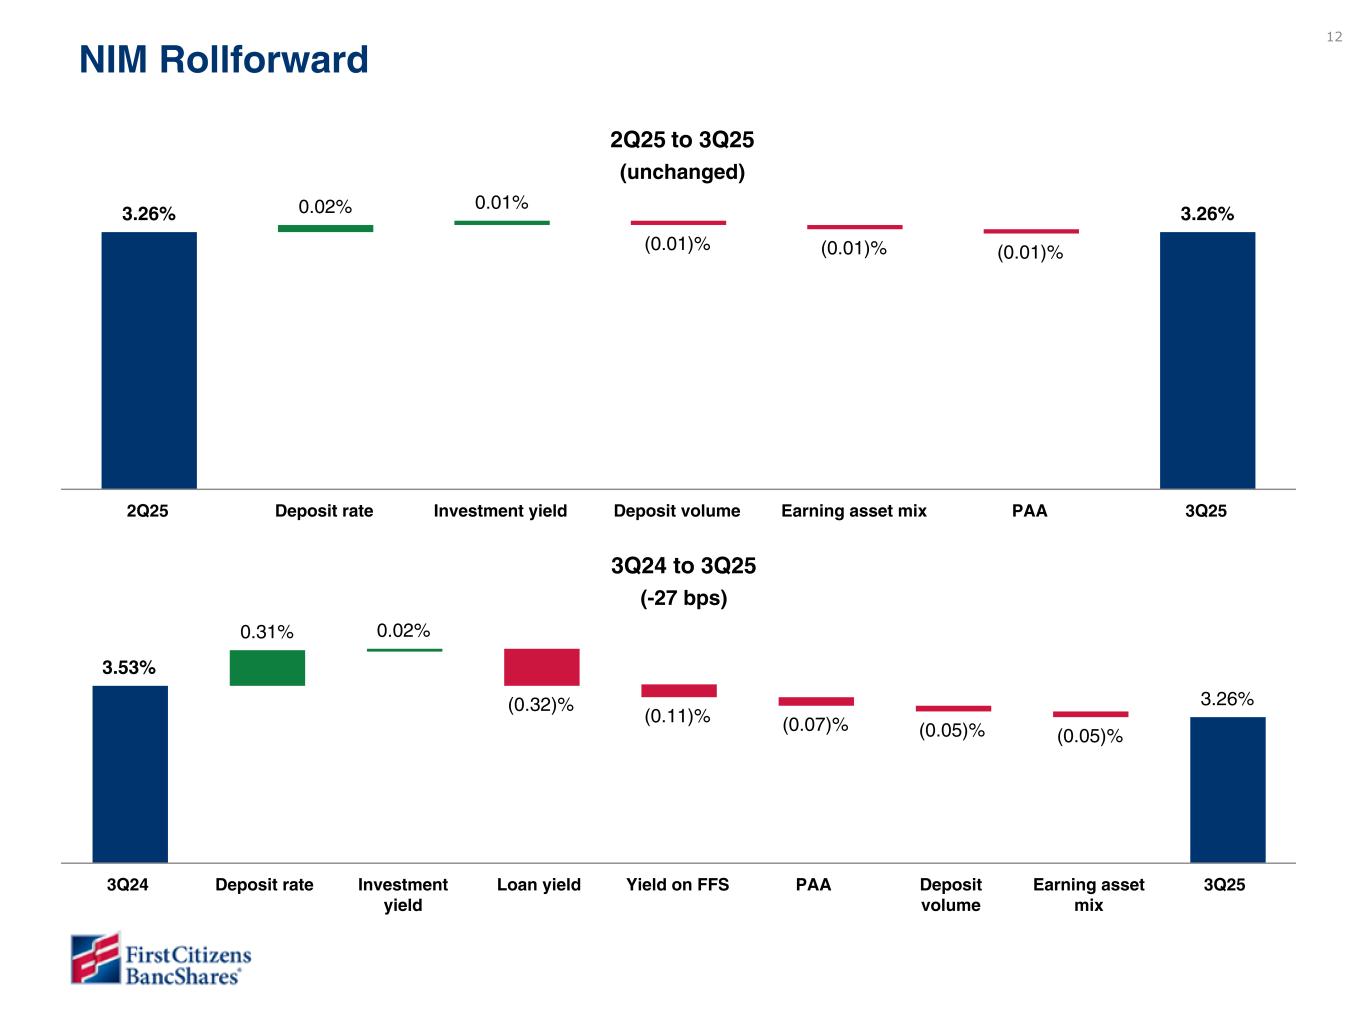
12 3.53% 0.31% 0.02% (0.32)% (0.11)% (0.07)% (0.05)% (0.05)% 3.26% 3Q24 Deposit rate Investment yield Loan yield Yield on FFS PAA Deposit volume Earning asset mix 3Q25 3Q24 to 3Q25 (-27 bps) NIM Rollforward 3.26% 0.02% 0.01% (0.01)% (0.01)% (0.01)% 3.26% 2Q25 Deposit rate Investment yield Deposit volume Earning asset mix PAA 3Q25 2Q25 to 3Q25 (0 bps) Craig - Both loan and investment yield were up and have an impact but each are less than 1 bps. We do want to acknowledge that so added a EA yield because if we round each to loans it confuses the rest of the story. 2Q25 to 3Q25 (unchanged) Earning asset yield
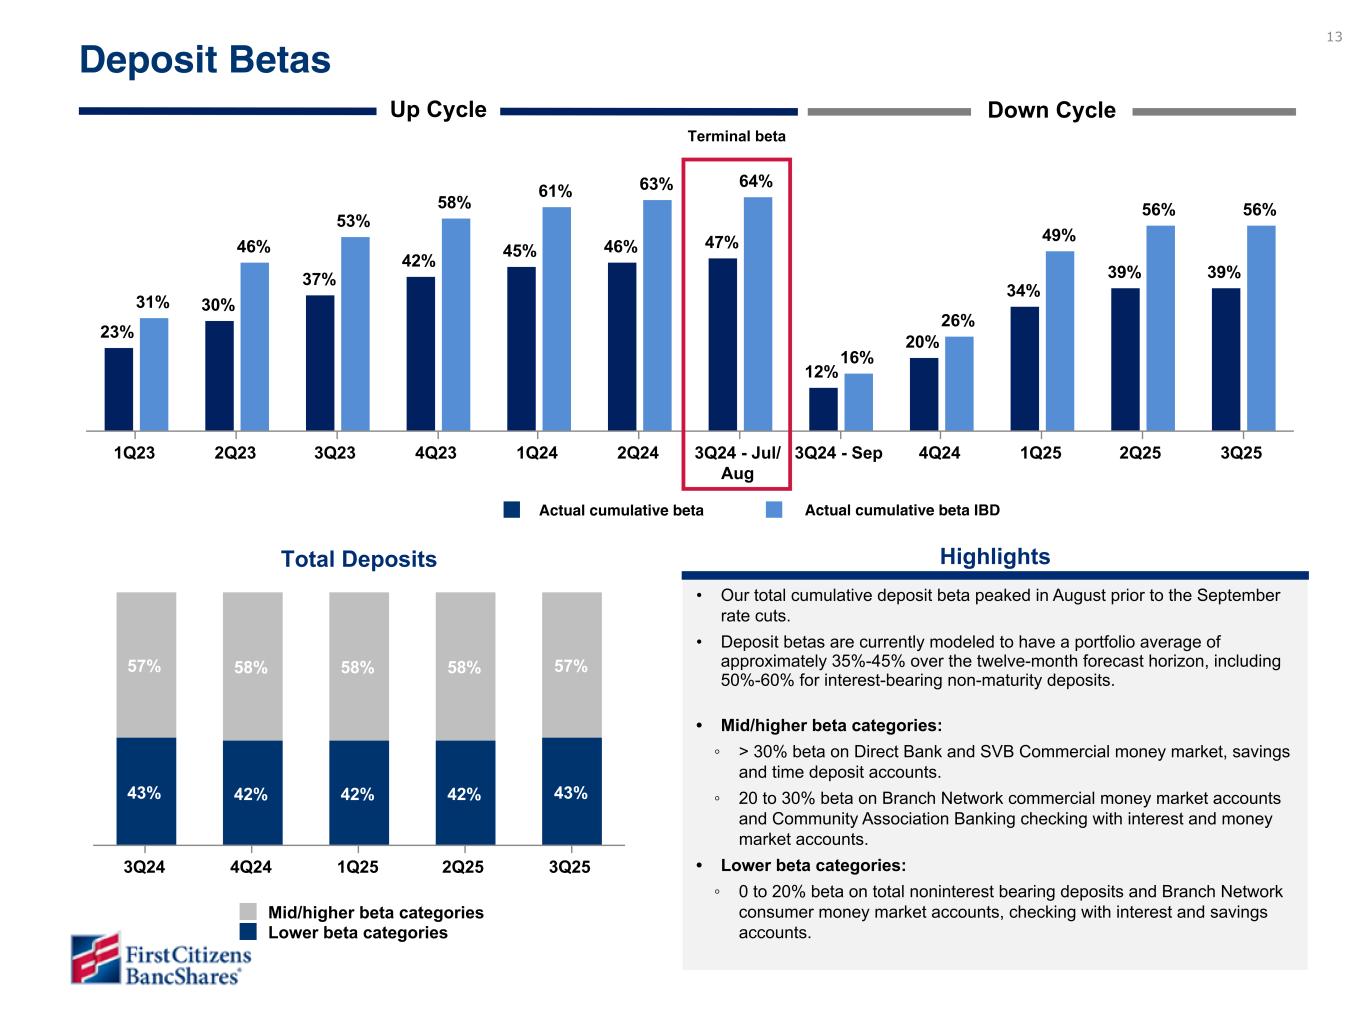
13 Deposit Betas Highlights • Our total cumulative deposit beta peaked in August prior to the September rate cuts. • Deposit betas are currently modeled to have a portfolio average of approximately 35%-45% over the twelve-month forecast horizon, including 50%-60% for interest-bearing non-maturity deposits. • Mid/higher beta categories: ◦ > 30% beta on Direct Bank and SVB Commercial money market, savings and time deposit accounts. ◦ 20 to 30% beta on Branch Network commercial money market accounts and Community Association Banking checking with interest and money market accounts. • Lower beta categories: ◦ 0 to 20% beta on total noninterest bearing deposits and Branch Network consumer money market accounts, checking with interest and savings accounts. 23% 30% 37% 42% 45% 46% 47% 12% 20% 34% 39% 39% 31% 46% 53% 58% 61% 63% 64% 16% 26% 49% 56% 56% 1Q23 2Q23 3Q23 4Q23 1Q24 2Q24 3Q24 - Jul/ Aug 3Q24 - Sep 4Q24 1Q25 2Q25 3Q25 Up Cycle Down Cycle Terminal beta 2.32% 2.27% 2.25% Rate paid on deposits 2.46% 43% 42% 42% 42% 43% 57% 58% 58% 58% 57% Mid/higher beta categories Lower beta categories 3Q24 4Q24 1Q25 2Q25 3Q25 Total Deposits Actual cumulative beta Actual cumulative beta IBD Question out to Tom - Given timing of the rate cut it appears as if our betas are worsening but its really a timing issue. Thoughts on adjusting the denominator to only include a portion of the 25bps cut received in late Sep? Option 2 - Removed the forecast beta from the top chart and updated the language in the highlights to more closely align with our long-term beta expectations as outlined in the 10-Q/K. Wording remains under review.
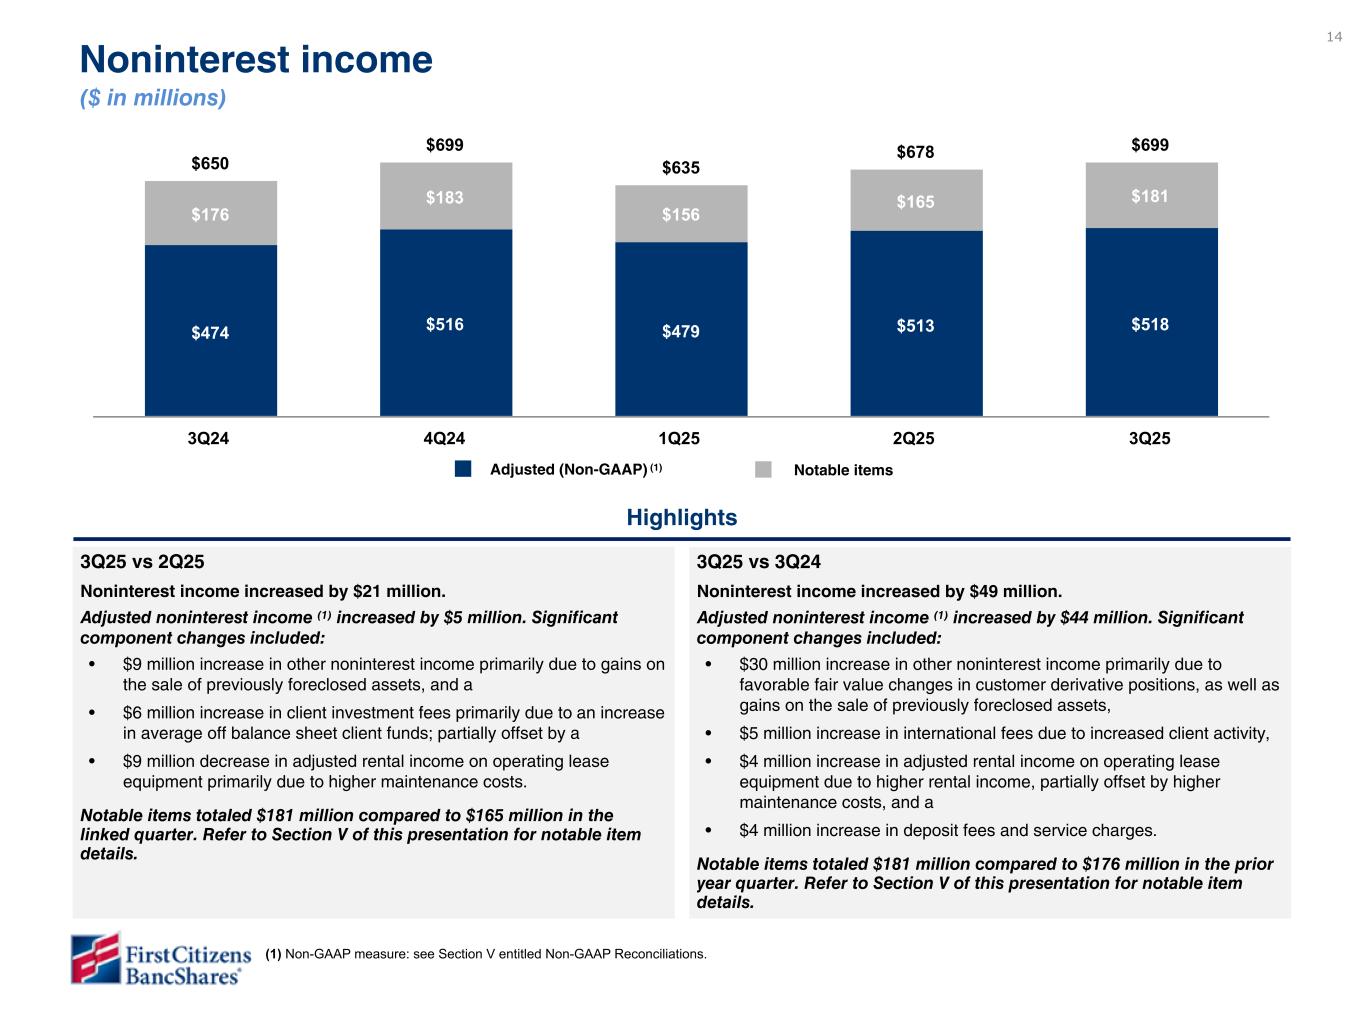
14 $650 $699 $635 $678 $699 $474 $516 $479 $513 $518 $176 $183 $156 $165 $181 3Q24 4Q24 1Q25 2Q25 3Q25 $295 $181 1Q23 SVB contribution $1,940 $2,136 $996 $1,141 $944 $995 YTD Dec 21 YTD Dec 22 3Q25 vs 2Q25 Noninterest income increased by $21 million. Adjusted noninterest income (1) increased by $5 million. Significant component changes included: • $9 million increase in other noninterest income primarily due to gains on the sale of previously foreclosed assets, and a • $6 million increase in client investment fees primarily due to an increase in average off balance sheet client funds; partially offset by a • $9 million decrease in adjusted rental income on operating lease equipment primarily due to higher maintenance costs. Notable items totaled $181 million compared to $165 million in the linked quarter. Refer to Section V of this presentation for notable item details. YTD22 vs YTD21 Noninterest income increased $196 million. Significant components of the change were: ◦ Rental income on operating leases increased $91 million due to the same reasons as in the linked quarter. Expenses on operating lease equipment declined $16 million resulting in a $107 million increase in adjusted rental income. ◦ Cardholder services income, net increased $15 million due to higher volume and fee income and other service charges increased $14 million, primarily due to higher capital markets and portfolio servicing fees. ◦ Wealth management services increased $13 million due to increased brokerage transactions and higher assets under management. ◦ Other noninterest income increased $63 million spread among various line items, including a $431 million bargain purchase gain, partially offset by a $147 million decline in investment gains and a $188 million decline in gains on asset and loan sales. Highlights Noninterest income ($ in millions) Core: ### increase 3Q25 vs 3Q24 Noninterest income increased by $49 million. Adjusted noninterest income (1) increased by $44 million. Significant component changes included: • $30 million increase in other noninterest income primarily due to favorable fair value changes in customer derivative positions, as well as gains on the sale of previously foreclosed assets, • $5 million increase in international fees due to increased client activity, • $4 million increase in adjusted rental income on operating lease equipment due to higher rental income, partially offset by higher maintenance costs, and a • $4 million increase in deposit fees and service charges. Notable items totaled $181 million compared to $176 million in the prior year quarter. Refer to Section V of this presentation for notable item details. Adjusted (Non-GAAP) (1) Notable items $176 - total notable items $181 - total notable items $518 - total adjusted (Non-GAAP) (1) (1) Non-GAAP measure: see Section V entitled Non-GAAP Reconciliations. Craig - Note that we didn’t include positive here for FV changes as the largest portion of the impact is really from the absence of negative FV changes that occurred in 1Q25. Refer to the additional file and let us know if you agree or want us to add.
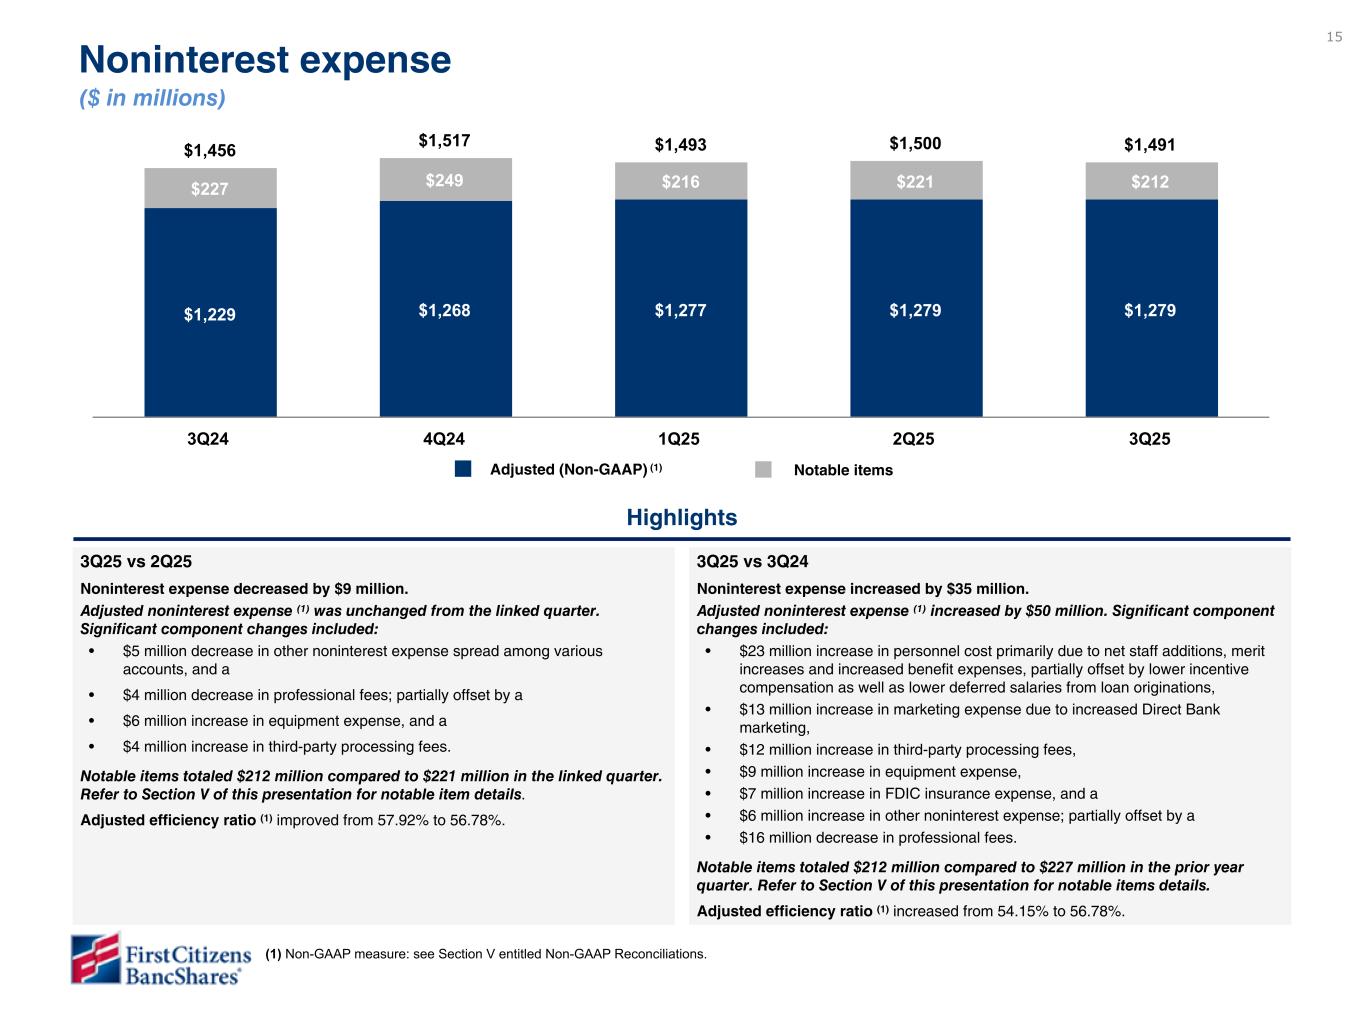
15 3Q25 vs 3Q24 Noninterest expense increased by $35 million. Adjusted noninterest expense (1) increased by $50 million. Significant component changes included: • $23 million increase in personnel cost primarily due to net staff additions, merit increases and increased benefit expenses, partially offset by lower incentive compensation as well as lower deferred salaries from loan originations, • $13 million increase in marketing expense due to increased Direct Bank marketing, • $12 million increase in third-party processing fees, • $9 million increase in equipment expense, • $7 million increase in FDIC insurance expense, and a • $6 million increase in other noninterest expense; partially offset by a • $16 million decrease in professional fees. Notable items totaled $212 million compared to $227 million in the prior year quarter. Refer to Section V of this presentation for notable items details. Adjusted efficiency ratio (1) increased from 54.15% to 56.78%. 3Q25 vs 2Q25 Noninterest expense decreased by $9 million. Adjusted noninterest expense (1) was unchanged from the linked quarter. Significant component changes included: • $5 million decrease in other noninterest expense spread among various accounts, and a • $4 million decrease in professional fees; partially offset by a • $6 million increase in equipment expense, and a • $4 million increase in third-party processing fees. Notable items totaled $212 million compared to $221 million in the linked quarter. Refer to Section V of this presentation for notable item details. Adjusted efficiency ratio (1) improved from 57.92% to 56.78%. $1,456 $1,517 $1,493 $1,500 $1,491 $1,229 $1,268 $1,277 $1,279 $1,279 $227 $249 $216 $221 $212 3Q24 4Q24 1Q25 2Q25 3Q25 YTD22 vs YTD21 Noninterest expense increased $252 million. Significant components of the change were: ◦ Merger-related expenses increased $194 million. ◦ Salaries and benefits expense increased $53 million as a result of merger-related costs, wage increases, revenue- based incentives and temporary personnel costs, partially offset by net staff reductions. ◦ Marketing costs increased $23 million due to the same reasons as the quarterly increases. ◦ Third-party processing expenses increased $14 million and other operating expenses increased $14 million; ◦ Partially offset by an $18 million reduction in FDIC insurance premiums, a $16 million decline in expenses on operating leases, and a $12 million reduction in professional fees. Efficiency ratio improved from 64.43% to 60.50%. Adjusted efficiency ratio improved from 64.34% to 56.40% as adjusted net revenue grew 19% and adjusted noninterest expense grew 4%. Noninterest expense ($ in millions) $2,823 $3,075 $2,212 $2,305 $611 $770 YTD Dec 21 YTD Dec 22 (1) Non-GAAP measure: see Section V entitled Non-GAAP Reconciliations. Highlights Adjusted (Non-GAAP) (1) Notable items Craig - Note that merit large driver over PYQ driven by addition of SVB - last year merit at SVB was generally limited to associates < $100K but this year most of L- SVB was eligible.
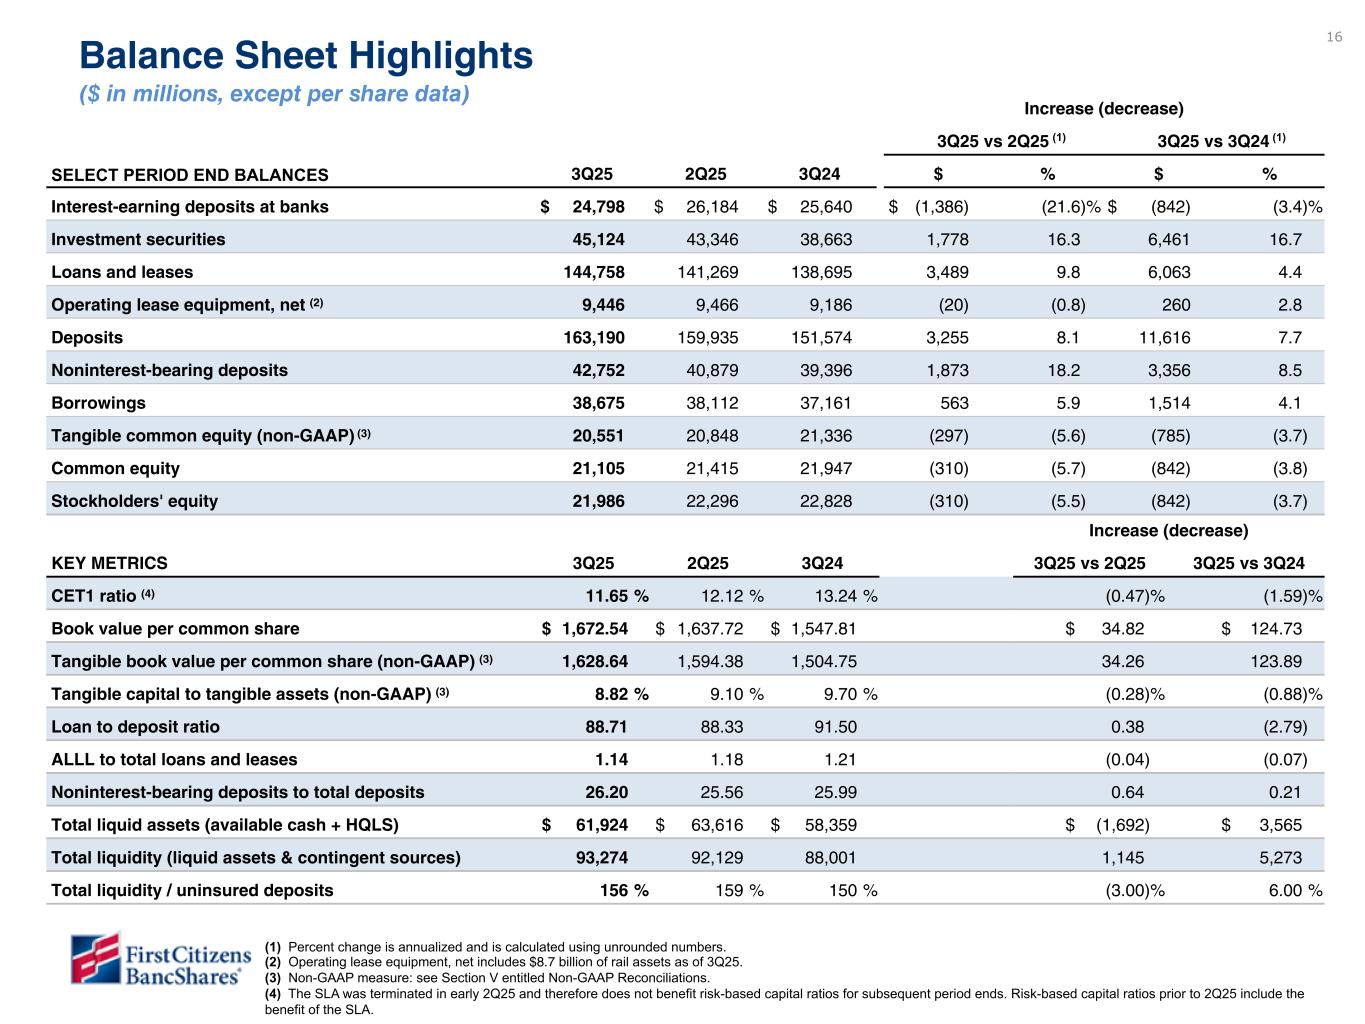
16 16 Increase (decrease) 3Q25 vs 2Q25 3Q25 vs 3Q24 SELECT PERIOD END BALANCES 3Q25 2Q25 3Q24 $ % $ % Interest-earning deposits at banks $ 24,798 $ 26,184 $ 25,640 $ (1,386) (21.6) % $ (842) (3.4) % Investment securities 45,124 43,346 38,663 1,778 16.3 6,461 16.7 Loans and leases 144,758 141,269 138,695 3,489 9.8 6,063 4.4 Operating lease equipment, net (2) 9,446 9,466 9,186 (20) (0.8) 260 2.8 Deposits 163,190 159,935 151,574 3,255 8.1 11,616 7.7 Noninterest-bearing deposits 42,752 40,879 39,396 1,873 18.2 3,356 8.5 Borrowings 38,675 38,112 37,161 563 5.9 1,514 4.1 Tangible common equity (non-GAAP) (3) 20,551 20,848 21,336 (297) (5.6) (785) (3.7) Common equity 21,105 21,415 21,947 (310) (5.7) (842) (3.8) Stockholders' equity 21,986 22,296 22,828 (310) (5.5) (842) (3.7) Increase (decrease) KEY METRICS 3Q25 2Q25 3Q24 3Q25 vs 2Q25 3Q25 vs 3Q24 CET1 ratio (4) 11.65 % 12.12 % 13.24 % (0.47) % (1.59) % Book value per common share $ 1,672.54 $ 1,637.72 $ 1,547.81 $ 34.82 $ 124.73 Tangible book value per common share (non-GAAP) (3) 1,628.64 1,594.38 1,504.75 34.26 123.89 Tangible capital to tangible assets (non-GAAP) (3) 8.82 % 9.10 % 9.70 % (0.28) % (0.88) % Loan to deposit ratio 88.71 88.33 91.50 0.38 (2.79) ALLL to total loans and leases 1.14 1.18 1.21 (0.04) (0.07) Noninterest-bearing deposits to total deposits 26.20 25.56 25.99 0.64 0.21 Total liquid assets (available cash + HQLS) $ 61,924 $ 63,616 $ 58,359 $ (1,692) $ 3,565 Total liquidity (liquid assets & contingent sources) 93,274 92,129 88,001 1,145 5,273 Total liquidity / uninsured deposits 156 % 159 % 150 % (3.00) % 6.00 % Balance Sheet Highlights ($ in millions, except per share data) (1) (1) (1) Percent change is annualized and is calculated using unrounded numbers. (2) Operating lease equipment, net includes $8.7 billion of rail assets as of 3Q25. (3) Non-GAAP measure: see Section V entitled Non-GAAP Reconciliations. (4) The SLA was terminated in early 2Q25 and therefore does not benefit risk-based capital ratios for subsequent period ends. Risk-based capital ratios prior to 2Q25 include the benefit of the SLA. CET1 ratio highlighted in yellow is directional, but not yet final.
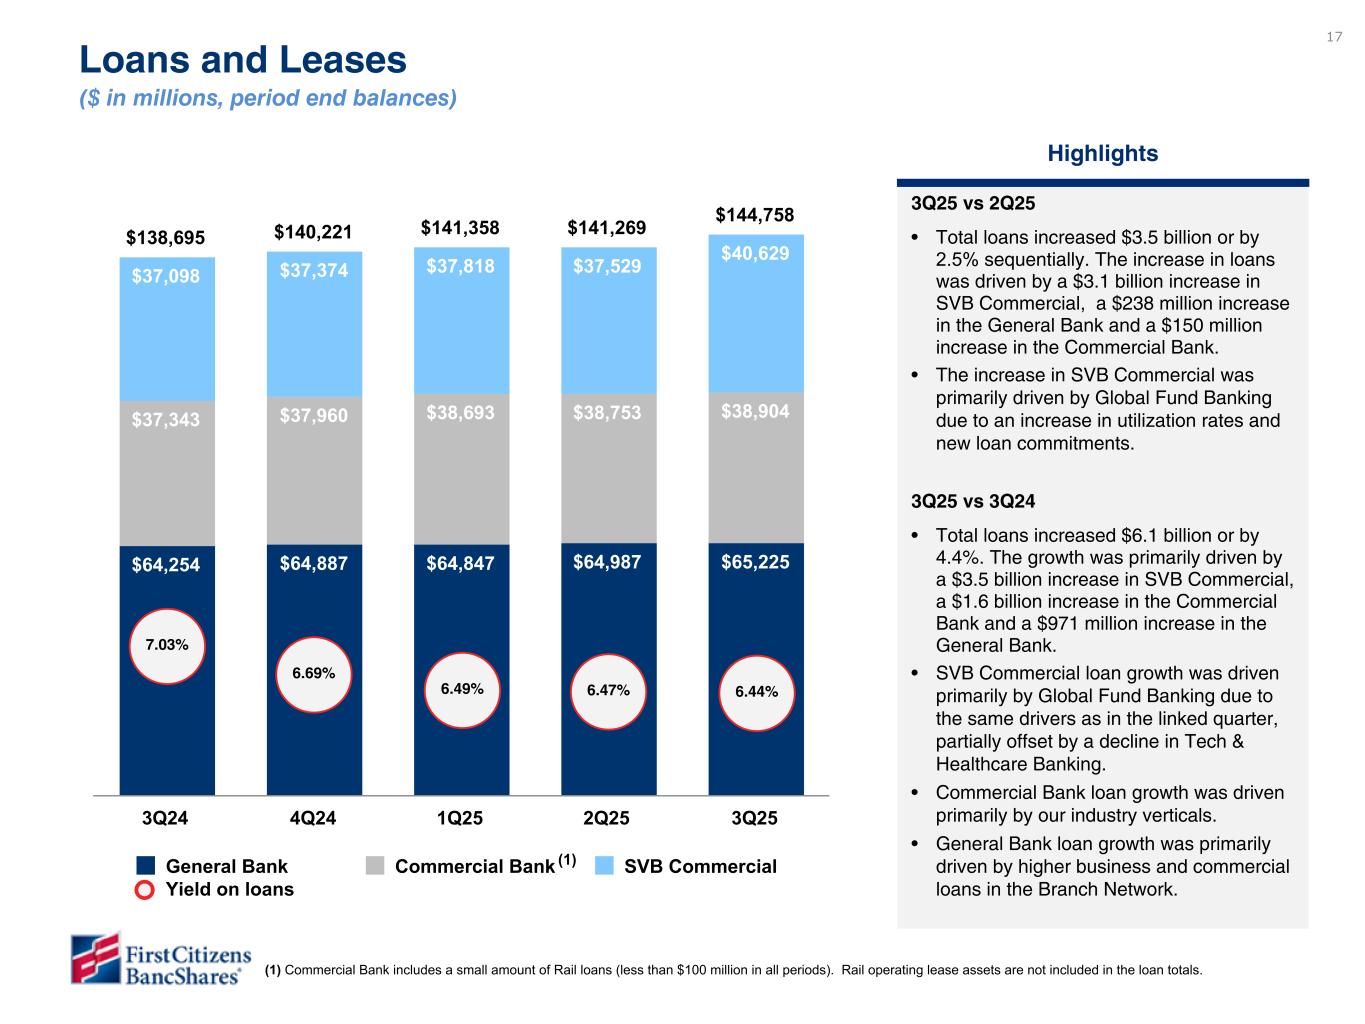
17 3Q25 vs 2Q25 • Total loans increased $3.5 billion or by 2.5% sequentially. The increase in loans was driven by a $3.1 billion increase in SVB Commercial, a $238 million increase in the General Bank and a $150 million increase in the Commercial Bank. • The increase in SVB Commercial was primarily driven by Global Fund Banking due to an increase in utilization rates and new loan commitments. 3Q25 vs 3Q24 • Total loans increased $6.1 billion or by 4.4%. The growth was primarily driven by a $3.5 billion increase in SVB Commercial, a $1.6 billion increase in the Commercial Bank and a $971 million increase in the General Bank. • SVB Commercial loan growth was driven primarily by Global Fund Banking due to the same drivers as in the linked quarter, partially offset by a decline in Tech & Healthcare Banking. • Commercial Bank loan growth was driven primarily by our industry verticals. • General Bank loan growth was primarily driven by higher business and commercial loans in the Branch Network. $138,695 $140,221 $141,358 $141,269 $144,758 $64,254 $64,887 $64,847 $64,987 $65,225 $37,343 $37,960 $38,693 $38,753 $38,904 $37,098 $37,374 $37,818 $37,529 $40,629 General Bank Commercial Bank SVB Commercial Yield on loans 3Q24 4Q24 1Q25 2Q25 3Q25 Highlights Loans and Leases ($ in millions, period end balances) 6.47%6.49% 6.69% 7.03% 6.44% 10.1% (1) (1) Commercial Bank includes a small amount of Rail loans (less than $100 million in all periods). Rail operating lease assets are not included in the loan totals. Loan data is preliminary and subject to change pending final rounding files from SEC team
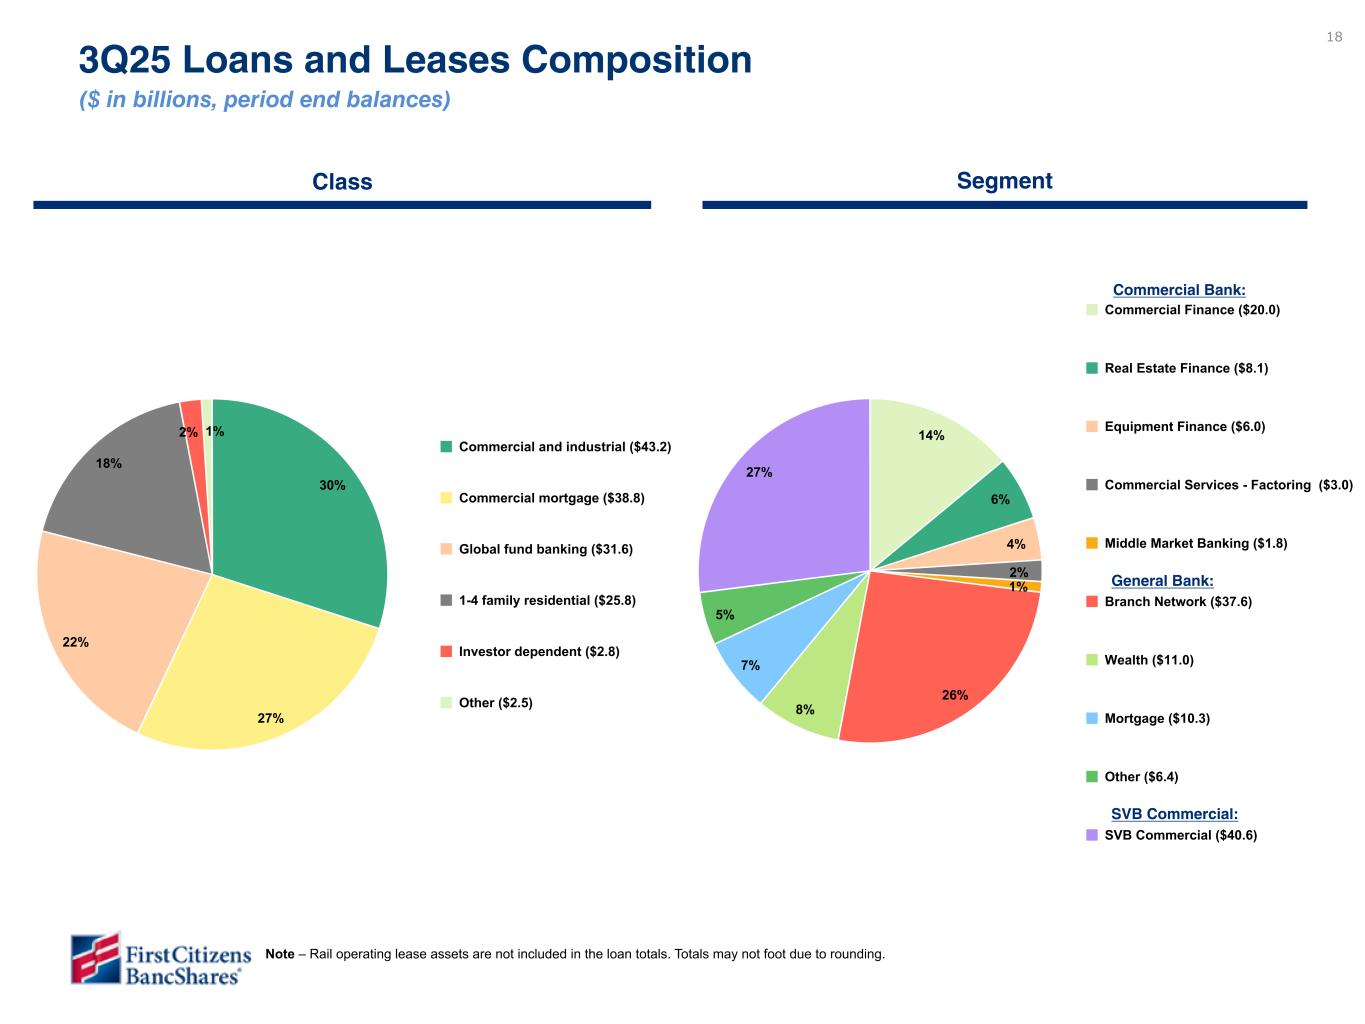
18 14% 6% 4% 2% 1% 26% 8% 7% 5% 27% Commercial Finance ($20.0) Real Estate Finance ($8.1) Equipment Finance ($6.0) Commercial Services - Factoring ($3.0) Middle Market Banking ($1.8) Branch Network ($37.6) Wealth ($11.0) Mortgage ($10.3) Other ($6.4) SVB Commercial ($40.6) 30% 27% 22% 18% 2% 1% Commercial and industrial ($43.2) Commercial mortgage ($38.8) Global fund banking ($31.6) 1-4 family residential ($25.8) Investor dependent ($2.8) Other ($2.5) Class Segment 3Q25 Loans and Leases Composition ($ in billions, period end balances) Commercial Bank: General Bank: SVB Commercial: Note – Rail operating lease assets are not included in the loan totals. Totals may not foot due to rounding.
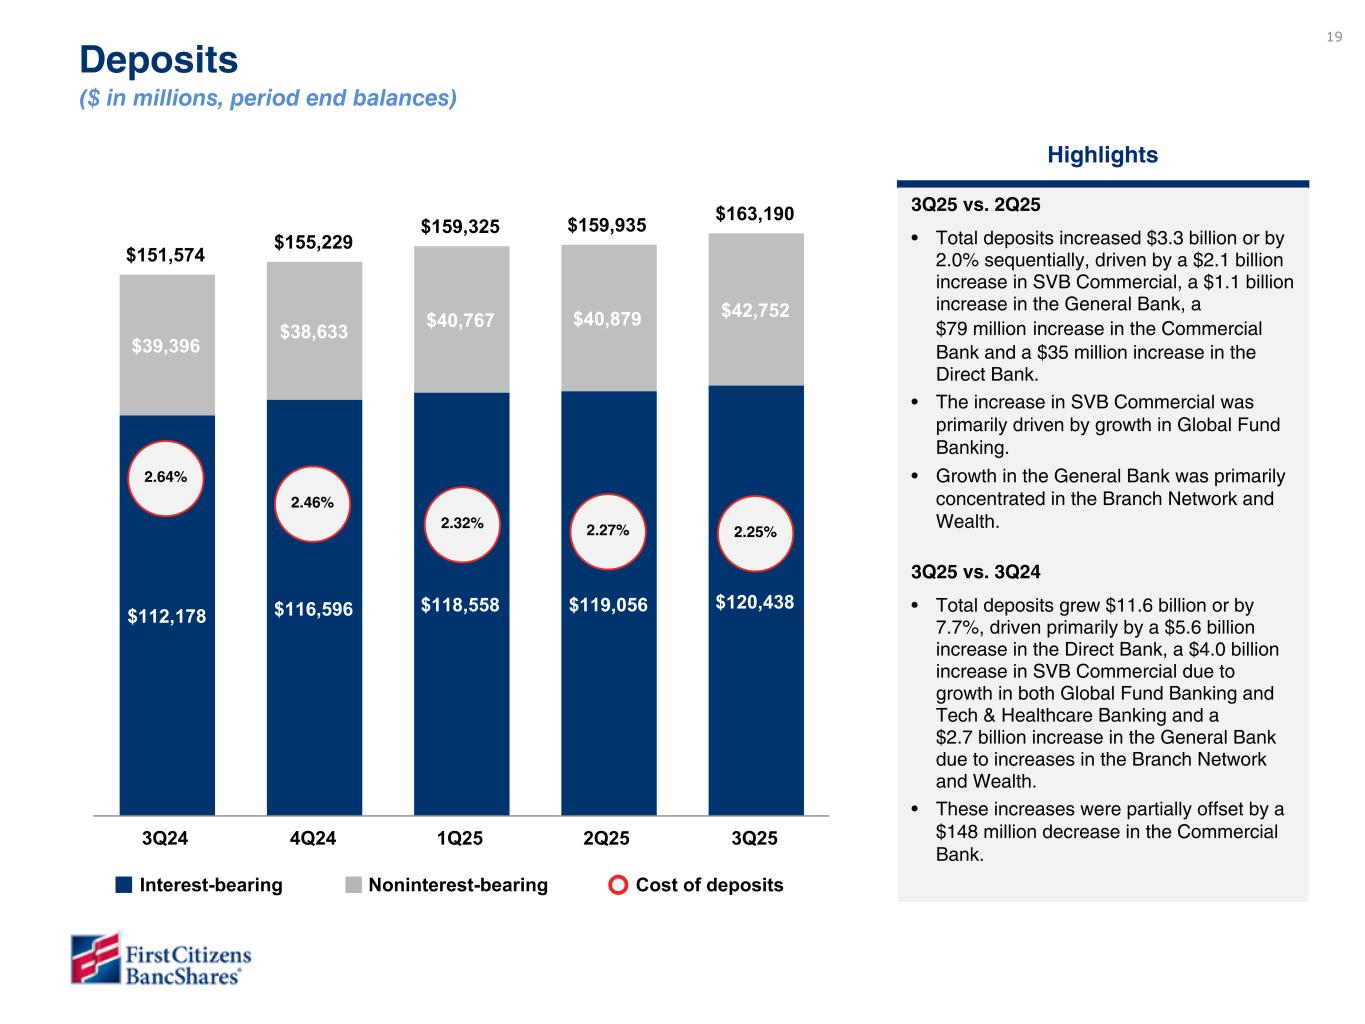
19 $151,574 $155,229 $159,325 $159,935 $163,190 $112,178 $116,596 $118,558 $119,056 $120,438 $39,396 $38,633 $40,767 $40,879 $42,752 3Q24 4Q24 1Q25 2Q25 3Q25 2.27% 2.32% 2.46% 2.64% 2.25% Highlights Interest-bearing Noninterest-bearing Cost of deposits Deposits ($ in millions, period end balances) $140,050 $66,686 $24,105 $18,715 $30,544 1Q23 3Q25 vs. 2Q25 • Total deposits increased $3.3 billion or by 2.0% sequentially, driven by a $2.1 billion increase in SVB Commercial, a $1.1 billion increase in the General Bank, a $79 million increase in the Commercial Bank and a $35 million increase in the Direct Bank. • The increase in SVB Commercial was primarily driven by growth in Global Fund Banking. • Growth in the General Bank was primarily concentrated in the Branch Network and Wealth. 3Q25 vs. 3Q24 • Total deposits grew $11.6 billion or by 7.7%, driven primarily by a $5.6 billion increase in the Direct Bank, a $4.0 billion increase in SVB Commercial due to growth in both Global Fund Banking and Tech & Healthcare Banking and a $2.7 billion increase in the General Bank due to increases in the Branch Network and Wealth. • These increases were partially offset by a $148 million decrease in the Commercial Bank. Highlighted commentary is being validated with businesses Added a note on general bank but its fairly high level as lots of moving parts. See detail provided in additional attachment.
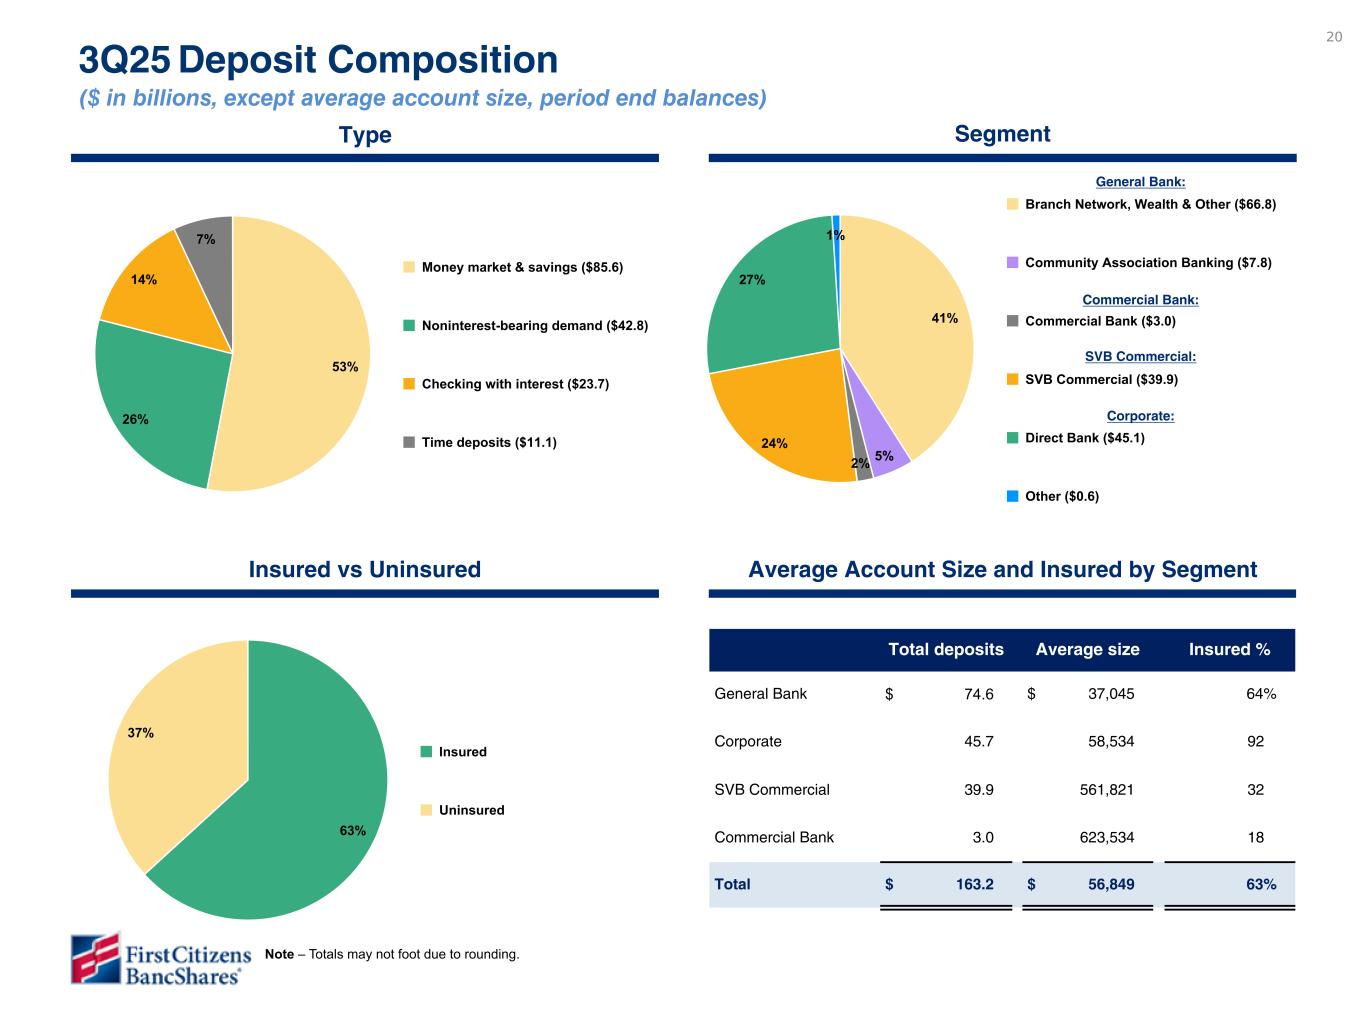
20 41% 5%2% 24% 27% 1% Branch Network, Wealth & Other ($66.8) Community Association Banking ($7.8) Commercial Bank ($3.0) SVB Commercial ($39.9) Direct Bank ($45.1) Other ($0.6) Commercial Bank: 53% 26% 14% 7% Money market & savings ($85.6) Noninterest-bearing demand ($42.8) Checking with interest ($23.7) Time deposits ($11.1) General Bank: Corporate: Type Segment 3Q25 Deposit Composition ($ in billions, except average account size, period end balances) Insured vs Uninsured 63% 37% Insured Uninsured Average Account Size and Insured by Segment Total deposits Average size Insured % General Bank $ 74.6 $ 37,045 64 % Corporate 45.7 58,534 92 SVB Commercial 39.9 561,821 32 Commercial Bank 3.0 623,534 18 Total $ 163.2 $ 56,849 63 % SVB Commercial: Note – Totals may not foot due to rounding. Insured deposit information by segment remains under review with Treasury Note to Craig: Avg. deposits in the Commercial Bank increased to ~$600K from ~$250K in prior quarters. This was due to a change in approach by the Treasury team who provides this information after they located an error in account logic - near zero balance accounts that should have been allocated to the Direct Bank were being incorrectly allocated to the Commercial Bank.
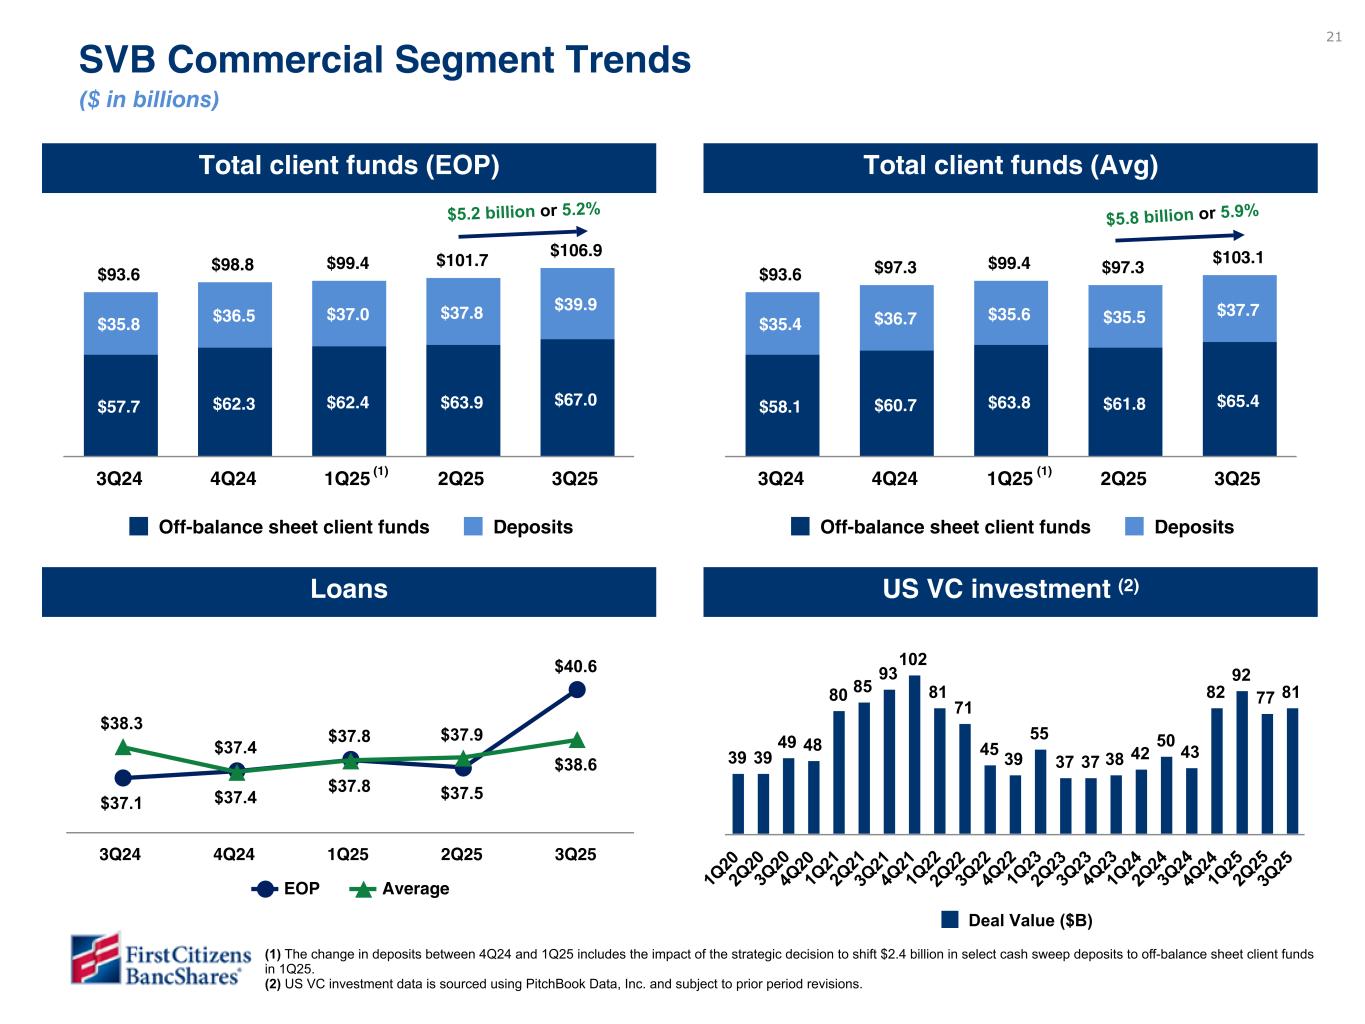
21 US VC investment (2)Loans Total client funds (Avg)Total client funds (EOP) SVB Commercial Segment Trends ($ in billions) $93.6 $98.8 $99.4 $101.7 $106.9 $57.7 $62.3 $62.4 $63.9 $67.0 $35.8 $36.5 $37.0 $37.8 $39.9 Off-balance sheet client funds Deposits 3Q24 4Q24 1Q25 2Q25 3Q25 $93.6 $97.3 $99.4 $97.3 $103.1 $58.1 $60.7 $63.8 $61.8 $65.4 $35.4 $36.7 $35.6 $35.5 $37.7 Off-balance sheet client funds Deposits 3Q24 4Q24 1Q25 2Q25 3Q25 $37.1 $37.4 $37.8 $37.5 $40.6 $38.3 $37.4 $37.8 $37.9 $38.6 EOP Average 3Q24 4Q24 1Q25 2Q25 3Q25 39 39 49 48 80 85 93 102 81 71 45 39 55 37 37 38 42 50 43 82 92 77 81 Deal Value ($B) 1Q 20 2Q 20 3Q 20 4Q 20 1Q 21 2Q 21 3Q 21 4Q 21 1Q 22 2Q 22 3Q 22 4Q 22 1Q 23 2Q 23 3Q 23 4Q 23 1Q 24 2Q 24 3Q 24 4Q 24 1Q 25 2Q 25 3Q 25 $5.2 billion or 5.2% $5.8 billion or 5.9% (1) The change in deposits between 4Q24 and 1Q25 includes the impact of the strategic decision to shift $2.4 billion in select cash sweep deposits to off-balance sheet client funds in 1Q25. (2) US VC investment data is sourced using PitchBook Data, Inc. and subject to prior period revisions. Please do not review. To be provided in subsequent draft once data is available (1) Data has been validated but still working with business to understand large differences in spot and average balance variances over linked quarter. (1) To be updated in subsequent draft once data is available. Please do not review
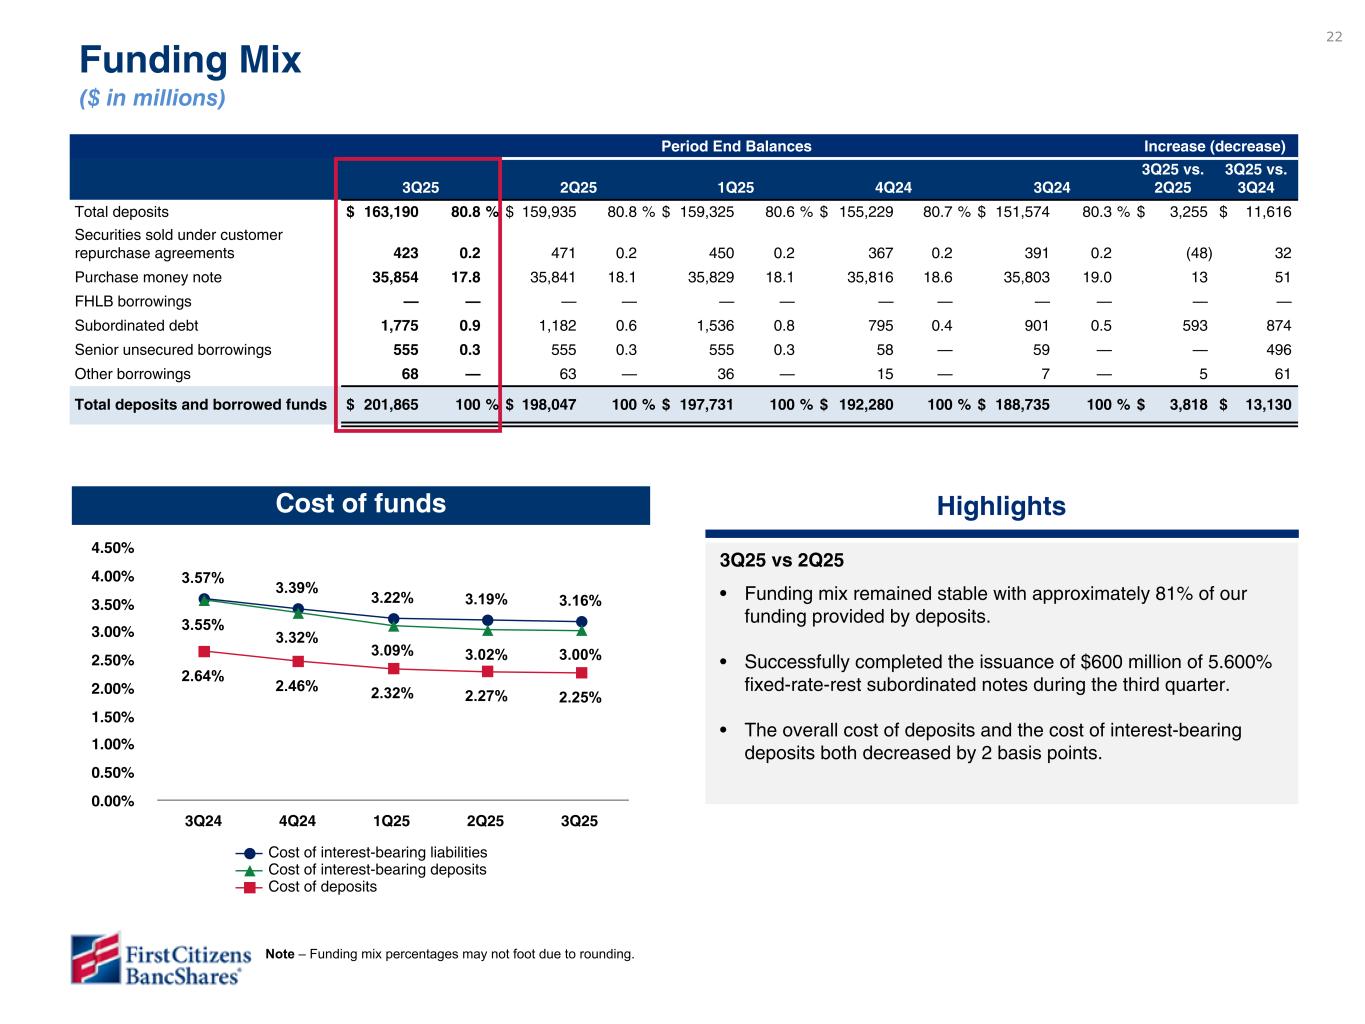
22 3.57% 3.39% 3.22% 3.19% 3.16% 3.55% 3.32% 3.09% 3.02% 3.00% 2.64% 2.46% 2.32% 2.27% 2.25% Cost of interest-bearing liabilities Cost of interest-bearing deposits Cost of deposits 3Q24 4Q24 1Q25 2Q25 3Q25 0.00% 0.50% 1.00% 1.50% 2.00% 2.50% 3.00% 3.50% 4.00% 4.50% Cost of funds Additional sources of liquidity Categories $ in millions FHLB $ 9,218 FRB 4,203 Line of credit 100 Total $ 13,521 Period End Balances Increase (decrease) 3Q25 2Q25 1Q25 4Q24 3Q24 3Q25 vs. 2Q25 3Q25 vs. 3Q24 Total deposits $ 163,190 80.8 % $ 159,935 80.8 % $ 159,325 80.6 % $ 155,229 80.7 % $ 151,574 80.3 % $ 3,255 $ 11,616 Securities sold under customer repurchase agreements 423 0.2 471 0.2 450 0.2 367 0.2 391 0.2 (48) 32 Purchase money note 35,854 17.8 35,841 18.1 35,829 18.1 35,816 18.6 35,803 19.0 13 51 FHLB borrowings — — — — — — — — — — — — Subordinated debt 1,775 0.9 1,182 0.6 1,536 0.8 795 0.4 901 0.5 593 874 Senior unsecured borrowings 555 0.3 555 0.3 555 0.3 58 — 59 — — 496 Other borrowings 68 — 63 — 36 — 15 — 7 — 5 61 Total deposits and borrowed funds $ 201,865 100 % $ 198,047 100 % $ 197,731 100 % $ 192,280 100 % $ 188,735 100 % $ 3,818 $ 13,130 Funding Mix ($ in millions) Highlights 3Q25 vs 2Q25 • Funding mix remained stable with approximately 81% of our funding provided by deposits. • Successfully completed the issuance of $600 million of 5.600% fixed-rate-rest subordinated notes during the third quarter. • The overall cost of deposits and the cost of interest-bearing deposits both decreased by 2 basis points. Note – Funding mix percentages may not foot due to rounding. 3Q25 vs 2Q25 • Funding mix remained stable with approximately 81% of our funding provided by deposits. • Successfully completed the issuance of $600 million of fixed-to- fixed rate subordinated notes during the third quarter. • The overall cost of deposits and the cost of interest-bearing deposits decreased by 2 and 2 basis points, respectively.
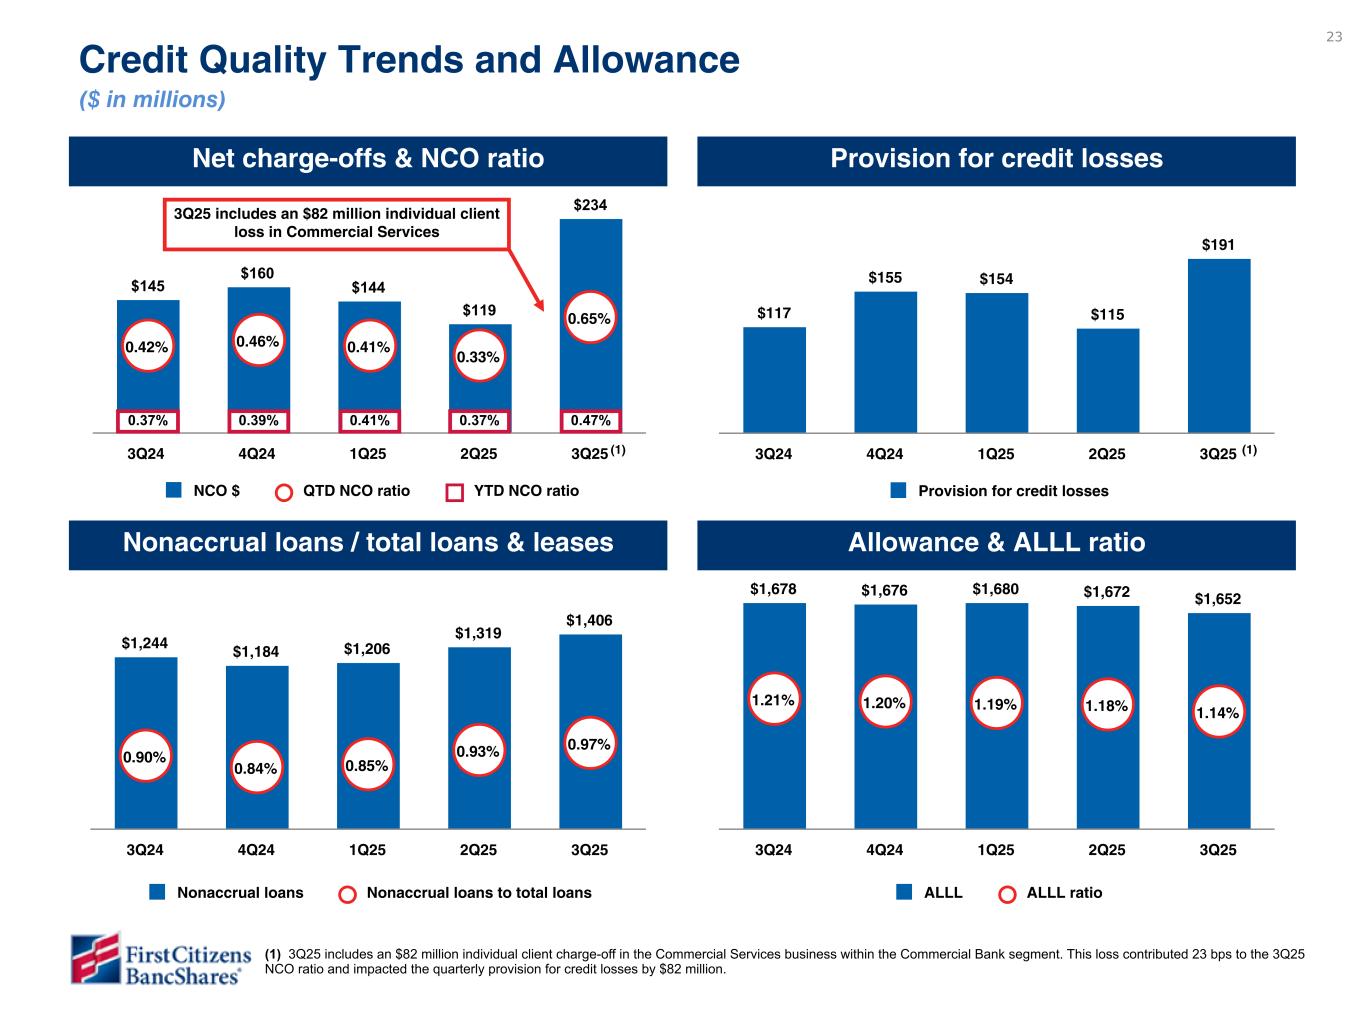
23 $117 $155 $154 $115 $191 Provision for credit losses 3Q24 4Q24 1Q25 2Q25 3Q25 Credit Quality Trends and Allowance ($ in millions) Net charge-offs & NCO ratio Provision for credit losses $145 $160 $144 $119 $234 0.42% 0.46% 0.41% 0.33% 0.65% NCO $ QTD NCO ratio YTD NCO ratio 3Q24 4Q24 1Q25 2Q25 3Q25 $1,244 $1,184 $1,206 $1,319 0.90% 0.84% 0.85% 0.93% 0.97% Nonaccrual loans Nonaccrual loans to total loans 3Q24 4Q24 1Q25 2Q25 3Q25 Nonaccrual loans / total loans & leases Allowance & ALLL ratio $1,678 $1,676 $1,680 $1,672 $1,652 1.21% 1.20% 1.19% 1.18% 1.14% ALLL ALLL ratio 3Q24 4Q24 1Q25 2Q25 3Q25 0.47%0.37% 0.39% 0.41% 0.37% To be updated in subsequent draft Nonaccrual loan balance and % to total loans numbers are preliminary and will be finalized in subsequent draft. $1,244 $1,184 $1,206 $1,319 $1,406 0.90% 0.84% 0.85% 0.93% 0.97% Nonaccrual loans Nonaccrual loans to total loans 3Q24 4Q24 1Q25 2Q25 3Q25 $234 $152 $82 Non-FB FB Non-FB Ratio FB Ratio 3Q24 4Q24 1Q25 2Q25 3Q25 (1) 3Q25 includes an $82 million individual client charge-off in the Commercial Services business within the Commercial Bank segment. This loss contributed 23 bps to the 3Q25 NCO ratio and impacted the quarterly provision for credit losses by $82 million. (1) 3Q25 includes an $82 million individual client loss in Commercial Services (1) Craig - We have not specifically called out ‘First Brands’ on the slide but do plan to note the company in the script (similar with JPM’s approach to discuss ‘tricolor’ during Q&A but to leave off the IP). Additionally, in the ER we are calling this business ‘supply chain finance’. We have opted to call this ‘Commercial Services’, which is aligned with how we have historically discussed this business in the IP and script. Jim Mortimer in legal is aligned with this approach as well.

24 $1,672 $(31) $(15) $(8) $21 $13 $1,652 2Q25 Economic outlook Other Portfolio changes Specific reserves Loan volume 3Q25 Highlights 3Q25 vs 2Q25 • ALLL decreased $20 million from the linked quarter. • The decrease compared to the linked quarter was driven by improvements in the economic outlook and other changes, including the elimination of reserves related to Hurricane Helene. These reductions were partially offset by higher specific reserves for individually evaluated loans and growth in higher credit quality loan portfolios. • The ALLL covered annualized net charge-offs 1.7 times. The reduction in coverage compared to the linked quarter was driven by an $82 million Commercial Bank segment net charge-off in the third quarter. The ALLL provided 1.2 times coverage of nonaccrual loans. ALLL Coverage 2.9x 2.6x 2.9x 3.5x 1.7x 1.4x 1.4x 1.4x 1.3x 1.2x ALLL ratio / NCO ratio ALLL / Nonaccrual loans 3Q24 4Q24 1Q25 2Q25 3Q25 2Q25 to 3Q25 Allowance for loan and lease losses ($ in millions) Please do not review - data still being finalized. To be provided in subsequent draft. Highlights commentary with Robert for review To be updated in subsequent draft once data is available. Please do not review
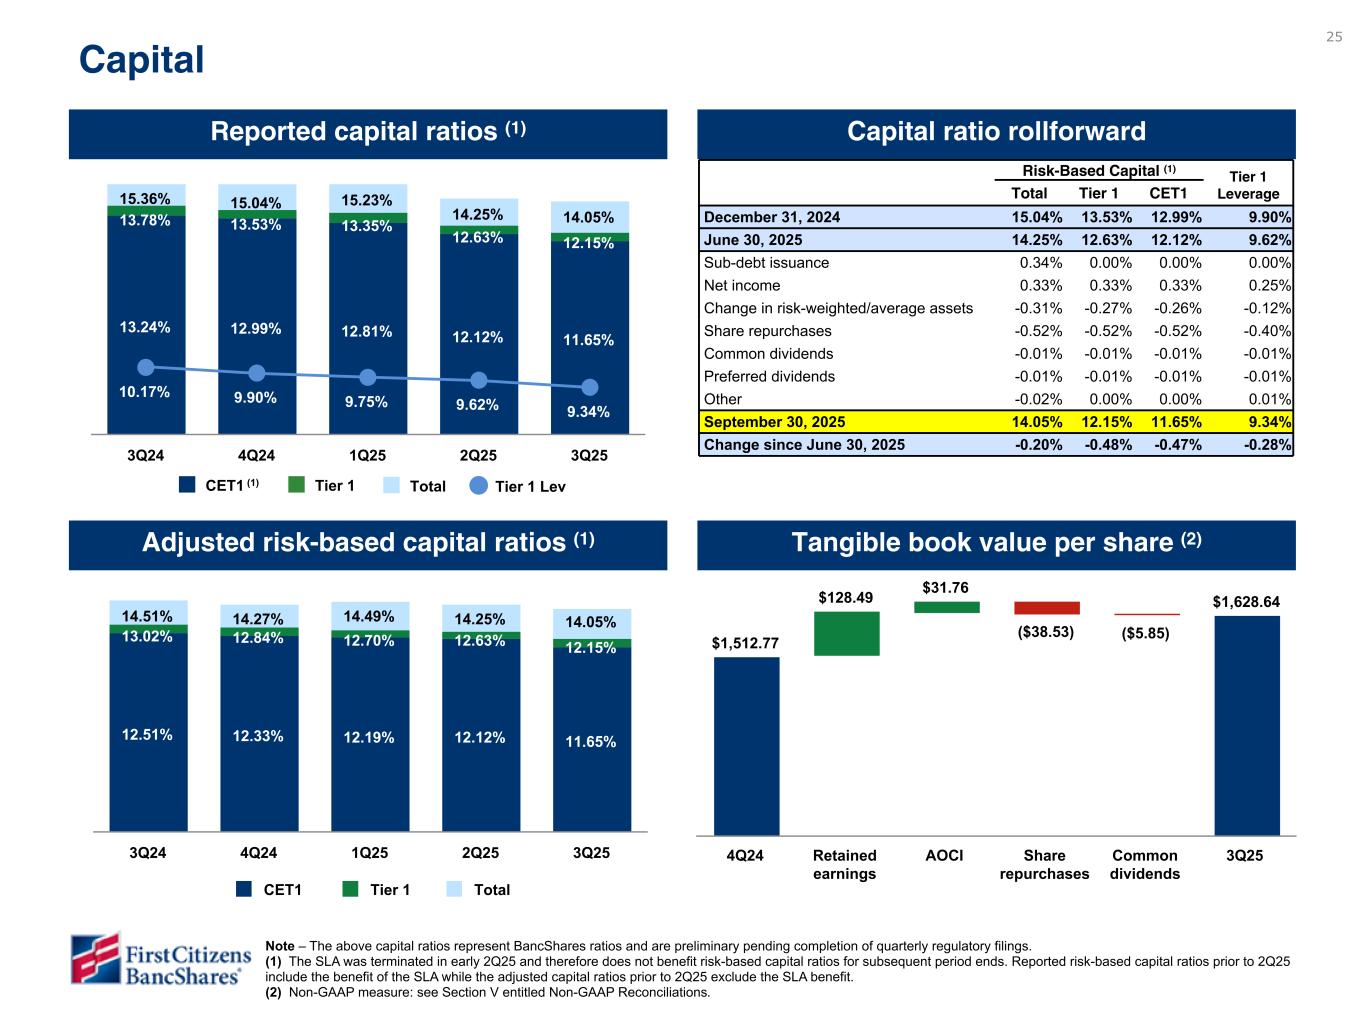
25 Reported capital ratios (1) Capital ratio rollforward Adjusted risk-based capital ratios (1) Tangible book value per share (2) Capital Risk-Based Capital (1) Tier 1 Leverage Total Tier 1 CET1 December 31, 2024 15.04 % 13.53 % 12.99 % 9.90 % June 30, 2025 14.25 % 12.63 % 12.12 % 9.62 % Sub-debt issuance 0.34 % 0.00 % 0.00 % 0.00 % Net income 0.33 % 0.33 % 0.33 % 0.25 % Change in risk-weighted/average assets -0.31 % -0.27 % -0.26 % -0.12 % Share repurchases -0.52 % -0.52 % -0.52 % -0.40 % Common dividends -0.01 % -0.01 % -0.01 % -0.01 % Preferred dividends -0.01 % -0.01 % -0.01 % -0.01 % Other -0.02 % 0.00 % 0.00 % 0.01 % September 30, 2025 14.05 % 12.15 % 11.65 % 9.34 % Change since June 30, 2025 -0.20 % -0.48 % -0.47 % -0.28 % 13.24% 12.99% 12.81% 12.12% 11.65% 13.78% 13.53% 13.35% 12.63% 12.15% 15.36% 15.04% 15.23% 14.25% 14.05% 3Q24 4Q24 1Q25 2Q25 3Q25 $1,512.77 $128.49 $31.76 ($38.53) ($5.85) $1,628.64 4Q24 Retained earnings AOCI Share repurchases Common dividends 3Q25 Note – The above capital ratios represent BancShares ratios and are preliminary pending completion of quarterly regulatory filings. (1) The SLA was terminated in early 2Q25 and therefore does not benefit risk-based capital ratios for subsequent period ends. Reported risk-based capital ratios prior to 2Q25 include the benefit of the SLA while the adjusted capital ratios prior to 2Q25 exclude the SLA benefit. (2) Non-GAAP measure: see Section V entitled Non-GAAP Reconciliations. 10.17% 9.90% 9.75% 9.62% 9.34% Tier 1 Lev 12.51% 12.33% 12.19% 12.12% 11.65% 13.02% 12.84% 12.70% 12.63% 12.15% 14.51% 14.27% 14.49% 14.25% 14.05% CET1 Tier 1 Total 3Q24 4Q24 1Q25 2Q25 3Q25 Please do not review - data still being finalized. To be provided in subsequent draft. CET1 (1) Tier 1 Total To be updated in subsequent draft once data is available. Please do not review
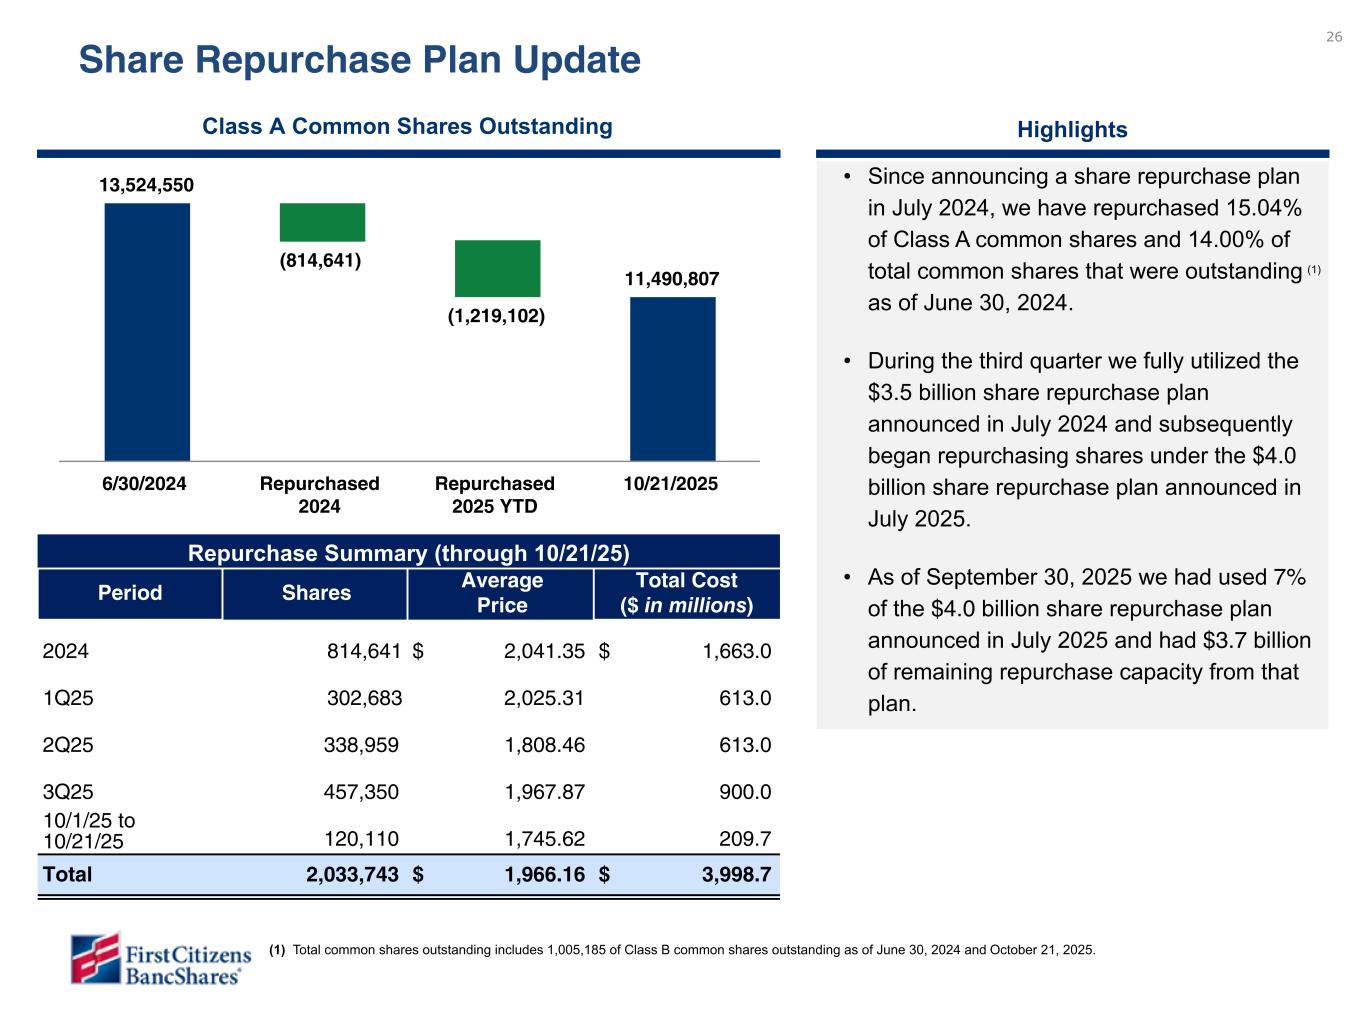
26 Share Repurchase Plan Update • Since announcing a share repurchase plan in July 2024, we have repurchased 15.04% of Class A common shares and 14.00% of total common shares that were outstanding (1) as of June 30, 2024. • During the third quarter we fully utilized the $3.5 billion share repurchase plan announced in July 2024 and subsequently began repurchasing shares under the $4.0 billion share repurchase plan announced in July 2025. • As of September 30, 2025 we had used 7% of the $4.0 billion share repurchase plan announced in July 2025 and had $3.7 billion of remaining repurchase capacity from that plan. Highlights Class A Common Shares Outstanding Repurchase Summary (through 10/21/25) Period Shares Average Price Total Cost ($ in millions) 2024 814,641 $ 2,041.35 $ 1,663.0 1Q25 302,683 2,025.31 613.0 2Q25 338,959 1,808.46 613.0 3Q25 457,350 1,967.87 900.0 10/1/25 to 10/21/25 120,110 1,745.62 209.7 Total 2,033,743 $ 1,966.16 $ 3,998.7 13,524,550 (814,641) (1,219,102) 11,490,807 6/30/2024 Repurchased 2024 Repurchased 2025 YTD 10/21/2025 (1) Total common shares outstanding includes 1,005,185 of Class B common shares outstanding as of June 30, 2024 and October 21, 2025. Note to Craig: We have updated the SRP slide in consultation with Tom/David given the dual plan authorizations. Some of the major changes include: 1) switched walk from repurchase authorization and activity to Class A common shares outstanding, 2)removed “Repurchase Completed” % column from table to eliminate confusion over which authorization each period drew from and 3) adjusted highlights commentary to align with new approach Slide is updated through 9/30 but will ultimately include data through 10/21
Financial Outlook Section III
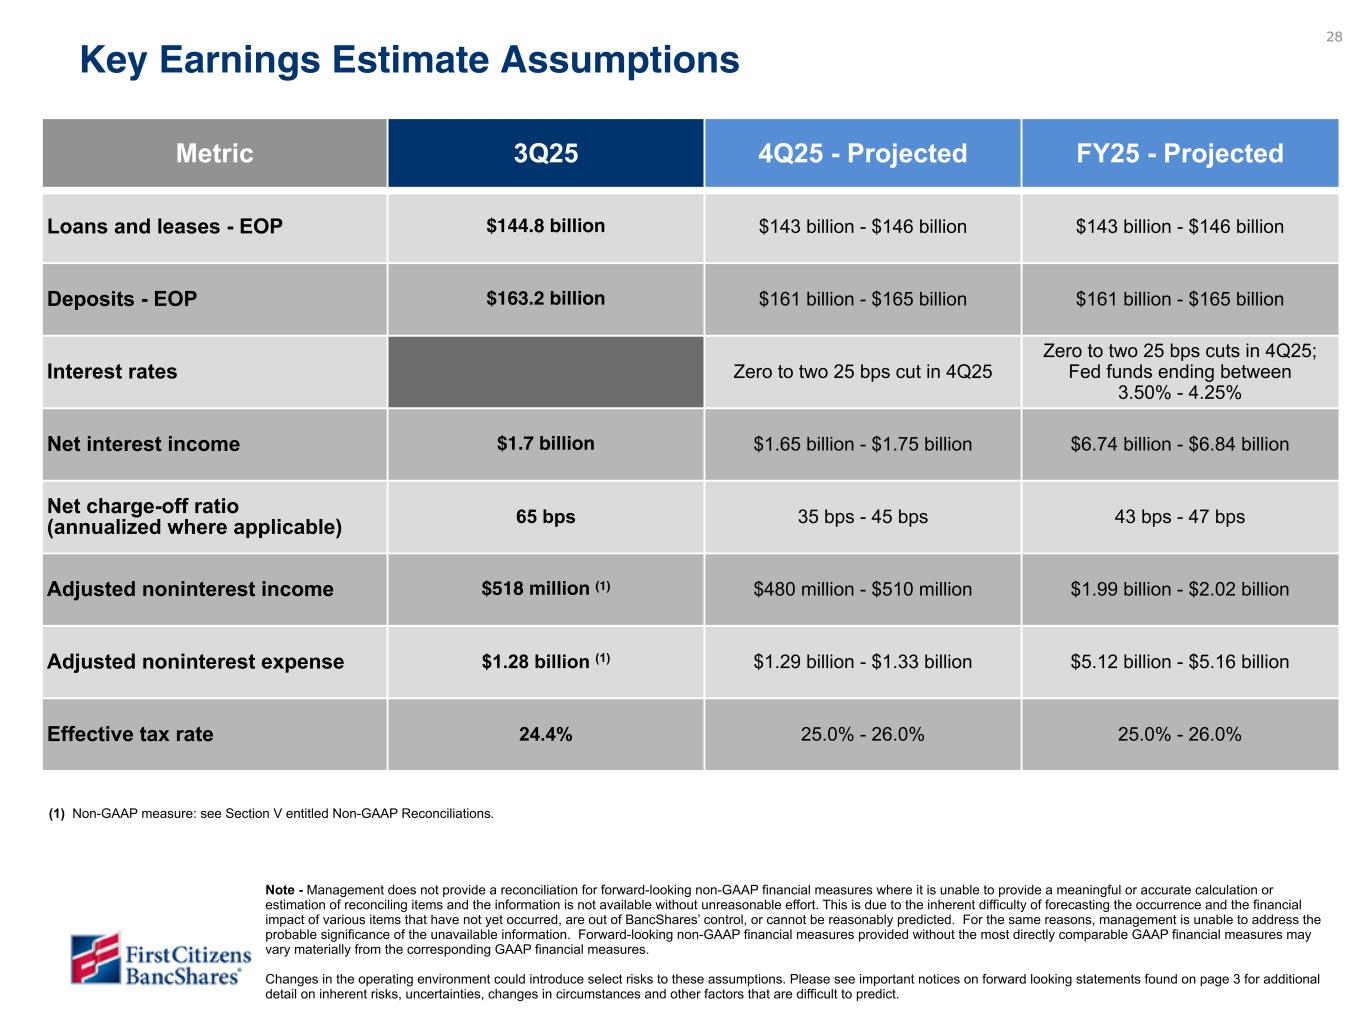
28 Metric 3Q25 4Q25 - Projected FY25 - Projected Loans and leases - EOP $144.8 billion $143 billion - $146 billion $143 billion - $146 billion Deposits - EOP $163.2 billion $161 billion - $165 billion $161 billion - $165 billion Interest rates Zero to two 25 bps cut in 4Q25 Zero to two 25 bps cuts in 4Q25; Fed funds ending between 3.50% - 4.25% Net interest income $1.7 billion $1.65 billion - $1.75 billion $6.74 billion - $6.84 billion Net charge-off ratio (annualized where applicable) 65 bps 35 bps - 45 bps 43 bps - 47 bps Adjusted noninterest income $518 million (1) $480 million - $510 million $1.99 billion - $2.02 billion Adjusted noninterest expense $1.28 billion (1) $1.29 billion - $1.33 billion $5.12 billion - $5.16 billion Effective tax rate 24.4% 25.0% - 26.0% 25.0% - 26.0% Key Earnings Estimate Assumptions (1) Non-GAAP measure: see Section V entitled Non-GAAP Reconciliations. Note - Management does not provide a reconciliation for forward-looking non-GAAP financial measures where it is unable to provide a meaningful or accurate calculation or estimation of reconciling items and the information is not available without unreasonable effort. This is due to the inherent difficulty of forecasting the occurrence and the financial impact of various items that have not yet occurred, are out of BancShares’ control, or cannot be reasonably predicted. For the same reasons, management is unable to address the probable significance of the unavailable information. Forward-looking non-GAAP financial measures provided without the most directly comparable GAAP financial measures may vary materially from the corresponding GAAP financial measures. Changes in the operating environment could introduce select risks to these assumptions. Please see important notices on forward looking statements found on page 3 for additional detail on inherent risks, uncertainties, changes in circumstances and other factors that are difficult to predict. To be updated in subsequent draft once data is available. Please do not review

Appendix Section IV
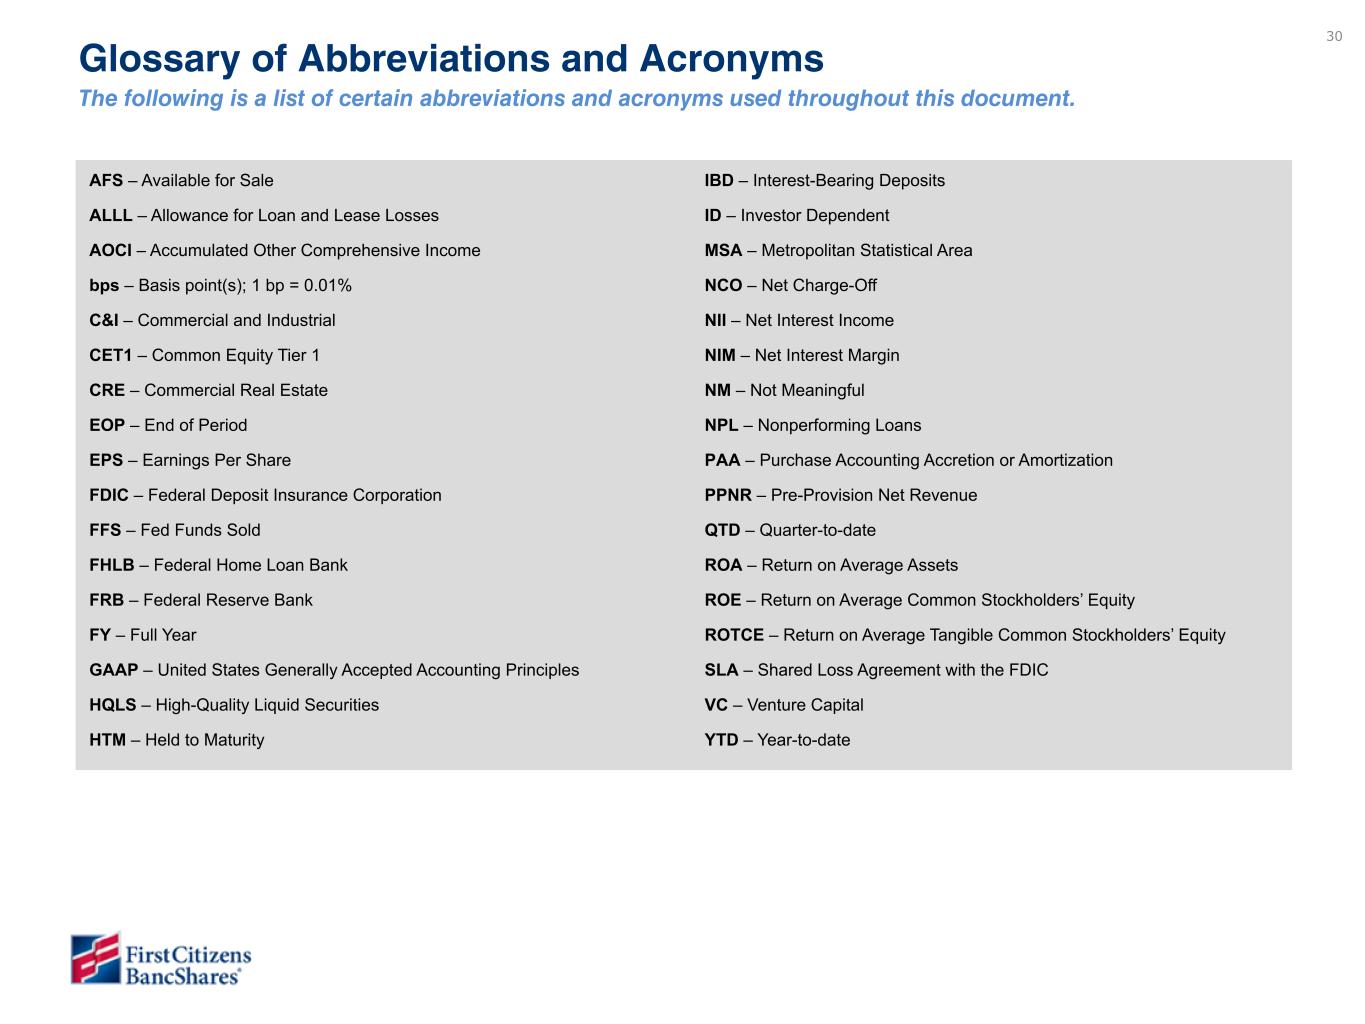
30 Glossary of Abbreviations and Acronyms The following is a list of certain abbreviations and acronyms used throughout this document. AFS – Available for Sale ALLL – Allowance for Loan and Lease Losses AOCI – Accumulated Other Comprehensive Income bps – Basis point(s); 1 bp = 0.01% C&I – Commercial and Industrial CET1 – Common Equity Tier 1 CRE – Commercial Real Estate EOP – End of Period EPS – Earnings Per Share FDIC – Federal Deposit Insurance Corporation FFS – Fed Funds Sold FHLB – Federal Home Loan Bank FRB – Federal Reserve Bank FY – Full Year GAAP – United States Generally Accepted Accounting Principles HQLS – High-Quality Liquid Securities HTM – Held to Maturity IBD – Interest-Bearing Deposits ID – Investor Dependent MSA – Metropolitan Statistical Area NCO – Net Charge-Off NII – Net Interest Income NIM – Net Interest Margin NM – Not Meaningful NPL – Nonperforming Loans PAA – Purchase Accounting Accretion or Amortization PPNR – Pre-Provision Net Revenue QTD – Quarter-to-date ROA – Return on Average Assets ROE – Return on Average Common Stockholders’ Equity ROTCE – Return on Average Tangible Common Stockholders’ Equity SLA – Shared Loss Agreement with the FDIC VC – Venture Capital YTD – Year-to-date 3Q25 Additions 3Q25 Removals Archive ACL – Allowance for Credit Losses CAB - Community Association Banking NIB - Noninterest-bearing RBC - Risk-Based Capital TA - Tangible Assets TCE - Tangible Common Equity AUM – Assets Under Management AWA – Affluent Wealth Advisors LIBOR – London Inter-Bank Offered Rate LOC – Line of Credit MSA – Metropolitan Statistical Area PE – Private Equity RIA – Registered Investment Advisor SOFR – Secured Overnight Financing Rate LTD – Long Term Debt RWA – Risk Weighted Assets ACH – Automated clearing house CECL – Current Expected Credit Losses ETF – Exchange-Traded Fund FFR – Federal Funds Rate IPO – Initial Public Offering LP – Limited Partner VC – Venture Capital AI – Artificial Intelligence FFR – Federal Funds Rate FY – Full Year GFB – Global Fund Banking OBS – Off Balance Sheet Client Funds PCD – Purchased Credit Deteriorated LFI – Large Financial Institution TBV – Tangible Book Value FX – Foreign Exchange Under review - to be provided in subsequent draft Not on main pages and/or do not come up in search AOCI QTD
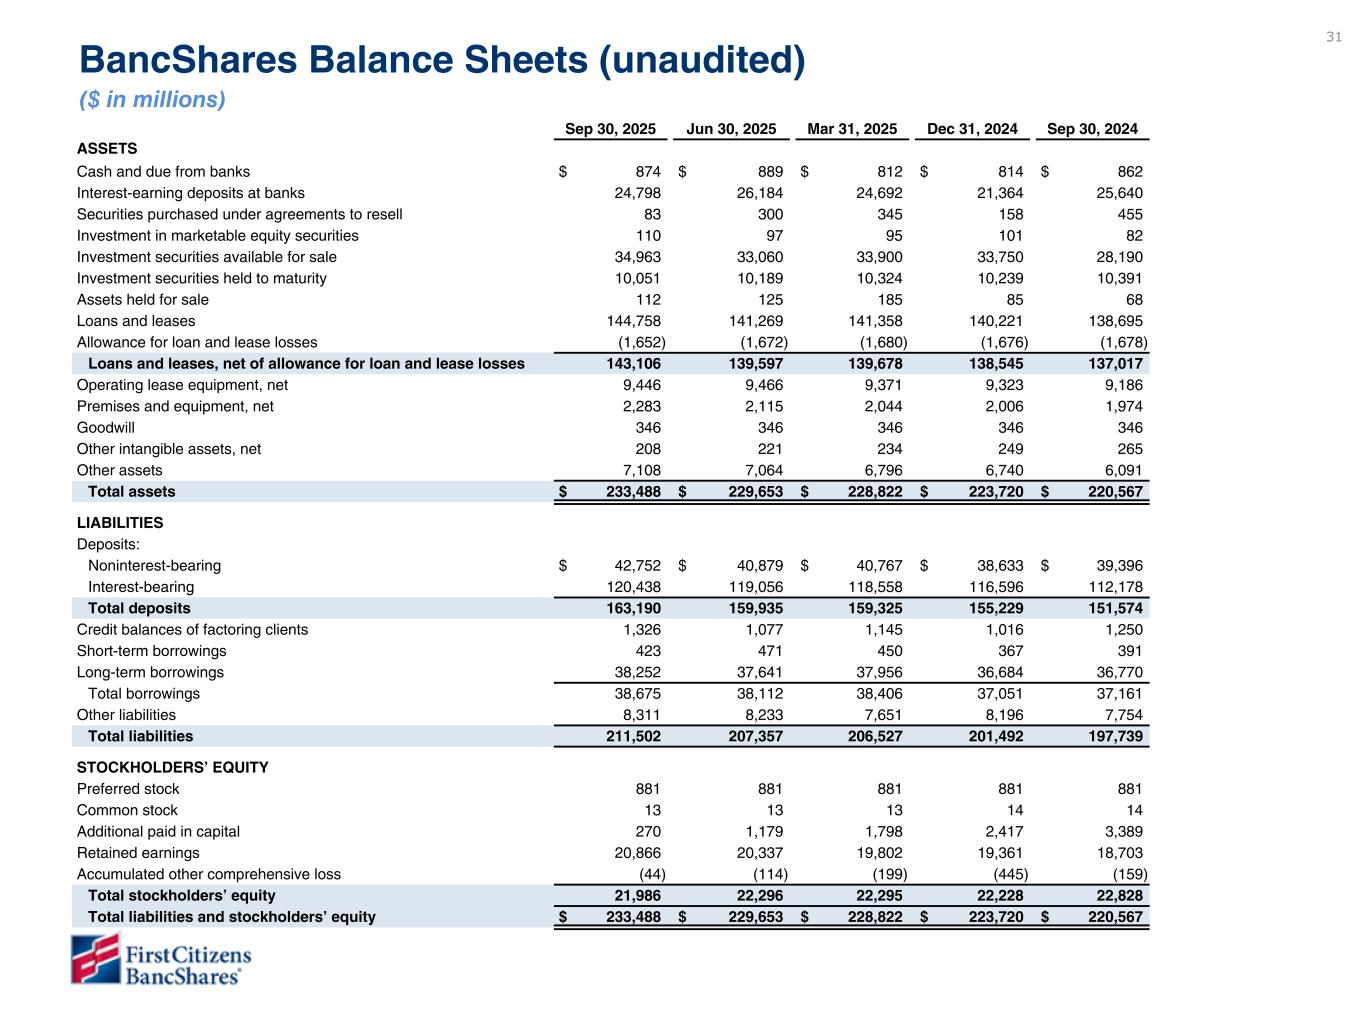
31 Sep 30, 2025 Jun 30, 2025 Mar 31, 2025 Dec 31, 2024 Sep 30, 2024 ASSETS Cash and due from banks $ 874 $ 889 $ 812 $ 814 $ 862 Interest-earning deposits at banks 24,798 26,184 24,692 21,364 25,640 Securities purchased under agreements to resell 83 300 345 158 455 Investment in marketable equity securities 110 97 95 101 82 Investment securities available for sale 34,963 33,060 33,900 33,750 28,190 Investment securities held to maturity 10,051 10,189 10,324 10,239 10,391 Assets held for sale 112 125 185 85 68 Loans and leases 144,758 141,269 141,358 140,221 138,695 Allowance for loan and lease losses (1,652) (1,672) (1,680) (1,676) (1,678) Loans and leases, net of allowance for loan and lease losses 143,106 139,597 139,678 138,545 137,017 Operating lease equipment, net 9,446 9,466 9,371 9,323 9,186 Premises and equipment, net 2,283 2,115 2,044 2,006 1,974 Goodwill 346 346 346 346 346 Other intangible assets, net 208 221 234 249 265 Other assets 7,108 7,064 6,796 6,740 6,091 Total assets $ 233,488 $ 229,653 $ 228,822 $ 223,720 $ 220,567 LIABILITIES Deposits: Noninterest-bearing $ 42,752 $ 40,879 $ 40,767 $ 38,633 $ 39,396 Interest-bearing 120,438 119,056 118,558 116,596 112,178 Total deposits 163,190 159,935 159,325 155,229 151,574 Credit balances of factoring clients 1,326 1,077 1,145 1,016 1,250 Short-term borrowings 423 471 450 367 391 Long-term borrowings 38,252 37,641 37,956 36,684 36,770 Total borrowings 38,675 38,112 38,406 37,051 37,161 Other liabilities 8,311 8,233 7,651 8,196 7,754 Total liabilities 211,502 207,357 206,527 201,492 197,739 STOCKHOLDERS’ EQUITY Preferred stock 881 881 881 881 881 Common stock 13 13 13 14 14 Additional paid in capital 270 1,179 1,798 2,417 3,389 Retained earnings 20,866 20,337 19,802 19,361 18,703 Accumulated other comprehensive loss (44) (114) (199) (445) (159) Total stockholders’ equity 21,986 22,296 22,295 22,228 22,828 Total liabilities and stockholders’ equity $ 233,488 $ 229,653 $ 228,822 $ 223,720 $ 220,567 BancShares Balance Sheets (unaudited) ($ in millions)
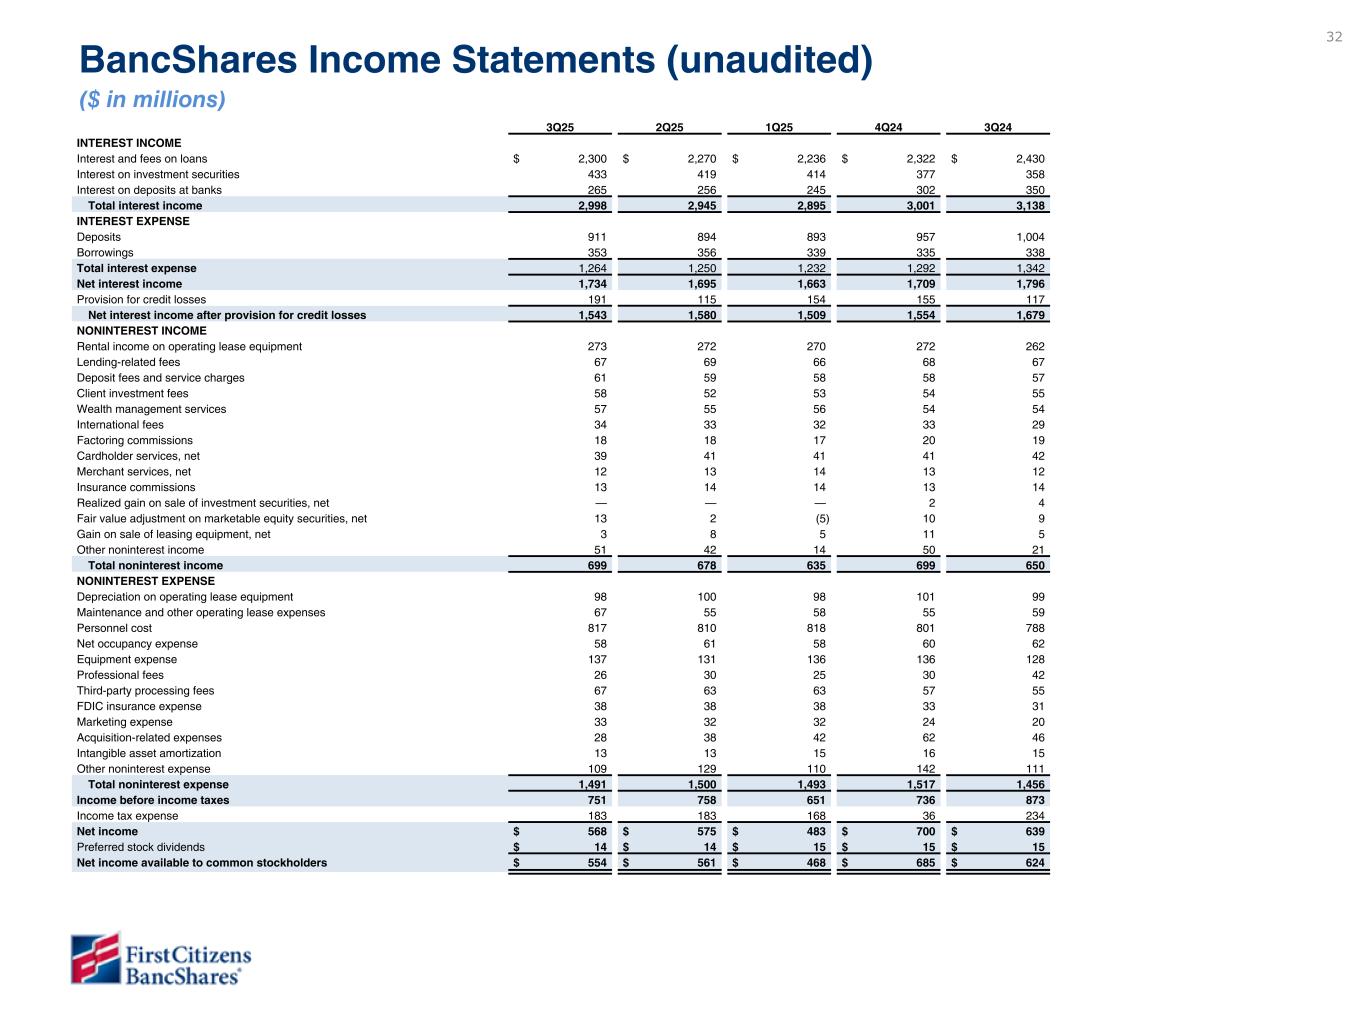
32 3Q25 2Q25 1Q25 4Q24 3Q24 INTEREST INCOME Interest and fees on loans $ 2,300 $ 2,270 $ 2,236 $ 2,322 $ 2,430 Interest on investment securities 433 419 414 377 358 Interest on deposits at banks 265 256 245 302 350 Total interest income 2,998 2,945 2,895 3,001 3,138 INTEREST EXPENSE Deposits 911 894 893 957 1,004 Borrowings 353 356 339 335 338 Total interest expense 1,264 1,250 1,232 1,292 1,342 Net interest income 1,734 1,695 1,663 1,709 1,796 Provision for credit losses 191 115 154 155 117 Net interest income after provision for credit losses 1,543 1,580 1,509 1,554 1,679 NONINTEREST INCOME Rental income on operating lease equipment 273 272 270 272 262 Lending-related fees 67 69 66 68 67 Deposit fees and service charges 61 59 58 58 57 Client investment fees 58 52 53 54 55 Wealth management services 57 55 56 54 54 International fees 34 33 32 33 29 Factoring commissions 18 18 17 20 19 Cardholder services, net 39 41 41 41 42 Merchant services, net 12 13 14 13 12 Insurance commissions 13 14 14 13 14 Realized gain on sale of investment securities, net — — — 2 4 Fair value adjustment on marketable equity securities, net 13 2 (5) 10 9 Gain on sale of leasing equipment, net 3 8 5 11 5 Other noninterest income 51 42 14 50 21 Total noninterest income 699 678 635 699 650 NONINTEREST EXPENSE Depreciation on operating lease equipment 98 100 98 101 99 Maintenance and other operating lease expenses 67 55 58 55 59 Personnel cost 817 810 818 801 788 Net occupancy expense 58 61 58 60 62 Equipment expense 137 131 136 136 128 Professional fees 26 30 25 30 42 Third-party processing fees 67 63 63 57 55 FDIC insurance expense 38 38 38 33 31 Marketing expense 33 32 32 24 20 Acquisition-related expenses 28 38 42 62 46 Intangible asset amortization 13 13 15 16 15 Other noninterest expense 109 129 110 142 111 Total noninterest expense 1,491 1,500 1,493 1,517 1,456 Income before income taxes 751 758 651 736 873 Income tax expense 183 183 168 36 234 Net income $ 568 $ 575 $ 483 $ 700 $ 639 Preferred stock dividends $ 14 $ 14 $ 15 $ 15 $ 15 Net income available to common stockholders $ 554 $ 561 $ 468 $ 685 $ 624 BancShares Income Statements (unaudited) ($ in millions)
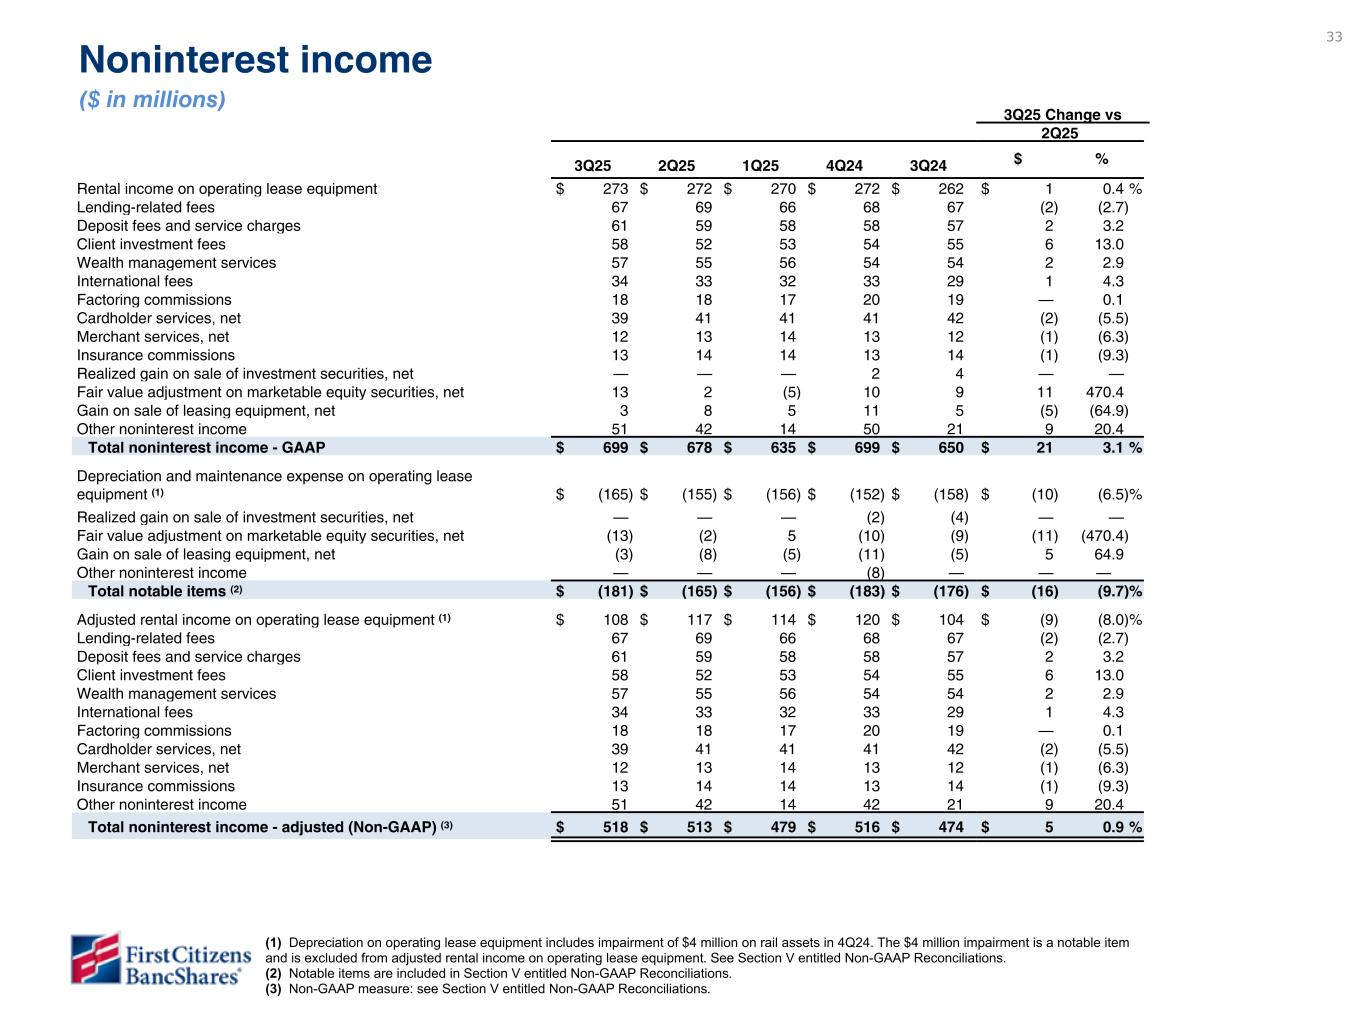
33 Noninterest income ($ in millions) 3Q25 Change vs 2Q25 3Q25 2Q25 1Q25 4Q24 3Q24 $ % Rental income on operating lease equipment $ 273 $ 272 $ 270 $ 272 $ 262 $ 1 0.4 % Lending-related fees 67 69 66 68 67 (2) (2.7) Deposit fees and service charges 61 59 58 58 57 2 3.2 Client investment fees 58 52 53 54 55 6 13.0 Wealth management services 57 55 56 54 54 2 2.9 International fees 34 33 32 33 29 1 4.3 Factoring commissions 18 18 17 20 19 — 0.1 Cardholder services, net 39 41 41 41 42 (2) (5.5) Merchant services, net 12 13 14 13 12 (1) (6.3) Insurance commissions 13 14 14 13 14 (1) (9.3) Realized gain on sale of investment securities, net — — — 2 4 — — Fair value adjustment on marketable equity securities, net 13 2 (5) 10 9 11 470.4 Gain on sale of leasing equipment, net 3 8 5 11 5 (5) (64.9) Other noninterest income 51 42 14 50 21 9 20.4 Total noninterest income - GAAP $ 699 $ 678 $ 635 $ 699 $ 650 $ 21 3.1 % Depreciation and maintenance expense on operating lease equipment (1) $ (165) $ (155) $ (156) $ (152) $ (158) $ (10) (6.5) % Realized gain on sale of investment securities, net — — — (2) (4) — — Fair value adjustment on marketable equity securities, net (13) (2) 5 (10) (9) (11) (470.4) Gain on sale of leasing equipment, net (3) (8) (5) (11) (5) 5 64.9 Other noninterest income — — — (8) — — — Total notable items (2) $ (181) $ (165) $ (156) $ (183) $ (176) $ (16) (9.7) % Adjusted rental income on operating lease equipment (1) $ 108 $ 117 $ 114 $ 120 $ 104 $ (9) (8.0) % Lending-related fees 67 69 66 68 67 (2) (2.7) Deposit fees and service charges 61 59 58 58 57 2 3.2 Client investment fees 58 52 53 54 55 6 13.0 Wealth management services 57 55 56 54 54 2 2.9 International fees 34 33 32 33 29 1 4.3 Factoring commissions 18 18 17 20 19 — 0.1 Cardholder services, net 39 41 41 41 42 (2) (5.5) Merchant services, net 12 13 14 13 12 (1) (6.3) Insurance commissions 13 14 14 13 14 (1) (9.3) Other noninterest income 51 42 14 42 21 9 20.4 Total noninterest income - adjusted (Non-GAAP) (3) $ 518 $ 513 $ 479 $ 516 $ 474 $ 5 0.9 % (1) Depreciation on operating lease equipment includes impairment of $4 million on rail assets in 4Q24. The $4 million impairment is a notable item and is excluded from adjusted rental income on operating lease equipment. See Section V entitled Non-GAAP Reconciliations. (2) Notable items are included in Section V entitled Non-GAAP Reconciliations. (3) Non-GAAP measure: see Section V entitled Non-GAAP Reconciliations.
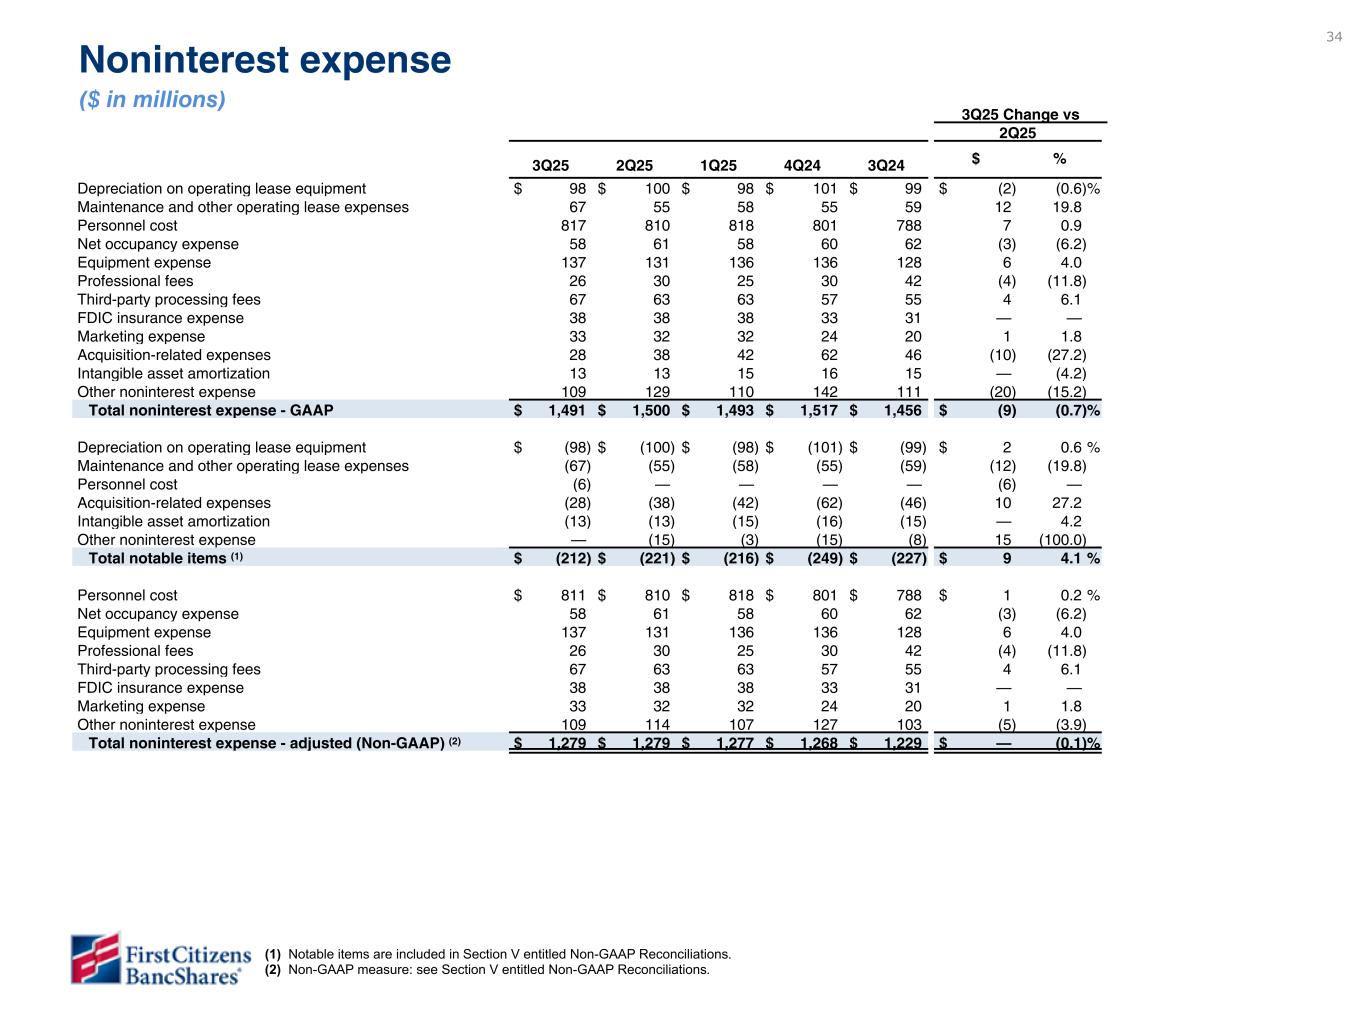
34 3Q25 Change vs 2Q25 3Q25 2Q25 1Q25 4Q24 3Q24 $ % Depreciation on operating lease equipment $ 98 $ 100 $ 98 $ 101 $ 99 $ (2) (0.6) % Maintenance and other operating lease expenses 67 55 58 55 59 12 19.8 Personnel cost 817 810 818 801 788 7 0.9 Net occupancy expense 58 61 58 60 62 (3) (6.2) Equipment expense 137 131 136 136 128 6 4.0 Professional fees 26 30 25 30 42 (4) (11.8) Third-party processing fees 67 63 63 57 55 4 6.1 FDIC insurance expense 38 38 38 33 31 — — Marketing expense 33 32 32 24 20 1 1.8 Acquisition-related expenses 28 38 42 62 46 (10) (27.2) Intangible asset amortization 13 13 15 16 15 — (4.2) Other noninterest expense 109 129 110 142 111 (20) (15.2) Total noninterest expense - GAAP $ 1,491 $ 1,500 $ 1,493 $ 1,517 $ 1,456 $ (9) (0.7) % Depreciation on operating lease equipment $ (98) $ (100) $ (98) $ (101) $ (99) $ 2 0.6 % Maintenance and other operating lease expenses (67) (55) (58) (55) (59) (12) (19.8) Personnel cost (6) — — — — (6) — Acquisition-related expenses (28) (38) (42) (62) (46) 10 27.2 Intangible asset amortization (13) (13) (15) (16) (15) — 4.2 Other noninterest expense — (15) (3) (15) (8) 15 (100.0) Total notable items (1) $ (212) $ (221) $ (216) $ (249) $ (227) $ 9 4.1 % Personnel cost $ 811 $ 810 $ 818 $ 801 $ 788 $ 1 0.2 % Net occupancy expense 58 61 58 60 62 (3) (6.2) Equipment expense 137 131 136 136 128 6 4.0 Professional fees 26 30 25 30 42 (4) (11.8) Third-party processing fees 67 63 63 57 55 4 6.1 FDIC insurance expense 38 38 38 33 31 — — Marketing expense 33 32 32 24 20 1 1.8 Other noninterest expense 109 114 107 127 103 (5) (3.9) Total noninterest expense - adjusted (Non-GAAP) (2) $ 1,279 $ 1,279 $ 1,277 $ 1,268 $ 1,229 $ — (0.1) % Noninterest expense ($ in millions) (1) Notable items are included in Section V entitled Non-GAAP Reconciliations. (2) Non-GAAP measure: see Section V entitled Non-GAAP Reconciliations.
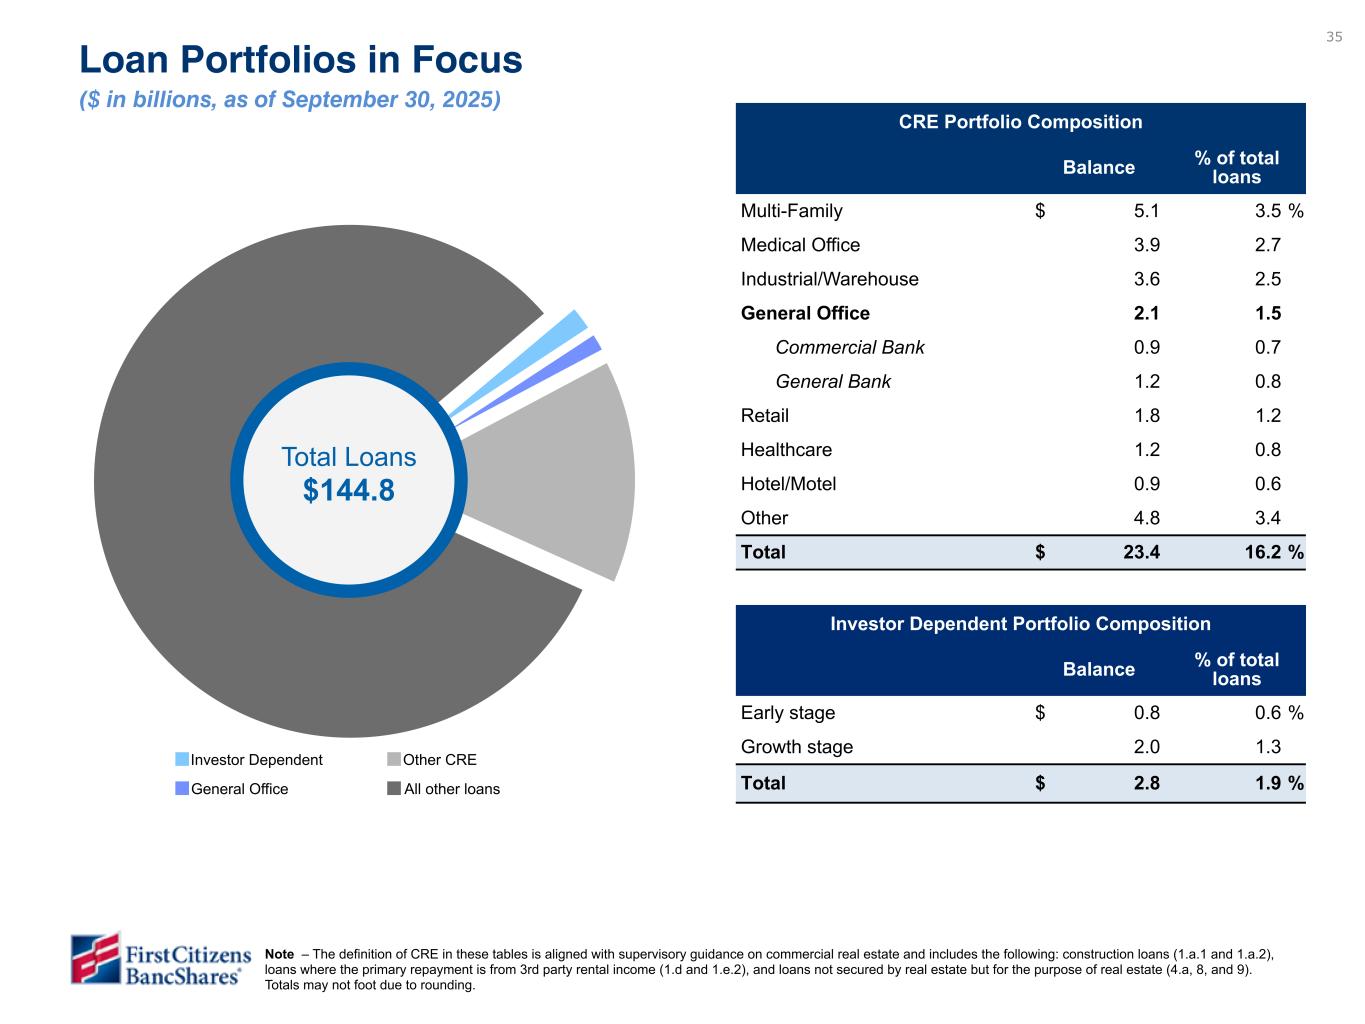
35 Loan Portfolios in Focus ($ in billions, as of September 30, 2025) Total Loans $144.8 CRE $23.4 CRE Portfolio Composition Balance % of total loans Multi-Family $ 5.1 3.5 % Medical Office 3.9 2.7 Industrial/Warehouse 3.6 2.5 General Office 2.1 1.5 Commercial Bank 0.9 0.7 General Bank 1.2 0.8 Retail 1.8 1.2 Healthcare 1.2 0.8 Hotel/Motel 0.9 0.6 Other 4.8 3.4 Total $ 23.4 16.2 % Investor Dependent Portfolio Composition Balance % of total loans Early stage $ 0.8 0.6 % Growth stage 2.0 1.3 Total $ 2.8 1.9 % Investor dependent $2.8 Note – The definition of CRE in these tables is aligned with supervisory guidance on commercial real estate and includes the following: construction loans (1.a.1 and 1.a.2), loans where the primary repayment is from 3rd party rental income (1.d and 1.e.2), and loans not secured by real estate but for the purpose of real estate (4.a, 8, and 9). Totals may not foot due to rounding. Bottom table shifted given change in SEC classes this quarter and still working through formatting on this slide. Investor Dependent Other CRE All other loansGeneral Office General office balances are directional, but not yet final.
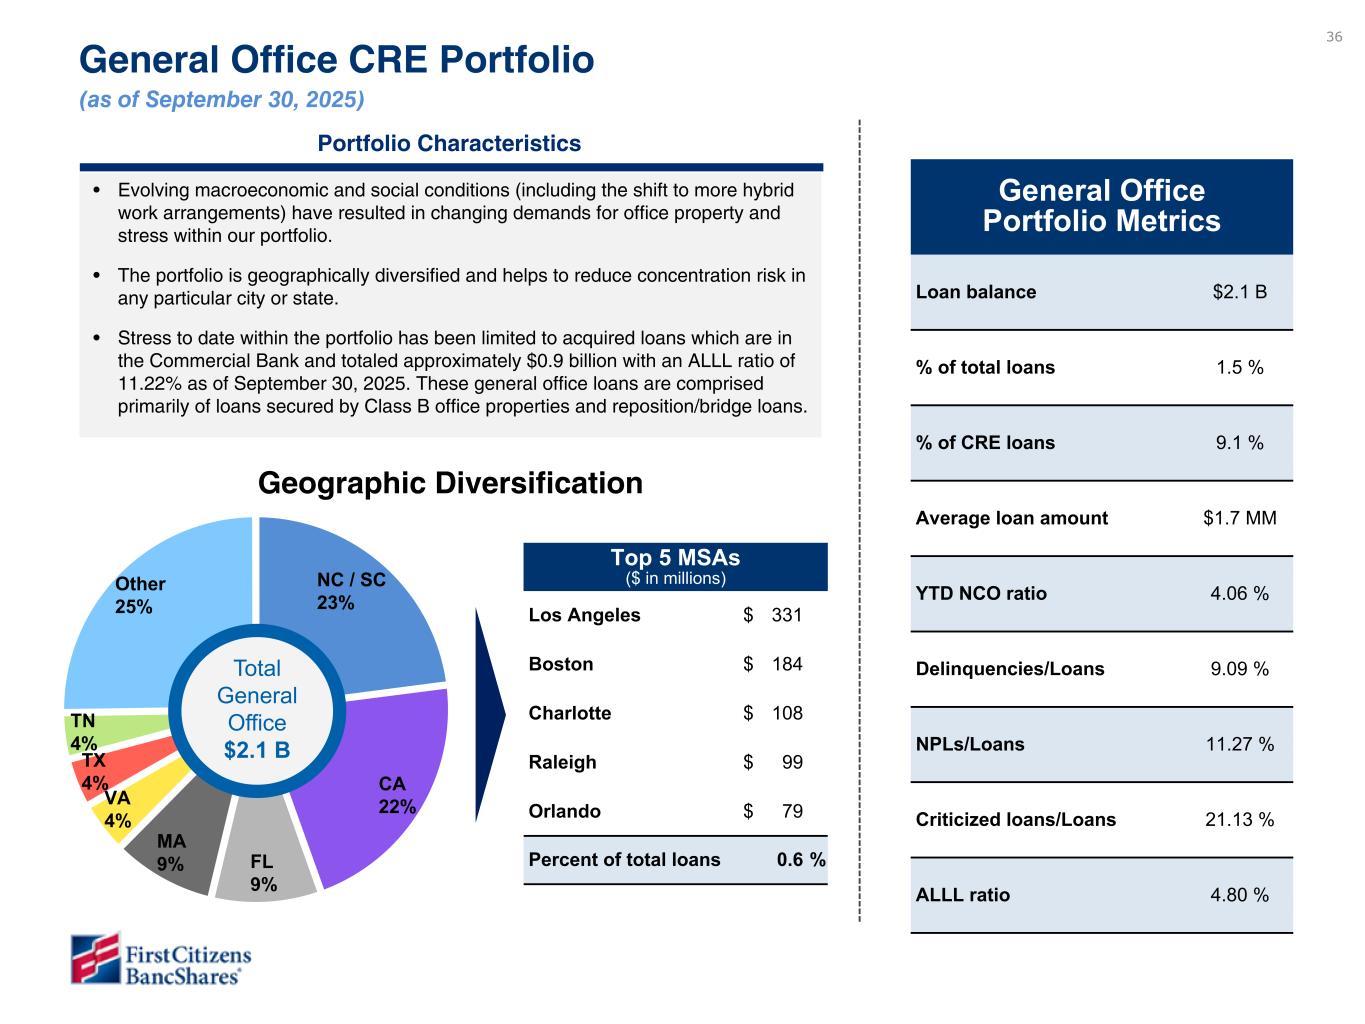
36 General Office CRE Portfolio (as of September 30, 2025) NC / SC 23% CA 22% FL 9% MA 9% VA 4% TX 4% TN 4% Other 25% Total General Office $2.1 B Geographic Diversification Top 5 MSAs ($ in millions) Los Angeles $ 331 Boston $ 184 Charlotte $ 108 Raleigh $ 99 Orlando $ 79 Percent of total loans 0.6 % General Office Portfolio Metrics Loan balance $2.1 B % of total loans 1.5 % % of CRE loans 9.1 % Average loan amount $1.7 MM YTD NCO ratio 4.06 % Delinquencies/Loans 9.09 % NPLs/Loans 11.27 % Criticized loans/Loans 21.13 % ALLL ratio 4.80 % Portfolio Characteristics • Evolving macroeconomic and social conditions (including the shift to more hybrid work arrangements) have resulted in changing demands for office property and stress within our portfolio. • The portfolio is geographically diversified and helps to reduce concentration risk in any particular city or state. • Stress to date within the portfolio has been limited to acquired loans which are in the Commercial Bank and totaled approximately $0.9 billion with an ALLL ratio of 11.22% as of September 30, 2025. These general office loans are comprised primarily of loans secured by Class B office properties and reposition/bridge loans. Data is directional but under further review.
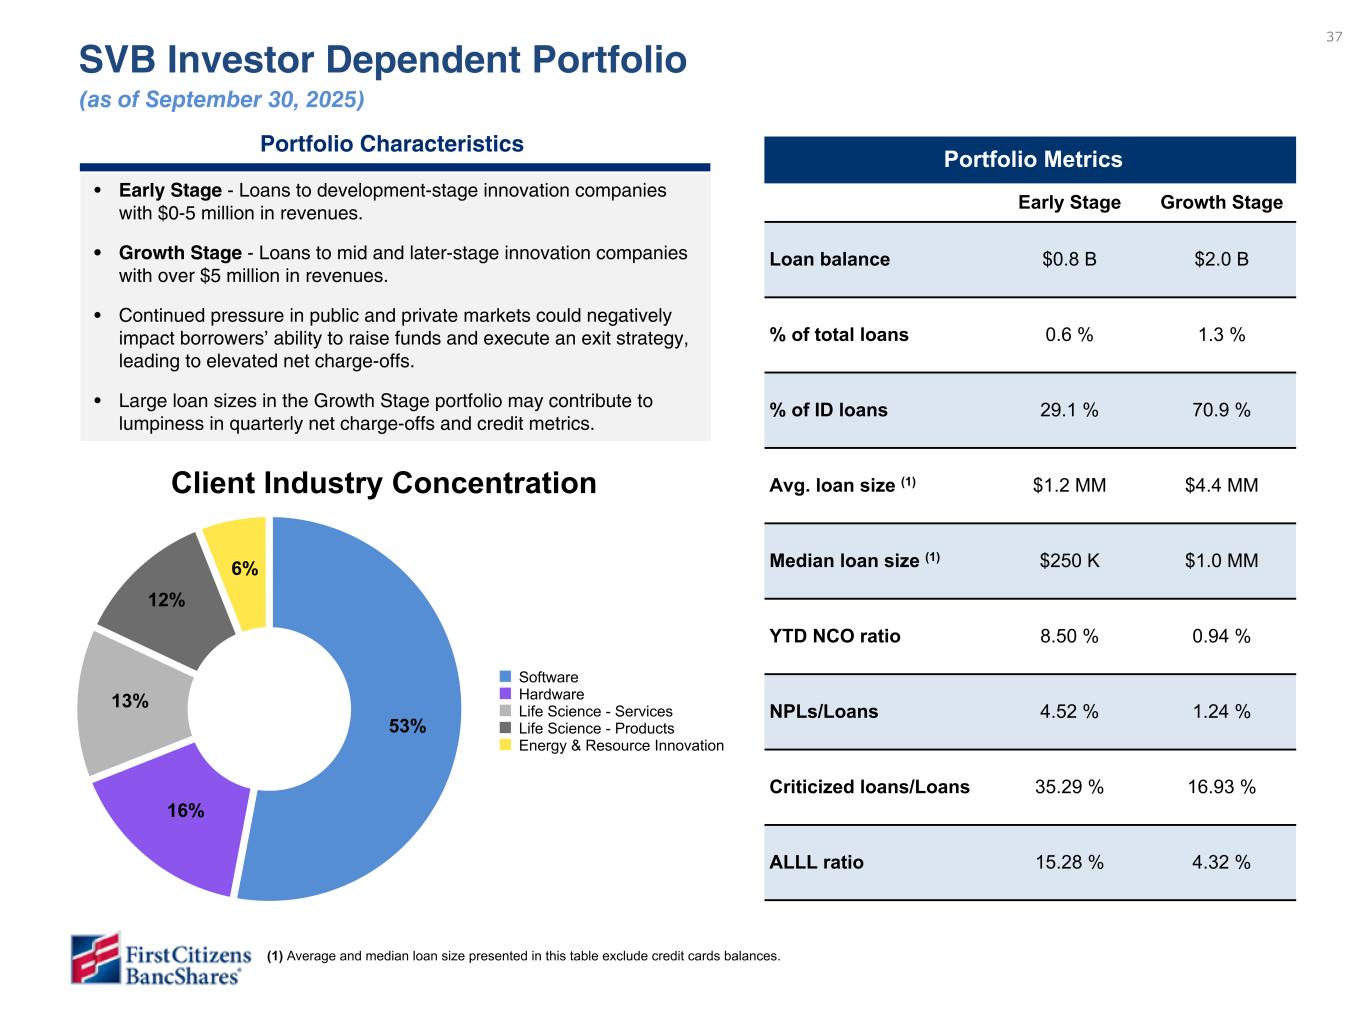
37 SVB Investor Dependent Portfolio (as of September 30, 2025) Portfolio Metrics Early Stage Growth Stage Loan balance $0.8 B $2.0 B % of total loans 0.6 % 1.3 % % of ID loans 29.1 % 70.9 % Avg. loan size (1) $1.2 MM $4.4 MM Median loan size (1) $250 K $1.0 MM YTD NCO ratio 8.50 % 0.94 % NPLs/Loans 4.52 % 1.24 % Criticized loans/Loans 35.29 % 16.93 % ALLL ratio 15.28 % 4.32 % Client Industry Concentration Portfolio Characteristics • Early Stage - Loans to development-stage innovation companies with $0-5 million in revenues. • Growth Stage - Loans to mid and later-stage innovation companies with over $5 million in revenues. • Continued pressure in public and private markets could negatively impact borrowers’ ability to raise funds and execute an exit strategy, leading to elevated net charge-offs. • Large loan sizes in the Growth Stage portfolio may contribute to lumpiness in quarterly net charge-offs and credit metrics. 53% 16% 13% 12% 6% Software Hardware Life Science - Services Life Science - Products Energy & Resource Innovation (1) Average and median loan size presented in this table exclude credit cards balances. Data is directional but under further review.
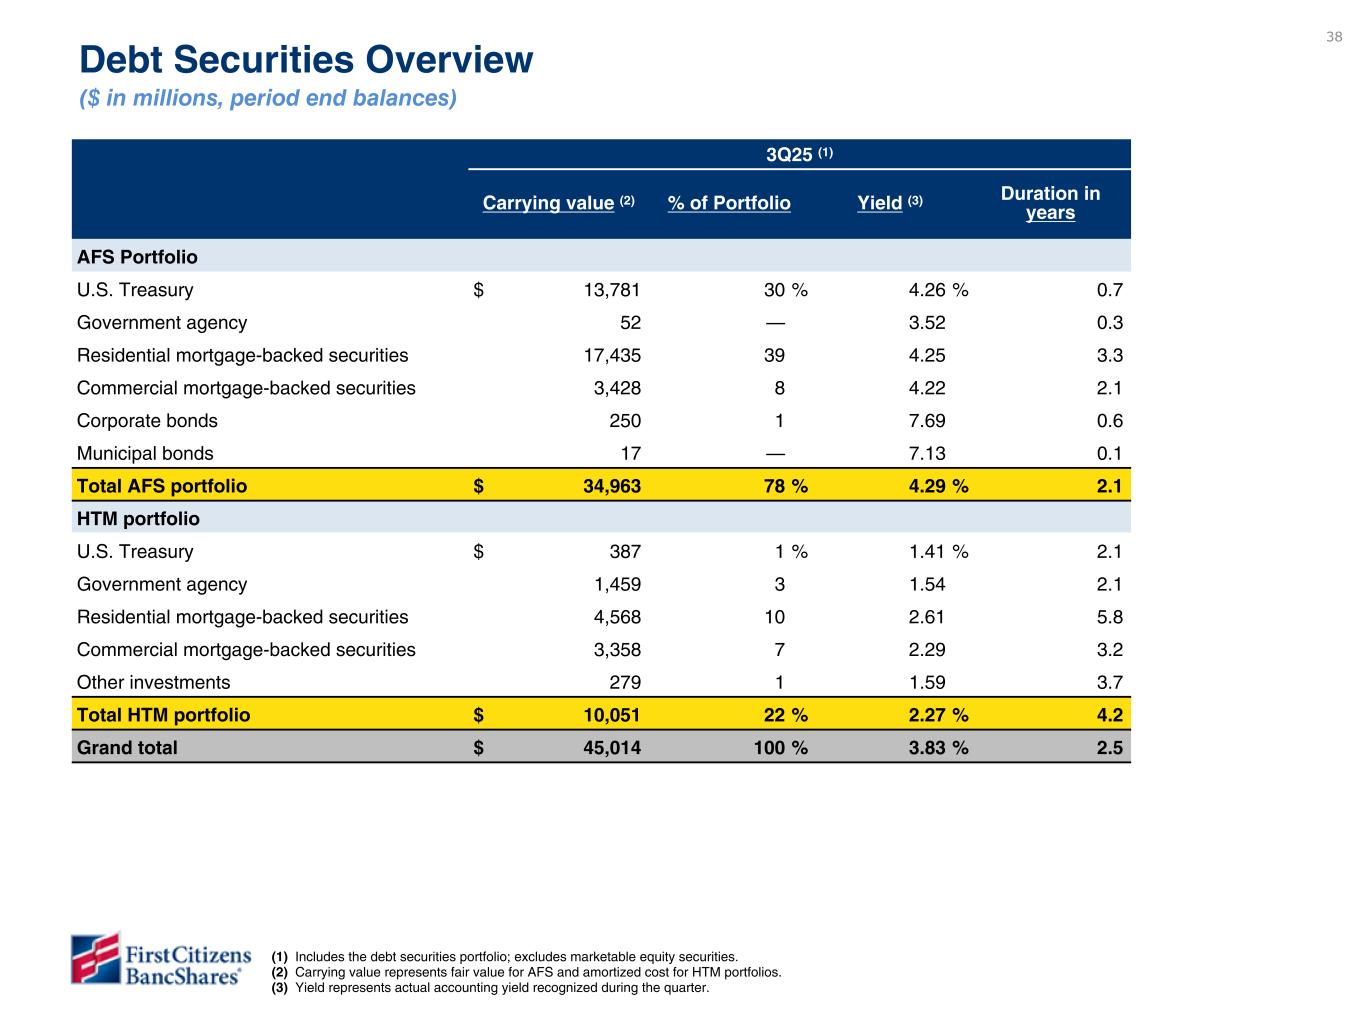
38 (1) 3Q25 (1) Carrying value (2) % of Portfolio Yield (3) Duration in years AFS Portfolio U.S. Treasury $ 13,781 30 % 4.26 % 0.7 Government agency 52 — 3.52 0.3 Residential mortgage-backed securities 17,435 39 4.25 3.3 Commercial mortgage-backed securities 3,428 8 4.22 2.1 Corporate bonds 250 1 7.69 0.6 Municipal bonds 17 — 7.13 0.1 Total AFS portfolio $ 34,963 78 % 4.29 % 2.1 HTM portfolio U.S. Treasury $ 387 1 % 1.41 % 2.1 Government agency 1,459 3 1.54 2.1 Residential mortgage-backed securities 4,568 10 2.61 5.8 Commercial mortgage-backed securities 3,358 7 2.29 3.2 Other investments 279 1 1.59 3.7 Total HTM portfolio $ 10,051 22 % 2.27 % 4.2 Grand total $ 45,014 100 % 3.83 % 2.5 Debt Securities Overview ($ in millions, period end balances) (1) Includes the debt securities portfolio; excludes marketable equity securities. (2) Carrying value represents fair value for AFS and amortized cost for HTM portfolios. (3) Yield represents actual accounting yield recognized during the quarter.
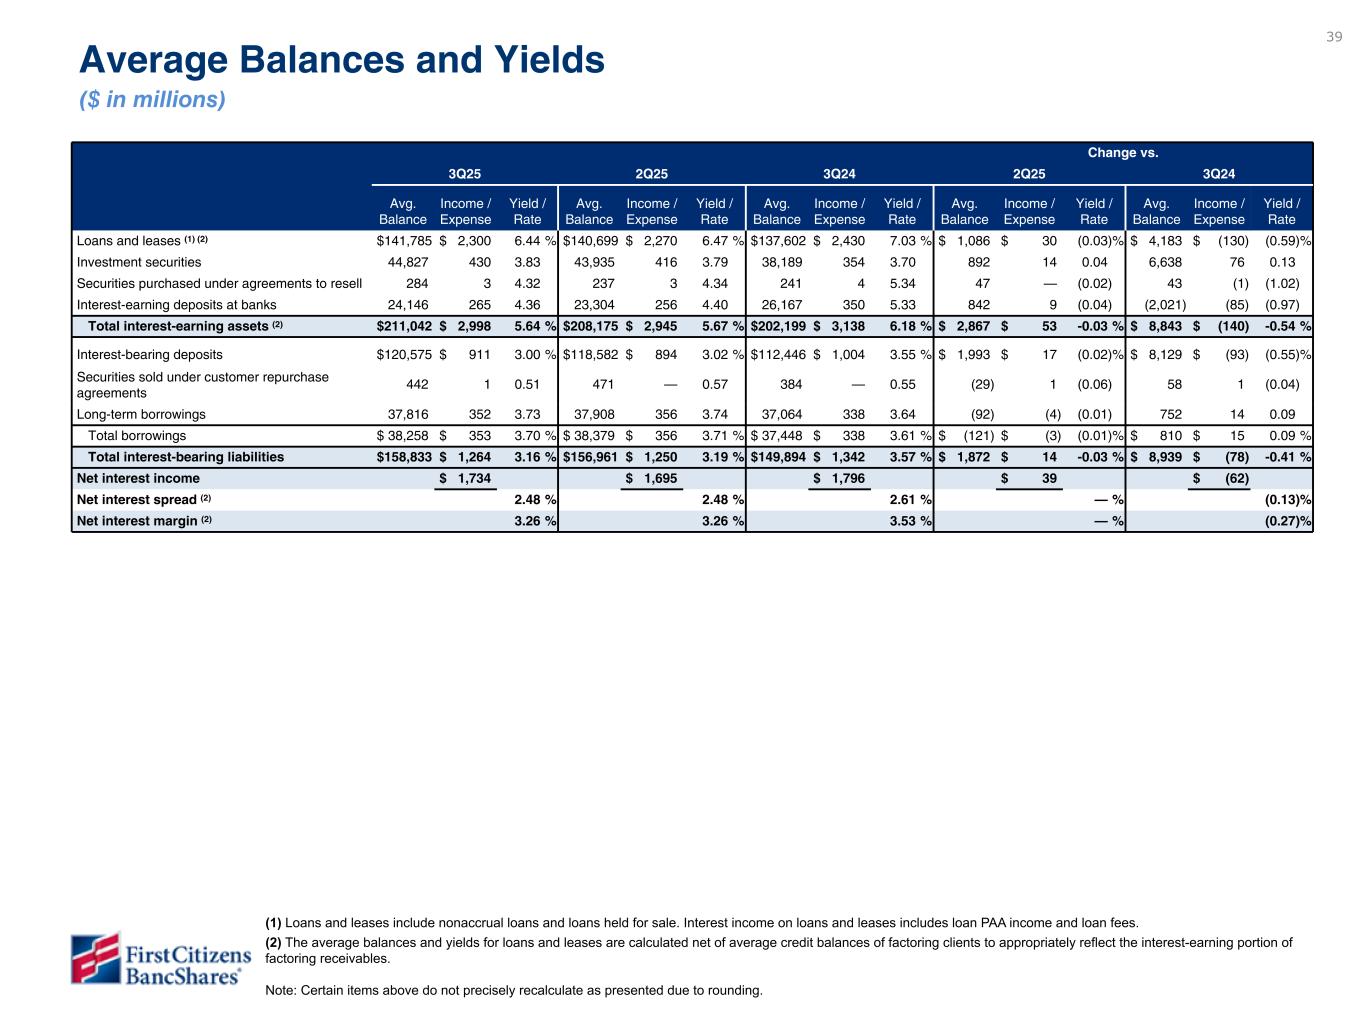
39 Change vs. 3Q25 2Q25 3Q24 2Q25 3Q24 Avg. Balance Income / Expense Yield / Rate Avg. Balance Income / Expense Yield / Rate Avg. Balance Income / Expense Yield / Rate Avg. Balance Income / Expense Yield / Rate Avg. Balance Income / Expense Yield / Rate Loans and leases (1) (2) $ 141,785 $ 2,300 6.44 % $ 140,699 $ 2,270 6.47 % $ 137,602 $ 2,430 7.03 % $ 1,086 $ 30 (0.03) % $ 4,183 $ (130) (0.59) % Investment securities 44,827 430 3.83 43,935 416 3.79 38,189 354 3.70 892 14 0.04 6,638 76 0.13 Securities purchased under agreements to resell 284 3 4.32 237 3 4.34 241 4 5.34 47 — (0.02) 43 (1) (1.02) Interest-earning deposits at banks 24,146 265 4.36 23,304 256 4.40 26,167 350 5.33 842 9 (0.04) (2,021) (85) (0.97) Total interest-earning assets (2) $ 211,042 $ 2,998 5.64 % $ 208,175 $ 2,945 5.67 % $ 202,199 $ 3,138 6.18 % $ 2,867 $ 53 -0.03 % $ 8,843 $ (140) -0.54 % Interest-bearing deposits $ 120,575 $ 911 3.00 % $ 118,582 $ 894 3.02 % $ 112,446 $ 1,004 3.55 % $ 1,993 $ 17 (0.02) % $ 8,129 $ (93) (0.55) % Securities sold under customer repurchase agreements 442 1 0.51 471 — 0.57 384 — 0.55 (29) 1 (0.06) 58 1 (0.04) Long-term borrowings 37,816 352 3.73 37,908 356 3.74 37,064 338 3.64 (92) (4) (0.01) 752 14 0.09 Total borrowings $ 38,258 $ 353 3.70 % $ 38,379 $ 356 3.71 % $ 37,448 $ 338 3.61 % $ (121) $ (3) (0.01) % $ 810 $ 15 0.09 % Total interest-bearing liabilities $ 158,833 $ 1,264 3.16 % $ 156,961 $ 1,250 3.19 % $ 149,894 $ 1,342 3.57 % $ 1,872 $ 14 -0.03 % $ 8,939 $ (78) -0.41 % Net interest income $ 1,734 $ 1,695 $ 1,796 $ 39 $ (62) Net interest spread (2) 2.48 % 2.48 % 2.61 % — % (0.13) % Net interest margin (2) 3.26 % 3.26 % 3.53 % — % (0.27) % Change vs. YTD23 YTD22 YTD22 Avg. Balance Income / Expense Yield / Rate Avg. Balance Income / Expense Yield / Rate Avg. Balance Income / Expense Yield / Rate Loans and leases (1) $ 66,634 $ 2,953 4.41 % $ 65,639 $ 2,697 4.09 % $ 995 $ 256 0.32 % Investment securities 19,166 354 1.85 16,110 216 1.32 3,056 138 0.53 Interest-earning deposits at banks 7,726 106 1.38 13,246 17 0.13 (5,520) 89 1.25 Total interest-earning assets (1) $ 93,526 $ 3,413 3.63 % $ 94,995 $ 2,930 3.07 % $ (1,469) $ 483 0.56 % Interest-bearing deposits $ 63,598 $ 335 0.53 % $ 65,295 $ 239 0.37 % $ (1,697) $ 96 0.16 % Securities sold under customer repurchase agreements 590 1 0.19 660 1 0.20 (70) — (0.01) Other short-term borrowings 824 28 3.30 — — — 824 28 3.30 Long-term borrowings 3,882 103 2.64 5,915 249 4.15 (2,033) (146) (1.51) Total borrowings $ 5,296 $ 132 2.47 % $ 6,575 $ 250 3.75 % $ (1,279) $ (118) (1.28) % Total interest-bearing liabilities $ 68,894 $ 467 0.68 % $ 71,870 $ 489 0.68 % $ (2,976) $ (22) — % Net interest income $ 2,946 $ 2,441 $ 505 Net interest spread (1) 2.95 % 2.39 % 0.56 % Net interest margin (1) 3.14 % 2.55 % 0.59 % Average Balances and Yields ($ in millions) YTD not disclosed Q1 (1) Loans and leases include nonaccrual loans and loans held for sale. Interest income on loans and leases includes loan PAA income and loan fees. (2) The average balances and yields for loans and leases are calculated net of average credit balances of factoring clients to appropriately reflect the interest-earning portion of factoring receivables. Note: Certain items above do not precisely recalculate as presented due to rounding.
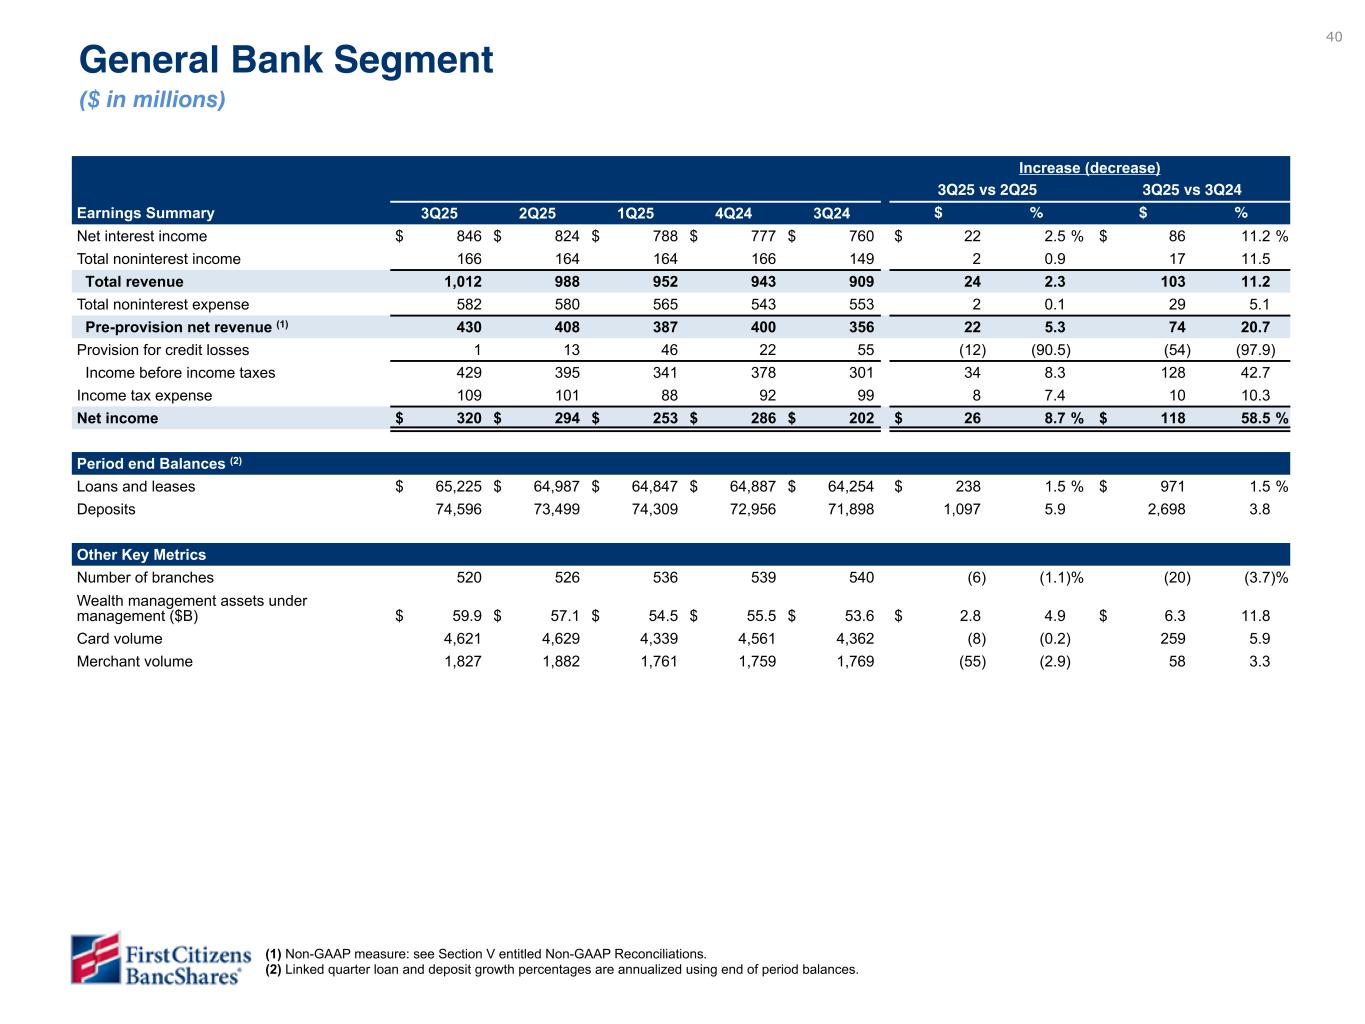
40 General Bank Segment ($ in millions) (1) Non-GAAP measure: see Section V entitled Non-GAAP Reconciliations. (2) Linked quarter loan and deposit growth percentages are annualized using end of period balances. Increase (decrease) 3Q25 vs 2Q25 3Q25 vs 3Q24 Earnings Summary 3Q25 2Q25 1Q25 4Q24 3Q24 $ % $ % Net interest income $ 846 $ 824 $ 788 $ 777 $ 760 $ 22 2.5 % $ 86 11.2 % Total noninterest income 166 164 164 166 149 2 0.9 17 11.5 Total revenue 1,012 988 952 943 909 24 2.3 103 11.2 Total noninterest expense 582 580 565 543 553 2 0.1 29 5.1 Pre-provision net revenue (1) 430 408 387 400 356 22 5.3 74 20.7 Provision for credit losses 1 13 46 22 55 (12) (90.5) (54) (97.9) Income before income taxes 429 395 341 378 301 34 8.3 128 42.7 Income tax expense 109 101 88 92 99 8 7.4 10 10.3 Net income $ 320 $ 294 $ 253 $ 286 $ 202 $ 26 8.7 % $ 118 58.5 % Period end Balances (2) Loans and leases $ 65,225 $ 64,987 $ 64,847 $ 64,887 $ 64,254 $ 238 1.5 % $ 971 1.5 % Deposits 74,596 73,499 74,309 72,956 71,898 1,097 5.9 2,698 3.8 Other Key Metrics Number of branches 520 526 536 539 540 (6) (1.1) % (20) (3.7) % Wealth management assets under management ($B) $ 59.9 $ 57.1 $ 54.5 $ 55.5 $ 53.6 $ 2.8 4.9 $ 6.3 11.8 Card volume 4,621 4,629 4,339 4,561 4,362 (8) (0.2) 259 5.9 Merchant volume 1,827 1,882 1,761 1,759 1,769 (55) (2.9) 58 3.3 Highlights • The General Bank segment achieved strong loan growth during the quarter, 4.1% annualized over the linked quarter, driven primarily by business and commercial loan production in the Branch Network. • Deposits increased $893 million compared to the linked quarter driven by growth in the Branch Network. • Segment net revenue increased $32 million compared to the linked quarter as net interest income increased $15 million and noninterest income increased by $17 million. Noninterest expense decreased by $20 million compared to the linked quarter. Data has not yet been validated but is directional. To be finalized in subsequent draft.
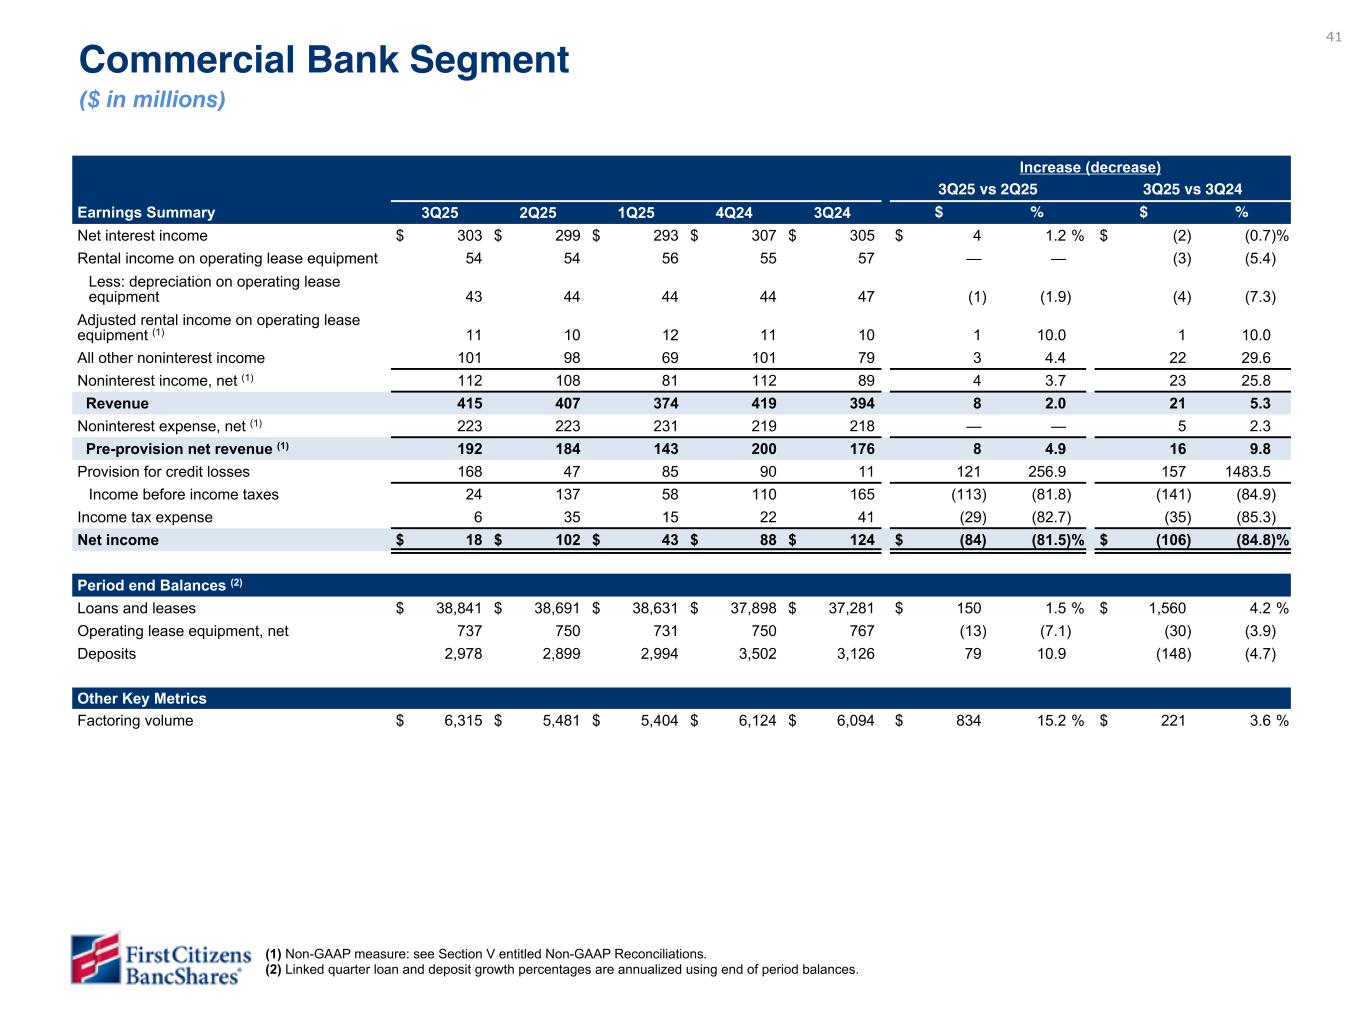
41 Increase (decrease) 3Q25 vs 2Q25 3Q25 vs 3Q24 Earnings Summary 3Q25 2Q25 1Q25 4Q24 3Q24 $ % $ % Net interest income $ 303 $ 299 $ 293 $ 307 $ 305 $ 4 1.2 % $ (2) (0.7) % Rental income on operating lease equipment 54 54 56 55 57 — — (3) (5.4) Less: depreciation on operating lease equipment 43 44 44 44 47 (1) (1.9) (4) (7.3) Adjusted rental income on operating lease equipment (1) 11 10 12 11 10 1 10.0 1 10.0 All other noninterest income 101 98 69 101 79 3 4.4 22 29.6 Noninterest income, net (1) 112 108 81 112 89 4 3.7 23 25.8 Revenue 415 407 374 419 394 8 2.0 21 5.3 Noninterest expense, net (1) 223 223 231 219 218 — — 5 2.3 Pre-provision net revenue (1) 192 184 143 200 176 8 4.9 16 9.8 Provision for credit losses 168 47 85 90 11 121 256.9 157 1483.5 Income before income taxes 24 137 58 110 165 (113) (81.8) (141) (84.9) Income tax expense 6 35 15 22 41 (29) (82.7) (35) (85.3) Net income $ 18 $ 102 $ 43 $ 88 $ 124 $ (84) (81.5) % $ (106) (84.8) % Period end Balances (2) Loans and leases $ 38,841 $ 38,691 $ 38,631 $ 37,898 $ 37,281 $ 150 1.5 % $ 1,560 4.2 % Operating lease equipment, net 737 750 731 750 767 (13) (7.1) (30) (3.9) Deposits 2,978 2,899 2,994 3,502 3,126 79 10.9 (148) (4.7) Other Key Metrics Factoring volume $ 6,315 $ 5,481 $ 5,404 $ 6,124 $ 6,094 $ 834 15.2 % $ 221 3.6 % Highlights • The Commercial Bank segment achieved strong loan growth during the quarter, 6.2% annualized over the linked quarter, largely driven by strong origination volume in our industry verticals. • Factoring volume totaled $6.3 billion, relatively in line with the linked quarter and the prior year quarter. • Segment revenue increased $15 million compared to the linked quarter, primarily driven by higher noninterest income. Commercial Bank Segment ($ in millions) (1) Non-GAAP measure: see Section V entitled Non-GAAP Reconciliations. (2) Linked quarter loan and deposit growth percentages are annualized using end of period balances. Data has not yet been validated but is directional. To be finalized in subsequent draft.
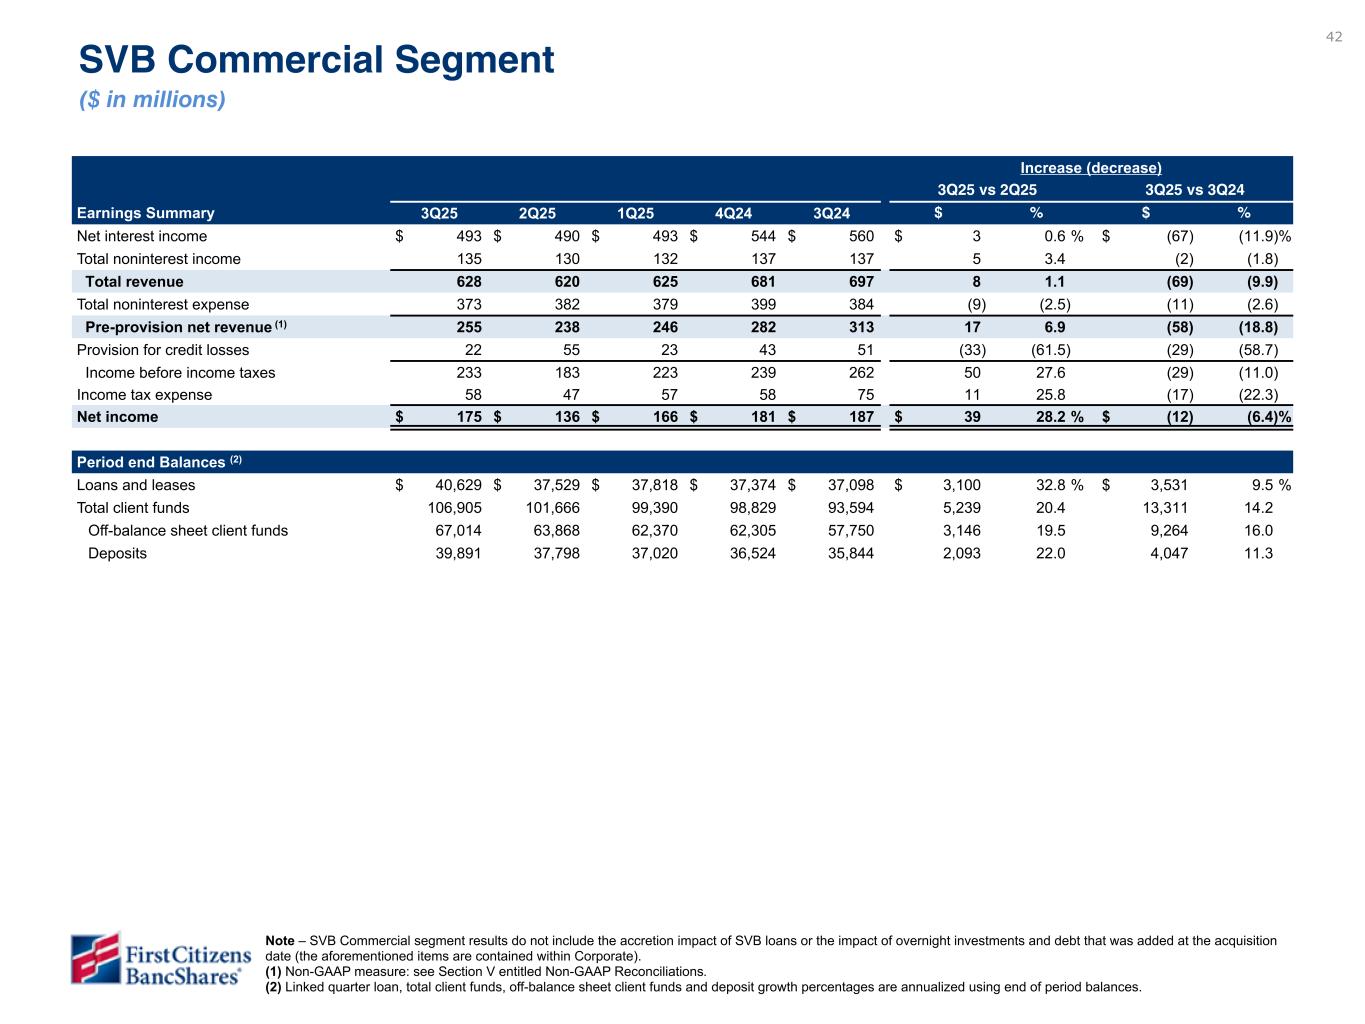
42 Increase (decrease) 3Q25 vs 2Q25 3Q25 vs 3Q24 Earnings Summary 3Q25 2Q25 1Q25 4Q24 3Q24 $ % $ % Net interest income $ 493 $ 490 $ 493 $ 544 $ 560 $ 3 0.6 % $ (67) (11.9) % Total noninterest income 135 130 132 137 137 5 3.4 (2) (1.8) Total revenue 628 620 625 681 697 8 1.1 (69) (9.9) Total noninterest expense 373 382 379 399 384 (9) (2.5) (11) (2.6) Pre-provision net revenue (1) 255 238 246 282 313 17 6.9 (58) (18.8) Provision for credit losses 22 55 23 43 51 (33) (61.5) (29) (58.7) Income before income taxes 233 183 223 239 262 50 27.6 (29) (11.0) Income tax expense 58 47 57 58 75 11 25.8 (17) (22.3) Net income $ 175 $ 136 $ 166 $ 181 $ 187 $ 39 28.2 % $ (12) (6.4) % Period end Balances (2) Loans and leases $ 40,629 $ 37,529 $ 37,818 $ 37,374 $ 37,098 $ 3,100 32.8 % $ 3,531 9.5 % Total client funds 106,905 101,666 99,390 98,829 93,594 5,239 20.4 13,311 14.2 Off-balance sheet client funds 67,014 63,868 62,370 62,305 57,750 3,146 19.5 9,264 16.0 Deposits 39,891 37,798 37,020 36,524 35,844 2,093 22.0 4,047 11.3 SVB Commercial Segment ($ in millions) Note – SVB Commercial segment results do not include the accretion impact of SVB loans or the impact of overnight investments and debt that was added at the acquisition date (the aforementioned items are contained within Corporate). (1) Non-GAAP measure: see Section V entitled Non-GAAP Reconciliations. (2) Linked quarter loan, total client funds, off-balance sheet client funds and deposit growth percentages are annualized using end of period balances. Highlights • SVB Commercial segment loans increased from the linked quarter driven by Global Fund Banking production and improved utilization. • Total client funds increased compared to the linked quarter including growth of in off balance sheet client funds and on balance sheet deposit growth of . The increase in total client funds reflects higher VC investment activity and slowing client cash burn. • Segment net revenue decreased compared to the linked quarter due to lower net interest income partially offset by higher noninterest income. Noninterest expense decreased compared to the linked quarter. Data has not yet been validated but is directional. To be finalized in subsequent draft.
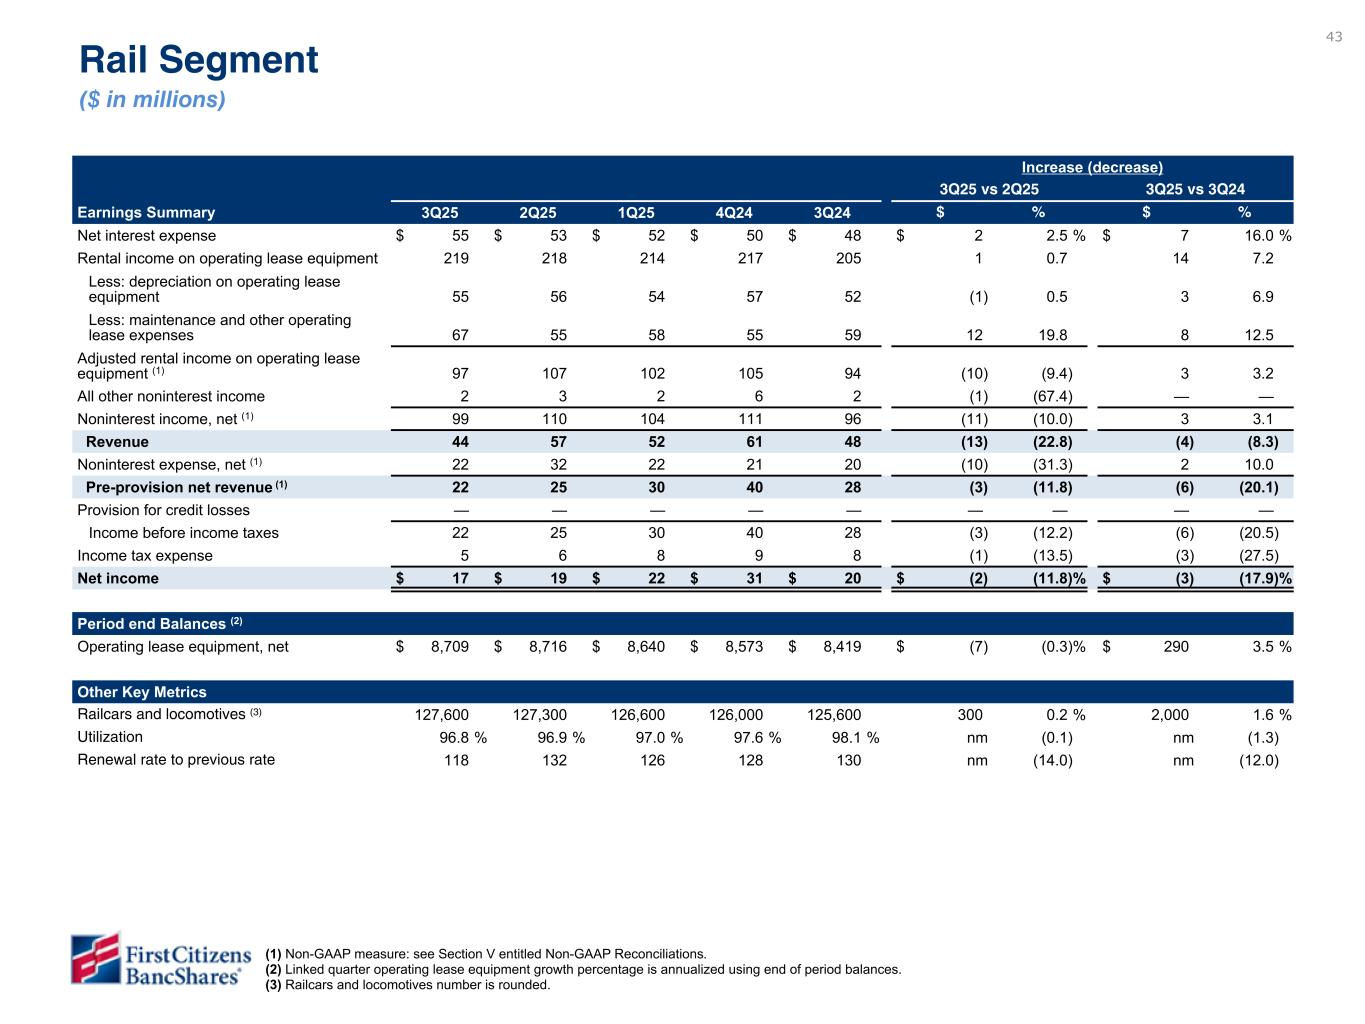
43 Increase (decrease) 3Q25 vs 2Q25 3Q25 vs 3Q24 Earnings Summary 3Q25 2Q25 1Q25 4Q24 3Q24 $ % $ % Net interest expense $ 55 $ 53 $ 52 $ 50 $ 48 $ 2 2.5 % $ 7 16.0 % Rental income on operating lease equipment 219 218 214 217 205 1 0.7 14 7.2 Less: depreciation on operating lease equipment 55 56 54 57 52 (1) 0.5 3 6.9 Less: maintenance and other operating lease expenses 67 55 58 55 59 12 19.8 8 12.5 Adjusted rental income on operating lease equipment (1) 97 107 102 105 94 (10) (9.4) 3 3.2 All other noninterest income 2 3 2 6 2 (1) (67.4) — — Noninterest income, net (1) 99 110 104 111 96 (11) (10.0) 3 3.1 Revenue 44 57 52 61 48 (13) (22.8) (4) (8.3) Noninterest expense, net (1) 22 32 22 21 20 (10) (31.3) 2 10.0 Pre-provision net revenue (1) 22 25 30 40 28 (3) (11.8) (6) (20.1) Provision for credit losses — — — — — — — — — Income before income taxes 22 25 30 40 28 (3) (12.2) (6) (20.5) Income tax expense 5 6 8 9 8 (1) (13.5) (3) (27.5) Net income $ 17 $ 19 $ 22 $ 31 $ 20 $ (2) (11.8) % $ (3) (17.9) % Period end Balances (2) Operating lease equipment, net $ 8,709 $ 8,716 $ 8,640 $ 8,573 $ 8,419 $ (7) (0.3) % $ 290 3.5 % Other Key Metrics Railcars and locomotives (3) 127,600 127,300 126,600 126,000 125,600 300 0.2 % 2,000 1.6 % Utilization 96.8 % 96.9 % 97.0 % 97.6 % 98.1 % nm (0.1) nm (1.3) Renewal rate to previous rate 118 132 126 128 130 nm (14.0) nm (12.0) Rail Segment ($ in millions) (1) Non-GAAP measure: see Section V entitled Non-GAAP Reconciliations. (2) Linked quarter operating lease equipment growth percentage is annualized using end of period balances. (3) Railcars and locomotives number is rounded. Highlights • The fleet is effectively fully utilized, with a utilization rate of 96.8%. • Favorable renewal repricing trends continued, up 28% over the expiring rate for the quarter, with gains in both freight cars (+36%) and tank cars (+21%). • Adjusted rental income on operating lease equipment increased from the linked quarter reflecting fleet growth, continued positive repricing trends and lower maintenance expense. Data has not yet been validated but is directional. To be finalized in subsequent draft.
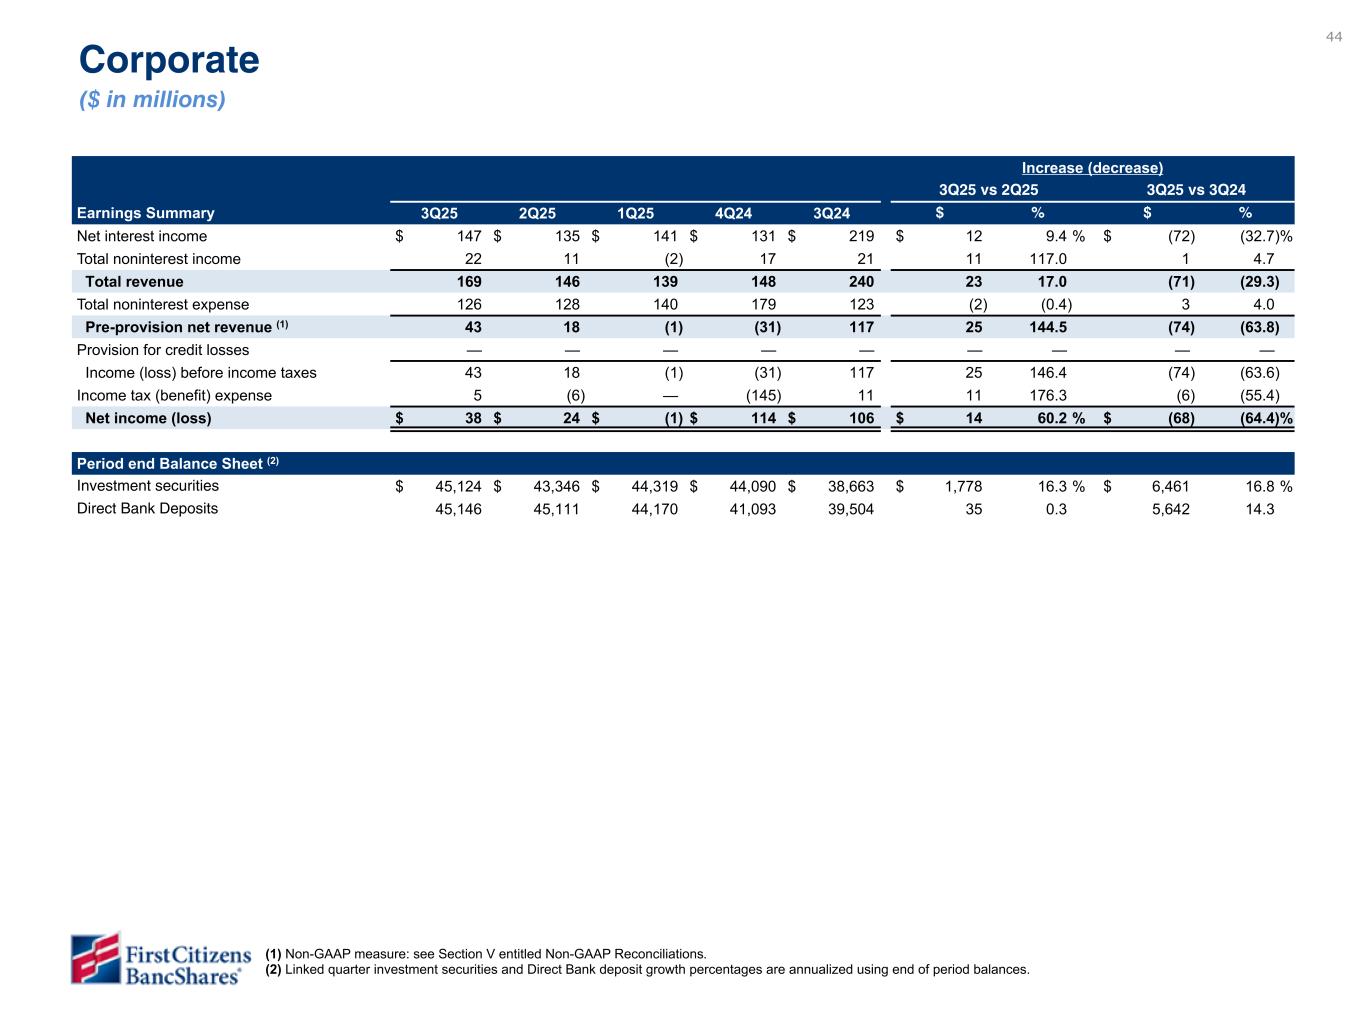
44 Highlights • Net interest income decreased compared to the linked quarter driven primarily by lower interest income from overnight investments and higher interest expense from growth in Direct Bank deposits, partially offset by increased interest income from higher investment securities. • Noninterest expense increased driven primarily by similar items as noted on slide 16. • Direct Bank deposits reflect continued growth in the channel even with declining rates paid. Corporate ($ in millions) (1) Non-GAAP measure: see Section V entitled Non-GAAP Reconciliations. (2) Linked quarter investment securities and Direct Bank deposit growth percentages are annualized using end of period balances. Increase (decrease) 3Q25 vs 2Q25 3Q25 vs 3Q24 Earnings Summary 3Q25 2Q25 1Q25 4Q24 3Q24 $ % $ % Net interest income $ 147 $ 135 $ 141 $ 131 $ 219 $ 12 9.4 % $ (72) (32.7) % Total noninterest income 22 11 (2) 17 21 11 117.0 1 4.7 Total revenue 169 146 139 148 240 23 17.0 (71) (29.3) Total noninterest expense 126 128 140 179 123 (2) (0.4) 3 4.0 Pre-provision net revenue (1) 43 18 (1) (31) 117 25 144.5 (74) (63.8) Provision for credit losses — — — — — — — — — Income (loss) before income taxes 43 18 (1) (31) 117 25 146.4 (74) (63.6) Income tax (benefit) expense 5 (6) — (145) 11 11 176.3 (6) (55.4) Net income (loss) $ 38 $ 24 $ (1) $ 114 $ 106 $ 14 60.2 % $ (68) (64.4) % Period end Balance Sheet (2) Investment securities $ 45,124 $ 43,346 $ 44,319 $ 44,090 $ 38,663 $ 1,778 16.3 % $ 6,461 16.8 % Direct Bank Deposits 45,146 45,111 44,170 41,093 39,504 35 0.3 5,642 14.3 Data has not yet been validated but is directional. To be finalized in subsequent draft.
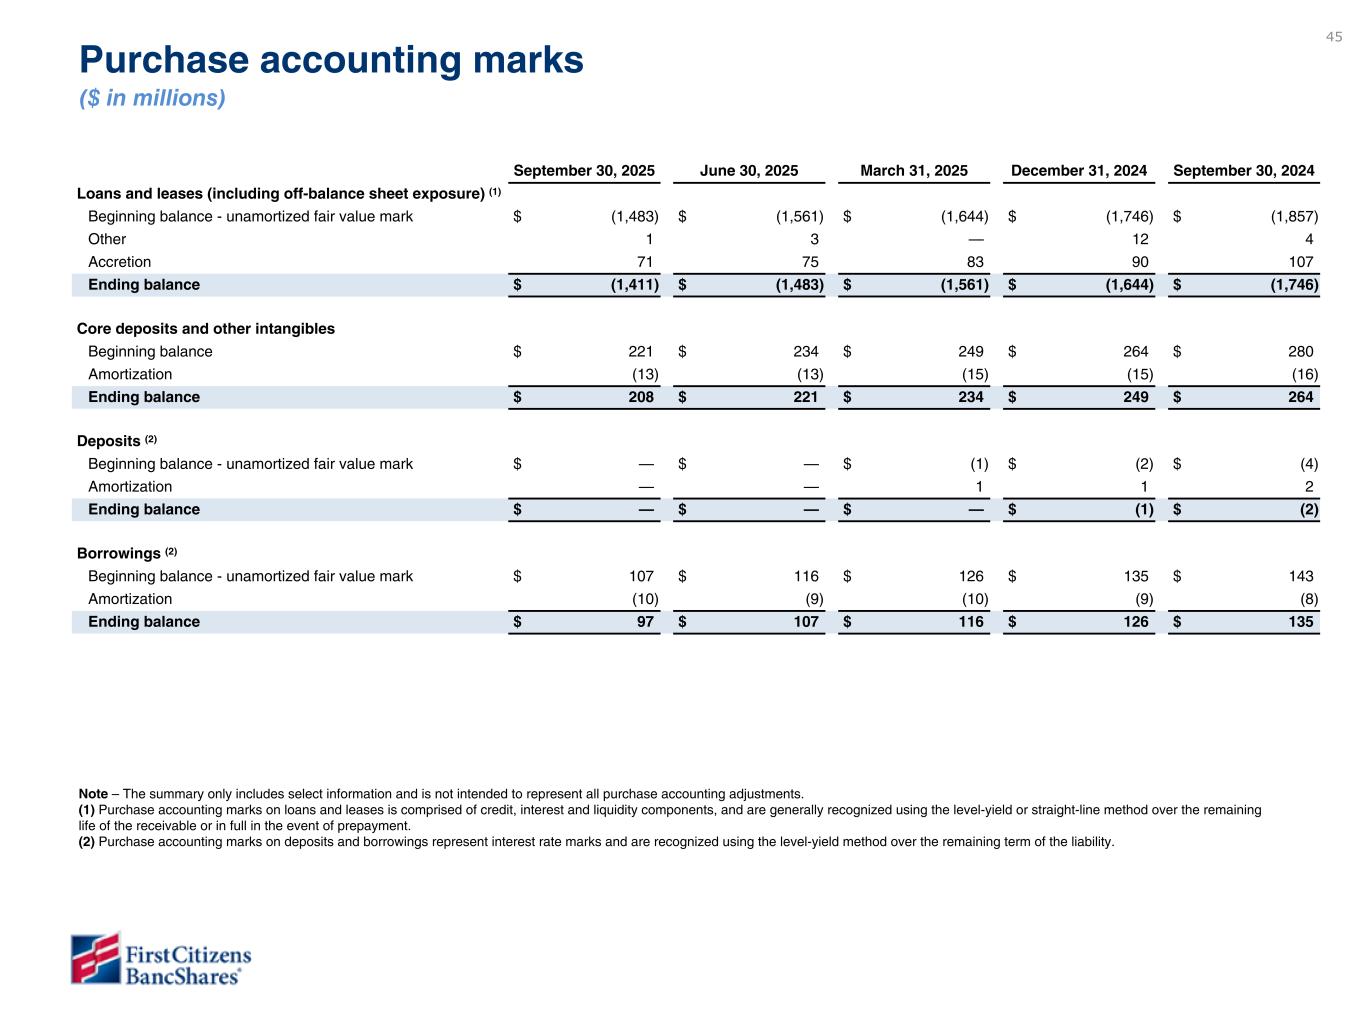
45 September 30, 2025 June 30, 2025 March 31, 2025 December 31, 2024 September 30, 2024 Loans and leases (including off-balance sheet exposure) (1) Beginning balance - unamortized fair value mark $ (1,483) $ (1,561) $ (1,644) $ (1,746) $ (1,857) Other 1 3 — 12 4 Accretion 71 75 83 90 107 Ending balance $ (1,411) $ (1,483) $ (1,561) $ (1,644) $ (1,746) Core deposits and other intangibles Beginning balance $ 221 $ 234 $ 249 $ 264 $ 280 Amortization (13) (13) (15) (15) (16) Ending balance $ 208 $ 221 $ 234 $ 249 $ 264 Deposits (2) Beginning balance - unamortized fair value mark $ — $ — $ (1) $ (2) $ (4) Amortization — — 1 1 2 Ending balance $ — $ — $ — $ (1) $ (2) Borrowings (2) Beginning balance - unamortized fair value mark $ 107 $ 116 $ 126 $ 135 $ 143 Amortization (10) (9) (10) (9) (8) Ending balance $ 97 $ 107 $ 116 $ 126 $ 135 Purchase accounting marks ($ in millions) Note – The summary only includes select information and is not intended to represent all purchase accounting adjustments. (1) Purchase accounting marks on loans and leases is comprised of credit, interest and liquidity components, and are generally recognized using the level-yield or straight-line method over the remaining life of the receivable or in full in the event of prepayment. (2) Purchase accounting marks on deposits and borrowings represent interest rate marks and are recognized using the level-yield method over the remaining term of the liability. Data has not yet been validated but is directional. To be finalized in subsequent draft.
Non-GAAP Reconciliations Section V
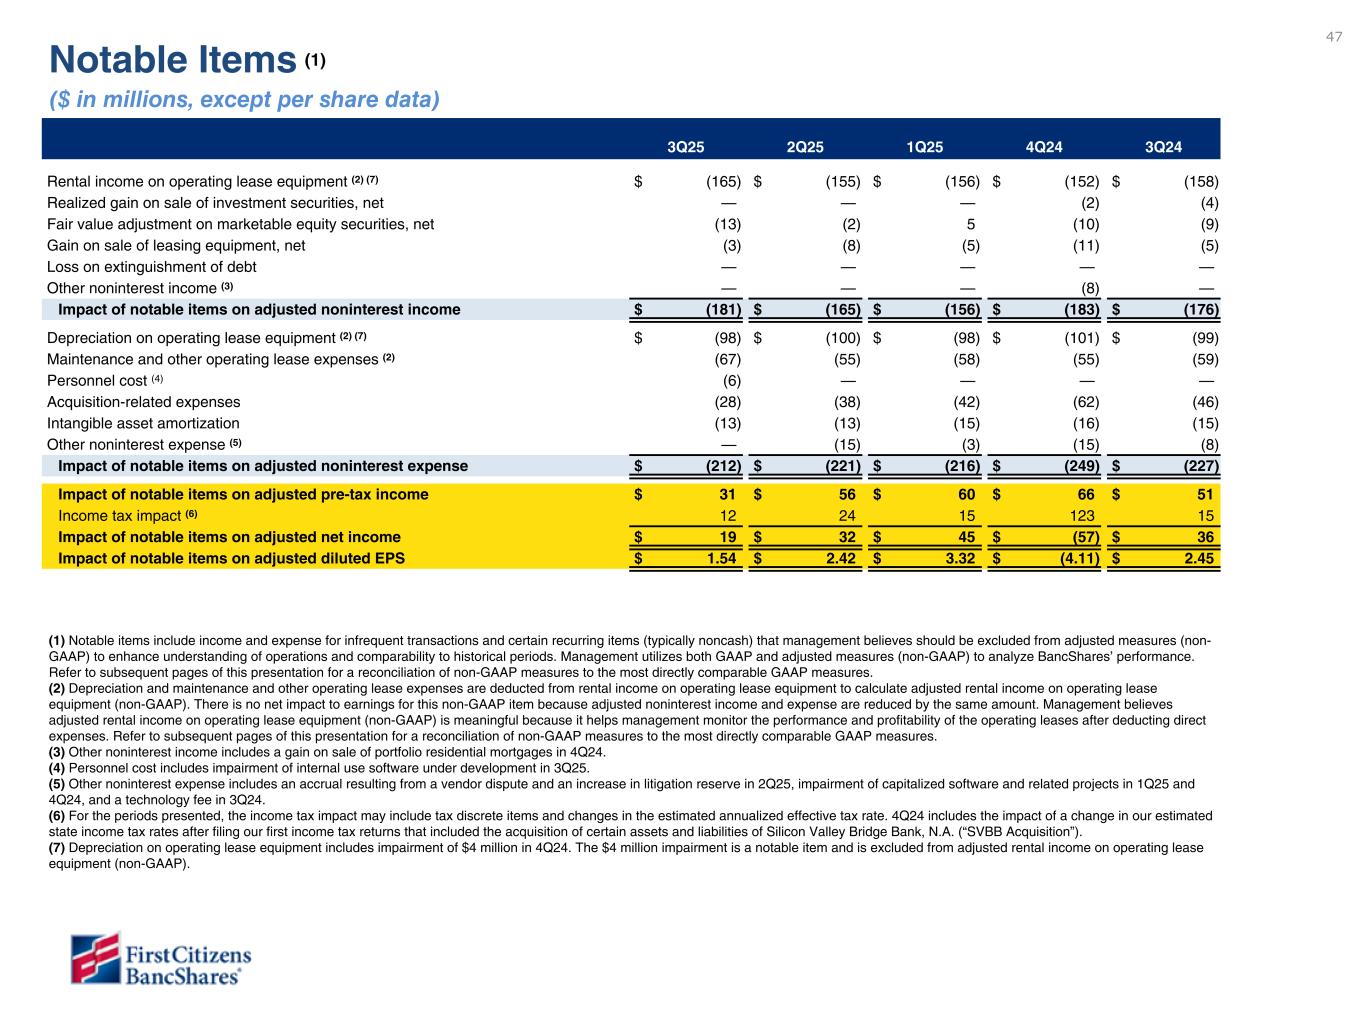
47 1Q23 4Q22 1Q22 Rental income on operating lease equipment (2) $ (165) $ (155) $ (158) Realized gain on sale of investment securities available for sale, net — — (4) Fair value adjustment on marketable equity securities, net (13) (2) (9) Gain on sale of leasing equipment, net (3) (8) (5) Gain on acquisition — — — Gain on extinguishment of debt — — — Other noninterest income(3) — — — Impact on adjusted noninterest income $ (181) $ (165) $ (176) Depreciation on operating lease equipment (2) $ (98) $ (100) $ (99) Maintenance and other operating lease expenses (2) (67) (55) (59) Salaries and benefits (6) — — Acquisition-related expenses (28) (38) (46) Intangible asset amortization (13) (13) (15) Other noninterest expense (4) — (15) (8) Impact on adjusted noninterest expense $ (212) $ (221) $ (227) CECL Day 2 provision and reserve for unfunded commitments — (716) — Provision for credit losses- investment securities available for sale — (4) — Provision for credit losses - total adjustments $ — $ — $ — Impact on adjusted pre-tax income $ 134 $ 173 $ 38 Income tax impact (5) (6) 12 24 15 Impact on adjusted net income $ 19 $ 32 $ 36 Impact on adjusted diluted EPS $ 1.54 $ 2.42 2.45 Notable Items (1) ($ in millions, except per share data) 3Q25 2Q25 1Q25 4Q24 3Q24 Rental income on operating lease equipment (2) (7) $ (165) $ (155) $ (156) $ (152) $ (158) Realized gain on sale of investment securities, net — — — (2) (4) Fair value adjustment on marketable equity securities, net (13) (2) 5 (10) (9) Gain on sale of leasing equipment, net (3) (8) (5) (11) (5) Loss on extinguishment of debt — — — — — Other noninterest income (3) — — — (8) — Impact of notable items on adjusted noninterest income $ (181) $ (165) $ (156) $ (183) $ (176) Depreciation on operating lease equipment (2) (7) $ (98) $ (100) $ (98) $ (101) $ (99) Maintenance and other operating lease expenses (2) (67) (55) (58) (55) (59) Personnel cost (4) (6) — — — — Acquisition-related expenses (28) (38) (42) (62) (46) Intangible asset amortization (13) (13) (15) (16) (15) Other noninterest expense (5) — (15) (3) (15) (8) Impact of notable items on adjusted noninterest expense $ (212) $ (221) $ (216) $ (249) $ (227) Impact of notable items on adjusted pre-tax income $ 31 $ 56 $ 60 $ 66 $ 51 Income tax impact (6) 12 24 15 123 15 Impact of notable items on adjusted net income $ 19 $ 32 $ 45 $ (57) $ 36 Impact of notable items on adjusted diluted EPS $ 1.54 $ 2.42 $ 3.32 $ (4.11) $ 2.45 (1) Notable items include income and expense for infrequent transactions and certain recurring items (typically noncash) that management believes should be excluded from adjusted measures (non- GAAP) to enhance understanding of operations and comparability to historical periods. Management utilizes both GAAP and adjusted measures (non-GAAP) to analyze BancShares’ performance. Refer to subsequent pages of this presentation for a reconciliation of non-GAAP measures to the most directly comparable GAAP measures. (2) Depreciation and maintenance and other operating lease expenses are deducted from rental income on operating lease equipment to calculate adjusted rental income on operating lease equipment (non-GAAP). There is no net impact to earnings for this non-GAAP item because adjusted noninterest income and expense are reduced by the same amount. Management believes adjusted rental income on operating lease equipment (non-GAAP) is meaningful because it helps management monitor the performance and profitability of the operating leases after deducting direct expenses. Refer to subsequent pages of this presentation for a reconciliation of non-GAAP measures to the most directly comparable GAAP measures. (3) Other noninterest income includes a gain on sale of portfolio residential mortgages in 4Q24. (4) Personnel cost includes impairment of internal use software under development in 3Q25. (5) Other noninterest expense includes an accrual resulting from a vendor dispute and an increase in litigation reserve in 2Q25, impairment of capitalized software and related projects in 1Q25 and 4Q24, and a technology fee in 3Q24. (6) For the periods presented, the income tax impact may include tax discrete items and changes in the estimated annualized effective tax rate. 4Q24 includes the impact of a change in our estimated state income tax rates after filing our first income tax returns that included the acquisition of certain assets and liabilities of Silicon Valley Bridge Bank, N.A. (“SVBB Acquisition”). (7) Depreciation on operating lease equipment includes impairment of $4 million in 4Q24. The $4 million impairment is a notable item and is excluded from adjusted rental income on operating lease equipment (non-GAAP). Non-GAAP materials are under review and will be provided in subsequent draft
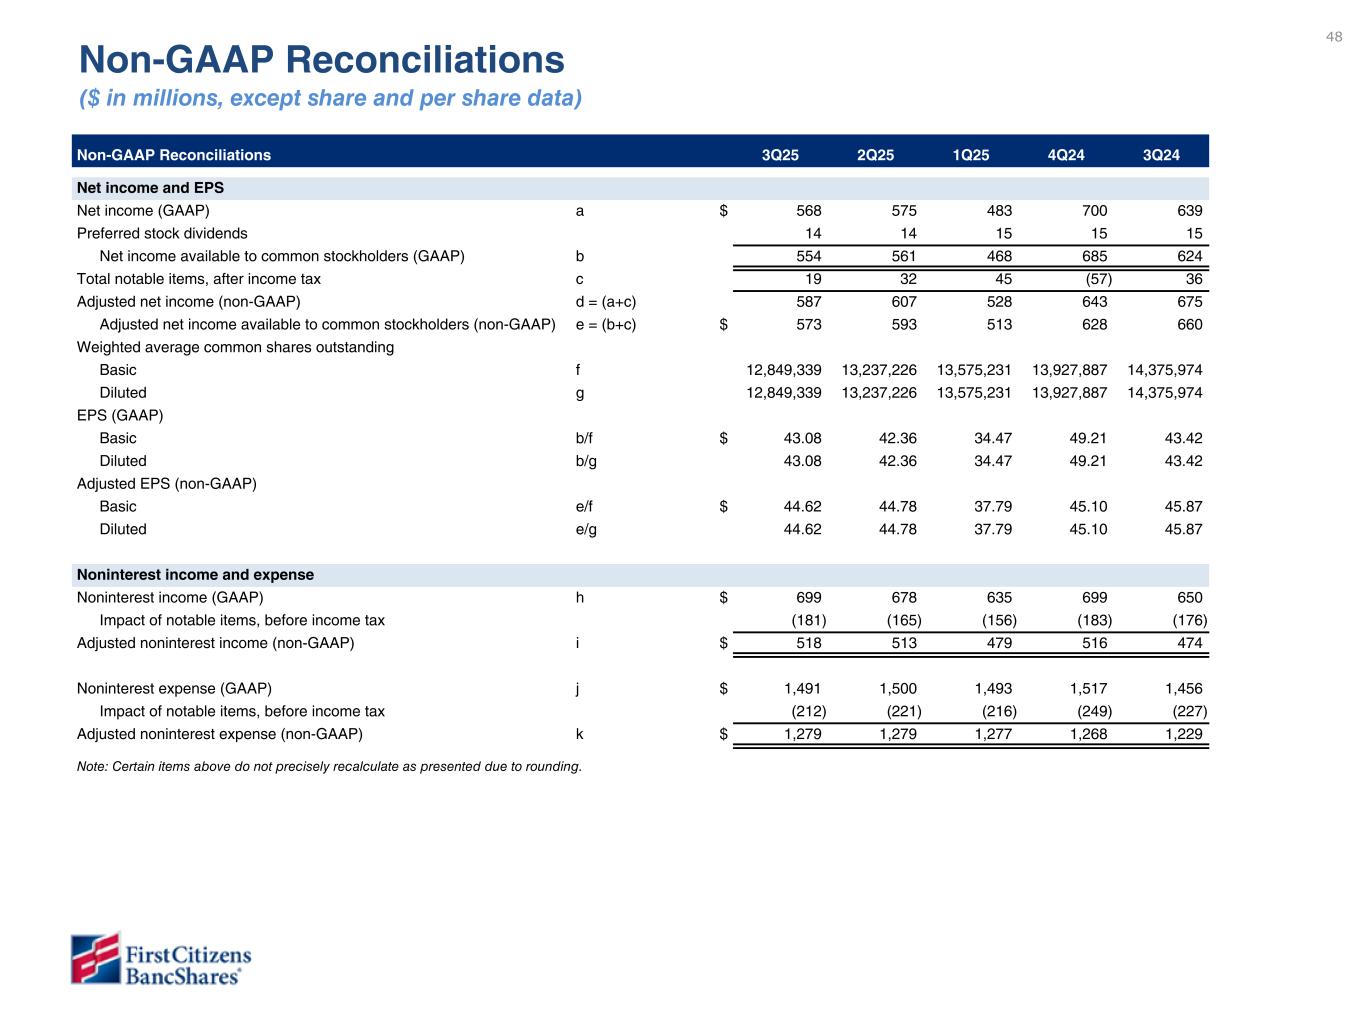
48 Non-GAAP Reconciliations 3Q25 2Q25 1Q25 4Q24 3Q24 Net income and EPS Net income (GAAP) a $ 568 575 483 700 639 Preferred stock dividends 14 14 15 15 15 Net income available to common stockholders (GAAP) b 554 561 468 685 624 Total notable items, after income tax c 19 32 45 (57) 36 Adjusted net income (non-GAAP) d = (a+c) 587 607 528 643 675 Adjusted net income available to common stockholders (non-GAAP) e = (b+c) $ 573 593 513 628 660 Weighted average common shares outstanding Basic f 12,849,339 13,237,226 13,575,231 13,927,887 14,375,974 Diluted g 12,849,339 13,237,226 13,575,231 13,927,887 14,375,974 EPS (GAAP) Basic b/f $ 43.08 42.36 34.47 49.21 43.42 Diluted b/g 43.08 42.36 34.47 49.21 43.42 Adjusted EPS (non-GAAP) Basic e/f $ 44.62 44.78 37.79 45.10 45.87 Diluted e/g 44.62 44.78 37.79 45.10 45.87 Noninterest income and expense Noninterest income (GAAP) h $ 699 678 635 699 650 Impact of notable items, before income tax (181) (165) (156) (183) (176) Adjusted noninterest income (non-GAAP) i $ 518 513 479 516 474 Noninterest expense (GAAP) j $ 1,491 1,500 1,493 1,517 1,456 Impact of notable items, before income tax (212) (221) (216) (249) (227) Adjusted noninterest expense (non-GAAP) k $ 1,279 1,279 1,277 1,268 1,229 Note: Certain items above do not precisely recalculate as presented due to rounding. Non-GAAP Reconciliations ($ in millions, except share and per share data)
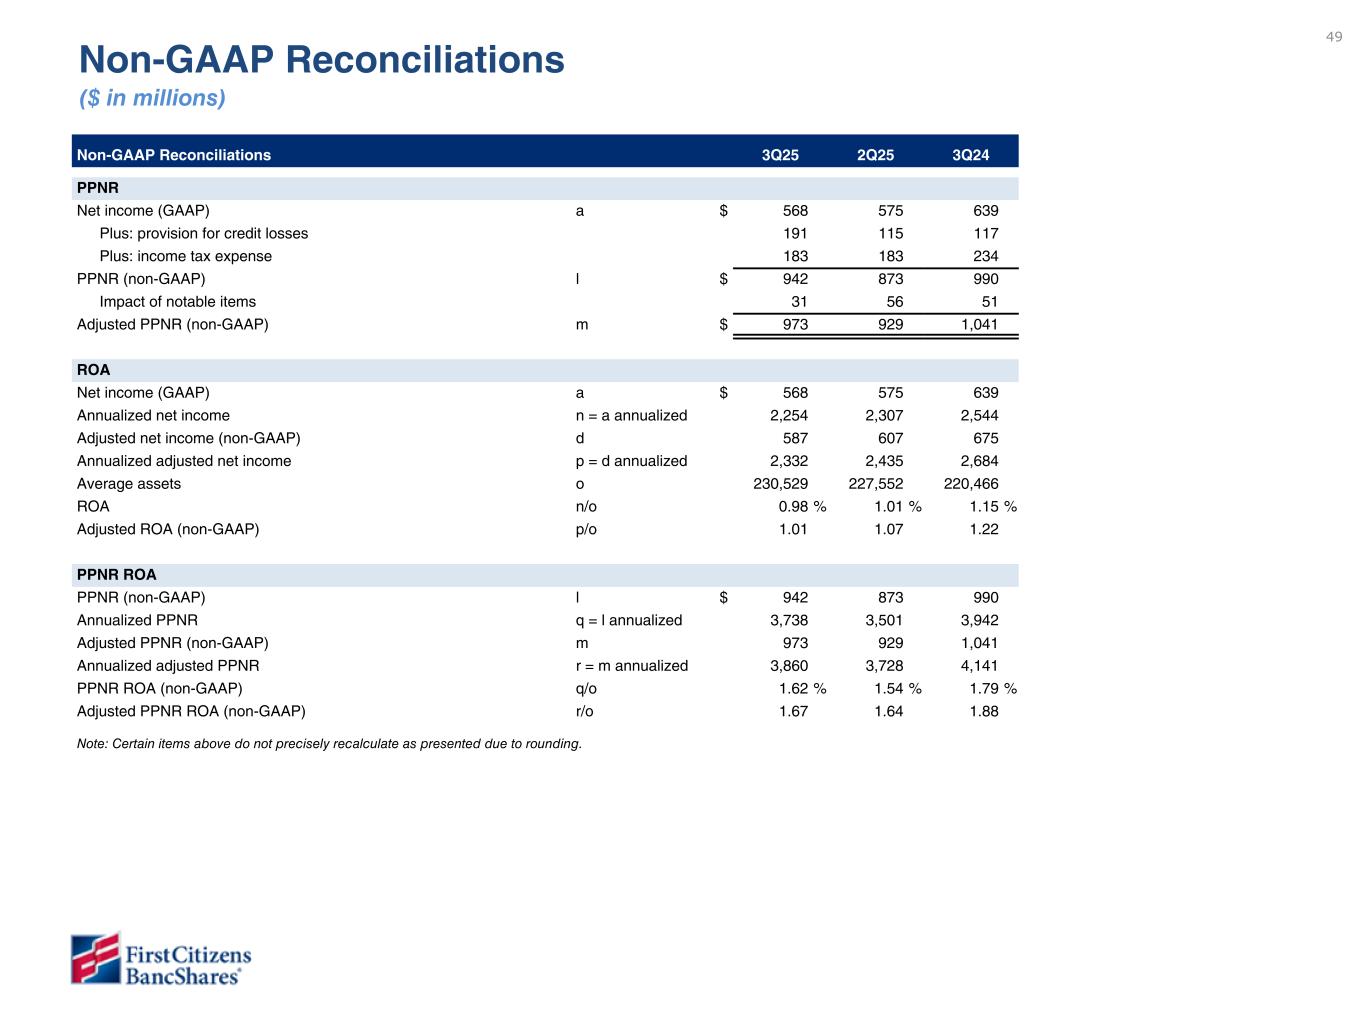
49 Non-GAAP Reconciliations ($ in millions) Non-GAAP Reconciliations 3Q25 2Q25 3Q24 PPNR Net income (GAAP) a $ 568 575 639 Plus: provision for credit losses 191 115 117 Plus: income tax expense 183 183 234 PPNR (non-GAAP) l $ 942 873 990 Impact of notable items 31 56 51 Adjusted PPNR (non-GAAP) m $ 973 929 1,041 ROA Net income (GAAP) a $ 568 575 639 Annualized net income n = a annualized 2,254 2,307 2,544 Adjusted net income (non-GAAP) d 587 607 675 Annualized adjusted net income p = d annualized 2,332 2,435 2,684 Average assets o 230,529 227,552 220,466 ROA n/o 0.98 % 1.01 % 1.15 % Adjusted ROA (non-GAAP) p/o 1.01 1.07 1.22 PPNR ROA PPNR (non-GAAP) l $ 942 873 990 Annualized PPNR q = l annualized 3,738 3,501 3,942 Adjusted PPNR (non-GAAP) m 973 929 1,041 Annualized adjusted PPNR r = m annualized 3,860 3,728 4,141 PPNR ROA (non-GAAP) q/o 1.62 % 1.54 % 1.79 % Adjusted PPNR ROA (non-GAAP) r/o 1.67 1.64 1.88 Note: Certain items above do not precisely recalculate as presented due to rounding.
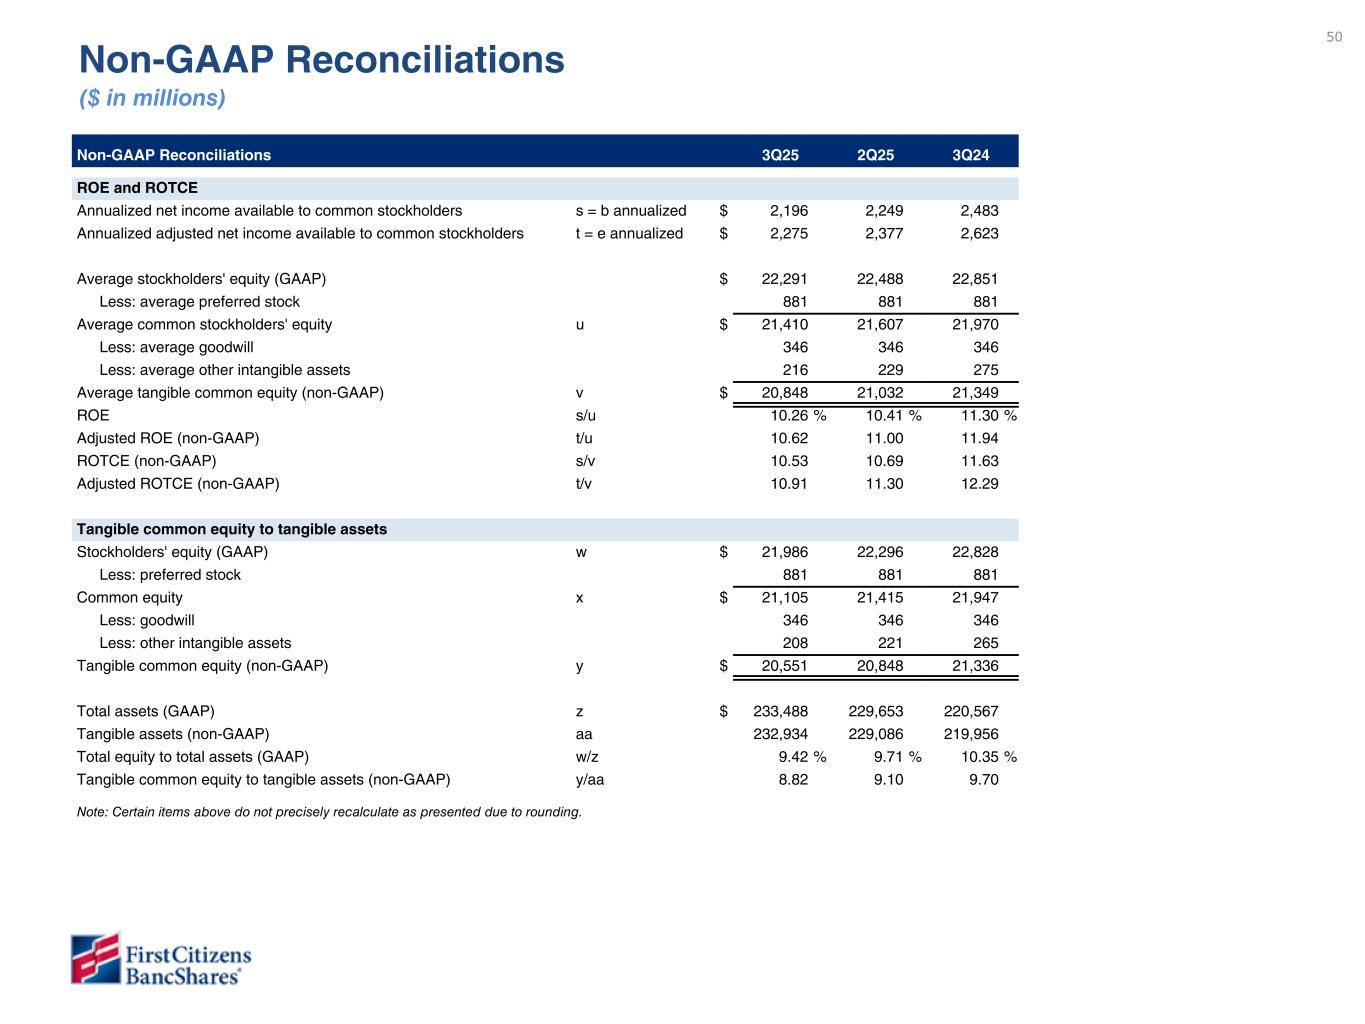
50 Non-GAAP Reconciliations ($ in millions) Non-GAAP Reconciliations 3Q25 2Q25 3Q24 ROE and ROTCE Annualized net income available to common stockholders s = b annualized $ 2,196 2,249 2,483 Annualized adjusted net income available to common stockholders t = e annualized $ 2,275 2,377 2,623 Average stockholders' equity (GAAP) $ 22,291 22,488 22,851 Less: average preferred stock 881 881 881 Average common stockholders' equity u $ 21,410 21,607 21,970 Less: average goodwill 346 346 346 Less: average other intangible assets 216 229 275 Average tangible common equity (non-GAAP) v $ 20,848 21,032 21,349 ROE s/u 10.26 % 10.41 % 11.30 % Adjusted ROE (non-GAAP) t/u 10.62 11.00 11.94 ROTCE (non-GAAP) s/v 10.53 10.69 11.63 Adjusted ROTCE (non-GAAP) t/v 10.91 11.30 12.29 Tangible common equity to tangible assets Stockholders' equity (GAAP) w $ 21,986 22,296 22,828 Less: preferred stock 881 881 881 Common equity x $ 21,105 21,415 21,947 Less: goodwill 346 346 346 Less: other intangible assets 208 221 265 Tangible common equity (non-GAAP) y $ 20,551 20,848 21,336 Total assets (GAAP) z $ 233,488 229,653 220,567 Tangible assets (non-GAAP) aa 232,934 229,086 219,956 Total equity to total assets (GAAP) w/z 9.42 % 9.71 % 10.35 % Tangible common equity to tangible assets (non-GAAP) y/aa 8.82 9.10 9.70 Note: Certain items above do not precisely recalculate as presented due to rounding.
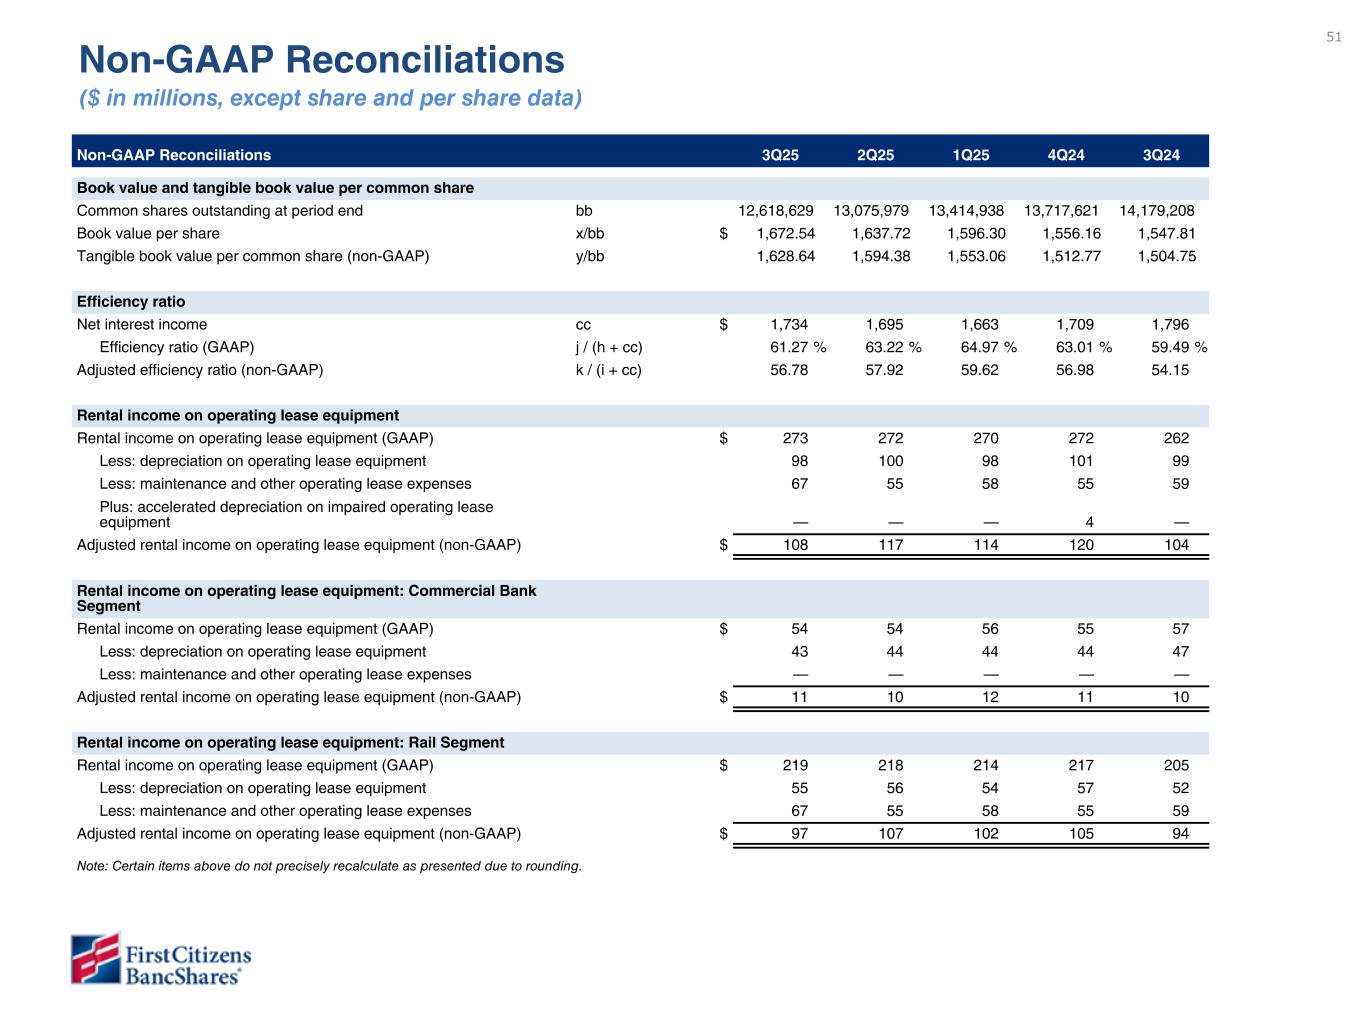
51 Non-GAAP Reconciliations ($ in millions, except share and per share data) Non-GAAP Reconciliations 3Q25 2Q25 1Q25 4Q24 3Q24 Book value and tangible book value per common share Common shares outstanding at period end bb 12,618,629 13,075,979 13,414,938 13,717,621 14,179,208 Book value per share x/bb $ 1,672.54 1,637.72 1,596.30 1,556.16 1,547.81 Tangible book value per common share (non-GAAP) y/bb 1,628.64 1,594.38 1,553.06 1,512.77 1,504.75 Efficiency ratio Net interest income cc $ 1,734 1,695 1,663 1,709 1,796 Efficiency ratio (GAAP) j / (h + cc) 61.27 % 63.22 % 64.97 % 63.01 % 59.49 % Adjusted efficiency ratio (non-GAAP) k / (i + cc) 56.78 57.92 59.62 56.98 54.15 Rental income on operating lease equipment Rental income on operating lease equipment (GAAP) $ 273 272 270 272 262 Less: depreciation on operating lease equipment 98 100 98 101 99 Less: maintenance and other operating lease expenses 67 55 58 55 59 Plus: accelerated depreciation on impaired operating lease equipment — — — 4 — Adjusted rental income on operating lease equipment (non-GAAP) $ 108 117 114 120 104 Rental income on operating lease equipment: Commercial Bank Segment Rental income on operating lease equipment (GAAP) $ 54 54 56 55 57 Less: depreciation on operating lease equipment 43 44 44 44 47 Less: maintenance and other operating lease expenses — — — — — Adjusted rental income on operating lease equipment (non-GAAP) $ 11 10 12 11 10 Rental income on operating lease equipment: Rail Segment Rental income on operating lease equipment (GAAP) $ 219 218 214 217 205 Less: depreciation on operating lease equipment 55 56 54 57 52 Less: maintenance and other operating lease expenses 67 55 58 55 59 Adjusted rental income on operating lease equipment (non-GAAP) $ 97 107 102 105 94 Note: Certain items above do not precisely recalculate as presented due to rounding.
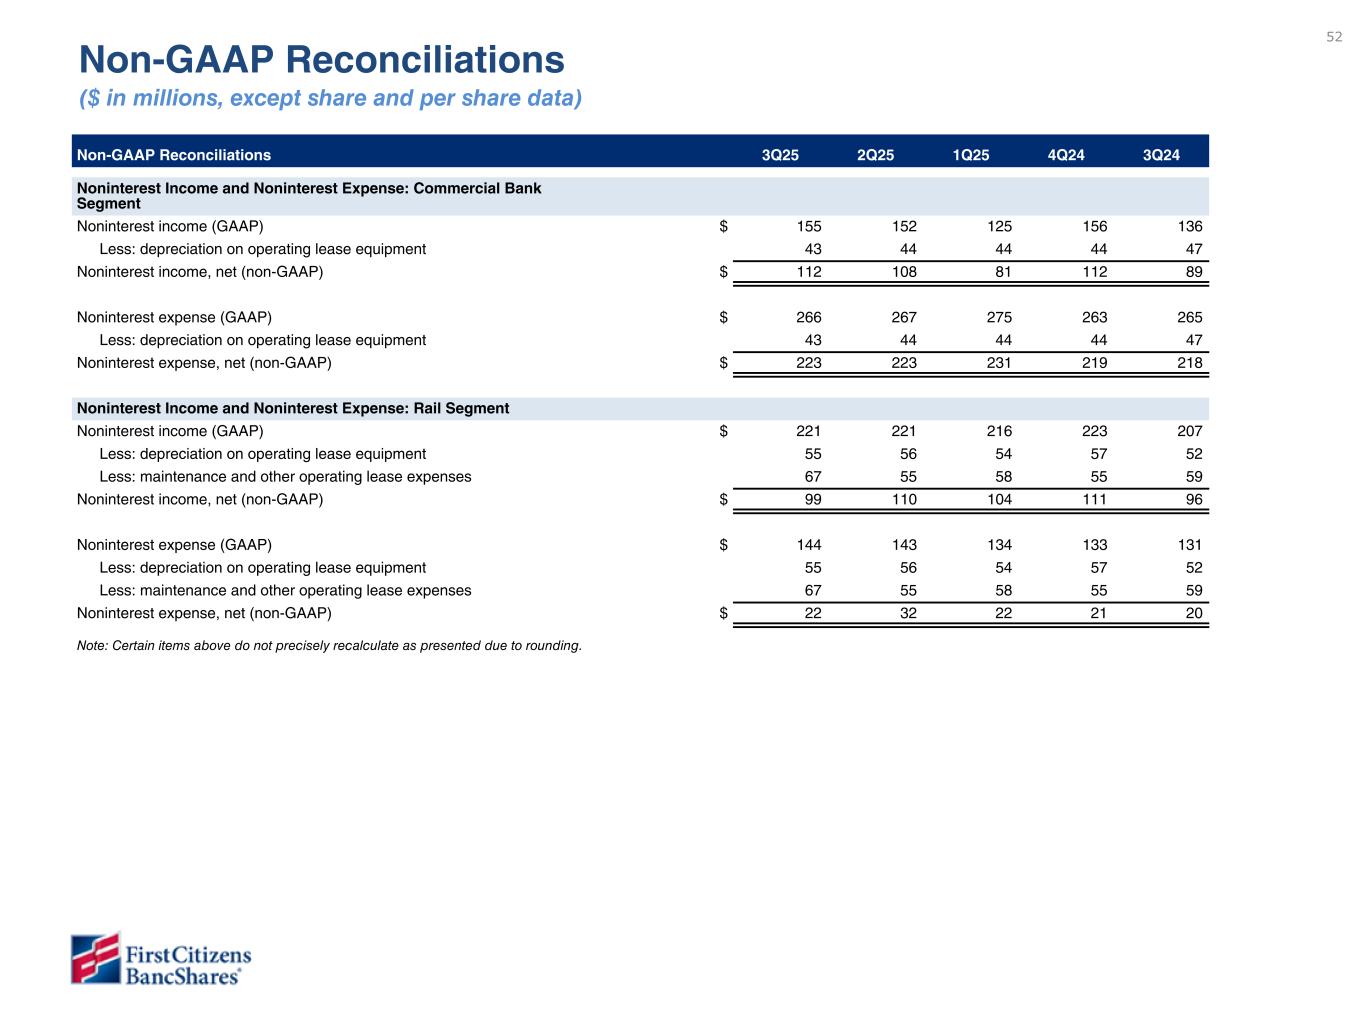
52 Non-GAAP Reconciliations ($ in millions, except share and per share data) Non-GAAP Reconciliations 3Q25 2Q25 1Q25 4Q24 3Q24 Noninterest Income and Noninterest Expense: Commercial Bank Segment Noninterest income (GAAP) $ 155 152 125 156 136 Less: depreciation on operating lease equipment 43 44 44 44 47 Noninterest income, net (non-GAAP) $ 112 108 81 112 89 Noninterest expense (GAAP) $ 266 267 275 263 265 Less: depreciation on operating lease equipment 43 44 44 44 47 Noninterest expense, net (non-GAAP) $ 223 223 231 219 218 Noninterest Income and Noninterest Expense: Rail Segment Noninterest income (GAAP) $ 221 221 216 223 207 Less: depreciation on operating lease equipment 55 56 54 57 52 Less: maintenance and other operating lease expenses 67 55 58 55 59 Noninterest income, net (non-GAAP) $ 99 110 104 111 96 Noninterest expense (GAAP) $ 144 143 134 133 131 Less: depreciation on operating lease equipment 55 56 54 57 52 Less: maintenance and other operating lease expenses 67 55 58 55 59 Noninterest expense, net (non-GAAP) $ 22 32 22 21 20 Note: Certain items above do not precisely recalculate as presented due to rounding.
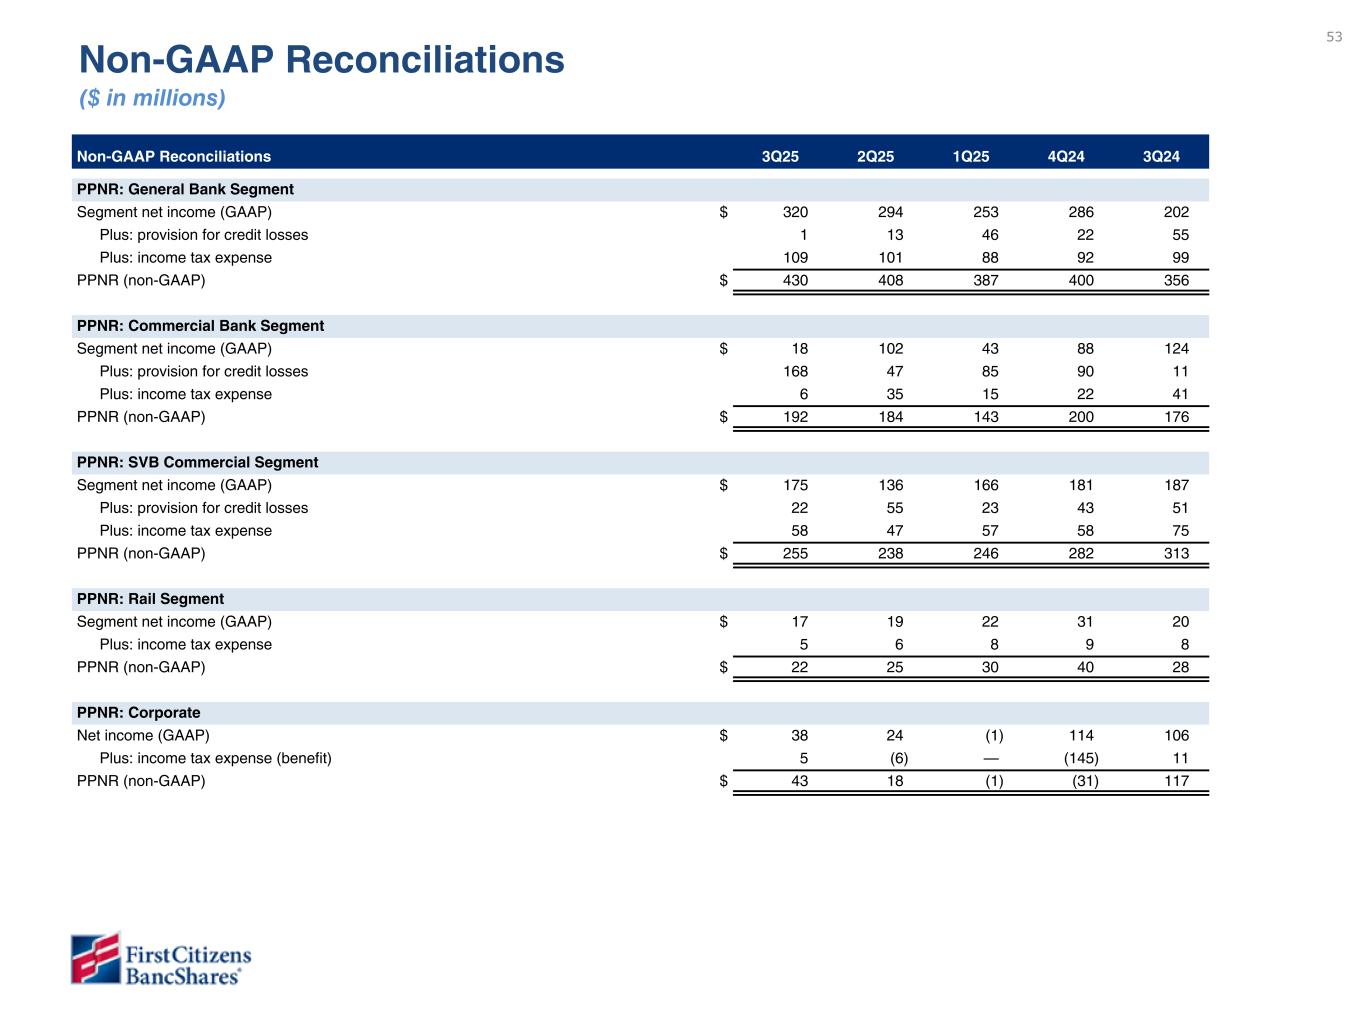
53 Non-GAAP Reconciliations ($ in millions) Non-GAAP Reconciliations 3Q25 2Q25 1Q25 4Q24 3Q24 PPNR: General Bank Segment Segment net income (GAAP) $ 320 294 253 286 202 Plus: provision for credit losses 1 13 46 22 55 Plus: income tax expense 109 101 88 92 99 PPNR (non-GAAP) $ 430 408 387 400 356 PPNR: Commercial Bank Segment Segment net income (GAAP) $ 18 102 43 88 124 Plus: provision for credit losses 168 47 85 90 11 Plus: income tax expense 6 35 15 22 41 PPNR (non-GAAP) $ 192 184 143 200 176 PPNR: SVB Commercial Segment Segment net income (GAAP) $ 175 136 166 181 187 Plus: provision for credit losses 22 55 23 43 51 Plus: income tax expense 58 47 57 58 75 PPNR (non-GAAP) $ 255 238 246 282 313 PPNR: Rail Segment Segment net income (GAAP) $ 17 19 22 31 20 Plus: income tax expense 5 6 8 9 8 PPNR (non-GAAP) $ 22 25 30 40 28 PPNR: Corporate Net income (GAAP) $ 38 24 (1) 114 106 Plus: income tax expense (benefit) 5 (6) — (145) 11 PPNR (non-GAAP) $ 43 18 (1) (31) 117
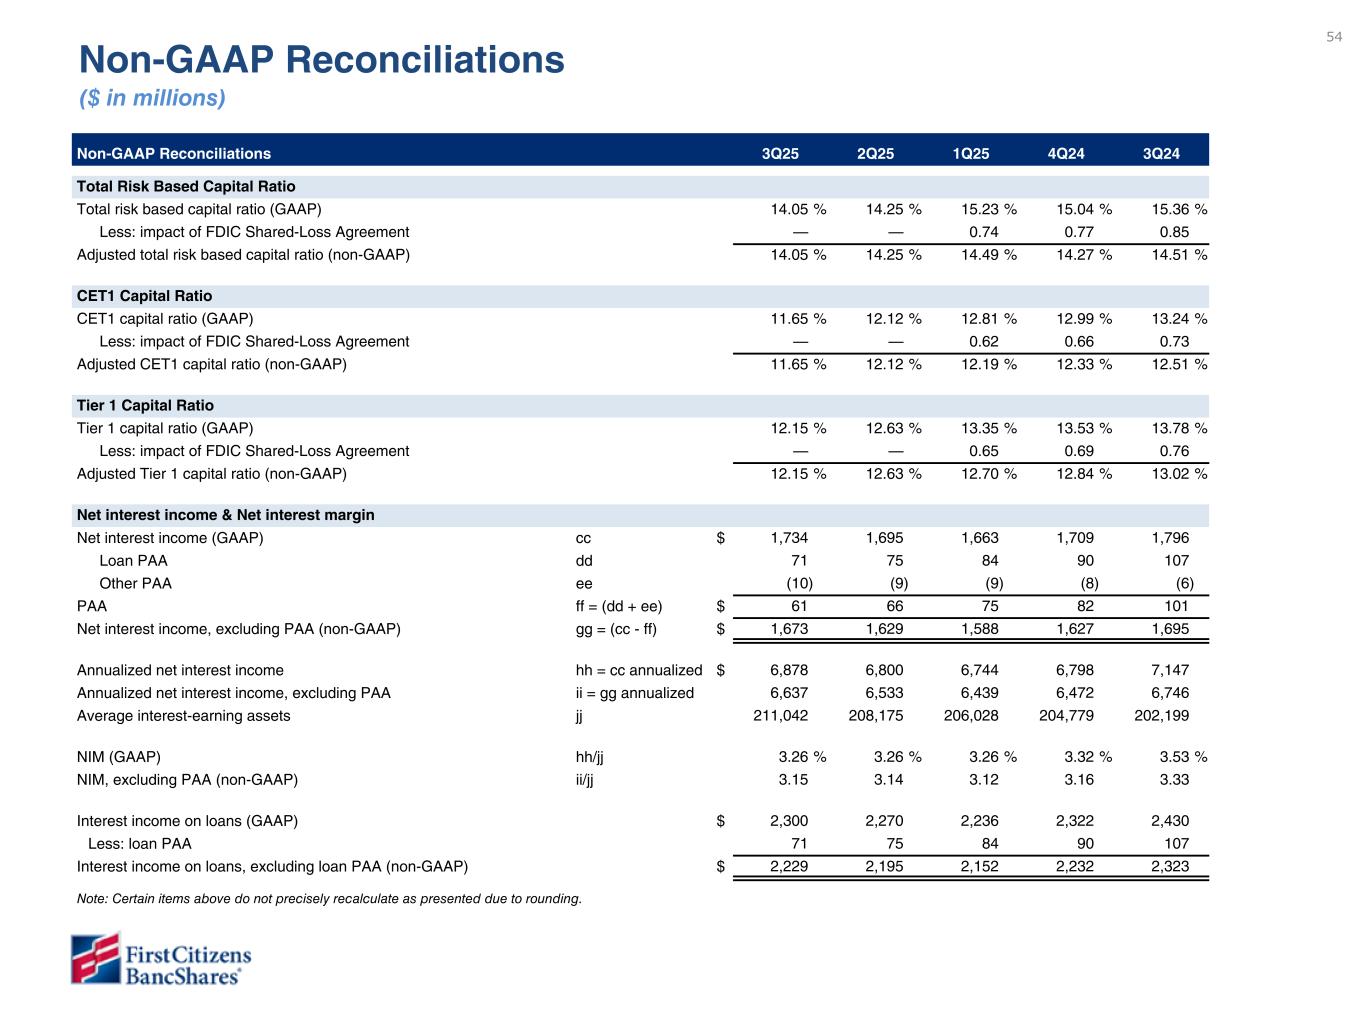
54 Non-GAAP Reconciliations ($ in millions) Non-GAAP Reconciliations 3Q25 2Q25 1Q25 4Q24 3Q24 Total Risk Based Capital Ratio Total risk based capital ratio (GAAP) 14.05 % 14.25 % 15.23 % 15.04 % 15.36 % Less: impact of FDIC Shared-Loss Agreement — — 0.74 0.77 0.85 Adjusted total risk based capital ratio (non-GAAP) 14.05 % 14.25 % 14.49 % 14.27 % 14.51 % CET1 Capital Ratio CET1 capital ratio (GAAP) 11.65 % 12.12 % 12.81 % 12.99 % 13.24 % Less: impact of FDIC Shared-Loss Agreement — — 0.62 0.66 0.73 Adjusted CET1 capital ratio (non-GAAP) 11.65 % 12.12 % 12.19 % 12.33 % 12.51 % Tier 1 Capital Ratio Tier 1 capital ratio (GAAP) 12.15 % 12.63 % 13.35 % 13.53 % 13.78 % Less: impact of FDIC Shared-Loss Agreement — — 0.65 0.69 0.76 Adjusted Tier 1 capital ratio (non-GAAP) 12.15 % 12.63 % 12.70 % 12.84 % 13.02 % Net interest income & Net interest margin Net interest income (GAAP) cc $ 1,734 1,695 1,663 1,709 1,796 Loan PAA dd 71 75 84 90 107 Other PAA ee (10) (9) (9) (8) (6) PAA ff = (dd + ee) $ 61 66 75 82 101 Net interest income, excluding PAA (non-GAAP) gg = (cc - ff) $ 1,673 1,629 1,588 1,627 1,695 Annualized net interest income hh = cc annualized $ 6,878 6,800 6,744 6,798 7,147 Annualized net interest income, excluding PAA ii = gg annualized 6,637 6,533 6,439 6,472 6,746 Average interest-earning assets jj 211,042 208,175 206,028 204,779 202,199 NIM (GAAP) hh/jj 3.26 % 3.26 % 3.26 % 3.32 % 3.53 % NIM, excluding PAA (non-GAAP) ii/jj 3.15 3.14 3.12 3.16 3.33 Interest income on loans (GAAP) $ 2,300 2,270 2,236 2,322 2,430 Less: loan PAA 71 75 84 90 107 Interest income on loans, excluding loan PAA (non-GAAP) $ 2,229 2,195 2,152 2,232 2,323 Note: Certain items above do not precisely recalculate as presented due to rounding.
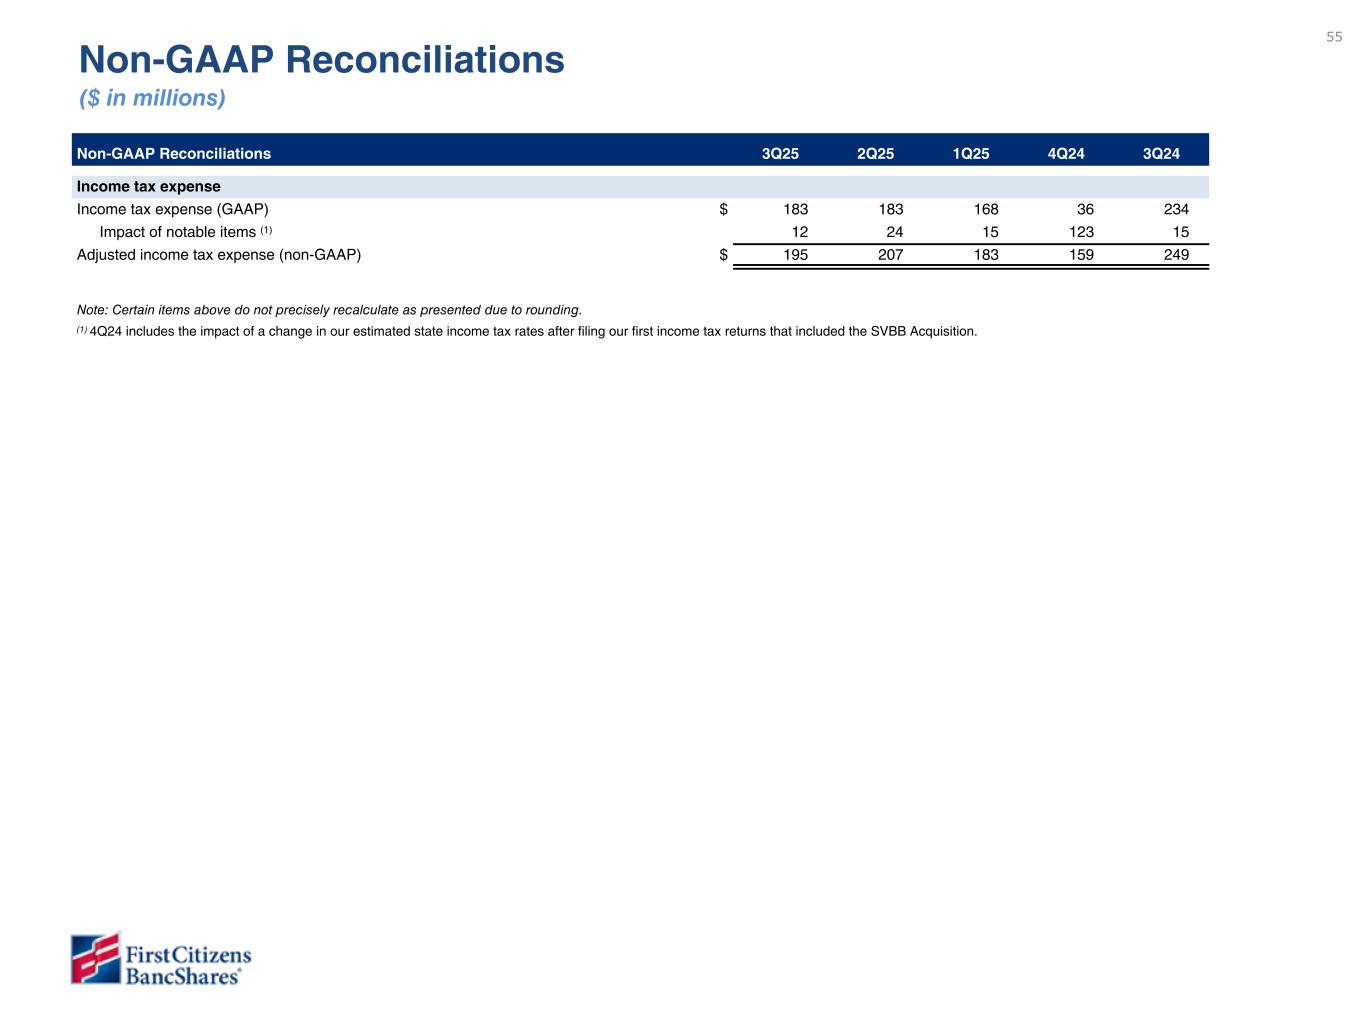
55 Non-GAAP Reconciliations ($ in millions) Non-GAAP Reconciliations 3Q25 2Q25 1Q25 4Q24 3Q24 Income tax expense Income tax expense (GAAP) $ 183 183 168 36 234 Impact of notable items (1) 12 24 15 123 15 Adjusted income tax expense (non-GAAP) $ 195 207 183 159 249 Note: Certain items above do not precisely recalculate as presented due to rounding. (1) 4Q24 includes the impact of a change in our estimated state income tax rates after filing our first income tax returns that included the SVBB Acquisition.