
Financial Results For The Third Quarter Ended September 27th 2026 Pilgrim’s Pride Corporation (NASDAQ: PPC)
Cautionary Notes and Forward-Looking Statements ▪ Statements contained in this press release that state the intentions, plans, hopes, beliefs, anticipations, expectations or predictions of the future of Pilgrim’s Pride Corporation and its management are considered forward-looking statements. Without limiting the foregoing, words such as “anticipates,” “believes,” “estimates,” “expects,” “intends,” “may,” “plans,” “projects,” “should,” “targets,” “will” and the negative thereof and similar words and expressions are intended to identify forward-looking statements. It is important to note that actual results could differ materially from those projected in such forward-looking statements. Factors that could cause actual results to differ materially from those projected in such forward-looking statements include: matters affecting the poultry industry generally; the ability to execute the Company’s business plan to achieve desired cost savings and profitability; future pricing for feed ingredients and the Company’s products; outbreaks of avian influenza or other diseases, either in Pilgrim’s Pride’s flocks or elsewhere, affecting its ability to conduct its operations and/or demand for its poultry products; contamination of Pilgrim’s Pride’s products, which has previously and can in the future lead to product liability claims and product recalls; exposure to risks related to product liability, product recalls, property damage and injuries to persons, for which insurance coverage is expensive, limited and potentially inadequate; management of cash resources; restrictions imposed by, and as a result of, Pilgrim’s Pride’s leverage; changes in laws or regulations affecting Pilgrim’s Pride’s operations or the application thereof; new immigration legislation or increased enforcement efforts in connection with existing immigration legislation that cause the costs of doing business to increase, cause Pilgrim’s Pride to change the way in which it does business, or otherwise disrupt its operations; competitive factors and pricing pressures or the loss of one or more of Pilgrim’s Pride’s largest customers; currency exchange rate fluctuations, trade barriers, exchange controls, expropriation and other risks associated with foreign operations; disruptions in international markets and distribution channels, including, but not limited to, the impacts of the Russia-Ukraine conflict; the risk of cyber-attacks, natural disasters, power losses, unauthorized access, telecommunication failures, and other problems on our information systems; and the impact of uncertainties of litigation and other legal matters described in our most recent Form 10-K and Form 10-Q, including the In re Broiler Chicken Antitrust Litigation, as well as other risks described under “Risk Factors” in the Company’s Annual Report on Form 10-K, Quarterly Reports on Form 10-Q and subsequent filings with the Securities and Exchange Commission. The forward looking statements in this release speak only as of the date hereof, and the Company undertakes no obligation to update any such statement after the date of this release, whether as a result of new information, future developments or otherwise, except as may be required by applicable law ▪ Actual results could differ materially from those projected in these forward-looking statements as a result of these factors, among others, many of which are beyond our control. In making these statements, we are not undertaking, and specifically decline to undertake, any obligation to address or update each or any factor in future filings or communications regarding our business or results, and we are not undertaking to address how any of these factors may have caused changes to information contained in previous filings or communications. Although we have attempted to list comprehensively these important cautionary risk factors, we must caution investors and others that other factors may in the future prove to be important and affecting our business or results of operations ▪ This presentation may include information that may be considered non-GAAP financial information as contemplated by SEC Regulation G, Rule 100, including EBITDA, Adjusted EBITDA, LTM EBITDA, Net Debt, Free Cash Flow, Adjusted EBITDA Margin and others. Accordingly, we have provided tables in the accompanying appendix and in our previous filings with the SEC that reconcile these measures to their corresponding GAAP-based measures and explain why these measures are useful to investors, which can be obtained from the Consolidated Statements of Income provided with our previous filings with the SEC. Our method of computation may or may not be comparable to other similarly titled measures used in filings with the SEC by other companies. See the consolidated statements of income and consolidated statements of cash flows included in our financial statements. 2
Third Quarter 2026 Financial Review 3 Main Indicators ($MM) Q3 2026 Q3 2025 Net Revenue 4,653.2 4,759.3 Gross Profit 333.7 659.4 SG&A 142.2 165.0 Operating Income 191.5 492.6 Net Interest 30.2 29.0 Net Income 116.3 343.1 Earnings Per Share (EPS) 0.49 1.44 Adjusted EBITDA* 316.3 633.1 Adjusted EBITDA Margin* 6.8% 13.3% * This is a non-GAAP measurement considered by management to be useful in understanding our results. Please see the appendix and most recent SEC financial filings for definition of this measurement and reconciliation to US GAAP. ▪ U.S.: Year-over-year (YoY) decrease in commodity market pricing and higher grain costs negatively impacted the business unit; partially offset by strong growth in Prepared Foods volumes and improved live performance and plant yields in the Fresh business; Europe: YoY profit decline primarily due to lower priced European supply of Pork; Mexico: YoY profitability declined primarily due to lower market pricing and higher grain costs. ▪ SG&A is lower primarily due to a decrease in legal settlements expense and lower incentive compensation costs In $MM U.S. EU MX Net Revenue 2,680.1 1,374.0 599.1 Adjusted Operating Income* 105.8 63.4 22.3 Adjusted Operating Income Margin* 3.9% 4.6% 3.7% Source: PPC
Pullet Placements Rose 1.1% Y/Y in Q3-2026, Reflecting Steady Quarterly Growth 4 - 2,000 4,000 6,000 8,000 10,000 12,000 Jan Feb Mar Apr May Jun Jul Aug Sep Oct Nov Dec Th o u sa n d H ea d Intended Pullet Placements, Domestic Use 2024 2025 2026 5 Yr. Avg. Source: USDA
Broiler Layer Flock Increased Y/Y in Q3-26; Eggs/100 Slightly Down Y/Y in Q3-26 5 ▪ Broiler layer flock +1.4% YoY in Q3-26. ▪ Eggs/100 -0.4% YoY in Q3-26. 50,000 52,000 54,000 56,000 58,000 60,000 62,000 64,000 H ea d ( 0 0 0 ) Broiler Type Hatching Layers 2024 2025 2026 5 Yr. Avg. 1,500 1,550 1,600 1,650 1,700 1,750 1,800 1,850 1,900 1,950 2,000 E g g s Eggs/100 2024 2025 2026 5 Yr. Avg. Source: USDA
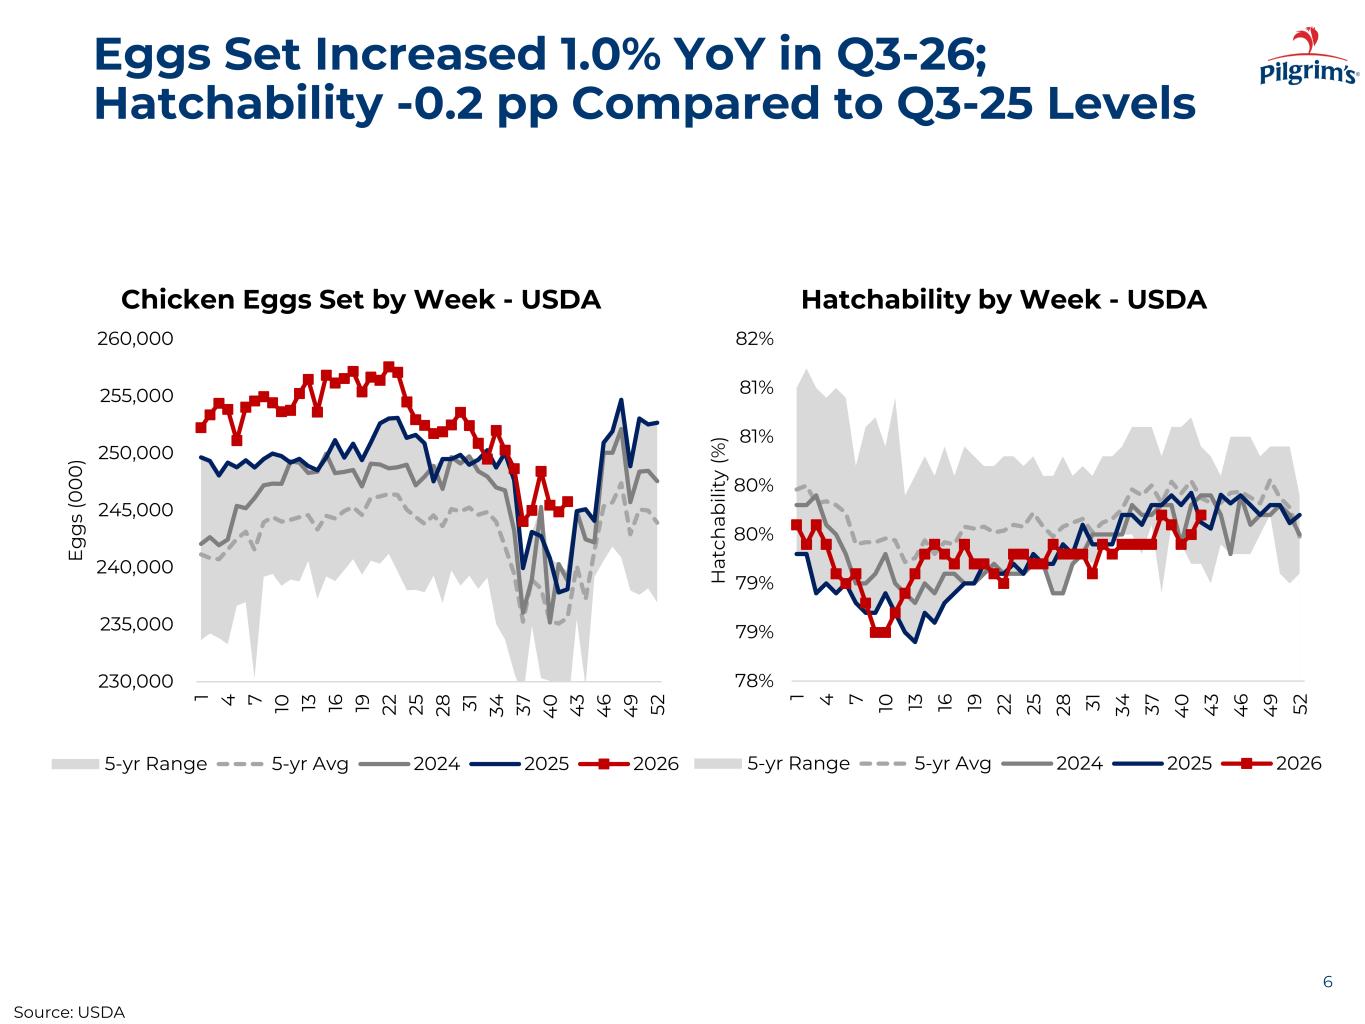
Eggs Set Increased 1.0% YoY in Q3-26; Hatchability -0.2 pp Compared to Q3-25 Levels 6 215,000 220,000 225,000 230,000 235,000 240,000 245,000 250,000 255,000 1 4 7 1 0 1 3 1 6 1 9 2 2 2 5 2 8 3 1 3 4 3 7 4 0 4 3 4 6 4 9 5 2 Eg gs ( 0 0 0 ) Chicken Eggs Set by Week - USDA 5-yr Range 5-yr Avg 2023 2024 2025 230,000 235,000 240,000 245,000 250,000 255,00 260,000 1 4 7 10 13 16 19 22 25 28 31 34 37 4 0 4 3 4 6 4 9 52 E g g s (0 0 0 ) Chicken Egg y ek - USDA 5-yr Range 5-yr Avg 2024 2025 2026 78% 79% 79% 80% 80% 81% 81% 82% 1 4 7 10 13 16 19 22 25 28 31 34 37 4 0 4 3 4 6 4 9 52 H at ch ab ili ty ( % ) Hatchability by Week - USDA 5-yr Range 5-yr Avg 2024 2025 2026 Source: USDA
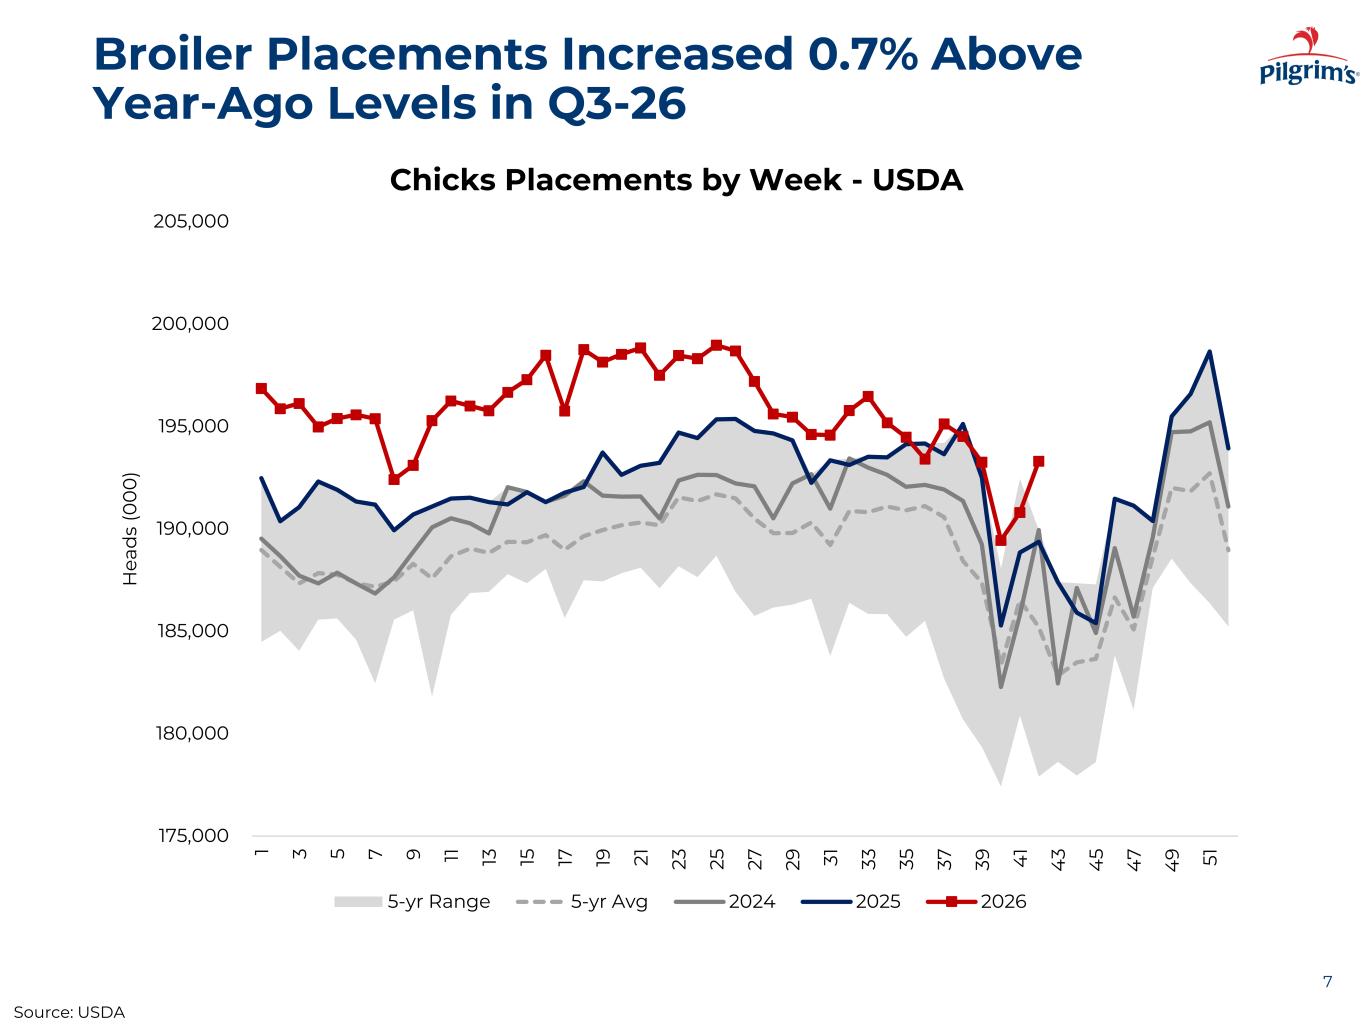
Broiler Placements Increased 0.7% Above Year-Ago Levels in Q3-26 7 175,000 180,000 185,000 190,000 195,000 200,000 205,000 1 3 5 7 9 11 13 15 17 19 21 23 25 27 29 31 33 35 37 39 4 1 4 3 4 5 4 7 4 9 51 H ea d s (0 0 0 ) Chicks Placements by Week - USDA 5-yr Range 5-yr Avg 2024 2025 2026 Source: USDA
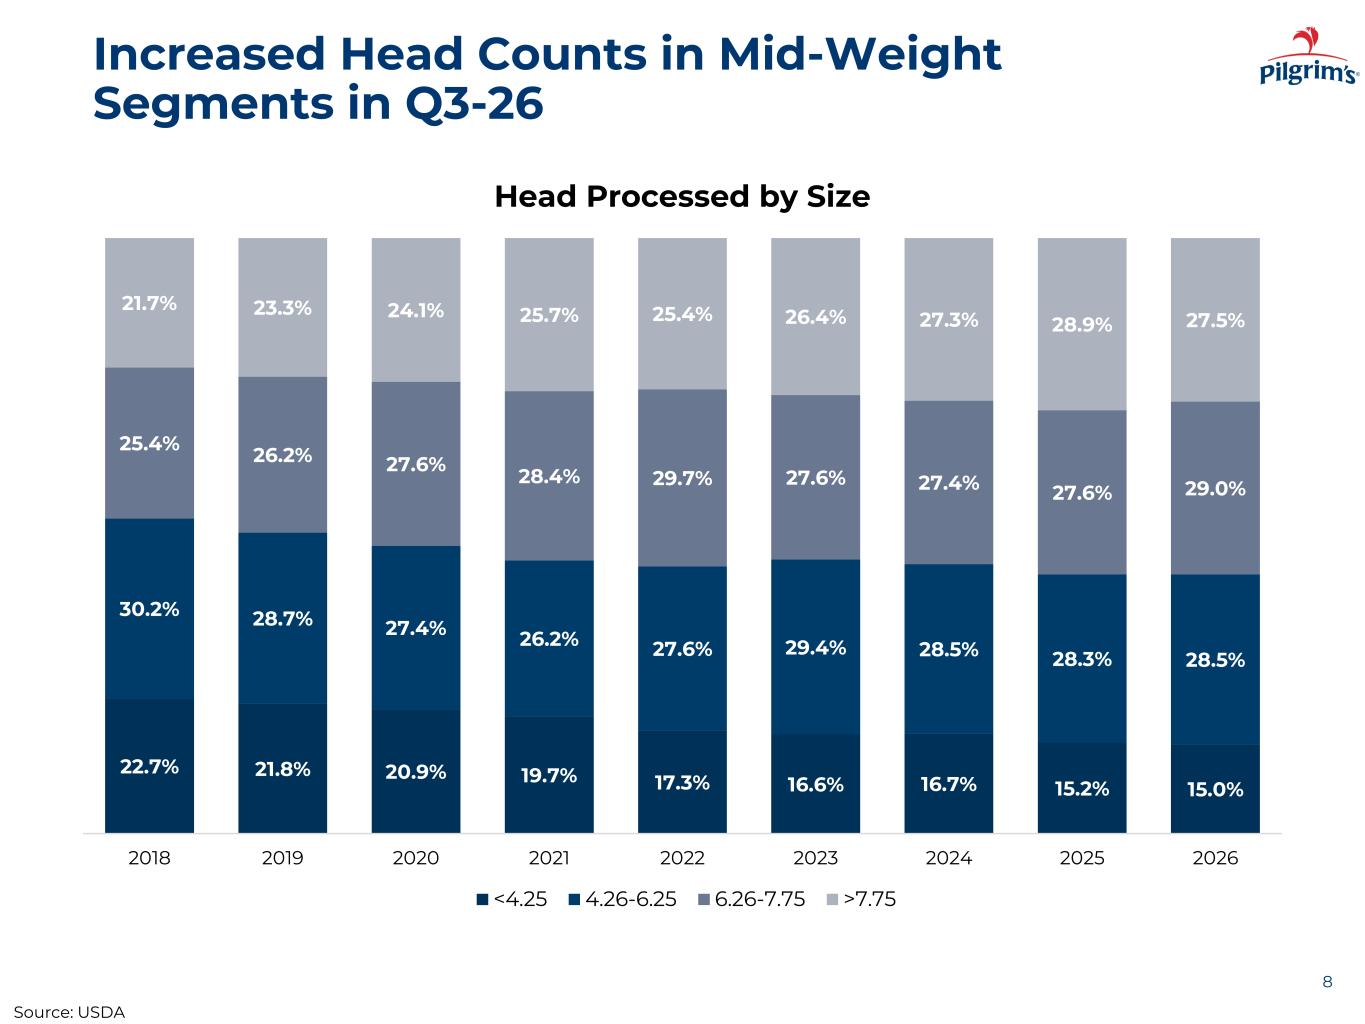
Increased Head Counts in Mid-Weight Segments in Q3-26 8 22.7% 21.8% 20.9% 19.7% 17.3% 16.6% 16.7% 15.2% 15.0% 30.2% 28.7% 27.4% 26.2% 27.6% 29.4% 28.5% 28.3% 28.5% 25.4% 26.2% 27.6% 28.4% 29.7% 27.6% 27.4% 27.6% 29.0% 21.7% 23.3% 24.1% 25.7% 25.4% 26.4% 27.3% 28.9% 27.5% 2018 2019 2020 2021 2022 2023 2024 2025 2026 Head Processed by Size <4.25 4.26-6.25 6.26-7.75 >7.75 Source: USDA
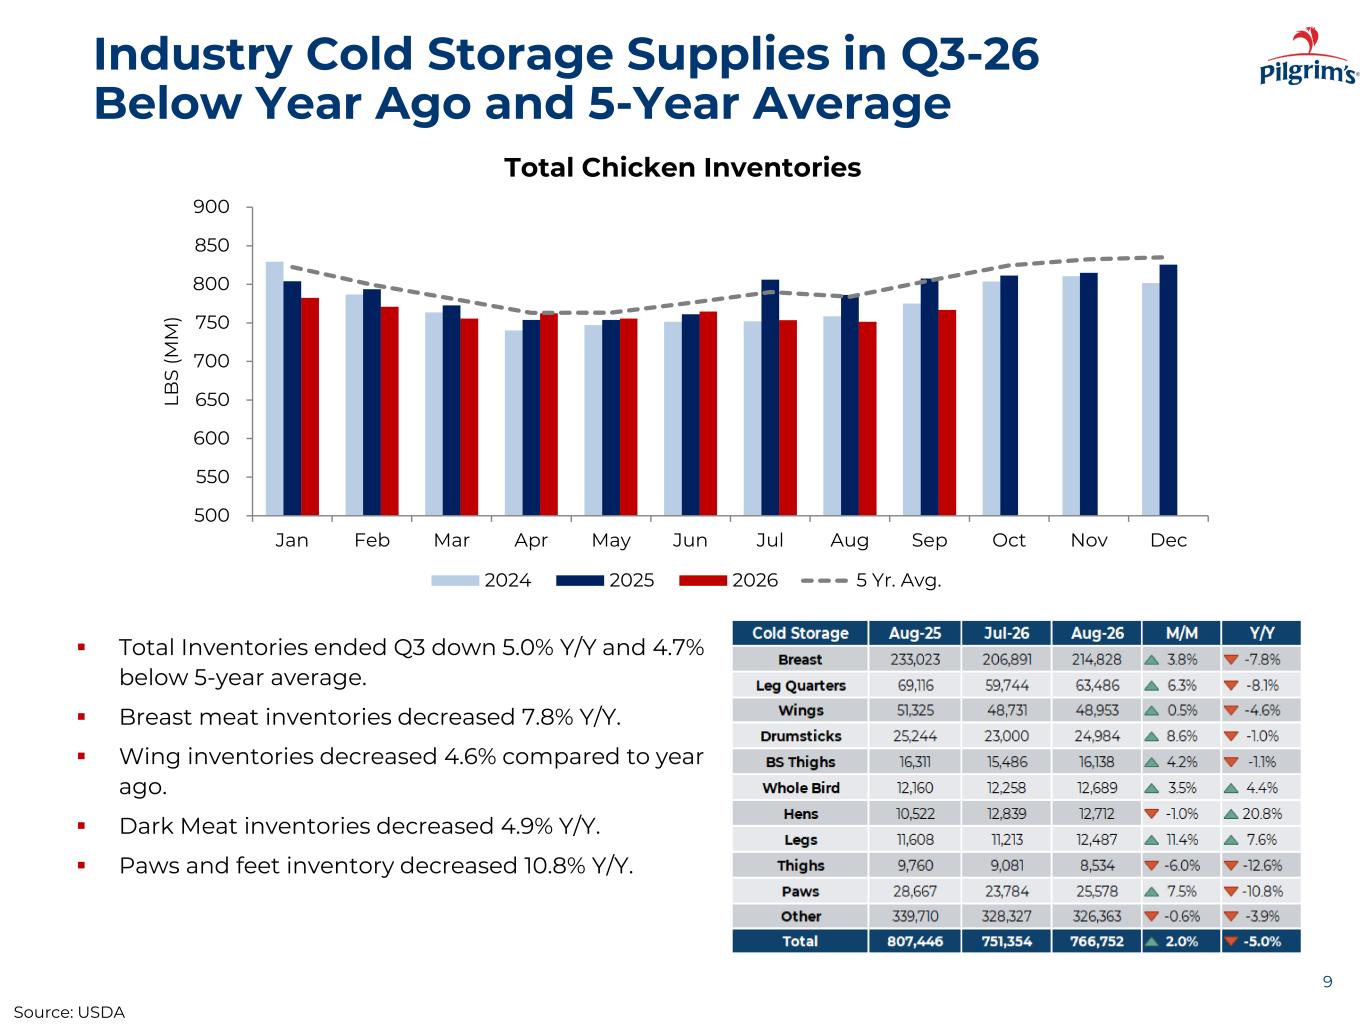
Industry Cold Storage Supplies in Q3-26 Below Year Ago and 5-Year Average ▪ Total Inventories ended Q3 down 5.0% Y/Y and 4.7% below 5-year average. ▪ Breast meat inventories decreased 7.8% Y/Y. ▪ Wing inventories decreased 4.6% compared to year ago. ▪ Dark Meat inventories decreased 4.9% Y/Y. ▪ Paws and feet inventory decreased 10.8% Y/Y. 9 500 550 600 650 700 750 800 850 900 Jan Feb Mar Apr May Jun Jul Aug Sep Oct Nov Dec LB S (M M ) Total Chicken Inventories 2024 2025 2026 5 Yr. Avg. Source: USDA
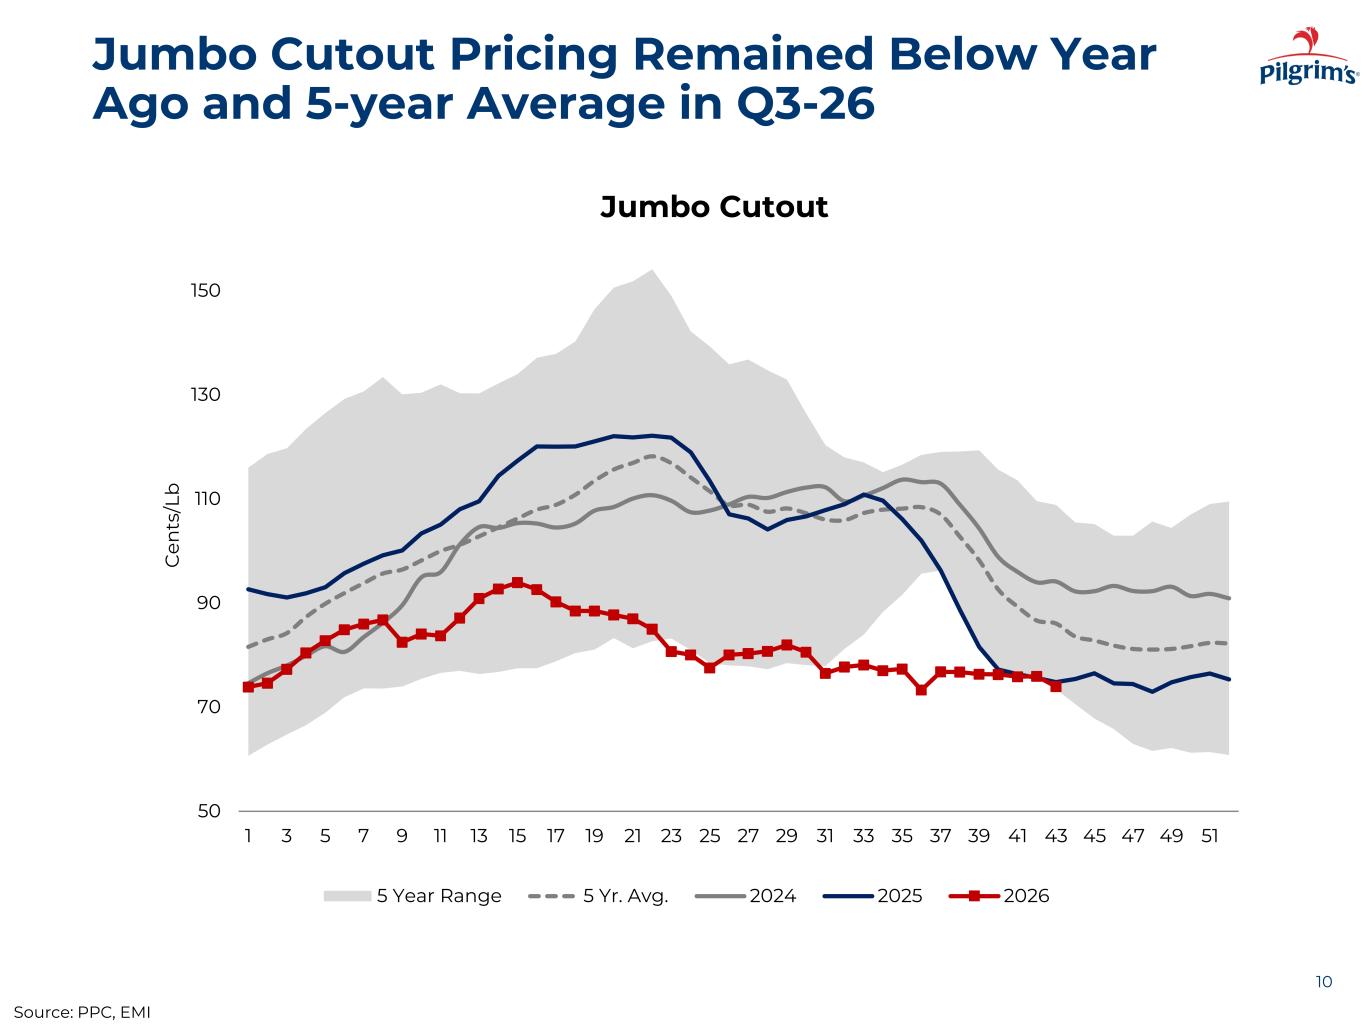
Jumbo Cutout Pricing Remained Below Year Ago and 5-year Average in Q3-26 10 50 70 90 110 130 150 1 3 5 7 9 11 13 15 17 19 21 23 25 27 29 31 33 35 37 39 41 43 45 47 49 51 C en ts /L b Jumbo Cutout 5 Year Range 5 Yr. Avg. 2024 2025 2026 Source: PPC, EMI
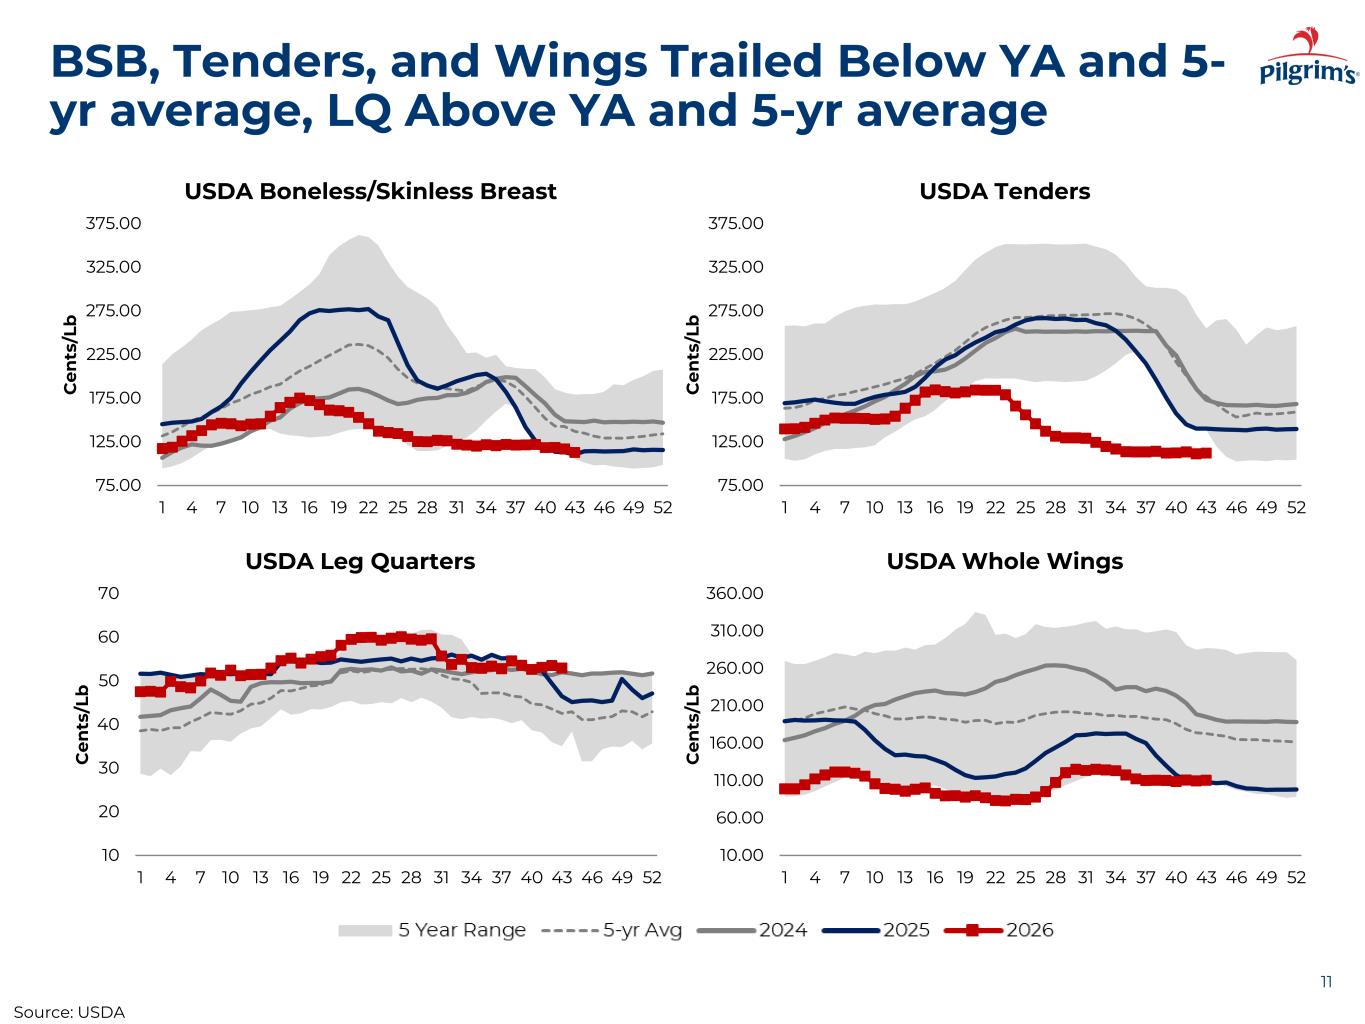
BSB, Tenders, and Wings Trailed Below YA and 5- yr average, LQ Above YA and 5-yr average 11 75.00 125.00 175.00 225.00 275.00 325.00 375.00 1 4 7 10 13 16 19 22 25 28 31 34 37 40 43 46 49 52 C e n ts /L b USDA Boneless/Skinless Breast 75.00 125.00 175.00 225.00 275.00 325.00 375.00 1 4 7 10 13 16 19 22 25 28 31 34 37 40 43 46 49 52 C e n ts /L b USDA Tenders 10 20 30 40 50 60 70 1 4 7 10 13 16 19 22 25 28 31 34 37 40 43 46 49 52 C e n ts /L b USDA Leg Quarters 10.00 60.00 110.00 160.00 210.00 260.00 310.00 360.00 1 4 7 10 13 16 19 22 25 28 31 34 37 40 43 46 49 52 C e n ts /L b USDA Whole Wings Source: USDA
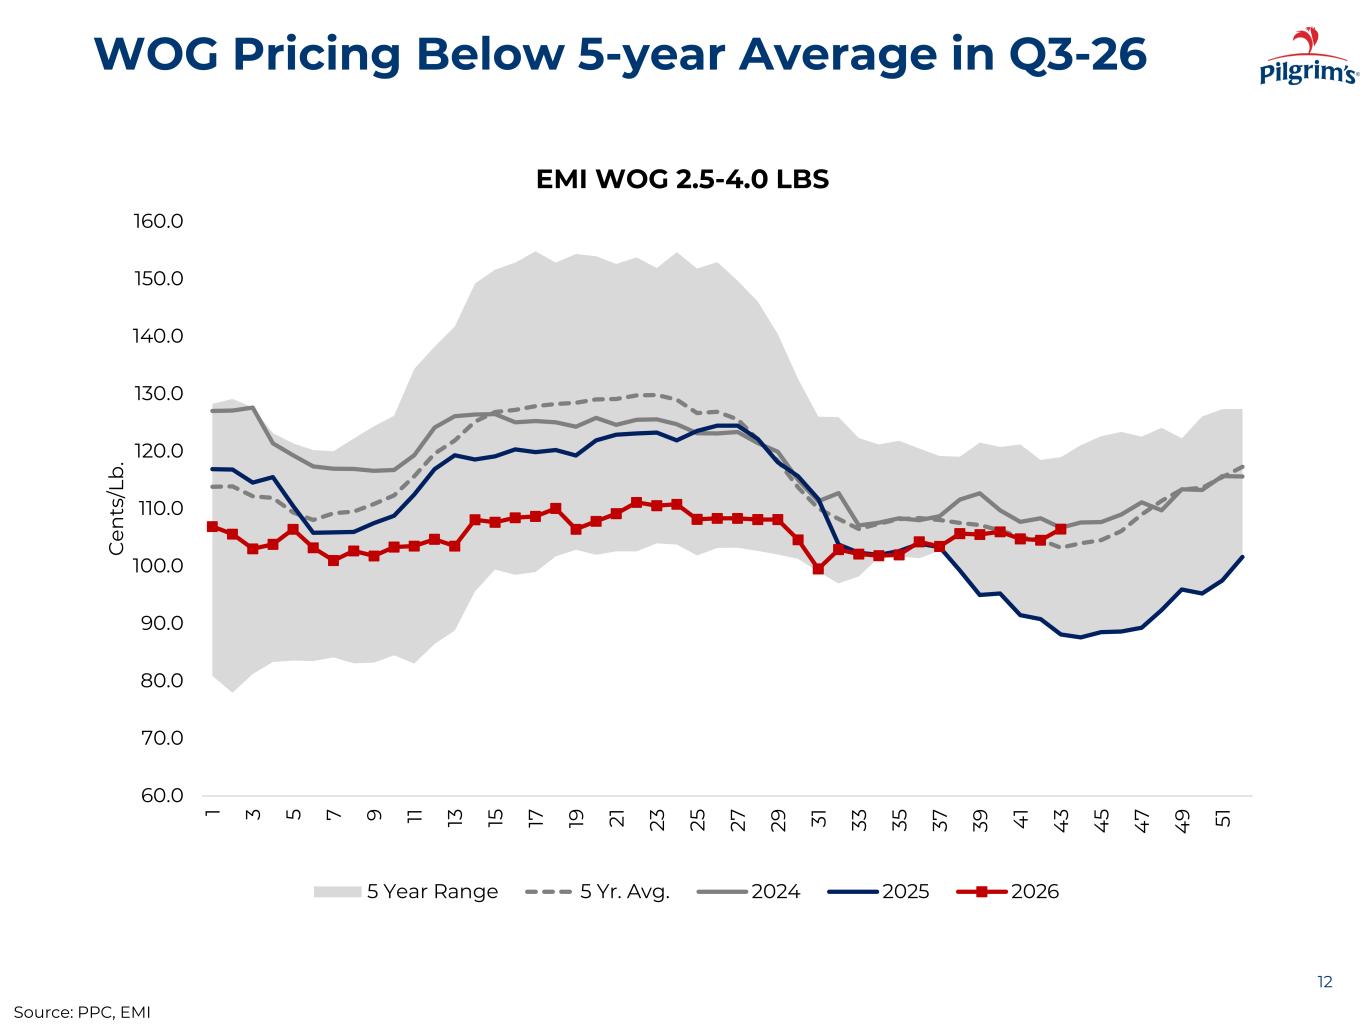
WOG Pricing Below 5-year Average in Q3-26 12 60.0 70.0 80.0 90.0 100.0 110.0 120.0 130.0 140.0 150.0 160.0 1 3 5 7 9 11 13 15 17 19 21 23 25 27 29 31 33 35 37 39 4 1 4 3 4 5 4 7 4 9 51 C en ts /L b . EMI WOG 2.5-4.0 LBS 5 Year Range 5 Yr. Avg. 2024 2025 2026 Source: PPC, EMI
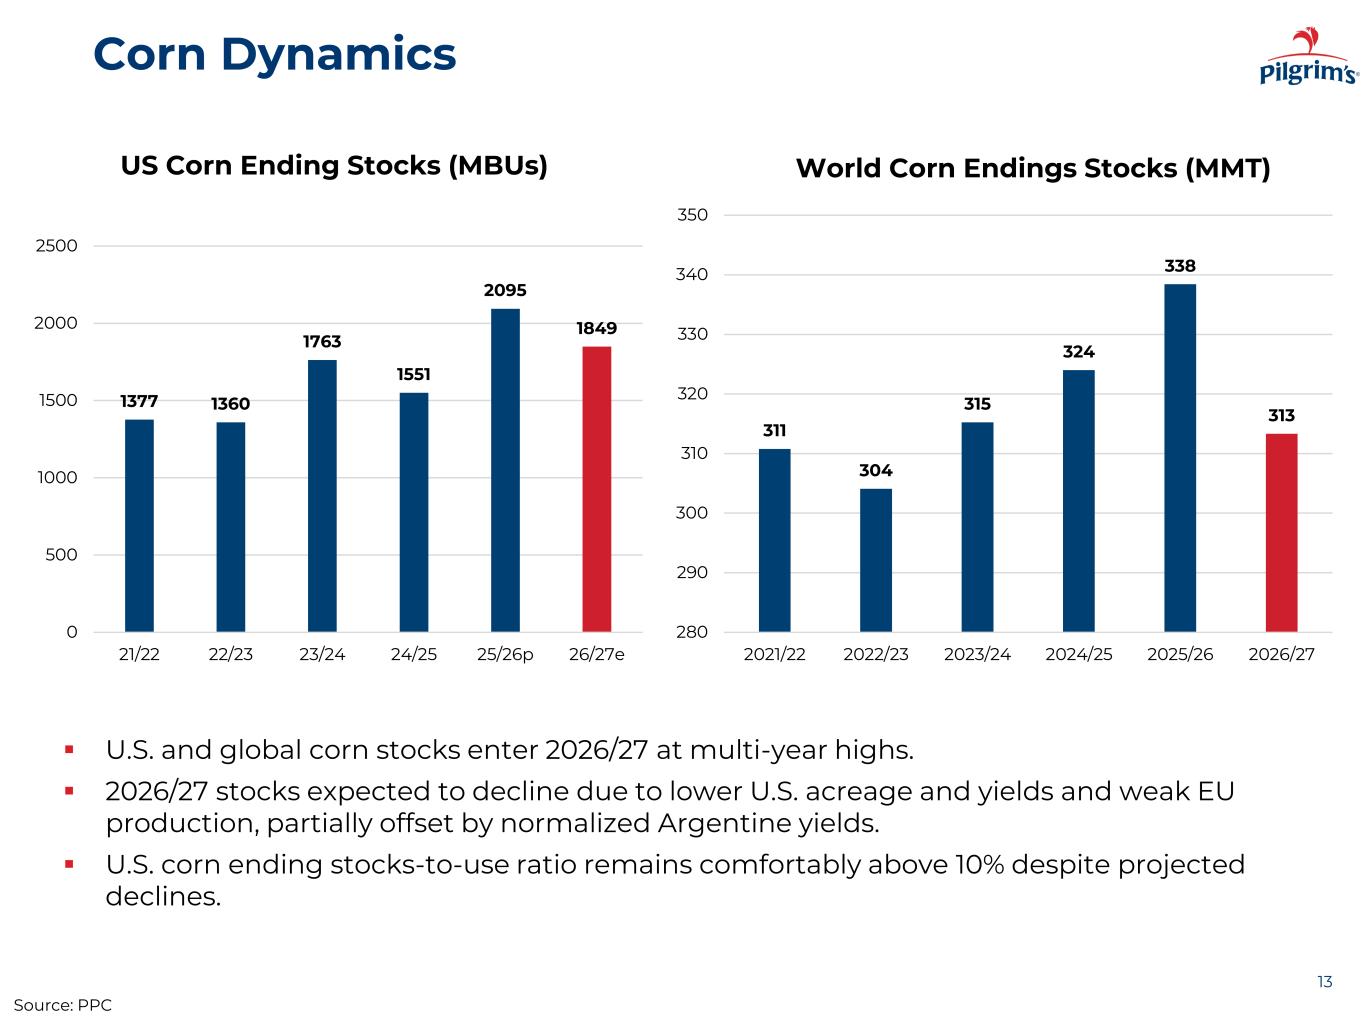
Corn Dynamics 13 Source: PPC 1377 1360 1763 1551 2095 1849 0 500 1000 1500 2000 2500 21/22 22/23 23/24 24/25 25/26p 26/27e US Corn Ending Stocks (MBUs) 311 304 315 324 338 313 280 290 300 310 320 330 340 350 2021/22 2022/23 2023/24 2024/25 2025/26 2026/27 World Corn Endings Stocks (MMT) ▪ U.S. and global corn stocks enter 2026/27 at multi-year highs. ▪ 2026/27 stocks expected to decline due to lower U.S. acreage and yields and weak EU production, partially offset by normalized Argentine yields. ▪ U.S. corn ending stocks-to-use ratio remains comfortably above 10% despite projected declines.
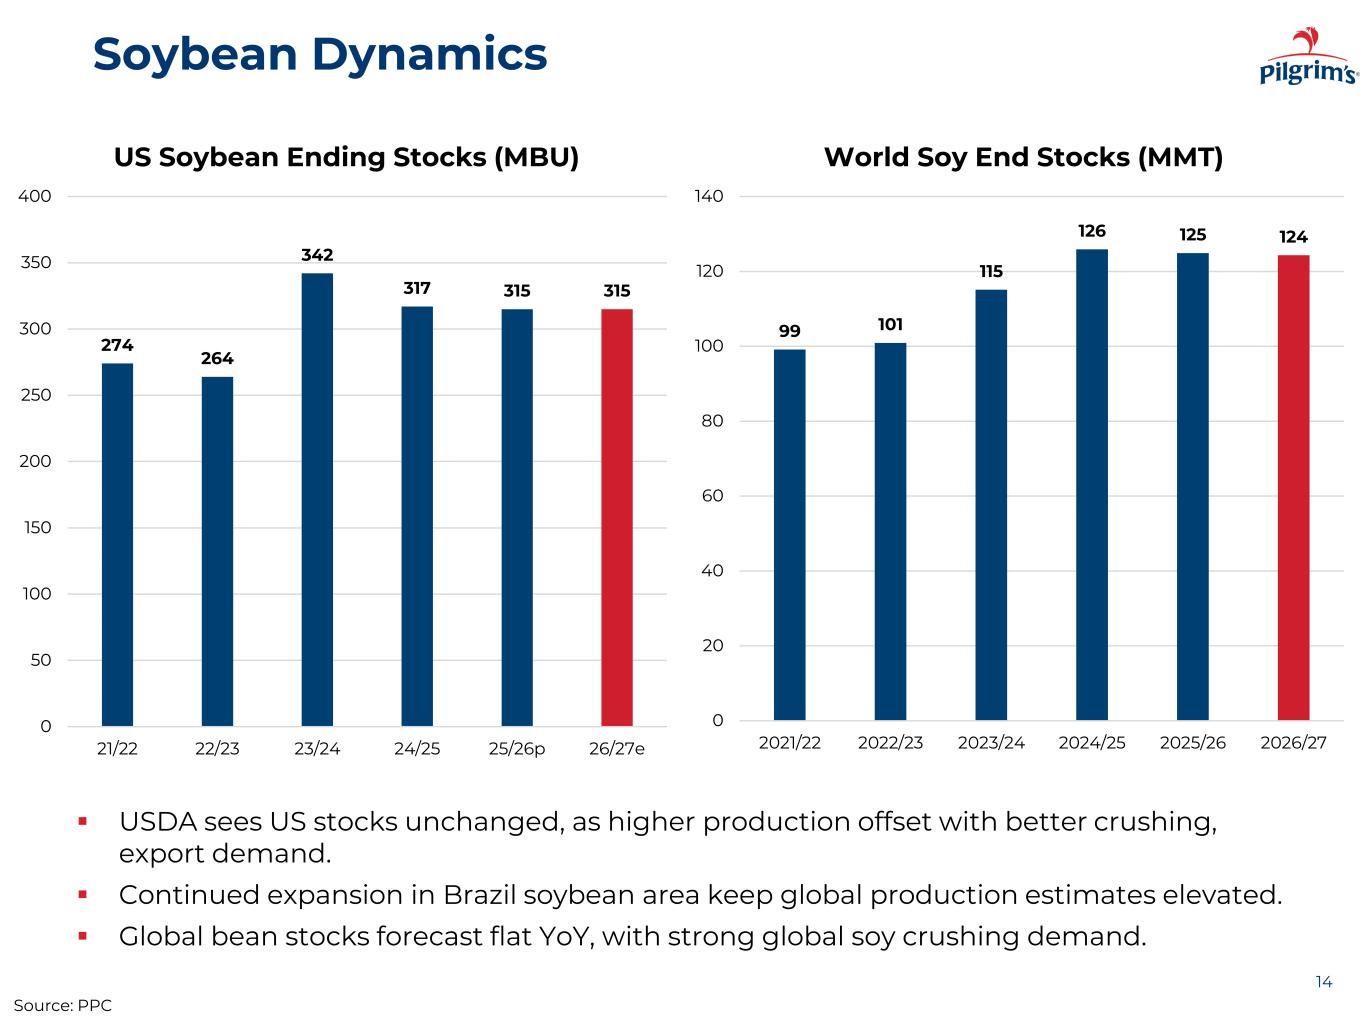
Soybean Dynamics 14 Source: PPC ▪ USDA sees US stocks unchanged, as higher production offset with better crushing, export demand. ▪ Continued expansion in Brazil soybean area keep global production estimates elevated. ▪ Global bean stocks forecast flat YoY, with strong global soy crushing demand. 274 264 342 317 315 315 0 50 100 150 200 250 300 350 400 21/22 22/23 23/24 24/25 25/26p 26/27e US Soybean Ending Stocks (MBU) 99 101 115 126 125 124 0 20 40 60 80 100 120 140 2021/22 2022/23 2023/24 2024/25 2025/26 2026/27 World Soy End Stocks (MMT)
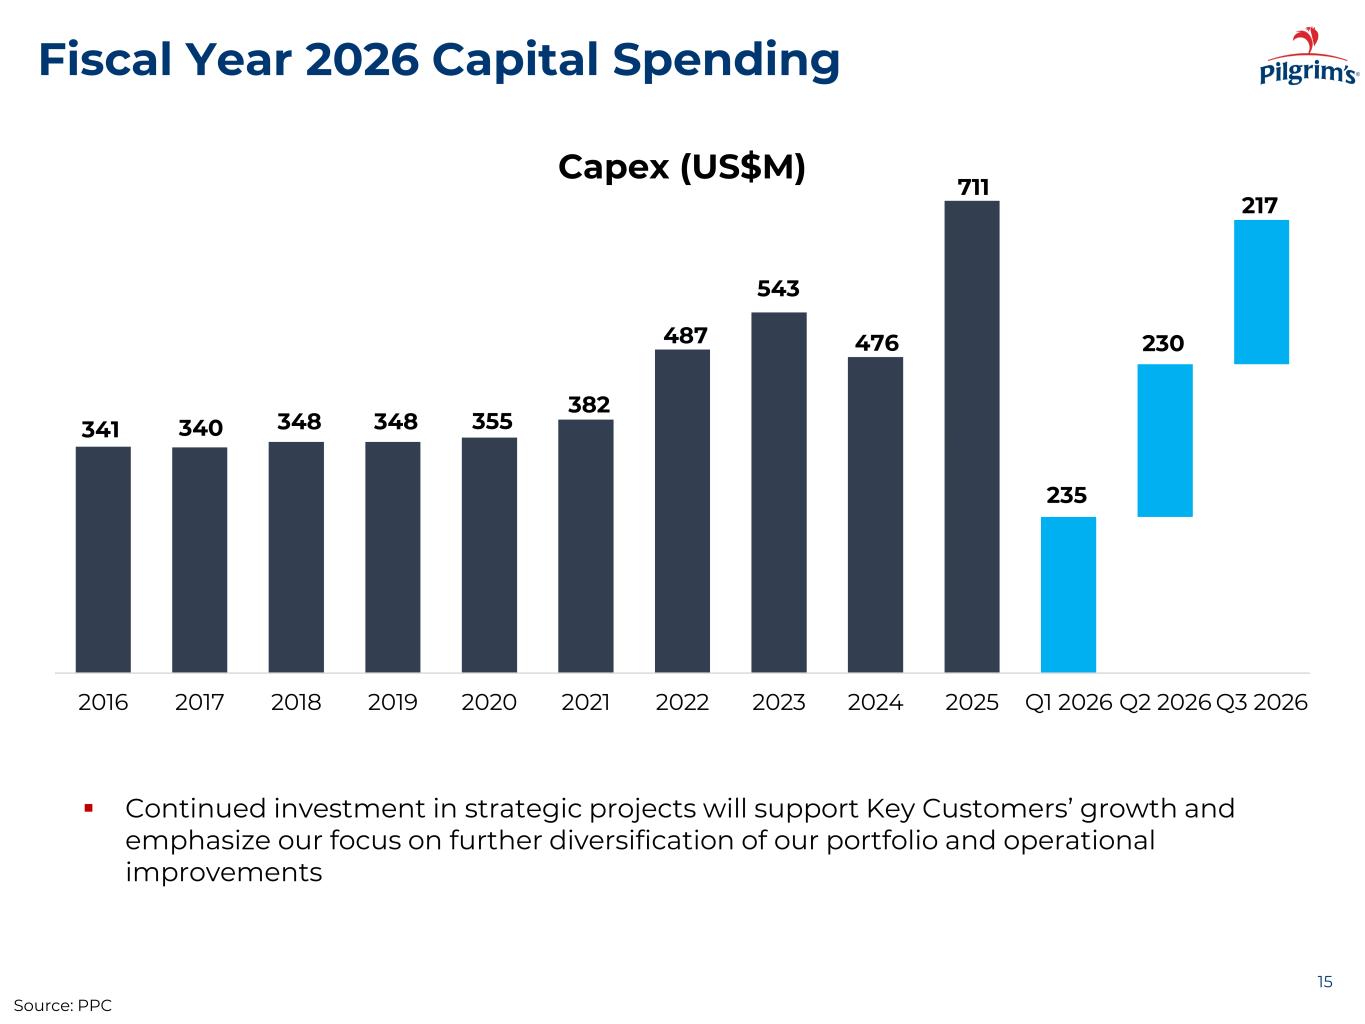
Fiscal Year 2026 Capital Spending 15 Capex (US$M) ▪ Continued investment in strategic projects will support Key Customers’ growth and emphasize our focus on further diversification of our portfolio and operational improvements Source: PPC 341 340 348 348 355 382 487 543 476 711 235 230 217 2016 2017 2018 2019 2020 2021 2022 2023 2024 2025 Q1 2026 Q2 2026 Q3 2026

APPENDIX 16
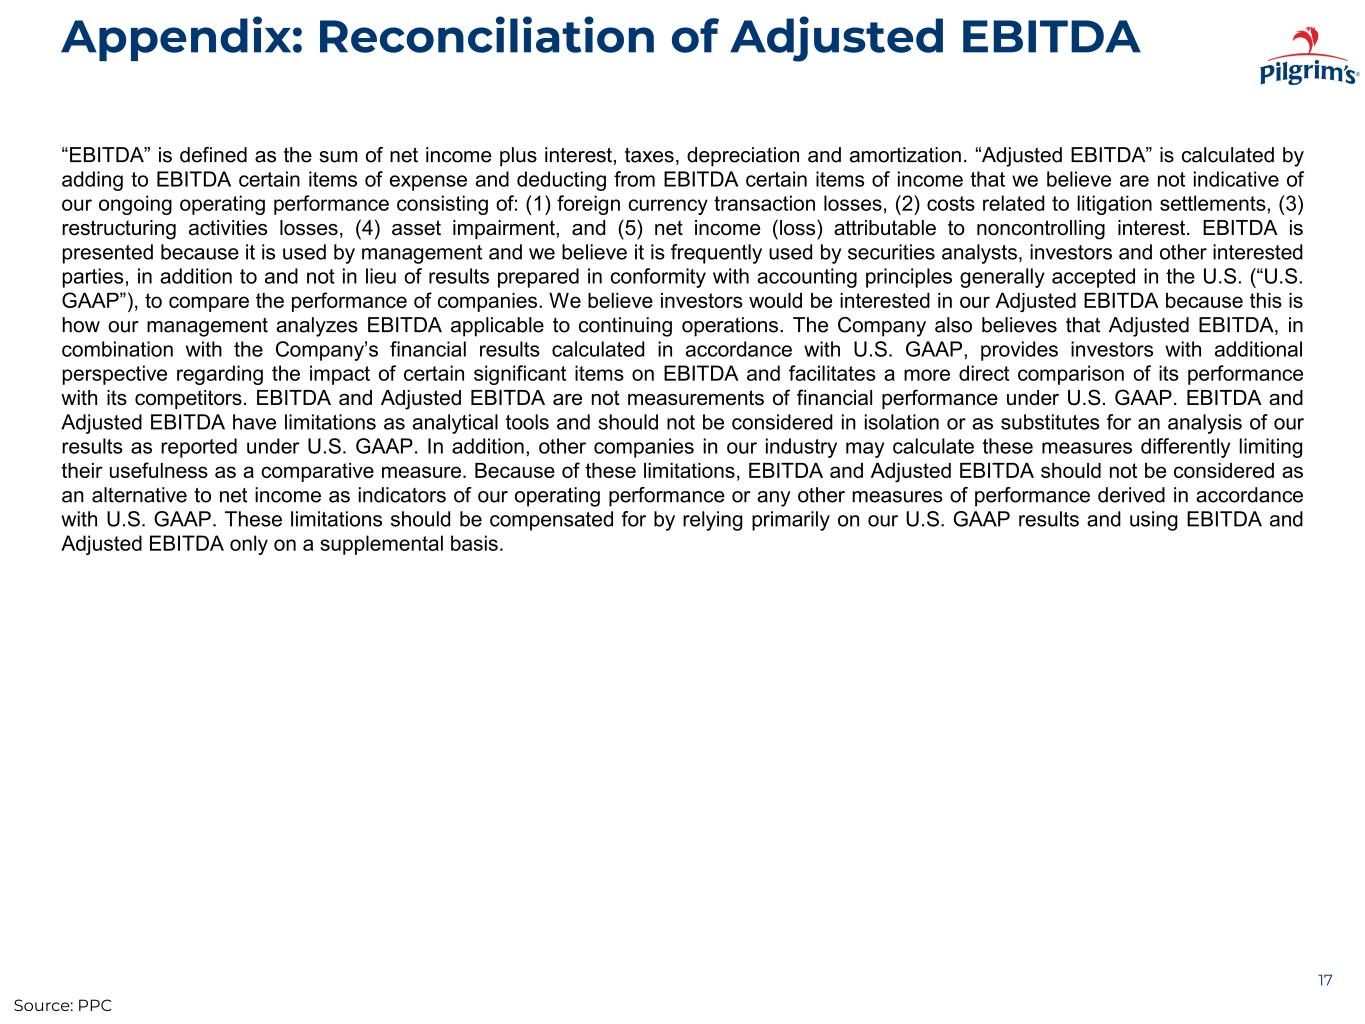
Appendix: Reconciliation of Adjusted EBITDA 17 “EBITDA” is defined as the sum of net income plus interest, taxes, depreciation and amortization. “Adjusted EBITDA” is calculated by adding to EBITDA certain items of expense and deducting from EBITDA certain items of income that we believe are not indicative of our ongoing operating performance consisting of: (1) foreign currency transaction losses, (2) costs related to litigation settlements, (3) restructuring activities losses, (4) asset impairment, and (5) net income (loss) attributable to noncontrolling interest. EBITDA is presented because it is used by management and we believe it is frequently used by securities analysts, investors and other interested parties, in addition to and not in lieu of results prepared in conformity with accounting principles generally accepted in the U.S. (“U.S. GAAP”), to compare the performance of companies. We believe investors would be interested in our Adjusted EBITDA because this is how our management analyzes EBITDA applicable to continuing operations. The Company also believes that Adjusted EBITDA, in combination with the Company’s financial results calculated in accordance with U.S. GAAP, provides investors with additional perspective regarding the impact of certain significant items on EBITDA and facilitates a more direct comparison of its performance with its competitors. EBITDA and Adjusted EBITDA are not measurements of financial performance under U.S. GAAP. EBITDA and Adjusted EBITDA have limitations as analytical tools and should not be considered in isolation or as substitutes for an analysis of our results as reported under U.S. GAAP. In addition, other companies in our industry may calculate these measures differently limiting their usefulness as a comparative measure. Because of these limitations, EBITDA and Adjusted EBITDA should not be considered as an alternative to net income as indicators of our operating performance or any other measures of performance derived in accordance with U.S. GAAP. These limitations should be compensated for by relying primarily on our U.S. GAAP results and using EBITDA and Adjusted EBITDA only on a supplemental basis. Source: PPC
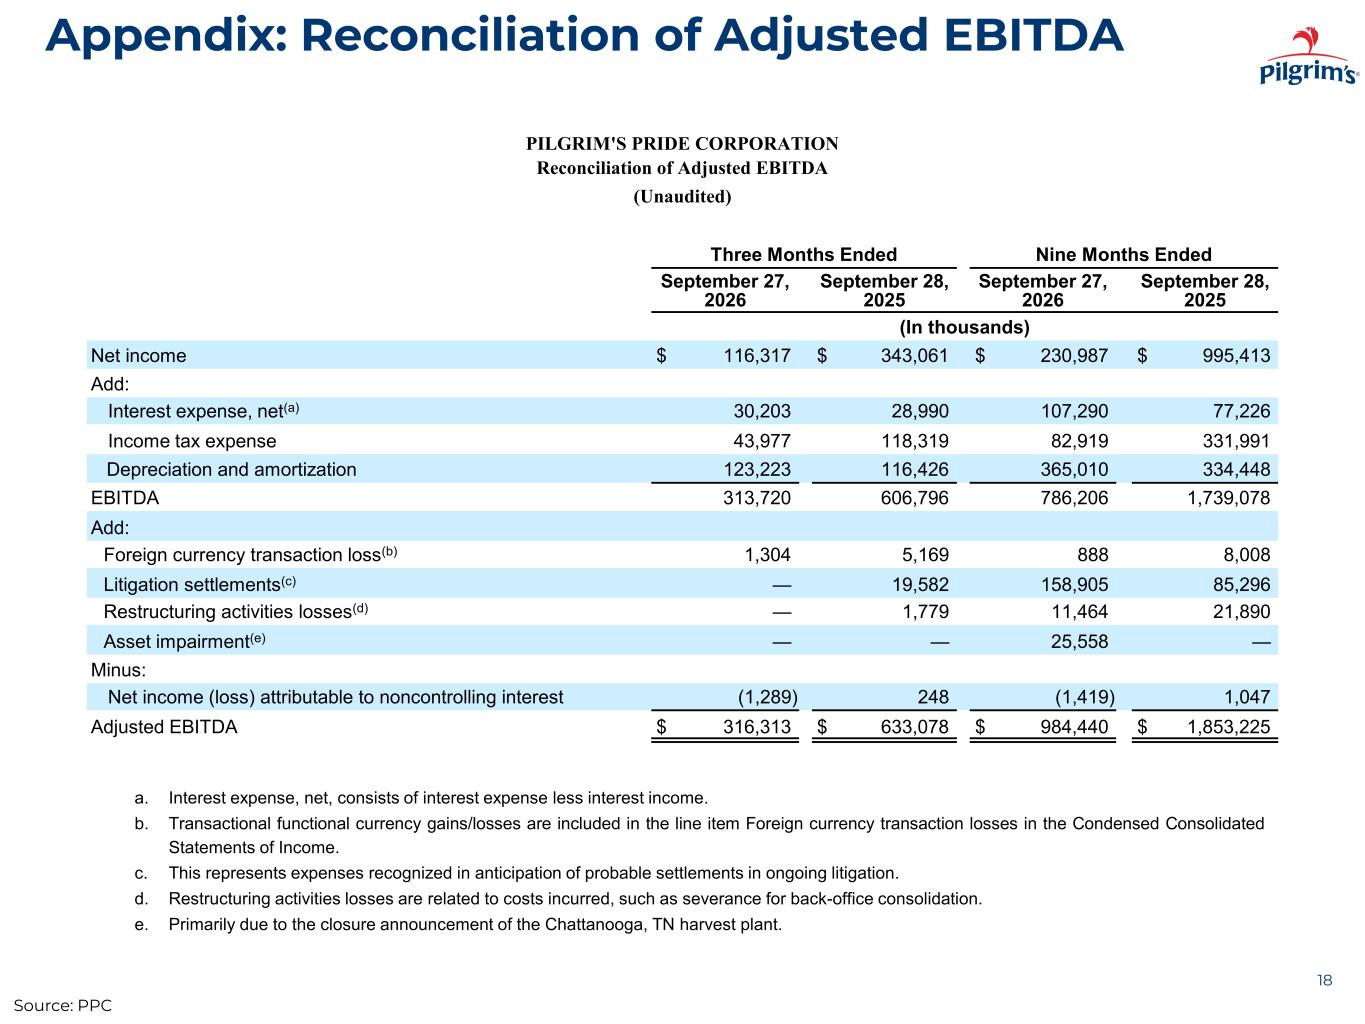
Appendix: Reconciliation of Adjusted EBITDA 18 PILGRIM'S PRIDE CORPORATION Reconciliation of Adjusted EBITDA (Unaudited) Three Months Ended Nine Months Ended September 27, 2026 September 28, 2025 September 27, 2026 September 28, 2025 (In thousands) Net income $ 116,317 $ 343,061 $ 230,987 $ 995,413 Add: Interest expense, net(a) 30,203 28,990 107,290 77,226 Income tax expense 43,977 118,319 82,919 331,991 Depreciation and amortization 123,223 116,426 365,010 334,448 EBITDA 313,720 606,796 786,206 1,739,078 Add: Foreign currency transaction loss(b) 1,304 5,169 888 8,008 Litigation settlements(c) — 19,582 158,905 85,296 Restructuring activities losses(d) — 1,779 11,464 21,890 Asset impairment(e) — — 25,558 — Minus: Net income (loss) attributable to noncontrolling interest (1,289) 248 (1,419) 1,047 Adjusted EBITDA $ 316,313 $ 633,078 $ 984,440 $ 1,853,225 Source: PPC a. Interest expense, net, consists of interest expense less interest income. b. Transactional functional currency gains/losses are included in the line item Foreign currency transaction losses in the Condensed Consolidated Statements of Income. c. This represents expenses recognized in anticipation of probable settlements in ongoing litigation. d. Restructuring activities losses are related to costs incurred, such as severance for back-office consolidation. e. Primarily due to the closure announcement of the Chattanooga, TN harvest plant.
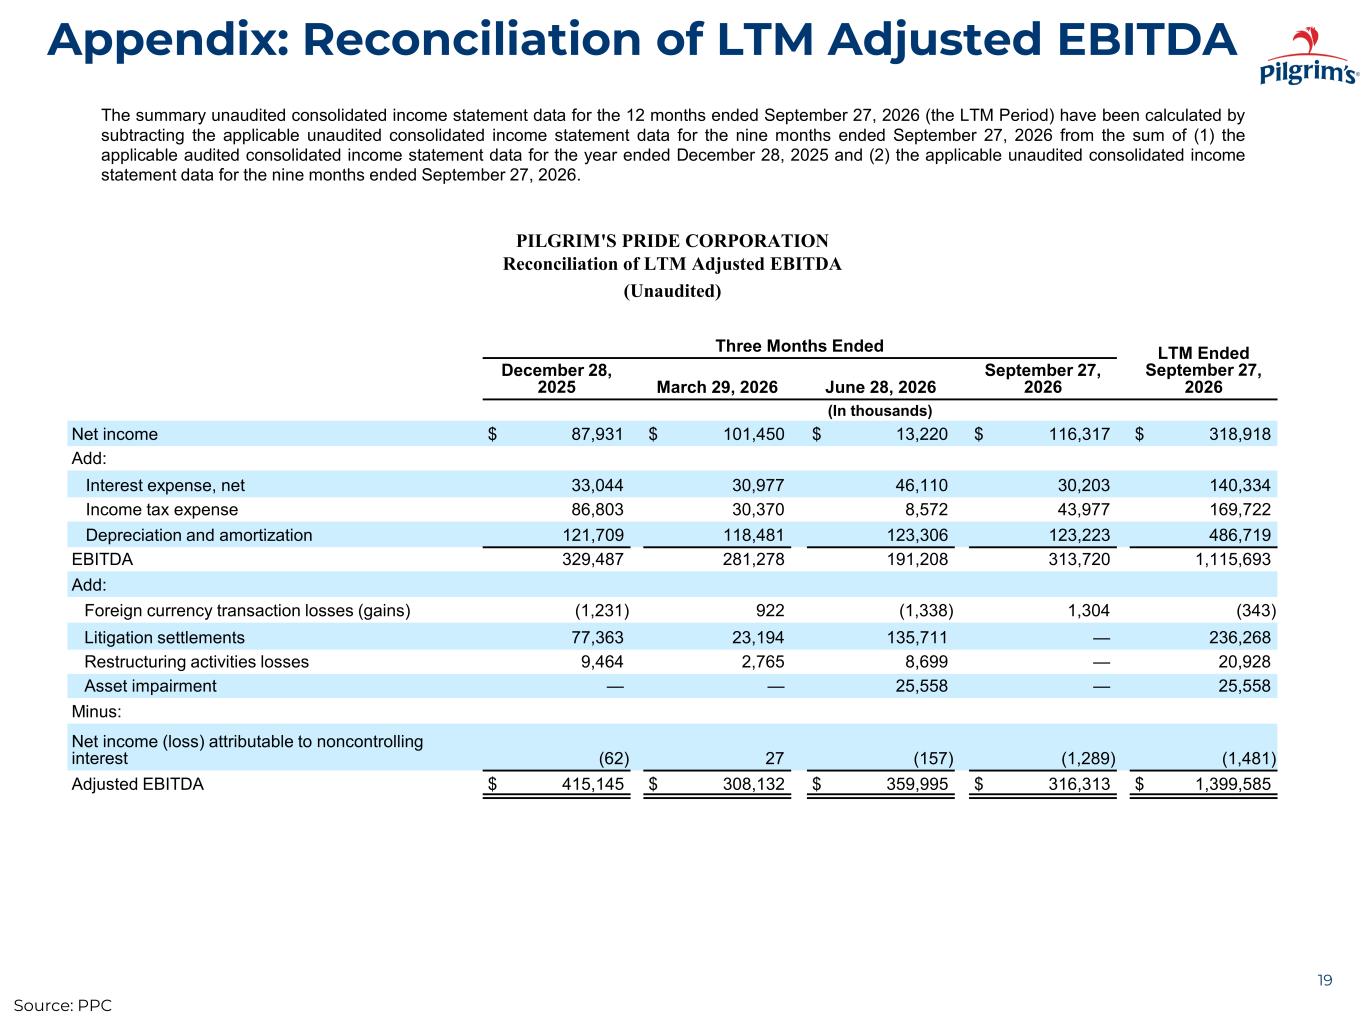
Appendix: Reconciliation of LTM Adjusted EBITDA 19 The summary unaudited consolidated income statement data for the 12 months ended September 27, 2026 (the LTM Period) have been calculated by subtracting the applicable unaudited consolidated income statement data for the nine months ended September 27, 2026 from the sum of (1) the applicable audited consolidated income statement data for the year ended December 28, 2025 and (2) the applicable unaudited consolidated income statement data for the nine months ended September 27, 2026. PILGRIM'S PRIDE CORPORATION Reconciliation of LTM Adjusted EBITDA (Unaudited) Three Months Ended LTM Ended September 27, 2026 December 28, 2025 March 29, 2026 June 28, 2026 September 27, 2026 (In thousands) Net income $ 87,931 $ 101,450 $ 13,220 $ 116,317 $ 318,918 Add: Interest expense, net 33,044 30,977 46,110 30,203 140,334 Income tax expense 86,803 30,370 8,572 43,977 169,722 Depreciation and amortization 121,709 118,481 123,306 123,223 486,719 EBITDA 329,487 281,278 191,208 313,720 1,115,693 Add: Foreign currency transaction losses (gains) (1,231) 922 (1,338) 1,304 (343) Litigation settlements 77,363 23,194 135,711 — 236,268 Restructuring activities losses 9,464 2,765 8,699 — 20,928 Asset impairment — — 25,558 — 25,558 Minus: Net income (loss) attributable to noncontrolling interest (62) 27 (157) (1,289) (1,481) Adjusted EBITDA $ 415,145 $ 308,132 $ 359,995 $ 316,313 $ 1,399,585 Source: PPC
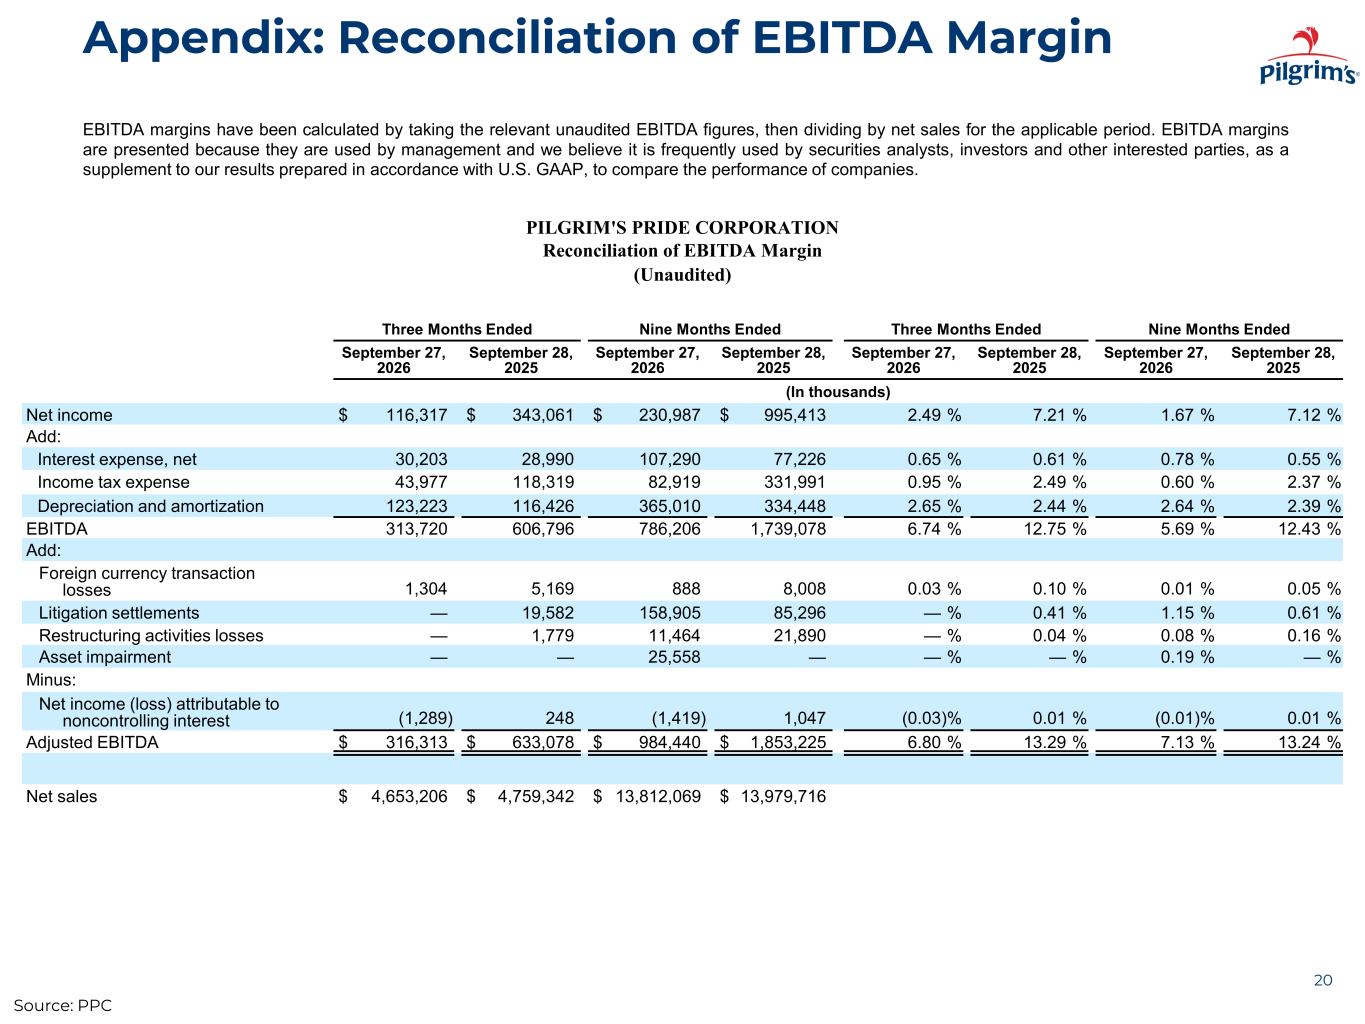
Appendix: Reconciliation of EBITDA Margin 20 EBITDA margins have been calculated by taking the relevant unaudited EBITDA figures, then dividing by net sales for the applicable period. EBITDA margins are presented because they are used by management and we believe it is frequently used by securities analysts, investors and other interested parties, as a supplement to our results prepared in accordance with U.S. GAAP, to compare the performance of companies. PILGRIM'S PRIDE CORPORATION Reconciliation of EBITDA Margin (Unaudited) Three Months Ended Nine Months Ended Three Months Ended Nine Months Ended September 27, 2026 September 28, 2025 September 27, 2026 September 28, 2025 September 27, 2026 September 28, 2025 September 27, 2026 September 28, 2025 (In thousands) Net income $ 116,317 $ 343,061 $ 230,987 $ 995,413 2.49 % 7.21 % 1.67 % 7.12 % Add: Interest expense, net 30,203 28,990 107,290 77,226 0.65 % 0.61 % 0.78 % 0.55 % Income tax expense 43,977 118,319 82,919 331,991 0.95 % 2.49 % 0.60 % 2.37 % Depreciation and amortization 123,223 116,426 365,010 334,448 2.65 % 2.44 % 2.64 % 2.39 % EBITDA 313,720 606,796 786,206 1,739,078 6.74 % 12.75 % 5.69 % 12.43 % Add: Foreign currency transaction losses 1,304 5,169 888 8,008 0.03 % 0.10 % 0.01 % 0.05 % Litigation settlements — 19,582 158,905 85,296 — % 0.41 % 1.15 % 0.61 % Restructuring activities losses — 1,779 11,464 21,890 — % 0.04 % 0.08 % 0.16 % Asset impairment — — 25,558 — — % — % 0.19 % — % Minus: Net income (loss) attributable to noncontrolling interest (1,289) 248 (1,419) 1,047 (0.03)% 0.01 % (0.01)% 0.01 % Adjusted EBITDA $ 316,313 $ 633,078 $ 984,440 $ 1,853,225 6.80 % 13.29 % 7.13 % 13.24 % Net sales $ 4,653,206 $ 4,759,342 $ 13,812,069 $ 13,979,716 Source: PPC
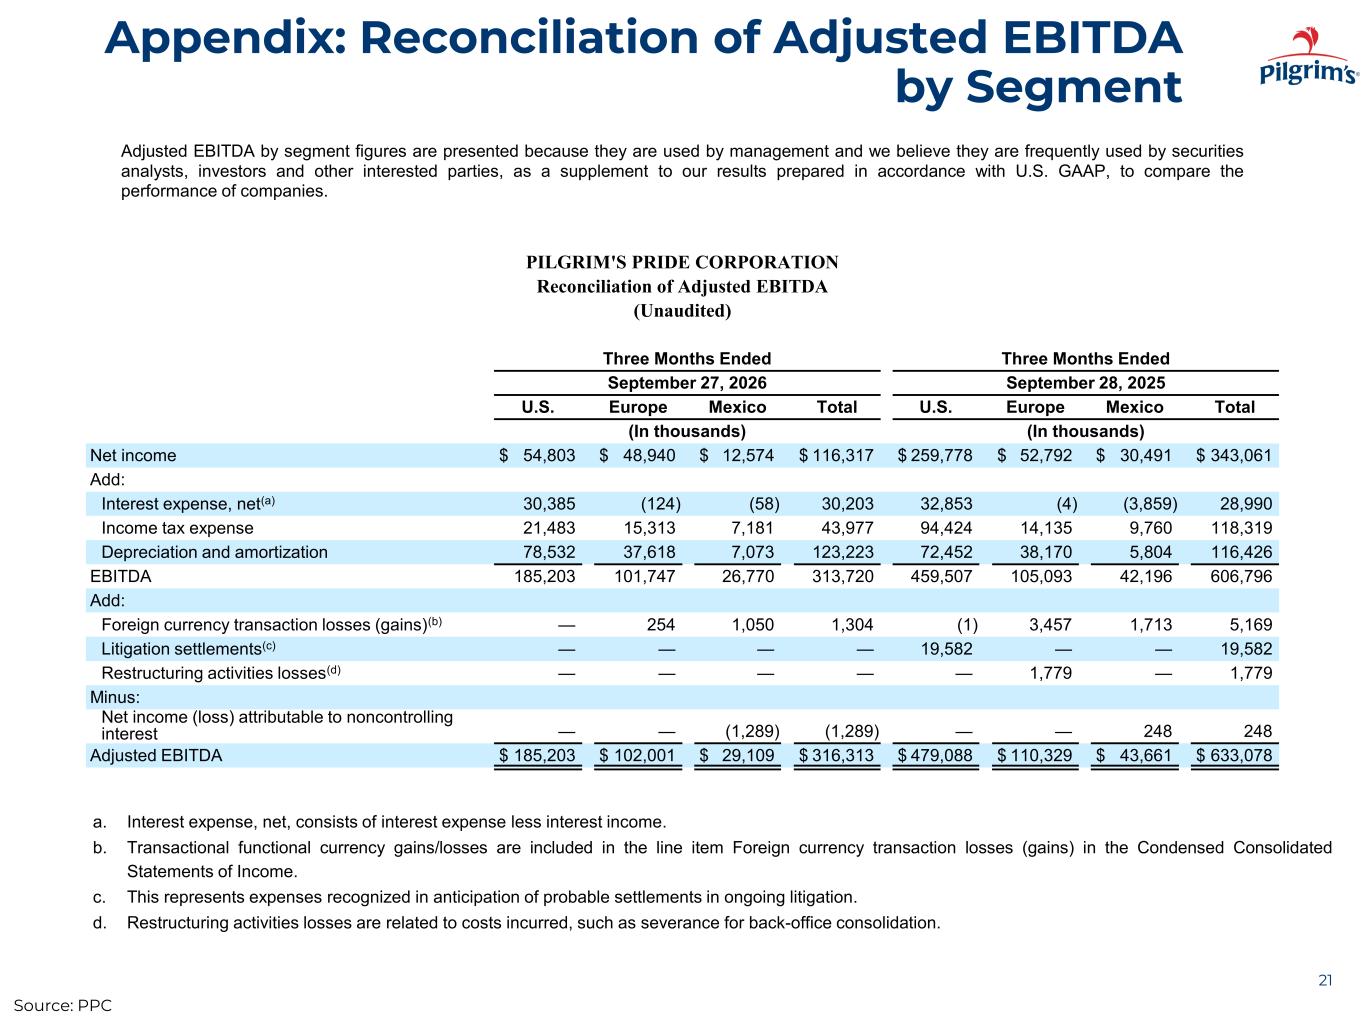
Appendix: Reconciliation of Adjusted EBITDA by Segment 21 PILGRIM'S PRIDE CORPORATION Reconciliation of Adjusted EBITDA (Unaudited) Three Months Ended Three Months Ended September 27, 2026 September 28, 2025 U.S. Europe Mexico Total U.S. Europe Mexico Total (In thousands) (In thousands) Net income $ 54,803 $ 48,940 $ 12,574 $ 116,317 $ 259,778 $ 52,792 $ 30,491 $ 343,061 Add: Interest expense, net(a) 30,385 (124) (58) 30,203 32,853 (4) (3,859) 28,990 Income tax expense 21,483 15,313 7,181 43,977 94,424 14,135 9,760 118,319 Depreciation and amortization 78,532 37,618 7,073 123,223 72,452 38,170 5,804 116,426 EBITDA 185,203 101,747 26,770 313,720 459,507 105,093 42,196 606,796 Add: Foreign currency transaction losses (gains)(b) — 254 1,050 1,304 (1) 3,457 1,713 5,169 Litigation settlements(c) — — — — 19,582 — — 19,582 Restructuring activities losses(d) — — — — — 1,779 — 1,779 Minus: Net income (loss) attributable to noncontrolling interest — — (1,289) (1,289) — — 248 248 Adjusted EBITDA $ 185,203 $ 102,001 $ 29,109 $ 316,313 $ 479,088 $ 110,329 $ 43,661 $ 633,078 Adjusted EBITDA by segment figures are presented because they are used by management and we believe they are frequently used by securities analysts, investors and other interested parties, as a supplement to our results prepared in accordance with U.S. GAAP, to compare the performance of companies. Source: PPC a. Interest expense, net, consists of interest expense less interest income. b. Transactional functional currency gains/losses are included in the line item Foreign currency transaction losses (gains) in the Condensed Consolidated Statements of Income. c. This represents expenses recognized in anticipation of probable settlements in ongoing litigation. d. Restructuring activities losses are related to costs incurred, such as severance for back-office consolidation.
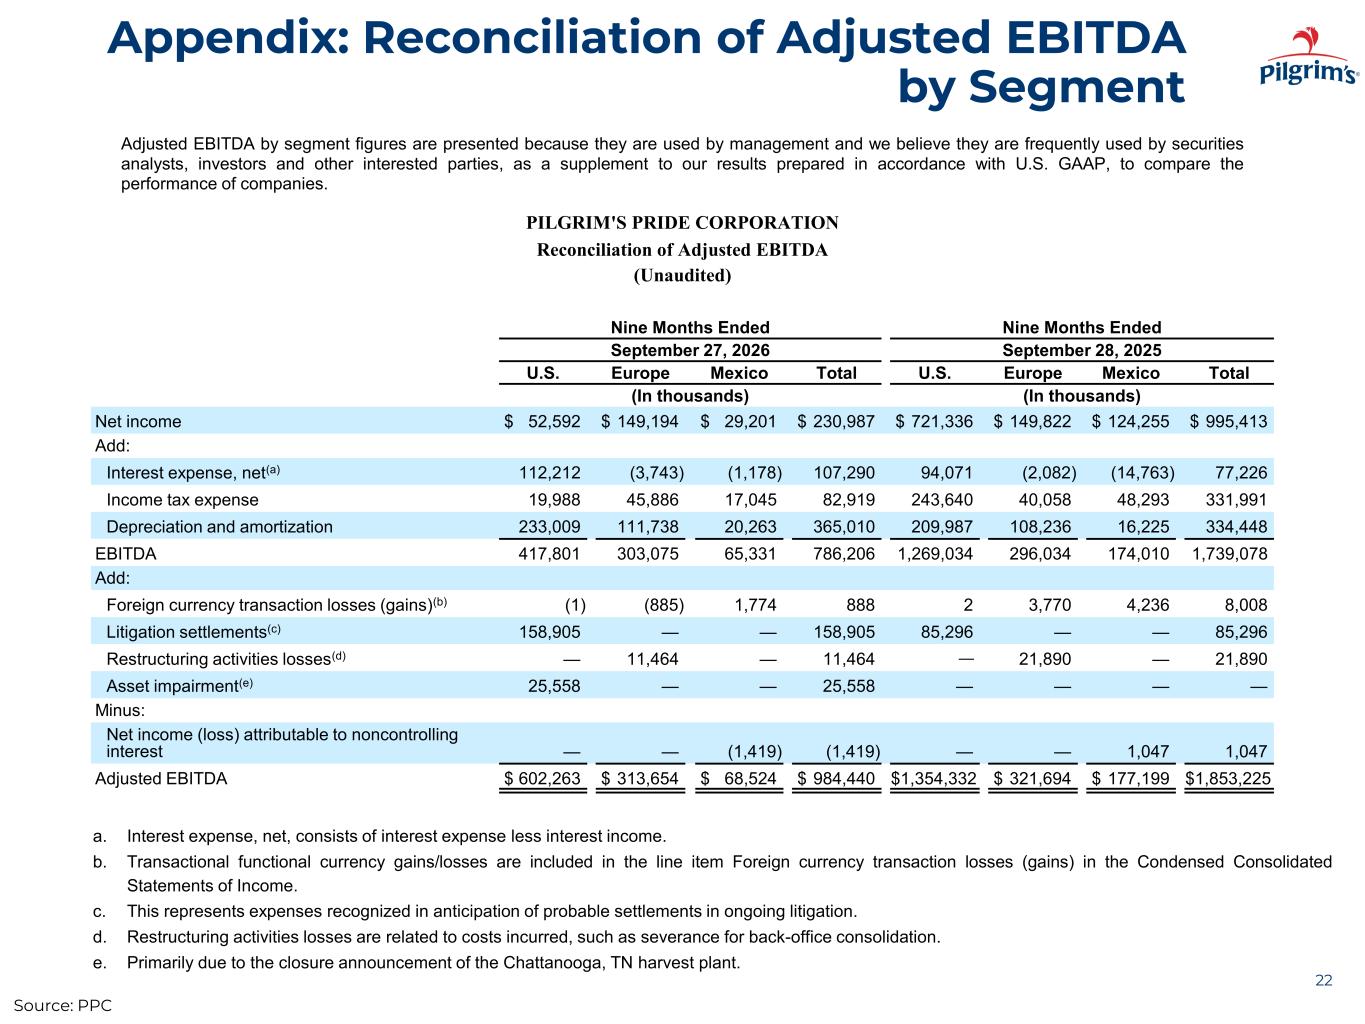
Appendix: Reconciliation of Adjusted EBITDA by Segment 22 PILGRIM'S PRIDE CORPORATION Reconciliation of Adjusted EBITDA (Unaudited) Nine Months Ended Nine Months Ended September 27, 2026 September 28, 2025 U.S. Europe Mexico Total U.S. Europe Mexico Total (In thousands) (In thousands) Net income $ 52,592 $ 149,194 $ 29,201 $ 230,987 $ 721,336 $ 149,822 $ 124,255 $ 995,413 Add: Interest expense, net(a) 112,212 (3,743) (1,178) 107,290 94,071 (2,082) (14,763) 77,226 Income tax expense 19,988 45,886 17,045 82,919 243,640 40,058 48,293 331,991 Depreciation and amortization 233,009 111,738 20,263 365,010 209,987 108,236 16,225 334,448 EBITDA 417,801 303,075 65,331 786,206 1,269,034 296,034 174,010 1,739,078 Add: Foreign currency transaction losses (gains)(b) (1) (885) 1,774 888 2 3,770 4,236 8,008 Litigation settlements(c) 158,905 — — 158,905 85,296 — — 85,296 Restructuring activities losses(d) — 11,464 — 11,464 — 21,890 — 21,890 Asset impairment(e) 25,558 — — 25,558 — — — — Minus: Net income (loss) attributable to noncontrolling interest — — (1,419) (1,419) — — 1,047 1,047 Adjusted EBITDA $ 602,263 $ 313,654 $ 68,524 $ 984,440 $1,354,332 $ 321,694 $ 177,199 $1,853,225 Adjusted EBITDA by segment figures are presented because they are used by management and we believe they are frequently used by securities analysts, investors and other interested parties, as a supplement to our results prepared in accordance with U.S. GAAP, to compare the performance of companies. Source: PPC a. Interest expense, net, consists of interest expense less interest income. b. Transactional functional currency gains/losses are included in the line item Foreign currency transaction losses (gains) in the Condensed Consolidated Statements of Income. c. This represents expenses recognized in anticipation of probable settlements in ongoing litigation. d. Restructuring activities losses are related to costs incurred, such as severance for back-office consolidation. e. Primarily due to the closure announcement of the Chattanooga, TN harvest plant.
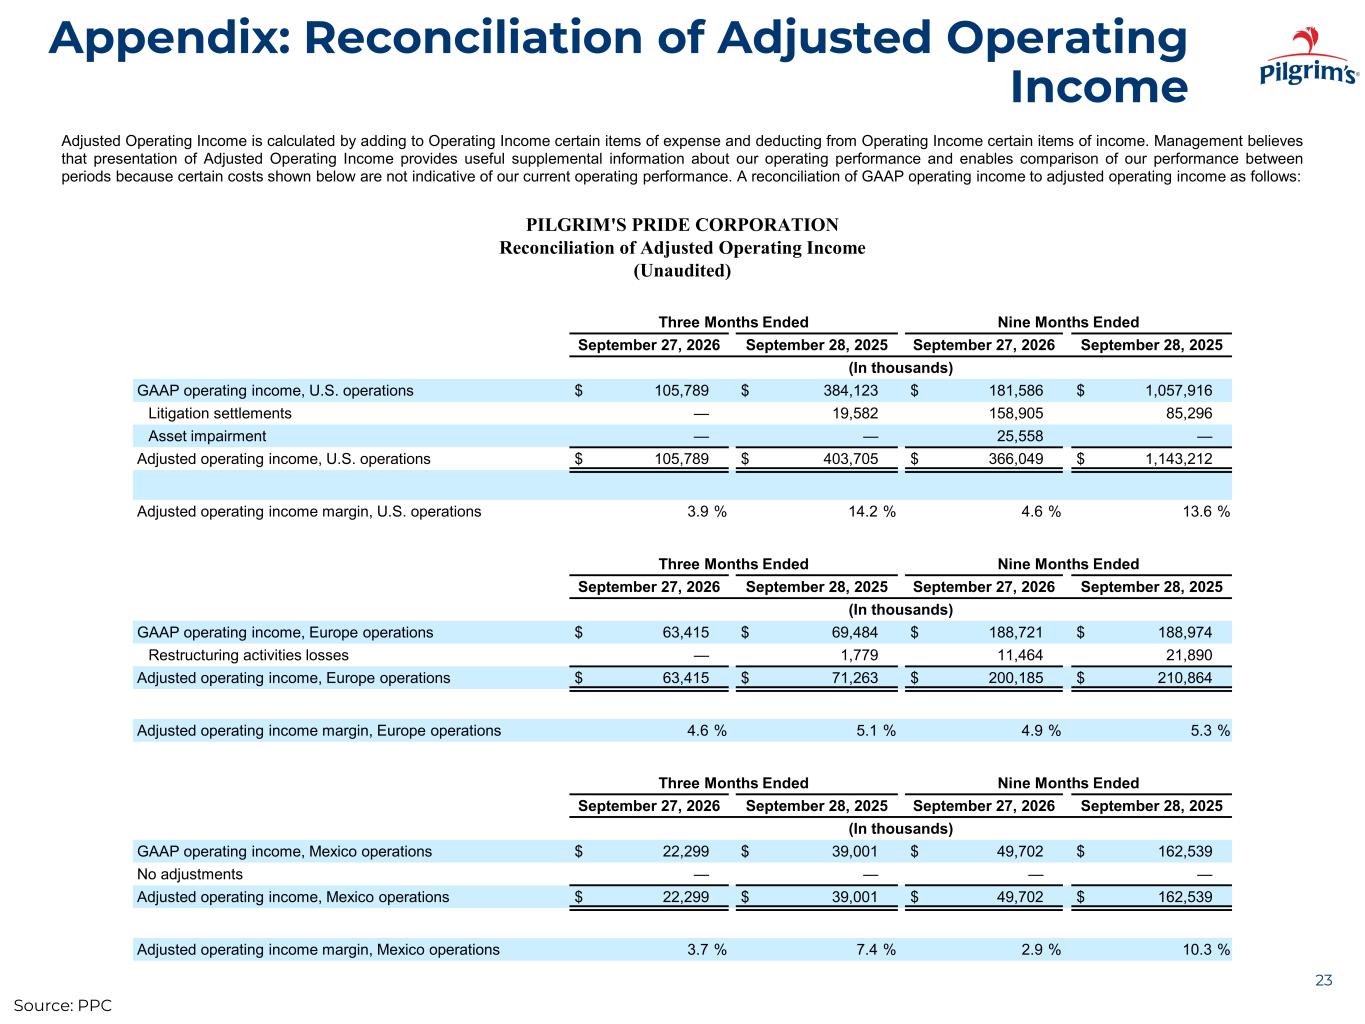
Appendix: Reconciliation of Adjusted Operating Income 23 Adjusted Operating Income is calculated by adding to Operating Income certain items of expense and deducting from Operating Income certain items of income. Management believes that presentation of Adjusted Operating Income provides useful supplemental information about our operating performance and enables comparison of our performance between periods because certain costs shown below are not indicative of our current operating performance. A reconciliation of GAAP operating income to adjusted operating income as follows: PILGRIM'S PRIDE CORPORATION Reconciliation of Adjusted Operating Income (Unaudited) Three Months Ended Nine Months Ended September 27, 2026 September 28, 2025 September 27, 2026 September 28, 2025 (In thousands) GAAP operating income, U.S. operations $ 105,789 $ 384,123 $ 181,586 $ 1,057,916 Litigation settlements — 19,582 158,905 85,296 Asset impairment — — 25,558 — Adjusted operating income, U.S. operations $ 105,789 $ 403,705 $ 366,049 $ 1,143,212 Adjusted operating income margin, U.S. operations 3.9 % 14.2 % 4.6 % 13.6 % Three Months Ended Nine Months Ended September 27, 2026 September 28, 2025 September 27, 2026 September 28, 2025 (In thousands) GAAP operating income, Europe operations $ 63,415 $ 69,484 $ 188,721 $ 188,974 Restructuring activities losses — 1,779 11,464 21,890 Adjusted operating income, Europe operations $ 63,415 $ 71,263 $ 200,185 $ 210,864 Adjusted operating income margin, Europe operations 4.6 % 5.1 % 4.9 % 5.3 % Three Months Ended Nine Months Ended September 27, 2026 September 28, 2025 September 27, 2026 September 28, 2025 (In thousands) GAAP operating income, Mexico operations $ 22,299 $ 39,001 $ 49,702 $ 162,539 No adjustments — — — — Adjusted operating income, Mexico operations $ 22,299 $ 39,001 $ 49,702 $ 162,539 Adjusted operating income margin, Mexico operations 3.7 % 7.4 % 2.9 % 10.3 % Source: PPC
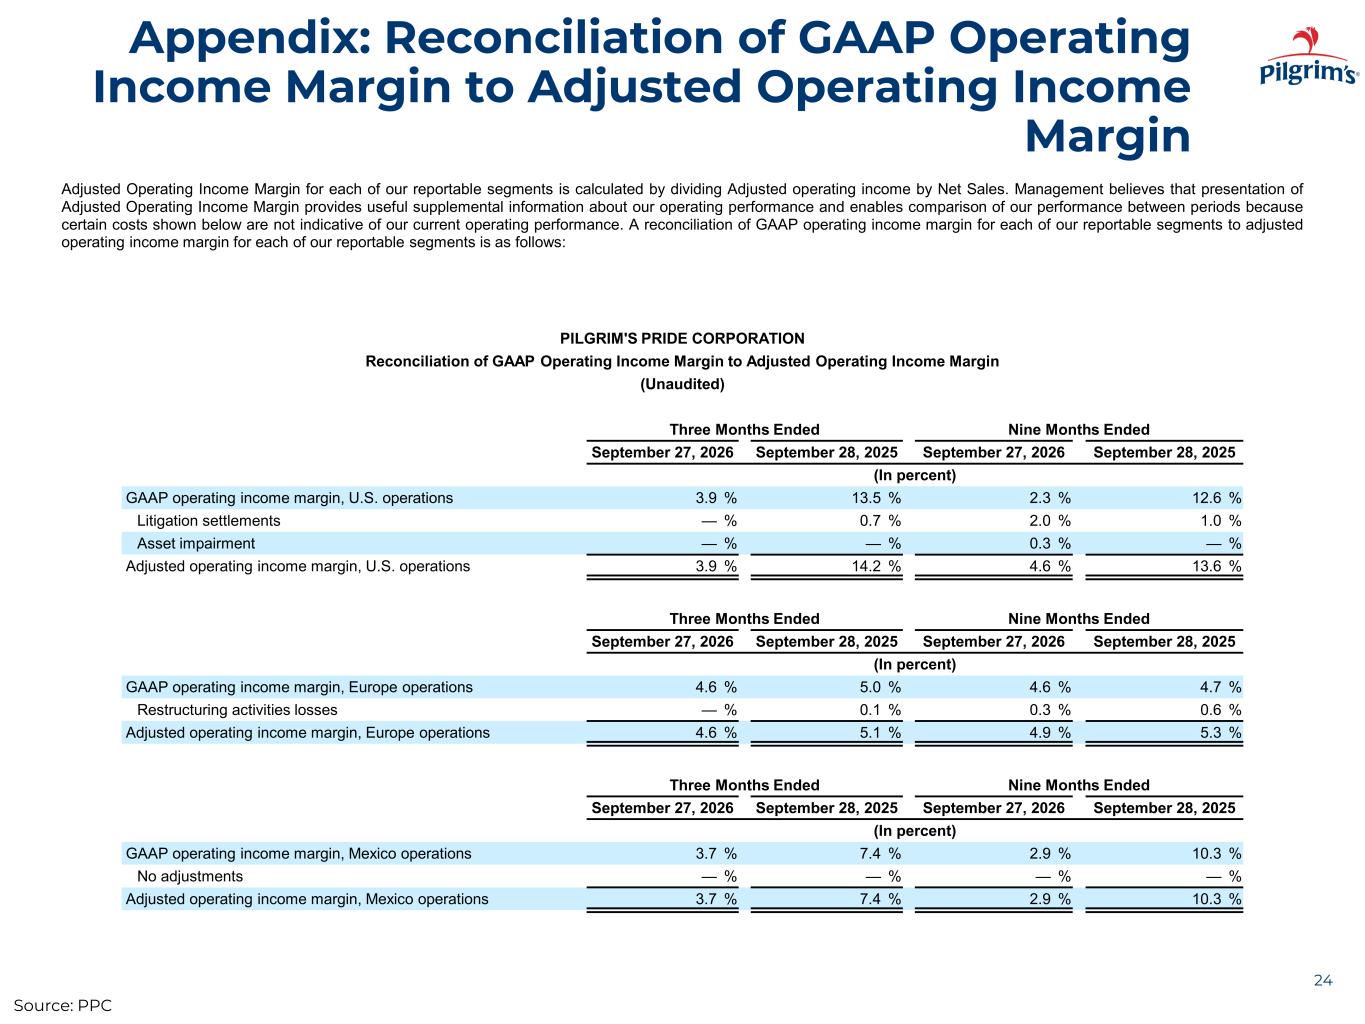
Appendix: Reconciliation of GAAP Operating Income Margin to Adjusted Operating Income Margin 24 Adjusted Operating Income Margin for each of our reportable segments is calculated by dividing Adjusted operating income by Net Sales. Management believes that presentation of Adjusted Operating Income Margin provides useful supplemental information about our operating performance and enables comparison of our performance between periods because certain costs shown below are not indicative of our current operating performance. A reconciliation of GAAP operating income margin for each of our reportable segments to adjusted operating income margin for each of our reportable segments is as follows: PILGRIM'S PRIDE CORPORATION Reconciliation of GAAP Operating Income Margin to Adjusted Operating Income Margin (Unaudited) Three Months Ended Nine Months Ended September 27, 2026 September 28, 2025 September 27, 2026 September 28, 2025 (In percent) GAAP operating income margin, U.S. operations 3.9 % 13.5 % 2.3 % 12.6 % Litigation settlements — % 0.7 % 2.0 % 1.0 % Asset impairment — % — % 0.3 % — % Adjusted operating income margin, U.S. operations 3.9 % 14.2 % 4.6 % 13.6 % Three Months Ended Nine Months Ended September 27, 2026 September 28, 2025 September 27, 2026 September 28, 2025 (In percent) GAAP operating income margin, Europe operations 4.6 % 5.0 % 4.6 % 4.7 % Restructuring activities losses — % 0.1 % 0.3 % 0.6 % Adjusted operating income margin, Europe operations 4.6 % 5.1 % 4.9 % 5.3 % Three Months Ended Nine Months Ended September 27, 2026 September 28, 2025 September 27, 2026 September 28, 2025 (In percent) GAAP operating income margin, Mexico operations 3.7 % 7.4 % 2.9 % 10.3 % No adjustments — % — % — % — % Adjusted operating income margin, Mexico operations 3.7 % 7.4 % 2.9 % 10.3 % Source: PPC
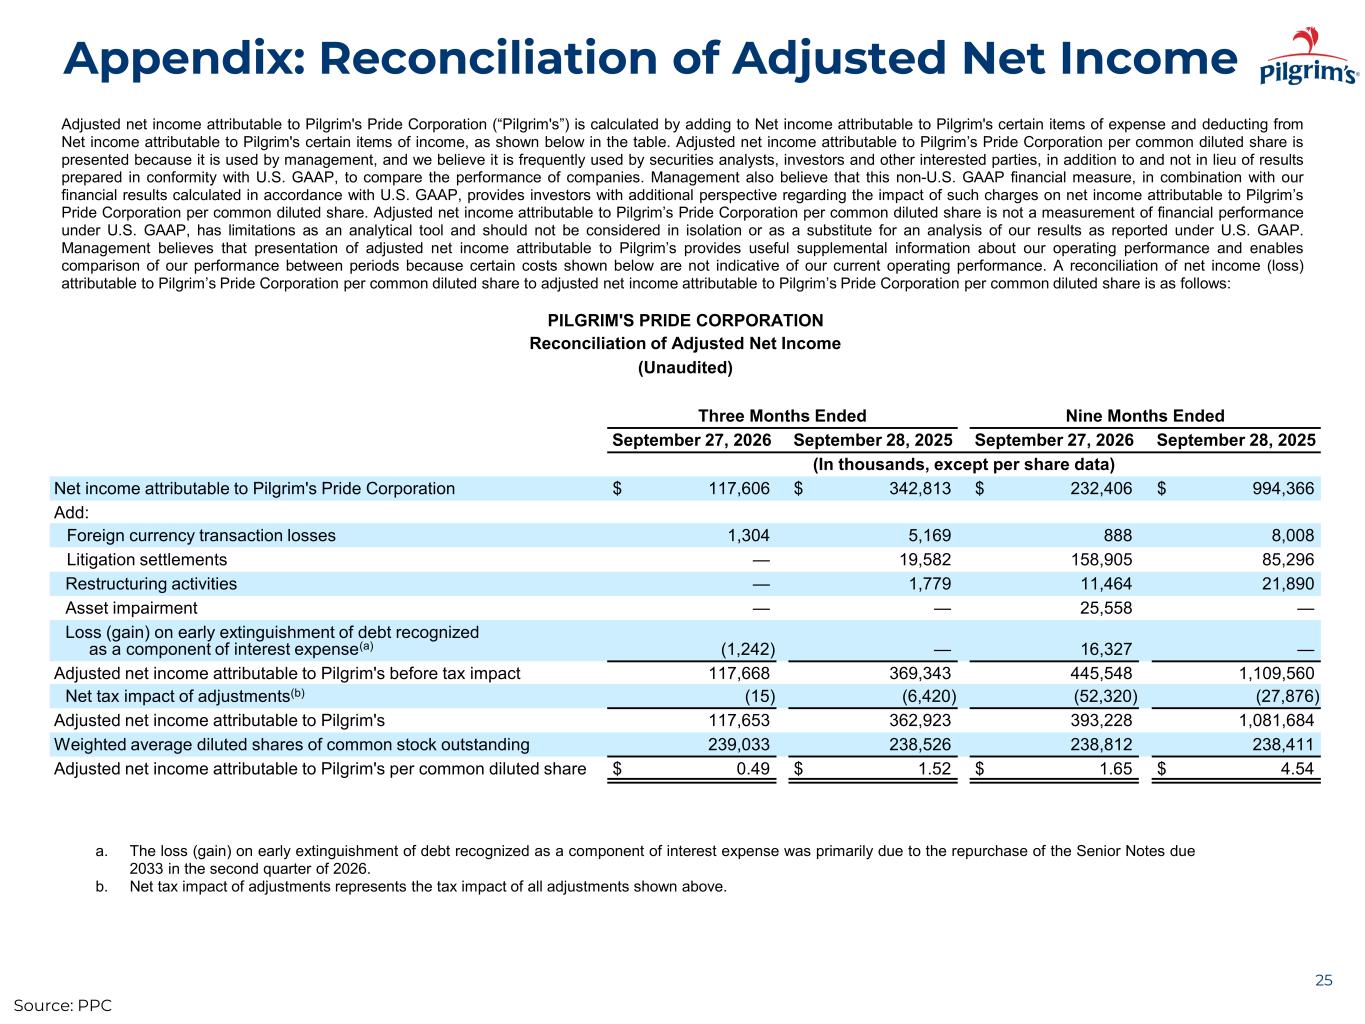
Appendix: Reconciliation of Adjusted Net Income 25 Adjusted net income attributable to Pilgrim's Pride Corporation (“Pilgrim's”) is calculated by adding to Net income attributable to Pilgrim's certain items of expense and deducting from Net income attributable to Pilgrim's certain items of income, as shown below in the table. Adjusted net income attributable to Pilgrim’s Pride Corporation per common diluted share is presented because it is used by management, and we believe it is frequently used by securities analysts, investors and other interested parties, in addition to and not in lieu of results prepared in conformity with U.S. GAAP, to compare the performance of companies. Management also believe that this non-U.S. GAAP financial measure, in combination with our financial results calculated in accordance with U.S. GAAP, provides investors with additional perspective regarding the impact of such charges on net income attributable to Pilgrim’s Pride Corporation per common diluted share. Adjusted net income attributable to Pilgrim’s Pride Corporation per common diluted share is not a measurement of financial performance under U.S. GAAP, has limitations as an analytical tool and should not be considered in isolation or as a substitute for an analysis of our results as reported under U.S. GAAP. Management believes that presentation of adjusted net income attributable to Pilgrim’s provides useful supplemental information about our operating performance and enables comparison of our performance between periods because certain costs shown below are not indicative of our current operating performance. A reconciliation of net income (loss) attributable to Pilgrim’s Pride Corporation per common diluted share to adjusted net income attributable to Pilgrim’s Pride Corporation per common diluted share is as follows: PILGRIM'S PRIDE CORPORATION Reconciliation of Adjusted Net Income (Unaudited) Three Months Ended Nine Months Ended September 27, 2026 September 28, 2025 September 27, 2026 September 28, 2025 (In thousands, except per share data) Net income attributable to Pilgrim's Pride Corporation $ 117,606 $ 342,813 $ 232,406 $ 994,366 Add: Foreign currency transaction losses 1,304 5,169 888 8,008 Litigation settlements — 19,582 158,905 85,296 Restructuring activities — 1,779 11,464 21,890 Asset impairment — — 25,558 — Loss (gain) on early extinguishment of debt recognized as a component of interest expense(a) (1,242) — 16,327 — Adjusted net income attributable to Pilgrim's before tax impact 117,668 369,343 445,548 1,109,560 Net tax impact of adjustments(b) (15) (6,420) (52,320) (27,876) Adjusted net income attributable to Pilgrim's 117,653 362,923 393,228 1,081,684 Weighted average diluted shares of common stock outstanding 239,033 238,526 238,812 238,411 Adjusted net income attributable to Pilgrim's per common diluted share $ 0.49 $ 1.52 $ 1.65 $ 4.54 Source: PPC a. The loss (gain) on early extinguishment of debt recognized as a component of interest expense was primarily due to the repurchase of the Senior Notes due 2033 in the second quarter of 2026. b. Net tax impact of adjustments represents the tax impact of all adjustments shown above.
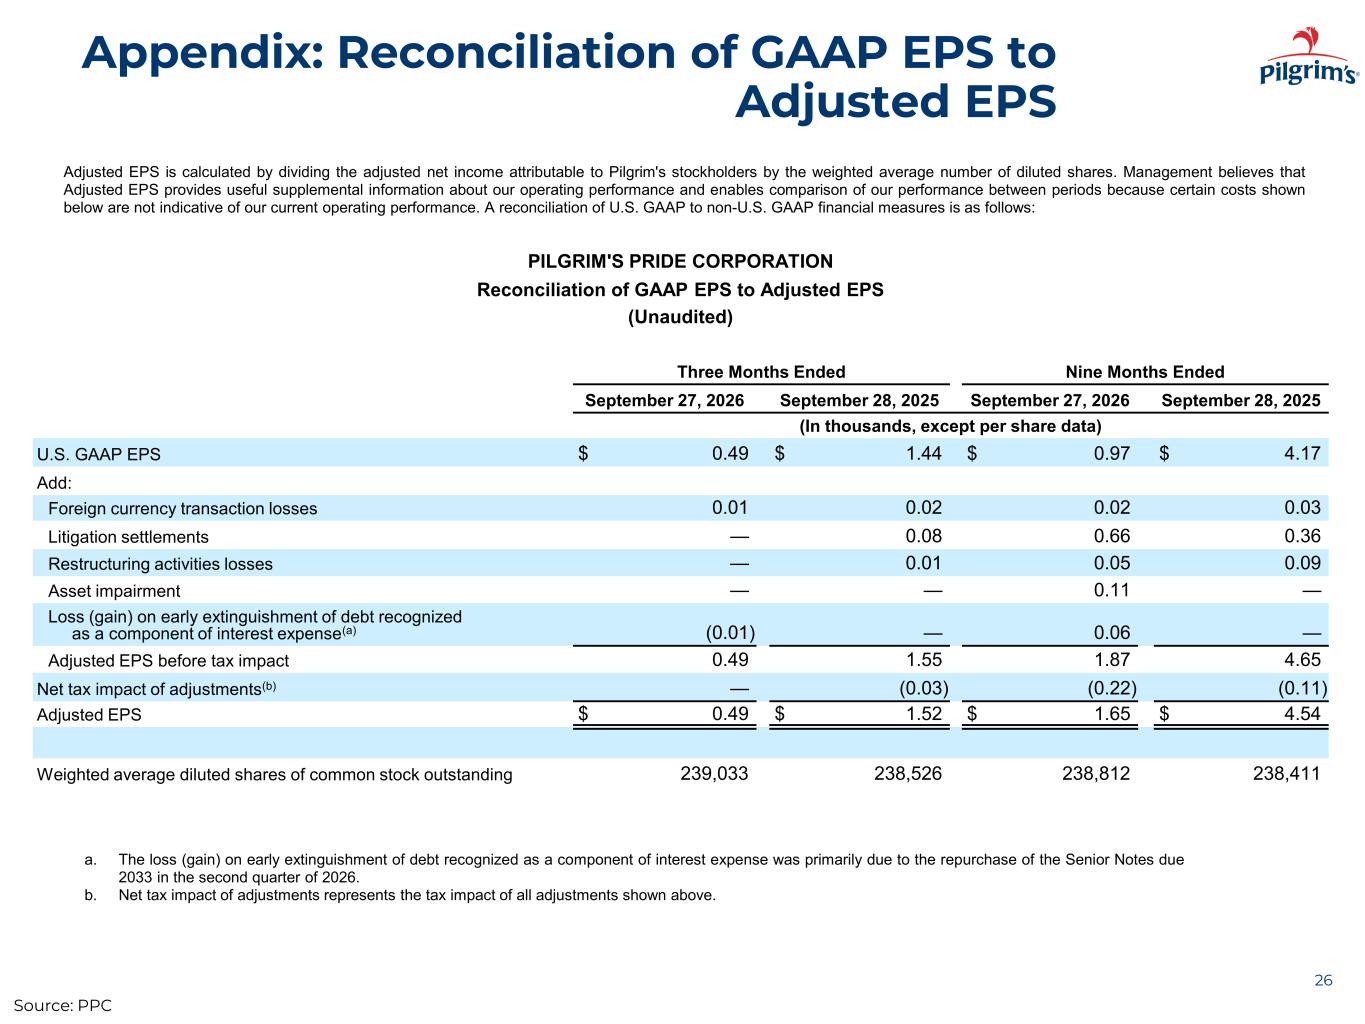
Appendix: Reconciliation of GAAP EPS to Adjusted EPS 26 Adjusted EPS is calculated by dividing the adjusted net income attributable to Pilgrim's stockholders by the weighted average number of diluted shares. Management believes that Adjusted EPS provides useful supplemental information about our operating performance and enables comparison of our performance between periods because certain costs shown below are not indicative of our current operating performance. A reconciliation of U.S. GAAP to non-U.S. GAAP financial measures is as follows: PILGRIM'S PRIDE CORPORATION Reconciliation of GAAP EPS to Adjusted EPS (Unaudited) Three Months Ended Nine Months Ended September 27, 2026 September 28, 2025 September 27, 2026 September 28, 2025 (In thousands, except per share data) U.S. GAAP EPS $ 0.49 $ 1.44 $ 0.97 $ 4.17 Add: Foreign currency transaction losses 0.01 0.02 0.02 0.03 Litigation settlements — 0.08 0.66 0.36 Restructuring activities losses — 0.01 0.05 0.09 Asset impairment — — 0.11 — Loss (gain) on early extinguishment of debt recognized as a component of interest expense(a) (0.01) — 0.06 — Adjusted EPS before tax impact 0.49 1.55 1.87 4.65 Net tax impact of adjustments(b) — (0.03) (0.22) (0.11) Adjusted EPS $ 0.49 $ 1.52 $ 1.65 $ 4.54 Weighted average diluted shares of common stock outstanding 239,033 238,526 238,812 238,411 Source: PPC a. The loss (gain) on early extinguishment of debt recognized as a component of interest expense was primarily due to the repurchase of the Senior Notes due 2033 in the second quarter of 2026. b. Net tax impact of adjustments represents the tax impact of all adjustments shown above.
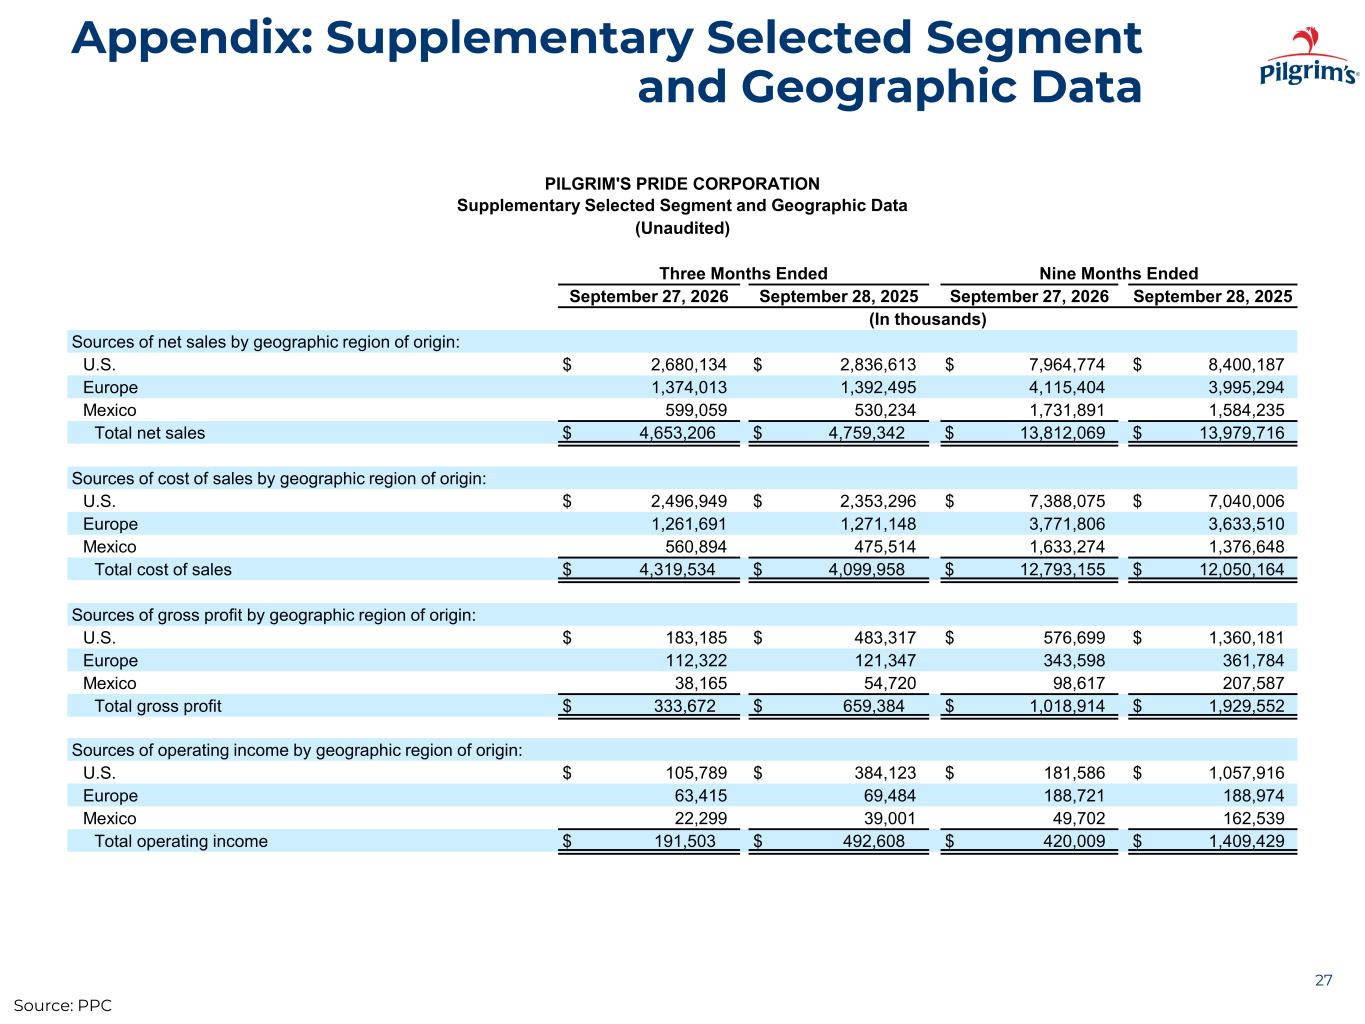
Appendix: Supplementary Selected Segment and Geographic Data 27 PILGRIM'S PRIDE CORPORATION Supplementary Selected Segment and Geographic Data (Unaudited) Three Months Ended Nine Months Ended September 27, 2026 September 28, 2025 September 27, 2026 September 28, 2025 (In thousands) Sources of net sales by geographic region of origin: U.S. $ 2,680,134 $ 2,836,613 $ 7,964,774 $ 8,400,187 Europe 1,374,013 1,392,495 4,115,404 3,995,294 Mexico 599,059 530,234 1,731,891 1,584,235 Total net sales $ 4,653,206 $ 4,759,342 $ 13,812,069 $ 13,979,716 Sources of cost of sales by geographic region of origin: U.S. $ 2,496,949 $ 2,353,296 $ 7,388,075 $ 7,040,006 Europe 1,261,691 1,271,148 3,771,806 3,633,510 Mexico 560,894 475,514 1,633,274 1,376,648 Total cost of sales $ 4,319,534 $ 4,099,958 $ 12,793,155 $ 12,050,164 Sources of gross profit by geographic region of origin: U.S. $ 183,185 $ 483,317 $ 576,699 $ 1,360,181 Europe 112,322 121,347 343,598 361,784 Mexico 38,165 54,720 98,617 207,587 Total gross profit $ 333,672 $ 659,384 $ 1,018,914 $ 1,929,552 Sources of operating income by geographic region of origin: U.S. $ 105,789 $ 384,123 $ 181,586 $ 1,057,916 Europe 63,415 69,484 188,721 188,974 Mexico 22,299 39,001 49,702 162,539 Total operating income $ 191,503 $ 492,608 $ 420,009 $ 1,409,429 Source: PPC