
Q3 2025 Financial Results October 29, 2025 1
Disclaimer 2 Forward-looking Statements This presentation contains “forward-looking” statements as defined in the Private Securities Litigation Reform Act of 1995. These statements are based on management's current expectations or predictions of future conditions, events, or results based on various assumptions and management's estimates of trends and economic factors in the markets in which we are active, as well as our business plans. Words such as “expects,” “anticipates,” “priorities,” “objectives,” “intends,” “plans,” “believes,” “seeks,” “estimates,” “projects,” “forecasts,” “continue,” “may,” “should,” “will,” “goals,” and variations of such words and similar expressions are intended to identify such forward-looking statements. Forward-looking statements include, but are not limited to, statements related to: our expectation for regulatory approvals including approval of the BLA for Avance® by the FDA in December 2025; market development opportunities; and 2025 financial guidance, including revenue growth, cash and gross margins. Actual results or events could differ materially from those described in any forward-looking statements as a result of various factors, including, without limitation, statements related to potential disruptions caused by leadership transitions, global supply chain issues, record inflation, hospital staffing issues, product development, product potential, expected clinical enrollment timing and outcomes, regulatory process and approvals, financial performance, sales growth, surgeon and product adoption, market awareness of our products, data validation, our visibility at and sponsorship of conferences and educational events, global business disruption caused by Russia’s invasion of Ukraine and related sanctions, recent geopolitical conflicts in the Middle East, potential impact of recent government actions and policies, including the One Big Beautiful Bill Act and the October 2025 U.S. government shutdown, on our business, tax position, and regulatory processes, as well as those risk factors described under Part I, Item 1A., “Risk Factors,” of our Annual Report on Form 10-K for the most recently ended fiscal year. Forward-looking statements are not a guarantee of future performance, and actual results may differ materially from those projected. The forward-looking statements are representative only as of the date they are made and, except as required by applicable law, we assume no responsibility to publicly update or revise any forward-looking statements. About Non-GAAP Financial Measures To supplement our condensed consolidated financial statements, we use the non-GAAP financial measures of EBITDA, which measures earnings before interest, income taxes, depreciation and amortization, EBITDA margin, Adjusted EBITDA, which further excludes non-cash stock compensation expense, and Adjusted EBITDA margin. We also use the non-GAAP financial measures of Adjusted Net Income (Loss) and Adjusted Net Income (Loss) Per Common Share -diluted which excludes noncash stock compensation expense from Net Income (Loss) and Net Income (Loss) Per Common Share - diluted, respectively. We also use the Operational Cashflow metric, which corresponds to Net change in cash, cash equivalents, restricted cash, and investments, less cashflow from issuance or repayment of long-term debt. These non-GAAP measures are not based on any comprehensive set of accounting rules or principles and should not be considered a substitute for, or superior to, financial measures calculated in accordance with GAAP and may be different from non-GAAP measures used by other companies. In addition, these non-GAAP measures should be read in conjunction with our financial statements prepared in accordance with GAAP. The reconciliations of the non- GAAP measures to the most directly comparable financial measures calculated and presented in accordance with GAAP should be carefully evaluated. We use these non-GAAP financial measures for financial and operational decision-making and as a means to evaluate period-to-period comparisons. We believe that these non-GAAP financial measures provide meaningful supplemental information regarding our performance and that both management and investors benefit from referring to these non-GAAP financial measures in assessing our performance and when planning, forecasting, and analyzing future periods. We believe these non-GAAP financial measures are useful to investors because (1) they allow for greater transparency with respect to key metrics used by management in its financial and operational decision-making and (2) they are used by our institutional investors and the analyst community to help them analyze the performance of our business, the Company’s cash available for operations, and the Company’s ability to meet future capital expenditure and working capital requirements.
3 Michael Dale President and Chief Executive Officer Q3 2025 Business Highlights
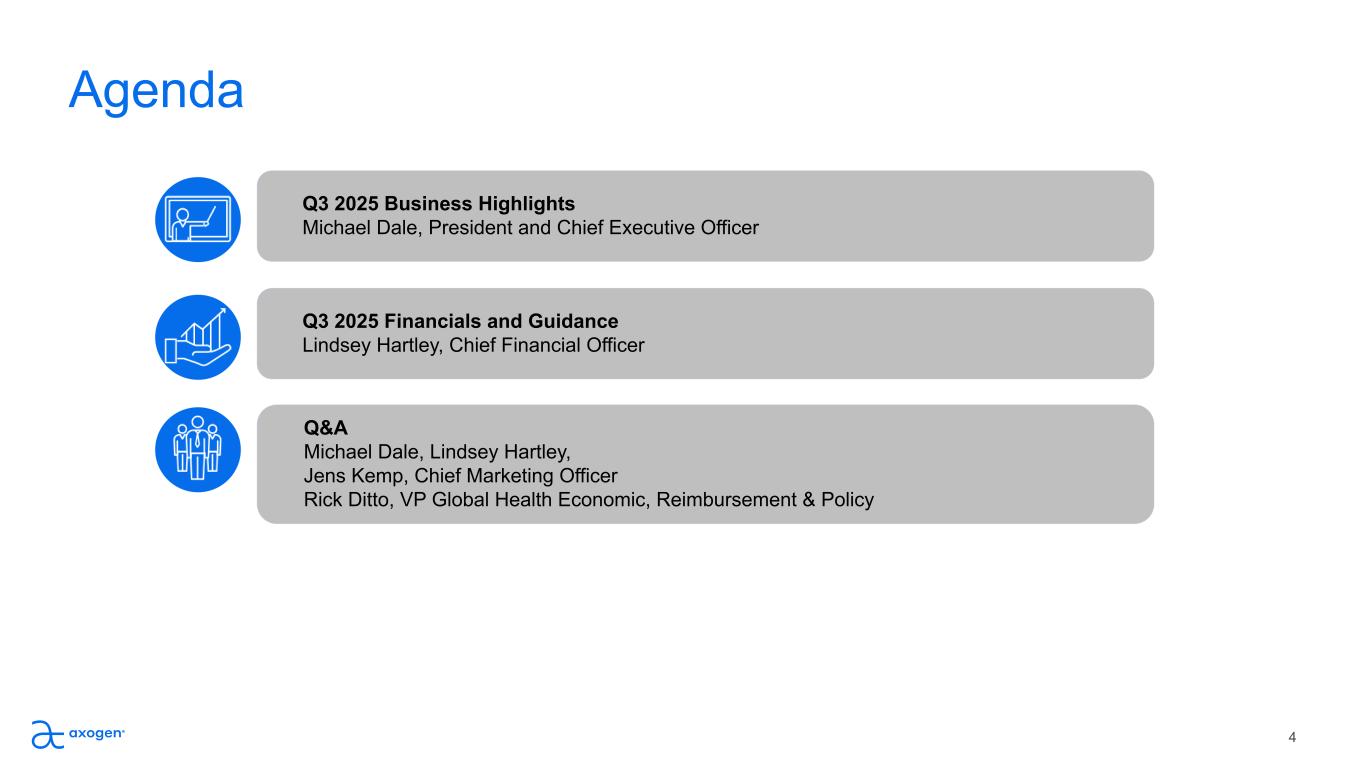
Agenda 4 Q3 2025 Financials and Guidance Lindsey Hartley, Chief Financial Officer Q&A Michael Dale, Lindsey Hartley, Jens Kemp, Chief Marketing Officer Rick Ditto, VP Global Health Economic, Reimbursement & Policy Q3 2025 Business Highlights Michael Dale, President and Chief Executive Officer
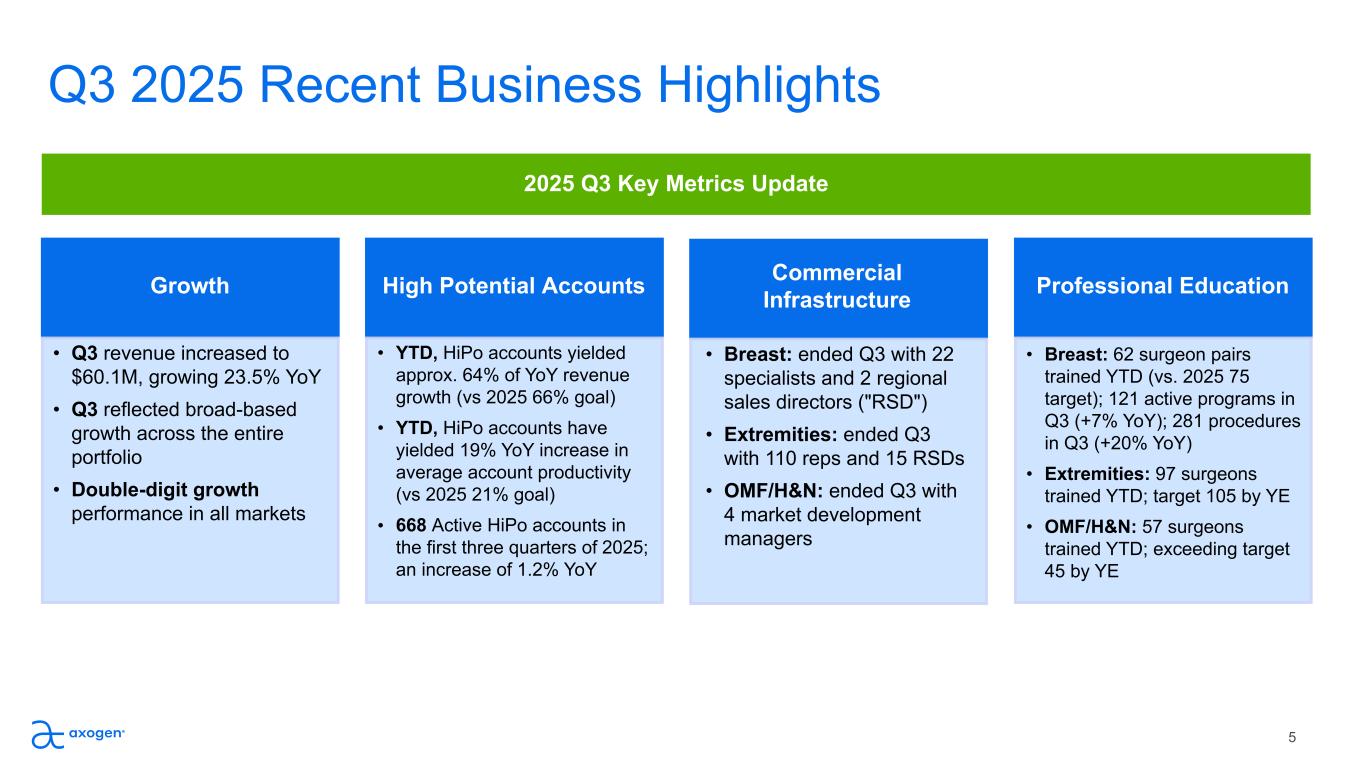
5 Growth • Q3 revenue increased to $60.1M, growing 23.5% YoY • Q3 reflected broad-based growth across the entire portfolio • Double-digit growth performance in all markets High Potential Accounts • YTD, HiPo accounts yielded approx. 64% of YoY revenue growth (vs 2025 66% goal) • YTD, HiPo accounts have yielded 19% YoY increase in average account productivity (vs 2025 21% goal) • 668 Active HiPo accounts in the first three quarters of 2025; an increase of 1.2% YoY Professional Education • Breast: ended Q3 with 22 specialists and 2 regional sales directors ("RSD") • Extremities: ended Q3 with 110 reps and 15 RSDs • OMF/H&N: ended Q3 with 4 market development managers Commercial Infrastructure • Breast: 62 surgeon pairs trained YTD (vs. 2025 75 target); 121 active programs in Q3 (+7% YoY); 281 procedures in Q3 (+20% YoY) • Extremities: 97 surgeons trained YTD; target 105 by YE • OMF/H&N: 57 surgeons trained YTD; exceeding target 45 by YE 2025 Q3 Key Metrics Update Q3 2025 Recent Business Highlights
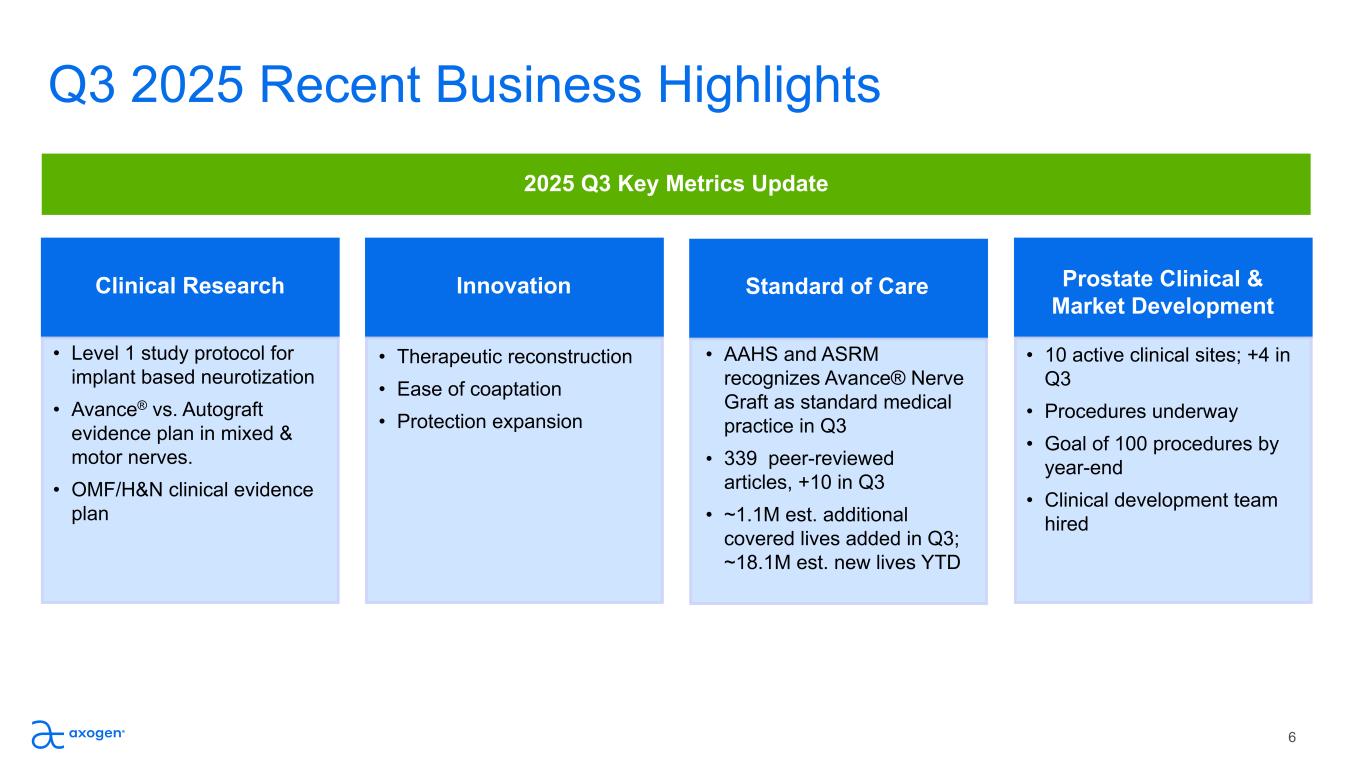
6 Clinical Research • Level 1 study protocol for implant based neurotization • Avance® vs. Autograft evidence plan in mixed & motor nerves. • OMF/H&N clinical evidence plan Innovation • Therapeutic reconstruction • Ease of coaptation • Protection expansion Prostate Clinical & Market Development • AAHS and ASRM recognizes Avance® Nerve Graft as standard medical practice in Q3 • 339 peer-reviewed articles, +10 in Q3 • ~1.1M est. additional covered lives added in Q3; ~18.1M est. new lives YTD Standard of Care • 10 active clinical sites; +4 in Q3 • Procedures underway • Goal of 100 procedures by year-end • Clinical development team hired 2025 Q3 Key Metrics Update Q3 2025 Recent Business Highlights

Biologics License Application For Avance® Nerve Graft Anticipate FDA approval for Avance® Nerve Graft as a Biologic in the US on December 5, 2025. 7 Q3 2025 Update
8 Lindsey Hartley Chief Financial Officer Q3 2025 Financials and Guidance Discussion
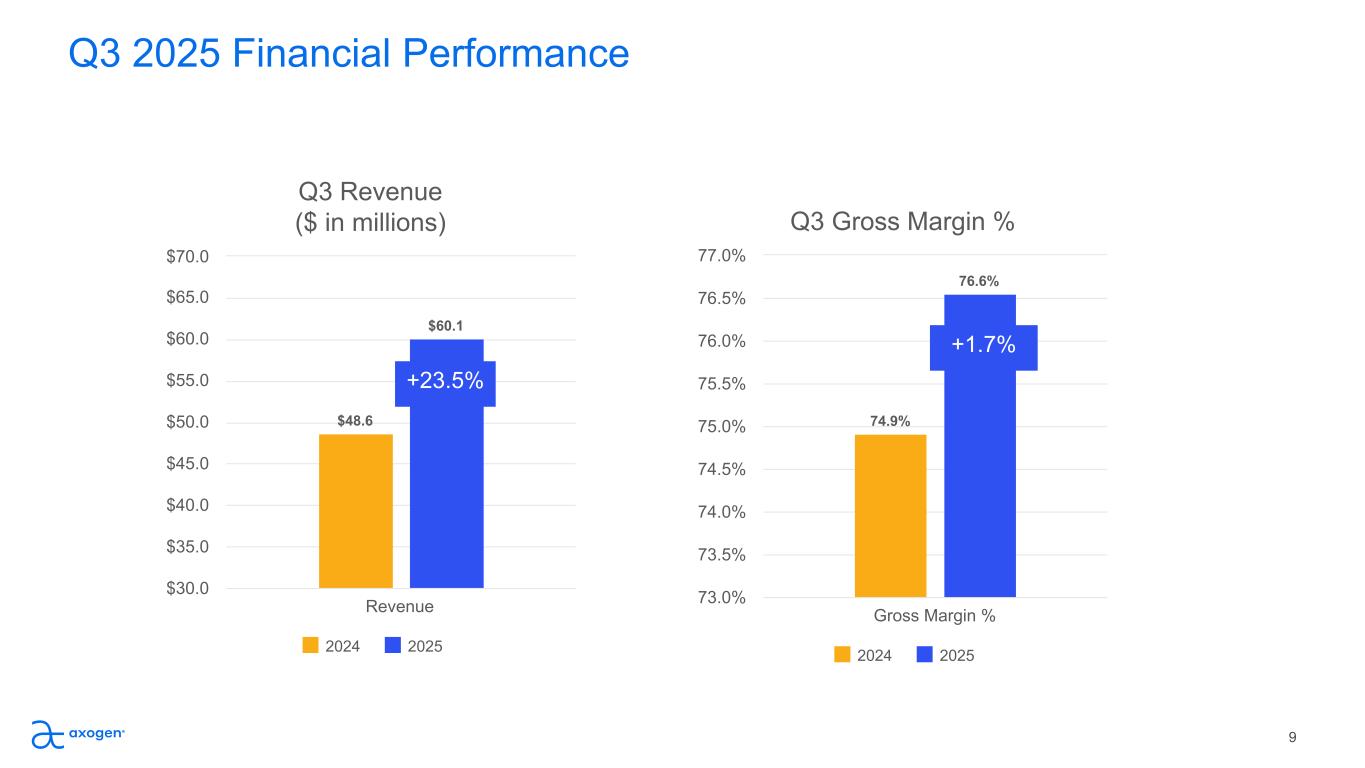
Q3 2025 Financial Performance 9 Q3 Revenue ($ in millions) $48.6 $60.1 2024 2025 Revenue $30.0 $35.0 $40.0 $45.0 $50.0 $55.0 $60.0 $65.0 $70.0 Q3 Gross Margin % 74.9% 76.6% 2024 2025 Gross Margin % 73.0% 73.5% 74.0% 74.5% 75.0% 75.5% 76.0% 76.5% 77.0% +1.7% +23.5%
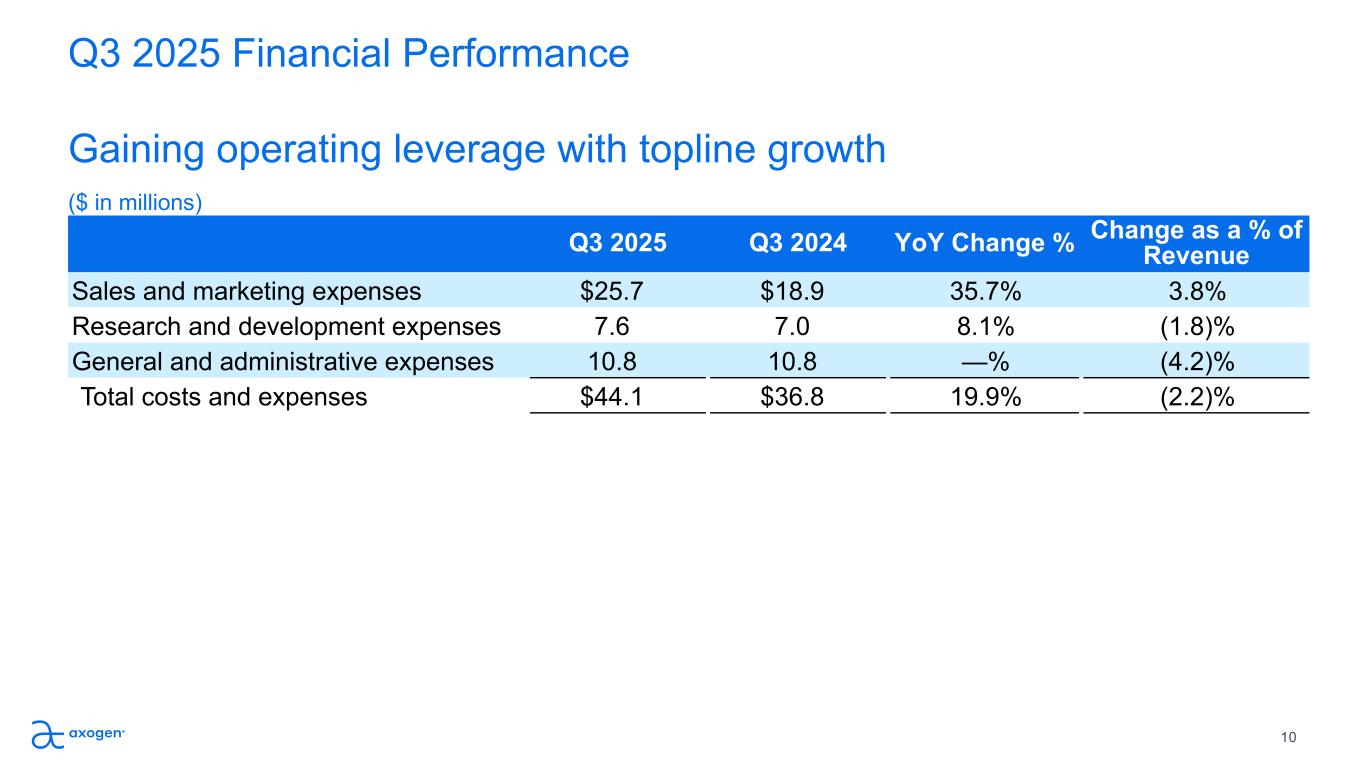
Q3 2025 Financial Performance Gaining operating leverage with topline growth ($ in millions) 10 Q3 2025 Q3 2024 YoY Change % Change as a % of Revenue Sales and marketing expenses $25.7 $18.9 35.7% 3.8% Research and development expenses 7.6 7.0 8.1% (1.8)% General and administrative expenses 10.8 10.8 —% (4.2)% Total costs and expenses $44.1 $36.8 19.9% (2.2)%
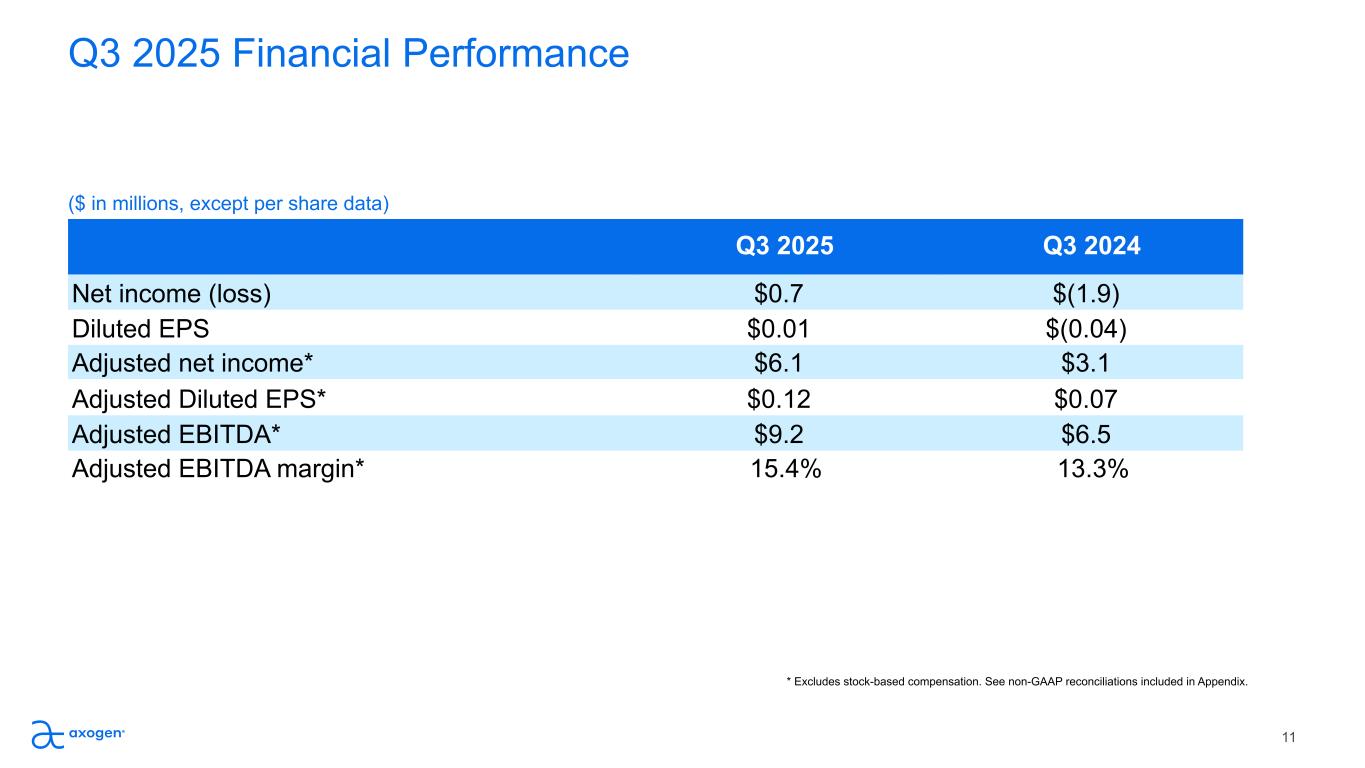
Q3 2025 Financial Performance ($ in millions, except per share data) 11 * Excludes stock-based compensation. See non-GAAP reconciliations included in Appendix. Q3 2025 Q3 2024 Net income (loss) $0.7 $(1.9) Diluted EPS $0.01 $(0.04) Adjusted net income* $6.1 $3.1 Adjusted Diluted EPS* $0.12 $0.07 Adjusted EBITDA* $9.2 $6.5 Adjusted EBITDA margin* 15.4% 13.3%
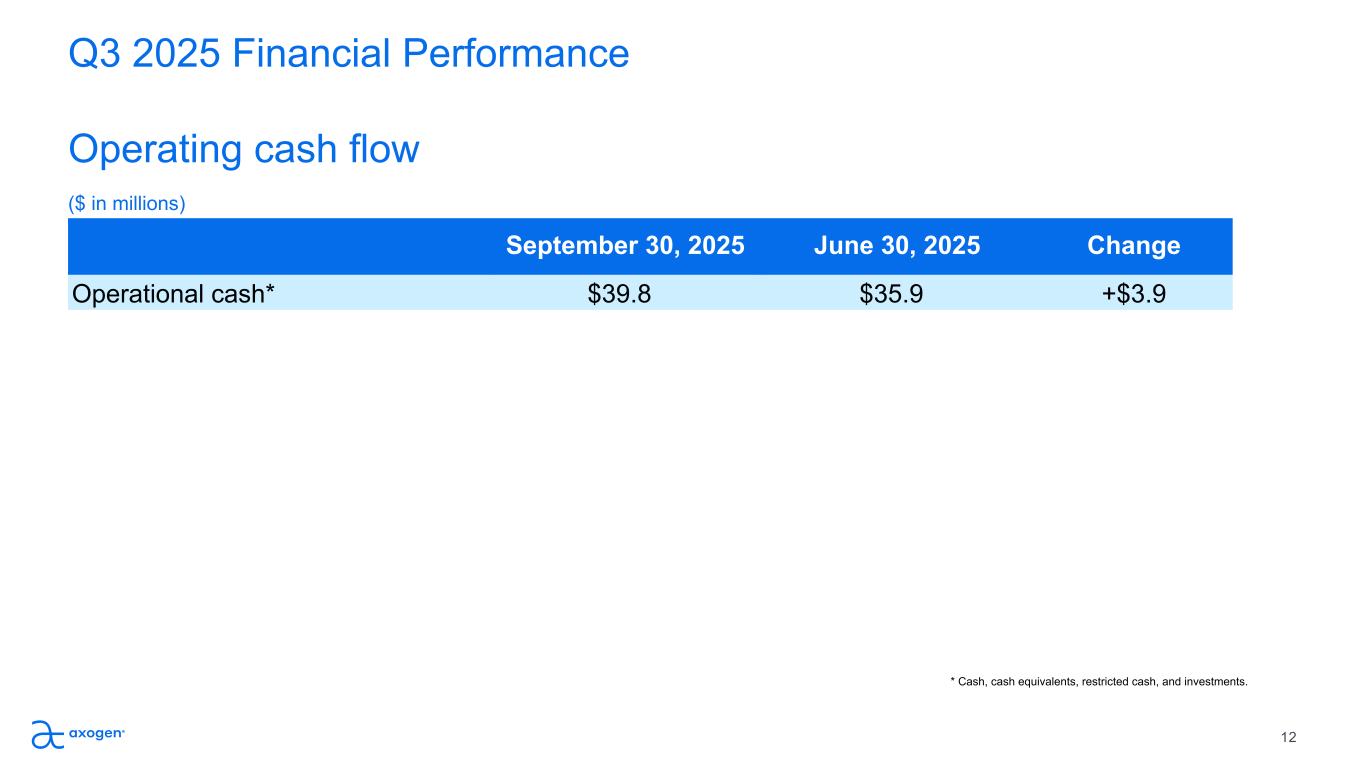
Q3 2025 Financial Performance Operating cash flow ($ in millions) 12 * Cash, cash equivalents, restricted cash, and investments. September 30, 2025 June 30, 2025 Change Operational cash* $39.8 $35.9 +$3.9
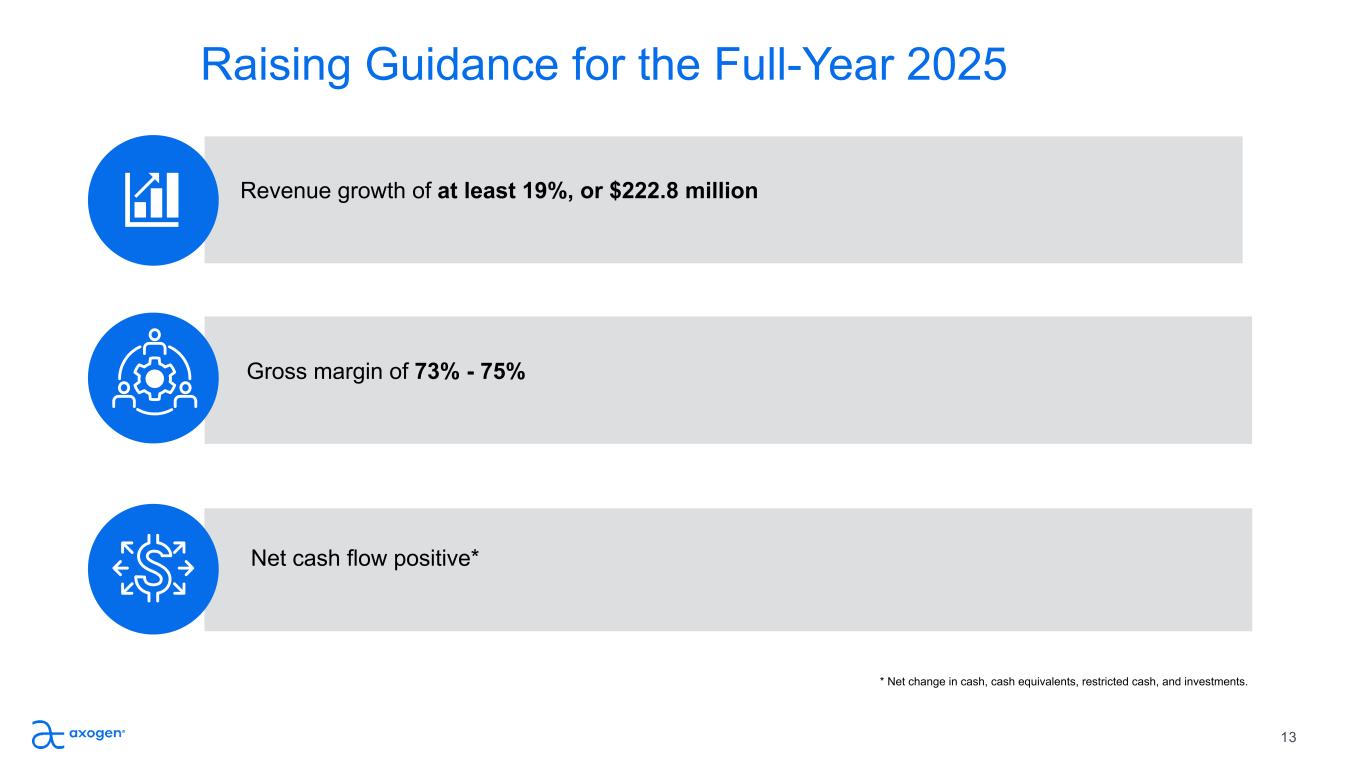
Raising Guidance for the Full-Year 2025 Revenue growth of at least 19%, or $222.8 million Gross margin of 73% - 75% Net cash flow positive* 13 * Net change in cash, cash equivalents, restricted cash, and investments.

Michael Dale President and Chief Executive Officer Jens Kemp Chief Marketing Officer Rick Ditto VP, Global Health Economics, Reimbursement & Policy 14 Lindsey Hartley Chief Financial Officer Q&A

Thank you

Appendix 16
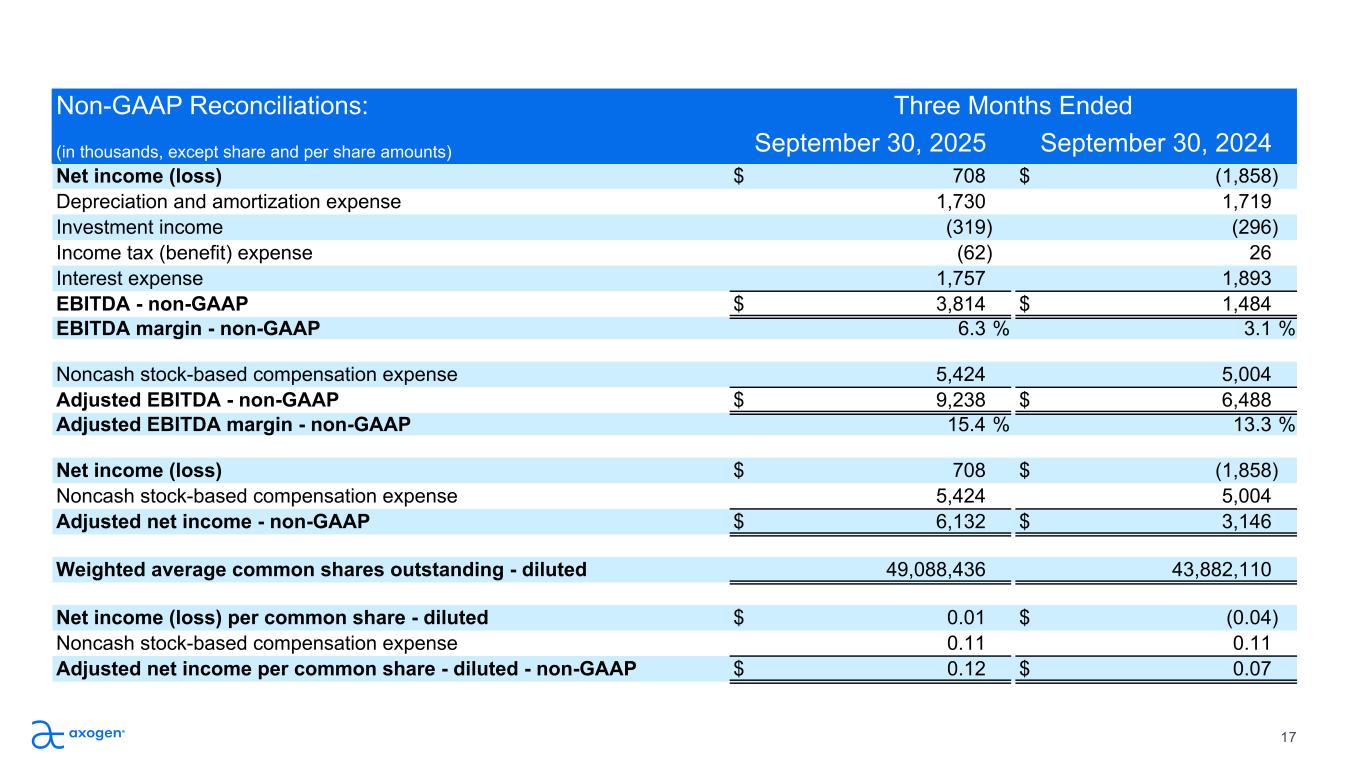
17 Non-GAAP Reconciliations: Three Months Ended (in thousands, except share and per share amounts) September 30, 2025 September 30, 2024 Net income (loss) $ 708 $ (1,858) Depreciation and amortization expense 1,730 1,719 Investment income (319) (296) Income tax (benefit) expense (62) 26 Interest expense 1,757 1,893 EBITDA - non-GAAP $ 3,814 $ 1,484 EBITDA margin - non-GAAP 6.3 % 3.1 % Noncash stock-based compensation expense 5,424 5,004 Adjusted EBITDA - non-GAAP $ 9,238 $ 6,488 Adjusted EBITDA margin - non-GAAP 15.4 % 13.3 % Net income (loss) $ 708 $ (1,858) Noncash stock-based compensation expense 5,424 5,004 Adjusted net income - non-GAAP $ 6,132 $ 3,146 Weighted average common shares outstanding - diluted 49,088,436 43,882,110 Net income (loss) per common share - diluted $ 0.01 $ (0.04) Noncash stock-based compensation expense 0.11 0.11 Adjusted net income per common share - diluted - non-GAAP $ 0.12 $ 0.07
