Exhibit (c)(11)
Project Titan | Discussion materials October 15, 2020
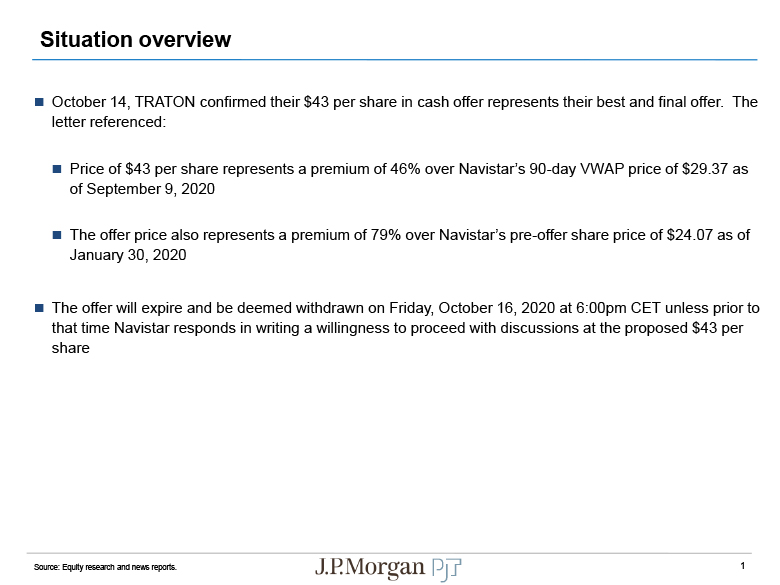
Situation overview Source: Equity research and news reports. 1 October 14, TRATON confirmed
their $43 per share in cash offer represents their best and final offer. Theletter referenced:Price of $43 per share represents a premium of 46% over Navistar’s 90-day VWAP price of $29.37 as of September 9, 2020The offer price also
represents a premium of 79% over Navistar’s pre-offer share price of $24.07 as ofJanuary 30, 2020The offer will expire and be deemed withdrawn on Friday, October 16, 2020 at 6:00pm CET unless prior to that time Navistar responds in writing
a willingness to proceed with discussions at the proposed $43 per share
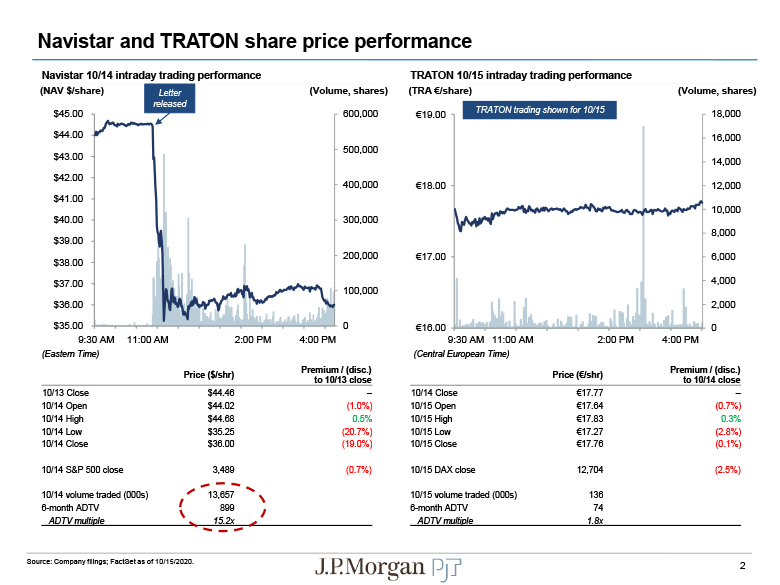
Navistar and TRATON share price performance Source: Company filings; FactSet as of
10/15/2020. Price ($/shr) Premium / (disc.) to 10/13 close 10/13 Close $44.46 – 10/14 Open $44.02 (1.0%) 10/14 High $44.68 0.5% 10/14 Low $35.25 (20.7%) 10/14 Close $36.00 (19.0%) 10/14 S&P 500
close 3,489 (0.7%) 10/14 volume traded (000s) 13,657 6-month ADTV 899 ADTV multiple 15.2x Navistar 10/14 intraday trading performance TRATON 10/15 intraday trading
performance 2 0 100,000 200,000 300,000 400,000 500,000 600,000 €19.00 $35.00 $36.00 $37.00 $38.00 $39.00 $40.00 $41.00 $42.00 $43.00 $44.00 $45.00 (NAV $/share) (Volume, shares) (TRA
€/share) 9:30 AM(Eastern Time) 4:00 PM 11:00 AM 2:00 PM (Volume, shares) 0 2,000 4,000 6,000 8,000 10,000 12,000 14,000 16,000 18,000 €16.00 €17.00 €18.00 9:30 AM 11:00 AM 4:00
PM 2:00 PM Price (€/shr) Premium / (disc.) to 10/14 close 10/14 Close €17.77 – 10/15 Open €17.64 (0.7%) 10/15 High €17.83 0.3% 10/15 Low €17.27 (2.8%) 10/15 Close €17.76 (0.1%) 10/15 DAX close 12,704 (2.5%) 10/15
volume traded (000s) 136 6-month ADTV 74 ADTV multiple 1.8x (Central European Time) Letterreleased TRATON trading shown for 10/15
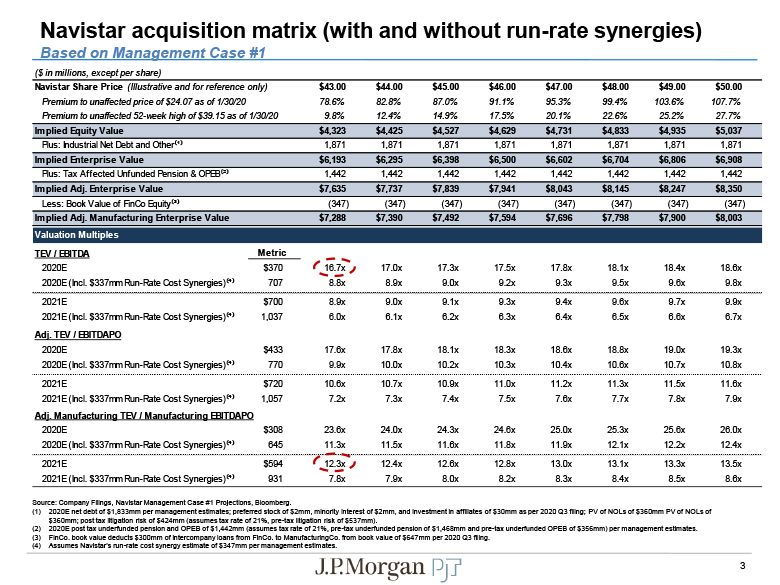
Navistar acquisition matrix (with and without run-rate synergies) Based on Management Case #1 ($ in
millions, except per share) Source: Company Filings, Navistar Management Case #1 Projections, Bloomberg.2020E net debt of $1,833mm per management estimates; preferred stock of $2mm, minority interest of $2mm, and investment in affiliates
of $30mm as per 2020 Q3 filing; PV of NOLs of $360mm PV of NOLs of$360mm; post tax litigation risk of $424mm (assumes tax rate of 21%, pre-tax litigation risk of $537mm).2020E post tax underfunded pension and OPEB of $1,442mm (assumes tax
rate of 21%, pre-tax underfunded pension of $1,468mm and pre-tax underfunded OPEB of $356mm) per management estimates.FinCo. book value deducts $300mm of intercompany loans from FinCo. to ManufacturingCo. from book value of $647mm per 2020
Q3 filing.Assumes Navistar’s run-rate cost synergy estimate of $347mm per management estimates.3 Navistar Share Price (Illustrative and for reference only) $43.00 $44.00 $45.00 $46.00 $47.00 $48.00 $49.00 $50.00 Premium
to unaffected price of $24.07 as of 1/30/20 78.6% 82.8% 87.0% 91.1% 95.3% 99.4% 103.6% 107.7% Premium to unaffected 52-week high of $39.15 as of 1/30/20 9.8% 12.4% 14.9% 17.5% 20.1% 22.6% 25.2% 27.7% Implied Equity
Value $4,323 $4,425 $4,527 $4,629 $4,731 $4,833 $4,935 $5,037 Plus: Industrial Net Debt and Other⁽¹⁾ 1,871 1,871 1,871 1,871 1,871 1,871 1,871 1,871 Implied Enterprise
Value $6,193 $6,295 $6,398 $6,500 $6,602 $6,704 $6,806 $6,908 Plus: Tax Affected Unfunded Pension & OPEB⁽²⁾ 1,442 1,442 1,442 1,442 1,442 1,442 1,442 1,442 Implied Adj. Enterprise
Value $7,635 $7,737 $7,839 $7,941 $8,043 $8,145 $8,247 $8,350 Less: Book Value of FinCo Equity⁽³⁾ (347) (347) (347) (347) (347) (347) (347) (347) Implied Adj. Manufacturing Enterprise
Value $7,288 $7,390 $7,492 $7,594 $7,696 $7,798 $7,900 $8,003 Valuation Multiples TEV / EBITDA Metric 2020E $370 16.7x 17.0x 17.3x 17.5x 17.8x 18.1x 18.4x 18.6x 2020E (Incl. $337mm
Run-Rate Cost Synergies)⁽⁴⁾ 707 8.8x 8.9x 9.0x 9.2x 9.3x 9.5x 9.6x 9.8x 2021E $700 8.9x 9.0x 9.1x 9.3x 9.4x 9.6x 9.7x 9.9x 2021E (Incl. $337mm Run-Rate Cost Synergies)⁽⁴⁾
1,037 6.0x 6.1x 6.2x 6.3x 6.4x 6.5x 6.6x 6.7x Adj. TEV / EBITDAPO 2020E $433 17.6x 17.8x 18.1x 18.3x 18.6x 18.8x 19.0x 19.3x 2020E (Incl. $337mm Run-Rate Cost
Synergies)⁽⁴⁾ 770 9.9x 10.0x 10.2x 10.3x 10.4x 10.6x 10.7x 10.8x 2021E $720 10.6x 10.7x 10.9x 11.0x 11.2x 11.3x 11.5x 11.6x 2021E (Incl. $337mm Run-Rate Cost
Synergies)⁽⁴⁾ 1,057 7.2x 7.3x 7.4x 7.5x 7.6x 7.7x 7.8x 7.9x Adj. Manufacturing TEV / Manufacturing EBITDAPO 2020E $308 23.6x 24.0x 24.3x 24.6x 25.0x 25.3x 25.6x 26.0x 2020E (Incl. $337mm Run-Rate Cost
Synergies)⁽⁴⁾ 645 11.3x 11.5x 11.6x 11.8x 11.9x 12.1x 12.2x 12.4x 2021E $594 12.3x 12.4x 12.6x 12.8x 13.0x 13.1x 13.3x 13.5x 2021E (Incl. $337mm Run-Rate Cost
Synergies)⁽⁴⁾ 931 7.8x 7.9x 8.0x 8.2x 8.3x 8.4x 8.5x 8.6x
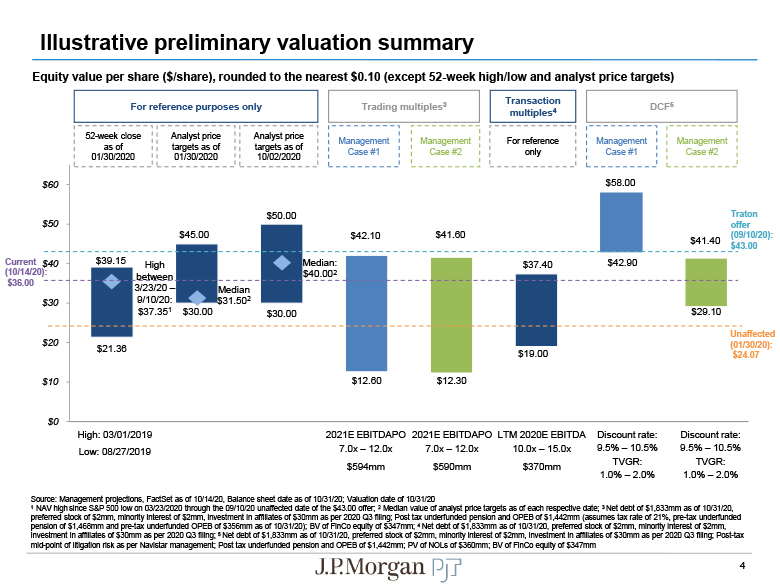
Illustrative preliminary valuation
summary $21.36 $30.00 $30.00 $12.60 $12.30 $19.00 $42.90 $29.10 $39.15 $45.00 $50.00 $42.10 $41.60 $37.40 $58.00 $41.40 $0 $10 $20 $30 $50 $60 Unaffected (01/30/20):$24.07 Discount rate: 9.5% –
10.5% TVGR:1.0% – 2.0% Current $40 7.0x – 12.0x$594mm Source: Management projections, FactSet as of 10/14/20, Balance sheet date as of 10/31/20; Valuation date of 10/31/201 NAV high since S&P 500 low on 03/23/2020 through the
09/10/20 unaffected date of the $43.00 offer; 2 Median value of analyst price targets as of each respective date; 3 Net debt of $1,833mm as of 10/31/20, preferred stock of $2mm, minority interest of $2mm, investment in affiliates of $30mm
as per 2020 Q3 filing; Post tax underfunded pension and OPEB of $1,442mm (assumes tax rate of 21%, pre-tax underfunded pension of $1,468mm and pre-tax underfunded OPEB of $356mm as of 10/31/20); BV of FinCo equity of $347mm; 4 Net debt of
$1,833mm as of 10/31/20, preferred stock of $2mm, minority interest of $2mm, investment in affiliates of $30mm as per 2020 Q3 filing; 5 Net debt of $1,833mm as of 10/31/20, preferred stock of $2mm, minority interest of $2mm, investment in
affiliates of $30mm as per 2020 Q3 filing; Post-tax mid-point of litigation risk as per Navistar management; Post tax underfunded pension and OPEB of $1,442mm; PV of NOLs of $360mm; BV of FinCo equity of
$347mm4 (10/14/20): $36.00 Trading multiples3 Management Case #1 Management Case #2 7.0x – 12.0x$590mm 2021E EBITDAPO 2021E EBITDAPO LTM 2020E EBITDA 10.0x – 15.0x$370mm Discount rate: 9.5% – 10.5% TVGR:1.0% –
2.0% DCF5 Management Case #1 Management Case #2 Traton offer (09/10/20):$43.00 High: 03/01/2019 Low: 08/27/2019 For reference purposes only 52-week close as of 01/30/2020 Analyst price targets as of 01/30/2020 Analyst
price targets as of 10/02/2020 High between 3/23/20 –9/10/20:$37.351 Median $31.502 Median: $40.002 Equity value per share ($/share), rounded to the nearest $0.10 (except 52-week high/low and analyst price targets)Transaction
multiples4For reference only
Appendix
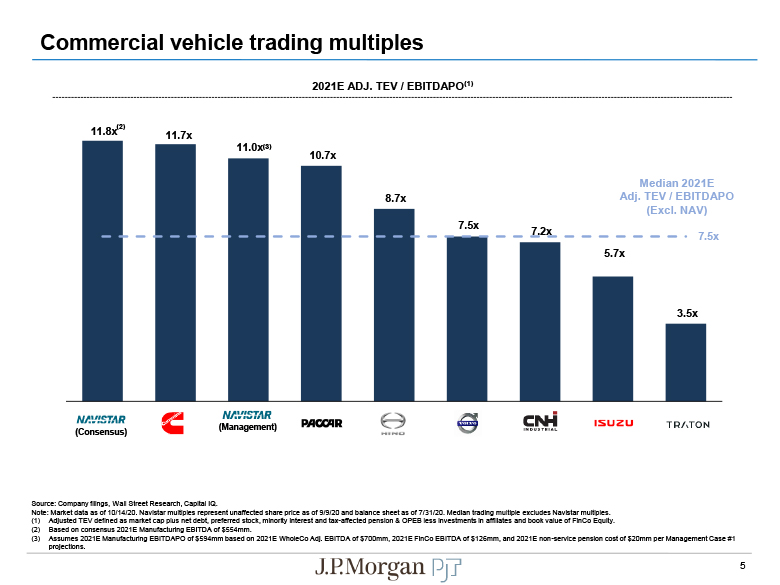
Commercial vehicle trading
multiples 11.8x(2) 11.7x 10.7x 8.7x 7.5x 7.2x 5.7x 3.5x 7.5x 11.0x(3) Source: Company filings, Wall Street Research, Capital IQ.Note: Market data as of 10/14/20. Navistar multiples represent unaffected share price as of
9/9/20 and balance sheet as of 7/31/20. Median trading multiple excludes Navistar multiples.Adjusted TEV defined as market cap plus net debt, preferred stock, minority interest and tax-affected pension & OPEB less investments in
affiliates and book value of FinCo Equity.Based on consensus 2021E Manufacturing EBITDA of $554mm.Assumes 2021E Manufacturing EBITDAPO of $594mm based on 2021E WholeCo Adj. EBITDA of $700mm, 2021E FinCo EBITDA of $126mm, and 2021E
non-service pension cost of $20mm per Management Case #1 projections.5 2021E ADJ. TEV / EBITDAPO(1) (Consensus) (Management) Median 2021E Adj. TEV / EBITDAPO(Excl. NAV)
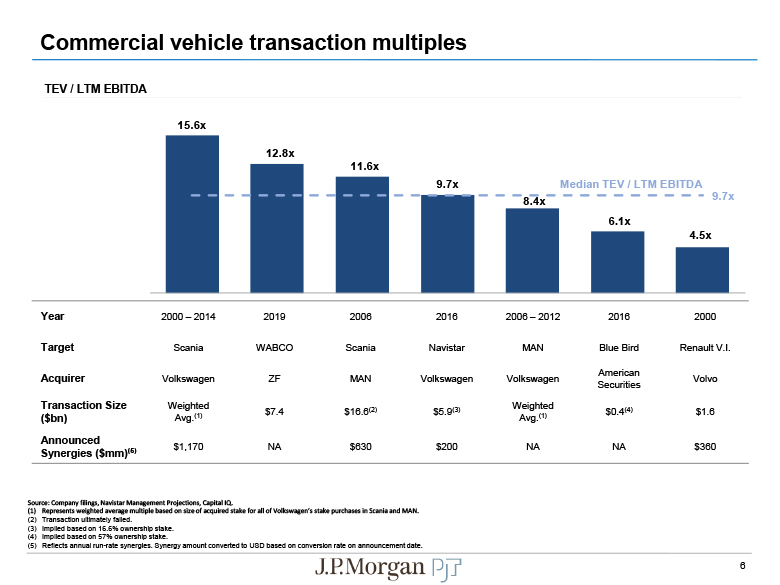
Commercial vehicle transaction multiples 9.7x 8.4x 6.1x4.5x 9.7x TEV / LTM
EBITDA15.6x12.8x11.6x Year 2000 – 2014 2019 2006 2016 2006 – 2012 2016 2000 Target Scania WABCO Scania Navistar MAN Blue Bird Renault V.I. Acquirer Volkswagen ZF MAN Volkswagen Volkswagen American
Securities Volvo Transaction Size ($bn) Weighted Avg.(1) $7.4 $16.6(2) $5.9(3) Weighted Avg.(1) $0.4(4) $1.6 Announced Synergies ($mm)(5) $1,170 NA $630 $200 NA NA $360 Source: Company filings, Navistar Management
Projections, Capital IQ.Represents weighted average multiple based on size of acquired stake for all of Volkswagen’s stake purchases in Scania and MAN.Transaction ultimately failed.Implied based on 16.6% ownership stake.Implied based on 57%
ownership stake.Reflects annual run-rate synergies. Synergy amount converted to USD based on conversion rate on announcement date. 6 Median TEV / LTM EBITDA
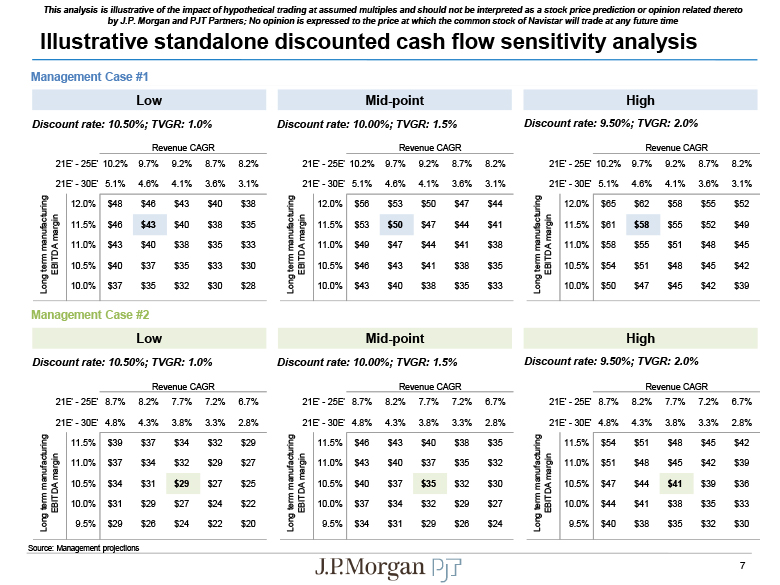
Revenue CAGR 21E' - 25E' 10.2% 9.7% 9.2% 8.7% 8.2%21E' - 30E' 5.1% 4.6% 4.1% 3.6% 3.1% Long
term manufacturing EBITDA margin 12.0% $48 $46 $43 $40 $38 11.5% $46 $43 $40 $38 $35 11.0% $43 $40 $38 $35 $33 10.5% $40 $37 $35 $33 $30 10.0% $37 $35 $32 $30 $28 Illustrative standalone discounted
cash flow sensitivity analysis High Low Mid-point Discount rate: 10.50%; TVGR: 1.0% Discount rate: 10.00%; TVGR: 1.5% Discount rate: 9.50%; TVGR: 2.0% Management Case #1 Revenue CAGR 21E' - 25E' 10.2% 9.7% 9.2% 8.7%
8.2%21E' - 30E' 5.1% 4.6% 4.1% 3.6% 3.1% Long term manufacturing EBITDA
margin 12.0% $56 $53 $50 $47 $44 11.5% $53 $50 $47 $44 $41 11.0% $49 $47 $44 $41 $38 10.5% $46 $43 $41 $38 $35 10.0% $43 $40 $38 $35 $33 Revenue CAGR 21E' - 25E' 10.2% 9.7% 9.2% 8.7% 8.2%21E' - 30E'
5.1% 4.6% 4.1% 3.6% 3.1% Long term manufacturing EBITDA margin 12.0% $65 $62 $58 $55 $52 11.5% $61 $58 $55 $52 $49 11.0% $58 $55 $51 $48 $45 10.5% $54 $51 $48 $45 $42 10.0% $50 $47 $45 $42 $39
Revenue CAGR 21E' - 25E' 8.7% 8.2% 7.7% 7.2% 6.7% 21E' - 25E' 8.7% 8.2% 7.7% 7.2% 6.7% 21E' - 25E' 8.7% 8.2% 7.7% 7.2% 6.7% 21E' - 30E' 4.8% 4.3% 3.8% 3.3% 2.8% 21E' - 30E' 4.8% 4.3% 3.8% 3.3% 2.8% 21E' - 30E'
4.8% 4.3% 3.8% 3.3% 2.8% Long term manufacturing EBITDA
margin 11.5% $39 $37 $34 $32 $29 11.0% $37 $34 $32 $29 $27 10.5% $34 $31 $29 $27 $25 10.0% $31 $29 $27 $24 $22 9.5% $29 $26 $24 $22 $20 High Low Mid-point Discount rate: 10.50%; TVGR:
1.0% Discount rate: 10.00%; TVGR: 1.5% Discount rate: 9.50%; TVGR: 2.0% Management Case #2 Revenue CAGR Long term manufacturing EBITDA
margin 11.5% $46 $43 $40 $38 $35 11.0% $43 $40 $37 $35 $32 10.5% $40 $37 $35 $32 $30 10.0% $37 $34 $32 $29 $27 9.5% $34 $31 $29 $26 $24 Revenue CAGR Long term manufacturing EBITDA
margin 11.5% $54 $51 $48 $45 $42 11.0% $51 $48 $45 $42 $39 10.5% $47 $44 $41 $39 $36 10.0% $44 $41 $38 $35 $33 9.5% $40 $38 $35 $32 $30 Source: Management projections 7 This analysis is
illustrative of the impact of hypothetical trading at assumed multiples and should not be interpreted as a stock price prediction or opinion related thereto by J.P. Morgan and PJT Partners; No opinion is expressed to the price at which the
common stock of Navistar will trade at any future time