Exhibit (c)(7)
CONFIDENTIAL and PROPRIETARY to NAVISTAR NYSE: NAV Project Titan | Valuation
analysis Preliminary draft for illustrative purposes only – All projections are WIP July 28, 2020
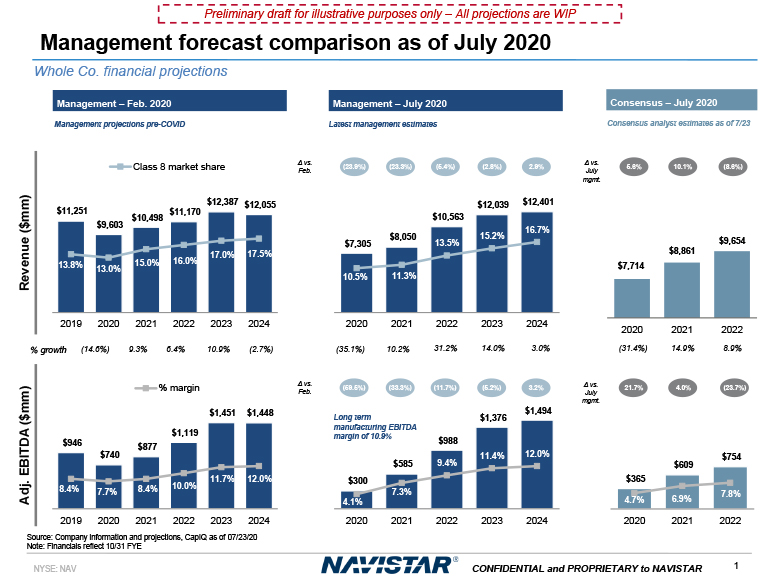
Management forecast comparison as of July 2020 Preliminary draft for illustrative purposes only –
All projections are WIP Management – Feb. 2020 Revenue ($mm) Adj. EBITDA ($mm) $946 $740 $877 $1,119 $1,451 $1,448 10.0% 11.7% 12.0% % margin (14.6%) 9.3% 6.4% 10.9% (2.7%) %
growth Management projections pre-COVID Source: Company information and projections, CapIQ as of 07/23/20 Note: Financials reflect 10/31 FYE Management – July
2020 $300 $585 $988 $1,376 $1,494 9.4% 11.4% 12.0% (35.1%) 10.2% 31.2% 14.0% 3.0% Latest management estimates (23.9%) (23.3%) (5.4%) (2.8%) 2.9% Δ vs.
Feb. (59.5%) (33.3%) (11.7%) (5.2%) 3.2% Δ vs. Feb. Whole Co. financial projections Consensus – July
2020 $7,714 $8,861 $9,654 2020 2021 2022 $365 $609 8.4% 7.7% 8.4% 4.1% 7.3% 4.7% 6.9% 7.8% 2019 2020 2021 2022 2023 2024 2020 2021 2022 2023 2024 2020 2021 2022 $754 (31.4%) 14.9% 8.9% Consensus
analyst estimates as of 7/23 Δ vs. July mgmt. 5.6% 10.1% (8.6%) Δ vs. July mgmt. 21.7% 4.0% (23.7%) Long term manufacturing EBITDA margin of 10.9% $11,251 $9,603 $10,498
$11,170 $12,387 $12,055 13.8% 13.0% 15.0% 16.0% 17.0% 17.5% 2019 2020 2021 2022 2023 2024 Class 8 market share $7,305 2 NYSE: NAV CONFIDENTIAL and PROPRIETARY to
NAVISTAR $8,050 $10,563 $12,039 $12,401 10.5% 11.3% 13.5% 15.2% 16.7% 2020 2021 2022 2023 2024
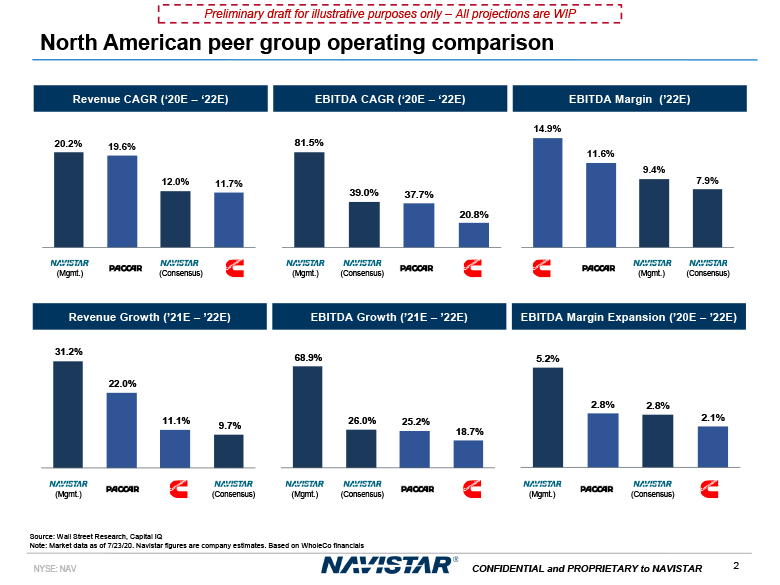
Revenue CAGR (‘20E – ‘22E) EBITDA CAGR (‘20E – ‘22E) Source: Wall Street Research, Capital
IQNote: Market data as of 7/23/20. Navistar figures are company estimates. Based on WholeCo financials (Mgmt.) Revenue Growth (’21E – ’22E) EBITDA Growth (’21E –
’22E) (Consensus) (Mgmt.) (Consensus) (Mgmt.) (Consensus) (Mgmt.) (Consensus) (Mgmt.) (Consensus) North American peer group operating comparison Preliminary draft for illustrative
purposes only – All projections are WIP 20.2% 19.6% 12.0% 11.7% 81.5% 39.0% 37.7% 20.8% EBITDA Margin (’22E) 14.9% 11.6% 9.4% 7.9% (Mgmt.) (Consensus) EBITDA Margin Expansion (’20E –
’22E) 31.2% 22.0% 11.1% 9.7% 68.9% 26.0% 25.2% 18.7% 5.2% 3 NYSE: NAV CONFIDENTIAL and PROPRIETARY to NAVISTAR 2.8% 2.8% 2.1%
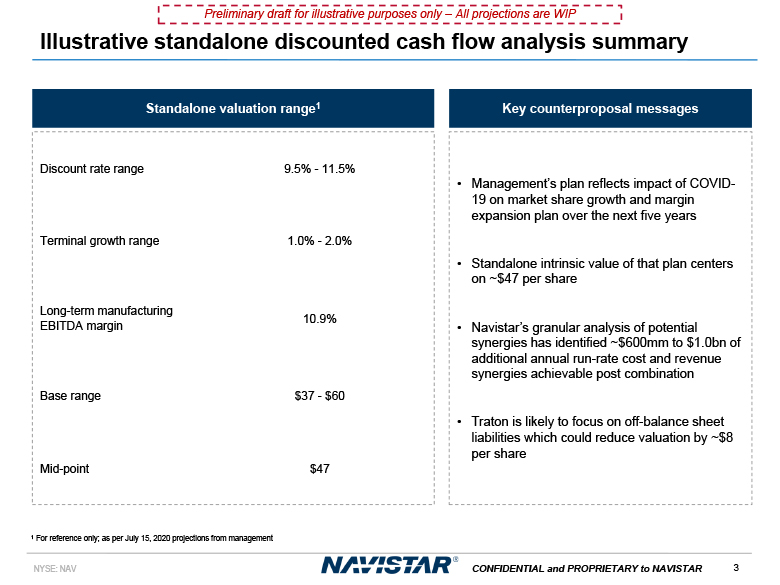
Illustrative standalone discounted cash flow analysis summary Preliminary draft for illustrative
purposes only – All projections are WIP Discount rate range 9.5% - 11.5% Terminal growth range 1.0% - 2.0% Long-term manufacturing EBITDA margin 10.9% Base range $37 - $60 Mid-point $47 Standalone valuation range1 Key
counterproposal messages Management’s plan reflects impact of COVID- 19 on market share growth and margin expansion plan over the next five yearsStandalone intrinsic value of that plan centers on ~$47 per shareNavistar’s granular analysis
of potential synergies has identified ~$600mm to $1.0bn of additional annual run-rate cost and revenue synergies achievable post combinationTraton is likely to focus on off-balance sheet liabilities which could reduce valuation by ~$8 per
share 1 For reference only; as per July 15, 2020 projections from management 3 NYSE: NAV CONFIDENTIAL and PROPRIETARY to NAVISTAR
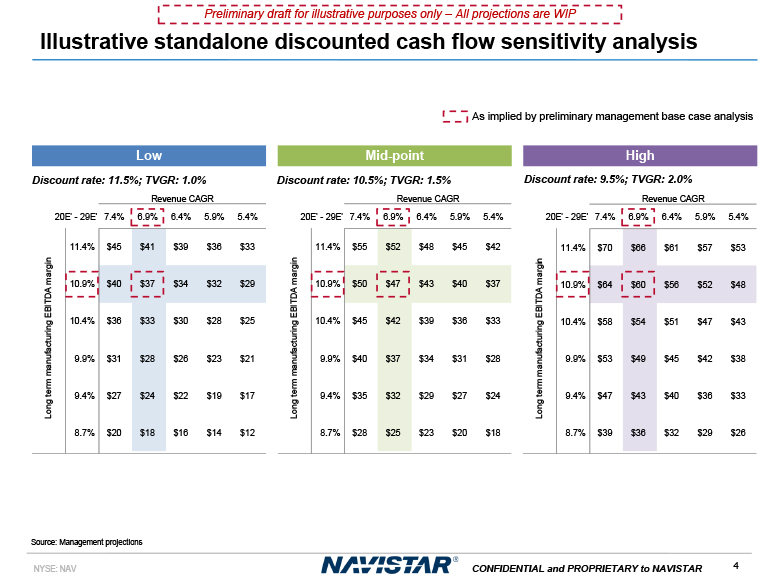
Illustrative standalone discounted cash flow sensitivity analysis Preliminary draft for
illustrative purposes only – All projections are WIP As implied by preliminary management base case analysis High Low Mid-point Discount rate: 10.5%; TVGR: 1.5% Revenue CAGR 20E' - 29E' 7.4% 6.9% 6.4% 5.9% 5.4% 11.4% $55
$52 $48 $45 $42 10.9% $50 $47 $43 $40 $37 10.4% $45 $42 $39 $36 $33 9.9% $40 $37 $34 $31 $28 9.4% $35 $32 $29 $27 $24 8.7% $28 $25 $23 $20 $18 Long term manufacturing EBITDA margin Discount
rate: 9.5%; TVGR: 2.0% Revenue CAGR 20E' - 29E' 7.4% 6.9% 6.4% 5.9% 5.4% 11.4% $70 $66 $61 $57 $53 10.9% $64 $60 $56 $52 $48 10.4% $58 $54 $51 $47 $43 9.9% $53 $49 $45 $42 $38 9.4% $47 $43 $40 $36 $33 8.7%
$39 $36 $32 $29 $26 Long term manufacturing EBITDA margin Discount rate: 11.5%; TVGR: 1.0% Revenue CAGR 20E' - 29E' 7.4% 6.9% 6.4% 5.9% 5.4% 11.4% $45 $41 $39 $36 $33 10.9% $40 $37 $34 $32 $29 10.4%
$36 $33 $30 $28 $25 9.9% $31 $28 $26 $23 $21 9.4% $27 $24 $22 $19 $17 8.7% $20 $18 $16 $14 $12 Long term manufacturing EBITDA margin Source: Management projections 4 NYSE: NAV CONFIDENTIAL and
PROPRIETARY to NAVISTAR
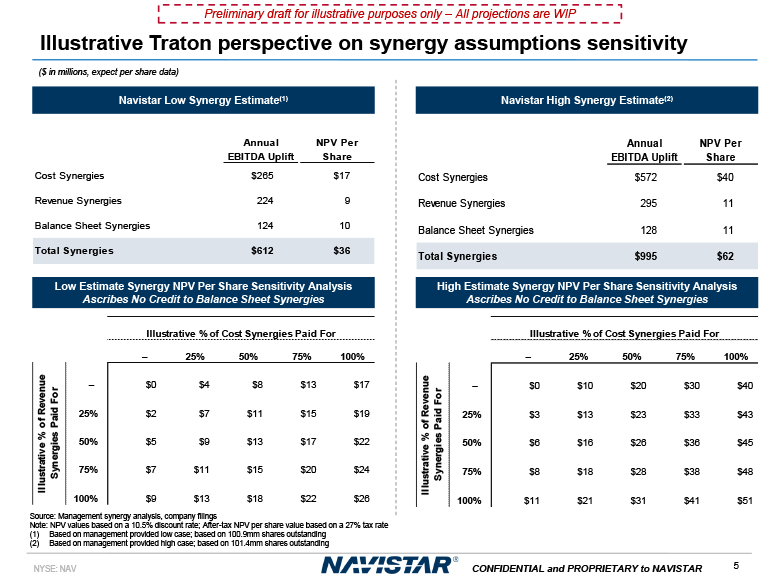
Navistar Low Synergy Estimate(1) Low Estimate Synergy NPV Per Share Sensitivity AnalysisAscribes
No Credit to Balance Sheet Synergies Navistar High Synergy Estimate(2) High Estimate Synergy NPV Per Share Sensitivity AnalysisAscribes No Credit to Balance Sheet Synergies Source: MNote: NPV values based on a 10.5% discount rate;
After-tax NPV per share value based on a 27% tax rate(1) Based on management provided low case; based on 100.9mm shares outstanding – 25% 50% 75% 100% – 25% 50% 75% 100% – $0 $4 $8 $13 $17 enue
or – $0 $10 $20 $30 $40 25% $2 $7 $11 $15 $19 of Rev Paid F 25% $3 $13 $23 $33 $43 50% $5 $9 $13 $17 $22 ive % rgies 50% $6 $16 $26 $36 $45 75% $7 $11 $15 $20 $24 ustrat
Syne 75% $8 $18 $28 $38 $48 100% $9 $13 $18 $22 $26 Ill 100% $11 $21 $31 $41 $51 anagement s ynergy analysis, company filings Illustrative Traton perspective on synergy assumptions
sensitivity Preliminary draft for illustrative purposes only – All projections are WIP Cost Synergies $265 $17 Revenue Synergies 224 9 Balance Sheet Synergies 124 10 Total Synergies $612 $36 Annual NPV Per EBITDA Uplift Share
Cost Synergies $572 $40 Revenue Synergies 295 11 Balance Sheet Synergies 128 11 Total Synergies $995 $62 Annual NPV Per EBITDA Uplift Share Illustrative % of Cost Synergies Paid For Illustrative % of RevenueSynergies Paid
For Illustrative % of Cost Synergies Paid For ($ in millions, expect per share data) (2) Based on management provided high case; based on 101.4mm shares outstanding 5 NYSE: NAV CONFIDENTIAL and PROPRIETARY to NAVISTAR
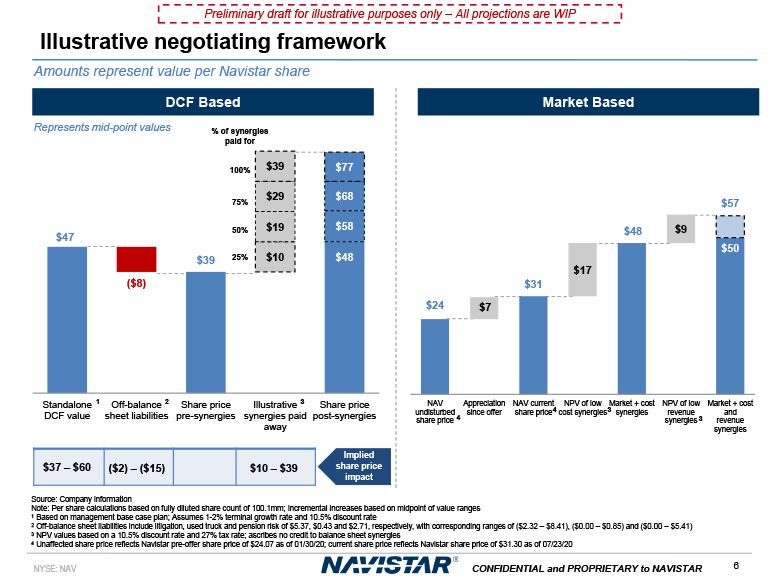
% of synergies paid
for 100% $47 $39 ($8) 75% 50% $19 $58 25% $10 $48 $29 $68 $39 $77 Standalone 1 Off-balance 2DCF value sheet liabilities Share price pre-synergies Illustrative 3 Share price synergies paid
post-synergiesaway Illustrative negotiating framework $37 – $60 ($2) – ($15) $10 – $39 Source: Company informationNote: Per share calculations based on fully diluted share count of 100.1mm; Incremental increases based on midpoint of
value ranges1 Based on management base case plan; Assumes 1-2% terminal growth rate and 10.5% discount rate2 Off-balance sheet liabilities include litigation, used truck and pension risk of $5.37, $0.43 and $2.71, respectively, with
corresponding ranges of ($2.32 – $8.41), ($0.00 – $0.85) and ($0.00 – $5.41)3 NPV values based on a 10.5% discount rate and 27% tax rate; ascribes no credit to balance sheet synergies Preliminary draft for illustrative purposes only – All
projections are WIP Represents mid-point values DCF Based Market Based undisturbed since offer share price4 cost synergies3 synergies revenue share price 4 synergies 3 Implied share price impact Amounts represent value per
Navistar share 4 Unaffected share price reflects Navistar pre-offer share price of $24.07 as of 01/30/20; current share price reflects Navistar share price of $31.30 as of 07/23/20 6 NYSE: NAV CONFIDENTIAL and PROPRIETARY to
NAVISTAR $24 $31 $50 $7 $17 $48 $9 $57 NAV Appreciation NAV current NPV of low Market + cost NPV of low Market + cost and revenue synergies

CONFIDENTIAL and PROPRIETARY to NAVISTAR NYSE: NAV APPENDIX
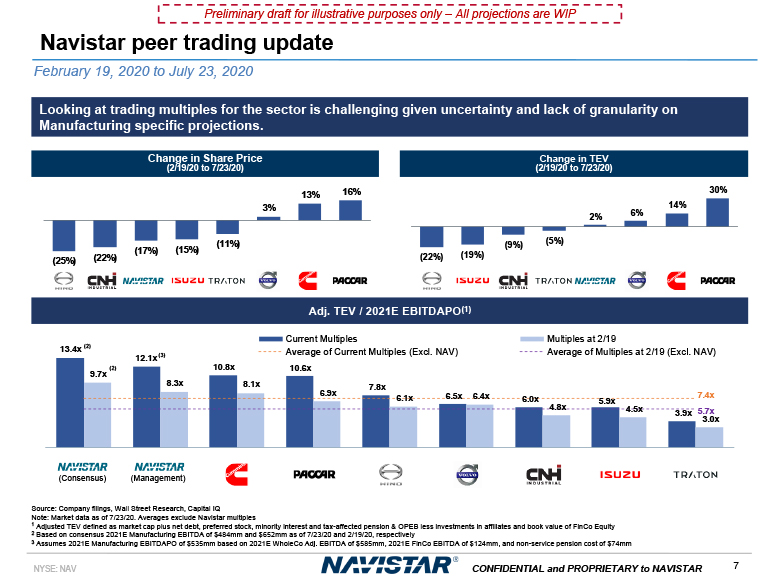
13.4x
(2) 10.8x 7.8x 6.5x 6.0x 5.9x 8.3x 8.1x 6.9x 6.1x 6.4x 4.8x 4.5x 3.0x 7.4x 3.9x 5.7x Current Multiples Multiples at 2/19 Average of Current Multiples (Excl. NAV) Average of Multiples at 2/19 (Excl. NAV)10.6x 12.1x
(3) (2)9.7x Adj. TEV / 2021E EBITDAPO(1) Source: Company filings, Wall Street Research, Capital IQNote: Market data as of 7/23/20. Averages exclude Navistar multiples1 Adjusted TEV defined as market cap plus net debt, preferred stock,
minority interest and tax-affected pension & OPEB less investments in affiliates and book value of FinCo Equity2 Based on consensus 2021E Manufacturing EBITDA of $484mm and $652mm as of 7/23/20 and 2/19/20, respectively3 Assumes 2021E
Manufacturing EBITDAPO of $535mm based on 2021E WholeCo Adj. EBITDA of $585mm, 2021E FinCo EBITDA of $124mm, and non-service pension cost of $74mm (Consensus) (Management) Looking at trading multiples for the sector is
challenging given uncertainty and lack of granularity on Manufacturing specific projections. Change in Share Price(2/19/20 to 7/23/20) Change in TEV(2/19/20 to 7/23/20) Navistar peer trading
update February 19, 2020 to July 23, 2020 Preliminary draft for illustrative purposes only – All projections are WIP (25%) (22%) (17%) (15%) (11%) 3% 13% 16% (22%) 9 NYSE: NAV CONFIDENTIAL and PROPRIETARY to
NAVISTAR (19%) (9%) (5%) 2% 6% 14% 30%
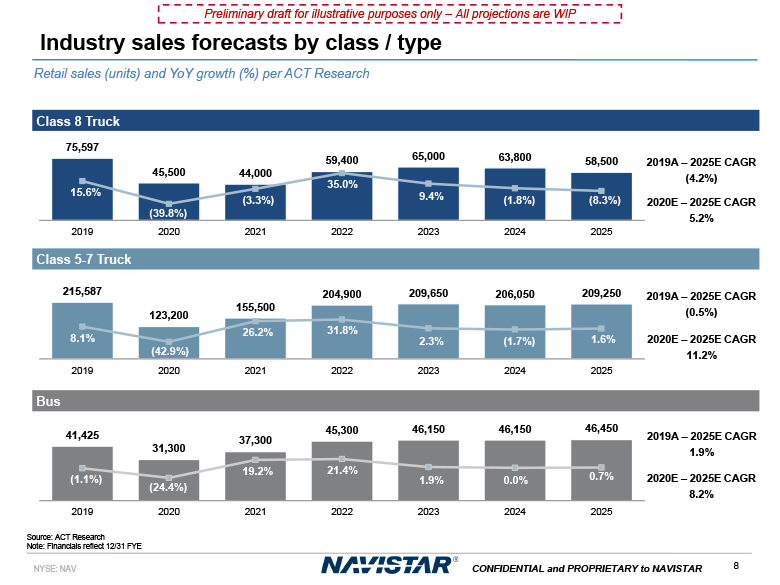
Industry sales forecasts by class / type Class 8
Truck 75,597 45,500 44,000 59,400 65,000 63,800 58,500 15.6% (39.8%) 35.0% 9.4% (3.3%) (1.8%) (8.3%) Source: ACT ResearchNote: Financials reflect 12/31
FYE 8.1% 26.2% 31.8% 2.3% (1.7%) 1.6% (42.9%) 2019 2020 2021 2022 2023 2024 2025 2019 2020 2021 2022 2023 2024 2025 Class 5-7
Truck 215,587 123,200 155,500 204,900 209,650 206,050 209,250 2019A – 2025E CAGR(0.5%) Bus 41,425 10 NYSE: NAV CONFIDENTIAL and PROPRIETARY to
NAVISTAR 31,300 37,300 19.2% 21.4% (1.1%) (24.4%) 1.9% 0.0% 0.7% 2019 2020 2021 2022 2023 2024 2025 45,300 46,150 46,150 46,450 Retail sales (units) and YoY growth (%) per ACT
Research 2019A – 2025E CAGR (4.2%) 2019A – 2025E CAGR1.9% 2020E – 2025E CAGR5.2% 2020E – 2025E CAGR11.2% 2020E – 2025E CAGR8.2% Preliminary draft for illustrative purposes only – All projections are WIP
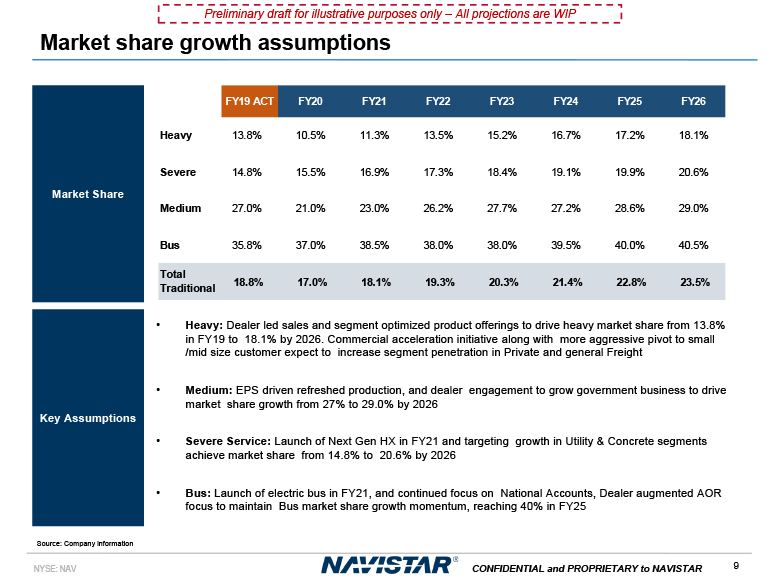
Heavy: Dealer led sales and segment optimized product offerings to drive heavy market share from
13.8% in FY19 to 18.1% by 2026. Commercial acceleration initiative along with more aggressive pivot to small/mid size customer expect to increase segment penetration in Private and general Freight Medium: EPS driven refreshed production,
and dealer engagement to grow government business to drive market share growth from 27% to 29.0% by 2026 Severe Service: Launch of Next Gen HX in FY21 and targeting growth in Utility & Concrete segments achieve market share from 14.8%
to 20.6% by 2026 Bus: Launch of electric bus in FY21, and continued focus on National Accounts, Dealer augmented AOR focus to maintain Bus market share growth momentum, reaching 40% in FY25 Market Share FY19
ACT FY20 FY21 FY22 FY23 FY24 FY25 FY26 Heavy 13.8% 10.5% 11.3% 13.5% 15.2% 16.7% 17.2% 18.1% Severe 14.8% 15.5% 16.9% 17.3% 18.4% 19.1% 19.9% 20.6% Medium 27.0% 21.0% 23.0% 26.2% 27.7% 27.2% 28.6% 29.0% Bus 35.8% 37.0% 38.5% 38.0% 38.0% 39.5% 40.0% 40.5% Total
Traditional 18.8% 17.0% 18.1% 19.3% 20.3% 21.4% 22.8% 23.5% Source: Company information 9 NYSE: NAV CONFIDENTIAL and PROPRIETARY to NAVISTAR Key Assumptions Market share growth assumptions Preliminary draft for illustrative
purposes only – All projections are WIP
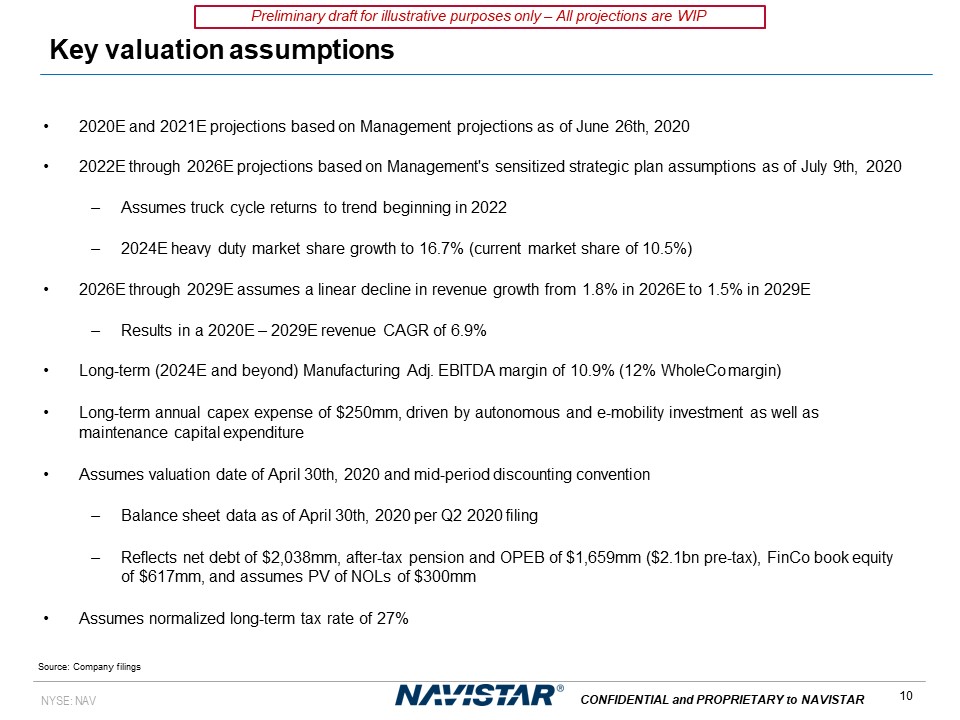
Key valuation assumptions 10 NYSE: NAV CONFIDENTIAL and PROPRIETARY to NAVISTAR 2020E and 2021E
projections based on Management projections as of June 26th, 20202022E through 2026E projections based on Management's sensitized strategic plan assumptions as of July 9th, 2020Assumes truck cycle returns to trend beginning in 20222024E
heavy duty market share growth to 16.7% (current market share of 10.5%)2026E through 2029E assumes a linear decline in revenue growth from 1.8% in 2026E to 1.5% in 2029EResults in a 2020E – 2029E revenue CAGR of 6.9%Long-term (2024E and
beyond) Manufacturing Adj. EBITDA margin of 10.9% (12% WholeCo margin)Long-term annual capex expense of $250mm, driven by autonomous and e-mobility investment as well as maintenance capital expenditureAssumes valuation date of April 30th,
2020 and mid-period discounting conventionBalance sheet data as of April 30th, 2020 per Q2 2020 filingReflects net debt of $2,038mm, after-tax pension and OPEB of $1,659mm ($2.1bn pre-tax), FinCo book equity of $617mm, and assumes PV of
NOLs of $300mmAssumes normalized long-term tax rate of 27% Preliminary draft for illustrative purposes only – All projections are WIP Source: Company filings
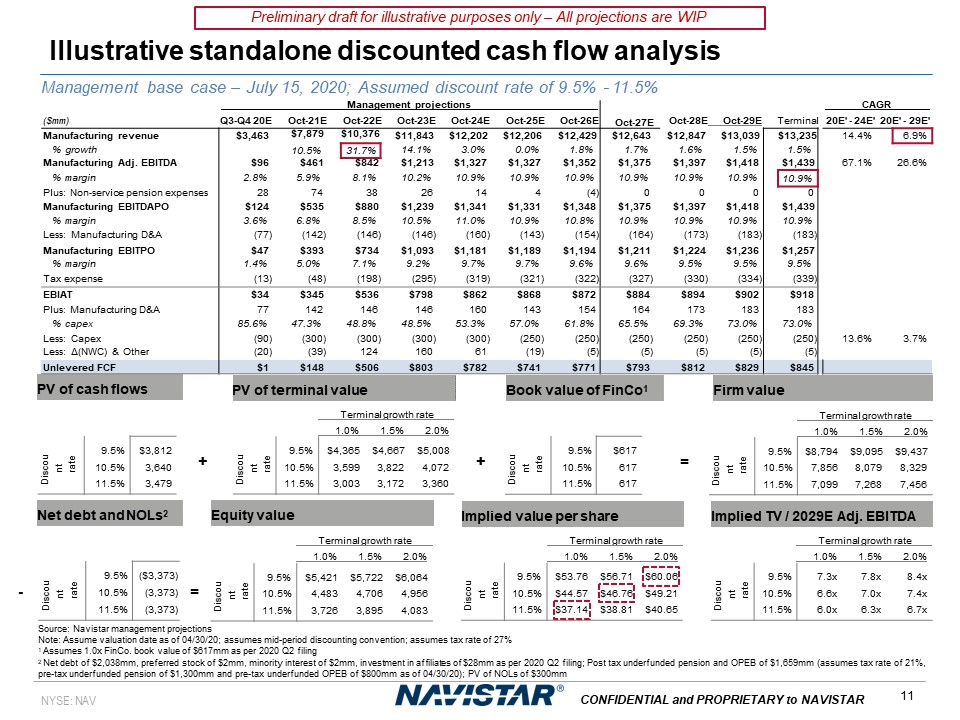
Illustrative standalone discounted cash flow analysis Preliminary draft for illustrative purposes
only – All projections are WIP PV of terminal value PV of cash flows + Firm value Equity value Implied value per share Book value of FinCo1 + Implied TV / 2029E Adj. EBITDA = Terminal growth rate 1.0% 1.5% 2.0%
Discount rate 9.5% $4,365 $4,667 $5,008 10.5% 3,599 3,822 4,072 11.5% 3,003 3,172 3,360 Terminal growth rate 1.0% 1.5% 2.0% Discount
rate 9.5% $8,794 $9,095 $9,437 10.5% 7,856 8,079 8,329 11.5% 7,099 7,268 7,456 Terminal growth rate 1.0% 1.5% 2.0% Discount rate 9.5% $5,421 $5,722 $6,064 10.5% 4,483 4,706 4,956 11.5% 3,726 3,895 4,083
Terminal growth rate 1.0% 1.5% 2.0% Discount rate 9.5% $53.76 $56.71 $60.06 10.5% $44.57 $46.76 $49.21 11.5% $37.14 $38.81 $40.65 Terminal growth rate 1.0% 1.5% 2.0% Discount
rate 9.5% 7.3x 7.8x 8.4x 10.5% 6.6x 7.0x 7.4x 11.5% 6.0x 6.3x 6.7x Discount rate 9.5% $3,812 10.5% 3,640 11.5% 3,479 Discount rate 9.5% $617 10.5% 617 11.5% 617 Net debt and NOLs2 Discount
rate 9.5% ($3,373) 10.5% (3,373) 11.5% (3,373) = - Source: Navistar management projectionsNote: Assume valuation date as of 04/30/20; assumes mid-period discounting convention; assumes tax rate of 27%1 Assumes 1.0x FinCo. book
value of $617mm as per 2020 Q2 filing2 Net debt of $2,038mm, preferred stock of $2mm, minority interest of $2mm, investment in affiliates of $28mm as per 2020 Q2 filing; Post tax underfunded pension and OPEB of $1,659mm (assumes tax rate of
21%, pre-tax underfunded pension of $1,300mm and pre-tax underfunded OPEB of $800mm as of 04/30/20); PV of NOLs of $300mm Management base case – July 15, 2020; Assumed discount rate of 9.5% - 11.5% Management projections ($mm) Q3-Q4 20E
Oct-21E Oct-22E Oct-23E Oct-24E Oct-25E Oct-26E Oct-27E CAGR Oct-28E Oct-29E Terminal 20E' - 24E' 20E' - 29E' Manufacturing
revenue $3,463 $7,879 $10,376 $11,843 $12,202 $12,206 $12,429 $12,643 $12,847 $13,039 $13,235 14.4% 6.9% % growth 10.5% 31.7% 14.1% 3.0% 0.0% 1.8% 1.7% 1.6% 1.5% 1.5% Manufacturing Adj.
EBITDA $96 $461 $842 $1,213 $1,327 $1,327 $1,352 $1,375 $1,397 $1,418 $1,439 67.1% 26.6% % margin 2.8% 5.9% 8.1% 10.2% 10.9% 10.9% 10.9% 10.9% 10.9% 10.9% 10.9% Plus: Non-service pension
expenses 28 74 38 26 14 4 (4) 0 0 0 0 Manufacturing EBITDAPO $124 $535 $880 $1,239 $1,341 $1,331 $1,348 $1,375 $1,397 $1,418 $1,439 %
margin 3.6% 6.8% 8.5% 10.5% 11.0% 10.9% 10.8% 10.9% 10.9% 10.9% 10.9% Less: Manufacturing D&A (77) (142) (146) (146) (160) (143) (154) (164) (173) (183) (183) Manufacturing
EBITPO $47 $393 $734 $1,093 $1,181 $1,189 $1,194 $1,211 $1,224 $1,236 $1,257 % margin 1.4% 5.0% 7.1% 9.2% 9.7% 9.7% 9.6% 9.6% 9.5% 9.5% 9.5% Tax
expense (13) (48) (198) (295) (319) (321) (322) (327) (330) (334) (339) EBIAT $34 $345 $536 $798 $862 $868 $872 $884 $894 $902 $918 Plus: Manufacturing
D&A 77 142 146 146 160 143 154 164 173 183 183 % capex 85.6% 47.3% 48.8% 48.5% 53.3% 57.0% 61.8% 65.5% 69.3% 73.0% 73.0% Less:
Capex (90) (300) (300) (300) (300) (250) (250) (250) (250) (250) (250) 13.6% 3.7% Less: Δ(NWC) & Other (20) (39) 124 160 61 (19) (5) (5) (5) (5) (5) Unlevered
FCF $1 $148 $506 $803 $782 $741 $771 $793 $812 $829 $845 11 NYSE: NAV CONFIDENTIAL and PROPRIETARY to NAVISTAR
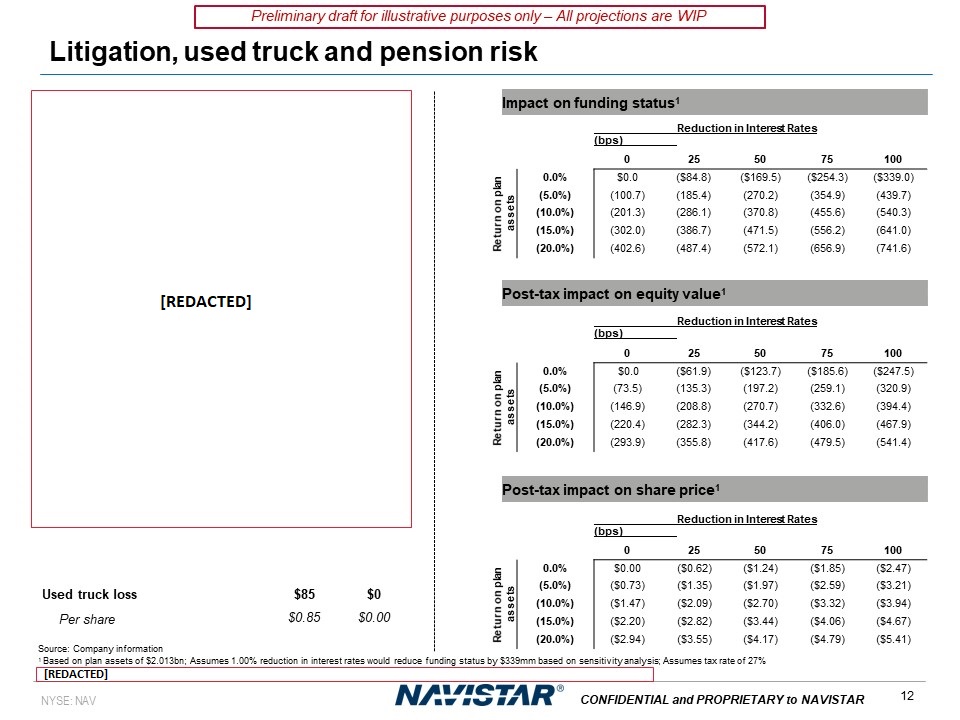
Litigation, used truck and pension risk Reduction in Interest Rates (bps)
0 25 50 75 100 Return on plan
assets 0.0% $0.0 ($84.8) ($169.5) ($254.3) ($339.0) (5.0%) (100.7) (185.4) (270.2) (354.9) (439.7) (10.0%) (201.3) (286.1) (370.8) (455.6) (540.3) (15.0%) (302.0) (386.7) (471.5) (556.2) (641.0) (20.0%) (402.6) (487.4) (572.1) (656.9) (741.6) Impact
on funding status1 Reduction in Interest Rates (bps) 0 25 50 75 100 Return on plan
assets 0.0% $0.0 ($61.9) ($123.7) ($185.6) ($247.5) (5.0%) (73.5) (135.3) (197.2) (259.1) (320.9) (10.0%) (146.9) (208.8) (270.7) (332.6) (394.4) (15.0%) (220.4) (282.3) (344.2) (406.0) (467.9) (20.0%) (293.9) (355.8) (417.6) (479.5) (541.4) Post-tax
impact on equity value1 Reduction in Interest Rates (bps) 0 25 50 75 100 Return on plan
assets 0.0% $0.00 ($0.62) ($1.24) ($1.85) ($2.47) (5.0%) ($0.73) ($1.35) ($1.97) ($2.59) ($3.21) (10.0%) ($1.47) ($2.09) ($2.70) ($3.32) ($3.94) (15.0%) ($2.20) ($2.82) ($3.44) ($4.06) ($4.67) (20.0%) ($2.94) ($3.55) ($4.17) ($4.79) ($5.41) Post-tax
impact on share price1 $85 $0 $0.85 $0.00 Used truck lossPer shareSource: Company information1 Based on plan assets of $2.013bn; Assumes 1.00% reduction in interest rates would reduce funding status by $339mm based on sensitivity
analysis; Assumes tax rate of 27% Preliminary draft for illustrative purposes only – All projections are WIP 12 NYSE: NAV CONFIDENTIAL and PROPRIETARY to NAVISTAR
This document contains highly confidential information and is solely for informational purposes. You
should not rely upon or use it to form the definitive basis for any decision or action whatsoever, with respect to any proposed transaction or otherwise. You and your affiliates and agentsmust hold this document and any oral information
provided in connection with this document, as well as any information derived by you from the information contained herein, in strict confidence and may not communicate, reproduce or disclose it to any other person, or refer to it publicly,
in whole or in part at any time except with our prior written consent. If you are not the intended recipient of this document, please delete and destroy all copies immediately.This document is “as is” and is based, in part, on information
obtained from other sources. Our use of such information does not imply that we have independently verified or necessarily agree with any of such information, and we have assumed and relied upon the accuracy and completeness of such
information for purposes of this document. Neither we nor any of our affiliates or agents, make any representation or warranty, express or implied, in relation to the accuracy or completeness of the information contained in this document or
any oral information provided in connection herewith, or any data it generates and expressly disclaim any and all liability (whether direct or indirect, in contract, tort or otherwise) in relation to any of such information or any errors or
omissions therein. Any views or terms contained herein are preliminary, and are based on financial, economic, market and other conditions prevailing as of the date of this document and are subject to change. We undertake no obligations or
responsibility to update any of the information contained in this document. Past performance does not guarantee or predict future performance.This document does not constitute an offer to sell or the solicitation of an offer to buy any
security, nor does it constitute an offer or commitment to lend, syndicate or arrange a financing, underwrite or purchase or act as an agent or advisor or in any other capacity with respect to any transaction,or commit capital, or to
participate in any trading strategies, and does not constitute legal, regulatory, accounting or tax advice to the recipient. This document does not constitute and should not be considered as any form of financial opinion or recommendation
by us or any of our affiliates. This document is not a research report nor should it be construed as such.This document may include information from the S&P Capital IQ Platform Service. Such information is subject to the following:
“Copyright © 2020, S&P Capital IQ (and its affiliates, as applicable). This may contain information obtained from third parties, including ratings from credit ratings agencies such as Standard & Poor’s. Reproduction and distribution
of third party content in any form is prohibited except with the prior written permission of the related third party. Third party content providers do not guarantee the accuracy, completeness, timeliness or availability of any information,
including ratings, and are not responsible for any errors or omissions (negligent or otherwise), regardless of the cause, or for the results obtained from the use of such content. THIRD PARTY CONTENT PROVIDERS GIVE NO EXPRESS OR IMPLIED
WARRANTIES, INCLUDING, BUT NOT LIMITED TO, ANY WARRANTIES OF MERCHANTABILITY OR FITNESS FOR A PARTICULAR PURPOSE OR USE. THIRD PARTY CONTENT PROVIDERS SHALL NOT BE LIABLE FOR ANY DIRECT, INDIRECT, INCIDENTAL, EXEMPLARY, COMPENSATORY,
PUNITIVE, SPECIAL OR CONSEQUENTIAL DAMAGES, COSTS, EXPENSES, LEGAL FEES, OR LOSSES (INCLUDING LOST INCOME OR PROFITS AND OPPORTUNITY COSTS OR LOSSES CAUSED BY NEGLIGENCE) IN CONNECTION WITH ANY USE OF THEIR CONTENT,INCLUDING RATINGS. Credit
ratings are statements of opinions and are not statements of fact or recommendations to purchase, hold or sell securities. They do not address the suitability of securities or the suitability of securities for investment purposes, and
should not be relied on as investment advice.”This document may include information from SNL Financial LC. Such information is subject to the following: “CONTAINS COPYRIGHTED AND TRADE SECRET MATERIAL DISTRIBUTED UNDER LICENSE FROM SNL. FOR
RECIPIENT’S INTERNAL USE ONLY.”Copyright © 2020, PJT Partners LP (and its affiliates, as applicable). NYSE: NAV CONFIDENTIAL and PROPRIETARY to NAVISTAR
This presentation was prepared exclusively for the benefit and internal use of the J.P. Morgan client
to whom it is directly addressed and delivered (including such client’s subsidiaries, the “Company”) in order to assist the Company in evaluating, on a preliminary basis, the feasibility of a possible transaction or transactions and does
not carry any right of publication or disclosure, in whole or in part, to any other party. This presentation is for discussion purposes only and is incomplete without reference to, and should be viewed solely in conjunction with, the oral
briefing provided by J.P. Morgan. Neither this presentation nor any of its contents may be disclosed or used for any other purpose without the prior written consent of J.P. Morgan.The information in this presentation is based upon any
management forecasts supplied to us and reflects prevailing conditions and our views as of this date, all of which are accordingly subject to change. J.P. Morgan’s opinions and estimates constitute J.P. Morgan’s judgment and should be
regarded as indicative, preliminary and for illustrative purposes only. In preparing this presentation, we have relied upon and assumed, without independent verification, the accuracy and completeness of all information available from
public sources or which was provided to us by or on behalf of the Company or which was otherwise reviewed by us. In addition, our analyses are not and do not purport to be appraisals of the assets, stock, or business of the Company or any
other entity. J.P. Morgan makes no representations as to the actual value which may be received in connection with a transaction nor the legal, tax or accounting effects of consummating a transaction. Unless expressly contemplated hereby,
the information in this presentation does not take into account the effects of a possible transaction or transactions involving an actual or potential change of control, which may have significant valuation and other effects.Notwithstanding
anything herein to the contrary, the Company and each of its employees, representatives or other agents may disclose to any and all persons, without limitation of any kind, the U.S. federal and state income tax treatment and the U.S.
federal and state income tax structure of the transactions contemplated hereby and all materials of any kind (including opinions or other tax analyses) that are provided to the Company relating to such tax treatment and tax structure
insofar as such treatment and/or structure relates to aU.S. federal or state income tax strategy provided to the Company by J.P. Morgan. J.P. Morgan's policies on data privacy can be found at http://www.jpmorgan.com/pages/privacy.J.P.
Morgan is a party to the SEC Research Settlement and as such, is generally not permitted to utilize the firm's research capabilities in pitching for investment banking business. All views contained in this presentation are the views of J.P.
Morgan’s Investment Bank, not the Research Department. J.P. Morgan’s policies prohibit employees from offering, directly or indirectly, a favorable research rating or specific price target, or offering to change a rating or price target, to
a subject company as consideration or inducement for the receipt of business or for compensation. J.P. Morgan also prohibits its research analysts from being compensated for involvement in investment banking transactions except to the
extent that such participation is intended to benefit investors.Changes to Interbank Offered Rates (IBORs) and other benchmark rates: Certain interest rate benchmarks are, or may in the future become, subject to ongoing international,
national and other regulatory guidance, reform and proposals for reform. For more information, please consult: https://www.jpmorgan.com/global/disclosures/interbank_offered_ratesJPMorgan Chase & Co. and its affiliates do not provide tax
advice. Accordingly, any discussion of U.S. tax matters included herein (including any attachments) is not intended or written to be used, and cannot be used, in connection with the promotion, marketing or recommendation by anyone not
affiliated with JPMorgan Chase & Co. of any of the matters addressed herein or for the purpose of avoiding U.S. tax-related penalties.J.P. Morgan is a marketing name for investment businesses of JPMorgan Chase & Co. and its
subsidiaries and affiliates worldwide. Securities, syndicated loan arranging, financial advisory, lending, derivatives and other investment banking and commercial banking activities are performed by a combination of J.P. Morgan Securities
LLC, J.P. Morgan Securities plc, J.P. Morgan AG, JPMorgan Chase Bank, N.A. and the appropriately licensed subsidiaries and affiliates of JPMorgan Chase & Co. worldwide. J.P. Morgan deal team members may be employees of any of the
foregoing entities. J.P. Morgan Securities plc is authorized by the Prudential Regulation Authority and regulated by the Financial Conduct Authority and the Prudential Regulation Authority. J.P. Morgan AG is authorized by the German Federal
Financial Supervisory Authority (BaFin) and regulated by BaFin and the German Central Bank (Deutsche Bundesbank).For information on any J.P. Morgan German legal entity see:
https://www.jpmorgan.com/country/US/en/disclosures/legal-entity-information#germany.For information on any other J.P. Morgan legal entity see: https://www.jpmorgan.com/country/GB/EN/disclosures/investment-bank-legal-entity-disclosures.This
presentation does not constitute a commitment by any J.P. Morgan entity to underwrite, subscribe for or place any securities or to extend or arrange credit or to provide any other services.Copyright 2020 JPMorgan Chase & Co. All rights
reserved. JPMorgan Chase Bank, N.A., organized under the laws of U.S.A. with limited liability. NYSE: NAV CONFIDENTIAL and PROPRIETARY to NAVISTAR