May 2026 Investor Presentation
Safe Harbor Statement This presentation and some of our comments during this
presentation may contain projections or other forward-looking statements regarding future events, our future financial performance, and/or the future performance of the industry. These statements are predictions and contain risks and
uncertainties. We refer you to the risk factors in our Annual Report on Form 10-K for the fiscal year ended October 31, 2025 and other subsequent filings with the Securities and Exchange Commission. These documents contain and identify
important factors that could cause the actual results for the Company to differ materially from those contained in our projections or forward-looking statements. Although we believe that the expectations reflected in the forward-looking
statements are reasonable, we cannot guarantee the accuracy of any forecasts or estimates, and we are not obligated to update any forward-looking statements if our expectations change. 2
Corporate Overview
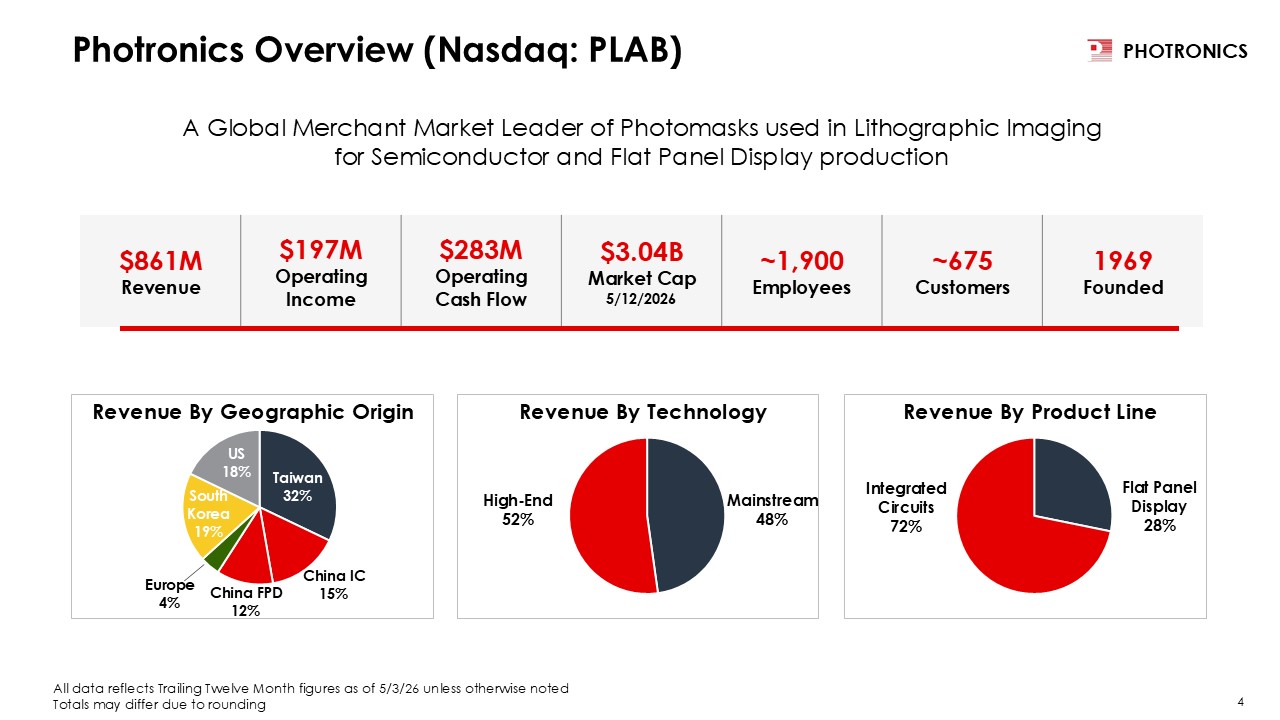
Europe 4% Taiwan 32% South Korea 19% US 18% Photronics Overview (Nasdaq:
PLAB) $861M Revenue $197M Operating Income $283M Operating Cash Flow $3.04B Market Cap 5/12/2026 ~1,900 Employees ~675 Customers 1969 Founded A Global Merchant Market Leader of Photomasks used in Lithographic Imaging for
Semiconductor and Flat Panel Display production Revenue By Geographic Origin Revenue By Technology All data reflects Trailing Twelve Month figures as of 5/3/26 unless otherwise noted Totals may differ due to
rounding 4 Mainstream 48% High-End 52% Revenue By Product Line Flat Panel Display 28% Integrated Circuits 72% China IC 15% China FPD 12%
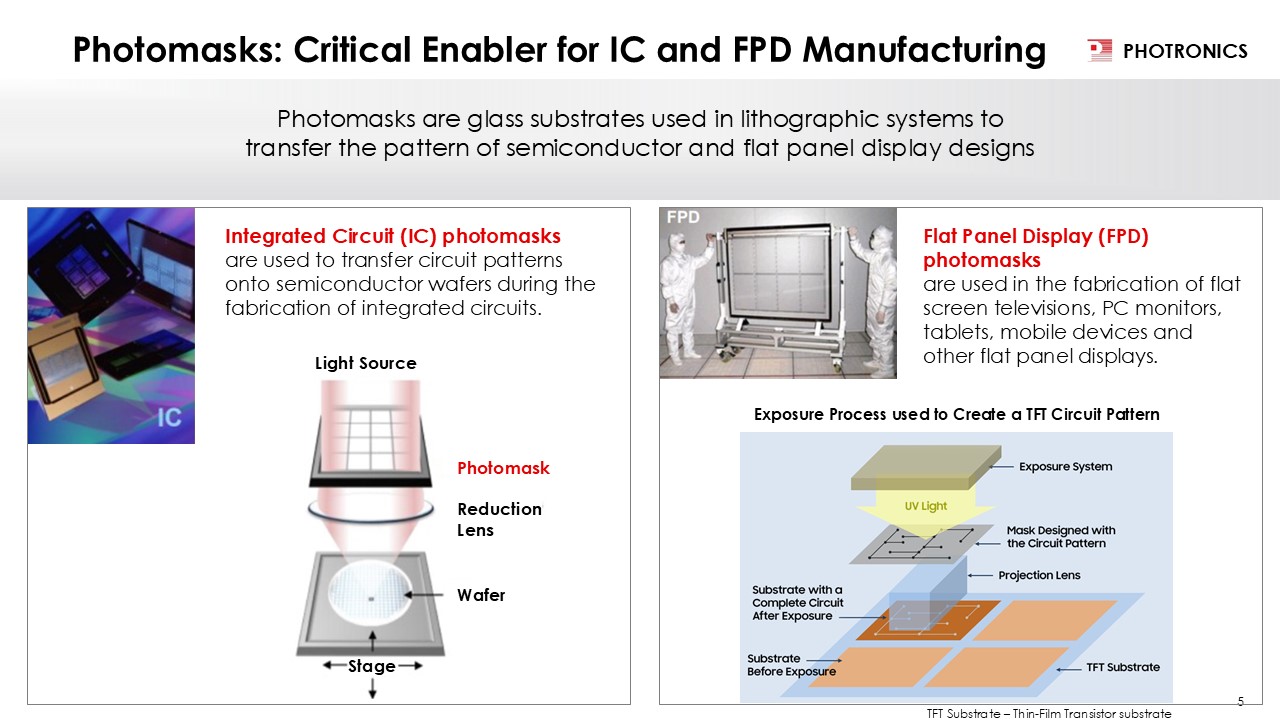
Photomasks: Critical Enabler for IC and FPD Manufacturing Integrated Circuit (IC)
photomasks are used to transfer circuit patterns onto semiconductor wafers during the fabrication of integrated circuits. Photomasks are glass substrates used in lithographic systems to transfer the pattern of semiconductor and flat panel
display designs Light Source Photomask Reduction Lens Wafer Stage 5 Flat Panel Display (FPD) photomasksare used in the fabrication of flat screen televisions, PC monitors, tablets, mobile devices and other flat panel displays. Exposure
Process used to Create a TFT Circuit Pattern TFT Substrate – Thin-Film Transistor substrate
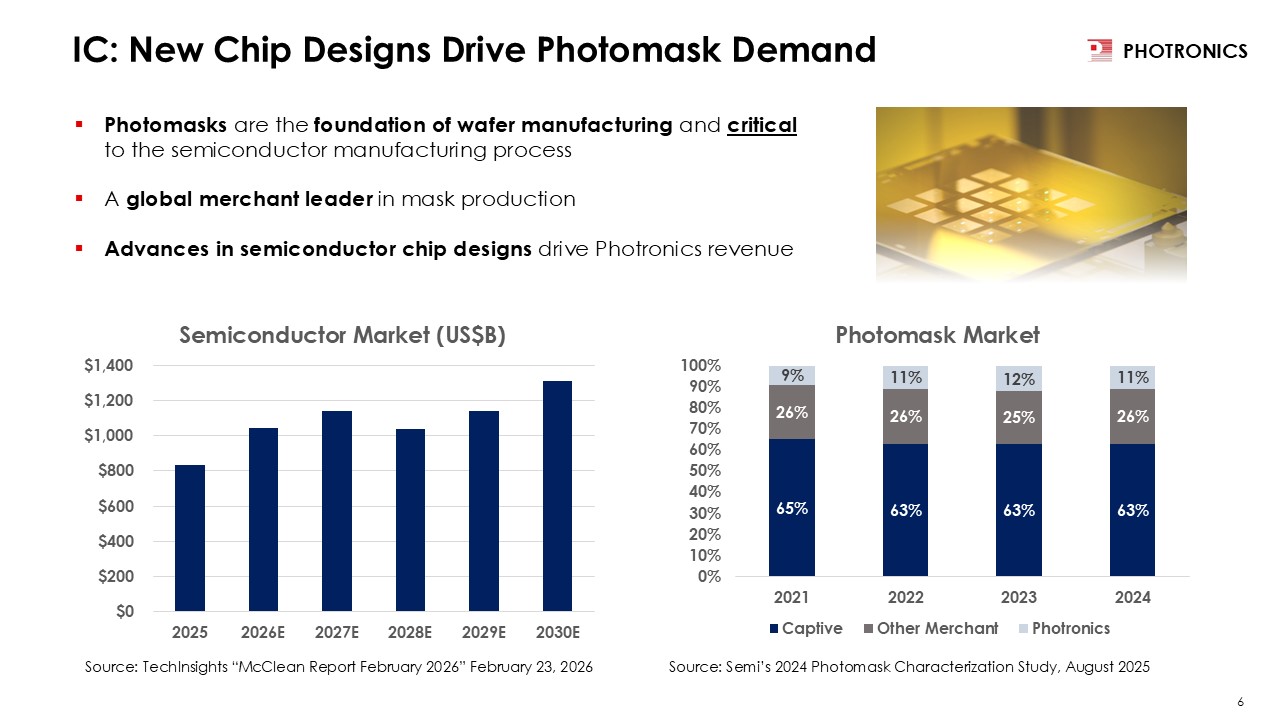
IC: New Chip Designs Drive Photomask Demand Photomasks are the foundation of
wafer manufacturing and critical to the semiconductor manufacturing process A global merchant leader in mask production Advances in semiconductor chip designs drive Photronics revenue 6 Source: Semi’s 2024 Photomask Characterization Study,
August 2025 Source: TechInsights “McClean Report February 2026” February 23, 2026
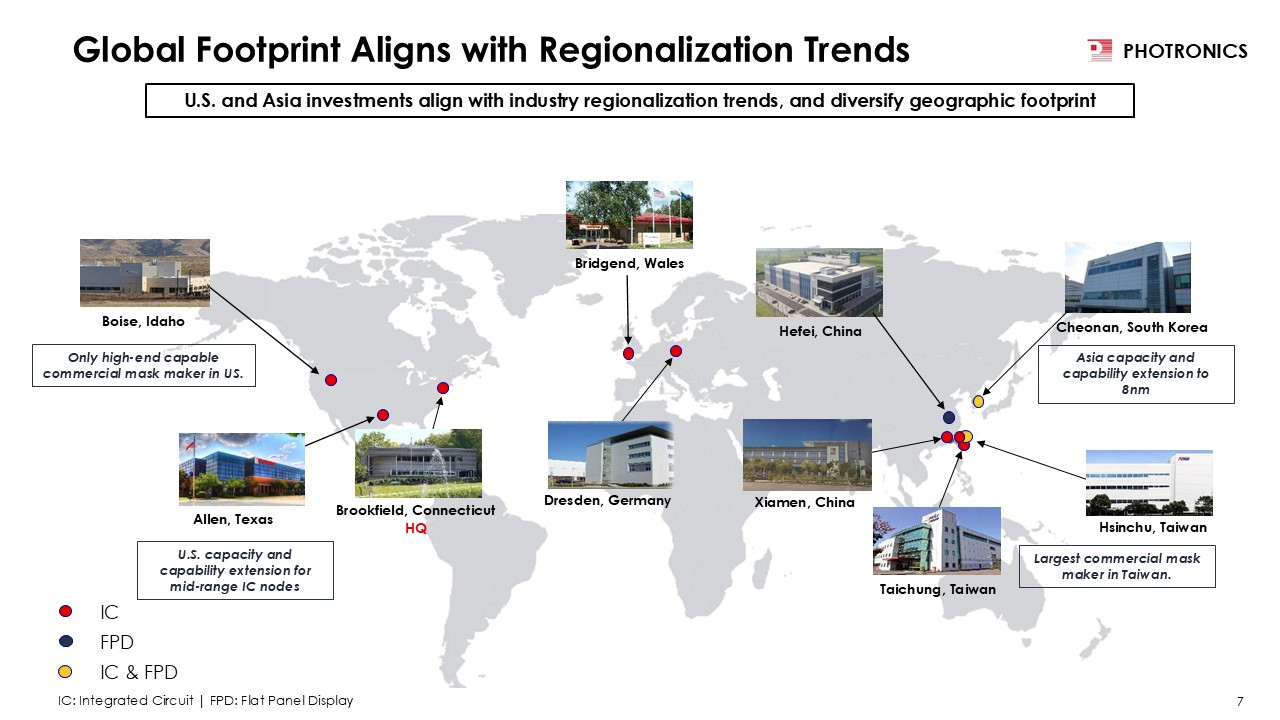
Global Footprint Aligns with Regionalization Trends IC: Integrated Circuit | FPD:
Flat Panel Display 7 Allen, Texas Boise, Idaho Brookfield, Connecticut HQ Bridgend, Wales Cheonan, South Korea Hsinchu, Taiwan Xiamen, China Dresden, Germany Hefei, China Taichung, Taiwan Largest commercial mask maker in Taiwan.
Only high-end capable commercial mask maker in US. IC FPD IC & FPD U.S. and Asia investments align with industry regionalization trends, and diversify geographic footprint U.S. capacity and capability extension for mid-range IC
nodes Asia capacity and capability extension to 8nm
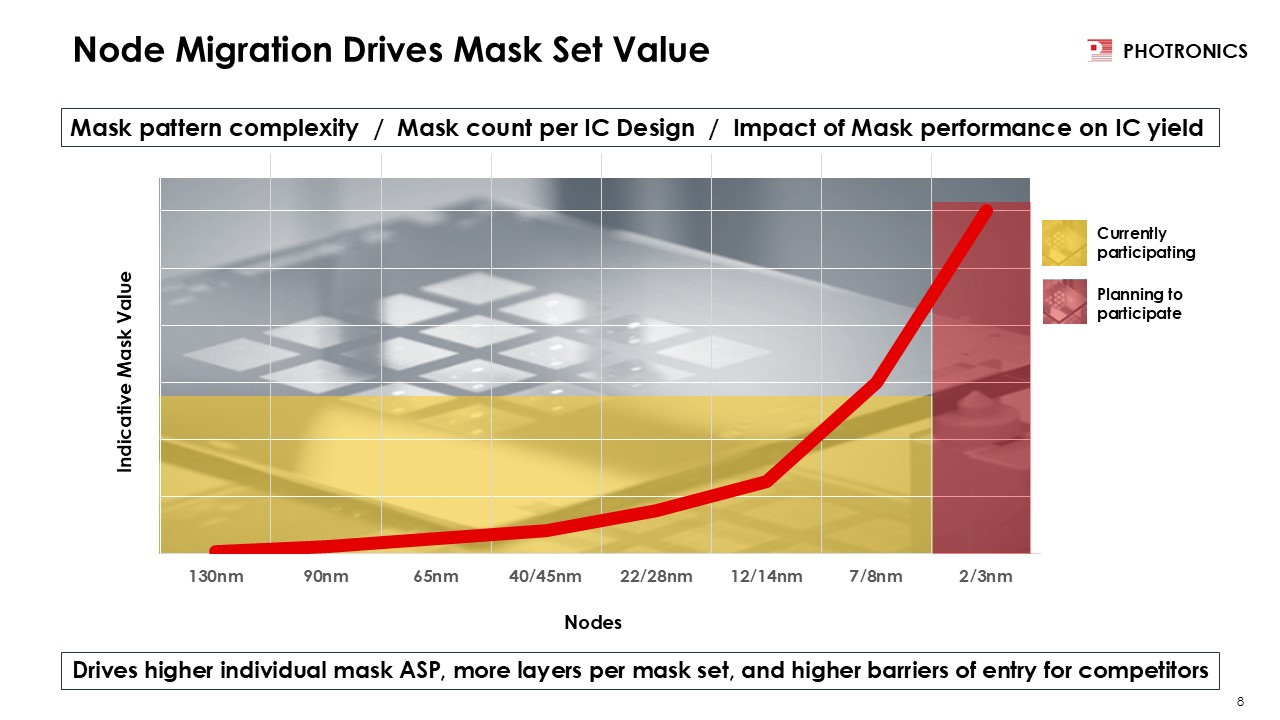
Node Migration Drives Mask Set Value Nodes Indicative Mask Value 8 Mask
pattern complexity / Mask count per IC Design / Impact of Mask performance on IC yield Drives higher individual mask ASP, more layers per mask set, and higher barriers of entry for competitors Currently participating Planning to
participate
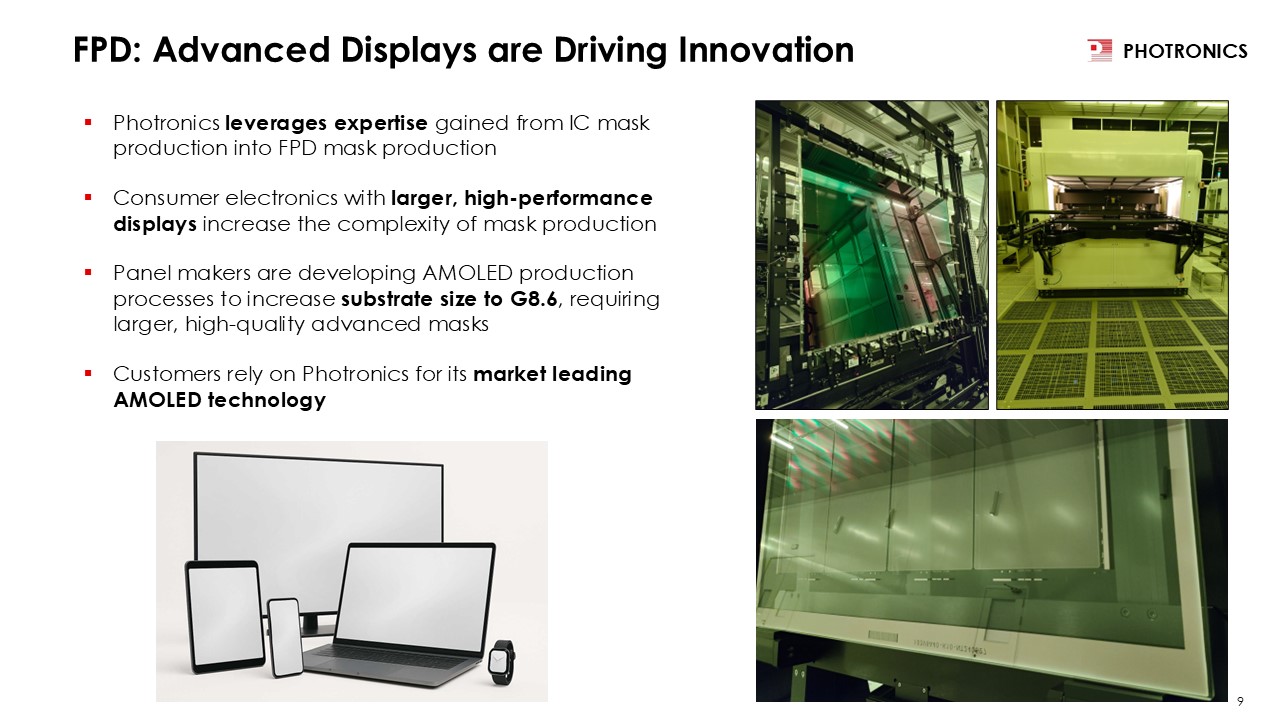
FPD: Advanced Displays are Driving Innovation Photronics leverages expertise
gained from IC mask production into FPD mask production Consumer electronics with larger, high-performance displays increase the complexity of mask production Panel makers are developing AMOLED production processes to increase substrate size
to G8.6, requiring larger, high-quality advanced masks Customers rely on Photronics for its market leading AMOLED technology 9
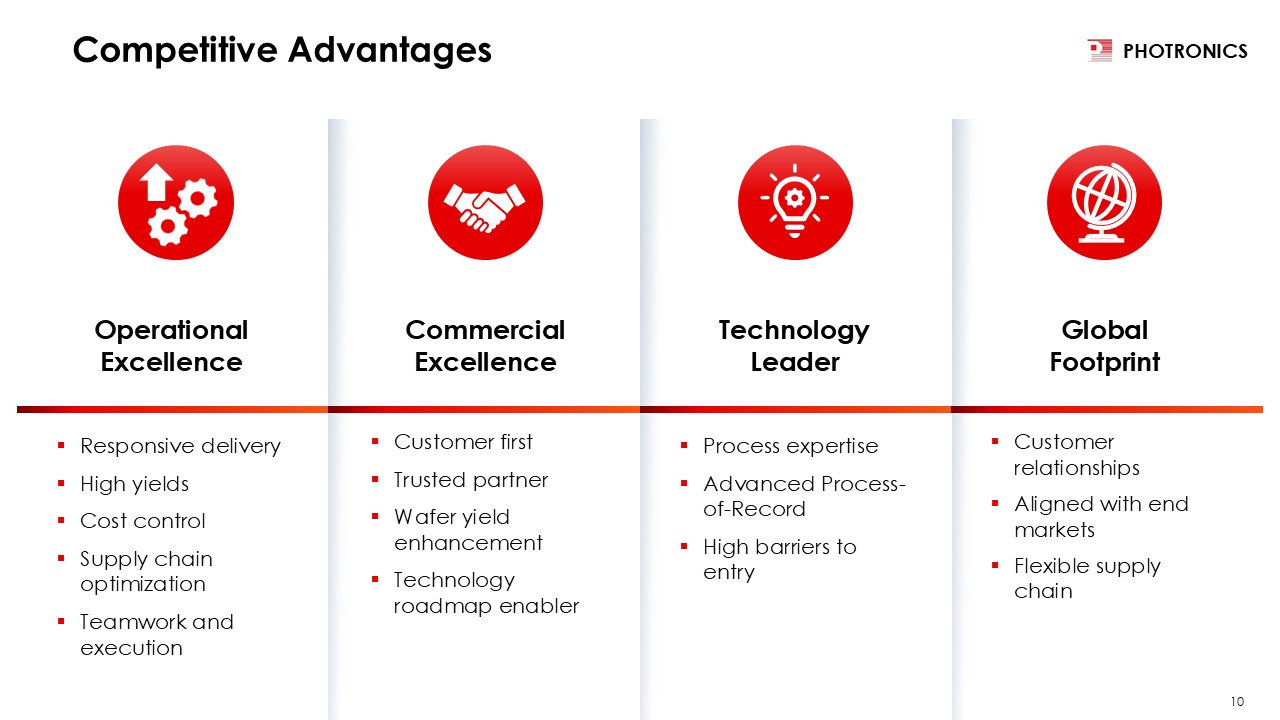
Competitive Advantages Global Footprint Customer relationships Aligned with end
markets Flexible supply chain Technology Leader Process expertise Advanced Process-of-Record High barriers to entry Commercial Excellence Customer first Trusted partner Wafer yield enhancement Technology roadmap enabler Operational
Excellence Responsive delivery High yields Cost control Supply chain optimization Teamwork and execution 10
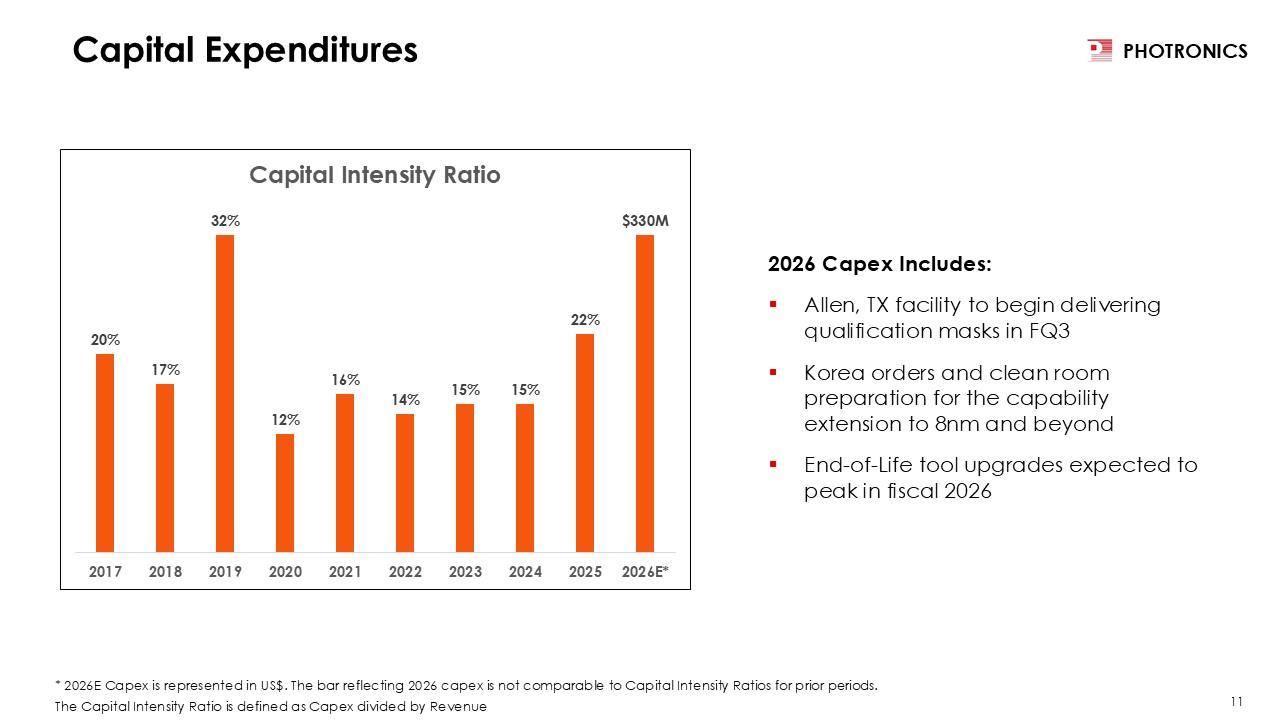
Capital Expenditures * 2026E Capex is represented in US$. The bar reflecting 2026
capex is not comparable to Capital Intensity Ratios for prior periods. The Capital Intensity Ratio is defined as Capex divided by Revenue 11 2026 Capex Includes: Allen, TX facility to begin delivering qualification masks in FQ3 Korea
orders and clean room preparation for the capability extension to 8nm and beyond End-of-Life tool upgrades expected to peak in fiscal 2026
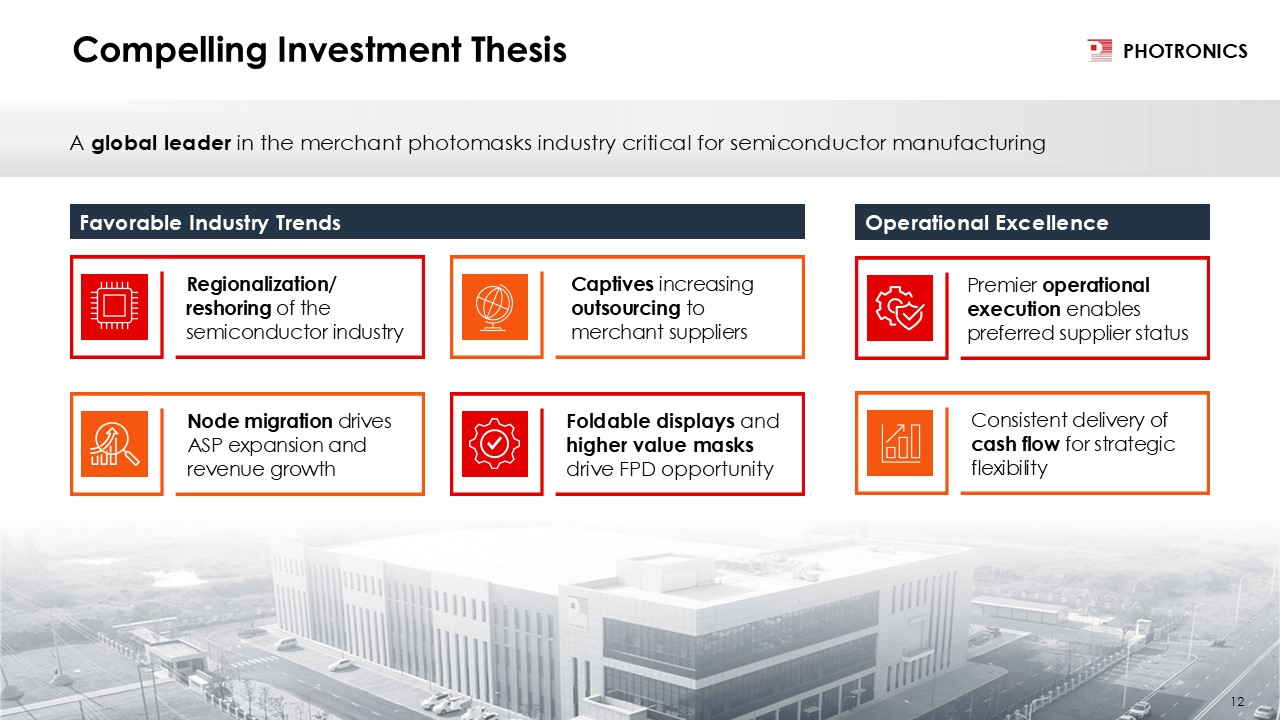
Compelling Investment Thesis A global leader in the merchant photomasks industry
critical for semiconductor manufacturing Favorable Industry Trends 12 Regionalization/ reshoring of the semiconductor industry Captives increasing outsourcing to merchant suppliers Node migration drives ASP expansion and revenue
growth Foldable displays and higher value masks drive FPD opportunity Premier operational execution enables preferred supplier status Consistent delivery of cash flow for strategic flexibility Operational Excellence

Fiscal Q2 2026 Financial Results
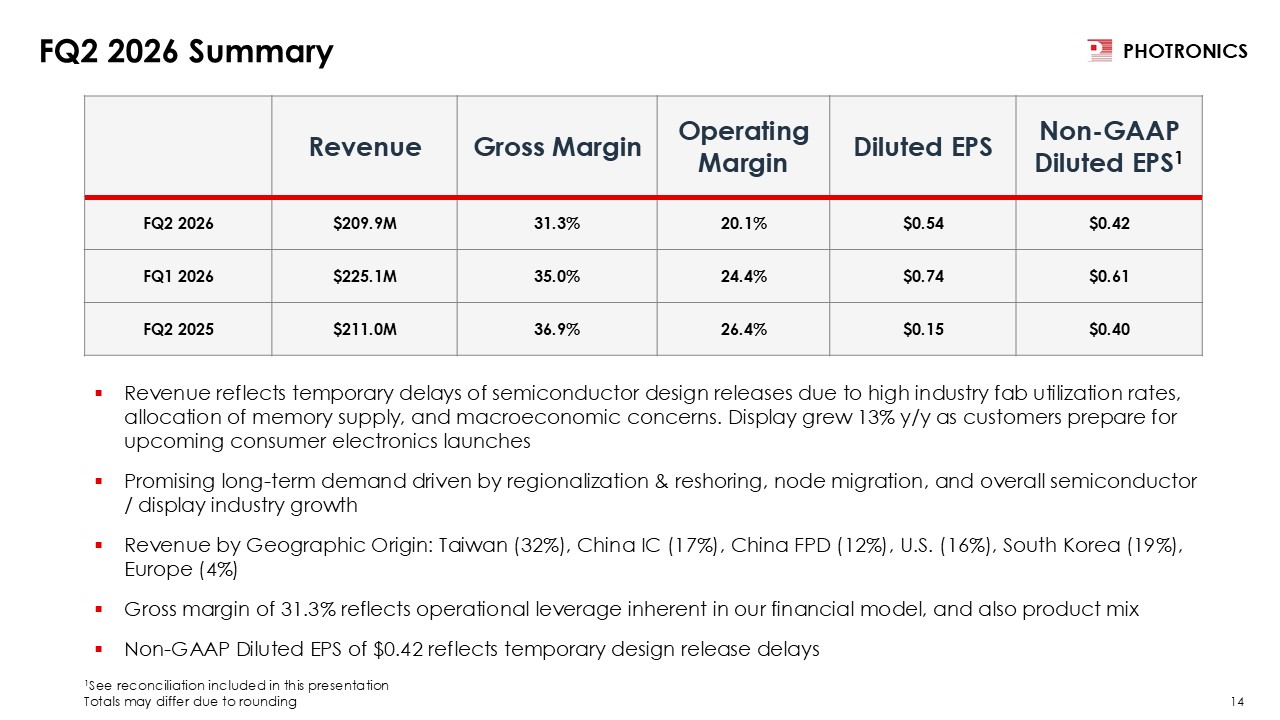
FQ2 2026 Summary Revenue Gross Margin Operating Margin Diluted EPS Non-GAAP
Diluted EPS1 FQ2 2026 $209.9M 31.3% 20.1% $0.54 $0.42 FQ1 2026 $225.1M 35.0% 24.4% $0.74 $0.61 FQ2 2025 $211.0M 36.9% 26.4% $0.15 $0.40 1See reconciliation included in this presentation Totals may differ due to
rounding 14 Revenue reflects temporary delays of semiconductor design releases due to high industry fab utilization rates, allocation of memory supply, and macroeconomic concerns. Display grew 13% y/y as customers prepare for upcoming
consumer electronics launches Promising long-term demand driven by regionalization & reshoring, node migration, and overall semiconductor / display industry growth Revenue by Geographic Origin: Taiwan (32%), China IC (17%), China FPD
(12%), U.S. (16%), South Korea (19%), Europe (4%) Gross margin of 31.3% reflects operational leverage inherent in our financial model, and also product mix Non-GAAP Diluted EPS of $0.42 reflects temporary design release delays
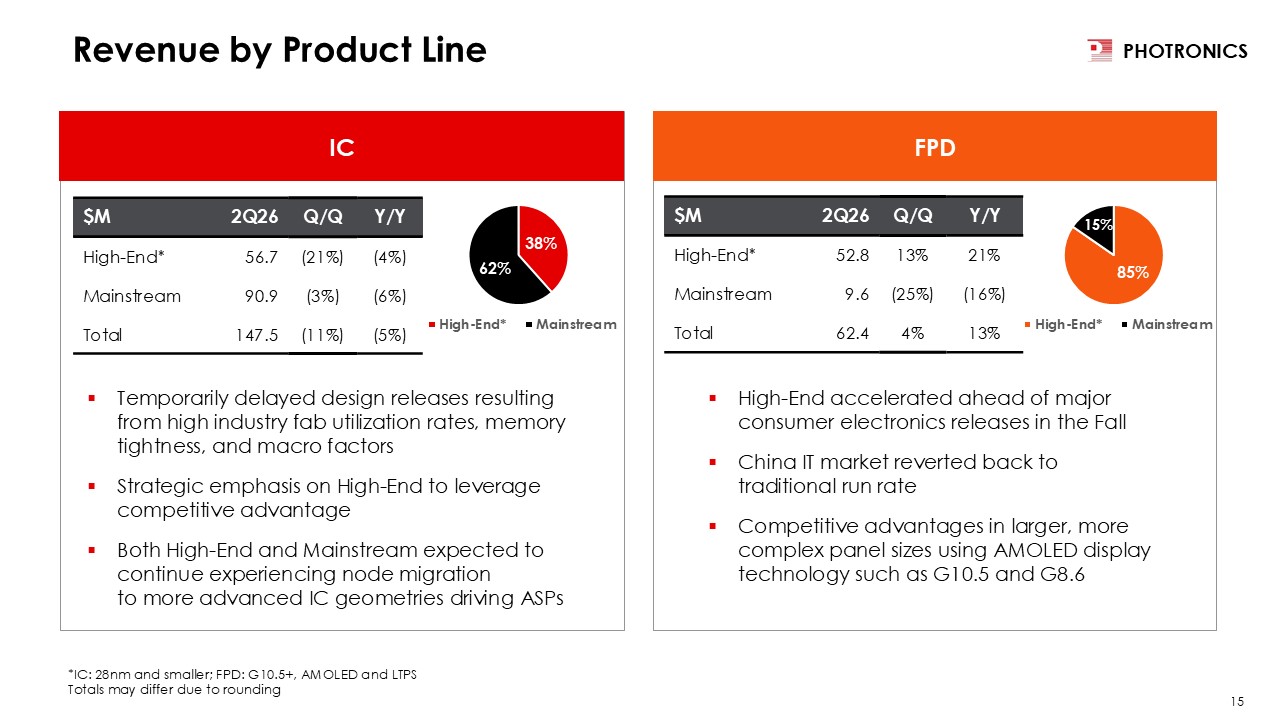
Revenue by Product
Line $M 2Q26 Q/Q Y/Y High-End* 56.7 (21%) (4%) Mainstream 90.9 (3%) (6%) Total 147.5 (11%) (5%) Temporarily delayed design releases resulting from high industry fab utilization rates, memory tightness, and macro
factors Strategic emphasis on High-End to leverage competitive advantage Both High-End and Mainstream expected to continue experiencing node migration to more advanced IC geometries driving ASPs *IC: 28nm and smaller; FPD: G10.5+, AMOLED and
LTPS Totals may differ due to rounding High-End accelerated ahead of major consumer electronics releases in the Fall China IT market reverted back to traditional run rate Competitive advantages in larger, more complex panel sizes using
AMOLED display technology such as G10.5 and G8.6 $M 2Q26 Q/Q Y/Y High-End* 52.8 13% 21% Mainstream 9.6 (25%) (16%) Total 62.4 4% 13% IC FPD 15
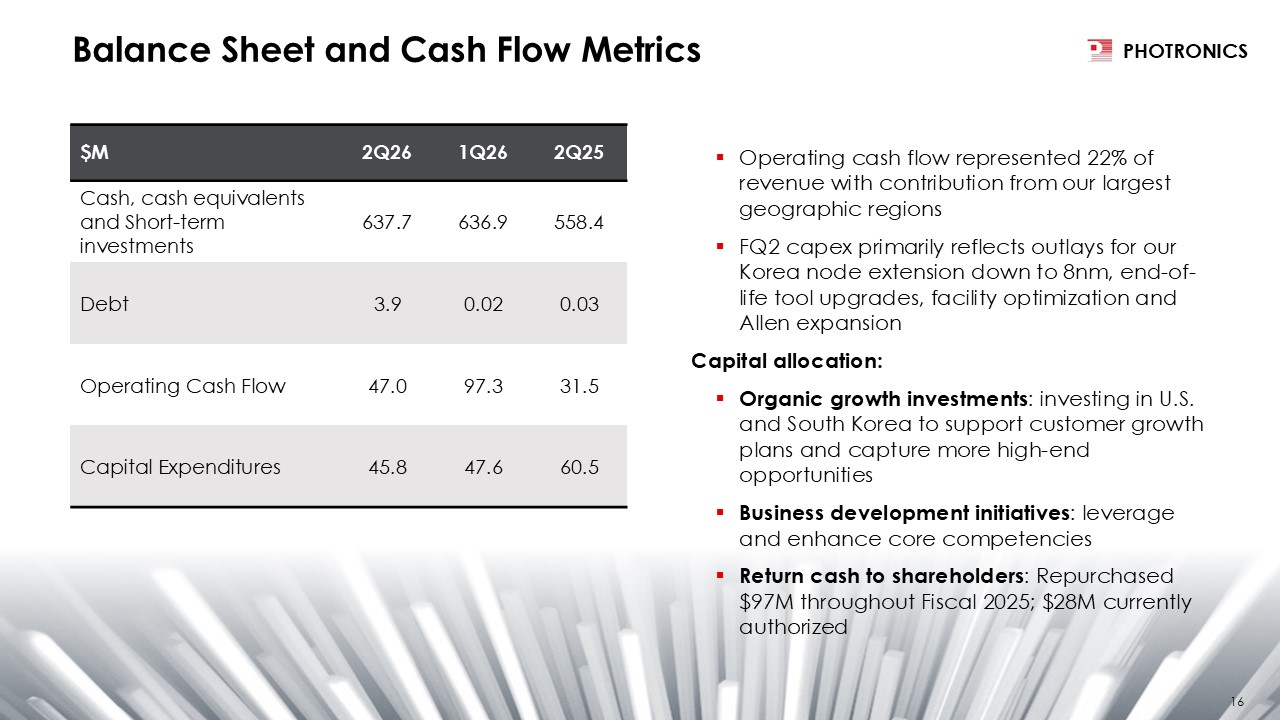
Operating cash flow represented 22% of revenue with contribution from our largest
geographic regions FQ2 capex primarily reflects outlays for our Korea node extension down to 8nm, end-of-life tool upgrades, facility optimization and Allen expansion Capital allocation: Organic growth investments: investing in U.S. and
South Korea to support customer growth plans and capture more high-end opportunities Business development initiatives: leverage and enhance core competencies Return cash to shareholders: Repurchased $97M throughout Fiscal 2025; $28M currently
authorized Balance Sheet and Cash Flow Metrics $M 2Q26 1Q26 2Q25 Cash, cash equivalents and Short-term investments 637.7 636.9 558.4 Debt 3.9 0.02 0.03 Operating Cash Flow 47.0 97.3 31.5 Capital
Expenditures 45.8 47.6 60.5 16
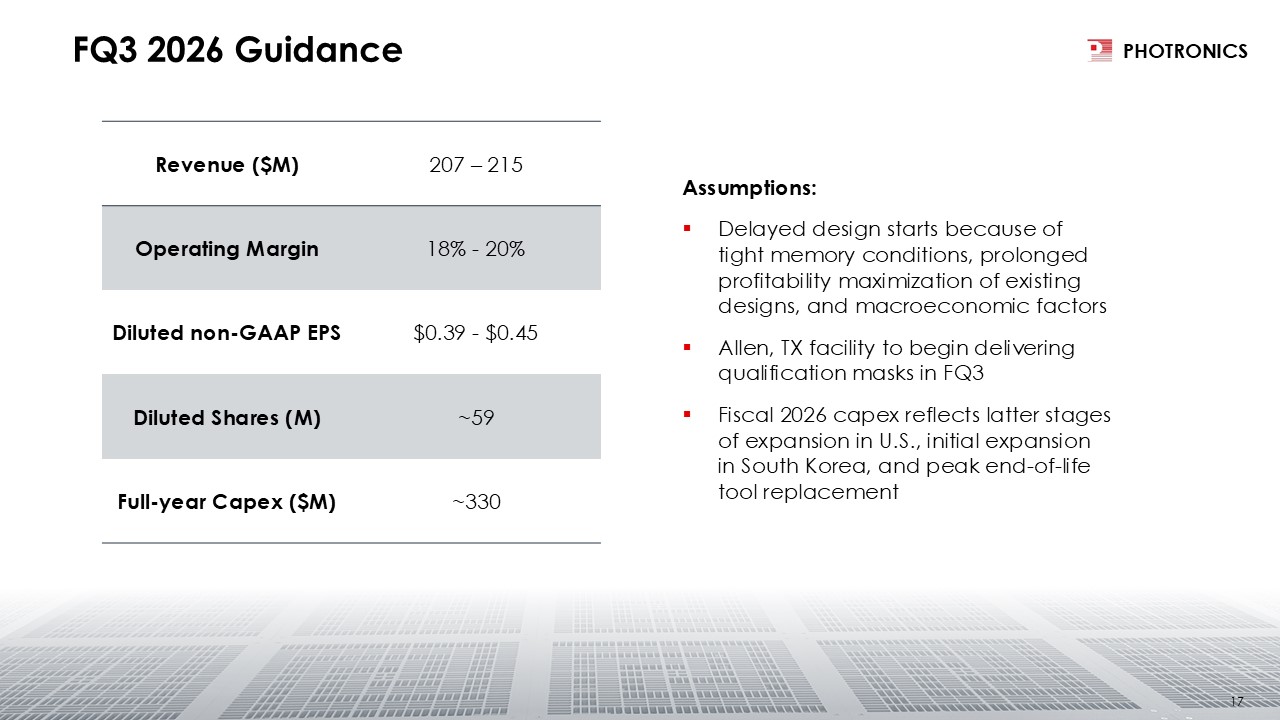
FQ3 2026 Guidance Assumptions: Delayed design starts because of tight memory
conditions, prolonged profitability maximization of existing designs, and macroeconomic factors Allen, TX facility to begin delivering qualification masks in FQ3 Fiscal 2026 capex reflects latter stages of expansion in U.S., initial expansion
in South Korea, and peak end-of-life tool replacement Revenue ($M) 207 – 215 Operating Margin 18% - 20% Diluted non-GAAP EPS $0.39 - $0.45 Diluted Shares (M) ~59 Full-year Capex ($M) ~330 17
Appendix
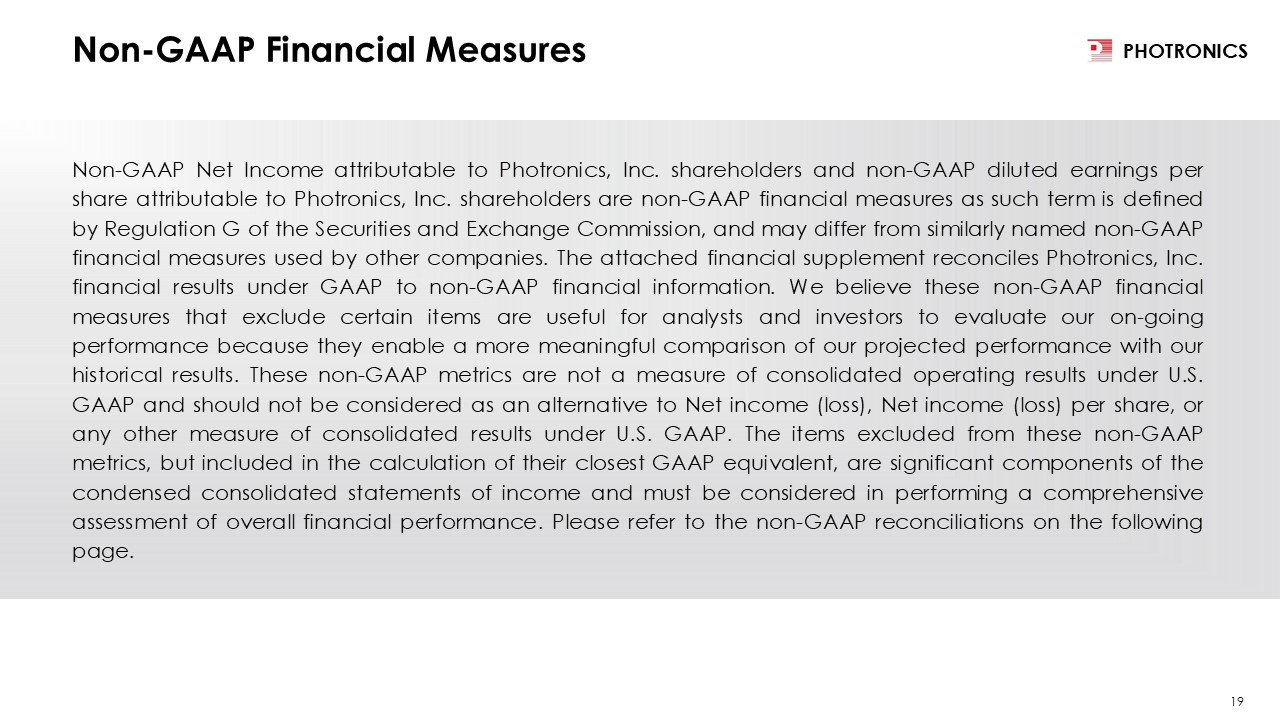
Non-GAAP Financial Measures Non-GAAP Net Income attributable to Photronics, Inc.
shareholders and non-GAAP diluted earnings per share attributable to Photronics, Inc. shareholders are non-GAAP financial measures as such term is defined by Regulation G of the Securities and Exchange Commission, and may differ from similarly
named non-GAAP financial measures used by other companies. The attached financial supplement reconciles Photronics, Inc. financial results under GAAP to non-GAAP financial information. We believe these non-GAAP financial measures that exclude
certain items are useful for analysts and investors to evaluate our on-going performance because they enable a more meaningful comparison of our projected performance with our historical results. These non-GAAP metrics are not a measure of
consolidated operating results under U.S. GAAP and should not be considered as an alternative to Net income (loss), Net income (loss) per share, or any other measure of consolidated results under U.S. GAAP. The items excluded from these
non-GAAP metrics, but included in the calculation of their closest GAAP equivalent, are significant components of the condensed consolidated statements of income and must be considered in performing a comprehensive assessment of overall
financial performance. Please refer to the non-GAAP reconciliations on the following page. 19
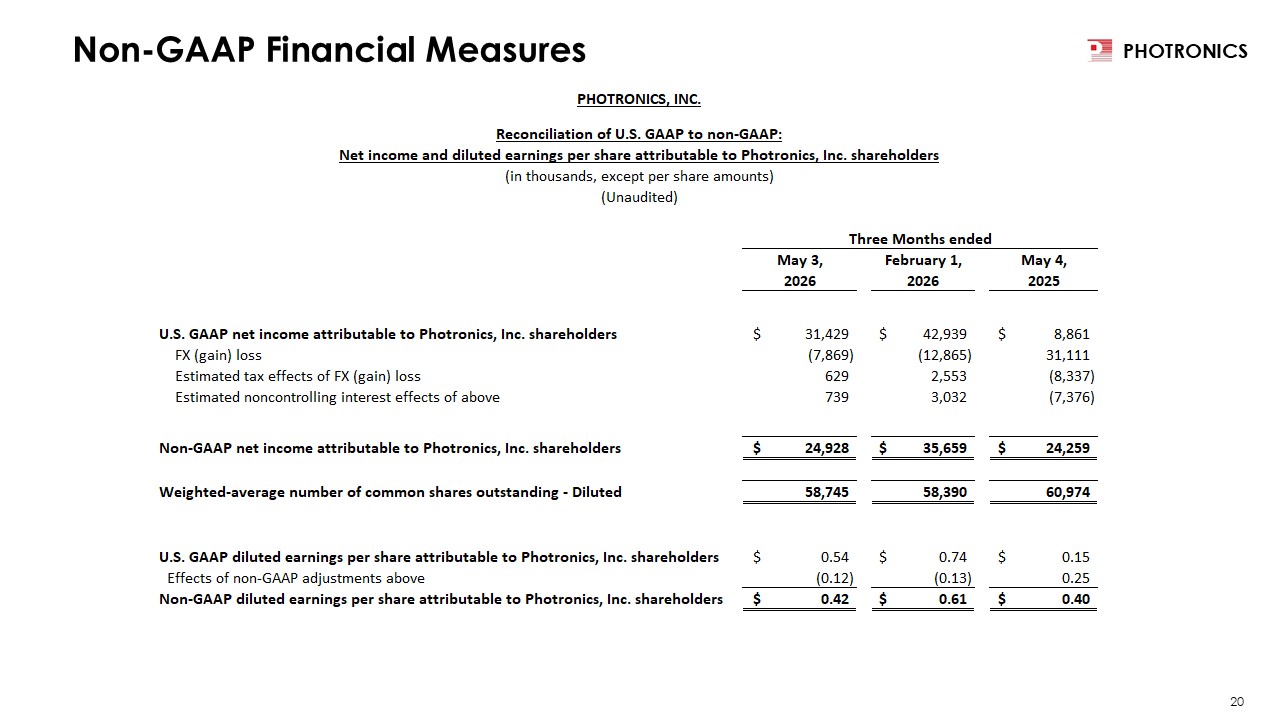
Non-GAAP Financial Measures 20