|
Delaware
|
51-0265872
|
||
|
(State
of Incorporation)
|
(I.R.S.
Employer Identification No.)
|
|
Securities
registered pursuant to Section 12(b) of the Act:
|
Name
of exchange on which registered:
|
|
|
Common
Stock, par value $.01 per share
|
New
York Stock Exchange
|
|
|
Preferred
Stock Purchase Rights
|
New
York Stock Exchange
|
|
PART
I
|
|
|
Item
1.
|
Business
|
|
Item
1A.
|
Risk
Factors
|
|
Item
1B.
|
Unresolved
Staff Comments
|
|
Item
2.
|
Properties
|
|
Item
3.
|
Legal
Proceedings
|
|
Item
4.
|
Submission
of Matters to a Vote of Security Holders
|
|
PART
II
|
|
|
Item
5.
|
Market
for Registrant’s Common Stock, Related Stockholder Matters and Issuer
Purchases of Equity Securities
|
|
Item
6.
|
Selected
Financial Data
|
|
Item
7.
|
Management’s
Discussion and Analysis of Financial Condition and Results of
Operations
|
|
Item
7A.
|
Quantitative
and Qualitative Disclosures About Market Risk
|
|
Item
8.
|
Financial
Statements and Supplementary Data
|
|
Item
9.
|
Changes
in and Disagreements with Accountants on Accounting and Financial
Disclosure
|
|
Item
9A.
|
Controls
and Procedures
|
|
Item
9B.
|
Other
Information
|
|
PART
III
|
|
|
Item
10.
|
Directors,
Executive Officers and Corporate Governance
|
|
Item
11.
|
Executive
Compensation
|
|
Item
12.
|
Security
Ownership of Certain Beneficial Owners and Management and Related
Stockholder Matters
|
|
Item
13.
|
Certain
Relationships and Related Transactions, and Director
Independence
|
|
Item
14.
|
Principal
Accounting Fees and Services
|
|
PART
IV
|
|
|
Item
15.
|
Exhibits
and Financial Statement Schedules
|
|
Business Segments
|
Description of Service
|
Benefits to Client
|
|
Program Management
Services:
|
||
|
Hospital
Rehabilitation Services:
|
||
|
Inpatient
Inpatient
Rehabilitation Facilities:
Skilled
Nursing Units (Subacute Rehabilitation):
|
High
acuity rehabilitation for conditions such as stroke, orthopedic conditions
and head injuries.
Lower
acuity rehabilitation for conditions such as stroke, cancer, heart
failure, burns and wounds.
|
Affords
the client opportunities to retain and expand market share in the
post-acute market by offering specialized clinical rehabilitation services
to patients who might otherwise be discharged to a setting outside the
client’s facility.
|
|
Outpatient
|
Outpatient
therapy programs for hospital-based and satellite programs (primarily
sports and work-related injuries).
|
Helps
bring patients into the client’s facility by providing specialized
clinical programs and helps the client compete with freestanding
clinics.
|
|
Skilled
Nursing Rehabilitation Services:
|
||
|
Contract
Therapy
|
Rehabilitation
services in freestanding
skilled nursing, long-term
care and assisted living
facilities for neurological, orthopedic and other medical
conditions.
|
Affords
the client the ability to fulfill the continuing need for therapists on a
full-time or part-time basis. Offers the client a better opportunity to
improve the quality of their programs.
|
|
Other
|
Resident-centered
consulting services and therapist and nurse staffing services for
healthcare providers.
|
Provides
management advisory services and solutions to healthcare
providers.
|
|
Hospitals:
|
||
|
Long-Term
Acute Care Hospitals (LTACHs)
|
Provide
high-level therapeutic and clinical care to patients with medically
complex diagnoses requiring an average length of stay of 25 days or
more.
|
|
| Rehabilitation Hospitals | Provide intense interdisciplinary rehabilitation services to patients on an inpatient and outpatient basis. | |
|
Program
Management Services
|
||||||||
|
Inpatient
|
||||||||
|
Rehabilitation/
|
Outpatient
|
Contract
|
||||||
|
Skilled
Nursing
|
Therapy
|
Therapy
|
||||||
|
Geographic Region
|
Units
|
Programs
|
Programs
|
Hospitals
|
||||
|
Mountain
Region
|
1/1
|
1
|
66
|
1
|
||||
|
North
Central Region
|
35/1
|
10
|
327
|
7
|
||||
|
Northeast
Region
|
16/1
|
5
|
121
|
2
|
||||
|
South
Central Region
|
32/0
|
6
|
403
|
22
|
||||
|
Southeast
Region
|
14/2
|
7
|
148
|
2
|
||||
|
Western
Region
|
8/4
|
1
|
53
|
0
|
||||
|
Total
|
106/9
|
30
|
1,118
|
34
|
||||
|
|
·
|
Improve Clinical
Quality. Program managers focused on rehabilitation are able to
develop and employ best practices, which benefit client facilities and
their patients.
|
|
|
·
|
Increase Volumes.
Through the addition of specialty services such as IRFs within
acute-care hospitals, patients who were being discharged to other venues
for treatment can now remain in the hospital setting. This allows
hospitals to capture revenues that would otherwise be realized by another
provider. Upon discharge, patients can return for outpatient care,
creating added revenues for the provider. New services also help hospitals
attract new patients. The addition of a managed rehabilitation program
helps skilled nursing facilities attract residents by broadening their
scope of services.
|
|
|
·
|
Optimize Utilization of Space.
Inpatient services help hospitals optimize physical plant space to
treat patients who have specific diagnoses within the particular
hospital’s targeted service lines.
|
|
|
·
|
Increase Cost Control.
Because of their extensive experience in the service line, contract
management companies can offer pricing structures that effectively control
a healthcare provider’s financial risk related to the service provided.
For hospitals and other providers that utilize program managers, the
result is often lower average cost than that of self-managed programs. As
a result, the facility is able to increase its revenues without having to
increase administrative staff or incur other fixed
costs.
|
|
|
·
|
Establish Agreements with
Managed Care Organizations. Program managers often have the ability
to improve clinical care by capturing and analyzing patient information
from a large number of inpatient rehabilitation and skilled nursing units,
which an individual hospital could not do on its own without a substantial
investment in specialized systems. Becoming part of a managed care network
helps the hospital attract physicians, and in turn, attract more patients
to the hospital.
|
|
|
·
|
Provide Access to
Capital. Contract management companies, particularly
those which have access to public markets, can in certain circumstances
make capital available to their clients for adding programs and services
like physical rehabilitative services or expanding existing programs when
community needs dictate.
|
|
|
·
|
Obtain Reimbursement Advice.
Contract management companies, like RehabCare, employ reimbursement
specialists who are available to assist client facilities in interpreting
complicated regulations within a given specialty — a highly valued service
in the changing healthcare
environment.
|
|
|
·
|
Obtain Clinical Resources and
Expertise. Rehabilitation service providers have the ability to
develop and implement clinical training and development programs that can
provide best practices for clients.
|
|
|
·
|
Ensure Appropriate Levels of
Staffing for Rehabilitation Professionals. Therapy staffing in both
hospitals and skilled nursing settings presents unique challenges that can
be better managed by a provider with a national recruiting presence.
Program managers have the ability to more sharply focus on staffing levels
in order to address the fluctuating clinical needs of the host
facility.
|
| ITEM 1A. | RISK FACTORS |
|
·
|
facility
and professional licensure;
|
|
·
|
conduct
of operations;
|
|
·
|
certain
clinical procedures;
|
|
·
|
addition
of facilities and services, including certificates of
need;
|
|
·
|
coding
and billing for services; and
|
|
·
|
payment
for services.
|
|
·
|
difficulties
integrating acquired personnel and distinct cultures into our
business;
|
|
·
|
disagreements
with our joint ownership partners;
|
|
·
|
incomplete
due diligence or misunderstanding as to the target company’s future
prospects;
|
|
·
|
diversion
of management attention and capital resources from existing
operations;
|
|
·
|
short-term
(or longer lasting) dilution in the value of our
shares;
|
|
·
|
over-paying
for an acquired company or joint ownership entity due to incorrect
analysis or because of competition from other companies for the same
target;
|
|
·
|
inability
to achieve forecasted revenues, cost savings or other
synergies;
|
|
·
|
potential
loss of key employees, customers or relationships;
and
|
|
·
|
assumption
of liabilities and exposure to unforeseen liabilities of acquired or joint
ownership companies, including liabilities for failure to comply with
healthcare regulations.
|
|
·
|
result
in our inability to comply with the financial and other restrictive
covenants in our credit facilities;
|
|
·
|
increase
our vulnerability to adverse industry and general economic
conditions;
|
|
·
|
require
us to dedicate a substantial portion of our cash flow from operations to
make payments on our debt, thereby reducing the availability of our cash
flow for working capital, capital investments and other business
activities;
|
|
·
|
limit
our ability to obtain additional financing to fund future working capital,
capital investments and other business
activities;
|
|
·
|
limit
our ability to refinance our indebtedness on terms that are commercially
reasonable, or at all;
|
|
·
|
expose
us to the risk of interest rate fluctuations to the extent we pay interest
at variable rates on the debt;
|
|
·
|
limit
our flexibility to plan for, and react to, changes in our business and our
industry; and
|
|
·
|
place
us at a competitive disadvantage relative to our less leveraged
competitors.
|
|
·
|
incur
or guarantee additional debt or issue certain preferred
stock;
|
|
·
|
pay
dividends or make distributions on our capital stock or certain
subordinated debt or redeem, repurchase or retire our capital stock or
certain subordinated debt;
|
|
·
|
make
certain investments;
|
|
·
|
create
liens on our or our subsidiaries’
assets;
|
|
·
|
make
distributions from our joint
ventures;
|
|
·
|
enter
into transactions with affiliates;
|
|
·
|
merge
or consolidate with another person or sell or otherwise dispose of all or
substantially all of our assets;
|
|
·
|
enter
into sales leaseback transactions;
|
|
·
|
sell
assets, including capital stock of our
subsidiaries;
|
|
·
|
alter
the business that we conduct; and
|
|
·
|
change
our fiscal year.
|
| ITEM 1B. | UNRESOLVED STAFF COMMENTS |
| ITEM 2. | PROPERTIES |
| ITEM 3. | LEGAL PROCEEDINGS |
| ITEM 4. | SUBMISSION OF MATTERS TO A VOTE OF SECURITY HOLDERS |
|
|
ITEM
5.
|
MARKET
FOR THE REGISTRANT’S COMMON STOCK, RELATED STOCKHOLDER MATTERS AND ISSUER
PURCHASES OF EQUITY SECURITIES
|
|
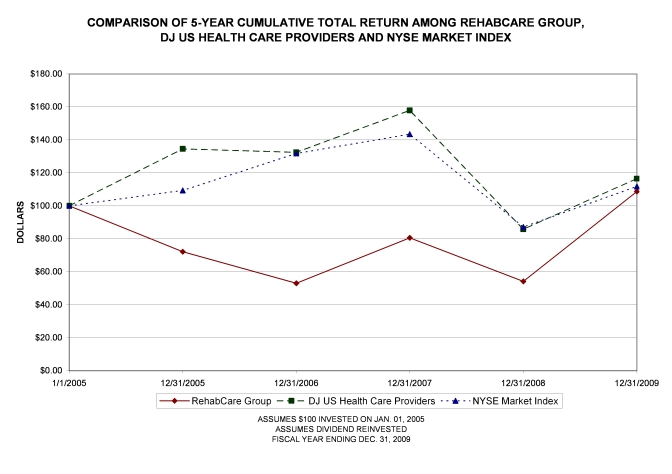
1/1/2005
|
12/31/2005
|
12/31/2006
|
12/31/2007
|
12/31/2008
|
12/31/2009
|
||||||
|
RehabCare
Group
|
$100.00
|
$72.17
|
$53.05
|
$80.60
|
$54.16
|
$108.72
|
|||||
|
Health
Care Providers
|
$100.00
|
$134.55
|
$132.44
|
$157.86
|
$85.76
|
$116.49
|
|||||
|
NYSE
Market Index
|
$100.00
|
$109.36
|
$131.75
|
$143.43
|
$87.12
|
$111.76
|
|
Calendar
Quarter
|
1st
|
2nd
|
3rd
|
4th
|
|
|
2009
|
High
|
$18.75
|
$23.93
|
$25.65
|
$31.29
|
|
Low
|
12.45
|
16.04
|
20.63
|
18.75
|
|
|
2008
|
High
|
$26.07
|
$17.41
|
$20.23
|
$18.09
|
|
Low
|
14.00
|
13.75
|
14.99
|
10.45
|
|
| ITEM 6. | SELECTED FINANCIAL DATA |
|
SIX-YEAR
FINANCIAL SUMMARY
|
|||||||||||||||||||||||
|
Dollars
in thousands, except per share data
|
|||||||||||||||||||||||
|
(Year
ended December 31,)
|
2009
|
2008
|
2007
|
2006
|
2005
|
2004
|
|||||||||||||||||
|
Consolidated
statement of earnings data:
|
|||||||||||||||||||||||
|
Operating
revenues
|
$
|
869,427
|
$
|
735,412
|
$
|
693,013
|
$
|
601,807
|
$
|
443,731
|
$
|
378,797
|
|||||||||||
|
Operating
earnings
|
44,474
|
32,907
|
27,530
|
21,551
|
32,610
|
41,311
|
|||||||||||||||||
|
Amounts
attributable to RehabCare: (2)
|
|||||||||||||||||||||||
|
Earnings (loss) from continuing
operations
|
$
|
23,794
|
$
|
19,568
|
$
|
13,041
|
$
|
7,594
|
$
|
(17,373)
|
$
|
22,893
|
|||||||||||
|
Basic EPS from continuing
operations
|
$
|
1.29
|
$
|
1.11
|
$
|
0.76
|
$
|
0.45
|
$
|
(1.04)
|
$
|
1.41
|
|||||||||||
|
Diluted EPS from continuing
operations
|
$
|
1.26
|
$
|
1.10
|
$
|
0.75
|
$
|
0.44
|
$
|
(1.04)
|
$
|
1.36
|
|||||||||||
|
Weighted
average shares outstanding (000s):
|
|||||||||||||||||||||||
|
Basic
|
18,481
|
17,583
|
17,226
|
17,008
|
16,751
|
16,292
|
|||||||||||||||||
|
Diluted
|
18,862
|
17,798
|
17,459
|
17,243
|
16,751
|
16,835
|
|||||||||||||||||
|
Consolidated
balance sheet data:
|
|||||||||||||||||||||||
|
Working
capital
|
$
|
113,296
|
$
|
97,284
|
$
|
80,285
|
$
|
85,982
|
$
|
60,664
|
$
|
76,451
|
|||||||||||
|
Total
assets
|
1,109,980
|
438,406
|
408,560
|
428,296
|
272,925
|
277,666
|
|||||||||||||||||
|
Total
liabilities
|
650,360
|
160,606
|
163,271
|
217,431
|
74,677
|
70,638
|
|||||||||||||||||
|
Total
equity
|
459,620
|
277,800
|
245,289
|
210,865
|
198,248
|
207,028
|
|||||||||||||||||
|
Financial
statistics:
|
|||||||||||||||||||||||
|
Operating
margin
|
5.1%
|
4.5%
|
4.0%
|
3.6%
|
7.3%
|
10.9%
|
|||||||||||||||||
|
Net
margin (2)
|
2.7%
|
2.7%
|
1.9%
|
1.3%
|
(3.9)%
|
6.0%
|
|||||||||||||||||
|
Current
ratio
|
1.7:1
|
2.1:1
|
1.9:1
|
1.9:1
|
1.9:1
|
2.3:1
|
|||||||||||||||||
|
Diluted
EPS growth rate (2)
|
14.5%
|
46.7%
|
70.5%
|
142.3%
|
(176.5)%
|
258.1%
|
|||||||||||||||||
|
Return
on equity (1)
(2)
|
6.5%
|
7.5%
|
5.7%
|
3.7%
|
(8.6)%
|
11.9%
|
|||||||||||||||||
|
Operating
statistics:
|
|||||||||||||||||||||||
|
Hospitals:
|
|||||||||||||||||||||||
|
Number of hospitals at end of
year (3)
|
34
|
11
|
8
|
7
|
5
|
N/A
|
|||||||||||||||||
|
Number of patient discharges
(3)
|
8,369
|
6,019
|
5,070
|
3,595
|
1,110
|
N/A
|
|||||||||||||||||
|
Program
management:
|
|||||||||||||||||||||||
|
Inpatient
units:
|
|||||||||||||||||||||||
|
Average number of
programs
|
121
|
122
|
127
|
137
|
145
|
142
|
|||||||||||||||||
|
Average admissions per
program
|
393
|
377
|
363
|
360
|
372
|
383
|
|||||||||||||||||
|
Outpatient
programs:
|
|||||||||||||||||||||||
|
Average number of
locations
|
35
|
33
|
35
|
41
|
42
|
42
|
|||||||||||||||||
|
Patient visits
(000s)
|
1,264
|
983
|
1,006
|
1,130
|
1,146
|
1,133
|
|||||||||||||||||
|
Contract
therapy:
|
|||||||||||||||||||||||
|
Average number of locations
(4)
|
1,088
|
1,066
|
1,125
|
1,018
|
749
|
588
|
|
(1)
|
Based
on average of beginning and ending
equity.
|
|
(2)
|
The
results for 2005 include after tax losses on our equity investment in
InteliStaf Holdings, Inc. of $36.5 million or $2.18 per diluted
share.
|
|
(3)
|
We
entered the freestanding hospitals business on August 1, 2005 with the
acquisition of substantially all of the operating assets of MeadowBrook
Healthcare, Inc. Effective November 24, 2009, we acquired
Triumph HealthCare Holdings, Inc., which added 20 long-term acute care
hospitals to our portfolio of
hospitals.
|
|
(4)
|
Effective
July 1, 2006, we acquired Symphony Health Services, LLC and its RehabWorks
business, which added 470 contract therapy
locations.
|
|
|
ITEM
7.
|
MANAGEMENT’S
DISCUSSION AND ANALYSIS OF FINANCIAL CONDITION AND RESULTS OF
OPERATIONS
|
|
Year
Ended December 31,
|
|||||||||
|
2009
|
2008
|
2007
|
|||||||
|
(in
thousands)
|
|||||||||
|
Revenues:
|
|||||||||
|
Program
management:
|
|||||||||
|
Skilled
nursing rehabilitation services
|
$
|
496,250
|
$
|
457,229
|
$
|
432,910
|
|||
|
Hospital
rehabilitation services
|
178,168
|
165,658
|
164,102
|
||||||
|
Program
management total
|
674,418
|
622,887
|
597,012
|
||||||
|
Hospitals
|
195,009
|
112,525
|
96,001
|
||||||
|
Total
|
$
|
869,427
|
$
|
735,412
|
$
|
693,013
|
|||
|
Operating
Earnings (Loss):
|
|||||||||
|
Program
management:
|
|||||||||
|
Skilled
nursing rehabilitation services
|
$
|
37,753
|
$
|
25,544
|
$
|
7,249
|
|||
|
Hospital
rehabilitation services
|
29,487
|
21,997
|
22,893
|
||||||
|
Program management
total
|
67,240
|
47,541
|
30,142
|
||||||
|
Hospitals
(1)
|
(22,512
|
)
|
(13,903
|
)
|
(1,972
|
)
|
|||
|
Unallocated
corporate expenses (2)
|
(254
|
)
|
(731
|
)
|
(640
|
)
|
|||
|
Total
|
$
|
44,474
|
$
|
32,907
|
$
|
27,530
|
|||
|
|
(1)
|
The
2009 operating earnings of hospitals include $7.2 million of
acquisition-related expenses for costs directly related to the acquisition
of Triumph including fees for legal, accounting, advisory and other
outside services. The 2007 operating earnings of hospitals
include a $4.9 million impairment loss on a separately identifiable
intangible asset. See Note 7 to the consolidated financial
statements for additional
information.
|
|
|
(2)
|
Represents
general corporate overhead costs associated with Phase 2 Consulting, Inc.,
which was sold on June 1, 2009.
|
|
Year
Ended December 31,
|
|||||||||
|
2009
|
2008
|
2007
|
|||||||
|
Medicare
|
68.8
|
%
|
74.2
|
%
|
77.8
|
%
|
|||
|
Medicaid
|
2.0
|
0.8
|
0.6
|
||||||
|
Other
third party payors
|
27.4
|
22.5
|
19.1
|
||||||
|
Self-pay
|
0.1
|
0.4
|
0.5
|
||||||
|
Total
net patient revenue
|
98.3
|
97.9
|
98.0
|
||||||
|
Other
revenue
|
1.7
|
2.1
|
2.0
|
||||||
|
100.0
|
%
|
100.0
|
%
|
100.0
|
%
|
||||
|
Year
Ended December 31,
|
|||||||||
|
2009
|
2008
|
2007
|
|||||||
|
Operating
revenues
|
100.0
|
%
|
100.0
|
%
|
100.0
|
%
|
|||
|
Cost
and expenses:
|
|||||||||
|
Operating
|
81.0
|
81.3
|
81.0
|
||||||
|
Selling,
general and administrative
|
12.0
|
12.2
|
11.9
|
||||||
|
Impairment
of assets
|
—
|
—
|
0.7
|
||||||
|
Depreciation
and amortization
|
1.9
|
2.0
|
2.4
|
||||||
|
Operating
earnings
|
5.1
|
4.5
|
4.0
|
||||||
|
Interest
income
|
—
|
—
|
0.1
|
||||||
|
Interest
expense
|
(0.6
|
)
|
(0.5
|
)
|
(1.2
|
)
|
|||
|
Equity
in net income of affiliate
|
—
|
—
|
—
|
||||||
|
Earnings
from continuing operations before income taxes
|
4.5
|
4.0
|
2.9
|
||||||
|
Income
taxes
|
2.0
|
1.6
|
1.1
|
||||||
|
Earnings
from continuing operations, net of tax
|
2.5
|
2.4
|
1.8
|
||||||
|
Loss
from discontinued operations, net of tax
|
(0.1
|
)
|
(0.1
|
)
|
—
|
||||
|
Net
earnings
|
2.4
|
2.3
|
1.8
|
||||||
|
Net
loss attributable to noncontrolling interests
|
0.2
|
0.2
|
—
|
||||||
|
Net
earnings attributable to RehabCare
|
2.6
|
%
|
2.5
|
%
|
1.8
|
%
|
|||
|
Revenues
|
|||||||||
|
2009
|
2008
|
%
Change
|
|||||||
|
(dollars
in thousands)
|
|||||||||
|
Skilled
nursing rehabilitation services
|
$
|
496,250
|
$
|
457,229
|
8.5
|
%
|
|||
|
Hospital
rehabilitation services
|
178,168
|
165,658
|
7.6
|
||||||
|
Hospitals
|
195,009
|
112,525
|
73.3
|
||||||
|
Consolidated
revenues
|
$
|
869,427
|
$
|
735,412
|
18.2
|
%
|
|||
|
Cost
and Expenses
|
||||||||||||||
|
%
of
|
%
of
|
|||||||||||||
|
2009
|
Revenue
|
2008
|
Revenue
|
|||||||||||
|
(dollars
in thousands)
|
||||||||||||||
|
Consolidated
costs and expenses:
|
||||||||||||||
|
Operating
expenses
|
$
|
704,394
|
81.0
|
%
|
$
|
597,879
|
81.3
|
%
|
||||||
|
Selling,
general and administrative
|
104,060
|
12.0
|
90,056
|
12.2
|
||||||||||
|
Depreciation
and amortization
|
16,499
|
1.9
|
14,570
|
2.0
|
||||||||||
|
Total
costs and expenses
|
$
|
824,953
|
94.9
|
%
|
$
|
702,505
|
95.5
|
%
|
||||||
|
%
of
|
%
of
|
|||||||||||||
|
Unit
|
Unit
|
|||||||||||||
|
2009
|
Revenue
|
2008
|
Revenue
|
|||||||||||
|
(dollars
in thousands)
|
||||||||||||||
|
Skilled
Nursing Rehabilitation Services:
|
||||||||||||||
|
Operating
expenses
|
$
|
402,461
|
81.1
|
%
|
$
|
373,939
|
81.8
|
%
|
||||||
|
Selling,
general and administrative
|
49,753
|
10.0
|
50,911
|
11.1
|
||||||||||
|
Depreciation
and amortization
|
6,283
|
1.3
|
6,835
|
1.5
|
||||||||||
|
Total
costs and expenses
|
$
|
458,497
|
92.4
|
%
|
$
|
431,685
|
94.4
|
%
|
||||||
|
Hospital
Rehabilitation Services:
|
||||||||||||||
|
Operating
expenses
|
$
|
124,758
|
70.0
|
%
|
$
|
118,291
|
71.4
|
%
|
||||||
|
Selling,
general and administrative
|
21,500
|
12.1
|
22,729
|
13.7
|
||||||||||
|
Depreciation
and amortization
|
2,423
|
1.3
|
2,641
|
1.6
|
||||||||||
|
Total
costs and expenses
|
$
|
148,681
|
83.4
|
%
|
$
|
143,661
|
86.7
|
%
|
||||||
|
Hospitals:
|
||||||||||||||
|
Operating
expenses
|
$
|
177,175
|
90.8
|
%
|
$
|
105,649
|
93.9
|
%
|
||||||
|
Selling,
general and administrative
|
32,553
|
16.7
|
15,685
|
13.9
|
||||||||||
|
Depreciation
and amortization
|
7,793
|
4.0
|
5,094
|
4.6
|
||||||||||
|
Total
costs and expenses
|
$
|
217,521
|
111.5
|
%
|
$
|
126,428
|
112.4
|
%
|
||||||
|
Revenues
|
|||||||||
|
2008
|
2007
|
%
Change
|
|||||||
|
(dollars
in thousands)
|
|||||||||
|
Skilled
nursing rehabilitation services
|
$
|
457,229
|
$
|
432,910
|
5.6
|
%
|
|||
|
Hospital
rehabilitation services
|
165,658
|
164,102
|
0.9
|
||||||
|
Hospitals
|
112,525
|
96,001
|
17.2
|
||||||
|
Consolidated
revenues
|
$
|
735,412
|
$
|
693,013
|
6.1
|
%
|
|||
|
Cost
and Expenses
|
||||||||||||||
|
%
of
|
%
of
|
|||||||||||||
|
2008
|
Revenue
|
2007
|
Revenue
|
|||||||||||
|
(dollars
in thousands)
|
||||||||||||||
|
Consolidated
costs and expenses:
|
||||||||||||||
|
Operating
expenses
|
$
|
597,879
|
81.3
|
%
|
$
|
561,233
|
81.0
|
%
|
||||||
|
Selling,
general and administrative
|
90,056
|
12.2
|
82,806
|
11.9
|
||||||||||
|
Impairment
of assets
|
—
|
—
|
4,906
|
0.7
|
||||||||||
|
Depreciation
and amortization
|
14,570
|
2.0
|
16,538
|
2.4
|
||||||||||
|
Total
costs and expenses
|
$
|
702,505
|
95.5
|
%
|
$
|
665,483
|
96.0
|
%
|
||||||
|
%
of
|
%
of
|
|||||||||||||
|
Unit
|
Unit
|
|||||||||||||
|
2008
|
Revenue
|
2007
|
Revenue
|
|||||||||||
|
(dollars
in thousands)
|
||||||||||||||
|
Skilled
Nursing Rehabilitation Services:
|
||||||||||||||
|
Operating
expenses
|
$
|
373,939
|
81.8
|
%
|
$
|
363,909
|
84.1
|
%
|
||||||
|
Selling,
general and administrative
|
50,911
|
11.1
|
52,975
|
12.2
|
||||||||||
|
Depreciation
and amortization
|
6,835
|
1.5
|
8,777
|
2.0
|
||||||||||
|
Total
costs and expenses
|
$
|
431,685
|
94.4
|
%
|
$
|
425,661
|
98.3
|
%
|
||||||
|
Hospital
Rehabilitation Services:
|
||||||||||||||
|
Operating
expenses
|
$
|
118,291
|
71.4
|
%
|
$
|
115,706
|
70.5
|
%
|
||||||
|
Selling,
general and administrative
|
22,729
|
13.7
|
21,399
|
13.0
|
||||||||||
|
Depreciation
and amortization
|
2,641
|
1.6
|
4,104
|
2.5
|
||||||||||
|
Total
costs and expenses
|
$
|
143,661
|
86.7
|
%
|
$
|
141,209
|
86.0
|
%
|
||||||
|
Hospitals:
|
||||||||||||||
|
Operating
expenses
|
$
|
105,649
|
93.9
|
%
|
$
|
81,618
|
85.0
|
%
|
||||||
|
Selling,
general and administrative
|
15,685
|
13.9
|
7,792
|
8.1
|
||||||||||
|
Impairment
of intangible assets
|
—
|
—
|
4,906
|
5.1
|
||||||||||
|
Depreciation
and amortization
|
5,094
|
4.6
|
3,657
|
3.9
|
||||||||||
|
Total
costs and expenses
|
$
|
126,428
|
112.4
|
%
|
$
|
97,973
|
102.1
|
%
|
||||||
|
Less
than
|
2-3
|
4-5
|
More
than
|
|||||||||||||||
|
Total
|
1
year
|
years
|
years
|
5
years
|
Other
|
|||||||||||||
|
Operating
leases (1)
|
$
|
426,603
|
$
|
31,611
|
$
|
65,823
|
$
|
66,458
|
$
|
262,711
|
$
|
—
|
||||||
|
Purchase
obligations (2)
|
14,583
|
13,730
|
853
|
—
|
—
|
—
|
||||||||||||
|
Long-term
debt including capital lease obligations (3)
|
464,159
|
7,507
|
19,499
|
9,653
|
427,500
|
—
|
||||||||||||
|
Interest
on long-term debt (4)
|
159,222
|
27,954
|
53,802
|
51,918
|
25,548
|
—
|
||||||||||||
|
Unrecognized
tax benefits (5)
|
1,647
|
—
|
—
|
—
|
—
|
1,647
|
||||||||||||
|
Other
long-term liabilities (6)
|
3,352
|
—
|
—
|
—
|
—
|
3,352
|
||||||||||||
|
Total
|
$
|
1,069,566
|
$
|
80,802
|
$
|
139,977
|
$
|
128,029
|
$
|
715,759
|
$
|
4,999
|
||||||
|
(1)
|
We
lease many of our facilities under non-cancelable operating leases in the
normal course of business. Some lease agreements provide us
with the option to renew the lease. Our future operating lease obligations
would change if we exercised these renewal options and if we entered into
additional operating lease agreements. For more information, see Note 13
to our accompanying consolidated financial
statements.
|
|
(2)
|
Purchase
obligations include agreements to purchase goods or services that are
enforceable and legally binding on us and that specify all significant
terms. Purchase obligations exclude agreements that are cancelable without
penalty.
|
|
(3)
|
The
amount of long-term debt reported on our consolidated balance sheet at
December 31, 2009 includes unamortized original issue discounts of
approximately $8,892,000.
|
|
(4)
|
Interest
on our variable rate debt is estimated using the rate in effect as of
December 31, 2009. This line also includes interest related to
capital lease obligations, but excludes the amortization of original issue
discounts and the amortization of deferred loan
fees.
|
|
(5)
|
Represents
our total liability for unrecognized tax benefits based on the guidance in
the Financial Accounting Standards Board’s Accounting Standards
Codification Topic 740, “Income Taxes.” There is a high degree
of uncertainty regarding the timing of future cash outflows associated
with these liabilities, which involve various taxing
authorities. As a result, we are unable to predict the timing
of payments against this
obligation.
|
|
(6)
|
We
maintain a nonqualified deferred compensation plan for certain employees.
Under the plan, participants may defer up to 70% of their salary and cash
incentive compensation. The amounts are held in trust in investments
designated by participants but remain our property until distribution.
Because most distributions of funds are tied to the termination of
employment or retirement of participants, we are not able to predict the
timing of payments against this obligation. At December 31,
2009, we owned trust assets with a value approximately equal to the total
amount of this obligation.
|
| ITEM 7A. | QUANTITATIVE AND QUALITATIVE DISCLOSURES ABOUT MARKET RISK |
|
|
ITEM
8.
|
FINANCIAL
STATEMENTS AND SUPPLEMENTARY DATA
|
|
Report
of Independent Registered Public Accounting Firm
|
46
|
|
Consolidated
Balance Sheets as of December 31, 2009 and 2008
|
48
|
|
Consolidated
Statements of Earnings for the years
|
|
|
ended December 31, 2009, 2008 and
2007
|
49
|
|
Consolidated
Statements of Comprehensive Income for the years
|
|
|
ended December 31, 2009, 2008 and
2007
|
50
|
|
Consolidated
Statements of Changes in Equity for the years
|
|
|
ended December 31, 2009, 2008
and 2007
|
51
|
|
Consolidated
Statements of Cash Flows for the years
|
|
|
ended December 31, 2009, 2008 and
2007
|
52
|
|
Notes
to the Consolidated Financial Statements
|
53
|

|
December
31,
|
|||||||
|
Assets
|
2009
|
2008
|
|||||
|
Current
assets:
|
|||||||
|
Cash
and cash equivalents
|
$
|
24,690
|
$
|
27,373
|
|||
|
Accounts
receivable, net of allowance for doubtful accounts of $24,729 and $19,480,
respectively
|
199,447
|
139,197
|
|||||
|
Deferred
tax assets
|
21,249
|
14,876
|
|||||
|
Other
current assets
|
19,530
|
7,165
|
|||||
|
Total
current assets
|
264,916
|
188,611
|
|||||
|
Marketable
securities, trading
|
3,314
|
2,810
|
|||||
|
Property
and equipment, net
|
111,814
|
37,851
|
|||||
|
Goodwill
|
566,078
|
171,365
|
|||||
|
Intangible
assets, net
|
135,406
|
28,944
|
|||||
|
Investment
in unconsolidated affiliate
|
4,761
|
4,772
|
|||||
|
Other
|
23,691
|
4,053
|
|||||
|
Total
assets
|
$
|
1,109,980
|
$
|
438,406
|
|||
|
Liabilities and Equity
|
|||||||
|
Current
liabilities:
|
|||||||
|
Current
portion of long-term debt
|
$
|
7,507
|
$
|
—
|
|||
|
Accounts
payable
|
18,293
|
8,330
|
|||||
|
Accrued
salaries and wages
|
80,138
|
55,188
|
|||||
|
Income
taxes payable
|
97
|
776
|
|||||
|
Accrued
expenses
|
45,585
|
27,033
|
|||||
|
Total
current liabilities
|
151,620
|
91,327
|
|||||
|
Long-term
debt, less current portion
|
447,760
|
57,000
|
|||||
|
Deferred
compensation
|
3,352
|
2,833
|
|||||
|
Deferred
tax liabilities
|
45,605
|
8,306
|
|||||
|
Other
|
2,023
|
1,140
|
|||||
|
Total
liabilities
|
650,360
|
160,606
|
|||||
|
Stockholders’
equity:
|
|||||||
|
Preferred
stock, $.10 par value; authorized 10,000,000 shares, none issued and
outstanding
|
—
|
—
|
|||||
|
Common
stock, $.01 par value; authorized 60,000,000 shares, issued 28,036,014
shares and 21,657,544 shares as of December 31, 2009 and 2008,
respectively
|
280
|
217
|
|||||
|
Additional
paid-in capital
|
291,771
|
145,647
|
|||||
|
Retained
earnings
|
199,991
|
177,036
|
|||||
|
Accumulated
other comprehensive loss
|
—
|
(424
|
)
|
||||
|
Less
common stock held in treasury at cost; 4,002,898 shares as of December 31,
2009 and 2008
|
(54,704
|
)
|
(54,704
|
)
|
|||
|
Total
stockholders’ equity
|
437,338
|
267,772
|
|||||
|
Noncontrolling
interests
|
22,282
|
10,028
|
|||||
|
Total
equity
|
459,620
|
277,800
|
|||||
|
Total
liabilities and equity
|
$
|
1,109,980
|
$
|
438,406
|
|||
|
Year
Ended December 31,
|
||||||||||||
|
2009
|
2008
|
2007
|
||||||||||
|
Operating
revenues
|
$
|
869,427
|
$
|
735,412
|
$
|
693,013
|
||||||
|
Costs
and expenses:
|
||||||||||||
|
Operating
|
704,394
|
597,879
|
561,233
|
|||||||||
|
Selling,
general and administrative
|
104,060
|
90,056
|
82,806
|
|||||||||
|
Impairment
of assets
|
—
|
—
|
4,906
|
|||||||||
|
Depreciation
and amortization
|
16,499
|
14,570
|
16,538
|
|||||||||
|
Total
costs and expenses
|
824,953
|
702,505
|
665,483
|
|||||||||
|
Operating
earnings
|
44,474
|
32,907
|
27,530
|
|||||||||
|
Interest
income
|
98
|
143
|
830
|
|||||||||
|
Interest
expense
|
(5,546
|
)
|
(3,897
|
)
|
(8,362
|
)
|
||||||
|
Other
income
|
12
|
21
|
37
|
|||||||||
|
Equity
in net income of affiliate
|
431
|
471
|
287
|
|||||||||
|
Earnings
from continuing operations before income taxes
|
39,469
|
29,645
|
20,322
|
|||||||||
|
Income
taxes
|
17,641
|
12,063
|
7,658
|
|||||||||
|
Earnings
from continuing operations, net of tax
|
21,828
|
17,582
|
12,664
|
|||||||||
|
Loss
from discontinued operations, net of tax
|
(839
|
)
|
(863
|
)
|
(382
|
)
|
||||||
|
Net
earnings
|
20,989
|
16,719
|
12,282
|
|||||||||
|
Net
loss attributable to noncontrolling interests
|
1,966
|
1,986
|
377
|
|||||||||
|
Net
earnings attributable to RehabCare
|
$
|
22,955
|
$
|
18,705
|
$
|
12,659
|
||||||
|
Amounts
attributable to RehabCare stockholders:
|
||||||||||||
|
Earnings
from continuing operations, net of tax
|
$
|
23,794
|
$
|
19,568
|
$
|
13,041
|
||||||
|
Loss
from discontinued operations, net of tax
|
(839
|
)
|
(863
|
)
|
(382
|
)
|
||||||
|
Net
earnings
|
$
|
22,955
|
$
|
18,705
|
$
|
12,659
|
||||||
|
Basic
earnings per share attributable to RehabCare:
|
||||||||||||
|
Earnings
from continuing operations, net of tax
|
$
|
1.29
|
$
|
1.11
|
$
|
0.76
|
||||||
|
Loss
from discontinued operations, net of tax
|
(0.05
|
)
|
(0.05
|
)
|
(0.03
|
)
|
||||||
|
Net
earnings
|
$
|
1.24
|
$
|
1.06
|
$
|
0.73
|
||||||
|
Diluted
earnings per share attributable to RehabCare:
|
||||||||||||
|
Earnings
from continuing operations, net of tax
|
$
|
1.26
|
$
|
1.10
|
$
|
0.75
|
||||||
|
Loss
from discontinued operations, net of tax
|
(0.04
|
)
|
(0.05
|
)
|
(0.02
|
)
|
||||||
|
Net
earnings
|
$
|
1.22
|
$
|
1.05
|
$
|
0.73
|
||||||
|
Year
Ended December 31,
|
||||||||||
|
2009
|
2008
|
2007
|
||||||||
|
Net
earnings
|
$
|
20,989
|
$
|
16,719
|
$
|
12,282
|
||||
|
Other
comprehensive income (loss), net of tax:
|
||||||||||
|
Changes
in the fair value of derivative designated as a cash flow hedge, net of
income tax expense (benefit) of $267, $(226) and $(41),
respectively
|
424
|
(358
|
)
|
(66
|
)
|
|||||
|
Total
other comprehensive loss, net of tax
|
424
|
(358
|
)
|
(66
|
)
|
|||||
|
Comprehensive
income
|
21,413
|
16,361
|
12,216
|
|||||||
|
Comprehensive
loss attributable to noncontrolling interests
|
1,966
|
1,986
|
377
|
|||||||
|
Comprehensive
income attributable to RehabCare
|
$
|
23,379
|
$
|
18,347
|
$
|
12,593
|
||||
|
Amounts
Attributable to RehabCare Stockholders
|
|||||||||||||||||||||
|
Accumulated
|
|||||||||||||||||||||
|
Additional
|
other
|
Non-
|
|||||||||||||||||||
|
Common
|
paid-in
|
Retained
|
Treasury
|
comprehensive
|
controlling
|
Total
|
|||||||||||||||
|
stock
|
capital
|
earnings
|
stock
|
earnings
(loss)
|
interests
|
equity
|
|||||||||||||||
|
Balance,
December 31, 2006
|
$
|
211
|
$
|
134,040
|
$
|
131,232
|
$
|
(54,704
|
)
|
$
|
—
|
$
|
86
|
$
|
210,865
|
||||||
|
Net
earnings (loss)
|
—
|
—
|
12,659
|
—
|
—
|
(377
|
)
|
12,282
|
|||||||||||||
|
Changes
in the fair value of derivative, net of tax
|
—
|
—
|
—
|
—
|
(66
|
)
|
—
|
(66
|
)
|
||||||||||||
|
Adjustment
to initially apply FIN 48
|
—
|
—
|
14,440
|
—
|
—
|
—
|
14,440
|
||||||||||||||
|
Stock-based
compensation
|
—
|
1,726
|
—
|
—
|
—
|
—
|
1,726
|
||||||||||||||
|
Activity
under stock plans
|
4
|
4,480
|
—
|
—
|
—
|
—
|
4,484
|
||||||||||||||
|
Contributions
made by noncontrolling interests
|
—
|
—
|
—
|
—
|
—
|
1,558
|
1,558
|
||||||||||||||
|
Balance,
December 31, 2007
|
215
|
140,246
|
158,331
|
(54,704
|
)
|
(66
|
)
|
1,267
|
245,289
|
||||||||||||
|
Net
earnings (loss)
|
—
|
—
|
18,705
|
—
|
—
|
(1,986
|
)
|
16,719
|
|||||||||||||
|
Changes
in the fair value of derivative, net of tax
|
—
|
—
|
—
|
—
|
(358
|
)
|
—
|
(358
|
)
|
||||||||||||
|
Stock-based
compensation
|
—
|
3,195
|
—
|
—
|
—
|
—
|
3,195
|
||||||||||||||
|
Activity
under stock plans
|
2
|
2,206
|
—
|
—
|
—
|
—
|
2,208
|
||||||||||||||
|
Contributions
made by noncontrolling interests
|
—
|
—
|
—
|
—
|
—
|
10,747
|
10,747
|
||||||||||||||
|
Balance,
December 31, 2008
|
217
|
145,647
|
177,036
|
(54,704
|
)
|
(424
|
)
|
10,028
|
277,800
|
||||||||||||
|
Net
earnings (loss)
|
—
|
—
|
22,955
|
—
|
—
|
(1,966
|
)
|
20,989
|
|||||||||||||
|
Changes
in the fair value of derivative, net of tax
|
—
|
—
|
—
|
—
|
424
|
—
|
424
|
||||||||||||||
|
Sale
of common stock
|
62
|
140,187
|
—
|
—
|
—
|
—
|
140,249
|
||||||||||||||
|
Stock-based
compensation
|
—
|
4,662
|
—
|
—
|
—
|
—
|
4,662
|
||||||||||||||
|
Activity
under stock plans
|
1
|
1,275
|
—
|
—
|
—
|
—
|
1,276
|
||||||||||||||
|
Business
combinations
|
—
|
—
|
—
|
—
|
—
|
11,591
|
11,591
|
||||||||||||||
|
Contributions
made by noncontrolling interests
|
—
|
—
|
—
|
—
|
—
|
4,423
|
4,423
|
||||||||||||||
|
Distributions
to noncontrolling interests
|
—
|
—
|
—
|
—
|
—
|
(1,794
|
)
|
(1,794
|
)
|
||||||||||||
|
Balance,
December 31, 2009
|
$
|
280
|
$
|
291,771
|
$
|
199,991
|
$
|
(54,704
|
)
|
$
|
—
|
$
|
22,282
|
$
|
459,620
|
||||||
|
Year
Ended December 31,
|
|||||||||||||
|
2009
|
2008
|
2007
|
|||||||||||
|
Cash
flows from operating activities:
|
|||||||||||||
|
Net
earnings
|
$
|
20,989
|
$
|
16,719
|
$
|
12,282
|
|||||||
|
Reconciliation
to net cash provided by operating activities:
|
|||||||||||||
|
Depreciation
and amortization
|
16,522
|
14,886
|
17,021
|
||||||||||
|
Provision
for doubtful accounts
|
7,794
|
10,178
|
9,194
|
||||||||||
|
Equity
in net income of affiliate
|
(431
|
)
|
(471
|
)
|
(287
|
)
|
|||||||
|
Impairment
of assets
|
—
|
—
|
4,906
|
||||||||||
|
Stock-based
compensation
|
4,662
|
3,195
|
1,726
|
||||||||||
|
Income
tax benefit related to stock options exercised
|
916
|
812
|
1,122
|
||||||||||
|
Excess
tax benefit related to stock options exercised
|
(405
|
)
|
(564
|
)
|
(973
|
)
|
|||||||
|
Loss
(gain) on disposal of discontinued operation
|
1,188
|
(321
|
)
|
—
|
|||||||||
|
Gain
on disposal of property and equipment
|
(12
|
)
|
(21
|
)
|
(37
|
)
|
|||||||
|
Changes
in assets and liabilities:
|
|||||||||||||
|
Accounts
receivable, net
|
(5,837
|
)
|
(11,318
|
)
|
7,883
|
||||||||
|
Other
current assets
|
(6,821
|
)
|
846
|
925
|
|||||||||
|
Accounts
payable
|
(3,478
|
)
|
2,328
|
(3,895
|
)
|
||||||||
|
Accrued
salaries and wages
|
5,715
|
4,952
|
(523
|
)
|
|||||||||
|
Income
taxes payable and deferred taxes
|
477
|
4,456
|
5,871
|
||||||||||
|
Accrued
expenses
|
6,212
|
2,629
|
(2,486
|
)
|
|||||||||
|
Other
assets and other liabilities
|
599
|
352
|
(720
|
)
|
|||||||||
|
Net
cash provided by operating activities
|
48,090
|
48,658
|
52,009
|
||||||||||
|
Cash
flows from investing activities:
|
|||||||||||||
|
Additions
to property and equipment
|
(13,215
|
)
|
(18,502
|
)
|
(9,989
|
)
|
|||||||
|
Purchase
of marketable securities
|
(476
|
)
|
(509
|
)
|
(354
|
)
|
|||||||
|
Proceeds
from sale/maturities of marketable securities
|
607
|
546
|
1,390
|
||||||||||
|
Investment
in unconsolidated affiliate
|
—
|
—
|
(1,119
|
)
|
|||||||||
|
Proceeds
from disposition of business
|
5,043
|
7,193
|
—
|
||||||||||
|
Purchase
of businesses, net of cash acquired
|
(549,783
|
)
|
(8,408
|
)
|
(1
|
)
|
|||||||
|
Other,
net
|
(27
|
)
|
(406
|
)
|
(871
|
)
|
|||||||
|
Net
cash used in investing activities
|
(557,851
|
)
|
(20,086
|
)
|
(10,944
|
)
|
|||||||
|
Cash
flows from financing activities:
|
|||||||||||||
|
Net
change in revolving credit facility
|
(57,000
|
)
|
(11,500
|
)
|
(45,000
|
)
|
|||||||
|
Proceeds
from the issuance of long-term debt
|
450,000
|
—
|
—
|
||||||||||
|
Debt
issuance costs
|
(28,448
|
)
|
—
|
—
|
|||||||||
|
Principal
payments on long-term debt
|
(1,749
|
)
|
(6,000
|
)
|
(1,059
|
)
|
|||||||
|
Net
proceeds from the sale of common stock
|
140,249
|
—
|
—
|
||||||||||
|
Cash
contributed by noncontrolling interests
|
4,423
|
3,663
|
1,373
|
||||||||||
|
Cash
distributed to noncontrolling interests
|
(1,794
|
)
|
—
|
—
|
|||||||||
|
Activity
under stock plans
|
992
|
1,809
|
3,483
|
||||||||||
|
Excess
tax benefit related to stock options exercised
|
405
|
564
|
973
|
||||||||||
|
Net
cash provided by (used in) financing activities
|
507,078
|
(11,464
|
)
|
(40,230
|
)
|
||||||||
|
Net
(decrease) increase in cash and cash equivalents
|
(2,683
|
)
|
17,108
|
835
|
|||||||||
|
Cash
and cash equivalents at beginning of year
|
27,373
|
10,265
|
9,430
|
||||||||||
|
Cash
and cash equivalents at end of year
|
$
|
24,690
|
$
|
27,373
|
$
|
10,265
|
|||||||
| (1) | Overview of Company and Summary of Significant Accounting Policies |
|
As
of December 31,
|
||||||
|
Hospital segment
|
2009
|
2008
|
||||
|
Medicare
|
58.7
|
%
|
64.7
|
%
|
||
|
Medicaid
|
2.8
|
2.3
|
||||
|
Other
third party payors
|
36.8
|
32.1
|
||||
|
Self-pay
|
1.6
|
0.9
|
||||
|
Total
net patient accounts receivable
|
99.9
|
100.0
|
||||
|
Other
receivables
|
0.1
|
—
|
||||
|
Total
net accounts receivable
|
100.0
|
%
|
100.0
|
%
|
||
| (2) | Stock-Based Compensation |
|
Year
Ended December 31,
|
|||||||||
|
2009
|
2008
|
2007
|
|||||||
|
Share-based
compensation expense
|
$
|
4,662
|
$
|
3,195
|
$
|
1,726
|
|||
|
Income
tax benefit
|
1,802
|
1,235
|
667
|
||||||
|
Weighted-
|
Weighted-Average
|
Aggregate
|
||||||
|
Average
|
Remaining
|
Intrinsic
|
||||||
|
Exercise
|
Contractual
|
Value
|
||||||
|
Stock Options
|
Shares
|
Price
|
Life
(yrs)
|
(millions)
|
||||
|
Outstanding
at January 1, 2009
|
974,739
|
$24.10
|
||||||
|
Granted
|
—
|
—
|
||||||
|
Exercised
|
(93,910
|
)
|
14.11
|
|||||
|
Forfeited
or expired
|
(10,000
|
)
|
30.08
|
|||||
|
Outstanding
at December 31, 2009
|
870,829
|
$25.11
|
3.5
|
$5.7
|
||||
|
Exercisable
at December 31, 2009
|
863,329
|
$25.16
|
3.5
|
$5.6
|
|
Weighted-
|
|||||
|
Average
|
|||||
|
Grant-Date
|
|||||
|
Nonvested Stock Options
|
Shares
|
Fair
Value
|
|||
|
Nonvested
at January 1, 2009
|
15,000
|
$7.78
|
|||
|
Granted
|
—
|
—
|
|||
|
Vested
|
(7,500
|
)
|
7.78
|
||
|
Forfeited
|
—
|
—
|
|||
|
Nonvested
at December 31, 2009
|
7,500
|
$7.78
|
|
Weighted-
|
|||||
|
Average
|
|||||
|
Grant-Date
|
|||||
|
Nonvested Restricted Stock
Awards
|
Shares
|
Fair
Value
|
|||
|
Nonvested
at January 1, 2009
|
398,742
|
$18.90
|
|||
|
Granted
|
382,016
|
14.80
|
|||
|
Vested
|
(92,595
|
)
|
17.91
|
||
|
Forfeited
|
(58,430
|
)
|
16.18
|
||
|
Nonvested
at December 31, 2009
|
629,733
|
$16.81
|
|||
| (3) | Marketable Securities |
| (4) | Allowance for Doubtful Accounts |
|
Year
Ended December 31,
|
||||||||||
|
2009
|
2008
|
2007
|
||||||||
|
Balance
at beginning of year
|
$
|
19,480
|
$
|
16,266
|
$
|
14,355
|
||||
|
Provisions
for doubtful accounts
|
7,794
|
9,643
|
9,194
|
|||||||
|
Acquisitions
|
8,201
|
17
|
1,472
|
|||||||
|
Disposition
|
(41
|
)
|
—
|
—
|
||||||
|
Accounts
written off, net of recoveries
|
(10,705
|
)
|
(6,446
|
)
|
(8,755
|
)
|
||||
|
Balance
at end of year
|
$
|
24,729
|
$
|
19,480
|
$
|
16,266
|
||||
| (5) | Property and Equipment |
|
December
31,
|
|||||||
|
2009
|
2008
|
||||||
|
Equipment
|
$
|
88,808
|
$
|
58,163
|
|||
|
Land
|
6,043
|
1,010
|
|||||
|
Buildings
and leasehold improvements
|
60,328
|
27,599
|
|||||
|
Buildings
and equipment under capital lease obligations
|
11,243
|
—
|
|||||
|
166,422
|
86,772
|
||||||
|
Less
accumulated depreciation
|
54,608
|
48,921
|
|||||
|
$
|
111,814
|
$
|
37,851
|
||||
| (6) | Business Combinations |
|
Cash
|
$
|
—
|
||
|
Accounts
receivable
|
60,636
|
|||
|
Other
current assets
|
13,357
|
|||
|
Property
and equipment
|
67,777
|
|||
|
Identifiable
intangible assets, principally Medicare licenses, trade name and
certificates of need
|
108,960
|
|||
|
Other
assets
|
1,747
|
|||
|
Current
portion of long-term debt
|
(2,536
|
)
|
||
|
Accounts
payable and other current liabilities
|
(45,649
|
)
|
||
|
Noncurrent
portion of long-term debt
|
(10,217
|
)
|
||
|
Other
liabilities
|
(36,455
|
)
|
||
|
Total
identifiable net assets
|
157,620
|
|||
|
Noncontrolling
interests in Triumph
|
(10,000
|
)
|
||
|
Goodwill
|
390,920
|
|||
|
Fair
value of total consideration transferred
|
$
|
538,540
|
|
Year
ended
|
Year
ended
|
||||||||||||||||
|
December
31, 2009
|
December
31, 2008
|
||||||||||||||||
|
As
Reported
|
Pro
Forma
|
As
Reported
|
Pro
Forma
|
||||||||||||||
|
Operating
revenues
|
$
|
869,427
|
$
|
1,260,775
|
$
|
735,412
|
$
|
1,159,138
|
|||||||||
|
Net
earnings from continuing operations attributable to
RehabCare
|
$
|
23,794
|
$
|
45,724
|
$
|
19,568
|
$
|
35,144
|
|||||||||
|
Diluted
earnings per share from continuing operations attributable to
RehabCare
|
$
|
1.26
|
$
|
1.88
|
$
|
1.10
|
$
|
1.46
|
|||||||||
| (7) | Goodwill and Other Intangible Assets |
|
December 31, 2009
|
December 31, 2008
|
||||||||||||||||
|
Gross
|
Gross
|
||||||||||||||||
|
Carrying
|
Accumulated
|
Carrying
|
Accumulated
|
||||||||||||||
|
Amount
|
Amortization
|
Amount
|
Amortization
|
||||||||||||||
|
Amortizing
Intangible Assets:
|
|||||||||||||||||
|
Noncompete
agreements
|
$
|
4,710
|
$
|
(1,566
|
)
|
$
|
1,850
|
$
|
(1,261
|
)
|
|||||||
|
Customer
contracts and relationships
|
23,096
|
(12,577
|
)
|
23,096
|
(10,042
|
)
|
|||||||||||
|
Trade
names
|
40,083
|
(2,792
|
)
|
9,683
|
(1,929
|
)
|
|||||||||||
|
Medicare
exemption
|
454
|
(340
|
)
|
454
|
(227
|
)
|
|||||||||||
|
Market
access assets
|
5,720
|
(310
|
)
|
5,720
|
(24
|
)
|
|||||||||||
|
Certificates
of need
|
9,442
|
(152
|
)
|
142
|
(28
|
)
|
|||||||||||
|
Lease
arrangements
|
1,305
|
(297
|
)
|
905
|
(205
|
)
|
|||||||||||
|
Total
|
$
|
84,810
|
$
|
(18,034
|
)
|
$
|
41,850
|
$
|
(13,716
|
)
|
|||||||
|
Non-amortizing
Intangible Assets:
|
|||||||||||||||||
|
Trade
names
|
$
|
410
|
$
|
810
|
|||||||||||||
|
Medicare
provider numbers
|
68,220
|
—
|
|||||||||||||||
| $ |
68,630
|
$ |
810
|
||||||||||||||
|
Healthcare
Management
|
|||||||||||||||||||
|
SRS
(a)
|
HRS
(b)
|
Hospitals
|
Consulting
(c)
|
Total
|
|||||||||||||||
|
Balance
at December 31, 2007
|
$ |
79,419
|
$ |
39,715
|
$ |
45,239
|
$ |
4,144
|
$ |
168,517
|
|||||||||
|
Acquisitions
|
—
|
—
|
6,414
|
—
|
6,414
|
||||||||||||||
|
Dispositions
|
—
|
—
|
(3,566
|
)
|
—
|
(3,566
|
)
|
||||||||||||
|
Balance
at December 31, 2008
|
79,419
|
|
39,715
|
|
48,087
|
|
4,144
|
|
171,365
|
||||||||||
|
Acquisitions
|
—
|
—
|
398,857
|
—
|
398,857
|
||||||||||||||
|
Dispositions
|
—
|
—
|
—
|
(4,144
|
)
|
(4,144
|
)
|
||||||||||||
|
Balance
at December 31, 2009
|
$
|
79,419
|
$
|
39,715
|
$
|
446,944
|
$
|
—
|
$
|
566,078
|
|||||||||
|
|
(a)
|
Skilled
Nursing Rehabilitation Services
(SRS).
|
|
|
(b)
|
Hospital
Rehabilitation Services (HRS).
|
|
|
(c)
|
The
healthcare management consulting segment consists of Phase 2 Consulting,
Inc., which was sold effective June 1,
2009.
|
| (8) | Dispositions and Discontinued Operations |
|
Assets:
|
||||
|
Accounts
receivable
|
$
|
2,202
|
||
|
Other
current assets
|
23
|
|||
|
Property
and equipment, net
|
115
|
|||
|
Goodwill
|
4,144
|
|||
|
Intangible
assets
|
400
|
|||
|
Other
assets
|
13
|
|||
|
Total
assets
|
$
|
6,897
|
||
|
Liabilities:
|
||||
|
Accounts
payable and accrued expenses
|
$
|
209
|
||
|
Total
liabilities
|
$
|
209
|
||
|
2009
|
2008
|
2007
|
|||||||||||
|
Operating
revenues
|
$
|
2,833
|
$
|
9,563
|
$
|
12,480
|
|||||||
|
Costs
and expenses
|
3,064
|
9,789
|
11,375
|
||||||||||
|
Operating
gain (loss) from discontinued operations
|
(231
|
)
|
(226
|
)
|
1,105
|
||||||||
|
Loss
on disposal of assets of discontinued operations
|
(1,188
|
)
|
—
|
—
|
|||||||||
|
Income
tax benefit (expense)
|
553
|
88
|
(440
|
)
|
|||||||||
|
Gain
(loss) from discontinued operations
|
$
|
(866
|
)
|
$
|
(138
|
)
|
$
|
665
|
|||||
|
Assets:
|
||||
|
Property
and equipment, net
|
$
|
18
|
||
|
Goodwill
|
3,566
|
|||
|
Intangible
assets, net
|
2,154
|
|||
|
Total
assets
|
$
|
5,738
|
||
|
Liabilities:
|
||||
|
Accrued
salaries and wages
|
$
|
7
|
||
|
Total
liabilities
|
$
|
7
|
|
2009
|
2008
|
2007
|
|||||||||||
|
Operating
revenues
|
$
|
—
|
$
|
3,962
|
$
|
7,125
|
|||||||
|
Costs
and expenses
|
(44
|
)
|
5,471
|
8,791
|
|||||||||
|
Operating
gain (loss) from discontinued operations
|
44
|
(1,509
|
)
|
(1,666
|
)
|
||||||||
|
Loss
on disposal of assets of discontinued operations
|
—
|
321
|
—
|
||||||||||
|
Income
tax benefit (expense)
|
(17
|
)
|
463
|
619
|
|||||||||
|
Gain
(loss) from discontinued operations
|
$
|
27
|
$
|
(725
|
)
|
$
|
(1,047
|
)
|
|||||
| (9) | Long-Term Debt |
|
December
31,
|
|||||||
|
2009
|
2008
|
||||||
|
Borrowings
under $175 million revolving credit facility
|
$
|
—
|
$
|
57,000
|
|||
|
Borrowings
under $125 million revolving credit facility; maturity date of November
24, 2014
|
|
—
|
|
—
|
|||
|
Term
loan facility; payable in quarterly installments of $1.1 million with
remaining balance due on November 24, 2015; net of unamortized original
issue discount of $8,892
|
441,108
|
—
|
|||||
|
Note
payable to bank; bearing interest at prime plus 1%, but not less than 5%
nor greater than 7.5%; payable in monthly installments through January
2011 and $4.2 million due in February 2011
|
4,528
|
—
|
|||||
|
Capital
lease obligations
|
9,631
|
—
|
|||||
|
455,267
|
57,000
|
||||||
|
Less: current
portion
|
(7,507
|
)
|
—
|
||||
|
$
|
447,760
|
$
|
57,000
|
||||
|
2010
|
$
|
7,507
|
||
|
2011
|
11,708
|
|||
|
2012
|
7,791
|
|||
|
2013
|
5,148
|
|||
|
2014
|
4,505
|
|||
|
Thereafter
|
427,500
|
|||
|
Total
|
$
|
464,159
|
| (10) | Stockholders’ Equity |
| (11) | Earnings per Share |
|
Year
Ended December 31,
|
||||||||||||
|
2009
|
2008
|
2007
|
||||||||||
|
Numerator:
|
||||||||||||
|
Earnings
from continuing operations, net of tax
|
$
|
23,794
|
$
|
19,568
|
$
|
13,041
|
||||||
|
Loss
from discontinued operations, net of tax
|
(839
|
)
|
(863
|
)
|
(382
|
)
|
||||||
|
Net
earnings
|
$
|
22,955
|
$
|
18,705
|
$
|
12,659
|
||||||
|
Denominator:
|
||||||||||||
|
Basic
weighted average common shares outstanding
|
18,481
|
17,583
|
17,226
|
|||||||||
|
Effect
of dilutive securities:
|
||||||||||||
|
stock
options and restricted stock awards
|
381
|
215
|
233
|
|||||||||
|
Diluted
weighted average common shares outstanding
|
18,862
|
17,798
|
17,459
|
|||||||||
|
Basic
earnings per common share:
|
||||||||||||
|
Earnings
from continuing operations, net of tax
|
$
|
1.29
|
$
|
1.11
|
$
|
0.76
|
||||||
|
Loss
from discontinued operations, net of tax
|
(0.05
|
)
|
(0.05
|
)
|
(0.03
|
)
|
||||||
|
Net
earnings
|
$
|
1.24
|
$
|
1.06
|
$
|
0.73
|
||||||
|
Diluted
earnings per common share:
|
||||||||||||
|
Earnings
from continuing operations, net of tax
|
$
|
1.26
|
$
|
1.10
|
$
|
0.75
|
||||||
|
Loss
from discontinued operations, net of tax
|
(0.04
|
)
|
(0.05
|
)
|
(0.02
|
)
|
||||||
|
Net
earnings
|
$
|
1.22
|
$
|
1.05
|
$
|
0.73
|
||||||
| (12) | Employee Benefits |
| (13) | Commitments |
|
2010
|
$
|
31,611
|
|||
|
2011
|
32,893
|
||||
|
2012
|
32,930
|
||||
|
2013
|
32,987
|
||||
|
2014
|
33,471
|
||||
|
Thereafter
|
262,711
|
||||
|
Total
|
$
|
426,603
|
|
2010
|
$
|
3,533
|
|||
|
2011
|
3,532
|
||||
|
2012
|
3,532
|
||||
|
2013
|
658
|
||||
|
2014
|
5
|
||||
|
Thereafter
|
—
|
||||
|
Total
minimum lease payments
|
11,260
|
||||
|
Less:
interest portion
|
(1,629
|
)
|
|||
|
Total
obligations under capital leases
|
$
|
9,631
|
|||
| (14) | Income Taxes |
|
Year
Ended December 31,
|
|||||||||||
|
2009
|
2008
|
2007
|
|||||||||
|
Federal
– current
|
$
|
13,051
|
$
|
7,282
|
$
|
1,196
|
|||||
|
Federal
– deferred
|
2,183
|
3,229
|
6,392
|
||||||||
|
State
|
2,407
|
1,552
|
70
|
||||||||
|
$
|
17,641
|
$
|
12,063
|
$
|
7,658
|
||||||
|
Year
Ended December 31,
|
|||||||||||
|
2009
|
2008
|
2007
|
|||||||||
|
Expected
income taxes
|
$
|
13,814
|
$
|
10,376
|
$
|
7,113
|
|||||
|
Tax
effect of interest income from municipal bond obligations exempt from
federal taxation
|
(2
|
)
|
(1
|
)
|
(8
|
)
|
|||||
|
State
income taxes, net of federal income tax benefit
|
1,634
|
982
|
120
|
||||||||
|
Tax
effect of losses attributable to noncontrolling interests not deductible
by the Company
|
688
|
695
|
132
|
||||||||
|
Tax
effect on nondeductible acquisition-related expenses
|
1,347
|
—
|
—
|
||||||||
|
Other,
net
|
160
|
11
|
301
|
||||||||
|
$
|
17,641
|
$
|
12,063
|
$
|
7,658
|
||||||
|
December
31,
|
|||||||
|
2009
|
2008
|
||||||
|
Deferred
tax assets:
|
|||||||
|
Allowance
for doubtful accounts
|
$
|
7,588
|
$
|
5,439
|
|||
|
Accrued
insurance, vacation, bonus and deferred compensation
|
12,563
|
8,348
|
|||||
|
Net
operating loss carryforward/capital loss carryforward
|
1,697
|
184
|
|||||
|
Stock
based compensation
|
3,081
|
1,993
|
|||||
|
Other
|
6,516
|
4,717
|
|||||
|
Total
gross deferred tax assets
|
31,445
|
20,681
|
|||||
|
Valuation
allowance
|
(74
|
)
|
(75
|
)
|
|||
|
Net
deferred tax assets
|
31,371
|
20,606
|
|||||
|
Deferred
tax liabilities:
|
|||||||
|
Acquired
goodwill and intangibles
|
47,402
|
10,500
|
|||||
|
Depreciation
and amortization
|
5,229
|
1,913
|
|||||
|
Other
|
3,096
|
1,623
|
|||||
|
Total
deferred tax liabilities
|
55,727
|
14,036
|
|||||
|
$
|
(24,356
|
)
|
$
|
6,570
|
|||
|
2009
|
2008
|
|||||||
|
Balance
at beginning of year
|
$
|
448
|
$
|
308
|
||||
|
Liability
assumed in acquisition of Triumph
|
133
|
—
|
||||||
|
Increase
as a result of tax positions taken in prior years
|
510
|
7
|
||||||
|
Increase
as a result of tax positions taken in the current year
|
710
|
212
|
||||||
|
Lapse
of applicable statute of limitations
|
(154
|
)
|
(79
|
)
|
||||
|
Balance
at end of year
|
$
|
1,647
|
$
|
448
|
| (15) | Investment in Unconsolidated Affiliate |
| (16) | Severance and Restructuring Costs |
|
Balance,
January 1, 2009
|
$
|
—
|
||
|
Accrual
for severance costs
|
862
|
|||
|
Payments
|
(105
|
)
|
||
|
Balance,
December 31, 2009
|
$
|
757
|
||
|
Balance,
January 1, 2008
|
$
|
—
|
||
|
Accrual
for severance costs
|
2,263
|
|||
|
Payments
|
(910
|
)
|
||
|
Balance,
December 31, 2008
|
$
|
1,353
|
||
|
Payments
|
(1,353
|
)
|
||
|
Balance,
December 31, 2009
|
$
|
—
|
||
| (17) | Related Party Transactions |
| (18) | Fair Value Measurements |
|
December
31, 2009
|
||||||||||||||||
|
Carrying
|
Fair
Value Measurements
|
|||||||||||||||
|
Value
|
Level
1
|
Level
2
|
Level
3
|
|||||||||||||
|
Trading
securities
|
$
|
3,314
|
$
|
3,314
|
$
|
—
|
$
|
—
|
||||||||
|
December
31, 2008
|
||||||||||||||||
|
Carrying
|
Fair
Value Measurements
|
|||||||||||||||
|
Value
|
Level
1
|
Level
2
|
Level
3
|
|||||||||||||
|
Trading
securities
|
$
|
2,810
|
$
|
2,810
|
$
|
—
|
$
|
—
|
||||||||
|
Interest
rate swap
|
(692
|
)
|
—
|
(692
|
)
|
—
|
||||||||||
|
Total
net financial assets (liabilities)
|
$
|
2,118
|
$
|
2,810
|
$
|
(692
|
)
|
$
|
—
|
|||||||
| (19) | Industry Segment Information |
|
Operating
Revenues
|
Operating
Earnings (Loss)
|
||||||||||||||||||
|
2009
|
2008
|
2007
|
2009
|
2008
|
2007
|
||||||||||||||
|
Program
management:
|
|||||||||||||||||||
|
Skilled
nursing rehabilitation services
|
$
|
496,250
|
$
|
457,229
|
$
|
432,910
|
$
|
37,753
|
$
|
25,544
|
$
|
7,249
|
|||||||
|
Hospital
rehabilitation services
|
178,168
|
165,658
|
164,102
|
29,487
|
21,997
|
22,893
|
|||||||||||||
|
Program
management total
|
674,418
|
622,887
|
597,012
|
67,240
|
47,541
|
30,142
|
|||||||||||||
|
Hospitals
|
195,009
|
112,525
|
96,001
|
(22,512
|
)
|
(13,903
|
)
|
(1,972
|
)
|
||||||||||
|
Unallocated
corporate expenses (1)
|
N/A
|
N/A
|
N/A
|
(254
|
)
|
(731
|
)
|
(640
|
)
|
||||||||||
|
Total
|
$
|
869,427
|
$
|
735,412
|
$
|
693,013
|
$
|
44,474
|
$
|
32,907
|
$
|
27,530
|
|||||||
|
Depreciation
and Amortization
|
Capital
Expenditures
|
||||||||||||||||||
|
2009
|
2008
|
2007
|
2009
|
2008
|
2007
|
||||||||||||||
|
Program
management:
|
|||||||||||||||||||
|
Skilled
nursing rehabilitation services
|
$
|
6,283
|
$
|
6,835
|
$
|
8,777
|
$
|
2,422
|
$
|
3,824
|
$
|
2,530
|
|||||||
|
Hospital
rehabilitation services
|
2,423
|
2,641
|
4,104
|
1,328
|
1,032
|
442
|
|||||||||||||
|
Program
management total
|
8,706
|
9,476
|
12,881
|
3,750
|
4,856
|
2,972
|
|||||||||||||
|
Hospitals
|
7,793
|
5,094
|
3,657
|
9,465
|
13,604
|
6,824
|
|||||||||||||
|
Healthcare
management consulting (2)
|
N/A
|
N/A
|
N/A
|
—
|
42
|
193
|
|||||||||||||
|
Total
|
$
|
16,499
|
$
|
14,570
|
$
|
16,538
|
$
|
13,215
|
$
|
18,502
|
$
|
9,989
|
|||||||
|
Total
Assets
|
|||||||||||
|
as
of December 31,
|
|||||||||||
|
2009
|
2008
|
2007
|
|||||||||
|
Program
management:
|
|||||||||||
|
Skilled
nursing rehabilitation services
|
$
|
187,744
|
$
|
198,236
|
$
|
201,482
|
|||||
|
Hospital
rehabilitation services
|
127,212
|
115,044
|
105,292
|
||||||||
|
Program
management total
|
314,956
|
313,280
|
306,774
|
||||||||
|
Hospitals
(3)
|
795,024
|
118,267
|
93,659
|
||||||||
|
Healthcare
management consulting
|
—
|
6,859
|
8,127
|
||||||||
|
Total
|
$
|
1,109,980
|
$
|
438,406
|
$
|
408,560
|
|||||
|
|
(1)
|
Represents
general corporate overhead expenses associated with Phase 2 Consulting,
Inc., which was sold effective June 1, 2009. All other costs
and expenses associated with Phase 2 have been reported in discontinued
operations.
|
|
|
(2)
|
The
healthcare management consulting segment consists of Phase 2 Consulting,
Inc., which was sold effective June 1, 2009. Depreciation and
amortization expense associated with Phase 2 has been reported in
discontinued operations.
|
|
|
(3)
|
Hospitals
segment total assets include the carrying value of the Company’s
investment in HRSC.
|
| (20) | Quarterly Financial Information (Unaudited) |
|
Quarter
Ended
|
||||||||||||||||
|
2009
|
December
31
|
September
30
|
June
30
|
March
31
|
||||||||||||
|
(in
thousands, except per share data)
|
||||||||||||||||
|
Operating
revenues
|
$
|
254,692
|
$
|
208,040
|
$
|
205,164
|
$
|
201,531
|
||||||||
|
Operating
earnings (1)
|
6,872
|
10,480
|
12,832
|
14,290
|
||||||||||||
|
Earnings
from continuing operations, net of tax
|
295
|
5,706
|
7,430
|
8,397
|
||||||||||||
|
Gain
(loss) from discontinued operations, net of tax
|
8
|
(16
|
)
|
(882
|
)
|
51
|
||||||||||
|
Net
earnings
|
303
|
5,690
|
6,548
|
8,448
|
||||||||||||
|
Net
earnings attributable to RehabCare
|
655
|
6,757
|
6,883
|
8,660
|
||||||||||||
|
Net
earnings per share attributable to RehabCare:
|
||||||||||||||||
|
Basic
|
0.03
|
0.38
|
0.39
|
0.49
|
||||||||||||
|
Diluted
|
0.03
|
0.37
|
0.38
|
0.48
|
||||||||||||
|
Quarter
Ended
|
||||||||||||||||
|
2008
|
December
31
|
September
30
|
June
30
|
March
31
|
||||||||||||
|
(in
thousands, except per share data)
|
||||||||||||||||
|
Operating
revenues
|
$
|
192,059
|
$
|
181,350
|
$
|
181,899
|
$
|
180,104
|
||||||||
|
Operating
earnings
|
9,511
|
7,080
|
7,786
|
8,530
|
||||||||||||
|
Earnings
from continuing operations, net of tax
|
5,408
|
3,666
|
4,008
|
4,500
|
||||||||||||
|
Loss
from discontinued operations, net of tax
|
(352
|
)
|
(280
|
)
|
(159
|
)
|
(72
|
)
|
||||||||
|
Net
earnings
|
5,056
|
3,386
|
3,849
|
4,428
|
||||||||||||
|
Net
earnings attributable to RehabCare
|
5,703
|
3,998
|
4,496
|
4,508
|
||||||||||||
|
Net
earnings per share attributable to RehabCare:
|
||||||||||||||||
|
Basic
|
0.32
|
0.23
|
0.26
|
0.26
|
||||||||||||
|
Diluted
|
0.32
|
0.22
|
0.25
|
0.25
|
||||||||||||
| (21) | Contingencies |
| ITEM 9. | CHANGES IN AND DISAGREEMENTS WITH ACCOUNTANTS |
| ON ACCOUNTING AND FINANCIAL DISCLOSURE |
| ITEM 9A. | CONTROLS AND PROCEDURES |
| ITEM 9B. | OTHER INFORMATION |
| ITEM 10. | DIRECTORS, EXECUTIVE OFFICERS AND CORPORATE GOVERNANCE |
|
|
·
|
Information
regarding directors who are standing for reelection and any persons
nominated to become directors is set forth under the caption "Election of
Directors."
|
|
|
·
|
Information
regarding the Company’s audit committee and designated "audit committee
financial experts" is set forth under the caption "Audit
Committee."
|
|
|
·
|
Information
regarding Section 16(a) beneficial ownership reporting compliance is set
forth under the caption "Section 16(a) Beneficial Ownership Reporting
Compliance."
|
|
Name
|
Age
|
Position
|
||
|
John
H. Short, Ph.D.
|
65
|
President
and Chief Executive Officer
|
||
|
Jay
W. Shreiner
|
59
|
Executive
Vice President, Chief Financial Officer
|
||
|
Patricia
S. Williams
|
42
|
Senior
Vice President, General Counsel and Secretary
|
||
|
Patricia
M. Henry
|
57
|
Executive
Vice President, Operations
|
||
|
Mary
Pat Welc
|
55
|
Senior
Vice President, Operations
|
||
|
Kevin
J. Gross
|
54
|
Senior
Vice President, Operations
|
||
|
James
F. Martin
|
59
|
Senior
Vice President, Chief Human Resources Officer
|
||
|
Jeff
A. Zadoks
|
44
|
Senior
Vice President, Chief Accounting Officer
|
||
|
Samuel
W. Duggan II
|
46
|
Vice
President, Treasurer
|
|
ITEM
11.
|
EXECUTIVE
COMPENSATION
|
| ITEM 12. | SECURITY OWNERSHIP OF CERTAIN BENEFICIAL OWNERS AND |
| MANAGEMENT AND RELATED STOCKHOLDER MATTERS |
|
Plan
category
|
Number
of
securities
to
be
issued
upon
exercise
of
outstanding
options,
warrants
and
rights
(a)
|
Weighted-average
exercise
price of
outstanding
options,
warrants
and
rights
(b)
|
Number
of securities
remaining
available
for
future issuance
under
equity
compensation
plans
(excluding
securities
reflected
in column (a))
(c)
|
|
|
Equity
compensation plans approved by security holders
|
870,829
|
$25.11
|
274,903
|
(1)
|
|
Equity
compensation plans not approved by security holders
|
-
|
-
|
-
|
|
|
Total
|
870,829
|
$25.11
|
274,903
|
|
|
|
(1)
|
Represents
the number of shares of common stock available for future issuance under
the Company’s 2006 Equity Incentive Plan. Permissible awards
under the Company’s plan include stock options, stock appreciation rights,
restricted stock, stock units and other equity-based
awards.
|
|
ITEM 13.
|
CERTAIN
RELATIONSHIPS AND RELATED TRANSACTIONS, AND DIRECTOR
INDEPENDENCE
|
| ITEM 14. | PRINCIPAL ACCOUNTANT FEES AND SERVICES |
|
ITEM
15.
|
EXHIBITS
AND FINANCIAL STATEMENT SCHEDULES
|
|
(a)
|
The
following documents are filed as part of this Annual Report on Form
10-K:
|
||
|
(1)
|
Financial
Statements:
|
||
|
Report
of Independent Registered Public Accounting Firm
|
|||
|
Consolidated
Balance Sheets as of December 31, 2009 and 2008
|
|||
|
Consolidated
Statements of Earnings for the years ended December 31, 2009, 2008 and
2007
|
|||
|
Consolidated
Statements of Comprehensive Income for the years ended December 31, 2009,
2008 and 2007
|
|||
|
Consolidated
Statements of Changes in Equity for the years ended December 31, 2009,
2008 and 2007
|
|||
|
Consolidated
Statements of Cash Flows for the years ended December 31, 2009, 2008 and
2007
|
|||
|
Notes
to Consolidated Financial Statements
|
|||
|
(2)
|
Financial
Statement Schedules:
|
||
|
None
|
|||
|
(3)
|
Exhibits:
|
||
|
See
Exhibit Index on page 88 of this Annual Report on Form
10-K.
|
|||
|
|
SIGNATURES
|
|
REHABCARE
GROUP, INC.
|
|
| (Registrant) | |
|
By
:
|
/s/
John H.
Short
|
|
John
H. Short
|
|
|
President
and Chief Executive Officer
|
|
Signature
|
Title
|
Dated
|
||
|
/s/
John H.
Short
|
President,
Chief Executive
|
March
8, 2010
|
||
|
John
H. Short
|
Officer
and Director
|
|||
|
(Principal
Executive Officer)
|
||||
|
/s/
Jay W.
Shreiner
|
Executive
Vice President and
|
March
8, 2010
|
||
|
Jay
W. Shreiner
|
Chief
Financial Officer
|
|||
|
(Principal
Financial Officer)
|
||||
|
/s/
Jeff A.
Zadoks
|
Senior
Vice President and
|
March
8, 2010
|
||
|
Jeff
A. Zadoks
|
Chief
Accounting Officer
|
|||
|
(Principal
Accounting Officer)
|
||||
|
/s/
Colleen
Conway-Welch
|
Director
|
March
8, 2010
|
||
|
Colleen
Conway-Welch
|
||||
|
/s/
Christopher T.
Hjelm
|
Director
|
March
8, 2010
|
||
|
Christopher
T. Hjelm
|
||||
|
/s/
Anthony S.
Piszel
|
Director
|
March
8, 2010
|
||
|
Anthony
S. Piszel
|
||||
|
/s/
Suzan L.
Rayner
|
Director
|
March
8, 2010
|
||
|
Suzan
L. Rayner
|
||||
|
/s/
Harry E.
Rich
|
Director
|
March
8, 2010
|
||
|
Harry
E. Rich
|
||||
|
/s/
Larry
Warren
|
Director
|
March
8, 2010
|
||
|
Larry
Warren
|
||||
|
/s/
Theodore M.
Wight
|
Director
|
March
8, 2010
|
||
|
Theodore
M. Wight
|
||||
|
2.1
|
Agreement
and Plan of Merger, dated November 3, 2009, between the Registrant,
RehabCare Group East, Inc., RehabCare Hospital Holdings, L.L.C., RehabCare
Merger Sub Corporation, Triumph HealthCare Holdings, Inc. and TA
Associates, Inc. (filed as Exhibit 99.2 to the Registrant’s Current Report
on Form 8-K dated November 3, 2009 and incorporated herein by
reference)
|
|
3.1
|
Restated
Certificate of Incorporation (filed as Exhibit 3.1 to the Registrant’s
Registration Statement on Form S-1, dated May 9, 1991 [Registration No.
33-40467], and incorporated herein by
reference)
|
|
3.2
|
Certificate
of Amendment of Certificate of Incorporation (filed as Exhibit 3.1 to the
Registrant’s Quarterly Report on Form 10-Q for the quarter ended May 31,
1995 and incorporated herein by
reference)
|
|
3.3
|
Amended
and Restated Bylaws, dated October 30, 2007 (filed as Exhibit 3.1 to the
Registrant’s Current Report on Form 8-K dated October 31, 2007 and
incorporated herein by reference)
|
|
4.1
|
Rights
Agreement, dated August 28, 2002, by and between the Registrant and
Computershare Trust Company, Inc. (filed as Exhibit 1 to the Registrant’s
Registration Statement on Form 8-A filed September 5, 2002 and
incorporated herein by reference)
|
|
10.1
|
1987
Incentive Stock Option and 1987 Nonstatutory Stock Option Plans (filed as
Exhibit 10.1 to the Registrant’s Registration Statement on Form S-1, dated
May 9, 1991 [Registration No. 33-40467] and incorporated herein by
reference) *
|
|
10.2
|
Form
of Stock Option Agreement for 1987 Incentive Stock Option and 1987
Nonstatutory Stock Option Plans (filed as Exhibit 10.2 to the Registrant’s
Registration Statement on Form S-1, dated May 9, 1991 [Registration No.
33-40467] and incorporated herein by reference) *
|
|
10.3
|
Termination
Compensation Agreement, dated December 11, 2007 by and between RehabCare
Group, Inc. and John H. Short, Ph.D. (filed as Exhibit 10.1 to
Registrant’s Annual Report on Form 8-K dated December 12, 2007 and
incorporated herein by reference) *
|
|
10.4
|
Amendment
to Termination Compensation Agreement, dated December 11, 2007 by and
between RehabCare Group, Inc. and John H. Short, Ph.D. (filed as Exhibit
10.1 to Registrant’s Current Report on Form 8-K dated December 12, 2008
and incorporated herein by reference)
*
|
|
10.5
|
Termination
Compensation Agreement dated December 8, 2008 by and between RehabCare
Group, Inc. and Jay W. Shreiner (filed as Exhibit 10.2 to Registrant’s
Current Report on Form 8-K dated December 12, 2008 and incorporated herein
by reference) *
|
|
10.6
|
Termination
Compensation Agreement dated December 8, 2008 by and between RehabCare
Group, Inc. and Patricia M. Henry (filed as Exhibit 10.3 to Registrant’s
Current Report on Form 8-K dated December 12, 2008 and incorporated herein
by reference) *
|
|
10.7
|
Form
of Change in Control Termination Agreement dated December 8, 2008 by and
between RehabCare Group, Inc. and Mary Patricia Welc (filed as Exhibit
10.4 to Registrant’s Current Report on Form 8-K dated December 12, 2008
and incorporated herein by reference)
*
|
|
10.8
|
Change
in Control Termination Agreement dated November 12, 2007 by and between
RehabCare Group, Inc. and Patricia S. Williams (filed as Exhibit 10.6 to
Registrant’s Annual Report on Form 10-K for the year ended December 31,
2007 and incorporated herein by reference)
*
|
|
10.9
|
Form
of Termination Compensation Agreement dated March 10, 2006 by and between
RehabCare Group, Inc. and other executive officers who are not named
executive officers in the Registrant’s proxy statement for the 2006 annual
meeting of stockholders (filed as Exhibit 10.5 to Registrant’s Annual
Report on Form 10-K for the year ended December 31, 2005 and incorporated
herein by reference) *
|
|
10.10
|
RehabCare
Severance Plan for Company Senior Vice Presidents effective January 1,
2009 (filed as Exhibit 10.5 to Registrant’s Current Report on Form 8-K
dated December 12, 2008 and incorporated herein by reference)
*
|
|
10.11
|
RehabCare
Severance Plan for Company Vice Presidents effective January 1, 2009
(filed as Exhibit 10.6 to Registrant’s Current Report on Form 8-K dated
December 12, 2008 and incorporated herein by reference)
*
|
|
10.12
|
RehabCare
Executive Deferred Compensation Plan (filed as Exhibit 10.12 to the
Registrant’s Report on Form 10-K, dated May 27, 1994 and incorporated
herein by reference) *
|
|
10.13
|
RehabCare
Executive Deferred Compensation Plan as amended and restated effective
January 1, 2009 (filed as Exhibit 10.7 to Registrant’s Current Report on
Form 8-K dated December 12, 2008 and incorporated herein by reference)
*
|
|
10.14
|
RehabCare
Directors’ Stock Option Plan (filed as Appendix A to Registrant’s
definitive Proxy Statement for the 1994 Annual Meeting of Stockholders and
incorporated herein by reference) *
|
|
10.15
|
Second
Amended and Restated 1996 Long-Term Performance Plan (filed as Appendix B
to Registrant’s definitive Proxy Statement for the 2004 Annual Meeting of
Stockholders and incorporated herein by reference) *
|
|
10.16
|
Form
of Stock Option Agreement for the Second Amended and Restated 1996
Long-Term Performance Plan (filed as Exhibit 10.10 to the Registrant’s
Annual Report on Form 10-K for the year ended December 31, 2005 and
incorporated herein by reference) *
|
|
10.17
|
Form
of Restricted Stock Agreement for the Second Amended and Restated 1996
Long-Term Performance Plan (filed as Exhibit 10.11 to the Registrant’s
Annual Report on Form 10-K for the year ended December 31, 2005 and
incorporated herein by reference) *
|
|
10.18
|
RehabCare
Group, Inc. 2006 Equity Incentive Plan (filed as Appendix A to the
Registrant’s Definitive Proxy Statement for the 2006 Annual Meeting of
Shareholders and incorporated herein by reference)
*
|
|
10.19
|
Amended
and Restated Credit Agreement, dated November 24, 2009, by and among
RehabCare Group, Inc., as borrower, certain subsidiaries and affiliates of
the borrower, as guarantors, and Bank of America, N.A., as administrative
agent and collateral agent, and Banc of America Securities LLC, RBC
Capital Markets and BNP Paribas Securities Corp., as joint lead arrangers
(filed as Exhibit 10.1 to the Registrant’s Current Report on Form 8-K
dated November 24, 2009 and incorporated herein by
reference)
|
|
10.20
|
Pledge
Agreement, dated as of November 24, 2009, by and among RehabCare Group,
Inc. and subsidiaries, as pledgors, and Bank of America, N.A., as
collateral agent (filed as Exhibit 10.1 to the Registrant’s Current Report
on Form 8-K dated November 24, 2009 and incorporated herein by
reference)
|
|
10.21
|
Security
Agreement, dated as of November 24, 2009, by and among RehabCare Group,
Inc. and subsidiaries, as grantors, and Bank of America, N.A., as
collateral agent (filed as Exhibit 10.1 to the Registrant’s Current Report
on Form 8-K dated November 24, 2009 and incorporated herein by
reference)
|
|
10.22
|
Non-Continuous
Aircraft Dry Lease Agreement by and between 55JS Limited, Co. and
RehabCare Group, Inc. (filed as Exhibit 10.1 to Registrant’s Current
Report on Form 8-K dated September 7, 2006 and incorporated herein by
reference)
|
|
10.23
|
Asset
Purchase Agreement dated June 8, 2005 by and among RehabCare Group East,
Inc., a wholly owned subsidiary of Registrant, MeadowBrook HealthCare,
Inc., MeadowBrook Specialty Hospital of Tulsa LLC, Lafayette Rehab
Associate Limited Partnership, Clear Lake Rehabilitation Hospital, Inc.
and South Dade Rehab Associates Limited Partnership (filed as Exhibit 10.1
to Registrant’s Current Report on Form 8-K dated August 4, 2005 and
incorporated herein by reference)
|
|
10.24
|
Purchase
and Sale Agreement, dated May 3, 2006, by and among LUK-Symphony
Management, LLC, Symphony Health Services, LLC and RehabCare Group, Inc.
(filed as exhibit 10.1 to the Registrant’s Current Report on Form 8-K
dated May 8, 2006 and incorporated herein by
reference)
|
|
10.25
|
Termination
Compensation Agreement dated July 1, 2008 by and between RehabCare Group,
Inc. and Kevin Gross (filed as Exhibit 10.2 to Registrant’s Current Report
on Form 8-K dated July 7, 2008 and incorporated herein by reference)
*
|
|
21.1
|
Subsidiaries
of the Registrant (filed herewith)
|
|
23.1
|
Consent
of KPMG LLP (filed herewith)
|
|
31.1
|
Certification
by Chief Executive Officer in accordance with Rule 13a-14(a) under the
Securities Exchange Act of 1934, as adopted pursuant to Section 302 of the
Sarbanes-Oxley Act of 2002 (filed
herewith)
|
|
31.2
|
Certification
by Chief Financial Officer in accordance with Rule 13a-14(a) under the
Securities Exchange Act of 1934, as adopted pursuant to Section 302 of the
Sarbanes-Oxley Act of 2002 (filed
herewith)
|
|
32.1
|
Certification
by Chief Executive Officer in accordance with 18 U.S.C. Section 1350, as
adopted pursuant to Section 906 of the Sarbanes-Oxley Act of 2002 (filed
herewith)
|
|
32.2
|
Certification
by Chief Financial Officer in accordance with 18 U.S.C. Section 1350, as
adopted pursuant to Section 906 of the Sarbanes-Oxley Act of 2002 (filed
herewith)
|