| Table of Contents |  | ||||
| Second Quarter 2025 | |||||
| Supplemental Financial and Operating Data | Page | ||||
| Income Statements | |||||
| Volumes and Prices | |||||
| Balance Sheets | |||||
| Cash Flow Statements | |||||
| Non-GAAP Financial Measures | |||||
| Adjusted Net Income | |||||
| Net Income Per Share | |||||
| Adjusted Net Income Per Share | |||||
| Cash Flow from Operations and Free Cash Flow | |||||
| Net Debt-to-Total Capitalization Ratio | |||||
| Revenues, Costs and Margins Per Barrel of Oil Equivalent | |||||
| Additional Key Financial Information | |||||
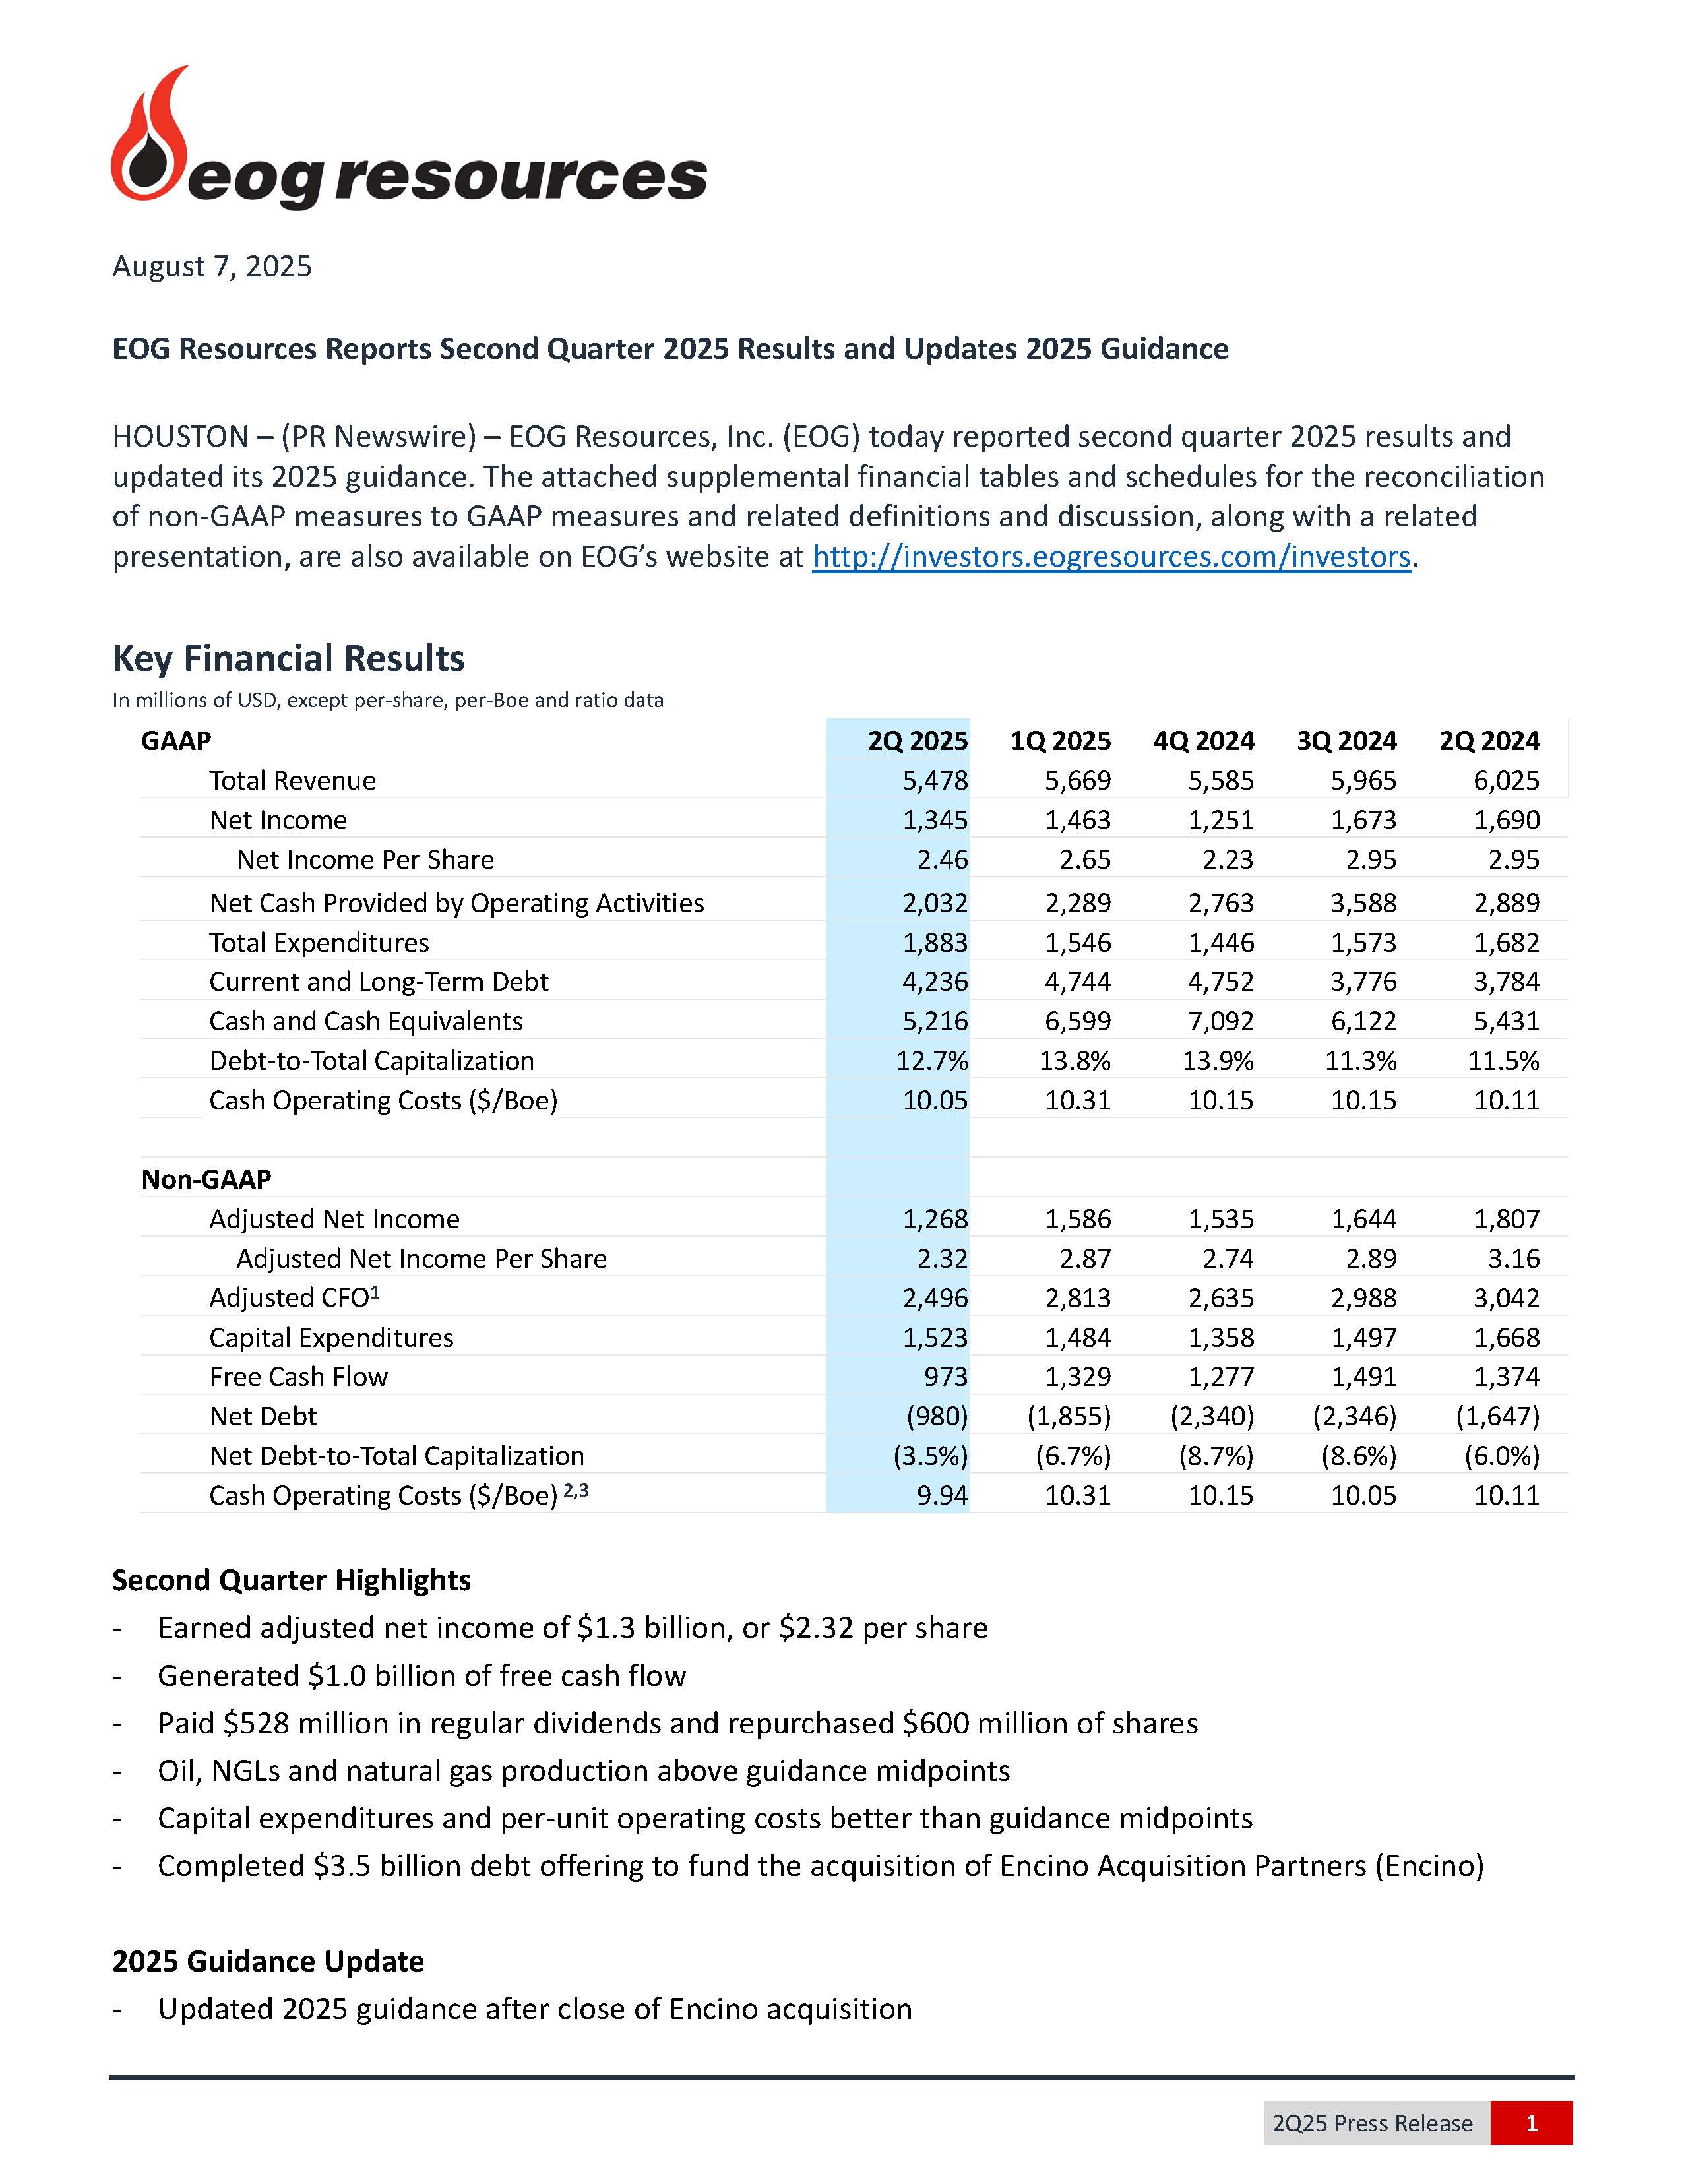
| Income Statements | | ||||||||||||||||||||||||||||||||||
| In millions of USD, except share data (in millions) and per share data (Unaudited) | |||||||||||||||||||||||||||||||||||
| 2024 | 2025 | ||||||||||||||||||||||||||||||||||
| 1st Qtr | 2nd Qtr | 3rd Qtr | 4th Qtr | Year | 1st Qtr | 2nd Qtr | 3rd Qtr | 4th Qtr | Year | ||||||||||||||||||||||||||
| Operating Revenues and Other | |||||||||||||||||||||||||||||||||||
| Crude Oil and Condensate | 3,480 | 3,692 | 3,488 | 3,261 | 13,921 | 3,293 | 2,974 | 6,267 | |||||||||||||||||||||||||||
| Natural Gas Liquids | 513 | 515 | 524 | 554 | 2,106 | 572 | 534 | 1,106 | |||||||||||||||||||||||||||
| Natural Gas | 382 | 303 | 372 | 494 | 1,551 | 637 | 600 | 1,237 | |||||||||||||||||||||||||||
| Gains (Losses) on Mark-to-Market Financial Commodity and Other Derivative Contracts, Net | 237 | (47) | 79 | (65) | 204 | (191) | 107 | (84) | |||||||||||||||||||||||||||
| Gathering, Processing and Marketing | 1,459 | 1,519 | 1,481 | 1,341 | 5,800 | 1,340 | 1,247 | 2,587 | |||||||||||||||||||||||||||
| Gains (Losses) on Asset Dispositions, Net | 26 | 20 | (7) | (23) | 16 | (1) | — | (1) | |||||||||||||||||||||||||||
| Other, Net | 26 | 23 | 28 | 23 | 100 | 19 | 16 | 35 | |||||||||||||||||||||||||||
| Total | 6,123 | 6,025 | 5,965 | 5,585 | 23,698 | 5,669 | 5,478 | 11,147 | |||||||||||||||||||||||||||
| Operating Expenses | |||||||||||||||||||||||||||||||||||
| Lease and Well | 396 | 390 | 392 | 394 | 1,572 | 401 | 396 | 797 | |||||||||||||||||||||||||||
| Gathering, Processing and Transportation Costs | 413 | 423 | 445 | 441 | 1,722 | 440 | 455 | 895 | |||||||||||||||||||||||||||
| Exploration Costs | 45 | 34 | 43 | 52 | 174 | 41 | 74 | 115 | |||||||||||||||||||||||||||
| Dry Hole Costs | 1 | 5 | — | 8 | 14 | 34 | 11 | 45 | |||||||||||||||||||||||||||
| Impairments | 19 | 81 | 15 | 276 | 391 | 44 | 39 | 83 | |||||||||||||||||||||||||||
| Marketing Costs | 1,404 | 1,490 | 1,500 | 1,323 | 5,717 | 1,325 | 1,216 | 2,541 | |||||||||||||||||||||||||||
| Depreciation, Depletion and Amortization | 1,074 | 984 | 1,031 | 1,019 | 4,108 | 1,013 | 1,053 | 2,066 | |||||||||||||||||||||||||||
| General and Administrative | 162 | 151 | 167 | 189 | 669 | 171 | 186 | 357 | |||||||||||||||||||||||||||
| Taxes Other Than Income | 338 | 337 | 283 | 291 | 1,249 | 341 | 301 | 642 | |||||||||||||||||||||||||||
| Total | 3,852 | 3,895 | 3,876 | 3,993 | 15,616 | 3,810 | 3,731 | 7,541 | |||||||||||||||||||||||||||
| Operating Income | 2,271 | 2,130 | 2,089 | 1,592 | 8,082 | 1,859 | 1,747 | 3,606 | |||||||||||||||||||||||||||
| Other Income, Net | 62 | 66 | 76 | 70 | 274 | 65 | 55 | 120 | |||||||||||||||||||||||||||
| Income Before Interest Expense and Income Taxes | 2,333 | 2,196 | 2,165 | 1,662 | 8,356 | 1,924 | 1,802 | 3,726 | |||||||||||||||||||||||||||
| Interest Expense, Net | 33 | 36 | 31 | 38 | 138 | 47 | 51 | 98 | |||||||||||||||||||||||||||
| Income Before Income Taxes | 2,300 | 2,160 | 2,134 | 1,624 | 8,218 | 1,877 | 1,751 | 3,628 | |||||||||||||||||||||||||||
| Income Tax Provision | 511 | 470 | 461 | 373 | 1,815 | 414 | 406 | 820 | |||||||||||||||||||||||||||
| Net Income | 1,789 | 1,690 | 1,673 | 1,251 | 6,403 | 1,463 | 1,345 | 2,808 | |||||||||||||||||||||||||||
| Dividends Declared per Common Share | 0.9100 | 0.9100 | 0.9100 | 0.9750 | 3.7050 | 0.9750 | 1.9950 | 2.9700 | |||||||||||||||||||||||||||
| Net Income Per Share | |||||||||||||||||||||||||||||||||||
| Basic | 3.11 | 2.97 | 2.97 | 2.25 | 11.31 | 2.66 | 2.48 | 5.13 | |||||||||||||||||||||||||||
| Diluted | 3.10 | 2.95 | 2.95 | 2.23 | 11.25 | 2.65 | 2.46 | 5.11 | |||||||||||||||||||||||||||
| Average Number of Common Shares | |||||||||||||||||||||||||||||||||||
| Basic | 575 | 569 | 564 | 557 | 566 | 550 | 543 | 547 | |||||||||||||||||||||||||||
| Diluted | 577 | 572 | 568 | 561 | 569 | 553 | 546 | 549 | |||||||||||||||||||||||||||
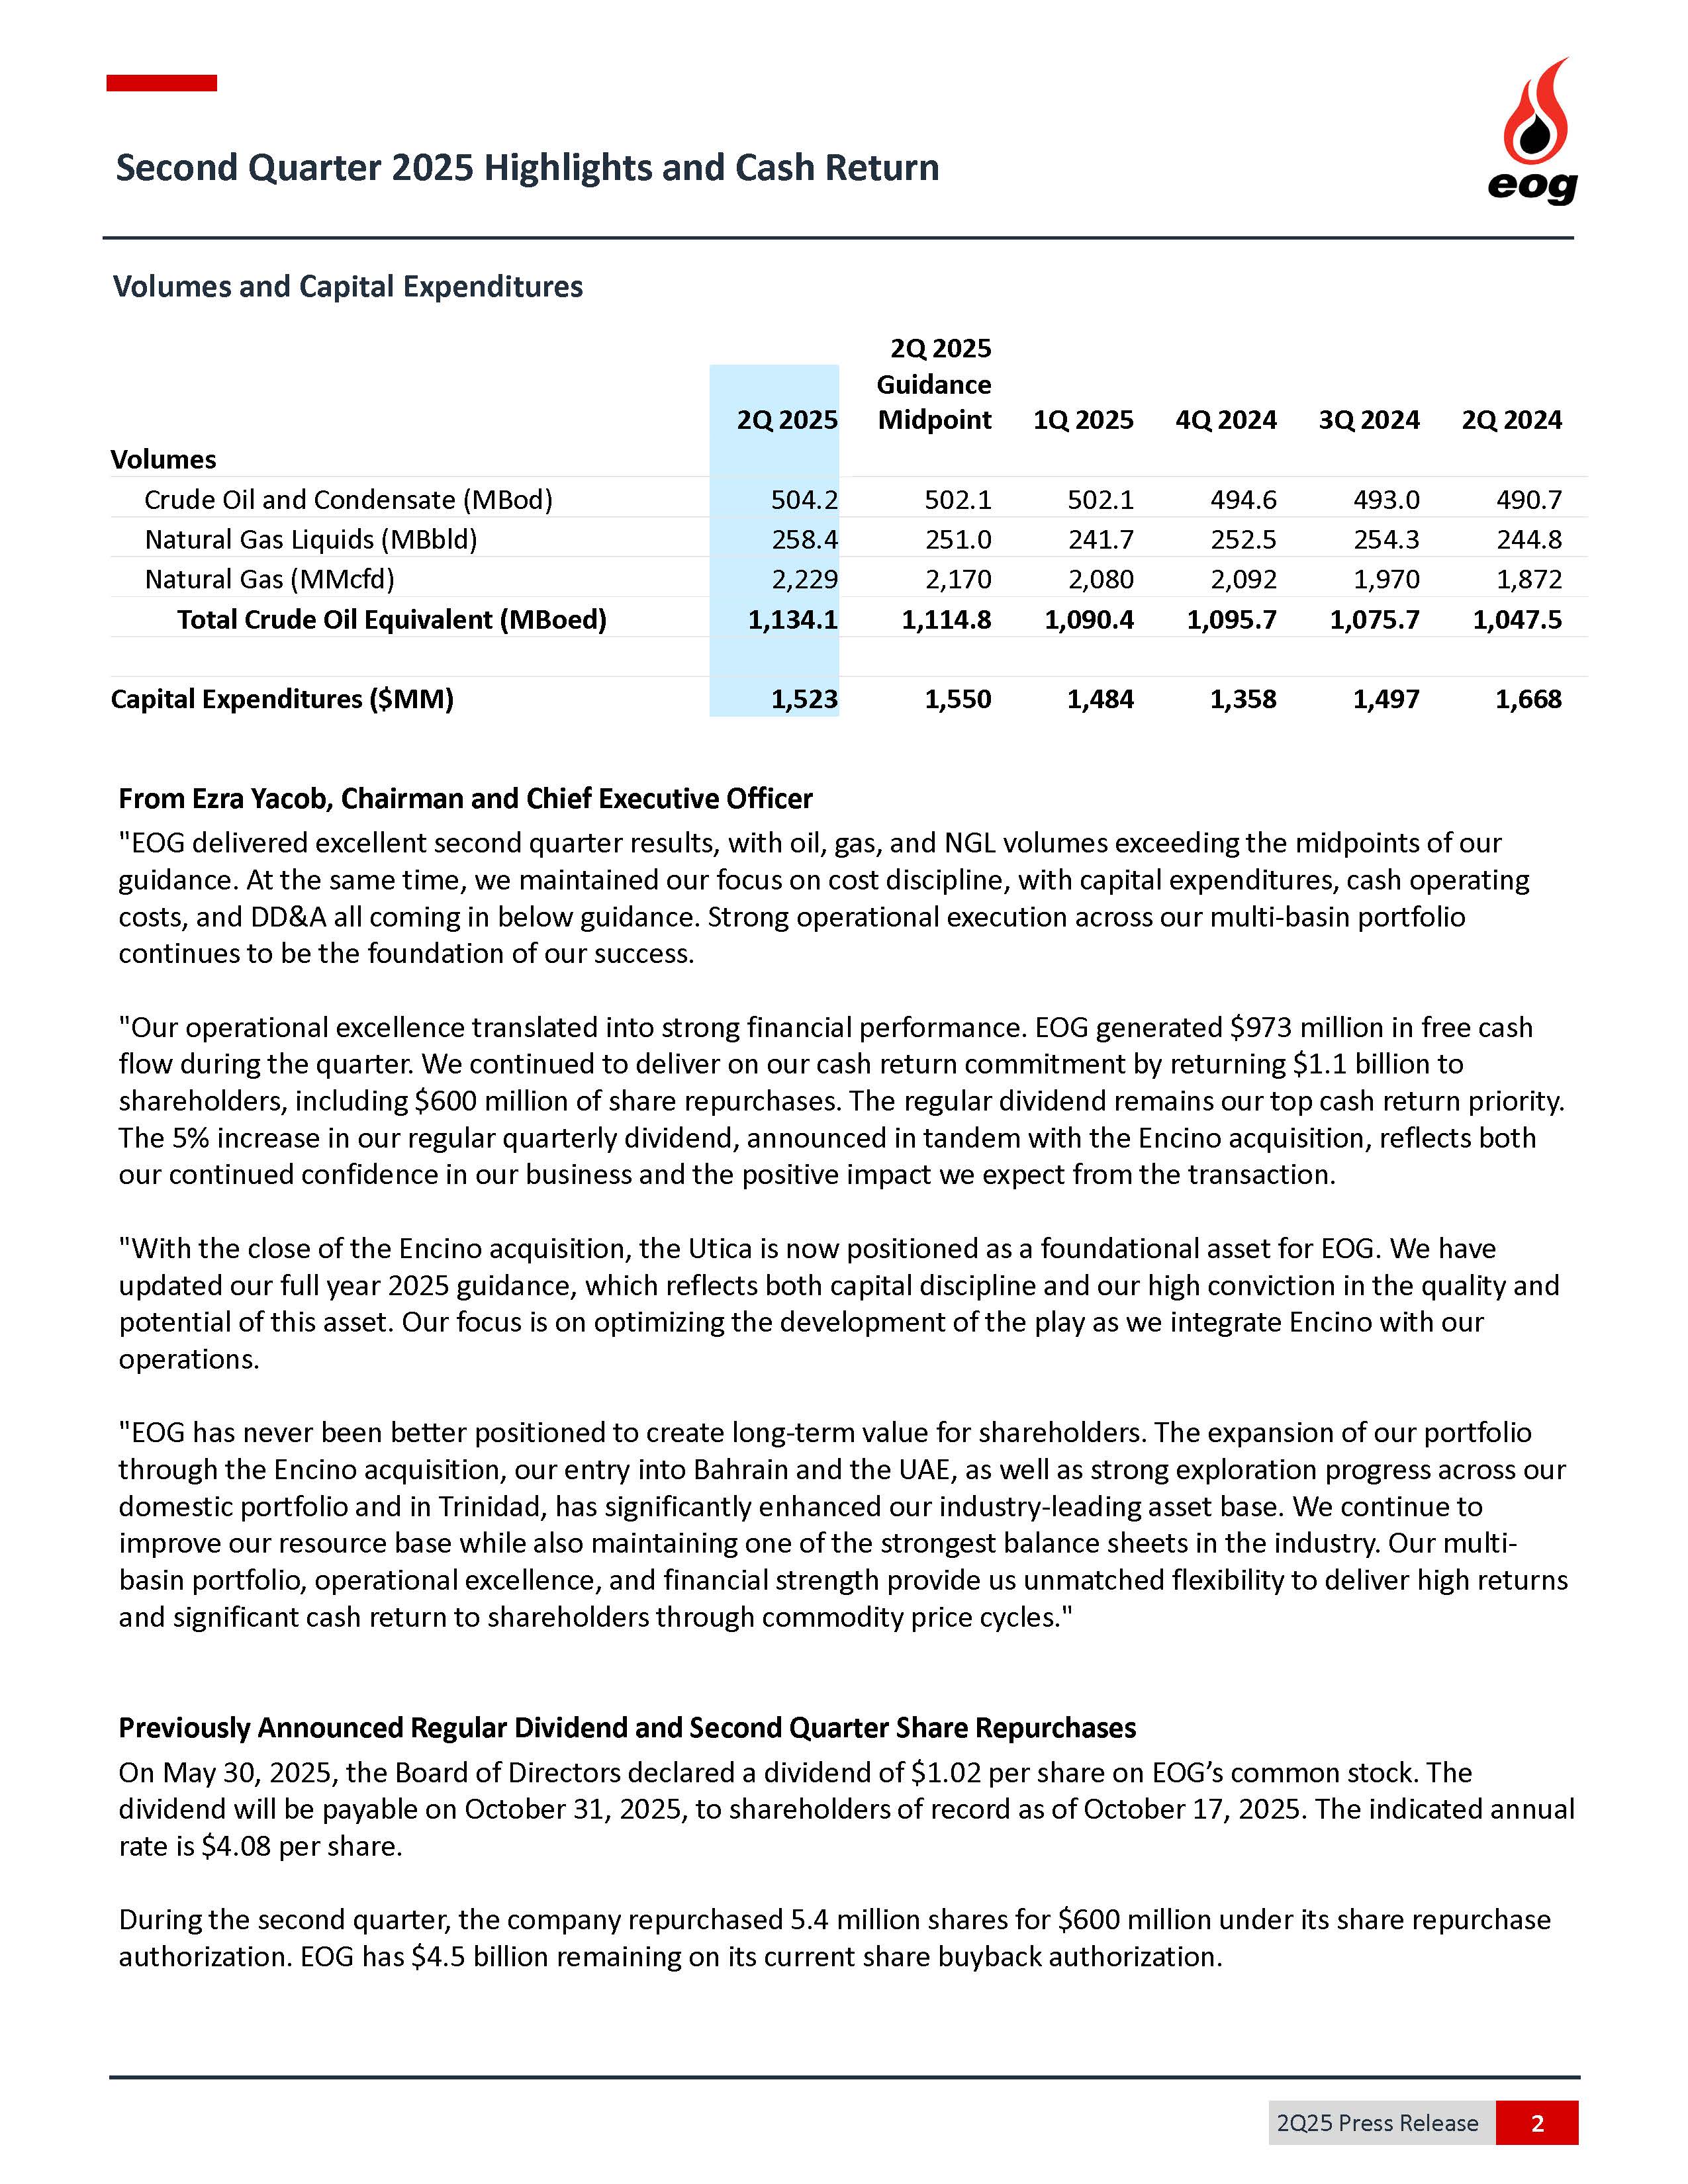
| Volumes and Prices | | ||||||||||||||||||||||||||||||||||
| (Unaudited) | |||||||||||||||||||||||||||||||||||
| 2024 | 2025 | ||||||||||||||||||||||||||||||||||
| 1st Qtr | 2nd Qtr | 3rd Qtr | 4th Qtr | Year | 1st Qtr | 2nd Qtr | 3rd Qtr | 4th Qtr | Year | ||||||||||||||||||||||||||
Crude Oil and Condensate Volumes (MBbld) (A) | |||||||||||||||||||||||||||||||||||
| United States | 486.8 | 490.1 | 491.8 | 493.5 | 490.6 | 500.9 | 503.1 | 502.0 | |||||||||||||||||||||||||||
| Trinidad | 0.6 | 0.6 | 1.2 | 1.1 | 0.8 | 1.2 | 1.1 | 1.1 | |||||||||||||||||||||||||||
| Total | 487.4 | 490.7 | 493.0 | 494.6 | 491.4 | 502.1 | 504.2 | 503.1 | |||||||||||||||||||||||||||
Average Crude Oil and Condensate Prices ($/Bbl) (B) | |||||||||||||||||||||||||||||||||||
| United States | $ | 78.46 | $ | 82.71 | $ | 76.95 | $ | 71.68 | $ | 77.42 | $ | 72.90 | $ | 64.84 | $ | 68.84 | |||||||||||||||||||
| Trinidad | 67.50 | 70.75 | 63.15 | 60.47 | 64.43 | 61.12 | 54.50 | 57.84 | |||||||||||||||||||||||||||
| Composite | 78.45 | 82.69 | 76.92 | 71.66 | 77.40 | 72.87 | 64.82 | 68.81 | |||||||||||||||||||||||||||
Natural Gas Liquids Volumes (MBbld) (A) | |||||||||||||||||||||||||||||||||||
| United States | 231.7 | 244.8 | 254.3 | 252.5 | 245.9 | 241.7 | 258.4 | 250.1 | |||||||||||||||||||||||||||
| Total | 231.7 | 244.8 | 254.3 | 252.5 | 245.9 | 241.7 | 258.4 | 250.1 | |||||||||||||||||||||||||||
Average Natural Gas Liquids Prices ($/Bbl) (B) | |||||||||||||||||||||||||||||||||||
| United States | $ | 24.32 | $ | 23.11 | $ | 22.42 | $ | 23.85 | $ | 23.40 | $ | 26.29 | $ | 22.70 | $ | 24.42 | |||||||||||||||||||
| Composite | 24.32 | 23.11 | 22.42 | 23.85 | 23.40 | 26.29 | 22.70 | 24.42 | |||||||||||||||||||||||||||
Natural Gas Volumes (MMcfd) (A) | |||||||||||||||||||||||||||||||||||
| United States | 1,658 | 1,668 | 1,745 | 1,840 | 1,728 | 1,834 | 1,977 | 1,906 | |||||||||||||||||||||||||||
| Trinidad | 200 | 204 | 225 | 252 | 220 | 246 | 252 | 249 | |||||||||||||||||||||||||||
| Total | 1,858 | 1,872 | 1,970 | 2,092 | 1,948 | 2,080 | 2,229 | 2,155 | |||||||||||||||||||||||||||
Average Natural Gas Prices ($/Mcf) (B) | |||||||||||||||||||||||||||||||||||
| United States | $ | 2.10 | $ | 1.57 | $ | 1.84 | $ | 2.39 | $ | 1.99 | $ | 3.36 | $ | 2.87 | $ | 3.10 | |||||||||||||||||||
| Trinidad | 3.54 | 3.48 | 3.68 | 3.86 | 3.65 | 3.78 | 3.65 | 3.71 | |||||||||||||||||||||||||||
| Composite | 2.26 | 1.78 | 2.05 | 2.57 | 2.17 | 3.41 | 2.96 | 3.17 | |||||||||||||||||||||||||||
Crude Oil Equivalent Volumes (MBoed) (C) | |||||||||||||||||||||||||||||||||||
| United States | 994.7 | 1,013.0 | 1,037.1 | 1,052.7 | 1,024.5 | 1,048.3 | 1,090.9 | 1,069.7 | |||||||||||||||||||||||||||
| Trinidad | 34.1 | 34.5 | 38.6 | 43.0 | 37.6 | 42.1 | 43.2 | 42.7 | |||||||||||||||||||||||||||
| Total | 1,028.8 | 1,047.5 | 1,075.7 | 1,095.7 | 1,062.1 | 1,090.4 | 1,134.1 | 1,112.4 | |||||||||||||||||||||||||||
Total MMBoe (C) | 93.6 | 95.3 | 99.0 | 100.8 | 388.7 | 98.1 | 103.2 | 201.3 | |||||||||||||||||||||||||||
| Balance Sheets | | ||||||||||||||||||||||||||||
| In millions of USD (Unaudited) | |||||||||||||||||||||||||||||
| 2024 | 2025 | ||||||||||||||||||||||||||||
| MAR | JUN | SEP | DEC | MAR | JUN | SEP | DEC | ||||||||||||||||||||||
| Current Assets | |||||||||||||||||||||||||||||
| Cash and Cash Equivalents | 5,292 | 5,431 | 6,122 | 7,092 | 6,599 | 5,216 | |||||||||||||||||||||||
| Accounts Receivable, Net | 2,688 | 2,657 | 2,545 | 2,650 | 2,621 | 2,504 | |||||||||||||||||||||||
| Inventories | 1,154 | 1,069 | 1,038 | 985 | 897 | 934 | |||||||||||||||||||||||
| Assets from Price Risk Management Activities | 110 | 4 | — | — | — | — | |||||||||||||||||||||||
Other (A) | 684 | 642 | 460 | 503 | 563 | 591 | |||||||||||||||||||||||
| Total | 9,928 | 9,803 | 10,165 | 11,230 | 10,680 | 9,245 | |||||||||||||||||||||||
| Property, Plant and Equipment | |||||||||||||||||||||||||||||
| Oil and Gas Properties (Successful Efforts Method) | 73,356 | 74,615 | 75,887 | 77,091 | 78,432 | 80,139 | |||||||||||||||||||||||
| Other Property, Plant and Equipment | 5,768 | 6,078 | 6,314 | 6,418 | 6,510 | 6,616 | |||||||||||||||||||||||
| Total Property, Plant and Equipment | 79,124 | 80,693 | 82,201 | 83,509 | 84,942 | 86,755 | |||||||||||||||||||||||
| Less: Accumulated Depreciation, Depletion and Amortization | (46,047) | (47,049) | (48,075) | (49,297) | (50,310) | (51,394) | |||||||||||||||||||||||
| Total Property, Plant and Equipment, Net | 33,077 | 33,644 | 34,126 | 34,212 | 34,632 | 35,361 | |||||||||||||||||||||||
| Deferred Income Taxes | 38 | 44 | 42 | 39 | 44 | 39 | |||||||||||||||||||||||
| Other Assets | 1,753 | 1,733 | 1,818 | 1,705 | 1,626 | 1,639 | |||||||||||||||||||||||
| Total Assets | 44,796 | 45,224 | 46,151 | 47,186 | 46,982 | 46,284 | |||||||||||||||||||||||
| Current Liabilities | |||||||||||||||||||||||||||||
| Accounts Payable | 2,389 | 2,436 | 2,290 | 2,464 | 2,353 | 2,266 | |||||||||||||||||||||||
| Accrued Taxes Payable | 786 | 600 | 855 | 1,007 | 668 | 348 | |||||||||||||||||||||||
| Dividends Payable | 523 | 516 | 513 | 539 | 534 | 1,081 | |||||||||||||||||||||||
| Liabilities from Price Risk Management Activities | — | 8 | 32 | 116 | 276 | 85 | |||||||||||||||||||||||
| Current Portion of Long-Term Debt | 34 | 534 | 34 | 532 | 1,280 | 778 | |||||||||||||||||||||||
| Current Portion of Operating Lease Liabilities | 318 | 303 | 338 | 315 | 318 | 360 | |||||||||||||||||||||||
| Other | 223 | 231 | 344 | 381 | 290 | 257 | |||||||||||||||||||||||
| Total | 4,273 | 4,628 | 4,406 | 5,354 | 5,719 | 5,175 | |||||||||||||||||||||||
| Long-Term Debt | 3,757 | 3,250 | 3,742 | 4,220 | 3,464 | 3,458 | |||||||||||||||||||||||
| Other Liabilities | 2,533 | 2,456 | 2,480 | 2,395 | 2,368 | 2,398 | |||||||||||||||||||||||
| Deferred Income Taxes | 5,597 | 5,731 | 5,949 | 5,866 | 5,915 | 6,015 | |||||||||||||||||||||||
| Commitments and Contingencies | |||||||||||||||||||||||||||||
| Stockholders' Equity | |||||||||||||||||||||||||||||
| Common Stock, $0.01 Par | 206 | 206 | 206 | 206 | 206 | 206 | |||||||||||||||||||||||
| Additional Paid in Capital | 6,188 | 6,219 | 6,058 | 6,090 | 6,095 | 6,153 | |||||||||||||||||||||||
| Accumulated Other Comprehensive Loss | (8) | (8) | (9) | (4) | (4) | (7) | |||||||||||||||||||||||
| Retained Earnings | 23,897 | 25,071 | 26,231 | 26,941 | 27,869 | 28,131 | |||||||||||||||||||||||
| Common Stock Held in Treasury | (1,647) | (2,329) | (2,912) | (3,882) | (4,650) | (5,245) | |||||||||||||||||||||||
| Total Stockholders' Equity | 28,636 | 29,159 | 29,574 | 29,351 | 29,516 | 29,238 | |||||||||||||||||||||||
| Total Liabilities and Stockholders' Equity | 44,796 | 45,224 | 46,151 | 47,186 | 46,982 | 46,284 | |||||||||||||||||||||||
| Cash Flow Statements | | ||||||||||||||||||||||||||||||||||
| In millions of USD (Unaudited) | |||||||||||||||||||||||||||||||||||
| 2024 | 2025 | ||||||||||||||||||||||||||||||||||
| 1st Qtr | 2nd Qtr | 3rd Qtr | 4th Qtr | Year | 1st Qtr | 2nd Qtr | 3rd Qtr | 4th Qtr | Year | ||||||||||||||||||||||||||
| Cash Flows from Operating Activities | |||||||||||||||||||||||||||||||||||
| Reconciliation of Net Income to Net Cash Provided by Operating Activities: | |||||||||||||||||||||||||||||||||||
| Net Income | 1,789 | 1,690 | 1,673 | 1,251 | 6,403 | 1,463 | 1,345 | 2,808 | |||||||||||||||||||||||||||
| Items Not Requiring (Providing) Cash | |||||||||||||||||||||||||||||||||||
| Depreciation, Depletion and Amortization | 1,074 | 984 | 1,031 | 1,019 | 4,108 | 1,013 | 1,053 | 2,066 | |||||||||||||||||||||||||||
| Impairments | 19 | 81 | 15 | 276 | 391 | 44 | 39 | 83 | |||||||||||||||||||||||||||
| Stock-Based Compensation Expenses | 45 | 45 | 58 | 51 | 199 | 50 | 53 | 103 | |||||||||||||||||||||||||||
| Deferred Income Taxes | 199 | 128 | 220 | (80) | 467 | 44 | 105 | 149 | |||||||||||||||||||||||||||
| (Gains) Losses on Asset Dispositions, Net | (26) | (20) | 7 | 23 | (16) | 1 | — | 1 | |||||||||||||||||||||||||||
| Other, Net | 9 | 3 | 2 | 3 | 17 | 11 | 11 | 22 | |||||||||||||||||||||||||||
| Dry Hole Costs | 1 | 5 | — | 8 | 14 | 34 | 11 | 45 | |||||||||||||||||||||||||||
| Mark-to-Market Financial Commodity and Other Derivative Contracts (Gains) Losses, Net | (237) | 47 | (79) | 65 | (204) | 191 | (107) | 84 | |||||||||||||||||||||||||||
| Net Cash Received from (Payments for) Settlements of Financial Commodity Derivative Contracts | 55 | 79 | 61 | 19 | 214 | (38) | (24) | (62) | |||||||||||||||||||||||||||
| Changes in Components of Working Capital and Other Assets and Liabilities | |||||||||||||||||||||||||||||||||||
| Accounts Receivable | 58 | 33 | 109 | (99) | 101 | 48 | 122 | 170 | |||||||||||||||||||||||||||
| Inventories | 117 | 75 | 30 | 37 | 259 | 76 | (45) | 31 | |||||||||||||||||||||||||||
| Accounts Payable | (58) | 29 | (159) | 152 | (36) | (129) | (107) | (236) | |||||||||||||||||||||||||||
| Accrued Taxes Payable | 319 | (185) | 256 | 151 | 541 | (339) | (321) | (660) | |||||||||||||||||||||||||||
| Other Assets | (161) | 42 | 197 | (34) | 44 | (43) | (43) | (86) | |||||||||||||||||||||||||||
| Other Liabilities | (71) | (20) | 108 | 6 | 23 | (96) | (52) | (148) | |||||||||||||||||||||||||||
| Changes in Components of Working Capital Associated with Investing Activities | (229) | (127) | 59 | (85) | (382) | (41) | (8) | (49) | |||||||||||||||||||||||||||
| Net Cash Provided by Operating Activities | 2,903 | 2,889 | 3,588 | 2,763 | 12,143 | 2,289 | 2,032 | 4,321 | |||||||||||||||||||||||||||
| Investing Cash Flows | |||||||||||||||||||||||||||||||||||
| Additions to Oil and Gas Properties | (1,485) | (1,357) | (1,263) | (1,248) | (5,353) | (1,381) | (1,699) | (3,080) | |||||||||||||||||||||||||||
| Additions to Other Property, Plant and Equipment | (350) | (313) | (239) | (117) | (1,019) | (102) | (94) | (196) | |||||||||||||||||||||||||||
| Proceeds from Sales of Assets | 9 | 10 | — | 4 | 23 | 12 | 4 | 16 | |||||||||||||||||||||||||||
| Changes in Components of Working Capital Associated with Investing Activities | 229 | 127 | (59) | 85 | 382 | 41 | 8 | 49 | |||||||||||||||||||||||||||
| Net Cash Used in Investing Activities | (1,597) | (1,533) | (1,561) | (1,276) | (5,967) | (1,430) | (1,781) | (3,211) | |||||||||||||||||||||||||||
| Financing Cash Flows | |||||||||||||||||||||||||||||||||||
| Long-Term Debt Borrowings | — | — | — | 985 | 985 | — | — | — | |||||||||||||||||||||||||||
| Long-Term Debt Repayments | — | — | — | — | — | — | (500) | (500) | |||||||||||||||||||||||||||
| Dividends Paid | (525) | (520) | (533) | (509) | (2,087) | (538) | (528) | (1,066) | |||||||||||||||||||||||||||
| Treasury Stock Purchased | (759) | (699) | (795) | (993) | (3,246) | (806) | (602) | (1,408) | |||||||||||||||||||||||||||
| Proceeds from Stock Options Exercised and Employee Stock Purchase Plan | — | 11 | — | 11 | 22 | — | 11 | 11 | |||||||||||||||||||||||||||
| Debt Issuance and Other Financing Costs | — | — | — | (2) | (2) | — | (7) | (7) | |||||||||||||||||||||||||||
| Repayment of Finance Lease Liabilities | (8) | (9) | (8) | (8) | (33) | (8) | (9) | (17) | |||||||||||||||||||||||||||
| Net Cash Used in Financing Activities | (1,292) | (1,217) | (1,336) | (516) | (4,361) | (1,352) | (1,635) | (2,987) | |||||||||||||||||||||||||||
| Effect of Exchange Rate Changes on Cash | — | – | – | (1) | (1) | — | 1 | 1 | |||||||||||||||||||||||||||
| Increase (Decrease) in Cash and Cash Equivalents | 14 | 139 | 691 | 970 | 1,814 | (493) | (1,383) | (1,876) | |||||||||||||||||||||||||||
| Cash and Cash Equivalents at Beginning of Period | 5,278 | 5,292 | 5,431 | 6,122 | 5,278 | 7,092 | 6,599 | 7,092 | |||||||||||||||||||||||||||
| Cash and Cash Equivalents at End of Period | 5,292 | 5,431 | 6,122 | 7,092 | 7,092 | 6,599 | 5,216 | 5,216 | |||||||||||||||||||||||||||
| Non-GAAP Financial Measures | | |||||||||||||
| Adjusted Net Income | | ||||||||||||||||||||||
| In millions of USD, except share data (in millions) and per share data (Unaudited) | |||||||||||||||||||||||
| The following tables adjust reported Net Income (Loss) (GAAP) to reflect actual net cash received from (payments for) settlements of financial commodity derivative contracts by eliminating the net unrealized mark-to-market (gains) losses from these and other derivative transactions, to eliminate the net (gains) losses on asset dispositions, to add back impairment charges related to certain of EOG's assets (which are generally (i) attributable to declines in commodity prices, (ii) related to sales of certain oil and gas properties or (iii) the result of certain other events or decisions (e.g., a periodic review of EOG's oil and gas properties or other assets)), and to make certain other adjustments to exclude non-recurring and certain other items as further described below. EOG believes this presentation may be useful to investors who follow the practice of some industry analysts who adjust reported company earnings to match hedge realizations to production settlement months and make certain other adjustments to exclude non-recurring and certain other items. EOG management uses this information for purposes of comparing its financial performance with the financial performance of other companies in the industry. | |||||||||||||||||||||||
| 2Q 2025 | |||||||||||||||||||||||
| Before Tax | Income Tax Impact | After Tax | Diluted Earnings per Share | ||||||||||||||||||||
| Reported Net Income (GAAP) | 1,751 | (406) | 1,345 | 2.46 | |||||||||||||||||||
| Adjustments: | |||||||||||||||||||||||
| Gains on Mark-to-Market Financial Commodity and Other Derivative Contracts, Net | (107) | 23 | (84) | (0.16) | |||||||||||||||||||
Net Cash Payments for Settlements of Financial Commodity Derivative Contracts (1) | (24) | 5 | (19) | (0.03) | |||||||||||||||||||
| Add: Certain Impairments | 11 | — | 11 | 0.02 | |||||||||||||||||||
Add: Acquisition-related costs (2) | 18 | (3) | 15 | 0.03 | |||||||||||||||||||
| Adjustments to Net Income | (102) | 25 | (77) | (0.14) | |||||||||||||||||||
| Adjusted Net Income (Non-GAAP) | 1,649 | (381) | 1,268 | 2.32 | |||||||||||||||||||
| Average Number of Common Shares | |||||||||||||||||||||||
| Basic | 543 | ||||||||||||||||||||||
| Diluted | 546 | ||||||||||||||||||||||
Adjusted Net Income (Continued) | | ||||||||||||||||||||||
| In millions of USD, except share data (in millions) and per share data (Unaudited) | |||||||||||||||||||||||
| 1Q 2025 | |||||||||||||||||||||||
| Before Tax | Income Tax Impact | After Tax | Diluted Earnings per Share | ||||||||||||||||||||
| Reported Net Income (GAAP) | 1,877 | (414) | 1,463 | 2.65 | |||||||||||||||||||
| Adjustments: | |||||||||||||||||||||||
| Losses on Mark-to-Market Financial Commodity and Other Derivative Contracts, Net | 191 | (41) | 150 | 0.26 | |||||||||||||||||||
Net Cash Payments for Settlements of Financial Commodity Derivative Contracts (1) | (38) | 8 | (30) | (0.05) | |||||||||||||||||||
| Add: Losses on Asset Dispositions, Net | 1 | 2 | 3 | 0.01 | |||||||||||||||||||
| Adjustments to Net Income | 154 | (31) | 123 | 0.22 | |||||||||||||||||||
| Adjusted Net Income (Non-GAAP) | 2,031 | (445) | 1,586 | 2.87 | |||||||||||||||||||
| Average Number of Common Shares | |||||||||||||||||||||||
| Basic | 550 | ||||||||||||||||||||||
| Diluted | 553 | ||||||||||||||||||||||
Adjusted Net Income (Continued) | | ||||||||||||||||||||||
| In millions of USD, except share data (in millions) and per share data (Unaudited) | |||||||||||||||||||||||
| 4Q 2024 | |||||||||||||||||||||||
| Before Tax | Income Tax Impact | After Tax | Diluted Earnings per Share | ||||||||||||||||||||
| Reported Net Income (GAAP) | 1,624 | (373) | 1,251 | 2.23 | |||||||||||||||||||
| Adjustments: | |||||||||||||||||||||||
| Losses on Mark-to-Market Financial Commodity and Other Derivative Contracts, Net | 65 | (14) | 51 | 0.10 | |||||||||||||||||||
Net Cash Received from Settlements of Financial Commodity Derivative Contracts (1) | 19 | (4) | 15 | 0.03 | |||||||||||||||||||
| Add: Losses on Asset Dispositions, Net | 23 | (4) | 19 | 0.03 | |||||||||||||||||||
| Add: Certain Impairments | 254 | (55) | 199 | 0.35 | |||||||||||||||||||
| Adjustments to Net Income | 361 | (77) | 284 | 0.51 | |||||||||||||||||||
| Adjusted Net Income (Non-GAAP) | 1,985 | (450) | 1,535 | 2.74 | |||||||||||||||||||
| Average Number of Common Shares | |||||||||||||||||||||||
| Basic | 557 | ||||||||||||||||||||||
| Diluted | 561 | ||||||||||||||||||||||
Adjusted Net Income (Continued) | | ||||||||||||||||||||||
| In millions of USD, except share data (in millions) and per share data (Unaudited) | |||||||||||||||||||||||
| 3Q 2024 | |||||||||||||||||||||||
| Before Tax | Income Tax Impact | After Tax | Diluted Earnings per Share | ||||||||||||||||||||
| Reported Net Income (GAAP) | 2,134 | (461) | 1,673 | 2.95 | |||||||||||||||||||
| Adjustments: | |||||||||||||||||||||||
| Gains on Mark-to-Market Financial Commodity and Other Derivative Contracts, Net | (79) | 17 | (62) | (0.11) | |||||||||||||||||||
Net Cash Received from Settlements of Financial Commodity Derivative Contracts (1) | 61 | (13) | 48 | 0.08 | |||||||||||||||||||
| Add: Losses on Asset Dispositions, Net | 7 | (2) | 5 | 0.01 | |||||||||||||||||||
| Less: Severance Tax Refund | (31) | 7 | (24) | (0.04) | |||||||||||||||||||
| Add: Severance Tax Consulting Fees | 10 | (2) | 8 | 0.01 | |||||||||||||||||||
| Less: Interest on Severance Tax Refund | (5) | 1 | (4) | (0.01) | |||||||||||||||||||
| Adjustments to Net Income | (37) | 8 | (29) | (0.06) | |||||||||||||||||||
| Adjusted Net Income (Non-GAAP) | 2,097 | (453) | 1,644 | 2.89 | |||||||||||||||||||
| Average Number of Common Shares | |||||||||||||||||||||||
| Basic | 564 | ||||||||||||||||||||||
| Diluted | 568 | ||||||||||||||||||||||
Adjusted Net Income (Continued) | | ||||||||||||||||||||||
| In millions of USD, except share data (in millions) and per share data (Unaudited) | |||||||||||||||||||||||
| 2Q 2024 | |||||||||||||||||||||||
| Before Tax | Income Tax Impact | After Tax | Diluted Earnings per Share | ||||||||||||||||||||
| Reported Net Income (GAAP) | 2,160 | (470) | 1,690 | 2.95 | |||||||||||||||||||
| Adjustments: | |||||||||||||||||||||||
| Losses on Mark-to-Market Financial Commodity and Other Derivative Contracts, Net | 47 | (10) | 37 | 0.07 | |||||||||||||||||||
Net Cash Received from Settlements of Financial Commodity Derivative Contracts (1) | 79 | (17) | 62 | 0.11 | |||||||||||||||||||
| Less: Gains on Asset Dispositions, Net | (20) | 5 | (15) | (0.03) | |||||||||||||||||||
| Add: Certain Impairments | 35 | (2) | 33 | 0.06 | |||||||||||||||||||
| Adjustments to Net Income | 141 | (24) | 117 | 0.21 | |||||||||||||||||||
| Adjusted Net Income (Non-GAAP) | 2,301 | (494) | 1,807 | 3.16 | |||||||||||||||||||
| Average Number of Common Shares | |||||||||||||||||||||||
| Basic | 569 | ||||||||||||||||||||||
| Diluted | 572 | ||||||||||||||||||||||
Adjusted Net Income (Continued) | | ||||||||||||||||||||||
| In millions of USD, except share data (in millions) and per share data (Unaudited) | |||||||||||||||||||||||
| FY 2024 | |||||||||||||||||||||||
| Before Tax | Income Tax Impact | After Tax | Diluted Earnings per Share | ||||||||||||||||||||
| Reported Net Income (GAAP) | 8,218 | (1,815) | 6,403 | 11.25 | |||||||||||||||||||
| Adjustments: | |||||||||||||||||||||||
| Gains on Mark-to-Market Financial Commodity and Other Derivative Contracts, Net | (204) | 44 | (160) | (0.28) | |||||||||||||||||||
Net Cash Received from Settlements of Financial Commodity Derivative Contracts (1) | 214 | (46) | 168 | 0.30 | |||||||||||||||||||
| Less: Gains on Asset Dispositions, Net | (16) | 3 | (13) | (0.02) | |||||||||||||||||||
| Add: Certain Impairments | 291 | (57) | 234 | 0.41 | |||||||||||||||||||
| Less: Severance Tax Refund | (31) | 7 | (24) | (0.04) | |||||||||||||||||||
| Add: Severance Tax Consulting Fees | 10 | (2) | 8 | 0.01 | |||||||||||||||||||
| Less: Interest on Severance Tax Refund | (5) | 1 | (4) | (0.01) | |||||||||||||||||||
| Adjustments to Net Income | 259 | (50) | 209 | 0.37 | |||||||||||||||||||
| Adjusted Net Income (Non-GAAP) | 8,477 | (1,865) | 6,612 | 11.62 | |||||||||||||||||||
| Average Number of Common Shares | |||||||||||||||||||||||
| Basic | 566 | ||||||||||||||||||||||
| Diluted | 569 | ||||||||||||||||||||||
Adjusted Net Income (Continued) | | ||||||||||||||||||||||
| In millions of USD, except share data (in millions) and per share data (Unaudited) | |||||||||||||||||||||||
| FY 2023 | |||||||||||||||||||||||
| Before Tax | Income Tax Impact | After Tax | Diluted Earnings per Share | ||||||||||||||||||||
| Reported Net Income (GAAP) | 9,689 | (2,095) | 7,594 | 13.00 | |||||||||||||||||||
| Adjustments: | |||||||||||||||||||||||
| Gains on Mark-to-Market Financial Commodity Derivative Contracts, Net | (818) | 176 | (642) | (1.09) | |||||||||||||||||||
Net Cash Payments for Settlements of Financial Commodity Derivative Contracts (1) | (112) | 24 | (88) | (0.15) | |||||||||||||||||||
| Less: Gains on Asset Dispositions, Net | (95) | 20 | (75) | (0.13) | |||||||||||||||||||
| Add: Certain Impairments | 42 | (6) | 36 | 0.06 | |||||||||||||||||||
| Adjustments to Net Income | (983) | 214 | (769) | (1.31) | |||||||||||||||||||
| Adjusted Net Income (Non-GAAP) | 8,706 | (1,881) | 6,825 | 11.69 | |||||||||||||||||||
| Average Number of Common Shares | |||||||||||||||||||||||
| Basic | 581 | ||||||||||||||||||||||
| Diluted | 584 | ||||||||||||||||||||||
| Net Income per Share | | ||||||||||
| In millions of USD, except share data (in millions), per share data, production volume data and per Boe data (Unaudited) | |||||||||||
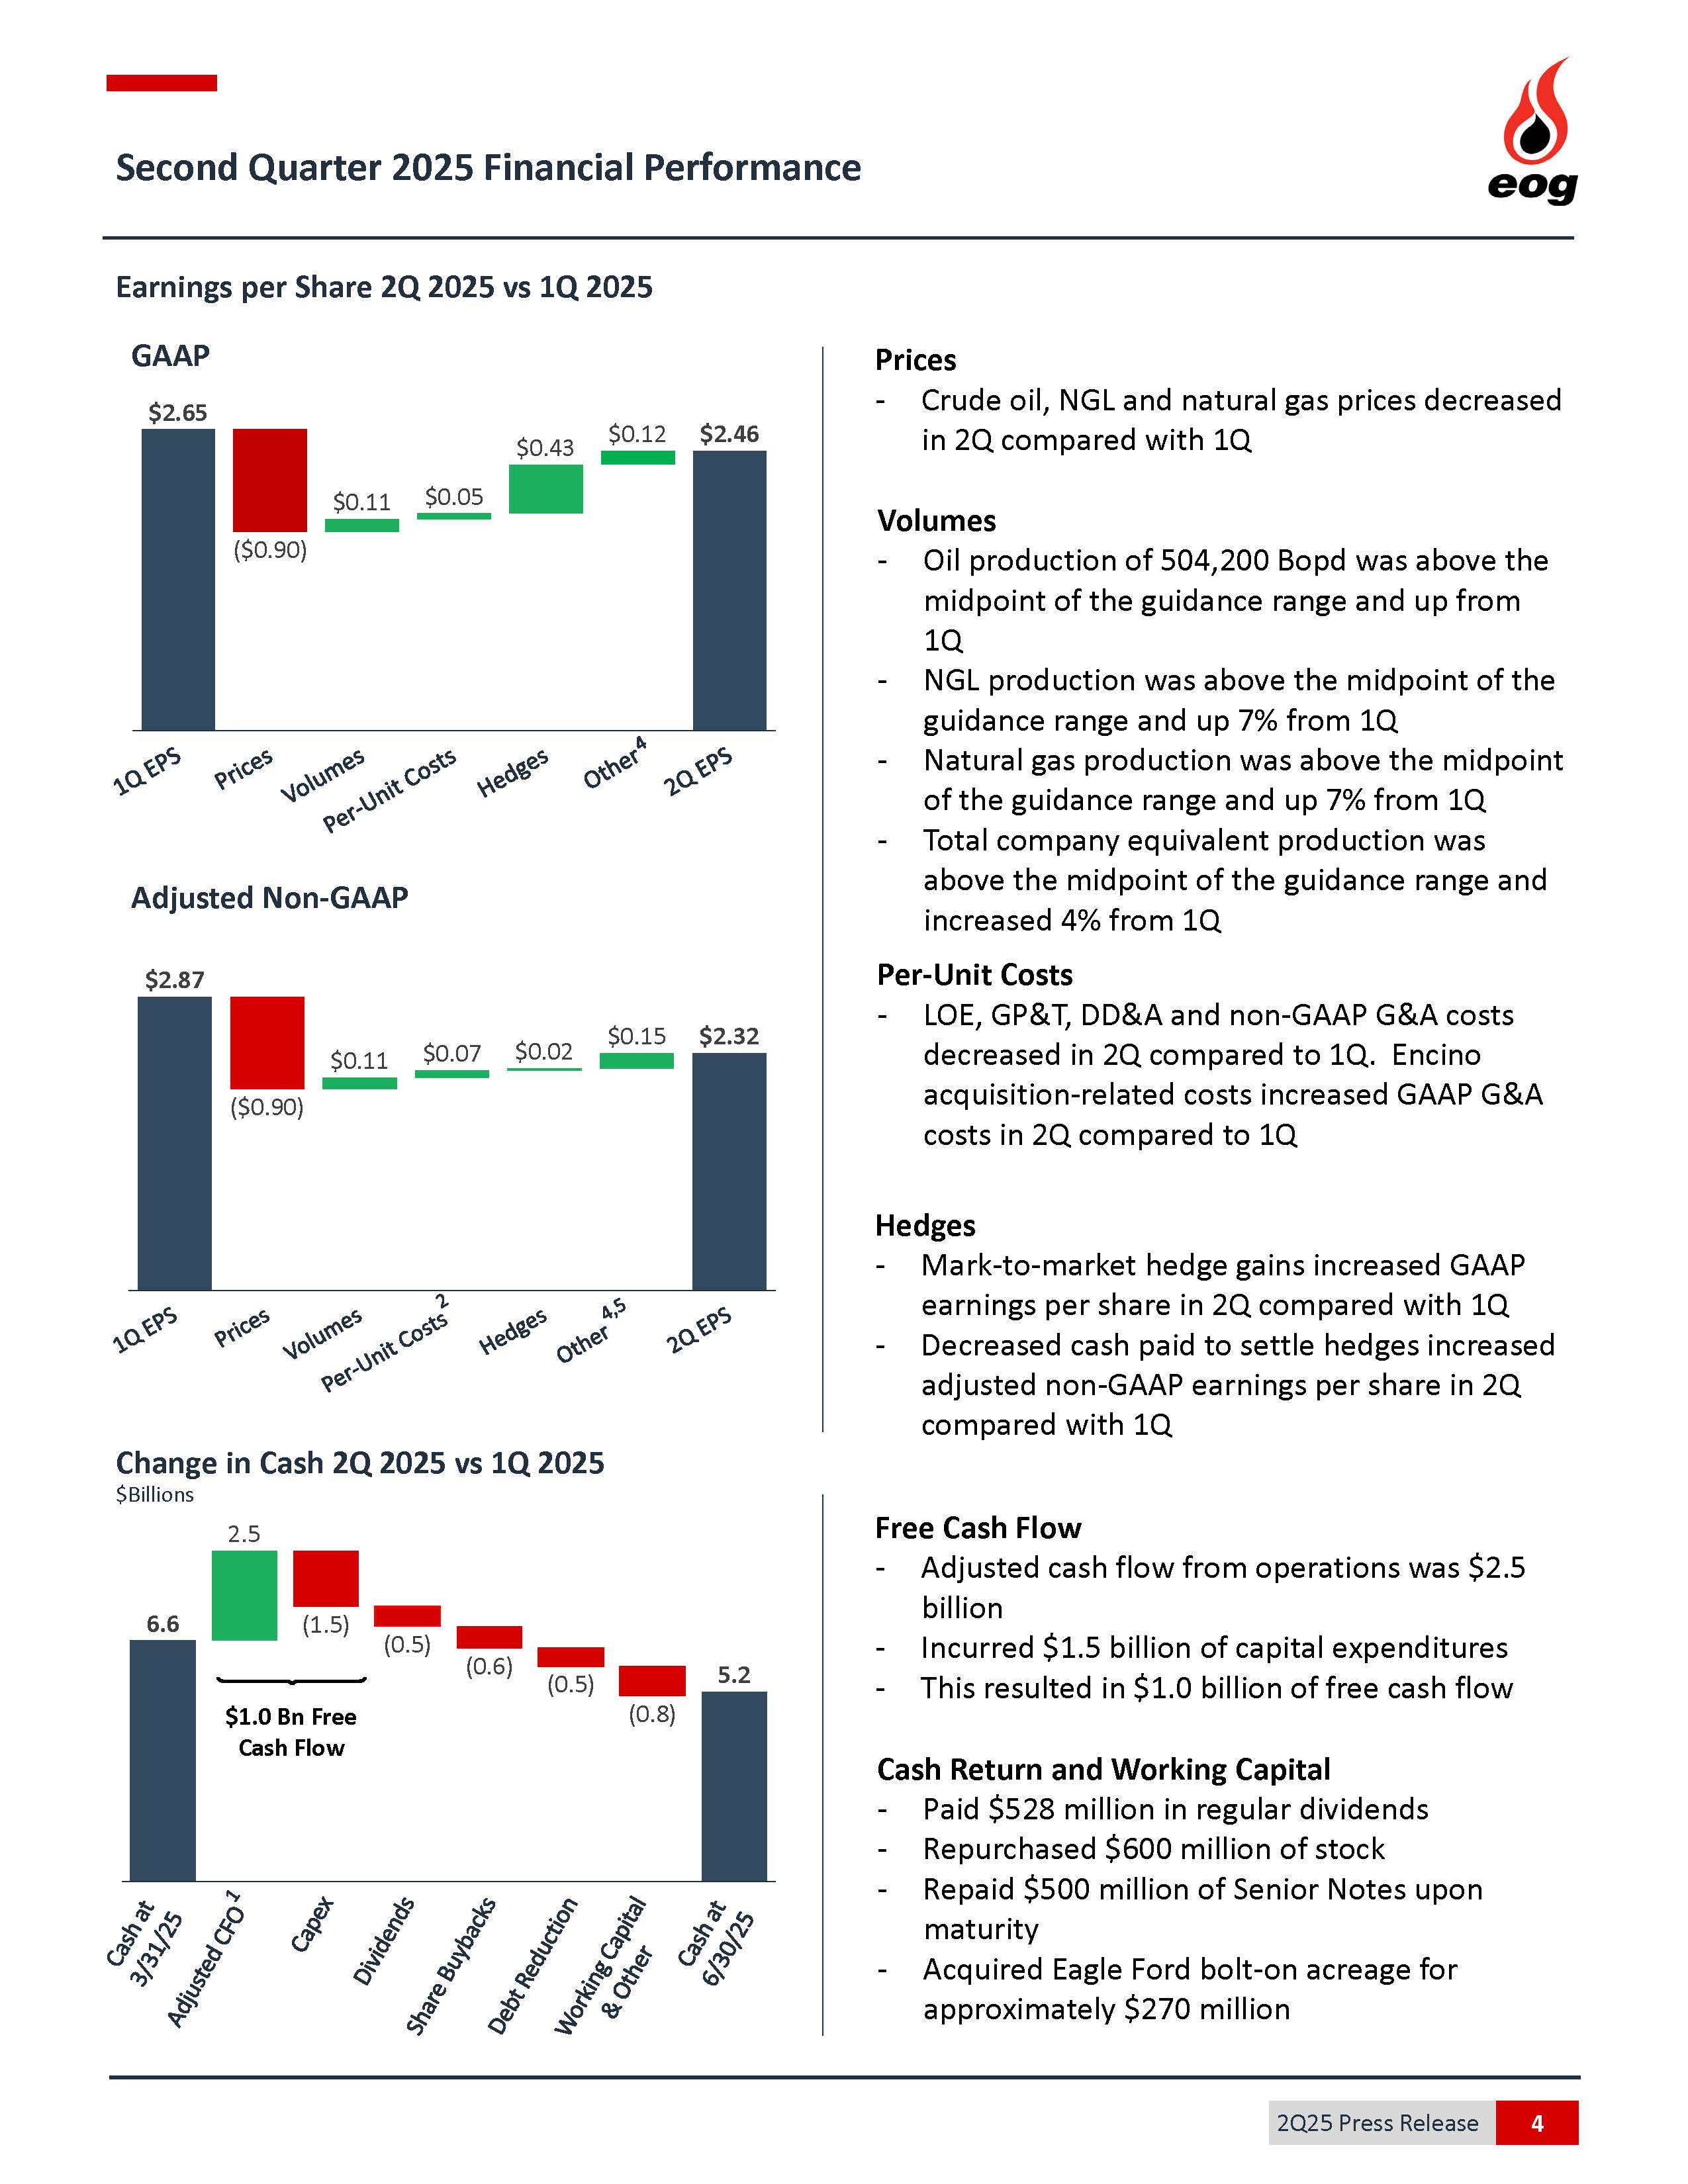
| 1Q 2025 Net Income per Share (GAAP) - Diluted | 2.65 | ||||||||||
| Realized Prices | |||||||||||
| 2Q 2025 Composite Average Revenue from Sales of Crude Oil and Condensate, NGLs, and Natural Gas per Boe | 39.80 | ||||||||||
| Less: 1Q 2025 Composite Average Revenue from Sales of Crude Oil and Condensate, NGLs, and Natural Gas per Boe | (45.88) | ||||||||||
| Subtotal | (6.08) | ||||||||||
| Multiplied by: 2Q 2025 Crude Oil Equivalent Volumes (MMBoe) | 103.2 | ||||||||||
| Total Change in Revenue | (627) | ||||||||||
| Add: Income Tax Benefit (Provision) Imputed (based on 22%) | 138 | ||||||||||
| Change in Net Income | (489) | ||||||||||
| Change in Diluted Earnings per Share | (0.90) | ||||||||||
| Volumes | |||||||||||
| 2Q 2025 Crude Oil Equivalent Volumes (MMBoe) | 103.2 | ||||||||||
| Less: 1Q 2025 Crude Oil Equivalent Volumes (MMBoe) | (98.1) | ||||||||||
| Subtotal | 5.1 | ||||||||||
| Multiplied by: 2Q 2025 Composite Average Margin per Boe (GAAP) (Including Total Exploration Costs) (refer to "Revenues, Costs and Margins Per Barrel of Oil Equivalent" schedule below) | 14.94 | ||||||||||
| Change in Margin | 76 | ||||||||||
| Less: Income Tax Benefit (Provision) Imputed (based on 22%) | (17) | ||||||||||
| Change in Net Income | 59 | ||||||||||
| Change in Diluted Earnings per Share | 0.11 | ||||||||||
| Certain Operating Costs per Boe | |||||||||||
| 1Q 2025 Total Cash Operating Costs (GAAP) and Total DD&A per Boe | 20.63 | ||||||||||
| Less: 2Q 2025 Total Cash Operating Costs (GAAP) and Total DD&A per Boe | (20.25) | ||||||||||
| Subtotal | 0.38 | ||||||||||
| Multiplied by: 2Q 2025 Crude Oil Equivalent Volumes (MMBoe) | 103.2 | ||||||||||
| Change in Before-Tax Net Income | 39 | ||||||||||
| Less: Income Tax Benefit (Provision) Imputed (based on 22%) | (9) | ||||||||||
| Change in Net Income | 30 | ||||||||||
| Change in Diluted Earnings per Share | 0.05 | ||||||||||
Net Income Per Share (Continued) | | ||||||||||
| In millions of USD, except share data (in millions), per share data, production volume data and per Boe data (Unaudited) | |||||||||||
| Gains (Losses) on Mark-to-Market Financial Commodity and Other Derivative Contracts, Net | |||||||||||
| 2Q 2025 Net Gains (Losses) on Mark-to-Market Financial Commodity and Other Derivative Contracts | 107 | ||||||||||
| Less: Income Tax Benefit (Provision) | (23) | ||||||||||
| After Tax - (a) | 84 | ||||||||||
| Less: 1Q 2025 Net Gains (Losses) on Mark-to-Market Financial Commodity and Other Derivative Contracts | (191) | ||||||||||
| Less: Income Tax Benefit (Provision) | 41 | ||||||||||
| After Tax - (b) | (150) | ||||||||||
| Change in Net Income - (a) - (b) | 234 | ||||||||||
| Change in Diluted Earnings per Share | 0.43 | ||||||||||
Other (1) | 0.12 | ||||||||||
| 2Q 2025 Net Income per Share (GAAP) - Diluted | 2.46 | ||||||||||
| 2Q 2025 Average Number of Common Shares - Diluted | 546 | ||||||||||
| Adjusted Net Income Per Share | | ||||||||||
| In millions of USD, except share data (in millions), per share data, production volume data and per Boe data (Unaudited) | |||||||||||
| 1Q 2025 Adjusted Net Income per Share (Non-GAAP) - Diluted | 2.87 | ||||||||||
| Realized Prices | |||||||||||
| 2Q 2025 Composite Average Revenue from Sales of Crude Oil and Condensate, NGLs, and Natural Gas per Boe | 39.80 | ||||||||||
| Less: 1Q 2025 Composite Average Revenue from Sales of Crude Oil and Condensate, NGLs, and Natural Gas per Boe | (45.88) | ||||||||||
| Subtotal | (6.08) | ||||||||||
| Multiplied by: 2Q 2025 Crude Oil Equivalent Volumes (MMBoe) | 103.2 | ||||||||||
| Total Change in Revenue | (627) | ||||||||||
| Add: Income Tax Benefit (Provision) Imputed (based on 22%) | 138 | ||||||||||
| Change in Net Income | (489) | ||||||||||
| Change in Diluted Earnings per Share | (0.90) | ||||||||||
| Volumes | |||||||||||
| 2Q 2025 Crude Oil Equivalent Volumes (MMBoe) | 103.2 | ||||||||||
| Less: 1Q 2025 Crude Oil Equivalent Volumes (MMBoe) | (98.1) | ||||||||||
| Subtotal | 5.1 | ||||||||||
| Multiplied by: 2Q 2025 Composite Average Margin per Boe (Non-GAAP) (Including Total Exploration Costs) (refer to "Revenues, Costs and Margins Per Barrel of Oil Equivalent" schedule below) | 15.21 | ||||||||||
| Change in Margin | 78 | ||||||||||
| Add: Income Tax Benefit (Provision) Imputed (based on 22%) | (17) | ||||||||||
| Change in Net Income | 61 | ||||||||||
| Change in Diluted Earnings per Share | 0.11 | ||||||||||
| Certain Operating Costs per Boe | |||||||||||
| 1Q 2025 Total Cash Operating Costs (Non-GAAP) and Total DD&A per Boe | 20.63 | ||||||||||
| Less: 2Q 2025 Total Cash Operating Costs (Non-GAAP) and Total DD&A per Boe | (20.14) | ||||||||||
| Subtotal | 0.49 | ||||||||||
| Multiplied by: 2Q 2025 Crude Oil Equivalent Volumes (MMBoe) | 103.2 | ||||||||||
| Change in Before-Tax Net Income | 51 | ||||||||||
| Add: Income Tax Benefit (Provision) Imputed (based on 22%) | (11) | ||||||||||
| Change in Net Income | 40 | ||||||||||
| Change in Diluted Earnings per Share | 0.07 | ||||||||||
Adjusted Net Income Per Share (Continued) | | ||||||||||
| In millions of USD, except share data (in millions), per share data, production volume data and per Boe data (Unaudited) | |||||||||||
| Net Cash Received from (Payments for) Settlements of Financial Commodity Derivative Contracts | |||||||||||
| 2Q 2025 Net Cash Received from (Payments for) Settlements of Financial Commodity Derivative Contracts | (24) | ||||||||||
| Less: Income Tax Benefit (Provision) | 5 | ||||||||||
| After Tax - (a) | (19) | ||||||||||
| 1Q 2025 Net Cash Received from (Payments for) Settlements of Financial Commodity Derivative Contracts | (38) | ||||||||||
| Less: Income Tax Benefit (Provision) | 8 | ||||||||||
| After Tax - (b) | (30) | ||||||||||
| Change in Net Income - (a) - (b) | 11 | ||||||||||
| Change in Diluted Earnings per Share | 0.02 | ||||||||||
Other (1) | 0.15 | ||||||||||
| 2Q 2025 Adjusted Net Income per Share (Non-GAAP) | 2.32 | ||||||||||
| 2Q 2025 Average Number of Common Shares - Diluted | 546 | ||||||||||
| Cash Flow from Operations and Free Cash Flow | | ||||||||||||||||||||||||||||||||||
| In millions of USD (Unaudited) | |||||||||||||||||||||||||||||||||||
| The following tables reconcile Net Cash Provided by Operating Activities (GAAP) to Adjusted Cash Flow from Operations (Non-GAAP). EOG believes this presentation may be useful to investors who follow the practice of some industry analysts who adjust Net Cash Provided by Operating Activities for Changes in Components of Working Capital and Other Assets and Liabilities, Changes in Components of Working Capital Associated with Investing Activities (or Investing and Financing Activities, as applicable) and certain other adjustments to exclude certain non-recurring items and other items as further described below. EOG defines Free Cash Flow (Non-GAAP) for a given period as Adjusted Cash Flow from Operations (Non-GAAP) (see below reconciliation) for such period less the Total Capital Expenditures (Non-GAAP) (see below reconciliation) during such period, as is illustrated below. EOG management uses this information for comparative purposes within the industry. As indicated in the tables below, EOG is (1) in addition to its customary working capital-related adjustments, adjusting Net Cash Provided by Operating Activities (GAAP) to add back certain non-recurring acquisition-related costs incurred during the second quarter 2025 and (2) now presenting such adjusted measure as “Adjusted Cash Flow from Operations (Non-GAAP)” (instead of “Cash Flow from Operations Before Changes in Working Capital (Non-GAAP)” as reported in prior periods); the presentation below with respect to the second quarter 2025 and the prior periods shown has been conformed. | |||||||||||||||||||||||||||||||||||
| 2024 | 2025 | ||||||||||||||||||||||||||||||||||
| 1st Qtr | 2nd Qtr | 3rd Qtr | 4th Qtr | Year | 1st Qtr | 2nd Qtr | 3rd Qtr | 4th Qtr | Year | ||||||||||||||||||||||||||
| Net Cash Provided by Operating Activities (GAAP) | 2,903 | 2,889 | 3,588 | 2,763 | 12,143 | 2,289 | 2,032 | 4,321 | |||||||||||||||||||||||||||
| Adjustments: | |||||||||||||||||||||||||||||||||||
| Changes in Components of Working Capital and Other Assets and Liabilities | |||||||||||||||||||||||||||||||||||
| Accounts Receivable | (58) | (33) | (109) | 99 | (101) | (48) | (122) | (170) | |||||||||||||||||||||||||||
| Inventories | (117) | (75) | (30) | (37) | (259) | (76) | 45 | (31) | |||||||||||||||||||||||||||
| Accounts Payable | 58 | (29) | 159 | (152) | 36 | 129 | 107 | 236 | |||||||||||||||||||||||||||
| Accrued Taxes Payable | (319) | 185 | (256) | (151) | (541) | 339 | 321 | 660 | |||||||||||||||||||||||||||
| Other Assets | 161 | (42) | (197) | 34 | (44) | 43 | 43 | 86 | |||||||||||||||||||||||||||
| Other Liabilities | 71 | 20 | (108) | (6) | (23) | 96 | 52 | 148 | |||||||||||||||||||||||||||
| Changes in Components of Working Capital Associated with Investing Activities | 229 | 127 | (59) | 85 | 382 | 41 | 8 | 49 | |||||||||||||||||||||||||||
| Add: | |||||||||||||||||||||||||||||||||||
Acquisition-Related Costs (1), Net of Tax | — | — | — | — | — | — | 10 | 10 | |||||||||||||||||||||||||||
| Adjusted Cash Flow from Operations (Non-GAAP) | 2,928 | 3,042 | 2,988 | 2,635 | 11,593 | 2,813 | 2,496 | 5,309 | |||||||||||||||||||||||||||
| Less: | |||||||||||||||||||||||||||||||||||
Total Capital Expenditures (Non-GAAP) (2) | (1,703) | (1,668) | (1,497) | (1,358) | (6,226) | (1,484) | (1,523) | (3,007) | |||||||||||||||||||||||||||
| Free Cash Flow (Non-GAAP) | 1,225 | 1,374 | 1,491 | 1,277 | 5,367 | 1,329 | 973 | 2,302 | |||||||||||||||||||||||||||
| (1) Consists of Encino acquisition-related G&A costs of $12 million (before tax) for the three months ended June 30, 2025. | |||||||||||||||||||||||||||||||||||
| (2) See below reconciliation of Total Expenditures (GAAP) to Total Capital Expenditures (Non-GAAP): | |||||||||||||||||||||||||||||||||||
| 2024 | 2025 | ||||||||||||||||||||||||||||||||||
| 1st Qtr | 2nd Qtr | 3rd Qtr | 4th Qtr | Year | 1st Qtr | 2nd Qtr | 3rd Qtr | 4th Qtr | Year | ||||||||||||||||||||||||||
| Total Expenditures (GAAP) | 1,952 | 1,682 | 1,573 | 1,446 | 6,653 | 1,546 | 1,883 | 3,429 | |||||||||||||||||||||||||||
| Less: | |||||||||||||||||||||||||||||||||||
| Asset Retirement Costs | (21) | 60 | (11) | (26) | 2 | (13) | (14) | (27) | |||||||||||||||||||||||||||
| Non-Cash Acquisition Costs of Unproved Properties | (31) | (34) | (17) | (3) | (85) | (9) | (2) | (11) | |||||||||||||||||||||||||||
| Acquisition Costs of Proved Properties | (21) | (5) | — | (7) | (33) | 1 | (270) | (269) | |||||||||||||||||||||||||||
| Acquisition Costs of Other Property, Plant and Equipment | (131) | (1) | (5) | — | (137) | — | — | — | |||||||||||||||||||||||||||
| Exploration Costs | (45) | (34) | (43) | (52) | (174) | (41) | (74) | (115) | |||||||||||||||||||||||||||
| Total Capital Expenditures (Non-GAAP) | 1,703 | 1,668 | 1,497 | 1,358 | 6,226 | 1,484 | 1,523 | 3,007 | |||||||||||||||||||||||||||
| Cash Flow from Operations and Free Cash Flow | | ||||||||||||||||||||||
| In millions of USD (Unaudited) | |||||||||||||||||||||||
| FY 2023 | FY 2022 | ||||||||||||||||||||||
Net Cash Provided by Operating Activities (GAAP) | 11,340 | 11,093 | |||||||||||||||||||||
| Adjustments: | |||||||||||||||||||||||
Changes in Components of Working Capital and Other Assets and Liabilities | |||||||||||||||||||||||
Accounts Receivable | 38 | 347 | |||||||||||||||||||||
Inventories | 231 | 534 | |||||||||||||||||||||
Accounts Payable | 119 | (90) | |||||||||||||||||||||
Accrued Taxes Payable | (61) | 113 | |||||||||||||||||||||
Other Assets | (39) | 364 | |||||||||||||||||||||
Other Liabilities | (184) | 266 | |||||||||||||||||||||
| Changes in Components of Working Capital Associated with Investing Activities | (295) | (375) | |||||||||||||||||||||
| Adjusted Cash Flow from Operations (Non-GAAP) | 11,149 | 12,252 | |||||||||||||||||||||
Less: | |||||||||||||||||||||||
Total Capital Expenditures (Non-GAAP) (a) | (6,041) | (4,607) | |||||||||||||||||||||
| Free Cash Flow (Non-GAAP) | 5,108 | 7,645 | |||||||||||||||||||||
| (a) See below reconciliation of Total Expenditures (GAAP) to Total Capital Expenditures (Non-GAAP): | |||||||||||||||||||||||
Total Expenditures (GAAP) | 6,818 | 5,610 | |||||||||||||||||||||
Less: | |||||||||||||||||||||||
Asset Retirement Costs | (257) | (298) | |||||||||||||||||||||
| Non-Cash Development Drilling | (90) | — | |||||||||||||||||||||
Non-Cash Acquisition Costs of Unproved Properties | (99) | (127) | |||||||||||||||||||||
Acquisition Costs of Proved Properties | (16) | (419) | |||||||||||||||||||||
| Acquisition Costs of Other Property, Plant and Equipment | (134) | — | |||||||||||||||||||||
| Exploration Costs | (181) | (159) | |||||||||||||||||||||
| Total Capital Expenditures (Non-GAAP) | 6,041 | 4,607 | |||||||||||||||||||||
| Net Debt-to-Total Capitalization Ratio | | ||||||||||||||||||||||||||||
| In millions of USD, except ratio data (Unaudited) | |||||||||||||||||||||||||||||
| The following tables reconcile Current and Long-Term Debt (GAAP) to Net Debt (Non-GAAP) and Total Capitalization (GAAP) to Total Capitalization (Non-GAAP), as used in the Net Debt-to-Total Capitalization ratio calculation. A portion of the cash is associated with international subsidiaries; tax considerations may impact debt paydown. EOG believes this presentation may be useful to investors who follow the practice of some industry analysts who utilize Net Debt and Total Capitalization (Non-GAAP) in their Net Debt-to-Total Capitalization ratio calculation. EOG management uses this information for comparative purposes within the industry. | |||||||||||||||||||||||||||||
| June 30, 2025 | March 31, 2025 | December 31, 2024 | September 30, 2024 | June 30, 2024 | |||||||||||||||||||||||||
| Total Stockholders' Equity - (a) | 29,238 | 29,516 | 29,351 | 29,574 | 29,159 | ||||||||||||||||||||||||
| Current and Long-Term Debt (GAAP) - (b) | 4,236 | 4,744 | 4,752 | 3,776 | 3,784 | ||||||||||||||||||||||||
| Less: Cash | (5,216) | (6,599) | (7,092) | (6,122) | (5,431) | ||||||||||||||||||||||||
| Net Debt (Non-GAAP) - (c) | (980) | (1,855) | (2,340) | (2,346) | (1,647) | ||||||||||||||||||||||||
| Total Capitalization (GAAP) - (a) + (b) | 33,474 | 34,260 | 34,103 | 33,350 | 32,943 | ||||||||||||||||||||||||
| Total Capitalization (Non-GAAP) - (a) + (c) | 28,258 | 27,661 | 27,011 | 27,228 | 27,512 | ||||||||||||||||||||||||
Debt-to-Total Capitalization (GAAP) - (b) / [(a) + (b)] | 12.7 | % | 13.8 | % | 13.9 | % | 11.3 | % | 11.5 | % | |||||||||||||||||||
| Net Debt-to-Total Capitalization (Non-GAAP) - (c) / [(a) + (c)] | -3.5 | % | -6.7 | % | -8.7 | % | -8.6 | % | -6.0 | % | |||||||||||||||||||
| Revenues, Costs and Margins Per Barrel of Oil Equivalent | | ||||||||||||||||||||||||||||
| In millions of USD, except Boe and per Boe amounts (Unaudited) | |||||||||||||||||||||||||||||
| EOG believes this presentation may be useful to investors who follow the practice of some industry analysts who review certain components and/or groups of components of revenues, costs and/or margins per barrel of oil equivalent (Boe). Certain of these components are adjusted for non-recurring and certain other items, as further discussed below. EOG management uses this information for purposes of comparing its financial performance with the financial performance of other companies in the industry. | |||||||||||||||||||||||||||||
| 2Q 2025 | 1Q 2025 | 4Q 2024 | 3Q 2024 | 2Q 2024 | |||||||||||||||||||||||||
| Volume - Million Barrels of Oil Equivalent - (a) | 103.2 | 98.1 | 100.8 | 99.0 | 95.3 | ||||||||||||||||||||||||
| Total Operating Revenues and Other - (b) | 5,478 | 5,669 | 5,585 | 5,965 | 6,025 | ||||||||||||||||||||||||
| Total Operating Expenses - (c) | 3,731 | 3,810 | 3,993 | 3,876 | 3,895 | ||||||||||||||||||||||||
| Operating Income - (d) | 1,747 | 1,859 | 1,592 | 2,089 | 2,130 | ||||||||||||||||||||||||
| Revenues from Sales of Crude Oil and Condensate, NGLs, and Natural Gas | |||||||||||||||||||||||||||||
| Crude Oil and Condensate | 2,974 | 3,293 | 3,261 | 3,488 | 3,692 | ||||||||||||||||||||||||
| Natural Gas Liquids | 534 | 572 | 554 | 524 | 515 | ||||||||||||||||||||||||
| Natural Gas | 600 | 637 | 494 | 372 | 303 | ||||||||||||||||||||||||
| Total Revenues from Sales of Crude Oil and Condensate, NGLs, and Natural Gas - (e) | 4,108 | 4,502 | 4,309 | 4,384 | 4,510 | ||||||||||||||||||||||||
| Operating Costs | |||||||||||||||||||||||||||||
| Lease and Well | 396 | 401 | 394 | 392 | 390 | ||||||||||||||||||||||||
Gathering, Processing and Transportation Costs (1) | 455 | 440 | 441 | 445 | 423 | ||||||||||||||||||||||||
| General and Administrative (GAAP) | 186 | 171 | 189 | 167 | 151 | ||||||||||||||||||||||||
| Less: Certain Items (see Endnotes 2 & 3 to 2Q 2025 earnings release) | (12) | — | — | (10) | — | ||||||||||||||||||||||||
General and Administrative (Non-GAAP) (3) | 174 | 171 | 189 | 157 | 151 | ||||||||||||||||||||||||
| Taxes Other Than Income (GAAP) | 301 | 341 | 291 | 283 | 337 | ||||||||||||||||||||||||
| Add: Severance Tax Refund | — | — | — | 31 | — | ||||||||||||||||||||||||
Taxes Other Than Income (Non-GAAP) (4) | 301 | 341 | 291 | 314 | 337 | ||||||||||||||||||||||||
| Interest Expense, Net | 51 | 47 | 38 | 31 | 36 | ||||||||||||||||||||||||
| Less: Acquisition-Related Financing Commitment Costs | (6) | — | — | — | — | ||||||||||||||||||||||||
Interest Expense, Net (Non-GAAP) (5) | 45 | 47 | 38 | 31 | 36 | ||||||||||||||||||||||||
| Total Operating Cost (GAAP) (excluding DD&A and Total Exploration Costs) - (f) | 1,389 | 1,400 | 1,353 | 1,318 | 1,337 | ||||||||||||||||||||||||
| Total Operating Cost (Non-GAAP) (excluding DD&A and Total Exploration Costs) - (g) | 1,371 | 1,400 | 1,353 | 1,339 | 1,337 | ||||||||||||||||||||||||
| Depreciation, Depletion and Amortization (DD&A) | 1,053 | 1,013 | 1,019 | 1,031 | 984 | ||||||||||||||||||||||||
| Total Operating Cost (GAAP) (excluding Total Exploration Costs) - (h) | 2,442 | 2,413 | 2,372 | 2,349 | 2,321 | ||||||||||||||||||||||||
| Total Operating Cost (Non-GAAP) (excluding Total Exploration Costs) - (i) | 2,424 | 2,413 | 2,372 | 2,370 | 2,321 | ||||||||||||||||||||||||
| Exploration Costs | 74 | 41 | 52 | 43 | 34 | ||||||||||||||||||||||||
| Dry Hole Costs | 11 | 34 | 8 | — | 5 | ||||||||||||||||||||||||
| Impairments | 39 | 44 | 276 | 15 | 81 | ||||||||||||||||||||||||
| Total Exploration Costs (GAAP) | 124 | 119 | 336 | 58 | 120 | ||||||||||||||||||||||||
Less: Certain Impairments (2) | (11) | — | (254) | — | (35) | ||||||||||||||||||||||||
| Total Exploration Costs (Non-GAAP) | 113 | 119 | 82 | 58 | 85 | ||||||||||||||||||||||||
| Total Operating Cost (GAAP) (including Total Exploration Costs (GAAP)) - (j) | 2,566 | 2,532 | 2,708 | 2,407 | 2,441 | ||||||||||||||||||||||||
| Total Operating Cost (Non-GAAP) (including Total Exploration Costs (Non-GAAP)) - (k) | 2,537 | 2,532 | 2,454 | 2,428 | 2,406 | ||||||||||||||||||||||||
| Total Revenues from Sales of Crude Oil and Condensate, NGLs, and Natural Gas less Total Operating Cost (GAAP) (including Total Exploration Costs (GAAP)) | 1,542 | 1,970 | 1,601 | 1,977 | 2,069 | ||||||||||||||||||||||||
| Total Revenues from Sales of Crude Oil and Condensate, NGLs, and Natural Gas less Total Operating Cost (Non-GAAP) (including Total Exploration Costs (Non-GAAP)) | 1,571 | 1,970 | 1,855 | 1,956 | 2,104 | ||||||||||||||||||||||||
Revenues, Costs and Margins Per Barrel of Oil Equivalent (Continued) | | ||||||||||||||||||||||||||||
| In millions of USD, except Boe and per Boe amounts (Unaudited) | |||||||||||||||||||||||||||||
| 2Q 2025 | 1Q 2025 | 4Q 2024 | 3Q 2024 | 2Q 2024 | |||||||||||||||||||||||||
| Per Barrel of Oil Equivalent (Boe) Calculations (GAAP) | |||||||||||||||||||||||||||||
| Composite Average Operating Revenues and Other per Boe - (b) / (a) | 53.08 | 57.79 | 55.41 | 60.25 | 63.22 | ||||||||||||||||||||||||
| Composite Average Operating Expenses per Boe - (c) / (a) | 36.15 | 38.84 | 39.62 | 39.15 | 40.87 | ||||||||||||||||||||||||
| Composite Average Operating Income per Boe - (d) / (a) | 16.93 | 18.95 | 15.79 | 21.10 | 22.35 | ||||||||||||||||||||||||
| Composite Average Revenue from Sales of Crude Oil and Condensate, NGLs, and Natural Gas per Boe - (e) / (a) | 39.80 | 45.88 | 42.74 | 44.31 | 47.31 | ||||||||||||||||||||||||
| Total Operating Cost per Boe (excluding DD&A and Total Exploration Costs) - (f) / (a) | 13.46 | 14.26 | 13.42 | 13.32 | 14.03 | ||||||||||||||||||||||||
| Composite Average Margin per Boe (excluding DD&A and Total Exploration Costs) - [(e) / (a) - (f) / (a)] | 26.34 | 31.62 | 29.32 | 30.99 | 33.28 | ||||||||||||||||||||||||
| Total Operating Cost per Boe (excluding Total Exploration Costs) - (h) / (a) | 23.66 | 24.58 | 23.53 | 23.74 | 24.35 | ||||||||||||||||||||||||
| Composite Average Margin per Boe (excluding Total Exploration Costs) - [(e) / (a) - (h) / (a)] | 16.14 | 21.30 | 19.21 | 20.57 | 22.96 | ||||||||||||||||||||||||
| Total Operating Cost per Boe (including Total Exploration Costs) - (j) / (a) | 24.86 | 25.79 | 26.86 | 24.33 | 25.61 | ||||||||||||||||||||||||
| Composite Average Margin per Boe (including Total Exploration Costs) - [(e) / (a) - (j) / (a)] | 14.94 | 20.09 | 15.88 | 19.98 | 21.70 | ||||||||||||||||||||||||
| Per Barrel of Oil Equivalent (Boe) Calculations (Non-GAAP) | |||||||||||||||||||||||||||||
| Total Operating Cost per Boe (excluding DD&A and Total Exploration Costs) - (g) / (a) | 13.30 | 14.26 | 13.42 | 13.53 | 14.03 | ||||||||||||||||||||||||
| Composite Average Margin per Boe (excluding DD&A and Total Exploration Costs) - [(e) / (a) - (g) / (a)] | 26.50 | 31.62 | 29.32 | 30.78 | 33.28 | ||||||||||||||||||||||||
| Total Operating Cost per Boe (excluding Total Exploration Costs) - (i) / (a) | 23.50 | 24.58 | 23.53 | 23.95 | 24.35 | ||||||||||||||||||||||||
| Composite Average Margin per Boe (excluding Total Exploration Costs) - [(e) / (a) - (i) / (a)] | 16.30 | 21.30 | 19.21 | 20.36 | 22.96 | ||||||||||||||||||||||||
| Total Operating Cost per Boe (including Total Exploration Costs) - (k) / (a) | 24.59 | 25.79 | 24.34 | 24.54 | 25.24 | ||||||||||||||||||||||||
| Composite Average Margin per Boe (including Total Exploration Costs) - [(e) / (a) - (k) / (a)] | 15.21 | 20.09 | 18.40 | 19.77 | 22.07 | ||||||||||||||||||||||||
Revenues, Costs and Margins Per Barrel of Oil Equivalent (Continued) | | ||||||||||||||||||||||||||||
| In millions of USD, except Boe and per Boe amounts (Unaudited) | |||||||||||||||||||||||||||||
| 2024 | 2023 | 2022 | |||||||||||||||||||||||||||
| Volume - Million Barrels of Oil Equivalent - (a) | 388.7 | 359.4 | 331.5 | ||||||||||||||||||||||||||
| Total Operating Revenues and Other - (b) | 23,698 | 24,186 | 25,702 | ||||||||||||||||||||||||||
| Total Operating Expenses - (c) | 15,616 | 14,583 | 15,736 | ||||||||||||||||||||||||||
| Operating Income (Loss) - (d) | 8,082 | 9,603 | 9,966 | ||||||||||||||||||||||||||
| Revenues from Sales of Crude Oil and Condensate, NGLs, and Natural Gas | |||||||||||||||||||||||||||||
| Crude Oil and Condensate | 13,921 | 13,748 | 16,367 | ||||||||||||||||||||||||||
| Natural Gas Liquids | 2,106 | 1,884 | 2,648 | ||||||||||||||||||||||||||
| Natural Gas | 1,551 | 1,744 | 3,781 | ||||||||||||||||||||||||||
| Total Revenues from Sales of Crude Oil and Condensate, NGLs, and Natural Gas - (e) | 17,578 | 17,376 | 22,796 | ||||||||||||||||||||||||||
| Operating Costs | |||||||||||||||||||||||||||||
| Lease and Well | 1,572 | 1,454 | 1,331 | ||||||||||||||||||||||||||
Gathering, Processing and Transportation Costs (1) | 1,722 | 1,620 | 1,587 | ||||||||||||||||||||||||||
| General and Administrative (GAAP) | 669 | 640 | 570 | ||||||||||||||||||||||||||
| Less: Severance Tax Consulting Fees | (10) | — | (16) | ||||||||||||||||||||||||||
General and Administrative (Non-GAAP) (3) | 659 | 640 | 554 | ||||||||||||||||||||||||||
| Taxes Other Than Income (GAAP) | 1,249 | 1,284 | 1,585 | ||||||||||||||||||||||||||
| Add: Severance Tax Refund | 31 | — | 115 | ||||||||||||||||||||||||||
Taxes Other Than Income (Non-GAAP) (4) | 1,280 | 1,284 | 1,700 | ||||||||||||||||||||||||||
| Interest Expense, Net | 138 | 148 | 179 | ||||||||||||||||||||||||||
| Total Operating Cost (GAAP) (excluding DD&A and Total Exploration Costs) - (f) | 5,350 | 5,146 | 5,252 | ||||||||||||||||||||||||||
| Total Operating Cost (Non-GAAP) (excluding DD&A and Total Exploration Costs) - (g) | 5,371 | 5,146 | 5,351 | ||||||||||||||||||||||||||
| Depreciation, Depletion and Amortization (DD&A) | 4,108 | 3,492 | 3,542 | ||||||||||||||||||||||||||
| Total Operating Cost (GAAP) (excluding Total Exploration Costs) - (h) | 9,458 | 8,638 | 8,794 | ||||||||||||||||||||||||||
| Total Operating Cost (Non-GAAP) (excluding Total Exploration Costs) - (i) | 9,479 | 8,638 | 8,893 | ||||||||||||||||||||||||||
| Exploration Costs | 174 | 181 | 159 | ||||||||||||||||||||||||||
| Dry Hole Costs | 14 | 1 | 45 | ||||||||||||||||||||||||||
| Impairments | 391 | 202 | 382 | ||||||||||||||||||||||||||
| Total Exploration Costs (GAAP) | 579 | 384 | 586 | ||||||||||||||||||||||||||
Less: Certain Impairments (2) | (291) | (42) | (113) | ||||||||||||||||||||||||||
| Total Exploration Costs (Non-GAAP) | 288 | 342 | 473 | ||||||||||||||||||||||||||
| Total Operating Cost (GAAP) (including Total Exploration Costs (GAAP)) - (j) | 10,037 | 9,022 | 9,380 | ||||||||||||||||||||||||||
| Total Operating Cost (Non-GAAP) (including Total Exploration Costs (Non-GAAP)) - (k) | 9,767 | 8,980 | 9,366 | ||||||||||||||||||||||||||
| Total Revenues from Sales of Crude Oil and Condensate, NGLs, and Natural Gas less Total Operating Cost (GAAP) (including Total Exploration Costs (GAAP)) | 7,541 | 8,354 | 13,416 | ||||||||||||||||||||||||||
| Total Revenues from Sales of Crude Oil and Condensate, NGLs, and Natural Gas less Total Operating Cost (Non-GAAP) (including Total Exploration Costs (Non-GAAP)) | 7,811 | 8,396 | 13,430 | ||||||||||||||||||||||||||
Revenues, Costs and Margins Per Barrel of Oil Equivalent (Continued) | | ||||||||||||||||||||||||||||
| In millions of USD, except Boe and per Boe amounts (Unaudited) | |||||||||||||||||||||||||||||
| 2024 | 2023 | 2022 | |||||||||||||||||||||||||||
| Per Barrel of Oil Equivalent (Boe) Calculations (GAAP) | |||||||||||||||||||||||||||||
| Composite Average Operating Revenues and Other per Boe - (b) / (a) | 60.97 | 67.30 | 77.53 | ||||||||||||||||||||||||||
| Composite Average Operating Expenses per Boe - (c) / (a) | 40.18 | 40.58 | 47.47 | ||||||||||||||||||||||||||
| Composite Average Operating Income (Loss) per Boe - (d) / (a) | 20.79 | 26.72 | 30.06 | ||||||||||||||||||||||||||
| Composite Average Revenue from Sales of Crude Oil and Condensate, NGLs, and Natural Gas per Boe - (e) / (a) | 45.22 | 48.34 | 68.77 | ||||||||||||||||||||||||||
| Total Operating Cost per Boe (excluding DD&A and Total Exploration Costs) - (f) / (a) | 13.76 | 14.31 | 15.84 | ||||||||||||||||||||||||||
| Composite Average Margin per Boe (excluding DD&A and Total Exploration Costs) - [(e) / (a) - (f) / (a)] | 31.46 | 34.03 | 52.93 | ||||||||||||||||||||||||||
| Total Operating Cost per Boe (excluding Total Exploration Costs) - (h) / (a) | 24.33 | 24.03 | 26.53 | ||||||||||||||||||||||||||
| Composite Average Margin per Boe (excluding Total Exploration Costs) - [(e) / (a) - (h) / (a)] | 20.89 | 24.31 | 42.24 | ||||||||||||||||||||||||||
| Total Operating Cost per Boe (including Total Exploration Costs) - (j) / (a) | 25.82 | 25.10 | 28.30 | ||||||||||||||||||||||||||
| Composite Average Margin per Boe (including Total Exploration Costs) - [(e) / (a) - (j) / (a)] | 19.40 | 23.24 | 40.47 | ||||||||||||||||||||||||||
| Per Barrel of Oil Equivalent (Boe) Calculations (Non-GAAP) | |||||||||||||||||||||||||||||
| Total Operating Cost per Boe (excluding DD&A and Total Exploration Costs) - (g) / (a) | 13.82 | 14.31 | 16.14 | ||||||||||||||||||||||||||
| Composite Average Margin per Boe (excluding DD&A and Total Exploration Costs) - [(e) / (a) - (g) / (a)] | 31.40 | 34.03 | 52.63 | ||||||||||||||||||||||||||
| Total Operating Cost per Boe (excluding Total Exploration Costs) - (i) / (a) | 24.39 | 24.03 | 26.83 | ||||||||||||||||||||||||||
| Composite Average Margin per Boe (excluding Total Exploration Costs) - [(e) / (a) - (i) / (a)] | 20.83 | 24.31 | 41.94 | ||||||||||||||||||||||||||
| Total Operating Cost per Boe (including Total Exploration Costs) - (k) / (a) | 25.13 | 24.98 | 28.26 | ||||||||||||||||||||||||||
Composite Average Margin per Boe (including Total Exploration Costs) - [(e) / (a) - (k) / (a)] | 20.09 | 23.36 | 40.51 | ||||||||||||||||||||||||||
| Additional Key Financial Information | | ||||||||||||||||||||||
| (Unaudited) | |||||||||||||||||||||||
See “Endnotes” below for related discussion and definitions. | 2024 Actual | 2023 Actual | 2022 Actual | ||||||||||||||||||||
| Crude Oil and Condensate Volumes (MBod) | |||||||||||||||||||||||
| United States | 490.6 | 475.2 | 460.7 | ||||||||||||||||||||
| Trinidad | 0.8 | 0.6 | 0.6 | ||||||||||||||||||||
| Total | 491.4 | 475.8 | 461.3 | ||||||||||||||||||||
| Natural Gas Liquids Volumes (MBbld) | |||||||||||||||||||||||
| Total | 245.9 | 223.8 | 197.7 | ||||||||||||||||||||
| Natural Gas Volumes (MMcfd) | |||||||||||||||||||||||
| United States | 1,728 | 1,551 | 1,315 | ||||||||||||||||||||
| Trinidad | 220 | 160 | 180 | ||||||||||||||||||||
| Total | 1,948 | 1,711 | 1,495 | ||||||||||||||||||||
| Crude Oil Equivalent Volumes (MBoed) | |||||||||||||||||||||||
| United States | 1,024.5 | 957.5 | 877.5 | ||||||||||||||||||||
| Trinidad | 37.6 | 27.3 | 30.7 | ||||||||||||||||||||
| Total | 1,062.1 | 984.8 | 908.2 | ||||||||||||||||||||
| Benchmark Price | |||||||||||||||||||||||
| Oil (WTI) ($/Bbl) | 75.72 | 77.61 | 94.23 | ||||||||||||||||||||
| Natural Gas (HH) ($/Mcf) | 2.27 | 2.74 | 6.64 | ||||||||||||||||||||
Crude Oil and Condensate - above (below) WTI1 ($/Bbl) | |||||||||||||||||||||||
| United States | 1.70 | 1.57 | 2.99 | ||||||||||||||||||||
| Trinidad | (11.29) | (9.03) | (8.07) | ||||||||||||||||||||
| Natural Gas Liquids - Realizations as % of WTI | |||||||||||||||||||||||
| Total | 30.9 | % | 29.7 | % | 39.0 | % | |||||||||||||||||
Natural Gas - above (below) NYMEX Henry Hub2 ($/Mcf) | |||||||||||||||||||||||
| United States | (0.28) | (0.04) | 0.63 | ||||||||||||||||||||
Natural Gas Realizations3 ($/Mcf) | |||||||||||||||||||||||
| Trinidad | 3.65 | 3.65 | 4.43 | ||||||||||||||||||||
| Total Expenditures (GAAP) ($MM) | 6,653 | 6,818 | 5,610 | ||||||||||||||||||||
Capital Expenditures4 (non-GAAP) ($MM) | 6,226 | 6,041 | 4,607 | ||||||||||||||||||||
| Operating Unit Costs ($/Boe) | |||||||||||||||||||||||
| Lease and Well | 4.04 | 4.05 | 4.02 | ||||||||||||||||||||
Gathering, Processing and Transportation Costs5 | 4.43 | 4.50 | 4.78 | ||||||||||||||||||||
| General and Administrative (GAAP) | 1.72 | 1.78 | 1.72 | ||||||||||||||||||||
General and Administrative (non-GAAP)6 | 1.70 | 1.78 | 1.67 | ||||||||||||||||||||
| Cash Operating Costs (GAAP) | 10.19 | 10.33 | 10.52 | ||||||||||||||||||||
Cash Operating Costs (non-GAAP)6 | 10.17 | 10.33 | 10.47 | ||||||||||||||||||||
| Depreciation, Depletion and Amortization | 10.57 | 9.72 | 10.69 | ||||||||||||||||||||
| Expenses ($MM) | |||||||||||||||||||||||
| Exploration and Dry Hole | 188 | 182 | 204 | ||||||||||||||||||||
| Impairment (GAAP) | 391 | 202 | 382 | ||||||||||||||||||||
Impairment (excluding certain impairments (non-GAAP))7 | 100 | 160 | 269 | ||||||||||||||||||||
| Capitalized Interest | 45 | 33 | 36 | ||||||||||||||||||||
| Net Interest | 138 | 148 | 179 | ||||||||||||||||||||
| TOTI (% of revenues from sales of crude oil and condensate, NGLs and natural gas) | |||||||||||||||||||||||
| (GAAP) | 7.1 | % | 7.4 | % | 7.0 | % | |||||||||||||||||
(non-GAAP)6 | 7.3 | % | 7.4 | % | 7.5 | % | |||||||||||||||||
| Income Taxes | |||||||||||||||||||||||
| Effective Rate | 22.1 | % | 21.6 | % | 21.7 | % | |||||||||||||||||
| Current Tax Expense ($MM) | 1,348 | 1,415 | 2,208 | ||||||||||||||||||||
Additional Key Information (Continued) | | ||||||||||||||||||||||