Annual Report Pursuant to Section 13 or 15(d) of the Securities Exchange Act of 1934
For the fiscal year ended December 31, 2025
or
☐
Transition Report Pursuant to Section 13 or 15(d) of the Securities Exchange Act of 1934
Commission File Number: 001-09819
DYNEX CAPITAL, INC.
(Exact name of registrant as specified in its charter)
Virginia
52-1549373
(State or other jurisdiction of incorporation or organization)
(I.R.S. Employer Identification No.)
140 East Shore Drive, Suite 100
Glen Allen,
Virginia
23059-5755
(Address of principal executive offices)
(Zip Code)
(804)
217-5800
(Registrant’s telephone number, including area code)
Securities registered pursuant to Section 12(b) of the Act:
Title of each class
Trading Symbol(s)
Name of each exchange on which registered
Common Stock, par value $0.01 per share
DX
New York Stock Exchange
6.900% Series C Fixed-to-Floating Rate Cumulative Redeemable Preferred Stock, par value $0.01 per share
DXPRC
New York Stock Exchange
Indicate by check mark if the registrant is a well-known seasoned issuer, as defined in Rule 405 of the Securities Act.
Yes
☒
No
☐
Indicate by check mark if the registrant is not required to file reports pursuant to Section 13 or 15(d) of the Act.
Yes
☐
No
☒
Indicate by check mark whether the registrant (1) has filed all reports required to be filed by Section 13 or 15(d) of the Securities Exchange Act of 1934 during the preceding 12 months (or for such shorter period that the registrant was required to file such reports), and (2) has been subject to such filing requirements for the past 90 days.
Yes
☒
No
☐
Indicate by check mark whether the registrant has submitted electronically every Interactive Data File required to be submitted pursuant to Rule 405 of Regulation S-T (§232.405 of this chapter) during the preceding 12 months (or for such shorter period that the registrant was required to submit such files).
Yes
☒
No
☐
Indicate by check mark whether the registrant is a large accelerated filer, an accelerated filer, a non-accelerated filer, a smaller reporting company, or an emerging growth company. See the definitions of “large accelerated filer,” “accelerated filer,” “smaller reporting company,” and "emerging growth company" in Rule 12b-2 of the Exchange Act.
Large accelerated filer
☒
Accelerated filer
☐
Non-accelerated filer
☐
Smaller reporting company
☐
Emerging growth company
☐
If an emerging growth company, indicate by check mark if the registrant has elected not to use the extended transition period for complying with any new or revised financial accounting standards provided pursuant to Section 13(a) of the Exchange Act. ☐
Indicate by check mark whether the registrant has filed a report on and attestation to its management’s assessment of the effectiveness of its internal control over financial reporting under Section 404(b) of the Sarbanes-Oxley Act
(15 U.S.C. 7262(b)) by the registered public accounting firm that prepared or issued its audit report.
x
If securities are registered pursuant to Section 12(b) of the Act, indicate by check mark whether the financial statements of the registrant included in the filing reflect the correction of an error to previously issued financial statements. ☐
Indicate by check mark whether any of those error corrections are restatements that required a recovery analysis of incentive-based compensation received by any of the registrant’s executive officers during the relevant recovery period pursuant to §240.10D-1(b). ☐
Indicate by check mark whether the registrant is a shell company (as defined in Rule 12b-2 of the Exchange Act).
Yes ☐ No ☒
As of June 30, 2025, the aggregate market value of the common stock held by non-affiliates of the registrant was approximately $1.5 billion based on the closing sales price on the New York Stock Exchange of $12.22.
On February 20, 2026, the registrant had 201,983,261 shares outstanding of common stock, $0.01 par value, which is the registrant’s only class of common stock.
DOCUMENTS INCORPORATED BY REFERENCE
Portions of the Definitive Proxy Statement for the registrant’s 2026 Annual Meeting of Shareholders, expected to be filed pursuant to Regulation 14A within 120 days from December 31, 2025, are incorporated by reference into Part III of this Annual Report on Form 10-K to the extent stated herein.
CAUTIONARY STATEMENT – This Annual Report on Form 10-K contains “forward-looking” statements within the meaning of Section 27A of the Securities Act of 1933, as amended (“Securities Act”), and Section 21E of the Securities Exchange Act of 1934, as amended (“Exchange Act”). We caution that such forward-looking statements we make are not guarantees of future performance, and actual results may differ materially from those expressed or implied in such forward-looking statements. Some factors that could cause actual results to differ materially from estimates expressed or implied in our forward-looking statements are set forth in this Annual Report on Form 10-K for the year ended December 31, 2025. See “Forward-Looking Statements” set forth within this Part 1, Item 1 and “Risk Factors” within Part I, Item 1A of this Annual Report on Form 10-K.
In this Annual Report on Form 10-K, we refer to Dynex Capital, Inc. and its subsidiaries as the "Company,” “we,” “us,” or “our,” unless we specifically state otherwise, or the context indicates otherwise.
PART I.
ITEM 1. BUSINESS
COMPANY OVERVIEW
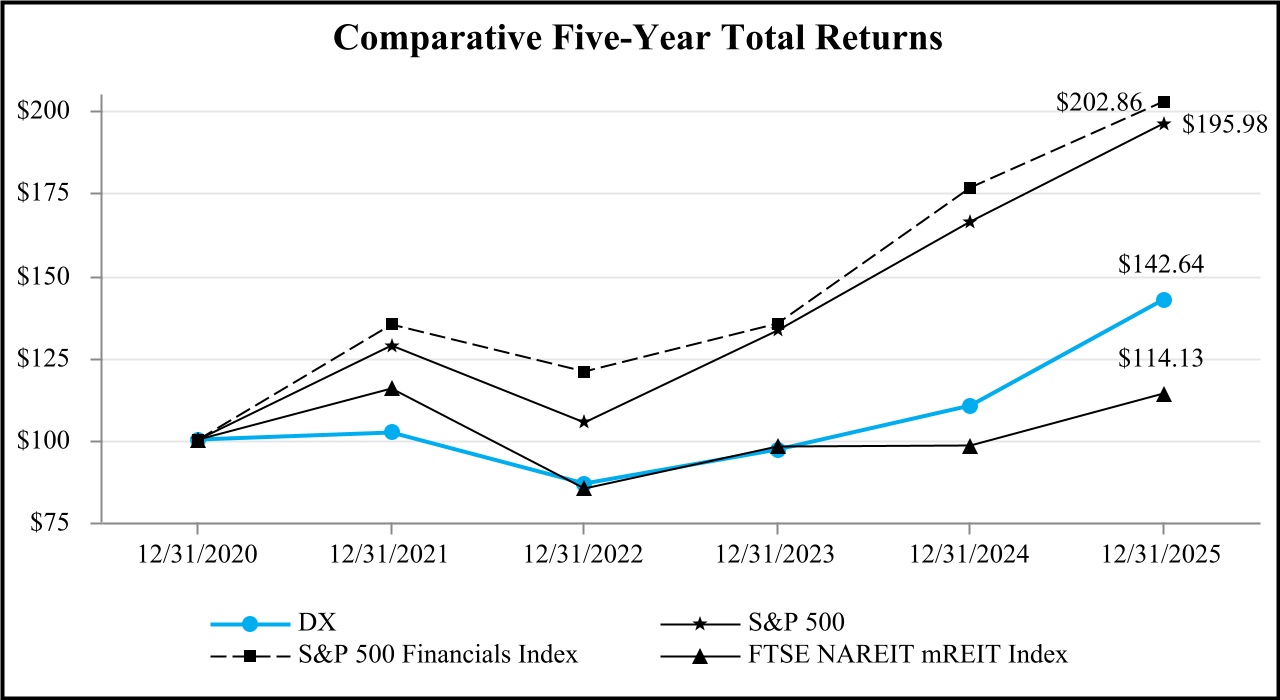
Dynex Capital, Inc. is a real estate investment trust (“REIT”) structured to deliver dividends to shareholders supported by long term returns from investments in mortgage assets backed by U.S. housing and commercial real estate. Our common and preferred stocks trade on the New York Stock Exchange (“NYSE”) under the ticker symbols “DX” and “DXPRC”, respectively.
We are internally managed and invest primarily in residential and commercial mortgage-backed securities (“RMBS” and “CMBS”, respectively), which are backed by residential and commercial mortgage loans, and which are Agency securities guaranteed by U.S. government-sponsored enterprises (“GSEs”). We may invest opportunistically in other mortgage-related assets consistent with our objectives. We actively manage interest rate, prepayment, spread, liquidity, and counterparty risks. The Dynex approach emphasizes risk management and disciplined capital allocation designed to preserve book value and support dividends across market cycles.
We operate to qualify as a REIT and to distribute at least 90% of our taxable income. We also seek to maintain exclusion from registration under the Investment Company Act of 1940 (the “1940 Act”). Please refer to “Operating and Regulatory Structure” within this Item 1, “Business” and Item 1A, “Risk Factors” of Part I of this Annual Report on Form 10-K for additional information.
Our business is subject to risks and uncertainties, including changes in interest rates and the yield curve, mortgage prepayments, market volatility and spread movements, financing conditions, counterparty performance, and regulatory and macroeconomic developments. Please refer to Item 1A, "Risk Factors," within this Part I as well as Part II, Item 7, "Management's Discussion and Analysis of Financial Condition and Results of Operations," and Item 7A, "Quantitative and Qualitative Disclosures about Market Risk," of this Annual Report on Form 10-K for additional discussions of factors that have the potential to impact our results of operations and financial condition.
INVESTMENT STRATEGY
Our investment strategy and the allocation of our capital to a particular sector or investment is driven by a “top-down” framework that focuses on the risk management, scenario analysis, and expected risk-adjusted returns of any investment. Key aspects of this framework include the following:
•understanding macroeconomic factors, global monetary and fiscal policies, and variable outcomes;
•understanding the regulatory environment, competition for assets, and terms and availability of financing;
•investment analysis, including understanding absolute returns, relative and risk-adjusted returns, and supply/demand metrics in various mortgage asset classes;
•financing and hedging analysis, including sensitivity analysis on credit, interest rate volatility, liquidity, and market value risk; and
•managing performance and inherent portfolio risks, including but not limited to interest rate, credit, prepayment, and liquidity risks.
1
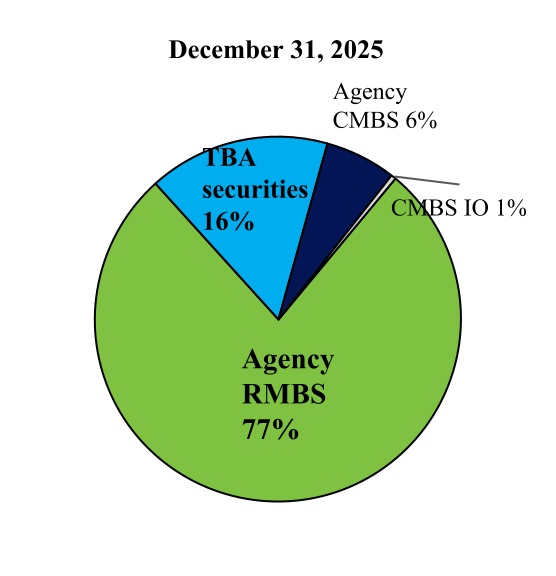
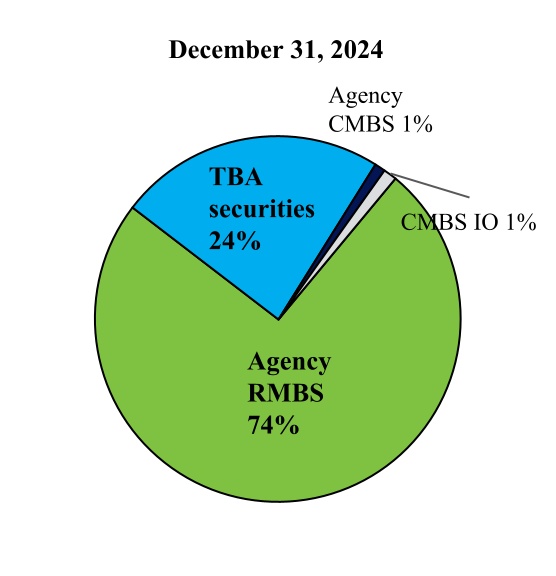
In allocating our capital and executing our strategy, we seek to balance the risks of owning specific types of investments with the earnings opportunity on the investment. Though the majority of our investment portfolio is currently in fixed-rate Agency RMBS, we may allocate capital from time to time to a variety of other investments, including adjustable-rate Agency RMBS, fixed-rate Agency CMBS, investment grade and unrated non-Agency RMBS and CMBS, Agency and non-Agency CMBS IO, and residual interests in securitized mortgage loans. Our investments in non-Agency MBS are generally higher quality senior or mezzanine classes (typically rated 'A' or better by one or more of the nationally recognized statistical rating organizations) because they are typically more liquid (i.e., they are more easily converted into cash either through sales or pledges as collateral for repurchase agreement borrowings) and have less exposure to credit losses than lower-rated non-Agency MBS. We regularly review our existing operations to determine whether our investment strategy or business model should change, including through capital reallocation, changing our targeted investments as well as hedging instruments and shifting our risk position.
From time to time, we analyze and evaluate potential business opportunities that we identify or are presented to us, including possible partnerships, mergers, acquisitions, or divestiture transactions that might maximize value for our shareholders. Pursuing such an opportunity or transaction could require us to issue additional equity or debt securities.
RMBS. As of December 31, 2025, the majority of our investments were Agency-issued pass-through RMBS collateralized primarily by pools of fixed-rate single-family mortgage loans. Monthly payments of principal and interest made by the individual borrowers on the mortgage loans underlying the pools are "passed through" to the security holders after deducting GSE or U.S. government agency guarantee and servicing fees. Mortgage pass-through certificates generally distribute cash flows from the underlying collateral on a pro-rata basis among the security holders. Security holders also receive guarantor advances of principal and interest for delinquent loans in the mortgage pools.
We also purchase to-be-announced securities (“TBAs” or “TBA securities”) as a means of investing in non-specified fixed-rate Agency RMBS, and from time to time, we may also sell TBA securities to economically hedge our book value exposure to Agency RMBS. A TBA security is a forward contract (“TBA contract”) for the purchase (“long position”) or sale (“short position”) of a fixed-rate Agency MBS at a predetermined price with certain principal and interest terms and certain types of collateral. The actual Agency securities to be delivered are not identified until approximately two days before the settlement date. We hold long and short positions in TBA securities by executing a series of transactions, commonly referred to as “dollar roll” transactions, which effectively delay the settlement of a forward purchase (or sale) of a non-specified Agency RMBS by entering into an offsetting TBA position, net settling the paired-off positions in cash, and simultaneously entering into an identical TBA long (or short) position with a later settlement date. TBA securities purchased or sold for a forward settlement date are generally priced at a discount relative to TBA securities settling in the current month because the current month settlement will receive a coupon sooner than the TBA settling in a forward month. This price difference, often referred to as “drop income,” represents the economic equivalent of net interest income (interest income less implied financing cost) on the underlying Agency security from the trade date to the settlement date. We account for all TBAs (whether net long or net short positions, or collectively “TBA dollar roll positions”) as derivative instruments because we cannot assert that it is probable at inception and throughout the term of an individual TBA transaction that its settlement will result in physical delivery of the underlying Agency RMBS, or that the individual TBA transaction will settle in the shortest period possible.
CMBS. Our CMBS investments comprised 6% of our investment portfolio as of December 31, 2025, and are fixed-rate Agency-issued securities backed by multifamily housing loans. The loans underlying CMBS are generally fixed-rate with scheduled principal payments generally assuming a 30-year amortization period but typically requiring balloon payments on average approximately 5-10 years from origination. These loans typically have some form of prepayment protection provisions (such as prepayment lock-out) or prepayment compensation provisions (such as yield maintenance or prepayment penalty), which provide us compensation if underlying loans prepay prior to us earning our expected return on our investment. Yield maintenance and prepayment penalty requirements are intended to create an economic disincentive for the loans to prepay, which we believe makes CMBS less costly to hedge relative to RMBS.
2
CMBS IO. CMBS interest only (“CMBS IO”) are interest-only securities issued as part of a CMBS securitization and represent the right to receive a portion of the monthly interest payments (but not principal cash flows) on the unpaid principal balance of the underlying pool of commercial mortgage loans. We have investments in both Agency-issued and non-Agency issued CMBS IO, which collectively comprised less than 1% of our investment portfolio as of December 31, 2025. The loans collateralizing Agency-issued CMBS IO pools are similar in composition to the pools of loans that collateralize CMBS as discussed above. Non-Agency issued CMBS IO, which are issued by non-governmental enterprises and do not have a guaranty of principal or interest payments, are backed by loans secured by many different property types, including multifamily, office buildings, hospitality, and retail, among others. Since CMBS IO securities have no principal associated with them, the interest payments received are based on the unpaid principal balance of the underlying mortgage loan pool, which is commonly referred to as the notional amount. Yields on CMBS IO securities depend on the underlying loans’ performance. Similar to CMBS described above, the Company may receive prepayment compensation; however, there are no prepayment protections if the loan defaults and is partially or wholly repaid earlier because of loss mitigation actions taken by the underlying loan servicer. Because Agency CMBS IO generally contain higher credit quality loans, they have a lower risk of default than non-Agency CMBS IO. The majority of our CMBS IO investments are well-seasoned and investment grade-rated, with the majority rated ‘AAA’ by at least one of the nationally recognized statistical rating organizations.
FINANCING STRATEGY
We employ leverage to enhance the returns on our invested capital by pledging our investments as collateral for borrowings, primarily through repurchase agreements. The amount of leverage we utilize is contingent on various factors such as prevailing economic, political, and financial market conditions; the actual and anticipated liquidity and price volatility of our assets; the gap between the duration of our investments, financings, and hedges; the availability and cost of financing our assets; our opinion of the creditworthiness of financing counterparties; the health of the U.S. residential mortgage and housing markets; our outlook for the level, slope, and volatility of interest rates; the credit quality of the loans underlying our investments; the rating assigned to securities; and our outlook for asset spreads. Repurchase agreements generally have original terms to maturity of overnight to six months, though in some instances, we may enter into longer-dated maturities depending on market conditions. We pay interest on our repurchase agreement borrowings at a rate determined by a spread to certain short-term interest rates and fixed for the term of the borrowing. Borrowings under uncommitted repurchase agreements are renewable at the discretion of our lenders and do not contain guaranteed rollover terms.
Repurchase agreement financing is provided principally by major financial institutions and broker-dealers acting as financial intermediaries for short-term cash investors, including money market funds and securities lenders. Repurchase agreement financing exposes us to counterparty risk to such financial intermediaries, principally related to the excess of our collateral pledged over the amount borrowed. We seek to mitigate this risk by spreading our borrowings across a diverse set of repurchase agreement lenders. As of December 31, 2025, we did not have more than 10% of equity at risk with any of our repurchase agreement counterparties. Please refer to "Risk Factors—Risks Related to Our Financing and Hedging Activities" in Part I, Item 1A of this Annual Report on Form 10-K for additional information regarding significant risks related to repurchase agreement financing.
RISK MANAGEMENT AND HEDGING STRATEGIES
As a leveraged investor, risk management is essential to our business operations. We face a range of market risks, including interest rate, prepayment, extension, spread, and credit risks. Our investment strategies reflect our assessment of these risks, our ability to hedge a portion of them, and our intent to maintain our REIT qualification, which could limit our activities and the instruments that we may use to hedge risk.
Our hedging strategy is dynamic and is based on our assessment of U.S. and global economic conditions, monetary policies, and our expectations for future interest rates—both their absolute level and the slope of the yield curve relative to market pricing. We use derivative instruments primarily as economic hedges of our exposure to adverse changes in interest rates resulting from our ownership of longer-term fixed-rate investments financed using
3
short-term repurchase agreements with interest rates that reset each time we renew our borrowing. Some interest rate hedges are intended to protect primarily against larger interest rate moves and may be less effective for smaller changes. We also may choose to not fully hedge interest rate risk, as well as prepayment or extension risks, if we believe maintaining some risk exposure enhances our return profile or if certain hedges could adversely affect our REIT status.
We do not use hedges to protect our book value from spread risk—the possibility that the spread between market yields on our assets and the benchmark rates, primarily U.S. Treasury benchmarks, will change. We attempt to mitigate spread risk primarily by diversification in the coupon and asset types we hold in our portfolio. Our risk-management decisions may reduce near-term earnings and dividends in order to preserve our book value and the maintenance of attractive earnings and dividends over the long term.
OPERATING POLICIES
We invest our capital and manage our risk according to our “Investment Policy,” which is approved by our Board of Directors. The Investment Policy sets forth investment and risk limitations related to the Company's investment activities and sets parameters for the Company's investment and capital allocation decisions. The Investment Policy also places limits on certain risks to which we are exposed, such as interest rate risk, liquidity risk, and shareholders’ equity at risk from changes in the fair value of our investment securities. Also, it sets forth limits for the Company’s overall leverage and who is expressly authorized to trade.
Our Investment Policy currently limits our investment in non-Agency MBS that are rated BBB+ or lower at the time of purchase by any of the nationally recognized statistical ratings organizations to 10% of total shareholders’ equity. We also conduct our own independent evaluation of the credit risk on any non-Agency MBS, so that we do not rely solely on the security’s credit rating. Our Investment Policy requires us to perform a variety of stress tests to model the effect of adverse market conditions on our investment portfolio value and our liquidity.
Within the overall limits established by the Investment Policy, our investment and capital allocation decisions depend on prevailing market conditions and other factors and may change over time in response to opportunities available in different economic and capital market environments. Our Board of Directors may also adjust the Investment Policy from time to time based on macroeconomic expectations, market conditions, and risk tolerances.
In addition to the Investment Policy described above, we manage our operations and investments to comply with various REIT limitations (as discussed further below in “Operating and Regulatory Structure”) and to avoid qualifying as an investment company as such term is defined in the 1940 Act or as a commodity pool operator under the Commodity Exchange Act of 1936, as amended.
HUMAN CAPITAL STRATEGY
The Company views its employees as its most important asset and as the key to managing a successful business for the benefit of all of our stakeholders. Our human capital strategy is designed to create an environment where our employees can grow professionally and contribute to the success of the Company. We believe a supportive, collaborative, engaging, and equitable culture is key to attracting and retaining skilled, experienced, and talented employees and fostering the development of the Company’s next generation of leaders. We have implemented a formal operating process to track, manage, and monitor key corporate goals for the Company and our employees. Further, we encourage employee engagement through monthly Company-wide meetings and an anonymous survey to assess employee satisfaction and to solicit feedback on the employee experience at the Company.
As of December 31, 2025, we had 28 full and part-time employees with an average tenure of 8.9 years. Our voluntary turnover rate was 9% based on an average headcount of 22 for the three years ended December 31, 2025. None of our employees are covered by any collective bargaining agreements, and we are not aware of any union-organizing activity relating to our employees.
4
Dynex Values
As part of our mission and values, Dynex focuses on key attributes that each employee, board member, consultant, and business partner embodies. Delivering value, fostering curiosity, building trust, and being kind allow us to build a winning team. Our team is focused on alignment with shareholders, being prepared, proactively identifying potential risks, being a trusted partner, and helping each other develop and grow professionally. These values propel us to seek different perspectives and build diversity of thought, which we believe is essential to strengthening the Company. We hire, evaluate, reward, and promote based on experience, performance, and values.
Health, Safety, and Wellness
The Company strives to offer employees a healthy work-life balance and an open environment in which they are encouraged to offer thoughts and opinions. Employees have a wide selection of resources available to help protect their health, well-being, and financial security, including an on-site gym, coverage of a substantial portion of their health insurance, and a competitive 401(k) company match. We provide our employees with access to flexible, comprehensive, and convenient medical coverage intended to meet their needs and the needs of their families. In addition to standard medical coverage, we offer employees dental and vision coverage, health savings and flexible spending accounts, paid time off, employee assistance programs, voluntary short-term and long-term disability insurance, term life insurance, and other benefits. In addition, we have historically offered flexible working arrangements to accommodate the individual needs of our employees.
Employee Development
Recognizing the vital role that human capital management serves in the long-term success of the Company, we have initiated a Human Capital Strategy Planning process, which is overseen by our Board of Directors, to formalize the process for management and development of employees. In addition to talent management and development initiatives, the Human Capital Strategy Planning process includes the following:
•development of organizational core values and integration of these values into a variety of human
capital processes and practices;
•offering personal and professional development programs for all employees;
•formal process for determining current and future human capital requirements; and
•implementing improved performance measures designed to determine individual and team developmental needs.
COMPETITION
In purchasing investments and obtaining financing, we compete with other mortgage REITs, broker-dealers and investment banking firms, GSEs, mutual funds, banks, hedge funds, mortgage bankers, insurance companies, governmental bodies, including the Federal Reserve, and other entities, many of which may have greater financial resources and a lower cost of capital than we do. Increased competition in the market may reduce the available supply of investments and may drive prices of investments to levels that would negatively impact our ability to earn an acceptable amount of income from these investments. Competition may also reduce the availability of borrowing capacity at our repurchase agreement counterparties as such capacity is not unlimited.
OPERATING AND REGULATORY STRUCTURE
Real Estate Investment Trust Requirements
As a REIT, we are required to abide by certain requirements for qualification as a REIT under the Internal Revenue Code of 1986, as amended (the “Tax Code”). To retain our REIT status, the REIT rules generally require that we invest primarily in real estate-related assets, that our activities be passive rather than active, and that we distribute annually to our shareholders amounts equal to at least 90% of our REIT taxable income, after certain
5
deductions. Dividend distributions to our shareholders in excess of REIT taxable income are considered a return of capital to the shareholder.
We use the calendar year for financial reporting in accordance with generally accepted accounting principles (“GAAP”) in the United States and for tax purposes. Income determined under GAAP differs from income determined under U.S. federal income tax rules due to permanent and temporary differences in income and expense recognition. The primary differences between our GAAP net income and our taxable income are: (i) unrealized gains and losses on investments (including TBAs accounted for as derivatives) are recognized in comprehensive income for GAAP purposes but are excluded from taxable income until realized; (ii) realized gains and losses on derivatives that are designated as tax hedges which are recognized in net income for GAAP purposes but are deferred and amortized for tax purposes over the original periods hedged by those derivatives (e.g., 10 years for a short position on a 10-year U.S. Treasury future position); and (iii) permanent differences due to limitations on the deductibility of certain GAAP expenses from taxable income. The Company estimates its REIT taxable income for the year ended December 31, 2025, is $229 million, which includes $100 million related to the amortization of net deferred tax hedge gains.
The following table provides the projected amortization of our net deferred tax hedge gains as of December 31, 2025, that will be recognized as taxable income over the periods indicated. However, recognition of deferred tax hedge gains and losses may be accelerated if the underlying instrument originally hedged is terminated or paid off:
Projected Period of Recognition for Tax Hedge Gains, Net
December 31, 2025
($ in thousands)
Fiscal year 2026
$
95,972
Fiscal year 2027
91,382
Fiscal year 2028
85,347
Fiscal year 2029 and thereafter
285,531
$
558,232
As of December 31, 2025, we also had $505 million of capital loss carryforwards, all of which will expire by either December 31, 2027 or by December 31, 2028.
We declared common stock dividends of $2.00 for the year ended December 31, 2025 for GAAP purposes. Our monthly dividend of $0.17 for December 2025 is recognized in the year ended December 31, 2025, for GAAP purposes, but it is not recognized as a taxable dividend until it is paid in January 2026. Likewise, the monthly dividend of $0.15 per common share that we declared for December 2024 was recognized in the year ended December 31, 2024, for GAAP purposes, but it is included as a taxable dividend for 2025. As such, the total dividends declared for tax purposes is $1.98 for the year ended December 31, 2025.
The following table summarizes our dividends declared per share and their related tax characterization for the periods indicated:
6
Tax Characterization
Total Dividends Paid Per Share
Ordinary
Capital Gain
Return of Capital
Common dividends declared:
Year ended December 31, 2025
$
1.84334
$
—
$
0.13666
$
1.98000
Year ended December 31, 2024
$
1.27707
$
—
$
0.30293
$
1.58000
Preferred Series C dividends declared:
Year ended December 31, 2025
$
2.13485
$
—
$
—
$
2.13485
Year ended December 31, 2024
$
1.72500
$
—
$
—
$
1.72500
Qualification as a REIT
Qualification as a REIT requires that we satisfy various tests relating to our income, assets, distributions, and ownership. The significant tests are summarized below.
Sources of Income. To continue qualifying as a REIT, we must satisfy two distinct tests with respect to the sources of our income: the “75% income test” and the “95% income test.” The 75% income test requires that we derive at least 75% of our gross income (excluding gross income from prohibited transactions) from certain real estate-related sources. To satisfy the 95% income test, 95% of our gross income for the taxable year must consist of either income that qualifies under the 75% income test or certain other types of passive income, such as interest and dividends. Our primary source of income is interest on obligations secured by mortgages on real property.
If we fail to meet either the 75% income test or the 95% income test, or both, in a taxable year, we might nonetheless continue to qualify as a REIT, if our failure was due to reasonable cause and not willful neglect and the nature and amounts of our items of gross income were properly disclosed to the Internal Revenue Service (the “IRS”). However, in such a case, we would be required to pay a tax equal to 100% of any excess non-qualifying income.
Nature and Diversification of Assets. At the end of each calendar quarter, we must meet multiple asset tests. Under the “75% asset test,” at least 75% of the value of our total assets must represent cash or cash items (including receivables), government securities, or real estate assets. Under the “10% asset test,” we may not own more than 10% of the outstanding voting power or value of securities of any single non-governmental issuer, provided such securities do not qualify under the 75% asset test or relate to taxable REIT subsidiaries. Under the “5% asset test,” ownership of any stocks or securities that do not qualify under the 75% asset test must be limited, in respect of any single non-governmental issuer, to an amount not greater than 5% of the value of our total assets (excluding ownership of any taxable REIT subsidiaries). Taxable REIT subsidiaries may not exceed 20% of the value of our total assets.
If we inadvertently fail to satisfy one or more of the asset tests at the end of a calendar quarter, such failure would not cause us to lose our REIT status, provided that (i) we satisfied all of the asset tests at the close of the preceding calendar quarter and (ii) the discrepancy between the values of our assets and the standards imposed by the asset tests either did not exist immediately after the acquisition of any particular asset or was not wholly or partially caused by such an acquisition. If the condition described in clause (ii) of the preceding sentence was not satisfied, we still could avoid disqualification by eliminating any discrepancy within 30 days after the close of the calendar quarter in which it arose.
Ownership. To maintain our REIT status, we must not be deemed to be closely held and must have more than 100 shareholders. The closely held prohibition requires that not more than 50% of the value of our outstanding shares be owned by five or fewer persons at any time during the last half of our taxable year. The "more than 100 shareholders" rule requires that we have at least 100 shareholders for 335 days of a twelve-month taxable year. If we failed to satisfy the ownership requirements, we would be subject to fines and required to take curative action to
7
meet the ownership requirements in order to maintain our REIT status. Please refer to Part I, Item 1A, "Risk Factors" of this Annual Report on Form 10-K for further discussion.
Exemption from Regulation under the Investment Company Act of 1940
We conduct our operations under the exemption provided under Section 3(c)(5)(C) of the 1940 Act, a provision available to companies primarily engaged in the business of purchasing and otherwise acquiring mortgages and other liens on and interests in real estate. According to the U.S. Securities and Exchange Commission (“SEC”) staff no-action letters, companies relying on this exemption must ensure that at least 55% of their assets are mortgage loans and other qualifying assets and at least 80% are real estate-related. The 1940 Act requires that we and each of our subsidiaries evaluate our qualification for exemption under the 1940 Act. Our subsidiaries rely either on Section 3(c)(5)(C) of the 1940 Act or other sections that provide exemptions from registering under the 1940 Act, including Sections 3(a)(1)(C) and 3(c)(7). Under the 1940 Act, an investment company is required to register with the SEC and is subject to extensive restrictive and potentially adverse regulations relating to, among other things, operating methods, management, capital structure, leverage, dividends, and transactions with affiliates. We believe that we are operating our business in accordance with the exemption requirements of Section 3(c)(5)(C) of the 1940 Act. Please refer to Part I, Item 1A, "Risk Factors" of this Annual Report on Form 10-K for further discussion.
Exemption from Regulation as a Commodity Pool Operator
The Dodd-Frank Act established a comprehensive new regulatory framework for derivative contracts commonly referred to as “swaps.” As a result, any investment fund that trades in swaps or other derivatives may be considered a “commodity pool,” which would cause its operators (in some cases, the fund’s directors) to be regulated as commodity pool operators (“CPOs”). On December 7, 2012, the Commodity Futures Trading Commission’s (“CFTC”) Division of Swap Dealer and Intermediary Oversight (the “Division”) issued no-action relief from CPO registration to mortgage REITs that use CFTC-regulated products (“commodity interests”) and that satisfy certain enumerated criteria. Pursuant to the no-action letter, the Division will not recommend that the CFTC take enforcement action against a mortgage REIT if its operator fails to register as a CPO, provided that the mortgage REIT (i) submits a claim to take advantage of the relief and (ii) the mortgage REIT: (a) limits the initial margin and premiums required to establish its commodity interest positions to no greater than 5% of the fair market value of the mortgage REIT’s total assets; (b) limits the net income derived annually from its commodity interest positions, excluding the income from commodity interest positions that are “qualifying hedging transactions,” to less than 5% of its annual gross income; (c) does not market interests in the mortgage REIT to the public as interests in a commodity pool or otherwise in a vehicle for trading in the commodity futures, commodity options or swaps markets; and (d) either: (1) identified itself as a “mortgage REIT” in Item G of its last U.S. income tax return on Form 1120-REIT; or (2) if it has not yet filed its first U.S. income tax return on Form 1120-REIT, it discloses to its shareholders that it intends to identify itself as a “mortgage REIT” in its first U.S. income tax return on Form 1120-REIT. We believe that we have complied with all of the requirements set forth above as of December 31, 2025. Please refer to Part I, Item 1A, "Risk Factors" of this Annual Report on Form 10-K for further discussion.
AVAILABLE INFORMATION
We are subject to the reporting requirements of the Exchange Act and its rules and regulations. The Exchange Act requires us to file reports, proxy statements, and other information with the SEC. These materials may be obtained electronically by accessing the SEC’s home page at www.sec.gov.
Our website can be found at www.dynexcapital.com. Our annual reports on Form 10-K, our quarterly reports on Form 10-Q, our current reports on Form 8-K, and amendments to those reports, filed or furnished pursuant to Section 13(a) or 15(d) of the Exchange Act, are made available free of charge through our website as soon as reasonably practicable after such material is electronically filed with or furnished to the SEC. Our Code of Business Conduct and Ethics (our “Code of Conduct”) is available on our website, along with our Whisteblower Policy, Audit Committee Charter, Nominating and Corporate Governance Committee Charter, Compensation Committee Charter, and Risk Committee Charter. We will post amendments to the Code of Conduct or waivers from
8
its provisions, if any, on our website that apply to any of our directors or executive officers in accordance with the requirements of the SEC or the NYSE.
The information on our website is not a part of, nor is it incorporated by reference, into this Annual Report. Further, our references to the URLs for these websites are intended to be inactive textual references only.
Regulation FD Disclosures
In addition to information we file with the SEC, we routinely announce material information to investors and the marketplace using press releases, public conference calls, presentations, webcasts, and on the investor relations page of our website and our LinkedIn page. We use these channels for purposes of compliance with Regulation FD and as routine channels for distribution of important information. While not all of the information that we post to the investor relations page of our website or to our LinkedIn page is of a material nature, some information could be deemed to be material. Accordingly, investors should monitor these channels, in addition to following our press releases, SEC filings, and public conference calls and webcasts. The information posted on these channels are not incorporated by reference in this Annual Report on Form 10-K or in any other report or document we file with the SEC.
FORWARD-LOOKING STATEMENTS
Certain written statements in this Annual Report on Form 10-K that are not historical facts constitute “forward-looking statements” within the meaning of Section 27A of the Securities Act of 1933, as amended, and Section 21E of the Securities Exchange Act of 1934, as amended (the “Exchange Act”). Statements in this report addressing expectations, assumptions, beliefs, projections, future plans and strategies, future events, developments that we expect or anticipate will occur in the future, and future operating results, capital management, and dividend policy are forward-looking statements. Forward-looking statements are based upon management’s beliefs, assumptions, and expectations as of the date of this report regarding future events and operating performance, considering all information currently available to us, and are applicable only as of the date of this report. Forward-looking statements generally can be identified by the use of words such as “believe,” “expect,” “anticipate,” “estimate,” “plan,” “may,” “will,” “intend,” “should,” “could,” or similar expressions. We caution readers not to place undue reliance on our forward-looking statements, which are not historical facts and may be based on projections, assumptions, expectations, and anticipated events that do not materialize. Except as required by law, we are not obligated to, and do not intend to, update or revise any forward-looking statement, whether as a result of new information, future events, or otherwise.
Forward-looking statements are inherently subject to risks, uncertainties and other factors that could cause our actual results to differ materially from historical results or from any results expressed or implied by such forward-looking statements. Not all these risks and other factors are known to us. New risks and uncertainties arise over time, and it is not possible to predict those events or how they may affect us. The projections, assumptions, expectations, or beliefs upon which the forward-looking statements are based can also change as a result of these risks or other factors. If such a risk or other factor materializes in future periods, our business, financial condition, liquidity, and results of operations may vary materially from those expressed or implied in our forward-looking statements.
While it is not possible to identify all factors that may cause actual results to differ from historical results or any results expressed or implied by forward-looking statements or that may cause our projections, assumptions, expectations, or beliefs to change, some of those factors include the following:
•the risks and uncertainties referenced in this Annual Report on Form 10-K, especially those incorporated by reference into Part I, Item 1A, “Risk Factors,”
•our ability to find suitable reinvestment opportunities;
•changes in domestic economic conditions;
•geopolitical events and instability and the related impact on macroeconomic conditions as a result of such related uncertainty;
•tariffs that the U.S. imposes on trading partners or tariffs imposed on the U.S. from trading partners;
•global and domestic government policy changes and the ability or inability to react to rapidly changing economic policies;
9
•changes in interest rates and credit spreads, including the repricing of interest-earning assets and interest-bearing liabilities;
•our investment portfolio performance, particularly as it relates to cash flow, prepayment rates, and credit performance;
•the impact on markets and asset prices from changes in the Federal Reserve’s policies regarding the purchases of Agency RMBS, Agency CMBS, and U.S. Treasuries;
•actual or anticipated changes in Federal Reserve monetary policy or the monetary policy of other central banks;
•adverse reactions in U.S. financial markets related to actions of foreign central banks or the economic performance of foreign economies, including in particular China, Japan, the European Union, and the United Kingdom;
•the cost and availability of financing, including the future availability of financing due to changes to regulation of, and capital requirements imposed upon, financial institutions;
•the cost and availability of new equity capital;
•changes in our leverage and use of leverage;
•changes to our investment strategy, operating policies, dividend policy, or asset allocations;
•the quality of performance of third-party service providers, including our sole third-party service provider for our critical operations and trade functions;
•the loss or unavailability of our third-party service provider’s service and technology that supports critical functions of our business related to our trading and borrowing activities due to outages, interruptions, or other failures;
•the level of defaults by borrowers on loans underlying MBS;
•changes in our industry;
•increased competition;
•changes in government policies or regulations affecting our business;
•changes or volatility in the repurchase agreement financing markets and other credit markets;
•changes to the market for interest rate swaps and other derivative instruments, including changes to margin requirements on derivative instruments;
•uncertainty regarding continued government support of the U.S. financial system and U.S. housing and real estate markets, or to reform the U.S. housing finance system, including the resolution of the conservatorship of Fannie Mae and Freddie Mac;
•the composition of the Board of Governors of the Federal Reserve;
•the political environment in the U.S.;
•systems failures or cybersecurity incidents; and
•exposure to current and future claims and litigation.
ITEM 1A. RISK FACTORS
The following is a discussion of the risk factors we believe are material to our business. These are factors that, individually or in the aggregate, we think could cause our actual results to differ significantly from anticipated or historical results. In addition to understanding the key risks described below, investors should understand that it is not possible to predict or identify all risk factors. Consequently, the following is not a complete discussion of all potential risks or uncertainties facing our business.
RISKS RELATED TO OUR INVESTMENT ACTIVITIES
Changes in market spreads may negatively impact the market value and profitability of our investment portfolio.
Changes in market spreads represent the market’s valuation of the perceived riskiness of assets relative to risk-free rates. Market spreads change based on factors specific to a particular security, such as prepayment performance or credit performance, and other factors, including, but not limited to, macroeconomic and systemic changes, market psychology, market liquidity, and Federal Reserve monetary policies. When spreads widen, the market value of our investments will decline because market participants typically require additional yield to hold
10
riskier assets. Spread levels also impact income over the longer term. When market spreads tighten, we pay a higher premium for new investments, which lowers the yield we expect to earn on our future investment portfolio.
Interest rate fluctuations could negatively impact our financing costs, the market value of our investments, dividends, liquidity, and the market price of our stock.
Interest rate fluctuations impact us in multiple ways. During periods of rising rates, particularly interest rate increases that occur with increases to the targeted U.S. Federal Funds Rate (“Federal Funds Rate”), we may experience a decline in our net interest income because interest rates paid on our borrowings may increase faster than interest rates earned on our investments. While the Federal Reserve continued to reduce the targeted Federal Funds Rate in 2025, future reductions are not certain, and there can be no assurance that the Federal Reserve will not make upwards adjustments to the Federal Funds Rate in the future. Any increases in the Federal Funds Rate, and market anticipation of the same, are likely to cause our borrowing costs to increase, negatively impacting our net interest income, common stock dividends, market price of our stock, and book value per common share.
Interest rate increases may also negatively affect the market value of our securities, and if we do not adequately hedge against such increases, we will experience declines in comprehensive income, book value per common share, and liquidity. Since our investment portfolio consists substantially of fixed rate instruments, rising interest rates will reduce the market value of our MBS as market participants will in turn demand higher yielding assets. Reductions in the market value of our MBS typically result in margin calls from our lenders, which impacts our liquidity. Furthermore, an increasing interest rate environment may expose us to extension risk as prepayments on the loans underlying our MBS are likely to decline, which may reduce our ability to reinvest into higher yielding assets.
Conversely, declining interest rates may expose us to prepayment risk to the extent that prepayments increase on investments we own at a premium to their par value. We amortize the premiums we pay for a security using the effective interest method, so as prepayments increase, the amortization expense of any remaining premium we paid for an investment will also increase, and thereby negatively impact interest income. If market participants factor in potentially faster prepayment rates, we may also experience declines in the market value of higher coupon MBS.
Interest rate fluctuations may also impact the market price of our common stock independent of the effects such conditions may have on our investment and hedging portfolios. Interest rates may be impacted by many factors, including unexpected or uncertain domestic and global political and economic events, such as trade conflicts, international politics, global monetary policy, and the impact of economic or other sanctions, and it can be difficult to predict the impact such events could have on interest rates. Among other factors, one factor investors may consider in deciding whether to buy or sell our common stock is our dividend rate (or expected future dividend rate) relative to market interest rates. If market interest rates increase, prospective investors may demand a higher dividend rate on our common stock or seek alternative investments paying higher dividends or interest. We cannot assure you that we will achieve results that will allow us to increase our dividend rate in response to market interest rate increases.
Volatile market conditions for mortgages and mortgage-related assets as well as the broader financial markets can result in a significant contraction in liquidity for mortgages and mortgage-related assets, which may adversely affect the pricing reliability and value of our investments.
Our business is materially affected by conditions in the mortgage and real estate markets as well as the broader financial markets. Significant adverse changes in financial market conditions can result in a deleveraging of the global financial system and the forced sale of large quantities of mortgage-related and other financial assets. Concerns over economic recession, inflation, subdued growth expectations, interest rate increases, changes to U.S. fiscal and monetary policy, trade wars, new or increased tariffs, geopolitical issues, unemployment, the availability and cost of financing, or conditions in the mortgage and real estate market have historically contributed, and may continue to contribute to increased and prolonged volatility and diminished expectations for the economy and markets. Increased volatility and deterioration in the markets for mortgages and mortgage-related assets and investor perception of the risks associated with mortgage and mortgage-related assets as well as the broader financial markets may adversely affect the performance, liquidity and market value of our investments.
Periods of market stress can lead to dislocations in asset pricing, making it difficult to accurately value MBS because they are traded in over-the-counter (“OTC”) markets, which are less liquid and have less price
11
transparency than assets traded on securities exchanges. During periods of severe economic stress, a market may not exist for certain of our investments at any price, particularly non-Agency MBS.
When these conditions exist, institutions from which we seek financing for our investments may tighten their lending standards, increase haircuts or become insolvent, which could make it more difficult for us to obtain financing on favorable terms or at all. If the MBS market were to experience a severe or extended period of illiquidity, lenders may refuse to accept MBS as collateral for repurchase agreement financing. If we are unable to obtain financing on favorable terms, or at all, our ability to acquire new assets or maintain our existing portfolio could be adversely affected. Additionally, a lack of liquidity in the market may force us to sell assets at a loss to meet our liquidity needs.
Changes in the Federal Reserve, government agency, or other government related entity participation in the Agency mortgage market may impact the market value and return on our investments.
The Federal Reserve’s participation in the Agency mortgage market can materially impact the supply, pricing, and returns on our MBS investments. When the Federal Reserve actively purchases Agency RMBS, mortgage spreads usually tighten and the price of MBS tends to increase, which reduces the return potential of new purchases we make, and thereby negatively impacts future interest income. Conversely, actual or anticipated reductions in the Federal Reserve’s holdings of Agency RMBS may increase the return potential on new investments, but the market value of the investments we hold tend to decline due to spread widening and excess supply in the market, which could result in an increase in margin calls due to declines in the market value of collateral we have pledged to our repurchase agreement borrowings and negatively impact our financial condition and book value. In addition, if the actual pace at which the Federal Reserve reduces its holdings is faster than the market anticipates, interest rate volatility is likely to increase, spreads will widen further, and liquidity will decline in the market, which could result in larger than expected declines in our book value. Larger haircuts and margin calls could force us to sell MBS at a loss.
Changes in prepayment rates on the mortgage loans underlying our investments may subject us to reinvestment risk and adversely affect our interest income, the market value of our investments, and our liquidity.
We are subject to reinvestment risk as a result of the prepayment, repayment, and sales of our investments. To maintain our investment portfolio size and our earnings, we need to reinvest capital received from these events into new investments, and if market yields on new investments are lower, our interest income will decline. In addition, based on market conditions, our leverage, and our liquidity profile, we may decide to not reinvest the cash flows we receive from our investment portfolio even when attractive reinvestment opportunities areavailable, or we may decide to reinvest in assets with lower yield but greater liquidity. If we retain capital or pay dividends to return capital to shareholders rather than reinvest capital, or if we invest capital in lower yielding assets for liquidity reasons, the size of our investment portfolio and the amount of income generated by our investment portfolio will decline.
RMBS have no prepayment protection while CMBS and CMBS IO have voluntary prepayment protection in the form of a prepayment lock-out on the loan for an initial period or by yield maintenance or prepayment penalty provisions, which serve as full or partial compensation for future lost interest income on the loan, although, we may not be able to reinvest the proceeds into a similar yielding asset. Compensation for voluntary prepayment on CMBS IO securities may not be sufficient to compensate us for the loss of interest as a result of the prepayment. We have no protection from involuntary prepayments. The impact of involuntary prepayments on CMBS IO is particularly acute because the investment consists entirely of premium. An increase in involuntary prepayments will result in the loss of investment premiums at an accelerated rate which could materially reduce our interest income. Involuntary prepayments typically increase in periods of economic slowdown or stress, and actions taken as a result by the GSEs and federal, state, and local governments. Defaults in loans underlying our CMBS IO, particularly loans in non-Agency CMBS IO securities collateralized by income-producing properties such as retail shopping centers, office buildings, multifamily apartments, and hotels, may increase as a result of economic weakness.
Prepayments on Agency CMBS, which are often collateralized by a single loan, could result in margin calls by lenders in excess of our available liquidity, particularly for larger balance investments. Typically, there is a 20-day delay between the announcement of prepayments and the receipt of the cash from the prepayment; however, the repurchase agreement lender may initiate a margin call when the prepayment is announced. If we do not have liquidity available to cover the margin call at that time, we may be in default under the repurchase agreement until
12
we receive the cash from the prepayment. Alternatively, we could be forced to sell assets quickly and on terms unfavorable to us to meet the margin call.
We may be subject to risks associated with inadequate or untimely services from third-party loan servicers, which may negatively impact our results of operations. We also rely on corporate trustees to act on behalf of us and other holders of securities in enforcing our rights.
Loans underlying our non-Agency MBS receive primary and special servicing from third-party service providers, who control all aspects of loan collection, loss mitigation, default management, and ultimate resolution of a defaulted loan. If a third-party servicer fails to perform its duties under the securitization documents, as a result of insolvency or other reasons, this may result in a material increase in delinquencies or losses to the securities. For non-Agency MBS, any financial difficulties with the servicer could lead to a material increase in delinquencies or losses to the securities. As a result, the value of the securities may be adversely impacted, and we may incur losses on our investment.
We invest in securities guaranteed by Fannie Mae and Freddie Mac, which are currently under conservatorship by the Federal Housing Finance Agency (“FHFA”). Potential changes to the federal conservatorship of Fannie Mae and Freddie Mac or to the laws and regulations affecting the support that the GSEs receive from the U.S. government may adversely affect the availability, pricing, liquidity, market value, and financing of our assets.
As conservator, the FHFA has assumed all the powers of the shareholders, directors, and officers of the GSEs with the goal of preserving and conserving their assets. At various times since the implementation of the conservatorship, Congress and the executive branch have considered structural changes to the GSEs, including proposals that could lead to the release of the GSEs from conservatorship. If such support is modified or withdrawn, if the U.S. Treasury fails to inject new capital as needed, or if the GSEs are released from conservatorship, the market value of Agency MBS may significantly decline, making it difficult for us to obtain repurchase agreement financing or forcing us to sell assets at substantial losses. Furthermore, any policy changes to the relationship between the GSEs and the U.S. government may create market uncertainty and have the effect of reducing the actual or perceived credit quality of securities issued by the GSEs. It may also interrupt the cash flows received by investors on the underlying MBS. Finally, reforms to the GSEs could also negatively impact our ability to comply with the provisions of the 1940 Act (see further discussion below regarding risks related to the 1940 Act).
It could be uneconomical to roll our TBA contracts or we may be unable to meet margin calls on our TBA contracts, which would have a negative impact on our liquidity.
Under certain market conditions, Agency RMBS purchased (or sold) for forward settlement under a TBA contract may be priced at a premium to Agency RMBS for settlement in the current month. For example, changes to prepayment expectations on Agency RMBS as well as changes to the Federal Reserve’s reinvestment policy on Agency RMBS have adversely impacted the TBA dollar roll market. Under such conditions, we may not be able to roll our TBA positions prior to the settlement date, which could cause us to accept physical delivery of the security (or in the case of a short position, force us to deliver one of our Agency RMBS), which would mean using cash to pay off any amounts outstanding under a repurchase agreement collateralized by that security. We may not have sufficient funds or alternative financing sources available to settle such obligations. In addition, pursuant to the margin provisions established by the Mortgage-Backed Securities Division (“MBSD”) of the Fixed Income Clearing Corporation, we are subject to margin calls on our TBA contracts and our trading counterparties may require us to post additional margin above the levels established by the MBSD. Losses on TBA dollar roll transactions, failure to procure adequate financing to settle our obligations, or failure to meet margin calls under our TBA contracts could result in default or force us to sell assets under adverse market conditions.
Provisions requiring yield maintenance charges, prepayment penalties, defeasance, or lockouts in CMBS IO securities may not be enforceable.
Provisions in loan documents for mortgages in CMBS IO securities in which we invest requiring yield maintenance charges, prepayment penalties, defeasance, or lock-out periods may not be enforceable in some states and under federal bankruptcy law. Provisions in the loan documents requiring yield maintenance charges and prepayment penalties may also be interpreted as constituting the collection of interest for usury purposes. Accordingly, we cannot be assured that the obligation of a borrower to pay any yield maintenance charge or prepayment penalty under a loan document in a CMBS IO security will be enforceable. Also, we cannot be assured that foreclosure proceeds under a loan document in a CMBS IO security will be sufficient to pay an enforceable
13
yield maintenance charge. If yield maintenance charges and prepayment penalties are not collected, or if a lock-out period is not enforced, we may incur losses to write down the fair value of the CMBS IO security.
Credit ratings assigned to debt securities by credit rating agencies may not accurately reflect the risks associated with those securities. Changes in credit ratings for securities we own or for similar securities might negatively impact the market value of these securities.
Rating agencies rate securities based upon their assessment of the safety of the receipt of principal and interest payments on the securities. Rating agencies do not consider the risks of fluctuations in fair value or other factors that may influence the value of securities and, therefore, the assigned credit rating may not fully reflect the true risks of an investment in securities. Also, rating agencies may fail to make timely adjustments to credit ratings based on available data or changes in economic outlook or may otherwise fail to make changes in credit ratings in response to subsequent events, so the credit quality of our investments may be better or worse than the ratings indicate. We attempt to reduce the impact of the risk that a credit rating may not accurately reflect the risks associated with a particular debt security by not relying solely on credit ratings as the indicator of the quality of an investment. We make our acquisition decisions after factoring in other information that we have obtained about the loans underlying the security, creditworthiness of the borrowers, and the credit subordination structure of the security. Despite these efforts, our assessment of the quality of an investment may also prove to be inaccurate and we may incur credit losses in excess of our initial expectations.
Credit rating agencies may change their methods of evaluating credit risk and determining ratings on securities backed by real estate loans and securities. These changes may occur quickly and often. The market’s ability to understand and absorb these changes, and the impact to the securitization market in general, are difficult to predict. Such changes may have a negative impact on the value of securities that we own.
RISKS RELATED TO LEVERAGE, FINANCING AND HEDGING ACTIVITIES
Our use of leverage, primarily through repurchase agreements, to enhance shareholder returns increases the risk of volatility in our results and could lead to material decreases in comprehensive income, shareholders’ equity, dividends, and liquidity.
Leverage increases the return on our invested capital if we earn a greater return on investments than our cost of borrowing but decreases return on our invested capital if borrowing costs increase and we have not adequately hedged against such an increase. Further, using leverage magnifies the potential losses to shareholders’ equity and book value per common share if our investments’ fair market value declines, net of associated hedges.
Our ability to fund our operations, meet financial obligations, and finance targeted asset acquisitions may be adversely impacted by an inability to secure and maintain our financing through repurchase agreements or other borrowings with our counterparties. For example, lenders may respond to adverse market conditions by changing the terms of such financings in a manner that makes it more difficult for us to renew or replace on a continuous basis our maturing short-term repurchase agreement borrowings. Furthermore, we may have to dispose of assets at significantly depressed prices, which could result in significant losses, or we may be forced to curtail our asset purchases if certain events occur, including if we:
•are unable to renew or otherwise access new funds under our existing financing arrangements;
•are unable to arrange for new financing on acceptable terms;
•default on our financial covenants contained in our financing arrangements; or
•become subject to larger haircuts under our financing arrangements requiring us to post additional collateral.
In addition, if the Federal Reserve revises capital requirements for lenders, capital market liquidity may be reduced. As a result, our lenders may be required to significantly increase the cost of the financing that they provide to us or the amounts of collateral they require as a condition to providing us with financing. At various times, our lenders have revised and may continue to revise, their eligibility requirements for the types of assets that they are willing to finance or the terms of such financing arrangements, including increased haircuts and requiring additional cash collateral, based on, among other factors, the regulatory environment and a lender’s management of actual and perceived risk. Moreover, the amount of financing we receive under our financing agreements will be related to our lenders’ valuation of the assets subject to such agreements.
14
Typically, the master repurchase agreements that govern our borrowings grant the lender the absolute right, at its sole discretion, to reevaluate the fair market value of the assets subject to such repurchase agreements at any time. These valuations may be different from the values that we ascribe to these assets and may be influenced by recent asset sales at distressed levels by forced sellers. If a lender determines that the value of the assets has decreased, the lender has the right to initiate a margin call, which would require us to transfer additional assets, including cash, to the lender to collateralize the existing borrowing or to repay a portion of the outstanding borrowings. We may also be required to post additional collateral if haircuts increase under a repurchase agreement. In these situations, we may be forced to sell assets at significantly depressed prices to meet the margin calls, which may cause significant losses. Significant margin calls related to our repurchase agreement borrowings or variation margin related to our hedging instruments may have a material adverse effect on our results of operations, financial condition, business, liquidity, and ability to make distributions to our shareholders, and could cause the value of our capital stock to decline.
Our ability to access leverage in the conduct of our operations is impacted by certain factors that are beyond our control and are difficult to predict. Market dislocations could limit our ability to access funding or access funding on terms that we believe are attractive, which could have a material adverse effect on our financial condition.
For more information about our operating policies regarding our use of leverage, please see “Liquidity and Capital Resources” within Part II, Item 7, “Management’s Discussion and Analysis of Financial Condition and Results of Operations” of this Annual Report on Form 10-K.
Our repurchase agreements and agreements governing certain derivative instruments may contain financial and nonfinancial covenants. Our inability to meet these covenants could adversely affect our financial condition, results of operations, and cash flows.
In connection with certain of our repurchase agreements and derivative instruments, we are required to maintain certain financial and non-financial covenants. As of December 31, 2025, our most restrictive financial covenants require that the declines in our shareholders’ equity are no greater than 25% in any quarter and 35% in any year. In addition, virtually all of our repurchase agreements and derivative agreements require us to maintain our status as a REIT and be exempt from the provisions of the 1940 Act. Compliance with these covenants depends on market factors, the strength of our business, and operating results. Various risks, uncertainties, and events beyond our control, including significant fluctuations in interest rates, market volatility and changes in market conditions, may affect our ability to comply with these covenants. Failure to comply with these covenants could result in an event of default, termination of an agreement, acceleration of all amounts owed under an agreement, and may give the counterparty the right to exercise available remedies under the repurchase agreement, such as the sale of the asset subject to repurchase at the time of default, unless we were able to negotiate a waiver in connection with any such default. Any such waiver may be conditioned on an amendment to the underlying agreement and any related guaranty agreement on terms that may be unfavorable to us. If we are unable to negotiate a covenant waiver, or replace or refinance our assets under a new repurchase agreement on favorable terms or at all, we may be forced to sell assets at an inopportune time which will likely have a negative impact on our financial condition, results of operations, liquidity and cash flows. Further, certain of our repurchase agreements and derivative instruments have cross-default, cross-acceleration, or similar provisions, such that if we were to violate a covenant under one agreement, that violation could lead to defaults, accelerations, or other adverse events under other agreements, as well.
Our use of hedging strategies to mitigate our interest rate risk may not be effective and may adversely affect our net income, liquidity, and book value per common share.
We use a variety of derivative instruments to help mitigate increased financing costs and volatility in the market value of our investments from adverse changes in interest rates. Our hedging activity will vary in scope based on, among other things, our forecast of future interest rates, our investment portfolio construction and objectives, the actual and implied level and volatility of interest rates, and sources and terms of financing used. No hedging strategy can completely insulate us from the interest rate risk to which we are exposed. Interest rate hedging may fail to protect or could adversely affect our results of operations, book value and liquidity because, among other things:
15
•the performance of instruments used to hedge may not completely correlate with the performance of the assets or liabilities being hedged;
•available hedging instruments may not correspond directly with the interest rate risk from which we seek protection;
•the duration of the hedge may not match the duration of the related asset or liability given management’s expectation of future changes in interest rates or a result of the inaccuracies of models in forecasting cash flows on the asset being hedged;
•the value of derivatives used for hedging will be adjusted from time to time in accordance with GAAP to reflect changes in fair value and downward adjustments will reduce our earnings, shareholders’ equity, and book value;
•the amount of income that a REIT may earn from hedging transactions (other than through taxable REIT subsidiaries) may be limited by U.S. federal income tax rules governing REITs;
•interest rate hedging can be expensive, particularly during periods of volatile interest rates;
•the credit quality of the party owing money on the hedge may be downgraded to such an extent that it impairs our ability to sell or assign our side of the hedging transaction; and
•the party owing money in the hedging transaction may default on its obligation to pay.
Our hedging instruments can be traded on an exchange, or administered through a clearing house or under bilateral agreements between us and a counterparty. Bilateral agreements expose us to increased counterparty risk, and we may be at risk of losing any collateral held by a hedging counterparty if the counterparty becomes insolvent or files for bankruptcy.
Furthermore, the volume and type of derivative instruments we use to hedge is limited to the extent we must comply with necessary requirements to remain exempt from CFTC regulation as a CPO. If we fail to satisfy the criteria, (as listed in Item 1, “Business” of this Annual Report on Form 10-K), or if the criteria change, we may become subject to CFTC regulation or enforcement action, the consequences of which could have a material adverse effect on our financial condition or results of operations.
Clearing facilities or exchanges may increase the margin requirements we are required to post when entering into derivative instruments, which may negatively impact our ability to hedge and our liquidity.
We are required to post margin when entering into a hedging instrument that is traded on an exchange or administered through a clearing house. The amount of margin is set for each derivative instrument by the exchange or clearinghouse. Exchanges will also require additional margin in response to events having, or expected to have, adverse economic consequences. Future adverse economic developments, market uncertainty, or any proposed new reporting requirements by self-regulatory authorities and Congress may result in increased margin requirements for our hedging instruments, which may have a material adverse effect on our liquidity, financial condition and results of operations.
We may incur significant losses if we, or one or more of our third-party lenders, default on a repurchase agreement or file for bankruptcy.
Repurchase agreement transactions are legally structured as the sale of a security to a lender in return for cash from the lender. These transactions are accounted for as financing agreements because the lenders are obligated to resell the same securities back to us at the end of the transaction term. Because the cash we receive from the lender when we initially sell the securities to the lender is less than the value of those securities, if the lender defaults on its obligation to resell the same securities back to us at the end of the transaction term, we would incur a loss on the transaction equal to the difference between the value of the securities sold and the amount borrowed from the lender including accrued interest. The lender may default on its obligation to resell if it experiences financial difficulty or if the lender has re-hypothecated the security to another party who fails to transfer the security back to the lender. Additionally, if we default on one of our obligations under a repurchase agreement, the lender can terminate the transaction, sell the underlying collateral and cease entering into any other repurchase transactions with us. Any losses we incur on our repurchase transactions could adversely affect our liquidity and earnings, and therefore reduce our ability to pay dividends to our shareholders.
In the event that one of our lenders under a repurchase agreement files for bankruptcy, it may be difficult for us to recover our assets pledged as collateral to such lender. In addition, if we ever file for bankruptcy, lenders under our repurchase agreements may be able to avoid the automatic stay provisions of the U.S. Bankruptcy Code
16
and take possession of and liquidate our collateral under our repurchase agreements without delay. In the event that either we or one of our lenders file for bankruptcy, we may incur losses in amounts equal to the excess of our collateral pledged over the amount of repurchase agreement borrowing due to the lender, which would adversely affect our liquidity, earnings and ability to pay dividends to our shareholders.
The models we use to make purchases and risk management decisions for our portfolio may be inaccurate or incomplete, which could materially and adversely affect our cash flows.
We use models and third-party data to value and to measure the risk in our portfolio. These models provide estimates on duration, convexity, prepayment speeds, future interest rates, defaults as well as other factors. There are no guarantees that the models provide accurate results because, among other things, the assumptions, estimates, and judgments used as inputs may be inaccurate or incomplete. There is also a risk that market participants could be using different models or interpreting model results differently than we do. These variations in data, interpretation, and even model errors could result in potential losses of cash flow and trading losses in our portfolio.
RISKS RELATED TO OUR QUALIFICATION AS A REIT AND TAX-RELATED OR OTHER REGULATORY MATTERS
If we fail to conduct our operations properly, we may not qualify for exemption under the 1940 Act, which may reduce our flexibility and limit our ability to pursue certain opportunities.
We seek to conduct our operations to avoid falling under the definition of an investment company pursuant to the 1940 Act. Specifically, we seek to conduct our operations to comply with Section 3(c)(5)(C) of the 1940 Act, which provides an exemption to companies primarily engaged in the business of purchasing or otherwise acquiring mortgages and other liens on and interests in real estate. According to SEC staff no-action letters, companies relying on this exemption must ensure that at least 55% of their assets are mortgage loans and other qualifying assets and at least 80% of their assets are real estate-related. The 1940 Act requires that we and each of our subsidiaries evaluate our qualification for exemption under the 1940 Act. We believe that we are operating our business in accordance with the exemption requirements of Section 3(c)(5)(C) of the 1940 Act. Likewise, our subsidiaries will rely either on Section 3(c)(5)(C) of the 1940 Act or other sections of the 1940 Act that provide exemptions from registration thereunder, including Sections 3(a)(1)(C) and 3(c)(7).
Under the 1940 Act, an investment company is required to register with the SEC and is subject to extensive regulations relating to, among other things, operating methods, management, capital structure, leverage, dividends, and transactions with affiliates. If we are classified as an investment company, our ability to use leverage and conduct business as we do today would be substantially impaired. This would severely impact our business model, profitability, and ability to pay dividends to our shareholders.
To meet our REIT distribution requirements, we may be forced to increase our dividend distributions which could cause us to liquidate attractive assets or incur debt on unfavorable terms. If we are unable to generate the required cash for a cash dividend distribution, we may be forced to declare a dividend that is payable, at least in part, in the form of stock, in which case shareholders may be required to pay income taxes in excess of the cash dividends received.
To qualify as a REIT and avoid certain taxes, we must generally distribute at least 90% of our taxable income annually to our shareholders, subject to certain adjustments and excluding any net capital gain. To the extent that we satisfy this 90% distribution requirement but distribute less than 100% of our taxable income, including our net capital gain, we will be subject to federal corporate income tax on our undistributed taxable income. In addition, ifwe fail to meet certain other thresholds for the distribution of our taxable income, we may be subject to a non-deductible 4% excise tax. While we aim to distribute sufficient cash dividends to our shareholders to satisfy REIT distribution requirements and avoid the corporate income tax and the non-deductible 4% excise tax, we have not established a minimum dividend payment level and cannot guarantee future dividends will be payable in cash.
If we do not have the funds available to meet our REIT distribution requirements or to avoid corporate and excise taxes, we could be forced to use unfavorable options to generate the necessary cash, such as selling assets at distressed prices, borrowing on unfavorable terms, distributing amounts that would otherwise be invested or used to repay debt, or paying dividends in the form of stock. Taxable shareholders receiving stock will be required to include in income, as a dividend, the full value of such stock, to the extent of our current and accumulated earnings
17
for federal income tax purposes. As a result, a U.S. shareholder may be required to pay income taxes with respect to such dividends in excess of the cash dividends received.
As described in Item 1, “Operating and Regulatory Structure,” realized gains and losses on derivatives that we designate as tax hedges are one of the reasons why our net income for GAAP purposes will differ from our taxable income. As of December 31, 2025, we have $558 million of deferred tax hedge gains, which were recognized in GAAP net income during 2025 and prior periods. Our projected amortization of these deferred tax hedge gains into taxable income for 2026 is currently estimated to be $96 million; however, this amount is subject to change based on a number of factors, particularly given the degree of uncertainty about the trajectory of interest rates. It is possible that our REIT distribution requirements may exceed the net cash we generate from our operations.
We have not established a minimum dividend payment level, and we may not have the ability to pay dividends in the future. Furthermore, our monthly dividend strategy could attract shareholders who are especially sensitive to the level and frequency of the dividend. If we were to reduce the dividend or change to a quarterly payment cycle, our share price could materially decline.
We currently intend to pay regular dividends to our common shareholders and to make distributions to our shareholders in amounts such that all or substantially all of our taxable income, subject to certain adjustments, is distributed. However, we have not established a minimum dividend payment level, and the amount of our dividend is subject to fluctuation. Our ability to pay dividends may be adversely affected by the risk factors described herein. All distributions will be made at the discretion of our Board of Directors and will depend on our GAAP and tax earnings, our financial condition, the requirements for REIT qualification, and such other factors as our Board of Directors may deem relevant from time to time. We may not be able to make distributions, or our Board of Directors may change our dividend policy in the future. To the extent that we decide to pay dividends in excess of our current and accumulated tax earnings and profits, such distributions would generally be considered a return of capital for U.S. federal income tax purposes. A return of capital reduces the basis of a shareholder’s investment in our common stock to the extent of such basis and is treated as capital gain thereafter.
Our strategy of paying a monthly dividend is designed in part to attract retail shareholders that invest in stocks that pay a monthly dividend. The ownership of our stock may become overly concentrated in shareholders who only invest in monthly dividend-paying stocks. These shareholders may be more sensitive to reductions in the dividend or a change in the payment cycle, and our share price could materially decline if we were to reduce the dividend or change the payment cycle of our dividend.
Qualifying as a REIT involves highly technical and complex provisions of the Tax Code, and a technical or inadvertent violation could jeopardize our REIT qualification. Maintaining our REIT status may reduce our flexibility to manage our operations.
Qualification as a REIT involves the application of highly technical and complex Tax Code provisions for which only limited judicial and administrative authorities exist. Even a technical or inadvertent violation could jeopardize our REIT qualification. Our qualification as a REIT will depend on our satisfaction of certain asset and income tests, organization, distribution, shareholder ownership, and other requirements on a continuing basis. Any violations of the relevant requirements under the Tax Code could cause us to lose our REIT status or to pay significant penalties and interest. In addition, our ability to satisfy the requirements to qualify as a REIT depends in part on the actions of third parties over which we have no control or only limited influence, including in cases where we own an equity interest in an entity that is classified as a partnership for U.S. federal income tax purposes.
Maintaining our REIT status may limit flexibility in managing our operations. For instance:
•Compliance with the REIT requirements may limit the type or extent of investment or hedging activities.
•Our ability to own non-real estate related assets and earn non-real estate related income is limited. Our ability to own equity interests in other entities is limited. If we fail to comply with these limits, we may be forced to liquidate attractive assets on short notice on unfavorable terms in order to maintain our REIT status.
•Our ability to invest in taxable subsidiaries is limited under the REIT rules. Maintaining compliance with this limitation could require us to constrain the growth of future taxable REIT affiliates.
18
•Meeting minimum REIT dividend distribution requirements could reduce our liquidity. Earning non-cash REIT taxable income could necessitate our selling assets, incurring debt, or raising new equity in order to fund dividend distributions.
•Stock ownership tests may limit our ability to raise significant amounts of equity capital from one source.
We may be subject to adverse legislative or regulatory tax changes that could increase our tax liability, reduce our operating flexibility, or reduce the market price of our securities.
The present U.S. federal income tax treatment of REITs may be modified, possibly with retroactive effect, by legislative, judicial, or administrative action at any time, which could affect the U.S. federal income tax treatment of an investment in us. The U.S. federal income tax rules dealing with REITs are constantly under review and subject to frequent revisions to regulations and interpretations.
Future revisions in the U.S. federal tax laws and interpretations thereof may affect or cause us to change our investments and commitments and affect the tax considerations of an investment in us. Any such revisions could have an adverse effect on an investment in our securities or on the market value or the resale potential of our assets. Shareholders are urged to consult with their tax advisor with respect to the impact of such revisions on their investment in our shares and the status of legislative, regulatory, or administrative developments and proposals and their potential effect on an investment in our shares. Although REITs generally receive certain tax advantages compared to entities taxed as regular corporations, it is possible that future legislation would result in a REIT having fewer tax advantages, and it could become more advantageous for a company that invests in real estate to elect to be treated for U.S. federal income tax purposes as a corporation.
If we do not qualify as a REIT or fail to remain qualified as a REIT, we may be subject to tax as a regular corporation and could face a tax liability, which would reduce the amount of cash available for distribution to our shareholders. We would also violate debt covenants in certain repurchase and derivative agreements which may put us in default on these agreements.
We intend to operate in a manner that will allow us to qualify as a REIT for federal income tax purposes. Our ability to satisfy the asset tests depends upon our analysis of the characterization and fair market values of our assets, some of which are not susceptible to a precise determination, and for which we will not obtain independent appraisals. Our compliance with the REIT income and quarterly asset requirements also depends upon our ability to successfully manage the composition of our income and assets on an ongoing basis.
If we fail to qualify as a REIT in any taxable year, we will be subject to federal income tax before consideration of any dividends paid to our shareholders during the respective tax year. The resulting corporate tax liability could be material. Unless we are entitled to relief under certain Tax Code provisions, we also will be disqualified from taxation as a REIT until the fifth taxable year following the year for which we failed to qualify as a REIT. If we lose our REIT status, some of our lenders would have the right to terminate any repurchase agreement borrowings and derivative contracts outstanding at that time. This would further stress our liquidity position, reduce the amount of cash available for distribution to our shareholders, and could further exacerbate the adverse impacts on the value of our common stock described above.
Dividends payable by REITs do not qualify for the reduced tax rates available for some dividends.
The maximum tax rate applicable to “qualified dividend income” payable to U.S. shareholders that are taxed at individual rates is lower than the corresponding maximum ordinary income tax rates. Dividends payable by REITs, however, are generally not eligible for the reduced rates on qualified dividend income. Instead, under the current law, qualified REIT dividends constitute “qualified business income,” and thus, a 20% deduction is available to individual taxpayers with respect to such dividends, resulting in a 29.6% maximum federal tax rate (plus the 3.8% surtax on net investment income, if applicable) for individual U.S. shareholders. The more favorable rates applicable to regular corporate qualified dividends could cause investors who are taxed at individual rates to perceive investments in REITs to be relatively less attractive than equity investments in non-REIT entities that pay dividends, which could adversely affect the value of the shares of REITs, including our common stock.
Uncertainty exists with respect to the treatment of our TBAs for purposes of the REIT asset and income tests.
There is no direct authority with respect to the qualification of TBAs as real estate assets or U.S. government securities for purposes of the 75% asset test or the qualification of income or gains from dispositions of TBAs as gains from the sale of real property or other qualifying income for purposes of the 75% gross income test.
19
However, we treat our TBAs as qualifying assets for purposes of the REIT 75% asset test, and we treat income and gains from our TBAs as qualifying income for purposes of the 75% gross income test, based on an opinion of a nationally recognized accounting and tax services firm, substantially to the effect that (i) for purposes of the REIT asset tests, our ownership of a TBA should more likely than not be treated as ownership of the underlying Agency RMBS, and (ii) for purposes of the 75% REIT gross income test, any gain recognized by us in connection with the settlement of our TBAs should more likely than not be treated as gain from the sale or disposition of the underlying Agency RMBS. Tax opinions are not binding on the IRS, and no assurance can be given that the IRS will not successfully challenge the conclusions set forth in such opinions, which could lead to tax penalties, REIT compliance issues, or other regulatory compliance challenges. In addition, we must emphasize that the opinion is based on various assumptions relating to our TBAs and is conditioned upon fact-based representations and covenants made by our management regarding our TBAs. No assurance can be given that the IRS would not assert that such assets or income are not qualifying assets or income. If the IRS were to challenge the opinion successfully, we could be subject to a penalty tax or we could fail to remain qualified as a REIT if a sufficient portion of our assets consists of TBAs or a sufficient portion of our income consists of income or gains from the disposition of TBAs.
Our ability to qualify as a REIT could be adversely affected if the IRS disagrees with our treatment of repurchase agreement transactions as financing of the investments we pledge as collateral.
Repurchase agreement financing arrangements are structured legally as a sale and repurchase whereby we nominally sell certain of our investments to a counterparty and simultaneously enter into an agreement to repurchase these securities at a later date in exchange for a purchase price. Economically, these agreements are financings that are secured by the investments sold pursuant thereto, and we treat them as such for U.S. federal income tax purposes. We believe that we would be treated for REIT asset and income test purposes as the owner of the securities that are the subject of any such sale and repurchase agreement, notwithstanding that such agreement may legally transfer ownership of the securities to the counterparty during the term of the agreement. It is possible, however, that the IRS could assert that we did not own the securities during the term of the sale and repurchase agreement, in which case we could fail to qualify as a REIT.
Even if we remain qualified as a REIT, we may face other tax liabilities that reduce our cash flow and our profitability.
Even if we remain qualified for taxation as a REIT, we may be subject to certain federal, state, and local taxes on our income and assets, including taxes on any undistributed income, tax on income from certain activities conducted as a result of a foreclosure or considered prohibited transactions under the Tax Code. Any of these taxes would decrease cash available for distribution to our shareholders. In addition, to meet the REIT qualification requirements or to avert the imposition of a 100% tax that applies to certain gains derived by a REIT from prohibited transactions, we may hold some of our assets through a taxable REIT subsidiary (“TRS”) or other subsidiary corporations that will be subject to corporate-level income tax at regular rates. Any of these taxes would decrease cash available for distribution to our shareholders.
The stock ownership limit imposed by the Tax Code for REITs and our Restated Articles of Incorporation (“Articles of Incorporation”) may restrict our business combination opportunities. The stock ownership limitation may also result in reduced liquidity of our stock and may result in losses to an acquiring shareholder.
To qualify as a REIT under the Tax Code, not more than 50% in value of our outstanding stock may be owned, directly or indirectly, by five or fewer individuals (as defined in the Tax Code to include certain entities) at any time during the last half of each taxable year. Our Articles of Incorporation, with certain exceptions, authorize our Board of Directors to take the actions that are necessary and desirable to qualify as a REIT. Pursuant to our Articles of Incorporation, no person may beneficially or constructively own more than 9.8% of our capital stock (including our common and preferred stocks). Our Board of Directors may grant an exemption from this 9.8% stock ownership limitation, in its sole discretion, subject to such conditions, representations, and undertakings as it determines to be reasonably necessary.
The constructive ownership rules contained in our Articles of Incorporation are complex and may cause the outstanding stock owned by a group of related individuals or entities to be deemed as constructively owned by one individual. As a result, the acquisition of less than 9.8% of the outstanding stock by an individual or entity could cause that individual or entity to own constructively in excess of the ownership limit. Our Board of Directors has the
20
right to refuse to transfer any shares of our capital stock in a transaction that would result in ownership in excess of the ownership limit. In addition, we have the right to redeem shares of our capital stock held in excess of the ownership limit.
The ownership limits contained in our Articles of Incorporation are intended to assist us in complying with tax law requirements and to minimize administrative burdens. However, these ownership limits might also delay or prevent a transaction or a change in our control that might be in the best interest of our shareholders.
The stock ownership limit imposed by the Tax Code for REITs and our Articles of Incorporation may impair the ability of holders to convert shares of our outstanding preferred stock into shares of our common stock upon a change of control.
The terms of our outstanding preferred stock provide that, upon the occurrence of a change of control (as defined in the Articles of Incorporation), each holder of our outstanding preferred stock may have the right to convert, in conjunction with a change in control, all or part of such outstanding preferred stock held by such holder into a number of shares of our common stock per share of outstanding preferred stock based on the formulas set forth in our Articles of Incorporation. However, the stock ownership restrictions in our Articles of Incorporation also restrict ownership of shares of our outstanding preferred stock. As a result, no holder of outstanding preferred stock will be entitled to convert such stock into our common stock to the extent that receipt of our common stock would cause the holder to exceed the ownership limitations contained in our Articles of Incorporation, endanger the tax status of one or more real estate mortgage investment conduits in which we may have an interest, or result in the imposition of a direct or indirect penalty tax on us. These provisions may limit the ability of a holder of outstanding preferred stock to convert shares of preferred stock into our common stock upon a change of control, which could adversely affect the market price of shares of our outstanding preferred stock.
If we experience an ownership change as defined by the Tax Code for REITs, our ability to utilize our capital loss carryforwards to offset future taxable gains may be significantly limited or eliminated entirely, which could reduce cash available to distribute to our shareholders and adversely affect the market price of our common stock.
We have capital loss carryforwards that may be used to offset future taxable gains, thereby reducing our taxable income and enhancing our cash flow available for distribution to shareholders. However, our ability to utilize these capital loss carryforwards could be significantly limited if we experience an “ownership change” as defined under Section 382 of the Internal Revenue Code. An ownership change generally occurs if the percentage of our stock owned by one or more “5-percent shareholders” increases by more than 50 percentage points over a three-year period.
As we actively raise capital through equity offerings and other transactions, there is an increased risk that such activities could trigger an ownership change under Section 382. If an ownership change occurs, our ability to use existing capital loss carryforwards to offset future taxable gains may be subject to annual limitations, or in some cases, may be eliminated entirely.
We monitor our equity structure and capital raising activities to mitigate the risk of an ownership change, but there can be no assurance that we will be able to prevent such an event, especially as we pursue growth and capital raising initiatives. Any limitation on the use of our capital loss carryforwards could materially and adversely impact our business and shareholder returns.
Future issuances of equity securities may dilute your percentage ownership in us and may also negatively affect the market price of our common stock.
The issuance or sale of substantial amounts of our common stock (directly, in underwritten offerings or through our at-the-market (“ATM”) program, or indirectly through convertible or exchangeable securities, warrants, or options) to raise additional capital, or pursuant to our stock incentive plans, or the perception that such securities are available or that such issuances or sales are likely to occur, could materially and adversely affect the market price of our common stock and our ability to raise capital through future offerings of equity or equity-related securities. However, our future growth will depend, in part, upon our ability to raise additional capital, including through the issuance of equity securities. We are not required to offer any additional equity securities to existing common shareholders on a preemptive basis, and our charter empowers our Board of Directors to take significant actions without stockholder approval to protect the Company’s status as a REIT, which actions may affect holders of our capital stock. Our preferred stock, as well as any additional preferred stock we may issue, will have a preference
21
on distribution payments, periodically or upon liquidation, which could impact our ability to make distributions to common shareholders.
During 2025, we raised substantial amounts of capital through our ATM program. Because our decision to issue additional equity securities in the future will depend on market conditions and other factors beyond our control, we cannot predict or estimate the amount, timing, nature, or success of our future capital-raising efforts. Thus, common shareholders bear the risk that our future issuances of equity securities may negatively affect the market price of our common stock and will likely dilute their percentage ownership.
OTHER RISK FACTORS RELATED TO OUR BUSINESS
If we are unable to successfully manage risks associated with the significant growth in our business and operations, our financial condition, results of operation, and reputation could be materially and adversely affected.
We have experienced, and may continue to experience, significant growth in our business operations, including significant increases in our investment portfolio. While growth can enhance our competitive position and increase shareholder value, it also presents substantial risks and challenges that could adversely affect our business, financial condition, and results of operations. Continued significant growth may strain our management, operational, and financial resources. Failure to adapt our internal systems to accommodate this growth could result in operational inefficiencies, increased risk of errors or fraud, and difficulties in maintaining compliance with applicable laws and regulations, including those imposed by the SEC and other regulatory bodies.
Additionally, our significant growth has required and may continue to require us to hire and integrate new personnel, implement new technology systems, and establish new policies and procedures. If we are unable to effectively manage these changes, we may experience disruptions in our operations, reduced asset quality, or increased costs.
We rely on a third-party service provider for critical operational and trade functions and on other third parties for information and communication systems, and problems in the use, access, or performance of these systems, including as a result of any cybersecurity incident, could increase our costs and significantly disrupt our ability to operate our business, which may have a significant adverse impact on our financial condition and results of operations.
Certain critical functions of our business relating to our trading and borrowing activities, including MBS trading and repurchase agreement borrowing activities, are operated and managed by a third-party service provider. This service and related technologies may become unavailable due to a variety of reasons, including outages, interruptions, or other failure to perform. The risk of operational failure or constraints of this third-party service could cause us to default on contractual obligations, fail to meet margin calls, or otherwise experience breaches or disruptions to our critical business relationships, which could have a significant adverse effect on our financial condition or results of operations.
Additionally, any failure or interruption of our operational and trading systems or communication or information systems caused by a cybersecurity breach of our networks or systems or the third-party service providers’ networks or systems, could cause delays or other problems in our trading or borrowing activities or lead to unauthorized trading activity, any of which may have a significant adverse effect on our financial condition or results of operations. The use of artificial intelligence (“AI”) may increase the sophistication, effectiveness, and harm caused by cybersecurity attacks. A disruption or breach could also lead to the unauthorized access, release, misuse, loss, or destruction of proprietary or confidential information, including the personal or confidential information of our employees or third parties, which could lead to regulatory fines, litigation, increased expenses due to the costs of remediating a breach, reputational harm, and fewer third parties willing to do business with us. Cybersecurity insurance policies we hold may be inadequate to cover these costs.
Computer malware, viruses, computer hacking, and phishing attacks have become more prevalent and may occur on our or our third-party service providers’ systems. We have no control over our third-party service providers’ systems, and any cybersecurity breach of their network or systems could compromise our operations. Even with all reasonable security efforts, not every system or network breach can be prevented or even detected.
22
Furthermore, because certain of our employees are working remotely, there is an increased risk of disruption to our operations because our employees’ residential networks and infrastructure may not be as secure as our office environment. We may face increased costs as we (i) continue to evolve our cybersecurity defenses in order to contend with evolving risks, (ii) monitor our systems for cyber-attacks and security threats, and (iii) seek to determine the extent of our losses in the event of a cybersecurity breach. The costs and losses associated with preventing cybersecurity breaches are difficult to predict and quantify and could have a significant adverse effect on our financial condition and results of operations. We rely heavily on the financial, accounting, risk management, and other data processing systems provided by our third-party service providers, and any failure to maintain performance, reliability, and security of these systems and our other technical infrastructure could have a significant adverse effect on our financial condition or results of operations. Furthermore, we have no control over the cybersecurity systems used by our third-party service providers, and such third-party service providers may have limited indemnification obligations to us.
We may change our investment strategy, operating policies, dividend policy, and/or asset allocations without shareholder consent and/or in a manner which shareholders, analysts, and capital markets may not agree with.
A change in our investment strategy or asset allocation may materially change our exposure to interest rate and/or credit risk, default risk, and real estate market fluctuations. These changes could have a material impact on our ability to continue to pay dividends at a level that we had previously paid before the change in strategy. Furthermore, if any change in investment strategy, asset allocation, operating or dividend policy is perceived negatively by the markets or analysts covering our stock, our stock price may decline. Part of our investment strategy includes deciding whether to reinvest payments received on our existing investment portfolio. Based on market conditions, our leverage, and our liquidity profile, we may decide not to reinvest the cash flows we receive from our investment portfolio, or we may pursue alternate investment strategies. If we retain, rather than reinvest, these cash flows, the size of our investment portfolio and the amount of net interest income generated by our investment portfolio will likely decline. In addition, if the new assets we acquire in the future earn lower yields than the assets we currently own, our reported earnings per share will likely decline over time as the older assets pay down or are sold.
We may be subject to risks associated with our use of data and technology systems, including our evolving use of AI and machine learning technology.
As we expand our use of internet-based products and services, including cloud computing, our data and technology systems may be subject to increased cybersecurity risks and exposures. Further, with technological advances in AI and machine learning technology rapidly accelerating, the risks associated with our use of AI may increase as well due to both increasing reliance on this technology and emerging risks as the technology develops. We may utilize machine learning or AI to create efficiencies or opportunities in our processes (such as data analytics, coding, initial drafts of documents, and summarization of research or longer documents) and such use by us, or by third parties providing information or advice to us, may result in us relying on or receiving incorrect, misleading, or incomplete information, which could materially adversely impact our business and financial results. While our policies require responsible use of AI and machine learning technology, we may be unsuccessful in identifying or resolving potential issues before they arise. Further, as the legal and regulatory framework related to AI and machine learning continues to evolve, we may be subject to increased legal and regulatory risks associated with our use of AI and machine learning technologies. We may not be able to anticipate how to respond to these rapidly evolving frameworks, and we may need to expend resources to maintain compliance. Furthermore, because AI and machine learning technology are highly complex and rapidly developing, it is not possible to predict all of the legal, operational, competitive, or technological risks that may arise relating to their use.
We also could be exposed to the risks of AI and machine learning technology if third-party service providers or any counterparties, whether or not known to us, also use AI and machine learning technology in their business activities. We will not be able to control the use of such technology in third-party products or services. Use by third-party service providers could give rise to issues pertaining to data privacy, data protection, and intellectual property considerations.
We also may face competitive risks if we fail to adopt AI or other machine-learning technologies in a timely manner. As a result, our competitive position could be adversely affected if we do not, or are perceived to not, maintain a competitive position among our peers. Similarly, market pressure to adopt emerging or untested technologies could pose risks to our business.
23
We are subject to human capital risk.
The success of our Company is dependent on attracting and retaining employees and key personnel, particularly with an understanding of MBS investments and risk as well as REIT regulations. We are also exposed to human capital risks at our key vendors and our business can be adversely affected to the extent a key vendor experiences material turnover. There is competition for talented employees to operate our business and set the strategic direction for the Company. The departure of employees could impact our operating results and outlook for investing in the future.
Share repurchases of our common stock or Series C Preferred Stock may negatively impact our compliance with covenants in our financing agreements and regulatory requirements (including maintaining exclusions from the requirements of the 1940 Act and qualification as a REIT). Any compliance failures associated with share repurchases could have a material adverse effect on our business, financial condition, and results of operations. Share repurchases also may negatively impact our ability to invest in our target assets in the future.
Our Board of Directors has approved a share repurchase program that permits the Company to repurchase shares of its preferred or common stock at any time or from time to time at management’s discretion. Certain of our financing agreements have financial covenants that our share repurchases may impact. Furthermore, if we fund share repurchases by selling our investments, the allocation of our investment portfolio for purposes of maintaining an exclusion from the requirements of the 1940 Act could be impacted, as well as our ability to comply with income and asset tests required to qualify as a REIT. In addition, our decision to repurchase shares under the program could adversely affect our competitive position and could negatively impact our ability in the future to invest in assets that have a greater potential return than our share repurchases.
ITEM 1B. UNRESOLVED STAFF COMMENTS
None.
ITEM 1C. CYBERSECURITY
The Company recognizes cybersecurity as crucial to protecting its business and employees’ sensitive information. The Company has implemented and maintains a security incident response policy as part of its enterprise-wide risk management system, which is intended to ensure that the Company’s information technology (“IT”) systems function properly and successfully assess, identify, contain, investigate, remedy, report, and respond to information security risks, threats or incidents.
The Company’s IT services including, but not limited to, service desk support, endpoint management, network and server administration, cloud engineering, and cybersecurity and incident management, are provided by an IT team consisting of third-party consultants who are employed on a contract basis with assistance from the Company’s IT employees. Our Chief Operating Officer has management oversight of our IT team, which is comprised of personnel who have extensive skills and experience managing technology and cybersecurity matters. Each of our IT employees and full time dedicated consultants have at least 10 years experience in information technology matters, and many have direct experience managing or implementing systems and processes to anticipate, mitigate, and manage cybersecurity risks.
To mitigate the risk of a cybersecurity incident both internally and with third parties, the Company’s IT team provides mandatory cybersecurity training for all employees and contractors. They also conduct periodic training and awareness campaigns by sending employees simulated phishing attacks. The results of these simulated phishing attacks are reviewed and periodically reported to our executive officers and other members of management and the Board of Directors or its committees. In addition to training its employees and consultants, the Company’s devices and servers are equipped with cybersecurity software applications, which are continuously monitored by an expert third-party managed security service provider (“MSSP”) that has numerous certifications recognized in the IT industry and provides security services for several Fortune 100 companies and certain highly secure government agencies. Different data analytics techniques are used to detect suspicious system behavior, provide contextual information, and block malicious activity. If there is a threat or malicious activity detected, the third-party MSSP is immediately alerted for further investigation and remediation. Periodically, the Company engages a third party to
24
perform both internal and external penetration testing to assess strengths and vulnerabilities of the Company’s readiness against cyber attacks.
The Risk Committee oversees the Company’s enterprise risk management program, which includes periodic assessments of cybersecurity risk. As a part of these assessments, the Risk Committee reviews and discusses the Company’s policies and practices in place to mitigate cybersecurity-related risks.Our executive officers and other members of management regularly present to the Board of Directors, the Risk Committee, and its other committees on our cybersecurity strategy and activities, results of testing and training, and, as needed, to inform the Board of Directors and the Risk Committee of any new or emerging threats or risks.
The Company is not aware of any material breaches in its cybersecurity operations during the three years ended December 31, 2025. Further, the Company has not identified any specific risks from cybersecurity threats that have materially affected or are likely to materially affect the Company, including its business strategy, results of operations, or financial conditions.
For more information, please also refer to our risk factor related to our reliance on third-party service providers under Part I, Item 1A, “Risk Factors” of this Annual Report on Form 10-K.
ITEM 2. PROPERTIES
The Company does not own or lease any physical properties that are material to its business, financial condition, or results of operations.
ITEM 3. LEGAL PROCEEDINGS
To the Company’s knowledge, there are no pending or threatened legal proceedings, which, in management’s opinion, individually or in total, could have a material adverse effect on the Company’s results of operations or financial condition.
ITEM 4. MINE SAFETY DISCLOSURES
None.
25
PART II.
ITEM 5. MARKET FOR REGISTRANT'S COMMON EQUITY, RELATED STOCKHOLDER MATTERS, AND ISSUER PURCHASES OF EQUITY SECURITIES
Our common stock is traded on the NYSE under the trading symbol “DX”. The common stock was held by approximately 354 holders of record as of February 20, 2026. On that date, the closing price of our common stock on the NYSE was $14.13 per share. The Company currently pays a monthly dividend on its common stock and declared a total of $2.00 per common share for the year ending December 31, 2025. Please refer to “Operating and Regulatory Structure” contained within Part I, Item 1, “Business” for disclosure regarding the tax characterization of these dividends.
Our ability to pay dividends may be adversely affected by the risk factors described in Part I, Item 1A, “Risk Factors.” All distributions will be made at the discretion of our Board of Directors, which will consider the Company’s taxable income, the REIT distribution requirements of the Tax Code, financial performance measures, maintaining compliance with dividend requirements of the Series C Preferred Stock, and such other factors our Board of Directors may deem relevant from time to time.
The following graph is a five-year comparison of shareholders’ cumulative total return, assuming $100 invested at the close of trading on December 31, 2020 with reinvestment of all dividends, in each of: (i) our common stock, (ii) the stocks included in the Standard & Poor’s 500 Index (“S & P 500”); (iii) the stocks included in the S&P 500 Financials Index; and (iv) the stocks included in the FTSE NAREIT Mortgage REIT Index.
Cumulative Total Stockholder Returns as of December 31,
Index (1)
2020
2021
2022
2023
2024
2025
Dynex Capital, Inc. Common Stock
$
100.00
$
102.27
$
86.57
$
96.98
$
110.25
$
142.64
S&P 500 Index
$
100.00
$
128.68
$
105.36
$
133.03
$
166.28
$
195.98
S&P 500 Financials Index
$
100.00
$
134.87
$
120.61
$
135.21
$
176.45
$
202.86
FTSE NAREIT mREIT Index
$
100.00
$
115.56
$
85.11
$
98.04
$
98.25
$
114.13
(1) Source: Bloomberg
26
The historical information set forth above is not necessarily indicative of future performance. Accordingly, we do not make or endorse any predictions as to future share performance.
The Company’s Board of Directors has authorized a share repurchase program (the “Program”) of up to $100 million of the Company’s outstanding shares of common stock and up to $50 million of the Company’s Series C Preferred Stock through open market transactions, privately negotiated transactions, trading plans adopted in accordance with Rule 10b5-1 under the Exchange Act, block transactions or otherwise. The Program permits the Company to repurchase shares of common stock or Series C Preferred Stock at any time or from time to time at management’s discretion. The decision to purchase shares will depend on a variety of factors, including, but not limited to, the market prices of the common stock and the Series C Preferred Stock, as applicable, general market and economic conditions, and applicable legal and regulatory requirements. The Program does not obligate the Company to purchase any shares, and any open market repurchases under the Program will be made in accordance with Exchange Act Rule 10b-18, which sets certain restrictions on the method, timing, price, and volume of open market stock repurchases. The Program is authorized through April 30, 2026, although it may be modified or terminated by the Board of Directors at any time.
The Company has an at-the-market program ("ATM") whereby the Company may offer and sell through its sales agents up to approximately 161.3 million shares of common stock. During the year ended December 31, 2025, the Company issued 90,126,672 shares of its common stock through its ATM program at an aggregate value of $1.2 billion, net of $12.4 million in broker commissions, of which 29,101,267 million shares were issued during the fourth quarter of 2025 at an aggregate value of $393.3 million, net of $3.8 million in broker commissions.
ITEM 6. [Reserved]
ITEM 7. MANAGEMENT’S DISCUSSION AND ANALYSIS OF FINANCIAL CONDITION AND RESULTS OF OPERATIONS
The following discussion should be read in conjunction with our financial statements and the related notes included in Part II, Item 8, "Financial Statements and Supplementary Data” in this Annual Report on Form 10-K.
This discussion contains forward-looking statements that involve risks and uncertainties. Our actual results could differ materially from those anticipated in these forward-looking statements as a result of various factors including, but not limited to, those disclosed in Part I, Item 1A, “Risk Factors” elsewhere in this Annual Report on Form 10-K and in other documents we file with the SEC or otherwise publicly disclose. Please refer to “Forward-Looking Statements” contained within Part I, Item 1, “Business” of the Annual Report on Form 10-K for additional information. This discussion also contains non-GAAP financial measures, which are discussed in the section “Non-GAAP Financial Measures.”
For a complete description of our business, including our operating policies, investment philosophy and strategy, financing, risk management and hedging strategies, and other important information, please refer to Part I, Item 1, “Business” of this Annual Report on Form 10-K.
EXECUTIVE OVERVIEW
During 2025, shifting U.S. policy and persistent global uncertainty created a favorable backdrop for high-quality, liquid assets like Agency MBS. The second Trump Administration implemented significant tariff increases that generated significantly higher customs revenues and passed the One Big Beautiful Bill Act extending tax provisions from 2017 with additional benefits. Despite these policy shifts and stricter immigration enforcement that contributed to unemployment rising to over 4.0% by year-end, the U.S. economy demonstrated resilience with 2.5% GDP growth through the first three quarters. The combination of moderating inflation, a softening labor market, and policy-driven uncertainty enabled the Federal Reserve to reduce the Federal Funds Rate by 75 basis points in the second half of 2025, bringing the target range to 3.50-3.75%. Additionally, the Fed ended its balance sheet runoff in December, announcing Treasury bill purchases to maintain stable reserve levels and reduce funding market volatility.
With this backdrop, Agency MBS emerged as one of the better performing sectors within the fixed-income
27
market due to favorable technical and fundamental drivers. The U.S. Treasury yield curve steepened as short-term rates fell more rapidly than long-term yields while Agency MBS spreads substantially tightened relative to Treasuries. Interest rate volatility declined, which aided a reduction in hedging costs. Supply/demand dynamics were favorable overall as new mortgage originations remained muted while demand increased.
The charts below show the range of U.S. Treasury and Secured Overnight Funding Rate (“SOFR”)-based swap rates for the year ended December 31, 2025 and information regarding market spreads as of and for the periods indicated:
28
Market Spreadsas of:
Change in Spreads YTD
Investment Type: (1)
December 31, 2025
September 30, 2025
June 30, 2025
March 31, 2025
December 31, 2024
Agency RMBS:
2.0% coupon
70
85
96
85
89
(19)
2.5% coupon
73
90
99
90
93
(20)
4.0% coupon
50
65
78
65
69
(19)
4.5% coupon
45
64
76
65
68
(23)
5.0% coupon
46
66
77
66
69
(23)
5.5% coupon
51
72
82
69
72
(21)
6.0% coupon
54
74
86
66
74
(20)
Agency CMBS(2)
82
96
102
94
96
(14)
(1)Option adjusted spreads (“OAS”) are based on Company estimates using third-party models and market data. OAS shown for prior periods may differ from previous disclosures because the Company regularly updates the third-party model used.
(2)Data is sourced from J.P. Morgan and represents the spread to swap rate on newly issued Agency securities collateralized by multifamily properties.
Summary of 2025 Financial Performance
Our 2025 results directly reflected our ability to capitalize on this favorable environment while maintaining disciplined risk management. For the year ended December 31, 2025, our total economic return ("TER") of $2.75 per common share, or 21.6% of beginning book value, was comprised of an increase in book value of $0.75 per common share and dividends declared of $2.00 per common share. The increase in our book value was predominantly driven by asset appreciation due to tighter spreads between our asset yields and the yields on our interest rate swaps and Treasury futures.The Company's results for 2025 also benefited from higher net interest income due to its purchases of Agency RMBS and CMBS throughout the year at higher yield levels than 2024 while related repurchase agreement financing costs fell following three U.S. Federal Funds rate cuts in 2025. Our increase in the use of SOFR-based interest rate swaps in 2025 added to economic net interest income.
Our total equity and market capitalization as of December 31, 2025 more than doubled since December 31, 2024 primarily because we raised over $1.2 billion through the issuance of over 90 million shares of common stock pursuant to our ATM program. We deployed the majority of this capital into opportunities in the Agency MBS market, while also strengthening our organization with refreshed leadership, a new independent auditor, and an expanded office footprint.
For our shareholders, 2025 delivered a 29.4% total return including dividends and share price appreciation. Over this decade through December 31, 2025, Dynex shareholders have experienced a 67% cumulative total return, or approximately 9% annualized with dividends reinvested.
29
The following table summarizes the changes in the Company's financial position during the year ended December 31, 2025:
($s in thousands except per share data)
Net Change in Fair Value
Components of Comprehensive Income
Common Book Value Rollforward
Per Common Share
Balance as of December 31, 2024 (1)
$
1,073,436
$
12.70
Net interest income
$
114,356
Periodic interest from interest rate swaps
45,063
G & A and other operating expenses
(53,047)
Preferred stock dividends
(10,191)
Changes in fair value:
MBS and other
$
416,278
TBAs
94,646
U.S. Treasury futures
(46,190)
Options on U.S. Treasury futures
(7,852)
Interest rate swaps
(194,715)
Interest rate swaptions
(4,045)
Total net change in fair value
258,122
Comprehensive income to common shareholders
354,303
Capital transactions:
Net proceeds from stock issuance (2)
1,179,983
Common dividends declared
(257,078)
Balance as of December 31, 2025 (1)
$
2,350,644
$
13.45
(1)Amounts represent total shareholders' equity less the aggregate liquidation preference of the Company's preferred stock of $111.5 million, in thousands and on a per common share basis.
(2)Net proceeds from common stock issuance include approximately $1.2 billion from ATM issuances and approximately $11 million from amortization of share-based compensation, net of grants, during the year ended December 31, 2025.
Outlook for 2026
We believe the favorable macro environment for high-quality, liquid assets will persist into 2026, continuing to support Agency MBS performance. Recent policy actions now point toward a more stable and supportive framework for the mortgage market, creating a strong foundation for forward returns. Most notably, the Administration's January 2026 directive to the GSEs to purchase $200 billion in Agency MBS to support housing affordability creates a powerful technical tailwind. Combined with the potential for modest additional rate cuts, the policy environment has shifted decisively in favor of mortgage market stability. This clarity enhances our confidence in the path ahead for MBS spreads.
We anticipate sustained global demand for high-quality, liquid, dollar-denominated assets as geopolitical uncertainties persist and credit concerns mount in riskier sectors. Agency MBS remain uniquely positioned at the intersection of government-backed credit quality, superior yields to U.S. Treasuries, deep liquidity, and defensive characteristics appropriate for an uncertain late-cycle environment.
While spreads have tightened from the historically wide levels where we deployed capital in 2025, current valuations remain compelling on a forward-looking basis given the policy support, technical factors, and risk-adjusted return characteristics relative to alternatives.
30
FINANCIAL CONDITION
Investment Portfolio
Our investment portfolio (including TBAs) as of December 31, 2025, has increased 98% since December 31, 2024. We added $8.2 billion of Agency RMBS and $1.2 billion of Agency CMBS during the year ended December 31, 2025, of which $809 million were pending settlement as of December 31, 2025. The following charts compare the composition of our MBS portfolio (including TBAs) as of the dates indicated:
The following tables compare our 30-year fixed-rate Agency RMBS investments, including TBA dollar roll positions, as of the dates indicated:
December 31, 2025
Agency RMBS by Coupon
Par/Notional
Amortized Cost/
Implied Cost
Basis (3)(5)
Fair
Value (4)(5)
Weighted Average
Loan Age
(in months)(6)
3 Month
CPR (6)(7)
Estimated Duration (8)
Market Yield (9)
($s in thousands)
2.0%
$
603,965
$
613,475
$
497,097
63
5.2
%
7.42
4.68
%
2.5%
516,325
535,039
444,904
64
5.1
%
7.02
4.67
%
4.0%
293,073
293,432
281,889
57
6.5
%
5.89
4.63
%
4.5% (1)
1,911,130
1,853,757
1,881,304
33
5.8
%
5.46
4.74
%
5.0%
3,974,655
3,913,622
3,997,537
21
5.9
%
4.62
4.91
%
5.5%
6,325,638
6,361,758
6,465,769
13
8.1
%
3.39
5.10
%
6.0%
1,381,567
1,419,727
1,432,860
9
8.2
%
2.28
5.14
%
TBA 4.0%
1,162,000
1,101,441
1,102,764
n/a
n/a
6.29
4.76
%
TBA 4.5%(2)
1,447,000
1,425,945
1,430,136
n/a
n/a
4.58
4.64
%
TBA 5.0%
176,000
175,287
175,670
n/a
n/a
4.51
5.03
%
TBA 5.5%
183,000
185,175
185,631
n/a
n/a
3.28
5.23
%
TBA 6.0%
221,000
226,218
226,922
n/a
n/a
1.99
5.24
%
Total
$
18,195,353
$
18,104,876
$
18,122,483
21
7.0
%
4.29
4.94
%
December 31, 2024
Agency RMBS by Coupon
Par/Notional
Amortized Cost/
Implied Cost
Basis (3)(5)
Fair
Value (4)(5)
Weighted Average
Loan Age
(in months)(6)
3 Month
CPR (6)(7)
Estimated Duration (8)
Market Yield (9)
($s in thousands)
2.0%
$
655,356
$
666,107
$
516,541
51
5.0
%
6.49
5.42
%
2.5%
561,625
582,776
463,402
52
4.3
%
6.37
5.33
%
4.0%
324,615
325,091
299,774
45
6.4
%
5.92
5.25
%
4.5%
1,323,371
1,291,410
1,252,219
27
7.4
%
5.79
5.33
%
5.0%
2,356,262
2,315,518
2,284,613
18
5.7
%
5.19
5.47
%
5.5%
2,193,064
2,207,296
2,178,180
13
5.3
%
4.53
5.61
%
6.0%
303,470
307,211
307,509
13
13.2
%
3.60
5.74
%
TBA 4.0%
462,000
424,917
421,796
n/a
n/a
6.62
5.20
%
TBA 4.5%
383,000
361,610
359,837
n/a
n/a
5.95
5.35
%
TBA 5.0%
710,000
693,938
684,706
n/a
n/a
5.20
5.51
%
TBA 5.5%
864,000
860,609
852,053
n/a
n/a
4.21
5.73
%
Total
$
10,136,763
$
10,036,483
$
9,620,630
23
6.1
%
5.22
5.49
%
(1)Includes a par value of $9 million of 4.5% 15-year Agency RMBS.
(2)Includes a notional amount of $690 million of 4.5% 15-year TBA securities.
(3)Implied cost basis of TBAs represents the forward price to be paid for the underlying Agency MBS.
(4)Fair value of TBAs is the implied market value of the underlying Agency security as of the end of the period.
(5)TBAs are included on the consolidated balance sheet within “derivative assets/liabilities” at their net carrying value which is the difference between their implied market value and implied cost basis. Please refer to Note 5 of the Notes to the Consolidated Financial Statements for additional information.
(6)TBAs are excluded from this calculation as they do not have a defined weighted-average loan balance or age until mortgages have been assigned to the pool.
(7)Constant prepayment rate (“CPR”) represents the 3-month CPR of Agency RMBS held as of date indicated.
(8)Duration measures the sensitivity of a security's price to the change in interest rates and represents the percent change in price of a security for a 100-basis point increase in interest rates. We calculate duration using third-party financial models and empirical data. Different models and methodologies can produce different estimates of duration for the same securities.
(9)Represents the weighted average market yield projected using cash flows generated from the forward curve based on market prices as of the date indicated and assuming zero volatility.
Our Agency CMBS consist of loans collateralized by multifamily properties. Though we expect our exposure to Agency CMBS to remain modest as a percentage of the total portfolio, we added Agency CMBS selectively during 2025 where the risk-adjusted return profile aligned with our broader strategy. In addition to offering strong relative value, Agency CMBS help diversify and stabilize the portfolio's cash flow and total return profile, given their unique prepayment characteristics and underlying asset base.
Agency CMBS IO are backed by loans collateralized by multifamily properties. Our Agency CMBS IO are from Freddie Mac Series K deals from which interest continues to be advanced even in the event of an underlying default up until liquidation. According to Freddie Mac, 99.7% of the loans in K-deals are current as of December 2025. Our non-Agency CMBS IO were all originated prior to 2018 and are backed by loans collateralized by a number of different property types, such as multifamily, office, retail, hotels, industrial, storage, and others. Our non-Agency CMBS IO investments are nearing maturity and have very little amortized cost remaining; any changes in actual payments may result in large swings in yield as shown below.
The following table provides certain information regarding our CMBS and CMBS IO as of the dates indicated:
December 31, 2025
($s in thousands)
Par/Notional Value
Amortized Cost
Fair Value
WAVG Life Remaining (1)
WAVG Market Yield (2)
Agency CMBS
$
1,210,953
$
1,213,107
$
1,218,343
5.5
4.25
%
CMBS IO
6,000,525
87,557
87,285
4.7
10.40
%
Total
$
1,300,664
$
1,305,628
December 31, 2024
($s in thousands)
Par/Notional Value
Amortized Cost
Fair Value
WAVG Life Remaining (1)
WAVG Market Yield (2)
Agency CMBS
$
99,636
$
99,848
$
95,463
2.6
4.76
%
CMBS IO
8,647,176
117,591
114,386
4.5
12.65
%
Total
$
217,439
$
209,849
(1) Represents the weighted average life remaining in years based on contractual cash flows as of the dates indicated.
(2) Represents the weighted average market yield projected using cash flows generated off the forward curve based on market prices as of the dates indicated and assuming zero volatility.
Repurchase Agreements
Our repurchase agreement borrowings increased to $14 billion as of December 31, 2025 from $7 billion as of December 31, 2024. These borrowings were used to partially finance our purchases of Agency MBS during the year ended December 31, 2025. We have not experienced any difficulty in securing financing with any of our counterparties, and our repurchase agreement counterparties have not indicated any concerns regarding leverage or credit. Please refer to Note 4 of the Notes to the Consolidated Financial Statements contained within this Annual Report on Form 10-K as well as “Results of Operations” and “Liquidity and Capital Resources” contained within this Item 7 for additional information relating to our repurchase agreement borrowings.
Derivative Assets and Liabilities
Please refer to Note 5 of the Notes to the Consolidated Financial Statements for details on our interest rate hedging instruments as well as “Liquidity and Capital Resources” within Item 7 and “Quantitative and Qualitative Disclosures about Market Risk” within Item 7A of this Annual Report on Form 10-K.
RESULTS OF OPERATIONS
Year Ended December 31, 2025 Compared to the Year Ended December 31, 2024
Net Interest Income and Economic Net Interest Income
Net interest income and net interest spread increased for the year ended December 31, 2025, compared to the year ended December 31, 2024 due to the purchases of higher yielding Agency MBS over the past year. Though interest expense increased due to an increase in repurchase agreement borrowings used to finance these purchases, the average financing rate we paid declined 95 basis points year over year.
Net periodic interest earned on interest rate swaps increased for the year ended December 31, 2025, compared to the year ended December 31, 2024 due to a higher notional amount of interest rate swaps. The combination of higher interest earned on Agency MBS, lower financing rates, and higher periodic interest on interest rate swaps resulted in higher economic net interest income and higher economic net interest spread.
The following table presents information about our interest-earning assets and interest-bearing liabilities and their performance for the periods indicated:
Year Ended
December 31,
2025
2024
($s in thousands)
Interest Income/Expense
Average Balance (1)(2)
Effective Yield/
Financing Cost (3)(4)
Interest Income/Expense
Average Balance (1)(2)
Effective Yield/
Financing Cost (3)(4)
Agency RMBS
$
487,894
10,076,482
4.84
%
$
289,781
$
6,477,575
4.47
%
Agency CMBS
18,051
422,520
4.21
%
3,247
106,641
3.00
%
CMBS IO (5)
8,169
101,600
8.04
%
11,029
140,353
7.86
%
Other investments
49
887
3.99
%
78
1,396
5.04
%
Subtotal
$
514,163
$
10,601,489
4.85
%
$
304,135
$
6,725,965
4.52
%
Cash equivalents
19,358
15,399
Total interest income
$
533,521
$
319,534
Repurchase agreement financing
(419,165)
9,431,455
(4.38)
%
(313,657)
5,790,037
(5.33)
%
Net interest income (expense)/spread
$
114,356
0.47
%
$
5,877
(0.81)
%
Net periodic interest (6)
45,063
0.48
%
16,105
0.28
%
Economic net interest income (expense)/spread (6)
$
159,419
0.95
%
$
21,982
(0.53)
%
*Table Note: Data may not foot due to rounding.
(1)Average balance for assets is calculated as a simple average of the daily amortized cost and excludes securities pending settlement if applicable.
(2)Average balance for liabilities is calculated as a simple average of the daily borrowings outstanding during the period.
(3)Effective yield is calculated by dividing interest income by the average balance of asset type outstanding during the reporting period. Unscheduled adjustments to premium/discount amortization/accretion, such as for prepayment compensation, are not annualized in this calculation.
(4)Financing cost is calculated by dividing annualized interest expense by the total average balance of borrowings outstanding during the period with an assumption of 360 days in a year.
(5)Includes Agency and non-Agency issued securities.
(6)Net periodic interest is the difference between the fixed interest rate we pay and the variable interest rate we receive on our interest rate swaps. It is a component of economic net interest income (expense), a non-GAAP measure. Please refer to the section below “Non-GAAP Financial Measures” for more information.
The following table presents information regarding the performance of our TBA dollar roll transactions for the periods indicated:
Year Ended
December 31,
2025
2024
($s in thousands)
Implied Net Interest Income (1)
Average Balance
Implied Net Spread
Implied Net Interest Expense (1)
Average Balance
Implied Net Spread
TBAs
$
15,807
$
2,483,899
0.63
%
(2,694)
2,044,740
(0.13)
%
(1)Implied net interest income (expense) is also referred to as “drop income (loss)” and represents a portion of the total realized gain (loss) from our TBA dollar roll transactions recorded within “gain (loss) on derivative instruments, net.”
Gains (Losses) on Investments and Derivative Instruments
For the year ended December 31, 2025, gains on our investment portfolio exceeded losses on our hedges by approximately $303 million, which includes $45 million in net periodic interest we earned from interest rate swaps. The fair value of our investment portfolio increased during the year ended December 31, 2025 primarily due to the tightening of mortgage spreads to U.S. Treasuries relative to wider spreads at the time of purchase. U.S. Treasury rates and SOFR-based swap rates declined overall during the year ended December 31, 2025, which resulted in losses on our hedging portfolio.
For the year ended December 31, 2024, net gains from our interest rate hedging portfolio exceeded the net loss in fair value of our investments by $131 million. Through repositioning of our interest rate hedging portfolio, we managed through the volatile interest rate environment of 2024 to offset the negative impact of the increasing 10-year U.S. Treasury rate on our investment portfolio, which was also negatively impacted by widening credit spreads for the majority of 2024.
The following tables provide details on realized and unrealized gains and losses within our investment and interest rate hedging portfolios for the periods indicated:
Year Ended
December 31, 2025
($s in thousands)
Realized Gain (Loss) Recognized in Net Income
Unrealized Gain (Loss) Recognized in Net Income
Unrealized Gain (Loss) Recognized in OCI
Total Change in Fair Value
Investment portfolio:
Agency RMBS
$
—
$
362,327
$
41,394
$
403,721
Agency CMBS
—
7,298
2,322
9,620
CMBS IO
—
1,221
1,712
2,933
Other investments
—
4
—
4
Subtotal
—
370,850
45,428
416,278
TBA securities (1)
64,909
29,737
—
94,646
Net gain on investments
$
64,909
$
400,587
$
45,428
$
510,924
Interest rate hedging portfolio:
U.S. Treasury futures
$
(66,906)
$
20,716
$
—
$
(46,190)
Interest rate swaps (2)
45,063
(194,715)
—
(149,652)
Interest rate swaptions
—
(4,045)
—
(4,045)
Options on U.S. Treasury futures
(6,527)
(1,325)
—
(7,852)
Net loss on interest rate hedges
$
(28,370)
$
(179,369)
$
—
$
(207,739)
Total net gain
$
36,539
$
221,218
$
45,428
$
303,185
Year Ended
December 31, 2024
($s in thousands)
Realized Gain (Loss) Recognized in Net Income
Unrealized Gain (Loss) Recognized in Net Income
Unrealized Gain (Loss) Recognized in OCI
Total Change in Fair Value
Investment portfolio:
Agency RMBS
$
—
$
(144,139)
$
(18,642)
$
(162,781)
Agency CMBS
(1,506)
1,073
747
314
CMBS IO
—
531
3,861
4,392
Other investments
—
183
47
230
Subtotal
(1,506)
(142,352)
(13,987)
(157,845)
TBA securities (1)
38,530
(77,042)
—
(38,512)
Net gain (loss) on investments
$
37,024
$
(219,394)
$
(13,987)
$
(196,357)
Interest rate hedging portfolio:
U.S. Treasury futures
$
(46,955)
$
221,063
$
—
$
174,108
Interest rate swaps
16,105
136,676
—
152,781
Net (loss) gain on interest rate hedges
$
(30,850)
$
357,739
$
—
$
326,889
Total net gain (loss)
$
6,174
$
138,345
$
(13,987)
$
130,532
(1)Realized and unrealized gains (losses) on TBA securities are recorded within “gain (loss) on derivative instruments, net” on the Company’s consolidated statements of comprehensive income.
(2)Realized gain (loss) for interest rate swaps consists of net periodic interest benefit of $45.1 million for the year ended December 31, 2025 and $16.1 million for the year ended December 31, 2024.
Operating Expenses
Operating expenses for the year ended December 31, 2025 increased $17 million compared to the year ended December 31, 2024 due to higher salary, bonus, and share-based compensation expenses, primarily resulting from an increase in performance-based compensation accruals and from the hiring of new employees. Audit and legal expenses also increased in 2025 compared to 2024 primarily due to the growth of the Company.
Year Ended December 31, 2024 Compared to the Year Ended December 31, 2023
Please refer to “Results of Operations” within Item 7 of our Annual Report on Form 10-K for the year ended December 31, 2024 for a discussion of the results of operations for the year ended December 31, 2024 compared to the year ended December 31, 2023, which is incorporated herein by reference.
Non-GAAP Financial Measures
In addition to reporting the Company’s financial results determined in accordance with GAAP, management of the Company believes that investors’ understanding of our operating results may be enhanced by the use of non-GAAP financial measures, which are used by management internally, along with GAAP measures, to evaluate our performance. Our non-GAAP financial measures include earnings available for distribution (“EAD”) to common shareholders (including per common share) and economic net interest income and the related metric
economic net interest spread. Management believes these non-GAAP financial measures may be useful to investors because they are viewed by management as additional measures of the investment portfolio’s return.
Drop income generated by TBA dollar roll positions, which is included in "gain (loss) on derivatives instruments, net" on the Company's consolidated statements of comprehensive income, is included in EAD because management views drop income as the economic equivalent of net interest income (interest income less implied financing cost) on the underlying Agency security from trade date to settlement date. However, drop income/loss does not represent the total realized gain/loss from the Company’s investments in TBA securities.
Management also includes net periodic interest from its interest rate swaps, which is included in "gain (loss) on derivatives instruments, net," in EAD and economic net interest income because interest rate swaps are used by the Company to economically hedge the impact of changing interest rates on its borrowing costs from repurchase agreements, and including net periodic interest from interest rate swaps is a helpful indicator of the Company’s total financing cost in addition to GAAP interest expense.
Non-GAAP financial measures are not a substitute for GAAP measures and may be different from non-GAAP measures used by other companies. In addition, other companies, including in our industry, may calculate comparable measures differently, which reduces their usefulness as comparative measures. Investors should not rely on any single financial measure when evaluating our business. These non-GAAP measures should be considered as supplemental in nature and not as a substitute for our operating results in accordance with GAAP.
Reconciliations of each non-GAAP measure to certain GAAP financial measures are provided below.
Year Ended
Reconciliations of GAAP to Non-GAAP Financial Measures:
December 31, 2025
December 31, 2024
($s in thousands except per share data)
Comprehensive income to common shareholders (GAAP)
$
354,303
$
92,217
Less:
Change in fair value of investments (1)
(416,278)
157,845
Change in fair value of derivative instruments, net (2)
173,963
(274,966)
EAD to common shareholders (non-GAAP)
$
111,988
$
(24,904)
Average common shares outstanding
124,128,422
70,766,410
EAD per common share (non-GAAP)
$
0.90
$
(0.35)
Net interest income (GAAP)
$
114,356
$
5,877
Net periodic interest earned from interest rate swaps
45,063
16,105
Economic net interest income (non-GAAP)
159,419
21,982
TBA drop income (loss) (3)
15,807
(2,694)
Total operating expenses
(53,047)
(36,498)
Preferred stock dividends
(10,191)
(7,694)
EAD to common shareholders (non-GAAP)
$
111,988
$
(24,904)
Net interest spread (GAAP)
0.47
%
(0.81)
%
Net periodic interest from interest rate swaps as a percentage of average repurchase borrowings
0.48
%
0.28
%
Economic net interest spread (non-GAAP)
0.95
%
(0.53)
%
(1)Amount includes realized and unrealized gains and losses due to changes in the fair value of the Company’s MBS.
(2)The following table reconciles “change in fair value of derivative instruments, net” to the “gain (loss) on derivative instruments, net” shown on the consolidated statements of comprehensive income.
Year Ended
($s in thousands)
December 31, 2025
December 31, 2024
(Loss) gain on derivative instruments, net
$
(113,093)
$
288,377
Less:
TBA drop (income) loss
(15,807)
2,694
Net periodic interest earned from interest rate swaps
(45,063)
(16,105)
Change in fair value of derivative instruments, net
$
(173,963)
$
274,966
(3)TBA drop income is calculated by multiplying the notional amount of the TBA dollar roll positions by the difference in price between two TBA securities with the same terms but different settlement dates.
LIQUIDITY AND CAPITAL RESOURCES
Our primary sources of liquidity include borrowings under repurchase arrangements and monthly principal and interest payments we receive on our investments. Additional sources may include proceeds from the sale of investments, equity offerings, and net payments received from counterparties for derivative instruments. We use our liquidity to purchase investments, to pay amounts due on our repurchase agreement borrowings, and to pay our operating expenses and dividends on our common and preferred stock. We also use our liquidity to meet margin requirements for our repurchase agreements and derivative transactions, including TBA contracts, under the terms of the related agreements. We may also periodically use liquidity to repurchase shares of the Company’s stock.
During the year ended December 31, 2025, we issued 90,126,672 shares of common stock through our ATM program, resulting in proceeds of $1.2 billion, net of broker commissions and fees. We partially deployed these proceeds into Agency RMBS and to post initial margin requirements related to a larger hedging portfolio.
Our liquidity fluctuates based on our investment activities, leverage, capital raising activities, and changes in the fair value of our investments and derivative instruments. Our measurement of liquidity includes unrestricted cash and cash equivalents and unpledged Agency MBS, which are recognized as assets on our consolidated balance sheet. In our measure of liquidity, we also include the fair value of noncash collateral pledged to us by our counterparties, which we typically receive when the fair value of our pledged collateral exceeds our current margin requirement. Our liquidity as of December 31, 2025, was approximately $1.4 billion, which consisted of unrestricted cash of $531 million, unpledged Agency MBS with a fair value of $901 million, and noncash collateral pledged by our counterparties of $1 million. Our liquidity as of December 31, 2024, was $658 million.
We continuously monitor our liquidity, especially with potential risk events on the horizon, such as tariff changes, potential GSE transition, uncertainty regarding Federal Reserve policy decisions, the size of the Federal Reserve’s balance sheet, quantitative tightening or easing measures, federal government shutdowns, and the impact on global markets stemming from global central bank policies. We are also monitoring the wars and conflicts around the globe. We continuously assess the adequacy of our liquidity under various scenarios based on changes in the fair value of our investments and derivative instruments due to market factors such as changes in the absolute level of interest rates and the shape of the yield curve, credit spreads, lender haircuts, and prepayment speeds, which in turn have an impact on margin requirements. In performing these analyses, we also consider the current state of the fixed-income markets and the repurchase agreement markets to determine if market forces such as supply-demand imbalances or structural changes to these markets could change the liquidity of MBS or the availability of financing. We have not experienced any material changes in the terms of our repurchase agreements with our counterparties, and they have not indicated to us any concerns regarding access to liquidity.
In addition to the GSE guarantee of principal payments on our Agency investments, we expect the capital and repurchase agreement markets will remain accessible at capacities sufficient to cover our short-term and long-term liquidity needs.
Our perception of the liquidity of our investments and market conditions significantly influences our targeted leverage. In general, our leverage will increase if we view the risk-reward opportunity of higher leverage on our capital outweighs the risk to our liquidity and book value. Our leverage, which we calculate using total liabilities plus the cost basis of TBA long positions, was 7.3 times shareholders’ equity as of December 31, 2025. We include 100% of the cost basis of our TBA securities in evaluating our leverage because it is possible under certain market conditions that it may be uneconomical for us to roll a TBA long position into future months, which may result in us having to take physical delivery of the underlying securities and use cash or other financing sources to fund our total purchase commitment.
Repurchase Agreements
Leverage based solely on repurchase agreement amounts outstanding was 5.6 times shareholders’ equity as of December 31, 2025. Our repurchase agreement borrowings are uncommitted with terms renewable at the discretion of our lenders and generally have original terms to maturity of overnight to six months, though in some instances, we may enter into longer-dated maturities depending on market conditions. We seek to maintain unused capacity under our existing repurchase agreement credit lines with multiple counterparties, which helps protect us in the event of a counterparty's failure to renew existing repurchase agreements. As part of our continuous evaluation of counterparty risk, we maintain our highest counterparty exposures with broker-dealer subsidiaries of regulated financial institutions or primary dealers.
The amount outstanding for our repurchase agreement borrowings will typically fluctuate in any given period as it is dependent upon several factors, but particularly the extent to which we are active in buying and selling securities, including the volume of activity in TBA dollar roll transactions versus buying specified pools. The following table presents information regarding the balances of our repurchase agreement borrowings as of and for the periods indicated:
Repurchase Agreements
($s in thousands)
Balance Outstanding As of Quarter End
Average Balance Outstanding For the Quarter Ended
Maximum Balance Outstanding During the Quarter Ended
December 31, 2025
$
13,904,231
$
12,469,902
$
13,904,304
September 30, 2025
11,753,522
10,468,568
11,754,581
June 30, 2025
8,600,143
7,871,627
8,600,487
March 31, 2025
7,234,723
6,842,485
7,234,723
December 31, 2024
6,563,120
6,431,743
6,568,805
September 30, 2024
6,423,890
5,943,805
6,461,475
June 30, 2024
5,494,428
5,410,282
5,529,856
March 31, 2024
5,284,708
5,365,575
5,469,434
December 31, 2023
5,381,104
5,168,821
5,381,354
September 30, 2023
5,002,230
4,773,435
5,037,440
June 30, 2023
4,201,901
3,447,406
4,203,788
March 31, 2023
2,937,124
2,713,481
2,959,263
For our repurchase agreement borrowings, we are required to post and maintain margin to the lender (i.e., collateral in excess of the repurchase agreement borrowing) in order to support the amount of the financing. This excess collateral is often referred to as a “haircut” and is intended to provide the lender protection against fluctuations in the fair value of the collateral and/or the failure by us to repay the borrowing at maturity. Lenders have the right to change haircut requirements at maturity of the repurchase agreement and may change their haircuts based on market conditions and the perceived riskiness of the collateral pledged. If the fair value of the collateral falls below the amount required by the lender, the lender has the right to demand additional margin or collateral. If we fail to meet any margin call, our lenders have the right to terminate the repurchase agreement and sell any collateral pledged. The weighted average haircut for our borrowings as of December 31, 2025, was consistent with
prior periods, typically averaging less than 5% for borrowings collateralized with Agency RMBS and CMBS and between 10-14% for borrowings collateralized with CMBS IO.
The collateral we post in excess of our repurchase agreement borrowing with any counterparty is also typically referred to by us as “equity at risk,” which represents the potential loss to the Company if the counterparty is unable or unwilling to return collateral securing the repurchase agreement borrowing at its maturity. The counterparties with whom we have the greatest amounts of equity at risk may vary significantly during any given period due to the short-term and uncommitted nature of the repurchase agreement borrowings. As of December 31, 2025, we had amounts outstanding under 28 different repurchase agreements and did not have more than 10% of equity at risk with any counterparty or group of related counterparties.
We have various financial and operating covenants in certain of our repurchase agreements, which we monitor and evaluate on an ongoing basis for compliance as well as for impacts these customary covenants may have on our operating and financing flexibility. We do not believe we are subject to any covenants that materially restrict our financing flexibility. We were in full compliance with our debt covenants as of December 31, 2025, and we are not aware of circumstances that could potentially result in our non-compliance in the near future.
Derivative Instruments
Derivative instruments we enter into may require us to post initial margin at inception and daily variation margin based on subsequent changes in their fair value. Daily variation margin requirements also entitle us to receive collateral from our counterparties if the value of amounts owed to us under the derivative agreement exceeds the minimum margin requirement. The collateral posted as margin by us is typically in cash. As of December 31, 2025, we had cash collateral posted to our counterparties of $399 million under these agreements.
Collateral requirements for interest rate derivative instruments are typically governed by the central clearing exchange and the associated futures commission merchant, which may establish margin requirements in excess of the clearing exchange. Collateral requirements for our TBA contracts are governed by the MBSD of the Fixed Income Clearing Corporation and, if applicable, by our third-party brokerage agreements, which may establish margin levels in excess of the MBSD. Our TBA contracts, which are subject to master securities forward transaction agreements published by the Securities Industry and Financial Markets Association as well as supplemental terms and conditions with each counterparty, generally provide that valuations for our TBA contracts and any pledged collateral are to be obtained from a generally recognized source agreed to by both parties. However, in certain circumstances, our counterparties have the sole discretion to determine the value of the TBA contract and any pledged collateral. In such instances, our counterparties are required to act in good faith in making determinations of value. In the event of a margin call, we must generally provide additional collateral on the same business day.
The following table provides details on the “net (payments) receipts on derivative instruments” shown on our consolidated statements of cash flows for the periods indicated:
Year Ended
December 31,
Cash received or paid by instrument:
2025
2024
2023
($s in thousands)
Interest rate swaps:
Net variation margin (paid) received
$
(204,751)
$
146,379
$
—
Net periodic interest (1)
49,457
—
—
(155,294)
146,379
—
U.S. Treasury futures:
Net variation margin (paid) received
19,457
218,399
(214,622)
Paid upon maturity/termination
(66,906)
(46,955)
207,456
(47,449)
171,444
(7,166)
Options on U.S. Treasury futures
Premium paid at inception
(11,989)
—
—
Received upon maturity/termination
1,481
—
7,448
(10,508)
—
7,448
TBA securities:
Received (paid) upon settlement
59,812
45,106
(96,250)
Net (payments) receipts on derivative instruments
$
(153,439)
$
362,929
$
(95,968)
(1)Net periodic interest from our effective interest rate swaps is recognized as income or expense during the period earned or incurred, but the cash is not received or paid until the anniversary of each agreement’s effective date or upon maturity.
Dividends
We set our dividend based on many factors, including our view on long-term returns, yield on comparable investments, liquidity and market risk, and taxable income. Among these factors, we focus on economic returns and taxable income within the context of the distribution requirements. As a REIT, we are required to distribute to our shareholders amounts equal to at least 90% of our REIT taxable income for each taxable year after certain deductions, including the separate dividend requirements of the Series C Preferred Stock.
We designate certain derivative instruments as interest rate hedges for tax purposes. Realized gains (losses) resulting from the difference in fair value and the amount of cash received or paid upon termination or maturity of designated derivative instruments are included in GAAP earnings in the same reporting period in which the derivative instrument matures or is terminated by the Company but are generally not recognized in REIT taxable income until future periods. Non-designated derivative instruments are included in GAAP earnings and REIT taxable income in the same period the derivative instrument matures or is terminated by the Company. Our remaining net deferred tax hedge gain was estimated to be $558 million as of December 31, 2025, which will be amortized into REIT taxable income over several years. As of December 31, 2025, we also had $505 million in capital loss carryforwards, all of which will expire by either December 31, 2027 or by December 31, 2028. Due to these amounts and other temporary and permanent differences between GAAP net income and REIT taxable income, coupled with the uncertainty inherent in the forward interest rate curve, we cannot reasonably estimate how much the deferred tax hedge gains to be recognized will impact our dividend declarations during 2026 or in any given period.
We fund dividend distributions through portfolio cash flows, existing cash balances, or through the return of principal from our investments (either through repayment or sale). Please refer to "Operating and Regulatory Structure" within Part I, Item 1, "Business," as well as Part I, Item 1A, “Risk Factors” of this Annual Report on
Form 10-K for additional important information regarding our deferred tax hedge gains and dividends declared on our taxable income.
RECENT ACCOUNTING PRONOUNCEMENTS
Please refer to Note 1 of the Notes to the Consolidated Financial Statements contained within Part II, Item 8 of this Annual Report on Form 10-K for additional information.
CRITICAL ACCOUNTING ESTIMATES
The discussion and analysis of our financial condition and results of operations are based in large part upon our consolidated financial statements, which have been prepared in accordance with GAAP. The preparation of our consolidated financial statements requires management to make estimates, judgments and assumptions that affect the reported amounts of assets, liabilities, revenues, and expenses and disclosure of contingent assets and liabilities. We base these estimates and judgments on historical experience and assumptions believed to be reasonable under current facts and circumstances. Actual results, however, may differ significantly from the estimated amounts we have recorded.
The following discussion provides information on our critical accounting policies, which require management's most difficult, subjective, or complex judgments, and may result in materially different results under different assumptions and conditions. Please also refer to Note 1 of our Notes to the Consolidated Financial Statements included within Part II, Item 8 of this Annual Report on Form 10-K for additional information related to significant accounting policies.
Fair Value Measurements. The fair value of our Agency MBS is based on prices received from an independent third-party pricing service. Most of our MBS are substantially similar to securities actively traded and observable in the market. In valuing a security, the pricing service primarily uses a market approach, which uses observable prices and other relevant information that is generated by market transactions of identical or similar securities, but may also use an income approach, which uses valuation techniques such as discounted cash flow modeling. Examples of the observable inputs and assumptions used in the valuation techniques include market interest rates, credit spreads, and projected prepayment speeds, among other factors. If the fair value of a security is not available from a third-party pricing service, we may estimate the fair value of the security through a variety of methods using observable market data.
Management reviews the prices it receives from the pricing service for reasonableness using additional third-party pricing services. If the price of a security is obtained from quoted prices for similar instruments or model-derived valuations whose inputs are observable, the security is classified as a level 2 security. The security is classified as a level 3 security if the inputs are unobservable, resulting in an estimate of fair value based primarily on management's judgment. Although it is rare, we may exclude a price received from a third party if we determine, based on our knowledge and expertise of the market, that the price received is significantly different from other observable market data. Please refer to Note 6 of the Notes to the Consolidated Financial Statements contained within Part II, Item 8 of this Annual Report on Form 10-K for additional information on fair value measurements.
ITEM 7A. QUANTITATIVE AND QUALITATIVE DISCLOSURES ABOUT MARKET RISK
Market risk is the exposure to losses resulting from changes in market factors. Our business strategy exposes us to a variety of market risks, including interest rate, spread, prepayment, credit, liquidity, and reinvestment risks. These risks can and do cause fluctuations in our liquidity, comprehensive income and book value
31
as discussed below.
Interest Rate Risk
Investing in interest-rate sensitive investments such as MBS and TBA securities subjects us to interest rate risk. Interest rate risk results from investing in securities with a fixed coupon or a floating coupon that may not immediately adjust for changes in interest rates. Interest rate risk also results from the mismatch between the duration of our assets versus the duration of our liabilities and hedges. The amount of the impact will depend on the composition of our portfolio, our hedging strategy, the effectiveness of our hedging instruments and the magnitude and duration of the change in interest rates.
We manage interest rate risk within tolerances set by our Board of Directors. We use interest rate hedging instruments to mitigate the impact of changing interest rates on the market value of our assets and on our interest expense from repurchase agreements used to finance our investments. Our hedging methods are based on many factors, including, but not limited to, our estimates regarding future interest rates and expected levels of prepayments of our assets. If prepayments are slower or faster than assumed, the maturity of our investments will also differ from our expectations, which could reduce the effectiveness of our hedging strategies and may cause losses that adversely affect our cash flow. Estimates of prepayment speeds can vary significantly by investor for the same security, and therefore, estimates of security and portfolio duration can vary considerably between market participants.
We continuously monitor market conditions, economic conditions, interest rates, and other market activity and adjust the composition of our investments and hedges throughout any given period. As such, the projections for changes in market value provided below are limited in usefulness because the modeling assumes no changes to the composition of our investment portfolio or hedging instruments as of the dates indicated. Changes in the types of our investments, the returns earned on these investments, future interest rates, credit spreads, the shape of the yield curve, the availability of financing, and/or the mix of our investments and financings, including derivative instruments, may cause actual results to differ significantly from the modeled results shown in the tables below. Therefore, the modeled results shown in the tables below and all related disclosures constitute forward-looking statements.
Management evaluates changes in interest rate curves to manage portfolio interest rate risk and the market value of its investments and common equity. Because interest rates do not typically move in a parallel fashion from period to period (as can be seen by the graph for U.S. Treasury rates in Item 7, “Executive Overview”), the tables below show the projected sensitivity of the market value of our financial instruments and common equity to both parallel and non-parallel shifts in market interest rates.
32
December 31, 2025
Parallel Decrease in Interest Rates of
Parallel Increase in Interest Rates of
100 Basis Points
50 Basis Points
50 Basis Points
100 Basis Points
Type of
Instrument (1)
% of Market Value
% of Common Equity
% of Market Value
% of Common Equity
% of Market Value
% of Common Equity
% of Market Value
% of Common Equity
RMBS
2.3
%
19.1
%
1.4
%
11.6
%
(1.8)
%
(15.1)
%
(3.9)
%
(32.3)
%
CMBS
0.3
%
2.3
%
0.1
%
1.2
%
(0.1)
%
(1.1)
%
(0.3)
%
(2.2)
%
CMBS IO
—
%
0.1
%
—
%
—
%
—
%
—
%
—
%
(0.1)
%
TBAs
0.7
%
5.6
%
0.4
%
3.2
%
(0.4)
%
(3.7)
%
(0.9)
%
(7.6)
%
Interest rate hedges
(4.4)
%
(36.7)
%
(2.2)
%
(18.2)
%
2.2
%
17.8
%
4.3
%
35.7
%
Total
(1.1)
%
(9.6)
%
(0.3)
%
(2.2)
%
(0.1)
%
(2.1)
%
(0.8)
%
(6.5)
%
December 31, 2024
Parallel Decrease in Interest Rates of
Parallel Increase in Interest Rates of
100 Basis Points
50 Basis Points
50 Basis Points
100 Basis Points
Type of
Instrument (1)
% of Market Value
% of Common Equity
% of Market Value
% of Common Equity
% of Market Value
% of Common Equity
% of Market Value
% of Common Equity
RMBS
3.6
%
33.0
%
1.9
%
17.4
%
(2.0)
%
(18.3)
%
(4.1)
%
(37.1)
%
CMBS
0.1
%
0.5
%
—
%
0.2
%
—
%
(0.2)
%
(0.1)
%
(0.5)
%
CMBS IO
—
%
0.3
%
—
%
0.1
%
—
%
(0.1)
%
—
%
(0.3)
%
TBAs
1.0
%
9.6
%
0.6
%
5.3
%
(0.7)
%
(6.0)
%
(1.3)
%
(12.2)
%
Interest rate hedges
(5.0)
%
(46.2)
%
(2.5)
%
(22.6)
%
2.3
%
21.2
%
4.6
%
41.9
%
Total
(0.3)
%
(2.8)
%
—
%
0.4
%
(0.4)
%
(3.4)
%
(0.9)
%
(8.2)
%
December 31, 2025
December 31, 2024
Non-Parallel Shifts
Basis Point Change in 2-year UST
Basis Point Change in 10-year UST
% of Market Value (1)
% of Common Equity
% of Market Value (1)
% of Common Equity
Bearish
Steepening
+25
+50
(0.2)
%
(1.4)
%
(0.3)
%
(2.5)
%
+50
+100
(0.6)
%
(5.3)
%
(0.7)
%
(6.6)
%
Flattening
+50
+25
(0.2)
%
(1.4)
%
(0.3)
%
(2.5)
%
+100
+50
(0.4)
%
(3.4)
%
(0.5)
%
(4.9)
%
Bullish
Steepening
-25
+0
0.1
%
0.5
%
0.1
%
1.4
%
-50
-10
0.1
%
0.6
%
0.3
%
2.6
%
-75
-25
—
%
0.2
%
0.4
%
3.6
%
Flattening
+0
-25
(0.1)
%
(1.1)
%
—
%
(0.4)
%
-10
-50
(0.4)
%
(3.0)
%
(0.1)
%
(1.1)
%
-25
-75
(0.7)
%
(6.2)
%
(0.3)
%
(3.0)
%
(1)Includes changes in market value of our investments and derivative instruments, including TBA securities, but excludes changes in market value of our financings which are not carried at fair value on our balance sheet due to their short-term maturities. The projections for market value do not assume any change in credit spreads.
33
Spread Risk
Spread risk is the risk of loss from an increase in the market spread between the yield on an investment versus its benchmark index. Changes in market spreads represent the market's valuation of the perceived riskiness of an asset relative to risk-free rates. Widening spreads reduce the market value of our investments as market participants require additional yield to hold riskier assets. Market spreads could change based on macroeconomic or systemic factors as well as the factors specific to a particular security, such as prepayment performance or credit performance. Other factors that could impact credit spreads include technical issues, such as supply and demand for a particular type of security, Federal Reserve monetary policy, or other governmental policy change. We do not hedge spread risk given the cost and complexity of hedging credit spreads and, in our opinion, the lack of liquid instruments available to use as hedges.
Fluctuations in spreads typically vary based on the type of investment. Sensitivity to changes in market spreads is derived from models that are dependent on various assumptions, and actual changes in market value in response to changes in market spreads could differ materially from the projected sensitivity if actual conditions differ from these assumptions.
The table below shows the projected sensitivity of the market value of our investments given the indicated change in market spreads as of the dates indicated:
December 31, 2025
December 31, 2024
Percentage Change in
Percentage Change in
Basis Point Change in Market Spreads
Market Value of Investments (1)
% of Common Equity
Market Value of Investments (1)
% of Common Equity
+20/+50 (2)
(1.0)
%
(8.4)
%
(1.1)
%
(10.4)
%
+10
(0.5)
%
(4.2)
%
(0.6)
%
(5.2)
%
-10
0.5
%
4.2
%
0.6
%
5.2
%
-20/-50 (2)
1.0
%
8.4
%
1.1
%
10.4
%
(1) Includes changes in market value of our MBS investments, including TBA securities.
(2) Assumes a 20-basis point shift in Agency and non-Agency RMBS and CMBS and a 50-basis point shift in Agency
and non-Agency CMBS IO.
Prepayment Risk
Prepayment risk is the risk of an early, unscheduled return of principal on an investment. We are subject to prepayment risk from premiums paid on investments, which are amortized as a reduction in interest income using the effective interest method. Our comprehensive income and book value per common share may also be negatively impacted by prepayments if the fair value of the investment materially exceeds the par balance of the underlying security. Principal prepayments on our investments are influenced by changes in market interest rates and a variety of economic, geographic, government policy, and other factors beyond our control, including GSE policy with respect to loan forbearance and delinquent loan buy-outs.
We seek to manage our prepayment risk on our MBS by diversifying our investments and investing in securities that either contain loans for which the underlying borrowers have a disincentive to refinance or have some provision of prepayment prohibition or yield maintenance, as is the case with CMBS and CMBS IO. Loans underlying our CMBS and CMBS IO securities typically have prepayment protection provisions (such as prepayment lock-outs) or prepayment compensation provisions (such as yield maintenance or prepayment penalties). There are no prepayment protections if the loan defaults and is partially or wholly repaid earlier as a result of loss mitigation actions taken by the underlying loan servicer.
In a declining interest rate environment, higher yielding investments will typically prepay at a faster rate than anticipated. If we are unable to reinvest the repayments at comparable yields, our future net interest income may be negatively impacted. In an increasing interest rate environment, lower yielding assets with a fixed rate may extend or prepay slower than anticipated. Because we finance our investments with short-term repurchase agreement
34
financing, we may be required to finance our investments at a higher interest rate without the ability to reinvest principal into higher yielding securities, which would cause a decline in our net interest income.
Credit Risk
Credit risk is the risk that we will not receive all contractual amounts due on investments that we own due to default by the borrower or due to a deficiency in proceeds from the liquidation of the collateral securing the obligation. Credit losses on loans could result in lower or negative yields on our investments.
Agency RMBS and Agency CMBS have credit risk to the extent that Fannie Mae or Freddie Mac fails to remit payments on the MBS for which they have issued a guaranty of payment. Given the improved financial performance and conservatorship of these entities and the continued support of the U.S. government, we believe this risk is low.
Agency and non-Agency CMBS IO represent the right to excess interest (and not principal) on the underlying loans. These securities are exposed to the loss of investment basis in the event a loan collateralizing the security liquidates without paying yield maintenance or prepayment penalty. This will typically occur when the underlying loan is in default and proceeds from the disposition of the loan collateral are insufficient to pay the prepayment consideration. To mitigate credit risk of investing in CMBS IO, we invest in primarily AAA-rated securities that are stripped off senior tranches, which means we receive the highest payment priority and are the last to absorb losses in the event of a shortfall in cash flows. Our Agency CMBS IO are Class X1 from Freddie Mac Series K deals from which interest continues to be advanced even in the event of an underlying default up until liquidation, which is the triggering event that disrupts the Agency CMBS IO cash flow. For non-Agency CMBS IO, the servicer and master servicer will determine if interest will continue to be advanced upon default of a loan based on their estimate of liquidation proceeds. Senior non-Agency CMBS IO may benefit from changes in contractual cash flows, including modifications or loan extensions as the senior classes can remain outstanding beyond the original maturity date.
In addition, bilateral agreements expose us to increased credit risk related to our counterparties, and we may be at risk of loss of any collateral held by a repurchase or derivative counterparty if the counterparty becomes insolvent or files for bankruptcy.
Liquidity Risk
We have liquidity risk principally from the use of recourse repurchase agreements to finance our ownership of securities. Our repurchase agreements are renewable at the discretion of our lenders and do not contain guaranteed rollover terms. If we fail to repay the lender at maturity, the lender has the right to immediately sell the collateral and pursue us for any shortfall if the sales proceeds are inadequate to cover the repurchase agreement financing. In addition, declines in the market value of our investments pledged as collateral for repurchase agreement borrowings and for our derivative instruments may result in counterparties initiating margin calls for additional collateral.
Our use of TBA long positions as a means of investing in and financing Agency RMBS also exposes us to liquidity risk in the event that we are unable to roll or terminate our TBA contracts prior to their settlement date. If we are unable to roll or terminate our TBA long positions, we could be required to take physical delivery of the underlying securities and settle our obligations for cash, which could negatively impact our liquidity position or force us to sell assets under adverse conditions if financing is not available to us on acceptable terms.
For further information, including how we attempt to mitigate liquidity risk and monitor our liquidity position, and in particular, during the current macroeconomic environment, please refer to “Liquidity and Capital Resources” in Item 7 of this Annual Report on Form 10-K.
Reinvestment Risk
We are subject to reinvestment risk as a result of the prepayment, repayment and sales of our investments. In order to maintain our investment portfolio size and our earnings, we need to reinvest capital received from these events into new interest-earning assets or TBA securities, and if market yields on new investments are lower or if financing costs are higher, our net interest income will decline. In addition, based on market conditions, our leverage, and our liquidity profile, we may decide to not reinvest the cash flows we receive from our investment
35
portfolio even when attractive reinvestment opportunities are available, or we may decide to reinvest in assets with lower yield but greater liquidity. If we retain capital or pay dividends to return capital to shareholders rather than reinvest capital, or if we invest capital in lower yielding assets for liquidity reasons, the income generated by our investment portfolio will likely decline.
ITEM 8. FINANCIAL STATEMENTS AND SUPPLEMENTARY DATA
Our consolidated financial statements and the related notes, together with the Reports of the Independent Registered Public Accounting Firm thereon, are set forth beginning on page F-1 of this Annual Report on Form 10-K.
ITEM 9. CHANGES IN AND DISAGREEMENTS WITH ACCOUNTANTS ON ACCOUNTING AND FINANCIAL DISCLOSURE
None.
ITEM 9A. CONTROLS AND PROCEDURES
Disclosure Controls and Procedures
Our management evaluated, with the participation of our co-principal executive officers and principal financial officer, the effectiveness of our disclosure controls and procedures, as defined in Exchange Act Rule 13a-15(e), as of the end of the period covered by this report. Based on that evaluation, our co-principal executive officers and principal financial officer concluded that, as of December 31, 2025, our disclosure controls and procedures were effective to ensure that information required to be disclosed in the reports that we file or submit under the Exchange Act is recorded, processed, summarized and reported, within the time periods specified in the SEC’s rules and forms, and that such information is accumulated and communicated to our management, including our co-principal executive officers and principal financial officer, as appropriate, to allow timely decisions regarding required disclosure.
Changes in Internal Control over Financial Reporting
There were no changes in our internal control over financial reporting during the three months ended December 31, 2025 that materially affected, or are reasonably likely to materially affect, our internal control over financial reporting.
Management’s Annual Report on Internal Control over Financial Reporting
Our management is responsible for establishing and maintaining adequate internal control over financial reporting as defined in Rule 13a-15(f) of the Exchange Act. Because of inherent limitations, a system of internal control over financial reporting may not prevent or detect misstatements. Also, projections of any evaluation of effectiveness to future periods are subject to the risk that controls may become inadequate due to a change in conditions, or that the degree of compliance with policies or procedures may deteriorate.
Our management evaluated, with the participation of our co-principal executive officers and principal financial officer, the effectiveness of our internal control over financial reporting using the criteria set forth by the Committee of Sponsoring Organizations of the Treadway Commission (“COSO”) (2013) in “Internal Control-Integrated Framework.” Based on that evaluation, our co-principal executive officers and principal financial officer concluded that our internal control over financial reporting was effective as of the end of the period covered by this report.
The Company’s internal control over financial reporting as of December 31, 2025 has been audited by Ernst & Young, LLP, the independent registered public accounting firm that also audited the Company’s consolidated financial statements as of and for the year ended December 31, 2025 included in this Annual Report on Form 10-K. The attestation report of Ernst & Young, LLP on the effectiveness of the Company’s internal control over financial reporting appears on page # herein.
36
ITEM 9B. OTHER INFORMATION
Rule 10b5-1 Trading Plan
During the three months ended December 31, 2025, none of the Company’s directors or Section 16 officers adopted or terminated any “Rule 10b5-1 trading arrangements” or any “non-Rule 10b5-1 trading arrangements” (in each case, as defined in Item 408 of Regulation S-K).
ITEM 9C. DISCLOSURE REGARDING FOREIGN JURISDICTIONS THAT PREVENT INSPECTIONS
Not applicable.
37
PART III.
ITEM 10. DIRECTORS, EXECUTIVE OFFICERS AND CORPORATE GOVERNANCE
The information required by Item 10 will be included in our definitive proxy statement for use in connection with our 2026 Annual Meeting of Shareholders (“2026 Proxy Statement”) and is incorporated herein by reference.
Our Board has adopted a Code of Business Conduct and Ethics (“Code of Conduct”) that applies to all of our directors and employees. We have posted a copy of our Code of Conduct on our website at www.dynexcapital.com. We intend to satisfy the disclosure requirements under Item 5.05 of Form 8-K regarding amendments to, or waivers from, the Code of Conduct by posting such information on our website. We are not including the information contained on our website as part of, or incorporating it by reference into, this Annual Report.
ITEM 11. EXECUTIVE COMPENSATION
The information required by Item 11 will be included in the 2026 Proxy Statement and is incorporated herein by reference.
ITEM 12. SECURITY OWNERSHIP OF CERTAIN BENEFICIAL OWNERS AND MANAGEMENT AND RELATED STOCKHOLDER MATTERS
The following table sets forth information as of December 31, 2025 with respect to the Company’s common stock that may be issued under the Dynex, Inc. 2025 Stock and Incentive Plan, which is the Company’s only compensation plan under which equity securities are currently authorized for issuance:
Equity Compensation Plan Information
Plan Category
Number of Securities to Be Issued upon Exercise of Outstanding Options, Warrants and Rights (1)
Weighted-Average
Exercise Price of Outstanding Options, Warrants and Rights (2)
Number of Securities Remaining Available for Future Issuance Under Equity Compensation Plans
Equity Compensation Plans Approved by Shareholders:
2025 Stock and Incentive Plan
1,092,330
$
—
10,907,670
Equity Compensation Plans Not Approved by Shareholders
—
—
—
Total
1,092,330
$
—
10,907,670
(1)Amount shown reflects the maximum number of shares that may be issued upon future vesting of restricted stock units if time-based service conditions are met and performance-based stock units if maximum performance goals are achieved.
(2)The outstanding stock awards and units issued by the Company for share-based compensation do not have an exercise price.
The remaining information required by Item 12 will be included in the 2026 Proxy Statement and is incorporated herein by reference.
38
ITEM 13. CERTAIN RELATIONSHIPS AND RELATED TRANSACTIONS, AND DIRECTOR INDEPENDENCE
The information required by Item 13 will be included in the 2026 Proxy Statement and is incorporated herein by reference.
ITEM 14. PRINCIPAL ACCOUNTANT FEES AND SERVICES
The information required by Item 14 will be included in the 2026 Proxy Statement and is incorporated herein by reference.
ITEM 15. EXHIBITS AND FINANCIAL STATEMENT SCHEDULES
(a)(1) and (a)(2) Financial Statements and Schedules:
1. and 2.
Financial Statements and Schedules: The information required by this section of Item 15 is set forth in the Consolidated Financial Statements and Reports of Independent Registered Public Accounting Firm beginning at page F-1 of this Annual Report on Form 10-K. The index to the Financial Statements is set forth at page F-2 of this Annual Report on Form 10-K.
The following materials from Dynex Capital, Inc.'s Annual Report on Form 10-K for the year ended December 31, 2025, formatted in iXBRL (Inline Extensible Business Reporting Language), filed herewith: (i) Consolidated Balance Sheets, (ii) Consolidated Statements of Comprehensive Income, (iii) Consolidated Statements of Shareholders’ Equity, (iv) Consolidated Statements of Cash Flows, and (v) Notes to the Consolidated Financial Statements.
104
The cover page from Dynex Capital, Inc.'s Annual Report on Form 10-K for the year ended December 31, 2025, formatted in iXBRL (Inline Extensible Business Reporting Language) (included with Exhibit 101).
* Denotes a management contract or compensatory plan or arrangement.
ITEM 16. FORM 10-K SUMMARY
None.
39
SIGNATURES
Pursuant to the requirements of Section 13 or 15(d) of the Securities Exchange Act of 1934, the registrant has duly caused this report to be signed on its behalf by the undersigned, thereunto duly authorized.
DYNEX CAPITAL, INC.
Date:
February 25, 2026
/s/ Robert S. Colligan
Robert S. Colligan
Chief Financial Officer
(Principal Financial Officer)
Pursuant to the requirements of the Securities Exchange Act of 1934, this report has been signed below by the following persons on behalf of the registrant and in the capacities and on the dates indicated.
Signature
Title
Date
/s/ Byron L. Boston
Co-Chief Executive Officer and Chairman
February 25, 2026
Byron L. Boston
(Co-Principal Executive Officer)
/s/ Smriti L. Popenoe
Co-Chief Executive Officer, President, and Director
February 25, 2026
Smriti L. Popenoe
(Co-Principal Executive Officer)
/s/ Robert S. Colligan
Chief Financial Officer
February 25, 2026
Robert S. Colligan
(Principal Financial Officer)
/s/ Jeffrey L. Childress
Chief Accounting Officer
February 25, 2026
Jeffrey L. Childress
(Principal Accounting Officer)
/s/ Marie A. Chandoha
Director
February 25, 2026
Marie A. Chandoha
/s/ Julia L. Coronado
Director
February 25, 2026
Julia L. Coronado
/s/ Alexander I. Crawford
Director
February 25, 2026
Alexander I. Crawford
/s/ Andrew I. Gray
Director
February 25, 2026
Andrew I. Gray
/s/ Joy D. Palmer
Director
February 25, 2026
Joy D. Palmer
40
DYNEX CAPITAL, INC.
CONSOLIDATED FINANCIAL STATEMENTS AND
REPORTS OF INDEPENDENT REGISTERED PUBLIC ACCOUNTING FIRM
For Inclusion in Annual Report on Form 10-K
Filed with Securities and Exchange Commission
December 31, 2025
DYNEX CAPITAL, INC.
INDEX TO FINANCIAL STATEMENTS
Page
Reports of Independent Registered Public Accounting Firm:
Ernst & Young, LLP; Richmond, Virginia; PCAOB ID#42
Consolidated Financial Statements As of December 31, 2025 and December 31, 2024 and For the Years Ended December 31, 2025, December 31, 2024, and December 31, 2023:
Report of Independent Registered Public Accounting Firm
To the Shareholders and the Board of Directors of Dynex Capital, Inc.
Opinion on the Financial Statements
We have audited the accompanying consolidated balance sheet of Dynex Capital, Inc. (the Company) as of December 31, 2025, the related consolidated statements of comprehensive income, shareholders' equity and cash flows for the year ended December 31, 2025, and the related notes (collectively referred to as the “consolidated financial statements”). In our opinion, the consolidated financial statements present fairly, in all material respects, the financial position of the Company at December 31, 2025, and the results of its operations and its cash flows for year ended December 31, 2025, in conformity with U.S. generally accepted accounting principles.
We also have audited, in accordance with the standards of the Public Company Accounting Oversight Board (United States) (PCAOB), the Company's internal control over financial reporting as of December 31, 2025, based on criteria established in Internal Control—Integrated Framework issued by the Committee of Sponsoring Organizations of the Treadway Commission (2013 framework), and our report dated February 25, 2026 expressed an unqualified opinion thereon.
Basis for Opinion
These financial statements are the responsibility of the Company's management. Our responsibility is to express an opinion on the Company’s financial statements based on our audits. We are a public accounting firm registered with the PCAOB and are required to be independent with respect to the Company in accordance with the U.S. federal securities laws and the applicable rules and regulations of the Securities and Exchange Commission and the PCAOB.
We conducted our audit in accordance with the standards of the PCAOB. Those standards require that we plan and perform the audit to obtain reasonable assurance about whether the financial statements are free of material misstatement, whether due to error or fraud. Our audit included performing procedures to assess the risks of material misstatement of the financial statements, whether due to error or fraud, and performing procedures that respond to those risks. Such procedures included examining, on a test basis, evidence regarding the amounts and disclosures in the financial statements. Our audit also included evaluating the accounting principles used and significant estimates made by management, as well as evaluating the overall presentation of the financial statements. We believe that our audit provides a reasonable basis for our opinion.
Critical Audit Matter
The critical audit matter communicated below is a matter arising from the current period audit of the financial statements that was communicated or required to be communicated to the audit committee and that: (1) relates to accounts or disclosures that are material to the financial statements and (2) involved our especially challenging, subjective or complex judgments. The communication of the critical audit matter does not alter in any way our opinion on the consolidated financial statements, taken as a whole, and we are not, by communicating the critical audit matter below, providing a separate opinion on the critical audit matter or on the accounts or disclosures to which it relates.
At December 31, 2025, the Company’s mortgage-backed securities, at fair value were $16.3 billion. As described in Note 6 to the consolidated financial statements, management determines the fair value of mortgage-backed securities primarily by using an independent third-party pricing service. The pricing service primarily uses a market approach, which uses observable prices and other relevant information that is generated by market transactions of identical or similar securities, but may use an income approach, which uses valuation techniques such as discounted cash flow modeling. These prices are assessed for reasonableness by management using additional third-party pricing services. If the fair value of a security is not available from a third-party pricing service, the Company may estimate the fair value of the security using a variety of methods using observable market data.
Auditing the fair value of mortgage-backed securities was complex due to the high degree of audit effort in performing procedures and evaluating audit evidence related to the fair value of the mortgage-backed securities.
How We Addressed the Matter in Our Audit
We obtained an understanding, evaluated the design and tested the operating effectiveness of the Company’s controls that address the risk of material misstatement relating to the valuation of mortgage-backed securities. For example, we tested controls over management’s review of the third-party pricing data, evaluation of the competence and objectivity of the third-party pricing service, as well as their review of the methodologies used by the third-party pricing service. We also tested controls over the completeness and accuracy of data used in management’s review.
Our audit procedures included, among others, developing an independent range of prices for the securities by obtaining independent pricing from third-party services, comparing management’s estimate of fair value to the independent range of prices to evaluate management’s estimate, testing the inputs of internal valuations performed by the Company by comparing such inputs to market observable data, and testing the completeness and accuracy of the data provided by management.
/s/ Ernst & Young LLP
We have served as the Company’s auditor since 2025.
Report of Independent Registered Public Accounting Firm
To the Shareholders and the Board of Directors of Dynex Capital, Inc.
Opinion on Internal Control over Financial Reporting
We have audited Dynex Capital, Inc.’s internal control over financial reporting as of December 31, 2025, based on criteria established in Internal Control— Integrated Framework issued by the Committee of Sponsoring Organizations of the Treadway Commission (2013 framework) (the COSO criteria). In our opinion, Dynex Capital, Inc. (the Company) maintained, in all material respects, effective internal control over financial reporting as of December 31, 2025, based on the COSO criteria.
We also have audited, in accordance with the standards of the Public Company Accounting Oversight Board (United States) (PCAOB), the consolidated balance sheet of the Company as of December 31, 2025, the related consolidated statements of comprehensive income, shareholders’ equity and cash flows for the year ended December 31, 2025, and the related notes and our report dated February 25, 2026 expressed an unqualified opinion thereon.
Basis for Opinion
The Company’s management is responsible for maintaining effective internal control over financial reporting and for its assessment of the effectiveness of internal control over financial reporting included in the accompanying Management’s Annual Report on Internal Control over Financial Reporting. Our responsibility is to express an opinion on the Company’s internal control over financial reporting based on our audit. We are a public accounting firm registered with the PCAOB and are required to be independent with respect to the Company in accordance with the U.S. federal securities laws and the applicable rules and regulations of the Securities and Exchange Commission and the PCAOB.
We conducted our audit in accordance with the standards of the PCAOB. Those standards require that we plan and perform the audit to obtain reasonable assurance about whether effective internal control over financial reporting was maintained in all material respects.
Our audit included obtaining an understanding of internal control over financial reporting, assessing the risk that a material weakness exists, testing and evaluating the design and operating effectiveness of internal control based on the assessed risk, and performing such other procedures as we considered necessary in the circumstances. We believe that our audit provides a reasonable basis for our opinion.
Definition and Limitations of Internal Control Over Financial Reporting
A company’s internal control over financial reporting is a process designed to provide reasonable assurance regarding the reliability of financial reporting and the preparation of financial statements for external purposes in accordance with generally accepted accounting principles. A company’s internal control over financial reporting includes those policies and procedures that (1) pertain to the maintenance of records that, in reasonable detail, accurately and fairly reflect the transactions and dispositions of the assets of the company; (2) provide reasonable assurance that transactions are recorded as necessary to permit preparation of financial statements in accordance with generally accepted accounting principles, and that receipts and expenditures of the company are being made only in accordance with authorizations of management and directors of the company; and (3) provide reasonable assurance regarding prevention or timely detection of unauthorized acquisition, use, or disposition of the company’s assets that could have a material effect on the financial statements.
Because of its inherent limitations, internal control over financial reporting may not prevent or detect misstatements. Also, projections of any evaluation of effectiveness to future periods are subject to the risk that controls may become
Report of Independent Registered Public Accounting Firm
Shareholders and Board of Directors
Dynex Capital, Inc.
Glen Allen, Virginia
Opinion on the consolidated Financial Statements
We have audited the accompanying consolidated balance sheets of Dynex Capital, Inc. (the “Company”) as of December 31, 2024, the related consolidated statements of comprehensive income, shareholders’ equity, and cash flows for each of the two years in the period ended December 31, 2024, and the related notes (collectively referred to as the “consolidated financial statements”). In our opinion, the consolidated financial statements present fairly, in all material respects, the financial position of the Company at December 31, 2024, and the results of its operations and its cash flows for each of the two years in the period ended December 31, 2024, in conformity with accounting principles generally accepted in the United States of America.
Basis for Opinion
These consolidated financial statements are the responsibility of the Company’s management. Our responsibility is to express an opinion on the Company’s consolidated financial statements based on our audits. We are a public accounting firm registered with the Public Company Accounting Oversight Board (United States) (“PCAOB”) and are required to be independent with respect to the Company in accordance with the U.S. federal securities laws and the applicable rules and regulations of the Securities and Exchange Commission and the PCAOB.
We conducted our audits in accordance with the standards of the PCAOB. Those standards require that we plan and perform the audit to obtain reasonable assurance about whether the consolidated financial statements are free of material misstatement, whether due to error or fraud.
Our audits included performing procedures to assess the risks of material misstatement of the consolidated financial statements, whether due to error or fraud, and performing procedures that respond to those risks. Such procedures included examining, on a test basis, evidence regarding the amounts and disclosures in the consolidated financial statements. Our audits also included evaluating the accounting principles used and significant estimates made by management, as well as evaluating the overall presentation of the consolidated financial statements. We believe that our audits provide a reasonable basis for our opinion.
BDO USA, P.C.
We have served as the Company's auditor from 2005 to 2024.
Richmond, Virginia
February 28, 2025
F-5
DYNEX CAPITAL, INC.
CONSOLIDATED BALANCE SHEETS
($s in thousands except per share data)
December 31, 2025
December 31, 2024
ASSETS
Cash and cash equivalents
$
531,043
$
377,099
Cash collateral posted to counterparties
399,344
244,440
Mortgage-backed securities (including pledged assets of $14,593,470 and $6,893,629, respectively), at fair value
16,306,988
7,512,087
Due from counterparties
17,425
10,445
Derivative assets
10,498
133
Accrued interest receivable
67,940
32,841
Other assets
8,940
7,534
Total assets
$
17,342,178
$
8,184,579
LIABILITIES AND SHAREHOLDERS’ EQUITY
Liabilities:
Repurchase agreements
$
13,904,231
$
6,563,120
Due to counterparties
811,656
341,924
Derivative liabilities
4,830
22,814
Cash collateral posted by counterparties
8,373
—
Accrued interest payable
95,196
44,672
Dividends payable
37,171
16,501
Other liabilities
18,577
10,612
Total liabilities
14,880,034
6,999,643
Shareholders’ equity:
Preferred stock, par value $0.01 per share; 50,000,000 shares authorized; 4,460,000 and 4,460,000 shares issued and outstanding, respectively ($111,500 and $111,500 aggregate liquidation preference, respectively)
107,843
107,843
Common stock, par value $0.01 per share, 360,000,000 shares authorized;
174,814,912 and 84,491,800 shares issued and outstanding, respectively
1,748
845
Additional paid-in capital
2,921,551
1,742,471
Accumulated other comprehensive loss
(127,061)
(172,489)
Accumulated deficit
(441,937)
(493,734)
Total shareholders’ equity
2,462,144
1,184,936
Total liabilities and shareholders’ equity
$
17,342,178
$
8,184,579
See notes to the consolidated financial statements.
F-6
DYNEX CAPITAL, INC.
CONSOLIDATED STATEMENTS OF COMPREHENSIVE INCOME
($s in thousands except per share data)
Year Ended
December 31,
2025
2024
2023
INTEREST INCOME (EXPENSE)
Interest income
$
533,521
$
319,534
$
207,517
Interest expense
(419,165)
(313,657)
(215,448)
Net interest income (expense)
114,356
5,877
(7,931)
OTHER GAINS (LOSSES)
Realized loss on sales of investments, net
—
(1,506)
(74,916)
Unrealized gain (loss) on investments, net
370,850
(142,352)
142,501
(Loss) gain on derivative instruments, net
(113,093)
288,377
(32,905)
Total other gains, net
257,757
144,519
34,680
EXPENSES
Compensation and benefits
(35,127)
(20,505)
(16,929)
Other general and administrative
(16,381)
(14,088)
(13,799)
Other operating expenses
(1,539)
(1,905)
(2,151)
Total operating expenses
(53,047)
(36,498)
(32,879)
Net income (loss)
319,066
113,898
(6,130)
Preferred stock dividends
(10,191)
(7,694)
(7,694)
Net income (loss) to common shareholders
$
308,875
$
106,204
$
(13,824)
Other comprehensive income:
Unrealized gain (loss) on available-for-sale investments, net
$
45,428
$
(13,987)
$
22,844
Total other comprehensive income (loss)
45,428
(13,987)
22,844
Comprehensive income to common shareholders
$
354,303
$
92,217
$
9,020
Weighted average common shares-basic
124,128,422
70,766,410
54,809,462
Weighted average common shares-diluted
125,067,280
71,260,358
54,809,462
Net income (loss) per common share-basic
$
2.49
$
1.50
$
(0.25)
Net income (loss) per common share-diluted
$
2.47
$
1.49
$
(0.25)
See notes to the consolidated financial statements.
F-7
DYNEX CAPITAL, INC.
CONSOLIDATED STATEMENTS OF SHAREHOLDERS’ EQUITY
($s in thousands)
Preferred Stock
Common Stock
Additional Paid-in Capital
Accumulated Other Comprehensive Loss
Accumulated Deficit
Total Shareholders’ Equity
Shares
Amount
Shares
Amount
Balance as of
December 31, 2022
4,460,000
$
107,843
53,637,095
$
536
$
1,357,514
$
(181,346)
$
(383,219)
$
901,328
Stock issuance
—
—
3,329,802
33
42,593
—
—
42,626
Restricted stock granted, net of amortization
—
—
74,017
1
1,168
—
—
1,169
Other share-based compensation, net of amortization
—
—
33,213
—
3,664
—
—
3,664
Adjustments for tax withholding on share-based compensation
—
—
(35,880)
—
(445)
—
—
(445)
Stock issuance costs
—
—
—
—
(63)
—
—
(63)
Net loss
—
—
—
—
—
—
(6,130)
(6,130)
Dividends on preferred stock
—
—
—
—
—
—
(7,694)
(7,694)
Dividends on common stock
—
—
—
—
—
—
(86,564)
(86,564)
Other comprehensive income
—
—
—
—
—
22,844
—
22,844
Balance as of December 31, 2023
4,460,000
$
107,843
57,038,247
$
570
$
1,404,431
$
(158,502)
$
(483,607)
$
870,735
Stock issuance
—
—
27,256,835
273
332,044
—
—
332,317
Restricted stock granted, net of amortization
—
—
65,668
1
870
—
—
871
Other share-based compensation, net of amortization
—
—
195,641
2
6,362
—
—
6,364
Adjustments for tax withholding on share-based compensation
—
—
(64,591)
(1)
(948)
—
—
(949)
Stock issuance costs
—
—
—
—
(288)
—
—
(288)
Net income
—
—
—
—
—
—
113,898
113,898
Dividends on preferred stock
—
—
—
—
—
—
(7,694)
(7,694)
Dividends on common stock
—
—
—
—
—
—
(116,331)
(116,331)
Other comprehensive loss
—
—
—
—
—
(13,987)
—
(13,987)
F-8
Preferred Stock
Common Stock
Additional Paid-in Capital
Accumulated Other Comprehensive Loss
Accumulated Deficit
Total Shareholders’ Equity
Shares
Amount
Shares
Amount
Additional Paid-in Capital
Accumulated Other Comprehensive Loss
Accumulated Deficit
Total Shareholders’ Equity
Balance as of December 31, 2024
4,460,000
$
107,843
84,491,800
$
845
$
1,742,471
$
(172,489)
$
(493,734)
$
1,184,936
Stock issuance
—
—
90,126,672
901
1,168,377
—
—
1,169,278
Restricted stock granted, net of amortization
—
—
—
—
422
—
—
422
Other share-based compensation, net of amortization
—
—
290,237
3
12,140
—
—
12,143
Adjustments for tax withholding on share-based compensation
—
—
(93,797)
(1)
(1,628)
—
—
(1,629)
Stock issuance costs
—
—
—
(231)
—
—
(231)
Net income
—
—
—
—
—
—
319,066
319,066
Dividends on preferred stock
—
—
—
—
—
—
(10,191)
(10,191)
Dividends on common stock
—
—
—
—
—
—
(257,078)
(257,078)
Other comprehensive income
—
—
—
—
—
45,428
—
45,428
Balance as of
December 31, 2025
4,460,000
$
107,843
174,814,912
$
1,748
$
2,921,551
$
(127,061)
$
(441,937)
$
2,462,144
See notes to the consolidated financial statements.
F-9
DYNEX CAPITAL, INC.
CONSOLIDATED STATEMENTS OF CASH FLOWS ($s in thousands)
Year Ended
December 31,
2025
2024
2023
Operating activities:
Net income (loss)
$
319,066
$
113,898
$
(6,130)
Adjustments to reconcile net income (loss) to cash provided by operating activities:
Realized loss on sales of investments, net
—
1,506
74,916
Unrealized (gain) loss on investments, net
(370,850)
142,352
(142,501)
Loss (gain) on derivative instruments, net
113,093
(288,378)
32,905
Amortization of investment premiums, net
25,967
47,671
74,696
Other amortization and depreciation
2,098
1,867
2,315
Share-based compensation expense
12,565
7,235
4,833
Increase in accrued interest receivable
(35,099)
(3,471)
(13,467)
Increase (decrease) in accrued interest payable
50,524
(8,522)
36,744
Change in other assets and liabilities, net
3,457
234
(2,111)
Net cash provided by operating activities
120,821
14,392
62,200
Investing activities:
Purchases of investments
(8,882,183)
(1,872,422)
(3,578,289)
Principal payments received on trading securities
832,872
439,900
233,387
Principal payments received on available-for-sale investments
119,851
75,024
86,272
Proceeds from sales of trading securities
—
13,782
348,091
Principal payments received on mortgage loans held for investment
549
762
889
Net (payments) receipts on derivative instruments
(153,439)
362,929
(95,968)
Increase (decrease) in cash collateral posted by counterparties
8,373
(46,001)
45,566
Net cash used in investing activities
(8,073,977)
(1,026,026)
(2,960,052)
Financing activities:
Borrowings under repurchase agreements
143,887,928
66,437,278
23,502,271
Repayments of repurchase agreement borrowings
(136,546,817)
(65,255,262)
(20,765,572)
Proceeds from issuance of common stock
1,169,278
332,317
42,626
Cash paid for stock issuance costs
(157)
(231)
—
Payments related to tax withholding for share-based compensation
(1,629)
(949)
(445)
Dividends paid
(246,599)
(117,844)
(93,041)
Net cash provided by financing activities
8,262,004
1,395,309
2,685,839
Net increase (decrease) in cash, including cash posted to counterparties
308,848
383,675
(212,013)
Cash including cash collateral posted to counterparties at beginning of period
621,539
237,864
449,877
Cash including cash collateral posted to counterparties at end of period
$
930,387
$
621,539
$
237,864
Supplemental Disclosure of Cash Activity:
Cash paid for interest on repurchase agreements
$
368,641
$
322,179
$
178,705
Noncash Investing Activities:
Payable for purchases of investments
$
809,201
$
335,096
$
—
See notes to the consolidated financial statements.
F-10
DYNEX CAPITAL, INC.
NOTES TO THE CONSOLIDATED FINANCIAL STATEMENTS
NOTE 1 – ORGANIZATION AND SUMMARY OF SIGNIFICANT ACCOUNTING POLICIES
Organization
Dynex Capital, Inc. (“Dynex” or “the Company”) is a real estate investment trust (“REIT”) structured to deliver dividends to shareholders supported by long term returns from investments in mortgage assets backed by U.S. housing and commercial real estate. The Company’s common and preferred stocks trade on the New York Stock Exchange (“NYSE”) under the ticker symbols “DX” and “DXPRC”, respectively.
The Company is internally managed and primarily earns income from investing in residential and commercial mortgage-backed securities (“RMBS” and “CMBS”, respectively), which are backed by residential and commercial mortgage loans, and which are Agency securities guaranteed by U.S. government-sponsored enterprises (“GSEs”). The Company may also invest in other mortgage-related assets consistent with its objectives. Dynex actively manages interest rate, prepayment, spread, liquidity, and counterparty risks. The Dynex approach emphasizes risk management and disciplined capital allocation designed to preserve book value and support dividends across market cycles.
Basis of Presentation
The accompanying consolidated financial statements of Dynex Capital, Inc. and its subsidiaries have been prepared in accordance with U.S. generally accepted accounting principles (“GAAP”) and the rules and regulations of the U.S. Securities and Exchange Commission.
Use of Estimates
The preparation of financial statements in conformity with GAAP requires management to make estimates and assumptions that affect the reported amounts of assets and liabilities and the disclosure of contingent assets and liabilities at the date of the financial statements as well as the reported amounts of revenue and expenses during the reported period. Actual results could differ from those estimates. The most significant estimate used by management relates to the fair value measurement of its investments, including TBA securities accounted for as derivative instruments, which is discussed further below within this note to the consolidated financial statements. The Company believes the estimates and assumptions underlying the consolidated financial statements included herein are reasonable and supportable based on the information available as of December 31, 2025.
Consolidation and Variable Interest Entities
The consolidated financial statements include the accounts of the Company and the accounts of its majority owned subsidiaries. All intercompany accounts and transactions have been eliminated in consolidation.
The Company does not consolidate any variable interest entities (“VIEs”) as of December 31, 2025. The Company consolidates a VIE if the Company is determined to be the VIE’s primary beneficiary, which is defined as the party that has both (i) the power to control the activities that most significantly impact the VIE’s financial performance; and (ii) the right to receive benefits or absorb losses that could potentially be significant to the VIE. The Company reconsiders its evaluation of whether to consolidate a VIE on an ongoing basis, based on changes in the facts and circumstances pertaining to the VIE. Though the Company invests in Agency and non-Agency MBS which are generally considered to be interests in VIEs, the Company does not consolidate these entities because it does not meet the criteria to be deemed the primary beneficiary. The maximum exposure to loss for these VIEs is the carrying value of the MBS.
Income Taxes
The Company has elected to be taxed as a REIT under the Internal Revenue Code of 1986 (the “Tax Code”) and the corresponding provisions of state law. To qualify as a REIT, the Company must meet certain asset, income, ownership, and distribution tests. To meet these requirements, the Company’s main source of income is interest earned from obligations secured by mortgages on real property, and the Company must distribute at least 90% of its annual REIT taxable income to shareholders. The Company’s income will generally not be subject to federal income tax to the extent its income is distributed as dividends to shareholders.
F-11
DYNEX CAPITAL, INC.
NOTES TO THE CONSOLIDATED FINANCIAL STATEMENTS
The Company assesses its tax positions for all open tax years and determines whether the Company has any material unrecognized liabilities and records these liabilities, if any, to the extent they are deemed more likely than not to have been incurred.
Net Income (Loss) Per Common Share
The Company calculates basic net income (loss) per common share by dividing net income (loss) to common shareholders for the period by weighted-average shares of common stock outstanding for that period. Please see Note 2 for the calculation of the Company’s basic and diluted net income (loss) per common share for the periods indicated.
The Company currently has restricted stock, service-based restricted stock units (“RSUs”) and performance-based stock units (“PSUs”) issued and outstanding. Restricted stock awards issued under the Company’s 2020 Stock and Incentive Plan (the “2020 Plan”) are considered participating securities and therefore are included in the computation of basic net income per common share using the two-class method because holders of unvested shares of restricted stock issued are eligible to receive non-forfeitable dividends. Holders of RSUs and PSUs issued under the 2020 Plan as well as the Company’s 2025 Stock and Incentive Plan (the “2025 Plan”) accrue forfeitable dividend equivalent rights ("DERs") over the period outstanding, receiving dividend payments only upon the settlement date if the requisite service-based and performance-based conditions have been achieved, as applicable. As such, RSUs and PSUs are excluded from the computation of basic net income per common share but are included in the computation of diluted net income per common share using the treasury stock method unless the effect is to reduce a net loss or increase the net income per common share (also known as “anti-dilutive”). Upon vesting, restrictions on transfer expire on each share of restricted stock, RSU, and PSU, and each such share or unit becomes one unrestricted share of common stock and is included in the computation of basic net income per common share.
Because the Company’s 6.900% Series C Fixed-to-Floating Rate Cumulative Redeemable Preferred Stock (the “Series C Preferred Stock”) is redeemable at the Company’s option for cash only and convertible into shares of common stock only upon a change of control of the Company (and subject to other circumstances) as described in Article IIIC of the Company’s Restated Articles of Incorporation, as amended, the effect of those shares and their related dividends are excluded from the calculation of diluted net income per common share for the periods presented.
Cash and Cash Equivalents
Cash and cash equivalents include unrestricted demand deposits at highly rated financial institutions and highly liquid investments with original maturities of three months or less. The Company’s cash balances fluctuate throughout the year and may exceed Federal Deposit Insurance Corporation (“FDIC”) insured limits from time to time. Although the Company bears risk on amounts in excess of those insured by the FDIC, the Company believes the risk of loss is mitigated by the financial position, creditworthiness, and strength of the depository institutions in which those deposits are held.
Cash Collateral Posted To/By Counterparties
The Company regularly pledges and receives amounts to cover margin requirements related to the Company’s financing and derivative instruments. If the amount pledged to a counterparty exceeds the amount received from a counterparty, the net amount is recorded as an asset within “cash collateral posted to counterparties,” and if the amount received from a counterparty exceeds the amount pledged to a counterparty, the net amount is recorded as a liability within “cash collateral posted by counterparties” on the Company’s consolidated balance sheets.
The following table provides a reconciliation of “cash” and “cash posted to counterparties” reported on the Company's consolidated balance sheets presented herein that sum to the total of the same such amounts shown on the Company’s consolidated statement of cash flows for the years ended December 31, 2025 and December 31, 2024:
F-12
DYNEX CAPITAL, INC.
NOTES TO THE CONSOLIDATED FINANCIAL STATEMENTS
($s in thousands)
December 31, 2025
December 31, 2024
Cash and cash equivalents
$
531,043
$
377,099
Cash collateral posted to counterparties
399,344
244,440
Total cash including cash posted to counterparties shown on consolidated statement of cash flows
$
930,387
$
621,539
Mortgage-Backed Securities
The Company’s MBS are recorded at fair value on the Company’s consolidated balance sheet. Changes in fair value of MBS purchased prior to January 1, 2021 are designated as available-for-sale (“AFS”) with changes in fair value reported in other comprehensive income (“OCI”) as an unrealized gain (loss) until the security is sold or matures. Effective January 1, 2021, the Company elected the fair value option (“FVO”) for all MBS purchased on or after that date with changes in fair value reported in net income as “unrealized gain (loss) on investments, net” until the security is sold or matures. Management elected the fair value option so that net income will reflect the changes in fair value for its future purchases of MBS in a manner consistent with the presentation and timing of the changes in fair value of its derivative instruments. Upon the sale of an MBS, any unrealized gain or loss within OCI or net income is reclassified to “realized gain (loss) on sale of investments, net” within net income using the specific identification method.
Interest Income, Premium Amortization, and Discount Accretion.Interest income on MBS is accrued based on the outstanding principal balance (or notional balance in the case of IO securities) and the contractual terms. Premiums or discounts associated with the purchase of Agency MBS as well as any non-Agency MBS are amortized or accreted into interest income over the life of such securities using the effective interest method, and adjustments to premium amortization and discount accretion are made for actual cash payments received. On at least a quarterly basis, the Company reviews and makes any necessary adjustments to its cash flows and updates the yield recognized on these assets.
Determination of MBS Fair Value.The Company estimates the fair value of the majority of its MBS based upon prices obtained from an independent third-party pricing service. These prices are assessed for reasonableness using additional third-party pricing services. Please refer to Note 6 for further discussion of MBS fair value measurements.
Allowance for Credit Losses.On at least a quarterly basis, the Company evaluates any MBS designated as AFS with a fair value less than its amortized cost for credit losses. If the difference between the present value of cash flows expected to be collected on the MBS is less than its amortized cost, the difference is recorded as an allowance for credit loss through net income up to and not exceeding the amount that the amortized cost exceeds current fair value. Subsequent changes in credit loss estimates are recognized in earnings in the period in which they occur. Because the majority of the Company’s investments are higher credit quality and most are guaranteed by a GSE, the Company is not likely to have an allowance for credit losses related to its MBS recorded on its consolidated balance sheet.
Interest accrued between payment dates on MBS is presented separately from the Company’s investment portfolio as “accrued interest receivable” on its consolidated balance sheet. The Company does not estimate an allowance for credit loss for its accrued interest receivable because the interest is generally received within 30 days and amounts not received when due are written off against interest income.
Repurchase Agreements
The Company’s repurchase agreements are used to finance its purchases of MBS. The Company pledges its securities as collateral to secure a loan, which is equal to a specified percentage of the estimated fair value of the pledged collateral. The Company retains beneficial ownership of the pledged collateral. Pursuant to Accounting Standards Codification (“ASC”) Topic 860, the Company accounts for repurchase agreements as collateralized financing transactions, which are carried at their contractual amounts (cost), plus accrued interest. The interest rates the Company pays for these borrowings are based on a spread added to the Secured Overnight Funding Rate (“SOFR”). At the maturity of a repurchase agreement borrowing, the Company is required to repay the loan and
F-13
DYNEX CAPITAL, INC.
NOTES TO THE CONSOLIDATED FINANCIAL STATEMENTS
concurrently receives back its pledged collateral from the lender, or, with the consent of the lender, the Company may renew the agreement at the then prevailing financing rate. A repurchase agreement lender may require the Company to pledge additional collateral in the event of a decline in the fair value of the collateral pledged. Repurchase agreement financing is recourse to the Company and the assets pledged. The repurchase facilities available to the Company are uncommitted with no guarantee of renewal.
Derivative Instruments
Derivative instruments are carried at fair value, and all periodic interest benefits/costs and changes in the fair value of derivative instruments, including gains and losses realized upon termination, maturity, or settlement, are recorded in “gain (loss) on derivative instruments, net” on the Company’s consolidated statements of comprehensive income (loss). Cash receipts and payments related to derivative instruments are classified in the investing activities section of the consolidated statements of cash flows in accordance with the underlying nature or purpose of the derivative transactions.
The Company’s short positions in U.S. Treasury futures contracts are centrally cleared through the Chicago Mercantile Exchange (“CME”), which requires the Company to post initial margin as determined by the CME. Daily variation margin is exchanged, typically in cash, for the changes in the fair value of the futures contracts, which is treated as legal settlement of the exposure under the related futures contracts as opposed to a pledge of collateral. The effect of these legal settlements reduces what would have otherwise been reported as the fair value of the futures contracts, generally to $0. The margin requirement varies based on the market value of the open positions and the equity retained in the account. Any margin excess or deficit outstanding is recorded as a receivable or payable within “due from/to counterparties” as of the date of the Company’s consolidated balance sheets. The Company realizes gains or losses on these contracts upon expiration at an amount equal to the difference between the current fair value of the underlying asset and the contractual price of the futures contract.
The Company’s interest rate swaps are pay-fixed, which involve the receipt of variable-rate amounts based on SOFR from a counterparty in exchange for the Company making fixed-rate payments over the life of the interest rate swap without exchange of the underlying notional amount. The net periodic interest benefit (cost) is recorded in the period earned (incurred) in “gain (loss) on derivative instruments, net”, but the net receipt (payment) of cash is exchanged annually, typically on the anniversary of each agreement’s effective date. Similar to the Company’s U.S. Treasury futures, interest rate swap agreements are centrally cleared through the CME with requirements to post initial margin and to exchange daily variation margin amounts, which are treated as legal settlements of the agreements. Any margin excess or deficit outstanding is recorded as a receivable or payable within “due from/to counterparties” as of the date of the Company’s consolidated balance sheets.
The Company’s interest rate swaptions are SOFR-based and provide the Company the right, but not the obligation, to enter into an interest rate swap at a predetermined notional amount with a stated term and pay and receive rates in the future. These agreements are entered into directly with a counterparty (a “bilateral contract”) with whom we may exchange margin collateral. Because these agreements are not centrally cleared, the Company has exposure to counterparty risk. The Company records the premium it will pay for the swaption as a derivative asset on its consolidated balance sheet and adjusts the balance for changes in fair value through “gain (loss) on derivative instruments” until the swaption is exercised or the contract expires. If the swaption expires unexercised, the realized loss is limited to the premium paid. If exercised, the realized gain or loss on the swaptions is equal to the difference between the fair value of the underlying interest rate swap and the premium paid.
The Company may also use options on U.S. Treasury futures, which are initially recorded at the contract price paid at inception. Subsequent changes in fair value are recorded in “gain (loss) on derivatives instruments” until the option is exercised or the contract expires. If the option expires unexercised, the realized loss is limited to the contract price paid at inception. If exercised, the realized gain or loss on the option is equal to the difference between the fair value of the underlying U.S. Treasury future and the contract price paid at inception.
The Company purchases to-be-announced (“TBA”) securities as a means of investing in non-specified fixed-rate Agency RMBS and may also periodically sell TBA securities as a means of economically hedging its exposure to Agency RMBS. A TBA security is a forward contract (“TBA contract”) for the purchase (“long position”) or sale (“short position”) of a non-specified Agency MBS at a predetermined price with certain principal and interest terms and certain types of collateral, but the particular Agency securities to be delivered are not
F-14
DYNEX CAPITAL, INC.
NOTES TO THE CONSOLIDATED FINANCIAL STATEMENTS
identified until shortly before the settlement date. The Company accounts for long and short positions in Agency RMBS TBAs as derivative instruments in accordance with ASC 815 because the Company cannot assert that it is probable at inception and throughout the term of an individual TBA transaction that its settlement will result in physical delivery of the underlying Agency RMBS or that the individual TBA transaction will settle in the shortest time period possible.
Please refer to Note 5 for additional information regarding the Company’s derivative instruments as well as Note 6 for information on how the fair value of these instruments is calculated.
Share-Based Compensation
The Company’s Board of Directors adopted the 2025 Plan, which was approved by the Company’s shareholders on May 20, 2025. The 2025 Plan, which replaced the Company’s 2020 Plan, reserves for issuance up to 12,000,000 common shares for eligible employees, non-employee directors, consultants, and advisors to the Company to be granted in the form of stock options, restricted stock, RSUs, stock appreciation rights, PSUs, and performance-based cash awards (collectively, “awards”). Awards previously granted under the 2020 Plan will remain outstanding and valid in accordance with their terms, but no new awards will be granted under the 2020 Plan. As of December 31, 2025, there were 10,907,670 common shares remaining available for issuance under the 2025 Plan.
The Company has issued restricted stock and RSUs, which are treated as equity awards and recorded at their fair value using the closing stock price on the grant date. Compensation expense is generally recognized over a service period specified within each award with a corresponding credit to shareholders’ equity using the straight-line method until the vesting date specified within each award or until the employee becomes eligible for retirement, if earlier than the vesting date. Compensation expense is recognized immediately upon the grant date for equity awards granted to an employee who is retirement eligible.
The Company also has PSUs issued and outstanding which contain Company performance-based and market performance-based conditions. PSUs subject to Company performance-based conditions are initially recognized as equity at their fair value which is measured using the closing stock price on the grant date multiplied by the number of units expected to vest based on an assessment of the probability of achievement of the Company performance-based conditions as of the grant date. The grant date fair value is recognized as expense using the straight-line method until the earlier of the vesting date specified within each award or the date the employee becomes eligible for retirement. Adjustments are made, if necessary, based on any change in probability of achievement which is re-assessed as of each reporting date and on at least a quarterly basis. PSUs subject to market performance-based conditions are recognized as equity at their grant date fair value determined through a Monte-Carlo simulation of the Company’s common stock total shareholder return (“TSR”) relative to the common stock TSR of the group of peer companies specified in the award agreement. Awards subject to market performance-based conditions are not assessed for probability of achievement and are not remeasured subsequent to issuance. The grant date fair value is recognized as expense using the straight-line method until the earlier of the vesting date specified within each award or the date the employee becomes eligible for retirement, even if the market performance-based conditions are not achieved. The Company does not have any market performance-based PSUs outstanding as of December 31, 2025.
The Company does not estimate forfeitures for any of its share-based compensation awards but adjusts for actual forfeitures in the periods in which they occur. Because RSUs and PSUs have forfeitable DERs, which are paid in cash only upon settlement, any accrued DERs on forfeited units are reversed with a corresponding credit to “Compensation and benefits” expense.
Please see Note 7 for additional information about the Company’s share-based compensation awards.
Contingencies
From time to time, the Company may be involved in various claims and legal actions arising in the ordinary course of its business. In the opinion of management, the Company did not have any material pending lawsuits, claims, or other contingencies as of December 31, 2025 or December 31, 2024.
F-15
DYNEX CAPITAL, INC.
NOTES TO THE CONSOLIDATED FINANCIAL STATEMENTS
Recently Issued Accounting Pronouncements
The Company evaluates Accounting Standards Updates (“ASU”) issued by the Financial Accounting Standards Board on at least a quarterly basis to evaluate applicability and significance of any impact on its financial condition and results of operations. There are no new accounting pronouncements which are not yet effective that are expected to have a significant impact on our consolidated financial statements upon adoption.
NOTE 2 – NET INCOME (LOSS) PER COMMON SHARE
Please refer to Note 1 for information regarding the Company’s treatment of its preferred stock and stock awards in the calculation of its basic and diluted net income or loss per common share and to Note 7 for information regarding the Company’s stock award activity for the periods presented. The following table presents the computations of basic and diluted net income or loss per common share for the periods indicated:
Year Ended
December 31,
($s in thousands)
2025
2024
2023
Weighted average number of common shares outstanding - basic
124,128,422
70,766,410
54,809,462
Incremental common shares-unvested RSUs
301,171
194,597
—
Incremental common shares-unvested PSUs
637,687
299,351
—
Weighted average number of common shares outstanding - diluted
125,067,280
71,260,358
54,809,462
Net income (loss) to common shareholders
$
308,875
$
106,204
$
(13,824)
Net income (loss) per common share-basic
$
2.49
$
1.50
$
(0.25)
Net income (loss) per common share-diluted
$
2.47
$
1.49
$
(0.25)
The calculation of diluted net loss per common share for the year ended December 31, 2023 excludes unvested RSUs and PSUs of 401,522, which would have been anti-dilutive for the period.
F-16
DYNEX CAPITAL, INC.
NOTES TO THE CONSOLIDATED FINANCIAL STATEMENTS
NOTE 3 – MORTGAGE-BACKED SECURITIES
The following tables provide details on the Company’s MBS by investment type as of the dates indicated:
December 31, 2025
($s in thousands)
Agency RMBS
Agency CMBS
CMBS IO (1)
Total
Measured at fair value through net income:
Amortized cost
$
14,233,682
$
1,165,674
$
30,680
$
15,430,036
Gross unrealized gain
236,304
8,293
20
244,617
Gross unrealized loss
(99,899)
(995)
(1,147)
(102,041)
Fair value through net income
$
14,370,087
$
1,172,972
$
29,553
$
15,572,612
Measured at fair value through OCI:
Amortized cost
$
757,127
$
47,433
$
56,877
$
861,437
Gross unrealized gain
—
25
2,620
2,645
Gross unrealized loss
(125,854)
(2,087)
(1,765)
(129,706)
Fair value through OCI
$
631,273
$
45,371
$
57,732
$
734,376
Total
$
15,001,360
$
1,218,343
$
87,285
$
16,306,988
December 31, 2024
Agency RMBS
Agency CMBS
CMBS IO (1)
Total
Measured at fair value through net income:
Amortized cost
$
6,868,095
$
—
$
35,737
$
6,903,832
Gross unrealized gain
11,081
—
—
11,081
Gross unrealized loss
(237,004)
—
(2,348)
(239,352)
Fair value through net income
$
6,642,172
$
—
$
33,389
$
6,675,561
Measured at fair value through OCI:
Amortized cost
$
827,314
$
99,848
$
81,854
$
1,009,016
Gross unrealized gain
—
3
3,280
3,283
Gross unrealized loss
(167,248)
(4,388)
(4,137)
(175,773)
Fair value through OCI
$
660,066
$
95,463
$
80,997
$
836,526
Total
$
7,302,238
$
95,463
$
114,386
$
7,512,087
(1) The Company held a notional balance of Agency CMBS IO and non-Agency CMBS IO of $4,928,803 and $1,071,722, respectively, as of December 31, 2025, and $6,196,778 and $2,450,398, respectively, as of December 31, 2024.
The majority of the Company’s MBS are pledged as collateral for the Company’s repurchase agreements, which are disclosed in Note 4. Actual maturities of MBS are affected by the contractual lives of the underlying mortgage collateral, scheduled payments, and unscheduled prepayments of principal, and the payment priority structure of the security; therefore, actual maturities are generally shorter than the securities' stated contractual maturities.
F-17
DYNEX CAPITAL, INC.
NOTES TO THE CONSOLIDATED FINANCIAL STATEMENTS
The following table presents information regarding unrealized gains and losses on investments reported within net income (loss) on the Company’s consolidated statements of comprehensive income (loss) for the periods indicated:
Year Ended
December 31,
($s in thousands)
2025
2024
2023
Agency RMBS
$
362,327
$
(144,139)
$
141,263
Agency CMBS
7,298
1,073
96
CMBS IO
1,221
531
1,111
Other investments
4
183
31
Unrealized gain (loss) on investments, net
$
370,850
$
(142,352)
$
142,501
The following table presents information regarding realized gains and losses on sales of MBS reported in the Company’s consolidated statements of comprehensive income (loss) for the periods indicated:
Year Ended
December 31,
($s in thousands)
2025
2024
2023
Realized loss on sale of MBS - FVO
$
—
$
(1,506)
$
(74,916)
Total realized loss on sales of investments, net
$
—
$
(1,506)
$
(74,916)
The following table presents certain information for MBS designated as AFS that were in an unrealized loss position as of the dates indicated:
December 31, 2025
December 31, 2024
($s in thousands)
Fair Value
Gross Unrealized Losses
# of Securities
Fair Value
Gross Unrealized Losses
# of Securities
Continuous unrealized loss position for less than 12 months:
Agency MBS
$
730
$
(1)
2
$
920
$
(3)
3
Non-Agency MBS
208
(22)
3
823
(73)
2
Continuous unrealized loss position for 12 months or longer:
Agency MBS
$
721,536
$
(129,658)
56
$
814,443
$
(175,497)
65
Non-Agency MBS
752
(25)
3
6,097
(200)
10
The unrealized loss positions on the Company’s MBS designated as AFS as of December 31, 2025 and December 31, 2024 were the result of higher interest rates and wider spreads to U.S. Treasuries compared to at the time of purchase. The unrealized loss positions are not credit related; therefore, the Company did not record an allowance for credit losses as of December 31, 2025 or December 31, 2024. The Company has the ability and intent to hold any MBS with an unrealized loss until the recovery in its value. This assessment is based on the amount of the unrealized loss and significance of the related investment as well as the Company’s leverage and liquidity position. In addition, for its non-Agency MBS, the Company reviews the credit ratings, the credit characteristics of the mortgage loans collateralizing these securities, and the estimated future cash flows including projected collateral losses.
F-18
DYNEX CAPITAL, INC.
NOTES TO THE CONSOLIDATED FINANCIAL STATEMENTS
NOTE 4 – REPURCHASE AGREEMENTS
The Company’s repurchase agreements outstanding as of December 31, 2025 and December 31, 2024 are summarized in the following tables:
December 31, 2025
December 31, 2024
Collateral Type
Balance
Weighted Average Rate
Fair Value of Collateral Pledged (1)
Balance
Weighted Average Rate
Fair Value of Collateral Pledged (1)
($s in thousands)
Agency RMBS
$
12,857,827
4.09
%
$
13,496,489
$
6,368,457
4.79
%
$
6,689,336
Agency CMBS
967,024
4.07
%
1,012,532
90,717
4.78
%
95,071
Agency CMBS IO
77,057
4.41
%
81,913
96,146
5.18
%
101,165
Non-Agency CMBS IO
2,323
4.72
%
2,536
7,800
5.52
%
8,057
Total
$
13,904,231
4.10
%
$
14,593,470
$
6,563,120
4.80
%
$
6,893,629
(1) Amounts disclosed for fair value of collateral pledged include amounts pledged to cover margin calls, which may differ in collateral type from the initial collateral type pledged.
The Company had borrowings outstanding under 28 different repurchase agreements as of December 31, 2025, and its equity at risk did not exceed 10% with any single counterparty as of that date.
The following table provides information on the remaining term to maturity and original term to maturity for the Company’s repurchase agreements as of the dates indicated:
December 31, 2025
December 31, 2024
Remaining Term to Maturity
Balance
Weighted Average Rate
WAVG Original Term to Maturity
Balance
Weighted Average Rate
WAVG Original Term to Maturity
($s in thousands)
Less than 30 days
$
9,146,566
4.11
%
75
$
1,742,440
4.83
%
68
30 to 90 days
4,757,665
4.07
%
94
4,820,680
4.78
%
83
91 to 180 days
—
—
%
0
—
—
%
—
Total
$
13,904,231
4.10
%
81
$
6,563,120
4.80
%
79
The Company’s accrued interest payable related to its repurchase agreement borrowings increased to $95 million as of December 31, 2025 from $45 million as of December 31, 2024.
The Company’s counterparties, as set forth in the master repurchase agreement with each counterparty, require the Company to comply with various customary operating and financial covenants, including, but not limited to, minimum net worth, maximum declines in net worth in a given period, and maximum leverage requirements as well as maintaining the Company’s REIT status. In addition, some of the agreements contain cross default features, whereby default under an agreement with one lender simultaneously causes default under agreements with other lenders. To the extent that the Company fails to comply with the covenants contained in these financing agreements or is otherwise found to be in default under the terms of such agreements, the counterparty has the right to accelerate amounts due under the master repurchase agreement. The Company believes it was in full compliance with all covenants in master repurchase agreements under which there were amounts outstanding as of December 31, 2025.
The Company's repurchase agreements are subject to underlying agreements with master netting or similar arrangements, which provide for the right of set off in the event of default or in the event of bankruptcy of either party to the transactions. The Company reports its repurchase agreements to these arrangements on a gross basis. The following table presents information regarding the Company's repurchase agreements as if the Company had
F-19
DYNEX CAPITAL, INC.
NOTES TO THE CONSOLIDATED FINANCIAL STATEMENTS
presented them on a net basis as of December 31, 2025 and December 31, 2024:
($s in thousands)
Gross Amount of Recognized Liabilities
Gross Amount Offset in the Balance Sheet
Net Amount of Liabilities Presented in the Balance Sheet
Gross Amount Not Offset in the Balance Sheet (1)
Net Amount
Financial Instruments Posted as Collateral
Cash Posted as Collateral
December 31, 2025:
Repurchase agreements
$
13,904,231
$
—
$
13,904,231
$
(13,904,231)
$
—
$
—
December 31, 2024:
Repurchase agreements
$
6,563,120
$
—
$
6,563,120
$
(6,563,120)
$
—
$
—
(1) Amounts disclosed for collateral received by or posted to the same counterparty include cash and the fair value of MBS up to and not exceeding the net amount of the repurchase agreement liability presented in the balance sheet. The fair value of the total collateral received by or posted to the same counterparty may exceed the amounts presented. Please refer to the consolidated balance sheets for the total fair value of financial instruments pledged as collateral for derivatives and repurchase agreements, which is shown parenthetically, and the total cash pledged or received as collateral, which is disclosed as “cash collateral posted to/by counterparties.”
Please see Note 5 for information related to the Company’s derivatives, which are also subject to underlying agreements with master netting or similar arrangements.
NOTE 5 – DERIVATIVES
Types and Uses of Derivatives Instruments
Interest Rate Derivatives.The Company frequently changes the type of derivative instruments it uses to mitigate the impact of changing interest rates on its repurchase agreement financing costs and the fair value of its investments. Please refer to Note 1 for descriptions of these instruments and how the Company accounts for them.
TBA Transactions. The Company purchases TBA securities as a means of investing in non-specified fixed-rate Agency RMBS and may also periodically sell TBA securities as a means of economically hedging its exposure to Agency RMBS. Please refer to Note 1 for more information about these securities.
The table below provides detail of the Company’s gain and losses by type of derivative instrument for the periods indicated:
Year Ended
December 31,
Type of Derivative Instrument
2025
2024
2023
($s in thousands)
U.S. Treasury futures
$
(46,190)
$
174,108
$
(12,430)
Interest rate swaps
(149,652)
152,781
—
Interest rate swaptions
(4,045)
—
—
Options on U.S. Treasury futures
(7,852)
—
1,588
TBA securities
94,646
(38,512)
(22,063)
(Loss) gain on derivative instruments, net
$
(113,093)
$
288,377
$
(32,905)
The table below provides the carrying amount by type of derivative instrument comprising the Company’s derivative assets and liabilities on its consolidated balance sheets as of the dates indicated:
F-20
DYNEX CAPITAL, INC.
NOTES TO THE CONSOLIDATED FINANCIAL STATEMENTS
Type of Derivative Instrument
Balance Sheet Location
Purpose
December 31, 2025
December 31, 2024
($s in thousands)
Options on U.S. Treasury futures
Derivative assets
Economic hedging
$
2,657
—
TBA securities
Derivative assets
Investing
7,841
133
Total derivatives assets
$
10,498
$
133
Interest rate swaptions
Derivative liabilities
Economic hedging
$
4,045
$
—
TBA securities
Derivative liabilities
Investing
785
22,814
Total derivatives liabilities
$
4,830
$
22,814
The table below presents information regarding the long positions in SOFR-based interest rate swaptions and options on U.S. Treasury futures held by the Company as of December 31, 2025. The Company did not hold any interest rate swaptions or options on U.S. Treasury futures as of December 31, 2024.
December 31, 2025
Option
Underlying Financial Instrument
Cost (1)
Fair Value
Carrying Value (1)
Notional Amount
Average Fixed Receive Rate
Type of Instrument
($s in thousands)
1-2 year interest rate swaptions
$
11,725
$
7,680
$
(4,045)
$
750,000
3.25
%
5 year SOFR-based swap
3-month options on U.S. Treasury futures
3,981
2,657
2,657
500,000
n/a
10-year U.S. Treasury future
(1)The Company pays the premium for its interest rate swaptions at the end of the option period, so the carrying value on the Company's consolidated balance sheets is fair value, net of the payable for the unpaid premium as of the period indicated. The Company pays the premium for its options on U.S. Treasury futures at inception, so the carrying value is equal to the fair value as of the period indicated.
Because the daily margin exchanged for the Company’s U.S. Treasury futures and interest rate swaps are considered legal settlement of the derivative as opposed to a pledge of collateral, these instruments have a carrying value of $0 on the Company’s consolidated balance sheets. The Company’s U.S. Treasury futures, excluding the recognition of variation margin settlements, were in a net asset position of $22 million as of December 31, 2025 and a net asset position of $1 million as of December 31, 2024, and its interest rate swaps were in a net liability position of $(46) million as of December 31, 2025 and net asset position of $153 million as of December 31, 2024. The amount of cash posted by the Company to cover required initial margin for its U.S. Treasury futures and its interest rate swaps was $392 million as of December 31, 2025 and $219 million as of December 31, 2024, which was recorded within “cash collateral posted to counterparties.” The Company had a margin receivable of $17 million as of December 31, 2025 and $10 million as of December 31, 2024, which was recorded within “due from counterparties.”
The table below presents information regarding the pay fixed/receive variable SOFR-based interest rate swaps the Company held as of the dates indicated:
F-21
DYNEX CAPITAL, INC.
NOTES TO THE CONSOLIDATED FINANCIAL STATEMENTS
December 31, 2025
December 31, 2024
Pay Fixed Interest Rate Swaps -
Years to Maturity
Notional Amount
Weighted Average
Pay Fixed Rate
Notional Amount
Weighted Average
Pay Fixed Rate
($s in thousands)
3-5 years
$
2,450,000
3.42
%
1,275,000
3.42
%
5-7 years
4,070,000
3.66
%
3,085,000
3.61
%
7-10 years
3,090,000
3.87
%
1,025,000
3.83
%
10-15 years
75,000
3.77
%
—
—
%
$
9,685,000
3.66
%
$
5,385,000
3.61
%
The table below presents information regarding the notional amounts of the short positions in U.S. Treasury futures held by the Company as of the dates indicated:
U.S. Treasury Futures
December 31, 2025
December 31, 2024
($s in thousands)
5-year U.S. Treasury futures
$
(30,000)
$
—
10-year U.S. Treasury futures
(1,475,000)
(735,000)
30-year U.S. Treasury futures
(1,153,500)
(516,500)
$
(2,658,500)
$
(1,251,500)
The following table summarizes information about the notional amounts of the Company's long positions in TBA securities as of the dates indicated:
TBA securities
December 31, 2025
December 31, 2024
($s in thousands)
Implied market value (1)
$
3,121,122
$
2,318,392
Implied cost basis (2)
3,114,066
2,341,073
Net carrying value (3)
$
7,056
$
(22,681)
(1) Implied market value represents the estimated fair value of the underlying Agency MBS as of the dates indicated.
(2) Implied cost basis represents the forward price to be paid for the underlying Agency MBS as of the dates indicated.
(3) Net carrying value represents the difference between the implied market value and the implied cost basis of the Company’s TBA securities as of the dates indicated. The total shown is the net amount included on the consolidated balance sheets as derivative assets of $7,841 and derivative liabilities of $785 as of December 31, 2025 and $133 and $22,814, respectively, as of December 31, 2024.
Volume of Activity
The table below summarizes changes in the Company’s derivative instruments for the year ended December 31, 2025:
Type of Derivative Instrument
Beginning Notional Amount-Long (Short)
Additions
Settlements, Terminations, or Pair-Offs
Ending Notional Amount-Long (Short)
($s in thousands)
U.S. Treasury futures
$
(1,251,500)
$
(12,767,200)
$
11,360,200
$
(2,658,500)
Interest rate swaps
5,385,000
4,300,000
—
9,685,000
Interest rate swaptions
—
750,000
—
750,000
Options on U.S. Treasury futures
—
1,500,000
(1,000,000)
500,000
TBA securities
2,419,000
39,328,000
(38,558,000)
3,189,000
F-22
DYNEX CAPITAL, INC.
NOTES TO THE CONSOLIDATED FINANCIAL STATEMENTS
Offsetting
The Company's derivatives are subject to underlying agreements with master netting or similar arrangements, which provide for the right of set off in the event of default or in the event of bankruptcy of either party to the transactions. The Company reports its derivative assets and liabilities subject to these arrangements on a gross basis. Please see Note 4 for information related to the Company’s repurchase agreements, which are also subject to underlying agreements with master netting or similar arrangements. The following tables present information regarding those derivative assets and liabilities subject to such arrangements as if the Company had presented them on a net basis as of December 31, 2025 and December 31, 2024:
Offsetting of Assets
($s in thousands)
Gross Amount of Recognized Assets
Gross Amount Offset in the Balance Sheet
Net Amount of Assets Presented in the Balance Sheet
Gross Amount Not Offset in the Balance Sheet (1)
Net Amount
Financial Instruments Received as Collateral
Cash Received as Collateral
December 31, 2025
Options on U.S. Treasury futures
$
2,657
$
—
$
2,657
$
—
$
—
$
2,657
TBA securities
7,841
—
7,841
(689)
(6,333)
819
Derivative assets
$
10,498
$
—
$
10,498
$
(689)
$
(6,333)
$
3,476
December 31, 2024
TBA securities
$
133
$
—
$
133
$
(133)
$
—
$
—
Derivative assets
$
133
$
—
$
133
$
(133)
$
—
$
—
Offsetting of Liabilities
($s in thousands)
Gross Amount of Recognized Liabilities
Gross Amount Offset in the Balance Sheet
Net Amount of Liabilities Presented in the Balance Sheet
Gross Amount Not Offset in the Balance Sheet (1)
Net Amount
Financial Instruments Posted as Collateral
Cash Posted as Collateral
December 31, 2025
Interest rate swaptions
$
4,045
$
—
$
4,045
$
—
$
—
$
4,045
TBA securities
785
—
785
(689)
(96)
—
Derivative liabilities
$
4,830
$
—
$
4,830
$
(689)
$
(96)
$
4,045
December 31, 2024
TBA securities
$
22,814
$
—
$
22,814
$
(133)
$
(21,308)
$
1,373
Derivative liabilities
$
22,814
$
—
$
22,814
$
(133)
$
(21,308)
$
1,373
(1)Amounts disclosed for collateral received by or posted to the same counterparty include cash and the fair value of MBS up to and not exceeding the net amount of the derivative asset or liability presented in the balance sheet. The fair value of the total collateral received by or posted to the same counterparty may exceed the amounts presented. Please refer to the consolidated balance sheets for the total fair value of financial instruments pledged as collateral for derivatives and repurchase agreements, which is shown parenthetically, and the total cash pledged or received as collateral which is disclosed as “cash collateral posted to/by counterparties.”
F-23
DYNEX CAPITAL, INC.
NOTES TO THE CONSOLIDATED FINANCIAL STATEMENTS
NOTE 6 – FAIR VALUE OF FINANCIAL INSTRUMENTS
Fair value is defined as the price that would be received to sell an asset or paid to transfer a liability in an orderly transaction between market participants at the measurement date. Fair value is based on the assumptions market participants would use when pricing an asset or liability and also considers all aspects of nonperformance risk, including the entity’s own credit standing, when measuring fair value of a liability. ASC Topic 820 established a valuation hierarchy of three levels as follows:
•Level 1 – Inputs are unadjusted, quoted prices in active markets for identical assets or liabilities as of the measurement date.
•Level 2 – Inputs include quoted prices in active markets for similar assets or liabilities; quoted prices in inactive markets for identical or similar assets or liabilities; or inputs either directly observable or indirectly observable through correlation with market data at the measurement date and for the duration of the instrument’s anticipated life.
•Level 3 – Unobservable inputs are supported by little or no market activity. The unobservable inputs represent management’s best estimate of how market participants would price the asset or liability at the measurement date. Consideration is given to the risk inherent in the valuation technique and the risk inherent in the inputs to the model.
The following table presents the Company’s financial instruments that are measured at fair value on the Company’s consolidated balance sheet by their valuation hierarchy levels as of the dates indicated:
($s in thousands)
December 31, 2025
December 31, 2024
Total
Level 1
Level 2
Level 3
Total
Level 1
Level 2
Level 3
Assets:
MBS
$
16,306,988
$
—
$
16,306,988
$
—
$
7,512,087
$
—
$
7,512,087
$
—
TBA securities (1)
7,841
—
7,841
—
133
—
133
—
Option on U.S. Treasury futures
2,657
2,657
—
—
—
—
—
—
Mortgage loans (2)
618
—
—
618
1,130
—
—
1,130
Total
$
16,318,104
$
2,657
$
16,314,829
$
618
$
7,513,350
$
—
$
7,512,220
$
1,130
Liabilities:
TBA securities (1)
$
785
$
—
$
785
$
—
$
22,814
$
—
$
22,814
$
—
Interest rate swaptions (3)
4,045
—
4,045
—
—
—
—
—
Total
$
4,830
$
—
$
4,830
$
—
$
22,814
$
—
$
22,814
$
—
(1)TBA securities are reflected on the consolidated balance sheet as derivative assets or liabilities at their implied fair value, net of implied cost basis. Please refer to Note 5 for additional information.
(2)Mortgage loans are included on the consolidated balance sheets as a component of other assets.
(3)Interest rate swaptions are reflected on the consolidated balance sheet as derivative assets or liabilities at their fair value, net of cost. Please refer to Note 5 for additional information.
The fair value measurements for the Company’s TBA securities and its MBS are considered Level 2 because there are substantially similar securities actively trading or for which there has been recent trading activity in their respective markets. Fair value for Agency MBS and TBA securities is based on prices received from an independent third-party pricing service. In valuing a security, the pricing service primarily uses a market approach, which uses observable prices and other relevant information that is generated by market transactions of identical or
F-24
DYNEX CAPITAL, INC.
NOTES TO THE CONSOLIDATED FINANCIAL STATEMENTS
similar securities, but may use an income approach, which uses valuation techniques such as discounted cash flow modeling. Examples of the observable inputs and assumptions used in the valuation techniques include market interest rates, credit spreads, and projected prepayment speeds, among other things. The Company reviews the prices it receives from the pricing service for reasonableness using other third-party pricing services. If the fair value of a security is not available from a third-party pricing service, the Company may estimate the fair value of the security through a variety of methods using observable market data.
The Company's mortgage loans held for investment are single-family mortgage loans, which were originated or purchased by the Company prior to 2000, and for which the Company has elected the fair value option. The fair value measurements for these mortgage loans are considered Level 3 because there has been no recent trading activity of similar instruments upon which their fair value can be measured. The fair value for these Level 3 assets is measured by discounting the estimated future cash flows derived from cash flow models using certain inputs such as the security’s credit rating, coupon rate, estimated prepayment speeds, expected weighted average life, collateral composition, and expected credit losses as well as certain other relevant information. The Company used a constant prepayment rate assumption of 10%, default rate of 2%, loss severity of 20%, and a discount rate of 10% in measuring the fair value of its Level 3 assets as of December 31, 2025 and as of December 31, 2024.
The Company’s short positions in U.S. Treasury futures contracts are valued based on exchange pricing and are classified accordingly as Level 1 measurements. Interest rate swaps are valued using the daily settlement price, or fair value, determined by the clearing exchange based on a pricing model that references observable market inputs, including current benchmark rates and the forward yield curve, and thus their fair values are considered Level 2 measurements. The carrying value of the U.S. Treasury futures contracts and interest rate swaps on the Company’s consolidated balance sheets is $0 because the instruments require daily margin exchanges, which are considered by the settlement agent to represent legal settlement of the contracts on a daily basis. Please see Note 1 and Note 5 for additional information regarding the fair value of the Company’s derivative instruments.
The fair value measurement of interest rate swaptions is considered Level 2 because it is based on the fair value of the underlying interest rate swap and time remaining until its expiration and is carried on the balance sheet net of any deferred premium to be paid upon exercise or expiration. The fair value measurement of options on U.S. Treasury futures is considered Level 1 because they are valued based on closing exchange prices on these contracts. Options on U.S. Treasury futures are initially recorded on the balance sheet at the contract price paid and subsequently adjusted for changes in fair value until exercise or expiration.
The Company’s repurchase agreements are reported at cost, which approximates fair value. Given their short-term nature (less than one year) and the interest rates on outstanding amounts, which largely correspond to prevailing rates observed in the repurchase agreement market, their inputs are considered Level 2.
NOTE 7 – SHAREHOLDERS’ EQUITY AND SHARE-BASED COMPENSATION
Preferred Stock. The Company’s Board of Directors has designated 6,600,000 shares of the Company’s preferred stock for issuance as Series C Preferred Stock, of which the Company has 4,460,000 of such shares outstanding as of December 31, 2025. The Series C Preferred Stock has no stated maturity, is not subject to any sinking fund or mandatory redemption, and will remain outstanding indefinitely unless redeemed, repurchased, or converted into common stock pursuant to the terms of the Series C Preferred Stock. As of April 15, 2025, the Series C Preferred Stock may be redeemed at any time and from time to time at the Company's option at a cash redemption price of $25.00 per share plus any accumulated and unpaid dividends. In addition, the Series C Preferred Stock will now pay a quarterly cumulative cash dividend at a percentage of its $25.00 liquidation value per share equal to 3-month term SOFR plus the statutorily prescribed tenor spread adjustment of 0.26161% in addition to the spread pursuant to the terms of the Series C Preferred Stock of 5.461% for a total spread of 5.723%. The Company paid a quarterly dividend of $0.61437 per share of Series C Preferred Stock on January 15, 2025 to shareholders of record
F-25
DYNEX CAPITAL, INC.
NOTES TO THE CONSOLIDATED FINANCIAL STATEMENTS
as of January 1, 2025.
Common Stock. During the year ended December 31, 2025, the Company issued 90,126,672 shares of its common stock through its at-the-market (“ATM”) program at an aggregate value of $1.2 billion, net of broker commissions and fees. The Company declared monthly dividends on its common stock totaling $0.51 for the three months ended December 31, 2025 and $2.00 per common share for the year ended December 31, 2025. The Company’s timing, frequency, and amount of dividends declared on its common stock are determined by its Board of Directors. When declaring dividends, the Board of Directors considers the Company’s taxable income, management’s view on long-term returns, the REIT distribution requirements of the Tax Code, and maintaining compliance with dividend requirements of the Series C Preferred Stock, along with other factors that the Board of Directors may deem relevant from time to time.
Share-Based Compensation. The following table presents a rollforward of share-based awards for the periods indicated:
Year Ended
December 31,
2025
2024
2023
Type of Award
Shares
Weighted Average
Grant Date
Fair Value
Per Share
Shares
Weighted Average
Grant Date
Fair Value
Per Share
Shares
Weighted Average
Grant Date
Fair Value
Per Share
Restricted stock:
Awards outstanding, beginning of period
93,595
$
12.78
104,282
$
12.61
133,951
$
15.22
Granted
—
—
65,668
12.56
74,017
11.27
Vested
(68,490)
12.94
(76,355)
12.37
(103,686)
15.03
Awards outstanding, end of period
25,105
$
12.34
93,595
$
12.78
104,282
$
12.61
Target RSUs: (1)
Awards outstanding, beginning of period
463,070
$
12.64
394,497
$
13.06
86,666
$
16.57
Granted
502,636
12.88
214,755
12.50
341,044
12.55
Vested
(227,483)
12.69
(146,182)
13.57
(33,213)
16.96
Awards outstanding, end of period
738,223
$
12.79
463,070
$
12.64
394,497
$
13.06
Target PSUs: (2)
Awards outstanding, beginning of period
482,409
$
12.32
276,866
$
13.17
201,284
$
16.60
Granted
371,282
12.05
322,132
12.50
160,277
11.97
Vested
(160,277)
11.97
(116,589)
14.83
(84,695)
19.04
Awards outstanding, end of period
693,414
$
12.26
482,409
$
12.32
276,866
$
13.17
(1)The number of RSUs shown represent the target number of awards. Actual number of shares that will potentially settle may range from 0% if the recipient’s service-based vesting condition is not met to 100% if the service-based vesting condition is met.
(2)The number of PSUs shown represent the target number of awards. Actual number of shares that will potentially settle may range from 0% to 200% based on the achievement of the performance goals defined in each grant award.
F-26
DYNEX CAPITAL, INC.
NOTES TO THE CONSOLIDATED FINANCIAL STATEMENTS
The restricted stock awards that vested during the year ended December 31, 2025 were all granted to employees except for 38,068 shares granted to the Company’s non-employee directors. Restricted stock granted to employees generally vests in equal installments over a period of 3 years, and restricted stock granted to non-employee directors generally vests upon the first anniversary of the grant date. RSUs vest in equal installments over a period of 3 years. PSUs cliff vest based on performance results measured over a period of 3 years. The Company expects 165% of the remaining target PSUs outstanding as of December 31, 2025 will be settled on their vesting dates. Approximately 121% of target PSUs granted in 2023 with a performance period ended December 31, 2025 are expected to be awarded based on information known as of the filing date of this Annual Report on Form 10-K.
The following table discloses the dividends payable to the Company’s shareholders for common and preferred stock as well as to its employees and directors for DERs related to its outstanding RSUs and PSUs as of the dates indicated:
Dividends Payable
December 31, 2025
December 31, 2024
($s in thousands)
RSU DERs
$
1,578
$
916
PSU DERs
3,423
1,287
Accrued DERs
5,001
2,203
Common stock dividends
$
29,877
$
12,674
Preferred stock dividends
2,293
1,624
Accrued dividends
32,170
14,298
Total dividends payable
$
37,171
$
16,501
Total share-based compensation expense recognized by the Company for the year ended December 31, 2025 was $13 million compared to $7 million and $5 million for the years ended December 31, 2024 and December 31, 2023, respectively. The following table discloses the Company’s remaining compensation expense related to stock awards it has granted as of December 31, 2025, which will be amortized over the period disclosed:
December 31, 2025
($s in thousands)
Remaining Compensation Cost
WAVG Period of Recognition
Restricted stock
$
142
1.1 years
RSUs
4,894
1.8 years
PSUs
4,675
1.8 years
Total
$
9,711
1.8 years
NOTE 8 – INCOME TAXES
The Company does not expect to incur any income tax liability for the year ended December 31, 2025 and did not incur any material income tax liability for the years ended December 31, 2024 or December 31, 2023. As of December 31, 2025, the Company has $505 million of capital loss carryforwards, all of which will expire by either December 31, 2027 or by December 31, 2028.
After reviewing for any potentially uncertain income tax positions, the Company has concluded that it does not have any uncertain tax positions that meet the recognition or measurement criteria of ASC Topic 740 as of December 31, 2025 or December 31, 2024, although its tax returns for those tax years are open to examination by the IRS. In the event that the Company incurs income tax related interest and penalties, its policy is to classify them
F-27
DYNEX CAPITAL, INC.
NOTES TO THE CONSOLIDATED FINANCIAL STATEMENTS
as a component of provision for income taxes.
NOTE 9 - SEGMENT REPORTING
The Company’s operations consist of one reportable segment which involves investing in MBS and funding these investments with repurchase agreements and equity. Because the Company’s investment portfolio and financings are subject to market risks, primarily interest rate risk, management seeks to offset a portion of its market value exposure and financing costs through its interest rate derivative instruments (“hedging portfolio”). The Company’s investment and hedging portfolios are managed together.
The Company’s revenue is derived from its investment portfolio, which currently consists of primarily Agency RMBS. The Company’s chief operating decision maker (“CODM”) is its Co-CEO and President. Segment performance is measured by and resource allocation decisions are based on “comprehensive income to common shareholders” as presented on the Company’s consolidated statement of comprehensive income. The segment’s significant expense categories as shown on the Company’s consolidated statement of comprehensive income are regularly provided to the CODM for review and are also used to make resource allocation decisions. Segment assets are total assets as shown on the Company’s consolidated balance sheet.
NOTE 10 - SUBSEQUENT EVENTS
Subsequent to December 31, 2025, the Company issued 27 million shares of its common stock through its ATM program, for which it received proceeds of approximately $376 million, net of commissions.